UNITED STATES
SECURITIES AND EXCHANGE COMMISSION
Washington, DC 20549
FORM 10-K
(Mark One)
ý ANNUAL REPORT PURSUANT TO SECTION 13 OR 15(d) OF THE SECURITIES EXCHANGE ACT OF 1934
For the fiscal year ended December 31, 2006
o TRANSITION REPORT PURSUANT TO SECTION 13 OR 15(d) OF THE SECURITIES EXCHANGE ACT OF 1934
Commission File Number 0-16761
HIGHLANDS BANKSHARES, INC.
(Exact name of registrant as specified in its charter)
| West Virginia | 55-0650743 |
| (State or other jurisdiction of incorporation or organization) | (I.R.S. Employer Identification No.) |
| P.O. Box 929 Petersburg, WV | 26847 |
| (Address of principal executive offices) | (Zip Code) |
Registrant’s telephone number, including area code: 304-257-4111
Securities registered pursuant to Section 12(b) of the Act: None
Securities registered pursuant to Section 12(g) of the Act: Common Stock, $5 par
Indicate by check mark if the registrant is a well-know seasoned issuer, as defined in Rule 405 or the Securities Act o Yes ý No
Indicate by check mark if the registrant is not required to file reports pursuant to Section 13 or Section 15(d) of the Act o Yes ý No
Indicate by check mark whether the registrant has (1) filed all reports required to be filed by Section 13 or 15(d) of the Exchange Act during the preceding 12 months (or for such shorter period that the registrant was required to file such reports), and (2) has been subject to such filing requirements for the past 90 days. Yes ý No o
Indicate by check mark if disclosure of delinquent filers in response to Item 405 of Regulation S-K is not contained in this form, and will not be contained, to the best of registrant's knowledge, in definitive proxy or information statements incorporated by reference in Part III of this Form 10-K or any amendment to this Form 10-K. ý
Indicate by check mark whether the registrant is a large accelerated filer, an accelerated filer, or a non-accelerated filer. o Large Accelerated Filer o Accelerated Filer ý Non-accelerated filer
Indicate by check mark whether the registrant is a shell company (as defined in rule 126-2 of the Act) Yes o No ý
State the aggregate market value of the voting and non-voting common equity held by non-affiliates computed by reference to the price at which the common equity was last sold, or the average bid and asked price of such common equity, as of the last business day of the registrant’s most recently completed second fiscal quarter:
The aggregate market value of the 1,319,381 shares of common stock of the registrant issued and outstanding held by nonaffiliates on June 30, 2006 was approximately $42,880,000 based on the closing sales price of $32.50 on June 30, 2006. For the purposes of this calculation, the term “affiliate” refers to all directors and executive officers of the registrant.
Indicate the number of shares outstanding of each of the registrant’s classes of common stock as of the last practicable date: As of March 15, 2007: 1,436,874 shares of common stock.
DOCUMENTS INCORPORATED BY REFERENCE
Portions of the Proxy Statement for the 2007 Annual Shareholders’ Meeting are incorporated by reference into Part III, Items 10,11,12,13 and 14.
|
| | Page |
| Business | 1 |
| Risk Factors | 5 |
| Unresolved Staff Comments | 8 |
| Properties | 8 |
| Legal Proceedings | 8 |
| Submission of Matters to a Vote of Security Holders | 8 |
| | | |
| | |
| Market for Registrant’s Common Equity, Related Stockholder Matters and Issuer Purchases of Equity Securities | 8 |
| Selected Financial Data | 10 |
| Management’s Discussion and Analysis of Financial Condition and Results of Operations | 11 |
| Quantitative and Qualitative Disclosures About Market Risk | 31 |
| Financial Statements and Supplementary Data | 33 |
| Changes in and Disagreements with Accountants on Accounting and Financial Disclosure | 62 |
| Controls and Procedures | 62 |
| Other Information | 62 |
| | | |
| | |
| Directors and Officers of Registrant | 62 |
| Executive Compensation | 62 |
| Security Ownership of Certain Beneficial Owners and Management and Related Stockholder Matters | 63 |
| Certain Relationships and Related Transactions | 63 |
| Principal Accounting Fees and Services | 63 |
| | | |
| | |
| Exhibits and Financial Statement Schedules | 64 |
| | | |
| 65 |
General
Highlands Bankshares, Inc. (hereinafter referred to as “Highlands,” or the “Company”), incorporated under the laws of West Virginia in 1985, is a multi bank holding company subject to the provisions of the Bank Holding Company Act of 1956, as amended, and owns 100% of the outstanding stock of its subsidiary Banks, The Grant County Bank and Capon Valley Bank (hereinafter referred to as the “Banks” or “Capon” and/or “Grant”), and its life insurance subsidiary, HBI Life Insurance Company (hereinafter referred to as “HBI Life”).
The Grant County Bank was chartered on August 6, 1902, and Capon Valley Bank was chartered on July 1, 1918. Both are state banks chartered under the laws of the State of West Virginia. HBI Life was chartered in April 1988 under the laws of the State of Arizona.
Services Offered by the Banks
The Banks offer all services normally offered by a full service commercial bank, including commercial and individual demand and time deposit accounts, commercial and individual loans, drive in banking services and automated teller machines. No material portion of the Banks' deposits have been obtained from a single or small group of customers and the loss of the deposits of any one customer or of a small group of customers would not have a material adverse effect on the business of the Banks. Credit life and accident and health insurance are sold to customers of the subsidiary Banks through HBI Life.
Employees
As of December 31, 2006, The Grant County Bank had 72 full time equivalent employees, Capon Valley Bank had 49 full time equivalent employees and Highlands had 3 full time equivalent employees. No person is employed by HBI Life on a full time basis.
Competition
The Banks' primary trade area is generally defined as Grant, Hardy, Mineral, Randolph, Pendleton and Tucker Counties in West Virginia, the western portion of Frederick County in Virginia and portions of Western Maryland. This area includes the towns of Petersburg, Wardensville, Moorefield and Keyser and several rural towns. The Banks' secondary trade area includes portions of Hampshire County in West Virginia. The Banks primarily compete with four state chartered banks, three national banks and three credit unions. In addition, the Banks compete with money market mutual funds and investment brokerage firms for deposits in their service area. No financial institution has been chartered in the area within the last five years although branches of state and nationally chartered banks have located in this area within this time period. Competition for new loans and deposits in the Banks' service area is quite intense.
Regulation and Supervision
The Company, as a registered bank holding company, and its subsidiary Banks, as insured depository institutions, operate in a highly regulated environment and are regularly examined by federal and state regulators. The following description briefly discusses certain provisions of federal and state laws and regulations and the potential impact of such provisions to which the Company and subsidiary are subject. These federal and state laws and regulations are designed to reduce potential loss exposure to the depositors of such depository institutions and to the Federal Deposit Insurance Corporation’s insurance fund and are not intended to protect the Company’s security holders. Proposals to change the laws and regulations governing the banking industry are frequently raised in Congress, in state legislatures, and before the various bank regulatory agencies. The likelihood and timing of any changes and the impact such changes might have on the Company are impossible to determine with any certainty. A change in applicable laws or regulations, or a change in the way such laws or regulations are interpreted by regulatory agencies or courts, may have a material impact on the business, operations and earnings of the Company. To the extent that the following information describes statutory or regulatory provisions, it is qualified entirely by reference to the particular statutory or regulatory provision.
As a bank holding company registered under the Bank Holding Company Act of 1956, as amended (the “BHCA”), the Company is subject to regulation by the Federal Reserve Board. Federal banking laws require a bank holding company to serve as a source of financial strength to its subsidiary depository institutions and to commit resources to support such institutions in circumstances where it might not do so otherwise. Additionally, the Federal Reserve Board has jurisdiction under the BHCA to approve any bank or non-bank acquisition, merger or consolidation proposed by a bank holding company. The BHCA generally limits the activities of a bank holding company and its subsidiaries to that of banking, managing or controlling banks as to be a proper incident thereto. The BHCA also prohibits a bank holding company, with certain exceptions, from acquiring more than 5% of the voting shares of any company and from engaging in any business other than banking or managing or controlling banks. The Federal Reserve Board has by regulation determined that certain activities are closely related to banking within the meaning of the BHCA. These activities include: operating a mortgage company, finance company, credit card company or factoring company; performing certain data processing operations; providing investment and financial advice; and acting as an insurance agent for certain types of credit-related insurance.
The Gramm-Leach-Bliley Act (“Gramm-Leach”) became law in November 1999. Gramm-Leach established a comprehensive framework to permit affiliations among commercial banks, investment banks, insurance companies, securities firms, and other financial service providers. Gramm-Leach permits qualifying bank holding companies to register with the Federal Reserve Board as “financial holding companies” and allows such companies to engage in a significantly broader range of financial activities than were historically permissible for bank holding companies. Although the Federal Reserve Board provides the principal regulatory supervision of financial services permitted under Gramm-Leach, the Securities and Exchange Commission and state regulators also provide substantial supervisory oversight. In addition to broadening the range of financial services a bank holding company may provide, Gramm-Leach also addressed customer privacy and information sharing issues and set forth certain customer disclosure requirements. The Company has no current plans to petition the Federal Reserve Board for consideration as a financial holding company.
The Riegle-Neal Interstate Banking and Branching Efficiency Act of 1994 (“Riegle-Neal”) permits bank holding companies to acquire banks located in any state. Riegle-Neal also allows national banks and state banks with different home states to merge across state lines and allows branch banking across state lines, unless specifically prohibited by state laws.
The International Money Laundering Abatement and Anti-Terrorist Financing Act of 2001 (USA “Patriot Act”) was adopted in response to the September 11, 2001 terrorist attacks. The Patriot Act provides law enforcement with greater powers to investigate terrorism and prevent future terrorist acts. Among the broad-reaching provisions contained in the Patriot Act are several designed to deter terrorists’ ability to launder money in the United States and provide law enforcement with additional powers to investigate how terrorists and terrorist organizations are financed. The Patriot Act creates additional requirements for banks, which were already subject to similar regulations. The Patriot Act authorizes the Secretary of Treasury to require financial institutions to take certain “special measures” when the Secretary suspects that certain transactions or accounts are related to money laundering. These special measures may be ordered when the Secretary suspects that a jurisdiction outside of the United States, a financial institution operating outside of the United States, a class of transactions involving a jurisdiction outside of the United States or certain types of accounts are of “primary money laundering concern.” The special measures include the following: (a) require financial institutions to keep records and report on transactions or accounts at issue; (b) require financial institutions to obtain and retain information related to the beneficial ownership of any account opened or maintained by foreign persons; (c) require financial institutions to identify each customer who is permitted to use the account; and (d) prohibit or impose conditions on the opening or maintaining of correspondence or payable-through accounts. Failure of a financial institution to maintain and implement adequate programs to combat money laundering and terrorist financing, or to comply with all of the relevant laws or regulations, could have serious legal and reputational consequences for the institution.
The operations of the insurance subsidiary are subject to the oversight and review of State of Arizona Department of Insurance.
On July 30, 2002, the United States Congress enacted the Sarbanes-Oxley Act of 2002, a law that addresses corporate governance, auditing and accounting, executive compensation and enhanced timely disclosure of corporate information. As Sarbanes-Oxley directs, the Company’s Chief Executive Officer and Chief Financial Officer are each required to certify that the Company’s quarterly and annual reports do not contain any untrue statement of a material fact. Additionally, these individuals must certify that: they are responsible for establishing, maintaining and regularly evaluating the effectiveness of the Company’s internal controls; they have made certain disclosures to the Company’s auditors and the Audit Committee of the Board of Directors about the Company’s internal controls; and they have included information in the Company’s quarterly and annual reports about their evaluation and whether there have been significant changes in the Company’s internal controls or in other factors that could significantly affect internal controls subsequent to the evaluations. Effective in 2007, Section 404 of Sarbanes-Oxley will become applicable to the Company.
Capital Adequacy
Federal banking regulations set forth capital adequacy guidelines, which are used by regulatory authorities to assess the adequacy of capital in examining and supervising a bank holding company and its insured depository institutions. The capital adequacy guidelines generally require bank holding companies to maintain total capital equal to at least 8% of total risk-adjusted assets, with at least one-half of total capital consisting of core capital (i.e., Tier I capital) and the remaining amount consisting of “other” capital-eligible items (i.e., Tier II capital), such as perpetual preferred stock, certain subordinated debt, and, subject to limitations, the allowance for loan losses. Tier I capital generally includes common stockholders’ equity plus, within certain limitations, perpetual preferred stock and trust preferred securities. For purposes of computing risk-based capital ratios, bank holding companies must meet specific capital guidelines that involve quantitative measures of assets, liabilities and certain off-balance sheet items, calculated under regulatory accounting practices. The Company’s and its subsidiaries’ capital accounts and classifications are also subject to qualitative judgments by the regulators about components, risk weightings, and other factors.
In addition to total and Tier I capital requirements, regulatory authorities also require bank holding companies and insured depository institutions to maintain a minimum leverage capital ratio of 3%. The leverage ratio is determined as the ratio of Tier I capital to total average assets, where average assets exclude goodwill, other intangibles, and other specifically excluded assets. Regulatory authorities have stated that minimum capital ratios are adequate for those institutions that are operationally and financially sound, experiencing solid earnings, have high levels of asset quality and are not experiencing significant growth. The guidelines also provide that banking organizations experiencing internal growth or making acquisitions will be expected to maintain strong capital positions substantially above the minimum supervisory levels. In those instances where these criteria are not evident, regulatory authorities expect, and may require, bank holding companies and insured depository institutions to maintain higher than minimum capital levels.
Additionally, federal banking laws require regulatory authorities to take “prompt corrective action” with respect to depository institutions that do not satisfy minimum capital requirements. The extent of these powers depends upon whether the institutions in question are “well capitalized”, “adequately capitalized”, “undercapitalized”, “significantly undercapitalized” or “critically undercapitalized”, as such terms are defined under uniform regulations defining such capital levels issued by each of the federal banking agencies. As an example, a depository institution that is not well capitalized is generally prohibited from accepting brokered deposits and offering interest rates on deposits higher than the prevailing rate in its market. Additionally, a depository institution is generally prohibited from making any capital distribution (including payment of a dividend) or paying any management fee to its holding company, may be subject to asset growth limitations and may be required to submit capital restoration plans if the depository institution is considered undercapitalized.
The Company’s and its subsidiaries’ regulatory capital ratios are presented in the following table:
| | Actual Ratio | Actual Ratio | Regulatory |
| | December 31, 2006 | December 31, 2005 | Minimum |
Total Risk Based Capital | | | |
| Highlands Bankshares | 13.45% | 13.85% | |
| The Grant County Bank | 12.63% | 13.67% | 8.00% |
| Capon Valley Bank | 14.56% | 13.45% | 8.00% |
| | | | |
Tier 1 Leverage Ratio | | | |
| Highlands Bankshares | 9.26% | 9.45% | |
| The Grant County Bank | 8.85% | 8.81% | 4.00% |
| Capon Valley Bank | 9.53% | 8.87% | 4.00% |
| | | | |
Tier 1 Risk Based Capital Ratio | | | |
| Highlands Bankshares | 12.21% | 12.60% | |
| The Grant County Bank | 11.39% | 12.47% | 4.00% |
| Capon Valley Bank | 13.30% | 12.20% | 4.00% |
Dividends and other Payments
The Company is a legal entity separate and distinct from its subsidiaries. Dividends and management fees from Grant County Bank and Capon Valley Bank are essentially the sole source of cash for the Company, although HBI Life will periodically pay dividends to the Company. The right of the Company, and shareholders of the Company, to participate in any distribution of the assets or earnings of Grant County Bank and Capon Valley Bank through the payment of such dividends or otherwise is necessarily subject to the prior claims of creditors of Grant County Bank and Capon Valley Bank, except to the extent that claims of the Company in its capacity as a creditor may be recognized. Moreover, there are various legal limitations applicable to the payment of dividends to the Company as well as the payment of dividends by the Company to its shareholders. Under federal law, Grant County Bank and Capon Valley Bank may not, subject to certain limited expectations, make loans or extensions of credit to, or invest in the securities of, or take securities of the Company as collateral for loans to any borrower. Grant County Bank and Capon Valley Bank are also subject to collateral security requirements for any loans or extensions of credit permitted by such exceptions.
Grant County Bank and Capon Valley Bank are subject to various statutory restrictions on their ability to pay dividends to the Company. Specifically, the approval of the appropriate regulatory authorities is required prior to the payment of dividends by Grant County Bank and Capon Valley Bank in excess of earnings retained in the current year plus retained net profits for the preceding two years. The payment of dividends by the Company, Grant County Bank and Capon Valley Bank may also be limited by other factors, such as requirements to maintain adequate capital above regulatory guidelines. The Federal Reserve Board and the Federal Deposit Insurance Corporation have the authority to prohibit any bank under their jurisdiction from engaging in an unsafe and unsound practice in conducting its business. Depending upon the financial condition of Grant County Bank and Capon Valley Bank, the payment of dividends could be deemed to constitute such an unsafe or unsound practice. The Federal Reserve Board and the FDIC have indicated their view that it generally would be an unsafe and unsound practice to pay dividends except out of current operating earnings. The Federal Reserve Board has stated that, as a matter of prudent banking, a bank or bank holding company should not maintain its existing rate of cash dividends on common stock unless (1) the organization’s net income available to common shareholders over the past year has been sufficient to fund fully the dividends and (2) the prospective rate or earnings retention appears consistent with the organization’s capital needs, asset quality, and overall financial condition. Moreover, the Federal Reserve Board has indicated that bank holding companies should serve as a source of managerial and financial strength to their subsidiary banks. Accordingly, the Federal Reserve Board has stated that a bank holding company should not maintain a level of cash dividends to its shareholders that places undue pressure on the capital of bank subsidiaries, or that can be funded only through additional borrowings or other arrangements that may undermine the bank holding company’s ability to serve as a source of strength.
Governmental Policies
The Federal Reserve Board regulates money and credit and interest rates in order to influence general economic conditions. These policies have a significant influence on overall growth and distribution of bank loans, investments and deposits and affect interest rates charged on loans or paid for time and savings deposits. Federal Reserve monetary policies have had a significant effect on the operating results of commercial banks in the past and are expected to continue to do so in the future.
Various other legislation, including proposals to overhaul the banking regulatory system and to limit the investments that a depository institution may make with insured funds, are from time to time introduced in Congress. The Company cannot determine the ultimate effect that such potential legislation, if enacted, would have upon its financial condition or operations.
Available Information
The Company files annual, quarterly and current reports, proxy statements and other information with the SEC. The Company’s SEC filings are filed electronically and are available to the public via the internet at the SEC’s website, www.sec.gov. In addition, any document filed by the Company with the SEC can be read and copies obtained at the SEC’s public reference facilities at 100 F Street, NE, Washington, DC 20549. Copies of documents can be obtained at prescribed rates by writing to the Public Reference Section of the SEC at 100 F Street NE, Washington, DC 20549. The public may obtain information on the operation of the Public Reference Room by calling the SEC at 1-800-SEC-0330. Copies of documents can also be obtained free of charge by writing to Highlands Bankshares, Inc., P.O. Box 929, Petersburg, WV 26847.
Executive Officers
Name | Age | Position with the Company | Principal Occupation (Past Five Years) |
Clarence E. Porter | 58 | President & Chief Executive Officer; Treasurer | CEO of Highlands since 2004; President of The Grant County Bank since 1991 |
R. Alan Miller | 37 | Finance Officer | Finance Officer of Highlands since 2002; Senior Manager of Finance, Cable & Wireless USA prior to 2002 |
| Alan L. Brill | 52 | Secretary; President of Capon Valley Bank | President of Capon Valley Bank since 2001 |
Due to Increased Competition, the Company May Not Be Able to Attract and Retain Banking Customers At Current Levels.
If, due to competition from competitors in the Company’s market area, the Company is unable to attract new and retain current customers, loan and deposit growth could decrease causing the Company’s results of operations and financial condition to be negatively impacted. The Company faces competition from the following:
| | · | Local, regional and national banks; |
| | · | Brokerage firms serving the Company’s market areas. |
The Company’s Lending Limit May Prevent It from Making Large Loans.
In the future, the Company may not be able to attract larger volume customers because the size of loans that the company can offer to potential customers is less than the size of the loans that many of the Company’s larger competitors can offer. We anticipate that our lending limit will continue to increase proportionately with the Company’s growth in earnings; however, the Company may not be able to successfully attract or maintain larger customers.
Certain Loans That the Banks Make Are Riskier than Loans for Real Estate Lending.
The Banks make loans that involve a greater degree of risk than loans involving residential real estate lending. Commercial business loans may involve greater risks than other types of lending because they are often made based on varying forms of collateral, and repayment of these loans often depends on the success of the commercial venture. Consumer loans may involve greater risk because adverse changes in borrowers’ incomes and employment after funding of the loans may impact their abilities to repay the loans.
The Company Is Subject to Interest Rate Risk.
Aside from credit risk, the most significant risk resulting from the Company’s normal course of business, extending loans and accepting deposits, is interest rate risk. If market interest rate fluctuations cause the Company’s cost of funds to increase faster than the yield of its interest-earning assets, then its net interest income will be reduced. The Company’s results of operations depend to a large extent on the level of net interest income, which is the difference between income from interest-earning assets, such as loans and investment securities, and interest expense on interest-bearing liabilities, such as deposits and borrowings. Interest rates are highly sensitive to many factors that are beyond the Company’s control, including general economic conditions and the policies of various governmental and regulatory authorities.
The Company May Not Be Able to Retain Key Members of Management.
The departure of one or more of the Company’s officers or other key personnel could adversely affect the Company’s operations and financial position. The Company’s management makes most decisions that involve the Company’s operations.
An Economic Slowdown in the Company’s Market Area Could Hurt Our Business.
An economic slowdown in our market area could hurt our business. An economic slowdown could have the following consequences:
| · | Loan delinquencies may increase; |
| · | Problem assets and foreclosures may increase; |
| · | Demand for the products and services of the Company may decline; and |
| · | Collateral (including real estate) for loans made by the company may decline in value, in turn reducing customers’ borrowing power and making existing loans less secure. |
The Company and the Bank are Extensively Regulated.
The operations of the Company are subject to extensive regulation by federal, state and local governmental authorities and are subject to various laws and judicial and administrative decisions imposing requirements and restrictions on them. Policies adopted or required by these governmental authorities can affect the Company’s business operations and the availability, growth and distribution of the Company’s investments, borrowings and deposits. Proposals to change the laws governing financial institutions are frequently raised in Congress and before bank regulatory authorities. Changes in applicable laws or policies could materially affect the Company’s business, and the likelihood of any major changes in the future and their effects are impossible to determine.
The Company’s Allowance for Loan Losses May Not Be Sufficient.
In the future, the Company could experience negative credit quality trends that could lead to a deterioration of asset quality. Such deterioration could require the company to incur loan charge-offs in the future and incur additional loan loss provision, both of which would have the effect of decreasing earnings. The Company maintains an allowance for possible loan losses which is a reserve established through a provision for possible loan losses charged to expense that represents management’s best estimate of probable losses that have been incurred within the existing portfolio of loans. Any increases in the allowance for possible loan losses will result in a decrease in net income and, possibly, capital, and may not have a material adverse effect on the Company’s financial condition and results of operation.
A Shareholder May Have Difficulty Selling Shares.
Because a very limited public market exists for the Company’s common stock, a shareholder may have difficulty selling his or her shares in the secondary market. We cannot predict when, if ever, we could meet the listing qualifications of the Nasdaq Stock Market’s National Market Tier or any exchange. We cannot assure investors that there will be a more active public market for the shares in the near future.
Shares of the Company’s Common Stock Are Not FDIC Insured.
Neither the Federal Deposit Insurance Corporation nor any other governmental agency insures the shares of the Company’s common stock. Therefore, the value of investors’ shares in the Company will be based on their market value and may decline.
Customers May Default on the Repayment of Loans.
The Bank’s customers may default on the repayment of loans, which may negatively impact the Company’s earnings due to loss of principal and interest income. Increased operating expenses may result from the allocation of management time and resources to the collection and workout of the loan. Collection efforts may or may not be successful causing the Company to write off the loan or repossess the collateral securing the loan, which may or may not exceed the balance of the loan.
The Company’s Controls and Procedures May Fail or Be Circumvented.
Management regularly reviews and updates the Company’s internal controls, disclosure controls and procedures, and corporate governance policies and procedures. Any system of controls, no matter how well designed and operated, is based in part on certain assumptions and can provide only reasonable, not absolute, assurances that the objectives of the system are met. Any failure or circumvention of the Company’s controls and procedures or failure to comply with regulations related to controls and procedures could have a material adverse effect on the Company’s business, results of operations and financial conditions.
| Unresolved Staff Comments |
None
Location | | Description |
| 3 N. Main Street, Petersburg, WV 26847 | | Primary Office, The Grant County Bank |
| Route 33, Riverton, WV 26814 | | Branch Office, The Grant County Bank |
| 500 S. Main Street, Moorefield, WV 26836 | | Branch Office, The Grant County Bank |
| Route 220 & Josie Dr., Keyser, WV 26726 | | Branch Office, The Grant County Bank |
| Main Street, Harman, WV 26270 | | Branch Office, The Grant County Bank |
| William Avenue, Davis, WV 26260 | | Branch Office, The Grant County Bank |
| Route 32 & Cortland Rd., Davis, WV 26260 | | Branch Office, The Grant County Bank |
| 2 W. Main Street, Wardensville, WV 26851 | | Primary Office, Capon Valley Bank |
| 717 N. Main Street, Moorefield, WV 26836 | | Branch Office, Capon Valley Bank |
| Route 55, Baker, WV 26801 | | Branch Office, Capon Valley Bank |
| 6701 Northwestern Pike, Gore, VA 22637 | | Branch Office, Capon Valley Bank |
All facilities are owned by the Company.
Management is not aware of any material pending or threatened litigation in which Highlands or its subsidiaries may be involved as a defendant. In the normal course of business, the Banks periodically must initiate suits against borrowers as a final course of action in collecting past due loans.
| Submission of Matters to a Vote of Security Holders |
Highlands Bankshares, Inc. did not submit any matters to a vote of security holders during the fourth quarter of 2006.
| Market for Registrant’s Common Equity, Related Stockholder Matters and Issuer Purchases of Equity Securities |
The Company had approximately 1,100 shareholders of record as of December 31, 2006. This amount includes all shareholders, whether titled individually or held by a brokerage firm or custodian in street name. The Company's stock is not traded on any national or regional stock exchange although brokers may occasionally initiate or be a participant in a trade. The Company’s stock is listed on the Over The Counter Bulletin Board. Terms of an exchange between individual parties may not be known to the Company.
The following table outlines the dividends paid and market prices of the Company's stock based on prices disclosed to management. Prices have been provided using a nationally recognized online stock quote system. Such prices may not include retail mark-ups, mark-downs or commissions. Dividends are subject to the restrictions described in Note 10 to the Financial Statements.
| | | | Estimated Market Price Range |
2006 | | Dividends Per Share | High | Low |
| First Quarter | | .23 | 32.25 | 31.00 |
| Second Quarter | | .23 | 32.50 | 31.15 |
| Third Quarter | | .23 | 32.50 | 31.03 |
| Fourth Quarter | | .25 | 32.75 | 31.50 |
| | | | | |
2005 | | | | |
| First Quarter | | .20 | 28.90 | 24.80 |
| Second Quarter | | .20 | 29.10 | 26.74 |
| Third Quarter | | .20 | 30.79 | 28.11 |
| Fourth Quarter | | .22 | 32.00 | 30.79 |
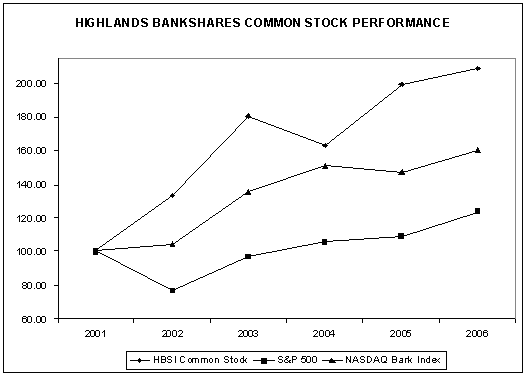
Set forth below is a line graph comparing the cumulative total return of Highlands Bankshares’ common stock from December 31, 2000 assuming reinvestment of dividends, with that of the Standard & Poor's 500 Index ("S&P 500") and the the Nasdaq Bank Index.
| | | Years Ending December 31, | |
| | | (in thousands of dollars, except for per share amounts) | |
| | | 2006 | | 2005 | | 2004 | | 2003 | | 2002 | |
| Total Interest Income | | $ | 23,894 | | $ | 19,813 | | $ | 17,729 | | $ | 18,283 | | $ | 18,970 | |
| Total Interest Expense | | | 7,909 | | | 5,761 | | | 4,711 | | | 6,338 | | | 7,705 | |
| Net Interest Income | | | 15,985 | | | 14,052 | | | 13,018 | | | 11,945 | | | 11,265 | |
| | | | | | | | | | | | | | | | | |
| Provision for Loan Losses | | | 682 | | | 875 | | | 920 | | | 1,820 | | | 820 | |
| | | | | | | | | | | | | | | | | |
| Net Interest Income After Provision for Loan Losses | | | 15,303 | | | 13,177 | | | 12,098 | | | 10,125 | | | 10,445 | |
| | | | | | | | | | | | | | | | | |
| Other Income | | | 1,997 | | | 1,669 | | | 1,597 | | | 1,367 | | | 1,304 | |
| Other Expenses | | | 10,394 | | | 9,128 | | | 8,938 | | | 8,247 | | | 8,048 | |
| | | | | | | | | | | | | | | | | |
| Income Before Income Taxes | | | 6,906 | | | 5,718 | | | 4,757 | | | 3,245 | | | 3,701 | |
| | | | | | | | | | | | | | | | | |
| Income Tax Expense | | | 2,391 | | | 1,916 | | | 1,551 | | | 1,012 | | | 1,179 | |
| | | | | | | | | | | | | | | | | |
| Net Income | | $ | 4,515 | | $ | 3,802 | | $ | 3,206 | | $ | 2,233 | | $ | 2,522 | |
| | | | | | | | | | | | | | | | | |
| Total Assets at Year End | | $ | 357,316 | | $ | 337,573 | | $ | 299,992 | | $ | 301,168 | | $ | 296,672 | |
| Long Term Debt at Year End | | $ | 14,992 | | $ | 15,063 | | $ | 8,377 | | $ | 5,295 | | $ | 4,030 | |
| | | | | | | | | | | | | | | | | |
| Net Income Per Share of Common Stock | | $ | 3.14 | | $ | 2.65 | | $ | 2.23 | | $ | 1.55 | | $ | 1.73 | |
| Dividends Per Share of Common Stock | | $ | .94 | | $ | .82 | | $ | .63 | | $ | .56 | | $ | .51 | |
| | | | | | | | | | | | | | | | | |
| Return on Average Assets | | | 1.29 | % | | 1.21 | % | | 1.07 | % | | .73 | % | | .89 | % |
| Return on Average Equity | | | 12.67 | % | | 11.53 | % | | 10.36 | % | | 7.60 | % | | 8.87 | % |
| Dividend Payout Ratio | | | 29.91 | % | | 30.99 | % | | 28.23 | % | | 36.03 | % | | 29.26 | % |
| Year End Equity to Assets Ratio | | | 10.38 | % | | 10.07 | % | | 10.55 | % | | 9.81 | % | | 9.69 | % |
| | | | | | | | | | | | | | | | | |
| 2002 per share figures restated to reflect stock split effected in form of dividend in 2002 |
| Management’s Discussion and Analysis of Financial Condition and Results of Operations |
Forward Looking Statements
Certain statements in this report may constitute “forward-looking statements” within the meaning of the Private Securities Litigation Reform Act of 1995. Forward-looking statements are statements that include projections, predictions, expectations or beliefs about future events or results or otherwise are not statements of historical fact. Such statements are often characterized by the use of qualified words (and their derivatives) such as “expect,” “believe,” “estimate,” “plan,” “project,” “anticipate” or other similar words. Although the Company believes that its expectations with respect to certain forward-looking statements are based upon reasonable assumptions within the bounds of its existing knowledge of its business and operations, there can be no assurance that actual results, performance or achievements of the Company will not differ materially from any future results, performance or achievements expressed or implied by such forward-looking statements. Actual future results and trends may differ materially from historical results or those anticipated depending on a variety of factors, including, but not limited to, the effects of and changes in: general economic conditions, the interest rate environment, legislative and regulatory requirements, competitive pressures, new products and delivery systems, inflation, changes in the stock and bond markets, technology, downturns in the trucking and timber industries, effects of mergers and/or downsizing in the poultry industry in Hardy County, and consumer spending and savings habits. Additionally, actual future results and trends may differ from historical or anticipated results to the extent: (1) any significant downturn in certain industries, particularly the trucking and timber and coal extraction industries are experienced; (2) loan demand decreases from prior periods; (3) the Company may make additional loan loss provisions due to negative credit quality trends in the future that may lead to a deterioration of asset quality; (4) the Company may not continue to experience significant recoveries of previously charged-off loans or loans resulting in foreclosure; (5) increased liquidity needs may cause an increase in funding costs; and, (6) the Company is unable to control costs and expenses as anticipated. The Company does not update any forward-looking statements that may be made from time to time by or on behalf of the Company.
Introduction
The following discussion focuses on significant results of the Company’s operations and significant changes in our financial condition or results of operations for the periods indicated in the discussion. This discussion should be read in conjunction with the preceding financial statements and related notes. Current performance does not guarantee, and may not be indicative of, similar performance in the future.
Critical Accounting Policies
The Company’s financial statements are prepared in accordance with accounting principles generally accepted in the United States (“GAAP”). The financial statements contained within these statements are, to a significant extent, financial information that is based on measures of the financial effects of transactions and events that have already occurred. A variety of factors could affect the ultimate value that is obtained either when earning income, recognizing an expense, recovering an asset or relieving a liability. In addition, GAAP itself may change from one previously acceptable method to another method. Although the economics of these transactions would be the same, the timing of events that would impact these transactions could change.
Allowance for Loan Losses
The allowance for loan losses is an estimate of the losses in the loan portfolio. The allowance is based on two basic principles of accounting: (i) SFAS No. 5, Accounting for Contingencies, which requires that losses be accrued when they are probable of occurring and estimable and (ii) SFAS No. 114, Accounting by Creditors for Impairment of a Loan, which requires that losses be accrued based on the differences between the value of collateral, present value of future cash flows or values that are observable in the secondary market and the loan balance.
The Company’s allowance for loan losses is the accumulation of various components that are calculated based on independent methodologies. All components of the allowance represent an estimation performed pursuant to either SFAS No. 5 or SFAS No. 114. Management’s estimate of each SFAS No. 5 component is based on certain observable data that management believes are most reflective of the underlying credit losses being estimated. This evaluation includes credit quality trends; collateral values; loan volumes; geographic, borrower and industry concentrations; seasoning of the loan portfolio; the findings of internal credit quality assessments and results from external bank regulatory examinations. These factors, as well as historical losses and current economic and business conditions, are used in developing estimated loss factors used in the calculations.
Reserves for commercial loans are determined by applying estimated loss factors to the portfolio based on management’s evaluation and “risk grading” of the commercial loan portfolio. Reserves are provided for noncommercial loan categories using estimated loss factors applied to the total outstanding loan balance of each loan category. Specific reserves are typically provided on all impaired commercial loans in excess of a defined threshold that are classified in the Special Mention, Substandard or Doubtful risk grades. The specific reserves are determined on a loan-by-loan basis based on management’s evaluation the Company’s exposure for each credit, given the current payment status of the loan and the value of any underlying collateral.
While management uses the best information available to establish the allowance for loan and lease losses, future adjustments to the allowance may be necessary if economic conditions differ substantially from the assumptions used in making the valuations or, if required by regulators, based upon information available to them at the time of their examinations. Such adjustments to original estimates, as necessary, are made in the period in which these factors and other relevant considerations indicate that loss levels may vary from previous estimates.
Post Retirement Benefits and Life Insurance Investments
The Company has invested in and owns life insurance polices on key officers. The policies are designed so that the company recovers the interest expenses associated with carrying the policies and the officer will, at the time of retirement, receive any earnings in excess of the amounts earned by the Company. The Company recognizes as an asset the net amount that could be realized under the insurance contract as of the balance sheet date. This amount represents the cash surrender value of the policies less applicable surrender charges. The portion of the benefits, which will be received by the executives at the time of their retirement, is considered, when taken collectively, to constitute a retirement plan. Therefore the Company accounts for these policies using guidance found in Statement of Financial Accounting Standards No. 106, "Employers' Accounting for Post Retirement Benefits Other Than Pensions.” SFAS No. 106 requires that an employers' obligation under a deferred compensation agreement be accrued over the expected service life of the employee through their normal retirement date.
Assumptions are used in estimating the present value of amounts due officers after their normal retirement date. These assumptions include the estimated income to be derived from the investments and an estimate of the Company’s cost of funds in these future periods. In addition, the discount rate used in the present value calculation will change in future years based on market conditions.
Intangible Assets
Generally accepted accounting principles were applied to allocate the intangible components of the purchase of the National Bank of Davis in November 2005. This excess was allocated between identifiable intangibles (i.e. core deposit intangibles) and unidentified intangibles (i.e. goodwill). Goodwill is required to be evaluated for impairment on an annual basis, and the value of the goodwill adjusted accordingly, should impairment be found. As of December 31, 2006, the Company did not identify an impairment of this intangible.
Recent Accounting Pronouncements
In September 2006, the FASB issued Statement of Financial Accounting Standards No. 158, “Employers Accounting for Defined Benefit Pension and Other Postretirement Plans—an amendment of FASB Statements No. 87, 88, 106 and 132R” (SFAS 158). SFAS 158 requires an employer to recognize the over-funded or under-funded status of a defined benefit postretirement plan as an asset or liability in its statement of financial position and to recognize changes in that funded status, through comprehensive income, in the year in which the changes occur. The funded status of a benefit plan will be measured as the difference between plan assets at fair value and benefit obligation. For any other postretirement plan, the benefit obligation is the accumulated postretirement benefit obligation. SFAS 158 also requires an employer to measure the funded status of a plan as of the date of its year-end statement of financial position. The Statement also requires additional disclosures in the notes to financial statements about certain effects on net periodic benefit cost for the next fiscal year that arise from delayed recognition of the gains or losses, prior service costs or credits, and transition asset or obligation. Under SFAS 158 a company is required to initially recognize the funded status of a defined benefit postretirement plan to provide the required disclosures as of the end of the fiscal year ending after December 15, 2006. The requirement to measure plan assets and benefit obligations as of the date of the employer’s fiscal year end statement of financial position is effective for fiscal years ending after December 15, 2008. The Grant County Bank is a member of the West Virginia Bankers' Association Retirement Plan, a defined benefit plan under SFAS 158.
No other recent accounting pronouncements had a material impact on the Company’s consolidated financial statements.
Overview of 2006 Results
Highlands Bankshares experienced an 18.75% increase in net income for 2006 as compared to 2005. Increases in net interest income, driven by balance sheet increases and a net interest margin of 5.05%, and an increase of $328,000 in non-interest income offset increases in non-interest expense. Return on Average Assets (ROAA) for 2006 was 1.29% compared to an ROAA in 2005 of 1.21%. Return on Average Equity (ROAE) for the year was 12.67% compared to ROAE of 11.53% for 2005. Earnings per share increased from $2.65 in 2005 to $3.14 in 2006.
Total assets grew 5.85% from December 31, 2005 to December 31, 2006. Average earning assets were 8.72% greater in 2006 than during 2005. Loan balances continue to make up the bulk of earning assets. During 2006 average loan balances represented 87.47% of total average balances of earning assets.
The Company’s provision for loan losses during 2006 was $193,000 less than that taken in 2005. In spite of the decrease in provision, the ratio of the allowance for loan losses to gross loans increased from 1.16 at December 31, 2005 to 1.19 at December 31, 2006 as net loan charge-offs, as a percentage of gross loans, fell from .17% in 2005 to .11% in 2006.
Due largely to an increase in service fees on deposit accounts, non-interest income increased 19.65%. In addition to the increase in service fees, the Company experienced an increase in earnings on investments in life insurance policies, mainly as the result of a $155,000 one-time gain from the settlement of two of these policies. Insurance earnings declined significantly from 2005 to 2006, as over the past several years the volume of new consumer installment loans, the primary market for the Company’s insurance products, has declined.
Due largely to the general increase in operational size, and, to a lesser degree, due to normal inflationary pressures on costs, non-interest expense increased 13.87% in 2006 as compared to 2005. Of the increase in non-interest expense, the majority was an increase in the cost of salaries and employee benefits, though occupancy and equipment expense and data processing expense also experienced year over year increases.
Highlands' results of operations are discussed in greater detail following this overview.
The following table illustrates Highlands’ quarterly financial results for the year ended December 31, 2006 (in thousands of dollars):
| Quarterly Financial Results | |
| For The Year Ended December 31, 2006 | |
| (in thousands, except per share amounts) | |
| | |
| | | Fourth Quarter | | Third Quarter | | Second Quarter | | First Quarter | |
| Total Interest Income | | $ | 6,477 | | $ | 6,140 | | $ | 5,735 | | $ | 5,542 | |
| Total Interest Expense | | | 2,338 | | | 2,047 | | | 1,831 | | | 1,693 | |
| Net Interest Income | | | 4,139 | | | 4,093 | | | 3,904 | | | 3,849 | |
| | | | | | | | | | | | | | |
| Provision for Loan Losses | | | 173 | | | 155 | | | 176 | | | 177 | |
| | | | | | | | | | | | | | |
| Net Interest Income After Provision for Loan Losses | | | 3,966 | | | 3,938 | | | 3,728 | | | 3,671 | |
| | | | | | | | | | | | | | |
| Other Income | | | 442 | | | 469 | | | 647 | | | 439 | |
| Other Expenses | | | 2,619 | | | 2,619 | | | 2,615 | | | 2,541 | |
| | | | | | | | | | | | | | |
| Income Before Income Taxes | | | 1,789 | | | 1,788 | | | 1,760 | | | 1,569 | |
| | | | | | | | | | | | | | |
| Income Tax Expense | | | 635 | | | 632 | | | 559 | | | 565 | |
| | | | | | | | | | | | | | |
| Net Income | | $ | 1,154 | | $ | 1,156 | | $ | 1,201 | | $ | 1,004 | |
| | | | | | | | | | | | | | |
| Net Income Per Share of Common Stock | | $ | .80 | | $ | .80 | | $ | .84 | | $ | .70 | |
| Dividends Per Share of Common Stock | | $ | .25 | | $ | .23 | | $ | .23 | | $ | .23 | |
The following table illustrates Highlands’ quarterly financial results for the year ended December 31, 2006 (in thousands of dollars):
| Quarterly Financial Results | |
| For The Year Ended December 31, 2005 | |
| (in thousands, except per share amounts) | |
| | |
| | | Fourth Quarter | | Third Quarter | | Second Quarter | | First Quarter | |
| Total Interest Income | | $ | 5,406 | | $ | 5,008 | | $ | 4,783 | | $ | 4,616 | |
| Total Interest Expense | | | 1,612 | | | 1,493 | | | 1,392 | | | 1,264 | |
| Net Interest Income | | | 3,794 | | | 3,515 | | | 3,391 | | | 3,352 | |
| | | | | | | | | | | | | | |
| Provision for Loan Losses | | | 185 | | | 255 | | | 210 | | | 225 | |
| | | | | | | | | | | | | | |
| Net Interest Income After Provision for Loan Losses | | | 3,609 | | | 3,260 | | | 3,181 | | | 3,127 | |
| | | | | | | | | | | | | | |
| Other Income | | | 415 | | | 445 | | | 445 | | | 364 | |
| Other Expenses | | | 2,390 | | | 2,299 | | | 2,229 | | | 2,210 | |
| | | | | | | | | | | | | | |
| Income Before Income Taxes | | | 1,634 | | | 1,406 | | | 1,397 | | | 1,281 | |
| | | | | | | | | | | | | | |
| Income Tax Expense | | | 542 | | | 463 | | | 479 | | | 432 | |
| | | | | | | | | | | | | | |
| Net Income | | $ | 1,092 | | $ | 943 | | $ | 918 | | $ | 849 | |
| | | | | | | | | | | | | | |
| Net Income Per Share of Common Stock | | $ | .76 | | $ | .66 | | $ | .64 | | $ | .59 | |
| Dividends Per Share of Common Stock | | $ | .22 | | $ | .20 | | $ | .20 | | $ | .20 | |
Impact of Acquisition on Operational Results
During the fourth quarter of 2005, the Company acquired two additional branches through the purchase of the National Bank of Davis. Further information regarding this purchase can be found in the Company’s Annual Report on Form 10-K for 2005. This acquisition has significantly impacted the results of operations for 2006, both in revenues and costs.
The acquisition added significant balances of both earning assets and interest bearing liabilities to the Company’s operations. The addition of these assets and liabilities has impacted the asset/liability management strategy of the Company, specifically The Grant County Bank into which the branches were integrated. Because of the full integration of these assets and liabilities, determination of the exact dollar amount of the impact on the Company’s net interest income is difficult to determine. However, the addition has increased net interest income as compared to 2005 both because of the increased balances of earning assets and interest bearing liabilities and because of the increased options for asset/liability management resulting from the purchase.
The addition of two branches and eleven full time equivalent employees as the result of the purchase of the National Bank of Davis has also caused an increase in non-interest expense. Specifically, occupancy and equipment expense has increased because of the added physical locations. Salary and benefits expense have increased because of the additional employees, and data processing expense has increased because of the additional loan and deposit customers. Additionally, certain other non-interest expenses have increased because of the acquisition.
Non-interest income has also been impacted by the acquisition, but to a lesser degree than the impact of the acquisition on net interest income and non-interest expense.
Net Interest Income
2006 Compared to 2005
The acquisition of the branches, as discussed earlier, has had significant impact on the Company’s net interest income. The following discussion highlights recent trends in the Company’s management of its net interest margin. The comparison of net interest income in 2006 as compared to 2005, as discussed below, should be considered in conjunction with the comments relating to the impact on net interest income of the acquisition of the National Bank of Davis, found earlier in Management’s Discussion and Analysis under the heading of “Impact of Acquisition on Operational Results.”
Net interest income, on a fully taxable equivalent basis, increased 13.73% from 2005 to 2006. This increase is both attributable to a general growth in the Company’s net interest balance sheet and also to increases in rates. Though the relative mix of earning assets and earning liabilities and also the ratio of earning assets to earning liabilities was roughly similar from 2005 to 2006 and therefore changes in the mix of these assets and liabilities or the ratio of the same did not contribute greatly to the increase in net interest income, the ratio of assets to liabilities and the percentage of earning assets made up of higher earning loan balances continues to be favorable to the Company’s net interest income and also its net interest margin.
Average balances of earning assets increased 8.72% from 2005 to 2006 and the ratio of earning assets to earning liabilities remained steady, 1.24 in 2006 and 1.25 in 2005. Average balances of interest bearing liabilities increased 9.26%.
As the Federal Reserve Board (“the Fed”) continued to increase rates into the early portions of 2006, the Company continued to experience average rate increases on both earnings of assets and on the costs of interest bearing liabilities. The increase in the average rates earned on interest earning assets of 74 basis points outpaced the average rates paid on interest bearing liabilities, which experienced a 64 basis point increase. Due to the rate increases by the Fed, rates earned on new loan balances continue to increase and due to the volume of adjustable rate mortgages in the Company’s portfolio, a significant portion of existing loan balances continue to reprice upward. This increase in rates earned on loans has been offset to some extent by higher rates paid on new time deposits, and as older time deposits mature and are renewed, higher rates are paid on the renewed balances.
During the later portions of 2006, the Fed halted its increases in the target rate for Federal Funds and rates have flattened as a result. If the Fed continues its pattern into the coming periods of holding rates constant, the Company expects average rates on loans and deposits to continue to increase as new loans and deposits are made and older loans and deposits mature or are repriced at higher rates. However, management anticipates that a Fed pattern of constant rates will cause the increase in average rates to slow somewhat.
During the past several years, management has undertaken a strategy of funding loan growth by reductions in balances of comparatively lower earning assets such as federal funds sold and securities, rather than pay above market rates to obtain new deposits. Management weighed the relative cost of these deposits versus earning on certain assets in making this decision. During 2006, the relative earnings of federal funds sold and securities as compared to loans increased. This increase, coupled with strong loan demand created a need for a change in the funding strategy. During the later portions of 2006, the Company began offering competitive rates to attract new deposit balances with which to fund new loan growth. The resulting increase in interest bearing liabilities has not negatively impacted net interest margin. Although significant loan growth may create a need for corresponding deposit growth, and to obtain this growth, the Company may be required to pay above market rates to obtain new deposit balances. Management anticipates that net interest income will continue to not be adversely impacted, though net interest margin percentages may decline.
The table below sets forth an analysis of net interest income for the years ended December 31, 2006 and 2005 (average balances and interest income/expense shown in thousands of dollars):
| | | 2006 | | 2005 | |
| | | Average Balance | | Income /Expense | | Yield /Rate | | Average Balance | | Income /Expense | | Yield /Rate | |
| | | | | | | | | | | | | | |
| Earning Assets | | | | | | | | | | | | | | | | | | | |
| Loans | | $ | 277,871 | | $ | 22,118 | | | 7.96 | % | $ | 254,700 | | $ | 18,622 | | | 7.31 | % |
| Taxable investment securities | | | 24,970 | | | 1,095 | | | 4.39 | % | | 23,313 | | | 707 | | | 3.03 | % |
| Nontaxable investment securities | | | 2,987 | | | 173 | | | 5.79 | % | | 2,951 | | | 163 | | | 5.52 | % |
| Interest bearing deposits | | | 1,576 | | | 72 | | | 4.57 | % | | 1,268 | | | 38 | | | 3.00 | % |
| Federal funds sold | | | 10,287 | | | 500 | | | 4.87 | % | | 9,970 | | | 343 | | | 3.44 | % |
| Total Earning Assets | | | 317,691 | | | 23,958 | | | 7.54 | % | | 292,202 | | | 19,873 | | | 6.80 | % |
| | | | | | | | | | | | | | | | | | | | |
| Allowance for loan losses | | | (3,283 | ) | | | | | | | | (2,807 | ) | | | | | | |
| Other non-earning assets | | | 28,648 | | | | | | | | | 25,291 | | | | | | | |
| | | | | | | | | | | | | | | | | | | | |
| Total Assets | | $ | 343,056 | | | | | | | | $ | 314,686 | | | | | | | |
| | | | | | | | | | | | | | | | | | | | |
| Interest Bearing Liabilities | | | | | | | | | | | | | | | | | | | |
| Demand deposits | | $ | 25,658 | | $ | 224 | | | .87 | % | $ | 23,554 | | $ | 189 | | | .80 | % |
| Savings deposits | | | 50,235 | | | 549 | | | 1.09 | % | | 49,391 | | | 437 | | | .88 | % |
| Time deposits | | | 164,005 | | | 6,429 | | | 3.92 | % | | 146,211 | | | 4,504 | | | 3.08 | % |
| Borrowed money | | | 15,643 | | | 707 | | | 4.52 | % | | 14,728 | | | 631 | | | 4.28 | % |
| Total Interest Bearing Liabilities | | | 255,541 | | | 7,909 | | | 3.10 | % | | 233,884 | | | 5,761 | | | 2.46 | % |
| | | | | | | | | | | | | | | | | | | | |
| Demand deposits | | | 48,056 | | | | | | | | | 41,360 | | | | | | | |
| Other liabilities | | | 3,810 | | | | | | | | | 6,459 | | | | | | | |
| Stockholders’ equity | | | 35,649 | | | | | | | | | 32,983 | | | | | | | |
| | | | | | | | | | | | | | | | | | | | |
| Total Liabilities and Stockholders’ Equity | | $ | 343,056 | | | | | | | | $ | 314,686 | | | | | | | |
| | | | | | | | | | | | | | | | | | | | |
| Net Interest Income | | | | | $ | 16,049 | | | | | | | | $ | 14,112 | | | | |
| Net Yield on Earning Assets | | | | | | | | | 5.05 | % | | | | | | | | 4.83 | % |
| | | | | | | | | | | | | | | | | | | | |
| Notes: | | | | | | | | | | | | | | | | | | | |
| (1) Yields are computed on a taxable equivalent basis using a 37% tax rate |
| (2) Average balances are based upon daily balances |
| (3) Includes loans in non-accrual status |
| (4) Income on loans includes fees |
The table below illustrates the effects on net interest income of changes in average volumes of interest bearing liabilities and earning assets from 2005 to 2006 and changes in average rates on interest bearing liabilities and earning assets from 2005 to 2006 (in thousands of dollars):
| EFFECT OF RATE-VOLUME CHANGES ON NET INTEREST INCOME | |
| (On a fully taxable equivalent basis) | |
| (In thousands of dollars) | |
| | | | | | | | |
| Increase (Decrease) 2006 Compared to 2005 | |
| | | | | | | | |
| | | Due to change in: | | | |
| | | Average Volume | | Average Rate | | Total Change | |
| Interest Income | | | | | | | | | | |
| Loans | | $ | 1,694 | | $ | 1,802 | | $ | 3,496 | |
| Taxable investment securities | | | 50 | | | 338 | | | 388 | |
| Nontaxable investment securities | | | 2 | | | 8 | | | 10 | |
| Interest bearing deposits | | | 9 | | | 25 | | | 34 | |
| Federal funds sold | | | 11 | | | 146 | | | 157 | |
| Total Interest Income | | | 1,766 | | | 2,319 | | | 4,085 | |
| | | | | | | | | | | |
| Interest Expense | | | | | | | | | | |
| Demand deposits | | | 17 | | | 18 | | | 35 | |
| Savings deposits | | | 7 | | | 105 | | | 112 | |
| Time deposits | | | 548 | | | 1,377 | | | 1,925 | |
| Borrowed money | | | 39 | | | 37 | | | 76 | |
| Total Interest Expense | | | 611 | | | 1,537 | | | 2,148 | |
| | | | | | | | | | | |
| Net Interest Income | | $ | 1,155 | | $ | 782 | | $ | 1,937 | |
Changes in volume are calculated based on the difference in average balance multiplied by the prior year average rate. Changes due to rate changes are calculated by subtracting the change due to volume from the total change.
2005 Compared to 2004
Net interest income, on a fully taxable equivalent basis, increased 7.81% in 2005 as compared to 2004. As the Federal Reserve Board (the “Fed”) continued to increase the target rates for federal funds, both interest rates paid on deposits and interest earned on assets increased. The increases by the Fed had the greatest impact on the rates earned on federal funds sold, deposits in other banks and on interest bearing deposits. Average balances of earning assets increased $12.39 million while average balances of interest bearing liabilities increased only $5.68 million. This relative increase, coupled with increases in loan balances, (a comparatively higher earning asset as a percentage of total average earning assets) had the greatest impact in the increase in net interest income and the increase of 15 basis points in net interest margin.
Throughout 2004 and into the early part of 2005, the Company chose to fund loan growth through the reduction of balances of federal funds sold, deposits in other banks and securities (relatively low earning assets) rather than pay above market rates to attract new deposits. This strategy caused overall average balances of interest bearing deposits to decrease slightly, investments in securities to decrease moderately and federal funds sold to decrease substantially. Average rates paid on interest bearing liabilities increased 40 basis points from 2004 to 2005 compared to the slightly larger 44 basis point increase experienced with interest earning assets.
While the rate increases enacted by the Fed had an immediate impact on the yields of federal funds sold and interest bearing deposits, continued heavy competition for new loans caused a more subdued increase in average rates earned on loans.
In addition to funding loan growth through reductions in balances of relatively lower earning assets, the Company also chose to utilize its borrowing capacity from the Federal Home Loan Bank (“FHLB”) more in 2005 than in the past. The lending options offered by the FHLB allowed the subsidiary Banks to borrow in certain instances at favorable rates and/or favorable repayment terms and assist in the Company’s management of its assets and liabilities.
Average balances of many of the categories of both earning assets and interest bearing liabilities were increased by the purchase of The National Bank of Davis (“Davis”). However, because this purchase occurred late in 2005, and because of the relatively small size of Davis compared to Highlands Bankshares, the impact on net interest margin for 2005 was not significant. At the time of purchase, Davis had a comparatively conservative balance sheet. Davis’ loan to deposit ratio at the time of purchase was 33.14% and Davis’ ratio of earning assets to interest bearing liabilities was 84.45% compared to a Highlands 2005 average ratio of earning assets to interest bearing liabilities of 124.93%.
The table below sets forth an analysis of net interest income for the years ended December 31, 2005 and 2004 (average balances and interest income/expense shown in thousands of dollars):
| | | 2005 | | 2004 | |
| | | Average Balance | | Income /Expense | | Yield /Rate | | Average Balance | | Income /Expense | | Yield /Rate | |
| | | | | | | | | | | | | | |
| Earning Assets | | | | | | | | | | | | | | | | | | | |
| Loans | | $ | 254,700 | | $ | 18,622 | | | 7.31 | % | $ | 235,023 | | $ | 16,752 | | | 7.13 | % |
| Taxable investment securities | | | 23,313 | | | 707 | | | 3.03 | % | | 25,944 | | | 674 | | | 2.60 | % |
| Nontaxable investment securities | | | 2,951 | | | 163 | | | 5.52 | % | | 3,298 | | | 194 | | | 5.89 | % |
| Interest bearing deposits | | | 1,268 | | | 38 | | | 3.00 | % | | 1,430 | | | 18 | | | 1.26 | % |
| Federal funds sold | | | 9,970 | | | 343 | | | 3.44 | % | | 14,119 | | | 163 | | | 1.15 | % |
| Total Earning Assets | | | 292,202 | | | 19,873 | | | 6.80 | % | | 279,814 | | | 17,801 | | | 6.36 | % |
| | | | | | | | | | | | | | | | | | | | |
| Allowance for loan losses | | | (2,807 | ) | | | | | | | | (2,418 | ) | | | | | | |
| Other non-earning assets | | | 25,291 | | | | | | | | | 23,024 | | | | | | | |
| | | | | | | | | | | | | | | | | | | | |
| Total Assets | | $ | 314,686 | | | | | | | | $ | 300,420 | | | | | | | |
| | | | | | | | | | | | | | | | | | | | |
| Interest Bearing Liabilities | | | | | | | | | | | | | | | | | | | |
| Demand deposits | | $ | 23,554 | | $ | 189 | | | .80 | % | $ | 24,031 | | $ | 95 | | | .40 | % |
| Savings deposits | | | 49,391 | | | 437 | | | .88 | % | | 52,079 | | | 296 | | | .57 | % |
| Time deposits | | | 146,211 | | | 4,504 | | | 3.08 | % | | 145,834 | | | 4,042 | | | 2.77 | % |
| Borrowed money | | | 14,728 | | | 631 | | | 4.28 | % | | 6,264 | | | 278 | | | 4.44 | % |
| Total Interest Bearing Liabilities | | | 233,884 | | | 5,761 | | | 2.46 | % | | 228,208 | | | 4,711 | | | 2.06 | % |
| | | | | | | | | | | | | | | | | | | | |
| Demand deposits | | | 41,360 | | | | | | | | | 37,325 | | | | | | | |
| Other liabilities | | | 6,459 | | | | | | | | | 3,954 | | | | | | | |
| Stockholders’ equity | | | 32,983 | | | | | | | | | 30,933 | | | | | | | |
| | | | | | | | | | | | | | | | | | | | |
| Total Liabilities and Stockholders’ Equity | | $ | 314,686 | | | | | | | | $ | 300,420 | | | | | | | |
| | | | | | | | | | | | | | | | | | | | |
| Net Interest Income | | | | | $ | 14,112 | | | | | | | | $ | 13,090 | | | | |
| Net Yield on Earning Assets | | | | | | | | | 4.83 | % | | | | | | | | 4.68 | % |
| | | | | | | | | | | | | | | | | | | | |
| Notes: | | | | | | | | | | | | | | | | | | | |
| (1) Yields are computed on a taxable equivalent basis using a 37% tax rate |
| (2) Average balances are based upon daily balances |
| (3) Includes loans in non-accrual status |
| (4) Income on loans includes fees |
The table below illustrates the effects on net interest income of changes in average volumes of interest bearing liabilities and earning assets from 2004 to 2005 and changes in average rates on interest bearing liabilities and earning assets from 2004 to 2005 (in thousands of dollars):
| EFFECT OF RATE-VOLUME CHANGES ON NET INTEREST INCOME | |
| (On a fully taxable equivalent basis) | |
| (In thousands of dollars) | |
| | | | | | | | |
| Increase (Decrease) 2005 Compared to 2004 | |
| | | | | | | | |
| | | Due to change in: | | | |
| | | Average Volume | | Average Rate | | Total Change | |
| Interest Income | | | | | | | | | | |
| Loans | | $ | 1,402 | | $ | 468 | | $ | 1,870 | |
| Taxable investment securities | | | (68 | ) | | 101 | | | 33 | |
| Nontaxable investment securities | | | (20 | ) | | (11 | ) | | (31 | ) |
| Interest bearing deposits | | | (2 | ) | | 22 | | | 20 | |
| Federal funds sold | | | (48 | ) | | 228 | | | 180 | |
| Total Interest Income | | | 1,264 | | | 808 | | | 2,012 | |
| | | | | | | | | | | |
| Interest Expense | | | | | | | | | | |
| Demand deposits | | | (2 | ) | | 96 | | | 94 | |
| Savings deposits | | | (15 | ) | | 156 | | | 141 | |
| Time deposits | | | 10 | | | 452 | | | 462 | |
| Borrowed money | | | 376 | | | (23 | ) | | 353 | |
| Total Interest Expense | | | 369 | | | 681 | | | 1,050 | |
| | | | | | | | | | | |
| Net Interest Income | | $ | 895 | | $ | 127 | | $ | 1,022 | |
Changes in volume are calculated based on the difference in average balance multiplied by the prior year average rate. Changes due to rate changes are calculated by subtracting the change due to volume from the total change.
Loan Portfolio
The Company is an active residential mortgage and construction lender and extends commercial loans to small and medium sized businesses within its primary service area. The Company’s commercial lending activity extends across its primary service areas of Grant, Hardy, Hampshire, Mineral, Randolph, Tucker and Pendleton counties in West Virginia and Frederick County, Virginia. Consistent with its focus on providing community-based financial services, the Company does not attempt to diversify its loan portfolio geographically by making significant amounts of loans to borrowers outside of its primary service area.
The following table summarizes the Company’s loan portfolio at December 31, 2006, 2005, 2004, 2003 and 2002 (in thousands of dollars):
| | | At December 31, | |
| | | 2006 | | 2005 | | 2004 | | 2003 | | 2002 | |
| Real estate mortgage | | $ | 164,243 | | $ | 153,646 | | $ | 140,762 | | $ | 129,671 | | $ | 121,558 | |
| Real estate construction | | | 14,828 | | | 12,201 | | | 8,850 | | | 7,552 | | | 6,813 | |
| Commercial | | | 70,408 | | | 57,908 | | | 52,813 | | | 42,911 | | | 47,089 | |
| Installment | | | 43,337 | | | 46,265 | | | 46,092 | | | 46,501 | | | 50,294 | |
| Total Loans | | | 292,816 | | | 270,020 | | | 248,517 | | | 226,635 | | | 225,754 | |
| | | | | | | | | | | | | | | | | |
| Allowance for loan losses | | | (3,482 | ) | | (3,129 | ) | | (2,530 | ) | | (2,463 | ) | | (1,793 | ) |
| | | | | | | | | | | | | | | | | |
| Net Loans | | $ | 289,334 | | $ | 266,891 | | $ | 245,987 | | $ | 224,172 | | $ | 223,961 | |
Commercial loan balances include certain loans secured by commercial real estate. As of December 31, 2006 the Company maintained balances of loans secured by real estate of $226,310,000.
There were no foreign loans outstanding during any of the above periods.
The following table illustrates the Company’s loan maturity distribution as of December 31, 2006 (in thousands of dollars):
| | | Maturity Range | |
| | | Less than 1 Year | | 1-5 Years | | Over 5 Years | | Total | |
Loan Type | | | | | | | | | | | | | |
| Commercial | | $ | 46,937 | | $ | 12,379 | | $ | 11,092 | | $ | 70,408 | |
| Real estate mortgage and construction | | | 60,347 | | | 52,802 | | | 65,922 | | | 179,071 | |
| Installment | | | 15,760 | | | 26,726 | | | 851 | | | 43,337 | |
| Total Loans | | $ | 123,044 | | $ | 91,907 | | $ | 77,865 | | $ | 292,816 | |
Credit Quality
The principal economic risk associated with each of the categories of loans in the Company’s portfolio is the creditworthiness of its borrowers. Within each category, such risk is increased or decreased depending on prevailing economic conditions. The risk associated with the real estate mortgage loans and installment loans to individuals varies based upon employment levels, consumer confidence, fluctuations in value of residential real estate and other conditions that affect the ability of consumers to repay indebtedness. The risk associated with commercial, financial and agricultural loans varies based upon the strength and activity of the local economies of the Company’s market areas. The risk associated with real estate construction loans varies based upon the supply of and demand for the type of real estate under construction.
An inherent risk in the lending of money is that the borrower will not be able to repay the loan under the terms of the original agreement. The allowance for loan losses (see subsequent section) provides for this risk and is reviewed periodically for adequacy. This review also considers concentrations of loans in terms of geography, business type or level of risk. While lending is geographically diversified within the service area, the Company does have some concentration of loans in the area of agriculture (primarily poultry farming), and the timber and coal extraction industries. Management recognizes these concentrations and considers them when structuring its loan portfolio.
Nonperforming loans include non-accrual loans, loans 90 days or more past due and restructured loans. Non-accrual loans are loans on which interest accruals have been discontinued. Loans are typically placed in non-accrual status when the collection of principal or interest is 90 days past due and collection is uncertain based on the net realizable value of the collateral and/or the financial strength of the borrower. Also, the existence of any guaranties by federal or state agencies is given consideration in this decision. The policy is the same for all types of loans. Restructured loans are loans for which a borrower has been granted a concession on the interest rate or the original repayment terms because of financial difficulties. Nonperforming loans do not represent or result from trends or uncertainties which management reasonably expects will materially impact future operating results, liquidity, or capital resources. Nonperforming loans are listed in the table below.
Nonperforming loans decreased 11.96% from December 31, 2005 to December 31, 2006, but still remain below the Company’s 5-year average. At December 31, 2006, nonperforming loans represented .58% of the Company’s balances of gross loans as compared to .72% at December 31, 2005.
The following table summarizes the Company’s nonperforming loans (in thousands of dollars):
| | | At December 31, | |
| | | 2006 | | 2005 | | 2004 | | 2003 | | 2002 | |
| Loans accounted for on a non-accrual basis | | | | | | | | | | | | | | | | |
| Consumer | | $ | 83 | | $ | 124 | | $ | 252 | | $ | 228 | | $ | 9 | |
| Real estate | | | 161 | | | 619 | | | 278 | | | 1,436 | | | 290 | |
| Total Non-accrual Loans | | | 244 | | | 743 | | | 530 | | | 1,664 | | | 299 | |
| | | | | | | | | | | | | | | | | |
| Restructured Loans | | | 0 | | | 0 | | | 0 | | | 631 | | | 662 | |
| | | | | | | | | | | | | | | | | |
| Loans delinquent 90 days or more | | | | | | | | | | | | | | | | |
| Consumer | | | 122 | | | 74 | | | 140 | | | 25 | | | 161 | |
| Commercial | | | 0 | | | 966 | | | 355 | | | 1,255 | | | 1,312 | |
| Real estate | | | 1,335 | | | 149 | | | 40 | | | 318 | | | 445 | |
| Total delinquent loans | | | 1,457 | | | 1,189 | | | 535 | | | 1,598 | | | 1,918 | |
| | | | | | | | | | | | | | | | | |
| Total Nonperforming Loans | | $ | 1,701 | | $ | 1,932 | | $ | 1,065 | | $ | 3,893 | | $ | 2,879 | |
The Company held no real estate acquired through foreclosure at December 31, 2006. Real estate acquired through foreclosure was $44,800 at December 31, 2005 and $327,650 at December 31, 2004. The Company's practice is to value real estate acquired through foreclosure at the lower of (i) an independent current appraisal or market analysis less anticipated costs of disposal, or (ii) the existing loan balance.
Because of its large impact on the local economy, management continues to monitor the economic health of the poultry industry. The Company has direct loans to poultry growers and the industry is a large employer in the Company’s trade area.
In recent periods, the Company’s loan portfolio has also begun to reflect a concentration in loans collateralized by heavy equipment, particularly in the trucking, mining and timber industries. In part because of rising fuel costs, the trucking sector has experienced a recent downturn. However, the Company has experienced no material losses related to foreclosures of loans collateralized by heavy equipment. While close monitoring of this sector is necessary, management expects no significant losses in the foreseeable future.
Allowance For Loan Losses
The allowance for loan losses is an estimate of the losses in the current loan portfolio. The allowance is based on two principles of accounting: (i) SFAS No. 5, Accounting for Contingencies which requires that losses be accrued when they are probable of occurring and estimable and (ii) SFAS No. 114, Accounting by Creditors for Impairment of a Loan, which requires that loans be identified which have characteristics of impairment as individual risks, (e.g. the collateral, present value of cash flows or observable market values are less than the loan balance).
Each of the Company's banking subsidiaries, Capon Valley Bank and The Grant County Bank, determines the adequacy of its allowance for loan losses independently. Although the loan portfolios of the two Banks are similar to each other, some differences exist which result in divergent risk patterns and different charge-off rates amongst the functional areas of the Banks’ portfolio. Each Bank pays particular attention to individual loan performance, collateral values, borrower financial condition and economic conditions. The determination of an adequate allowance at each Bank is done in a three-step process. The first step is to identify impaired loans. Impaired loans are problem loans above a certain threshold, which have estimated losses, calculated based on the fair value of the collateral with which the loan is secured.
A summary of the loans, which the Company has identified as impaired, follows (in thousands of dollars):
| December 31, 2006 | |
| | | | | Identified | |
| Loan Type | | Balance | | Impairment | |
| Mortgage | | $ | 774 | | $ | 107 | |
| Commercial | | | 977 | | | 520 | |
| Installment | | | 144 | | | 93 | |
The second step is to identify loans above a certain threshold, which are problem loans due to the borrowers' payment history or deteriorating financial condition. Losses in this category are determined based on historical loss rates adjusted for current economic conditions. The final step is to calculate a loss for the remainder of the portfolio using historical loss information for each type of loan classification. The determination of specific allowances and weighting is somewhat subjective and actual losses may be greater or less than the amount of the allowance. However, management believes that the allowance represents a fair assessment of the losses that exist in the current loan portfolio.
The required level of the allowance for loan losses is computed quarterly and the allowance adjusted prior to the issuance of the quarterly financial statements. All loan losses charged to the allowance are approved by the boards of directors of each Bank at their regular meetings. The allowance is reviewed for adequacy after considering historical loss rates, current economic conditions (both locally and nationally) and any known credit problems that have not been considered under the above formula.
Management has analyzed the potential risk of loss on the Company's loan portfolio given the loan balances and the value of the underlying collateral and has recognized losses where appropriate. Nonperforming loans are closely monitored on an ongoing basis as part of the Company's loan review process.
The ratio of the allowance for loan losses to total loans outstanding was 1.19% at December 31, 2006, 1.16% at December 31, 2005 and 1.02% at December 31, 2004. At December 31, 2006, the ratio of the allowance for loan losses to nonperforming loans was 204.70% compared to 161.96% at December 31, 2005 and 237.56% at December 31, 2004.
During 2005, the Company’s balances of non-performing loans and delinquent loans began to increase above levels experienced during 2003 and 2004. As a result, during 2005, management deemed it necessary to increase the allowance for loan losses as a percent of gross loans. Until the later months of 2006, the levels of non-performing and delinquent loans remained elevated and management deemed it necessary to maintain a ratio of allowance for loan losses as compared to gross loans above that of the Company’s recent historical averages. However, during 2006, the Company experienced a decline in net charge-offs, and the maintenance of the allowance for loan losses as a percentage of gross was achieved even while the provision against operations for the allowance for loan losses was greatly reduced.
An analysis of the changes in the allowance for loan losses is set forth in the following table (in thousands of dollars):
| | | 2006 | | 2005 | | 2004 | | 2003 | | 2002 | |
| Balance at beginning of period | | $ | 3,129 | | $ | 2,530 | | $ | 2,463 | | $ | 1,793 | | $ | 1,603 | |
| | | | | | | | | | | | | | | | | |
| Charge-offs: | | | | | | | | | | | | | | | | |
| Commercial loans | | | 27 | | | 45 | | | 97 | | | 557 | | | 246 | |
| Real estate loans | | | 1 | | | 8 | | | 422 | | | 65 | | | 110 | |
| Consumer loans | | | 551 | | | 567 | | | 642 | | | 839 | | | 424 | |
| Total Charge-offs: | | | 579 | | | 620 | | | 1,161 | | | 1,461 | | | 780 | |
| | | | | | | | | | | | | | | | | |
| Recoveries: | | | | | | | | | | | | | | | | |
| Commercial loans | | | 5 | | | 28 | | | 37 | | | 75 | | | 10 | |
| Real estate loans | | | 20 | | | 0 | | | 36 | | | 54 | | | 68 | |
| Consumer loans | | | 225 | | | 150 | | | 235 | | | 182 | | | 72 | |
| Total Recoveries | | | 250 | | | 178 | | | 308 | | | 311 | | | 150 | |
| | | | | | | | | | | | | | | | | |
| Net Charge-offs | | | 329 | | | 442 | | | 853 | | | 1,150 | | | 630 | |
| | | | | | | | | | | | | | | | | |
| Provision for loan losses | | | 682 | | | 875 | | | 920 | | | 1,820 | | | 820 | |
| Other additions | | | | | | 166 | | | | | | | | | | |
| | | | | | | | | | | | | | | | | |
| Balance at end of period | | $ | 3,482 | | $ | 3,129 | | $ | 2,530 | | $ | 2,463 | | $ | 1,793 | |
| | | | | | | | | | | | | | | | | |
| Percent of net charge-offs to average net loans outstanding during the period | | | .11 | % | | .17 | % | | .51 | % | | .29 | % | | .25 | % |
Cumulative net loan losses, after recoveries, for the five-year period ending December 31, 2006 are as follows (in thousands of dollars):
| | | Dollars | | Percent of Total | |
| Commercial | | $ | 817 | | | 24 | % |
| Real Estate | | | 428 | | | 13 | % |
| Consumer | | | 2,159 | | | 63 | % |
| Total | | $ | 3,404 | | | | |
The following table shows the allocation of loans in the loan portfolio and the corresponding amounts of the allowance allocated by loan type (dollar amounts in thousands of dollars):
| | | At December 31, | |
| | | 2006 | | 2005 | | 2004 | | 2003 | | 2002 | |
| | | Amount | | Percent of Loans | | Amount | | Percent of Loans | | Amount | | Percent of Loans | | Amount | | Percent of Loans | | Amount | | Percent of Loans | |
| Commercial | | $ | 1,492 | | | 24 | % | $ | 900 | | | 21 | % | $ | 697 | | | 21 | % | $ | 779 | | | 19 | % | $ | 543 | | | 21 | % |
| Mortgage | | | 996 | | | 61 | % | | 1,139 | | | 62 | % | | 853 | | | 60 | % | | 725 | | | 61 | % | | 504 | | | 57 | % |
| Consumer | | | 967 | | | 15 | % | | 1,082 | | | 17 | % | | 970 | | | 19 | % | | 819 | | | 20 | % | | 652 | | | 22 | % |
| Unallocated | | | 27 | | | | | | 8 | | | | | | 10 | | | | | | 140 | | | | | | 94 | | | | |
| Totals | | $ | 3,482 | | | 100 | % | $ | 3,129 | | | 100 | % | $ | 2,530 | | | 100 | % | $ | 2,463 | | | 100 | % | $ | 1,793 | | | 100 | % |
As certain loans identified as impaired are paid current, collateral values increase or loans are removed from watch lists for other reasons, and as other loans become identified as impaired, and because delinquency levels within each of the portfolios change, the allocation of the allowance among the loan types may change. Management feels that the allowance is a fair representation of the losses present in the portfolio given historical loss trends, economic conditions and any known credit problems as of any quarter's end. Management believes that the allowance is to be taken as a whole, and allocation between loan types is an estimation of potential losses within each type given information known at the time.
The above figures act as the beginning for the allocation of overall allowances. Additional changes have been made in the allocation of the allowance to address unknowns and contingent items. The unallocated portion is not computed using a specific formula and is management’s best estimate of what should be allocated for contingencies in the current portfolio.
Non-interest Income
2006 compared to 2005
Non-interest income increased 19.65% from 2005 to 2006.
Contributing heavily to this increase was a $337,000 increase in deposit service charges, mainly resulting from a rise in insufficient fund charges to demand deposit customers. This rise in insufficient funds charges was the result of both an increase in average balances of demand deposits and also the implementation in late 2005 by Capon Valley Bank of a courtesy overdraft program.
Also contributing to the growth in non-interest income was an increase in earnings on investments in life insurance contracts brought about by the settlement of two policies due to the death of an insured (see Note Twenty).
These increases were offset by a decline in insurance earnings. Insurance income continues to decrease due to the fact that the volume of new installment loans, the primary market for credit life and accident and health insurance, continues to fall.
2005 compared to 2004
Service charge income increased $66,000, almost exclusively in the income received from customer overdraft charges. As the Company’s account base grew and non-interest bearing checking volume grew, revenue from insufficient funds charges also increased. Also, late in 2005, Capon Valley Bank implemented a program commonly referred to as “Courtesy Overdraft.”
Income from insurance operations, which is underwriting income by HBI Life and commission income earned by the subsidiary Banks, decreased slightly during 2005 as compared to 2004. As new consumer installment loan volume has declined the income from insurance operations has also declined as insurance originations come mostly from installment lending.
During 2005, the Company recorded non-recurring income totaling $33,000. A portion of this income related to the gain on the sale of the Company's interest in an automated debit card company. Secondly, during the fourth quarter of 2005, a portion of the parking area of one of the Company’s branch locations was purchased as part of a street widening project, and the Company recorded a gain of $19,000 related to this sale.
Non-interest Expense
2006 compared to 2005
Non-interest expense increased 13.87% from 2005 to 2006.
Employee salary and benefits expense increased 14.02%. The table below summarizes the changes in salaries and benefits expense (all dollar amounts expressed in thousands of dollars):
| | | Increase | | Percent | |
| Increases in salary expense and related payroll tax due to changes in average number of full time equivalent employees | | $ | 290 | | | | |
| Increases in salary expense and related payroll tax due to average pay rate increases | | | 176 | | | | |
| Total increase in salary expense and related payroll tax | | | 466 | | | 12.80 | % |
| | | | | | | | |
| Increase in the cost of employee insurance benefits | | | 97 | | | 15.22 | % |
| Increase in the cost of executive retirement benefits related to investments in insurance contracts | | | 49 | | | 26.01 | % |
| Increase in the cost of employee post retirement benefit plans | | | 86 | | | 17.21 | % |
Occupancy and equipment expense increased largely because of an increase in the number of physical structures owned by the Company as a result of the acquisition of two branches in late 2005. Data processing increased 28.20% as the volume of accounts, both loan and deposit, increased. This increase in customer volume was both the result of the additional customers acquired with the branches purchase and also continued endogenous growth of legacy operations.
The amortization of core deposit intangibles (see Notes Two and Nineteen of the Financial Statements) increased $137,000 from 2005 to 2006.
Legal and professional fees fell slightly from 2005 to 2006 as a result of lessened consulting engagements relating to regulatory compliance issues.
2005 compared to 2004
Expenses related to salaries and benefits increased 1.99% in 2005 as compared to 2004. An increase in full-time equivalent employees was responsible for about half of this increase. Costs of post retirement benefits for employees declined primarily due to lower costs that resulted from the retirement of an employee in 2004. Occupancy and equipment expense increased slightly as the properties of the Company remained relatively constant (not inclusive of the physical assets obtained with the purchase of The National Bank of Davis). Data processing expense fell 5.81% in 2005 as compared to 2004, due mainly to a decrease in the contractual rate charged to the subsidiary Banks by the primary supplier of account processing functions. Legal and professional fees increased $98,000 in 2005 as compared to 2004. Significant costs relating to compliance efforts under Rule 404 of the Sarbanes Oxley Act of 2002 and increased audit procedures required by bank regulatory authorities were responsible for the largest portion of the increase in legal and professional fees.
Securities
The Company's securities portfolio serves several purposes. Portions of the portfolio are used to secure certain public and trust deposits. The remaining portfolio is held as investments or used to assist the Company in liquidity and asset liability management. Total securities, including restricted securities, represented 7.13% of total assets at December 31, 2006.
The securities portfolio consists of three components: securities held to maturity, securities available for sale and restricted securities. Securities are classified as held to maturity when management has the intent and the Company has the ability at the time of purchase to hold the securities to maturity. Held to maturity securities are carried at cost, adjusted for amortization of premiums and accretion of discounts. Securities to be held for indefinite periods of time are classified as available for sale and accounted for at market value. Securities available for sale include securities that may be sold in response to changes in market interest rates, changes in the security's prepayment risk, increases in loan demand, general liquidity needs and other similar factors. Restricted securities are those investments purchased as a requirement of membership in certain governmental lending institutions and cannot be transferred without the issuer’s permission. The Company's purchases of securities have generally been limited to securities of high credit quality with short to medium term maturities.
The Company identifies at the time of acquisition those securities that are available for sale. These securities are valued at their market value with any difference in market value and amortized cost shown as an adjustment in stockholders' equity. Changes within the year in market values are reflected as changes in other comprehensive income, net of the deferred tax effect. As of December 31, 2006, the cost basis of the securities available for sale exceeded their fair value by $6,000 ($4,000 after tax effect of $2,000).
The following table summarizes the carrying value of the Company’s securities at December 31, 2006, 2005 and 2004 (in thousands of dollars):
| | | Held to Maturity | | Available for Sale | |
| | | Carrying Value | | Carrying Value | |
| | | December 31, | | December 31, | |
| | | 2006 | | 2005 | | 2004 | | 2006 | | 2005 | | 2004 | |
| U.S. Treasuries and Agencies | | $ | 0 | | $ | 0 | | $ | 0 | | $ | 14,403 | | $ | 17,234 | | $ | 18,164 | |
| Obligations of states and political subdivisions | | | 170 | | | 491 | | | 1,162 | | | 2,744 | | | 2,705 | | | 1,817 | |
| Mortgage backed securities | | | 0 | | | 0 | | | 0 | | | 6,554 | | | 7,163 | | | 4,693 | |
| Marketable equities | | | 0 | | | 0 | | | 0 | | | 28 | | | 28 | | | 28 | |
| Total | | $ | 170 | | $ | 491 | | $ | 1,162 | | $ | 23,729 | | $ | 27,130 | | $ | 24,702 | |
The carrying amount and estimated market value of debt securities (in thousands of dollars) at December 31, 2006 by contractual maturity are shown below. Expected maturities will differ from contractual maturities because borrowers may have the right to call or prepay obligations with or without call or prepayment penalties.
| | | Amortized Cost | | Fair Value | | Equivalent Average Yield | |
| Securities Held to Maturity | | | | | | | | | | |
| Due in 3 months or less | | $ | 170 | | $ | 170 | | | 7.49 | % |
| Total Held to Maturity | | $ | 170 | | $ | 170 | | | 7.49 | % |
| | | | | | | | | | | |
| | | | | | | | | | | |
| Securities Available for Sale | | | | | | | | | | |
| Due in 3 months or less | | $ | 2,112 | | $ | 2,109 | | | 4.36 | % |
| Due in 3 months through one year | | | 6,339 | | | 6,313 | | | 4.59 | % |
| Due after one year through five years | | | 14,908 | | | 14,931 | | | 4.98 | % |
| Due after five years through ten years | | | 80 | | | 80 | | | 6.32 | % |
| Due after ten years | | | 268 | | | 268 | | | 4.58 | % |
| Equity securities with no maturity | | | 28 | | | 28 | | | 8.40 | % |
| Total Available For Sale | | $ | 23,735 | | $ | 23,729 | | | 4.83 | % |
Yields on tax exempt securities are stated at actual yields.
Management has generally kept the maturities of investments relatively short providing for flexibility in investing. Such a philosophy allows the Company to better match deposit maturities with investment maturities and thus react more quickly to interest rate changes.
Deposits
The Company's primary source of funds is local deposits. The Company's deposit base is comprised of demand deposits, savings and money market accounts and other time deposits. The majority of the Company's deposits are provided by individuals and businesses located within the communities served.
Total balances of deposits increased 5.55% from December 31, 2005 to December 31, 2006.
Although the Company does not actively solicit large certificates of deposit (those more than $100,000) due to the unstable nature of these deposits, the balances of such deposits increased 20.71% from December 31, 2005 to December 31, 2006. This increase is, in part, attributable to rate specials offered by the subsidiary Banks during the second half of 2006.
A summary of the maturity range of deposits over $100,000 is as follows (in thousands of dollars):
| | | At December 31, | |
| | | 2006 | | 2005 | | 2004 | |
| Three months or less | | $ | 9,533 | | $ | 7,662 | | $ | 6,598 | |
| Four to twelve months | | | 30,810 | | | 14,835 | | | 13,861 | |
| One year to three years | | | 8,156 | | | 17,736 | | | 15,323 | |
| Four years to five years | | | 6,368 | | | 5,222 | | | 3,620 | |
| Total | | $ | 54,867 | | $ | 45,455 | | $ | 39,402 | |
Borrowed Money
Long Term Borrowings
The Company borrows funds from the Federal Home Loan Bank (“FHLB”) to reduce market rate risks, provide liquidity, and to fund capital additions. These borrowings may have fixed or variable interest rates and are amortized over a period of one to twenty years, or may be comprised of single payment borrowings with periodic interest payments and principal amounts due at maturity. Borrowings from this institution allow the Banks to offer long-term, fixed rate loans to their customers and match the interest rate exposure of the receivable and the liability and to meet liquidity needs and to manage interest rate risk through the use of long-term fixed rate borrowings. During 2006, the Company borrowed an additional $2,300,000 from the FHLB and made payments of $ 2,371,000 on outstanding balances.
Short Term Borrowings
Although the Company has traditionally not experienced the need for overnight or other short-term borrowings, loan growth during the fourth quarter of 2004 necessitated an overnight borrowing of $2,000,000 that was still outstanding at December 31, 2004. During the first quarter of 2005, the Company initiated $ 1,500,000 in new short-term borrowings and made repayments of $ 3,500,000. At December 31, 2006, the Company had no balances of short-term borrowings. Though this funding tool may be required in coming periods, Management prefers to fund growth through longer-term vehicles and expects instances of overnight borrowings to be limited.
Capital Resources
The assessment of capital adequacy depends on a number of factors such as asset quality, liquidity, earnings performance and changing competitive conditions and economic forces. The Company seeks to maintain a strong capital base to support its growth and expansion activities, to provide stability to current operations and to promote public confidence.
The Company's capital position continues to exceed regulatory minimums. The primary indicators relied on by the Federal Reserve Board and other bank regulators in measuring strength of capital position are the Tier 1 Capital, Total Capital and Leverage ratios. Tier 1 Capital consists of common stockholders' equity adjusted for unrealized gains and losses on securities. Total Capital consists of Tier 1 Capital and a portion of the allowance for loan losses. Risk-based capital ratios are calculated with reference to risk-weighted assets, which consist of both on and off-balance sheet risks.
The capital management function is an ongoing process. Central to this process is internal equity generation accomplished by earnings retention. During 2006, 2005, and 2004, total stockholders' equity increased by $3,084,000, $2,337,000 and $ 2,106,000, respectively, as a result of earnings retention and changes in the other comprehensive income. The return on average equity was 12.67% in 2006 compared to 11.53% for 2005 and 10.36% for 2004. Total cash dividends declared represent 29.91% of net income for 2006 compared to 30.99% of net income for 2005 and 28.23% for 2004. Book value per share was $25.80 at December 31, 2006 compared to $23.66 at December 31, 2005.
Liquidity
Operating liquidity is the ability to meet present and future financial obligations. Short-term liquidity is provided primarily through cash balances, deposits with other financial institutions, federal funds sold, non-pledged securities and loans maturing within one year. Additional sources of liquidity available to the Company include, but are not limited to, loan repayments, the ability to obtain deposits through the adjustment of interest rates and the purchasing of federal funds. To further meet its liquidity needs, the Company also maintains lines of credit with correspondent financial institutions, the Federal Reserve Bank of Richmond and the Federal Home Loan Bank of Pittsburgh.
Historically, the Company’s primary need for additional levels of operational liquidity has been to fund increases in loan balances. The Company has normally funded increases in loans by increasing deposits and decreases in secondary liquidity sources such as balances of federal funds sold and balances of securities. Although total deposit balances have decreased and increased slightly in the last two years, the Company has maintained or increased levels of secondary liquidity resources and does not anticipate that an unexpectedly high level of loan demand in coming periods would impact liquidity to the extent that the Company would be required to pay above market rates to obtain deposits.
The parent Company’s operating funds, funds with which to pay shareholder dividends and funds for the exploration of new business ventures have been supplied primarily through dividends paid by the Company’s two subsidiary Banks, Capon Valley Bank and The Grant County Bank. The various regulatory authorities impose restrictions on dividends paid by a state bank. A state bank cannot pay dividends without the consent of the relevant banking authorities in excess of the total net profits of the current year and the combined retained profits of the previous two years. As of January 1, 2006, the subsidiary Banks could pay dividends to Highlands Bankshares, Inc. of approximately $5,698,000 without permission of the regulatory authorities. The special dividend in October 2005 from The Grant County Bank to Highlands Bankshares to fund the acquisition of The National Bank of Davis exceeded Grant’s dividend limit as of the date of the dividend. As part of the regulatory application process for the acquisition, the applicable banking authorities approved this dividend and the Company believes that the special, one time, dividend will not restrict Grant’s ability to pay dividends to the parent company in the coming periods.
Effects of Inflation
Inflation primarily affects industries having high levels of property, plant and equipment or inventories. Although the Company is not significantly affected in these areas, inflation does have an impact on the growth of assets. As assets grow rapidly, it becomes necessary to increase equity capital at proportionate levels to maintain the appropriate equity to asset ratios. Traditionally, the Company's earnings and high capital retention levels have enabled the Company to meet these needs.
The Company's reported earnings results have been minimally affected by inflation. The different types of income and expense are affected in various ways. Interest rates are affected by inflation, but the timing and magnitude of the changes may not coincide with changes in the consumer price index. Management actively monitors interest rate sensitivity, as illustrated by the gap analysis shown under the section titled Interest Rate Sensitivity, in order to minimize the effects of inflationary trends on interest rates. Other areas of non-interest expenses may be more directly affected by inflation.
| Quantitative and Qualitative Disclosures About Market Risk |
The greatest portion of the Company’s net income is derived from net interest income. As such, the greatest component of market risk is interest rate volatility. In conjunction with maintaining a satisfactory level of liquidity, management must also control the degree of interest rate risk assumed on the balance sheet. Managing this risk involves regular monitoring of the interest sensitive assets relative to interest sensitive liabilities over specific time intervals. Early withdrawal of deposits, greater than expected balances of new deposits, prepayments of loans and loan delinquencies are some of the factors that could affect actual versus expected cash flows. In addition, changes in rates on interest sensitive assets and liabilities may not be equal, which could result in a change in net interest margin. While the Company does not match each of its interest sensitive assets against specific interest sensitive liabilities, it does review its positions regularly and takes actions to reposition itself when necessary. With the largest amount of interest sensitive assets and liabilities re-pricing within one year, the Company believes it is in an excellent position to respond quickly to rapid market rate changes.
Interest rate market conditions may also affect portfolio composition of both assets and liabilities. Traditionally, the Company’s subsidiary Banks have primarily offered one-year adjustable rate mortgages (ARMs) to its mortgage loan customers. However, the low interest rate environment during 2003, 2004 and 2005 created intense competition, especially from larger banking institutions and finance companies offering long term fixed rate mortgages. As a result, the Company in recent periods has begun to write more mortgage loans with adjustable rates and maturities greater than one year. The increase in new ARM and balloon loans with two, three and five year adjustable rates has caused a shift in the maturity composition of the loan portfolio. This shift to longer term rates is partially responsible for the average rates earned on the loan portfolio to, in 2005 and into 2006, lag behind increases in rates paid on deposits and rates earned on other earning assets. During the later portions of 2006, as the longer term ARM and balloon loans written in 2003, 2004 and 2005 began to re-price and as market rates for deposits began to flatten as compared to the growth seen in 2005 and early 2006, the Company experienced a reversal in this lag as average loan rates began to increase more than average deposit rates.
Competition for new loans remains heavy. The result of this competition has also had the effect of causing increases in rates earned on loans to lag behind the increase in those seen on interest bearing liabilities. Should these influences continue into the future, the Company may experience a decrease in its net interest margin.
As a result of the low interest rate environment in past years, depositors seemed reluctant to commit to longer-term time deposits and in many instances appeared to hold monies temporarily in interest bearing transaction accounts in anticipation of rising rates in the future. This trend began to reverse in 2005 and the reversal continued into 2006 as time deposit balances increased as customers began moving deposits from the lower earning transaction accounts and into time deposits. Should interest rates begin to rise sharply in the coming periods, management believes that additional monies now in interest bearing transaction and savings accounts may further shift to time deposits, and this will cause a rise in the Company’s cost of funds. Alternatively, these balances may be transferred by customers to other financial institutions offering higher deposit rates or customers may require the Company to match such rates to retain the deposit.
At present, the Company’s largest challenge in managing its net interest income is the funding of loan growth. High levels of loan growth would require new funding, which has historically been met by increases in deposits. As competition for deposits increases and should the Company need funds to finance loan growth, it may be forced to pay higher rates than other local banking organizations to obtain these deposits. This would result in a reduction in the Company’s net interest margin and its net income. During 2004 and 2005 and into early 2006, loan growth was funded through reduction in balances of comparatively lower earning assets like securities and federal funds sold and borrowing from the FHLB. The result was that during 2004 deposit balances fell, especially balances of time deposits. Balances of federal funds sold and securities also fell and net interest margin increased as a result of this. During 2005, deposit balances increased slightly, and this, coupled with cash flows from operations, allowed federal funds sold balances to increase. In addition, the purchase of The National Bank of Davis added balances of liquid funds, both in cash balances and balances of federal funds sold and this will allow for loan growth in the coming periods without the immediate need for attracting significant amounts of new deposits.
In 2006, the Company’s continued loan growth created a need for new deposit balances and the Company began offering more competitive rates on its deposits. As a result, deposit balances increased and the average rates paid on deposits increased.
Although it is expected that deposit rates will continue to rise, mnagement believes that with a significant portion of its loan portfolio re-pricing within one year that rising rates will not have a significant negative impact on the Company’s net interest earnings.
The following table illustrates the Company’s sensitivity to interest rate changes as of December 31, 2006 (in thousands of dollars):
| | | 1-90 Days | | 91-365 Days | | 1 to 3 Years | | 3 to 5 Years | | More that 5 years or no Maturity | | Total | |
| EARNING ASSETS | | | | | | | | | | | | | | | | | | | |
| Loans | | $ | 53,243 | | $ | 126,394 | | $ | 85,254 | | $ | 11,653 | | $ | 16,272 | | $ | 292,816 | |
| Federal funds sold | | | 12,210 | | | | | | | | | | | | | | | 12,210 | |
| Securities | | | 11,614 | | | 6,237 | | | 4,424 | | | 1,624 | | | | | | 23,899 | |
| Deposits in other banks | | | 1,321 | | | 303 | | | | | | | | | | | | 1,624 | |
| Total | | | 78,388 | | | 132,934 | | | 89,678 | | | 13,277 | | | 16,272 | | | 330,549 | |
| | | | | | | | | | | | | | | | | | | | |
| INTEREST BEARING LIABILITIES | | | | | | | | | | | | | | | | | | | |
| Interest bearing demand deposits | | | 25,363 | | | | | | | | | | | | | | | 25,363 | |
| Savings deposits | | | 46,227 | | | | | | | | | | | | | | | 46,227 | |
| Time deposits | | | 29,537 | | | 102,577 | | | 29,937 | | | 20,117 | | | | | | 182,168 | |
| Borrowed money | | | 2,447 | | | 1,752 | | | 1,028 | | | 1,165 | | | 8,600 | | | 14,992 | |
| Total | | | 103,574 | | | 104,329 | | | 30,965 | | | 21,282 | | | 8,600 | | | 268,750 | |
| | | | | | | | | | | | | | | | | | | | |
| Rate sensitivity gap | | $ | (25,186 | ) | $ | 28,605 | | $ | 58,713 | | $ | (8,005 | ) | $ | 7,672 | | $ | 61,799 | |
| | | | | | | | | | | | | | | | | | | | |
| Cumulative gap | | $ | (25,186 | ) | $ | 3,419 | | $ | 62,132 | | $ | 54,127 | | $ | 61,799 | | | | |
| Financial Statements and Supplementary Data |
HIGHLANDS BANKSHARES, INC. | |
CONSOLIDATED BALANCE SHEETS | |
December 31, 2006 and 2005 | |
(in thousands of dollars) | |
| | | 2006 | | 2005 | |
| ASSETS | | | | | | | |
| Cash and due from banks | | $ | 7,111 | | $ | 8,850 | |
| Interest bearing deposits in banks | | | 1,624 | | | 963 | |
| Federal funds sold | | | 12,210 | | | 10,808 | |
| Investment securities held to maturity | | | 170 | | | 491 | |
| Investment securities available for sale | | | 23,729 | | | 27,130 | |
| Restricted investments | | | 1,570 | | | 1,250 | |
| Loans | | | 292,816 | | | 270,020 | |
| Allowance for loan losses | | | (3,482 | ) | | (3,129 | ) |
| Bank premises and equipment | | | 8,099 | | | 7,684 | |
| Interest receivable | | | 2,173 | | | 1,818 | |
| Investment in life insurance contracts | | | 6,066 | | | 6,396 | |
| Goodwill | | | 1,534 | | | 1,534 | |
| Other intangible assets | | | 1,498 | | | 1,674 | |
| Other assets | | | 2,198 | | | 2,084 | |
| Total Assets | | $ | 357,316 | | $ | 337,573 | |
| | | | | | | | |
| LIABILITIES | | | | | | | |
| Deposits | | | | | | | |
| Non-interest bearing deposits | | | 46,726 | | $ | 47,753 | |
| Interest bearing transaction and savings accounts | | | 71,590 | | | 80,597 | |
| Time deposits over $100,000 | | | 54,867 | | | 45,455 | |
| All other time deposits | | | 127,301 | | | 110,887 | |
| Total Deposits | | | 300,484 | | | 284,692 | |
| | | | | | | | |
| Long term debt | | | 14,992 | | | 15,063 | |
| Accrued expenses and other liabilities | | | 4,764 | | | 3,826 | |
| Total Liabilities | | | 320,240 | | | 303,581 | |
| | | | | | | | |
| STOCKHOLDERS’ EQUITY | | | | | | | |
| Common Stock, $5 par value, 3,000,000 shares authorized, 1,436,874 shares issued and outstanding | | | 7,184 | | | 7,184 | |
| Surplus | | | 1,662 | | | 1,662 | |
| Retained earnings | | | 28,816 | | | 25,651 | |
| Other accumulated comprehensive loss | | | (586 | ) | | (505 | ) |
| Total Stockholders’ Equity | | | 37,076 | | | 33,992 | |
| | | | | | | | |
| Total Liabilities and Stockholders’ Equity | | $ | 357,316 | | $ | 337,573 | |
| | | | | | | | |
| The accompanying notes are an integral part of these statements |
HIGHLANDS BANKSHARES, INC. | |
CONSOLIDATED STATEMENTS OF INCOME | |
FOR THE YEARS ENDED DECEMBER 31, 2006, 2005 and 2004 | |
| (in thousands of dollars, except per share data) | |
| | |
| | | 2006 | | 2005 | | 2004 | |
| Interest and Dividend Income | | | | | | | | | | |
| Loans, including fees | | $ | 22,118 | | $ | 18,622 | | $ | 16,752 | |
| Federal funds sold | | | 500 | | | 343 | | | 163 | |
| Interest bearing deposits | | | 72 | | | 38 | | | 18 | |
| Investment securities | | | 1,204 | | | 810 | | | 796 | |
| Total Interest Income | | | 23,894 | | | 19,813 | | | 17,729 | |
| | | | | | | | | | | |
| Interest Expense | | | | | | | | | | |
| Interest on deposits | | | 7,202 | | | 5,130 | | | 4,433 | |
| Interest on borrowed money | | | 707 | | | 631 | | | 278 | |
| Total Interest Expense | | | 7,909 | | | 5,761 | | | 4,711 | |
| | | | | | | | | | | |
| Net Interest Income | | | 15,985 | | | 14,052 | | | 13,018 | |
| | | | | | | | | | | |
| Provision for Loan Losses | | | 682 | | | 875 | | | 920 | |
| | | | | | | | | | | |
| Net Interest Income after Provision for Loan Losses | | | 15,303 | | | 13,177 | | | 12,098 | |
| | | | | | | | | | | |
| Non-interest Income | | | | | | | | | | |
| Service charges | | | 1,213 | | | 876 | | | 810 | |
| Insurance commissions and income | | | 126 | | | 227 | | | 240 | |
| Life insurance investment income | | | 380 | | | 234 | | | 251 | |
| Gain on securities transactions | | | | | | 6 | | | 4 | |
| Other operating income | | | 278 | | | 326 | | | 292 | |
| Total Non-interest Income | | | 1,997 | | | 1,669 | | | 1,597 | |
| | | | | | | | | | | |
| Non-interest Expenses | | | | | | | | | | |
| Salaries and benefits | | | 5,671 | | | 4,973 | | | 4,876 | |
| Occupancy expense | | | 467 | | | 412 | | | 401 | |
| Equipment expense | | | 879 | | | 836 | | | 813 | |
| Data processing expense | | | 811 | | | 632 | | | 671 | |
| Legal and professional fees | | | 420 | | | 440 | | | 342 | |
| Directors fees | | | 392 | | | 341 | | | 328 | |
| Other operating expenses | | | 1,754 | | | 1,494 | | | 1,507 | |
| Total Non-interest Expenses | | | 10,394 | | | 9,128 | | | 8,938 | |
| | | | | | | | | | | |
| Income Before Income Tax Expense | | | 6,906 | | | 5,718 | | | 4,757 | |
| | | | | | | | | | | |
| Income Tax Expense | | | 2,391 | | | 1,916 | | | 1,551 | |
| | | | | | | | | | | |
| Net Income | | $ | 4,515 | | $ | 3,802 | | $ | 3,206 | |
| | | | | | | | | | | |
| Earnings Per Share | | $ | 3.14 | | $ | 2.65 | | $ | 2.23 | |
| Dividends Per Share | | | .94 | | | .82 | | | .63 | |
| Weighted Average Shares Outstanding | | | 1,436,874 | | | 1,436,874 | | | 1,436,874 | |
| | | | | | | | | | | |
| The accompanying notes are an integral part of these statements |
HIGHLANDS BANKSHARES, INC. | |
CONSOLIDATED STATEMENTS OF STOCKHOLDERS’ EQUITY | |
| (in thousands of dollars) | |
| | | Common Stock | | | Surplus | | | Retained Earnings | | | Accumulated Other Comprehensive Income (Loss) | | | Total | |
| Balances January 1, 2004 | | $ | 7,184 | | | $ | 1,662 | | | $ | 20,727 | | | $ | (24 | ) | | $ | 29,549 | |
| | | | | | | | | | | | | | | | | | | | | |
| Comprehensive Income: | | | | | | | | | | | | | | | | | | | | |
| Net income | | | | | | | | | | | 3,206 | | | | | | | | 3,206 | |
| Change in other comprehensive income | | | | | | | | | | | | | | | (195 | ) | | | (195 | ) |
| Total Comprehensive Income | | | | | | | | | | | | | | | | | | | 3,011 | |
| | | | | | | | | | | | | | | | | | | | | |
| Cash Dividends | | | | | | | | | (905 | ) | | | | | | (905 | ) |
| | | | | | | | | | | | | | | | | | | | | |
| Balances December 31, 2004 | | | 7,184 | | | | 1,662 | | | | 23,028 | | | | (219 | ) | | | 31,655 | |
| | | | | | | | | | | | | | | | | | | | | |
| Comprehensive Income: | | | | | | | | | | | | | | | | | | | | |
| Net income | | | | | | | | | | | 3,802 | | | | | | | | 3,802 | |
| Change in other comprehensive income | | | | | | | | | | | | | | | (286 | ) | | | (286 | ) |
| Total Comprehensive Income | | | | | | | | | | | | | | | | | | | 3,516 | |
| | | | | | | | | | | | | | | | | | | | | |
| Cash Dividends | | | | | | | | | (1,179 | ) | | | | | | (1,179 | ) |
| | | | | | | | | | | | | | | | | | | | | |
| Balances December 31, 2005 | | | 7,184 | | | | 1,662 | | | | 25,651 | | | | (505 | ) | | | 33,992 | |
| | | | | | | | | | | | | | | | | | | | | |
| Comprehensive Income: | | | | | | | | | | | | | | | | | | | | |
| Net income | | | | | | | | | | | 4,515 | | | | | | | | 4,515 | |
| Change in other comprehensive income | | | | | | | | | | | | | | | (81 | ) | | | (81 | ) |
| Total Comprehensive Income | | | | | | | | | | | | | | | | | | | 4,434 | |
| | | | | | | | | | | | | | | | | | | | | |
| Cash Dividends | | | | | | | | | (1,350 | ) | | | | | | (1,350 | ) |
| | | | | | | | | | | | | | | | | | | | | |
| Balances December 31, 2006 | | $ | 7,184 | | | $ | 1,662 | | | $ | 28,816 | | | $ | (586 | ) | | $ | 37,076 | |
| | |
| The accompanying notes are an integral part of these statements | |
HIGHLANDS BANKSHARES, INC. | |
CONSOLIDATED STATEMENTS OF CASH FLOWS | |
FOR THE YEARS ENDED DECEMBER 31, 2006, 2005 and 2004 | |
| (in thousands of dollars) | |
| | | Years Ended December 31, | |
| | | 2006 | | | 2005 | | | 2004 | |
| CASH FLOWS FROM OPERATING ACTIVITIES | | | | | | | | | |
| Net Income | | $ | 4,515 | | | $ | 3,802 | | | $ | 3,206 | |
| Adjustments to reconcile net income to net cash provided by operating activities | | | | | | | | | | | | |
| Gain on securities transactions | | | 0 | | | | (6 | ) | | | (4 | ) |
| (Gain) loss on sale of property | | | (7 | ) | | | (19 | ) | | | 1 | |
| Depreciation | | | 691 | | | | 692 | | | | 666 | |
| Income from life insurance contracts | | | (380 | ) | | | (234 | ) | | | (251 | ) |
| Net amortization of securities premiums | | | (182 | ) | | | 39 | | | | 248 | |
| Provision for loan losses | | | 682 | | | | 875 | | | | 920 | |
| Deferred income tax benefit | | | (115 | ) | | | (170 | ) | | | (103 | ) |
| Amortization of intangibles | | | 176 | | | | 38 | | | | 10 | |
| Decrease (Increase) in interest receivable | | | (355 | ) | | | (294 | ) | | | 282 | |
| Decrease (Increase) in other assets | | | 1 | | | | 95 | | | | 555 | |
| Increase (Decrease) in accrued expenses | | | 938 | | | | 207 | | | | (69 | ) |
| Net Cash Provided by Operating Activities | | | 5,964 | | | | 5,025 | | | | 5,461 | |
| | | | | | | | | | | | | |
| CASH FLOWS FROM INVESTING ACTIVITIES | | | | | | | | | | | | |
| Sale of property | | | 7 | | | | 19 | | | | 0 | |
| Proceeds from maturity of securities held to maturity | | | 320 | | | | 670 | | | | 201 | |
| Proceeds from maturity of securities available for sale | | | 11,539 | | | | 12,654 | | | | 15,244 | |
| Purchase of securities available for sale | | | (7,870 | ) | | | (8,083 | ) | | | (7,832 | ) |
| Increase in restricted investments | | | (320 | ) | | | (77 | ) | | | (232 | ) |
| Net change in interest bearing deposits in other banks | | | (661 | ) | | | (312 | ) | | | 536 | |
| Net increase in loans | | | (23,125 | ) | | | (13,442 | ) | | | (22,734 | ) |
| Settlement on insurance contract, net of gain | | | 555 | | | | 0 | | | | 0 | |
| Net change in federal funds sold | | | (1,402 | ) | | | (768 | ) | | | 12,712 | |
| Purchase of property and equipment | | | (1,117 | ) | | | (281 | ) | | | (265 | ) |
| Purchase of branch operations, net of cash received | | | 0 | | | | (893 | ) | | | 0 | |
| Net Cash Provided by (Used in) Investing Activities | | | (22,074 | ) | | | (10,513 | ) | | | (2,370 | ) |
| | | | | | | | | | | | | |
| CASH FLOWS FROM FINANCING ACTIVITIES | | | | | | | | | | | | |
| Net change in time deposits | | | 25,826 | | | | 5,793 | | | | (15,993 | ) |
| Net change in other deposit accounts | | | (10,034 | ) | | | (1,150 | ) | | | 7,699 | |
| Additional long term debt | | | 2,300 | | | | 8,200 | | | | 3,800 | |
| Repayment of long term debt | | | (2,371 | ) | | | (1,513 | ) | | | (719 | ) |
| Additional (repayment of) short term borrowings | | | | | | | (2,000 | ) | | | 2,000 | |
| Dividends paid in cash | | | (1,350 | ) | | | (1,179 | ) | | | (905 | ) |
| Net Cash Provided by (Used in) Financing Activities | | | 14,371 | | | | 8,151 | | | | (4,118 | ) |
| | | | | | | | | | | | | |
| CASH AND CASH EQUIVALENTS | | | | | | | | | | | | |
| Net increase (decrease) in cash and due from banks | | | (1,739 | ) | | | 2,663 | | | | (1,027 | ) |
| Cash and due from banks, beginning of year | | | 8,850 | | | | 6,187 | | | | 7,214 | |
| | | | | | | | | | | | | |
| Cash and due from banks, end of year | | $ | 7,111 | | | $ | 8,850 | | | $ | 6,187 | |
| | | | | | | | | | | | | |
| Supplemental Disclosures, Cash Paid For: | | | | | | | | | | | | |
| Interest Expense | | $ | 7,529 | | | $ | 5,523 | | | $ | 4,920 | |
| Income Taxes | | $ | 2,381 | | | $ | 1,984 | | | $ | 1,183 | |
| The accompanying notes are an integral part of these statements | |
Note One: Summary of Operations |
Highlands Bankshares, Inc. (the "Company") is a bank holding company and operates under a charter issued by the state of West Virginia. The Company owns all of the outstanding stock of The Grant County Bank ("Grant") and Capon Valley Bank ("Capon"), which operate under charters issued by the state of West Virginia. The Company also owns all of the outstanding stock of HBI Life Insurance Company, Inc. ("HBI Life"), which operates under a charter issued in Arizona. State chartered banks are subject to regulation by the West Virginia Division of Banking, The Federal Reserve Bank and the Federal Deposit Insurance Corporation, while the insurance company is regulated by the Arizona Department of Insurance. The Banks provide services to customers located mainly in Grant, Hardy, Hampshire, Mineral, Pendleton, Randolph and Tucker counties of West Virginia, including the towns of Petersburg, Keyser, Moorefield, Davis and Wardensville through ten locations and the county of Frederick in Virginia through a single location. The insurance company sells life and accident coverage exclusively through the Company's subsidiary Banks.
Note Two: Summary of Significant Accounting Policies |
The accounting and reporting policies of Highlands Bankshares, Inc. and its subsidiaries conform to accounting principles generally accepted in the United States of America and to accepted practice within the banking industry.
| (a) | Principles of Consolidation |
The consolidated financial statements include the accounts of The Grant County Bank, Capon Valley Bank and HBI Life Insurance Company. During 2005, the Company purchased all of the outstanding shares of The National Bank of Davis (“Davis”) (see Note Nineteen) and these operations are included subsequent to the purchase. All significant inter-company accounts and transactions have been eliminated.
| (b) | Use of Estimates in the Preparation of Financial Statements |
In preparing the financial statements, management is required to make estimates and assumptions that affect the reported amounts in those statements; actual results could differ significantly from those estimates. A material estimate that is particularly susceptible to significant changes in the near term is the determination of the allowance for loan losses, which is sensitive to changes in local economic conditions.
| (c) | Cash and Cash Equivalents |
For purposes of the statements of cash flows, cash and cash equivalents include cash on hand and non-interest bearing funds at correspondent institutions.
| (d) | Foreclosed Real Estate |
The components of foreclosed real estate are adjusted to the fair value of the property at the time of acquisition, less estimated costs of disposal. The current year provision for a valuation allowance has been recorded as an expense to current operations.
Securities that the Company has both the positive intent and ability to hold to maturity (at time of purchase) are classified as held to maturity securities. All other securities are classified as available for sale. Securities held to maturity are carried at historical cost and adjusted for amortization of premiums and accretion of discounts, using the effective interest method. Securities available for sale are carried at fair value with any valuation adjustments reported, net of deferred taxes, as other accumulated comprehensive income.
Restricted investments consist of investments in the Federal Home Loan Bank of Pittsburgh, the Federal Reserve Bank of Richmond and West Virginia Bankers’ Title Insurance Company. Such investments are required as members of these institutions and these investments cannot be sold without a change in the members' borrowing or service levels. Because there is no readily determinable market value for these investments, restricted investments are carried at cost on the Company’s balance sheet.
Interest and dividends on securities and amortization of premiums and discounts on securities are reported as interest income using the effective interest method. Gains (losses) realized on sales and calls of securities are determined using the specific identification method.
Loans are carried on the balance sheet net of unearned interest and allowance for loan losses. Interest income on loans is determined using the effective interest method based on the daily amount of principal outstanding except where serious doubt exists as to collectibility of the loan, in which case the accrual of income is discontinued. Loans are placed on non-accrual status or charged off if collection of principal or interest becomes doubtful. The interest on these loans is accounted for on a cash-basis or cost-recovery method until qualifying for return to accrual status. Loans are returned to accrual status when all the principal and interest amounts contractually due are brought current and the loan is performing as agreed.
| (g) | Allowance For Loan Losses |
The allowance for loan losses is established as losses are estimated to have occurred through a provision for loan losses charged to earnings. Loan losses are charged against the allowance when management believes the uncollectibility of a loan balance is confirmed. Subsequent recoveries, if any, are credited to the allowance.
The allowance for loan losses is evaluated on a regular basis by management and is based upon management's periodic review of the collectibility of the loans in light of historical experience, the nature and volume of the loan portfolio, adverse situations that may affect the borrower's ability to repay, estimated value of any underlying collateral and prevailing economic conditions. This evaluation is inherently subjective, as it requires estimates that are susceptible to significant revision as more information becomes available.
The impairment of loans that have been separately identified for evaluation is measured based on the present value of expected future cash flows or, alternatively, the observable market price of the loans or the fair value of the collateral. However, for those loans that are collateral dependent (that is, if repayment of those loans is expected to be provided solely by the underlying collateral) and for which management has determined foreclosure is possible, the measure of impairment of those loans is to be based on the fair value of the collateral. Large groups of smaller balance homogenous loans are collectively evaluated for impairment. Accordingly, the Company does not separately identify individual consumer and residential loans for impairment disclosures.
| (h) | Per Share Calculations |
Earnings per share are based on the weighted average number of shares outstanding.
| (i) | Bank Premises and Equipment |
Bank premises and equipment are stated at cost less accumulated depreciation. Assets acquired in the acquisition of Davis have been recorded at their fair value. Depreciation is charged to income over the estimated useful lives of the assets using a combination of the straight line and accelerated methods. The costs of maintenance, repairs, renewals, and improvements to buildings, equipment and furniture and fixtures are charged to operations as incurred. Gains and losses on routine dispositions are reflected in other income or expense.
| (j) | Recent Accounting Standards |
In September 2006, the FASB issued Statement of Financial Accounting Standards No. 158, “Employers Accounting for Defined Benefit Pension and Other Postretirement Plans—an amendment of FASB Statements No. 87, 88, 106 and 132R” (SFAS 158). SFAS 158 requires an employer to recognize the over-funded or under-funded status of a defined benefit postretirement plan as an asset or liability in its statement of financial position and to recognize changes in that funded status, through comprehensive income, in the year in which the changes occur. The funded status of a benefit plan will be measured as the difference between plan assets at fair value and benefit obligation. For any other postretirement plan, the benefit obligation is the accumulated postretirement benefit obligation. SFAS 158 also requires an employer to measure the funded status of a plan as of the date of its year-end statement of financial position. The Statement also requires additional disclosures in the notes to financial statements about certain effects on net periodic benefit cost for the next fiscal year that arise from delayed recognition of the gains or losses, prior service costs or credits, and transition asset or obligation. Under SFAS 158 a company is required to initially recognize the funded status of a defined benefit postretirement plan to provide the required disclosures as of the end of the fiscal year ending after December 15, 2006. The requirement to measure plan assets and benefit obligations as of the date of the employer’s fiscal year end statement of financial position is effective for fiscal years ending after December 15, 2008. The Grant County Bank is a member of the West Virginia Bankers' Association Retirement Plan, a defined benefit plan under SFAS 158.
No other recent accounting pronouncements had a material impact on the Company’s consolidated financial statements, and is is believed that none will have a material impact on the Company’s operations in future years.
Amounts provided for income tax expense are based on income reported for financial statement purposes rather than amounts currently payable under federal and state tax laws. Deferred taxes, which arise principally from differences between the period in which certain income and expenses are recognized for financial accounting purposes and the period in which they affect taxable income, are included in the amounts provided for income taxes.
Accounting principles generally require that recognized revenue, expenses, gains and losses be included in net income. Certain changes in assets and liabilities, such as unrealized gains and losses on available-for-sale securities and accrued pension liabilities, are reported along with net income as the components of comprehensive income.
| (m) | Bank Owned Life Insurance Contracts |
The Company has invested in and owns life insurance polices on key officers. The policies are designed so that the Company recovers the interest expenses associated with carrying the policies and the officer will, at the time of retirement, receive any earnings in excess of the amounts earned by the Company.
The Company recognizes as an asset the net amount that could be realized under the insurance contract as of the balance sheet date. This amount represents the cash surrender value of the policies less applicable surrender charges.
The portion of the benefits, which will be received by the executives at the time of their retirement, is considered, when taken collectively, to constitute a retirement plan. Therefore the Company accounts for these policies using guidance found in Statement of Financial Accounting Standards No. 106, "Employers' Accounting for Post Retirement Benefits Other Than Pensions.” SFAS No. 106 requires that an employers' obligation under a deferred compensation agreement be accrued over the expected service life of the employee through their normal retirement date.
Advertising costs are expensed as they are incurred. Advertising expense for the years ended December 31, 2006, 2005 and 2004 was $ 198,000, $158,000 and $161,000 respectively.
| (o) | Goodwill and Other Intangible Assets |
Goodwill represents the cost in excess of the fair value of net assets acquired (including identifiable intangibles) in transactions accounted for as purchases. In accordance with provisions of SFAS No. 142, "Goodwill and Other Intangible Assets", goodwill is not amortized over an estimated useful life, but rather will be tested at least annually for impairment. As of December 31, 2006, the Company found the goodwill acquired in the Davis acquisition to not be impaired.
Core deposit and other intangible assets include premiums paid for acquisitions of core deposits (core deposit intangibles) and other identifiable intangible assets. Intangible assets other than goodwill, which are determined to have finite lives, are amortized based upon the estimated economic benefits received, which is ten years for the core deposit intangibles.
Certain reclassifications have been made to prior period balances to conform with the current years’ presentation format.
The income derived from taxable and non-taxable securities for the years ended December 31, 2006, 2005 and 2004 is shown below (in thousands of dollars):
| | | Year Ended December 31, | |
| | | 2006 | | | 2005 | | | 2004 | |
| Investment securities, taxable | | | 1,095 | | | | 707 | | | | 674 | |
| Investment securities, nontaxable | | | 109 | | | | 103 | | | | 122 | |
The carrying amount and estimated fair value of securities held to maturity at December 31, 2006 and 2005 are as follows (in thousands of dollars):
| Held to Maturity Securities | |
| | | Amortized Cost | | | Unrealized Gains | | | Unrealized Losses | | | Fair Value | |
| December 31, 2006 | | | | | | | | | | | | |
| | | | | | | | | | | | | |
| State and municipals | | $ | 170 | | | $ | -- | | | $ | -- | | | $ | 170 | |
| Total Securities Held to Maturity | | $ | 170 | | | $ | -- | | | $ | -- | | | $ | 170 | |
| | | | | | | | | | | | | | | | | |
| December 31, 2005 | | | | | | | | | | | | | | | | |
| State and municipals | | $ | 491 | | | $ | 3 | | | $ | -- | | | $ | 494 | |
| Total Securities Held to Maturity | | $ | 491 | | | $ | 3 | | | $ | -- | | | $ | 494 | |
| | | | | | | | | | | | | | | | | |
Securities having a carrying value of $7,273,000 at December 31, 2006 were pledged to secure public deposits and for other purposes required by law.
The carrying amount and estimated fair value of securities available for sale at December 31, 2006 and 2005 are as follows (in thousands of dollars):
| Available for Sale Securities | |
| | | Amortized Cost | | | Unrealized Gains | | | Unrealized Losses | | | Fair Value | |
| December 31, 2006 | | | | | | | | | | | | |
| | | | | | | | | | | | | |
| U.S. Treasuries and Agencies | | $ | 14,397 | | | $ | 46 | | | $ | 40 | | | $ | 14,403 | |
| Mortgage backed securities | | | 6,547 | | | | 32 | | | | 25 | | | | 6,554 | |
| State and municipals | | | 2,763 | | | | 3 | | | | 22 | | | | 2,744 | |
| Marketable equities | | | 28 | | | | --- | | | | --- | | | | 28 | |
| Total Securities Available for Sale | | $ | 23,735 | | | $ | 81 | | | $ | 87 | | | $ | 23,729 | |
| | | | | | | | | | | | | | | | | |
| December 31, 2005 | | | | | | | | | | | | | | | | |
| | | | | | | | | | | | | | | | | |
| U.S. Treasuries and Agencies | | $ | 17,352 | | | $ | 19 | | | $ | 137 | | | $ | 17,234 | |
| Mortgage backed securities | | | 7,172 | | | | 30 | | | | 39 | | | | 7,163 | |
| State and municipals | | | 2,719 | | | | 6 | | | | 20 | | | | 2,705 | |
| Marketable equities | | | 28 | | | | --- | | | | --- | | | | 28 | |
| Total Securities Available for Sale | | $ | 27,271 | | | $ | 55 | | | $ | 196 | | | $ | 27,130 | |
The carrying amount and fair value of debt securities at December 31, 2006, by contractual maturity are shown below (in thousands of dollars). Expected maturities will differ from contractual maturities because borrowers may have the right to call or prepay obligations with or without call or prepayment penalties.
| Securities Held to Maturity | |
| | | Amortized Cost | | | Fair Value | |
| Due in one year or less | | $ | 170 | | | $ | 170 | |
| | | | | | | | | |
| Total Securities Held to Maturity | | $ | 170 | | | $ | 170 | |
| | | | | | | | | |
| | | | | | | | | |
| Securities Available for Sale | |
| | | Amortized Cost | | | Fair Value | |
| Due in one year or less | | $ | 8,408 | | | $ | 8,380 | |
| Due after one year through five years | | | 8,753 | | | | 8,767 | |
| Mortgage backed securities | | | 6,546 | | | | 6,554 | |
| Equity securities with no maturity | | | 28 | | | | 28 | |
| | | | | | | | | |
| Total Securities Available for Sale | | $ | 23,735 | | | $ | 23,729 | |
Information pertaining to securities with gross unrealized losses at December 31, 2006 and 2005, aggregated by investment category and length of time that individual securities have been in a continuous loss position is shown in the table below (in thousands of dollars):
| | | Total | | | Less than 12 Months | | | 12 Months or Greater | |
| | | Fair Value | | | Gross Unrealized Losses | | | Fair Value | | | Gross Unrealized Losses | | | Fair Value | | | Gross Unrealized Losses | |
| December 31, 2006 | | | | | | | | | | | | | | | | |
| Investment Category | | | | | | | | | | | | | | | | | | |
| U.S. Treasury and Agency | | $ | 9,635 | | | $ | (40 | ) | | $ | 3,426 | | | $ | (6 | ) | | $ | 6,209 | | | $ | (34 | ) |
| Mortgage backed securities | | | 3,233 | | | | (25 | ) | | | 34 | | | | (1 | ) | | | 3,199 | | | | (24 | ) |
| State and municipals | | | 2,106 | | | | (22 | ) | | | 891 | | | | (7 | ) | | | 1,215 | | | | (15 | ) |
| Total | | $ | 14,974 | | | $ | (87 | ) | | $ | 4,351 | | | $ | (14 | ) | | $ | 10,623 | | | $ | (73 | ) |
| | | | | | | | | | | | | | | | | | | | | | | | | |
| December 31, 2005 | | | | | | | | | | | | | | | | | | | | | |
| Investment Category | | | | | | | | | | | | | | | | | | | | | | | | |
| U.S. Treasury and Agency | | $ | 15,077 | | | $ | (137 | ) | | $ | 6,643 | | | $ | (52 | ) | | $ | 8,434 | | | $ | (85 | ) |
| Mortgage backed securities | | | 4,289 | | | | (39 | ) | | | 3,569 | | | | (27 | ) | | | 720 | | | | (12 | ) |
| State and municipals | | | 2,042 | | | | (20 | ) | | | 1,117 | | | | (15 | ) | | | 925 | | | | (5 | ) |
| Total | | $ | 21,408 | | | $ | (196 | ) | | $ | 11,329 | | | $ | (94 | ) | | $ | 10,079 | | | $ | (102 | ) |
The number of securities available for sale that were in an unrealized loss position at December 31, 2006 is summarized in the table below:
| | | Total | | | Loss Position less than 12 Months | | | Loss Position greater than 12 Months | |
| U.S. Treasuries and Agencies | | | 23 | | | | 10 | | | | 13 | |
| Mortgage backed securities | | | 14 | | | | 13 | | | | 1 | |
| States and municipals | | | 10 | | | | 5 | | | | 5 | |
| Total | | | 47 | | | | 28 | | | | 19 | |
It is management’s determination that all securities held at December 31, 2006, which have fair values less than the amortized cost, have gross unrealized losses related to increases in the current interest rates for similar issues of securities and that no material impairment for any securities in the portfolio exist because of downgrades of the securities or as a result of a change in the financial condition of any of the issuers.
Note Four: Restricted Investments |
Restricted investments at December 31, 2006 consist of investments in the Federal Reserve Bank (FRB), Federal Home Loan Bank (FHLB) and West Virginia Bankers’ Title Insurance Company. These investments are carried at face value. The level of investment in the FRB and FHLB is dictated by the level of participation with each institution. All of these investments are restricted as to transferability. Investments in the FHLB act as a collateral against the outstanding borrowings from that institution.
Loans outstanding as of December 31, 2006 and 2005 are summarized as follows (in thousands of dollars):
| | | 2006 | | | 2005 | |
| Commercial | | $ | 70,408 | | | $ | 57,908 | |
| Real Estate Construction | | | 14,828 | | | | 12,201 | |
| Real Estate Mortgage | | | 164,243 | | | | 153,646 | |
| Consumer Installment | | | 43,337 | | | | 46,265 | |
| Total Loans | | $ | 292,816 | | | $ | 270,020 | |
The following is a summary of information pertaining to impaired and non accrual loans at December 31, 2006 and 2005 (in thousands of dollars):
| | | 2006 | | | 2005 | |
| Year end balance, impaired loans | | $ | 1,895 | | | $ | 1,494 | |
| Allowance for impairments, year end | | | 720 | | | | 353 | |
| Average balance impaired loans, year ended December 31 | | | 1,773 | | | | 1,576 | |
| Income recorded on impaired loans, year ended December 31 | | | 131 | | | | 104 | |
| | | | | | | | | |
No loans were identified as impaired as of December 31 for which an allowance was not provided.
Certain loans identified as impaired are placed into non-accrual status, based upon the loans’ performance compared with contractual terms. Not all loans identified as impaired are placed upon non-accrual status. The interest on loans identified as impaired and also placed in non-accrual status and not recognized as income throughout the year was of an immaterial amount in both 2006 and 2005.
Balances of non-accrual loans and loans past due ninety days or greater and still accruing interest at December 31, 2006 and 2005 are shown below (in thousands of dollars):
| | | 2006 | | | 2005 | |
| Non-accrual loans at year end | | $ | 244 | | | $ | 743 | |
| Loans past due ninety days or greater and still accruing interest at year end | | | 1,457 | | | | 1,189 | |
Note Six: Allowance For Loan Losses |
A summary of the changes in the allowance for loan losses for the years ended December 31, 2006, 2005 and 2004 is show below (in thousands of dollars):
| | | 2006 | | | 2005 | | | 2004 | |
| Balance at beginning of year | | $ | 3,129 | | | $ | 2,530 | | | $ | 2,463 | |
| Provision charged to operating expenses | | | 682 | | | | 875 | | | | 920 | |
| Other additions | | | 0 | | | | 166 | | | | 0 | |
| Loan recoveries | | | 250 | | | | 178 | | | | 308 | |
| Loans charged off | | | (579 | ) | | | (620 | ) | | | (1,161 | ) |
| Balance at end of year | | $ | 3,482 | | | $ | 3,129 | | | $ | 2,530 | |
| | | | | | | | | | | | | |
| Allowance for Loan Losses as percentage of outstanding loans at year end | | | 1.19 | % | | | 1.16 | % | | | 1.02 | % |
Note Seven: Bank Premises and Equipment |
Bank premises and equipment as of December 31, 2006 and 2005 are summarized as follows (in thousands of dollars):
| | | 2006 | | | 2005 | |
| Land | | $ | 1,398 | | | $ | 1,323 | |
| Buildings and improvements | | | 7,897 | | | | 7,350 | |
| Furniture and equipment | | | 5,383 | | | | 4,902 | |
| | | | | | | | | |
| Total Cost | | | 14,678 | | | | 13,575 | |
| Less accumulated depreciation | | | (6,579 | ) | | | (5,891 | ) |
| | | | | | | | | |
| Net Book Value | | $ | 8,099 | | | $ | 7,684 | |
Provisions for depreciation charged to operations during 2006, 2005 and 2004 were as follows (in thousands of dollars):
Year | | Provision for Depreciation | |
| 2006 | | $ | 691 | |
| 2005 | | | 692 | |
| 2004 | | | 666 | |
At December 31, 2006, the scheduled maturities of time deposits were as follows (in thousands of dollars):
Year | | Amount Maturing | |
| 2007 | | $ | 132,114 | |
| 2008 | | | 23,844 | |
| 2009 | | | 6,093 | |
| 2010 | | | 9,187 | |
| 2011 | | | 10,930 | |
| Total | | $ | 182,168 | |
Interest expense on time deposits of $100,000 and over aggregated $2,086,000, $1,453,000 and $1,349,000 for 2006, 2005 and 2004, respectively.
The aggregate amount of demand deposit overdrafts reclassified as loan balances were $138,000 and $115,000 at December 31, 2006 and 2005, respectively.
Note Nine: Borrowed Money |
The Company has borrowed money from the Federal Home Loan Bank of Pittsburgh (FHLB). These borrowings have typically been for maturities of six months or longer. The various borrowings mature from 2007 to 2020. The interest rates on the various borrowings at December 31, 2006 range from 3.30% to 6.12%. The weighted average interest rate on the borrowings at December 31, 2006 was 4.50%. The Company has total borrowing capacity from the FHLB of $166,278,000. The Banks have pledged certain investments and mortgage loans as collateral on the FHLB borrowings in the approximate amount of $ 166,278,000 at December 31, 2006.
The subsidiary Banks also have short term borrowing capacity from each of their respective correspondent banks. As of December 31, 2006 the Company has total borrowing capacity from its correspondent banks of $25,300,000. The interest rates on these lines are variable and are subject to change daily based on current market conditions.
Repayments of long-term debt are due either monthly, quarterly or in a single payment at maturity. The maturities of long-term debt as of December 31, 2006 are as follows (in thousands of dollars):
Year | | Balance | |
| 2007 | | $ | 4,199 | |
| 2008 | | | 568 | |
| 2009 | | | 460 | |
| 2010 | | | 481 | |
| 2011 | | | 683 | |
| Thereafter | | | 8,601 | |
| Total | | $ | 14,992 | |
| | | | | |
In addition to the above facility, the Company has a line of credit with an unrelated financial institution for $2,500,000. The Company has not drawn on this line and the full amount is available for future borrowings, if needed.
Note Ten: Restrictions on Dividends of Subsidiary Banks |
The principal source of funds of Highlands Bankshares, Inc. is dividends paid by its subsidiary Banks. The various regulatory authorities impose restrictions on dividends paid by a state bank. A state bank cannot pay dividends (without the consent of state banking authorities) in excess of the total net profits (net income less dividends paid) of the current year to date and the combined retained profits of the previous two years. As of January 1, 2007, the Banks could pay dividends to Highlands Bankshares, Inc. of approximately $5,698,000 without permission of the regulatory authorities.
Note Eleven: Income Tax Expense |
The components of income tax expense for the years ended December 31, 2006, 2005 and 2004 are summarized in the table below (in thousands of dollars):
| | | 2006 | | | 2005 | | | 2004 | |
| Current Expense | | | | | | | | | |
| Federal | | $ | 2,154 | | | $ | 1,814 | | | $ | 1,420 | |
| State | | | 352 | | | | 272 | | | | 234 | |
| Total Current Expense | | | 2,506 | | | | 2,086 | | | | 1,654 | |
| | | | | | | | | | | | | |
| Deferred Expense (Benefit) | | | | | | | | | | | | |
| Federal | | | (107 | ) | | | (149 | ) | | | (99 | ) |
| State | | | (8 | ) | | | (21 | ) | | | (4 | ) |
| Total Current Expense (Benefit) | | | (115 | ) | | | (170 | ) | | | (103 | ) |
| | | | | | | | | | | | | |
| Income Tax Expense | | $ | 2,391 | | | $ | 1,916 | | | $ | 1,551 | |
The deferred tax effects of temporary differences for the years ended December 31, 2006, 2005 and 2004 are as follows (in thousands of dollars):
| | | 2006 | | | 2005 | | | 2004 | |
| Provision for loan losses | | $ | (140 | ) | | $ | (193 | ) | | $ | (8 | ) |
| Depreciation | | | (45 | ) | | | (45 | ) | | | 18 | |
| Deferred compensation | | | (39 | ) | | | 59 | | | | (125 | ) |
| Loss carry forward | | | 71 | | | | 0 | | | | 0 | |
| Miscellaneous | | | 38 | | | | 9 | | | | 12 | |
| Net (increase) decrease in deferred income tax benefit | | $ | (115 | ) | | $ | (170 | ) | | $ | (103 | ) |
The net deferred tax assets arising from temporary differences as of December 31, 2006 and 2005 are as follows (in thousands of dollars):
| | | 2006 | | | 2005 | |
| Deferred Tax Assets | | | | | | |
| Provision for loan losses | | $ | 1,008 | | | $ | 868 | |
| Insurance commissions | | | 39 | | | | 45 | |
| Loss carry forward | | | 0 | | | | 71 | |
| Deferred compensation | | | 817 | | | | 778 | |
| Pension obligation | | | 244 | | | | 150 | |
| Unrealized loss on securities available for sale | | | 1 | | | | 52 | |
| Other | | | 4 | | | | 6 | |
| Total Assets | | | 2,113 | | | | 1,970 | |
| | | | | | | | | |
| Deferred Tax Liabilities | | | | | | | | |
| Accretion income | | | 69 | | | | 29 | |
| Depreciation | | | 397 | | | | 442 | |
| Total Liabilities | | | 466 | | | | 471 | |
| | | | | | | | | |
| Net Deferred Tax Asset | | $ | 1,647 | | | $ | 1,499 | |
The following table summarizes the differences between income tax expense and the amount computed by applying the federal statutory rate for the three years ended December 31, 2006, 2005 and 2004 (in thousands of dollars):
| | | 2006 | | | 2005 | | | 2004 | |
| Amounts at federal statutory rates | | $ | 2,348 | | | $ | 1,944 | | | $ | 1,617 | |
| | | | | | | | | | | | | |
| Additions (reductions) resulting from: | | | | | | | | | | | | |
| Tax exempt income | | | (31 | ) | | | (50 | ) | | | (78 | ) |
| Partially exempt income | | | (25 | ) | | | (40 | ) | | | (41 | ) |
| State income taxes, net | | | 222 | | | | 178 | | | | 147 | |
| Income from life insurance contracts | | | (143 | ) | | | (91 | ) | | | (94 | ) |
| Other | | | 20 | | | | (25 | ) | | | 0 | |
| | | | | | | | | | | | | |
| Income tax expense | | $ | 2,391 | | | $ | 1,916 | | | $ | 1,551 | |
Note Twelve: Transactions with Related Parties |
During the year, officers and directors (and companies controlled by them) of the Company and subsidiary Banks were customers of and had transactions with the subsidiary Banks in the normal course of business. These transactions were made on substantially the same terms as those prevailing for other customers and did not involve any abnormal risk. Aggregate loan balances include open lines of credit, which are included in the balances above inclusive of unused amounts. The table below summarizes changes to balances of loans made to related parties during the years ended December 31, 2006 and 2005 (in thousands of dollars):
| | | 2006 | | | 2005 | |
| Loans to related parties, beginning of year | | $ | 5,065 | | | $ | 5,084 | |
| New loans | | | 549 | | | | 1,218 | |
| Repayments | | | (558 | ) | | | (1,237 | ) |
| Other changes related to changes in executive officer or director status | | | 87 | | | | 0 | |
| Loans to related parties, end of year | | $ | 5,143 | | | $ | 5,065 | |
At December 31, 2006, deposits of related parties including directors, executive officers, and their related interests of Highlands Bankshares, Inc. and subsidiaries approximated $6,665,000.
Note Thirteen: Concentrations |
The Banks grant commercial, residential real estate and consumer loans to customers located primarily in the eastern portion of the State of West Virginia. Although the Banks have a diversified loan portfolio, a substantial portion of the debtors' ability to honor their contracts is dependent upon the agribusiness, mining, trucking and logging sectors. Collateral required by the Banks is determined on an individual basis depending on the purpose of the loan and the financial condition of the borrower. The ultimate collectibility of the loan portfolios is susceptible to changes in local economic conditions. Of the $292,816,000 and $270,020,000 loans held by the Company at December 31, 2006 and 2005, respectively, $226,313,000 and $200,026,000 are secured by real estate.
The Company’s subsidiaries had cash deposited in and federal funds sold to other commercial banks totaling $14,918,000 and $12,380,000 at December 31, 2006 and 2005, respectively. Deposits with other correspondent banks are generally unsecured and have limited insurance under current banking insurance regulations, which management considers to be a normal business risk.
Note Fourteen: Employee Benefits |
In addition to an Employee Stock Ownership Plan (ESOP), which provides stock ownership to all employees of the Company, the Company’s two subsidiary Banks, The Grant County Bank (Grant) and Capon Valley Bank (Capon) have separate retirement and profit sharing plans which cover substantially all full time employees at each Bank. A summary of the employee benefits provided by each Bank is provided below.
The Company’s ESOP plan provides stock ownership to all employees of the Company. The Plan provides total vesting upon the attainment of seven years of service. Contributions to the plan are made at the discretion of the board of directors and are allocated based on the compensation of each employee relative to total compensation paid by the Company. All shares held by the Plan are considered outstanding in the computation of earnings per share. Shares of Company stock, when distributed, will have restrictions on transferability.
Certain executives of both Grant and Capon have post retirement benefits related to the Banks’ investment in life insurance policies (see Note Twenty).
Expenses related to all retirement benefit plans charged to operations totaled $808,000 in 2006, $505,000 in 2005 and $437,000 in 2004.
Capon Valley Bank
Capon has a defined contribution pension plan with 401(k) features that is funded with discretionary contributions. Capon matches on a limited basis the contributions of the employees. Investment of employee balances is done through the direction of each employee. Employer contributions are vested over a six-year period.
The Grant County Bank
Grant is a member of the West Virginia Bankers’ Association Retirement Plan (“the Plan”). This plan is a defined benefit plan with benefits under the plan based on compensation and years of service with full vesting after seven years of service. Prior to 2002, the Plan’s assets were in excess of the projected benefit obligations and thus Grant was not required to make contributions to the Plan. Since 2004, Grant has been required to make contributions and expects to be required to make contributions in 2007. At December 31, 2006, Grant has recognized liabilities of $680,331 relating to unfunded pension liabilities. As a result of the Plan’s inability to meet expected returns in recent years, a portion of this liability is reflected as a decrease in other comprehensive income of $584,471 (net of $343,261 tax benefit).
The following table provides a reconciliation of the changes in the Plan’s obligations and fair value of assets as of December 31, 2006 and 2005 using a measurement date of November 1, 2006 (in thousands of dollars):
| | | 2006 | | | 2005 | |
Change in Benefit Obligation | | | | | | |
| Benefit obligation, beginning | | $ | 3,310 | | | $ | 2,743 | |
| Service Cost | | | 131 | | | | 123 | |
| Interest Cost | | | 192 | | | | 179 | |
| Actuarial Loss (Gain) | | | (52 | ) | | | 325 | |
| Benefits Paid | | | (54 | ) | | | (60 | ) |
| Benefit obligation, ending | | $ | 3,527 | | | $ | 3,310 | |
| | | | | | | | | |
| Accumulated Benefit Obligation | | $ | 3,088 | | | $ | 2,852 | |
| | | | | | | | | |
Change in Plan Assets | | | | | | | | |
| Fair value of assets, beginning | | $ | 2,422 | | | $ | 1,768 | |
| Actual return on assets, net of administrative expenses | | | 307 | | | | 148 | |
| Employer contributions | | | 186 | | | | 566 | |
| Benefits paid | | | (54 | ) | | | (60 | ) |
| Fair value of assets, ending | | $ | 2,861 | | | $ | 2,422 | |
| | | | | | | | | |
Funded Status | | | | | | | | |
| Fair value of plan assets | | $ | 2,861 | | | $ | 2,422 | |
| Projected benefit obligation | | | 3,527 | | | | (3,310 | ) |
| Funded status | | | (666 | ) | | | (888 | ) |
| | | | | | | | | |
| Amounts Recognized in the Statement of Financial Position | | | | | | | | |
| Assets | | $ | 0 | | | $ | 0 | |
| Liabilities | | | (666 | ) | | | (888 | ) |
| Total | | $ | (666 | ) | | $ | (888 | ) |
| | | | | | | | | |
| Amounts Recognized in Accumulated Other Comprehensive Income | | | | | | | | |
| Transition Obligation (Asset) | | | | | | | | |
| Prior Service Cost | | $ | 14 | | | $ | 25 | |
| Net (Gain)/Loss | | | 914 | | | | 1,121 | |
| Total | | $ | 928 | | | $ | 1,146 | |
The adoption of SFAS No. 158 had no effect on the Company’s consolidated net income for the year ended December 31, 2006 or for any prior period. The incremental effects of adopting the provisions of SFAS No. 158 on the Company’s consolidated balance sheet at December 31, 2006 are presented in the following table (in thousands of dollars):
| | | December 31, 2006 | |
| | | Prior to Adopting SFAS No. 158 | | | Effect of Adopting SFAS No. 158 | | | As Reported | |
| Accrued pension liability | | $ | 144 | | | $ | 522 | | | $ | 666 | |
| Deferred income tax benefit | | | 150 | | | | 193 | | | | 343 | |
| Accumulated other comprehensive loss | | | 255 | | | | 329 | | | | 584 | |
The following table provides the components of the net periodic pension expense for the Plan for the years ended December 31, 2006, 2005 and 2004 (in thousands of dollars):
| | | 2006 | | | 2005 | | | 2004 | |
| Service cost | | $ | 131 | | | $ | 123 | | | $ | 114 | |
| Interest cost | | | 192 | | | | 179 | | | | 162 | |
| Expected return on plan assets | | | (212 | ) | | | (176 | ) | | | (166 | ) |
| Amortization of net obligation at transition | | | | | | | | | | | | |
| Recognized net actuarial loss | | | 61 | | | | 27 | | | | 14 | |
| Amortization of prior service cost | | | 11 | | | | 11 | | | | 11 | |
| Net Periodic Pension Expense | | $ | 183 | | | $ | 164 | | | $ | 135 | |
The expected pension expense for 2007 is $156,000. The amount of the Company’s minimum contribution for 2007 is $156,000.
The table below summarizes the benefits expected to be paid to participants in the plan (in thousands of dollars):
Year | | Expected Benefit Payments | |
| 2007 | | $ | 105 | |
| 2008 | | | 113 | |
| 2009 | | | 144 | |
| 2010 | | | 148 | |
| 2011 | | | 165 | |
| Years 2012 - 2016 | | | 1,293 | |
The weighted average assumption used in the measurement of Grant’s benefit obligation and net periodic pension expense is as follows:
| | | 2006 | | | 2005 | | | 2004 | |
| Discount rate | | | 5.8 | % | | | 6.5 | % | | | 6.5 | % |
| Expected return on plan assets | | | 8.5 | % | | | 8.5 | % | | | 8.5 | % |
| Rate of compensation increase | | | 3.0 | % | | | 3.5 | % | | | 3.5 | % |
The plan sponsor estimates the expected long-term rate of return on assets in consultation with their advisors and the plan actuary. This rate is intended to reflect the average rate of earnings expected to be earned on the funds invested or to be invested to provide plan benefits. Historical performance is reviewed, especially with respect to real rate of return (net of inflation) for the major asset classes held or anticipated to be held by the trust. Undue weight is not given to recent experience, which may not continue over the measurement period, with higher significance placed on current forecasts of future long-term economic conditions.
The following table provides the pension plan’s asset allocation as of December 31, 2006 and 2005:
| | | 2006 | | | 2005 | |
| Equity Securities | | | 74 | % | | | 73 | % |
| Debt Securities | | | 20 | % | | | 22 | % |
| Other | | | 6 | % | | | 5 | % |
The trust fund is sufficiently diversified to maintain a reasonable level of risk without imprudently sacrificing return. The targeted asset allocation and allowable range of allocation is set forth in the table below:
| | Target Allocation | Allowable Allocation Range |
| Equity Securities | 75% | 40%-80% |
| Debt Securities | 25% | 20%-40% |
| Other | 0% | 3%-10% |
The Investment Manager selects investment fund managers with demonstrated experience and expertise, and funds with demonstrated historical performance, for the implementation of the Plan’s investment strategy. The Investment Manager will consider both actively and passively managed investment strategies and will allocate funds across the asset classes to develop an efficient investment structure.
The Grant County Bank also maintains a profit sharing plan covering substantially all employees to which contributions are made at the discretion of the board of directors. Plan contributions by the employer are fully vested in the year of contribution.
Note Fifteen: Commitments and Guarantees |
The Banks make commitments to extend credit in the normal course of business and issue standby letters of credit to meet the financing needs of their customers. The amount of the commitments represents the Banks' exposure to credit loss that is not included in the balance sheet.
The Banks use the same credit policies in making commitments and issuing letters of credit as used for the loans reflected in the balance sheet. Commitments to extend credit are agreements to lend to a customer as long as there is no violation of any condition established in the contract. Commitments generally have fixed expiration dates or other termination clauses and may require payment of a fee. Since many of the commitments are expected to expire without being drawn upon, the total commitment amounts do not necessarily represent future cash requirements. The Banks evaluate each customer's creditworthiness on a case-by-case basis. The amount of collateral obtained, if deemed necessary by the Banks upon the extension of credit, is based on management's credit evaluation of the borrower. Collateral held varies but may include accounts receivable, inventory, property, plant and equipment.
As of December 31, 2006 and 2005, the Banks had outstanding the following commitments (in thousands of dollars):
| | | 2006 | | | 2005 | |
| Commitments to extend credit | | $ | 18,933 | | | $ | 21,087 | |
| Standby letter of credit | | | 957 | | | | 423 | |
Note Sixteen: Disclosures About Fair Value of Financial Instruments |
The fair value of the Company's assets and liabilities is influenced heavily by market conditions. Fair value applies to both assets and liabilities, either on or off the balance sheet. Fair value is defined as the amount at which a financial instrument could be exchanged in a current transaction between willing parties, other than in a forced or liquidation sale.
The following methods and assumptions were used to estimate the fair value of each class of financial instruments for which it is practicable to estimate that value:
Cash, Due from Banks and Money Market Investments
The carrying amount of cash, due from bank balances, interest bearing deposits and federal funds sold is a reasonable estimate of fair value.
Securities
Fair values of securities are based on quoted market prices or dealer quotes. If a quoted market price is not available, fair value is estimated using quoted market prices for similar securities.
Restricted Investments
The carrying amount of restricted investments is a reasonable estimate of fair value.
Loans
The fair value of loans is estimated by discounting the future cash flows using the current rates at which similar loans would be made to borrowers with similar credit ratings and for the same remaining maturities, taking into consideration the credit risk in various loan categories.
Deposits
The fair value of demand, interest checking, regular savings and money market deposits is the amount payable on demand at the reporting date. The fair value of fixed maturity certificates of deposit is estimated using the rates currently offered for deposits of similar remaining maturities.
Long Term Debt
The fair value of fixed rate loans is estimated using the rates currently offered by the Federal Home Loan Bank for indebtedness with similar maturities.
Short Term Debt
The fair value of short-term variable rate debt is deemed to be equal to the carrying value.
Interest Payable and Receivable
The carrying value of amounts of interest receivable and payable is a reasonable estimate of fair value.
Life Insurance
The carrying amount of life insurance contracts is assumed to be a reasonable fair value. Life insurance contracts are carried on the balance sheet at their redemption value as of December 31, 2006. This redemption value is based on existing market conditions and therefore represents the fair value of the contract.
Off-Balance-Sheet Items
The carrying amount and estimated fair value of off-balance-sheet items were not material at December 31, 2006 or 2005.
The carrying amount and estimated fair values of financial instruments as of December 31, 2006 and 2005 are as follows (in thousands of dollars):
| | | 2006 | | | 2005 | |
| | | Carrying Amount | | | Estimated Fair Value | | | Carrying Amount | | | Estimated Fair Value | |
| Financial Assets: | | | | | | | | | | | | |
| Cash and due from banks | | $ | 7,111 | | | $ | 7,111 | | | $ | 8,850 | | | $ | 8,850 | |
| Interest bearing deposits | | | 1,624 | | | | 1,624 | | | | 963 | | | | 963 | |
| Federal funds sold | | | 12,210 | | | | 12,210 | | | | 10,808 | | | | 10,808 | |
| Securities held to maturity | | | 170 | | | | 170 | | | | 491 | | | | 494 | |
| Securities available for sale | | | 23,729 | | | | 23,729 | | | | 27,130 | | | | 27,130 | |
| Restricted investments | | | 1,570 | | | | 1,570 | | | | 1,250 | | | | 1,250 | |
| Loans, net | | | 292,816 | | | | 293,661 | | | | 266,891 | | | | 268,347 | |
| Interest receivable | | | 2,173 | | | | 2,173 | | | | 1,818 | | | | 1,818 | |
| Life insurance contracts | | | 6,066 | | | | 6,066 | | | | 6,396 | | | | 6,396 | |
| | | | | | | | | | | | | | | | | |
| Financial Liabilities: | | | | | | | | | | | | | | | | |
| Demand and savings deposits | | | 118,316 | | | | 118,316 | | | | 128,350 | | | | 128,350 | |
| Time deposits | | | 182,168 | | | | 183,505 | | | | 156,342 | | | | 156,541 | |
| Long term debt | | | 14,992 | | | | 14,641 | | | | 15,063 | | | | 14,819 | |
| Interest payable | | | 1,014 | | | | 1,014 | | | | 633 | | | | 633 | |
Note Seventeen: Regulatory Matters |
The Company is subject to various regulatory capital requirements administered by the federal banking agencies. Failure to meet minimum capital requirements can initiate certain mandatory - and possibly additional discretionary - actions by regulators that, if undertaken, could have a direct material effect on the Company's financial statements. Under capital adequacy guidelines and the regulatory framework for prompt corrective action, the Company must meet specific capital guidelines that involve quantitative measures of the Company's assets, liabilities, and certain off-balance-sheet items as calculated under regulatory accounting practices. The Company's capital amounts and classification are also subject to qualitative judgments by the regulators about components, risk weightings and other factors.
Quantitative measures established by regulation to ensure capital adequacy require the Company to maintain minimum amounts and ratios (set forth in the table below) of total and Tier I capital (as defined in the regulations) to risk-weighted assets (as defined), and of Tier I capital (as defined) to average assets (as defined). The Company meets all capital adequacy requirements to which it is subject and as of the most recent examination, the Company was classified as well capitalized.
To be categorized as well capitalized the Company must maintain minimum total risk-based, Tier I risk-based, and Tier I leverage ratios as set forth in the table. There are no conditions or events that management believes have changed the Company's category from a well-capitalized status.
The Company’s actual and required capital amounts and ratios at December 31, 2006 is presented in the following table (in thousands of dollars):
| | | December 31, 2006 | |
| | | | | | | | | Regulatory Requirements | |
| | | Actual | | | Adequately Capitalized | | | Well Capitalized | |
| | | Amount | | | Percentage | | | Amount | | | Percentage | | | Amount | | | Percentage | |
| | | | | | | | | | | | | | | | | | | |
Total Risk Based Capital Ratio | | | | | | | | | | | | | | | | |
| Highlands Bankshares | | $ | 35,692 | | | | 13.45 | % | | $ | 21,231 | | | | 8.00 | % | | | | | | |
| Capon Valley Bank | | | 14,237 | | | | 14.56 | % | | | 7,825 | | | | 8.00 | % | | $ | 9,781 | | | | 10.00 | % |
| The Grant County Bank | | | 21,151 | | | | 12.63 | % | | | 13,395 | | | | 8.00 | % | | | 16,744 | | | | 10.00 | % |
| | | | | | | | | | | | | | | | | | | | | | | | | |
Tier 1 Leverage Ratio | | | | | | | | | | | | | | | | | | | | | |
| Highlands Bankshares | | | 32,392 | | | | 9.26 | % | | | 13,998 | | �� | | 4.00 | % | | | | | | | | |
| Capon Valley Bank | | | 13,011 | | | | 9.53 | % | | | 5,463 | | | | 4.00 | % | | | 6,829 | | | | 5.00 | % |
| The Grant County Bank | | | 19,076 | | | | 8.85 | % | | | 8,624 | | | | 4.00 | % | | | 10,780 | | | | 5.00 | % |
| | | | | | | | | | | | | | | | | | | | | | | | | |
Tier 1 Risk Based Capital Ratio | | | | | | | | | | | | | | | | | | | | | |
| Highlands Bankshares | | | 32,392 | | | | 12.21 | % | | | 10,616 | | | | 4.00 | % | | | | | | | | |
| Capon Valley Bank | | | 13,011 | | | | 13.30 | % | | | 3,912 | | | | 4.00 | % | | | 5,869 | | | | 6.00 | % |
| The Grant County Bank | | | 19,076 | | | | 11.39 | % | | | 6,697 | | | | 4.00 | % | | | 10,046 | | | | 6.00 | % |
The Company’s actual and required capital amounts and ratios at December 31, 2005 is presented in the following table (in thousands of dollars):
| | | December 31, 2005 | |
| | | | | | | | | Regulatory Requirements | |
| | | Actual | | | Adequately Capitalized | | | Well Capitalized | |
| | | Amount | | | Percentage | | | Amount | | | Percentage | | | Amount | | | Percentage | |
| | | | | | | | | | | | | | | | | | | |
Total Risk Based Capital Ratio | | | | | | | | | | | | | | | | |
| Highlands Bankshares | | $ | 34,041 | | | | 13.85 | % | | $ | 19,663 | | | | 8.00 | % | | | | | | |
| Capon Valley Bank | | | 12,910 | | | | 13.45 | % | | | 7,679 | | | | 8.00 | % | | $ | 9,599 | | | | 10.00 | % |
| The Grant County Bank | | | 20,448 | | | | 13.67 | % | | | 11,967 | | | | 8.00 | % | | | 14,958 | | | | 10.00 | % |
| | | | | | | | | | | | | | | | | | | | | | | | | |
Tier 1 Leverage Ratio | | | | | | | | | | | | | | | | | | | | | |
| Highlands Bankshares | | | 30,959 | | | | 9.45 | % | | | 13,104 | | | | 4.00 | % | | | | | | | | |
| Capon Valley Bank | | | 11,709 | | | | 8.87 | % | | | 5,280 | | | | 4.00 | % | | | 6,600 | | | | 5.00 | % |
| The Grant County Bank | | | 18,650 | | | | 8.81 | % | | | 8,468 | | | | 4.00 | % | | | 10,585 | | | | 5.00 | % |
| | | | | | | | | | | | | | | | | | | | | | | | | |
Tier 1 Risk Based Capital Ratio | | | | | | | | | | | | | | | | | | | | | |
| Highlands Bankshares | | | 30,959 | | | | 12.60 | % | | | 9,828 | | | | 4.00 | % | | | | | | | | |
| Capon Valley Bank | | | 11,709 | | | | 12.20 | % | | | 3,839 | | | | 4.00 | % | | | 5,759 | | | | 6.00 | % |
| The Grant County Bank | | | 18,650 | | | | 12.47 | % | | | 5,982 | | | | 4.00 | % | | | 8,974 | | | | 6.00 | % |
Capital ratios and amounts are applicable both at the individual Bank level and on a consolidated basis. At December 31, 2006, both subsidiary Banks had capital levels in excess of minimum requirements.
In addition, HBI Life Insurance Company is subject to certain capital requirements and dividend restrictions. At present, HBI Life is well within any capital limitations and no conditions or events have occurred to change this capital status, nor does management expect any such occurrence in the foreseeable future.
Note Eighteen: Changes in Other Comprehensive Income |
The components of changes in other comprehensive income and related tax effects for the years ended December 31, 2006, 2005 and 2004 are as follows (in thousands of dollars):
| | | 2006 | | | 2005 | | | 2004 | |
| Balance January 1 | | $ | (505 | ) | | $ | (219 | ) | | $ | (24 | ) |
| | | | | | | | | | | | | |
| Unrealized holding gains (losses) on available for sale securities net of income taxes of $50,000 for 2006, $27,000 for 2005 and $92,000 for 2004 | | | 86 | | | | (46 | ) | | | (176 | ) |
| Accrued pension obligation net of income taxes of $97,000 for 2006, $141,000 for 2005 and $ 12,000 for 2004 | | | (167 | ) | | | (240 | ) | | | (19 | ) |
| Net change for the year | | | (81 | ) | | | (286 | ) | | | (195 | ) |
| | | | | | | | | | | | | |
| Balance December 31 | | $ | (586 | ) | | $ | (505 | ) | | $ | (219 | ) |
Note Nineteen: Branches Acquisition and Related Intangible Assets |
On August 22, 2005, Highlands Bankshares entered into an agreement to purchase all of the outstanding shares of common stock of the National Bank of Davis (“Davis”), located in Davis, West Virginia. Davis is located in Tucker County and is contiguous to other counties that have Company branches. The Agreement can be found by accessing the website of the Securities and Exchange Commission under the filings of Highlands Bankshares, Inc. and as part of the Current Report on Form 8-K filed August, 23, 2005.
The Agreement was consummated on October 31, 2005 and the shareholders of Davis were paid a cash purchase price of $5,200,000. In addition to this amount, Highlands incurred additional expenses of $56,000 related to the purchase. Shortly after the purchase, Davis offices became branches of The Grant County Bank. Funding for the purchase was provided by a special, one time, dividend from The Grant County Bank to Highlands Bankshares. The purchase of Davis added two banking locations and 11 full time equivalent employees to the operations of Highlands. All operations of Davis subsequent to October 31, 2005 are reflected in the operations of the Company.
Upon acquisition, the net assets of Davis were recorded at fair value. Portions of the cost of acquisition, including expenses incurred relating to the purchase, were allocated as intangible assets. These intangible assets are comprised of both core deposit intangibles and goodwill. The amount of core deposit intangibles was valued based on comparable premiums paid on deposits for purchases of banking branches by other financial institutions in Virginia, West Virginia, and the entire Southeast region of the United States. After tangible assets were valued at fair value and the allocation made to core deposit intangibles, the remainder of the purchase price was allocated to goodwill. The amount of core deposit intangibles will be amortized over a ten-year period. Goodwill will not be amortized and will be tested for impairment on an annual basis. As of December 31, 2006, the goodwill acquired in the acquisition of Davis was not deemed to be impaired.
Amortization of intangibles charged to operations was $176,000 in 2006, $38,000 in 2005 and $11,000 in 2004.
In addition to the intangible assets acquired with the Davis purchase, the Company, at December 31, 2006 has a core deposit intangible of $39,000 (net of accumulated amortization) related to a branch acquisition in the year 2000.
A summary of the Company’s intangible assets at December 31, 2006 and 2005 is shown in the table below (in thousands of dollars):
| | | December 31, | |
| | | 2006 | | | 2005 | |
| Core Deposit Intangibles | | $ | 1,760 | | | $ | 1,760 | |
| (Accumulated Depreciation) | | | (262 | ) | | | (86 | ) |
| Goodwill | | | 1,534 | | | | 1,534 | |
| Total Intangible Assets | | $ | 3,032 | | | $ | 3,208 | |
The expected amortization of the intangible balances at December 31, 2006 for the next five years is summarized in the table below (in thousands of dollars):
Year | | Expected Expense | |
| 2007 | | $ | 176 | |
| 2008 | | | 176 | |
| 2009 | | | 176 | |
| 2010 | | | 172 | |
| 2011 | | | 165 | |
Note Twenty: Investment in Life Insurance Contracts |
Investments in insurance contracts consist of single premium insurance contracts, which have the purpose of providing a rate of return to the Company and of providing life insurance and retirement benefits to certain executives.
During the second quarter of 2006, the Company received payment in settlement relating to two of these policies. This payment related to the death of an insured and resulted in a one-time, non-recurring income of $155,000.
A summary of the changes to the balance of investments in insurance contracts from December 31, 2005 to December 31, 2006 is shown in the table below (in thousands of dollars):
| Balance December 31, 2005 | | $ | 6,396 | |
| Increases in value of policies | | | 225 | |
| Settlement payout | | | (555 | ) |
| Balance December 31, 2006 | | $ | 6,066 | |
Note Twenty One: Parent Corporation Only Financial Statements |
Balance Sheets | |
(in thousands of dollars) | |
| | | December 31, | |
| | | 2006 | | | 2005 | |
| Assets | | | | | | |
| Cash | | $ | 187 | | | $ | 154 | |
| Investment in subsidiaries | | | 37,025 | | | | 33,819 | |
| Income taxes receivable | | | 0 | | | | 24 | |
| Other assets | | | 40 | | | | 45 | |
| Total Assets | | $ | 37,252 | | | $ | 34,042 | |
| | | | | | | | | |
| Liabilities | | | | | | | | |
| Accrued expenses | | $ | 71 | | | $ | 44 | |
| Income taxes payable | | | 105 | | | | 0 | |
| Other liabilities | | 0 | | | | 6 | |
| Total Liabilities | | | 176 | | | | 50 | |
| | | | | | | | | |
| Stockholders’ Equity | | | | | | | | |
| Common stock, par value $5 per share, 3,000,000 shares authorized, 1,436,874 issued and outstanding | | | 7,184 | | | | 7,184 | |
| Surplus | | | 1,662 | | | | 1,662 | |
| Retained earnings | | | 28,816 | | | | 25,651 | |
| Other accumulated comprehensive income | | | (586 | ) | | | (505 | ) |
| Total Stockholders’ Equity | | | 37,076 | | | | 33,992 | |
| | | | | | | | | |
| Total Liabilities and Stockholders’ Equity | | $ | 37,252 | | | $ | 34,042 | |
Statements of Income and Retained Earnings | |
(in thousands of dollars) | |
| | | 2006 | | | 2005 | | | 2004 | |
| Income | | | | | | | | | |
| Dividends from subsidiaries | | $ | 1,651 | | | $ | 1,528 | | | $ | 940 | |
| Management fees from subsidiaries | | | 240 | | | | 63 | | | | --- | |
| Total Income | | | 1,891 | | | | 1,591 | | | | 940 | |
| | | | | | | | | | | | | |
| Expenses | | | | | | | | | | | | |
| Salary and benefits expense | | | 302 | | | | 203 | | | | 155 | |
| Professional fees | | | 191 | | | | 231 | | | | 82 | |
| Directors fees | | | 74 | | | | 65 | | | | 62 | |
| Other expenses | | | 70 | | | | 106 | | | | 83 | |
| Total Expenses | | | 637 | | | | 605 | | | | 382 | |
| | | | | | | | | | | | | |
| Net income before income tax benefit and undistributed subsidiary net income | | | 1,254 | | | | 986 | | | | 558 | |
| | | | | | | | | | | | | |
| Income tax benefit | | | 162 | | | | 214 | | | | 142 | |
| | | | | | | | | | | | | |
| Income before undistributed subsidiary net income | | | 1,416 | | | | 1,200 | | | | 700 | |
| | | | | | | | | | | | | |
| Undistributed subsidiary net income | | | 3,099 | | | | 2,602 | | | | 2,506 | |
| | | | | | | | | | | | | |
| Net Income | | $ | 4,515 | | | $ | 3,802 | | | $ | 3,206 | |
| | | | | | | | | | | | | |
| Retained earnings, beginning of period | | $ | 25,651 | | | $ | 23,028 | | | $ | 20,727 | |
| Dividends paid in cash | | | (1,350 | ) | | | (1,179 | ) | | | (905 | ) |
| Net income | | | 4,515 | | | | 3,802 | | | | 3,206 | |
| Retained earnings, end of period | | $ | 28,816 | | | $ | 25,651 | | | $ | 23,028 | |
| | | | | | | | | | | | | |
Statements of Cash Flows | |
(in thousands of dollars) | |
| | | | | | | | | | |
| | | Years Ended December 31, | |
| | | 2006 | | | 2005 | | | 2004 | |
| Cash Flows From Operating Activities | | | | | | | | | |
| | | | | | | | | | |
| Net Income | | $ | 4,515 | | | $ | 3,802 | | | $ | 3,206 | |
| | | | | | | | | | | | | |
| Adjustments to net income | | | | | | | | | | | | |
| Undistributed subsidiary income | | | (3,099 | ) | | | (2,602 | ) | | | (2,506 | ) |
| Depreciation and amortization | | | 7 | | | | 6 | | | | | |
| Increase (decrease) in payables | | | 126 | | | | (24 | ) | | | (46 | ) |
| (Increase) decrease in receivables | | | 24 | | | | 33 | | | | 450 | |
| (Increase) decrease in other assets | | | (1 | ) | | | 5 | | | | (13 | ) |
| | | | | | | | | | | | | |
| Net Cash Provided by Operating Activities | | | 1,572 | | | | 1,220 | | | | 1,091 | |
| | | | | | | | | | | | | |
| Cash Flows From Investing Activities | | | | | | | | | | | | |
| | | | | | | | | | | | | |
| Advances from (payments to) subsidiaries | | | (417 | ) | | | (199 | ) | | | (483 | ) |
| Received from subsidiaries | | | 229 | | | | 177 | | | | 281 | |
| Purchase of property and equipment | | | (1 | ) | | | (21 | ) | | | 0 | |
| Special dividend from subsidiary | | | 0 | | | | 5,200 | | | | 0 | |
| | | | | | | | | | | | | |
| Net Cash Provided by (used in) Investing Activities | | | (189 | ) | | | 5,157 | | | | (202 | ) |
| | | | | | | | | | | | | |
| Cash Flows From Financing Activities | | | | | | | | | | | | |
| | | | | | | | | | | | | |
| Purchase of branch operations | | | 0 | | | | (5,200 | ) | | | 0 | |
| Dividends paid in cash | | | (1,350 | ) | | | (1,179 | ) | | | (905 | ) |
| | | | | | | | | | | | | |
| Net Cash Used in Financing Activities | | | (1,350 | ) | | | (6,379 | ) | | | (905 | ) |
| | | | | | | | | | | | | |
| Net Increase (Decrease) in Cash | | | 33 | | | | (2 | ) | | | (16 | ) |
| | | | | | | | | | | | | |
| Cash, beginning of year | | | 154 | | | | 156 | | | | 172 | |
| | | | | | | | | | | | | |
| Cash, end of year | | $ | 187 | | | $ | 154 | | | $ | 156 | |
| | | | | | | | | | | | | |
REPORT OF INDEPENDENT REGISTERED PUBLIC ACCOUNTING FIRM
Board of Directors
Highlands Bankshares, Inc.
Petersburg, West Virginia
We have audited the accompanying consolidated balance sheet of Highlands Bankshares, Inc. and subsidiaries as of December 31, 2005, the related consolidated statements of income, stockholders’ equity, and cash flows for the years ended December 31, 2005 and 2004. These financial statements are the responsibility of the Company’s management. Our responsibility is to express an opinion on these financial statements based on our audits.
We conducted our audits in accordance with standards of the Public Company Accounting Oversight Board (United States). Those standards require that we plan and perform the audit to obtain reasonable assurance about whether the financial statements are free of material misstatement. The company is not required to have, nor were we engaged to perform, an audit of its internal control over financial reporting. Our audit included consideration of internal control over financial reporting as a basis for designing audit procedures that are appropriate in the circumstances, but not for the purpose of expressing an opinion on the effectiveness of the company's internal control over financial reporting. Accordingly, we express no such opinion. An audit includes examining, on a test basis, evidence supporting the amounts and disclosures in the financial statements, assessing the accounting principles used and significant estimates made by management, as well as evaluating the overall financial statement presentation. We believe that our audits provide a reasonable basis for our opinion.
In our opinion, the consolidated financial statement referred to above present fairly, in all material respects, the financial position of Highlands Bankshares, Inc. and subsidiaries as of December 31, 2005, and the results of its operations and its cash flows for the years ended December 31, 2005 and 2004 in conformity with U.S. generally accepted accounting principles.
| /s/ S. B. Hoover & Company, L.L.P. |
February 28, 2006
Harrisonburg, VA
REPORT OF INDEPENDENT REGISTERED PUBLIC ACCOUNTING FIRM
To the Shareholders and Board of Directors of
Highlands Bankshares, Inc.
Petersburg, West Virginia
We have audited the accompanying consolidated balance sheet of Highlands Bankshares, Inc. and subsidiaries as of December 31, 2006, and the related consolidated statements of income, stockholders' equity and cash flows for the year then ended. These consolidated financial statements are the responsibility of the corporation's management. Our responsibility is to express an opinion on these consolidated financial statements based on our audit. The consolidated financial statements of Highlands Bankshares, Inc. for each of the two years in the period ended December 31, 2005, were audited by other auditors whose report dated February 28, 2006, expressed an unqualified opinion on those financial statements.
We conducted our audit in accordance with the standards of the Public Company Accounting Oversight Board (United States). Those standards require that we plan and perform the audit to obtain reasonable assurance about whether the consolidated financial statements are free of material misstatement. An audit includes examining, on a test basis, evidence supporting the amounts and disclosures in the consolidated financial statements. An audit also includes assessing the accounting principles used and significant estimates made by management, as well as evaluating the overall financial statement presentation. We believe that our audit provides a reasonable basis for our opinion.
In our opinion, the 2006 consolidated financial statements referred to above present fairly, in all material respects, the financial position of Highlands Bankshares, Inc. and subsidiaries as of December 31, 2006, and the results of their operations and their cash flows for the year then ended in conformity with accounting principles generally accepted in the United States of America.
As discussed in Notes 2 and 14 to the financial statements, Highlands Bankshares, Inc. changed its policy for accounting for its defined benefit pension plan in 2006 to conform with Statement of Financial Accounting Standards No. 158.
| /s/ SMITH ELLIOTT KEARNS & COMPANY, LLC |
Chambersburg, Pennsylvania
March 21, 2007
| Changes in and Disagreements With Accountants on Accounting and Financial Disclosure |
None.
The Company’s management, with the participation of the Company’s Chief Executive Officer and Chief Financial Officer, has evaluated the effectiveness of the Company’s disclosure controls and procedures as of December 31, 2006. Based on this evaluation, the Company’s Chief Executive Officer and Chief Financial Officer concluded that the Company’s disclosure controls and procedures are effective in timely alerting them to material information relating to the Company required to be included in the Company’s periodic SEC filings.
Changes in Internal Controls
During the period reported upon, there were no significant changes in internal controls of Highlands Bankshares, Inc. pertaining to its financial reporting and control of its assets or in other factors that materially affected or are reasonably likely to materially affect such control.
None.
| Directors, Executive Officers and Corporate Governance |
Information required by this item is set forth under the caption “Compliance with Section 16(a) of the Securities Exchange Act” of our 2007 Proxy Statement, to be filed within 120 days after the end of the Company’s fiscal year end, and is incorporated herein by reference
Information required by this item is set forth under the caption “EXECUTIVE COMPENSATION” of our 2007 Proxy Statement, to be filed within 120 days after the end of the Company’s fiscal year end, and is incorporated herein by reference.
| Security Ownership of Certain Beneficial Owners and Management and Related Stockholder Matters |
Information required by this item is set forth under the caption “SECURITY OWNERSHIP OF CERTAIN BENEFICIAL OWNERS AND MANAGEMENT” of our 2007 Proxy Statement, to be filed within 120 days after the end of the Company’s fiscal year end, and is incorporated herein by reference.
| Certain Relationships and Related Transactions and Director Independence |
Information required by this item is set forth under the caption “Certain Related Transactions” of our 2007 Proxy Statement, to be filed within 120 days after the end of the Company’s fiscal year end, and is incorporated herein by reference.
Most of the directors, limited liability companies of which they may be members, partnerships of which they may be general partners and corporations of which they are officers or directors, maintain normal banking relationships with the Bank. Loans made by the Bank to such persons or other entities were made in the ordinary course of business, were made, at the date of inception, on substantially the same terms, including interest rates and collateral, as those prevailing at the time for comparable transactions with other persons, and did not involve more than normal risk of collectibility or present other unfavorable features. See Note Twelve of the consolidated financial statements.
Director John Van Meter is a partner with the law firm of VanMeter and VanMeter, which has been retained by the Company as legal counsel, and it is anticipated that the relationship will continue. Director Jack H. Walters is a partner with the law firm of Walters, Krauskopf & Baker, which provides legal counsel to the Company, and it is anticipated that the relationship will continue.
| Principal Accounting Fees and Services |
Information required by this item is set forth under the caption “FEES OF INDEPENDENT PUBLIC ACCOUNTANTS” of our 2007 Proxy Statement, to be filed within 120 days after the end of the Company’s fiscal year end, and is incorporated herein by reference.
| Exhibits, Financial Statement Schedules |
| (a)(1) | Financial Statements: Reference is made to Part II, Item 8 of the Annual Report on Form 10-K |
| (a)(2) | Financial Statement Schedules: These schedules are omitted as the required information is inapplicable or the information is presented in the consolidated financial statements or related notes |
| (a)(3) | Exhibits: |
| | |
Exhibit Number | Description |
| 3(i) | Articles of Incorporation of Highlands Bankshares, Inc. are incorporated by reference to Appendix C to Highlands Bankshares, Inc.'s Form S-4 filed October 20, 1986 |
| | Amendments to the original Articles of Incorporation are incorporated by reference; filed as Exhibit 3(i) with 1997 Form 10-KSB |
| 3(ii) | Bylaws of Highlands Bankshares, Inc. are incorporated by reference to Appendix D to Highlands Bankshares Inc.’s Form S-4 filed October 20, 1986 |
| | Amended Bylaws of Highlands Bankshares, Inc. are incorporated by reference to Exhibit 3(ii) to Highlands Bankshares Inc.’s Form 10Q filed May 15, 2003 |
| Code of Ethics |
| 16 | |
| 21 | Subsidiaries of the Registrant |
| Certification of Chief Executive Officer Pursuant to section 302 of the Sarbanes-Oxley Act of 2002 Chapter 63, Title 18 USC Section 1350 (A) and (B). |
| Certification of Chief Financial Officer Pursuant to section 302 of the Sarbanes-Oxley Act of 2002 Chapter 63, Title 18 USC Section 1350 (A) and (B). |
| Statement of Chief Executive Officer Pursuant to 18 U.S.C. §1350. |
| Statement of Chief Financial Officer Pursuant to 18 U.S.C. §1350. |
| (b) | See (a)(3) above |
| (c) | See (a)(1) and (a)(2) above |
Pursuance to the requirements of Section 13 or 15(d) of the Securities and Exchange Act of 1934, the registrant has duly cause this report to be signed on its behalf by the undersigned, thereunto duly authorized.
HIGHLANDS BANKSHARES, INC.
| /s/ C.E. Porter | | /s/ R. Alan Miller |
| C.E. Porter | | R. Alan Miller |
| President & Chief Executive Officer | | Chief Financial Officer |
| March 22, 2007 | | March 22, 2007 |
Pursuant to the requirements of the Securities and Exchange Act of 1934, this report has been signed below by the following persons on behalf of the registrant and in the capacities and on the dates indicated.
Name | Signature | Title | Date |
Leslie A. Barr | | Director | |
Jack H. Walters | /s/ Jack H. Walters | Director | March 22, 2007 |
Thomas B. McNeill, Sr. | /s/ Thomas B. McNeill, Sr. | Director | March 22, 2007 |
L. Keith Wolfe | | Director | |
Kathy G. Kimble | /s/ Kathy G. Kimble | Director | March 22, 2007 |
Steven C. Judy | /s/ Steven C. Judy | Director | March 22, 2007 |
Courtney R. Tusing | /s/ Courtney R. Tusing | Director | March 22, 2007 |
John G. Van Meter | /s/ John G. Van Meter | Director Chairman of The Board | March 22, 2007 |
Alan L. Brill | /s/ Alan L. Brill | Director Secretary | March 22, 2007 |
C. E. Porter | /s/ C.E. Porter | Director President & CEO Treasurer | March 22, 2007 |