UNITED STATES
SECURITIES AND EXCHANGE COMMISSION
Washington, DC 20549
FORM 10-K
(Mark One)
[X] ANNUAL REPORT PURSUANT TO SECTION 13 OR 15(d) OF THE SECURITIES EXCHANGE ACT OF 1934
For the fiscal year ended December 31, 2008
[ ] TRANSITION REPORT PURSUANT TO SECTION 13 OR 15(d) OF THE SECURITIES EXCHANGE ACT OF 1934
Commission File Number 0-16761
HIGHLANDS BANKSHARES, INC.
(Exact name of registrant as specified in its charter)
| West Virginia | 55-0650743 |
| (State or other jurisdiction of incorporation or organization) | (I.R.S. Employer Identification No.) |
| P.O. Box 929 Petersburg, WV | 26847 |
| (Address of principal executive offices) | (Zip Code) |
Registrant’s telephone number, including area code: 304-257-4111
Securities registered pursuant to Section 12(b) of the Act: None
Securities registered pursuant to Section 12(g) of the Act: Common Stock, $5 par value
Indicate by check mark if the registrant is a well-know seasoned issuer, as defined in Rule 405 or the Securities Act [ ] Yes [X] No
Indicate by check mark if the registrant is not required to file reports pursuant to Section 13 or Section 15(d) of the Act [ ] Yes [X] No
Indicate by check mark whether the registrant has (1) filed all reports required to be filed by Section 13 or 15(d) of the Exchange Act during the preceding 12 months (or for such shorter period that the registrant was required to file such reports), and (2) has been subject to such filing requirements for the past 90 days. Yes [X] No [ ]
Indicate by check mark if disclosure of delinquent filers in response to Item 405 of Regulation S-K is not contained in this form, and will not be contained, to the best of registrant's knowledge, in definitive proxy or information statements incorporated by reference in Part III of this Form 10-K or any amendment to this Form 10-K. [X]
Indicate by check mark whether the registrant is a large accelerated filer, an accelerated filer, or a non-accelerated filer.[ ] Large Accelerated Filer[ ] Accelerated Filer [X] Non-accelerated filer [ ] Smaller Reporting Company
Indicate by check mark whether the registrant is a shell company (as defined in rule 126-2 of the Act) Yes [ ] No [ X ]
State the aggregate market value of the voting and non-voting common equity held by non-affiliates computed by reference to the price at which the common equity was last sold, or the average bid and asked price of such common equity, as of the last business day of the registrant’s most recently completed second fiscal quarter:
The aggregate market value of the 1,241,108 shares of common stock of the registrant, issued and outstanding, held by non- affiliates on June 30, 2008, was approximately $41,701,232 based on the closing sale price of $33.60 per share on June 30, 2008. For the purposes of this calculation, the term “affiliate” refers to all directors and executive officers of the registrant.
Indicate the number of shares outstanding of each of the registrant’s classes of common stock as of the last practicable date: As of March 15, 2009: 1,336,873 shares of common stock.
DOCUMENTS INCORPORATED BY REFERENCE
Portions of the Proxy Statement for the 2009 Annual Shareholders’ Meeting, to be held May 12, 2009, are incorporated by reference into Part III, Items 10,11,12,13 and 14.
|
| |
| Part I | | Page |
| | 1 |
| | 7 |
| | 9 |
| | 9 |
| | 9 |
| | 9 |
| | | |
| Part II | | |
| | 9 |
| | 11 |
| | 12 |
| | 32 |
| | 34 |
| | 65 |
| | 65 |
| | 65 |
| | | |
| Part III | | |
| | 65 |
| | 66 |
| | 66 |
| | 66 |
| | 66 |
| | | |
| Part IV | | |
| | 67 |
| | | |
| 68 |
General
Highlands Bankshares, Inc. (hereinafter referred to as “Highlands,” or the “Company”), incorporated under the laws of the state of West Virginia in 1985, is a multi bank holding company subject to the provisions of the Bank Holding Company Act of 1956, as amended. Highlands owns 100% of the outstanding stock of its subsidiary banks, The Grant County Bank and Capon Valley Bank (hereinafter referred to as the “Banks” or “Capon” and/or “Grant”), and its life insurance subsidiary, HBI Life Insurance Company (hereinafter referred to as “HBI Life”).
The Grant County Bank was chartered on August 6, 1902, and Capon Valley Bank was chartered on July 1, 1918. Both are state banks chartered under the laws of the State of West Virginia. HBI Life was chartered in April 1988 under the laws of the State of Arizona.
Services Offered by the Banks
The Banks offer all services normally offered by a full service commercial bank, including commercial and individual demand and time deposit accounts, commercial and individual loans, drive in banking services and automated teller machines. No material portion of the Banks' deposits have been obtained from a single or small group of customers and the loss of the deposits of any one customer or of a small group of customers would not have a material adverse effect on the business of the Banks. Credit life and accident and health insurance are sold to customers of the subsidiary Banks through HBI Life.
Employees
As of December 31, 2008, The Grant County Bank had 72 full time equivalent employees, Capon Valley Bank had 52 full time equivalent employees and Highlands had 3 full time equivalent employees. No person is employed by HBI Life on a full time basis.
Competition
The Banks' primary trade area is generally defined as Grant, Hardy, Mineral, Randolph, Pendleton and Tucker Counties in West Virginia, the western portion of Frederick County in Virginia and portions of Western Maryland. This area includes the towns of Petersburg, Wardensville, Moorefield and Keyser and several rural towns. The Banks' secondary trade area includes portions of Hampshire County in West Virginia. The Banks primarily compete with four state chartered banks, three national banks and three credit unions. In addition, the Banks compete with money market mutual funds and investment brokerage firms for deposits in their service area. No financial institution has been chartered in the area within the last five years although other state and nationally chartered banks have opened branches in this area within this time period. Competition for new loans and deposits in the Banks' service area is quite intense.
Regulation and Supervision
The Company, as a registered bank holding company, and its subsidiary Banks, as insured depository institutions, operate in a highly regulated environment and are regularly examined by federal and state regulators. The following description briefly discusses certain provisions of federal and state laws and regulations and the potential impact of such provisions to which the Company and subsidiary are subject. These federal and state laws and regulations are designed to reduce potential loss exposure to the depositors of such depository institutions and to the Federal Deposit Insurance Corporation’s insurance fund and are not intended to protect the Company’s security holders. Proposals to change the laws and regulations governing the banking industry are frequently raised in Congress, in state legislatures, and before the various bank regulatory agencies. The likelihood and timing of any changes and the impact such changes might have on the Company are impossible to determine with any certainty. A change in applicable laws or regulations, or a change in the way such laws or regulations are interpreted by regulatory agencies or courts, may have a material impact on the business, operations and earnings of the Company. To the extent that the following information describes statutory or regulatory provisions, it is qualified entirely by reference to the particular statutory or regulatory provision.
As a bank holding company registered under the Bank Holding Company Act of 1956, as amended (the “BHCA”), the Company is subject to regulation by the Federal Reserve Board. Federal banking laws require a bank holding company to serve as a source of financial strength to its subsidiary depository institutions and to commit resources to support such institutions in circumstances where it might not do so otherwise. Additionally, the Federal Reserve Board has jurisdiction under the BHCA to approve any bank or non-bank acquisition, merger or consolidation proposed by a bank holding company. The BHCA generally limits the activities of a bank holding company and its subsidiaries to that of banking, with the managing or controlling of banks as to be a proper incident thereto. The BHCA also prohibits a bank holding company, with certain exceptions, from acquiring more than 5% of the voting shares of any company and from engaging in any business other than banking or managing or controlling banks. The Federal Reserve Board has determined by regulation that certain activities are closely related to banking within the meaning of the BHCA. These activities include: operating a mortgage company, finance company, credit card company or factoring company; performing certain data processing operations; providing investment and financial advice; and acting as an insurance agent for certain types of credit-related insurance.
The Gramm-Leach-Bliley Act (“Gramm-Leach”) became law in November 1999. Gramm-Leach established a comprehensive framework to permit affiliations among commercial banks, investment banks, insurance companies, securities firms, and other financial service providers. Gramm-Leach permits qualifying bank holding companies to register with the Federal Reserve Board as “financial holding companies” and allows such companies to engage in a significantly broader range of financial activities than were historically permissible for bank holding companies. Although the Federal Reserve Board provides the principal regulatory supervision of financial services permitted under Gramm-Leach, the Securities and Exchange Commission and state regulators also provide substantial supervisory oversight. In addition to broadening the range of financial services a bank holding company may provide, Gramm-Leach also addressed customer privacy and information sharing issues and set forth certain customer disclosure requirements. The Company has no current plans to petition the Federal Reserve Board for consideration as a financial holding company.
The Riegle-Neal Interstate Banking and Branching Efficiency Act of 1994 (“Riegle-Neal”) permits bank holding companies to acquire banks located in any state. Riegle-Neal also allows national banks and state banks with different home states to merge across state lines and allows branch banking across state lines, unless specifically prohibited by state laws.
The International Money Laundering Abatement and Anti-Terrorist Financing Act of 2001 (“Patriot Act”) was adopted in response to the September 11, 2001 terrorist attacks. The Patriot Act provides law enforcement with greater powers to investigate terrorism and prevent future terrorist acts. Among the broad-reaching provisions contained in the Patriot Act are several designed to deter terrorists’ ability to launder money in the United States and provide law enforcement with additional powers to investigate how terrorists and terrorist organizations are financed. The Patriot Act creates additional requirements for banks, which were already subject to similar regulations. The Patriot Act authorizes the Secretary of Treasury to require financial institutions to take certain “special measures” when the Secretary suspects that certain transactions or accounts are related to money laundering. These special measures may be ordered when the Secretary suspects that a jurisdiction outside of the United States, a financial institution operating outside of the United States, a class of transactions involving a jurisdiction outside of the United States or certain types of accounts are of “primary money laundering concern.” The special measures include the following: (a) require financial institutions to keep records and report on transactions or accounts at issue; (b) require financial institutions to obtain and retain information related to the beneficial ownership of any account opened or maintained by foreign persons; (c) require financial institutions to identify each customer who is permitted to use the account; and (d) prohibit or impose conditions on the opening or maintaining of correspondence or payable-through accounts. Failure of a financial institution to maintain and implement adequate programs to combat money laundering and terrorist financing or to comply with all of the relevant laws or regulations could have serious legal and reputational consequences for an institution.
The operations of the insurance subsidiary are subject to the oversight and review by the State of Arizona Department of Insurance.
On July 30, 2002, the United States Congress enacted the Sarbanes-Oxley Act of 2002, a law that addresses corporate governance, auditing and accounting, executive compensation and enhanced timely disclosure of corporate information. As Sarbanes-Oxley directs, the Company’s Chief Executive Officer and Chief Financial Officer are each required to certify that the Company’s quarterly and annual reports do not contain any untrue statement of a material fact. Additionally, these individuals must certify the following: they are responsible for establishing, maintaining and regularly evaluating the effectiveness of the Company’s internal controls; they have made certain disclosures to the Company’s auditors and the Audit Committee of the Board of Directors about the Company’s internal controls; and they have included information in the Company’s quarterly and annual reports about their evaluation and whether there have been significant changes in the Company’s internal controls or in other factors that could significantly affect internal controls subsequent to the evaluations.
Capital Adequacy
Federal banking regulations set forth capital adequacy guidelines, which are used by regulatory authorities to assess the adequacy of capital in examining and supervising a bank holding company and its insured depository institutions. The capital adequacy guidelines generally require bank holding companies to maintain total capital equal to at least 8% of total risk-adjusted assets, with at least one-half of total capital consisting of core capital (i.e., Tier I capital) and the remaining amount consisting of “other” capital-eligible items (i.e., Tier II capital), such as perpetual preferred stock, certain subordinated debt, and, subject to limitations, the allowance for loan losses. Tier I capital generally includes common stockholders’ equity plus, within certain limitations, perpetual preferred stock and trust preferred securities. For purposes of computing risk-based capital ratios, bank holding companies must meet specific capital guidelines that involve quantitative measures of assets, liabilities and certain off-balance sheet items, calculated under regulatory accounting practices. The Company’s and its subsidiaries’ capital accounts and classifications are also subject to qualitative judgments by the regulators about components, risk weightings, and other factors.
In addition to total and Tier I capital requirements, regulatory authorities also require bank holding companies and insured depository institutions to maintain a minimum leverage capital ratio of 3%. The leverage ratio is determined as the ratio of Tier I capital to total average assets, where average assets exclude goodwill, other intangibles, and other specifically excluded assets. Regulatory authorities have stated that minimum capital ratios are adequate for those institutions that are operationally and financially sound, experiencing solid earnings, have high levels of asset quality and are not experiencing significant growth. The guidelines also provide that banking organizations experiencing internal growth or making acquisitions will be expected to maintain strong capital positions substantially above the minimum supervisory levels. In those instances where these criteria are not evident, regulatory authorities expect, and may require, bank holding companies and insured depository institutions to maintain higher than minimum capital levels.
Additionally, federal banking laws require regulatory authorities to take “prompt corrective action” with respect to depository institutions that do not satisfy minimum capital requirements. The extent of these powers depends upon whether the institutions in question are “well capitalized,” “adequately capitalized,” “undercapitalized,” “significantly undercapitalized,” or “critically undercapitalized,” as such terms are defined under uniform regulations defining such capital levels issued by each of the federal banking agencies. As an example, a depository institution that is not well capitalized is generally prohibited from accepting brokered deposits and offering interest rates on deposits higher than the prevailing rate in its market. Additionally, a depository institution is generally prohibited from making any capital distribution (including payment of a dividend) or paying any management fee to its holding company, may be subject to asset growth limitations and may be required to submit capital restoration plans if the depository institution is considered undercapitalized.
The Company’s and its subsidiaries’ regulatory capital ratios are presented in the table below:
| | | Actual Ratio | | Actual Ratio | | Regulatory |
| | | December 31, 2008 | | December 31, 2007 | | Minimum |
| Total Risk Based Capital | | | | | | | | | |
| Highlands Bankshares | | | 14.20 | % | | | 14.53 | % | | | |
| The Grant County Bank | | | 13.99 | % | | | 13.23 | % | | | 8.00 | % |
| Capon Valley Bank | | | 12.77 | % | | | 14.78 | % | | | 8.00 | % |
| | | | | | | | | | | | | |
| Tier 1 Leverage Ratio | | | | | | | | | | | | |
| Highlands Bankshares | | | 10.18 | % | | | 9.95 | % | | | | |
| The Grant County Bank | | | 10.00 | % | | | 9.09 | % | | | 4.00 | % |
| Capon Valley Bank | | | 9.11 | % | | | 10.00 | % | | | 4.00 | % |
| | | | | | | | | | | | | |
| Tier 1 Risk Based Capital Ratio | | | | | | | | | | | | |
| Highlands Bankshares | | | 12.98 | % | | | 13.28 | % | | | | |
| The Grant County Bank | | | 12.79 | % | | | 12.09 | % | | | 4.00 | % |
| Capon Valley Bank | | | 11.52 | % | | | 13.53 | % | | | 4.00 | % |
Dividends and Other Payments
The Company is a legal entity separate and distinct from its subsidiaries. Dividends and management fees from Grant County Bank and Capon Valley Bank are essentially the sole source of cash for the Company, although HBI Life will periodically pay dividends to the Company. The right of the Company, and shareholders of the Company, to participate in any distribution of the assets or earnings of Grant County Bank and Capon Valley Bank through the payment of such dividends or otherwise is necessarily subject to the prior claims of creditors of Grant County Bank and Capon Valley Bank, except to the extent that claims of the Company in its capacity as a creditor may be recognized. Moreover, there are various legal limitations applicable to the payment of dividends to the Company as well as the payment of dividends by the Company to its shareholders. Under federal law, Grant County Bank and Capon Valley Bank may not, subject to certain limited exceptions, make loans or extensions of credit to, or invest in the securities of, or take securities of the Company as collateral for loans to any borrower. Grant County Bank and Capon Valley Bank are also subject to collateral security requirements for any loans or extensions of credit permitted by such exceptions.
Grant County Bank and Capon Valley Bank are subject to various statutory restrictions on their ability to pay dividends to the Company. Specifically, the approval of the appropriate regulatory authorities is required prior to the payment of dividends by Grant County Bank and Capon Valley Bank in excess of earnings retained in the current year plus retained net profits for the preceding two years. The payment of dividends by the Company, Grant County Bank and Capon Valley Bank may also be limited by other factors, such as requirements to maintain adequate capital above regulatory guidelines. The Federal Reserve Board and the Federal Deposit Insurance Corporation have the authority to prohibit any bank under their jurisdiction from engaging in an unsafe and unsound practice in conducting its business. Depending upon the financial condition of Grant County Bank and Capon Valley Bank, the payment of dividends could be deemed to constitute such an unsafe or unsound practice. The Federal Reserve Board and the FDIC have indicated their view that it’s generally unsafe and unsound practice to pay dividends except out of current operating earnings. The Federal Reserve Board has stated that, as a matter of prudent banking, a bank or bank holding company should not maintain its existing rate of cash dividends on common stock unless (1) the organization’s net income available to common shareholders over the past year has been sufficient to fund fully the dividends and (2) the prospective rate or earnings retention appears consistent with the organization’s capital needs, asset quality, and overall financial condition. Moreover, the Federal Reserve Board has indicated that bank holding companies should serve as a source of managerial and financial strength to their subsidiary banks. Accordingly, the Federal Reserve Board has stated that a bank holding company should not maintain a level of cash dividends to its shareholders that places undue pressure on the capital of bank subsidiaries, or that can be funded only through additional borrowings or other arrangements that may undermine the bank holding company’s ability to serve as a source of strength.
Governmental Policies
The Federal Reserve Board regulates money and credit and interest rates in order to influence general economic conditions. These policies have a significant influence on overall growth and distribution of bank loans, investments and deposits and affect interest rates charged on loans or paid for time and savings deposits. Federal Reserve monetary policies have had a significant effect on the operating results of commercial banks in the past and are expected to continue to do so in the future.
Various other legislation, including proposals to overhaul the banking regulatory system and to limit the investments that a depository institution may make with insured funds, are from time to time introduced in Congress. The Company cannot determine the ultimate effect that such potential legislation, if enacted, would have upon its financial condition or operations.
Financial Market and Economic Conditions May Adversely Affect Our Business.
The United States is considered to be in a recession, and many businesses are having difficulty due to reduced consumer spending and the lack of liquidity in the credit markets. Unemployment has increased significantly.
Because of declines in home prices and the values of subprime mortgages across the country, financial institutions and the securities markets have been adversely affected by significant declines in the values of most asset classes and by a serious lack of liquidity. These conditions have led to the failure or merger of a number of prominent financial institutions. In 2008, the U.S. government, the Federal Reserve and other regulators have taken numerous steps to increase liquidity and to restore investor confidence, but asset values have continued to decline and access to liquidity continues to be very limited.
Highlands’ financial performance and the ability of borrowers to pay interest on and repay principal of outstanding loans and the value of collateral securing those loans depends on the business environment in the markets where Highlands operates.
An Increase in FDIC Assessments Could Impact Our Financial Performance.
The FDIC imposes an assessment against all depository institutions for deposit insurance. See “Supervision and Regulation – FDIC Assessments.” In the current economic environment, it is likely that this assessment will increase in general for financial institutions across the country, including the Bank, thereby increasing operating costs.
The FDIC imposes an assessment against all depository institutions for deposit insurance. This assessment is based on the risk category of the institution and, prior to 2009, ranged from five to 43 basis points of an institution’s deposits. On October 7, 2008, as a result of decreases in the reserve ratio of the DIF, the FDIC issued a proposed rule establishing a Restoration Plan for the DIF. The rulemaking proposed that, effective January 1, 2009, assessment rates would increase uniformly by seven basis points for the first quarter 2009 assessment period. The rulemaking proposed to alter the way in which the FDIC’s risk-based assessment system differentiates for risk and set new deposit insurance assessment rates, effective April 1, 2009. Under the proposed rule, the FDIC would first establish an institution’s initial base assessment rate. This initial base assessment rate would range, depending on the risk category of the institution, from 10 to 45 basis points. The FDIC would then adjust the initial base assessment (higher or lower) to obtain the total base assessment rate. The adjustment to the initial base assessment rate would be based upon an institution’s levels of unsecured debt, secured liabilities, and brokered deposits. The total base assessment rate would range from eight to 77.5 basis points of the institution’s deposits. On December 22, 2008, the FDIC published a final rule raising the current deposit insurance assessment rates uniformly for all institutions by seven basis points (to a range from 12 to 50 basis points) for the first quarter of 2009. However, the FDIC approved an extension of the comment period on the parts of the proposed rulemaking that would become effective on April 1, 2009. The FDIC expects to issue a second final rule early in 2009, to be effective April 1, 2009, to change the way that the FDIC’s assessment differentiates for risk and to set new assessment rates beginning with the second quarter of 2009. On February 27, 2009, the FDIC proposed an emergency assessment charged to all financial institutions of 0.20% of insured deposits as of June 30, 2009, payable on September 30, 2009. In March of 2009, the FDIC reduced the amount of the proposed assessment to 0.10% of insured deposits as of June 30, 2009.
Troubled Asset Relief Program – Capital Purchase Program
On October 3, 2008, the Federal government enacted the Emergency Economic Stabilization Act of 2008 (“EESA”). EESA was enacted to provide liquidity to the U.S. financial system and lessen the impact of looming economic problems. The EESA included broad authority. The centerpiece of the EESA is the Troubled Asset Relief Program (“TARP”). EESA’s broad authority was interpreted to allow the U.S. Treasury to purchase equity interests in both healthy and troubled financial institutions. The equity purchase program is commonly referred to as the Capital Purchase Program (“CPP”). The company elected not to participate in the CPP.
America Recovery and Reinvestment Act of 2009
On February 17, 2009, President Obama signed into law the American Recovery and Reinvestment Act of 2009 (“ARRA”), more commonly known as the economic stimulus or economic recovery package. ARRA includes a wide variety of programs intended to stimulate the economy and provide for extensive infrastructure, energy, health, and education needs.
Future Legislation
Various other legislative and regulatory initiatives, including proposals to overhaul the banking regulatory system and to limit the investments that a depository institution may make with insured funds, are from time to time introduced in Congress and state legislatures, as well as regulatory agencies. Such legislation may change banking statutes and the operating environment of Highlands and its subsidiary banks in substantial and unpredictable ways, and could increase or decrease the cost of doing business, limit or expand permissible activities or affect the competitive balance depending upon whether any of this potential legislation will be enacted, and if enacted, the effect that it or any implementing regulations, would have on the financial condition or results of operations of Highlands or any of its subsidiaries. With the recent enactments of EESA and ARRA, the nature and extent of future legislative and regulatory changes affecting financial institutions is very unpredictable at this time. The Company cannot determine the ultimate effect that such potential legislation, if enacted, would have upon its financial condition or operations.
Available Information
The Company files annual, quarterly and current reports, proxy statements and other information with the SEC. The Company’s SEC filings are filed electronically and are available to the public via the Internet at the SEC’s website, www.sec.gov. In addition, any document filed by the Company with the SEC can be read and copies obtained at the SEC’s public reference facilities at 100 F Street, NE, Washington, DC 20549. Copies of documents can be obtained at prescribed rates by writing to the Public Reference Section of the SEC at 100 F Street NE, Washington, DC 20549. The public may obtain information on the operation of the Public Reference Room by calling the SEC at 1-800-SEC-0330. Copies of documents can also be obtained free of charge by writing to Highlands Bankshares, Inc., P.O. Box 929, Petersburg, WV 26847.
Executive Officers
| | Age | Position with the Company | Principal Occupation (Past Five Years) |
| C.E. Porter | 60 | Chief Executive Officer | CEO of Highlands since 2004, President of The Grant County Bank since 1991 |
| R. Alan Miller | 39 | Principal Financial Officer | PFO of Highlands since 2002 |
| Alan L. Brill | 54 | Secretary; President of Capon Valley Bank | President of Capon Valley Bank since 2001 |
Due to Increased Competition, the Company May Not Be Able to Attract and Retain Banking Customers At Current Levels.
If, due to competition from competitors in the Company’s market area, the Company is unable to attract new and retain current customers, loan and deposit growth could decrease causing the Company’s results of operations and financial condition to be negatively impacted. The Company faces competition from the following:
| | · | Local, regional and national banks; |
| | · | Brokerage firms serving the Company’s market areas. |
The Company’s Lending Limit May Prevent It from Making Large Loans.
In the future, the Company may not be able to attract larger volume customers because the size of loans that the company can offer to potential customers is less than the size of the loans that many of the Company’s larger competitors can offer. We anticipate that our lending limit will continue to increase proportionately with the Company’s growth in earnings; however, the Company may not be able to successfully attract or maintain larger customers.
Certain Loans That the Banks Make Are Riskier than Loans for Real Estate Lending.
The Banks make loans that involve a greater degree of risk than loans involving residential real estate lending. Commercial business loans may involve greater risks than other types of lending because they are often made based on varying forms of collateral, and repayment of these loans often depends on the success of the commercial venture. Consumer loans may involve greater risk because adverse changes in borrowers’ incomes and employment after funding of the loans may impact their abilities to repay the loans.
The Company Is Subject to Interest Rate Risk.
Aside from credit risk, the most significant risk resulting from the Company’s normal course of business, extending loans and accepting deposits, is interest rate risk. If market interest rate fluctuations cause the Company’s cost of funds to increase faster than the yield of its interest-earning assets, then its net interest income will be reduced. The Company’s results of operations depend to a large extent on the level of net interest income, which is the difference between income from interest-earning assets, such as loans and investment securities, and interest expense on interest-bearing liabilities, such as deposits and borrowings. Interest rates are highly sensitive to many factors that are beyond the Company’s control, including general economic conditions and the policies of various governmental and regulatory authorities.
The Company May Not Be Able to Retain Key Members of Management.
The departure of one or more of the Company’s officers or other key personnel could adversely affect the Company’s operations and financial position. The Company’s management makes most decisions that involve the Company’s operations.
Customers May Default on the Repayment of Loans.
The Bank’s customers may default on the repayment of loans, which may negatively impact the Company’s earnings due to loss of principal and interest income. Increased operating expenses may result from the allocation of management time and resources to the collection and workout of the loan. Collection efforts may or may not be successful causing the Company to write off the loan or repossess the collateral securing the loan, which may or may not exceed the balance of the loan.
An Economic Slowdown in the Company’s Market Area Could Hurt Our Business.
An economic slowdown in our market area could hurt our business. An economic slowdown could have the following consequences:
| | · | Loan delinquencies may increase; |
| | · | Problem assets and foreclosures may increase; |
| | · | Demand for the products and services of the Company may decline; |
| | · | Collateral (including real estate) for loans made by the company may decline in value, in turn reducing customers’ borrowing power and making existing loans less secure; |
| | · | Certain industries which are integral to the economy within the Company’s primary market area, may experience a downturn; and, |
| | · | The current economic environment poses significant challenges for the Company as well as other financial institutions across the country. These challenges could adversely affect our financial condition and results of operations. |
The Company and the Bank are Extensively Regulated.
The operations of the Company are subject to extensive regulation by federal, state and local governmental authorities and are subject to various laws and judicial and administrative decisions imposing requirements and restrictions on them. Policies adopted or required by these governmental authorities can affect the Company’s business operations and the availability, growth and distribution of the Company’s investments, borrowings and deposits. Proposals to change the laws governing financial institutions are frequently raised in Congress and before bank regulatory authorities. Changes in applicable laws or policies could materially affect the Company’s business, and the likelihood of any major changes in the future and their effects are impossible to determine.
The Company’s Allowance for Loan Losses May Not Be Sufficient.
In the future, the Company could experience negative credit quality trends that could lead to a deterioration of asset quality. Such deterioration could require the company to incur loan charge-offs in the future and incur additional loan loss provision, both of which would have the effect of decreasing earnings. The Company maintains an allowance for possible loan losses which is a reserve established through a provision for possible loan losses charged to expense that represents management’s best estimate of probable losses that have been incurred within the existing portfolio of loans. Any increases in the allowance for possible loan losses will result in a decrease in net income and, possibly, capital, and may not have a material adverse effect on the Company’s financial condition and results of operation.
A Shareholder May Have Difficulty Selling Shares.
Because a very limited public market exists for the Company’s common stock, a shareholder may have difficulty selling his or her shares in the secondary market. We cannot predict when, if ever, we could meet the listing qualifications of the NASDAQ Stock Market’s National Market Tier or any exchange. We cannot assure investors that there will be a more active public market for the shares in the near future.
Shares of the Company’s Common Stock Are Not FDIC Insured.
Neither the Federal Deposit Insurance Corporation nor any other governmental agency insures the shares of the Company’s common stock. Therefore, the value of investors’ shares in the Company will be based on their market value and may decline.
The Company’s Controls and Procedures May Fail or Be Circumvented.
Management regularly reviews and updates the Company’s internal controls, disclosure controls and procedures, and corporate governance policies and procedures. Any system of controls, no matter how well designed and operated, is based in part on certain assumptions and can provide only reasonable, not absolute, assurances that the objectives of the system are met. Any failure or circumvention of the Company’s controls and procedures or failure to comply with regulations related to controls and procedures could have a material adverse effect on the Company’s business, results of operations and financial conditions
| Unresolved Staff Comments |
None.
The table below lists the primary properties utilized in operations by the Company. All listed properties are owned by the Company.
| Location | Description |
| 3 N. Main Street, Petersburg, WV 26847 | Primary Office, The Grant County Bank |
| Route 33, Riverton, WV 26814 | Branch Office, The Grant County Bank |
| 500 S. Main Street, Moorefield, WV 26836 | Branch Office, The Grant County Bank |
| Route 220 & Josie Dr., Keyser, WV 26726 | Branch Office, The Grant County Bank |
| Main Street, Harman, WV 26270 | Branch Office, The Grant County Bank |
| William Avenue, Davis, WV 26260 | Branch Office, The Grant County Bank |
| Route 32 & Cortland Rd., Davis, WV 26260 | Branch Office, The Grant County Bank |
| 2 W. Main Street, Wardensville, WV 26851 | Primary Office, Capon Valley Bank |
| 717 N. Main Street, Moorefield, WV 26836 | Branch Office, Capon Valley Bank |
| Route 55, Baker, WV 26801 | Branch Office, Capon Valley Bank |
| 6701 Northwestern Pike, Gore, VA 22637 | Branch Office, Capon Valley Bank |
Management is not aware of any material pending or threatened litigation in which Highlands or its subsidiaries may be involved as a defendant. In the normal course of business, the Banks periodically must initiate suits against borrowers as a final course of action in collecting past due indebtedness.
| Submission of Matters to a Vote of Security Holders |
Highlands Bankshares, Inc. did not submit any matters to a vote of security holders during the fourth quarter of 2008.
| Market for Registrant’s Common Equity, Related Stockholder Matters and Issuer Purchases of Equity Securities |
The Company had approximately 1,100 shareholders as of December 31, 2008. This amount includes all shareholders, whether titled individually or held by a brokerage firm or custodian in street name. The Company's stock is not traded on any national or regional stock exchange although brokers may occasionally initiate or be a participant in a trade. The Company’s stock is listed on the Over The Counter Bulletin Board under the symbol HBSI.OB. The Company may not know terms of an exchange between individual parties.
The table on the following page outlines the dividends paid and market prices of the Company's stock based on prices disclosed to management. Prices have been provided using a nationally recognized online stock quote system. Such prices may not include retail mark-ups, mark-downs or commissions. Dividends are subject to the restrictions described in Note Nine to the Financial Statements.
| Highlands Bankshares, Inc. Common Stock | |
| | |
| | | | | | Estimated Market Range | |
| | | Dividends
Per Share | | | High | | | Low | |
| 2008 | | | | | | | | | |
| First Quarter | | $ | .27 | | | $ | 30.00 | | | $ | 27.00 | |
| Second Quarter | | $ | .27 | | | $ | 38.00 | | | $ | 27.75 | |
| Third Quarter | | $ | .27 | | | $ | 38.00 | | | $ | 31.00 | |
| Fourth Quarter | | $ | .27 | | | $ | 35.00 | | | $ | 29.00 | |
| | | | | | | | | | | | | |
| 2007 | | | | | | | | | | | | |
| First Quarter | | $ | .25 | | | $ | 34.50 | | | $ | 32.50 | |
| Second Quarter | | $ | .25 | | | $ | 34.75 | | | $ | 33.55 | |
| Third Quarter | | $ | .25 | | | $ | 34.85 | | | $ | 33.35 | |
| Fourth Quarter | | $ | .25 | | | $ | 34.85 | | | $ | 29.40 | |
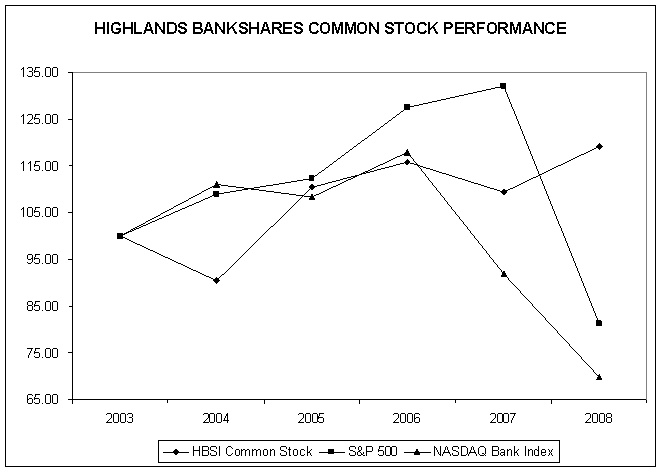
Set forth below is a line graph comparing the cumulative total return of Highlands Bankshares’ common stock from December 31, 2003, assuming reinvestment of dividends, with that of the Standard & Poor's 500 Index ("S&P 500") and the NASDAQ Bank Index.
| | | Years Ending December 31, | |
| | | (In thousands of dollars, except for per share amounts) | |
| | | 2008 | | | 2007 | | | 2006 | | | 2005 | | | 2004 | |
| Total Interest Income | | $ | 26,203 | | | $ | 27,664 | | | $ | 23,894 | | | $ | 19,813 | | | $ | 17,729 | |
| Total Interest Expense | | | 8,866 | | | | 10,703 | | | | 7,909 | | | | 5,761 | | | | 4,711 | |
| Net Interest Income | | | 17,337 | | | | 16,961 | | | | 15,985 | | | | 14,052 | | | | 13,018 | |
| | | | | | | | | | | | | | | | | | | | | |
| Provision for Loan Losses | | | 909 | | | | 837 | | | | 682 | | | | 875 | | | | 920 | |
| | | | | | | | | | | | | | | | | | | | | |
| Net Interest Income After Provision for Loan Losses | | | 16,428 | | | | 16,124 | | | | 15,303 | | | | 13,177 | | | | 12,098 | |
| | | | | | | | | | | | | | | | | | | | | |
| Other Income | | | 2,699 | | | | 2,080 | | | | 1,997 | | | | 1,669 | | | | 1,597 | |
| Other Expenses | | | 11,419 | | | | 10,952 | | | | 10,394 | | | | 9,128 | | | | 8,938 | |
| | | | | | | | | | | | | | | | | | | | | |
| Income Before Income Taxes | | | 7,708 | | | | 7,252 | | | | 6,906 | | | | 5,718 | | | | 4,757 | |
| | | | | | | | | | | | | | | | | | | | | |
| Income Tax Expense | | | 2,738 | | | | 2,599 | | | | 2,391 | | | | 1,916 | | | | 1,551 | |
| | | | | | | | | | | | | | | | | | | | | |
| Net Income | | $ | 4,970 | | | $ | 4,653 | | | $ | 4,515 | | | $ | 3,802 | | | $ | 3,206 | |
| | | | | | | | | | | | | | | | | | | | | |
| Total Assets at Year End | | $ | 378,295 | | | $ | 380,936 | | | $ | 357,316 | | | $ | 337,573 | | | $ | 299,992 | |
| Long Term Debt at Year End | | $ | 11,317 | | | $ | 11,819 | | | $ | 14,992 | | | $ | 15,063 | | | $ | 8,377 | |
| | | | | | | | | | | | | | | | | | | | | |
| Net Income Per Share of Common Stock | | $ | 3.59 | | | $ | 3.24 | | | $ | 3.14 | | | $ | 2.65 | | | $ | 2.23 | |
| Dividends Per Share of Common Stock | | $ | 1.08 | | | $ | 1.00 | | | $ | .94 | | | $ | .82 | | | $ | .63 | |
| | | | | | | | | | | | | | | | | | | | | |
| Return on Average Assets | | | 1.32 | % | | | 1.24 | % | | | 1.29 | % | | | 1.21 | % | | | 1.07 | % |
| Return on Average Equity | | | 12.38 | % | | | 12.03 | % | | | 12.67 | % | | | 11.53 | % | | | 10.36 | % |
| Dividend Payout Ratio | | | 30.12 | % | | | 30.88 | % | | | 29.91 | % | | | 30.99 | % | | | 28.23 | % |
| Year End Equity to Assets Ratio | | | 10.41 | % | | | 10.66 | % | | | 10.38 | % | | | 10.07 | % | | | 10.55 | % |
| Management’s Discussion and Analysis of Financial Condition and Results or Operations |
Forward Looking Statements
Certain statements in this report may constitute “forward-looking statements” within the meaning of the Private Securities Litigation Reform Act of 1995. Forward-looking statements are statements that include projections, predictions, expectations or beliefs about future events or results or otherwise are not statements of historical fact. Such statements are often characterized by the use of qualified words (and their derivatives) such as “expect,” “believe,” “estimate,” “plan,” “project,” “anticipate” or other similar words. Although the Company believes that its expectations with respect to certain forward-looking statements are based upon reasonable assumptions within the bounds of its existing knowledge of its business and operations, there can be no assurance that actual results, performance or achievements of the Company will not differ materially from any future results, performance or achievements expressed or implied by such forward-looking statements. Actual future results and trends may differ materially from historical results or those anticipated depending on a variety of factors, including, but not limited to, those factors set forth in “Risk Factors” and the effects of and changes in: general economic conditions, the interest rate environment, legislative and regulatory requirements, competitive pressures, new products and delivery systems, inflation, changes in the stock and bond markets, technology, downturns in the trucking and timber industries, effects of mergers and/or downsizing in the poultry industry in Hardy County, and consumer spending and savings habits. Additionally, actual future results and trends may differ from historical or anticipated results to the extent: (1) any significant downturn in certain industries, particularly the trucking and timber and coal extraction industries are experienced; (2) loan demand decreases from prior periods; (3) the Company may make additional loan loss provisions due to negative credit quality trends in the future that may lead to a deterioration of asset quality; (4) the Company may not continue to experience significant recoveries of previously charged-off loans or loans resulting in foreclosure; (5) increased liquidity needs may cause an increase in funding costs; (6) the quality of the Company’s securities portfolio may deteriorate and, (7) the Company is unable to control costs and expenses as anticipated. The Company does not update any forward-looking statements that may be made from time to time by or on behalf of the Company.
The following discussion focuses on significant results of the Company’s operations and significant changes in our financial condition or results of operations for the periods indicated in the discussion. This discussion should be read in conjunction with the preceding financial statements and related notes. Current performance does not guarantee, and may not be indicative of, similar performance in the future.
Critical Accounting Policies
The Company’s financial statements are prepared in accordance with accounting principles generally accepted in the United States (“GAAP”). The financial statements contained within these statements are, to a significant extent, financial information that is based on measures of the financial effects of transactions and events that have already occurred. A variety of factors could affect the ultimate value that is obtained either when earning income, recognizing an expense, recovering an asset or relieving a liability. In addition, GAAP itself may change from one previously acceptable method to another method. Although the economics of these transactions would be the same, the timing of events that would impact these transactions could change.
Allowance for Loan Losses
The allowance for loan losses is an estimate of the losses that may be sustained in the loan portfolio. The allowance is based on two basic principles of accounting: (i) Statement of Financial Accounting Standards No. 5, Accounting for Contingencies (SFAS 5), which requires that losses be accrued when they are probable of occurring and estimable and (ii) Statement of Financial Accounting Standards No. 114, Accounting by Creditors for Impairment of a Loan (SFAS 114), which requires that losses be accrued based on the differences between the value of collateral, present value of future cash flows or values that are observable in the secondary market and the loan balance.
The allowance for loan losses includes two basic components: estimated credit losses on individually evaluated loans that are determined to be impaired, and estimated credit losses inherent in the remainder of the loan portfolio. Under SFAS 114, an individual loan is impaired when, based on current information and events, it is probable that a creditor will be unable to collect all amounts due according to the contractual terms of the loan agreement. An individually evaluated loan that is determined not to be impaired under SFAS 114 is evaluated under SFAS 5 when specific characteristics of the loan indicate that it is probable there would be estimated credit losses in a group of loans with those characteristics.
SFAS 114 does not specify how an institution should identify loans that are to be evaluated for collectibility, nor does it specify how an institution should determine that a loan is impaired. Each subsidiary of Highlands uses its standard loan review procedures in making those judgments so that allowance estimates are based on a comprehensive analysis of the loan portfolio. For loans within the scope of SFAS 114 that are individually evaluated and found to be impaired, the associated allowance is based upon the estimated fair value, less costs to sell, of any collateral securing the loan as compared to the existing balance of the loan as of the date of analysis.
All other loans, including individually evaluated loans determined not to be impaired under SFAS 114, are included in a group of loans that are measured under SFAS 5 to provide for estimated credit losses that have been incurred on groups of loans with similar risk characteristics. The methodology for measuring estimated credit losses on groups of loans with similar risk characteristics in accordance with SFAS 5 is based on each group’s historical net charge-off rate, adjusted for the effects of the qualitative or environmental factors that are likely to cause estimated credit losses as of the evaluation date to differ from the group’s historical loss experience.
Post Retirement Benefits and Life Insurance Investments
The Company has invested in and owns life insurance policies on key officers. The policies are designed so that the company recovers the interest expenses associated with carrying the policies and the officer will, at the time of retirement, receive any earnings in excess of the amounts earned by the Company. The Company recognizes as an asset the net amount that could be realized under the insurance contract as of the balance sheet date. This amount represents the cash surrender value of the policies less applicable surrender charges. The portion of the benefits, which will be received by the executives at the time of their retirement, is considered, when taken collectively, to constitute a retirement plan. Therefore the Company accounts for these policies using guidance found in Statement of Financial Accounting Standards No. 106, "Employers' Accounting for Post Retirement Benefits Other Than Pensions.” SFAS No. 106 requires that an employer’s obligation under a deferred compensation agreement be accrued over the expected service life of the employee through their normal retirement date.
Assumptions are used in estimating the present value of amounts due officers after their normal retirement date. These assumptions include the estimated income to be derived from the investments and an estimate of the Company’s cost of funds in these future periods. In addition, the discount rate used in the present value calculation will change in future years based on market conditions.
Intangible Assets
The Company carries intangible assets related to the purchase of two banks. Amounts paid to purchase these banks were allocated as intangible assets. Generally accepted accounting principles were applied to allocate the intangible components of the purchases. The excess was allocated between identifiable intangibles (core deposit intangibles) and unidentified intangibles (goodwill). Goodwill is required to be evaluated for impairment on an annual basis, and the value of the goodwill adjusted accordingly, should impairment be found. As of December 31, 2008, the Company did not identify an impairment of this intangible.
In addition to the intangible assets associated with the purchases of banks, the company also carries intangible assets relating to the purchase of naming rights to certain features of a performing arts center in Petersburg, WV.
A summary of the change in balances of intangible assets can be found in Note Twenty Two to the Financial Statements.
Recent Accounting Pronouncements
In September 2006, the Financial Accounting Standards Board (FASB) reached a consensus on Emerging Issues Task Force (“EITF”) Issue 06-4, “Accounting for Deferred Compensation and Postretirement Benefit Aspects of Endorsement Split-Dollar Life Insurance Arrangements,” (“EITF Issue 06-4”). In March 2007, the FASB reached a consensus on EITF Issue 06-10, “Accounting for Collateral Assignment Split-Dollar Life Insurance Arrangements,” (“EITF Issue 06-10”). Both of these standards require a company to recognize an obligation over an employee’s service period based upon the substantive agreement with the employee such as the promise to maintain a life insurance policy or provide a death benefit postretirement. These EITF pronouncements became effective for Highlands Bankshares on January 1, 2008. These EITF pronouncements provided an option for affected companies to record the resulting liability as a cumulative effect adjustment to retained earnings at the beginning of the period in which recorded or to record through retrospective application to prior periods. Highlands Bankshares opted to record the liability as a cumulative effect adjustment to retained earnings and as such recorded a liability and corresponding reduction of retained earnings of $348,000. There is no corresponding deferred tax consequence relating to this liability.
In September 2006, the FASB issued Statement of Financial Accounting Standards No. 157, “Fair Value Measurements” (SFAS 157). SFAS 157 defines fair value, establishes a framework for measuring fair value in generally accepted accounting principles, and expands disclosures about fair value measurements. SFAS 157 does not require any new fair value measurements, but rather, provides enhanced guidance to other pronouncements that require or permit assets or liabilities to be measured at fair value. This Statement is effective for financial statements issued for fiscal years beginning after November 15, 2007 and interim periods within those years. The FASB has approved a one-year deferral for the implementation of the Statement for nonfinancial assets and nonfinancial liabilities that are recognized or disclosed at fair value in the financial statements on a nonrecurring basis. SFAS 157 had no material impact on the Company’s December 31, 2008 financial statements. Additional disclosure information required by this pronouncement is included as a footnote to the financial statements.
In February 2007, the FASB issued Statement of Financial Accounting Standards No. 159, “The Fair Value Option for Financial Assets and Financial Liabilities” (SFAS 159). This Statement permits entities to choose to measure many financial instruments and certain other items at fair value. The objective of this Statement is to improve financial reporting by providing entities with the opportunity to mitigate volatility in reported earnings caused by measuring related assets and liabilities differently without having to apply complex hedge accounting provisions. The fair value option established by this Statement permits all entities to choose to measure eligible items at fair value at specified election dates. A business entity shall report unrealized gains and losses on items for which the fair value option has been elected in earnings at each subsequent reporting date. The fair value option may be applied instrument by instrument and is irrevocable. SFAS 159 is effective as of the beginning of an entity’s first fiscal year that begins after November 15, 2007, with early adoption available in certain circumstances. The Company adopted SFAS 159 effective January 1, 2008. The Company decided not to report any existing financial assets or liabilities at fair value that are not already reported, thus the adoption of this statement did not have a material impact on the consolidated financial statements.
In November 2007, the Securities and Exchange Commission (SEC) issued Staff Accounting Bulletin No. 109, “Written Loan Commitments Recorded at Fair Value Through Earnings” (SAB 109). SAB 109 expresses the current view of the staff that the expected net future cash flows related to the associated servicing of the loan should be included in the measurement of all written loan commitments that are accounted for at fair value through earnings. SEC registrants are expected to apply the views in Question 1 of SAB 109 on a prospective basis to derivative loan commitments issued or modified in fiscal quarters beginning after December 15, 2007. SAB 109 did not have a material impact on the Company’s consolidated financial statements.
In April 2008, the FASB issued FASB Staff Position (FSP) No. 142-3, “Determination of the Useful Life of Intangible Assets” (“FSP No. 142-3”). FSP No. 142-3 amends the factors an entity should consider in developing renewal or extension assumptions used in determining the useful life of recognized intangible assets under FASB SFAS No. 142, “Goodwill and Other Intangible Assets” (“SFAS No. 142”). The intent of FSP No. 142-3 is to improve the consistency between the useful life of a recognized intangible asset under SFAS No. 142 and the period of expected cash flows used to measure the fair value of the assets under SFAS No. 141(R). FSP No. 142-3 is effective for the Company on January 1, 2009, and applies prospectively to intangible assets that are acquired individually or with a group of other assets in business combinations and asset acquisitions. The adoption of FSP No. 142-3 is not expected to have a material impact on the Company’s consolidated financial statements.
In May 2008, the FASB issued SFAS No. 162, “The Hierarchy of Generally Accepted Accounting Principles,” (“SFAS No. 162”). SFAS No. 162 identifies the sources of accounting principles and the framework for selecting the principles to be used in the preparation of financial statements of nongovernmental entities that are presented in conformity with generally accepted accounting principles. SFAS No. 162 is effective 60 days following the SEC’s approval of the Public Company Accounting Oversight Board amendments to AU Section 411, “The Meaning of Present Fairly in Conformity With Generally Accepted Accounting Principles.” Management does not expect the adoption of the provision of SFAS No. 162 to have any impact on the consolidated financial statements.
In October 2008, the FASB issued FSP FAS 157-3, “Determining the Fair Value of a Financial Asset When the Market for That Asset Is Not Active,” (“FSP 157-3”). FSP 157-3 clarifies the application of SFAS No. 157 in determining the fair value of a financial asset during periods of inactive markets. FSP 157-3 was effective as of September 30, 2008 and did not have material impact on the Company’s consolidated financial statements.
No other recent accounting pronouncements had a material impact on the Company’s consolidated financial statements, and it is believed that none will have a material impact on the Company’s operations in future years.
Overview of 2008 Results
Net income for 2008 increased by 6.81% as compared to 2007. The Company experienced a 2.22% increase in net interest income, which was partially offset by a $72,000 increase in the provision for loan losses. Non interest income increased 29.76% mostly as a result of increases in charges relating to non-sufficient funds fees charged to checking accounts and increases in insurance earnings. Non interest expense increased 4.26% due largely to an increase in salary and benefits expense and to increases in other operational expense as the result of expanding operational growth and usual inflationary pressures.
The table below compares selected commonly used measures of bank performance for the twelve month periods ended December 31, 2008, 2007 and 2006:
| | | 2008 | | | 2007 | | | 2006 | |
| Annualized return on average assets | | | 1.32 | % | | | 1.24 | % | | | 1.29 | % |
| Annualized return on average equity | | | 12.38 | % | | | 12.03 | % | | | 12.67 | % |
| Net interest margin (1) | | | 4.97 | % | | | 4.89 | % | | | 5.05 | % |
| Efficiency Ratio (2) | | | 56.99 | % | | | 57.52 | % | | | 57.80 | % |
| Earnings per share (3) | | $ | 3.59 | | | $ | 3.24 | | | $ | 3.14 | |
| | | | | | | | | | | | | |
| (1) On a fully taxable equivalent basis and including loan origination fees | |
| (2) Non-interest expenses for the period indicated divided by the sum of net interest income and non-interest income for the period indicated. | |
| (3) Per weighted average shares of common stock outstanding for the period indicated. Earnings per share for 2008 reflect share repurchase of 100,001 shares during the second and third quarters of 2008. | |
The change in net income from 2007 to 2008 was impacted significantly by non-recurring items. The table below summarizes the impact of non-recurring items on both 2008 and 2007 income.
| | | Impact of non
recurring item,
year ended
December 31, | | | | |
| | | 2008 | | | 2007 | | | Increase (Decrease) | |
| Description of non recurring item | | | | | | | | | |
| Gains (losses) recorded on calls of securities available for sale | | $ | 110 | | | $ | 1 | | | $ | 109 | |
| Gains (losses) recorded on sale of other real estate owned | | | 4 | | | | 0 | | | | 4 | |
| Gain on life insurance settlement | | | 30 | | | | 0 | | | | 30 | |
| Net gains (losses) recorded on sale of fixed assets | | | 32 | | | | (38 | ) | | | 70 | |
| Total impact of non recurring items on before tax income | | | 176 | | | | (37 | ) | | | 213 | |
| Income tax effect | | | (55 | ) | | | 13 | | | | (68 | ) |
| Total impact of non recurring items on net income | | $ | 121 | | | $ | (24 | ) | | $ | 145 | |
Quarterly Financial Results
| Quarterly Financial Results For the Year Ended December 31, 2008 | |
| (in thousands, except per share amounts) | |
| | |
| | | Fourth
Quarter | | | Third
Quarter | | | Second
Quarter | | | First
Quarter | |
| Total Interest Income | | $ | 6,325 | | | $ | 6,471 | | | $ | 6,570 | | | $ | 6,837 | |
| Total Interest Expense | | | 2,026 | | | | 2,054 | | | | 2,204 | | | | 2,582 | |
| Net Interest Income | | | 4,299 | | | | 4,417 | | | | 4,366 | | | | 4,255 | |
| | | | | | | | | | | | | | | | | |
| Provision for Loan Losses | | | 273 | | | | 238 | | | | 219 | | | | 179 | |
| | | | | | | | | | | | | | | | | |
| Net Interest Income After Provision for Loan Losses | | | 4,026 | | | | 4,179 | | | | 4,147 | | | | 4,076 | |
| | | | | | | | | | | | | | | | | |
| Other Income | | | 675 | | | | 687 | | | | 680 | | | | 657 | |
| Other Expenses | | | 2,848 | | | | 2,910 | | | | 2,875 | | | | 2,786 | |
| | | | | | | | | | | | | | | | | |
| Income Before Income Taxes | | | 1,853 | | | | 1,956 | | | | 1,952 | | | | 1,947 | |
| | | | | | | | | | | | | | | | | |
| Income Tax Expense | | | 642 | | | | 656 | | | | 731 | | | | 709 | |
| | | | | | | | | | | | | | | | | |
| Net Income | | $ | 1,211 | | | $ | 1,300 | | | $ | 1,221 | | | $ | 1,238 | |
| | | | | | | | | | | | | | | | | |
| Net Income Per Share of Common Stock outstanding | | $ | .90 | | | $ | .97 | | | $ | .86 | | | $ | .86 | |
| Dividends Per Share of Common Stock | | $ | .27 | | | $ | .27 | | | $ | .27 | | | $ | .27 | |
| Quarterly Financial Results For the Year Ended December 31, 2007 | |
| (in thousands, except per share amounts) | |
| | |
| | | Fourth Quarter | | | Third Quarter | | | Second Quarter | | | First Quarter | |
| Total Interest Income | | $ | 7,102 | | | $ | 7,079 | | | $ | 6,917 | | | $ | 6,566 | |
| Total Interest Expense | | | 2,799 | | | | 2,796 | | | | 2,660 | | | | 2,448 | |
| Net Interest Income | | | 4,303 | | | | 4,283 | | | | 4,257 | | | | 4,118 | |
| | | | | | | | | | | | | | | | | |
| Provision for Loan Losses | | | 351 | | | | 145 | | | | 168 | | | | 173 | |
| | | | | | | | | | | | | | | | | |
| Net Interest Income After Provision for Loan Losses | | | 3,952 | | | | 4,138 | | | | 4,089 | | | | 3,945 | |
| | | | | | | | | | | | | | | | | |
| Other Income | | | 572 | | | | 542 | | | | 495 | | | | 471 | |
| Other Expenses | | | 2,634 | | | | 2,857 | | | | 2,803 | | | | 2,658 | |
| | | | | | | | | | | | | | | | | |
| Income Before Income Taxes | | | 1,890 | | | | 1,823 | | | | 1,781 | | | | 1,758 | |
| | | | | | | | | | | | | | | | | |
| Income Tax Expense | | | 614 | | | | 690 | | | | 658 | | | | 637 | |
| | | | | | | | | | | | | | | | | |
| Net Income | | $ | 1,276 | | | $ | 1,133 | | | $ | 1,123 | | | $ | 1,121 | |
| | | | | | | | | | | | | | | | | |
| Net Income Per Share of Common Stock outstanding | | $ | .89 | | | $ | .79 | | | $ | .78 | | | $ | .78 | |
| Dividends Per Share of Common Stock | | $ | .25 | | | $ | .25 | | | $ | .25 | | | $ | .25 | |
Net Interest Income
2008 Compared to 2007
Net interest income, on a fully taxable equivalent basis, increased 2.27% from 2007 to 2008. As average balances of both earning assets and interest bearing liabilities remained relatively flat from year to year, this increase in net interest income was most impacted by changes in average rates earned on assets and paid on interest bearing liabilities and by changes in the relative mix of earning assets and interest bearing liabilities.
For the year ended December 31, 2008, the Company’s average balances of both earning assets and interest bearing liabilities remained relatively unchanged as compared to 2007. However, changes in the relative mix of earning assets and interest bearing liabilities for 2008 as compared to 2007 impacted the Company’s net interest earnings. The percent of average loan balances, the highest earning of the Company’s earning assets, to total average earning assets increased from 86.90% in 2007 to 90.04% in 2008, and the percent of average balances of time deposits and long term debt, both comparatively more expensive interest bearing liabilities, decreased slightly from 2007 to 2008. These changes in the relative mix of earning assets and interest bearing liabilities positively impacted the Company’s net interest income, contributing to the decline in average rates paid on interest bearing liabilities being greater than the decline seen on average rates on earning assets.
Recent rate cuts by the Federal Reserve (“the Fed”) for the target rate for federal funds sold continues to impact yields on earning assets and average rates paid on interest bearing liabilities. The Company experienced declining rates for 2008 as compared to 2007 on all components of earning assets and on all components of interest bearing liabilities.
During the fourth quarter of 2008, loan demand increased as compared to the first nine months of the year. The Company has substantially funded this loan growth through reductions in balances of federal funds sold, which stood at $21,714,000 at March 31, 2008, but decreased to nearly zero by the end of the year. In addition, competition for deposits appears to have increased, and, rather than increase deposit rates above that of the local competition, the Company allowed deposit balances to shrink. The result was that this fourth quarter loan growth required overnight and short term borrowings. The impact of these borrowings has been positive in the short term as a result of the low rate of interest paid on these borrowings versus those paid on time deposits or other long term debt instruments.
In the coming periods, should loan demand remain strong, the Company may be required to increase deposit rates to attract increased deposit balances to fund this potential loan growth, or may be required to further utilize its long term debt potential. This may have the effect of causing net interest margin to shrink, however, management anticipates, were this need to occur, that total net interest income should not be adversely affected.
Further discussion relating to potential risks relating to interest rates which might impact the Company’s net interest income in future periods occurs in Item 7A. Quantitative and Qualitative Disclosures About Market Risk.
Also, balances of non performing loans have increased from December 31, 2007 to December 31, 2008 and balances of other real estate acquired through foreclosures have increased over the same time period. Increases in balances of non-accrual loans and other real estate acquired through foreclosure often have adverse effects on net interest income. Should balances of non accrual loans and other real estate acquired through foreclosure continue to increase, net interest margin may decrease accordingly. Further discussion relating to the Company’s loan portfolio and credit quality can be found as part of this Management’s Discussion and Analysis under the headings of “Loan Portfolio” and “Credit Quality.”
The table below illustrates the effects on net interest income of changes in average volumes of interest bearing liabilities and earning assets from 2007 to 2008 and changes in average rates on interest bearing liabilities and earning assets from 2007 to 2008 (in thousands of dollars):
| EFFECT OF RATE-VOLUME CHANGES ON NET INTEREST | |
| (On a fully taxable equivalent basis) | |
| Increase (Decrease) 2008 Compared to 2007 | |
| | |
| | | Due to change in: | | | | |
| | | Average Volume | | | Average Rate | | | Total Change | |
| Interest Income | | | | | | | | | |
| Loans | | $ | 988 | | | $ | (1,474 | ) | | $ | (486 | ) |
| Taxable investment securities | | | (160 | ) | | | (167 | ) | | | (327 | ) |
| Nontaxable investment securities | | | 28 | | | | (1 | ) | | | 27 | |
| Interest bearing deposits | | | (37 | ) | | | (61 | ) | | | (98 | ) |
| Federal funds sold | | | (166 | ) | | | (401 | ) | | | (567 | ) |
| Total Interest Income | | | 653 | | | | (2,104 | ) | | | (1,451 | ) |
| | | | | | | | | | | | | |
| Interest Expense | | | | | | | | | | | | |
| Demand deposits | | | (7 | ) | | | (133 | ) | | | (140 | ) |
| Savings deposits | | | 9 | | | | (311 | ) | | | (302 | ) |
| Time deposits | | | (28 | ) | | | (1,280 | ) | | | (1,308 | ) |
| Overnight and other short term debt | | | 19 | | | | 0 | | | | 19 | |
| Long term debt | | | (54 | ) | | | (52 | ) | | | (106 | ) |
| Total Interest Expense | | | (61 | ) | | | (1,776 | ) | | | (1,837 | ) |
| | | | | | | | | | | | | |
| Net Interest Income | | $ | 714 | | | $ | (328 | ) | | $ | 386 | |
The table below sets forth an analysis of net interest income for the years ended December 31, 2008 and 2007 (average balances and interest income/expense shown in thousands of dollars):
| | | 2008 | | | 2007 | |
| | | Average Balance | | | Income /Expense | | | Yield /Rate | | | Average Balance | | | Income /Expense | | | Yield /Rate | |
| | | | | | | | | | | | | | | | | | | |
| Earning Assets | | | | | | | | | | | | | | | | | | |
| Loans | | $ | 315,473 | | | $ | 24,809 | | | | 7.86 | % | | $ | 302,906 | | | $ | 25,295 | | | | 8.35 | % |
| Taxable investment securities | | | 20,745 | | | | 987 | | | | 4.76 | % | | | 24,104 | | | | 1,314 | | | | 5.45 | % |
| Nontaxable investment securities | | | 3,392 | | | | 205 | | | | 6.04 | % | | | 2,929 | | | | 178 | | | | 6.06 | % |
| Interest bearing deposits | | | 1,419 | | | | 44 | | | | 3.10 | % | | | 2,610 | | | | 142 | | | | 5.44 | % |
| Federal funds sold | | | 9,354 | | | | 234 | | | | 2.50 | % | | | 16,006 | | | | 801 | | | | 5.00 | % |
| Total Earning Assets | | | 350,383 | | | | 26,279 | | | | 7.50 | % | | | 348,555 | | | | 27,730 | | | | 7.96 | % |
| | | | | | | | | | | | | | | | | | | | | | | | | |
| Allowance for loan losses | | | (3,637 | ) | | | | | | | | | | | (3,589 | ) | | | | | | | | |
| Other non-earning assets | | | 30,276 | | | | | | | | | | | | 29,504 | | | | | | | | | |
| | | | | | | | | | | | | | | | | | | | | | | | | |
| Total Assets | | $ | 377,022 | | | | | | | | | | | $ | 374,470 | | | | | | | | | |
| | | | | | | | | | | | | | | | | | | | | | | | | |
| Interest Bearing Liabilities | | | | | | | | | | | | | | | | | | | | | | | | |
| Demand deposits | | $ | 23,258 | | | $ | 77 | | | | .33 | % | | $ | 25,363 | | | $ | 217 | | | | .86 | % |
| Savings deposits | | | 49,363 | | | | 383 | | | | .78 | % | | | 48,181 | | | | 685 | | | | 1.42 | % |
| Time deposits | | | 195,963 | | | | 7,897 | | | | 4.03 | % | | | 196,648 | | | | 9,205 | | | | 4.68 | % |
| Overnight and other short term debt | | | 1,412 | | | | 19 | | | | 1.35 | % | | | | | | | | | | | | |
| Long term debt | | | 11,357 | | | | 490 | | | | 4.31 | % | | | 12,613 | | | | 596 | | | | 4.73 | % |
| Total Interest Bearing Liabilities | | | 281,353 | | | | 8,866 | | | | 3.15 | % | | | 282,805 | | | | 10,703 | | | | 3.78 | % |
| | | | | | | | | | | | | | | | | | | | | | | | | |
| Demand deposits | | | 49,827 | | | | | | | | | | | | 48,101 | | | | | | | | | |
| Other liabilities | | | 5,711 | | | | | | | | | | | | 4,886 | | | | | | | | | |
| Stockholders’ equity | | | 40,131 | | | | | | | | | | | | 38,678 | | | | | | | | | |
| | | | | | | | | | | | | | | | | | | | | | | | | |
| Total Liabilities and Stockholders’ Equity | | $ | 377,022 | | | | | | | | | | | $ | 374,470 | | | | | | | | | |
| | | | | | | | | | | | | | | | | | | | | | | | | |
| Net Interest Income | | | | | | $ | 17,413 | | | | | | | | | | | $ | 17,027 | | | | | |
| Net Yield on Earning Assets | | | | | | | | | | | 4.97 | % | | | | | | | | | | | 4.89 | % |
| | | | | | | | | | | | | | | | | | | | | | | | | |
| Notes: | | | | | | | | | | | | | | | | | | | | | | | | |
| (1) Yields are computed on a taxable equivalent basis using a 37% tax rate | |
| (2) Average balances are based upon daily balances | |
| (3) Includes loans in non-accrual status | |
| (4) Income on loans includes fees | |
2007 Compared to 2006
Net interest income, on a fully taxable equivalent basis, increased 6.09% from 2006 to 2007.
Although the Company experienced an increase in income, margins shrank from 2006 to 2007. This shrinking of the Company’s net interest margin occurred for multiple reasons, included in which are the effect of the Fed’s decrease in the target rate for fed funds sold during the later months of 2007, the relative repricing of deposits as compared to earning assets and both the ratio of earning assets to interest bearing deposits and the ratio of loans, a comparatively higher earning asset, to other types of earning assets.
Although the Company experienced an increase in loan balances from December 31, 2006 to December 31, 2007 and a 9.01% increase in the average balances of loans for 2007 as compared to 2006, balances of deposits increased at a greater rate. Loan balances increased $17,383,000 from December 31, 2006 to December 31, 2007 while deposit balances increased $23,254,000 over the same time period, resulting in an increase in federal funds sold during the last half of 2007. The relative difference in these balances caused the Company’s average balances of federal funds sold to be greater during 2007 than in 2006 and the decreases by the Fed for the target rate for federal funds sold late in the year caused a significant impact on the Company’s interest earnings.
Although earning assets continued to reprice upward in 2007 as a result of the increases in rates during 2006, the relative increase in rates paid on deposits, particularly time deposits, was greater than the increase in average rates earned on earning assets. Average rates earned on loans during 2007 were 39 basis points higher than in 2006 while the average rates paid on time deposits were 76 basis points higher in 2007 than in 2006.
The table below sets forth an analysis of net interest income for the years ended December 31, 2007 and 2006 (average balances and interest income/expense shown in thousands of dollars):
| | | 2007 | | | 2006 | |
| | | Average Balance | | | Income /Expense | | | Yield /Rate | | | Average Balance | | | Income /Expense | | | Yield /Rate | |
| | | | | | | | | | | | | | | | | | | |
| Earning Assets | | | | | | | | | | | | | | | | | | |
| Loans | | $ | 302,906 | | | $ | 25,295 | | | | 8.35 | % | | $ | 277,871 | | | $ | 22,118 | | | | 7.96 | % |
| Taxable investment securities | | | 24,104 | | | | 1,314 | | | | 5.45 | % | | | 24,970 | | | | 1,095 | | | | 4.39 | % |
| Nontaxable investment securities | | | 2,929 | | | | 178 | | | | 6.06 | % | | | 2,987 | | | | 173 | | | | 5.79 | % |
| Interest bearing deposits | | | 2,610 | | | | 142 | | | | 5.44 | % | | | 1,576 | | | | 72 | | | | 4.57 | % |
| Federal funds sold | | | 16,006 | | | | 801 | | | | 5.00 | % | | | 10,287 | | | | 500 | | | | 4.87 | % |
| Total Earning Assets | | | 348,555 | | | | 27,730 | | | | 7.96 | % | | | 317,691 | | | | 23,958 | | | | 7.54 | % |
| | | | | | | | | | | | | | | | | | | | | | | | | |
| Allowance for loan losses | | | (3,589 | ) | | | | | | | | | | | (3,283 | ) | | | | | | | | |
| Other non-earning assets | | | 29,504 | | | | | | | | | | | | 28,648 | | | | | | | | | |
| | | | | | | | | | | | | | | | | | | | | | | | | |
| Total Assets | | $ | 374,470 | | | | | | | | | | | $ | 343,056 | | | | | | | | | |
| | | | | | | | | | | | | | | | | | | | | | | | | |
| Interest Bearing Liabilities | | | | | | | | | | | | | | | | | | | | | | | | |
| Demand deposits | | $ | 25,363 | | | $ | 217 | | | | .86 | % | | $ | 25,658 | | | $ | 224 | | | | .87 | % |
| Savings deposits | | | 48,181 | | | | 685 | | | | 1.42 | % | | | 50,235 | | | | 549 | | | | 1.09 | % |
| Time deposits | | | 196,648 | | | | 9,205 | | | | 4.68 | % | | | 164,005 | | | | 6,429 | | | | 3.92 | % |
| Long term debt | | | 12,613 | | | | 596 | | | | 4.73 | % | | | 15,643 | | | | 707 | | | | 4.52 | % |
| Total Interest Bearing Liabilities | | | 282,805 | | | | 10,703 | | | | 3.78 | % | | | 255,541 | | | | 7,909 | | | | 3.10 | % |
| | | | | | | | | | | | | | | | | | | | | | | | | |
| Demand deposits | | | 48,101 | | | | | | | | | | | | 48,056 | | | | | | | | | |
| Other liabilities | | | 4,886 | | | | | | | | | | | | 3,810 | | | | | | | | | |
| Stockholders’ equity | | | 38,678 | | | | | | | | | | | | 35,649 | | | | | | | | | |
| | | | | | | | | | | | | | | | | | | | | | | | | |
| Total Liabilities and Stockholders’ Equity | | $ | 374,470 | | | | | | | | | | | $ | 343,056 | | | | | | | | | |
| | | | | | | | | | | | | | | | | | | | | | | | | |
| Net Interest Income | | | | | | $ | 17,027 | | | | | | | | | | | $ | 16,049 | | | | | |
| Net Yield on Earning Assets | | | | | | | | | | | 4.89 | % | | | | | | | | | | | 5.05 | % |
| | | | | | | | | | | | | | | | | | | | | | | | | |
| Notes: | | | | | | | | | | | | | | | | | | | | | | | | |
| (1) Yields are computed on a taxable equivalent basis using a 37% tax rate | |
| (2) Average balances are based upon daily balances | |
| (3) Includes loans in non-accrual status | |
| (4) Income on loans includes fees | |
The table below illustrates the effects on net interest income of changes in average volumes of interest bearing liabilities and earning assets from 2006 to 2007 and changes in average rates on interest bearing liabilities and earning assets from 2006 to 2007 (in thousands of dollars):
| EFFECT OF RATE-VOLUME CHANGES ON NET INTEREST INCOME | |
| (On a fully taxable equivalent basis) | |
| (In thousands of dollars) | |
| | | | | | | | | | |
| Increase (Decrease) 2007 Compared to 2006 | |
| | | | | | | | | | |
| | | Due to change in: | | | | |
| | | Average Volume | | | Average Rate | | | Total Change | |
| Interest Income | | | | | | | | | |
| Loans | | $ | 1,993 | | | $ | 1,184 | | | $ | 3,177 | |
| Taxable investment securities | | | (38 | ) | | | 257 | | | | 219 | |
| Nontaxable investment securities | | | (3 | ) | | | 8 | | | | 5 | |
| Interest bearing deposits | | | 46 | | | | 23 | | | | 69 | |
| Federal funds sold | | | 279 | | | | 22 | | | | 301 | |
| Total Interest Income | | | 2,277 | | | | 1,494 | | | | 3,771 | |
| | | | | | | | | | | | | |
| Interest Expense | | | | | | | | | | | | |
| Demand deposits | | | (3 | ) | | | (5 | ) | | | (8 | ) |
| Savings deposits | | | (22 | ) | | | 159 | | | | 137 | |
| Time deposits | | | 1,280 | | | | 1,496 | | | | 2,776 | |
| Long term debt | | | (137 | ) | | | 27 | | | | (110 | ) |
| Total Interest Expense | | | 1,118 | | | | 1,677 | | | | 2,795 | |
| | | | | | | | | | | | | |
| Net Interest Income | | $ | 1,159 | | | $ | (183 | ) | | $ | 976 | |
Loan Portfolio
The Company is an active residential mortgage and construction lender and extends commercial loans to small and medium sized businesses within its primary service area. The Company’s commercial lending activity extends across its primary service areas of Grant, Hardy, Hampshire, Mineral, Randolph, Tucker and Pendleton counties in West Virginia and Frederick County, Virginia. Consistent with its focus on providing community-based financial services, the Company does not attempt to diversify its loan portfolio geographically by making significant amounts of loans to borrowers outside of its primary service area.
The table below summarizes the Company’s loan portfolio at December 31, 2008, 2007, 2006, 2005 and 2004 (in thousands of dollars):
| | | At December 31, | |
| | | 2008 | | | 2007 | | | 2006 | | | 2005 | | | 2004 | |
| Real estate mortgage | | $ | 156,877 | | | $ | 169,122 | | | $ | 164,243 | | | $ | 153,646 | | | $ | 140,762 | |
| Real estate construction | | | 27,210 | | | | 15,560 | | | | 14,828 | | | | 12,201 | | | | 8,850 | |
| Commercial | | | 97,709 | | | | 79,892 | | | | 70,408 | | | | 57,908 | | | | 52,813 | |
| Installment | | | 43,958 | | | | 45,625 | | | | 43,337 | | | | 46,265 | | | | 46,092 | |
| Total Loans | | | 325,754 | | | | 310,199 | | | | 292,816 | | | | 270,020 | | | | 248,517 | |
| | | | | | | | | | | | | | | | | | | | | |
| Allowance for loan losses | | | (3,667 | ) | | | (3,577 | ) | | | (3,482 | ) | | | (3,129 | ) | | | (2,530 | ) |
| | | | | | | | | | | | | | | | | | | | | |
| Net Loans | | $ | 322,087 | | | $ | 306,622 | | | $ | 289,334 | | | $ | 266,891 | | | $ | 245,987 | |
Commercial loan balances include certain loans secured by commercial real estate. As of December 31, 2008 the Company maintained balances of loans secured by real estate of $261,289,000.
There were no foreign loans outstanding during any of the above periods.
The following table illustrates the Company’s loan maturity distribution as of December 31, 2008 (in thousands of dollars):
| | | Maturity Range | |
| | | Less than 1 Year | | | 1-5 Years | | | Over 5 Years | | | Total | |
| Loan Type | | | | | | | | | | | | |
| Commercial | | $ | 64,525 | | | $ | 16,715 | | | $ | 16,469 | | | $ | 97,709 | |
| Real estate mortgage and construction | | | 71,288 | | | | 86,414 | | | | 26,385 | | | | 184,087 | |
| Installment | | | 20,538 | | | | 23,324 | | | | 96 | | | | 43,958 | |
| Total Loans | | $ | 156,351 | | | $ | 126,453 | | | $ | 42,950 | | | $ | 325,754 | |
Credit Quality
The principal economic risk associated with each of the categories of loans in the Company’s portfolio is the creditworthiness of its borrowers. Within each category, such risk is increased or decreased depending on prevailing economic conditions. The risk associated with the real estate mortgage loans and installment loans to individuals varies based upon employment levels, consumer confidence, fluctuations in value of residential real estate and other conditions that affect the ability of consumers to repay indebtedness. The risk associated with commercial, financial and agricultural loans varies based upon the strength and activity of the local economies of the Company’s market areas. The risk associated with real estate construction loans vary based upon the supply of and demand for the type of real estate under construction.
An inherent risk in the lending of money is that the borrower will not be able to repay the loan under the terms of the original agreement. The allowance for loan losses (see subsequent section) provides for this risk and is reviewed periodically for adequacy. This review also considers concentrations of loans in terms of geography, business type or level of risk. While lending is geographically diversified within the service area, the Company does have some concentration of loans in the area of agriculture (primarily poultry farming), and the timber and coal extraction industries. Management recognizes these concentrations and considers them when structuring its loan portfolio.
Non-performing loans include non-accrual loans, loans 90 days or more past due and restructured loans. Non-accrual loans are loans on which interest accruals have been discontinued. Loans are typically placed in non-accrual status when the collection of principal or interest is 90 days past due and collection is uncertain based on the net realizable value of the collateral and/or the financial strength of the borrower. Also, the existence of any guaranties by federal or state agencies is given consideration in this decision. The policy is the same for all types of loans. Restructured loans are loans for which a borrower has been granted a concession on the interest rate or the original repayment terms because of financial difficulties. Non-performing loans do not represent or result from trends or uncertainties which management reasonably expects will materially impact future operating results, liquidity, or capital resources. Non-performing loans are listed in the table below.
The following table summarizes the Company’s non-performing loans (in thousands of dollars):
| | | At December 31, | |
| | | 2008 | | | 2007 | | | 2006 | | | 2005 | | | 2004 | |
| Loans accounted for on a non-accrual basis | | | | | | | | | | | | | | | |
| Consumer | | $ | 180 | | | $ | 71 | | | $ | 83 | | | $ | 124 | | | $ | 252 | |
| Real estate | | | 1,166 | | | | 845 | | | | 161 | | | | 619 | | | | 278 | |
| Total Non-accrual Loans | | | 1,346 | | | | 916 | | | | 244 | | | | 743 | | | | 530 | |
| | | | | | | | | | | | | | | | | | | | | |
| Restructured Loans | | | 705 | | | | 198 | | | | 0 | | | | 0 | | | | 0 | |
| | | | | | | | | | | | | | | | | | | | | |
| Loans delinquent 90 days or more | | | | | | | | | | | | | | | | | | | | |
| Consumer | | | 575 | | | | 497 | | | | 122 | | | | 74 | | | | 140 | |
| Commercial | | | 65 | | | | 3 | | | | 0 | | | | 966 | | | | 355 | |
| Real estate | | | 2,832 | | | | 1,744 | | | | 1,335 | | | | 149 | | | | 40 | |
| Total delinquent loans | | | 3,472 | | | | 2,244 | | | | 1,457 | | | | 1,189 | | | | 535 | |
| | | | | | | | | | | | | | | | | | | | | |
| Total Non-performing loans | | $ | 5,523 | | | $ | 3,358 | | | $ | 1,701 | | | $ | 1,932 | | | $ | 1,065 | |
The carrying value of real estate acquired through foreclosure was $1,359,000 at December 31, 2008 and $336,000 at December 31, 2007. The Company's practice is to value real estate acquired through foreclosure at the lower of (i) an independent current appraisal or market analysis less anticipated costs of disposal, or (ii) the existing loan balance.
Because of its large impact on the local economy, management continues to monitor the economic health of the poultry industry. The Company has direct loans to poultry growers and the industry is a large employer in the Company’s trade area. In recent periods, the Company’s loan portfolio has also begun to reflect a concentration in loans collateralized by heavy equipment, particularly in the trucking, mining and timber industries. Because of the impact of the slowing economic conditions on the housing market, the timber sector has experienced a recent downturn. However, the Company has experienced no material losses related to foreclosures of loans collateralized by assets typical to the timber harvest industry. While close monitoring of this sector is necessary, management expects no significant losses in the foreseeable future.
Allowance For Loan Losses
The allowance for loan losses is an estimate of the losses in the current loan portfolio. The allowance is based on two principles of accounting: (i) SFAS No. 5, Accounting for Contingencies which requires that losses be accrued when they are probable of occurring and estimable and (ii) SFAS No. 114, Accounting by Creditors for Impairment of a Loan, which requires that loans be identified which have characteristics of impairment as individual risks, (e.g. the collateral, present value of cash flows or observable market values are less than the loan balance).
Each of the Company's banking subsidiaries, Capon Valley Bank and The Grant County Bank, determines the adequacy of its allowance for loan losses independently. Although the loan portfolios of the two Banks are similar to each other, some differences exist which result in divergent risk patterns and different charge-off rates amongst the functional areas of the Banks’ portfolios. Each Bank pays particular attention to individual loan performance, collateral values, borrower financial condition and economic conditions. The determination of an adequate allowance at each Bank is done in a three-step process. The first step is to identify impaired loans. Impaired loans are problem loans above a certain threshold, which have estimated losses, calculated based on the fair value of the collateral with which the loan is secured.
A summary of the loans which the Company has identified as impaired follows (in thousands of dollars):
| December 31, 2008 | |
| | | | | | Identified | |
| Loan Type | | Balance | | | Impairment | |
| Mortgage | | $ | 2,237 | | | $ | 25 | |
| Commercial | | | 1,460 | | | | 171 | |
| Installment | | | 144 | | | | 76 | |
The second step is to identify loans above a certain threshold, which are problem loans due to the borrowers' payment history or deteriorating financial condition. Losses in this category are determined based on historical loss rates adjusted for current economic conditions. The final step is to calculate a loss for the remainder of the portfolio using historical loss information for each type of loan classification. The determination of specific allowances and weighting is somewhat subjective and actual losses may be greater or less than the amount of the allowance. However, management believes that the allowance represents a fair assessment of the losses that exist in the current loan portfolio.
The required level of the allowance for loan losses is computed quarterly and the allowance adjusted prior to the issuance of the quarterly financial statements. All loan losses charged to the allowance are approved by the boards of directors of each Bank at their regular meetings. The allowance is reviewed for adequacy after considering historical loss rates, current economic conditions (both locally and nationally) and any known credit problems that have not been considered under the above formula.
Management has analyzed the potential risk of loss on the Company's loan portfolio given the loan balances and the value of the underlying collateral and has recognized losses where appropriate. Non-performing loans are closely monitored on an ongoing basis as part of the Company's loan review process.
During 2008, the Company’s experienced level of net charge-offs, as compared to gross loan balances, was slightly greater than that experienced in 2007, Although the volumes of loans charged off during 2008 was less than experienced in 2007, recoveries on loans previously charged off also declined, resulting in an increased volume of net charge-offs. As a result of the impact of the increased net charge-offs, and in addition to continued increases in loan balances, the Company’s provision for loan losses during 2008 was $72,000 greater than in 2007. The Company’s ratio of allowance for loan losses to gross loans fell from 1.15% at December 31, 2007 to 1.13% at December 31, 2008. At December 31, 2008, the ratio of the allowance for loan losses to non-performing loans was 66.40% compared to 106.52% at December 31, 2007 and 204.70% at December 31, 2006.
Cumulative net loan losses, after recoveries, for the five-year period ending December 31, 2008 are as follows (in thousands of dollars):
| | | Dollars | | | Percent of Total |
| Commercial | | $ | 758 | | | | 24 | % |
| Real Estate | | | 644 | | | | 20 | % |
| Consumer | | | 1,783 | | | | 56 | % |
| Total | | $ | 3,185 | | | | | |
An analysis of the changes in the allowance for loan losses is set forth in the following table (in thousands of dollars):
| | | 2008 | | | 2007 | | | 2006 | | | 2005 | | | 2004 | |
| Balance at beginning of period | | $ | 3,577 | | | $ | 3,482 | | | $ | 3,129 | | | $ | 2,530 | | | $ | 2,463 | |
| | | | | | | | | | | | | | | | | | | | | |
| Charge-offs: | | | | | | | | | | | | | | | | | | | | |
| Commercial loans | | | 198 | | | | 540 | | | | 27 | | | | 45 | | | | 97 | |
| Real estate loans | | | 228 | | | | 47 | | | | 1 | | | | 8 | | | | 422 | |
| Consumer loans | | | 524 | | | | 494 | | | | 551 | | | | 567 | | | | 642 | |
| Total Charge-offs: | | | 950 | | | | 1,081 | | | | 579 | | | | 620 | | | | 1,161 | |
| | | | | | | | | | | | | | | | | | | | | |
| Recoveries: | | | | | | | | | | | | | | | | | | | | |
| Commercial loans | | | 20 | | | | 59 | | | | 5 | | | | 28 | | | | 37 | |
| Real estate loans | | | 2 | | | | 4 | | | | 20 | | | | 0 | | | | 36 | |
| Consumer loans | | | 109 | | | | 276 | | | | 225 | | | | 150 | | | | 235 | |
| Total Recoveries | | | 131 | | | | 339 | | | | 250 | | | | 178 | | | | 308 | |
| | | | | | | | | | | | | | | | | | | | | |
| Net Charge-offs | | | 819 | | | | 742 | | | | 329 | | | | 442 | | | | 853 | |
| | | | | | | | | | | | | | | | | | | | | |
| Provision for loan losses | | | 909 | | | | 837 | | | | 682 | | | | 875 | | | | 920 | |
| Other additions | | | 0 | | | | 0 | | | | 0 | | | | 166 | | | | 0 | |
| | | | | | | | | | | | | | | | | | | | | |
| Balance at end of period | | $ | 3,667 | | | $ | 3,577 | | | $ | 3,482 | | | $ | 3,129 | | | $ | 2,530 | |
| | | | | | | | | | | | | | | | | | | | | |
| Percent of net charge-offs to average net loans outstanding during the period | | | .26 | % | | | .24 | % | | | .11 | % | | | .17 | % | | | .51 | % |
The table below shows the allocation of loans in the loan portfolio and the corresponding amounts of the allowance allocated by loan type (dollar amounts in thousands of dollars):
| | | At December 31, | |
| | | 2008 | | | 2007 | | | 2006 | | | 2005 | | | 2004 | |
| | | Amount | | | Percent of Loans | | | Amount | | | Percent of Loans | | | Amount | | | Percent of Loans | | | Amount | | | Percent of Loans | | | Amount | | | Percent of Loans | |
| Commercial | | $ | 1,349 | | | | 30 | % | | $ | 1,140 | | | | 26 | % | | $ | 1,492 | | | | 24 | % | | $ | 900 | | | | 21 | % | | $ | 697 | | | | 21 | % |
| Mortgage | | | 994 | | | | 57 | % | | | 1,200 | | | | 59 | % | | | 996 | | | | 61 | % | | | 1,139 | | | | 62 | % | | | 853 | | | | 60 | % |
| Consumer | | | 1,285 | | | | 13 | % | | | 1,172 | | | | 15 | % | | | 967 | | | | 15 | % | | | 1,082 | | | | 17 | % | | | 970 | | | | 19 | % |
| Unallocated | | | 39 | | | | | | | | 65 | | | | | | | | 27 | | | | | | | | 8 | | | | | | | | 10 | | | | | |
| Totals | | $ | 3,667 | | | | 100 | % | | $ | 3,577 | | | | 100 | % | | $ | 3,482 | | | | 100 | % | | $ | 3,129 | | | | 100 | % | | $ | 2,530 | | | | 100 | % |
As certain loans identified as impaired are paid current, collateral values increase or loans are removed from watch lists for other reasons, and as other loans become identified as impaired, and because delinquency levels within each of the portfolios change, the allocation of the allowance among the loan types may change. Management feels that the allowance is a fair representation of the losses present in the portfolio given historical loss trends, economic conditions and any known credit problems as of any quarter's end. Management believes that the allowance is to be taken as a whole, and allocation between loan types is an estimation of potential losses within each type given information known at the time.
The above figures act as the beginning for the allocation of overall allowances. Additional changes have been made in the allocation of the allowance to address unknowns and contingent items. The unallocated portion is not computed using a specific formula and is management’s best estimate of what should be allocated for contingencies in the current portfolio.
Non Interest Income
2008 Compared to 2007
Non interest income increased 29.76%, or $619,000 from 2007 to 2008.
Of this increase, a large portion related to the recording of non-recurring income items in 2008 as compared to 2007. Further discussions of non recurring income, net of non recurring losses, for 2008 as compared to 2007, is found in the overview section above. In addition, the increases in non recurring income items, increases in service charges on deposit accounts and increases in net insurance earnings and commissions comprise the largest portion of the increase in non interest income.
Service charges on deposit accounts increased 25.52% from 2007 to 2008. Of this increase, $323,000 was related to non sufficient funds charges on demand deposit accounts. During the latter part of 2007, The Grant County Bank implemented what is commonly referred to as a “courtesy overdraft” program which led to much of this increase.
Net insurance earnings and commissions increased $78,000 from 2007 to 2008. Insurance earnings for the Company consist of commissions earned by the subsidiary banks on life and accident and health insurance sold in relation to the extension of credit and insurance revenues, net of benefits paid, expense allowances and policy and claim reserves earned by the life insurance subsidiary. As the Company’s balances of installment loans, and the new volume of installment loans, the primary market for credit life and accident and health insurance, have decreased over the past several years, gross revenues from insurance earnings have decreased. In relation to this decrease, required policy reserves have also declined, resulting in a larger net earnings for the life insurance subsidiary in 2008 as compared to 2007. The table below illustrates the components of insurance commissions and income for 2007 and 2008 (in thousands of dollars).
| | | 2008 | | | 2007 | | | Increase (Decrease) | |
| Revenues | | | | | | | | | |
| Gross commissions and insurance revenues | | $ | 303 | | | $ | 322 | | | $ | (19 | ) |
| | | | | | | | | | | | | |
| Expenses | | | | | | | | | | | | |
| Benefits Paid | | | 23 | | | | 21 | | | | 2 | |
| Changes in required policy and claim reserves | | | (38 | ) | | | 68 | | | | (106 | ) |
| Expense allowance | | | 107 | | | | 100 | | | | 7 | |
| Total Expenses | | | 92 | | | | 189 | | | | (97 | ) |
| | | | | | | | | | | | | |
| Net insurance income | | $ | 211 | | | $ | 133 | | | $ | 78 | |
2007 Compared to 2006
Non interest income increased $83,000 from 2006 to 2007.
During 2006, the Company recorded a one time gain of $155,000 on an insurance settlement. Income from investments in life insurance policies decreased $145,000 from 2006 to 2007. The decrease was largely the result of the non-recurring income recorded during 2006 from the settlement of a bank owned life insurance policy.
Largely because of continued increases in non-sufficient funds fees, as a result of implementation of what is commonly referred to as a “courtesy overdraft” program by Capon Valley Bank in late 2005, deposit account fees increased 14.67% from 2006 to 2007. The impact on non-interest income resulting from this program continued to increase during 2007. During late 2007, The Grant County Bank implemented a similar “courtesy overdraft” program, although the impact of Grant’s program on 2007 non interest income was not significant.
Insurance commissions and insurance earnings generated by HBI Life Insurance Company remained relatively steady from 2006 to 2007.
Non-interest Expense
2008 compared to 2007
Non-interest expense increased 4.26% in 2008 as compared to 2007.
Changes in salary and benefits expense
The following table compares the components of salary and benefits expense for the twelve month periods ended December 31, 2008 and 2007 (in thousands of dollars):
| Salary and Benefits Expense | |
| | | 2008 | | | 2007 | | | Increase (Decrease) | |
| Employee salaries | | $ | 4,198 | | | $ | 4,040 | | | $ | 158 | |
| Employee benefit insurance | | | 878 | | | | 830 | | | | 48 | |
| Payroll taxes | | | 346 | | | | 320 | | | | 26 | |
| Post retirement plans | | | 866 | | | | 762 | | | | 104 | |
| Total | | $ | 6,288 | | | $ | 5,952 | | | $ | 336 | |
The table below illustrates the change in salary expense between 2008 compared to salary expense for 2007 occurring because of increases in average pay per employee and increases in the average number of full time employees (in thousands of dollars):
| | | Amount | |
| Changes due to increase in average salary per full time equivalent employee | | $ | 138 | |
| Changes due to increase in the average full time equivalent employees for the periods | | | 20 | |
| Total increase in salary expense | | $ | 158 | |
Changes in data processing expense
Data processing expense decreased 1.41%. As the company has moved toward increased electronic transfer of information between branch locations and centralized data processing locations, data processing costs have been slightly reduced for 2008 as compared to 2007.
Changes in occupancy and equipment expense
The following table illustrates the components of occupancy and equipment expense for the twelve month periods ended December 31, 2008 and 2007 (in thousands of dollars):
| | | 2008 | | | 2007 | | | Increase (Decrease) | |
| Depreciation of buildings and equipment | | $ | 702 | | | $ | 704 | | | $ | (2 | ) |
| Maintenance expense on buildings and equipment | | | 439 | | | | 414 | | | | 25 | |
| Utilities expense | | | 94 | | | | 99 | | | | (5 | ) |
| Real estate and personal property tax | | | 88 | | | | 87 | | | | 1 | |
| Other expense related to occupancy and equipment | | | 95 | | | | 80 | | | | 15 | |
| Total occupancy and equipment expense | | $ | 1,418 | | | $ | 1,384 | | | $ | 34 | |
Changes in miscellaneous non interest expense
Most other components of other non interest expense remained comparatively flat for 2008 as compared to 2007. The typical increases in costs associated with inflation and the increasing size of the organization were offset by decreases in state franchise tax expense as a result of a reduction in the effective rate of this tax and also decreases in advertising and marketing expense and a slight decline in legal and professional fees.
The table below illustrates components of other non interest expense for 2008 and 2007 (in thousands of dollars). All significant individual components of other non interest expense are itemized.
| | | 2008 | | | 2007 | | | Increase (Decrease) | |
| Office supplies and postage & freight expense | | | 502 | | | | 492 | | | | 10 | |
| ATM expense | | | 193 | | | | 187 | | | | 6 | |
| Advertising and marketing expense | | | 189 | | | | 193 | | | | (4 | ) |
| Amortization of intangible assets | | | 182 | | | | 176 | | | | 6 | |
| Miscellaneous components of other non interest expense | | | 984 | | | | 882 | | | | 102 | |
| Total | | $ | 2,050 | | | $ | 1,930 | | | $ | 120 | |
2007 compared to 2006
Non-interest expense increased 5.37% from 2006 to 2007.
Changes in salary and benefits expense
The following table compares the components of salary and benefits expense for the twelve month periods ended December 31, 2007 and 2006 (in thousands of dollars):
| Salary and Benefits Expense | |
| | | 2007 | | | 2006 | | | Increase (Decrease) | |
| Employee salaries | | $ | 4,040 | | | $ | 3,773 | | | $ | 267 | |
| Employee benefit insurance | | | 831 | | | | 735 | | | | 96 | |
| Payroll taxes | | | 319 | | | | 331 | | | | (12 | ) |
| Post retirement plans | | | 762 | | | | 832 | | | | (70 | ) |
| Total | | $ | 5,952 | | | $ | 5,671 | | | $ | 281 | |
The table below illustrates the change in salary expense between 2007 compared to salary expense for 2006 occurring because of increases in average pay per employee and increases in the average number of full time employees (in thousands of dollars):
| | | Amount | |
| Changes due to increase in average salary per full time equivalent employee | | $ | 120 | |
| Changes due to increase in the average full time equivalent employees for the periods | | | 147 | |
| Total increase in salary expense | | $ | 267 | |
Changes in miscellaneous non interest expense
The Company’s physical plant remained relatively unchanged from 2006 to 2007 other than normal and customary upgrades of equipment and technology. As a result, occupancy and equipment expense remained relatively flat from 2006 to 2007. Data processing increased 5.30% as the volume of accounts, both loan and deposit, increased. Legal and professional fees increased 9.76% from 2006 to 2007 largely as a result of increases in consulting engagements relating to regulatory compliance issues, most notably Sarbanes Oxley Rule 404.
Securities Portfolio
The Company's securities portfolio serves several purposes. Portions of the portfolio are used to secure certain public and trust deposits. The remaining portfolio is held as investments or used to assist the Company in liquidity and asset liability management. Total securities, including restricted securities, represented 6.31% of total assets and 60.58% of total shareholders’ equity at December 31, 2008.
The securities portfolio typically will consist of three components: securities held to maturity, securities available for sale and restricted securities. Securities are classified as held to maturity when management has the intent and the Company has the ability at the time of purchase to hold the securities to maturity. Held to maturity securities are carried at cost, adjusted for amortization of premiums and accretion of discounts. Securities to be held for indefinite periods of time are classified as available for sale and accounted for at market value. Securities available for sale include securities that may be sold in response to changes in market interest rates, changes in the security's prepayment risk, increases in loan demand, general liquidity needs and other similar factors. Restricted securities are those investments purchased as a requirement of membership in certain governmental lending institutions and cannot be transferred without the issuer’s permission. The Company's purchases of securities have generally been limited to securities of high credit quality with short to medium term maturities.
The Company identifies at the time of acquisition those securities that are available for sale. These securities are valued at their market value with any difference in market value and amortized cost shown as an adjustment in stockholders' equity. Changes within the year in market values are reflected as changes in other comprehensive income, net of the deferred tax effect. As of December 31, 2008, the fair value of the securities available for sale exceed their cost basis by $354,000 ($223,000 after tax effect of $131,000).
The table below summarizes the carrying value of the Company’s securities at December 31, 2008, 2007 and 2006 (in thousands of dollars):
| | | Available for Sale | |
| | | Carrying Value | |
| | | December 31, | |
| | | 2008 | | | 2007 | | | 2006 | |
| U.S. Treasuries and Agencies | | $ | 7,726 | | | $ | 15,245 | | | $ | 14,403 | |
| Obligations of states and political subdivisions | | | 3,609 | | | | 3,039 | | | | 2,744 | |
| Mortgage backed securities | | | 10,342 | | | | 7,784 | | | | 6,554 | |
| Marketable equities | | | 15 | | | | 22 | | | | 28 | |
| Total | | $ | 21,692 | | | $ | 26,090 | | | $ | 23,729 | |
The carrying amount and estimated market value of debt securities (in thousands of dollars) at December 31, 2008 by contractual maturity are shown below. Expected maturities will differ from contractual maturities because borrowers may have the right to call or prepay obligations with or without call or prepayment penalties.
| | | Amortized Cost | | | Fair Value | | | Equivalent Average Yield |
| | | | | | | | | | |
| Securities Available for Sale | | | | | | | | | |
| Due in 3 months through one year | | $ | 749 | | | $ | 764 | | | | 3.14 | % |
| Due after one year through three | | | 7,024 | | | | 7,168 | | | | 4.26 | % |
| Due after three years through five years | | | 2,667 | | | | 2,750 | | | | 3.70 | % |
| Due five years through ten years | | | 660 | | | | 653 | | | | 3.98 | % |
| Mortgage backed securities | | | 10,211 | | | | 10,342 | | | | 4.58 | % |
| Equity securities with no maturity | | | 28 | | | | 15 | | | | | |
| Total Available For Sale | | $ | 21,339 | | | $ | 21,692 | | | | 4.29 | % |
| Yields on tax exempt securities are stated at actual yields. | |
Any changes in market values of securities deemed by management to be attributable to reasons other than changes in market rates of interest would be recorded through results of operations It is management’s determination that all securities held at December 31, 2008 which have fair values less than the amortized cost, have these gross unrealized losses related to increases in the current interest rates for similar issues of securities, and that no material impairment for any securities in the portfolio exists because of downgrades of the securities or as a result of a change in the financial condition of any of the issuers. A summary of the length of time of unrealized losses for all securities held at December 31, 2008 can be found in the footnotes to the financial statements. Management reviews all securities with unrealized losses, and all securities in the portfolio on a regular basis to determine whether the potential for other than temporary impairment exists. One of the criteria for making this determination is the rating given to each bond by the major ratings agencies Moodys and Standard & Poors.
A summary of the Company’s securities portfolio at December 31, 2008, based on the ratings of the securities in the portfolio given by these ratings agencies is shown below (in thousands of dollars):
| | | | Amortized Cost | | | Gross Unrealized Gains | | | Gross Unrealized Losses | | | Market Value | |
| Ratings Provided by Ratings Agencies | | | | | | | | | | | | | |
| Moody’s | | | S&P | | | | | | | | | | | | | |
| | | | | | | | | | | | | | | | | |
| U.S. Treasuries and Agencies | | | | | | | | | | | | | |
| Aaa | | | AAA | | | $ | 7,504 | | | $ | 222 | | | $ | 0 | | | $ | 7,726 | |
| | | | | | | | | | | | | | | | | | | | | |
| Mortgage Backed Securities | | | | | | | | | | | | | | | | | |
| Aaa | | | AAA | | | $ | 10,211 | | | $ | 148 | | | $ | 17 | | | $ | 10,342 | |
| | | | | | | | | | | | | | | | | | | | | |
| State and Municipals | | | | | | | | | | | | | | | | | |
| Aaa | | | AAA | | | $ | 1,375 | | | $ | 0 | | | $ | 9 | | | $ | 1,366 | |
| Aa2 | | | AA | | | | 607 | | | | 13 | | | | 0 | | | | 620 | |
| Aa3 | | | AA- | | | | 753 | | | | 13 | | | | 0 | | | | 766 | |
| A3 | | | A- | | | | 180 | | | | 3 | | | | 0 | | | | 183 | |
| Baa1 | | | BBB+ | | | | 285 | | | | 0 | | | | 0 | | | | 285 | |
| No Rating | | | | 396 | | | | 0 | | | | 7 | | | | 389 | |
| | | | | | | | | | | | | | | | | | | | | | | |
| Marketable Equities | | | | | | | | | | | | | | | | | |
| No Rating | | | $ | 28 | | | $ | 0 | | | $ | 13 | | | $ | 15 | |
Deposits
The Company's primary source of funds is local deposits. The Company's deposit base is comprised of demand deposits, savings and money market accounts and other time deposits. The majority of the Company's deposits are provided by individuals and businesses located within the communities served.
Total balances of deposits decreased 2.30% from December 31, 2007 to December 31, 2008.
A summary of the maturity range of deposits over $100,000 is as follows (in thousands of dollars):
| | | At December 31, | |
| | | 2008 | | | 2007 | | | 2006 | |
| Three months or less | | $ | 12,136 | | | $ | 19,609 | | | $ | 9,533 | |
| Four to twelve months | | | 32,828 | | | | 30,204 | | | | 30,810 | |
| One year to three years | | | 14,127 | | | | 10,067 | | | | 8,156 | |
| Four years to five years | | | 5,688 | | | | 5,606 | | | | 6,368 | |
| Total | | $ | 64,779 | | | $ | 65,486 | | | $ | 54,867 | |
Debt Instruments
Long Term Borrowings
The Company borrows funds from the Federal Home Loan Bank (“FHLB”) to reduce market rate risks or to provide operating liquidity. Management typically will initiate these borrowings in response to a specific need for managing market risks or for a specific liquidity need and will attempt to match features of these borrowings to best suit the specific need. Therefore, the borrowings on the Company’s balance sheet as of December 31, 2008 and throughout the twelve month period ended December 31, 2008 have varying features of amortization or single payment with periodic, regular interest payment and also have interest rates which vary based on the terms and on the features of the specific borrowing. During 2008, the Company borrowed an additional $1,500,000 from the FHLB and made payments of $2,002,000 on outstanding balances.
Short Term Borrowings
As it becomes necessary for short term liquidity needs and when beneficial for assisting in managing the profitability of the Company, management will periodically utilize either the FHLB or other available credit facilities for overnight or other short term borrowings. The use of short term debt instruments is not a frequently utilized borrowing mechanism of the Company, however, during the third and fourth quarters of 2008, circumstances prescribed use of these borrowing facilities. At December 31, 2008, the Company had balances of $4,800,000 in overnight and other short term borrowings. During the fourth quarter of 2008, the Company’s average balance of short term debt was $4,141,000. The average rate paid during the quarter on these borrowings was ..83%,
Capital Resources
The assessment of capital adequacy depends on a number of factors such as asset quality, liquidity, earnings performance and changing competitive conditions and economic forces. The Company seeks to maintain a strong capital base to support its growth and expansion activities, to provide stability to current operations and to promote public confidence.
The Company's capital position continues to exceed regulatory minimums. The primary indicators relied on by the Federal Reserve Board and other bank regulators in measuring strength of capital position are the Tier 1 Capital, Total Capital and Leverage ratios. Tier 1 Capital consists of common stockholders' equity adjusted for unrealized gains and losses on securities. Total Capital consists of Tier 1 Capital and a portion of the allowance for loan losses. Risk-based capital ratios are calculated with reference to risk-weighted assets, which consist of both on and off-balance sheet risks.
The capital management function is an ongoing process. The Company looks first and foremost to maintain capital levels adequate to satisfy regulatory requirements through earnings retention. The maintenance of capital adequacy is weighed against the management of capital for satisfactory return on equity, typically via use of dividends and/or share repurchases. During 2006 and 2007, the Company’s capital position increased by $3,517,000 and $3,084,000 respectively. During 2008, the Company’s capital position decreased by $1,194,000. The Company, during the second and third quarters of the year repurchased 6.96% of its outstanding common shares. The return on average equity was 12.38% in 2008 compared to 12.03% for 2007 and 12.67% for 2006. Total cash dividends declared represent 30.12% of net income for 2008 compared to 30.88% of net income for 2007 and 29.91% for 2006. Book value per share was $29.47 at December 31, 2008 compared to $28.25 at December 31, 2007.
Liquidity
Operating liquidity is the ability to meet present and future financial obligations. Short-term liquidity is provided primarily through cash balances, deposits with other financial institutions, federal funds sold, non-pledged securities and loans maturing within one year. Additional sources of liquidity available to the Company include, but are not limited to, loan repayments, the ability to obtain deposits through the adjustment of interest rates and the purchasing of federal funds. To further meet its liquidity needs, the Company also maintains lines of credit with correspondent financial institutions, the Federal Reserve Bank of Richmond and the Federal Home Loan Bank of Pittsburgh.
Historically, the Company’s primary need for additional levels of operational liquidity has been to fund increases in loan balances. The Company has normally funded increases in loans by increasing deposits and balances of borrowed fund and decreases in secondary liquidity sources such as balances of federal funds sold and balances of securities. The Company maintains credit facilities which are typically sufficient to adequately fulfill any short term liquidity needs, and management of deposit balances and long term borrowings are utilized for longer term liquidity management. Increases in liquidity requirements may cause the Company to offer above market rates on deposit products to attract new depositors, which would impact the Company’s net interest income. Further discussion relating to these risks can be found in Item 7A. Quantitative and Qualitative Disclosures About Market Risk.
The parent Company’s operating funds, funds with which to pay shareholder dividends and funds for the exploration of new business ventures have been supplied primarily through dividends paid by the Company’s two subsidiary Banks, Capon Valley Bank and The Grant County Bank. The various regulatory authorities impose restrictions on dividends paid by a state bank. A state bank cannot pay dividends without the consent of the relevant banking authorities in excess of the total net profits of the current year and the combined retained profits of the previous two years. As of January 1, 2009, the subsidiary Banks could pay dividends to Highlands Bankshares, Inc. of approximately $3,238,000 without permission of the regulatory authorities.
Effects of Inflation
Inflation primarily affects industries having high levels of property, plant and equipment or inventories. Although the Company is not significantly affected in these areas, inflation does have an impact on the growth of assets. As assets grow rapidly, it becomes necessary to increase equity capital at proportionate levels to maintain the appropriate equity to asset ratios. Traditionally, the Company's earnings and high capital retention levels have enabled the Company to meet these needs.
The Company's reported earnings results have been minimally affected by inflation. The different types of income and expense are affected in various ways. Interest rates are affected by inflation, but the timing and magnitude of the changes may not coincide with changes in the consumer price index. Management actively monitors interest rate sensitivity, as illustrated by the gap analysis shown under the section titled Interest Rate Sensitivity, in order to minimize the effects of inflationary trends on interest rates. Other areas of non-interest expenses may be more directly affected by inflation.
| Quantitative and Qualitative Disclosures About Market Risk |
The greatest portion of the Company’s net income is derived from net interest income after provision for loans losses. As such, factors that may have significant effects on the Company’s net interest income comprise the greatest market risks to the Company. The three largest components of risks to the Company’s ability to generate net interest income are competitive pressures for loans and deposits, interest rate volatility, and economic conditions which may have an effect on demand for loans or on the quality of the existing loan portfolio, which may affect the levels of provision for loan losses required to maintain an adequate allowance for loan losses.
Management must attempt to estimate and weigh the above factors in attempting to maintain a satisfactory level of liquidity and control the degree of interest rate risk assumed on the balance sheet in an effort to maximize net interest income given current and anticipated market conditions.
Competition for Loans and Deposits
Competition for new loans remains heavy. The result of this competition has also had the effect of causing increases in rates earned on loans to decrease as the Company has often had to price loans to match competitive pressures in order to maintain its demand for new loans. Should this influence continue into the future, the Company may experience a decrease in its net interest margin.
The competitive pressures have also affected deposit volumes and demand for the Company’s deposit products. To attract new deposit balances, the Company has often been required to increase deposit rates to match rates offered by competing financial institutions. Should this influence continue into the future, the Company may experience a decrease in its net interest margin.
Management can, to some degree, offset the effects of competitive rates on deposit products through other funding sources, such as long term and overnight borrowings. During the fourth quarter of 2008, the Company increasingly used its overnight borrowing capabilities to fund loan growth. The Company does not consider short term borrowings to be a significant part of its balance sheet management strategy, but will continue to utilize its capacity in this funding source when conditions warrant.
Economic Conditions
Economic conditions, both nationally and locally, could have a significant impact on the Company’s earnings and specifically on its net interest income after provision for loan losses.
Deteriorating economic conditions often have the effect of increasing balances of non-performing loans and the potential subsequent effect of increasing charge-offs. Both increasing balances of non-performing loans and increasing charge-offs may require the Company to increase its provision for loan losses to maintain an adequate balance of its allowance for loan losses, thus having a negative impact on the Company’s net interest margin after provision for loan losses. In addition, non-performing loans may be placed in non-accrual status, thus reducing the Company’s recognized interest revenue.
Interest Rate Volatility
Managing the risk of interest rate volatility involves regular monitoring of the interest sensitive assets relative to interest sensitive liabilities over specific time intervals. Early withdrawal of deposits, greater than expected balances of new deposits, prepayments of loans and loan delinquencies are some of the factors that could affect actual versus expected cash flows. In addition, changes in rates on interest sensitive assets and liabilities may not be equal, which could result in a change in net interest margin. While the Company does not match each of its interest sensitive assets against specific interest sensitive liabilities, it does review its positions regularly and takes actions to reposition itself when necessary. With the largest amount of interest sensitive assets and liabilities re-pricing within one year, the Company believes it is in an excellent position to respond quickly to rapid market rate changes.
Interest rate market conditions may also affect portfolio composition of both assets and liabilities. Traditionally, the Company’s subsidiary Banks have primarily offered one-year adjustable rate mortgages (ARMs) to its mortgage loan customers. However, the low interest rate environment during the past several years created intense competition, especially from larger banking institutions and finance companies offering long term fixed rate mortgages. As a result, the Company, in recent periods, has begun to write more mortgage loans with adjustable rate maturities greater than one year. This increase in average maturity lengths may affect the timing of the repricing of the loan portfolio as compared to the timing of the repricing of the deposit portfolio.
At December 31, 2008, the Company’s balance sheet was, in the coming quarter of 2009, liability sensitive in that more liabilities reprice within 90 days than do assets. With decreases in rates seen during the third and fourth quarters of 2008, as evidenced by decreases by the Federal Reserve Board of the target rate for federal funds sold, this position of being liability sensitive should have a more positive impact on the Company’s net interest income than if the Company were asset sensitive for the same time period. The following table illustrates the Company’s sensitivity to interest rate changes as of December 31, 2008 (in thousands of dollars):
| | | 1-90 Days | | | 91-365
Days | | | 1 to 3 Years | | | 3 to 5 Years | | | More than 5 Years or no Maturity | | | Total | |
| EARNING ASSETS | | | | | | | | | | | | | | | | | | |
| Loans | | $ | 64,009 | | | $ | 116,825 | | | $ | 87,250 | | | $ | 26,561 | | | $ | 31,109 | | | $ | 325,754 | |
| Federal funds sold | | | 160 | | | | | | | | | | | | | | | | | | | | 160 | |
| Restricted investments | | | | | | | | | | | | | | | | | | | 2,177 | | | | 2,177 | |
| Interest bearing deposits | | | 193 | | | | 309 | | | | | | | | | | | | | | | | 502 | |
| Securities | | | 1,589 | | | | 6,027 | | | | 7,373 | | | | 2,364 | | | | 4,339 | | | | 21,692 | |
| Total Earning Assets | | $ | 65,951 | | | | 123,161 | | | | 94,623 | | | | 28,925 | | | | 37,625 | | | | 350,285 | |
| | | | | | | | | | | | | | | | | | | | | | | | | |
| INTEREST BEARING LIABILITIES | | | | | | | | | | | | | | | | | | | | | | | | |
| Interest bearing transaction accounts | | | 68,610 | | | | | | | | | | | | | | | | | | | | 68,610 | |
| Time deposits greater than $100,000 | | | 12,136 | | | | 32,828 | | | | 14,127 | | | | 5,688 | | | | | | | | 64,779 | |
| Time deposits less than $100,000 | | | 21,124 | | | | 68,306 | | | | 35,029 | | | | 8,835 | | | | | | | | 133,294 | |
| Debt instruments | | | 4,911 | | | | 340 | | | | 2,728 | | | | 5,984 | | | | 2,154 | | | | 16,117 | |
| Total Interest bearing liabilities | | | 106,781 | | | | 101,474 | | | | 51,884 | | | | 20,507 | | | | 2,154 | | | | 282,800 | |
| | | | | | | | | | | | | | | | | | | | | | | | | |
| Rate sensitivity gap | | $ | (40,830 | ) | | $ | 21,687 | | | $ | 42,739 | | | $ | 8,418 | | | $ | 35,471 | | | $ | 67,485 | |
| | | | | | | | | | | | | | | | | | | | | | | | | |
| Cumulative gap | | $ | (40,830 | ) | | $ | (19,143 | ) | | $ | 23,596 | | | $ | 32,014 | | | $ | 67,485 | | | | | |
| Financial Statements and Supplementary Data |
| HIGHLANDS BANKSHARES, INC. | |
| CONSOLIDATED BALANCE SHEETS | |
| December 31, 2008 and 2007 | |
| (In thousands of dollars) | |
| | | 2008 | | | 2007 | |
| ASSETS | | | | | | |
| Cash and due from banks | | $ | 7,589 | | | $ | 7,935 | |
| Interest bearing deposits in banks | | | 502 | | | | 1,853 | |
| Federal funds sold | | | 160 | | | | 14,246 | |
| Investment securities available for sale | | | 21,692 | | | | 26,090 | |
| Restricted investments | | | 2,177 | | | | 1,498 | |
| Loans | | | 325,754 | | | | 310,199 | |
| Allowance for loan losses | | | (3,667 | ) | | | (3,577 | ) |
| Bank premises and equipment | | | 8,031 | | | | 8,104 | |
| Interest receivable | | | 2,164 | | | | 2,273 | |
| Investment in life insurance contracts | | | 6,499 | | | | 6,300 | |
| Goodwill | | | 1,534 | | | | 1,534 | |
| Other intangible assets | | | 1,215 | | | | 1,572 | |
| Other assets | | | 4,645 | | | | 2,909 | |
| Total Assets | | $ | 378,295 | | | $ | 380,936 | |
| | | | | | | | | |
| LIABILITIES | | | | | | | | |
| Deposits | | | | | | | | |
| Non-interest bearing deposits | | $ | 49,604 | | | $ | 48,605 | |
| Interest bearing transaction and savings accounts | | | 68,610 | | | | 73,736 | |
| Time deposits over $100,000 | | | 64,779 | | | | 65,486 | |
| All other time deposits | | | 133,294 | | | | 135,911 | |
| Total Deposits | | | 316,287 | | | | 323,738 | |
| | | | | | | | | |
| Overnight and other short term debt instruments | | | 4,800 | | | | 0 | |
| Long term debt instruments | | | 11,317 | | | | 11,819 | |
| Accrued expenses and other liabilities | | | 6,492 | | | | 4,786 | |
| Total Liabilities | | | 338,896 | | | | 340,343 | |
| | | | | | | | | |
| STOCKHOLDERS’ EQUITY | | | | | | | | |
| Common Stock, $5 par value, 3,000,000 shares authorized, 1,436,874 shares issued | | | 7,184 | | | | 7,184 | |
| Surplus | | | 1,662 | | | | 1,662 | |
| Treasury stock (100,001 shares, at cost at December 31, 2008) | | | (3,372 | ) | | | 0 | |
| Retained earnings | | | 35,157 | | | | 32,032 | |
| Other accumulated comprehensive loss | | | (1,232 | ) | | | (285 | ) |
| Total Stockholders’ Equity | | | 39,399 | | | | 40,593 | |
| | | | | | | | | |
| Total Liabilities and Stockholders’ Equity | | $ | 378,295 | | | $ | 380,936 | |
| | | | | | | | | |
| The accompanying notes are an integral part of these statements | |
| HIGHLANDS BANKSHARES, INC. | |
| CONSOLIDATED STATEMENTS OF INCOME | |
| FOR THE YEARS ENDED DECEMBER 31, 2008, 2007 and 2006 | |
| (in thousands of dollars, except per share data) | |
| | | 2008 | | | 2007 | | | 2006 | |
| Interest and Dividend Income | | | | | | | | | |
| Loans, including fees | | $ | 24,809 | | | $ | 25,295 | | | $ | 22,118 | |
| Federal funds sold | | | 234 | | | | 801 | | | | 500 | |
| Interest bearing deposits | | | 44 | | | | 142 | | | | 72 | |
| Investment securities | | | 1,116 | | | | 1,426 | | | | 1,204 | |
| Total Interest Income | | | 26,203 | | | | 27,664 | | | | 23,894 | |
| | | | | | | | | | | | | |
| Interest Expense | | | | | | | | | | | | |
| Interest on deposits | | | 8,357 | | | | 10,107 | | | | 7,202 | |
| Interest on overnight and other short term debt instruments | | | 19 | | | | 0 | | | | 0 | |
| Instrument on long term debt instruments | | | 490 | | | | 596 | | | | 707 | |
| Total Interest Expense | | | 8,866 | | | | 10,703 | | | | 7,909 | |
| | | | | | | | | | | | | |
| Net Interest Income | | | 17,337 | | | | 16,961 | | | | 15,985 | |
| | | | | | | | | | | | | |
| Provision for Loan Losses | | | 909 | | | | 837 | | | | 682 | |
| | | | | | | | | | | | | |
| Net Interest Income after Provision for Loan Losses | | | 16,428 | | | | 16,124 | | | | 15,303 | |
| | | | | | | | | | | | | |
| Non-interest Income | | | | | | | | | | | | |
| Service charges | | | 1,746 | | | | 1,391 | | | | 1,213 | |
| Life insurance investment income | | | 281 | | | | 235 | | | | 380 | |
| Gain on securities transactions | | | 110 | | | | 1 | | | | 0 | |
| Gain on sale of fixed assets | | | 32 | | | | 0 | | | | 0 | |
| Other operating income | | | 530 | | | | 453 | | | | 404 | |
| Total Non-interest Income | | | 2,699 | | | | 2,080 | | | | 1,997 | |
| | | | | | | | | | | | | |
| Non-interest Expenses | | | | | | | | | | | | |
| Salaries and benefits | | | 6,288 | | | | 5,952 | | | | 5,671 | |
| Occupancy and equipment expense | | | 1,418 | | | | 1,384 | | | | 1,346 | |
| Data processing expense | | | 842 | | | | 854 | | | | 811 | |
| Legal and professional fees | | | 465 | | | | 461 | | | | 420 | |
| Directors fees | | | 356 | | | | 371 | | | | 392 | |
| Other operating expenses | | | 2,050 | | | | 1,930 | | | | 1,754 | |
| Total Non-interest Expenses | | | 11,419 | | | | 10,952 | | | | 10,394 | |
| | | | | | | | | | | | | |
| Income Before Income Tax Expense | | | 7,708 | | | | 7,252 | | | | 6,906 | |
| | | | | | | | | | | | | |
| Income Tax Expense | | | 2,738 | | | | 2,599 | | | | 2,391 | |
| | | | | | | | | | | | | |
| Net Income | | $ | 4,970 | | | $ | 4,653 | | | $ | 4,515 | |
| | | | | | | | | | | | | |
| Earnings Per Weighted Average Share Outstanding | | $ | 3.59 | | | $ | 3.24 | | | $ | 3.14 | |
| Dividends Per Share | | $ | 1.08 | | | $ | 1.00 | | | $ | .94 | |
| Weighted Average Shares Outstanding | | | 1,383,214 | | | | 1,436,874 | | | | 1,436,874 | |
| The accompanying notes are an integral part of these statements | |
| HIGHLANDS BANKSHARES, INC. | |
| CONSOLIDATED STATEMENTS OF STOCKHOLDERS’ EQUITY | |
| (in thousands of dollars) | |
| | |
| | | Common Stock | | | Surplus | | | Treasury Stock | | | Retained Earnings | | | Accumulated Other Comprehensive Income | | | Total | |
| | | | | | | | | | | | | | | | | | | |
| Balances at December 31, 2005 | | $ | 7,184 | | | $ | 1,662 | | | $ | 0 | | | $ | 25,651 | | | $ | (505 | ) | | $ | 33,992 | |
| | | | | | | | | | | | | | | | | | | | | | | | | |
| Comprehensive income: | | | | | | | | | | | | | | | | | | | | | | | | |
| Net income | | | | | | | | | | | | | | | 4,515 | | | | | | | | 4,515 | |
| Change in other comprehensive income | | | | | | | | | | | | | | | | | | | (81 | ) | | | (81 | ) |
| Total comprehensive income | | | | | | | | | | | | | | | | | | | | | | | 4,434 | |
| | | | | | | | | | | | | | | | | | | | | | | | | |
| Cash dividends | | | | | | | | | | | | | | | (1,350 | ) | | | | | | | (1,350 | ) |
| | | | | | | | | | | | | | | | | | | | | | | | | |
| Balances at December 31, 2006 | | | 7,184 | | | | 1,662 | | | | 0 | | | | 28,816 | | | | (586 | ) | | | 37,076 | |
| | | | | | | | | | | | | | | | | | | | | | | | | |
| Comprehensive income: | | | | | | | | | | | | | | | | | | | | | | | | |
| Net income | | | | | | | | | | | | | | | 4,653 | | | | | | | | 4,653 | |
| Change in other comprehensive income | | | | | | | | | | | | | | | | | | | 301 | | | | 301 | |
| Total comprehensive income | | | | | | | | | | | | | | | | | | | | | | | 4,954 | |
| | | | | | | | | | | | | | | | | | | | | | | | | |
| Cash dividends | | | | | | | | | | | | | | | (1,437 | ) | | | | | | | (1,437 | ) |
| | | | | | | | | | | | | | | | | | | | | | | | | |
| Balances at December 31, 2007 | | | 7,184 | | | | 1,662 | | | | 0 | | | | 32,032 | | | | (285 | ) | | | 40,593 | |
| Cumulative effect adjustment to retained earnings for change in accounting principle | | | | | | | | | | | | | | | (348 | ) | | | | | | | (348 | ) |
| | | | | | | | | | | | | | | | | | | | | | | | | |
| Comprehensive income: | | | | | | | | | | | | | | | | | | | | | | | | |
| Net income | | | | | | | | | | | | | | | 4,970 | | | | | | | | 4,970 | |
| Change in other comprehensive income | | | | | | | | | | | | | | | | | | | (947 | ) | | | (947 | ) |
| Total comprehensive income | | | | | | | | | | | | | | | | | | | | | | | 4,023 | |
| | | | | | | | | | | | | | | | | | | | | | | | | |
| Purchase of treasury stock | | | | | | | | | | | (3,372 | ) | | | | | | | | | | | (3,372 | ) |
| Cash dividends | | | | | | | | | | | | | | | (1,497 | ) | | | | | | | (1,497 | ) |
| | | | | | | | | | | | | | | | | | | | | | | | | |
| Balances at December 31, 2008 | | $ | 7,184 | | | $ | 1,662 | | | $ | (3,372 | ) | | $ | 35,157 | | | $ | (1,232 | ) | | $ | 39,399 | |
| HIGHLANDS BANKSHARES, INC. | |
| CONSOLIDATED STATEMENTS OF CASH FLOWS | |
| FOR THE YEARS ENDED DECEMBER 31, 2008, 2007 and 2006 | |
| (In thousands of dollars) | |
| | | Years Ended December 31, | |
| | | 2008 | | | 2007 | | | 2006 | |
| CASH FLOWS FROM OPERATING ACTIVITIES | | | | | | | | | |
| Net Income | | $ | 4,970 | | | $ | 4,653 | | | $ | 4,515 | |
| Adjustments to reconcile net income to net cash provided by operating activities | | | | | | | | | | | | |
| Gain on securities transactions | | | (110 | ) | | | (1 | ) | | | 0 | |
| (Gain) loss on sale of property | | | (32 | ) | | | 38 | | | | (7 | ) |
| Other (gain)/loss | | | (4 | ) | | | 0 | | | | 0 | |
| Depreciation | | | 702 | | | | 704 | | | | 691 | |
| Income from life insurance contracts | | | (281 | ) | | | (234 | ) | | | (380 | ) |
| Net amortization of securities premiums | | | 32 | | | | (142 | ) | | | (182 | ) |
| Provision for loan losses | | | 909 | | | | 837 | | | | 682 | |
| Deferred income tax benefit | | | (65 | ) | | | (131 | ) | | | (115 | ) |
| Amortization of intangibles | | | 182 | | | | 176 | | | | 176 | |
| Decrease (Increase) in interest receivable | | | 109 | | | | (100 | ) | | | (355 | ) |
| Decrease (Increase) in other assets | | | (2,284 | ) | | | (585 | ) | | | 1 | |
| Increase (Decrease) in accrued expenses | | | 946 | | | | 22 | | | | 938 | |
| Net purchase of intangible assets | | | 175 | | | | (250 | ) | | | 0 | |
| Net Cash Provided by Operating Activities | | | 5,248 | | | | 4,987 | | | | 5,964 | |
| | | | | | | | | | | | | |
| CASH FLOWS FROM INVESTING ACTIVITIES | | | | | | | | | | | | |
| Sale of property | | | 46 | | | | 0 | | | | 7 | |
| Proceeds from maturity of securities held to maturity | | | 0 | | | | 170 | | | | 320 | |
| Proceeds from maturity of securities available for sale | | | 17,096 | | | | 10,198 | | | | 11,539 | |
| Purchase of securities available for sale | | | (12,537 | ) | | | (12,862 | ) | | | (7,870 | ) |
| Net change in other investments | | | (679 | ) | | | 72 | | | | (320 | ) |
| Net change in interest bearing deposits in other banks | | | 1,351 | | | | (229 | ) | | | (661 | ) |
| Net increase in loans | | | (16,374 | ) | | | (18,125 | ) | | | (23,125 | ) |
| Settlement on insurance contract, net of gain | | | 82 | | | | 0 | | | | 555 | |
| Net change in federal funds sold | | | 14,086 | | | | (2,036 | ) | | | (1,402 | ) |
| Purchase of property and equipment | | | (643 | ) | | | (715 | ) | | | (1,117 | ) |
| Net Cash Provided by (Used in) Investing Activities | | | 2,428 | | | | (22,807 | ) | | | (22,074 | ) |
| | | | | | | | | | | | | |
| CASH FLOWS FROM FINANCING ACTIVITIES | | | | | | | | | | | | |
| Net change in time deposits | | | (3,324 | ) | | | 19,229 | | | | 25,826 | |
| Net change in other deposit accounts | | | (4,127 | ) | | | 4,025 | | | | (10,034 | ) |
| Additional long term debt | | | 1,500 | | | | 1,000 | | | | 2,300 | |
| Repayment of long term debt | | | (2,002 | ) | | | (4,173 | ) | | | (2,371 | ) |
| Additional (repayment of) short term borrowings | | | 4,800 | | | | 0 | | | | 0 | |
| Purchase of treasury stock | | | (3,372 | ) | | | 0 | | | | 0 | |
| Dividends paid in cash | | | (1,497 | ) | | | (1,437 | ) | | | (1,350 | ) |
| Net Cash Provided by (Used in) Financing Activities | | | (8,022 | ) | | | 18,644 | | | | 14,371 | |
| | | | | | | | | | | | | |
| CASH AND CASH EQUIVALENTS | | | | | | | | | | | | |
| Net increase (decrease) in cash and due from banks | | | (346 | ) | | | 824 | | | | (1,739 | ) |
| Cash and due from banks, beginning of year | | | 7,935 | | | | 7,111 | | | | 8,850 | |
| | | | | | | | | | | | | |
| Cash and due from banks, end of year | | $ | 7,589 | | | $ | 7,935 | | | $ | 7,111 | |
| | | | | | | | | | | | | |
| Supplemental Disclosures, Cash Paid For: | | | | | | | | | | | | |
| Interest Expense | | $ | 9,147 | | | $ | 10,141 | | | $ | 7,529 | |
| Income Taxes | | $ | 2,827 | | | $ | 3,085 | | | $ | 2,381 | |
| The accompanying notes are an integral part of these statements | |
| NOTE ONE: SUMMARY OF OPERATIONS |
Highlands Bankshares, Inc. (the "Company") is a bank holding company and operates under a charter issued by the state of West Virginia. The Company owns all of the outstanding stock of The Grant County Bank ("Grant") and Capon Valley Bank ("Capon"), which operate under charters issued by the State of West Virginia. The Company also owns all of the outstanding stock of HBI Life Insurance Company, Inc. ("HBI Life"), which operates under a charter issued by the State of Arizona. State chartered banks are subject to regulation by the West Virginia Division of Banking, The Federal Reserve Bank and the Federal Deposit Insurance Corporation, while the insurance company is regulated by the Arizona Department of Insurance. The Banks provide services to customers located mainly in Grant, Hardy, Hampshire, Mineral, Pendleton, Randolph and Tucker counties of West Virginia, including the towns of Petersburg, Keyser, Moorefield, Davis and Wardensville through ten locations and in the county of Frederick in Virginia through a single location. The insurance company sells life and accident coverage exclusively through the Company's subsidiary Banks.
| NOTE TWO: SUMMARY OF SIGNIFICANT ACCOUNTING POLICIES |
The accounting and reporting policies of Highlands Bankshares, Inc. and its subsidiaries conform to accounting principles generally accepted in the United States of America and to accepted practice within the banking industry.
| (a) | Principles of Consolidation |
The consolidated financial statements include the accounts of The Grant County Bank, Capon Valley Bank and HBI Life Insurance Company. During 2005, the Company purchased all of the outstanding shares of The National Bank of Davis (“Davis”) and these operations are included subsequent to the purchase. All significant inter-company accounts and transactions have been eliminated.
| (b) | Use of Estimates in the Preparation of Financial Statements |
In preparing the financial statements, management is required to make estimates and assumptions that affect the reported amounts in those statements; actual results could differ significantly from those estimates. A material estimate that is particularly susceptible to significant changes in the near term is the determination of the allowance for loan losses, which is sensitive to changes in local economic conditions.
| (c) | Cash and Cash Equivalents |
For purposes of the statements of cash flows, cash and cash equivalents include cash on hand and non-interest bearing funds at correspondent institutions.
| (d) | Foreclosed Real Estate |
The components of foreclosed real estate are adjusted to the fair value of the property at the time of acquisition, less estimated costs of disposal. The current year provision for a valuation allowance has been recorded as an expense to current operations.
Loans are carried on the balance sheet net of unearned interest and allowance for loan losses. Interest income on loans is determined using the effective interest method based on the daily amount of principal outstanding except where serious doubt exists as to collectibility of the loan, in which case the accrual of income is discontinued. Loans are placed on non-accrual status or charged off if collection of principal or interest becomes doubtful. The interest on these loans is accounted for on a cash-basis or cost-recovery method until qualifying for return to accrual status. Loans are returned to accrual status when all the principal and interest amounts contractually due are brought current and the loan is performing as agreed.
Securities that the Company has both the positive intent and ability to hold to maturity (at time of purchase) are classified as held to maturity securities. All other securities are classified as available for sale. Securities held to maturity are carried at historical cost and adjusted for amortization of premiums and accretion of discounts, using the effective interest method. Securities available for sale are carried at fair value with any valuation adjustments reported, net of deferred taxes, as other accumulated comprehensive income.
Restricted investments consist of investments in the Federal Home Loan Bank of Pittsburgh, the Federal Reserve Bank of Richmond and West Virginia Bankers’ Title Insurance Company. Such investments are required as members of these institutions and these investments cannot be sold without a change in the members' borrowing or service levels. Because there is no readily determinable market value for these investments, restricted investments are carried at cost on the Company’s balance sheet.
Interest and dividends on securities and amortization of premiums and discounts on securities are reported as interest income using the effective interest method. Gains (losses) realized on sales and calls of securities are determined using the specific identification method.
| (g) | Allowance For Loan Losses |
The allowance for loan losses is an estimate of the losses that may be sustained in the loan portfolio. The allowance is based on two basic principles of accounting: (i) Statement of Financial Accounting Standards No. 5, Accounting for Contingencies (SFAS 5), which requires that losses be accrued when they are probable of occurring and estimable, and (ii) Statement of Financial Accounting Standards No. 114, Accounting by Creditors for Impairment of a Loan (SFAS 114), which requires that losses be accrued based on the differences between the value of collateral, present value of future cash flows or values that are observable in the secondary market and the loan balance.
The allowance for loan losses includes two basic components: estimated credit losses on individually evaluated loans that are determined to be impaired, and estimated credit losses inherent in the remainder of the loan portfolio. Under SFAS 114, an individual loan is impaired when, based on current information and events, it is probable that a creditor will be unable to collect all amounts due according to the contractual terms of the loan agreement. An individually evaluated loan that is determined not to be impaired under SFAS 114 is evaluated under SFAS 5 when specific characteristics of the loan indicate that it is probable there would be estimated credit losses in a group of loans with those characteristics.
SFAS 114 does not specify how an institution should identify loans that are to be evaluated for collectibility, nor does it specify how an institution should determine that a loan is impaired. Each subsidiary of Highlands Bankshares uses its standard loan review procedures in making those judgments so that allowance estimates are based on a comprehensive analysis of the loan portfolio. For loans within the scope of SFAS 114 that are individually evaluated and found to be impaired, the associated allowance is based upon the estimated fair value, less costs to sell, of any collateral securing the loan as compared to the existing balance of the loan as of the date of analysis.
All other loans, including individually evaluated loans determined not to be impaired under SFAS 114, are included in a group of loans that are measured under SFAS 5 to provide for estimated credit losses that have been incurred on groups of loans with similar risk characteristics. The methodology for measuring estimated credit losses on groups of loans with similar risk characteristics in accordance with SFAS 5 is based on each group’s historical net charge-off rate, adjusted for the effects of the qualitative or environmental factors that are likely to cause estimated credit losses as of the evaluation date to differ from the group’s historical loss experience.
| (h) | Per Share Calculations |
Earnings per share are based on the weighted average number of shares outstanding.
| (i) | Bank Premises and Equipment |
Bank premises and equipment are stated at cost less accumulated depreciation. Assets acquired in the acquisition of Davis have been recorded at their fair value. Depreciation is charged to income over the estimated useful lives of the assets using a combination of the straight line and accelerated methods. The costs of maintenance, repairs, renewals, and improvements to buildings, equipment and furniture and fixtures are charged to operations as incurred. Gains and losses on routine dispositions are reflected in other income or expense.
Accounting principles generally require that recognized revenue, expenses, gains and losses be included in net income. Certain changes in assets and liabilities, such as unrealized gains and losses on available-for-sale securities and accrued pension liabilities, are reported along with net income as the components of comprehensive income.
| (k) | Bank Owned Life Insurance Contracts |
The Company has invested in and owns life insurance policies on certain officers. The policies are designed so that the company recovers the interest expenses associated with carrying the policies and the officer will, at the time of retirement, receive any earnings in excess of the amounts earned by the Company. The Company recognizes as an asset the net amount that could be realized under the insurance contract as of the balance sheet date. This amount represents the cash surrender value of the policies less applicable surrender charges. The portion of the benefits which will be received by the executives at the time of their retirement is considered, when taken collectively, to constitute a retirement plan. Therefore the Company accounts for these policies using guidance found in Statement of Financial Accounting Standards No. 106, "Employers' Accounting for Post Retirement Benefits Other Than Pensions.” SFAS No. 106 requires that an employers' obligation under a deferred compensation agreement be accrued over the expected service life of the employee through their normal retirement date. Assumptions are used in estimating the present value of amounts due officers after their normal retirement date. These assumptions include the estimated income to be derived from the investments and an estimate of the Company’s cost of funds in these future periods. In addition, the discount rate used in the present value calculation will change in future years based on market conditions.
Advertising costs are expensed as they are incurred. Advertising expense for the years ended December 31, 2008, 2007 and 2006 was $ 189,000, $193,000 and $198,000 respectively.
| (m) | Goodwill and Other Intangible Assets |
In accordance with provisions of SFAS No. 142, "Goodwill and Other Intangible Assets", goodwill is not amortized over an estimated useful life, but rather will be tested at least annually for impairment. Core deposit and other intangible assets include premiums paid for acquisitions of core deposits (core deposit intangibles) and other identifiable intangible assets. Intangible assets other than goodwill, which are determined to have finite lives, are amortized based upon the estimated economic benefits received.
Core deposit and other intangible assets include premiums paid for acquisitions of core deposits (core deposit intangibles) and other identifiable intangible assets related to business acquisitions. In addition to the intangible assets associated with the purchase of banking organizations, the company also carries intangible assets related to the purchase of certain naming rights to a performing arts center in Petersburg, WV.
Intangible assets other than goodwill, which are determined to have finite lives, are amortized based upon the estimated economic benefits received, which is ten years for the core deposit intangibles.
Amounts provided for income tax expense are based on income reported for financial statement purposes rather than amounts currently payable under federal and state tax laws. Deferred taxes, which arise principally from differences between the period in which certain income and expenses are recognized for financial accounting purposes and the period in which they affect taxable income, are included in the amounts provided for income taxes.
When tax returns are filed, it is highly certain that some positions taken would be sustained upon examination by the taxing authorities, while others are subject to uncertainty about the merits of the position taken or the amount of the position that would be ultimately sustained. The benefit of a tax position is recognized in the financial statements in the period during which, based on all available evidence, management believes it is more likely than not that the position will be sustained upon examination, including the resolution of appeals or litigation processes, if any. Tax positions taken are not offset or aggregated with other positions. Tax positions that meet the more-likely-than-not recognition threshold are measured as the largest amount of tax benefit that is more than 50 percent likely to be realized upon settlement with the applicable taxing authority. The portion of the benefits associated with tax positions taken that exceeds the amount measured as described above would be reflected as a liability for unrecognized tax benefits in the accompanying balance sheet along with any associated interest and penalties that would be payable to the taxing authorities upon examination.
Interest and penalties associated with unrecognized tax benefits would be classified as additional income taxes in the statement of income.
At December 31, 2008 there was no liability for unrecognized tax benefits.
Certain reclassifications have been made to prior period balances to conform with the current year’s presentation format.
| (p) | Recent Accounting Standards |
In September 2006, the FASB issued Statement of Financial Accounting Standards No. 158, “Employers Accounting for Defined Benefit Pension and Other Postretirement Plans—an amendment of FASB Statements No. 87, 88, 106 and 132R” (SFAS 158). SFAS 158 requires an employer to recognize the over-funded or under-funded status of a defined benefit postretirement plan as an asset or liability in its statement of financial position and to recognize changes in that funded status, through comprehensive income, in the year in which the changes occur. The funded status of a benefit plan will be measured as the difference between plan assets at fair value and benefit obligation. For any other postretirement plan, the benefit obligation is the accumulated postretirement benefit obligation. SFAS 158 also requires an employer to measure the funded status of a plan as of the date of its year-end statement of financial position. The Statement also requires additional disclosures in the notes to financial statements about certain effects on net periodic benefit cost for the next fiscal year that arise from delayed recognition of the gains or losses, prior service costs or credits, and transition asset or obligation. Under SFAS 158 a company is required to initially recognize the funded status of a defined benefit postretirement plan to provide the required disclosures as of the end of the fiscal year ending after December 15, 2006. The requirement to measure plan assets and benefit obligations as of the date of the employer’s fiscal year end statement of financial position is effective for fiscal years ending after December 15, 2008. The Grant County Bank is a member of the West Virginia Bankers' Association Retirement Plan, a defined benefit plan under SFAS 158.
In September 2006, the Financial Accounting Standards Board (FASB) reached a consensus on Emerging Issues Task Force (“EITF”) Issue 06-4, “Accounting for Deferred Compensation and Postretirement Benefit Aspects of Endorsement Split-Dollar Life Insurance Arrangements,” (“EITF Issue 06-4”). In March 2007, the FASB reached a consensus on EITF Issue 06-10, “Accounting for Collateral Assignment Split-Dollar Life Insurance Arrangements,” (“EITF Issue 06-10”). Both of these standards require a company to recognize an obligation over an employee’s service period based upon the substantive agreement with the employee such as the promise to maintain a life insurance policy or provide a death benefit postretirement. These EITF pronouncements became effective for Highlands Bankshares on January 1, 2008. These EITF pronouncements provided an option for affected companies to record the resulting liability as a cumulative effect adjustment to retained earnings at the beginning of the period in which recorded or to record through retrospective application to prior periods. Highlands Bankshares opted to record the liability as a cumulative effect adjustment to retained earnings and as such recorded a liability and corresponding reduction of retained earnings of $348,000. There is no corresponding deferred tax consequence relating to this liability.
In September 2006, the FASB issued Statement of Financial Accounting Standards No. 157, “Fair Value Measurements” (SFAS 157). SFAS 157 defines fair value, establishes a framework for measuring fair value in generally accepted accounting principles, and expands disclosures about fair value measurements. SFAS 157 does not require any new fair value measurements, but rather, provides enhanced guidance to other pronouncements that require or permit assets or liabilities to be measured at fair value. This Statement is effective for financial statements issued for fiscal years beginning after November 15, 2007 and interim periods within those years. The FASB has approved a one-year deferral for the implementation of the Statement for nonfinancial assets and nonfinancial liabilities that are recognized or disclosed at fair value in the financial statements on a nonrecurring basis. SFAS 157 had no material impact on the Company’s December 31, 2008 financial statements. Additional disclosure information required by this pronouncement is included in Note Nineteen.
In February 2007, the FASB issued Statement of Financial Accounting Standards No. 159, “The Fair Value Option for Financial Assets and Financial Liabilities” (SFAS 159). This Statement permits entities to choose to measure many financial instruments and certain other items at fair value. The objective of this Statement is to improve financial reporting by providing entities with the opportunity to mitigate volatility in reported earnings caused by measuring related assets and liabilities differently without having to apply complex hedge accounting provisions. The fair value option established by this Statement permits all entities to choose to measure eligible items at fair value at specified election dates. A business entity shall report unrealized gains and losses on items for which the fair value option has been elected in earnings at each subsequent reporting date. The fair value option may be applied instrument by instrument and is irrevocable. SFAS 159 is effective as of the beginning of an entity’s first fiscal year that begins after November 15, 2007, with early adoption available in certain circumstances. The Company adopted SFAS 159 effective January 1, 2008. The Company decided not to report any existing financial assets or liabilities at fair value that are not already reported, thus the adoption of this statement did not have a material impact on the consolidated financial statements.
In November 2007, the Securities and Exchange Commission (SEC) issued Staff Accounting Bulletin No. 109, “Written Loan Commitments Recorded at Fair Value Through Earnings” (SAB 109). SAB 109 expresses the current view of the staff that the expected net future cash flows related to the associated servicing of the loan should be included in the measurement of all written loan commitments that are accounted for at fair value through earnings. SEC registrants are expected to apply the views in Question 1 of SAB 109 on a prospective basis to derivative loan commitments issued or modified in fiscal quarters beginning after December 15, 2007. SAB 109 did not have a material impact on the Company’s consolidated financial statements.
In April 2008, the FASB issued FASB Staff Position (FSP) No. 142-3, “Determination of the Useful Life of Intangible Assets” (“FSP No. 142-3”). FSP No. 142-3 amends the factors an entity should consider in developing renewal or extension assumptions used in determining the useful life of recognized intangible assets under FASB SFAS No. 142, “Goodwill and Other Intangible Assets” (“SFAS No. 142”). The intent of FSP No. 142-3 is to improve the consistency between the useful life of a recognized intangible asset under SFAS No. 142 and the period of expected cash flows used to measure the fair value of the assets under SFAS No. 141(R). FSP No. 142-3 is effective for the Company on January 1, 2009, and applies prospectively to intangible assets that are acquired individually or with a group of other assets in business combinations and asset acquisitions. The adoption of FSP No. 142-3 is not expected to have a material impact on the Company’s consolidated financial statements.
In May 2008, the FASB issued SFAS No. 162, “The Hierarchy of Generally Accepted Accounting Principles,” (“SFAS No. 162”). SFAS No. 162 identifies the sources of accounting principles and the framework for selecting the principles to be used in the preparation of financial statements of nongovernmental entities that are presented in conformity with generally accepted accounting principles. SFAS No. 162 is effective 60 days following the SEC’s approval of the Public Company Accounting Oversight Board amendments to AU Section 411, “The Meaning of Present Fairly in Conformity With Generally Accepted Accounting Principles.” Management does not expect the adoption of the provision of SFAS No. 162 to have any impact on the consolidated financial statements.
In October 2008, the FASB issued FSP FAS 157-3, “Determining the Fair Value of a Financial Asset When the Market for That Asset Is Not Active,” (“FSP 157-3”). FSP 157-3 clarifies the application of SFAS No. 157 in determining the fair value of a financial asset during periods of inactive markets. FSP 157-3 was effective as of September 30, 2008 and did not have material impact on the Company’s consolidated financial statements.
No other recent accounting pronouncements had a material impact on the Company’s consolidated financial statements, and it is believed that none will have a material impact on the Company’s operations in future years.
The income derived from taxable and non-taxable securities for the years ended December 31, 2008, 2007 and 2006 is shown below (in thousands of dollars):
| | | Year Ended December 31, | |
| | | 2008 | | | 2007 | | | 2006 | |
| Investment securities, taxable | | $ | 987 | | | $ | 1,314 | | | $ | 1,095 | |
| Investment securities, nontaxable | | | 129 | | | | 112 | | | | 109 | |
The carrying amount and estimated fair value of securities available for sale at December 31, 2008 and 2007 are as follows (in thousands of dollars):
| Available for Sale Securities | |
| | | Amortized Cost | | | Unrealized Gains | | | Unrealized Losses | | | Fair Value | |
| December 31, 2008 | | | | | | | | | | | | |
| | | | | | | | | | | | | |
| U.S. Treasuries and Agencies | | $ | 7,504 | | | $ | 222 | | | $ | 0 | | | $ | 7,726 | |
| Mortgage backed securities | | | 10,211 | | | | 148 | | | | 17 | | | | 10,342 | |
| State and municipals | | | 3,596 | | | | 29 | | | | 16 | | | | 3,609 | |
| Marketable equities | | | 28 | | | | --- | | | | 13 | | | | 15 | |
| Total Securities Available for Sale | | $ | 21,339 | | | $ | 399 | | | $ | 46 | | | $ | 21,692 | |
| | | | | | | | | | | | | | | | | |
| December 31, 2007 | | | | | | | | | | | | | | | | |
| | | | | | | | | | | | | | | | | |
| U.S. Treasuries and Agencies | | $ | 15,040 | | | $ | 207 | | | $ | 2 | | | $ | 15,245 | |
| Mortgage backed securities | | | 7,718 | | | | 74 | | | | 8 | | | | 7,784 | |
| State and municipals | | | 3,034 | | | | 8 | | | | 3 | | | | 3,039 | |
| Marketable equities | | | 28 | | | | --- | | | | 6 | | | | 22 | |
| Total Securities Available for Sale | | $ | 25,820 | | | $ | 289 | | | $ | 19 | | | $ | 26,090 | |
The carrying amount and fair value of debt securities at December 31, 2008, by contractual maturity are shown below (in thousands of dollars). Expected maturities will differ from contractual maturities because borrowers may have the right to call or prepay obligations with or without call or prepayment penalties.
| Securities Available for Sale | |
| | | Amortized Cost | | | Fair Value | |
| Due in one year or less | | $ | 749 | | | $ | 764 | |
| Due after one year through three years | | | 7,024 | | | | 7,168 | |
| Due after three years through five years | | | 2,667 | | | | 2,750 | |
| Due after five years through ten years | | | 660 | | | | 653 | |
| Mortgage backed securities | | | 10,211 | | | | 10,342 | |
| Equity securities with no maturity | | | 28 | | | | 15 | |
| Total Securities Available for Sale | | $ | 21,339 | | | $ | 21,692 | |
Securities having a carrying value of $5,632,000 at December 31, 2008 and $6,859,000 at December 31, 2007 were pledged to secure public deposits and for other purposes required by law.
Information pertaining to securities with gross unrealized losses at December 31, 2008 and 2007, aggregated by investment category and length of time that individual securities have been in a continuous loss position is shown in the table below (in thousands of dollars):
| | | Total | | | Less than 12 Months | | | 12 Months or Greater | |
| | | Fair Value | | | Gross Unrealized Losses | | | Fair Value | | | Gross Unrealized Losses | | | Fair Value | | | Gross Unrealized Losses | |
| December 31, 2008 | | | | | | | | | | | | | | | | |
| Investment Category | | | | | | | | | | | | | | | | | | |
| Mortgage backed securities | | | 1,225 | | | | (17 | ) | | | 1,156 | | | | (16 | ) | | | 69 | | | | (1 | ) |
| State and municipals | | | 1,908 | | | | (16 | ) | | | 1,708 | | | | (15 | ) | | | 200 | | | | (1 | ) |
| Other equity securities | | | 15 | | | | (13 | ) | | | 0 | | | | 0 | | | | 15 | | | | (13 | ) |
| Total | | $ | 3,148 | | | $ | (46 | ) | | $ | 2,864 | | | $ | (31 | ) | | $ | 284 | | | $ | (15 | ) |
| | | | | | | | | | | | | | | | | | | | | | | | | |
| December 31, 2007 | | | | | | | | | | | | | | | | | | | | | |
| Investment Category | | | | | | | | | | | | | | | | | | | | | | | | |
| U.S. Treasury and Agency | | $ | 1,497 | | | $ | (2 | ) | | $ | 0 | | | $ | 0 | | | $ | 1,497 | | | $ | (2 | ) |
| Mortgage backed securities | | | 2,574 | | | | (8 | ) | | | 1,005 | | | | (1 | ) | | | 1,569 | | | | (7 | ) |
| State and municipals | | | 575 | | | | (3 | ) | | | 0 | | | | 0 | | | | 575 | | | | (3 | ) |
| Other Equity Securities | | | 22 | | | | (6 | ) | | | 22 | | | | (6 | ) | | | 0 | | | | 0 | |
| Total | | $ | 4,668 | | | $ | (19 | ) | | $ | 1,027 | | | $ | (7 | ) | | $ | 3,641 | | | $ | (12 | ) |
The number of securities available for sale that were in an unrealized loss position at December 31, 2008 is summarized in the table below:
| | | Total | | | Loss Position less than 12 Months | | | Loss Position greater than 12 Months | |
| Mortgage backed securities | | | 13 | | | | 9 | | | | 4 | |
| States and municipals | | | 5 | | | | 4 | | | | 1 | |
| Other equity securities | | | 1 | | | | 0 | | | | 1 | |
| Total | | | 19 | | | | 13 | | | | 6 | |
It is management’s determination that all securities held at December 31, 2008, which have fair values less than the amortized cost, have gross unrealized losses related to increases in the current interest rates for similar issues of securities, and that no material impairment for any securities in the portfolio exists because of downgrades of the securities or as a result of a change in the financial condition of any of the issuers.
| NOTE FOUR: RESTRICTED INVESTMENTS |
Restricted investments consist of investments in the Federal Home Loan Bank, the Federal Reserve Bank and West Virginia Bankers’ Title Insurance Company. Investments are carried at face value and the level of investment is dictated by the level of participation with each institution. Amounts are restricted as to transferability. Investments in the Federal Home Loan Bank act as a collateral against the outstanding borrowings from that institution.
Loans outstanding as of December 31, 2008 and 2007 are summarized as follows (in thousands of dollars):
| | | 2008 | | | 2007 | |
| Commercial | | $ | 97,709 | | | $ | 79,892 | |
| Real Estate Construction | | | 27,210 | | | | 15,560 | |
| Real Estate Mortgage | | | 156,877 | | | | 169,122 | |
| Consumer Installment | | | 43,958 | | | | 45,625 | |
| Total Loans | | $ | 325,754 | | | $ | 310,199 | |
The following is a summary of information pertaining to impaired and non accrual loans at December 31, 2008, 2007 and 2006 (in thousands of dollars):
| | | 2008 | | | 2007 | | | 2006 | |
| Year end balance, impaired loans | | $ | 3,841 | | | $ | 1,216 | | | $ | 1,895 | |
| Allowance for impairments, year end | | | 272 | | | | 243 | | | | 720 | |
| Average balance impaired loans, year ended December 31 | | | 2,333 | | | | 1,995 | | | | 1,773 | |
| Income recorded on impaired loans, year ended December 31 | | | 179 | | | | 160 | | | | 131 | |
No loans were identified as impaired as of December 31 2008 or 2007 for which an allowance was not provided.
Certain loans identified as impaired are placed into non-accrual status, based upon the loans’ performance compared with contractual terms. Not all loans identified as impaired are placed upon non-accrual status. The interest on loans identified as impaired and also placed in non-accrual status and not recognized as income throughout the year was of an immaterial amount in both 2008 and 2007.
Balances of non-accrual loans and loans past due ninety days or greater and still accruing interest at December 31, 2008 and 2007 are shown below (in thousands of dollars):
| | | 2008 | | | 2007 | |
| Non-accrual loans at year end | | $ | 1,346 | | | $ | 916 | |
| Loans past due ninety days or greater and still accruing interest at year end | | | 3,472 | | | | 2,244 | |
| NOTE SIX: EARNINGS PER SHARE |
During 2007, there were no changes to the outstanding shares of common stock. During the second and third quarters of 2008, the Company purchased, at varying intervals, 100,001 shares of outstanding common stock. The weighted average shares, upon which earnings per share calculations for the twelve month period ended December 31, 2008, were calculated based upon the date repurchased and the number of shares repurchased on that date, as a percentage of the total period represented.
| NOTE SEVEN: ALLOWANCE FOR LOAN LOSSES |
A summary of the changes in the allowance for loan losses for the years ended December 31, 2008, 2007 and 2006 is show below (in thousands of dollars):
| | | 2008 | | | 2007 | | | 2006 | |
| Balance at beginning of year | | $ | 3,577 | | | $ | 3,482 | | | $ | 3,129 | |
| Provision charged to operating expenses | | | 909 | | | | 837 | | | | 682 | |
| Loan recoveries | | | 131 | | | | 339 | | | | 250 | |
| Loans charged off | | | (950 | ) | | | (1,081 | ) | | | (579 | ) |
| Balance at end of year | | $ | 3,667 | | | $ | 3,577 | | | $ | 3,482 | |
| | | | | | | | | | | | | |
| Allowance for Loan Losses as percentage of outstanding loans at year end | | | 1.13 | % | | | 1.15 | % | | | 1.19 | % |
| NOTE EIGHT: BANK PREMISES AND EQUIPMENT |
Bank premises and equipment as of December 31, 2008 and 2007 are summarized as follows (in thousands of dollars):
| | | 2008 | | | 2007 | |
| Land | | $ | 1,528 | | | $ | 1,549 | |
| Buildings and improvements | | | 8,288 | | | | 7,963 | |
| Furniture and equipment | | | 4,915 | | | | 4,789 | |
| | | | | | | | | |
| Total Cost | | | 14,731 | | | | 14,301 | |
| Less accumulated depreciation | | | (6,700 | ) | | | (6,197 | ) |
| | | | | | | | | |
| Net Book Value | | $ | 8,031 | | | $ | 8,104 | |
Provisions for depreciation charged to operations during 2008, 2007 and 2006 were as follows (in thousands of dollars):
Year | | Provision for Depreciation | |
| 2008 | | $ | 702 | |
| 2007 | | | 704 | |
| 2006 | | | 691 | |
| NOTE NINE: RESTRICTIONS ON DIVIDENDS OF SUBSIDIARY BANKS |
The principal source of funds of Highlands Bankshares, Inc. is dividends paid by its subsidiary Banks. The various regulatory authorities impose restrictions on dividends paid by a state bank. A state bank cannot pay dividends (without the consent of state banking authorities) in excess of the total net profits (net income less dividends paid) of the current year to date and the combined retained profits of the previous two years. As of January 1, 2008, the Banks could pay dividends to Highlands Bankshares, Inc. of approximately $3,238,000 without permission of the regulatory authorities.
At December 31, 2008, the scheduled maturities of time deposits were as follows (in thousands of dollars):
| Year | | Amount Maturing | |
| 2009 | | $ | 134,394 | |
| 2010 | | | 29,974 | |
| 2011 | | | 19,181 | |
| 2012 | | | 8,196 | |
| 2013 | | | 6,328 | |
| Total | | $ | 198,073 | |
Interest expense on time deposits of $100,000 and over aggregated $2,678,000, $3,078,000 and $2,042,000 for 2008, 2007 and 2006, respectively.
The aggregate amount of demand deposit overdrafts reclassified as loan balances were $175,000 and $285,000 at December 31, 2008 and 2007, respectively.
| NOTE ELEVEN: CONCENTRATIONS |
The Banks grant commercial, residential real estate and consumer loans to customers located primarily in the eastern portion of the State of West Virginia. Although the Banks have a diversified loan portfolio, a substantial portion of the debtors' ability to honor their contracts is dependent upon the agribusiness, mining, trucking and logging sectors. Collateral required by the Banks is determined on an individual basis depending on the purpose of the loan and the financial condition of the borrower. The ultimate collectibility of the loan portfolios is susceptible to changes in local economic conditions. Of the $325,754,000 and $310,199,000 loans held by the Company at December 31, 2008 and 2007, respectively, $261,289,000 and $240,208,000 are secured by real estate.
The Company’s subsidiaries had cash deposited in and federal funds sold to other commercial banks totaling $764,000 and $16,599,000 at December 31, 2008 and 2007, respectively. Deposits with other correspondent banks are generally unsecured and have limited insurance under current banking insurance regulations, which management considers to be a normal business risk.
| NOTE TWELVE: TRANSACTIONS WITH RELATED PARTIES |
During the year, officers and directors (and companies controlled by them) of the Company and subsidiary Banks were customers of and had transactions with the subsidiary Banks in the normal course of business. These transactions were made on substantially the same terms as those prevailing for other customers and did not involve any abnormal risk.. The table below summarizes changes to balances of loans and to unused commitments to related parties during the years ended December 31, 2008 and 2007 (in thousands of dollars):
| | | 2008 | | | 2007 | |
| Loans to related parties, beginning of year | | $ | 5,244 | | | $ | 5,143 | |
| New loans | | | 3,989 | | | | 719 | |
| Repayments | | | (841 | ) | | | (617 | ) |
| Loans to related parties, end of year | | $ | 8,392 | | | $ | 5,244 | |
At December 31, 2008, deposits of related parties including directors, executive officers, and their related interests of Highlands Bankshares, Inc. and subsidiaries approximated $7,474,000, and at December 31, 2007, deposits of related parties including directors, executive officers, and their related interests of Highlands Bankshares, Inc. and subsidiaries approximated $7,465,000.
| NOTE THIRTEEN: DEBT INSTRUMENTS |
The Company has borrowed money from the Federal Home Loan Bank of Pittsburgh (FHLB). This debt consists of both borrowings with terms of maturities of six month or greater and also certain debts with maturities of thirty days or less.
The borrowings with long term maturities may have either single payment maturities or amortize. The various borrowings mature from 2009 to 2020. The interest rates on the various borrowings at December 31, 2008 range from 3.94% to 5.96%. The weighted average interest rate on the borrowings at December 31, 2008 was 4.62%. Repayments of long-term debt are due monthly, quarterly or in a single payment at maturity. The maturities of long-term debt as of December 31, 2008 are as follows (in thousands of dollars):
| Year | | Balance | |
| 2009 | | $ | 451 | |
| 2010 | | | 1,473 | |
| 2011 | | | 1,255 | |
| 2012 | | | 5,695 | |
| 2013 | | | 289 | |
| Thereafter | | | 2,154 | |
| Total | | $ | 11,317 | |
In addition to utilization of the FHLB for borrowings of long term debt, the Company also can utilize the FHLB for overnight and other short term borrowings. At December 31, 2008, the Company had balances of $4,800,000 in overnight and other short term borrowings. All of this short term debt was through the FHLB. The Company has total borrowing capacity from the FHLB of $171,211,000. The Banks have pledged certain investments and mortgage loans as collateral on the FHLB borrowings in the approximate amount of $174,173,000 at December 31, 2008.
The subsidiary Banks also have short term borrowing capacity from each of their respective correspondent banks. As of December 31, 2008 the Company has total borrowing capacity from its correspondent banks of $31,200,000. The interest rates on these lines are variable and are subject to change daily based on current market conditions.
| NOTE FOURTEEN: INCOME TAX EXPENSE |
Highlands files an income tax return in the U.S. federal jurisdiction and an income tax return in the State of West Virginia. With few exceptions, the Company is no longer subject to U.S. federal, state or local income tax examinations by tax authorities for years before 2005.
The Company adopted the provisions of FASB Interpretations No. 48, Accounting for Uncertainty in Income Taxes, on January 1, 2007, with no impact on the financial statements.
Included in the balance sheet at December 31, 2008 are tax positions related to loan charge offs for which the ultimate deductibility is highly certain but for which there is uncertainty about the timing of such deductibility. Because of the impact of deferred tax accounting, other than interest and penalties, the disallowance of the shorter deductibility period would not affect the annual effective tax rate but would accelerate the payment of cash to the taxing authority to an earlier period.
The components of income tax expense for the years ended December 31, 2008, 2007 and 2006 are summarized in the table on the following page (in thousands of dollars):
| | | 2008 | | | 2007 | | | 2006 | |
| Current Expense | | | | | | | | | |
| Federal | | $ | 2,433 | | | $ | 2,400 | | | $ | 2,154 | |
| State | | | 370 | | | | 330 | | | | 352 | |
| Total Current Expense | | | 2,803 | | | | 2,730 | | | | 2,506 | |
| | | | | | | | | | | | | |
| Deferred Expense (Benefit) | | | | | | | | | | | | |
| Federal | | | (60 | ) | | | (121 | ) | | | (107 | ) |
| State | | | (5 | ) | | | (10 | ) | | | (8 | ) |
| Total Current Expense (Benefit) | | | (65 | ) | | | (131 | ) | | | (115 | ) |
| | | | | | | | | | | | | |
| Income Tax Expense | | $ | 2,738 | | | $ | 2,599 | | | $ | 2,391 | |
The deferred tax effects of temporary differences for the years ended December 31, 2008, 2007 and 2006 are as follows (in thousands of dollars):
| | | 2008 | | | 2007 | | | 2006 | |
| Provision for loan losses | | $ | (61 | ) | | $ | (18 | ) | | $ | (140 | ) |
| Depreciation | | | 13 | | | | (45 | ) | | | (45 | ) |
| Deferred compensation | | | 18 | | | | (59 | ) | | | (39 | ) |
| Loss carry forward | | | 0 | | | | 0 | | | | 71 | |
| Miscellaneous | | | (35 | ) | | | (9 | ) | | | 38 | |
| Net increase in deferred income tax benefit | | $ | (65 | ) | | $ | (131 | ) | | $ | (115 | ) |
The net deferred tax assets arising from temporary differences as of December 31, 2008 and 2007 are shown in the table on the following page (in thousands of dollars):
| | | 2008 | | | 2007 | |
| Deferred Tax Assets | | | | | | |
| Provision for loan losses | | $ | 1,086 | | | $ | 1,022 | |
| Insurance commissions | | | 35 | | | | 41 | |
| Deferred compensation | | | 932 | | | | 870 | |
| Pension obligation | | | 677 | | | | 175 | |
| Other | | | 0 | | | | 16 | |
| Total Assets | | | 2,730 | | | | 2,124 | |
| | | | | | | | | |
| Deferred Tax Liabilities | | | | | | | | |
| Accretion income | | | 9 | | | | 70 | |
| Unrealized gain on securities available for sale | | | 131 | | | | 101 | |
| Depreciation | | | 362 | | | | 352 | |
| Other | | | 6 | | | | 0 | |
| Total Liabilities | | | 508 | | | | 523 | |
| | | | | | | | | |
| Net Deferred Tax Asset | | $ | 2,222 | | | $ | 1,601 | |
The following table summarizes the differences between income tax expense and the amount computed by applying the federal statutory rate for the three years ended December 31, 2008, 2007 and 2006 (in thousands of dollars):
| | | 2008 | | | 2007 | | | 2006 | |
| Amounts at federal statutory rates | | $ | 2,621 | | | $ | 2,466 | | | $ | 2,348 | |
| | | | | | | | | | | | | |
| Additions (reductions) resulting from: | | | | | | | | | | | | |
| Tax exempt income | | | (64 | ) | | | (63 | ) | | | (50 | ) |
| Partially exempt income | | | (34 | ) | | | (25 | ) | | | (40 | ) |
| State income taxes, net | | | 233 | | | | 222 | | | | 178 | |
| Income from life insurance contracts | | | (87 | ) | | | (143 | ) | | | (91 | ) |
| Non deductible income related to branch acquisitions | | | 66 | | | | 68 | | | | 3 | |
| Other | | | 3 | | | | (16 | ) | | | (22 | ) |
| | | | | | | | | | | | | |
| Income tax expense | | $ | 2,738 | | | $ | 2,599 | | | $ | 2,391 | |
| NOTE FIFTEEN: EMPLOYEE BENEFITS |
In addition to an Employee Stock Ownership Plan (ESOP), which provides stock ownership to all employees of the Company, the Company’s two subsidiary Banks, The Grant County Bank (Grant) and Capon Valley Bank (Capon) have separate retirement and profit sharing plans which cover substantially all full time employees at each Bank. A summary of the employee benefits provided by each Bank is provided below. The Company’s ESOP plan provides stock ownership to all employees of the Company. The Plan provides total vesting upon the attainment of seven years of service. Contributions to the plan are made at the discretion of the board of directors and are allocated based on the compensation of each employee relative to total compensation paid by the Company. All shares held by the Plan are considered outstanding in the computation of earnings per share. Shares of Company stock, when distributed, will have restrictions on transferability. Certain executives of both Grant and Capon have post retirement benefits related to the Banks’ investment in life insurance policies (see Note Twenty). Expenses related to all retirement benefit plans charged to operations totaled $866,000 in 2008, $762,000 in 2007 and $832,000 in 2006.
Capon Valley Bank
Capon has a defined contribution pension plan with 401(k) features that is funded with discretionary contributions. Capon matches on a limited basis the contributions of the employees. Investment of employee balances is done through the direction of each employee. Employer contributions are vested over a six-year period.
The Grant County Bank
Grant is a member of the West Virginia Bankers’ Association Retirement Plan (the “Plan”). This Plan is a defined benefit plan with benefits under the Plan based on compensation and years of service with full vesting after seven years of service. Prior to 2002, the Plan’s assets were in excess of the projected benefit obligations and thus Grant was not required to make contributions to the Plan. Since 2004, Grant has been required to make contributions and has an expected contribution in 2009 of $589,570. At December 31, 2008, Grant has recognized liabilities of $1,842,000 relating to unfunded pension liabilities. As a result of the Plan’s inability to meet expected returns in recent years, a portion of this liability is reflected as a decrease in other comprehensive income of $1,455,000 (net of $854,000 tax benefit).
The following table provides a reconciliation of the changes in the Plan’s obligations and fair value of assets as of December 31, 2008 and 2007 using a measurement date of December 31, 2008 and November 1, 2007 respectively (in thousands of dollars):
| | | 2008 | | | 2007 | |
| Change in Benefit Obligation | | | | | | |
| Benefit obligation, beginning | | $ | 3,859 | | | $ | 3,527 | |
| Service Cost | | | 179 | | | | 131 | |
| Interest Cost | | | 283 | | | | 192 | |
| Actuarial Loss (Gain) | | | 260 | | | | (52 | ) |
| Benefits Paid | | | (89 | ) | | | (54 | ) |
| Benefit obligation, ending | | $ | 4,492 | | | $ | 3,859 | |
| | | | | | | | | |
| Accumulated Benefit Obligation | | $ | 3,858 | | | $ | 3,310 | |
| | | | | | | | | |
| Change in Plan Assets | | | | | | | | |
| Fair value of assets, beginning | | $ | 3,335 | | | $ | 2,861 | |
| Actual return on assets, net of administrative expenses | | | (1,042 | ) | | | 433 | |
| Employer contributions | | | 446 | | | | 139 | |
| Benefits paid | | | (89 | ) | | | (99 | ) |
| Fair value of assets, ending | | $ | 2,650 | | | $ | 3,334 | |
| | | | | | | | | |
| Funded Status | | | | | | | | |
| Fair value of plan assets | | $ | 2,650 | | | $ | 3,334 | |
| Projected benefit obligation | | | 4,492 | | | | 3,859 | |
| Funded status | | | (1,842 | ) | | | (478 | ) |
| | | | | | | | | |
| Liabilities Recognized in the Statement of Financial Position | | $ | (1,842 | ) | | $ | (478 | ) |
| | | | | | | | | |
| Amounts Recognized in Accumulated Other Comprehensive Income | | | | | | | | |
| Prior Service Cost | | $ | 0 | | | $ | 3 | |
| Net (Gain)/Loss | | | 2,310 | | | | 720 | |
| Total | | $ | 2,310 | | | $ | 723 | |
The following table provides the components of the net periodic pension expense for the Plan for the years ended December 31, 2008, 2007 and 2006 (in thousands of dollars):
| | | 2008 | | | 2007 | | | 2006 | |
| Service cost | | $ | 154 | | | $ | 139 | | | $ | 131 | |
| Interest cost | | | 243 | | | | 221 | | | | 192 | |
| Expected return on plan assets | | | (294 | ) | | | (235 | ) | | | (212 | ) |
| Recognized net actuarial loss | | | 47 | | | | 66 | | | | 61 | |
| Amortization of prior service cost | | | 3 | | | | 11 | | | | 11 | |
| Adjustment due to change in measurement date | | | 25 | | | | 0 | | | | 0 | |
| Net Periodic Pension Expense | | $ | 178 | | | $ | 202 | | | $ | 183 | |
The expected pension expense for 2008 is $210,000.
The table below summarizes the benefits expected to be paid to participants in the plan (in thousands of dollars):
Year | | Expected Benefit Payments | |
| 2009 | | $ | 156 | |
| 2010 | | | 163 | |
| 2011 | | | 186 | |
| 2012 | | | 202 | |
| 2013 | | | 243 | |
| Years 2014 – 2018 | | | 1,635 | |
The weighted average assumption used in the measurement of Grant’s benefit obligation and net periodic pension expense is as follows:
| | | 2008 | | 2007 | | 2006 |
| Discount rate | | | 6.25 | % | | | 6.00 | % | | | 5.75 | % |
| Expected return on plan assets | | | 8.00 | % | | | 8.50 | % | | | 8.50 | % |
| Rate of compensation increase | | | 3.00 | % | | | 3.00 | % | | | 3.00 | % |
The plan sponsor estimates the expected long-term rate of return on assets in consultation with their advisors and the plan actuary. This rate is intended to reflect the average rate of earnings expected to be earned on the funds invested or to be invested to provide plan benefits. Historical performance is reviewed, especially with respect to real rate of return (net of inflation) for the major asset classes held or anticipated to be held by the trust. Undue weight is not given to recent experience, which may not continue over the measurement period, with higher significance placed on current forecasts of future long-term economic conditions.
The following table provides the pension plan’s asset allocation as of December 31, 2008 and 2007:
| | | 2008 | | 2007 |
| Equity Securities | | | 64 | % | | | 67 | % |
| Debt Securities | | | 30 | % | | | 28 | % |
| Other | | | 6 | % | | | 5 | % |
The trust fund is sufficiently diversified to maintain a reasonable level of risk without imprudently sacrificing return. The targeted asset allocation and allowable range of allocation is set forth in the table below:
| | Target Allocation | Allowable Allocation Range |
| Equity Securities | 70% | 40%-80% |
| Debt Securities | 25% | 20%-40% |
| Other | 5% | 3%-10% |
The Investment Manager selects investment fund managers with demonstrated experience and expertise, and funds with demonstrated historical performance, for the implementation of the Plan’s investment strategy. The Investment Manager will consider both actively and passively managed investment strategies and will allocate funds across the asset classes to develop an efficient investment structure.
The Grant County Bank also maintains a profit sharing plan covering substantially all employees to which contributions are made at the discretion of the board of directors. Portions of employer contributions to this plan are, at individual employees’ discretion, available to employees as immediate cash payment while portions are allocated for deferred payment to the employee. The portions of the plan contribution by the employer which are allocated for deferred payment to the employee are vested over a five year period.
| NOTE SIXTEEN: COMMITMENTS AND GUARANTEES |
The Banks make commitments to extend credit in the normal course of business and issue standby letters of credit to meet the financing needs of their customers. The amount of the commitments represents the Banks' exposure to credit loss that is not included in the balance sheet.
The Banks use the same credit policies in making commitments and issuing letters of credit as used for the loans reflected in the balance sheet. Commitments to extend credit are agreements to lend to a customer as long as there is no violation of any condition established in the contract. Commitments generally have fixed expiration dates or other termination clauses and may require payment of a fee. Since many of the commitments are expected to expire without being drawn upon, the total commitment amounts do not necessarily represent future cash requirements. The Banks evaluate each customer's creditworthiness on a case-by-case basis. The amount of collateral obtained, if deemed necessary by the Banks upon the extension of credit, is based on management's credit evaluation of the borrower. Collateral held varies but may include accounts receivable, inventory, property, plant and equipment.
As of December 31, 2008 and 2007, the Banks had outstanding the following commitments (in thousands of dollars):
| | | 2008 | | | 2007 | |
| Commitments to extend credit | | $ | 24,204 | | | $ | 20,536 | |
| Standby letter of credit | | | 836 | | | | 709 | |
| NOTE SEVENTEEN: CHANGES IN OTHER COMPREHENSIVE INCOME |
The components of changes in other comprehensive income and related tax effects for the years ended December 31, 2008, 2007 and 2006 are as follows (in thousands of dollars):
| | | 2008 | | | 2007 | | | 2006 | |
| Balance January 1 | | $ | (285 | ) | | $ | (586 | ) | | $ | (505 | ) |
| | | | | | | | | | | | | |
| Unrealized holding gains (losses) on available for sale securities net of income taxes of $31,000 for 2008, $101,000 for 2007 and $50,000 for 2006 | | | 52 | | | | 173 | | | | 86 | |
| Accrued pension obligation net of income taxes of $587,000 for 2008, $(76,000) for 2007 and $97,000 for 2006 | | | (999 | ) | | | 128 | | | | (167 | ) |
| Net change for the year | | | (947 | ) | | | 301 | | | | (81 | ) |
| | | | | | | | | | | | | |
| Balance December 31 | | $ | (1,232 | ) | | $ | (285 | ) | | $ | (586 | ) |
| NOTE EIGHTEEN: ADJUSTMENT TO RETAINED EARNINGS FOR CHANGE IN ACCOUNTING PRINCIPLE |
In 2006, the FASB issued EITF 06-04 and EITF 06-10. These EITF pronouncements require that companies which own life insurance policies insuring employees and for which the employees receive a portion of the death benefits of the policies (commonly referred to as “split dollar” policies) and for which these death benefits to the employee continue post retirement record a liability for the present value of the cost of these post retirement death benefits. These EITF pronouncements became effective for Highlands Bankshares on January 1, 2008.
These EITF pronouncements provided an option for affected companies to record the resulting liability as a cumulative effect adjustment to retained earnings at the beginning of the period in which recorded or to record through retrospective application to prior periods. Highlands Bankshares opted to record the liability as a cumulative effect adjustment to prior period retained earnings and as such recorded a liability and corresponding reduction of prior period retained earnings of $348,000. There is no corresponding deferred tax consequence relating to this liability. The recording of the cumulative effect adjustment to retained earnings is reflected in the December 31, 2008 balance of retained earnings and is shown as an adjustment to retained earnings in the Consolidated Statement of Changes in Stockholders’ Equity.
| NOTE NINETEEN: FAIR VALUE MEASUREMENTS |
SFAS No. 157, Fair Value Measurements, defines fair value, establishes a framework for measuring fair value, establishes a three-level valuation hierarchy for disclosure of fair value measurement and enhances disclosure requirements for fair value measurements. The valuation hierarchy is based upon the transparency of inputs to the valuation of an asset or liability as of the measurement date. The three levels are defined as follow:
| | · | Level One: Inputs to the valuation methodology are quoted prices (unadjusted) for identical assets or liabilities in active markets. |
| | · | Level Two: Inputs to the valuation methodology include quoted prices for similar assets and liabilities in active markets, and inputs that are observable for the asset or liability, either directly or indirectly, for substantially the full term of the financial instrument. |
| | · | Level Three: Inputs to the valuation methodology are unobservable and significant to the fair value measurement. |
Following is a description of the valuation methodologies used for instruments measured at fair value on the Company’s balance sheet, as well as the general classification of such instruments pursuant to the valuation hierarchy:
Securities
Where quoted prices are available in an active market, securities are classified within level 1 of the valuation hierarchy. Level 1 securities would include highly liquid government bonds, mortgage products and exchange traded equities. If quoted market prices are not available, then fair values are estimated by using pricing models, quoted prices of securities with similar characteristics, or discounted cash flow. Level 2 securities would include U.S. agency securities, mortgage-backed agency securities, obligations of states and political subdivisions and certain corporate, asset backed and other securities. In certain cases where there is limited activity or less transparency around inputs to the valuation, securities are classified within level 3 of the valuation hierarchy. Currently, all of the Company’s securities are considered to be Level 2 securities.
Impaired Loans
SFAS No. 157 applies to loans measured for impairment using the practical expedients permitted by SFAS No. 114, Accounting by Creditors for Impairment of a Loan, including impaired loans measured at an observable market price (if available), or at the fair value of the loan’s collateral (if the loan is collateral dependent). Fair value of the loan’s collateral, when the loan is dependent on collateral, is determined by appraisals or independent valuation which is then adjusted for the cost related to liquidation of the collateral. At December 31, 2008, the Company had identified $3,841,000 in impaired loans (see Note Five).
Other Real Estate Owned
Certain assets such as other real estate owned (OREO) are measured at fair value less cost to sell. We believe that the fair value component in its valuation follows the provisions of SFAS No. 157.
The Company, at December 31, 2008, had no liabilities subject to fair value reporting requirements. The table below summarizes assets at December 31, 2008 measured at fair value on a recurring basis (in thousands of dollars):
| | | Level 1 | | | Level 2 | | | Level 3 | | | Total Fair Value Measurements | |
| Securities available for sale | | $ | 0 | | | $ | 21,692 | | | $ | 0 | | | $ | 21,692 | |
| Impaired Loans | | | 0 | | | | 3,841 | | | | 0 | | | | 3,841 | |
| Total | | $ | 0 | | | $ | 25,533 | | | $ | 0 | | | $ | 25,533 | |
In February 2008, the FASB issued Staff Position No. 157-2 (“FSP 157-2”) which delayed the effective date of SFAS 157 for certain nonfinancial assets and nonfinancial liabilities except for those items that are recognized or disclosed at fair value in the financial statements on a recurring basis. FSP 157-2 defers the effective date of SFAS 157 for such nonfinancial assets and nonfinancial liabilities to fiscal years beginning after November 15, 2008, and interim periods within those fiscal years. Thus, the Corporation has only partially applied SFAS 157. Those items affected by FSP 157-2 include other real estate owned (“OREO”), goodwill and core deposit intangibles.
The information above discusses financial instruments carried on the Company’s balance sheet at fair value. Other financial instruments on the Company’s balance sheet, while not carried at fair value, do have market values which may differ from the carrying value. SFAS 107, Disclosures about Fair Value of Financial Instrument, requires disclosure relating to these market values. The following information shows the carrying values and estimated fair values of financial instruments and discusses the methods and assumptions used in determining these fair values.
The fair value of the Company's assets and liabilities is influenced heavily by market conditions. Fair value applies to both assets and liabilities, either on or off the balance sheet. Fair value is defined as the amount at which a financial instrument could be exchanged in a current transaction between willing parties, other than in a forced or liquidation sale.
The methods and assumptions detailed below were used to estimate the fair value of each class of financial instruments for which it is practicable to estimate that value are discussed following:
Cash, Due from Banks and Money Market Investments
The carrying amount of cash, due from bank balances, interest bearing deposits and federal funds sold is a reasonable estimate of fair value.
Securities
Fair values of securities are based on quoted market prices or dealer quotes. If a quoted market price is not available, fair value is estimated using quoted market prices for similar securities.
Restricted Investments
The carrying amount of restricted investments is a reasonable estimate of fair value.
Loans
The fair value of loans is estimated by discounting the future cash flows using the current rates at which similar loans would be made to borrowers with similar credit ratings and for the same remaining maturities, taking into consideration the credit risk in various loan categories.
Deposits
The fair value of demand, interest checking, regular savings and money market deposits is the amount payable on demand at the reporting date. The fair value of fixed maturity certificates of deposit is estimated using the rates currently offered for deposits of similar remaining maturities.
Long Term Debt
The fair value of fixed rate loans is estimated using the rates currently offered by the Federal Home Loan Bank for indebtedness with similar maturities.
Short Term Debt
The fair value of short-term variable rate debt is deemed to be equal to the carrying value.
Interest Payable and Receivable
The carrying value of amounts of interest receivable and payable is a reasonable estimate of fair value.
Life Insurance
The carrying amount of life insurance contracts is assumed to be a reasonable fair value. Life insurance contracts are carried on the balance sheet at their redemption value as of December 31, 2008. This redemption value is based on existing market conditions and therefore represents the fair value of the contract.
Off-Balance-Sheet Items
The carrying amount and estimated fair value of off-balance-sheet items were not material at December 31, 2008 or 2007.
The carrying amount and estimated fair values of financial instruments as of December 31, 2008 and 2007 are shown in the table below (in thousands of dollars):
| | | 2008 | | | 2007 | |
| | | Carrying Amount | | | Estimated Fair Value | | | Carrying Amount | | | Estimated Fair Value | |
| Financial Assets: | | | | | | | | | | | | |
| Cash and due from banks | | $ | 7,589 | | | $ | 7,589 | | | $ | 7,935 | | | $ | 7,935 | |
| Interest bearing deposits | | | 502 | | | | 502 | | | | 1,853 | | | | 1,853 | |
| Federal funds sold | | | 160 | | | | 160 | | | | 14,246 | | | | 14,246 | |
| Securities available for sale | | | 21,692 | | | | 21,692 | | | | 26,090 | | | | 26,090 | |
| Restricted investments | | | 2,177 | | | | 2,177 | | | | 1,498 | | | | 1,498 | |
| Loans, net | | | 322,087 | | | | 323,788 | | | | 310,199 | | | | 311,217 | |
| Interest receivable | | | 2,164 | | | | 2,164 | | | | 2,273 | | | | 2,273 | |
| Life insurance contracts | | | 6,499 | | | | 6,499 | | | | 6,300 | | | | 6,300 | |
| | | | | | | | | | | | | | | | | |
| Financial Liabilities: | | | | | | | | | | | | | | | | |
| Demand and savings deposits | | | 118,214 | | | | 118,214 | | | | 122,341 | | | | 122,341 | |
| Time deposits | | | 198,073 | | | | 200,970 | | | | 201,397 | | | | 203,414 | |
| Overnight and other short term debt instruments | | | 4,800 | | | | 4,800 | | | | | | | | | |
| Long term debt instruments | | | 11,317 | | | | 11,930 | | | | 11,819 | | | | 11,921 | |
| Interest payable | | | 848 | | | | 848 | | | | 1,132 | | | | 1,132 | |
| NOTE TWENTY: INVESTMENTS IN LIFE INSURANCE CONTRACTS |
Investments in insurance contracts consist of single premium insurance contracts, which have the purpose of providing a rate of return to the Company and of providing life insurance and retirement benefits to certain executives.
During the third quarter of 2008, the Company received payment in settlement relating to one of these policies. This payment related to the death of an insured and resulted in a one-time, non-recurring gain of $30,000.
A summary of the changes to the balance of investments in insurance contracts for the twelve month periods ended December 31, 2008 and December 31, 2007 are shown in the table below (in thousands of dollars):
| | | 2008 | | | 2007 | |
| Balance, beginning of period | | $ | 6,300 | | | $ | 6,066 | |
| Increases in value of policies | | | 252 | | | | 234 | |
| Settlement payout | | | (53 | ) | | | 0 | |
| Balance, end of period | | $ | 6,499 | | | $ | 6,300 | |
| NOTE TWENTY ONE: REGULATORY MATTERS |
The Company is subject to various regulatory capital requirements administered by the federal banking agencies. Failure to meet minimum capital requirements can initiate certain mandatory - and possibly additional discretionary - actions by regulators that, if undertaken, could have a direct material effect on the Company's financial statements. Under capital adequacy guidelines and the regulatory framework for prompt corrective action, the Company must meet specific capital guidelines that involve quantitative measures of the Company's assets, liabilities, and certain off-balance-sheet items as calculated under regulatory accounting practices. The Company's capital amounts and classification are also subject to qualitative judgments by the regulators about components, risk weightings and other factors.
Quantitative measures established by regulation to ensure capital adequacy require the Company to maintain minimum amounts and ratios (set forth in the table below) of total and Tier I capital (as defined in the regulations) to risk-weighted assets (as defined), and of Tier I capital (as defined) to average assets (as defined). The Company meets all capital adequacy requirements to which it is subject and as of the most recent examination, the Company was classified as well capitalized.
To be categorized as well capitalized the Company must maintain minimum total risk-based, Tier I risk-based, and Tier I leverage ratios as set forth in the table. There are no conditions or events that management believes have changed the Company's category from a well-capitalized status.
Capital ratios and amounts are applicable both at the individual Bank level and on a consolidated basis. At December 31, 2008 both subsidiary Banks had capital levels in excess of minimum requirements.
In addition, HBI Life Insurance Company is subject to certain capital requirements and dividend restrictions. At present, HBI Life is well within any capital limitations and no conditions or events have occurred to change this capital status, nor does management expect any such occurrence in the foreseeable future.
The actual and required capital amounts and ratios of the Company and its subsidiary banks at December 31, 2008 are presented in the following table (in thousands of dollars):
| December 31, 2008 | |
| | | | | | | | | Regulatory Requirements | |
| | | Actual | | | Adequately Capitalized | | | Well Capitalized | |
| | | Amount | | | Percentage | | | Amount | | | Percentage | | | Amount | | | Percentage | |
| | | | | | | | | | | | | | | | | | | |
| Total Risk Based Capital Ratio | | | | | | | | | | | | | | | | |
| Highlands Bankshares | | $ | 41,440 | | | | 14.20 | % | | $ | 23,342 | | | | 8.00 | % | | | | | | |
| Capon Valley Bank | | | 14,588 | | | | 12.77 | % | | | 9,136 | | | | 8.00 | % | | $ | 11,421 | | | | 10.00 | % |
| The Grant County Bank | | | 24,799 | | | | 13.99 | % | | | 14,180 | | | | 8.00 | % | | | 17,725 | | | | 10.00 | % |
| | | | | | | | | | | | | | | | | | | | | | | | | |
| Tier 1 Leverage Ratio | | | | | | | | | | | | | | | | | | | | | |
| Highlands Bankshares | | | 37,882 | | | | 10.18 | % | | | 14,891 | | | | 4.00 | % | | | | | | | | |
| Capon Valley Bank | | | 13,159 | | | | 9.11 | % | | | 5,775 | | | | 4.00 | % | | | 7,219 | | | | 5.00 | % |
| The Grant County Bank | | | 22,663 | | | | 10.00 | % | | | 9,066 | | | | 4.00 | % | | | 11,333 | | | | 5.00 | % |
| | | | | | | | | | | | | | | | | | | | | | | | | |
| Tier 1 Risk Based Capital Ratio | | | | | | | | | | | | | | | | | | | | | |
| Highlands Bankshares | | | 37,882 | | | | 12.98 | % | | | 11,671 | | | | 4.00 | % | | | | | | | | |
| Capon Valley Bank | | | 13,159 | | | | 11.52 | % | | | 4,568 | | | | 4.00 | % | | | 6,852 | | | | 6.00 | % |
| The Grant County Bank | | | 22,663 | | | | 12.79 | % | | | 7,090 | | | | 4.00 | % | | | 10,635 | | | | 6.00 | % |
The actual and required capital amounts and ratios of the Company and its subsidiary banks at December 31, 2007 is presented in the following table (in thousands of dollars):
| December 31, 2007 | |
| | | | | | | | | Regulatory Requirements | |
| | | Actual | | | Adequately Capitalized | | | Well Capitalized | |
| | | Amount | | | Percentage | | | Amount | | | Percentage | | | Amount | | | Percentage | |
| | | | | | | | | | | | | | | | | | | |
| Total Risk Based Capital Ratio | | | | | | | | | | | | | | | | |
| Highlands Bankshares | | $ | 41,329 | | | | 14.53 | % | | $ | 22,754 | | | | 8.00 | % | | | | | | |
| Capon Valley Bank | | | 15,334 | | | | 14.78 | % | | | 8,299 | | | | 8.00 | % | | $ | 10,374 | | | | 10.00 | % |
| The Grant County Bank | | | 23,877 | | | | 13.23 | % | | | 14,437 | | | | 8.00 | % | | | 18,047 | | | | 10.00 | % |
| | | | | | | | | | | | | | | | | | | | | | | | | |
| Tier 1 Leverage Ratio | | | | | | | | | | | | | | | | | | | | | |
| Highlands Bankshares | | | 37,773 | | | | 9.95 | % | | | 15,185 | | | | 4.00 | % | | | | | | | | |
| Capon Valley Bank | | | 14,035 | | | | 10.00 | % | | | 5,611 | | | | 4.00 | % | | | 7,014 | | | | 5.00 | % |
| The Grant County Bank | | | 21,816 | | | | 9.09 | % | | | 9,598 | | | | 4.00 | % | | | 11,997 | | | | 5.00 | % |
| | | | | | | | | | | | | | | | | | | | | | | | | |
| Tier 1 Risk Based Capital Ratio | | | | | | | | | | | | | | | | | | | | | |
| Highlands Bankshares | | | 37,773 | | | | 13.28 | % | | | 11,377 | | | | 4.00 | % | | | | | | | | |
| Capon Valley Bank | | | 14,035 | | | | 13.53 | % | | | 4,150 | | | | 4.00 | % | | | 6,225 | | | | 6.00 | % |
| The Grant County Bank | | | 21,816 | | | | 12.09 | % | | | 7,219 | | | | 4.00 | % | | | 10,828 | | | | 6.00 | % |
| NOTE TWENTY TWO: INTANGIBLE ASSETS |
The Company’s balance sheet contains several components of intangible assets. At December 31, 2008, the total balance of intangible assets was comprised of Goodwill and Core Deposit Intangible Assets acquired as a result of the acquisition of other banks and also an intangible asset related to the purchased naming rights for a performing arts center located within the Company’s primary business area.
During the fourth quarter of 2007, The Grant County Bank entered into an agreement to contribute $250,000 toward the erection of a performing arts center located within the Company’s primary business area. In return, the bank has been granted naming rights for this performing arts center. During the second quarter of 2008, the performing arts center reached an agreement with another party for the same rights but at better terms and cancelled the contractual agreement with The Grant County Bank. The $250,000 paid to the performing arts center was subsequently returned during the third quarter of 2008. After the cancellation of the original contract, the performing arts center and The Grant County Bank reached another agreement whereby a contribution of $75,000 was made in return for naming rights to only a portion of the same arts center.
A summary of the changes in balances of intangible assets for the twelve month periods ended December 31, 2008, 2007 and 2006 is shown below (in thousands of dollars):
| | | 2008 | | | 2007 | | | 2006 | |
| Balance beginning of period | | $ | 3,106 | | | $ | 3,032 | | | $ | 3,208 | |
| Amortization of intangible assets | | | (182 | ) | | | (176 | ) | | | (176 | ) |
| Purchase of naming rights contract | | | 75 | | | | 250 | | | | 0 | |
| Cancellation of naming rights contract | | | (250 | ) | | | 0 | | | | 0 | |
| Balance end of period | | $ | 2,749 | | | $ | 3,106 | | | $ | 3,032 | |
The expected amortization of the intangible balances at December 31, 2008 for the next five years is summarized in the table below (in thousands of dollars):
| Year | | Expected Expense | |
| 2009 | | $ | 195 | |
| 2010 | | | 190 | |
| 2011 | | | 184 | |
| 2012 | | | 178 | |
| 2013 | | | 165 | |
| Total | | $ | 912 | |
| NOTE TWENTY THREE: SUBSEQUENT EVENTS |
On January 30, 2009, Capon Valley Bank, a subsidiary of Highlands Bankshares, Inc. purchased real estate and an existing building at 5511 Main St., Stephens City, VA. The building, with 3,600 square foot of capacity, was formerly occupied as a branch by another commercial bank. The total purchase price of the real estate and building was $1,075,000. Capon Valley Bank intends to, in the future, use this location as a full service branch of the bank, pending approval of applicable regulatory authorities.
| NOTE TWENTY FOUR: PARENT COMPANY FINANCIAL STATEMENTS |
| Balance Sheets | |
| (in thousands of dollars) | |
| | | December 31, | |
| | | 2008 | | | 2007 | |
| Assets | | | | | | |
| Cash | | $ | 182 | | | $ | 112 | |
| Investment in subsidiaries | | | 38,994 | | | | 40,142 | |
| Income taxes receivable | | | 261 | | | | 276 | |
| Other assets | | | 34 | | | | 63 | |
| Total Assets | | $ | 39,471 | | | $ | 40,593 | |
| | | | | | | | | |
| Liabilities | | | | | | | | |
| Accrued expenses | | $ | 72 | | | $ | 0 | |
| Other liabilities | | | 0 | | | | 0 | |
| Total Liabilities | | | 72 | | | | 0 | |
| | | | | | | | | |
| Stockholders’ Equity | | | | | | | | |
| Common stock, par value $5 per share, 3,000,000 shares authorized, 1,436,874 issued | | | 7,184 | | | | 7,184 | |
| Surplus | | | 1,662 | | | | 1,662 | |
| Treasury stock, at cost, 100,001 shares at December 31, 2008 | | | (3,372 | ) | | | 0 | |
| Retained earnings | | | 35,157 | | | | 32,032 | |
| Other accumulated comprehensive income | | | (1,232 | ) | | | (285 | ) |
| Total Stockholders’ Equity | | | 39,399 | | | | 40,593 | |
| | | | | | | | | |
| Total Liabilities and Stockholders’ Equity | | $ | 39,471 | | | $ | 40,593 | |
| Statements of Income and Retained Earnings | |
| (in thousands of dollars) | |
| | | 2008 | | | 2007 | | | 2006 | |
| Income | | | | | | | | | |
| Dividends from subsidiaries | | $ | 5,142 | | | $ | 1,637 | | | $ | 1,651 | |
| Management fees from subsidiaries | | | 212 | | | | 204 | | | | 240 | |
| Other income | | | 25 | | | | 0 | | | | 0 | |
| Total Income | | | 5,379 | | | | 1,841 | | | | 1,891 | |
| | | | | | | | | | | | | |
| Expenses | | | | | | | | | | | | |
| Salary and benefits expense | | | 361 | | | | 358 | | | | 302 | |
| Professional fees | | | 137 | | | | 175 | | | | 191 | |
| Directors fees | | | 79 | | | | 73 | | | | 74 | |
| Other expenses | | | 165 | | | | 131 | | | | 70 | |
| Total Expenses | | | 742 | | | | 737 | | | | 637 | |
| | | | | | | | | | | | | |
| Net income before income tax benefit and undistributed subsidiary net income | | | 4,637 | | | | 1,104 | | | | 1,254 | |
| | | | | | | | | | | | | |
| Income tax benefit | | | 198 | | | | 211 | | | | 162 | |
| | | | | | | | | | | | | |
| Income before undistributed subsidiary net income | | | 4,835 | | | | 1,315 | | | | 1,416 | |
| | | | | | | | | | | | | |
| Undistributed subsidiary net income | | | 135 | | | | 3,338 | | | | 3,099 | |
| | | | | | | | | | | | | |
| Net Income | | $ | 4,970 | | | $ | 4,653 | | | $ | 4,515 | |
| | | | | | | | | | | | | |
| Retained earnings, beginning of period | | $ | 32,032 | | | $ | 28,816 | | | $ | 25,651 | |
| Cumulative effect adjustment to retained earnings for change in accounting principle | | | (348 | ) | | | 0 | | | | 0 | |
| Dividends paid in cash | | | (1,497 | ) | | | (1,437 | ) | | | (1,350 | ) |
| Net income | | | 4,970 | | | | 4,653 | | | | 4,515 | |
| Retained earnings, end of period | | $ | 35,157 | | | $ | 32,032 | | | $ | 28,816 | |
| Statements of Cash Flows | |
| (in thousands of dollars) | |
| | | | | | | | | | |
| | | Years Ended December 31, | |
| | | 2008 | | | 2007 | | | 2006 | |
| Cash Flows From Operating Activities | | | | | | | | | |
| | | | | | | | | | |
| Net Income | | $ | 4,970 | | | $ | 4,653 | | | $ | 4,515 | |
| | | | | | | | | | | | | |
| Adjustments to net income | | | | | | | | | | | | |
| Undistributed subsidiary income | | | (135 | ) | | | (3,338 | ) | | | (3,099 | ) |
| Gain on sale of fixed assets | | | (25 | ) | | | 0 | | | | 0 | |
| Deferred tax benefit | | | (3 | ) | | | 0 | | | | 0 | |
| Depreciation and amortization | | | 0 | | | | 8 | | | | 7 | |
| Increase (decrease) in payables | | | 72 | | | | (176 | ) | | | 126 | |
| (Increase) decrease in receivables | | | 15 | | | | (271 | ) | | | 24 | |
| (Increase) decrease in other assets | | | 10 | | | | (36 | ) | | | (1 | ) |
| | | | | | | | | | | | | |
| Net Cash Provided by Operating Activities | | | 4,904 | | | | 840 | | | | 1,572 | |
| | | | | | | | | | | | | |
| Cash Flows From Investing Activities | | | | | | | | | | | | |
| | | | | | | | | | | | | |
| Net advances from (payments to) subsidiaries | | | (11 | ) | | | 523 | | | | (188 | ) |
| Proceeds from sale of fixed assets | | | 46 | | | | 0 | | | | 0 | |
| Purchase of fixed assets | | | (0 | ) | | | (1 | ) | | | (1 | ) |
| | | | | | | | | | | | | |
| Net Cash Provided by (used in) Investing Activities | | | 35 | | | | 522 | | | | (189 | ) |
| | | | | | | | | | | | | |
| Cash Flows From Financing Activities | | | | | | | | | | | | |
| | | | | | | | | | | | | |
| Purchase of treasury stock | | | (3,372 | ) | | | 0 | | | | 0 | |
| Dividends paid in cash | | | (1,497 | ) | | | (1,437 | ) | | | (1,350 | ) |
| | | | | | | | | | | | | |
| Net Cash Used in Financing Activities | | | (4,869 | ) | | | (1,437 | ) | | | (1,350 | ) |
| | | | | | | | | | | | | |
| Net Increase (Decrease) in Cash | | | 70 | | | | (75 | ) | | | 33 | |
| | | | | | | | | | | | | |
| Cash, beginning of year | | | 112 | | | | 187 | | | | 154 | |
| | | | | | | | | | | | | |
| Cash, end of year | | $ | 182 | | | $ | 112 | | | $ | 187 | |
| | | | | | | | | | | | | |
REPORT OF INDEPENDENT REGISTERED PUBLIC ACCOUNTING FIRM
To the Shareholders and Board of Directors of
Highlands Bankshares, Inc.
Petersburg, West Virginia
We have audited the accompanying consolidated balance sheets of Highlands Bankshares, Inc. and subsidiaries as of December 31, 2008 and 2007, and the related consolidated statements of income, stockholders' equity and cash flows for each of the years in the three-year period ended December 31, 2008. These consolidated financial statements are the responsibility of the Company's management. Our responsibility is to express an opinion on these consolidated financial statements based on our audits.
We conducted our audits in accordance with the standards of the Public Company Accounting Oversight Board (United States). Those standards require that we plan and perform the audit to obtain reasonable assurance about whether the consolidated financial statements are free of material misstatement. The Company is not required to have, nor were we engaged to perform, an audit of its internal control over financial reporting. Our audit included consideration of internal control over financial reporting as a basis for designing audit procedures that are appropriate in the circumstances, but not for the purpose of expressing an opinion on the effectiveness of the Company’s internal control over financial reporting. Accordingly, we express no such opinion. An audit also includes examining, on a test basis, evidence supporting the amounts and disclosures in the consolidated financial statements, assessing the accounting principles used and significant estimates made by management, as well as evaluating the overall financial statement presentation. We believe that our audits provide a reasonable basis for our opinion.
In our opinion, the consolidated financial statements referred to above present fairly, in all material respects, the financial position of Highlands Bankshares, Inc. and subsidiaries as of December 31, 2008 and 2007, and the results of their operations and their cash flows for each of the years in the three-year period ended December 31, 2008 in conformity with accounting principles generally accepted in the United States of America.
As discussed in Notes two and fifteen to the consolidated financial statements, Highlands Bankshares, Inc. changed its policy for accounting for its defined benefit pension plan in 2006 to conform with Statement of Financial Accounting Standards No. 158. As discussed in Notes Two and Eighteen to the consolidated financial statements, the Company changed its method of accounting for split-dollar post-retirement benefits in 2008 as required by the provisions of EITF 06-04.
| /s/ SMITH ELLIOTT KEARNS & COMPANY, LLC |
Chambersburg, Pennsylvania
March 23, 2009
MANAGEMENT’S REPORT ON INTERNAL CONTROLS
Highlands Bankshares, Inc. is responsible for the preparation, integrity, and fair presentation of the consolidated financial statements included in this annual report. The consolidated financial statements and notes included in this annual report have been prepared in conformity with United States generally accepted accounting principles and necessarily include some amounts that are based on management’s best estimates and judgments.
The management of Highland’s Bankshares, Inc. and its wholly owned subsidiaries is responsible for establishing and maintaining adequate internal control over financial reporting as defined in Rule 13a-15(f) of the Exchange Act. Because of its inherent limitations, internal control over financial reporting may not prevent or detect misstatements or may not prevent the possibility that a control can be circumvented or overridden Also, projections of any evaluation of effectiveness to future periods are subject to the risk that controls may become inadequate because of changes in conditions, or that the degree of compliance with the policies or procedures may deteriorate.
Management assessed the effectiveness of the Company’s internal control over financial reporting as of December 31, 2008. In making this assessment, management used the criteria set forth by the Committee of Sponsoring Organizations of the Treadway Commission (“COSO”) in Internal Control-Integrated Framework. Based on the assessment using those criteria, management concluded that the internal control over financial reporting was effective as of December 31, 2008.
| /s/ C.E. Porter |
| C.E. Porter |
| Chief Executive Officer |
| March 23, 2009 |
| /s/ R. Alan Miller |
| R. Alan Miller |
| Principal Financial Officer |
| March 23, 2009 |
| Changes in and Disagreements With Accountants on Accounting and Financial Disclosure |
None.
The Company’s management, with the participation of the Company’s Chief Executive Officer and Principal Financial Officer, has evaluated the effectiveness of the Company’s disclosure controls and procedures as of December 31, 2008. Based on this evaluation, the Company’s Chief Executive Officer and Principal Financial Officer concluded that the Company’s disclosure controls and procedures are effective in timely alerting them to material information relating to the Company required to be included in the Company’s periodic SEC filings.
This Annual Report does not include an attestation report of the Company’s registered public accounting firm regarding internal control over financial reporting. Management’s report was not subject to attestation by the Company’s registered public accounting firm pursuant to temporary rules of the Securities and Exchange Commission that permit the Company to provide only management’s report in the Annual Report.
Changes in Internal Controls
During the period reported upon, there were no significant changes in internal controls of Highlands Bankshares, Inc. pertaining to its financial reporting and control of its assets or in other factors that materially affected or are reasonably likely to materially affect such control.
None.
| Directors, Executive Officers and Corporate Governance |
Information required by this item is set forth as portions of our 2009 Proxy Statement, to be filed within 120 days after the end of the Company’s fiscal year end, and is incorporated herein by reference. Applicable information required by this item can be found in the 2009 Proxy Statement under the following captions:
| | · | “Compliance with Section 16(a) of the Securities Exchange Act” |
| | · | “INFORMATION CONCERNING DIRECTORS AND NOMINEES” |
| | · | “REPORT OF THE AUDIT COMMITTEE” |
The Company has adopted a Code of Ethics that applies to the Company’s Chief Executive Officer, Principal Financial Officer, Chief Accounting Officer and all directors, officers and employees of the Company. A copy of the Company’s Code of Ethics covering all employees will be mailed without charge upon request to Corporate Governance, Highlands Bankshares, Inc., P.O. Box 929, Main Street, Petersburg, West Virginia 26847. Any amendments to or waiver from any provision of the Code of Ethics, applicable to the Company’s Chief Executive Officer, Principal Financial Officer, or Chief Accounting Officer will be disclosed in a timely fashion via the Company’s filing of a Current Report on Form 8-K regarding and amendments to, or waivers of, any provision of the Code of Ethics applicable to the Company’ps Chief Executive Officer, Chief Financial Officer or Chief Accounting Officer.
Information required by this item is set forth under the caption “EXECUTIVE COMPENSATION” of our 2009 Proxy Statement, to be filed within 120 days after the end of the Company’s fiscal year end, and is incorporated herein by reference.
| Security Ownership of Certain Beneficial Owners and Management and Related Stockholder Matters |
Information required by this item is set forth under the caption “SECURITY OWNERSHIP OF CERTAIN BENEFICIAL OWNERS AND MANAGEMENT” of our 2009 Proxy Statement, to be filed within 120 days after the end of the Company’s fiscal year end, and is incorporated herein by reference
| Certain Relationships and Related Transactions and Director Independence |
Information required by this item is set forth under the caption “CERTAIN RELATED TRANSACTIONS” of our 2009 Proxy Statement, to be filed within 120 days after the end of the Company’s fiscal year end, and is incorporated herein by reference.
Most of the directors, limited liability companies of which they may be members, partnerships of which they may be general partners and corporations of which they are officers or directors, maintain normal banking relationships with the Bank. Loans made by the Bank to such persons or other entities were made in the ordinary course of business, were made, at the date of inception, on substantially the same terms, including interest rates and collateral, as those prevailing at the time for comparable transactions with other persons, and did not involve more than normal risk of collectibility or present other unfavorable features. See Note Twelve of the consolidated financial statements.
Director John Van Meter is a partner with the law firm of VanMeter and VanMeter, which has been retained by the Company as legal counsel, and it is anticipated that the relationship will continue. Director Jack H. Walters is a partner with the law firm of Walters, Krauskopf & Baker, which provides legal counsel to the Company, and it is anticipated that the relationship will continue.
| Principal Accounting Fees and Services |
Information required by this item is set forth under the caption “Fees of Independent Registered Certified Public Accountants” of our 2009 Proxy Statement, to be filed within 120 days after the end of the Company’s fiscal year end, and is incorporated herein by reference.
| Exhibits, Financial Statements and Schedules |
| (a)(1) | Financial Statements: Reference is made to Part II, Item 8 of the Annual Report on Form 10-K |
| (a)(2) | Financial Statement Schedules: These schedules are omitted as the required information is inapplicable or the information is presented in the consolidated financial statements or related notes |
| (a)(3) | Exhibits. The exhibits listed in the “Exhibits Index” on Page 65 of this Annual Report on Form 10-K included herein are filed herewith or are incorporated by reference from previous filings. |
| (b) | See (a)(3) above |
| (c) | See (a)(1) and (a)(2) above |
Pursuant to the requirements of Section 13 or 15(d) of the Securities and Exchange Act of 1934, the registrant has duly cause this report to be signed on its behalf by the undersigned, thereunto duly authorized.
HIGHLANDS BANKSHARES, INC.
| /s/ C.E. Porter | | /s/ R. Alan Miller | |
| C.E. Porter | | R. Alan Miller | |
| President & Chief Executive Officer | Principal Financial Officer | |
| Date: March 23, 2009 | | Date: March 23, 2009 | |
Pursuant to the requirements of the Securities and Exchange Act of 1934, this report has been signed below by the following persons on behalf of the registrant and in the capacities and on the dates indicated.
| Name | Signature | Title | Date |
| | | | |
| Leslie A. Barr | _____________________________ | Director | |
| | | | |
Alan L. Brill | /s/ Alan L. Brill | Director; Secretary | March 23, 2009 |
| | | | |
| | | | |
| Jack H. Walters | /s/ Jack H. Walters | Director | March 23, 2009 |
| | | | |
| | | | |
| Thomas B. McNeill, Sr. | /s/ Thomas B. McNeill, Sr. | Director | March 23, 2009 |
| | | | |
| | | | |
| Morris M. Homan | /s/ Morris M. Homan | Director | March 23, 2009 |
| | | | |
| | | | |
| Kathy G. Kimble | /s/ Kathy G. Kimble | Director | March 23, 2009 |
| | | | |
| | | | |
| Steven C. Judy | /s/ Steven C. Judy | Director | March 23, 2009 |
| | | | |
C.E. Porter | /s/ C.E. Porter | Director; President & Chief Executive Officer | March 23, 2009 |
| | | | |
John G. Van Meter | _____________________________ | Director; Chairman of The Board of Directors | |
| | | | |
| | | | |
| L. Keith Wolfe | /s/ L. Keith Wolfe | Director | March 23, 2009 |
| EXHIBIT INDEX |
Exhibit Number | Description |
| 3(i) | Articles of Incorporation of Highlands Bankshares, Inc., as restated, are hereby incorporated by reference to Exhibit 3(i) to Highlands Bankshares Inc.’s Form 10-Q filed November 13, 2007 . |
| 3(ii) | Amended Bylaws of Highlands Bankshares, Inc. are incorporated by reference to Exhibit 3(ii) to Highlands Bankshares Inc.’s Report on Form 8-K filed January 9, 2008 |
| 14 | Code of Ethics. The HIGHLANDS BANKSHARES, INC. CODE OF BUSINESS CONDUCT AND ETHICS is hereby incorporated by reference filed as Exhibit 14.1 with Highlands Bankshares Inc.’s Report on Form 8-K filed January 14, 2008 |
| Subsidiaries of the Registrant (filed herewith) |
| Certification of Chief Executive Officer Pursuant to section 302 of the Sarbanes-Oxley Act of 2002 Chapter 63, Title 18 USC Section 1350 (A) and (B). |
| Certification of Chief Financial Officer Pursuant to section 302 of the Sarbanes-Oxley Act of 2002 Chapter 63, Title 18 USC Section 1350 (A) and (B). |
| Statement of Chief Executive Officer Pursuant to 18 U.S.C. §1350. |
| Statement of Chief Financial Officer Pursuant to 18 U.S.C. §1350. |