On behalf of myself, the Directors, Officers and employees of our banks and the holding company, I would like to welcome you to our annual shareholders meeting. As always, it is a pleasure to have this opportunity to see and speak with each of you, some of whom we may only see once a year at this function.
In line with what Mr. VanMeter has already said about Tom McNeill and his retirement this year from the Highlands Bankshares Board, I, too, would like to express my appreciation and the appreciation of the Capon directors for Tom’s service as a director to the Highlands Board. Tom’s 44 years of service on the Capon Board and his various positions there have added an invaluable amount of experience and talent to the direction that Capon Valley Bank has taken over that period of time. For that reason, we look forward to his continued service on the Capon Board for many years to come.
Since the last shareholder meeting when Mr. Porter stood here and commented that your company had performed well in spite of the economic situation, probably few of us realized just how deeply this economy would fall into recession. In fact, it wasn’t until several months afterward that economists would proclaim that this economy actually fell into recession beginning in December 2007. Although the blame for this recession can be traced to various actions and in some cases, inactions by leaders of Congress and the regulatory agencies, there is little doubt that the liberal lending practices allowed by Fannie Mae and Freddie Mac contributed greatly to the problems. The investment in these flawed loan packages generally by larger regional banks and investment firms triggered the staggering losses that have caused the failures of some of these institutions and the bailout of others by the federal government. Add to that the losses created by stock investments in those weakened firms and the result is a financial crisis like this country probably has not seen since the depression of the 1930‘s.
Fortunately, your company had no direct investment in Fannie Mae or Freddie Mac, as several banks have had to show losses in the value of those stock holdings, your company did not alter its lending practices to compete with what we recognized as liberal credit standards that were being promoted in the marketplace and your company did not accept the TARP funds that were offered by the government to provide liquidity to the industry. The Board of Directors of your company reasoned that it was not in the best interests of our shareholders to risk dilution of your investment in our company, nor did they feel it was wise to allow the government to dictate how your company should be operated often with their “one size fits all” mentality.
Generally speaking, this financial crisis has primarily impacted the larger, more regional institutions more significantly than the smaller community banks. This is not to say, however, that your company has been immune from the fallout created by this weakened economy. Cutbacks in the automobile, timber and trucking industries, coupled with general business slowdown, and in some cases closures and bankruptcies, industry layoffs, and high levels of unemployment have triggered higher delinquencies and above average numbers of foreclosures for all of us in the industry. Consequently, 2009 is likely to be a difficult year for our economy and the banking industry as a whole, as we slowly work our way through the problems that led us into this recessionary period in the first place.
Also, at last year’s shareholder meeting, we talked about our intent to initiate a stock repurchase program for reasons that have already been disclosed. As a result, 100,001 shares of stock, including some fairly large blocks, were procured. As this stock is held as treasury stock, the impact of this action has increased the book value for the remaining shareholders by reducing the number of shares outstanding, positively improving both earnings per share and return on average equity.
Over the last few years, Grant County Bank has incorporated into their strategic direction a desire to expand their market further westward into the Canaan Valley area through the purchases of the Stockman’s Bank of Harman and The National Bank of Davis, greatly expanding the footprint of the holding company. In that same regard, this year Capon Valley Bank made a strategic decision to expand that footprint further eastward by the purchase of a former branch bank building in Stephens City, Virginia. Over the summer, the building will be renovated and modernized with an anticipated opening date sometime in the late fall of this year. This facility in southeastern Frederick County and the location of our Gore office in western Frederick County will provide the holding company with a broader base of penetration into the rural Frederick County Virginia market.
In today’s world, accessible and affordable technology solutions is the key that opens the door to a myriad of opportunities for expanding products and services in the financial industry. Over this past year, our banks have embraced the use of technology to improve and expand our operations and product offerings. The ability to image checks and present them electronically within the banking industry opened up a number of possibilities that were not present before the development of this technology. First, it has afforded us the opportunity to present check images as opposed to the physical delivery of checks, through the Federal Reserve and other clearinghouse systems. In the past, we were required to have the checks physically delivered by a specified deadline in order to obtain credit for those items daily. Weather and other similar issues occasionally presented obstacles to their timely delivery, causing delayed availability and loss of earnings. Electronic presentation eliminated those obstacles along with the ever increasing cost of couriers to transport the items. Second, smaller imaging systems were placed in all of our branch locations for the purpose of imaging items that are presented to us there by customers. Several times daily, those images are electronically transmitted to our main offices for processing, once again eliminating the need for couriers to physically transport those documents. Third, it presented the opportunity to offer these smaller image systems to merchant customers, who could choose to image their own checks at their own place of business for presentation to the bank for deposit; thus, giving them both the ability to reduce their need to physically transport those checks to the bank, and improved availability of those funds into their accounts.
Also in 2008, your Board of Directors and many members of our management team, working closely with a hired consultant, gave very serious consideration to the issue of possibly seeking out another vendor to provide our banks with core data processing services. Our company had processed with FiServ Source One (formerly the Mellon Bank processing system) for well over twenty years, and it became apparent to us that their systems were not keeping pace with advancements in technology. Our contract with them expires in December 2009, and after much thought and effort, the decision was made to leave the system that we had known for so long, to embark on a conversion to another FiServ processing system to take full advantage of much improved technological capabilities. That conversion will take place this fall, and much work needs to be done between now and then to prepare for this major overhaul to our operations. The changeover should be fairly transparent to our customers, but the system enhancements that we will receive with this conversion, promises to greatly improve our internal operations, by taking greater advantage of the technological capabilities that exist with systems which have kept pace with the advancements in this ever changing electronic arena. I personally would like to thank the members of our management teams for the extra effort that they have put forth to get us to this point in the process, knowing full well that the more difficult task of preparing for the conversion and dealing with post conversion issues still lies ahead for them to complete. I have every confidence in their ability to fulfill the task at hand in a manner consistent with their performance in successfully managing our banks on a daily basis.
A study of every basic business model will reveal that any fully functioning, successful business requires (1) shareholders who are willing to provide financial investment and dedicated support the business in which they have invested, (2) strong leadership that provides attainable, measurable goals for the business to achieve, (3) a management team of capable individuals dedicated to the task of completing those goals through hiring and training responsible employees, (4) a team of individual employees whose work ethic and customer service ability support the daily operations necessary to promote the achievement of those goals, (5) and a base of customers who are willing to pay for the products and services that the company has to offer. It is important to note that success comes when all parts of this business model work together in harmony.
So, today, in no particular order of importance, because each as we have determined is dependent on the other, we would like to recognize and thank each of those five groups of individuals, our shareholders, our directors, our management, our employees, and our customers for your continued support of our business operations in the markets that we serve, both today and in the days that lie ahead.
If you take nothing else from this meeting, as a shareholder, it is important to remember that promoting and growing the business that we own and operate together contribute both directly and positively to promoting and growing the investment that you have made in our company.


Certain statements in this presentation may constitute “forward-looking
statements” within the meaning of the Private Securities Litigation
Reform Act of 1995. Forward-looking statements are statements that
include projections, predictions, expectations or beliefs about future
events or results or otherwise are not statements of historical fact.
Although the Company believes that its expectations with respect to
certain forward-looking statements are based upon reasonable
assumptions within the bounds of its existing knowledge of its business
and operations, there can be no assurance that actual results,
performance or achievements of the Company will not differ
materially from any future results, performance or achievements
expressed or implied by such forward-looking statements. The
Company does not update any forward-looking statements that may be
made from time to time by or on behalf of the Company.

HIGHLIGHTS
FROM 2008

Net income increased 6.81%, as compared
to 2007
Net-interest income increased 2.22%
Non-interest income increased 29.76%,
while non-interest expense increased 4.26%
Total assets decreased .69% from
December 31, 2007 to December 31, 2008
Return on Average Assets was 1.32%,
compared to 1.24% for 2007
Return on Average Equity was 12.38%,
compared to 12.03% for 2007

Effects of Share Repurchase
Share repurchase reduced average shares
outstanding for 2008 by 53,660, as
compared to 2007
Therefore, Earnings Per Weighted Average
Common Shares Outstanding increased
10.80% from 2007 to 2008, as compared
to the 6.81% increase in Net Income
Share repurchase also had positive impact
on Return on Average Equity

INCOME
HIGHLIGHTS

Earnings Per Share
History
HBI EPS: FIVE YEAR INCREASE
$2.15
$2.35
$2.55
$2.75
$2.95
$3.15
$3.35
$3.55
$3.75
2004
2005
2006
2007
2008

Net Interest Income
HBI NET INTEREST INCOME FIVE YEAR
HISTORY
-
5,000,000
10,000,000
15,000,000
2004
2005
2006
2007
2008

Non Interest Income and
Non Interest Expense
Non-interest income was increased by several non-recurring items,
the largest of which related to calls on securities investments,
which totaled $87,000 in non-recurring gains
Annual Increase in Non Interest Income and Non
Interest Expense
0.00%
5.00%
10.00%
15.00%
20.00%
25.00%
30.00%
35.00%
2004
2005
2006
2007
2008
Annual Percentage Increase in Non interest Income
Annual Percentage Increase in Non interest Expense

Revenues By Type 2008
Interest and Fees
on Loans, 86%
Deposit Service
Charges, 6%
Other Interest, 5%
Other Income, 3%

Assets

FIVE YEAR ASSET GROWTH
Although total assets decreased slightly from 12/31/07 to 12/31/08,
assets have grown 26.00% over the five year period
that ended December 31, 2008
HBI Asset Growth
295,000,000
305,000,000
315,000,000
325,000,000
335,000,000
345,000,000
355,000,000
365,000,000
375,000,000
385,000,000
2003
2004
2005
2006
2007
2008

Assets by Type at Year End 2008
Other Assets,
4.53%
Fixed Assets,
2.12%
Other Earning
Assets, 8.20%
Net Loans, 85.14%

Loan Growth
Loan balances increased 5.01% from December 31, 2007 to
December 31, 2008 and have increased 120% in the past ten years
HBI Ten Year Loan Growth
(in millions of dollars)
-
50.00
100.00
150.00
200.00
250.00
300.00
350.00
1998
1999
2000
2001
2002
2003
2004
2005
2006
2007
2008

Return on Average Assets
Return on Average Assets Since
1995
0.70%
0.80%
0.90%
1.00%
1.10%
1.20%
1.30%
1.40%
1995
1996
1997
1998
1999
2000
2001
2002
2003
2004
2005
2006
2007
2008

CAPITAL

Balance of shareholders’ equity
decreased 2.96% from December 31,
2007 to December 31, 2008
Decrease was largely the result of
the share repurchase. HBI
repurchased 100,001 shares for a
total price of $3,372,000

Although the total balance of shareholders’ equity decreased
during 2008, HBI’s capital-to-asset ratio has remained
relatively constant for the past five years and the Company
remains within the categorization of “Well Capitalized”
0.00%
2.00%
4.00%
6.00%
8.00%
10.00%
12.00%
2004
2005
2006
2007
2008
Capital to Asset Ratio at Year End

During 2004, return on average equity topped 10%
for the first time since 1996 and 2008 represents
the fifth consecutive year of ROAE above 10%
Return on Average Equity Since
1995
7.00%
8.00%
9.00%
10.00%
11.00%
12.00%
13.00%
1995
1996
1997
1998
1999
2000
2001
2002
2003
2004
2005
2006
2007
2008

HISTORICAL
TRENDS

HBI INCOME HISTORY SINCE
INCEPTION
600
1,100
1,600
2,100
2,600
3,100
3,600
4,100
4,600
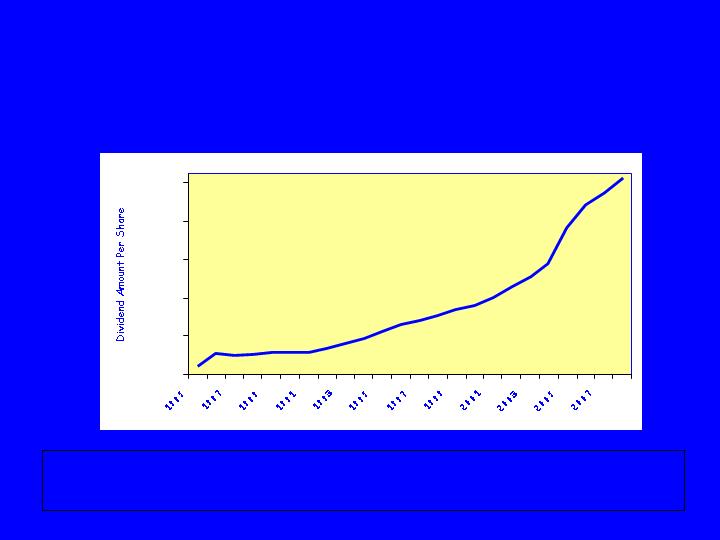
HBI DIVIDENDS PER SHARE
HISTORY SINCE INCEPTION
Trend has continued into 2009 with a dividend of 29 cents per share
paid during first two quarters of the year
0.05
0.25
0.45
0.65
0.85
1.05

Questions or
Comments
Regarding 2008
Results?

HBSI.OB Last Reported Share Price
$ 27.25

First Quarter 2009 Results
Income for the first quarter of 2009 was
$963,000, a decrease of 22.21% from the
same quarter in 2008
Earnings per share decrease is smaller at
16.28%
Total assets increased 4.00% during the
quarter
Loan balances increased 2.08% during the
quarter, while deposit balances increased
4.40%
