Exhibit 99.1

| SECOND QUARTER REPORT 2009 | For a full explanation of results, the Financial Statements and Management Discussion & Analysis, and mine statistics please see the Company’s website,www.barrick.com. | |
| JULY 30, 2009 | ||
| Based on US GAAP and expressed in US dollars |
Barrick Earns $492 Million ($0.56 Per Share)
Cash Flow Rises 42% to $718 Million
Cash Flow Rises 42% to $718 Million
Highlights
| • | Barrick Gold reported net income of $492 million ($0.56 per share) compared to $485 million ($0.56 per share) in Q2 2008. Adjusted net income of $431 million ($0.49 per share)1 compares to $442 million ($0.51 per share) in the prior year period. Operating cash flow rose 42% to $718 million in the second quarter compared to $505 million in the same prior year period. | ||
| • | Second quarter gold production of 1.87 million ounces at net cash costs of $360 per ounce or total cash costs of $452 per ounce1 exceeded plan on strong performance from the North and South America regions. Barrick remains on track with its full year 2009 production guidance of 7.2-7.6 million ounces of gold at net cash costs of $360-$385 per ounce or total cash costs of $450-$475 per ounce. | ||
| • | Production is expected to increase to approximately 7.7-8.1 million ounces in 2010 at lower total cash costs with the start-up of Cortez Hills. | ||
| • | The go-ahead decision on construction of the Pascua-Lama gold-silver project during the quarter is a significant milestone for Barrick. Pascua-Lama is expected to produce about 750,000-800,000 ounces of gold per year at anticipated total cash costs of $20-$50 per ounce2 in the first full five years of a +25 year mine life, making it one of the lowest cost gold mines in the world. | ||
| • | The Buzwagi project in Tanzania poured its first gold in early May on schedule and in line with its construction budget, and is the first of a new generation of low cost mines that also includes Cortez Hills, Pueblo Viejo, and Pascua-Lama. At full capacity, these projects are expected to collectively contribute 2.6 million ounces of average annual production at lower cash costs than the current Company profile. | ||
| • | Barrick continues to maintain a strong financial position with quarter-end cash of $2.0 billion, an undrawn credit facility of $1.5 billion and robust cash flow. |
Q2 production of 1.87 million ounces of gold at net cash costs of $360 per ounce (applying credit for non-gold sales) or total cash costs of $452 per ounce was ahead of plan.
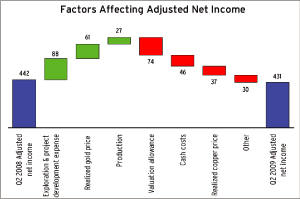
The realized gold price for the quarter was $931 per ounce1, which was $9 higher than the average spot price of $922 per ounce. The Company reported second quarter net income of $492 million ($0.56 per share) compared to net income of $485 million ($0.56 per share) in the prior year period. Q2 adjusted net income of $431 million ($0.49 per share) compares to $442 million ($0.51 per share) in the prior year period. Lower adjusted net income reflects higher cost of sales, offset by higher sales revenue, and lower project development and exploration expenses.
Q2 2009 operating cash flow increased to $718 million compared to $505 million in Q2 2008 and reflects lower income tax payments as a result of the production mix and the use of tax loss carry forwards.
| 1 | Adjusted net income, net cash costs per ounce, total cash costs per ounce and realized price are non-GAAP financial measures. See pages 32-36 of the Company’s MD&A. | |
| 2 | Total cash costs per ounce are calculated assuming a gold price of $800 per ounce and applying silver by-product credits assuming a silver price of $12 per ounce. |
| BARRICK SECOND QUARTER 2009 | PRESS RELEASE |
“Our portfolio of operations performed strongly in Q2, exceeding plan, and positioning us well to meet our production and cost targets for the year,” said Aaron Regent, Barrick’s President and CEO. “The go-ahead decision on Pascua-Lama during the quarter marks an important milestone for Barrick and our strategy of developing long life, low cost mines. Pascua-Lama is expected to be one of the industry’s lowest cost gold operations and joins the world-class Cortez Hills and Pueblo Viejo projects in construction. Execution on this new generation of projects, combined with a favorable gold price outlook and our focus on cost management provides the foundation from which Barrick will continue to deliver shareholder value.”
PRODUCTION AND COSTS
Q2 production of 1.87 million ounces at total cash costs of $452 per ounce exceeded plan as a result of strong operating performance from the North America and South America regions. The Company is on track with its full year production guidance of 7.2-7.6 million ounces of gold at net cash costs of $360-$385 per ounce or total cash costs of $450-$475 per ounce.
The North America region followed up a strong Q1 by delivering another quarter of results that exceeded plan with production of 0.77 million ounces at total cash costs of $484 per ounce. The result was largely driven by the Goldstrike operation, which produced 0.41 million ounces at total cash costs of $441 per ounce, as higher grade ore continued to be mined in the open pit and underground. Cortez contributed 0.12 million ounces at total cash costs of $542 per ounce. Further improvements to production and costs are anticipated at Cortez in the second half of the year with access to higher grade material.
The South America business unit also exceeded plan with production of 0.44 million ounces at total cash costs of $277 per ounce. The Lagunas Norte mine continued to deliver solid results in Q2 with production of 0.26 million ounces at total cash costs of $134 per ounce. Veladero’s production of 0.11 million ounces at total cash costs of $534 per ounce was ahead of plan. Production and costs are expected to improve in the latter half of 2009 as Veladero sequences through higher grade ore and as a result of higher throughput resulting from the crusher expansion, which is on target for completion in Q3. The expansion is anticipated to increase processing capacity from 50,000 to 85,000 tons per day and is about 90% complete.
The Australia Pacific business unit produced 0.49 million ounces at total cash costs of $552 per ounce. Porgera, the region’s largest operation, produced 0.14 million ounces at lower than planned total cash costs of $491 per ounce. The Kalgoorlie mine continued to access higher grade ore and benefit from improved performance of the mining fleet, resulting in better than planned production and total cash costs.
Production from the African business unit of 0.16 million ounces at total cash costs of $539 per ounce included production from the new Buzwagi mine which poured its first gold in May. “The project team is to be congratulated for delivering Buzwagi on time and in line with its construction budget,” said Aaron Regent. “This is the sixth project to be constructed on time in the last six years.” The mine produced about 36,000 ounces at total cash costs of $357 per ounce during the quarter and is expected to continue to ramp up production in the second half of the year. Buzwagi is anticipated to produce about 200,000 ounces of gold at total cash costs of about $335 per ounce in 2009.
The Company is on track with full year copper production guidance of 375-400 million pounds at total cash costs of $1.25-$1.35 per pound. Q2 copper production of 96 million pounds at total cash costs of $1.25 per pound was in line with plan. The Company benefited from its copper hedge position, realizing $3.18 per pound, $1.06 per pound higher than the average spot price.
Barrick’s production base is underpinned by the industry’s largest gold reserves of 138.5 million ounces3.
PROJECTS UPDATE
Barrick’s three projects in construction continue to progress on schedule and in line with their respective pre-production capital budgets.
| 3 | Calculated in accordance with National Instrument 43-101 as required by Canadian securities regulatory authorities. For United States reporting purposes, Industry Guide 7 (under the Securities Exchange Act of 1934), as interpreted by the Staff of the SEC, applies different standards in order to classify mineralization as a reserve. Accordingly, for U.S. reporting purposes, Cerro Casale is classified as mineralized material and approximately 600,000 ounces of reserves for Pueblo Viejo (Barrick’s 60% interest) are classified as mineralized material. For a breakdown of reserves and resources by category and additional information relating to reserves and resources, see pages 21-31 of Barrick’s 2008 Form 40-F/Annual Information Form on file with the U.S. Securities and Exchange Commission and Canadian provincial securities regulatory authorities. |
| BARRICK SECOND QUARTER 2009 | 2 | PRESS RELEASE |
Together with Buzwagi, they are expected to contribute nearly 2.6 million ounces4 of lower cost production once at full capacity. Production is expected to increase to 7.7-8.1 million ounces in 2010 with new production from Cortez Hills5.
Construction of the Cortez Hills project in Nevada is approximately 60% complete and is on schedule and in line with its $500 million capital budget. Initial production continues to be anticipated in Q1 2010 assuming the satisfactory resolution of the pending litigation regarding the project. The Cortez property is expected to contribute one million ounces per year at total cash costs of $350-$400 per ounce in the first full five years once Cortez Hills is in operation.
The Pueblo Viejo project in the Dominican Republic is advancing in line with its pre-production capital budget of approximately $2.7 billion (100% basis)6, and first gold continues to be expected in Q4 2011. Engineering and design is more than two-thirds complete and the fabrication of the autoclaves and oxygen plant is progressing on schedule. Barrick’s 60% share of annual gold production in the first full five years of operation is anticipated to be 600,000-650,000 ounces per year at total cash costs of about $275-$300 per ounce. Pueblo Viejo is a long life asset with an expected mine life of over 25 years.
Barrick announced a construction decision on the Pascua-Lama project in early May. As of quarter-end, the mills, mining fleet, and other processing and earth-moving equipment have been ordered. The project team expects to mobilize to the site during the third quarter to install construction infrastructure, including additional camp facilities, and to begin upgrading the access road. Pascua-Lama is expected to produce about 750,000-800,000 ounces of gold and 35 million ounces of silver annually in its first full five years at anticipated total cash costs of $20-$50 per ounce, making it one of the lowest cost gold mines in the world. Commissioning is expected in late 2012 and initial production in the first quarter of 2013.
FINANCIAL POSITION
Barrick maintained a strong financial position during the quarter with the gold industry’s highest credit rating, a cash balance of $2.0 billion, $1.5 billion in undrawn credit and net debt of $3.0 billion as at June 30, 2009.
* * * * *
Barrick’s vision is to be the world’s best gold company by finding, acquiring, developing and producing quality reserves in a safe, profitable and socially responsible manner. Barrick’s shares are traded on the Toronto and New York stock exchanges.
| 4 | 2.6 million ounces of production is based on the estimated cumulative average annual production in the first full 5 years once all are at full capacity. Lower cost refers to total cash costs per ounce. | |
| 5 | In Q4 2008, a number of opponents of the Cortez Hills expansion filed suit in the U.S. District Court for the District of Nevada seeking to overturn the Bureau of Land Management’s approval of the Cortez Hills project on environmental and religious grounds. The plaintiffs unsuccessfully sought to enjoin construction of the project pending consideration of their claims. The District Court’s denial of the requested injunction is currently being appealed. | |
| 6 | Pre-production, followed by $0.3 billion to complete phased expansion from 18,000 tpd to 24,000 tpd. |
| BARRICK SECOND QUARTER 2009 | 3 | PRESS RELEASE |
Key Statistics
| Barrick Gold Corporation | Three months ended | Six months ended | ||||||||||||||
| (in United States dollars) | June 30, | June 30, | ||||||||||||||
| (Unaudited) | 2009 | 2008 | 2009 | 2008 | ||||||||||||
Operating Results | ||||||||||||||||
Gold production (thousands of ounces)1 | 1,866 | 1,857 | 3,621 | 3,600 | ||||||||||||
Gold sold (thousands of ounces)1 | 1,882 | 1,866 | 3,596 | 3,595 | ||||||||||||
| Per ounce data | ||||||||||||||||
| Average spot gold price | $ | 922 | $ | 896 | $ | 915 | $ | 910 | ||||||||
Average realized gold price2 | 931 | 898 | 923 | 913 | ||||||||||||
Net cash costs5 | 360 | 326 | 378 | 289 | ||||||||||||
Total cash costs3 | 452 | 434 | 467 | 415 | ||||||||||||
Amortization and other4 | 116 | 106 | 114 | 105 | ||||||||||||
| Copper credits | 92 | 108 | 89 | 126 | ||||||||||||
| Total production costs | 568 | 540 | 581 | 520 | ||||||||||||
| Copper production (millions of pounds) | 96 | 87 | 191 | 174 | ||||||||||||
| Copper sold (millions of pounds) | 90 | 78 | 176 | 176 | ||||||||||||
| Per pound data | ||||||||||||||||
| Average spot copper price | $ | 2.12 | $ | 3.83 | $ | 1.83 | $ | 3.68 | ||||||||
Average realized copper price2 | 3.18 | 3.65 | 3.09 | 3.59 | ||||||||||||
Total cash costs3 | 1.25 | 1.08 | 1.28 | 1.00 | ||||||||||||
Amortization and other4 | 0.21 | 0.36 | 0.23 | 0.36 | ||||||||||||
| Total production costs | 1.46 | 1.44 | 1.51 | 1.36 | ||||||||||||
Financial Results (millions) | ||||||||||||||||
| Sales | $ | 2,029 | $ | 1,967 | $ | 3,856 | $ | 3,925 | ||||||||
| Net income | 492 | 485 | 863 | 999 | ||||||||||||
Adjusted net income6 | 431 | 442 | 732 | 981 | ||||||||||||
| Operating cash flow | 718 | 505 | 1,067 | 1,223 | ||||||||||||
| Per Share Data (dollars) | ||||||||||||||||
| Net income (basic) | 0.56 | 0.56 | 0.99 | 1.15 | ||||||||||||
Adjusted net income (basic)6 | 0.49 | 0.51 | 0.84 | 1.13 | ||||||||||||
| Net income (diluted) | 0.56 | 0.55 | 0.98 | 1.13 | ||||||||||||
| Weighted average basic common shares (millions) | 873 | 872 | 873 | 872 | ||||||||||||
Weighted average diluted common shares (millions)7 | 885 | 885 | 885 | 885 | ||||||||||||
| As at | As at | |||||||
| June 30, | December 31, | |||||||
| 2009 | 2008 | |||||||
Financial Position (millions) | ||||||||
| Cash and equivalents | $ | 2,038 | $ | 1,437 | ||||
| Non-cash working capital | 975 | 1,037 | ||||||
| Long-term debt | 5,126 | 4,556 | ||||||
| Equity | 16,583 | 15,459 | ||||||
| 1 | Production includes equity gold ounces in Highland Gold. Production also includes an additional 40% share of production from the Cortez mine from March 1, 2008 onwards, an additional 50% interest in Hemlo from January 1, 2009 onwards and 100% of Storm from October 1, 2008 onwards. | |
| 2 | Realized price is a non-GAAP financial performance measure with no standard meaning under US GAAP. See page 35 of the Company’s MD&A. | |
| 3 | Total cash costs is a non-GAAP financial performance measure with no standard meaning under US GAAP. See page 33 of the Company’s MD&A. | |
| 4 | Represents equity amortization expense, unrealized losses on non-hedge currency and commodity contracts and inventory purchase accounting adjustments at the Company’s producing mines, divided by equity ounces of gold sold or pounds of copper sold. | |
| 5 | Net cash costs is a non-GAAP financial performance measure with no standard meaning under US GAAP. See page 33 of the Company’s MD&A. | |
| 6 | Adjusted net income is a non-GAAP financial performance measure with no standard meaning under US GAAP. See page 32 of the Company’s MD&A. | |
| 7 | Fully diluted, includes dilutive effect of stock options and convertible debt. |
| BARRICK SECOND QUARTER 2009 | 4 | SUMMARY INFORMATION |
Production and Cost Summary
| Gold Production (attributable ounces) (000’s) | Total Cash Costs (US$/oz) | |||||||||||||||||||||||||||||||
| Three months ended | Six months ended | Three months ended | Six months ended | |||||||||||||||||||||||||||||
| June 30, | June 30, | June 30, | June 30, | |||||||||||||||||||||||||||||
| (Unaudited) | 2009 | 2008 | 2009 | 2008 | 2009 | 2008 | 2009 | 2008 | ||||||||||||||||||||||||
North America1 | 765 | 693 | 1,501 | 1,307 | $ | 484 | $ | 493 | $ | 491 | $ | 498 | ||||||||||||||||||||
| South America | 442 | 536 | 838 | 1,077 | 277 | 270 | 283 | 233 | ||||||||||||||||||||||||
| Australia Pacific | 488 | 471 | 977 | 906 | 552 | 520 | 580 | 481 | ||||||||||||||||||||||||
| Africa | 163 | 151 | 290 | 295 | 539 | 493 | 549 | 500 | ||||||||||||||||||||||||
| Other | 8 | 6 | 15 | 15 | 494 | 410 | 494 | 410 | ||||||||||||||||||||||||
| Total | 1,866 | 1,857 | 3,621 | 3,600 | $ | 452 | $ | 434 | $ | 467 | $ | 415 | ||||||||||||||||||||
| Copper Production (attributable pounds) (Millions) | Total Cash Costs (US$/lb) | |||||||||||||||||||||||||||||||
| Three months ended | Six months ended | Three months ended | Six months ended | |||||||||||||||||||||||||||||
| June 30, | June 30, | June 30, | June 30, | |||||||||||||||||||||||||||||
| (Unaudited) | 2009 | 2008 | 2009 | 2008 | 2009 | 2008 | 2009 | 2008 | ||||||||||||||||||||||||
| South America | 75 | 69 | 151 | 142 | $ | 1.27 | $ | 0.90 | $ | 1.29 | $ | 0.83 | ||||||||||||||||||||
| Australia Pacific | 21 | 18 | 40 | 32 | 1.13 | 1.77 | 1.27 | 1.66 | ||||||||||||||||||||||||
Total | 96 | 87 | 191 | 174 | $ | 1.25 | $ | 1.08 | $ | 1.28 | $ | 1.00 | ||||||||||||||||||||
| Total Gold Production Costs (US$/oz) | ||||||||||||||||
| Three months ended | Six months ended | |||||||||||||||
| June 30, | June 30, | |||||||||||||||
| (Unaudited) | 2009 | 2008 | 2009 | 2008 | ||||||||||||
| �� | ||||||||||||||||
| Direct mining costs at market foreign exchange rates | $ | 407 | $ | 478 | $ | 410 | $ | 447 | ||||||||
| (Gains) losses realized on currency hedge and commodity hedge/economic hedge contracts | 17 | (61 | ) | 30 | (47 | ) | ||||||||||
| By-product credits | (8 | ) | (17 | ) | (8 | ) | (19 | ) | ||||||||
| Copper credits | (92 | ) | (108 | ) | (89 | ) | (126 | ) | ||||||||
Cash operating costs, net basis | 324 | 292 | 343 | 255 | ||||||||||||
| Royalties | 30 | 30 | 29 | 29 | ||||||||||||
| Production taxes | 6 | 4 | 6 | 5 | ||||||||||||
Net cash costs2 | 360 | 326 | 378 | 289 | ||||||||||||
| Copper credits | 92 | 108 | 89 | 126 | ||||||||||||
Total cash costs2 | 452 | 434 | 467 | 415 | ||||||||||||
| Amortization | 115 | 114 | 114 | 111 | ||||||||||||
| Unrealized losses on non-hedge currency and commodity contracts | (2 | ) | (17 | ) | (2 | ) | (10 | ) | ||||||||
| Inventory purchase accounting adjustments and other | 3 | 9 | 2 | 4 | ||||||||||||
Total production costs | $ | 568 | $ | 540 | $ | 581 | $ | 520 | ||||||||
| Total Copper Production Costs (US$/lb) | ||||||||||||||||
| Three months ended | Six months ended | |||||||||||||||
| June 30, | June 30, | |||||||||||||||
| (Unaudited) | 2009 | 2008 | 2009 | 2008 | ||||||||||||
Cash operating costs | $ | 1.24 | $ | 1.06 | $ | 1.28 | $ | 0.99 | ||||||||
| Royalties | 0.01 | 0.02 | — | 0.01 | ||||||||||||
Total cash costs2 | 1.25 | 1.08 | 1.28 | 1.00 | ||||||||||||
| Amortization | 0.21 | 0.36 | 0.23 | 0.36 | ||||||||||||
Total production costs | $ | 1.46 | $ | 1.44 | $ | 1.51 | $ | 1.36 | ||||||||
| 1 | Barrick’s share of Cortez production and total cash costs increased to 100% effective March 1, 2008. Barrick’s share of Storm production and total cash costs increased to 100% effective October 1, 2008. Production includes an additional 50% interest in Hemlo from January 1, 2009 onwards and Barrick’s share of Hemlo total cash costs increased to 100% effective May 1, 2009. | |
| 2 | Total cash costs and net cash costs are non-GAAP financial performance measures with no standard meaning under US GAAP. See page 33 of the Company’s MD&A. |
| BARRICK SECOND QUARTER 2009 | 5 | SUMMARY INFORMATION |
MANAGEMENT’S DISCUSSION AND ANALYSIS (“MD&A”)
This portion of the Quarterly Report provides management’s discussion and analysis of the financial condition and results of operations to enable a reader to assess material changes in financial condition and results of operations as at and for the three and six month periods ended June 30, 2009, in comparison to the corresponding prior-year periods. This MD&A, which has been prepared as of July 29, 2009, is intended to supplement and complement the unaudited interim consolidated Financial Statements and notes thereto, prepared in accordance with US generally accepted accounting principles (“US GAAP”), for the three and six month periods ended June 30, 2009 (collectively, the “Financial Statements”), which are included in this Quarterly Report on pages 37 to 40. You are encouraged to review the Financial Statements in conjunction with your review of this MD&A. This MD&A should be read in conjunction with both the annual audited Consolidated Financial Statements for the three years ended December 31, 2008, the related annual MD&A included in the 2008 Annual Report, and the most recent Form 40-F/Annual Information Form on file with the US Securities and Exchange Commission (“SEC”) and Canadian provincial securities regulatory authorities. Certain notes to the Financial Statements are specifically referred to in this MD&A and such notes are incorporated by reference herein. All dollar amounts in this MD&A are in millions of US dollars, unless otherwise specified.
For the purposes of preparing our MD&A, we consider the materiality of information. Information is considered material if: (i) such information results in, or would reasonably be expected to result in, a significant change in the market price or value of our shares; or (ii) there is a substantial likelihood that a reasonable investor would consider it important in making an investment decision; or (iii) if it would significantly alter the total mix of information available to investors. We evaluate materiality with reference to all relevant circumstances, including potential market sensitivity.
CAUTIONARY STATEMENT ON FORWARD-LOOKING INFORMATION
Certain information contained or incorporated by reference in this MD&A, including any information as to our strategy, projects, plans or future financial or operating performance, constitutes “forward-looking statements”. All statements, other than statements of historical fact, are forward-looking statements. The words “believe”, “expect”, “anticipate”, “contemplate”, “target”, “plan”, “intend”, “continue”, “budget”, “estimate”, “may”, “will”, “schedule” and similar expressions identify forward-looking statements. Forward-looking statements are necessarily based upon a number of estimates and assumptions that, while considered reasonable by us, are inherently subject to significant business, economic and competitive uncertainties and contingencies. Known and unknown factors could cause actual results, including costs, production and returns, to differ materially from those projected in the forward-looking statements. Such factors include, but are not limited to: the impact of global liquidity and credit availability on the timing of cash flows and the values of assets and liabilities based on projected future cash flows; fluctuations in the currency markets (such as Canadian and Australian dollars, South African rand, Chilean peso, Argentinean peso, Peruvian sol and Papua New Guinean kina versus US dollar); fluctuations in the spot and forward price of gold and copper or certain other commodities (such as silver, diesel fuel and electricity); changes in US dollar interest rates or gold lease rates that could impact the mark-to-market value of outstanding derivative instruments and ongoing payments/receipts under interest rate swaps and variable rate debt obligations; risks arising from holding derivative instruments (such as credit risk, market liquidity risk and mark-to-market risk); changes in national and local government legislation, taxation, controls, regulations and political or economic developments in Canada, the United States, Dominican Republic, Australia, Papua New Guinea, Chile, Peru, Argentina, South Africa, Tanzania, Russia, Pakistan or Barbados or other countries in which we do or may carry on business in the future; business opportunities that may be presented to, or pursued by, us; our ability to successfully integrate acquisitions; operating or technical difficulties in connection with mining or development activities; employee relations; availability and increased costs associated with mining inputs and labor; litigation; the speculative nature of exploration and development, including the risks of obtaining necessary licenses and permits; diminishing quantities or grades of reserves; changes in costs and estimates associated with our projects; adverse changes in our credit rating; and contests over title to properties, particularly title to undeveloped properties. In addition, there are risks and hazards associated with the business of exploration, development and mining, including environmental hazards, industrial accidents, unusual or unexpected formations, pressures, cave-ins, flooding and gold bullion or copper cathode losses (and the risk of inadequate insurance, or inability to obtain insurance, to cover these risks). Many of these uncertainties and contingencies
| BARRICK SECOND QUARTER 2009 | 6 | MANAGEMENT’S DISCUSSION AND ANALYSIS |
can affect our actual results and could cause actual results to differ materially from those expressed or implied in any forward-looking statements made by, or on behalf of, us. Readers are cautioned that forward-looking statements are not guarantees of future performance. All of the forward-looking statements made in this MD&A are qualified by these cautionary statements. Specific reference is made to Barrick’s most recent Form 40-F/Annual Information Form on file with the SEC and Canadian provincial securities regulatory authorities for a discussion of some of the factors underlying forward-looking statements. We disclaim any intention or obligation to update or revise any forward-looking statements whether as a result of new information, future events or otherwise, except to the extent required by applicable law.
CONTENTS
Changes in Presentation of Non-GAAP Financial | 7 | |||
Performance Measures | ||||
Core Business and Market Overview | 7 | |||
Financial and Operational Results | 10 | |||
Significant Acquisitions and Divestitures | 14 | |||
Operating Segments Review | 14 | |||
Review of Significant Operating Expenses | 19 | |||
Quarterly Information | 21 | |||
Financial Condition Review | 22 | |||
New Accounting Policies and Accounting Estimates | 29 | |||
Non-GAAP Financial Performance Measures | 32 |
CHANGES IN PRESENTATION OF NON-GAAP FINANCIAL PERFORMANCE MEASURES
We use certain non-GAAP financial performance measures in our MD&A. For a detailed description of each of the non-GAAP measures used in this MD&A, please see the discussion under “Non-GAAP Financial Performance Measures” beginning on page 32 of our MD&A.
In this MD&A, we have updated the items included in our “Adjusted Net Income” to reflect recent changes in US GAAP. FAS 141(R), Business Combinations (“FAS 141(R)”) includes a requirement on step acquisitions to record previously held interests of the acquired entity at fair value, resulting in remeasurement of those assets and liabilities and the recognition of a related gain/loss. These gains/losses have been excluded from the calculation of Adjusted Net Income because, similar to our previously disclosed adjustment “Gains/losses on the disposition of long-lived assets”, they reflect non-cash charges which are not illustrative of operating performance. As such, we have adjusted Net Income for these items and the description of the relevant line item in the reconciliation has been changed to “Gains/losses on acquisitions/dispositions”.
In this MD&A, we have also updated the reconciling items in our “Reconciliation of Sales to Realized Price per ounce/pound” to include export duties that are paid upon sale and currently netted against revenues. We believe this provides investors and analysts with a more accurate measure with which to compare to market gold prices and to assess our gold sales performance.
In the first quarter 2009 MD&A, we changed the description of “total gold cash costs per ounce - full credit basis for non-gold sales” to “net cash costs per ounce”. Starting with that MD&A, we have placed greater emphasis on our net cash costs per ounce measure because we believe that it illustrates the performance of our business on a consolidated basis and enables investors to better understand our performance in comparison to other gold producers who present results on a similar basis. As part of this emphasis, we also introduced the measure “net cash margin” in the first quarter 2009 MD&A, which is calculated as the difference between realized price and net cash costs per ounce, as opposed to the measure “cash margin” which was previously disclosed by us and was calculated using total cash costs per ounce. The definition and manner of use of “net cash costs per ounce” and “net cash margin” remain unchanged from the first quarter 2009 MD&A.
CORE BUSINESS AND MARKET OVERVIEW
Core Business
Governed by our five core values; behave like an owner, act with a sense of urgency, be a team player, continually improve, and deliver results, we have become the world’s preeminent gold mining company. Our annual gold production and gold reserves are the largest in the industry. We also produce significant amounts of copper at some of our operating mines. We sell our production in the world market through three primary distribution channels: gold bullion is sold in the gold spot market; gold and copper concentrate is sold to independent smelting companies; and copper cathode is sold under copper cathode sales contracts with various third parties.
| BARRICK SECOND QUARTER 2009 | 7 | MANAGEMENT’S DISCUSSION AND ANALYSIS |
Global Economic Conditions
The second quarter of 2009 saw a marked improvement in financial market conditions over the prior six months including strength in credit and equity markets. Investor sentiment improved and resulted in money flows to risk-assets including the energy and commodity markets. This rally has been driven by a decrease in systemic risk to a number of global financial institutions, certain better than expected economic releases and a decrease in volatility in a number of markets to pre-September 2008 levels. However, economic growth continues to underperform due to rising unemployment, excess manufacturing capacity and higher costs of borrowing. As a result of these difficult conditions affecting the US and global economies, we expect US interest rates to remain very low for the next year until signs of inflation are evident. A number of market participants remain concerned about the growth in money supply, exceptionally low interest rates and high government spending that may lead to inflation in the medium term.
Our business is subject to a number of risks including:
| • | A tightening of global credit/liquidity markets could continue to impact the cost and availability of financing and our sources of liquidity. | |
| • | Volatility in market gold prices impacts the amount of our revenues, earnings and cash flow each period. | |
| • | Volatile energy prices, commodity and consumables prices and currency exchange rates impact our production costs in periods that we have not put in place price protection through supply contracts and currency/commodity hedge contracts. | |
| • | A downturn or a continuation in lower prices for copper, platinum group metals and nickel would impact copper sales beyond 2009 and returns on projects containing other non-gold revenues. |
Gold and Copper Prices
During the quarter, the gold price1 traded in a range of $865 to $990 per ounce, closing at $935, and averaging $922, which is $26 higher than the prior year period. Gold continued to be influenced by low interest rates, volatility in the credit and financial markets and the monetary policies put in place by the world’s most prominent central banks. As a result of the easing of monetary policy, as well as increases in announced government spending, we believe that inflation and US dollar depreciation could emerge in the coming years. Gold is viewed as a hedge against inflation and has historically been negatively correlated to the US dollar. Therefore, higher inflation and/or depreciation in the US dollar could be positive for the price of gold. In the first half of 2009, we have continued to see increased interest in owning gold as an investment and the amount of gold held in global ETFs totaled approximately 54 million ounces, an increase of over 15 million ounces.
We believe that the outlook for global gold mine production continues to be one of declining supply. The primary drivers for the global decline are a trend of lower grade production by many producers; increasing delays and impediments in bringing projects — especially large-scale projects - - to the production stage; a lack of global exploration success in recent years; and a dearth of new, promising regions for gold exploration and production. A decrease in global industry production raises the potential for a higher sustainable long term gold price.
Sales from the official sector under the Central Bank Gold Agreement (CBGA) are currently on pace to be well below half of the 500 tonnes full-year quota when the current accord expires this September. It is expected that there will likely be a renewed CBGA to take effect upon expiry of the current accord and that this renewal agreement will include sales of up to about 400 tonnes of gold from the International Monetary Fund.
Copper prices generally rose throughout the second quarter of 2009, continuing the pattern of rising copper prices in the previous quarter, from a low of $1.80 per pound to a high of $2.44 per pound. The average price in the quarter was $2.12 per pound and closing price was $2.32 per pound. Copper’s rise occurred mainly as a result of increased Chinese demand and positive sentiment about future economic expansion, including the expected impact on copper demand from government stimulus spending on infrastructure projects. Future copper prices should be influenced by demand from Asia, global economic performance, availability of scrap metal and production levels of mines and smelters. Our remaining 2009 copper production is protected from declines in LME spot prices through the use of forwards and collars. Based on our positions as at June 30, 2009, at spot prices between $1.57 and $2.01 per pound we expect to receive an average minimum cash price of approximately $3.00 per pound. On approximately half of our 2009 production, we are exposed to a decline in market prices below $1.57 per pound and have some upside participation above $2.01 per pound through buying calls that allowed us to lock in gains from $3.03 to $2.01 per pound and selling puts to finance these calls.
| 1 | The market price of gold is one of the most significant factors in determining the profitability of Barrick’s operations. A $50/oz increase/decrease in market gold price would cause reported revenues to increase/decrease by about $195 million (expected impact on EPS is about $0.15 per share, assuming a 30% tax rate) over the remainder of the year, assuming production at the mid-point of our 2009 guidance range. |
| BARRICK SECOND QUARTER 2009 | 8 | MANAGEMENT’S DISCUSSION AND ANALYSIS |
Currency Exchange Rates
In second quarter 2009, both the Canadian and Australian dollars strengthened significantly against the US dollar, partly as a result of stronger energy and commodity prices, as both countries are large net exporters of commodities. The Australian dollar traded in a wide range of 0.69 to 0.83 in the quarter, averaging 0.76 and closing at 0.81.
In the second quarter, we recorded hedge losses in earnings of approximately $2 million for Australian dollar hedges (2008: $59 million gain), primarily impacting our production costs, and a $4 million loss for Canadian dollar hedges (2008: $10 million gain), primarily impacting administration costs. Based on assumed average market exchange rates of $0.80 and $0.86 for the Australian and Canadian dollar, respectively, we expect to record opportunity gains in earnings of approximately $25 million in the remainder of 2009 on these positions.
A$ Currency Contracts
| A$:US$ contracts | Effective | % of Expected | ||||||||||
| (A$ millions) | Hedge Rate | A$ Exposure1 | ||||||||||
20092 | 771 | 0.76 | 92 | % | ||||||||
| 2010 | 1,284 | 0.80 | 84 | % | ||||||||
| 2011 | 1,321 | 0.76 | 92 | % | ||||||||
| 2012 | 964 | 0.74 | 72 | % | ||||||||
| 2013 | 580 | 0.68 | 48 | % | ||||||||
C$ Currency Contracts
| C$:US$ contracts | Effective | % of Expected | ||||||||||
| (C$ millions) | Hedge Rate | C$ Exposure1 | ||||||||||
20092 | 180 | 0.91 | 80 | % | ||||||||
| 2010 | 27 | 0.91 | 7 | % | ||||||||
| 1 | Includes all forecasted operating, sustainable and eligible project capital expenditures. | |
| 2 | Amounts presented represent the remaining position of 2009. |
We also have exposure to the Papua New Guinea kina, Peruvian sol, Chilean peso and Argentinean peso, primarily through mine operating costs.
Fuel
The price of crude oil traded in a wide range of $45 to $73 per barrel, closing at $70 per barrel and averaging $60 per barrel in the quarter, compared to an average of $124 per barrel in the same prior year period.
We directly consume on average about 3.5 million barrels of diesel fuel annually across all our mines. Diesel fuel is refined from crude oil and is therefore subject to the same volatility affecting crude oil prices. Our hedges do not reflect WTI pricing as we utilize financial contracts which trade at a premium to WTI for refining costs. Volatility in crude prices has a significant direct and indirect impact on our production costs. In order to mitigate this volatility, we have a fuel hedge position of 4.2 million barrels at an average price of $90 per barrel, which is primarily designated for our Nevada-based mines.
Financial Fuel Hedge Summary
| Barrels1 | Average | % of Expected | ||||||||||
| (thousands) | Price | Exposure | ||||||||||
20092 | 937 | $ | 97 | 53 | % | |||||||
| 2010 | 1,514 | $ | 104 | 39 | % | |||||||
| 2011 | 725 | $ | 83 | 19 | % | |||||||
| 2012 | 590 | $ | 69 | 15 | % | |||||||
| 2013 | 440 | $ | 63 | 12 | % | |||||||
| 4,206 | $ | 90 | 26 | % | ||||||||
| 1 | Refers to hedge contracts for a combination of WTI, WTB, MOPS and JET. | |
| 2 | Amounts presented represent the remaining position of 2009. |
In the second quarter, we recorded hedge losses in earnings of approximately $28 million on our fuel hedge positions (2008: $18 million gain) and expect to record opportunity losses of approximately $10 million in the remainder of 2009 based on an assumed average market oil price of $70 per barrel.
In addition, our wholly-owned subsidiary, Barrick Energy, provides a natural hedge against our fuel price exposure and is expected to produce 1.3 million barrels of oil equivalent in 2009, or roughly forty percent of our fuel requirements.
US Dollar Interest Rates
In 2008, in response to the contraction of global credit markets and in an effort to spur economic activity and avoid potential deflation, the US Federal Reserve reduced its benchmark rate to between 0 to 0.25%. For the remainder of 2009 and into 2010, we expect that short-term rates will remain at these low levels, with the US Federal Reserve continuing to use monetary policy initiatives in an effort to keep long-term interest rates low. We expect such initiatives to be followed by incremental increases to the short-term rate once economic conditions and credit markets normalize.
At present, our interest rate exposure mainly relates to the mark-to-market value of derivative instruments, the fair value and ongoing payments under US dollar interest-rate swaps and to the interest payments on our variable-rate debt ($0.3 billion at June 30, 2009), interest receipts on our cash balances ($2.0 billion at the end of the quarter) and the valuation and forward prices of our Project Gold Sales Contracts. At present, the
| BARRICK SECOND QUARTER 2009 | 9 | MANAGEMENT’S DISCUSSION AND ANALYSIS |
amount of interest expense recorded in our consolidated statement of income is not materially impacted by changes in short-term interest rates, because the majority of interest costs are fixed. The relative amounts of variable-rate financial assets and liabilities may change in the future, depending upon the amount of operating cash flow we generate, as well as amounts invested in capital expenditures.
FINANCIAL AND OPERATIONAL RESULTS
| Three months ended June 30 | Six months ended June 30 | |||||||||||||||
| ($ millions, except per share in dollars) | 2009 | 2008 | 2009 | 2008 | ||||||||||||
| Revenues | $ | 2,029 | $ | 1,967 | $ | 3,856 | $ | 3,925 | ||||||||
| Net income | 492 | 485 | 863 | 999 | ||||||||||||
Per share1 | 0.56 | 0.56 | 0.99 | 1.15 | ||||||||||||
| Net income | 492 | 485 | 863 | 999 | ||||||||||||
| Impairment charges related to goodwill, property, plant and equipment, and investments | — | — | 2 | 30 | ||||||||||||
| (Gains)/losses on acquisitions/dispositions | (79 | ) | (34 | ) | (81 | ) | (38 | ) | ||||||||
| Foreign currency translation (gains)/losses | 6 | 8 | (72 | ) | 12 | |||||||||||
| Unrealized (gains)/losses on non-hedge derivative instruments | 12 | (17 | ) | 20 | (22 | ) | ||||||||||
Adjusted net income2 | 431 | 442 | 732 | 981 | ||||||||||||
Per share1 | 0.49 | 0.51 | 0.84 | 1.13 | ||||||||||||
EBITDA3 | 954 | 886 | 1,609 | 1,870 | ||||||||||||
| Operating cash flow | 718 | 505 | 1,067 | 1,223 | ||||||||||||
Capital expenditures - sustaining4 | 174 | 135 | �� | 307 | 258 | |||||||||||
Capital expenditures - other4 | 12 | 14 | 22 | 26 | ||||||||||||
Capital expenditures - projects4 | $ | 261 | $ | 99 | 486 | 212 | ||||||||||
| Total assets | 25,331 | 24,355 | ||||||||||||||
| Total liabilities | $ | 8,748 | $ | 7,977 | ||||||||||||
| 1 | Calculated using weighted average number of shares outstanding under the basic method. | |
| 2 | Adjusted net income is a non-GAAP financial performance measure with no standardized meaning under US GAAP. For further information and a detailed reconciliation, please see page 32 of this MD&A. | |
| 3 | EBITDA is a non-GAAP financial performance measure with no standardized meaning under US GAAP. For further information and a detailed reconciliation, please see page 35 of this MD&A. | |
| 4 | Amount presented is on a cash basis and reflects our equity share of capital expenditures. For a detailed reconciliation and further discussion, please see page 26 of this MD&A. |
In second quarter 2009, net income was $492 million, up slightly from the same prior year period. Higher realized gold prices, higher production and lower project development expense were partly offset by higher cash costs, lower realized copper prices and higher income tax expense as a result of a deferred income tax credit recorded in second quarter 2008 due to a valuation allowance release.
For the six months ended June 30 2009, net income was $863 million, down $136 million from the prior year period. The decrease in net income was primarily driven by higher cash costs and lower copper prices. These decreases were partially offset by lower project development expense and lower income tax expense. The decline in income tax expense includes a $70 million currency translation gain, recorded in first quarter 2009 on deferred tax assets due to an election to adopt a US dollar functional currency for Canadian tax purposes.
| BARRICK SECOND QUARTER 2009 | 10 | MANAGEMENT’S DISCUSSION AND ANALYSIS |
Adjusted net income was $431 million for the three month period ended June 30, 2009, a decrease of 2% compared to the same prior year period. Adjusted net income was affected by the same factors as net income, with the exception of the adjusting items. The significant adjusting items consist of a $72 million gain recognized on the acquisition of the additional 50% interest in our Hemlo gold mine in second quarter 2009; a $42 million gain on the sale of our asset backed commercial paper (“ABCP”) in second quarter 2008; and the impact of unrealized gains/losses on non-hedge derivative instruments. For the six month period ended June 30, 2009, adjusted net income was $732 million, a decrease of 25% compared to the same prior year period. The significant adjusting items include: the aforementioned gains on Hemlo and ABCP; a $28 million impairment on the ABCP; a $70 million currency translation gain on deferred tax assets due to an election to adopt a US dollar functional currency for Canadian tax purposes; and the impact of unrealized gains/losses on non-hedge derivative instruments.
EBITDA was $954 million for the three month period ended June 30, 2009 and $1,609 million for the six month period ended June 30, 2009, an increase of 8% and decrease of 14%, respectively, over the comparable prior year periods. EBITDA was impacted by the same factors affecting net income with the exception of the higher income tax expense in second quarter 2009 and lower income tax expense in first half 2009.
Operating cash flow in second quarter 2009 was $718 million, 42% higher than the prior year period primarily due to higher income before tax and lower income taxes paid as a result of the production mix and the use of tax loss carry forwards. Operating cash flow in first half of 2009 was $1,067 million, 13% less than the prior year period as lower income before tax was offset by lower income taxes paid and a smaller increase in inventory balances.
Summary of Key Financial Statistics
| Three months ended June 30 | Six months ended June 30 | |||||||||||||||||||||||||||||||
| Gold | Copper | Gold | Copper | |||||||||||||||||||||||||||||
| 2009 | 2008 | 2009 | 2008 | 2009 | 2008 | 2009 | 2008 | |||||||||||||||||||||||||
Sales1 | ||||||||||||||||||||||||||||||||
| ’000s oz/millions Ibs | 1,882 | 1,866 | 90 | 78 | 3,596 | 3,595 | 176 | 176 | ||||||||||||||||||||||||
| $ millions | $ | 1,754 | $ | 1,684 | $ | 262 | $ | 283 | $ | 3,323 | $ | 3,292 | $ | 509 | $ | 633 | ||||||||||||||||
| Cost of sales ($ millions) | 856 | 796 | 111 | 86 | 1,687 | 1,480 | 226 | 177 | ||||||||||||||||||||||||
Market price2 | 922 | 896 | 2.12 | 3.83 | 915 | 910 | 1.83 | 3.68 | ||||||||||||||||||||||||
Realized price2,3 | 931 | 898 | 3.18 | 3.65 | 923 | 913 | 3.09 | 3.59 | ||||||||||||||||||||||||
Total cash costs2,4,5 | 452 | 434 | $ | 1.25 | $ | 1.08 | 467 | 415 | $ | 1.28 | $ | 1.00 | ||||||||||||||||||||
Net cash costs2,4,6 | $ | 360 | $ | 326 | $ | 378 | $ | 289 | ||||||||||||||||||||||||
| 1 | Gold sales ($ millions) reflect our equity share of sales. | |
| 2 | Per ounce/pound weighted average. | |
| 3 | Realized price is a non-GAAP financial performance measure with no standardized meaning under US GAAP. For further information and a detailed reconciliation, please see page 35 of this MD&A. | |
| 4 | Reflects our equity share of production. | |
| 5 | Total cash costs is a non-GAAP financial performance measure with no standardized meaning under US GAAP. For further information and a detailed reconciliation to cost of sales, please see page 33 of this MD&A. | |
| 6 | Net cash costs is a non-GAAP financial performance measure with no standardized meaning under US GAAP. For further information and a detailed reconciliation to cost of sales, please see page 33 of this MD&A. |
In second quarter 2009, total revenues of $2.0 billion were up slightly compared to the same prior year period, primarily due to higher realized gold prices and an increase in production, partially offset by lower realized copper prices. Realized gold prices of $931 per ounce in second quarter 2009 were $33 per ounce higher than in the prior year period primarily due to the rise in market prices. A 10% increase in copper production was offset by lower realized copper prices. Realized copper prices in second quarter 2009 were 13% lower than in the prior year period; however, they were 50% higher than market prices due to the impact of our copper hedges.
Our copper hedge position resulted in an additional $84 million in realized revenue during the quarter.
Total revenues of $3.9 billion for the first half of 2009 were down slightly compared to the same prior year period, as lower realized copper prices were partially offset by increases in realized gold prices. Realized copper prices in first half were 14% lower than in the prior year period; however, they were 69% higher than market prices due to the impact of our copper hedges. Our copper hedge position resulted in an additional $196 million in realized revenue during the first half of 2009.
| BARRICK SECOND QUARTER 2009 | 11 | MANAGEMENT’S DISCUSSION AND ANALYSIS |
Realized gold prices of $923 per ounce in first half were $10 per ounce higher than in the comparable prior year period.
Cost of sales attributable to gold was $856 million for the three month period ended June 30, 2009 and $1,687 million for the six month period ended June 30, 2009, an increase of 8% and 14%, respectively, over the comparable prior year periods. Cost of sales was impacted by increases in labor costs, realized losses on currency and fuel hedges and lower silver by-product credits. We continue to expect to meet our original cost of sales guidance of $3.2 billion to $3.6 billion in 2009.
Net cash costs per ounce were 10% higher in second quarter 2009 and 31% higher for the first half 2009 compared to the same prior year periods. These increases reflect higher labor costs, realized losses on currency and fuel hedges, lower silver by-product credits and lower copper credits from Zaldívar and Osborne as a result of lower realized copper prices. Net cash costs per ounce were also impacted by our relative production mix through the first half of 2009, with South America, our lowest cost region, contributing a smaller share of total gold production compared to first half 2008, largely due to the sequencing of production. We continue to expect to meet our original net cash costs guidance of $360 to $385 per ounce in 2009.
Total cash costs per ounce were 4% higher in second quarter 2009 and 13% higher in the first half of 2009 compared to the same prior year periods. The increase in total cash costs reflects the factors impacting net cash costs described above, except for the impact of lower copper credits. We continue to expect to meet our full year guidance for total cash costs of $450 to $475 per ounce in 2009.
In second quarter 2009, cost of sales attributable to copper increased by $25 million or 29% compared to the same prior year period. For the six month period ended June 30, 2009, costs of sales attributable to copper was 28% higher than the comparable prior year period. Total cash costs per pound were 16% higher in the second quarter and 28% higher in the first half of 2009 compared to the same prior year periods. The increase in cost of sales attributable to copper and total cash costs per pound was primarily attributable to a significant increase in sulfuric acid consumption and higher electricity prices resulting from a higher-cost power contract at Zaldívar, which came into effect in July 2008. We continue to expect to meet our original 2009 guidance for cost of sales of $470 to $540 million and total cash costs per pound of $1.25 to $1.35 per ounce in 2009.
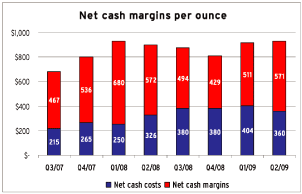
Net cash margins2 for gold were approximately the same in second quarter 2009 compared to the same prior year period, as higher realized prices were offset by higher net cash costs.
| 2 | Net cash margins is a non-GAAP financial performance measure with no standardized meaning under US GAAP. For further information and a detailed reconciliation, please see page 36 of this MD&A. |
| BARRICK SECOND QUARTER 2009 | 12 | MANAGEMENT’S DISCUSSION AND ANALYSIS |
Summary of Key Operational Statistics
| Three months ended June 30 | Six months ended June 30 | |||||||||||||||||||||||||||||||
| Gold | Copper | Gold | Copper | |||||||||||||||||||||||||||||
| 2009 | 2008 | 2009 | 2008 | 2009 | 2008 | 2009 | 2008 | |||||||||||||||||||||||||
| Tons mined (000’s) | 185,363 | 175,510 | 19,243 | 20,236 | 351,477 | 338,420 | 43,037 | 42,208 | ||||||||||||||||||||||||
| Ore tons processed (000’s) | 41,689 | 45,990 | 10,806 | 10,910 | 87,648 | 86,856 | 26,177 | 20,350 | ||||||||||||||||||||||||
| Average grade (ozs/ton and percentage) | 0.052 | 0.047 | 0.645 | 0.591 | 0.049 | 0.049 | 0.612 | 0.617 | ||||||||||||||||||||||||
Production (‘000s oz/millions lbs)1 | 1,866 | 1,857 | 96 | 87 | 3,621 | 3,600 | 191 | 174 | ||||||||||||||||||||||||
| 1 | Gold production reflects our equity share of production. |
Gold production for the second quarter and first half of 2009 was up slightly over the same prior year periods. First quarter 2009 was expected to be our lowest production quarter for the year and production levels increased in the second quarter. We expect production to continue to increase in the second half due to increased production at Veladero, Cortez and the contribution of the newly producing Buzwagi. We continue to expect to meet our 2009 operating guidance of between 7.2 and 7.6 million ounces of gold.
In second quarter 2009, total tons mined increased over the prior year period mainly due to the increased waste stripping at Golden Sunlight and activity at newly producing Buzwagi, offset by decreases at Cortez. Ore tons processed decreased by 9% reflecting a decrease at Cortez, offset by an increase at Veladero. Average ore grades increased as lower grade material processed at Bulyanhulu, Tulawaka and Plutonic was more than offset by grade increases at Goldstrike, Cortez and Cowal.
In first half 2009, total tons mined increased over the prior year period mainly due to Veladero, Kanowna and increased waste stripping at Golden Sunlight, offset by decreases at Porgera and Cowal. Ore tons processed were up slightly as increases at Veladero and Ruby Hill were offset by decreases at Cortez and Round Mountain. Average ore grades were similar year over year as grade increases at Goldstrike, Cowal and Hemlo were offset by lower grade material processed at Veladero, Pierina and Cortez.
Copper production in the second quarter and first half was 9 million pounds and 17 million pounds higher than the same prior year period, respectively. The increase was due to increased grade at Osborne and improved leaching kinetics at Zaldívar. Our estimated 2009 copper production guidance remains between 375 to 400 million pounds.
We are continuously evaluating opportunities to increase our gold and gold/copper production base. Beyond 2009, we expect gold production to increase to approximately 7.7 and 8.1 million ounces in 2010, with the start up of Cortez Hills, at expected lower cash costs.
Full Year 2009 Outlook
| (in millions unless otherwise stated) | Latest 2009E | |||
| Gold | ||||
| Production (millions of ounces) | 7.2 - 7.6 | |||
| Cost of sales | $ | 3,200 - 3,600 | ||
| Net cash costs ($ per ounce) | $ | 360 - 385 | ||
| Total cash costs ($ per ounce) | $ | 450 - 475 | ||
Amortization ($ per ounce)1 | $ | ~120 | ||
| Copper | ||||
| Production (millions of pounds) | 375 - 400 | |||
| Cost of sales | $ | 470 - 540 | ||
| Total cash costs ($ per pound) | $ | 1.25 - 1.35 | ||
| Amortization ($ per pound) | $ | 0.20 - 0.25 | ||
Other amortization and accretion2 | $ | 135 | ||
| Corporate administration | $ | 160 | ||
| Exploration expense | $ | 150 - 160 | ||
Project expense (including equity pick-up)3 | $ | 200 - 230 | ||
| Other expense | $ | 200 | ||
| Interest income | $ | 10 | ||
Interest expense4 | $ | 50 | ||
Capital expenditures - minesite sustaining5 | $ | ~850 | ||
Capital expenditures - projects6 | $ | ~1,500 | ||
Effective income tax rate7 | 30 | % | ||
| 1 | We expect amortization to be at the high end of our original guidance range of $115 - $120 per ounce due to the impact of the Hemlo acquisition. | |
| 2 | This amount reflects amortization expense attributable to Barrick Energy, and on corporate and Regional Business unit offices, plus accretion on our asset retirement obligations. | |
| 3 | In first quarter, we decreased our guidance for project expense in 2009 to $200 to $230 million from $250 to $270 million, which reflects reduced expenditures at certain of our early stage projects. | |
| 4 | In first quarter, we increased our guidance for interest expense in 2009 to $50 million from $30 million, reflecting the issuance of $750 million in debt in March 2009. | |
| 5 | We expect minesite sustaining capital expenditures to be at the high end of our original guidance of $750 to $850 million as a result of increased spend at Turquoise Ridge, Lagunas Norte and Barrick Energy. | |
| 6 | We expect project capital expenditures to be at the high end of our original guidance of $1,300 to $1,500 million with the approval of construction of our Pascua-Lama project. | |
| 7 | The estimated effective tax rate excludes the impact of currency translation gains on deferred tax balances and tax rate changes. |
BARRICK SECOND QUARTER 2009 | 13 | MANAGEMENT’S DISCUSSION AND ANALYSIS |
SIGNIFICANT ACQUISITIONS AND DIVESTITURES
Acquisition of 50% interest in Hemlo
On April 22, 2009, we completed the acquisition of the remaining 50% interest in the Williams and David Bell gold mines (“Hemlo”) in Canada from Teck Resources Ltd for cash consideration of $48 million, thereby increasing our interest to 100%. Following this transaction, in accordance with the new requirements for step acquisitions in FAS 141(R), we remeasured our existing 50% interest in the assets and liabilities of Hemlo to their current fair values. This remeasurement resulted in an increase in property, plant and equipment and deferred tax liabilities of $96 million and $34 million respectively, and a reduction in goodwill of $20 million. The net gain on the acquisition of the remaining 50% interest in Hemlo of $72 million was recognized in other income. The primary cause of these gains was the revaluation of property, plant and equipment to estimated fair value, and will result in $223 million higher amortization over the remaining four years of the Hemlo mine. We estimate that $39 million of additional amortization will be recorded in 2009.
Disposition of Henty mine
On July 6, 2009, we finalized an agreement with Bendigo Mining Limited (“Bendigo”) to divest our Henty mine in Australia for consideration of approximately $4 million cash, adjusted for the benefit of production from July 1, 2009 and $2 million in Bendigo shares. We intend to account for our investment in Bendigo as available-for-sale securities. Barrick will also receive a royalty payable on production from future exploration discoveries, capped at approximately $17 million. In third quarter 2009, we expect to report a gain of approximately $7 million as a result of the transaction.
Henty is one of our smallest mines, was scheduled for closure at the end of 2009 and did not fit into our long-range plans. The sale allowed us to monetize the remaining production and is not expected to impact our previously issued production and cash cost guidance. We will not have any involvement in the mine once the transaction closes, with the exception of our insignificant investment in Bendigo and any future royalty payments that may arise from future exploration discoveries.
OPERATING SEGMENTS REVIEW
We report our results of operations using a geographical business unit approach: North America, South America, Australia Pacific and Africa. In addition, we have a Capital Projects segment, distinct from our regional business units, to focus on managing projects. This structure reflects how we manage our business and how we classify our operations for planning and measuring performance.
In our Financial Statements, we present a measure of historical segment income that reflects gold sales and copper sales at average consolidated realized gold and copper prices, respectively, less segment expenses and amortization of segment property, plant and equipment.
We monitor segment expenses and period to period fluctuations in our total cost of sales on a unit basis, per ounce of gold and per pound of copper, which is referred to as total cash costs. Therefore, the discussion of results for our producing mines focuses primarily on this statistic to explain changes in segment expenses.
North America
Key Operating Statistics1
| Three months ended June 30 | Six months ended June 30 | |||||||||||||||||||||||
| 2009 | 2008 | % Change | 2009 | 2008 | % Change | |||||||||||||||||||
| Tons mined (millions) | 101,386 | 93,375 | 9 | % | 190,682 | 177,524 | 7 | % | ||||||||||||||||
| Ore tons processed (millions) | 14,956 | 21,868 | (32 | %) | 35,067 | 38,712 | (9 | %) | ||||||||||||||||
| Average grade (ozs/ton) | 0.058 | 0.039 | 49 | % | 0.050 | 0.044 | 14 | % | ||||||||||||||||
| Gold produced (000’s/oz) | 765 | 693 | 10 | % | 1,501 | 1,307 | 15 | % | ||||||||||||||||
| Cost of sales ($ millions) | 384 | 325 | 18 | % | 744 | 645 | 15 | % | ||||||||||||||||
| Total cash costs (per oz) | $ | 484 | $ | 493 | (2 | %) | $ | 491 | $ | 498 | (1 | %) | ||||||||||||
| 1 | Key Operating Statistics include the underground operations at Cortez Hills. For an update of the Cortez Hills project, refer to the Capital Projects section on page 17. |
Production for the second quarter and first half of 2009 was up 10% and 15%, respectively, over the comparable prior year. These increases were due to greater production at Goldstrike, Hemlo, Ruby Hill, and Storm, partly offset by lower production at Bald Mountain and Golden Sunlight.
BARRICK SECOND QUARTER 2009 | 14 | MANAGEMENT’S DISCUSSION AND ANALYSIS |
At Goldstrike, production for the second quarter and first half of this year increased by 9% and 21%, respectively, as a result of an increase in average grade due to the fact that a significant portion of the first two quarters in 2008 were focused on waste stripping. We expect that Goldstrike will continue to move in and out of extended waste stripping phases. At Hemlo and Storm, production increased reflecting the acquisition of our joint venture partners’ interests in those mines of 50% and 40%, respectively. At Ruby Hill, production increased due to a significant increase in ore tons processed as mining in the same prior year periods was focused on waste stripping. In fourth quarter 2008, Golden Sunlight entered an extended development phase and is not expected to produce gold until 2012.
Cost of sales has increased by $59 million or 18% and $99 million or 15% for the second quarter and first half of 2009, respectively, compared to the same prior year periods. Over the same periods, total cash costs per ounce were down slightly to $484 for the second quarter and $491 for the first half of this year. Cost of sales was adversely impacted by the acquisitions of the additional interests in Hemlo and Storm, which are higher cost operations; planned increases in labor as we ramp up underground activities at Cortez Hills; and realized losses on our fuel hedge contracts of $9 million for the second quarter and $22 million for the first half. Total cash costs per ounce levels remained relatively constant as higher production levels were able to offset the increases in cost of sales.
South America
Key Operating Statistics
Key Operating Statistics
| Three months ended June 30 | Six months ended June 30 | |||||||||||||||||||||||
| 2009 | 2008 | % Change | 2009 | 2008 | % Change | |||||||||||||||||||
Gold | ||||||||||||||||||||||||
| Tons mined (millions) | 39,173 | 38,028 | 3 | % | 77,354 | 75,103 | 3 | % | ||||||||||||||||
| Ore tons processed (millions) | 17,558 | 15,937 | 10 | % | 35,264 | 31,549 | 12 | % | ||||||||||||||||
| Average grade (ozs/ton) | 0.033 | 0.034 | (3 | %) | 0.031 | 0.039 | (20 | %) | ||||||||||||||||
| Gold produced (000’s/oz) | 442 | 536 | (18 | %) | 838 | 1,077 | (22 | %) | ||||||||||||||||
| Cost of sales ($ millions) | 127 | 149 | (15 | %) | 242 | 249 | (3 | %) | ||||||||||||||||
| Total cash costs (per oz) | $ | 277 | $ | 270 | 3 | % | $ | 283 | $ | 233 | 21 | % | ||||||||||||
Copper | ||||||||||||||||||||||||
| Copper produced (millions of lbs) | 75 | 69 | 9 | % | 151 | 142 | 6 | % | ||||||||||||||||
| Cost of sales ($ millions) | 94 | 57 | 65 | % | 192 | 115 | 67 | % | ||||||||||||||||
| Total cash costs (per oz) | $ | 1.27 | $ | 0.90 | 41 | % | $ | 1.29 | $ | 0.83 | 55 | % | ||||||||||||
Gold production for the second quarter and first half of 2009 was 18% and 22% lower, respectively, than the comparable prior year periods. These decreases were due to lower production at Pierina and Veladero, while Lagunas Norte continues to produce at the same level as prior year. Pierina production was affected by the planned mining of lower grade ore as the mine nears the end of its economic life anticipated in 2012. At Veladero, production declined by 28% due to mining in lower grade areas of the pit. Production at Veladero is expected to increase in the second half of 2009 with the completion of the crusher circuit expansion and mining of higher grade material.
Cost of sales applicable to gold has decreased by $22 million or 15% and $7 million or 3% for the second quarter and first half of the year, respectively, over the comparable prior year periods. Cost of sales was lower because of lower production levels and a decrease in maintenance costs, which was partially offset by lower silver by-product credits. Total cash costs per ounce were up 3% to $277 and 21% to $283 for the second quarter and first half of 2009, respectively, over the same prior year periods. Total cash costs per ounce were adversely impacted by the lower production, caused by lower grades at Pierina and Veladero.
Copper production for the second quarter and first half of the year was 9% and 6% higher than the same prior year periods, respectively. Zaldívar had an increase in heap leach ore and improved leaching kinetics as prior year kinetics were adversely affected by acid supply shortages.
Copper cost of sales has increased by $37 million or 65% and $77 million or 67% for the second quarter and first half of 2009, respectively. Total cash costs per pound were up 41% for the second quarter to $1.27 and 55% for the first half to $1.29 from the same prior year periods. Cost of sales and total cash costs per pound were adversely affected by higher acid consumption and higher prices for electricity under a new contract effective July 2008, under which the cost of power fluctuates with market oil prices.
BARRICK SECOND QUARTER 2009 | 15 | MANAGEMENT’S DISCUSSION AND ANALYSIS |
Australia Pacific
Key Operating Statistics
Key Operating Statistics
| Three months ended June 30 | Six months ended June 30 | |||||||||||||||||||||||
| 2009 | 2008 | % Change | 2009 | 2008 | % Change | |||||||||||||||||||
Gold | ||||||||||||||||||||||||
| Tons mined (millions) | 36,113 | 37,569 | (4 | %) | 70,219 | 73,772 | (5 | %) | ||||||||||||||||
| Ore tons processed (millions) | 7,506 | 7,161 | 5 | % | 14,594 | 14,580 | 0 | % | ||||||||||||||||
| Average grade (ozs/ton) | 0.074 | 0.076 | 4 | % | 0.076 | 0.072 | 6 | % | ||||||||||||||||
| Gold produced (000’s/oz) | 488 | 471 | 4 | % | 977 | 906 | 8 | % | ||||||||||||||||
| Cost of sales ($ millions) | 264 | 242 | 9 | % | 549 | 426 | 29 | % | ||||||||||||||||
| Total cash costs (per oz) | $ | 552 | $ | 520 | 6 | % | $ | 580 | $ | 481 | 21 | % | ||||||||||||
Copper | ||||||||||||||||||||||||
| Copper produced (millions of lbs) | 21 | 18 | 17 | % | 40 | 32 | 25 | % | ||||||||||||||||
| Cost of sales ($ millions) | 17 | 29 | (41 | %) | 34 | 62 | (45 | %) | ||||||||||||||||
| Total cash costs (per oz) | $ | 1.13 | $ | 1.77 | (36 | %) | $ | 1.27 | $ | 1.66 | (24 | %) | ||||||||||||
Gold production for the second quarter and first half of 2009 was up 4% and 8%, respectively, from the comparable prior year. These increases were due to higher production at Cowal, Kalgoorlie and Plutonic, which were partially offset by lower production at Porgera and Yilgarn South.
At Cowal, the slip on the east wall restricted access to high grade ore in the first half of 2008 and production levels returned to expected levels by the end of that year. Production at Kalgoorlie increased due to the mining of higher grade ore compared to the prior year periods. At Plutonic, production was negatively affected during June 2008 as a result of a gas pipeline explosion, which caused the temporary shut down of the mill. Production returned to expected levels later in 2008 after alternative gas sources were found. Production at Porgera has decreased over the same prior year periods, as wall stability issues affected production in second quarter 2009. At Yilgarn South lower production was principally due to lower grade underground material.
Cost of sales applicable to gold has increased by $22 million or 9% and $123 million or 29% for the second quarter and first half of 2009, respectively. Total cash costs per ounce were up 6% for the second quarter to $552 and 21% for the first half to $580 from the same prior year period. Cost of sales and total cash costs per ounce were adversely impacted by higher labor and contractor costs and higher natural gas prices under a new contract effective June 2008. Higher royalties impacted costs as Australian dollar gold prices traded at higher levels than 2008. Cost of sales and total cash costs per ounce also reflected realized losses on our Australian dollar hedges and fuel hedge contracts of $10 million or $20 per ounce for the second quarter and $55 million or $56 per ounce for the first half.
Copper production for the second quarter and first half of 2009 was up 17% and 25%, respectively, compared to the same prior year periods. These increases were due to higher head grades, recovery and increased tonnage experienced in the first half of 2009. Copper cost of sales decreased by $12 million or 41 % and $28 million or 45% for the second quarter and first half, respectively. Total cash costs per pound were down 36% for the second quarter to $1.13 and 24% for the first half to $1.27 from the same prior year periods. Improvements in cost of sales were a result of lower direct mining costs. Total cash costs per pound reflected the lower cost of sales and the increased production experienced in 2009.
Africa
Key Operating Statistics
Key Operating Statistics
| Three months ended June 30 | Six months ended June 30 | |||||||||||||||||||||||
| 2009 | 2008 | % Change | 2009 | 2008 | % Change | |||||||||||||||||||
| Tons mined (millions) | 8,691 | 6,536 | 33 | % | 13,222 | 12,022 | 10 | % | ||||||||||||||||
| Ore tons processed (millions) | 1,669 | 1,031 | 62 | % | 2,723 | 2,017 | 35 | % | ||||||||||||||||
| Average grade (ozs/ton) | 0.112 | 0.166 | (33 | %) | 0.122 | 0.165 | (26 | %) | ||||||||||||||||
| Gold produced (000’s/oz) | 163 | 151 | 8 | % | 290 | 295 | (2 | %) | ||||||||||||||||
| Cost of sales ($ millions) | 81 | 80 | 1 | % | 152 | 160 | (5 | %) | ||||||||||||||||
| Total cash costs (per oz) | $ | 539 | $ | 493 | 9 | % | $ | 549 | $ | 500 | 10 | % | ||||||||||||
BARRICK SECOND QUARTER 2009 | 16 | MANAGEMENT’S DISCUSSION AND ANALYSIS |
Gold production for the second quarter of 2009 was 8% higher than the same prior year period and first half production levels were similar year over year. The second quarter increase reflects higher production from newly producing Buzwagi, partially offset by lower production at Tulawaka. For the first half, the new production from Buzwagi and increased production from Bulyanhulu were offset by decreased production at Tulawaka and North Mara. Buzwagi entered production in May 2009 and is expected to contribute significant, low cost production to the region. At Bulyanhulu, production was higher compared to the same prior year period due to the negative impact of the illegal strike on production in the first half of 2008. Tulawaka production was 64% lower than the prior year due to the shift from open pit to underground mining planned in 2009. The decrease in production at North Mara was a result of completion of mining at the higher grade Gokona pit in 2008 and a move to the lower grade Nyabirama and Nyabigena pits in 2009 as well as processing constraints experienced due to plant downtime.
Cost of sales has increased slightly in second quarter 2009 and decreased $8 million or 5% for the first half of the year over the same prior periods. Total cash costs per ounce were up approximately 10% from the same prior year period for both the second quarter and first half to $539 and $549, respectively. Cost of sales and total cash costs per ounce were adversely impacted by lower production at Tulawaka and lower by-product credits realized at Bulyanhulu, offset by new, low cost production from Buzwagi starting in the second quarter.
Capital Projects
Key Operating Statistics
Key Operating Statistics
| Three months ended June 30 | Six months ended June 30 | |||||||||||||||||||||||
| (in millions) | 2009 | 2008 | % Change | 2009 | 2008 | % Change | ||||||||||||||||||
Project expenses1 | 4 | 58 | (93 | %) | 20 | 92 | (78 | %) | ||||||||||||||||
Project expense incurred by equity investees2 | 19 | 10 | 90 | % | 49 | 15 | 227 | % | ||||||||||||||||
| Total project expense | 23 | 68 | (66 | %) | 69 | 107 | (36 | %) | ||||||||||||||||
Capital expenditures3 | 174 | 57 | 205 | % | 337 | 149 | 126 | % | ||||||||||||||||
Capital commitments4 | $ | 583 | $ | 219 | 166 | % | ||||||||||||||||||
| 1 | Amounts presented represent our share of project development expense. | |
| 2 | Amounts presented represent our share of project development expense from projects for which we equity account, including Reko Diq, Cerro Casale, Kabanga and Donlin Creek | |
| 3 | Amounts presented represent our share of capital expenditures on a cash basis, and exclude expenditures incurred at our Cortez Hills property (three months 2009: $80 million, 2008: $42 million; six months 2009: $142 million, 2008: $63 million) and Golden Sunlight (three months 2009: $7 million, 2008: nil; six months 2009: $7 million, 2008: nil) which are not managed by the Capital Projects group. | |
| 4 | Capital commitments represent purchase obligations as at June 30 where binding commitments have been entered into for long lead capital items related to construction activities at our projects. |
Project expenses primarily relate to activities undertaken to advance the Sedibelo, Cerro Casale and Reko Diq projects. Project expense was higher in 2008 because costs at Pueblo Viejo were expensed until the end of 2008 when the project met US reserve reporting criteria. Capital expenditures are attributable to our Pueblo Viejo, Pascua-Lama and Buzwagi projects. Capital expenditures at Buzwagi have been included in minesite sustaining capital expenditure starting in May 2009. We expect project capital expenditures to increase over the remaining quarters of 2009 as activities at Pueblo Viejo and Pascua-Lama ramp up.
Significant projects
As discussed in the Africa operating segment review, the Buzwagi project in Tanzania commenced commercial production in May 2009. In second quarter, the mine produced 36 thousand ounces at total cash costs of $357 per ounce. Construction efforts are winding down and contractors have demobilized from site. The flotation plant, necessary to process sulfide ore, is expected to start operation in the third quarter. Buzwagi is in line with its pre-production capital budget of about $400 million and is expected to contribute approximately 200 thousand ounces in 2009 at total cash costs of about $335 per ounce.
At our Cortez Hills project in Nevada, we received a favorable decision from the Federal District Court in Reno during the first quarter allowing the full project to go forward. That Court decision is currently being appealed. Pre-stripping work is progressing in the open pit and work continues on the crusher, conveyor, leach pad, workshops and access roads. The project is expected to be completed in the first quarter of 2010 and once completed, it is expected to become a key, long life, low cost mine. Total construction costs remain in line with the pre-production capital budget of approximately $500 million with $366 million spent to date. In addition to the original scope of work, we continue to accelerate
BARRICK SECOND QUARTER 2009 | 17 | MANAGEMENT’S DISCUSSION AND ANALYSIS |
our underground development schedule. Underground ore production has begun and is being processed at the Cortez Pipeline mill (oxide) and the Goldstrike autoclave (refractory). To date, we have spent $69 million, and we now expect to spend an additional $30 to $50 million advancing underground development in the remainder of the year. We continue to capitalize interest on the development of the open pit part of the mine.
The Pueblo Viejo project in the Dominican Republic is advancing on schedule and within its pre-production capital budget of approximately $2.7 billion (100% basis), with initial production anticipated in the fourth quarter of 2011. Barrick’s 60% share of annual gold production in the first full five years of operation is expected to be 600 to 650 thousand ounces at total cash costs of $275 to $300 per ounce. Pueblo Viejo is a long life asset with an expected mine life of over 25 years.
In May 2009, we announced the go-ahead decision on construction of the Pascua-Lama project following the satisfactory resolution of certain outstanding fiscal matters. The pre-production construction plan is estimated at $2.8 - $3.0 billion, with commissioning expected in late 2012 and initial production expected in first quarter 2013. Average annual production is expected to be 750 to 800 thousand ounces of gold and 35 million ounces of silver in the first five full years with total cash costs between $20 - $50 per ounce3, making it one of the lowest cost gold producing mines in the world. We continue to work towards obtaining the remaining sectoral permits.
At Sedibelo, a platinum project in South Africa, Barrick obtained a 10% stake in the property following the completion of a feasibility study in 2008. Activities required under the mining right continue, though they have been modified to reflect the changing economic climate. We continue to evaluate our options given the current economics of platinum group metals.
A feasibility study update of our 50% owned Donlin Creek project in Alaska was approved by the Board of the Donlin Creek LLC in second quarter 2009. Further optimization work is underway to look at both capital and operating efficiencies. Pre-permitting activities are underway.
Reko Diq is a large copper-gold porphyry mineral deposit on the Tethyan belt, located in southwest Pakistan in the province of Baluchistan. We own 37.5% of this project. A project pre-feasibility study is currently in the final stages of review and is expected to be finalized in third quarter 2009. Work on a feasibility study has commenced and is expected to be completed in early 2010.
Cerro Casale is one of the world’s largest undeveloped gold and copper deposits, located in the Maricunga district of Region III in Chile, 145 km southeast of Copiapo. We own 50% of this project. A pre-feasibility study was completed in 2008. We continue to expect a full feasibility study to be completed by the end of third quarter 2009.
Kabanga is one of the world’s largest undeveloped nickel sulfide deposits located in Tanzania. Xstrata Nickel earned a 50% interest in the project under the earn-in agreement during the fourth quarter 2008 and is currently the operator of this project. All future expenditures will be funded equally by Xstrata Nickel and Barrick. We are committed to completing the final phase of a feasibility study, which we have targeted for completion by the end of 2009 at an expected cost of approximately $40 million (100% basis).
| 3 | Total cash costs per ounce are calculated assuming a gold price of $800 per ounce and applying silver by-product credits assuming a silver price of $12 per ounce. |
BARRICK SECOND QUARTER 2009 | 18 | MANAGEMENT’S DISCUSSION AND ANALYSIS |
REVIEW OF SIGNIFICANT OPERATING EXPENSES
Exploration
| Three months | Six months ended | |||||||||||||||||
| ended June 30 | June 30 | |||||||||||||||||
| ($ millions) | 2009 | 2008 | 2009 | 2008 | Comments on significant trends and variances | |||||||||||||
| North America | $ | 17 | $ | 25 | $ | 27 | $ | 41 | Lower second quarter expenditures at Spring Valley ($2 million), Ruby Hill ($1 million), Turquoise Ridge JV ($1 million), Bald Mountain ($1 million) and Cortez ($1 million). Year to date decrease mainly reflects lower expenditures at Cortez ($8 million) and Pinson ($3 million). | |||||||||
| South America | 5 | 11 | 11 | 21 | Lower year to date expenditures mainly due to lower activity at Zaldívar ($5 million) and decrease in Chile ($3 million). | |||||||||||||
| Australia Pacific | 11 | 12 | 23 | 23 | Lower second quarter expenditures at Lawlers ($1 million). | |||||||||||||
| Africa | 2 | 5 | 3 | 8 | Lower year to date expenditures at North Mara ($4 million). | |||||||||||||
| Capital Projects | — | — | 1 | 1 | ||||||||||||||
| Other | — | 1 | 2 | 3 | ||||||||||||||
Total | $ | 35 | $ | 54 | $ | 67 | $ | 97 | ||||||||||
Project Development Expense
| Three months | Six months ended | |||||||||||||||||
| ended June 30 | June 30 | |||||||||||||||||
| ($ millions) | 2009 | 2008 | 2009 | 2008 | Comments on significant trends and variances | |||||||||||||
| Mine development | $ | 1 | $ | 65 | $ | 13 | $ | 97 | Mainly because in 2009 expenditures at Pueblo Viejo are now being capitalized ($56 million) and lower activity at Kainantu ($6 million). | |||||||||
| Non-capitalizable project costs | 3 | 9 | 7 | 17 | The decrease in year to date was due to lower expenditures at Sedibelo ($4 million) and Pinson ($4 million). | |||||||||||||
| Business development/other | 10 | 9 | 18 | 15 | ||||||||||||||
| Total | $ | 14 | $ | 83 | $ | 38 | $ | 129 | ||||||||||
BARRICK SECOND QUARTER 2009 | 19 | MANAGEMENT’S DISCUSSION AND ANALYSIS |
Amortization and Accretion Expense
| Three months | Six months | ||||||||||||||||||
| ended June 30 | ended June 30 | ||||||||||||||||||
| ($ millions) | 2009 | 2008 | 2009 | 2008 | Comments on variances | ||||||||||||||
Gold mines | |||||||||||||||||||
| North America | $ | 97 | $ | 84 | $176 | $ | 155 | Higher amortization is mainly due to an increase in sales volume at Goldstrike ($23 million) and Hemlo ($16��million), which was partially offset by lower sales volume at Golden Sunlight ($18 million). | |||||||||||
| South America | 32 | 47 | 62 | 89 | Mainly due to lower sales volume at Pierina ($16 million) and Veladero ($11 million). | ||||||||||||||
| Australia Pacific | 71 | 64 | 142 | 121 | Higher sales volume resulted in higher amortization at Kanowna ($12 million), Plutonic ($7 million), and Darlot ($2 million). | ||||||||||||||
| Africa | 17 | 19 | 31 | 37 | Mainly due to lower sales volume at North Mara ($6 million). | ||||||||||||||
Copper mines | |||||||||||||||||||
| South America | 19 | 17 | 38 | 37 | |||||||||||||||
| Australia Pacific | — | 12 | 2 | 27 | Due to impairment recorded in fourth quarter 2008 which reduced property, plant and equipment amounts to salvage values. | ||||||||||||||
Other | 16 | 7 | 48 | 12 | Reflects Barrick Energy ($15 million), a one-time amortization adjustment ($16 million) and Pueblo Viejo ($ 3 million). | ||||||||||||||
Amortization total | $ | 252 | $ | 250 | $499 | $ | 478 | ||||||||||||
Accretion | 15 | 14 | 29 | 27 | |||||||||||||||
Total | $ | 267 | $ | 264 | $528 | $ | 505 | ||||||||||||
| Impairment Charges, Corporate Administration, Interest Income and Interest Expense, Other Expense and Other Income | |||||||||||||||||||
| Three months | Six months | ||||||||||||||||||
| ended June 30 | ended June 30 | ||||||||||||||||||
| ($ millions) | 2009 | 2008 | 2009 | 2008 | Comments on variances | ||||||||||||||
| Write-down of investments | $ | — | $ | — | $ | 1 | $ | 39 | In 2008, we recorded an impairment charge on Asset Backed Commercial paper ($39 million). | ||||||||||
| Corporate administration | 45 | 38 | 80 | 71 | Increase mainly due to stock option expense ($3 million) and technical services ($4 million). | ||||||||||||||
| Interest income | 2 | 5 | 5 | 22 | Decrease is mainly due to lower average cash balance in first quarter 2009 ($1.8 billion) compared to first quarter 2008 ($2.1 billion), combined with lower market interest rates. | ||||||||||||||
| Interest costs | |||||||||||||||||||
| Incurred | $ | 80 | $ | 59 | $ | 149 | $ | 109 | Increase is mainly due to additional interest incurred because of bond issuances (Q3 2008: $1,250 million, Q1 2009: $750 million) | ||||||||||
| Capitalized | 66 | 51 | 133 | 95 | Higher interest capitalized in second quarter due to capital projects relating to Cortez Hills ($17 million), Cerro Casale ($12 million), Pueblo Viejo ($7 million) and Pascua-Lama ($21 million) and other mines ($10 million). | ||||||||||||||
| Interest expensed | 14 | 8 | 16 | 14 | |||||||||||||||
| Other expense | 60 | 50 | 135 | 104 | Increase is due to severance costs ($11 million) accrued in Q1 2009 and a pension adjustment ($6 million) recorded over both quarters. | ||||||||||||||
| Other income | $ | 89 | $ | 54 | $ | 83 | $ | 84 | Comprised mainly of gain on acquisition of Hemlo in Q2 2009 ($72 million) and the realization on the gain on sale of ABCP in Q2 2008 ($42 million). | ||||||||||
BARRICK SECOND QUARTER 2009 | 20 | MANAGEMENT’S DISCUSSION AND ANALYSIS |
Income Taxes
Income tax expense was $198 million in second quarter 2009. Excluding the impact of the gain on acquisition of Hemlo and currency translation losses on deferred tax balances, the underlying effective tax rate for income in second quarter 2009 was 29%.
In fourth quarter 2008, we filed an election under Canadian draft legislation to prepare some of our Canadian tax returns using US dollars as the functional currency effective January 1, 2008. The legislation was enacted in first quarter 2009 which resulted in a one-time benefit of $70 million.
The Ontario provincial budget presented in Q1 2009 included a corporate tax rate reduction. When the budget legislation is enacted, likely later in 2009, we expect to record a reduction to our Canadian deferred tax asset and a corresponding deferred tax expense of about $55 to $65 million.
Our expected underlying effective tax rate for 2009 is 30%. This expected underlying rate excludes the effect of the gain on acquisition of Hemlo, Canadian functional currency election, currency translation gains and losses on deferred tax balances, gains and losses on non-hedge derivatives, the impact of tax rate changes and any changes in deferred tax valuation allowances.
We record deferred tax charges or credits if changes in facts or circumstances affect the estimated tax basis of assets and therefore the amount of deferred tax assets or liabilities, or because of changes in valuation allowances reflecting changing expectations in our ability to realize deferred tax assets. The interpretation of tax regulations and legislation and their application to our business is complex and subject to change. We have significant amounts of deferred tax assets, including tax loss carry forwards, and also deferred tax liabilities. Potential changes of any of these amounts, as well as our ability to realize deferred tax assets, could significantly affect net income or cash flow in future periods.
QUARTERLY INFORMATION
Quarterly Information($ millions, except where indicated)
| 2009 | 2008 | 2007 | ||||||||||||||||||||||||||||||
| Q2 | Q1 | Q4 | Q3 | Q2 | Q1 | Q4 | Q3 | |||||||||||||||||||||||||
Sales1 | $ | 2,029 | $ | 1,827 | $ | 2,110 | $ | 1,878 | $ | 1,967 | $ | 1,958 | $ | 1,917 | $ | 1,684 | ||||||||||||||||
Realized price2-gold | 931 | 915 | 809 | 874 | 898 | 930 | 801 | 682 | ||||||||||||||||||||||||
Realized price2-copper | 3.18 | 2.93 | 3.06 | 3.49 | 3.65 | 3.50 | 3.11 | 3.38 | ||||||||||||||||||||||||
| Cost of sales | 975 | 955 | 1,191 | 1,028 | 882 | 775 | 834 | 794 | ||||||||||||||||||||||||
| Net income/(loss) | 492 | 371 | (468 | ) | 254 | 485 | 514 | 537 | 345 | |||||||||||||||||||||||
Per share3 (dollars) | 0.56 | 0.42 | (0.54 | ) | 0.29 | 0.56 | 0.59 | 0.62 | 0.40 | |||||||||||||||||||||||
Adjusted net income4 | 431 | 296 | 277 | 408 | 442 | 537 | 597 | 293 | ||||||||||||||||||||||||
Per share3 (dollars) | 0.49 | 0.34 | 0.32 | 0.47 | 0.51 | 0.62 | 0.69 | 0.34 | ||||||||||||||||||||||||
EBITDA5 | 954 | 655 | (45 | ) | 522 | 886 | 984 | 793 | 710 | |||||||||||||||||||||||
| Operating cash flow | $ | 718 | $ | 349 | $ | 439 | $ | 508 | $ | 505 | $ | 718 | $ | 676 | $ | 557 | ||||||||||||||||
| 1 | Per our consolidated financial statements . | |
| 2 | Per ounce/pound weighted average. | |
| 3 | Calculated using weighted average number of shares outstanding under the basic method of earnings per share. | |
| 4 | Adjusted net income is a non-GAAP financial performance measure with no standardized meaning under US GAAP. For further information and a detailed reconciliation, please see page 32 of this MD&A. | |
| 5 | EBITDA is a non-GAAP financial performance measure with no standardized meaning under US GAAP. For further information and a detailed reconciliation, please see page 35 of this MD&A. |
Our financial results for the last eight quarters reflect: volatile spot gold and copper prices that impact realized sales price and higher production costs largely due to inflationary cost pressures. In fourth quarter 2008, the net loss included write-downs of goodwill and property, plant and equipment, and investments totaling $773 million, net of tax.
| BARRICK SECOND QUARTER 2009 | 21 | MANAGEMENT’S DISCUSSION AND ANALYSIS |
FINANCIAL CONDITION REVIEW
Summary Balance Sheet and Key Financial Ratios
| ($ millions, except ratios and share amounts) | As at June 30, 2009 | As at December 31, 2008 | ||||||
| Total cash and cash equivalents | $ | 2,038 | $ | 1,437 | ||||
| Total current assets | 4,336 | 4,112 | ||||||
| Total current liabilities | 1,390 | 1,844 | ||||||
| Working Capital | 2,946 | 2,268 | ||||||
| Total assets | 25,331 | 24,161 | ||||||
| Total liabilities | 8,748 | 8,702 | ||||||
Net debt1 | 2,986 | 2,889 | ||||||
| Total shareholders’ equity | $ | 16,257 | $ | 15,277 | ||||
Total common shares outstanding2 | 873,716,785 | 872,738,664 | ||||||
Key Financial Ratios: | ||||||||
Current ratio3 | 3.12:1 | 2.23:1 | ||||||
Debt-to-total capitalization4 | 0.27:1 | 0.24:1 | ||||||
Debt-to-book value5 | 0.20:1 | 0.19:1 | ||||||
Debt-to-equity6 | 0.32:1 | 0.30:1 | ||||||
| 1 | Represents total long-term debt of $5,024 million (December 31, 2008: $4,326 million) excluding fair value adjustments less total cash and cash equivalents of $2,038 million ($1,437 million) as at June 30, 2009. | |
| 2 | Total common shares outstanding does not include 13,184,115 stock options | |
| 3 | Represents current assets divided by current liabilities as at June 30, 2009 and December 31, 2008. | |
| 4 | Represents long term debt of $5,024 million (December 31, 2008: $4,326 million) divided by long term debt plus share capital of $13,403 million (December 31 2008: $13,372 million) | |
| 5 | Represents net debt divided by total liabilities and shareholders’ equity as at June 30, 2009 and December 31, 2008. | |
| 6 | Represents net debt divided by total shareholders’ equity as at June 30, 2009 and December 31, 2008. |
Balance Sheet Review
Total assets were $25.3 billion as at June 30, 2009, an increase of $1.1 billion or 5% compared to December 31, 2008. The increase primarily reflects an increase of cash as a result of operating cash flow, an increase in property, plant and equipment, partially offset by a decrease in current derivative assets. Total liabilities are $8.7 billion, which is similar to December 31, 2008 balances. Changes in the composition are primarily due to an increase in long term debt of $0.7 billion reflecting the issuance of debt in March 2009, partially offset by a decrease in derivative liabilities.
Our asset base is primarily comprised of non-current assets such as property, plant and equipment and goodwill, reflecting the capital intensive nature of the mining business and our history of growing through acquisitions, production inventories and cash and equivalents. We typically do not carry a material accounts receivable balance, since only sales of concentrate have a settlement period.
Shareholders’ Equity
Outstanding Share Data
| Shares outstanding | ||||
| As at July 13, 2009 | No. of shares | |||
| Common shares | 873,731,185 | |||
| Stock options | 13,184,115 | |||
During first quarter 2009, we redeemed the remainder (0.5 million) of the Barrick Gold Inc. exchangeable shares into Barrick common shares. The special voting share was also redeemed and cancelled during the first quarter.
Comprehensive Income
Comprehensive income consists of net income, together with certain other economic gains and losses that collectively are described as “other comprehensive income/loss” or “OCI”, and excluded from the income statement in accordance with US GAAP.
In second quarter 2009, other comprehensive income before tax was $527 million, mainly consisting of mark to market gains of $538 million on cash flow hedge contracts designated for future periods, caused primarily by changes in currency exchange rates and prices for copper and oil; reclassification adjustments totaling $51 million for hedge gains designated for second quarter 2009 that were transferred to earnings; $27 million in
| BARRICK SECOND QUARTER 2009 | 22 | MANAGEMENT’S DISCUSSION AND ANALYSIS |
gains on currency translation adjustments for Barrick Energy; and a $13 million unrealized gain on the fair value of investments.
Included in accumulated other comprehensive income at June 30, 2009 were unrealized losses on currency and oil hedge contracts totaling $5 million, based on June 30, 2009 market rates. The related hedge contracts are designated against operating costs primarily over the next three years, and are expected to help protect against the impact of the weakening US dollar and/or rising oil prices. We also had accumulated hedge gains on copper hedge contracts totaling $162 million, based on June 30, 2009 market rates. We expect to record these gains in copper sales over the remainder of 2009. The hedge gains/losses are expected to be recorded in earnings at the same time that the corresponding hedged copper sales, operating costs and amortization of capital expenditures are recorded in earnings.
Financial Position
We have maintained a sound financial position even with the market turbulence that was experienced in 2008 and into 2009. This is illustrated by our significant cash and working capital balances and our relatively low debt to equity and debt to total capitalization ratios as at June 30, 2009.
Our sound financial position is reflected in the fact that we have the only A-rated balance sheet in the gold mining industry as measured by S&P. Our credit ratings, as established by S&P, Moody’s and DBRS, have remained stable. Our ability to access unsecured debt markets and the related cost of debt financing is, in part, dependent upon maintaining an acceptable credit rating. Deterioration in our credit rating would not adversely affect existing debt securities, but could impact funding costs for any new debt financing.
Credit Rating from Major Rating Agencies
| At July 13, 2009: | ||||
| Standard and Poor’s (“S&P”) | A- | |||
| Moody’s | Baa1 | |||
| DBRS | A | |||
The key factors impacting our financial position, and therefore our credit rating, include the following:
| • | Our market capitalization and the strength of our balance sheet, including the amount of net debt and our debt-to-equity ratio (refer to liquidity section of this MD&A for discussion of key factors impacting these measures in 2009); | |
| • | Our net cash flow, including cash generated by operating activities (refer to liquidity section of this MD&A for discussion of key factors impacting these measures in 2009); | |
| • | Expected capital expenditure requirements and other off balance sheet commitments (refer to the off balance sheet arrangements section of this MD&A and the financial outlook of our 2008 Annual Report for discussion of key factors impacting these measures in future periods); | |
| • | The quantity of our gold reserves (refer to page 141 of our 2008 Annual Report for more information); | |
| • | Our geo-political risk profile; and | |
| • | The mark-to-market value of our Project Gold Sales Contracts (refer to fair value of derivatives position section of this MD&A.) |
Counterparty Risk
Our financial position is also dependent, in part, on our exposure to the risk of counterparty defaults related to our derivative contracts and our Project Gold Sales Contracts and the net fair value of these contracts. Counterparty risk is the risk that a third party might fail to fulfill its performance obligations under the terms of a financial instrument. Counterparty risk can be assessed both in terms of credit risk and liquidity risk. For cash and equivalents and accounts receivable, credit risk represents the carrying amount on the balance sheet, net of any overdraft positions.
For derivatives, when the fair value is positive, this creates credit risk. When the fair value of a derivative is negative, we assume no credit risk. However, liquidity risk exists to the extent a counterparty is no longer able to perform in accordance with the terms of the contract due to insolvency. In cases where we have a legally enforceable master netting agreement with a counterparty, credit risk exposure represents the net amount of the positive and negative fair values for similar types of derivatives. For a net negative amount, we regard credit risk as being zero. For a net positive amount, this is a reasonable basis to measure credit risk when there is a legally enforceable master netting agreement. We mitigate credit and liquidity risk by:
| • | Entering into derivatives with high credit-quality counterparties; | |
| • | Limiting the amount of exposure to each counterparty; and | |
| • | Monitoring the financial condition of counterparties. |
If a counterparty to a Project Gold Sales Contract is unable to conduct transactions in an accessible international bullion market due to causes beyond its control, including the inability of the counterparty to purchase gold in the open market or to fund any such purchase, and no commercially reasonable alternative means exist for the counterparty to enter into
| BARRICK SECOND QUARTER 2009 | 23 | MANAGEMENT’S DISCUSSION AND ANALYSIS |
transactions having the same effect, the counterparty has no obligation to extend the scheduled delivery date of such contract and, depending on the circumstances, this may result in early settlement of such contract. To date we have seen no evidence of lack of bullion availability with any of our counterparties. For our Project Gold Sales Contracts, the insolvency of a counterparty could, in certain circumstances, lead to a requirement to settle transactions between ourselves and the insolvent counterparty and may ultimately require the payment of a net amount by us to the counterparty. In determining the amounts owing as a consequence of any such settlement, we would be entitled to claim contractual damages suffered by us as a result of a counterparty default. These damages could include the costs of effecting replacement trades with other counterparties that would put us in the same position as we would have been if the insolvent counterparty had not defaulted. A settlement caused by a counterparty insolvency event would not trigger any cross-defaults under our other financial instruments.
We currently have Project Gold Sales Contracts in place with 17 counterparties, which consist primarily of large commercial banks. We proactively manage our exposure to individual counterparties in order to mitigate both credit and liquidity risks. As at June 30, 2009, we had one counterparty that held 13% of our total ounce and mark-to-market position and no other counterparty had in excess of 10% of the total ounce or mark-to-market position. Through June 30, 2009, none of the counterparties with which we held outstanding contracts had declared insolvency. In the event of a potential counterparty default due to insolvency, we would seek to have the contract reassigned to an alternative counterparty who is better able to perform under the contract. In certain circumstances, we have been able to assign contracts to alternative counterparties to manage counterparty risk, and we expect that we will be able to continue to do so to the extent creditworthy counterparties are willing to take on assigned contracts.
Fair Value of Derivative Positions
| As at June 30, 2009 | Unrealized | |||
| ($ millions) | Gain/(Loss) | |||
| Fixed Price Gold Sales contracts | $ | (3,118 | ) | |
| Floating Spot-Price Gold Sales contracts | (2,183 | ) | ||
| Silver Sales Contracts | (88 | ) | ||
| Currency contracts | 67 | |||
| Interest rate contracts | (6 | ) | ||
| Copper contracts | 215 | |||
| Fuel contracts | (63 | ) | ||
Total | $ | (5,176 | ) | |
Liquidity
Total cash and cash equivalents at the end of second quarter 2009 were $2.0 billion. At quarter end, our cash position consisted of a mix of term deposits and treasury bills. Net debt was $3.0 billion, with a debt-to-equity ratio of 0.32:1. The majority of our outstanding long-term debt matures at various dates beyond 2012, with approximately $250 million repayable4 in the period 2009 to 2012. In addition, counterparties to debt and derivative instruments do not have unilateral discretionary rights to accelerate repayment at earlier dates, and therefore we are largely protected from short-term liquidity fluctuations.
One of our primary sources of liquidity is operating cash flow, and in the second quarter 2009 we generated $718 million. The principal risk factor affecting operating cash flow is realized gold prices, which in turn are impacted by market gold prices, and project gold sales contracts. At present, any settlement of project gold sales would adversely impact our overall liquidity since market prices exceed contract prices. We are largely protected in 2009 from lower copper prices by our copper hedge position, although we will be exposed to market prices in 2010 onwards.
The principal uses of liquidity are sustaining capital expenditures, construction activities at capital projects, acquisitions, dividend payments and interest payments. We regularly assess alternatives for capital allocation and our capital structure to optimize both returns on capital and our cost of capital. Sustaining capital expenditures have averaged about $0.7 billion per year over the past three years and assuming 2008 dividend rates, dividends total about $0.35 billion per year. The balance of cash flow generated by operations, after paying for sustaining capital and dividends, is available for investment in capital projects and acquisitions. We have invested over $4.7 billion on capital projects and acquisitions in the past three years, partly financed by cash flow from operations and partly by new financings, including $750 million in new debt issued in March 2009. We expect to spend about $4.7 billion over the next four years to fund remaining construction activities at Cortez Hills, Pueblo Viejo, and Pascua-Lama, partly funded by project financing for a portion of the construction cost of Pueblo Viejo and Pascua-Lama. For Pueblo Viejo we are in active discussions with a group of export credit agencies to put in place $1 billion of project financing, including our partners’ share, which covers a portion of the total capital cost of the project. We are also finalizing feasibility studies for various other projects, which would require substantial up front capital investments to bring them into production, and are still
| 4 | Includes $49 million of capital lease payments. |
| BARRICK SECOND QUARTER 2009 | 24 | MANAGEMENT’S DISCUSSION AND ANALYSIS |
subject to a final capital allocation review. To the extent our expected uses of liquidity are projected to exceed sources, such as operating cash flow, then we would seek to secure funding from available sources, which could result in significant changes to our overall capital structure and/or our debt:equity ratio. At present, we have a cash balance of $2.0 billion and a $1.5 billion credit facility available as sources of financing.
Investments in capital projects and acquisitions are subject to an internal capital allocation review prior to proceeding with new expenditures. This review entails an assessment of our overall liquidity, the overall level of investment required, and the prioritization of investments. The assessment also takes into account expected levels of future operating cash flow and the cost and availability of new financing. A decline in market gold prices and/or copper prices could impact the timing and amount of future investment in capital projects and/or other uses of capital.
Alternatives for sourcing our future capital or other liquidity needs include other credit facilities, future operating cash flow, sale of non-core assets, project financings and debt or equity financings. These alternatives are continually evaluated to determine the optimal mix of capital resources of our capital needs.
In light of current global economic conditions, our ability to secure new financing for our expected capital needs for capital projects could be significantly impacted, particularly if these conditions persist for an extended period of time. In particular:
| • | An increased cost of financing due to rising credit spreads could have a negative impact on overall project economics. | |
| • | A lack of availability of credit on acceptable terms could make it difficult for us to raise the capital required to build some or all of our projects on the timelines previously anticipated or at all. | |
| • | Our joint venture partners may also have difficulty securing funding for their share of project capital requirements which could impact the ability to build some of the projects. |
Sources and Uses of Cash
Our liquidity needs can be met through a variety of sources, including: cash generated from operations, short-term borrowings and the issuance of long-term debt and/or equity.
Cash Inflow (Outflow)
| For the three | For the six | |||||||||||||||
| months ended | months ended | |||||||||||||||
| ($ millions) | June 30 | June 30 | ||||||||||||||
| For the three months ended June 30 | 2009 | 2008 | 2009 | 2008 | ||||||||||||
| Operating activities | $ | 718 | $ | 505 | $ | 1,067 | $ | 1,223 | ||||||||
| Investing activities | ||||||||||||||||
| Capital expenditures - minesite sustaining | (174 | ) | (135 | ) | (307 | ) | (258 | ) | ||||||||
| Capital expenditures - - projects | (331 | ) | (99 | ) | (616 | ) | (212 | ) | ||||||||
| Acquisitions | (48 | ) | (4 | ) | (48 | ) | (1,726 | ) | ||||||||
| Other investing | — | (74 | ) | (68 | ) | (182 | ) | |||||||||
| Total investing activities | (553 | ) | (312 | ) | (1,039 | ) | (2,378 | ) | ||||||||
| Financing activities | ||||||||||||||||
| Net debt | (144 | ) | (45 | ) | 574 | 940 | ||||||||||
| Dividends | (174 | ) | (174 | ) | (174 | ) | (174 | ) | ||||||||
| Other financing | 67 | 26 | 156 | 106 | ||||||||||||
| Total financing activities | (251 | ) | (193 | ) | 556 | 872 | ||||||||||
| Effect of exchange rates | 20 | 3 | 17 | 10 | ||||||||||||
| Change in cash and equivalents | $ | (66 | ) | $ | 3 | $ | 601 | $ | (273 | ) | ||||||

Operating cash flows for second quarter were $718 million compared to $505 million in the same prior year period, primarily due to higher income before tax and lower income taxes paid.
Operating cash flows for first half were $1,067 million compared to $1,223 million in the same prior year period. The decrease was primarily due to lower income before tax partially offset by lower income taxes paid and a smaller increase in inventory balances.
In second quarter 2009, cash used in investing activities amounted to $553 million, 77% higher than the prior year period. The increase is primarily due to the ramp-up of spending at our development projects, particularly Pueblo Viejo and Cortez Hills.
| BARRICK SECOND QUARTER 2009 | 25 | MANAGEMENT’S DISCUSSION AND ANALYSIS |
In the first half of 2009, cash used in investing activities amounted to $1,039 million, due to sustaining capital expenditures at our operating mines and development projects. In the prior year period acquisitions included the Cortez acquisition for $1,722 million in cash.
Capital Expenditures1
| For the three | For the six | |||||||||||||||
| months ended | months ended | |||||||||||||||
| June 30 | June 30 | |||||||||||||||
| ($ millions) | 2009 | 2008 | 2009 | 2008 | ||||||||||||
Capital expenditures - - projects | ||||||||||||||||
Buzwagi2 | $ | 15 | $ | 36 | $ | 52 | $ | 95 | ||||||||
| Pascua-Lama | 52 | 21 | 90 | 54 | ||||||||||||
| Pueblo Viejo | 106 | — | 194 | — | ||||||||||||
| Cortez Hills | 80 | 42 | 142 | 63 | ||||||||||||
| Golden Sunlight | 7 | — | 7 | — | ||||||||||||
| Sedibelo | 1 | — | 1 | — | ||||||||||||
Sub-total3 | $ | 261 | $ | 99 | $ | 486 | $ | 212 | ||||||||
Capital expenditures attributable to non-controlling interests4 | 70 | — | 130 | — | ||||||||||||
Total capital expenditures - - projects | $ | 331 | $ | 99 | $ | 616 | $ | 212 | ||||||||
Capital expenditures - -minesite sustaining | ||||||||||||||||
| North America | $ | 33 | $ | 37 | $ | 68 | $ | 66 | ||||||||
South America5 | 57 | 26 | 97 | 57 | ||||||||||||
| Australia Pacific | 44 | 54 | 88 | 104 | ||||||||||||
Africa2 | 40 | 18 | 54 | 31 | ||||||||||||
Total capital expenditures - - minesite sustaining | $ | 174 | $ | 135 | $ | 307 | $ | 258 | ||||||||
Capital expenditures - other | 12 | 14 | 22 | 26 | ||||||||||||
Capitalized interest | 88 | 78 | 130 | 95 | ||||||||||||
Total | $ | 605 | $ | 326 | $ | 1,075 | $ | 591 | ||||||||
| 1 | These amounts are presented on a cash basis consistent with the amounts presented on the Consolidated Statement of Cash Flows. | |
| 2 | Buzwagi entered into production as of May 1, 2009. Capital expenditures from May onwards have been reflected in minesite sustaining, although construction will not be finalized until third quarter 2009. | |
| 3 | On an accrual basis, our share of project capital expenditures is $328 million (3 months) and $646 million (6 months) including capitalized interest. | |
| 4 | Amount reflects our partners’ share of expenditures at the Pueblo Viejo project on a cash basis. | |
| 5 | Increases in South America reflect the crusher expansion expenditures at Veladero. |
Financing Activities
Cash used by financing activities was $251 million in the second quarter, a 30% increase over same prior year period, primarily as a result of increased debt repayments. Financing activities provided $556 million in the first half, primarily a result of our debt issuance in March 2009, offset by the debt repayments.
Off Balance Sheet Arrangements
Project Gold Sales Contracts
We have 9.5 million ounces of existing gold sales contracts with expected delivery dates between 2012 and 2019. The contracting parties are bullion banks whose business includes entering into contracts to purchase gold from mining companies. The terms of our gold and silver sales contracts enable us to deliver gold and silver whenever we choose over the primarily ten-year terms of the contracts. The forward sales prices on our Project Gold Sales Contracts have not been fully fixed, and thus remain sensitive to long-term interest rates. As part of our Master Trading Agreements (“MTAs”), Project Gold Sales Contracts are not subject to any provisions regarding any financial go-ahead decisions with construction, or any possible delay or change on the projects.
Key Aspects of Project Gold Sales Contracts
| Weighted | ||||||||||||||||
| Average | Mark-to- | |||||||||||||||
| Ounces | Future | Market | % of total | |||||||||||||
| (millions) | Price1 | Value2 | reserves3 | |||||||||||||
| Fixed Price Contracts | ||||||||||||||||
(non-participating)4 | 5.4 | $ | 376 | $ | (3,118 | ) | 4 | % | ||||||||
| Floating Spot-Price Contracts | ||||||||||||||||
(fully participating)5 | 4.1 | 397 | (2,183 | ) | 3 | % | ||||||||||
| 9.5 | $ | 385 | $ | (5,301 | ) | 7 | % | |||||||||
| 1 | Weighted average price per ounce based on current contract rates resetting from 2009 to 2017 and calculated at a spot gold price of $935 per ounce. | |
| 2 | At a spot gold price of $935 per ounce and market interest rates. | |
| 3 | Based on December 31, 2008 Proven and Probable Reserves calculated in accordance with Canadian reporting standards. | |
| 4 | The future sales price on our fixed price contracts do not participate in movements in the gold price. | |
| 5 | The future sales price on our floating spot-price contracts participate in movements in the gold price. |
| BARRICK SECOND QUARTER 2009 | 26 | MANAGEMENT’S DISCUSSION AND ANALYSIS |
Included in the 9.5 million ounces committed under our Project Gold Sales Contracts are floating spot-price contracts under which we are committed to deliver 4.1 million ounces of gold at future spot prices less an average price adjustment of $538 per ounce. Project Gold Sales Contracts allow us to move positions between fixed and floating prices. When a contract is converted from a fixed price to a floating price, the difference between the current market price of gold at the date of conversion and the contracted forward sales price is locked-in: i.e. the unrealized loss is fixed. Thereafter, future increases and decreases in market gold prices directly impact the final contract price. In a rising gold price environment, we have the opportunity to improve the price of the contract (assuming the gold price appreciates at a rate more than contango) and participate in higher gold prices by resetting a floating price contract to a fixed price contract. Conversely, a decline in gold price subsequent to the conversion would reduce the final contract price we receive. Therefore, floating price contracts increase our exposure to gold price movements, both upwards and downwards.
US dollar interest rates, gold lease rates, credit spreads relating to both the counterparties and Barrick’s credit quality, and the economic impact on the counterparties associated with funding Project Gold Sales Contracts with negative mark-to-market balances have a material impact on the difference between the forward gold price over the current spot price (“contango”), and, ultimately, the realized price under gold forward sales contracts entered into by Barrick. Low US dollar interest rates, higher gold lease rates and an increase in the credit spreads compared to the prior year may cause the Project Gold Sales Contracts to be in backwardation when rates are reset, with the result that our realized price under the forward sales contracts will decrease as contracts reset over the next few years. We estimate that the impact of a continuation of present unusual market conditions for US dollar interest rates, credit spreads and gold lease rates in existence as at June 30, 2009 would lead to a decline in the weighted average future contract price by approximately $1 per ounce in the remainder of 2009, by approximately $10 per ounce in 2010 and by approximately $18 per ounce in 2011 on the entire position. This was calculated assuming a constant spot gold price of $935 per ounce, the current Project Gold Sales Contracts positions as at June 30, 2009, and resetting contracts with current interim delivery dates in 2009-2011 to the end of 2011. In 2009, we have no significant exposure to gold lease rates, and about one quarter of the Project Gold Sales Contracts are exposed to US dollar interest rates and credit spreads.
Key Terms of Gold Sales Contracts
In all of our MTAs, which govern the terms of gold sales contracts with our 17 counterparties, the following applies.
| • | The counterparties do not have unilateral discretionary “right to break” provisions. | |
| • | There are no credit downgrade provisions. | |
| • | We are not subject to any margin calls, regardless of the price of gold. | |
| • | We have the right to settle our gold sales contracts on two days notice at any time during the life of the contracts, or keep these forward gold sales contracts outstanding for primarily up to 10 years. | |
| • | At our option, we can sell gold at the market price or the contract price, whichever is higher, up to the termination date of the MTAs. Unless extended further, currently, we have to deliver 250 thousand ounces by January 2012, 550 thousand ounces by December 2017, 400 thousand ounces by January 2018, and the remaining 8.3 million ounces currently have termination dates from the second half of 2018 to 2023. |
The MTAs with our counterparties do provide for early close out of certain transactions in the event of a material adverse change in our ability, or our principal hedging subsidiary’s ability, to perform our or its gold delivery and other obligations under the MTAs and related parent guarantees, a lack of gold market and for customary events of default such as covenant breaches, insolvency or bankruptcy. The principal financial covenants are:
| • | We must maintain a minimum consolidated net worth of at least $2 billion (approximately $16 billion at June 30, 2009). The MTAs exclude unrealized mark-to-market valuations in the calculation of consolidated net worth. | |
| • | We must maintain a maximum long-term debt to consolidated net worth ratio of less than 2:1 (we have consistently been below 1:1). |
In all cases, under the terms of the MTAs, the period over which we are required to deliver gold is extended annually by one year, or kept “evergreen”, regardless of the intended delivery dates, unless otherwise notified by the counterparty. This means that, with each year that passes, the termination date of most MTAs is extended into the future by one year. In the first half of 2009, all MTAs that came up for renewal were extended by an additional year.
As spot gold prices increase or decrease, the value of our gold mineral reserves and amount of potential operating cash inflows generally increase or decrease. The
| BARRICK SECOND QUARTER 2009 | 27 | MANAGEMENT’S DISCUSSION AND ANALYSIS |
unrealized mark-to-market loss on our fixed-price Project Gold Sales Contracts also increases or decreases. The mark-to-market value represents the cancellation value of these contracts based on current market levels, and does not represent an immediate economic obligation for payment by us. Our obligations under the Project Gold Sales Contracts are to deliver an agreed upon quantity of gold at a contracted price by the termination date of the contracts (currently 2018 or 2019 in most cases). Project Gold Sales Contracts are not recorded on our balance sheet. The economic impact of these contracts is reflected in our Financial Statements within gold sales based on selling prices under the contracts at the time we record revenue from the physical delivery of gold under the contracts.
Commitments and Contingencies
Capital Expenditures Not Yet Committed
We expect to incur capital expenditures during the next five years for both projects and producing mines. The projects are at various stages of development, from primarily exploration or scoping study stage through to the construction execution stage. The ultimate decision to incur capital expenditures at each potential site is subject to positive results which allow the project to advance past decision hurdles. Two projects are at an advanced stage, namely Cortez Hills and Pueblo Viejo at June 30, 2009 (refer to page 17 for further details)
Contractual Obligations and Commitments
| Payments due | ||||||||||||||||||||||||||||
| As at June 30, 2009 | ||||||||||||||||||||||||||||
| 2014 and | ||||||||||||||||||||||||||||
| ($ millions) | 20091 | 2010 | 2011 | 2012 | 2013 | thereafter | Total | |||||||||||||||||||||
Long-term debt2 | ||||||||||||||||||||||||||||
| Repayment of principal | $ | 26 | $ | 30 | $ | 10 | $ | 133 | $ | 565 | $ | 4,207 | $ | 4,971 | ||||||||||||||
| Capital leases | 14 | 21 | 9 | 5 | 4 | — | 53 | |||||||||||||||||||||
| Interest | 146 | 301 | 300 | 298 | 282 | 3,046 | 4,373 | |||||||||||||||||||||
Asset retirement obligations3 | 73 | 89 | 71 | 95 | 63 | 1,051 | 1,442 | |||||||||||||||||||||
| Operating leases | 11 | 10 | 6 | 3 | — | — | 30 | |||||||||||||||||||||
| Restricted share units | 23 | 34 | 43 | 1 | — | — | 101 | |||||||||||||||||||||
| Pension benefits | 57 | 29 | 24 | 24 | 24 | 116 | 274 | |||||||||||||||||||||
| Other post-retirement obligations | 3 | 3 | 3 | 3 | 2 | 11 | 25 | |||||||||||||||||||||
Derivative liabilities4 | 75 | 99 | 31 | 15 | — | — | 220 | |||||||||||||||||||||
Purchase obligations for supplies and consumables5 | 405 | 248 | 151 | 108 | 102 | 216 | 1,230 | |||||||||||||||||||||
Capital commitments6 | 342 | 270 | 56 | 47 | 16 | 0 | 731 | |||||||||||||||||||||
| Social development costs | 57 | 10 | 9 | 9 | 6 | 78 | 169 | |||||||||||||||||||||
Total | $ | 1,232 | $ | 1,144 | $ | 713 | $ | 741 | $ | 1,064 | $ | 8,725 | $ | 13,619 | ||||||||||||||
| 1 | Represents the obligations and commitments for the remainder of the year. | |
| 2 | Long-Term Debt and Interest - Our debt obligations do not include any subjective acceleration clauses or other clauses that enable the holder of the debt to call for early repayment, except in the event that we breach any of the terms and conditions of the debt or for other customary events of default. The Veladero financing is collateralized by assets at the Veladero mine. Other than this security, we are not required to post any collateral under any debt obligations. The terms of our debt obligations would not be affected by deterioration in our credit rating. Projected interest payments on variable rate debt were based on interest rates in effect at June 30, 2009. Interest is calculated on our long-term debt obligations using both fixed and variable rates. | |
| 3 | Asset Retirement Obligations - Amounts presented in the table represent the undiscounted future payments for the expected cost of asset retirement obligations. | |
| 4 | Derivative Liabilities - Amounts presented in the table relate to derivative contracts disclosed under notes 2 and 16 to the Financial Statements. Actual payments related to derivative contracts may change given variable market conditions. | |
| 5 | Purchase Obligations for Supplies and Consumables - Includes commitments related to new purchase obligations to secure a supply of acid, tires and cyanide for our production process. | |
| 6 | Capital Commitments - Purchase obligations for capital expenditures include only those items where binding commitments have been entered into. Commitments as at June 30, 2009 mainly related to construction capital at Pueblo Viejo and Pascua-Lama. |
Litigation and Claims
We are currently subject to litigation including that disclosed in note 20 to the Financial Statements, and we may be involved in disputes with other parties in the future that may result in litigation. If we are unable to resolve these disputes favorably, it may have a material adverse impact on our financial condition, cash flow and results of operations.
| BARRICK SECOND QUARTER 2009 | 28 | MANAGEMENT’S DISCUSSION AND ANALYSIS |
NEW ACCOUNTING POLICIES AND ACCOUNTING ESTIMATES
Management has discussed the development and selection of our critical accounting estimates with the Audit Committee of the Board of Directors, and the Audit Committee has reviewed the disclosure relating to such estimates in conjunction with its review of this MD&A. The accounting policies and methods we utilize determine how we report our financial condition and results of operations, and they may require management to make estimates or rely on assumptions about matters that are inherently uncertain. In this MD&A, we have provided an update for any changes in accounting policies and critical accounting estimates from our 2008 annual MD&A.
Accounting Policy Changes
FSP FAS 107-1 and APB 28-1, Interim Disclosures about Fair Value of Financial Instruments.
To enhance the transparency surrounding the treatment of financial instruments, this new guidance requires FAS 107 disclosures to be made at each interim reporting period regardless of how these instruments are recognized in the financial statements. We adopted the increased disclosure requirements beginning in first quarter 2009. Refer to note 17 for related disclosures.
FSP FAS 140-4 and FIN 46(R)-8, Disclosures by Public Entities (Enterprises) about Transfers of Financial Assets and Interests in Variable Interest Entities (FSP FAS 140-4 and FIN 46(R)-8)
In December 2008, the FASB issued FSP FAS 140-4 and FIN 46(R)-8 for the purpose of improving the transparency of transfers of financial assets and an enterprise’s involvement with variable interest entities (“VIEs”), including qualifying special-purpose entities (“QSPEs”). The impact on our financial reporting requirements is limited to the new VIE disclosures.
The VIE disclosure requirements focus on an enterprise’s involvement with VIEs and its judgments about the accounting for them. The FSP also requires disclosure of the details of any financial or other support provided to a VIE that the enterprise was not previously contractually required to provide, and the primary reasons for providing the support. The primary beneficiary of a VIE is also required to disclose the terms of any arrangements that could require the enterprise to provide future support to the VIE. In addition, FSP FAS 140-4 and FIN 46(R)-8 require disclosure of the carrying amount and classification of the variable interest entity’s assets and liabilities in the Balance Sheet and a reconciliation of those amounts to the enterprise’s maximum exposure to loss.
The adoption of this FSP in the fourth quarter of 2008, has resulted in expanded disclosure around our involvement with our VIEs and the significant judgments and assumptions we make in accounting for them. Refer to our 2008 annual financial statements for further details.
FAS 161, Disclosures about Derivative Instruments and Hedging Activities (FAS 161)
In first quarter 2009, we adopted the provisions of FAS 161. Under FAS 161 entities are required to provide enhanced disclosures about (a) how and why an entity uses derivative instruments, (b) how derivative instruments and related hedged items are accounted for under FAS 133 and its related interpretations, and (c) how derivative instruments and related hedged items affect an entity’s financial position, financial performance and cash flows. To the extent the required information was not previously disclosed in our 2008 annual financial statements, we incorporated new disclosures in note 16.
FAS 141(R), Business Combinations (FAS 141(R))
In first quarter 2009, we began applying the provisions of FAS 141(R), which replaced FAS 141, for business combinations consummated after the effective date of December 15, 2008. Under FAS 141(R), business acquisitions will be accounted for under the “acquisition method”, compared to the “purchase method” mandated by FAS 141.
The more significant changes to our accounting for business combinations that will result from applying the acquisition method include: (i) the definition of a business is broadened to include some development stage entities, and therefore more acquisitions may be accounted for as business combinations rather than asset acquisitions; (ii) the measurement date for equity interests issued by the acquirer is the acquisition date instead of a few days before and after terms are agreed to and announced, which may significantly change the amount recorded for the acquired business if share prices differ from the agreement and announcement date to the acquisition date; (iii) all future adjustments to income tax estimates will be recorded to income tax expense, whereas under FAS 141 certain changes in income tax estimates were recorded to goodwill; (iv) acquisition-related costs of the acquirer, including investment banking fees, legal fees, accounting fees, valuation fees, and other professional or consulting fees will be expensed as incurred, whereas under FAS 141 these costs were capitalized as part of the business combination; (v) the assets acquired and liabilities assumed as part of a business combination, whether full,
| BARRICK SECOND QUARTER 2009 | 29 | MANAGEMENT’S DISCUSSION AND ANALYSIS |
partial or step acquisition, result in all assets and liabilities recorded at 100% of fair value, whereas under FAS 141 only the controlling interest’s portion is recorded at fair value; (vi) recognition of a bargain purchase gain when the fair value of the identifiable assets exceeds the purchase price, where as under FAS 141, the net book value of the identifiable assets would have been adjusted downward; and (vii) the non-controlling interest will be recorded at its share of fair value of net assets acquired, including its share of goodwill, whereas under FAS 141 the non-controlling interest is recorded at its share of carrying value of net assets acquired with no goodwill being allocated.
FAS 160, Non-controlling Interests in Consolidated Financial Statements (FAS 160)
In first quarter 2009, we adopted the provisions of FAS 160. Under FAS 160, non-controlling interests are measured at 100% of the fair value of assets acquired and liabilities assumed. Under US GAAP prior to the effective date of FAS 160, non-controlling interests were measured at book value. For presentation and disclosure purposes under FAS 160, non-controlling interests are classified as a separate component of equity. In addition, FAS 160 changes the manner in which increases/decreases in ownership percentages are accounted for. Changes in ownership percentages are recorded as equity transactions and no gain or loss is recognized as long as the parent retains control of the subsidiary. When a parent company deconsolidates a subsidiary but retains a non-controlling interest, the non-controlling interest is re-measured at fair value on the date control is lost and a gain or loss is recognized at that time. Under FAS 160, accumulated losses attributable to the non-controlling interests are no longer limited to the original carrying amount, and therefore non-controlling interests could have a negative carrying balance. The provisions of FAS 160 are to be applied prospectively with the exception of the presentation and disclosure provisions, which are to be applied for all prior periods presented in the financial statements. The presentation and disclosure provisions of FAS 160 resulted in the reclassification of non-controlling interests to the Equity section of the Balance Sheet totaling $326 million for June 30, 2009 (December 31, 2008: $182 million).
International Financial Reporting Standards (IFRS)
We have commenced the process to convert our basis of accounting from US GAAP to IFRS effective our first quarter report in 2011. The transition date of January 1, 2010 will require the restatement, for comparative purposes, of our previously reported balance sheets as at December 31, 2009 and December 31, 2010 and our interim and annual consolidated statements of income and cash flows for 2010.
The conversion to IFRS from US GAAP is a significant undertaking, and as a result, we established a dedicated IFRS conversion team in early 2009 to lead this process. The implementation project consists of three primary phases, which in certain cases will be in process concurrently.
| • | Initial diagnostic phase: This phase involves performing a high-level impact assessment to identify key areas that may be impacted by the transition to IFRS. Each potential impact identified during this phase was ranked as having a high, moderate or low impact on our financial reporting; information systems, internal controls over financial reporting; business processes and procedures; other downstream business impacts; and overall difficulty of the conversion effort. | |
| • | Impact analysis, evaluation and solution development phase: This phase involves the selection of IFRS accounting polices by senior management and the review by audit committee; the quantification of the impact of changes to our existing accounting policies on our opening IFRS balance sheet; and the development of draft IFRS financial statements. This phase also involves the development of IFRS training programs for key personnel, and the identification of any required changes to our internal controls over financial reporting and business processes and procedures. | |
| • | Implementation and review phase: This phase involves the delivery of our IFRS training programs to key finance and other personnel and the implementation of the required changes to our information systems and business policies and procedures identified in the previous phase of the project. It will culminate in the collection of financial information necessary to prepare IFRS financial statements and audit committee approval of IFRS financial statements. |
We completed the initial diagnostic phase in the second quarter of 2009 and we are now in the impact analysis, evaluation and solution development phase. We expect to complete the selection of IFRS accounting policies in third quarter 2009.
| BARRICK SECOND QUARTER 2009 | 30 | MANAGEMENT’S DISCUSSION AND ANALYSIS |
Accounting Estimates
Reserve Estimates Used to Measure Amortization of Property, Plant and Equipment
Impact of Historic Changes in Reserve Estimates on Amortization
| Reserves | Amortization increase (decrease) | |||||||||||
| (millions oz/pounds) | increase | Periods ended June 30, 2009 | ||||||||||
| ($ millions) | (decrease)1 | Three months | Six Months | |||||||||
Gold | ||||||||||||
North America2 | 9.6 | $ | (7 | ) | $ | (8 | ) | |||||
| Australia Pacific | 0.3 | (2 | ) | (3 | ) | |||||||
| Africa | (0.5 | ) | — | (1 | ) | |||||||
South America3 | 13.5 | (1 | ) | (3 | ) | |||||||
Total Gold | 22.9 | $ | (10 | ) | $ | (15 | ) | |||||
Copper | ||||||||||||
Australia Pacific4 | (153 | ) | $ | (1 | ) | $ | (1 | ) | ||||
South America3 | 1,023 | (3 | ) | (6 | ) | |||||||
Total Copper | 870 | $ | (4 | ) | $ | (7 | ) | |||||
| 1 | Each year we update our reserve estimates as at the end of the year as part of our normal business cycle. Reserve changes presented were calculated as at the end of 2008 and are in millions of contained ounces/pounds. | |
| 2 | The increase in reserves attributable to North America is primarily due to the acquisitions of the additional 40% interest of Cortez in second quarter 2008 and the additional 50% of Hemlo in second quarter 2009. The impact of this reserve increase on amortization is partially offset by the increase in property, plant and equipment at Cortez and Hemlo as a result of the purchase price allocation. | |
| 3 | The increase in gold and copper reserves in South America is primarily due to the inclusion of Cerro Casale in reserves at the end of 2008. Cerro Casale is a development project and therefore this increase does not impact current amortization expense. | |
| 4 | Amortization expense in 2009 reflects the impairment charges at Osborne in fourth quarter 2008 which reduced property, plant and equipment to salvage values. Consequently, the decrease in reserves had an insignificant impact on amortization expense recorded in second quarter 2009. |
Fair Value of Asset Retirement Obligations (“AROs”)
At our operating mines, we continued to record AROs based on proper closure of the mine. It is reasonably possible that circumstances could arise during or by the end of the mine life that will require material revisions to AROs. In particular, the extent of water treatment can have a material effect on the fair value of AROs. The expected water quality at the end of the mine life, which is the primary driver of the extent of water treatment, can change significantly over the life of a mine. The period of time over which we have assumed that water quality monitoring and treatment will be required has a significant impact on AROs at closed mines. The amount of AROs recorded reflects the expected cost, taking into account the probability of particular scenarios.
During the first half of 2009, we recorded an adjustment in the second quarter of $8 million for changes in estimates of the AROs at Pueblo Viejo, Barrick Energy and Osborne and no adjustments in the first quarter. During second quarter 2008, we recorded an adjustment of $12 million for changes in estimates of the AROs at our Zaldívar, Buzwagi and Pueblo Viejo properties. During first quarter 2008, we recorded an adjustment of $20 million for changes in estimates of the AROs at our Buzwagi, Tulawaka and Veladero properties. These adjustments were recorded with a corresponding adjustment to property, plant and equipment.
Accounting for Goodwill and Tangible Asset Impairment
We conduct an annual test for impairment of goodwill in the fourth quarter of each fiscal year and at any other time if events or a change in circumstances indicate that it is more likely than not that the fair value of a reporting unit has been reduced below its carrying amount. Circumstances that could trigger an impairment test on goodwill or long-lived tangible assets include, but are not limited to: a significant adverse change in the business climate or legal factors; an adverse action or assessment by a regulator; the likelihood that a reporting unit or a significant portion of a reporting unit will be sold or otherwise disposed of; adverse results of testing for recoverability of a significant asset group within a reporting unit; and a significant change to the operating plans for the reporting unit.
The most significant factors impacting the outcome of impairment tests are market gold and copper prices; discount rates; and, market multiple assumptions used in the estimation of the value of reporting units. An adverse change in any one or a combination of these factors could lead to the recognition of impairment charges in future periods. The mines most likely to be affected by an adverse change in these factors include the Zaldívar copper mine in Chile and the Porgera gold mine in Papua New Guinea. Individual mines have a finite reserve life. Consequently mines with a short remaining reserve life are generally at greater risk of incurring a goodwill impairment charge. Based on our most recent life of mine plans, Pierina, Tulawaka, Osborne, Golden Sunlight and Storm have remaining reserve lives of four years or less.
In first quarter 2009, our Plutonic gold mine in Australia reported a reduction in reserves at the end of 2008. As a result of the decline in reserves there was an increased risk of a goodwill impairment occurring should there be a further decline in economic factors affecting the mine. We determined that it was appropriate to assess the carrying amount of goodwill associated with Plutonic for potential impairment as at March 31. No impairment charges were recorded as a result of this assessment.
| BARRICK SECOND QUARTER 2009 | 31 | MANAGEMENT’S DISCUSSION AND ANALYSIS |
The carrying amount of the assets attributable to these mines, as at June 30, 2009 is illustrated in the table below:
Carrying amounts of assets
| ($ millions) | ||||||||
| As at June 30 2009 | Long Lived Assets | Goodwill | ||||||
| Zaldívar | $ | 1,257 | $ | 743 | ||||
| Porgera | 660 | 927 | ||||||
| Hemlo | 242 | — | ||||||
| Plutonic | 124 | 88 | ||||||
| Pierina | 43 | 43 | ||||||
| Golden Sunlight | 32 | 9 | ||||||
| Osborne | 39 | — | ||||||
| Tulawaka | 24 | 14 | ||||||
| Storm | 29 | 4 | ||||||
Total | $ | 2,450 | $ | 1,828 | ||||
Each quarter, we also monitor our projects for potential triggering events indicating that the carrying amounts of assets are not recoverable. We continue to progress feasibility and optimization work on all of these projects. No triggering events were identified during the quarter; hence we have not recorded any impairment on our projects in 2009.
The carrying amount of the assets attributable to our more significant projects as at June 30, 2009 is illustrated in the table below.
Carrying amounts of assets
| ($ millions) | ||||
| As at June 30 | 2009 | |||
| Cerro Casale | $ | 838 | ||
| Reko Dig | 152 | |||
| Sedibelo | 121 | |||
| Donlin Creek | 76 | |||
Total | $ | 1,187 | ||
NON-GAAP FINANCIAL PERFORMANCE MEASURES
Adjusted Net Income (Adjusted Net Income per Share)
Adjusted net income is a non-GAAP financial measure which excludes the following from net income:
| • | Impairment charges related to goodwill, property, plant and equipment, and investments; | |
| • | Gains/losses on acquisitions/dispositions; | |
| • | Foreign currency translation gains/losses; and | |
| • | Unrealized gains/losses on non-hedge derivative instruments. |
Management uses this measure internally to evaluate the underlying operating performance of the Company as a whole for the reporting periods presented, and to assist with the planning and forecasting of future operating results. We believe that adjusted net income allows investors and analysts to better evaluate the results of the underlying business of the Company. While the adjustments to net income in this measure include items that are recurring, management believes that adjusted net income is a useful measure of the Company’s performance because impairment charges and gains/losses on asset acquisitions/dispositions do not reflect the underlying operating performance of our core mining business and are not necessarily indicative of future operating results. Further, foreign currency translation gains/losses and unrealized gains/losses from non-hedge derivative contracts are not necessarily reflective of the underlying operating results for the reporting periods presented.
As noted, the Company uses this measure for its own internal purposes. Management’s internal budgets and forecasts and public guidance do not reflect potential impairment charges, potential gains/losses on the acquisition/disposition of assets, foreign currency translation gains/losses, or unrealized gains/losses on non-hedge derivative contracts. Consequently, the presentation of adjusted net income enables investors and analysts to better understand the underlying operating performance of our core mining business through the eyes of Management. Management periodically evaluates the components of adjusted net income based on an internal assessment of performance measures that are useful for evaluating the operating performance of our business segments and a review of the non-GAAP measures used by mining industry analysts and other mining companies.
Starting in second quarter 2009, we have updated the items included in our “Adjusted Net Income” to reflect recent changes in US GAAP. FAS 141(R) includes a requirement on step acquisitions to record previously held interests of the acquired entity at fair value, resulting in remeasurement of those assets and liabilities and the recognition of a related gain/loss. These gains/losses have been excluded from the calculation of Adjusted Net Income because, similar to our previously disclosed adjustment “Gains/losses on the disposition of long-lived assets”, they reflect non-cash charges which are not illustrative of operating performance. As such, we have adjusted Net Income for these items and the description of the relevant line item in the reconciliation has been changed to “Gains/losses on acquisitions/dispositions”.
| BARRICK SECOND QUARTER 2009 | 32 | MANAGEMENT’S DISCUSSION AND ANALYSIS |
Adjusted net income is intended to provide additional information only and does not have any standardized meaning prescribed by US GAAP and should not be considered in isolation or as a substitute for measures of performance prepared in accordance with US GAAP. The measure is not necessarily indicative of operating profit or cash flow from operations as determined under US GAAP. Other companies may calculate this measure differently. The following table reconciles this non-GAAP measure to the most directly comparable US GAAP measure.
Reconciliation of Net Income to Adjusted Net Income
| Three months ended | Six months ended | |||||||||||||||
| June 30 | June 30 | |||||||||||||||
| ($ millions, except per share amounts in dollars) | 2009 | 2008 | 2009 | 2008 | ||||||||||||
| Net income | $ | 492 | $ | 485 | $ | 863 | $ | 999 | ||||||||
| Impairment charges related to goodwill, property, plant and equipment, and investments | — | — | 2 | 30 | ||||||||||||
(Gains)/losses on acquisitions/dispositions1 | (79 | ) | (34 | ) | (81 | ) | (38 | ) | ||||||||
Foreign currency translation (gains)/losses2 | 6 | 8 | (72 | ) | 12 | |||||||||||
| Unrealized (gains)/losses on non-hedge derivative instruments | 12 | (17 | ) | 20 | (22 | ) | ||||||||||
| Adjusted net income | $ | 431 | $ | 442 | $ | 732 | $ | 981 | ||||||||
Net income per share3 | 0.56 | 0.56 | 0.99 | 1.15 | ||||||||||||
Adjusted net income per share3 | $ | 0.49 | $ | 0.51 | $ | 0.84 | $ | 1.13 | ||||||||
| 1 | Includes gains recorded on the Hemlo acquisition of $72 million. Refer to page 14 of this MD&A for further information. | |
| 2 | Includes a currency translation gain of $70 million recorded in first quarter 2009 relating to Canadian deferred tax assets due to an election to adopt a US dollar functional currency for Canadian tax purposes. | |
| 3 | Calculated using adjusted net income and weighted average number of shares outstanding under the basic method of earnings per share. |
Total Cash Costs per ounce and Net Cash Costs per ounce
Total cash costs per ounce/pound and net cash costs per ounce are non-GAAP financial measures. Both measures include all costs absorbed into inventory, as well as royalties, by-product credits, and production taxes, and exclude inventory purchase accounting adjustments, unrealized gains/losses from non-hedge currency and commodity contracts, and amortization and accretion. These measures also include the gross margin generated by our Barrick Energy business unit, which was acquired to provide a long-term economic hedge of our exposure to oil prices as a credit against gold production costs. The presentation of these statistics in this manner allows us to monitor and manage those factors that impact production costs on a monthly basis. These measures are calculated by dividing the aggregate of the applicable costs by gold ounces or copper pounds sold. These measures are calculated on a consistent basis for the periods presented.
Under purchase accounting rules, we record the fair value of acquired work in progress and finished goods inventories as at the date of acquisition. As the acquired inventory is sold, any purchase accounting adjustments, reflected in the carrying amount of inventory at acquisition, impacts cost of sales. The method of valuing these inventories is based on estimated selling prices less costs to complete and a reasonable profit margin. Consequently, the fair values do not necessarily reflect costs to produce consistent with ore mined and processed into gold and copper after the acquisition. Hence, we have removed such costs from our cash costs measurements. Many mining companies record the unrealized gains/losses from non-hedge currency and commodity contracts in other income, and therefore these amounts are not reflected in the cost of sales measures presented by these companies. Consequently, we believe that removing these unrealized gains/losses provides investors and analysts with a measure of our costs of production that is more comparable to the measures presented by other mining companies. We have provided below reconciliations to illustrate the impact of excluding inventory purchase accounting adjustments and unrealized gains/losses from non-hedge currency and commodity contracts from our total cash costs and net cash costs measures.
We calculate total cash costs and net cash costs based on our equity interest in production from our mines. We believe that using an equity interest presentation is a fairer, more accurate way to measure economic performance than using a consolidated basis. For mines where we hold less than a 100% share in the production, we exclude the economic share of gold production that flows to our partners who hold a non-controlling interest. Consequently, for the Tulawaka mine, although we fully consolidated the results of operations from this mine in our consolidated financial statements, our production
| BARRICK SECOND QUARTER 2009 | 33 | MANAGEMENT’S DISCUSSION AND ANALYSIS |
and total cash costs and net cash costs statistics only reflect our equity share of the production.
Starting in 2008, we provided a net cash costs measure which treats the gross margin from all non-gold sales, whether or not these non-gold metals are produced in conjunction with gold, as a credit against the cost of producing gold. In 2009, we have begun using this measure to evaluate the overall performance of our business on a consolidated basis. A number of other gold producers present their costs net of the contribution from non-gold sales. We believe that including a measure of net cash costs per ounce on this basis provides investors and analysts with information with which to compare our performance to other gold producers, and to better assess the overall performance of our business. In addition, this measure provides information to enable investors and analysts to understand the importance of non-gold revenues to our cost structure.
Cash costs per ounce/pound statistics are intended to provide additional information, do not have any standardized meaning prescribed by US GAAP and should not be considered in isolation or as a substitute for measures of performance prepared in accordance with US GAAP. The measures are not necessarily indicative of operating profit or cash flow from operations as determined under US GAAP. Other companies may calculate these measures differently.
Reconciliation of Cost of Sales to Total Cash Costs per ounce/pound
| Three months ended June 30 | Six months ended June 30 | |||||||||||||||||||||||||||||||
| Gold | Copper | Gold | Copper | |||||||||||||||||||||||||||||
| ($ millions, except per ounce/ | ||||||||||||||||||||||||||||||||
| pound information in dollars) | 2009 | 2008 | 2009 | 2008 | 2009 | 2008 | 2009 | 2008 | ||||||||||||||||||||||||
| Cost of sales | $ | 856 | $ | 796 | $ | 111 | $ | 86 | $ | 1,687 | $ | 1,480 | $ | 226 | $ | 177 | ||||||||||||||||
Cost of sales attributable to non-controlling interests1 | (2 | ) | (4 | ) | — | — | (5 | ) | (7 | ) | — | — | ||||||||||||||||||||
| Unrealized non-hedge gains/(losses) on currency and commodity contracts | 4 | 31 | — | — | 8 | 35 | — | — | ||||||||||||||||||||||||
| Inventory purchase accounting adjustments | — | (16 | ) | — | — | — | (16 | ) | — | — | ||||||||||||||||||||||
| Impact of Barrick Energy | (6 | ) | — | — | — | (7 | ) | — | — | — | ||||||||||||||||||||||
| Total cash costs | $ | 852 | $ | 807 | $ | 111 | $ | 86 | $ | 1,683 | $ | 1,492 | $ | 226 | $ | 177 | ||||||||||||||||
| Ounces/pounds sold - consolidated basis (OOO’s) | 1,889 | 1,887 | 90 | 78 | 3,609 | 3,631 | 176 | 176 | ||||||||||||||||||||||||
| Ounces/pounds sold - non-controlling interest (OOO’s) | (7 | ) | (21 | ) | — | — | (13 | ) | (36 | ) | — | — | ||||||||||||||||||||
| Ounces/pounds sold - equity basis (OOO’s) | 1,882 | 1,866 | 90 | 78 | 3,596 | 3,595 | 176 | 176 | ||||||||||||||||||||||||
| Total cash costs per ounce/per pound | $ | 452 | $ | 434 | $ | 1.25 | $ | 1.08 | $ | 467 | $ | 415 | $ | 1.28 | $ | 1.00 | ||||||||||||||||
| 1 | Relates to our partner’s 30% interest in Tulawaka. |
Net Cash Costs per ounce
| Three months ended June 30 | Six months ended June 30 | |||||||||||||||
| ($ millions, except per ounce/pound data in dollars) | 2009 | 2008 | 2009 | 2008 | ||||||||||||
| Ounces gold sold - equity basis (OOO’s) | 1,882 | 1,866 | 3,596 | 3,595 | ||||||||||||
| Total cash costs per ounce - equity basis | $ | 452 | $ | 434 | $ | 467 | $ | 415 | ||||||||
| Revenues from copper sales | $ | 262 | $ | 283 | $ | 509 | $ | 633 | ||||||||
| Unrealized non-hedge gold/copper derivative (gains) losses | 23 | 4 | 35 | — | ||||||||||||
| Unrealized mark to market provisional price adjustments | — | — | — | — | ||||||||||||
| Net revenues from copper excluding unrealized non-hedge gains/losses from copper contracts | $ | 285 | $ | 287 | $ | 544 | $ | 633 | ||||||||
| Copper cost of sales per consolidated statement of income | 111 | 86 | 226 | 177 | ||||||||||||
| Copper credits | 174 | 201 | 318 | 456 | ||||||||||||
| Copper credits per ounce | 92 | 108 | 89 | 126 | ||||||||||||
| Net cash costs per ounce | $ | 360 | $ | 326 | $ | 378 | $ | 289 | ||||||||
| BARRICK SECOND QUARTER 2009 | 34 | MANAGEMENT’S DISCUSSION AND ANALYSIS |
EBITDA
EBITDA is a non-GAAP financial measure, which excludes the following from net income:
| • | Income tax expense; | |
| • | Interest expense; | |
| • | Interest income; and | |
| • | Depreciation and amortization. |
Management believes that EBITDA is a valuable indicator of the Company’s ability to generate liquidity by producing operating cash flow to: fund working capital needs, service debt obligations, and fund capital expenditures. Management uses EBITDA for this purpose. EBITDA is also frequently used by investors and analysts for valuation purposes whereby EBITDA is multiplied by a factor or “EBITDA multiple” that is based on observed or inferred relationship between EBITDA and market values to determine the approximate total enterprise value of a company.
EBITDA is intended to provide additional information to investors and analysts, does not have any standardized meaning prescribed by US GAAP and should not be considered in isolation or as a substitute for measures of performance prepared in accordance with US GAAP. EBITDA excludes the impact of cash costs of financing activities and taxes, and the effects of changes in operating working capital balances, and therefore is not necessarily indicative of operating profit or cash flow from operations as determined under US GAAP. Other companies may calculate EBITDA differently.
The following table provides a reconciliation of EBITDA to net income.
Reconciliation of Net Income to EBITDA
| Three months ended | Six months ended | |||||||||||||||
| June 30 | June 30 | |||||||||||||||
| ($ millions, except per share amounts in dollars) | 2009 | 2008 | 2009 | 2008 | ||||||||||||
| Net Income | $ | 492 | $ | 485 | $ | 863 | $ | 999 | ||||||||
| Income tax expense | 198 | 148 | 236 | 401 | ||||||||||||
| Interest expense | 14 | 8 | 16 | 14 | ||||||||||||
| Interest income | (2 | ) | (5 | ) | (5 | ) | (22 | ) | ||||||||
| Depreciation and amortization | 252 | 250 | 499 | 478 | ||||||||||||
| EBITDA | $ | 954 | $ | 886 | $ | 1,609 | $ | 1,870 | ||||||||
Realized Prices
Realized price is a non-GAAP financial measure which excludes from sales:
| • | Unrealized gains and losses on non-hedge derivative contracts; | |
| • | Unrealized mark-to-market gains and losses on provisional pricing from copper and gold sales contracts; and | |
| • | Export duties |
This measure is intended to enable management to better understand the price realized in each reporting period for gold and copper sales because unrealized mark-to-market value of non-hedge gold and copper derivatives and unrealized mark-to-market gains and losses on outstanding receivables from copper and gold sales contracts are subject to change each period due to changes in market factors such as spot and forward gold and copper prices such that prices ultimately realized may differ from those recorded. The exclusion of such unrealized mark-to-market gains and losses from the presentation of this performance measure enables investors to understand performance based on the realized proceeds of selling gold and copper production. The gains and losses on non-hedge derivatives and receivable balances relate to instruments/balances that mature in future periods, at which time the gains and losses will become realized. The amounts of these gains and losses reflect fair values based on market valuation assumptions at the end of each period and do not necessarily represent the amounts that will become realized on maturity. For those reasons, management believes that this measure provides a more accurate reflection of the Company’s past performance and is a better indicator of its expected performance in future periods.
Starting with second quarter 2009, we have begun to adjust our realized price calculation for export duties that are paid upon sale and are currently netted against revenues. We believe this provides investors and analysts with a more accurate measure with which to compare to market gold prices and to assess our gold sales performance.
The realized price measure is intended to provide additional information, and does not have any standardized meaning prescribed by US GAAP and should not be considered in isolation or as a substitute for measures of performance prepared in accordance with US GAAP. The measure is not necessarily indicative of sales
| BARRICK SECOND QUARTER 2009 | MANAGEMENT’S DISCUSSION AND ANALYSIS |
35
as determined under US GAAP. Other companies may calculate this measure differently. The following table reconciles realized prices to the most directly comparable US GAAP measure.
Reconciliation of Sales to Realized Price per ounce/per pound
| Three months ended June 30 | Six months ended June 30 | |||||||||||||||||||||||||||||||
| Gold | Copper | Gold | Copper | |||||||||||||||||||||||||||||
| ($ millions, except per ounce/pound data in dollars) | 2009 | 2008 | 2009 | 2008 | 2009 | 2008 | 2009 | 2008 | ||||||||||||||||||||||||
| Sales | 1,754 | 1,684 | 262 | 283 | 3,323 | 3,292 | 509 | 633 | ||||||||||||||||||||||||
| Sales attributable to non-controlling interests | $ | (6 | ) | $ | (19 | ) | $ | — | $ | — | $ | (12 | ) | $ | (33 | ) | $ | — | $ | — | ||||||||||||
| Unrealized non-hedge gold/copper derivative (gains) losses | — | 3 | 23 | 4 | — | 9 | 35 | — | ||||||||||||||||||||||||
| Unrealized mark to market provisional price adjustments | — | — | — | — | — | — | — | — | ||||||||||||||||||||||||
| Export duties | 7 | 8 | — | — | 11 | 16 | — | — | ||||||||||||||||||||||||
| Sales - as adjusted | 1,755 | 1,676 | 285 | 287 | 3,322 | 3,284 | 544 | 633 | ||||||||||||||||||||||||
| Ounces/pounds sold (000’s) | 1,882 | 1,866 | 90 | 78 | 3,596 | 3,595 | 176 | 176 | ||||||||||||||||||||||||
| Realized gold/copper price per ounce/pound | $ | 931 | $ | 898 | $ | 3.18 | $ | 3.65 | $ | 923 | $ | 913 | $ | 3.09 | $ | 3.59 | ||||||||||||||||
Net Cash Margin
Management uses a non-GAAP financial measure, net cash margin, which represents realized price per ounce less net cash costs per ounce. This measure is used by management to analyze profitability trends and to assess the cash generating capability from the sale of gold on a consolidated basis in each reporting period, expressed on a unit basis. In this MD&A, we have placed greater emphasis on our net cash costs per ounce measure because we believe that it illustrates the performance of our business on a consolidated basis and enables investors to better understand our performance in comparison to other gold producers who present results on a similar basis. As part of this emphasis, we have introduced the measure “net cash margin”, which is calculated using net cash costs per ounce, as opposed to the measure “cash margin” which was previously disclosed by us and was calculated using total cash costs per ounce.
Management believes that this measure reflects the net contribution from our gold sales and is an important indicator of expected performance in future periods. Our cash margin is intended to provide additional information, does not have any standardized meaning prescribed by US GAAP and should not be considered in isolation or as a substitute for measures of performance prepared in accordance with US GAAP. This measure is not necessarily indicative of operating profit or cash flow from operations as determined under US GAAP. Other companies may calculate cash margin differently. The following table derives this non-GAAP measure from previously defined non-GAAP measures of realized gold/copper price per ounce and net cash costs per ounce.
Reconciliation of Net Cash Margin
| Three months ended June 30 | Six months ended June 30 | |||||||||||||||
| (per ounce data in dollars) | 2009 | 2008 | 2009 | 2008 | ||||||||||||
| Realized gold price per ounce | $ | 931 | $ | 898 | $ | 923 | $ | 913 | ||||||||
| Net cash costs per ounce | 360 | 326 | 378 | 289 | ||||||||||||
| Net cash margin | $ | 571 | $ | 572 | $ | 545 | $ | 624 | ||||||||
| BARRICK SECOND QUARTER 2009 | 36 | MANAGEMENT’S DISCUSSION AND ANALYSIS |
Consolidated Statements of Income
| Barrick Gold Corporation | Three months ended | Six months ended | ||||||||||||||
| (in millions of United States dollars, except per share data) (Unaudited) | June 30, | June 30, | ||||||||||||||
| 2009 | 2008 | 2009 | 2008 | |||||||||||||
Sales(notes 4 and 5) | $ | 2,029 | $ | 1,967 | $ | 3,856 | $ | 3,925 | ||||||||
Costs and expenses | ||||||||||||||||
Cost of sales (notes 4 and 6)1 | 975 | 882 | 1,930 | 1,657 | ||||||||||||
| Amortization and accretion (notes 4 and 14) | 267 | 264 | 528 | 505 | ||||||||||||
| Corporate administration | 45 | 38 | 80 | 71 | ||||||||||||
| Exploration (notes 4 and 7) | 35 | 54 | 67 | 97 | ||||||||||||
| Project development expense (note 7) | 14 | 83 | 38 | 129 | ||||||||||||
| Other expense (note 8A) | 60 | 50 | 135 | 104 | ||||||||||||
| 1,396 | 1,371 | 2,778 | 2,563 | |||||||||||||
| Interest income | 2 | 5 | 5 | 22 | ||||||||||||
| Interest expense (note 16B) | (14 | ) | (8 | ) | (16 | ) | (14 | ) | ||||||||
| Other income (note 8C) | 89 | 54 | 83 | 84 | ||||||||||||
| Write-down of investments (note 8B) | — | — | (1 | ) | (39 | ) | ||||||||||
| 77 | 51 | 71 | 53 | |||||||||||||
Income before income taxes and other items | 710 | 647 | 1,149 | 1,415 | ||||||||||||
| Income tax expense (note 9) | (198 | ) | (148 | ) | (236 | ) | (401 | ) | ||||||||
| Loss from equity investees (note 12) | (20 | ) | (9 | ) | (48 | ) | (7 | ) | ||||||||
Income before non-controlling interests | 492 | 490 | 865 | 1,007 | ||||||||||||
| Non-controlling interests (note 8D) | — | (5 | ) | (2 | ) | (8 | ) | |||||||||
Net income | $ | 492 | $ | 485 | $ | 863 | $ | 999 | ||||||||
Earnings per share data (note 10) | ||||||||||||||||
| Net income | ||||||||||||||||
| Basic | $ | 0.56 | $ | 0.56 | $ | 0.99 | $ | 1.15 | ||||||||
| Diluted | $ | 0.56 | $ | 0.55 | $ | 0.98 | $ | 1.13 | ||||||||
| 1 | Exclusive of amortization. |
The accompanying notes are an integral part of these consolidated financial statements.
| BARRICK SECOND QUARTER 2009 | 37 | FINANCIAL STATEMENTS (UNAUDITED) |
Consolidated Statements of Cash Flow
| Barrick Gold Corporation | Three months ended | Six months ended | ||||||||||||||
| (in millions of United States dollars, except per share data) (Unaudited) | June 30, | June 30, | ||||||||||||||
| 2009 | 2008 | 2009 | 2008 | |||||||||||||
OPERATING ACTIVITIES | ||||||||||||||||
| Net income | $ | 492 | $ | 485 | $ | 863 | $ | 999 | ||||||||
| Amortization and accretion (notes 4 and 14) | 267 | 264 | 528 | 505 | ||||||||||||
| Income tax expense (note 9) | 198 | 148 | 236 | 401 | ||||||||||||
| Income taxes paid | (120 | ) | (230 | ) | (220 | ) | (357 | ) | ||||||||
| Increase in inventory | (82 | ) | (106 | ) | (160 | ) | (239 | ) | ||||||||
| Gain on sale/acquisition of long-lived assets (note 8C) | (80 | ) | — | (82 | ) | (4 | ) | |||||||||
| Other items (note 11) | 43 | (56 | ) | (98 | ) | (82 | ) | |||||||||
Net cash provided by operating activities | 718 | 505 | 1,067 | 1,223 | ||||||||||||
INVESTING ACTIVITIES | ||||||||||||||||
| Property, plant and equipment | ||||||||||||||||
| Capital expenditures (note 4) | (605 | ) | (326 | ) | (1,075 | ) | (591 | ) | ||||||||
| Sales proceeds | 4 | 1 | 7 | 5 | ||||||||||||
| Acquisitions (note 3) | (48 | ) | (4 | ) | (48 | ) | (1,726 | ) | ||||||||
| Investments (note 12) | ||||||||||||||||
| Purchases | — | (1 | ) | (2 | ) | (16 | ) | |||||||||
| Sales | — | 55 | — | 57 | ||||||||||||
| Decrease in restricted cash (note 16A) | 113 | — | 113 | — | ||||||||||||
| Long-term supply contract | — | — | — | (35 | ) | |||||||||||
| Other investing activities | (17 | ) | (37 | ) | (34 | ) | (72 | ) | ||||||||
Net cash used in investing activities | (553 | ) | (312 | ) | (1,039 | ) | (2,378 | ) | ||||||||
FINANCING ACTIVITIES | ||||||||||||||||
| Capital stock | ||||||||||||||||
| Proceeds on exercise of stock options | 11 | — | 21 | 70 | ||||||||||||
| Long-term debt (note 16B) | ||||||||||||||||
| Proceeds | 62 | — | 867 | 90 | ||||||||||||
| Repayments | (206 | ) | (45 | ) | (293 | ) | (50 | ) | ||||||||
| Dividends | (174 | ) | (174 | ) | (174 | ) | (174 | ) | ||||||||
| Funding from non-controlling interests | 60 | 26 | 146 | 36 | ||||||||||||
| Other financing activities | (4 | ) | — | (11 | ) | — | ||||||||||
Net cash provided by (used in) financing activities | (251 | ) | (193 | ) | 556 | 872 | ||||||||||
Effect of exchange rate changes on cash and equivalents | 20 | 3 | 17 | 10 | ||||||||||||
| Net increase (decrease) in cash and equivalents | (66 | ) | 3 | 601 | (273 | ) | ||||||||||
Cash and equivalents at beginning of period(note 16A) | 2,104 | 1,931 | 1,437 | 2,207 | ||||||||||||
Cash and equivalents at end of period(note 16A) | $ | 2,038 | $ | 1,934 | $ | 2,038 | $ | 1,934 | ||||||||
The accompanying notes are an integral part of these consolidated financial statements.
| BARRICK SECOND QUARTER 2009 | 38 | FINANCIAL STATEMENTS (UNAUDITED) |
Consolidated Balance Sheets
| Barrick Gold Corporation | As at June 30, | As at December 31, | ||||||
| (in millions of United States dollars, except per share data) (Unaudited) | 2009 | 2008 | ||||||
ASSETS | ||||||||
| Current assets | ||||||||
| Cash and equivalents (note 16A) | $ | 2,038 | $ | 1,437 | ||||
| Accounts receivable | 233 | 197 | ||||||
| Inventories (note 13) | 1,474 | 1,309 | ||||||
| Other current assets | 591 | 1,169 | ||||||
| 4,336 | 4,112 | |||||||
| Non-current assets | ||||||||
| Investments (note 12) | 1,185 | 1,145 | ||||||
| Property, plant and equipment (note 14) | 12,346 | 11,547 | ||||||
| Goodwill (note 15) | 5,260 | 5,280 | ||||||
| Intangible assets | 75 | 75 | ||||||
| Deferred income tax assets | 823 | 869 | ||||||
| Other assets | 1,306 | 1,133 | ||||||
Total assets | $ | 25,331 | $ | 24,161 | ||||
LIABILITIES AND SHAREHOLDERS’ EQUITY | ||||||||
| Current liabilities | ||||||||
| Accounts payable | 942 | 970 | ||||||
| Short-term debt | 67 | 206 | ||||||
| Other current liabilities | 381 | 668 | ||||||
| 1,390 | 1,844 | |||||||
| Non-current liabilities | ||||||||
| Long-term debt (note 16B) | 5,059 | 4,350 | ||||||
| Asset retirement obligations | 1,032 | 973 | ||||||
| Deferred income tax liabilities | 851 | 754 | ||||||
| Other liabilities | 416 | 781 | ||||||
Total liabilities | 8,748 | 8,702 | ||||||
Equity | ||||||||
| Capital stock (note 18) | 13,403 | 13,372 | ||||||
| Retained earnings | 2,950 | 2,261 | ||||||
| Accumulated other comprehensive loss (note 19) | (96 | ) | (356 | ) | ||||
Total shareholders’ equity | 16,257 | 15,277 | ||||||
| Non-controlling interests | 326 | 182 | ||||||
Total equity | 16,583 | 15,459 | ||||||
| Contingencies and commitments (notes 14 and 20) | ||||||||
Total liabilities and equity | $ | 25,331 | $ | 24,161 | ||||
The accompanying notes are an integral part of these consolidated financial statements.
| BARRICK SECOND QUARTER 2009 | 39 | FINANCIAL STATEMENTS (UNAUDITED) |
Consolidated Statements of Equity
| Barrick Gold Corporation | ||||||||
| For the six months ended June 30 (in millions of United States dollars) (Unaudited) | ||||||||
| 2009 | 2008 | |||||||
Common shares(number in millions) | ||||||||
| At January 1 | 873 | 870 | ||||||
| Issued on exercise of stock options | 1 | 2 | ||||||
| At June 30 | 874 | 872 | ||||||
Common shares | ||||||||
| At January 1 | $ | 13,372 | $ | 13,273 | ||||
| Issued on exercise of stock options | 21 | 70 | ||||||
| Recognition of stock option expense | 10 | 9 | ||||||
| At June 30 | 13,403 | 13,352 | ||||||
Retained earnings | ||||||||
| At January 1 | 2,261 | 1,832 | ||||||
| Net income | 863 | 9 | ||||||
| Dividends | (174 | ) | (174 | ) | ||||
| At June 30 | 2,950 | 2,657 | ||||||
| Accumulated other comprehensive income (loss) (note 19) | (96 | ) | 245 | |||||
Total shareholders’ equity | 2,854 | 2,902 | ||||||
Non-controlling interests | ||||||||
| At January 1 | 182 | 82 | ||||||
| Net loss attributable to non-controlling interests | (2 | ) | (8 | ) | ||||
| Funding to non-controlling interests | 146 | 50 | ||||||
| At June 30 | 326 | 124 | ||||||
Total equity at June 30 | $ | 16,583 | $ | 16,378 | ||||
Consolidated Statements of Comprehensive Income
| Barrick Gold Corporation | Three months ended | Six months ended | ||||||||||||||
| (in millions of United States dollars) (Unaudited) | June 30, | June 30, | ||||||||||||||
| 2009 | 2008 | 2009 | 2008 | |||||||||||||
| Net income | $ | 492 | $ | 485 | $ | 863 | $ | 999 | ||||||||
| Other comprehensive income, net of tax (note 19) | 372 | 228 | 260 | 94 | ||||||||||||
Comprehensive income | $ | 864 | $ | 713 | $ | 1,123 | $ | 1,093 | ||||||||
The accompanying notes are an integral part of these consolidated financial statements.
| BARRICK SECOND QUARTER 2009 | 40 | FINANCIAL STATEMENTS (UNAUDITED) |
NOTES TO CONSOLIDATED FINANCIAL STATEMENTS
Barrick Gold Corporation.Tabular dollar amounts in millions of United States dollars, unless otherwise shown. References to C$, A$, ZAR, CLP, PGK, TZS, JPY, ARS and EUR are to Canadian dollars, Australian dollars, South African rands, Chilean pesos, Papua New Guinea kina, Tanzanian schillings, Japanese yen, Argentinean pesos and Euros, respectively.
1 > NATURE OF OPERATIONS
Barrick Gold Corporation (“Barrick” or the “Company”) principally engages in the production and sale of gold, as well as related activities such as exploration and mine development. We also produce significant amounts of copper and hold interests in a platinum group metals development project and a nickel development project, both located in Africa. Our producing mines are concentrated in four regional business units: North America, South America, Africa and Australia Pacific. We sell our gold production into the world market and we sell our copper production into the world market and to private customers.
2 > SIGNIFICANT ACCOUNTING POLICIES
A Basis of Preparation
These consolidated financial statements have been prepared under United States generally accepted accounting principles (“US GAAP”).
B Use of Estimates
Significant Changes in Estimates
Gold and Copper Mineral Reserves
At the end of each fiscal year, as part of our annual business cycle, we prepare estimates of proven and probable gold and copper mineral reserves for each mineral property, including the transfer of amounts allocated to value beyond proven and probable (“VBPP”) to proven and probable reserves subject to amortization. We prospectively revise calculations of amortization of property, plant and equipment. The effect of changes in reserve estimates and transfers of VBPP amounts to proven and probable reserves subject to amortization on amortization expense for the three months ended June 30, 2009 was a decrease of $13 million (2008: $21 million decrease), and for the six months ended June 30, 2009 was a decrease of $21 million (2008: $34 million decrease).
Asset Retirement Obligations (“AROs”)
Each quarter we update cost estimates, and other assumptions used in the valuation of AROs at each of our mineral properties to reflect new events, changes in circumstances and any new information that is available. Changes in these cost estimates and assumptions have a corresponding impact on the fair value of the ARO. During the three month period ended June 30, 2009, we recorded a $39 million increase (2008: $12 million increase) and during the six month period ended June 30, 2009, we recorded an increase of $42 million (2008: $32 million) for changes in estimates of the AROs at various properties, including the acquisition of the 50% interest in Hemlo mines (note 3A). These adjustments were recorded with a corresponding adjustment to property, plant and equipment.
C Accounting Changes
FSP FAS 107-1 and APB 28-1, Interim Disclosures about Fair Value of Financial Instruments.
To enhance the transparency surrounding the treatment of financial instruments, this new guidance requires FAS 107 disclosures to be made at each interim reporting period regardless of how these instruments are recognized in the financial statements. We adopted the increased disclosure requirements beginning in first quarter 2009. Refer to note 17 for related disclosures.
FSP FAS 140-4 and FIN 46(R)-8, Disclosures by Public Entities (Enterprises) about Transfers of Financial Assets and Interests in Variable Interest Entities (FSP FAS 140-4 and FIN 46(R)-8)
In December 2008, the FASB issued FSP FAS 140-4 and FIN 46(R)-8 for the purpose of improving the transparency of transfers of financial assets and an enterprise’s involvement with variable interest entities (“VIEs”), including qualifying special-purpose entities (“QSPEs”). The impact on our financial reporting requirements is limited to the new VIE disclosures.
The VIE disclosure requirements focus on an enterprise’s involvement with VIEs and its judgments about the accounting for them. The FSP also requires disclosure of the details of any financial or other support provided to a VIE that the enterprise was not previously contractually required to provide, and the primary reasons for providing the support. The primary beneficiary of a VIE is also required to disclose the terms of any arrangements that could require the enterprise to provide future support to the VIE. In addition, FSP FAS 140-4 and FIN 46(R)-8 require disclosure of the carrying amount and classification of the variable interest entity’s assets and liabilities in the Balance Sheet and a reconciliation of those amounts to the enterprise’s maximum exposure to loss.
| BARRICK SECOND QUARTER 2009 | 41 | NOTES TO FINANCIAL STATEMENTS (UNAUDITED) |
The adoption of this FSP in the fourth quarter of 2008, has resulted in expanded disclosure around our involvement with our VIEs and the significant judgments and assumptions we make in accounting for them. Refer to our 2008 annual financial statements for further details.
FAS 161, Disclosures about Derivative Instruments and Hedging Activities (FAS 161)
In first quarter 2009, we adopted the provisions of FAS 161. Under FAS 161 entities are required to provide enhanced disclosures about (a) how and why an entity uses derivative instruments, (b) how derivative instruments and related hedged items are accounted for under FAS 133 and its related interpretations, and (c) how derivative instruments and related hedged items affect an entity’s financial position, financial performance and cash flows. To the extent the required information was not previously disclosed in our 2008 annual financial statements, we incorporated new disclosures in note 16.
FAS 141(R), Business Combinations (FAS 141(R))
In first quarter 2009, we began applying the provisions of FAS 141(R), which replaced FAS 141, for business combinations consummated after the effective date of December 15, 2008. Under FAS 141(R), business acquisitions will be accounted for under the “acquisition method”, compared to the “purchase method” mandated by FAS 141.
The more significant changes to our accounting for business combinations that will result from applying the acquisition method include: (i) the definition of a business is broadened to include some development stage entities, and therefore more acquisitions may be accounted for as business combinations rather than asset acquisitions; (ii) the measurement date for equity interests issued by the acquirer is the acquisition date instead of a few days before and after terms are agreed to and announced, which may significantly change the amount recorded for the acquired business if share prices differ from the agreement and announcement date to the acquisition date; (iii) all future adjustments to income tax estimates will be recorded to income tax expense, whereas under FAS 141 certain changes in income tax estimates were recorded to goodwill; (iv) acquisition-related costs of the acquirer, including investment banking fees, legal fees, accounting fees, valuation fees, and other professional or consulting fees will be expensed as incurred, whereas under FAS 141 these costs were capitalized as part of the business combination; (v) the assets acquired and liabilities assumed as part of a business combination, whether full, partial or step acquisition, result in all assets and liabilities recorded at 100% of fair value, whereas under FAS 141 only the controlling interest’s portion is recorded at fair value; (vi) recognition of a bargain purchase gain when the fair value of the identifiable assets exceeds the purchase price, where as under FAS 141, the net book value of the identifiable assets would have been adjusted downward; and (vii) the non-controlling interest will be recorded at its share of fair value of net assets acquired, including its share of goodwill, whereas under FAS 141 the non-controlling interest is recorded at its share of carrying value of net assets acquired with no goodwill being allocated.
FAS 160, Non-controlling Interests in Consolidated Financial Statements (FAS 160)
In first quarter 2009, we adopted the provisions of FAS 160. Under FAS 160, non-controlling interests are measured at 100% of the fair value of assets acquired and liabilities assumed. Under US GAAP prior to the effective date of FAS 160, non-controlling interests were measured at book value. For presentation and disclosure purposes under FAS 160, non-controlling interests are classified as a separate component of equity. In addition, FAS 160 changes the manner in which increases/decreases in ownership percentages are accounted for. Changes in ownership percentages are recorded as equity transactions and no gain or loss is recognized as long as the parent retains control of the subsidiary. When a parent company deconsolidates a subsidiary but retains a non-controlling interest, the non-controlling interest is re-measured at fair value on the date control is lost and a gain or loss is recognized at that time. Under FAS 160, accumulated losses attributable to the non-controlling interests are no longer limited to the original carrying amount, and therefore non-controlling interests could have a negative carrying balance. The provisions of FAS 160 are to be applied prospectively with the exception of the presentation and disclosure provisions, which are to be applied for all prior periods presented in the financial statements. The presentation and disclosure provisions of FAS 160 resulted in the reclassification of non-controlling interests to the Equity section of the Balance Sheet totaling $326 million for June 30, 2009 (December 31, 2008: $182 million).
D Accounting Developments
FAS 167, Amendments to FASB Interpretation No. 46(R).
In second quarter 2009, the FASB issued an amendment to interpretation No. 46(R). Although not effective until first quarter 2010, this new standard makes significant changes to the model for determining who should consolidate a VIE and how often this assessment should be performed. Based on our preliminary assessment, we
In second quarter 2009, the FASB issued an amendment to interpretation No. 46(R). Although not effective until first quarter 2010, this new standard makes significant changes to the model for determining who should consolidate a VIE and how often this assessment should be performed. Based on our preliminary assessment, we
| BARRICK SECOND QUARTER 2009 | 42 | NOTES TO FINANCIAL STATEMENTS (UNAUDITED) |
do not expect these changes to have a significant impact on our financial statements
3 > ACQUISITIONS AND DIVESTITURES
| Three month | Six month | |||||||||||||||
| period ended | period ended | |||||||||||||||
| June 30 | June 30 | |||||||||||||||
| 2009 | 2008 | 2009 | 2008 | |||||||||||||
Cash paid on acquisition1 | ||||||||||||||||
| Hemlo | $ | 50 | $ | — | $ | 50 | $ | — | ||||||||
| Arizona Star | — | — | — | 48 | ||||||||||||
| Kainantu | — | 4 | — | 4 | ||||||||||||
| Cortez | — | — | — | 1,695 | ||||||||||||
| $ | 50 | $ | 4 | $ | 50 | $ | 1,747 | |||||||||
| Less: cash acquired | (2 | ) | — | (2 | ) | (21 | ) | |||||||||
| $ | 48 | $ | 4 | $ | 48 | $ | 1,726 | |||||||||
| 1 | All amounts represent gross cash paid on acquisition or received on divestiture. |
A Acquisition of 50% interest in Hemlo
On April 22, 2009, we completed the acquisition of the remaining 50% interest in the Williams and David Bell gold mines (“Hemlo”) in Canada from Teck Resources Ltd. for cash consideration of $48 million, thereby increasing our interest to 100%. Following this transaction, in accordance with the new requirements for step acquisitions in FAS 141(R), we remeasured our existing 50% interest in the assets and liabilities of Hemlo to their current fair values. This remeasurement resulted in an increase in property, plant and equipment and deferred tax liabilities of $96 million and $34 million respectively, and a reduction in goodwill of $20 million. The net gain on the acquisition of the remaining 50% interest in Hemlo of $72 million was recognized in other income (note 8C).
The tables below represent the purchase cost, our final purchase price allocation, and the bargain purchase of the acquisition of the remaining 50% interest in Hemlo.
Purchase Cost
| Purchase cost | $ | 65 | ||
| Purchase price adjustment | (15 | ) | ||
| Less: cash acquired | (2 | ) | ||
| $ | 48 | |||
Summary Purchase Price Allocation
| Current assets | $ | 10 | ||
| Property, plant and equipment | ||||
| Building, plant and equipment | 25 | |||
| Capitalized development costs | 21 | |||
| Capitalized reserve acquisition costs | 81 | |||
| Total Assets | 137 | |||
| Current liabilities | 8 | |||
| Asset retirement obligations | 32 | |||
| Deferred income tax liabilities | 21 | |||
| Total liabilities | 61 | |||
| Net assets acquired | $ | 76 | ||
B Barrick Energy
In 2008, we acquired 59.2 million shares of Cadence Energy Inc. (“Cadence”) for cash consideration of $336 million, representing 100% of the issued and outstanding common shares. Subsequent to the acquisition, we renamed Cadence as Barrick Energy.
In 2008, we also acquired all of the oil and gas assets at Sturgeon Lake, Alberta, from Daylight Resources Trust for $83 million. The Sturgeon Lake assets are adjacent to Cadence’s Sturgeon Lake assets and the transaction enables us to consolidate 100% ownership of the Sturgeon Lake South Leduc pool. We have determined that this transaction represented an acquisition of assets, which were amalgamated with the Cadence operations to form Barrick Energy.
The tables below represent the purchase cost and the final purchase price allocation.
Purchase Cost
| Purchase cost | $ | 377 | ||
| Less: cash acquired | (41 | ) | ||
| $ | 336 | |||
Summary Purchase Price Allocation
| Current assets | $ | 25 | ||
| Property, plant and equipment | ||||
| Capitalized reserve acquisition and development costs | 278 | |||
| Building, plant and equipment | 68 | |||
| Goodwill | 96 | |||
| Total assets | 467 | |||
| Accounts payable | 24 | |||
| Derivative liabilities | 10 | |||
| Long-term debt | 65 | |||
| Asset retirement obligations | 10 | |||
| Deferred income tax liabilities | 22 | |||
| Total liabilities | 131 | |||
| Net assets acquired | $ | 336 | ||
| BARRICK SECOND QUARTER 2009 | 43 | NOTES TO FINANCIAL STATEMENTS (UNAUDITED) |
C Disposition of Henty mine
On July 6, 2009, we finalized an agreement with Bendigo Mining Limited (“Bendigo”) to divest our Henty mine in Australia for consideration of approximately $4 million cash, adjusted for the benefit of production from July 1, 2009 and $2 million in Bendigo shares. We intend to account for our investment in Bendigo as available-for-sale securities. Barrick will also receive a royalty payable on production from future exploration discoveries, capped at approximately $17 million.
The results of operations for the Henty mine remain included with our continuing operations in the Consolidated Statements of Income, the Consolidated Statements of Cash Flow and the Consolidated Balance Sheet for the current period and prior year comparatives, as they are not considered significant to our consolidated financial statements. As at June 30, 2009, our book value of total assets and total liabilities for Henty were $11 million and $15 million respectively (December 31, 2008: $14 million and $11 million). In the fourth quarter of 2008, we took a full impairment on the goodwill associated with Henty of $30 million. For the three months ended June 30, 2009, net income was $3 million (2008: $4 million) and for the six months ended June 30, 2009, net income was $1 million (2008: $5 million).
4> SEGMENT INFORMATION
Income Statement Information
| Sales | Cost of sales | Segment income (loss)1,2 | ||||||||||||||||||||||
| For the three months ended June 30 | 2009 | 2008 | 2009 | 2008 | 2009 | 2008 | ||||||||||||||||||
Gold | ||||||||||||||||||||||||
| North America | $ | 748 | $ | 621 | $ | 384 | $ | 325 | $ | 260 | $ | 206 | ||||||||||||
| South America | 420 | 490 | 127 | 149 | 258 | 291 | ||||||||||||||||||
| Australia Pacific | 444 | 414 | 264 | 242 | 106 | 106 | ||||||||||||||||||
| Africa | 142 | 159 | 81 | 80 | 43 | 59 | ||||||||||||||||||
Copper | ||||||||||||||||||||||||
| South America | 217 | 230 | 94 | 57 | 104 | 155 | ||||||||||||||||||
| Australia Pacific | 45 | 53 | 17 | 29 | 27 | 11 | ||||||||||||||||||
Capital Projects | — | — | — | — | (23 | ) | (84 | ) | ||||||||||||||||
Other | 13 | — | 8 | — | (2 | ) | — | |||||||||||||||||
| $ | 2,029 | $ | 1,967 | $ | 975 | $ | 882 | $ | 773 | $ | 744 | |||||||||||||
| Sales | Cost of sales | Segment income (loss)1,2 | ||||||||||||||||||||||
| For the six months ended June 30 | 2009 | 2008 | 2009 | 2008 | 2009 | 2008 | ||||||||||||||||||
Gold | ||||||||||||||||||||||||
| North America | $ | 1,418 | $ | 1,215 | $ | 744 | $ | 645 | $ | 485 | $ | 402 | ||||||||||||
| South America | 776 | 961 | 242 | 249 | 466 | 618 | ||||||||||||||||||
| Australia Pacific | 873 | 807 | 549 | 426 | 176 | 255 | ||||||||||||||||||
| Africa | 256 | 309 | 152 | 160 | 71 | 110 | ||||||||||||||||||
Copper | ||||||||||||||||||||||||
| South America | 429 | 504 | 192 | 115 | 198 | 351 | ||||||||||||||||||
| Australia Pacific | 80 | 129 | 34 | 62 | 43 | 39 | ||||||||||||||||||
Capital Projects | — | — | — | — | (69 | ) | (129 | ) | ||||||||||||||||
Other | 24 | — | 17 | — | (7 | ) | — | |||||||||||||||||
| $ | 3,856 | $ | 3,925 | $ | 1,930 | $ | 1,657 | $ | 1,363 | $ | 1,646 | |||||||||||||
| 1 | Segment income (loss) represents segment sales, less cost of sales, less segment amortization and accretion. For the three months ended June 30, 2009, accretion expense was $15 million (2008: $14 million), for the six months ended June 30, 2009, accretion expense was $29 million (2008: $27 million), see note 14 for further details. Segment loss for the Capital Projects segment includes project development expense and losses from capital projects held through equity investees, see notes 7 and 12 for further details. | |
| 2 | Accretion expense related to capital projects is included within amortization and accretion. All other amounts related to the capital projects segments are included within project development expense. |
| BARRICK SECOND QUARTER 2009 | 44 | NOTES TO FINANCIAL STATEMENTS (UNAUDITED) |
| Exploration1 | Regional business unit costs1 | |||||||||||||||
| For the three months ended June 30 | 2009 | 2008 | 2009 | 2008 | ||||||||||||
North America2 | $ | 17 | $ | 25 | $ | 11 | $ | 11 | ||||||||
| South America | 5 | 11 | 7 | 7 | ||||||||||||
| Australia Pacific | 11 | 12 | 12 | 16 | ||||||||||||
| Africa | 2 | 5 | 8 | 5 | ||||||||||||
| Capital Projects | — | — | — | — | ||||||||||||
| Other expense outside reportable segments | — | 1 | — | 1 | ||||||||||||
| $ | 35 | $ | 54 | $ | 38 | $ | 40 | |||||||||
| Exploration1 | Regional business unit costs1 | |||||||||||||||
| For the six months ended June 30 | 2009 | 2008 | 2009 | 2008 | ||||||||||||
North America2 | $ | 27 | $ | 41 | $ | 22 | $ | 21 | ||||||||
| South America | 11 | 21 | 13 | 14 | ||||||||||||
| Australia Pacific | 23 | 23 | 22 | 26 | ||||||||||||
| Africa | 3 | 8 | 15 | 9 | ||||||||||||
| Capital Projects | 1 | 1 | — | — | ||||||||||||
| Other expense outside reportable segments | 2 | 3 | — | 1 | ||||||||||||
| $ | 67 | $ | 97 | $ | 72 | $ | 71 | |||||||||
| 1 | Exploration and regional business unit costs are excluded from the measure of segment income but are reported separately by operating segment to the Chief Operating Decision Maker. | |
| 2 | In 2009, regional business unit costs include costs for Barrick Energy. |
Reconciliation of Segment Income
| Three month | Six month | |||||||||||||||
| period ended | period ended | |||||||||||||||
| June 30 | June 30 | |||||||||||||||
| 2009 | 2008 | 2009 | 2008 | |||||||||||||
| Segment income | $ | 773 | $ | 744 | $ | 1,363 | $ | 1,646 | ||||||||
| Amortization of corporate assets | (9 | ) | (7 | ) | (34 | ) | (12 | ) | ||||||||
| Exploration | (35 | ) | (54 | ) | (67 | ) | (97 | ) | ||||||||
| Other project expenses | (10 | ) | (9 | ) | (18 | ) | (15 | ) | ||||||||
| Corporate administration | (45 | ) | (38 | ) | (80 | ) | (71 | ) | ||||||||
| Other expense | (60 | ) | (50 | ) | (135 | ) | (104 | ) | ||||||||
| Impairment charges | — | — | (1 | ) | (39 | ) | ||||||||||
| Interest income | 2 | 5 | 5 | 22 | ||||||||||||
| Interest expense | (14 | ) | (8 | ) | (16 | ) | (14 | ) | ||||||||
| Other income | 89 | 54 | 83 | 84 | ||||||||||||
| Loss from capital projects held through equity investees | 19 | 10 | 49 | 15 | ||||||||||||
| Income before income taxes and other items | $ | 710 | $ | 647 | $ | 1,149 | $ | 1,415 | ||||||||
| BARRICK SECOND QUARTER 2009 | 45 | NOTES TO FINANCIAL STATEMENTS (UNAUDITED) |
Asset Information
| Amortization | Segment capital expenditures1 | |||||||||||||||
| For the three months ended June 30 | 2009 | 2008 | 2009 | 2008 | ||||||||||||
Gold | ||||||||||||||||
| North America | $ | 97 | $ | 84 | $ | 139 | $ | 81 | ||||||||
| South America | 32 | 47 | 37 | 14 | ||||||||||||
| Australia Pacific | 71 | 64 | 37 | 41 | ||||||||||||
| Africa | 17 | 19 | 40 | 30 | ||||||||||||
Copper | ||||||||||||||||
| South America | 19 | 17 | 17 | 18 | ||||||||||||
| Australia Pacific | — | 12 | 1 | 7 | ||||||||||||
| Capital Projects | — | — | 298 | 168 | ||||||||||||
| Other | 7 | — | 8 | — | ||||||||||||
| Segment total | 243 | 243 | 577 | 359 | ||||||||||||
| Other items not allocated to segments | 9 | 7 | 4 | 31 | ||||||||||||
| Enterprise total | $ | 252 | $ | 250 | $ | 581 | $ | 390 | ||||||||
Asset Information
| Amortization | Segment capital expenditures1 | |||||||||||||||
| For the six months ended June 30 | 2009 | 2008 | 2009 | 2008 | ||||||||||||
Gold | ||||||||||||||||
| North America | $ | 176 | $ | 155 | $ | 254 | $ | 135 | ||||||||
| South America | 62 | 89 | 69 | 37 | ||||||||||||
| Australia Pacific | 142 | 121 | 67 | 85 | ||||||||||||
| Africa | 31 | 37 | 54 | 44 | ||||||||||||
Copper | ||||||||||||||||
| South America | 38 | 37 | 20 | 29 | ||||||||||||
| Australia Pacific | 2 | 27 | 5 | 14 | ||||||||||||
| Capital Projects | — | — | 611 | 291 | ||||||||||||
| Other | 14 | — | 11 | — | ||||||||||||
| Segment total | 465 | 466 | 1,091 | 635 | ||||||||||||
| Other items not allocated to segments | 34 | 12 | 11 | 48 | ||||||||||||
| Enterprise total | $ | 499 | $ | 478 | $ | 1,102 | $ | 683 | ||||||||
| 1 | Segment capital expenditures are presented for internal management reporting purposes on an accrual basis. Capital expenditures in the Consolidated Statements of Cash Flow are presented on a cash basis. For the three months ended June 30, 2009, cash expenditures were $605 million (2008: $326 million) and the decrease in accrued expenditures were $24 million (2008: $64 million increase), for the six months ended June 30, 2009, cash expenditures were $1,075 million (2008: $591 million) and the increase in accrued expenditures were $27 million (2008: $92 million increase). |
| BARRICK SECOND QUARTER 2009 | 46 | NOTES TO FINANCIAL STATEMENTS (UNAUDITED) |
5> REVENUE AND GOLD SALES CONTRACTS
| Three month period | Six month period | |||||||||||||||
| ended June 30 | ended June 30 | |||||||||||||||
| 2009 | 2008 | 2009 | 2008 | |||||||||||||
Gold bullion sales1,2 | ||||||||||||||||
| Spot market sales | $ | 1,710 | $ | 1,642 | $ | 3,247 | $ | 3,202 | ||||||||
| 1,710 | 1,642 | 3,247 | 3,202 | |||||||||||||
Concentrate sales3 | 44 | 42 | 76 | 90 | ||||||||||||
| $ | 1,754 | $ | 1,684 | $ | 3,323 | $ | 3,292 | |||||||||
Copper sales1,4 | ||||||||||||||||
| Copper cathode sales | $ | 231 | $ | 226 | $ | 453 | $ | 495 | ||||||||
| Concentrate sales | 31 | 57 | 56 | 138 | ||||||||||||
| $ | 262 | $ | 283 | $ | 509 | $ | 633 | |||||||||
Oil and gas sales5 | $ | 13 | $ | — | $ | 24 | $ | — | ||||||||
| 1 | Revenues include amounts transferred from OCI to earnings for commodity cash flow hedges (see notes 16C and 19). | |
| 2 | Gold sales include gains and losses on non-hedge derivative contracts: For the three months ended June 30, 2009: $9 million gain (2008: $8 million loss), six months ended June 30, 2009: $23 million gain (2008: $5 million loss). | |
| 3 | Concentrate sales include gains and losses on embedded derivatives in smelting contracts: For the three months ended June 30, 2009: $0.1 million loss (2008: $1 million loss), six months ended June 30, 2009: $0.4 million gain (2008: $3 million loss). | |
| 4 | Copper sales include gains and losses on economic copper hedges that do not qualify for hedge accounting treatment: For the three months ended June 30, 2009: $21 million loss (2008: $10 million gain), six months ended June 30, 2009: $37 million loss (2008: $22 million gain). Sales also include gains and losses on embedded derivatives in copper smelting contracts: For the three months ended June 30, 2009: $1 million gain (2008: $2 million gain), six months ended June 30, 2009: $1 million gain (2008: $2 million gain). | |
| 5 | Represents Barrick Energy. |
Mark-to-Market Value
| Total ounces | At June 30, | |||||||
| $ millions | in millions | 2009 value1 | ||||||
| Project Gold Sales Contracts | ||||||||
| Fixed-price contracts | 5.4 | $ | (3,118 | ) | ||||
| Floating spot price contracts | 4.1 | (2,183 | ) | |||||
| 9.5 | $ | (5,301 | ) | |||||
| 1 | At a spot gold price of $934.50 per ounce. The fair value of gold sales contracts are the present value of expected cash flows that would be required to financially settle our obligations arising under the contracts. The present value model utilizes inputs, such as the current spot gold price, gold lease rates and US dollar interest rate curves that are derived from observable market data. |
Provisional Copper and Gold Sales
We had the following revenues before treatment and refining charges subject to final price adjustments:
| At June 30 | 2009 | 2008 | ||||||
| Copper | $ | 40 | $ | 78 | ||||
| Gold | 11 | 11 | ||||||
The final price adjustments realized were as follows:
| Three month | Six month period | |||||||||||||||
| period ended | ended | |||||||||||||||
| Gain (loss) | June 30 | June 30 | ||||||||||||||
| 2009 | 2008 | 2009 | 2008 | |||||||||||||
| Copper | $ | 16 | $ | (1 | ) | $ | 36 | $ | 34 | |||||||
| Gold | — | — | — | 2 | ||||||||||||
6 > COST OF SALES
| Gold | Copper | Oil & Gas | ||||||||||||||||||||||
| For the three months ended June 30 | 2009 | 2008 | 2009 | 2008 | 2009 | 2008 | ||||||||||||||||||
Cost of goods sold1 | $ | 805 | $ | 795 | $ | 110 | $ | 84 | $ | 6 | $ | — | ||||||||||||
| Unrealized gains on non-hedge contracts | (4 | ) | (31 | ) | — | — | — | — | ||||||||||||||||
By-product revenues2 | (13 | ) | (32 | ) | — | — | — | — | ||||||||||||||||
| Royalty expense | 57 | 56 | 1 | 2 | 2 | — | ||||||||||||||||||
| Mining production taxes | 11 | 8 | — | — | — | — | ||||||||||||||||||
| $ | 856 | $ | 796 | $ | 111 | $ | 86 | $ | 8 | $ | — | |||||||||||||
| BARRICK SECOND QUARTER 2009 | 47 | NOTES TO FINANCIAL STATEMENTS (UNAUDITED) |
| Gold | Copper | Oil & Gas | ||||||||||||||||||||||
| For the six months ended June 30 | 2009 | 2008 | 2009 | 2008 | 2009 | 2008 | ||||||||||||||||||
Cost of goods sold1 | $ | 1,595 | $ | 1,462 | $ | 227 | $ | 175 | $ | 13 | $ | — | ||||||||||||
| Unrealized gains on non-hedge contracts | (8 | ) | (35 | ) | — | — | — | — | ||||||||||||||||
By-product revenues2 | (25 | ) | (67 | ) | (1 | ) | (1 | ) | — | — | ||||||||||||||
| Royalty expense | 103 | 104 | — | 3 | 4 | — | ||||||||||||||||||
| Mining production taxes | 22 | 16 | — | — | — | — | ||||||||||||||||||
| $ | 1,687 | $ | 1,480 | $ | 226 | $ | 177 | $ | 17 | $ | — | |||||||||||||
| 1 | Cost of goods sold includes charges to reduce the cost of inventory to net realizable value as follows: $1 million for the three months ended June 30, 2009 (2008: $nil million) and $ 1 million for the six months ended June 30, 2009 (2008: $7 million). The cost of inventory sold in the period reflects all components capitalized to inventory, except that, for presentation purposes, the component of inventory cost relating to amortization of property, plant and equipment is classified in the income statement under “amortization”. Some companies present this amount under “cost of sales”. The amount presented in amortization rather than cost of sales was $ 243 million in the three months ended June 30, 2009 (2008: $243 million) and $ 465 million in the six months ended June 30, 2009 (2008: $466 million). | |
| 2 | We use silver sales contracts to sell a portion of silver produced as a by-product. Silver sales contracts have similar delivery terms and pricing mechanisms as gold sales contracts and accordingly, are accounted for in a manner similar to our gold sales contracts. At June 30, 2009, we had fixed-price commitments to deliver 8.1 million ounces of silver at an average price of $6.60 per ounce and floating spot price silver sales contracts for 6.8 million ounces of silver at an average price of $8.52 per ounce over periods primarily of up to 10 years. The mark-to-market on silver sales contracts at June 30, 2009 was negative $88 million (2008: negative $141 million). Refer to note 17 for further information on fair value measurements. |
7 > EXPLORATION AND PROJECT DEVELOPMENT EXPENSE
| Three month | Six month | |||||||||||||||
| period ended | period ended | |||||||||||||||
| June 30 | June 30 | |||||||||||||||
| 2009 | 2008 | 2009 | 2008 | |||||||||||||
| Exploration: | ||||||||||||||||
| Minesite exploration | $ | 7 | $ | 21 | $ | 18 | $ | 38 | ||||||||
| Projects | 28 | 33 | 49 | 59 | ||||||||||||
| $ | 35 | $ | 54 | $ | 67 | $ | 97 | |||||||||
| Project development expense: | ||||||||||||||||
Pueblo Viejo1 | (1 | ) | 39 | — | 56 | |||||||||||
| Sedibelo | 3 | 4 | 5 | 9 | ||||||||||||
| Fedorova | 1 | 6 | 1 | 10 | ||||||||||||
Buzwagi2 | — | — | — | 1 | ||||||||||||
| Pascua-Lama | 2 | 6 | 5 | 8 | ||||||||||||
| Kainantu | 2 | 8 | 4 | 14 | ||||||||||||
| Pinson | — | 3 | 2 | 5 | ||||||||||||
| Other | 7 | 17 | 21 | 26 | ||||||||||||
| $ | 14 | $ | 83 | $ | 38 | $ | 129 | |||||||||
| 1 | Effective January 1, 2009, we determined that mineralization at Pueblo Viejo met the definition of proven and probable reserves for United States reporting purposes and have begun capitalizing the cost of project activities. In 2009, the costs above represent 100% of start-up costs. We record a non-controlling interest recovery for our partner’s share of these expenditures within “non- controlling interests” in the income statement. In 2009, the costs include a reimbursement of historical remediation expenditures. | |
| 2 | In second quarter 2009, production began at our Buzwagi mine and we began amortizing mine property, plant and equipment. |
8 > OTHER EXPENSE
A Other Expense
| Three month | Six month | |||||||||||||||
| period ended | period ended | |||||||||||||||
| June 30 | June 30 | |||||||||||||||
| 2009 | 2008 | 2009 | 2008 | |||||||||||||
Regional business unit costs1 | $ | 38 | $ | 40 | $ | 72 | $ | 71 | ||||||||
Community development costs2 | 4 | 6 | 8 | 17 | ||||||||||||
| Environmental remediation costs | 2 | 2 | 8 | 8 | ||||||||||||
| World Gold Council fees | 3 | 2 | 7 | 5 | ||||||||||||
| Pension and other post- retirement benefit expense | 1 | — | 3 | 1 | ||||||||||||
| Severance costs | — | — | 11 | — | ||||||||||||
| Non-hedge derivative losses | 2 | — | 5 | — | ||||||||||||
| Other | 10 | — | 21 | 2 | ||||||||||||
| $ | 60 | $ | 50 | $ | 135 | $ | 104 | |||||||||
| 1 | Relates to costs incurred at regional business unit offices. | |
| 2 | Amounts mainly relate to community programs in Peru, Argentina and Tanzania. |
B Impairment Charges
| Three month period | Six month period | |||||||||||||||
| ended June 30 | ended June 30 | |||||||||||||||
| 2009 | 2008 | 2009 | 2008 | |||||||||||||
| Impairment charges on investments | $ | — | $ | — | $ | 1 | $ | 39 | ||||||||
| BARRICK SECOND QUARTER 2009 | 48 | NOTES TO FINANCIAL STATEMENTS (UNAUDITED) |
C Other Income
| Three month period | Six month period | |||||||||||||||
| ended June 30 | ended June 30 | |||||||||||||||
| 2009 | 2008 | 2009 | 2008 | |||||||||||||
| Gain on sale of assets | $ | 8 | $ | — | $ | 10 | $ | 4 | ||||||||
Gain on sale of investments (note 12)1 | — | 45 | — | 46 | ||||||||||||
Gain on acquisition of Hemlo (note 3A)2 | 72 | — | 72 | — | ||||||||||||
| Currency translation gains (losses) | 6 | (8 | ) | (4 | ) | 7 | ||||||||||
| Royalty income | 1 | 11 | 2 | 17 | ||||||||||||
| Interest income | 2 | 2 | 3 | 5 | ||||||||||||
| Other | — | 4 | — | 5 | ||||||||||||
| $ | 89 | $ | 54 | $ | 83 | $ | 84 | |||||||||
| 1 | In the second quarter of 2008, we sold Asset-Backed Commercial Paper for proceeds of $49 million. | |
| 2 | In the second quarter of 2009, we completed the acquisition of the remaining 50% interest in Hemlo. We grossed up our 50% interest in the assets and liabilities of Hemlo held prior to this transactions to their current fair values. The net gain recognized on the acquisition was $72 million. Refer to note 3A for further details. |
D Non-controlling Interests
| Three month period | Six month period | |||||||||||||||
| ended June 30 | ended June 30 | |||||||||||||||
| 2009 | 2008 | 2009 | 2008 | |||||||||||||
| Pueblo Viejo project | $ | — | $ | 8 | $ | — | $ | 15 | ||||||||
| Tulawaka mine | — | (13 | ) | (2 | ) | (23 | ) | |||||||||
| $ | — | $ | (5 | ) | $ | (2 | ) | $ | (8 | ) | ||||||
9 > INCOME TAX EXPENSE
| Three month | Six month | |||||||||||||||
| period ended | period ended | |||||||||||||||
| June 30 | June 30 | |||||||||||||||
| 2009 | 2008 | 2009 | 2008 | |||||||||||||
| Current | $ | 176 | $ | 117 | $ | 275 | $ | 327 | ||||||||
| Deferred | 22 | 31 | (39 | ) | 74 | |||||||||||
| 198 | 148 | 236 | 401 | |||||||||||||
| Actual effective tax rate | 28 | % | 23 | % | 21 | % | 28 | % | ||||||||
| Impact of gain on acquisition of Hemlo | 3 | % | — | 1 | % | — | ||||||||||
| Release of valuation allowance | — | 11 | % | — | 5 | % | ||||||||||
| Increase to unrecognized tax benefits | — | (4 | %) | — | (2 | %) | ||||||||||
| Impact of net currency translation gains/losses) on deferred tax balances | (2 | %) | 1 | % | (1 | %) | ||||||||||
| Canadian Functional Currency Election | — | — | 6 | % | �� | — | ||||||||||
| Estimated effective tax rate on ordinary income | 29 | % | 30 | % | 29 | % | 30 | % | ||||||||
The primary reasons why our effective income tax rate on ordinary income differs from the 33% Canadian statutory rate are mainly due to certain allowances and special deductions unique to extractive industries, and also because we operate in multiple tax jurisdictions, some of which have lower tax rates than the applicable Canadian federal and provincial rates.
Currency Translation
Deferred tax balances are subject to remeasurement for changes in currency exchange rates each period. The most significant balances are Australian and Papua New Guinea net deferred tax liabilities. These translation gains/losses are included within deferred tax expense/recovery.
Canadian Functional Currency Election
In fourth quarter 2008, we filed an election under Canadian draft legislation to prepare some of our Canadian tax returns using US dollar functional currency effective January 1, 2008. The legislation was enacted in first quarter 2009 which resulted in a one-time benefit of $70 million.
Decrease to Unrecognized Tax Benefits
In second quarter 2009, we made payments of $1 million and in first quarter 2009, we made payments of $15 million in settlement of US unrecognized tax benefits. We expect the amount of unrecognized tax benefits to further decrease within 12 months of the reporting date by approximately $7 to $8 million related primarily to the expected settlement of US income tax and Canadian mining tax assessments.
Release of Valuation Allowance
In second quarter 2008, due to the impact of higher market gold prices, we released $74 million of valuation allowances related to U.S. Alternative Minimum tax credits.
| BARRICK SECOND QUARTER 2009 | 49 | NOTES TO FINANCIAL STATEMENTS (UNAUDITED) |
10> EARNINGS PER SHARE
| Three month period ended June 30 | Six month period ended June 30 | |||||||||||||||||||||||||||||||
| ($ millions, except shares in millions and per share amounts in dollars) | 2009 | 2008 | 2009 | 2008 | ||||||||||||||||||||||||||||
| Basic | Diluted | Basic | Diluted | Basic | Diluted | Basic | Diluted | |||||||||||||||||||||||||
| Income available to common shareholders | $ | 492 | $ | 492 | $ | 485 | $ | 485 | $ | 863 | $ | 863 | $ | 999 | $ | 999 | ||||||||||||||||
| Plus: interest on convertible debentures | — | 1 | — | — | — | 1 | — | 1 | ||||||||||||||||||||||||
| Net Income | 492 | 493 | 485 | 485 | 863 | 864 | 999 | 1,000 | ||||||||||||||||||||||||
| Weighted average shares outstanding | 873 | 873 | 872 | 872 | 873 | 873 | 872 | 872 | ||||||||||||||||||||||||
| Effect of dilutive securities | ||||||||||||||||||||||||||||||||
| Stock options | — | 3 | — | 4 | — | 3 | — | 4 | ||||||||||||||||||||||||
| Convertible debentures | — | 9 | — | 9 | — | 9 | — | 9 | ||||||||||||||||||||||||
| 873 | 885 | 872 | 885 | 873 | 885 | 872 | 885 | |||||||||||||||||||||||||
| Earnings per share | ||||||||||||||||||||||||||||||||
| Net income | $ | 0.56 | $ | 0.56 | $ | 0.56 | $ | 0.55 | $ | 0.99 | $ | 0.98 | $ | 1.15 | $ | 1.13 | ||||||||||||||||
11 > OPERATING CASH FLOW — OTHER ITEMS
| Three month period ended | Six month period ended | |||||||||||||||
| June 30 | June 30 | |||||||||||||||
| 2009 | 2008 | 2009 | 2008 | |||||||||||||
| Adjustments for non-cash income statement items: | ||||||||||||||||
| Currency translation (gains) losses (note 8C) | $ | (6 | ) | $ | 8 | $ | 4 | $ | (7 | ) | ||||||
| Amortization of discount/premium on debt securities | (2 | ) | (3 | ) | (4 | ) | (5 | ) | ||||||||
| Stock option expense | 5 | 4 | 9 | 9 | ||||||||||||
| Loss from equity investees (note 12) | 20 | 9 | 48 | 7 | ||||||||||||
| Non-controlling interests (note 8D) | — | 5 | 2 | 8 | ||||||||||||
| Gain on sale of investments (note 8C) | — | (45 | ) | — | (46 | ) | ||||||||||
| Impairment charges (note 8B) | — | — | 1 | 39 | ||||||||||||
| Net change in working capital items, excluding inventory and income taxes payable | 34 | (25 | ) | (144 | ) | (71 | ) | |||||||||
| Settlement of AROs | (8 | ) | (9 | ) | (14 | ) | (16 | ) | ||||||||
| Other net operating activities | $ | 43 | $ | (56 | ) | $ | (98 | ) | $ | (82 | ) | |||||
| Operating cash flow includes payments for: | ||||||||||||||||
| Interest costs | $ | 98 | $ | 95 | $ | 142 | $ | 112 | ||||||||
| BARRICK SECOND QUARTER 2009 | 50 | NOTES TO FINANCIAL STATEMENTS (UNAUDITED) |
12> INVESTMENTS
| At June 30, 2009 | At Dec. 31, 2008 | |||||||
| Available-for-sale securities | $ | 51 | $ | 31 | ||||
| Other investments | 30 | 29 | ||||||
| Equity investments | 1,104 | 1,085 | ||||||
| $ | 1,185 | $ | 1,145 | |||||
| At June 30, 2009 | At Dec. 31, 2008 | |||||||||||||||
| Gains | Gains | |||||||||||||||
| Fair1 | (losses) | Fair | (losses) | |||||||||||||
| Value | in OCI | value | in OCI | |||||||||||||
Available-for-sale Securities | ||||||||||||||||
Securities in an unrealized gain position | ||||||||||||||||
| Equity securities | 42 | 19 | 14 | 3 | ||||||||||||
Securities in an unrealized loss position | ||||||||||||||||
Benefit plans2 | ||||||||||||||||
| Fixed-income | 2 | — | 2 | — | ||||||||||||
| Equity | 6 | (2 | ) | 7 | (3 | ) | ||||||||||
Other equity securities3 | 1 | — | 8 | (2 | ) | |||||||||||
| 9 | (2 | ) | 17 | (5 | ) | |||||||||||
| 51 | 17 | 31 | (2 | ) | ||||||||||||
Other investments | ||||||||||||||||
Long-term loan receivable from Yokohama Rubber Co. Ltd.4 | 30 | 29 | — | |||||||||||||
| $ | 81 | $ | 17 | $ | 60 | $ | (2 | ) | ||||||||
1 Refer to note 17 for further information on the measurement of fair value.
2 Under various benefit plans for certain former Homestake executives, a portfolio of marketable fixed-income and equity securities are held in a rabbi trust that is used to fund obligations under the plans.
3 Other equity securities in a loss position consist of investments in various junior mining companies.
4 The long-term loan receivable is measured at amortized cost.
Gains on Investments Recorded in Earnings
| Three month period | Six month period | |||||||||||||||
| ended June 30 | ended June 30 | |||||||||||||||
| 2009 | 2008 | 2009 | 2008 | |||||||||||||
| Gains realized on sales | $ | — | $ | 45 | $ | — | $ | 46 | ||||||||
| Cash proceeds from sales | $ | — | $ | 55 | $ | — | $ | 57 | ||||||||
Impairment charges
| Three month period | Six month period | |||||||||||||||
| ended June 30 | ended June 30 | |||||||||||||||
| 2009 | 2008 | 2009 | 2008 | |||||||||||||
| Impairment charges | $ | — | $ | — | $ | 1 | $ | 39 | ||||||||
Equity Method Investment Continuity
| Highland | Atacama | Cerro Casale | Donlin Creek | Kabanga | Total | |||||||||||||||||||
| At January 1, 2009 | $ | 35 | $ | 157 | $ | 815 | $ | 78 | $ | — | $ | 1,085 | ||||||||||||
| Equity pick-up | 1 | (22 | ) | (8 | ) | (10 | ) | (9 | ) | (48 | ) | |||||||||||||
| Capitalized interest | — | 4 | 23 | 2 | — | 29 | ||||||||||||||||||
| Funding | — | 13 | — | 6 | 11 | 30 | ||||||||||||||||||
| Eliminations | — | — | 8 | — | — | 8 | ||||||||||||||||||
| At June 30, 2009 | $ | 36 | $ | 152 | $ | 838 | $ | 76 | $ | 2 | $ | 1,104 | ||||||||||||
| Publicly traded | Yes | No | No | No | No | |||||||||||||||||||
| BARRICK SECOND QUARTER 2009 | 51 | NOTES TO FINANCIAL STATEMENTS (UNAUDITED) |
13> INVENTORIES
| Gold | Copper | |||||||||||||||
| At June 30 | At Dec. 31 | At June 30 | At Dec. 31 | |||||||||||||
| 2009 | 2008 | 2009 | 2008 | |||||||||||||
| Raw materials | ||||||||||||||||
| Ore in stockpiles | $ | 895 | $ | 825 | $ | 42 | $ | 41 | ||||||||
| Ore on leach pads | 193 | 161 | 186 | 189 | ||||||||||||
| Mine operating supplies | 492 | 434 | 24 | 34 | ||||||||||||
| Work in process | 211 | 188 | 12 | 8 | ||||||||||||
| Finished products | ||||||||||||||||
| Gold doré/bullion | 54 | 65 | — | — | ||||||||||||
| Copper cathode | — | — | 15 | 13 | ||||||||||||
| Copper concentrate | — | — | 35 | 18 | ||||||||||||
| Gold concentrate | 21 | 21 | — | — | ||||||||||||
| 1,866 | 1,694 | 314 | 303 | |||||||||||||
Non-current ore in stockpiles1 | (608 | ) | (595 | ) | (98 | ) | (93 | ) | ||||||||
| $ | 1,258 | $ | 1,099 | $ | 216 | $ | 210 | |||||||||
| 1 | Ore that we do not expect to process in the next 12 months is classified within other assets. |
| Three month period | Six month period | |||||||||||||||
| ended June 30 | ended June 30 | |||||||||||||||
| 2009 | 2008 | 2009 | 2008 | |||||||||||||
| Inventory impairment charges | $ | 1 | $ | — | $ | 1 | $ | 7 | ||||||||
Purchase Commitments
At June 30, 2009, we had purchase obligations for supplies and consumables of approximately $1,230 million.
14 > PROPERTY, PLANT AND EQUIPMENT
A Unamortized Assets
Acquired Mineral Properties and Capitalized Mine Development Costs
Acquired Mineral Properties and Capitalized Mine Development Costs
| Carrying | Carrying | |||||||
| amount at | amount at | |||||||
| June 30, 2009 | Dec. 31, 2008 | |||||||
| Exploration projects and other land positions | ||||||||
| PNG land positions | $ | 180 | $ | 171 | ||||
| Other | 26 | 26 | ||||||
| Value beyond proven and probable reserves at producing mines | 478 | 525 | ||||||
| Capital Projects | ||||||||
| Pascua-Lama | 868 | 777 | ||||||
| Pueblo Viejo | 830 | 439 | ||||||
| Sedibelo | 121 | 123 | ||||||
Buzwagi1 | — | 495 | ||||||
| Punta Colorado Wind Farm | 103 | 82 | ||||||
| $ | 2,606 | $ | 2,638 | |||||
| 1 | In second quarter 2009, production began at our Buzwagi mine and we began amortizing mine property, plant and equipment. |
B Amortization and Accretion
| Three month period | Six month period | |||||||||||||||
| ended June 30 | ended June 30 | |||||||||||||||
| 2009 | 2008 | 2009 | 2008 | |||||||||||||
| Amortization | $ | 252 | $ | 250 | $ | 499 | $ | 478 | ||||||||
| Accretion | 15 | 14 | 29 | 27 | ||||||||||||
| $ | 267 | $ | 264 | $ | 528 | $ | 505 | |||||||||
C Capital Commitments
In addition to entering into various operational commitments in the normal course of business, we had commitments of approximately $583 million at June 30, 2009 for construction activities at our capital projects.
15 > GOODWILL
In first quarter 2009, our Plutonic gold mine in Australia reported a reduction in reserves at the end of 2008. As a result of the decline in reserves there is an increased risk of a goodwill impairment occurring should there be a further decline in economic factors affecting the mine. We determined that it was appropriate to assess the carrying amount of goodwill associated with Plutonic for potential impairment. No impairment charges were booked in the first quarter as a result of this assessment.
In second quarter 2009, we acquired the remaining 50% interest in our Hemlo mine resulting in a $20 million reduction of goodwill (note 3A).
| BARRICK SECOND QUARTER 2009 | 52 | NOTES TO FINANCIAL STATEMENTS (UNAUDITED) |
16 > FINANCIAL INSTRUMENTS
Financial instruments include cash; evidence of ownership in an entity; or a contract that imposes an obligation on one party and conveys a right to a second entity to deliver/receive cash or another financial instrument.
A Cash and Equivalents
Cash and equivalents include cash, term deposits, treasury bills and money markets with original maturities of less than 90 days.
B Long-Term Debt
Interest costs
| Three month period | Six month period | |||||||||||||||
| ended June 30 | ended June 30 | |||||||||||||||
| 2009 | 2008 | 2009 | 2008 | |||||||||||||
| Incurred | $ | 80 | $ | 59 | $ | 149 | $ | 109 | ||||||||
| Capitalized | (66 | ) | (51 | ) | (133 | ) | (95 | ) | ||||||||
| Interest expensed | $ | 14 | $ | 8 | $ | 16 | $ | 14 | ||||||||
For the three months ended June 30, 2009, Cortez Hills, Pascua-Lama, Pueblo Viejo, Donlin Creek, Reko Diq, Cerro Casale, Sedibelo, PNG land positions, kabanga, Golden Sunlight and Punta Colorado Wind farm qualified for interest capitalization. Buzwagi qualified for capitalization until May 1, 2009, when it went into production.
Proceeds
In first quarter 2009, we issued an aggregate of $750 million of notes that mature in 2019. The 10-year notes have a coupon rate of 6.95%.
In October 2006, we issued $1 billion of Copper-Linked Notes. During the first three years, the full $1 billion obligation of these notes is to be repaid through the delivery of (the US dollar equivalent of) 324 million pounds of copper. At June 30, 2009, 13 million pounds of copper remained to be delivered. Coincident with the repayment of (the US dollar equivalent of) 324 million pounds of copper, we will reborrow $1 billion. As the copper-linked equivalent is repaid, the fixed US dollar obligation will increase ($62 million during the second quarter of 2009).
Repayments
In second quarter 2009, we repaid the $113 million drawn on our demand financing facility and terminated the facility. An equal amount required to be placed on deposit that was included in restricted cash has been released.
C Use of Derivative Instruments (“Derivatives”) in Risk Management
In the normal course of business, our assets, liabilities and forecasted transactions are impacted by various market risks including, but not limited to:
| Item | Impacted by | |
• Sales | • Prices of gold and copper | |
• Cost of sales | ||
o Consumption of diesel fuel, propane and natural gas | • Prices of diesel fuel, propane and natural gas | |
o Non-US dollar expenditures | • Currency exchange rates — US dollar versus A$, ARS, C$, CLP, JPY, PGK, TZS and ZAR | |
o By-product credits | • Prices of silver and copper | |
• Corporate administration exploration and business development costs | • Currency exchange rates — US dollar versus A$, ARS, C$, CLP, JPY, PGK, TZS and ZAR | |
• Capital expenditures | ||
o Non-US dollar capital expenditures | • Currency exchange rates — US dollar versus A$, ARS, C$, CLP, EUR and PGK | |
o Consumption of steel | • Price of steel | |
• Interest earned on cash | • US dollar interest rates | |
• Fair value of fixed-rate debt | • US dollar interest rates |
Under our risk management policy, we seek to mitigate the impact of these risks to provide certainty for a portion of our revenues and to control costs and enable us to plan our business with greater certainty. The timeframe and manner in which we manage these risks varies for each item based upon our assessment of the risk and available alternatives for mitigating risk. For these particular risks, we believe that derivatives are an appropriate way of managing the risk.
The primary objective of the hedging elements of our derivative instrument positions is that changes in the values of hedged items are offset by changes in the values of derivatives. Many of the derivatives we use meet the FAS 133 hedge effectiveness criteria and are designated in a hedge accounting relationship. Some of the derivative instruments are effective in achieving our risk management objectives, but they do not meet the strict FAS 133 hedge effectiveness criteria, and they are classified as “economic hedges”. The change in fair value of these economic hedges is recorded in current period earnings, classified with the income statement line item that is consistent with the derivative instruments’ intended risk objective.
Derivative Instruments
The fair value of derivative instruments is determined using either present value techniques or option pricing models that utilize a variety of inputs that are a
| BARRICK SECOND QUARTER 2009 | 53 | NOTES TO FINANCIAL STATEMENTS (UNAUDITED) |
combination of quoted prices and market-corroborated inputs. The fair value of our derivative contracts is adjusted for credit risk based upon the observed credit default swap spread for each particular counterparty, as appropriate. The fair value of US dollar interest rate and currency swap contracts is determined by discounting contracted cash flows using a discount rate derived from observed LIBOR and swap rate curves for comparable assets and liabilities. In the case of currency contracts, we convert non-US dollar cash flows into US dollars using an exchange rate derived from currency swap curves for comparable assets and liabilities. The fair value of commodity forward contracts is determined by discounting contractual cash flows using a discount rate derived from observed LIBOR and swap rate curves. Contractual cash flows are calculated using a forward pricing curve derived from observed forward prices for each commodity. The fair value of commodity options is determined using option-pricing models that utilize a combination of inputs including quoted market prices and market-corroborated inputs. Derivative instruments are classified within Level 2 of the fair value hierarchy.
Summary of Derivatives at June 30, 20091
| Fair | ||||||||||||||||||||||||||||||||
| Notional Amount by Term to | Accounting Classification by | value | ||||||||||||||||||||||||||||||
| Maturity | Notional Amount | (USD) | ||||||||||||||||||||||||||||||
| Within 1 | 2 to 3 | 4 to 5 | Cash flow | Fair value | Non- | |||||||||||||||||||||||||||
| year | years | years | Total | hedge | hedge | Hedge | ||||||||||||||||||||||||||
US dollar interest rate contracts | ||||||||||||||||||||||||||||||||
| Net pay-fixed swap positions (millions) | $ | (75 | ) | $ | — | $ | — | $ | (75 | ) | $ | — | $ | — | $ | (75 | ) | $ | (6 | ) | ||||||||||||
| Pay-fixed swaption (millions) | $ | 100 | $ | — | $ | — | $ | 100 | $ | — | $ | — | $ | 100 | $ | — | ||||||||||||||||
Currency contracts | ||||||||||||||||||||||||||||||||
| C$:US$ contracts (C$ millions) | 207 | — | — | 207 | 207 | — | — | (9 | ) | |||||||||||||||||||||||
| A$:US$ contracts (A$ millions) | 1,433 | 2,464 | 1,031 | 4,928 | 4,920 | — | 8 | 70 | ||||||||||||||||||||||||
| CLP:US$ contracts (CLP millions) | 30,156 | 6,120 | — | 36,276 | 36,276 | — | — | 4 | ||||||||||||||||||||||||
| ZAR:US$ contracts (ZAR millions) | — | — | — | — | — | — | — | 1 | ||||||||||||||||||||||||
| EUR:US$ contracts (EUR millions) | 17 | 30 | — | 47 | 47 | — | — | 1 | ||||||||||||||||||||||||
Commodity contracts | ||||||||||||||||||||||||||||||||
| Copper call option spread contracts (millions of pounds) | 13 | — | — | 13 | — | — | 13 | — | ||||||||||||||||||||||||
| Copper sold forward contracts (millions of pounds) | 24 | — | — | 24 | 24 | — | — | 28 | ||||||||||||||||||||||||
| Copper collar sell contracts (millions of pounds) | 194 | — | — | 194 | 95 | — | 99 | 139 | ||||||||||||||||||||||||
| Copper collar buy contracts (millions of pounds) | (99 | ) | — | — | (99 | ) | — | — | (99 | ) | 48 | |||||||||||||||||||||
Diesel contracts (thousands of barrels)2 | 1,804 | 1,772 | 730 | 4,306 | 4,206 | — | 100 | (46 | ) | |||||||||||||||||||||||
| Propane contracts (millions of gallons) | 15 | — | — | 15 | 15 | — | — | $ | (17 | ) | ||||||||||||||||||||||
| 1 | Excludes gold and silver sales contracts (see notes 5 and 6); refer to note 17 for further information on fair value measurements. | |
| 2 | Diesel commodity contracts represent a combination of WTI and ULSD/WTI Crack spread swaps, WTB, MOPS and JET hedge contracts. These derivatives hedge physical supply contracts based on the price of ULSD, WTB, MOPS and JET respectively, plus a spread. WTI represents West Texas Intermediate, WTB represents Waterborne, MOPS represents Mean of Platts Singapore, JET represents Jet Fuel, ULSD represents Ultra Low Sulfur Diesel US Gulf Coast. |
| BARRICK SECOND QUARTER 2009 | 54 | NOTES TO FINANCIAL STATEMENTS (UNAUDITED) |
Fair Values of Derivative Instruments
| Asset Derivatives | Liability Derivatives | |||||||||||||||||||||||||||||||
| At June 30, 2009 | At Dec. 31, 2008 | At June 30, 2009 | At Dec. 31, 2008 | |||||||||||||||||||||||||||||
| Balance Sheet | Balance Sheet | Balance Sheet | Balance Sheet | |||||||||||||||||||||||||||||
| Classification | Fair Value | Classification | Fair Value | Classification | Fair Value | Classification | Fair Value | |||||||||||||||||||||||||
| Derivatives designated as hedging instruments under FAS 133 | ||||||||||||||||||||||||||||||||
| Currency contracts | Other assets | $ | 173 | Other assets | $ | 22 | Other liabilities | $ | (110 | ) | Other liabilities | $ | (526 | ) | ||||||||||||||||||
| Commodity contracts | Other assets | 125 | Other assets | 402 | Other liabilities | (94 | ) | Other liabilities | (205 | ) | ||||||||||||||||||||||
| Total derivatives classified as hedging instruments under FAS 133 | $ | 298 | $ | 424 | $ | (204 | ) | $ | (731 | ) | ||||||||||||||||||||||
| Derivatives not designated as hedging instruments under FAS 133 | ||||||||||||||||||||||||||||||||
| US dollar interest rate contracts | Other assets | $ | 1 | Other assets | $ | — | Other liabilities | $ | (7 | ) | Other liabilities | $ | (8 | ) | ||||||||||||||||||
| Currency contracts | Other assets | 7 | Other assets | 4 | Other liabilities | (3 | ) | Other liabilities | (1 | ) | ||||||||||||||||||||||
| Commodity contracts | Other assets | 128 | Other assets | 404 | Other liabilities | (7 | ) | Other liabilities | (135 | ) | ||||||||||||||||||||||
| Total derivatives not designated as hedging instruments under FAS 133 | $ | 136 | $ | 408 | $ | (17 | ) | $ | (144 | ) | ||||||||||||||||||||||
| Total derivatives | $ | 434 | $ | 832 | $ | (221 | ) | $ | (875 | ) | ||||||||||||||||||||||
US Dollar Interest Rate Contracts
Non-hedge Contracts
We have a $75 million net US dollar pay-fixed interest rate swap position outstanding that was used to economically hedge the US dollar interest rate risk implicit in a prior gold lease rate swap position. Changes in the fair value of these interest rate swaps are recognized in current period earnings through interest expense. As of June 30, 2009, we have written a $100 million net US dollar pay-fixed swaption. If exercised at maturity, the underlying interest rate swap would be used as a fair value hedge in order to hedge the interest rate risk on our long-term fixed rate debt. Changes in the fair value of the swaption and the premiums earned are recognized in current period earnings through interest expense. For the quarter, we recognized a gain of $1 million in current period earnings.
Currency Contracts
Cash Flow Hedges
During the quarter, currency contracts totaling A$1,093 million, EUR 43 million, PGK 24 million, and CLP 13,656 million have been designated against forecasted non-US dollar denominated expenditures. The outstanding contracts hedge the variability of the US dollar amount of those expenditures caused by changes in currency exchange rates over the next four years.
Hedged items that relate to operating and/or sustaining capital expense are identified as the first stated quantity of dollars of forecasted expenditures in a future month. For C$171 million, A$4,804 million and CLP 36,276 million portions of the contracts, we have concluded that the hedges are 100% effective under FAS 133 because the critical terms (including notional amount and maturity date) of the hedged items and currency contracts are the same. For A$56 million prospective and retrospective hedge effectiveness is assessed using the hypothetical derivative method under FAS 133. The retrospective test involves comparing the effect of historic changes in exchange rates each period on the fair value of both the actual and hypothetical derivative using a dollar offset approach. The effective portion of changes in fair value of the currency contracts is recorded in OCI until the forecasted expenditure impacts earnings. The prospective test involves comparing the effect of a theoretical shift in forward exchange rates on the fair value of both the actual and hypothetical derivative. Where applicable, the fair value of derivatives has been evaluated to account for counterparty credit risk.
Hedged items that relate to pre-production expenditures at our development projects are identified as the stated quantity of dollars of the forecasted expenditures associated with a specific transaction in a pre-defined time period. For C$36 million, A$60 million and EUR 47 million hedge, effectiveness is assessed using the dual spot method under FAS 133, where changes in fair value attributable to changes in spot prices are calculated on a discounted basis for the actual derivative and an undiscounted basis for the hypothetical derivative. The effectiveness testing excludes time value of the hedging instrument. Prospective and retrospective hedge effectiveness uses a dollar offset method. Where applicable, the fair value of derivatives has been evaluated to account for counterparty credit risk.
| BARRICK FIRST QUARTER 2009 | 55 | NOTES TO FINANCIAL STATEMENTS (UNAUDITED) |
Non-hedge Contracts
Non-hedge currency contracts are used to mitigate the variability of the US dollar amount of non-US dollar denominated exposures that do not meet the criterion in FAS 133. Changes in the fair value of non-hedge currency contracts are recorded in current period cost of sales, corporate administration, other income, other expense or income tax expense according to the intention of the hedging instrument.
Commodity Contracts
Diesel Fuel/Propane
Cash Flow Hedges
During the quarter, we entered into 360 thousand barrels of WTI/ULSD crack spread swaps and 300 thousand barrels of MOPS forwards designated against forecasted fuel purchases for expected consumption at our mines. The designated contracts act as a hedge on variability in market prices on the cost of future fuel purchases over the next five years. Hedged items are identified as the first stated quantity in thousands of barrels of forecasted purchases in a future month. Prospective and retrospective hedge effectiveness is assessed using the hypothetical derivative method under FAS 133. The prospective test is based on regression analysis of the month-on-month change in fair value of both the actual derivative and a hypothetical derivative caused by actual historic changes in commodity prices over the last three years. The retrospective test involves comparing the effect of historic changes in commodity prices each period on the fair value of both the actual and hypothetical derivative using a dollar offset approach. The effective portion of changes in fair value of the commodity contracts is recorded in OCI until the forecasted transaction impacts earnings. Where applicable, the fair value of derivatives has been evaluated to account for counterparty credit risk.
On April 1, 2009 Barrick entered a new diesel fuel supply contract. Under the terms of the new contract, fuel purchased for consumption at our Nevada based mines is priced based on the ULSD index. We have continued to hedge our exposure to diesel using our existing WTI forward contracts. Retrospective hedge effectiveness testing shows a strong correlation between ULSD and WTI and thus we expect that these hedges will continue to be effective. The prospective and retrospective testing will continue to be assessed using the hypothetical derivative method under FAS 133.
Non-hedge Contracts
Non-hedge fuel contracts are used to mitigate the risk of price changes on fuel consumption at various sites. On completion of regression analysis, we concluded that contracts totaling 100 thousand barrels of fuel do not meet the “highly effective” criterion in FAS 133 due to currency and basis differences between derivative contract prices and the prices charged to the sites by oil suppliers. Although not qualifying as an accounting hedge, the contracts protect the Company to a significant extent from the effects of changes in fuel prices. Changes in the fair value of non-hedge fuel contracts are recorded in current period cost of sales.
Copper
Cash Flow Hedges
The copper-linked notes issued in 2006 contain an embedded fixed-price forward copper sales contract that meets the definition of a derivative and must be separately accounted for. At June 30, 2009, 13 million pounds of embedded fixed-price forward copper sales contracts were outstanding at a price of $3.08/lb. The resulting copper derivative has been designated against future copper cathode at the Zaldívar mine as a cash flow hedge of the variability in market prices of those future sales.
In addition to the embedded fixed-price forward copper sales contracts outstanding, there are 11 million pounds of copper forwards outstanding at an average price of $3.09/lb hedging future sales at Zaldívar.
Copper collar contracts totaling 95 million pounds have also been designated as hedges against copper cathode sales at our Zaldívar mine. The contracts contain purchased put and sold call options with average strike prices of $2.87/lb and $3.67/lb, respectively.
Hedged items are identified as the first stated quantity of pounds of forecasted sales in a future month. Prospective hedge effectiveness is assessed on these hedges using a dollar offset method. The dollar offset assessment involves comparing the effect of theoretical shifts in forward copper prices on the fair value of both the actual hedging derivative and a hypothetical hedging derivative. The retrospective assessment involves comparing the effect of historic changes in copper prices each period on the fair value of both the actual and hypothetical derivative using a dollar offset approach. The effective portion of changes in fair value of the copper contracts is recorded in OCI until the forecasted copper sale impacts earnings. Where applicable, the fair value of derivatives has been evaluated to account for counterparty credit risk.
Non-hedge Contracts
We have purchased and sold call options on copper that, when combined with the aforementioned embedded fixed-price forward copper sales contracts, economically lock in copper sales prices between $3.08/lb and
| BARRICK FIRST QUARTER 2009 | 56 | NOTES TO FINANCIAL STATEMENTS (UNAUDITED) |
$3.58/lb. At June 30, 2009, the notional amount of these options outstanding was 13 million pounds. During fourth quarter 2008, we de-designated collar sell contracts for 153 million pounds and crystallized $213 million of gains in OCI, of which $95 million remains at quarter-end. At the time of de-designation, we combined them with existing non-hedge contracts for a total of 198 million pounds. These hedges were originally designated against future copper production at our Zaldívar and Osborne mines. The exposure is still expected to occur and therefore amounts crystallized in OCI will be recorded in copper revenue when the originally designated sales occur. We continue to hold these collars as non-hedge contracts. At June 30, 2009, we had 99 million pounds of collar sell contracts outstanding. The contracts contain purchased put and sold call options with an average strike of $3.00/lb and $3.97/lb, respectively.
During fourth quarter 2008, we entered into collar buy contracts for 198 million pounds to economically lock in the gains on the de-designated and existing non-hedge contracts. The remaining contracts contain sold put and purchased call options with average strike prices of $1.57/lb and $2.01/lb, respectively. At June 30, 2009, 99 million pounds of collar buy contracts were outstanding.
These contracts are not designated as cash flow hedges under FAS 133. Changes in the fair value of these copper options are recorded in current period revenue. Where applicable, the fair value of derivatives has been evaluated to account for counterparty credit risk.
Non-hedge Gains (Losses)
| Three month | Six month | |||||||||||||||||
| period ended | period ended | |||||||||||||||||
| June 30 | June 30 | |||||||||||||||||
| Income statement | ||||||||||||||||||
| 2009 | 2008 | 2009 | 2008 | classification | ||||||||||||||
| Commodity contracts | ||||||||||||||||||
| Copper | $ | (21 | ) | $ | 10 | $ | (37 | ) | $ | 22 | Revenue | |||||||
| Gold | 9 | (8 | ) | 23 | (5 | ) | Revenue | |||||||||||
| Fuel | 2 | 33 | 4 | 38 | Cost of sales | |||||||||||||
| Currency contracts | (2 | ) | 1 | (5 | ) | 12 | Cost of sales/corporate administration/other income/expense/income tax expense | |||||||||||
| Interest rate contracts | 1 | 2 | (2 | ) | (1 | ) | Interest income/expense | |||||||||||
| (11 | ) | 38 | (17 | ) | 66 | |||||||||||||
| Hedge ineffectiveness | 1 | (2 | ) | 1 | (6 | ) | ||||||||||||
| Amounts excluded from effectiveness test | 1 | — | 1 | |||||||||||||||
| (9 | ) | 36 | (15 | ) | 60 | |||||||||||||
| BARRICK FIRST QUARTER 2009 | 57 | NOTES TO FINANCIAL STATEMENTS (UNAUDITED) |
Cash Flow Hedge Gains (Losses) in OCI
| Commodity price hedges | Currency hedges | Interest rate hedges | ||||||||||||||||||||||||||||||||||
| Operating | Administration | Capital | Cash | Long-term | ||||||||||||||||||||||||||||||||
| Gold/Silver | Copper | Fuel | costs | costs | expenditures | balances | debt | Total | ||||||||||||||||||||||||||||
| At Dec. 31, 2008 | $ | 13 | $ | 484 | $ | (169 | ) | $ | (478 | ) | $ | (30 | ) | $ | — | $ | — | $ | (33 | ) | $ | (213 | ) | |||||||||||||
| Effective portion of change in fair value of hedging instruments | — | (126 | ) | 47 | 491 | 11 | 12 | — | — | 435 | ||||||||||||||||||||||||||
| Transfers to earnings: | ||||||||||||||||||||||||||||||||||||
| On recording hedged items in earnings | (3 | ) | (196 | ) | 60 | 44 | 8 | (1 | ) | — | 2 | (86 | ) | |||||||||||||||||||||||
| At June 30, 2009 | $ | 10 | $ | 162 | $ | (62 | ) | $ | 57 | $ | (11 | ) | $ | 11 | $ | — | $ | (31 | ) | $ | 136 | |||||||||||||||
| Hedge gains/losses classified within | Gold sales | Copper sales | Cost of sales | Cost of sales | Administration | Amortization | Interest income | Interest expense | ||||||||||||||||||||||||||||
Portion of hedge gain (loss) expected to affect 2009 earnings1 | $ | 9 | $ | 162 | $ | (56 | ) | $ | 55 | $ | (11 | ) | $ | 3 | $ | — | $ | (3 | ) | $ | 159 | |||||||||||||||
| 1 | Based on the fair value of hedge contracts at June 30, 2009. |
Cash Flow Hedge Gains (Losses) at June 30
| Location of gain (loss) | Amount of gain (loss) | |||||||||||||||||||||||||||||||
| Derivatives in | Amount of gain (loss) | recognized in income | recognized in income | |||||||||||||||||||||||||||||
| cash flow | Amount of Gain | Location of gain (loss) | transferred from OCI | (Ineffective portion and amount | (Ineffective portion and | |||||||||||||||||||||||||||
| hedging | (loss) recognized in | transferred from OCI into income | into income | excluded from effectiveness | amount excluded from | |||||||||||||||||||||||||||
| relationships | OCI | (Effective portion) | (Effective portion) | testing) | effectiveness testing) | |||||||||||||||||||||||||||
| 2009 | 2008 | 2009 | 2008 | 2009 | 2008 | |||||||||||||||||||||||||||
| Interest rate contracts | $ | — | $ | — | Interest income/expense | $ | (2 | ) | $ | (1 | ) | Interest income/expense | $ | — | $ | — | ||||||||||||||||
| Cost of sales/Corporate | Cost of sales/corporate | |||||||||||||||||||||||||||||||
| Foreign | administration/amortization/other | administration/amortization/other | ||||||||||||||||||||||||||||||
| exchange | income/expense/income tax | income/expense/income tax | ||||||||||||||||||||||||||||||
| contracts | 514 | 323 | expense | (51 | ) | 111 | expense | 2 | — | |||||||||||||||||||||||
| Commodity | Revenue/cost of sales/project | Revenue/cost of sales/project | ||||||||||||||||||||||||||||||
| contracts | (79 | ) | (35 | ) | development expense | 139 | (23 | ) | development expense | — | (6 | ) | ||||||||||||||||||||
| Total | $ | 435 | $ | 288 | $ | 86 | $ | 87 | $ | 2 | $ | (6 | ) | |||||||||||||||||||
D Other use of derivative instruments
On a regular basis, we use derivative instruments to increase our gold and copper revenue. We enter into purchased and written options with the primary objective of increasing the realized price on our gold and copper sales.
During the quarter, we wrote gold put and call options with an average outstanding notional volume of 0.4 and 0.6 million ounces, respectively, on a net basis. We also held net purchased gold forwards during the second quarter with an average outstanding notional of 0.02 million ounces.
During the quarter, we wrote copper call options averaging 10 million pounds.
As a result of these activities, we recorded gains in revenue of $9 million on gold contracts and $1 million on copper options in second quarter 2009. There were no outstanding gold contracts outstanding at June 30, 2009. There were 22 million pounds of written copper call options outstanding at June 30, 2009.
17 > FAIR VALUE MEASUREMENTS
In 2008, we adopted FAS 157 for financial assets and liabilities that are measured at fair value on a recurring basis. FAS 157 defines fair value, establishes a framework for measuring fair value under US GAAP, and requires expanded disclosures about fair value measurements. Beginning in 2009, we applied FAS 157 to non-financial assets and liabilities that we periodically measure at fair value under US GAAP, which include: goodwill, tangible and intangible assets measured and recognized at fair value as a result of an impairment assessment; and non financial assets and non financial liabilities recognized as a result of a business combination. The application of FAS 157 to non-financial assets and liabilities will not have a significant impact on our methodology for measuring their fair values, but results in expanded disclosures.
FAS 157 defines fair value as the price that would be received to sell an asset or paid to transfer a liability in an orderly transaction between market participants at the measurement date. The fair value hierarchy
| BARRICK SECOND QUARTER 2009 | 58 | NOTES TO FINANCIAL STATEMENTS (UNAUDITED) |
established by FAS 157 establishes three levels to classify the inputs to valuation techniques used to measure fair value. Level 1 inputs are quoted prices (unadjusted) in active markets for identical assets or liabilities. Level 2 inputs are quoted prices in markets that are not active, quoted prices for similar assets or liabilities in active markets, inputs other than quoted prices that are observable for the asset or liability (for example, interest rate and yield curves observable at commonly quoted intervals, forward pricing curves used to value currency and commodity contracts and volatility measurements used to value option contracts), or inputs that are derived principally from or corroborated by observable market data or other means. Level 3 inputs are unobservable (supported by little or no market activity). The fair value hierarchy gives the highest priority to Level 1 inputs and the lowest priority to Level 3 inputs.
A Assets and Liabilities Measured at Fair Value on a Recurring Basis
Fair Value Measurements at June 30, 2009
| Quoted Prices in | Significant | |||||||||||||||
| Active Markets | Other | Significant | ||||||||||||||
| for Identical | Observable | Unobservable | ||||||||||||||
| Assets | Inputs | Inputs | Aggregate | |||||||||||||
| (Level 1) | (Level 2) | (Level 3) | Fair Value | |||||||||||||
| Cash equivalents | $ | 1,354 | $ | — | $ | — | $ | 1,354 | ||||||||
| Available-for-sale securities | 51 | — | — | 51 | ||||||||||||
| Receivables from provisional copper and gold sales | — | 61 | — | 61 | ||||||||||||
| Derivative Instruments | — | 213 | — | 213 | ||||||||||||
| $ | 1,405 | $ | 274 | $ | — | $ | 1,679 | |||||||||
B Fair Values of Financial Instruments
| At June 30, 2009 | At Dec. 31, 2008 | |||||||||||||||
| Carrying | Estimated | Carrying | Estimated | |||||||||||||
| amount | fair value | amount | fair value | |||||||||||||
| Financial assets | ||||||||||||||||
Cash and equivalents1 | $ | 2,038 | $ | 2,038 | $ | 1,437 | $ | 1,437 | ||||||||
Accounts receivable1 | 233 | 233 | 197 | 197 | ||||||||||||
Available-for-sale securities2 | 34 | 51 | 31 | 31 | ||||||||||||
| Derivative assets | 434 | 434 | 832 | 832 | ||||||||||||
| $ | 2,739 | $ | 2,756 | $ | 2,497 | $ | 2,497 | |||||||||
| Financial liabilities | ||||||||||||||||
Accounts payable1 | $ | 942 | $ | 942 | $ | 970 | $ | 970 | ||||||||
Long-term debt3 | 5,126 | 5,227 | 4,556 | 3,620 | ||||||||||||
| Derivative liabilities | 221 | 221 | 875 | 875 | ||||||||||||
Restricted share units4 | 102 | 102 | 120 | 120 | ||||||||||||
Deferred share units4 | 5 | 5 | 5 | 5 | ||||||||||||
| $ | 6,396 | $ | 6,497 | $ | 6,526 | $ | 5,590 | |||||||||
| 1 | Recorded at cost. Fair value approximates the carrying amounts due to the short-term nature and generally negligible credit losses. | |
| 2 | Recorded at fair value. Quoted market prices are used to determine fair value. | |
| 3 | Long-term debt is generally recorded at cost except for obligations that are designated in a fair-value hedge relationship, which are recorded at fair value in periods when a hedge relationship exists. The fair value of long-term debt is primarily determined using quoted market prices. Balance includes current portion of long-term debt. | |
| 4 | Recorded at fair value based on our period-end closing market share price. |
18 > CAPITAL STOCK
A Common Shares
Our authorized capital stock includes an unlimited number of common shares (issued 873,716,785 common shares); 9,764,929 First preferred shares Series A (issued nil); 9,047,619 Series B (issued nil); nil Series C special voting share (issued nil); and 14,726,854 Second preferred shares Series A (issued nil).
B Exchangeable Shares
In connection with a 1998 acquisition, Barrick Gold Inc. (“BGI”) issued 11.1 million BGI exchangeable shares, which were each exchangeable for 0.53 of a Barrick common share at any time at the option of the holder, and had essentially the same voting, dividend (payable in Canadian dollars), and other rights as 0.53 of a Barrick common share. BGI is a subsidiary that holds our interest in the Hemlo and Eskay Creek Mines.
We had the right to require the exchange of each outstanding BGI exchangeable share for 0.53 of a Barrick common share. In first quarter 2009, the remaining 0.5 million BGI exchangeable shares were redeemed for 0.3 million Barrick common shares. At June 30, 2008, 1.3 million BGI exchangeable shares were outstanding, which were the equivalent to 0.7 million Barrick common shares and were reflected in the number of common shares outstanding.
| BARRICK SECOND QUARTER 2009 | 59 | NOTES TO FINANCIAL STATEMENTS (UNAUDITED) |
19 > OTHER COMPREHENSIVE INCOME (LOSS) (“OCI”)2
| Three month period ended | Six month period ended | |||||||||||||||
| June 30 | June 30 | |||||||||||||||
| 2009 | 2008 | 2009 | 2008 | |||||||||||||
| Accumulated OCI at beginning of period | ||||||||||||||||
| Cash flow hedge gains (losses), net of tax of $119, $84, $89, $105 | $ | (232) | $ | 134 | $ | (124) | $ | 250 | ||||||||
| Investments, net of tax of $1, $3, $nil, $4 | 3 | 19 | (2 | ) | 37 | |||||||||||
| Currency translation adjustments, net of tax of $nil, $nil, $nil, $nil | (206 | ) | (143 | ) | (197 | ) | (143 | ) | ||||||||
| Pension plans and other post-retirement benefits, net of tax of $19, $2, $19, $2 | (33 | ) | 7 | (33 | ) | 7 | ||||||||||
| (468 | ) | $ | 17 | $ | (356 | ) | $ | 151 | ||||||||
| Other comprehensive income (loss) for the period: | ||||||||||||||||
| Changes in fair value of cash flow hedges | 538 | 400 | 435 | 288 | ||||||||||||
| Changes in fair value of investments | 13 | 36 | 18 | 18 | ||||||||||||
Currency translation adjustments1 | 27 | — | 18 | — | ||||||||||||
| Less: reclassification adjustments for gains/losses recorded in earnings: | ||||||||||||||||
| Transfers of cash flow hedge gains to earnings: | ||||||||||||||||
| On recording hedged items in earnings | (51 | ) | (62 | ) | (86 | ) | (87 | ) | ||||||||
| Investments: | ||||||||||||||||
| Other than temporary impairment charges | — | — | 1 | — | ||||||||||||
| Gains realized on sale | — | (45 | ) | — | (46 | ) | ||||||||||
| Other comprehensive income, before tax | 527 | 329 | 386 | 173 | ||||||||||||
| Income tax expense related to OCI | (155 | ) | (101 | ) | (126 | ) | (79 | ) | ||||||||
| Other comprehensive income, net of tax | $ | 372 | $ | 228 | $ | 260 | $ | 94 | ||||||||
| Accumulated OCI at June 30 | ||||||||||||||||
| Cash flow hedge gains (losses), net of tax of $35, $186, $35, $186 | 101 | 370 | 101 | 370 | ||||||||||||
| Investments, net of tax of $2, $2, $2, $2 | 15 | 11 | 15 | 11 | ||||||||||||
| Currency translation adjustments, net of tax of $nil, $nil, $nil, $nil | (179 | ) | (143 | ) | (179 | ) | (143 | ) | ||||||||
| Pension plans and other post-retirement benefits, net of tax of $19, $2, $19, $2 | (33 | ) | 7 | (33 | ) | 7 | ||||||||||
| $ | (96 | ) | $ | 245 | $ | (96 | ) | $ | 245 | |||||||
| 1 | Represents currency translation adjustments for Barrick Energy. | |
| 2 | At June 30, 2009, $nil other comprehensive income was attributable to non-controlling interests (2008: $nil). |
20 > LITIGATION AND CLAIMS
Certain conditions may exist as of the date the financial statements are issued, which may result in a loss to the Company but which will only be resolved when one or more future events occur or fail to occur. In assessing loss contingencies related to legal proceedings that are pending against us or unasserted claims that may result in such proceedings, the Company and its legal counsel evaluate the perceived merits of any legal proceedings or unasserted claims as well as the perceived merits of the amount of relief sought or expected to be sought.
If the assessment of a contingency suggests that a loss is probable, and the amount can be reliably estimated, then a loss is recorded. When a contingent loss is not probable but is reasonably possible, or is probable but the amount of loss cannot be reliably estimated, then details of the contingent loss are disclosed. Loss contingencies considered remote are generally not disclosed unless they involve guarantees, in which case we disclose the nature of the guarantee. Legal fees incurred in connection with pending legal proceedings are expensed as incurred.
Wagner Complaint
On June 12, 2003, a complaint was filed against Barrick and several of its current or former officers in the U.S. District Court for the Southern District of New York. The complaint is on behalf of Barrick shareholders who purchased Barrick shares between February 14, 2002 and September 26, 2002. It alleges that Barrick and the individual defendants violated U.S. securities laws by making false and misleading statements concerning Barrick’s projected operating results and earnings in 2002. The complaint seeks an unspecified amount of damages. In November 2008, near the completion of discovery, this matter was scheduled for trial in March 2009. The trial date was adjourned because of a settlement in principle among the parties. On March 30, 2009, the defendants entered into a stipulation agreement, pursuant to which Barrick and the individual defendants agreed to settle the complaint for $24 million pending the Court’s final approval of the settlement. The complaint is subject to coverage under the Company’s directors and officers insurance policy. On July 24, 2009, the Court issued a preliminary approval order in connection with the settlement.
| BARRICK SECOND QUARTER 2009 | 60 | NOTES TO FINANCIAL STATEMENTS (UNAUDITED) |
Cortez Hills Complaint
On November 12, 2008, the United States Bureau of Land Management issued a Record of Decision approving the Cortez Hills Expansion Project. On November 20, 2008, the TeMoak Shoshone Tribe, the East Fork Band Council of the TeMoak Shoshone Tribe and the Timbisha Shoshone Tribe, the Western Shoshone Defense Project, and Great Basin Resource Watch filed a lawsuit against the United States seeking to enjoin the majority of the activities comprising the Project on grounds that it violated the Western Shoshone rights under theReligious Freedom Restoration Act (“RFRA”),that it violated theFederal Land Policy and Management Act’sprohibition on “unnecessary and undue degradation,” and that the Project’s Environment Impact Statement did not meet the requirements of the NationalEnvironmental Policy Act.The Plaintiffs’ RFRA claim is based on the assertion that the Project and adjoining areas are sacred to certain Western Shoshone. On November 24, 2008, the Plaintiffs filed a Motion for a Temporary Restraining Order and a Preliminary Injunction barring work on the Project until after a trial on the merits. After a four day hearing, on January 26, 2009, the Court denied the Plaintiffs’ Motion for a Preliminary Injunction, concluding that the Plaintiffs had failed to demonstrate a likelihood of success on the merits and that the Plaintiffs had otherwise failed to satisfy the necessary elements for a preliminary injunction. The Plaintiffs appealed that decision to the United States Court of Appeals for the Ninth Circuit, which heard oral arguments on June 10, 2009, but has not yet issued a decision. Construction of the project is ongoing.
Marinduque Complaint
Placer Dome was named the sole defendant in a Complaint filed on October 4, 2005, by the Provincial Government of Marinduque, an island province of the Philippines (“Province”), with the District Court in Clark County, Nevada. The action was removed to the Nevada Federal District Court on motion of Placer Dome. The Complaint asserted that Placer Dome was responsible for alleged environmental degradation with consequent economic damages and impacts to the environment in the vicinity of the Marcopper mine that was owned and operated by Marcopper Mining Corporation (“Marcopper”). Placer Dome indirectly owned a minority shareholding of 39.9% in Marcopper until the divestiture of its shareholding in 1997. The Province seeks “to recover damages for injuries to the natural, ecological and wildlife resources within its territory”, but “does not seek to recover damages for individual injuries sustained by its citizens either to their persons or their property”. In addition to damages for injury to natural resources, the Province seeks compensation for the costs of restoring the environment, an order directing Placer Dome to undertake and complete “the remediation, environmental cleanup, and balancing of the ecology of the affected areas,” and payment of the costs of environmental monitoring. The Complaint addresses the discharge of mine tailings into Calancan Bay, the 1993 Maguila-guila dam breach, the 1996 Boac river tailings spill, and alleged past and continuing damage from acid rock drainage.
At the time of the amalgamation of Placer Dome and Barrick Gold Corporation, a variety of motions were pending before the District Court, including motions to dismiss the action for lack of personal jurisdiction and forforum non conveniens (improper choice of forum). On June 29, 2006, the Province filed a Motion to join Barrick Gold Corporation as an additional named Defendant and for leave to file a Third Amended Complaint which the Court granted on March 2, 2007. On March 6, 2007, the Court issued an order setting a briefing schedule on the Company’s motion to dismiss on grounds offorum non conveniens.On June 7, 2007, the Court issued an order granting the Company’s motion to dismiss. On June 25, 2007, the Province filed a motion requesting the Court to reconsider its Order dismissing the action. On January 16, 2008, the district court issued an order denying the Province’s motion for reconsideration. Following the district court’s order, the Province filed Notice of Appeal to the U.S. Court of Appeals for the Ninth Circuit. Oral arguments were heard by the U.S. Court of Appeals on March 10, 2009 and the Court’s decision is pending. We will challenge the claims of the Province on various grounds and otherwise vigorously defend the action. No amounts have been accrued for any potential loss under this complaint.
Calancan Bay (Philippines) Complaint
On July 23, 2004, a complaint was filed against Marcopper and Placer Dome Inc. (“PDI”) in the Regional Trial Court of Boac, on the Philippine island of Marinduque, on behalf of a putative class of fishermen who reside in the communities around Calancan Bay, in northern Marinduque. The complaint alleges injuries to health and economic damages to the local fisheries resulting from the disposal of mine tailings from the Marcopper mine. The total amount of damages claimed is approximately US$900 million.
On October 16, 2006, the court granted the plaintiffs’ application for indigent status, allowing the case to proceed without payment of filing fees. On January 17, 2007, the Court issued a summons to Marcopper and PDI. On March 25, 2008, an attempt was made to serve PDI by serving the summons and complaint on Placer Dome Technical Services (Philippines) Inc. (“PDTS”). PDTS has returned the summons and complaint with a manifestation stating that PDTS is not an agent of PDI for any purpose and is not authorized to accept service
| BARRICK SECOND QUARTER 2009 | 61 | NOTES TO FINANCIAL STATEMENTS (UNAUDITED) |
or to take any other action on behalf of PDI. On April 3, 2008, PDI made a special appearance by counsel to move to dismiss the complaint for lack of personal jurisdiction and on other grounds. The plaintiffs have opposed the motion to dismiss. The motion has been briefed and is currently pending.
The Company intends to defend the action vigorously. No amounts have been accrued for any potential loss under this complaint.
Pakistani Constitutional Litigation
On November 28, 2006, a Constitutional Petition was filed in the High Court of Balochistan by three Pakistani citizens against: Barrick, the governments of Balochistan and Pakistan, the Balochistan Development Authority (“BDA”), Tethyan Copper Company (“TCC”), Antofagasta Plc (“Antofagasta”), Muslim Lakhani and BHP (Pakistan) Pvt Limited (“BHP”).
The Petition alleged, among other things, that the entry by the BDA into the 1993 Joint Venture Agreement (“JVA”) with BHP to facilitate the exploration of the Reko Diq area and the grant of related exploration licenses were illegal and that the subsequent transfer of the interests of BHP in the JVA and the licenses to TCC was also illegal and should therefore be set aside. Barrick currently indirectly holds 50% of the shares of TCC, with Antofagasta indirectly holding the other 50%.
On June 26, 2007, the High Court of Balochistan dismissed the Petition against Barrick and the other respondents in its entirety. On August 23, 2007, the petitioners filed a Civil Petition for Leave to Appeal in the Supreme Court of Pakistan. The Supreme Court of Pakistan has not yet considered the Civil Petition for Leave to Appeal. Barrick intends to defend this action vigorously. No amounts have been accrued for any potential loss under this complaint.
21 >SUBSEQUENT EVENTS
We examined all significant transactions from our quarter end close date of June 30, 2009 up to and including the issuance date, July 30, 2009, and have not noted any significant events or transactions that would materially impact the financial statements as they are presented.
| BARRICK SECOND QUARTER 2009 | 62 | NOTES TO FINANCIAL STATEMENTS (UNAUDITED) |
CORPORATE OFFICE
Barrick Gold Corporation
Brookfield Place, TD Canada Trust Tower
Suite 3700
161 Bay Street, P.O. Box 212
Toronto, Canada M5J 2S1
Tel: (416) 861-9911 Fax: (416) 861-0727
Toll-free within Canada and United States: 1-800-720-7415
Email: investor@barrick.com
Website: www.barrick.com
Barrick Gold Corporation
Brookfield Place, TD Canada Trust Tower
Suite 3700
161 Bay Street, P.O. Box 212
Toronto, Canada M5J 2S1
Tel: (416) 861-9911 Fax: (416) 861-0727
Toll-free within Canada and United States: 1-800-720-7415
Email: investor@barrick.com
Website: www.barrick.com
SHARES LISTED
ABX — The Toronto Stock Exchange
The New York Stock Exchange
The New York Stock Exchange
INVESTOR CONTACT
Deni Nicoski
Vice President, Investor Relations
Tel: (416) 307-7410
Email: dnicoski@barrick.com
Deni Nicoski
Vice President, Investor Relations
Tel: (416) 307-7410
Email: dnicoski@barrick.com
TRANSFER AGENTS AND REGISTRARS
CIBC Mellon Trust Company
P.O. Box 7010, Adelaide Street Postal Station
Toronto, Ontario M5C 2W9
Tel: (416) 643-5500
Toll-free throughout North America: 1-800-387-0825
Fax: (416) 643-5501
Email: inquiries@cibcmellon.com
Website: www.cibcmellon.com
CIBC Mellon Trust Company
P.O. Box 7010, Adelaide Street Postal Station
Toronto, Ontario M5C 2W9
Tel: (416) 643-5500
Toll-free throughout North America: 1-800-387-0825
Fax: (416) 643-5501
Email: inquiries@cibcmellon.com
Website: www.cibcmellon.com
BNY MELLON SHAREOWNER SERVICES
480 Washington Blvd. — 27th Floor
Jersey City, NJ 07310
Tel: 1-800-589-9836 Fax: (201) 680-4665
Email: shrrelations@mellon.com
Website: www.melloninvestor.com
480 Washington Blvd. — 27th Floor
Jersey City, NJ 07310
Tel: 1-800-589-9836 Fax: (201) 680-4665
Email: shrrelations@mellon.com
Website: www.melloninvestor.com
MEDIA CONTACT
Vincent Borg
Executive Vice President, Corporate Communications
Tel: (416) 307-7477
Email: vborg@barrick.com
Vincent Borg
Executive Vice President, Corporate Communications
Tel: (416) 307-7477
Email: vborg@barrick.com
CAUTIONARY STATEMENT ON FORWARD-LOOKING INFORMATION
Certain information contained in this Second Quarter Report 2009, including any information as to our strategy, projects, plans or future financial or operating performance and other statements that express management’s expectations or estimates of future performance, constitute “forward-looking statements”. All statements, other than statements of historical fact, are forward-looking statements. The words “believe”, “expect”, “will”, “anticipate”, “contemplate”, “target”, “plan”, “continue’, “budget”, “may”, “intend”, “estimate” and similar expressions identify forward-looking statements. Forward-looking statements are necessarily based upon a number of estimates and assumptions that, while considered reasonable by management, are inherently subject to significant business, economic and competitive uncertainties and contingencies. The Company cautions the reader that such forward-looking statements involve known and unknown risks, uncertainties and other factors that may cause the actual financial results, performance or achievements of Barrick to be materially different from the Company’s estimated future results, performance or achievements expressed or implied by those forward-looking statements and the forward-looking statements are not guarantees of future performance. These risks, uncertainties and other factors include, but are not limited to: the impact of global liquidity and credit availability on the timing of cash flows and the values of assets and liabilities based on projected future cash flows; changes in the worldwide price of gold, copper or certain other commodities (such as silver, fuel and electricity); fluctuations in currency markets; changes in U.S. dollar interest rates or gold lease rates; risks arising from holding derivative instruments; ability to successfully complete announced transactions and integrate acquired assets; legislative, political or economic developments in the jurisdictions in which the Company carries on business; operating or technical difficulties in connection with mining or development activities; employee relations; availability and costs associated with mining inputs and labor; the speculative nature of exploration and development, including the risks of obtaining necessary licenses and permits and diminishing quantities or grades of reserves; changes in costs and estimates associated with our projects; adverse changes in our credit rating, level of indebtedness and liquidity, contests over title to properties, particularly title to undeveloped properties; the risks involved in the exploration, development and mining business. Certain of these factors are discussed in greater detail in the Company’s most recent Form 40-F/Annual Information Form on file with the U.S. Securities and Exchange Commission and Canadian provincial securities regulatory authorities.
The Company disclaims any intention or obligation to update or revise any forward-looking statements whether as a result of new information, future events or otherwise, except as required by applicable law.