Exhibit 99.1
The gold industry’s only ‘A’ rated balance sheet. The largest production , reserves and market capitalization. Three advanced projects that will bring on lower cost production in each of the next three years. An unwavering commitment to safe and responsible mining. Barrick is the gold industry leader.
2 Letter to Shareholders 5 Message from the President and CEO 6 Financial Strength 9 Gold Leverage 12 Operations 15 Reserves and Resources Summary 17 Advanced Projects 20 Responsible Mining 24 Management’s Discussion and Analysis 82 Financial Statements 86 Notes to Consolidated Financial Statements 141 Mineral Reserves and Resources 149 Corporate Governance and Committees of the Board 150 Shareholder Information 152 Board of Directors and Senior Officers
FINANCIAL HIGHLIGHTS
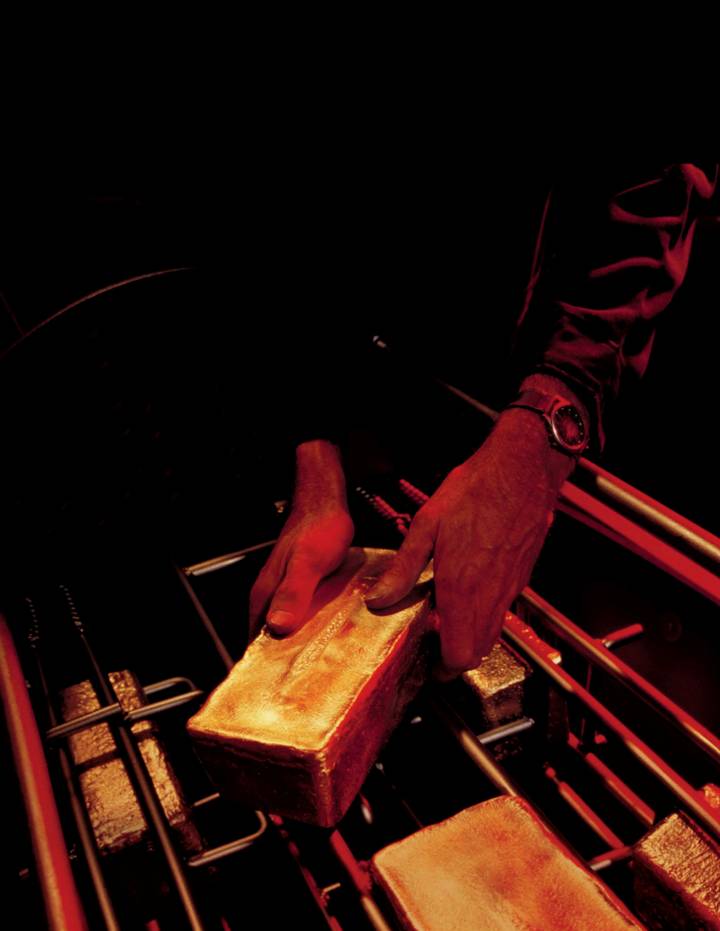
Barrick posted record cash flow in 2008 from the industry’s largest production.
(in millions of US dollars, except per share data) |
|
|
|
|
|
|
| |||
(US GAAP basis) |
| 2008 |
| 2007 |
| 2006 |
| |||
Sales |
| $ | 7,913 |
| $ | 6,332 |
| $ | 5,630 |
|
Net income |
| 785 |
| 1,119 |
| 1,506 |
| |||
per share |
| 0.90 |
| 1.29 |
| 1.79 |
| |||
Adjusted net income(2) |
| 1,661 |
| 1,036 |
| 1,230 |
| |||
per share |
| 1.90 |
| 1.19 |
| 1.46 |
| |||
Operating cash flow |
| 2,206 |
| 1,732 |
| 2,122 |
| |||
Cash and equivalents |
| 1,437 |
| 2,207 |
| 3,043 |
| |||
Dividends per share |
| 0.40 |
| 0.30 |
| 0.22 |
| |||
|
|
|
|
|
|
|
| |||
Operating Highlights |
|
|
|
|
|
|
| |||
Gold production (000s oz) |
| 7,657 |
| 8,060 |
| 8,643 |
| |||
Average realized gold price per ounce(2) |
| $ | 870 |
| $ | 619 |
| $ | 543 |
|
Total cash costs per ounce(2) |
| $ | 443 |
| $ | 345 |
| $ | 280 |
|
Total gold cash costs per ounce – full credit basis for non-gold sales(2) |
| $ | 337 |
| $ | 228 |
| $ | 201 |
|
Copper production (M lbs) |
| 370 |
| 402 |
| 367 |
| |||
Average realized copper price per pound(2) |
| $ | 3.39 |
| $ | 3.22 |
| $ | 3.06 |
|
Total cash costs per pound(2) |
| $ | 1.19 |
| $ | 0.82 |
| $ | 0.78 |
|
(1) See page 15 of the 2008 Annual Review.
(2) Non-GAAP measure – see pages 72-76 of the 2008 Financial Report.
|
· Only ‘A’ rated balance sheet
· $1.4 billion in cash
· $2.2 billion in operating cash flow
· $1.5 billion undrawn line of credit |

|
· 7.7 million ounces of production
· Industry’s largest reserves of 138.5 million ounces
· Largest market capitalization |
|
· 3 new projects in 3 years
· ~2.0 million ounces
· Lower cost production |

|
· Dow Jones Sustainability Index (World)
· Dow Jones Sustainability Index (North America)
· Sustainable economic development
· Zero incident safety culture |

Financial Strength |
| In a period of economic uncertainty, Barrick is in a strong financial position to continue executing its vision and strategy. |
|
|
|
|
|
Gold Leverage |
| With the industry’s largest production and reserves, Barrick has exceptional leverage to higher gold prices. |
|
|
|
|
|
Advanced Projects |
| Our three advanced projects collectively represent nearly two million ounces of lower cost average annual production when at full capacity. |
|
|
|
|
|
Responsible Mining |
| Barrick is committed to sustainable economic development, environmental stewardship and a culture of safety. |
|
Letter to Shareholders
These past few months, for the first time since founding Barrick 25 years ago, I have been flooded with calls from friends, business associates, acquaintances, and institutions eager to buy actual, physical gold. That’s how bad things are out there. And that is why I have struggled to find the right tone for this year’s letter.
On the one hand, I continue to be pessimistic about the global economy. The world is in a state of crisis, and it is not at all clear how or when we will emerge from the raging storm.
On the other hand, if ever there was a time to be in the gold business, this is it. While just about every other asset – from real estate to oil, from the British pound to the S&P 500 – has collapsed in value, the price of gold hovers around all-time highs. Gold has emerged as a true safe haven, a hedge against uncertainty and instability. Interest in buying gold has been strong even as the U.S. dollar has been firm.
As many of you know, I have never been a gold-bug. On the contrary, one of Barrick’s founding principles was to create a gold mining company that did not depend only on the rising price of gold – to create an enduring company whose fiscal prudence and outstanding management would reward its shareholders regardless of whether gold was trading at $400 per ounce or at $800 per ounce. I am happy to report that we have created just that company.
I am still not a gold-bug. Yet I believe firmly that bullion prices have a much better chance to move considerably higher over the next few years than the other way – and that Barrick and its shareholders will clearly reap the rewards of this trend. Why am I bullish on gold? For the same reasons that I am gloomy about the state of our global economy. As the financial crisis and its associated ills intensify, more and more investors will retreat to the relative safety of gold.
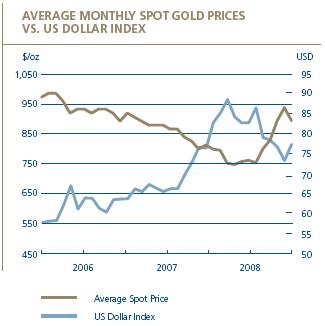
With the unprecedented scale of economic stimulus plans, it would be a historical anomaly if we did not see the re-emergence of inflation, and a devaluation of many of the world’s major paper currencies, including the U.S. dollar. And we all know of the inverse correlation between the U.S. dollar and the gold price.
This is not all that gold has in its favor right now: the metal’s underlying fundamentals have also never been more compelling. For even while demand for gold remains strong, the production of gold remains limited. Opening a gold mine is not as easy as it once was, not by a long shot.
If gold is so attractive right now, why do I continue to believe that Barrick shares are a better, more prudent investment than gold bars? Because I’m not simply interested in what will happen this month or even this year. My years in this business have taught me that what matters most is to have perspective, and to build for the long haul. Consider: while a $1,000 investment in Barrick at our founding in 1983 would today be worth $39,000, that same investment in gold bullion would today be worth only around $2,000.
2

Clearly I am more optimistic about Barrick’s future than ever. We are the industry’s leader, but more than that, we have positioned Barrick to offer investors leverage to the gold price. We have the industry’s largest reserves and production. Most importantly, we continue to have the only ‘A’ rated balance sheet in our industry.
Barrick ended 2008 with $1.4 billion in cash, a record $2.2 billion in cash flow, and an undrawn line of credit of $1.5 billion. As a further testament to Barrick’s financial credibility, I’m able to report that we successfully issued $1.25 billion in debt securities in late 2008. Our robust balance sheet gives us the freedom to look ahead and to execute our long-term strategic plans. In today’s corporate climate, that is a luxury that very few other companies can afford.
Accordingly, Barrick is forging ahead, bringing on line new projects where gold will be produced at significantly lower costs than our current operating mines. These new projects include: our Cortez Hills project in Nevada, where regulatory approval has now allowed construction to begin; our Pueblo Viejo property in the Dominican Republic, which has also advanced to the construction stage; and our Buzwagi project in Tanzania, where gold will begin to be poured by mid-year. Together, these three projects are expected to contribute almost two million ounces of gold a year to Barrick’s total production.
For all this good news, I am deeply saddened that this year also marked the resignation of Greg Wilkins as our president and chief executive officer. Greg has been an integral part of this company since the day we put the name “Barrick” down on paper. As CEO since 2003, he has played a critical role at Barrick, overseeing our 2006 acquisition of Placer Dome and many other key initiatives that built Barrick into what it is today. While Greg stepped down in March 2008 because of health reasons, he continues to work closely with us in his new position as Executive Vice Chairman. For that, we are grateful.
Our new president and chief executive officer, Aaron Regent, officially joined Barrick on January 16, 2009. After many months spent looking for the right person to lead Barrick, our search committee agreed unanimously that Aaron has all the characteristics and strengths we could hope for in a CEO. He has an unmatched reputation for thinking creatively, executing strategy, and delivering results to shareholders. He is experienced in both the worlds of mining and finance. And, especially gratifying to me, he fits easily into Barrick’s fast-moving, collegial and entrepreneurial culture.
That corporate culture demands, above all, that we perform for our shareholders – which we intend to do.

Peter Munk
Founder and Chairman
3
1983 – 2008: A QUARTER CENTURY OF BARRICK GOLD

Message from Aaron Regent President and CEO |
|

Since assuming the role of CEO in January, I have had the chance to meet many people within the company, visit a number of our operations and speak to a variety of our shareholders. My goal was to quickly gain an in-depth understanding of the opportunities and challenges facing Barrick. I have made progress but I have more to do. But what I have observed is a management team with breadth and depth and a workforce that has tremendous pride in Barrick’s track record of success and its future prospects. I, too, now share this pride in working for an outstanding enterprise.
Barrick has grown to become the world’s preeminent gold producer, guided by its core values, and I intend to reinforce those values. But while the company has excelled in many aspects, there is always room for improvement. New opportunities and challenges will present themselves and I am confident in our ability to take these on and prosper as a result.
Like every mining company, we are continually challenged to replace and grow the resource base that we mine every day. But Barrick is well positioned. We start with having the largest gold reserves in the world and a demonstrated track record of bringing those resources into production. Today, the company is constructing three major projects that will contribute lower cost production. We have an exploration program which is targeting the most prolific gold producing regions in the world. Acquisition opportunities will also play a key part in our growth plans. With a positive outlook for the gold price, excellent cash flows and a strong balance sheet, we have the financial capacity to strategically advance these initiatives.
While growth is an important driver, profitable growth is what matters most. Capital efficiency and cost containment will be priorities to ensure we deliver returns to our shareholders, which should ultimately be reflected in an improving share price.
While growing our production and resource base is a major priority and focus, we remain committed to operating in a safe and responsible manner. Our safety record has continuously improved where today we are among the leaders in the industry. But we can do better and we will. We also have a responsibility to the environment and the communities where we operate. To be successful we must also be good citizens. Not only is it the right thing to do, it is also good business. Our focus on working with communities to enhance their quality of life and standard of living will continue.
As Peter outlined in his letter, the outlook for the gold industry is very positive. As the gold industry leader, we have much to gain as a result.
In collaboration with Barrick’s talented 20,000-plus employees, I look forward to working on your behalf, day in and day out, to justify your continued confidence in us.

Aaron Regent
President and Chief Executive Officer
5
Financial Strength
· Barrick’s financial strength is a key competitive advantage, enabling the company to execute its strategy and act quickly on opportunities to enhance shareholder value. We have the gold industry’s only A’ rated balance sheet.
· The company ended the year in excellent financial shape, with a record $2.2 billion in operating cash flow, $1.4 billion in cash and a $1.5 billion undrawn line of credit.
$2.2 billion in operating cash flow
The financial crisis of 2008 was a watershed event that created economic dislocation on a scale not seen since the Great Depression. As the credit crisis unfolded, major bank failures brought the scope of the damage to the financial system into sharp focus and set off an unprecedented wave of global deleveraging. Interbank lending dried up as banks shut off credit to preserve their balance sheets, creating increasing levels of stress in the market and ultimately pushing the global economy into a deep and possibly protracted recession. The world is now facing a new economic reality in which risk has been re-priced and credit remains tight.
In this uncertain climate, financial strength is paramount, and Barrick is in an enviable position. Along with our gold focus, our strong cash position, A’ rated balance sheet and access to capital stand out as competitive advantages, enabling us to drive our vision and strategy forward.
As commodity prices fell in 2008, some companies were unable to refinance bridge loans or source funding and were penalized by the market when they were forced to defer new projects and drastically alter their corporate strategies. Now more than ever, investors are focused on financial flexibility as the vital ingredient to success; it is the key difference between a company that is equipped to deliver on its plans and build for the future, and those that cannot.
Barrick ended the year in excellent financial shape. Our portfolio of operations generated record cash flow of $2.2 billion during 2008, more than any other gold producer, and adjusted net income of $1.7 billion, leaving the company with a cash balance of $1.4 billion and net debt of $2.9 billion, about 16% of our total book capitalization.
6
Now more than ever, investors are focused on financial flexibility as the vital ingredient to success.
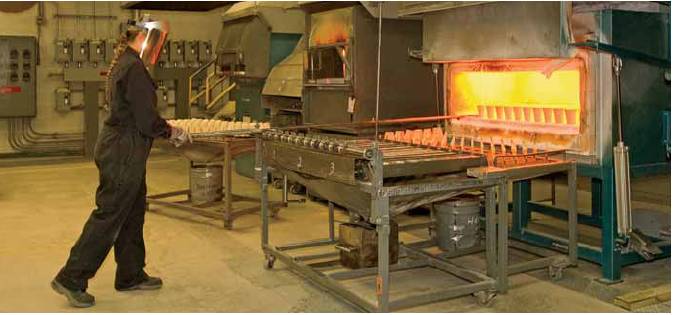
Over a million determinations a year are performed in the Goldstrike lab to ensure optimal gold recoveries in the roaster and autoclave.
In conjunction with our $1.5 billion undrawn credit facility and top-rated balance sheet, this low gearing level allows us to fund the construction of three advanced projects which collectively represent nearly two million ounces of lower cost production. It also enables us to act on what we see as strategic opportunities to enhance shareholder value.
In September 2008, we took advantage of a short window of opportunity in the credit markets to successfully complete a $1.25 billion long-term debt financing at attractive coupon rates. This transaction allowed us to fully repay our line of credit and has resulted in modest amounts of debt maturing prior to the first tranche of $500 million in 2013, reducing our refinancing risk significantly. Going forward, we expect to fund a portion of our Pueblo Viejo pre-production capital requirements through non-recourse project financing, and may consider project financing for other projects in the future.
Although our financial health is robust, we will be responsive to current market conditions. We will prudently manage our balance sheet, apply a disciplined approach to capital allocation decisions and be vigilant in looking for additional measures to increase efficiency and cut costs. We will continue to monitor and optimize our capital structure to ensure we are able to deploy funds and make investment decisions that have high returns for our shareholders.
7
Gold Leverage
· We are positive on the outlook for gold. As the gold industry leader with the largest production and reserves, Barrick offers exceptional leverage to higher gold prices.
· 7.7 million ounces of production
138.5 million ounces of proven and probable reserves
During the unprecedented market turmoil in 2008, gold proved itself as an important asset, appreciating in a year when the financial system all but collapsed and most asset classes suffered severe losses. Gold’s performance was all the more impressive in light of the tidal wave of deleveraging which occurred in response to the credit crisis, as investors were forced to sell their best-performing and liquid assets to raise cash and stem further losses.
While bullion prices increased modestly in U.S. dollar terms, they reached record levels in some of the world’s major currencies, including British pounds, Australian dollars, Indian rupees and euros, vindicating investor faith in gold’s ability to preserve, and in many instances, grow wealth during turbulent financial times.
As we enter 2009, the outlook for gold remains positive. The prospect of a deep global recession has forced governments to resort to a series of extraordinary fiscal and monetary stimulus measures, including steep and coordinated interest rate cuts, and the injection of unprecedented amounts of liquidity into the global economy. We believe investors will begin to focus on the potential for these measures to devalue currencies and raise inflation. Weaker paper currencies are expected to benefit investment demand for gold, which in comparison, cannot be printed.
Mine supply, which represents over 60% of total gold supply, is expected to decline over the next several years as production is challenged by maturing mines, the lack of large discoveries, financing constraints and longer development timelines. Taken together, all of these factors are extremely supportive of higher gold prices in the future.
As the gold industry leader with the largest production and reserves and a competitive cost structure,
9
| Barrick poured more gold than any other producer in 2008. In a strong gold price environment, this means earnings and cash flow leverage. |

The Veladero mine produced more than 0.5 million ounces in 2008 and is undergoing a crusher expansion to expand its processing capacity.
Barrick is uniquely placed to offer shareholders compelling leverage to stronger gold prices. We produced 7.7 million ounces in 2008, nearly 50% more than the next largest gold company, and ended the year with 138.5 million ounces of proven and probable reserves, more than 60% higher than our nearest competitor.
What this means is that as the gold price rises, Barrick’s earnings and cash flow are expected to benefit. For example, as the largest producer, we generated the highest operating cash flow in the industry in 2008, in contrast to companies with aspirations to grow cash flow from a comparatively smaller base. While these companies may ultimately increase their revenue and earnings leverage, this can take many years to achieve.
At Barrick, we provide investors with this leverage to gold today and expect to continue doing so in the future. Our next generation of mines – Buzwagi, Cortez Hills and Pueblo Viejo – will begin to deliver substantial production over the next three years at cash costs below the average of our current portfolio.
Barrick also has several other earlier stage projects in its inventory that it continues to evaluate. Feasibility studies are expected to be completed on Cerro Casale, Donlin Creek and Reko Diq in 2009.
10
Operations
· Barrick remained focused on its core gold business in a year when the gold price set record highs. The company poured more ounces than any other gold producer – 7.7 million ounces.
· The Lagunas Norte mine in Peru contributed more than 1.0 million ounces for the third year in a row and is expected to repeat this performance in 2009.
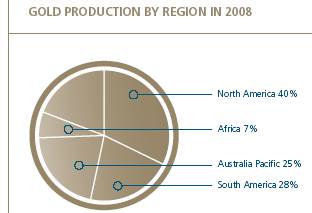
2008 PRODUCTION
(thousands of ounces)
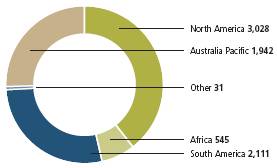
Barrick’s 2008 production of 7.7 million ounces emanated from a diversified global portfolio of operations strongly anchored in mining friendly jurisdictions in the U.S., Canada and Australia.
While the overall portfolio produced within our original guidance estimate, we were particularly pleased with the South America region, which contributed 2.1 million ounces as a result of another outstanding year from the world-class Lagunas Norte mine in Peru. This operation continues to exceed expectations and is expected to produce over one million ounces again in 2009, for the fourth year in a row. Production from the Veladero mine in Argentina benefited from access to higher grade ore during the year upon completion of a waste stripping phase. In 2009, performance is expected to be further enhanced by the new overland conveyor and by increased production capacity following completion of a crusher expansion, scheduled for the second half of the year.
Our North America region continues to be the cornerstone of our production and contributed 3.0 million ounces of gold in 2008. Production at the Goldstrike Complex increased in the second half of the year as we completed an extended waste stripping phase in the Betze-Post open pit, allowing processing to shift to higher grade mined ore from lower grade stockpiles in the fourth quarter. With nearly 13 million ounces of proven and probable reserves, this operation will continue to be an important source of production for many years to come. Goldstrike is the company’s Centre of Excellence, providing operating and technical expertise to many of our other operations.
Production from the Cortez mine benefited from the additional 40% interest acquired early in the year,
12
|
|
Remote control of Goldstrike processing facilities is tested by Kelli Cantrell an hour away in Elko as part of Barrick’s Mine Company of the Future initiative. |

giving us full ownership of this promising property. The Cortez Hills expansion project made significant progress, reaching an important milestone in November when the federal Bureau of Land Management issued a Record of Decision, allowing construction to proceed. Cortez Hills is expected to enter production in the first quarter of 2010, transforming the Cortez property into a one-million-ounce per year producer in its first five full years of operation.(1) After consolidating our interest and significantly reducing payable royalties on the property in 2008, Barrick is now in an excellent position to benefit from the significant exploration potential within this extensive land position on the highly prospective Cortez Trend.
Our Australia Pacific region contributed 1.9 million ounces, reflecting a full year of increased ownership at the large Porgera mine in Papua New Guinea. While production targets for the region were achieved, cash costs were adversely affected by the mining boom that increased skilled labor costs and turnover, particularly in Australia. East Wall remediation work at Cowal was completed on schedule in the fourth quarter, allowing access to higher grade ore and resulting in increased production that is expected to continue into 2009.
The Africa region produced 0.5 million ounces of gold in 2008, reflecting some challenges at the Bulyanhulu and North Mara mines. North Mara experienced some civil disturbances and Bulyanhulu was impacted by lower than planned mining rates; however, an anticipated ramp-up of underground development is expected to result in improved performance in 2009.
The Buzwagi project in Tanzania is on track to reach production on schedule in the second quarter of 2009 and within its $400 million pre-production capital budget. In its first full five years of production, Buzwagi is expected to contribute a quarter of a million ounces of gold annually at lower cash costs than our current average.
(1) See page 42 of the 2008 Financial Report.
Lagunas Norte produced over one million ounces for the third consecutive year and is expected to repeat this performance in 2009.
13
Operations | In addition to our gold business, our copper business contributed strong cash flow in 2008. |
Bucket loaders at the Zaldívar copper mine remove leached material from the pad to make room for fresh ore from the conveyor.
Total cash costs of $443 per ounce for the year reflected unprecedented inflationary pressures in the first half of 2008, before prices subsided in the second half of the year. Peak oil prices were a major driver of energy costs and had a significant ripple effect across our supply chain, impacting costs for other consumables in which oil is a key component. These and other input prices resulted in higher cash costs than anticipated at the start of the year.
Barrick’s total cash costs for gold remain competitively positioned within the lower half of the global cost curve, providing strong cash margins. Applying full credit for non-gold sales, our cash costs for 2008 were $337 per ounce,(2) lower than 80% of the world’s production. With the higher gold prices seen in 2008 and the largest production, Barrick generated the highest operating cash flow in the industry of $2.2 billion.
Our copper business contributed strong cash flow in 2008, despite a decline in spot prices in response to the economic downturn. Barrick’s copper operations at the Zaldívar and Osborne mines in Chile and Australia produced 370 million pounds of copper at total cash costs of $1.19 per pound.
The company’s copper hedge position provided a realized price of $3.39 per pound in 2008, well above the average market price of $3.15 per pound.
Zaldívar was adversely affected by a period of high market prices and supply shortages for sulphuric acid, which significantly disrupted production levels and impacted production costs. Production and costs improved as acid levels returned to normal in the latter part of 2008. Cash costs also reflected higher electricity and labor costs for this operation which came into effect at mid-year. Costs for electricity going forward are expected to reflect prevailing oil prices.
(2) Non-GAAP measure – see pages 73–74 of the 2008 Financial Report.
14
Reserves and Resources Summary(1),(2),(3)
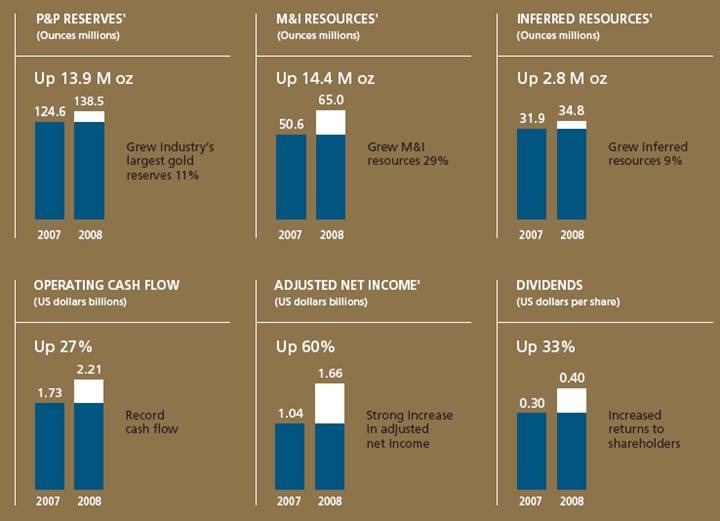
Barrick has a strong track record of consistently replacing and growing its reserves. The company grew the industry’s largest reserve base in 2008 by 13.9 million ounces to 138.5 million ounces, with notable additions at Cortez, Pueblo Viejo and the Cerro Casale project acquired in 2007. Measured and indicated resources increased by 29% to 65.0 million ounces, with exploration success at Pueblo Viejo, Donlin Creek and Reko Diq, and the addition of ounces from Cerro Casale.
The $150 to $160 million exploration(4) budget for 2009 is weighted towards near mine resource additions and reserve conversion, with approximately 40% of the total targeted for Nevada. The budget for 2009 reflects a focus on targets that have the potential to make near term contributions to the company’s earnings and cash flow.
at December 31, 2008 |
| Proven and |
| Measured and |
| Inferred |
|
(Barrick’s equity share) |
| Probable Reserves |
| Indicated Resources |
| Resources |
|
Gold (000s oz) |
| 138,506 |
| 65,040 |
| 34,753 |
|
|
|
|
|
|
|
|
|
North America |
| 50,561 |
| 33,275 |
| 12,030 |
|
South America |
| 50,502 |
| 9,199 |
| 3,108 |
|
Australia Pacific |
| 18,819 |
| 18,726 |
| 14,752 |
|
Africa |
| 18,372 |
| 3,840 |
| 4,689 |
|
Other |
| 252 |
| — |
| 174 |
|
|
|
|
|
|
|
|
|
Other Metals |
|
|
|
|
|
|
|
Copper (M lbs) |
| 6,392 |
| 12,471 |
| 9,917 |
|
Nickel (M lbs) |
| — |
| 254 |
| 1,121 |
|
Other Metals Contained in:
|
| Proven and Probable |
| Measured and Indicated |
| Inferred |
|
Silver (000s oz) |
| 1,093,153 |
| 147,977 |
| 50,217 |
|
Copper (M lbs) |
| 4,251 |
| 1,098 |
| 517 |
|
(1) Mineral reserves (“reserves”:) and mineral resources (“resources”) have been calculated as at December 31, 2008 in accordance with National Instrument 43-101 as required by Canadian securities regulatory authorities. For United States reporting purposes, Industry Guide 7, (under the Securities and Exchange Act of 1934), as interpreted by Staff of the SEC, applies different standards in order to classify mineralization as a reserve. Accordingly, for U.S. reporting purposes, Cerro Casale is classified as mineralized material and approximately 600,000 ounces of reserves for Pueblo Viejo (Barrick’s 60% interest) are classified as mineralized material. In addition, while the terms “measured”, “indicated” and “inferred” mineral resources are required pursuant to National Instrument 43-101, the U.S. Securities and Exchange Commission does not recognize such terms. Canadian standards differ significantly from the requirements of the U.S. Securities and Exchange Commission, and mineral resource information contained herein is not comparable to similar information regarding mineral reserves disclosed in accordance with the requirements of the U.S. Securities and Exchange Commission. U.S. investors should understand that “inferred” mineral resources have a great amount of uncertainty as to their existence and great uncertainty as to their economic and legal feasibility. In addition, U.S. investors are cautioned not to assume that any part or all of Barrick’s mineral resources constitute or will be converted into reserves. Calculations have been prepared by employees of Barrick, its joint venture partners or its joint venture operating companies, as applicable, under the supervision of Ivan Mullany, Senior Director, Metallurgy and Process Development, Technical Services of Barrick, Rick Allan, Senior Director, Mining of Barrick, and Rick Sims, Senior Director, Resources and Reserves of Barrick. Reserves have been calculated using an assumed long-term average gold price of $US 725 ($Aus. 850) per ounce, a silver price of $US 13.50 per ounce, a copper price of $US 2.00 per pound and exchange rates of $1.10 $Can/$US and $0.85 $US/$Aus. Reserve calculations incorporate current and/or expected mine plans and cost levels at each property. Varying cut-off grades have been used depending on the mine and type of ore contained in the reserves. Barrick’s normal data verification procedures have been employed in connection with the calculations. Resources as at December 31, 2008 have been estimated using varying cut-off grades, depending on both the type of mine or project, its maturity and ore types at each property. For a breakdown of reserves and resources by category and for a more detailed description of the key assumptions, parameters and methods used in calculating Barrick’s reserves and resources, see Barrick’s most recent Annual Information Form/Form 40-F on file with Canadian provincial securities regulatory authorities and the U.S. Securities and Exchange Commission.
(2) In March 2008, Barrick increased its interest in the Cortez property from 60% to 100%. 2008 reserves and resources for the Cortez property reflect Barrick’s 100% interest. 2007 reserves and resources for the Cortez property reflect Barrick’s then 60% interest.
(3) In December 2007, Barrick acquired a 51% interest in the Cerro Casale project through its acquisition of Arizona Star Resources Corp. 2008 reserves and resources for the Cerro Casale project reflect Barrick’s 51% interest. 2007 reserves and resources do not reflect Barrick’s acquisition of its 51% interest in the Cerro Casale project.
(4) Barrick’s exploration programs are designed and conducted under the supervision of Robert Krcmarov, Senior Vice President, Global Exploration of Barrick. For information on the geology, exploration activities generally, and drilling and analysis procedures on Barrick’s material properties, see Barrick’s most recent Annual Information Form/Form 40-F on file with Canadian provincial securities regulatory authorities and the U.S. Securities and Exchange Commission.
15

Advanced Projects
· Barrick’s three most advanced projects – Buzwagi, Cortez Hills and Pueblo Viejo represent almost two million ounces of production at lower cash costs than our current portfolio average.
· We achieved a strategic goal in 2008 by consolidating full ownership of the Cortez Joint Venture. Cortez Hills is expected to transform this asset into a one-million-ounce a year producer in 2010.
3 in three three new mines in three years
Barrick’s mine building and technical expertise has successfully delivered six new mines in the last five years on time and near budget, a strong record of execution in a period of increased challenges for the mining industry. Our next generation of projects is now ramping up and we expect to have a new mine entering production in each of the next three years – Buzwagi in 2009, Cortez Hills in 2010 and Pueblo Viejo in 2011. All three projects are on schedule and within their respective preproduction capital budgets.
In Nevada, we achieved a long-term strategic goal in early 2008 by acquiring Rio Tinto’s 40% interest in the Cortez Joint Venture, consolidating full ownership in this key asset and the Cortez Hills expansion project. An important milestone for the project was reached in November when the federal Bureau of Land Management issued a Record of Decision, allowing construction to begin.
The Cortez Hills project is expected to enter production in the first quarter of 2010, transforming the Cortez property into a one-million-ounce a year producer at total cash costs of about $350-$400 per ounce in its first full five years of operation. The project is in line with its $500 million pre-production capital budget, consistent with original guidance. With proven and probable reserves of over 13 million ounces, the expanded Cortez operation has an expected mine life of at least 15 years, making it one of the most important assets in our portfolio.
The Cortez property sits within our extensive land position on the highly prospective Cortez Trend, where new deposits have continued to be found since the original Cortez mine was discovered in the 1960s. The property has significant exploration potential from which we believe further value can be unlocked.
17
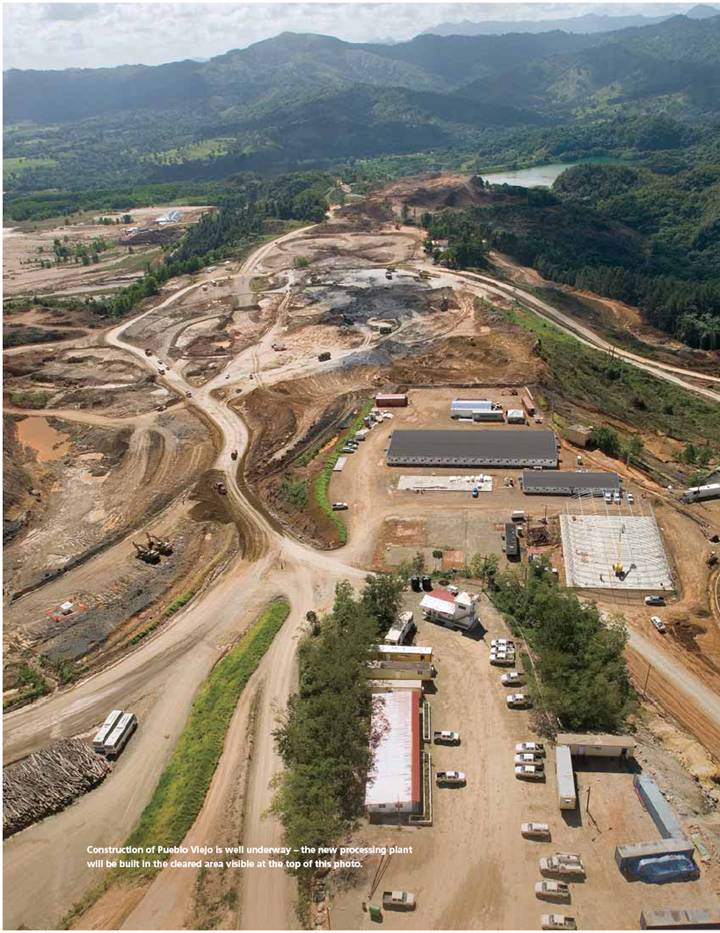
Advanced Projects | Pueblo Viejo is a large, low cost and long life project with an expected mine life of over 25 years. |

Commissioning of Buzwagi commenced in early 2009 – the project is on schedule to begin pouring gold in the second quarter of 2009.
The 60% owned Pueblo Viejo project in the Dominican Republic made significant strides in 2008. Demolition of existing facilities was completed, major contractors were engaged, long lead items were secured and delivery of the mining fleet commenced. Heavy fuel oil power for the mine was also secured.
Pueblo Viejo is expected to come on stream in the fourth quarter of 2011 and produce about one million ounces annually in its first full five years, contributing about 600,000-650,000 ounces per year to Barrick at total cash costs of about $275-$300 per ounce. The project is tracking within its pre-production capital budget of $2.7 billion.(3)
Pueblo Viejo is a long life asset with an expected mine life of over 25 years – and we continue to have success at finding more ounces in the near mine area, most notably at the Monte Oculto discovery.
The Buzwagi project will be our fourth mine in the Lake Victoria gold district of Tanzania. Stockpiling of ore commenced in the fourth quarter of 2008 and commissioning began in early 2009, positioning the project to begin pouring gold on schedule in the second quarter of 2009 and contribute an expected 200,000 ounces in 2009 at total cash costs of $320-$335 per ounce. Buzwagi has benefited from synergies with our other operations in this region and is within its original pre-production capital budget of $400 million.
In addition to these three projects, Barrick has an extensive suite of large, earlier stage projects, including Pascua-Lama, Cerro Casale, Donlin Creek and Reko Diq, which provide the company with a number of future development options.
The most advanced of these is the large Pascua-Lama gold-silver project in Chile and Argentina, which has almost 18 million ounces of proven and probable gold reserves and more than 700 million ounces of silver contained within gold reserves.
(3) 100% basis.
18
Responsible Mining
· In 2008, Barrick was named to the Dow Jones Sustainability Index (DJSI) World category, ranking the company as a global leader in social and environmental responsibility.
· The Atacama Commitment in Chile – a partnership between Barrick and respected community based organizations – is aimed at alleviating poverty in the region around our Pascua-Lama project.
|
Dow Jones Sustainability Indexes |
|

named to World category
At Barrick, we strive to be a model of responsible mining at our operations around the world. Wherever we operate, we are committed to contributing to sustainable development. Our aim is to set the standard for environmental stewardship, employee safety, community relations and ethical business practices.
In 2008, Barrick was named to the Dow Jones Sustainability Index (DJSI) World category, ranking the company as a global leader in social and environmental responsibility. Highlights of progress are described below.
For more detailed information, please view our 2008 Responsibility Report or subscribe to Beyond Borders, Barrick’s quarterly report on responsible mining, at www.barrick.com.
Community
Barrick’s global strategy is to constructively engage with communities and support initiatives that improve quality of life.
In Chile, Barrick has forged an alliance with some of the country’s most respected non-governmental organizations (NGOs) to alleviate poverty and assist 4,000 of the most underprivileged residents of the Atacama region, near our Pascua-Lama project. Under the Atacama Commitment, new homes will be built for 700 families, computer technology will help to modernize 12 local schools, and disabled children will have access to integrated health services. Recently, the United Nations Global Compact became the newest partner to join the Atacama Commitment.
At our operations, we take action to address serious health issues affecting the wider community. In Tanzania, Barrick is leading a cooperative effort to address some of the most serious health challenges affecting the Lake Zone region, home to nine million people and many of the country’s gold mining operations. The Lake Zone Health Initiative builds on
20
Barrick partnered with local NGOs to alleviate poverty in Chile’s Atacama region in 2008. |
|

Barrick’s comprehensive HIV/AIDS and malaria control programs near our operations, carried out in partnership with the African Medical & Research Foundation (AMREF). The Initiative aims to address severe shortages in health services by promoting collaboration among public and private sectors and NGOs. Barrick’s HIV/AIDS and malaria prevention programs in Tanzania were recognized in a report published by the World Gold Council.
In rural Peru, we are continuing our campaign to tackle child malnutrition and improve education and access to clean water, working with organizations like World Vision. Barrick has also made significant investments in health infrastructure, such as the recent funding of a new pediatric ward in Argentina and facilities for underserved communities in Papua New Guinea.
Throughout 2008, the company continued its strategic focus on education by investing in schools, scholarships, and employment skills training programs. We struck a collaborative partnership with the philanthropic organization Fundacion Cisneros and Intel Corporation that aims to foster a modern, 21st century learning environment in developing regions of South America. Over the coming year, the Class 21 program will be implemented at schools in Chile and Peru, equipping classrooms with modern computers and providing skills training to teachers. Barrick has also introduced adult literacy programs in the Dominican Republic, near our Pueblo Viejo project, and in Papua New Guinea, where 83 literacy teaching units have been established to address low literacy rates. Near our Buzwagi project in northwest Tanzania, Barrick was instrumental in establishing the first high school in one remote community and created a scholarship fund for the area’s poorest children.

Barrick helped establish the first high school in a remote community near the Tulawaka mine in Tanzania.
Indigenous Relations
Following three years of constructive dialogue, Barrick signed a Collaborative Agreement with elected leaders from Western Shoshone tribes in Nevada to work in partnership to improve education, health and economic opportunities and cultural preservation. The Agreement establishes the Western Shoshone Educational Legacy Fund, a scholarship program tied to revenues from the Cortez Hills project, that will benefit generations of Western Shoshone. This historic Agreement is the first of its kind by any company operating in Nevada.
Environment
Safeguarding the environment is critical to our social license to operate. Barrick continues to demonstrate exemplary leadership within the gold industry in the voluntary application of the International Cyanide
21
Responsible Mining |
|
Ángel Vera Figueroa, one of 37 Barrick Safety and Health Champions for 2008, helped Lagunas Norte reach more than two million hours of construction time without a reportable incident. |
Management Code. To date, 15 Barrick mines have been formally certified under the Code – more than any other mining company – with a further five mines on track for certification in 2009. Barrick’s four South American operations have achieved ISO 14001, the recognized international standard for sound environmental management. Efforts are currently underway to advance ISO 14001 certification at other Barrick-owned operations in 2009.
Worldwide, Barrick engages in extensive environmental monitoring and commits significant resources to protecting the environment. In 2008, our mine reclamation practices continued to garner recognition and awards. Most recently, our Ruby Hill mine in Nevada won the 2008 federal Bureau of Land Management Hardrock Mineral award for environmental practices and community relations.
Barrick’s new Global Water Conservation Standard has been finalized and is now being implemented as a company-wide priority. All of Barrick’s mines have conducted energy self-assessments and are working toward greater energy efficiency and conservation.
Barrick established a climate change policy and program in 2008. We have now completed the company’s first carbon profile and are engaged in a risk assessment to guide our efforts in the future.
In Chile, we announced a $30 million expansion of the Punta Colorado wind farm project near Pascua-Lama, increasing our investment to $70 million and its generating capacity from 20 to 36 megawatts. We have also built a high altitude wind turbine near our Veladero mine in Argentina and installed a solar power farm in Nevada. In 2008, Barrick also became the first mining company to join the International Leadership Council of the Nature Conservancy, the world’s largest conservation organization.
Safety
At Barrick, nothing is more important than the safety of our people. Our safety vision is: “Every person going home safe and healthy, every day.” This commitment has become one of the defining features of our company.
Since 2002, there has been a 70% improvement in Barrick’s safety performance in total recordable injury frequency rates, with the company now ranking among the top performers in our industry. However, there were three contractor fatalities in 2008 – two due to operational incidents and a third who was struck by lightning. We are deeply saddened by these fatalities and remain committed to our goal of a zero incident safety culture, and to building increased safety awareness within the company. Our safety message is supported by effective measures to control workplace hazards and eliminate injuries. On an annual basis, Barrick’s executive team visits mine sites to personally recognize accomplishments at both the site and individual level.
Since 2004, over 20,000 employees and contractors have taken the company’s intensive Courageous Safety Leadership training program. Follow-up refresher courses are just one aspect of a dynamic process for renewed and continued integration of the safety vision within the company culture.
A governance process for health and safety has been established at all levels to ensure that all safety issues are managed effectively.
Throughout 2008, efforts to improve health and safety programs and systems continued. These company-wide efforts are supported by disciplined risk assessment, ongoing coaching of employees, and targeted initiatives to change behaviors and improve our performance. Among other initiatives in 2009, the company is introducing a new program to improve driver safety and reduce roadway incidents.
22
Financial Report
24 Management’s Discussion and Analysis 82 Financial Statements 86 Notes to Consolidated Financial Statements 141 Mineral Reserves and Resources 149 Corporate Governance and Committees of the Board 150 Shareholder Information 152 Board of Directors and Senior Officers
Management’s Discussion and Analysis (“MD&A”)
Management’s Discussion and Analysis (“MD&A”) is intended to help the reader understand Barrick Gold Corporation (“Barrick”, “we”, “our” or the “Company”), our operations, financial performance and present and future business environment. This MD&A, which has been prepared as of February 19, 2009, should be read in conjunction with our unaudited consolidated financial statements for the year ended December 31, 2008. Unless otherwise indicated, all amounts are presented in US dollars.
For the purposes of preparing our MD&A, we consider the materiality of information. Information is considered material if: (i) such information results in, or would reasonably be expected to result in, a significant change in the market price or value of our shares; or (ii) there is a substantial likelihood that a reasonable investor would consider it important in making an investment decision; or (iii) if it would significantly alter the total mix of information available to investors. We evaluate materiality with reference to all relevant circumstances, including potential market sensitivity.
Continuous disclosure materials, including our most recent Form 40-F/Annual Information Form, annual MD&A, audited consolidated financial statements, and Notice of Annual Meeting of Shareholders and Proxy Circular will be available on our website at www.barrick.com, on SEDAR at www.sedar.com and on EDGAR at www.sec.gov. For an explanation of terminology unique to the mining industry, readers should refer to the glossary on page 77.
Cautionary Statement on Forward-Looking Information
Certain information contained or incorporated by reference in this MD&A, including any information as to our strategy, plans or future financial or operating performance, constitutes “forward-looking statements”. All statements, other than statements of historical fact, are forward-looking statements. The words “believe”, “expect”, “anticipate”, “contemplate”, “target”, “plan”, “intend”, “continue”, “budget”, “estimate”, “may”, “will”, “schedule” and similar expressions identify forward-looking statements. Forward-looking statements are necessarily based upon a number of estimates and assumptions that, while considered reasonable by us, are inherently subject to significant business, economic and competitive uncertainties and contingencies. Known and unknown factors could cause actual results to differ materially from those projected in the forward-looking statements. Such factors include, but are not limited to: the impact of global liquidity and credit availability on the timing of cash flows and the values of assets and liabilities based on projected future cash flows; fluctuations in the currency markets (such as Canadian and Australian dollars, South African rand, Chilean peso, Argentinean peso, Peruvian sol and Papua New Guinean kina versus US dollar); fluctuations in the spot and forward price of gold and copper or certain other commodities (such as silver, diesel fuel and electricity); changes in US dollar interest rates or gold lease rates that could impact the mark-to-market value of outstanding derivative instruments and ongoing payments/receipts under interest rate swaps and variable rate debt obligations; risks arising from holding derivative instruments (such as credit risk, market liquidity risk and mark-to-market risk); changes in national and local government legislation, taxation, controls, regulations and political or economic developments in Canada, the United States, Dominican Republic, Australia, Papua New Guinea, Chile, Peru, Argentina, South Africa, Tanzania, Russia, Pakistan or Barbados or other countries in which we do or may carry on business in the future; business opportunities that may be presented to, or pursued by, us; our ability to successfully integrate acquisitions; operating or technical difficulties in connection with mining or development activities; employee relations; availability and
24
increased costs associated with mining inputs and labor; litigation; the speculative nature of exploration and development, including the risks of obtaining necessary licenses and permits; diminishing quantities or grades of reserves; adverse changes in our credit rating; and contests over title to properties, particularly title to undeveloped properties. In addition, there are risks and hazards associated with the business of exploration, development and mining, including environmental hazards, industrial accidents, unusual or unexpected formations, pressures, cave-ins, flooding and gold bullion or copper cathode losses (and the risk of inadequate insurance, or inability to obtain insurance, to cover these risks). Many of these uncertainties and contingencies can affect our actual results and could cause actual results to differ materially from those expressed or implied in any forward-looking statements made by, or on behalf of, us. Readers are cautioned that forward-looking statements are not guarantees of future performance. All of the forward-looking statements made in this MD&A are qualified by these cautionary statements. Specific reference is made to Barrick’s most recent Form 40-F/Annual Information Form on file with the SEC and Canadian provincial securities regulatory authorities for a discussion of some of the factors underlying forward-looking statements. We disclaim any intention or obligation to update or revise any forward-looking statements whether as a result of new information, future events or otherwise, except to the extent required by applicable law.
Index | |
| |
26 | Core Business, Enterprise Strategy and Our Ability to Deliver Results |
| Provides an overview of Barrick and outlines our core business, critical success factors, key performance indicators for our business, our performance in relation to our 2008 strategic objectives, our 2009 strategic objectives, and our key strengths and competencies. |
|
|
31 | Market Overview and 2008 Financial and Operational Results |
| Provides a review of the overall market trends within the industry, reviews Barrick’s consolidated financial performance, including significant factors affecting income and cash flow. It also includes a review of our regional operating performance in 2008 along with an update on key projects. |
| 31 Market Overview |
| 36 Financial Overview 39 Operational Overview 40 Reserves 41 Key Business Transactions 41 Operating Segments Review |
|
|
47 | Review of Significant Operating Expenses |
| Provides analytics for variances for our significant operating expenditures. |
|
|
50 | Financial Outlook |
| Provides our 2009 forecast for key financial and operational performance measures, significant underlying assumptions, and economic sensitivities for some of these key assumptions. |
|
|
52 | Review of Quarterly Result |
| Provides a review of our consolidated financial performance in the fourth quarter, summarizes our results on a quarter by quarter basis, and includes an analysis of key factors impacting quarter to quarter performance. |
|
|
53 | Financial Condition Review |
| Reviews our cash flow, balance sheet, credit rating and our approach to managing our capital position and capital resources to support our business objectives. It also discusses our contractual obligations, off balance sheet arrangements and financial instruments as at the end of 2008. |
|
|
62 | Critical Accounting Policies and Estimates Summarizes key changes in accounting policies in 2008 and for future periods, analyzes critical accounting estimates, our internal controls over financial reporting, disclosure controls and procedures, and information on our conversion to IFRS. |
|
|
72 | Non-GAAP Financial Measures |
| Includes descriptions of the various non-GAAP financial performance measures used by management, the reasons for their usage and a tabular reconciliation of these measures to the closest equivalent US GAAP measure. |
|
|
77 | Glossary of Technical Terms |
| Explanation of terminology used in our MD&A that is unique to the mining industry. |
25
Changes in Definitions of Non-GAAP Measures
We use certain non-GAAP financial measures in our MD&A. In this MD&A, we have changed the definition of “adjusted net income”, “total cash costs”, “EBITDA”, “realized price” and “cash margin”. For a description of the change in the definition of (a) adjusted net income, please see pages 72 and 73, (b) total cash costs, please see pages 38 and 73 to 74, (c) EBITDA, please see page 75, (d) realized price, please see pages 75 to 76, and (e) cash margin, please see page 76. For a detailed discussion of each of the non-GAAP measures used in our MD&A, please see the discussion under “Non-GAAP Financial Performance Measures” beginning on page 72 of our MD&A.
Core Business, Enterprise Strategy and our Ability to Deliver Results
Our Vision
To be the world’s best gold mining company by finding, acquiring, developing and producing quality reserves in a safe, profitable and socially responsible manner.
Our Business
Governed by our five core values; behave like an owner, act with a sense of urgency, be a team player, continually improve, and deliver results, we have become the world’s preeminent gold mining company. Our annual gold production and gold reserves are the largest in the industry. We also produce significant amounts of copper at some of our operating mines. We sell our production in the world market through three primary distribution channels: gold bullion is sold in the gold spot market; gold and copper concentrate is sold to independent smelting companies; and copper cathode is sold under copper cathode sales contracts with various third parties.
Our Strategy
To increase total returns for our shareholders, we aim to increase earnings and operating cash flow and to provide leverage to gold prices through annual gold production and growing our reserve/resource base through a combination of organic growth, driven by new mineral reserve discoveries and the development of new projects, and also through acquisitions. Our profitability is largely dependent upon the volume of gold and copper production, realized prices of gold and copper and production costs. As gold prices have risen in recent years, we have been able to realize higher cash margins per ounce through containment of production costs. Although gold production has seen a declining trend in the past three years, we intend to increase production levels through the development of new mines and also through acquisitions.
Building new mines is key to our long term goal of increasing profitability and building shareholder value. It can take a number of years for a project to move from the exploration stage through to mine construction and production. Our business strategy reflects this long lead time by ensuring that we have an inventory of projects combined with effective management of current operating mines.
26
The projects in our inventory are at various stages of development, ranging from scoping to feasibility to construction. Three projects are at an advanced stage, namely Buzwagi, Cortez Hills and Pueblo Viejo. We are confident that we have the managerial team and resources to successfully bring these advanced projects into production. These projects will require substantial upfront capital that we expect to fund from a combination of future operating cash flow and new financings. We expect that these three new mines will operate at lower average total cash costs than the average total cash costs of our current portfolio of operating mines. We also expect these new mines will report higher amortization than our current portfolio, reflecting the high capital cost of building new mines in today’s economic environment. The other projects in our inventory include both gold and non-gold projects at various stages of feasibility. In light of today’s low price environment for other metals, our primary focus is on projects with a significant gold component. A decision to proceed with other projects will depend upon numerous factors, but particularly the expected economic returns on the project and the cost and availability of financing.
Acquisitions have always been an integral part of our growth strategy. In 2006, we acquired Placer Dome Inc., one of the world’s largest gold mining companies. In 2007, we continued to expand our projects through the acquisition of a 51% interest in the Cerro Casale copper-gold deposit in Chile, and a package of exploration licenses in Papua New Guinea from Highlands Pacific. We also increased our interest in the Porgera mine from 75% to 95%. In 2008, we increased our ownership in the Cortez mine and Cortez Hills project from 60% to 100%.
Key Strategic Performance
In 2008, our strategic targets focused on share price performance, creating a high performance organization, responsible mining, advancing our inventory of projects and meeting our financial and operating targets with a focus on core areas such as production, cost control, and increasing reserves. Our successes in each of these areas have laid the foundation for our 2009 key areas of focus: share price performance, growth, financial strength and flexibility, operational excellence, respect for our people, ensuring our license to operate and continuing to build and maintain a high performance organization.
27
Strategic Performance and 2009 Stategic Objectives
2008 Strategic Objectives |
| Performance |
| Key 2009 Strategic Objectives |
|
|
|
|
|
Operational Excellence · Meet guidance for production and total cash costs · Excellent financial management in areas of financial risk management, financial reporting, cost control and investor communications Growth · Continue to focus on exploration to find new gold reserves and resources · Expanding the role of R&D to add value to our existing operations · Targeted acquisitions to strengthen operational base Capital Management and Projects · Effective capital allocation through prioritization and sequencing of projects · Projects built on-time and on-budget · Address long-term energy needs and explore alternative energy projects |
| · Met guidance for gold production and met revised total cash cost guidance · Continued our emphasis on cost controls, supply security and supplier development · Increased gold reserves by 11% to 138.5 million ounces and increased gold resources by 29% to 65.0 million ounces · Moving into the execution phase of our internet based “Unlock the Value” program which is aimed at enhancing the recovery of the silver content of our Veladero deposit located in Argentina · Acquired additional 40% of Cortez to consolidate 100% interest · Buzwagi construction on schedule and within budget with production expected in mid-2009. · Cortez Hills regulatory approval obtained to allow commencement of construction and pre-stripping · Pueblo Viejo construction activity commenced · Acquired Barrick Energy as part of a long term strategy to contain the cost of oil consumption |
| Operational Excellence · Meet or improve upon operational guidance · Intense focus on capital efficiency and allocation of capital · Deliver projects on time and on budget · Manage financial and commodity exposures Growth · Focus on reserve/resource growth through a combination of new discoveries and acquisitions Enhance Financial Strength and Flexibility · Maintain investment grade credit ratings · Ensure credibility with shareholders by delivering on guidance and providing high-quality continuous communication · Ensure access to capital markets |
|
|
|
|
|
High Performance Organization · Strengthen leadership through sustained training and support for our people · Continue building culture focused on our values, innovation and open communication · Enhanced people management to be the employer of choice by attracting, motivating and retaining top people in competitive markets · Support the business by developing robust infrastructure, standardizing and streamlining business processes |
| · Continued Business Process Improvement program and implementation of standardized technology solutions and business processes across the company · Developed and implemented Compass, a set of learning and development programs for early stage professionals, in each of our technical mining disciplines |
| High Performance Organization · Maintain entrepreneurial culture · Enhance employee ownership and accountability · Reward and recognize bold leadership · Focus and simplify work practices |
|
|
|
|
|
Responsible Mining · Effective community and government relations that work to strengthen relationships with the communities around our operations · Environmental leadership on climate change, water management, energy management and International Cyanide Management Code implementation Innovation · Focus on innovation, through R&D efforts, to increase recovery, improve ore characterization, reduce energy equirements and improve plant design · Using technology as an enabler to develop strategy, increase automation and remote management at our mines |
| · Improved our safety record with fewer lost-time and total incidents · Over 20,000 people trained in Courageous Safety and Leadership to date · A Community Relations Leadership Team was established and played a key role in the development of a strategy to strengthen relationships with communities around our operations · We established a climate change policy and program during the year and have completed the company’s first carbon profile and are engaged in a risk assessment to guide our efforts in the future. · Voluntary application of the International Cyanide Management Code, which establishes strict guidelines for the safe management of cyanide in mining. Fourteen Barrick mines have been formally certified under the Code, with a further five mines on track for certification in 2009 |
| Respect our People · “Every person going home safe and healthy every day” · Personal development and career advancement of our employees · Continuously recognize the achievements of our people Ensure License to Operate · Welcomed partner of communities and government · Effective environmental stewardship · Compliance with regulatory standards |
28
Capability to Execute our Strategy
Our capability to execute our financial and operational strategy comes from the strength of our experienced management team, skilled workforce and organizational structure, a strong inventory of projects that facilitates the long-term sustainability of our business, our strong research and development group, our strong financial position and our commitment to achieving high standards in terms of environmental, health and safety performance.
Experienced Management Team, Skilled Workforce and Organizational Structure
We have an experienced management team with a proven track record in the mining industry. Strong leadership and governance are critical to the successful implementation of our core business strategies.
We manage our business using a regional business unit (“RBU”) structure. We have four RBUs, each of which is led by its own Regional President: North America, South America, Australia Pacific, and Africa. Each RBU operates as a standalone business unit with a range of functional groups. Since their inception, the RBUs have added value to our business by realizing operational efficiencies in the region, allocating resources more effectively and understanding and better managing the local business environment, including labor, consumable costs and supply and government and community relations.
A skilled workforce has a significant impact on the efficiency and effectiveness of our operations. The remote nature of many of our mine sites presents some challenges in maintaining a well-trained and skilled workforce. As a result, we continue to focus on training and development for key members of our senior mine management, technical professionals and frontline workers through our talent management processes and enhanced distance learning programs and e-learning technologies. We have also expanded our technical training and development programs to include all of our technical mining disciplines (mining, metallurgy, maintenance and geology). This program is now improving the technical and leadership skills of over 300 professionals.
In addition, we have a Continuous Improvement (“CI”) group that is focused on improving operational excellence. An ongoing focus for the CI group continues to be the identification of cost reduction opportunities, through process improvements, better utilization of plant and equipment and metallurgical recovery improvements to increase production rates and lower costs.
Advanced Exploration and Project Development
Our inventory of advanced exploration targets and development projects represents an important component of our long-term strategy of growing our reserves and resources. Our exploration is focused on prospective land positions and we prioritize exploration targets to optimize the investment in our exploration programs. An economic discovery is no longer a guarantee of a new mine, as considerable opposition to new mining projects can develop from institutional NGOs or unstable political climates. The development of a new mine requires successful permitting and government relations, community dialogue and engagement, and significant financial and human capital. As a result of these factors, the timeline and cost of developing projects has increased significantly. In 2008, we formed a dedicated Capital Projects group to focus on managing large projects and building new mines. This specialized group manages all project activities up to and including the commissioning of new mines, at which point responsibility for mine operations is handed over to the RBUs.
Research and Development
Our research and development (“R&D”) group is supported by an in-house Technology Center located in Vancouver, and supports both operations and projects. In 2009, we are moving into the execution phase of our internet-based “Unlock the Value” program which is aimed at enhancing the recovery of the silver content of our Veladero deposit located in Argentina. The silver recovery program for the Pueblo Viejo project also has increased expected recoveries significantly from the former Placer Dome feasibility work.
29
Financial Strength
The current global economic crisis has underlined the importance of maintaining adequate levels of liquidity and a strong balance sheet. We actively manage our liquidity by focusing on maintaining and growing operating cash flow, effective capital allocation and prioritization of capital projects, and putting in place financing, when appropriate, for our capital needs.
Environmental, Health and Safety
Safeguarding the environment is critical to our social license to operate. In mining, water and energy conservation are also a critical part of the environmental equation. Our new Global Water Conservation Standard has been finalized and is now being implemented as a company-wide priority. All 27 Barrick mines have conducted energy self-assessments and are working toward greater energy efficiency and conservation.
Our Environmental Management System continues to garner recognition. Most recently, our Ruby Hill mine in Nevada won the prestigious federal Bureau of Land Management award for its environmental management and concurrent reclamation practices. In Argentina, a pioneering wetlands rehabilitation program near our Veladero mine was recognized internationally by the industry association OLAMI (Organizacion Latinoamericana de Minería).
We also announced a $30 million expansion of the Punta Colorado wind farm project near Pascua-Lama in Chile, increasing our investment to $70 million and generating capacity from 20 to 36 megawatts. This brings the company’s total investment in renewable energy projects to $98 million to date, including a high altitude wind turbine near our Veladero mine in Argentina and solar power in Nevada. In 2008, we also became the first mining company to join the International Leadership Council of the Nature Conservancy, the world’s largest conservation organization.
We believe that the health and safety of our workers is fundamental to our business. Our vision is: “Every person going home safe and healthy every day”. We are committed to the identification, elimination or control of workplace hazards for the protection of ourselves and others. Our long-term goal is to be a zero incident company.
For us to succeed in fulfilling this goal, we are working to:
· Provide the expertise and resources needed to maintain safe and healthy working environments
· Establish clearly defined safety and occupational health programs and measure safety and health performance, making improvements as warranted
· Operate in accordance with recognized industry standards, while complying with applicable regulations
· Investigate the causes of accidents and incidents and develop effective preventative and remedial action
· Train employees to carry out their jobs safely and productively
· Maintain a high degree of emergency preparedness.
· Require that vendors and contractors comply with our applicable safety and health standards.
30
Market Overview and 2008 Financial and Operational Results
Market Overview
In 2008, the global economy experienced a tumultuous year, as many commodity prices and stock market indices reached all-time highs. Gold reached an all-time high of $1,032 per ounce in 2008, and copper reached a high of $4.06 per pound in 2008. Commodity prices declined precipitously during the latter half of the year as global credit markets seized up, investor confidence plummeted and many economies entered recession. The decrease in bank liquidity and the resulting credit crisis led to some high profile bank failures and other near failures. These developments had a pervasive impact on virtually all industries through the devaluation of global equities and commodities; increased volatility in global equities, commodities, foreign exchange and precious metals markets; deterioration in the credit ratings of a number of large financial institutions; decreases in market liquidity and unwinding of levered trades by hedge funds; intervention by governments and central banks in the marketplace; and a general slowdown in global economic activity. Although gold prices retreated to a low of $682 per ounce in 2008, market prices have since increased as investors have looked to gold as a safe haven, with recent prices in the range of $950 to $975 per ounce. These developments have had, and we expect will continue to have, a significant impact on our business. In particular:
· Volatility in gold prices leads to volatility in our revenues, earnings and cash flow.
· Lower copper prices impact the revenues and cash flow generated by our copper production and the potential returns on projects containing significant quantities of copper such as Cerro Casale and Reko Diq. Our copper hedge position largely economically protects us from lower copper prices in 2009, but beyond 2009 we are dependent on market copper prices.
· Lower energy prices, commodity and consumables prices and currency exchange rates should benefit our production costs in the medium to long term. In the short term, our currency and energy hedge positions will result in higher prices than current market rates, delaying the realization of benefits to production costs.
· Lower silver, platinum group metals, nickel and copper prices would impact the economics of capital projects containing significant quantities of these metals, such as Pascua-Lama, Sedibelo, Fedorova, Kabanga, Cerro Casale and Reko Diq.
· The global credit/liquidity crisis is impacting the cost and availability of new financing.
In response to these conditions we have taken a number of actions, including:
· A critical review of spending to contain costs;
· An extensive review of sustaining capital expenditures to prioritize allocations of capital; and
· Focusing on advancing our near term gold projects (Buzwagi, Cortez Hills and Pueblo Viejo) to optimize returns and cash flow.
Although current economic and credit conditions create many challenges and risks, a continuation of the trend of higher gold prices, if gold maintains its appeal as a safe haven, could enable us to increase cash margins from gold sales and operating cash flow from our current portfolio of operating mines. At the same time there is risk that a decline in gold prices could also occur.
Mineral Markets
Gold
The market price of gold is one of the most significant factors in determining the profitability of Barrick’s operations(1). The price of gold is subject to volatile price movements over short periods of time, especially in the current market environment, and is affected by numerous industry and macroeconomic factors that are beyond our control. Gold price volatility increased significantly compared to 2007, and the price ranged from $682 to $1,032 per ounce in 2008, with an average market price of $872 per ounce. Gold strongly outperformed all other major commodities in 2008 as it benefited from safe-haven flows during the financial crisis. However, safe-haven flows were subsequently outweighed by US dollar strengthening and a general deleveraging of balance sheets across the globe, which resulted in gold trading as low as $682 per ounce in November, after reaching over $1,000 per
(1) Refer to our financial outlook section in this MD&A for an illustration of the sensitivity of our revenues to movements in the gold price.
31
ounce in March. By year end, gold was trading at $870 per ounce due to less speculative selling and strong investment demand from Exchange Traded Funds (“ETFs”) and coin sales.
We believe that the uncertainty in the global financial markets, the amount of monetary stimulus being injected into the global economy, possible inflationary pressures in the medium term from an exceptionally low interest rate environment, the possibility of currency revaluations, including US dollar depreciation, and a sharp increase in government spending in response to the financial crisis are all supportive of higher gold prices in 2009 if such trends continue.
We believe the outlook for mine production from all gold mining companies over the next 5 to 10 years, which currently represents over 60% of total global supply, is one of gradual decline. The primary drivers for the global decline are a trend of lower grade production by many producers; increasing delays and impediments in bringing projects – especially large-scale projects – to the production stage; inflationary pressures on capital costs which have subsequently eased, but have been replaced by global financing conditions that constrain the ability of mining companies to finance projects; a lack of global exploration success in recent years; and a dearth of new, promising regions for gold exploration and production. A decrease in global industry production increases the potential for increases in the sustainable long term gold price.
Copper
London Metals Exchange (“LME”) copper prices traded in a range of $1.28 to $4.06 per pound in 2008, and averaged $3.15 per pound for the year. Our realized price of $3.39 in 2008 exceeded LME spot prices due to the impact of our copper hedging program. In 2008, copper prices reached all-time highs before suffering large declines through the end of 2008, due to the global economic slowdown. Future copper prices should be influenced by demand from Asia, global economic performance and production levels of mines and smelters. Our 2009 copper production is economically protected from declines in LME spot prices through the use of forwards and collars. At spot prices between $1.57 and $2.01 per pound we expect to realize an average minimum price of $3.03 per pound. On approximately half of our production we are exposed to a decline in market prices below $1.57 per pound and have upside participation above $2.01 per pound through buying calls that allowed us to lock in gains from $3.03 to $2.01 per pound and selling puts to finance these calls.
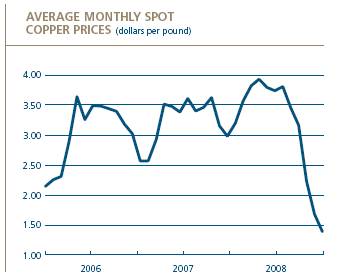
32
Currency Exchange Rates
The results of our mining operations outside the United States, particularly our mine operating costs, are affected by currency exchange rates. The largest single exposure we have is to the Australian dollar. We also have exposure to the Canadian dollar through a combination of Canadian mine operating costs and corporate administration costs; and the Papua New Guinea kina, Peruvian sol, Chilean peso and Argen-tinean peso through mine operating costs.
Fluctuations in the US dollar increase the volatility of our costs reported in US dollars, subject to protection we have put in place through our currency hedging program. In 2008, the Canadian dollar traded in a wide range of $0.77 to $1.03 and closed at $0.81 due to volatility in the global economy and weaker energy and commodity prices. The Australian dollar experienced high volatility as well, trading in a range of $0.60 to $0.98 and closed at $0.70, due in part to decreasing interest rate differentials and the impact of the global economic slowdown and weaker commodity prices.
About 60-65% of our consolidated production costs are denominated in US dollars and are not exposed to fluctuations in US dollar exchange rates. For the remaining portion, our currency hedge position allows for more accurate forecasting of our anticipated expenditures in US dollar terms and mitigates our exposure to volatility in the US dollar. Over the last three years, our currency hedge position has provided benefits to us in the form of hedge gains when contract exchange rates are compared to prevailing market exchange rates as follows: 2008 – $106 million; 2007 – $166 million; and 2006 – $84 million. These gains are recorded within our operating costs. We have also recorded hedge gains as an offset to corporate administration costs as follows: 2008 – $11 million; 2007 – $19 million; and 2006 – $14 million.
For 2009, our average Australian and Canadian dollar hedge rates exceed the current market rates for these currencies. The average hedge rates vary depending on when the contracts were put in place. We are approximately 95% hedged in 2009 for expected Australian and Canadian operating expenditures at rates of 0.76 and 0.94, respectively. In addition, we have hedged 90% of our expected 2010 Australian operating expenditures at a rate of $0.80. Assuming market exchange rates remain at the December 31st levels of $0.70 and $0.82, we expect to record opportunity losses of approximately $135 million in 2009 (about $14 per ounce on total 2009 production), or approximately $100 million for the Australian dollar and approximately $35 million for the Canadian dollar, which will primarily impact our administration costs. Further information on our currency hedge positions is included in note 20 to the Financial Statements.
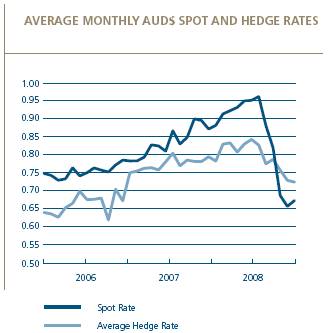
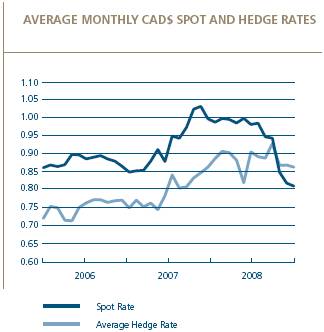
33
Fuel
We consume on average about 3.5 million barrels of diesel fuel annually across all our mines. Diesel fuel is refined from crude oil and is therefore subject to the same price volatility affecting crude oil prices. With global demand decreasing towards the end of 2008 on fears of a global slowdown in economic activity, oil prices decreased from a record high of $147 per barrel in third quarter 2008 to close at $45 per barrel at the end of the year.
Volatility in crude prices has a significant direct and indirect impact on our production costs. In order to mitigate this volatility, we employ a strategy combining the use of futures contracts and our production from Barrick Energy to effectively hedge our exposure to high oil prices. We currently have futures contracts in place totaling 5.1 million barrels, which represents about 62% of our total estimated direct consumption in 2009 and 21% of our total estimated direct consumption over the following four years. Those contracts are primarily designated for our Nevada-based mines, and have an average price of $91 per barrel. In 2008, we realized benefits in the form of fuel hedge gains on those contracts totaling $33 million (2007: $29 million; 2006: $16 million), when contract prices were compared to market prices. At a price of $42 per barrel, we expect to realize opportunity losses of approximately $100 million in 2009 from our financial contracts. In 2009, we expect Barrick Energy to produce about 1.4 million barrels of oil equivalent at a cash cost of about $29 per barrel. The combination of our financial contracts and expected Barrick Energy production provide us with an economic hedge of 3.5 million barrels for 2009 at an average cost of $69 per barrel.

Cost Pressures
Beyond fuel, the mining industry has also experienced high volatility in the prices of many of its other commodities and consumables used in the production of gold and copper.
In the case of sulfuric acid, we experienced a period of high market prices and supply shortages which have had a significant impact on production costs and disrupted production levels, particularly at our Zaldívar copper mine. We have now secured the supply and price of substantially all of our sulfuric acid needs for 2009 and over half of the supply expected to be required for 2010 and 2011 through firmly committed contracts, which should reduce the risk of future supply shortages and exposure to fluctuating prices.
Electricity prices fell from the highs experienced in third quarter 2008 primarily due to the decrease in the prices of diesel, coal, propane and natural gas, which are used for power generation. We continue to pursue alternative strategies to reduce our energy cost exposure, such as the operation of our natural gas-fired electricity plant to power our Nevada-based mines and its adjacent solar farm, our wind farm in Chile and our high-altitude wind turbine in Argentina.
The trend to lower prices for commodities and other consumables seen in the latter half of 2008 is expected to provide some eventual relief from the extraordinary rate of cost escalation the industry has witnessed over the last few years if prices remain at these lower levels. However, these lower prices will not significantly benefit our operating costs in 2009 due to the impact of existing inventory supplies, committed purchase contracts and commodity hedge contracts.
34
In addition to the volatile environment for operating expenses, we are also subject to fluctuations in certain commodity prices with respect to our capital projects. In particular, the cost of structured steel is a significant proportion of our pre-production capital costs at our development projects. Steel prices have been volatile since February 2008, when steel billet contracts first began trading on the LME. From the introduction of the January 2008 Mediterranean Steel Futures contract on the LME to the end of 2008, prices traded in a $1,110 per tonne range ($255 to $1,265 per tonne), closing the year at $368 per tonne. The fluctuations in the price of steel are a result of broad volatility in commodity prices.
US Dollar Interest Rates
As a result of the contraction of global credit markets and in an effort to spur economic activity and avoid potential deflation, the US Federal Reserve reduced short-term US dollar interest rates in 2008. Commercial credit spreads have widened, largely in response to the global re-pricing of credit. Rising credit spreads would increase our costs of new financing if this environment persists. In 2009, we expect that short-term rates will remain approximately at present levels followed by incremental increases to the short-term rate once economic conditions and credit markets normalize.
Our interest rate exposure mainly relates to the mark-to-market value of derivative instruments, the fair value and ongoing payments under U.S. dollar interest-rate swaps and to the interest payments on Barrick’s variable-rate debt ($0.3 billion at the end of the year), interest receipts on Barrick’s cash balances ($1.4 billion at the end of the year) and the valuation and forward prices of our Project Gold Sales Contracts. At present, the amount of interest expense recorded in our consolidated statement of income is not materially impacted by changes in short-term interest rates, due to the fact that the majority of our interest costs incurred are capitalized within property, plant and equipment. The relative amounts of variable-rate financial assets and liabilities may change in the future, depending upon the amount of operating cash flow we generate, as well as amounts invested in capital expenditures.
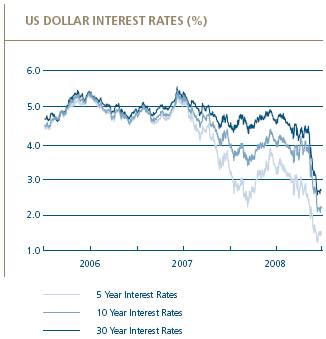
35
Financial Overview
Summary of Key Financial Results
($ millions, except per share data in dollars) |
|
|
|
|
|
|
| |||
For the years ended December 31 |
| 2008 |
| 2007 |
| 2006 |
| |||
Revenues |
| $ | 7,913 |
| $ | 6,332 |
| $ | 5,630 |
|
Net income |
| 785 |
| 1,119 |
| 1,506 |
| |||
Per share(1) |
| 0.90 |
| 1.29 |
| 1.79 |
| |||
Net income |
| 785 |
| 1,119 |
| 1,506 |
| |||
Impairment charges related to goodwill, property, plant and equipment, and investments |
| 899 |
| 59 |
| 17 |
| |||
(Gains)/losses on the disposition of long-lived assets |
| (178 | ) | (59 | ) | (301 | ) | |||
Foreign currency translation (gains)/losses |
| 135 |
| (73 | ) | (7 | ) | |||
Unrealized (gains)/losses on non-hedge derivative instruments |
| 20 |
| (10 | ) | 15 |
| |||
Adjusted net income(2) |
| 1,661 |
| 1,036 |
| 1,230 |
| |||
Per share(1) |
| 1.90 |
| 1.19 |
| 1.46 |
| |||
EBITDA(3) |
| 2,347 |
| 2,436 |
| 2,605 |
| |||
Operating cash flow |
| 2,206 |
| 1,732 |
| 2,122 |
| |||
Sustaining capital expenditures(4) |
| 742 |
| 679 |
| 720 |
| |||
Project capital expenditures(4) |
| 739 |
| 243 |
| 258 |
| |||
Total assets |
| 24,161 |
| 21,951 |
| 21,510 |
| |||
Total liabilities |
| 8,702 |
| 6,613 |
| 7,255 |
| |||
Dividends declared |
| $ | 349 |
| $ | 261 |
| $ | 191 |
|
(1) | Calculated using weighted average number of shares outstanding under the basic method. |
(2) | Adjusted net income is a non-GAAP financial performance measure with no standardized meaning under US GAAP. For further information and a detailed reconciliation, please see page 72 of this MD&A. |
(3) | EBITDA is a non-GAAP financial performance measure with no standardized meaning under US GAAP. For further information and a detailed reconciliation, please see page 75 of this MD&A. |
(4) | Amount presented is on a cash basis and reflects our equity share of capital expenditures on our advanced projects. For a detailed reconciliation and further discussion, please see page 57 of this MD&A. |
In 2008, net income decreased by $334 million, or 30% to a total of $785 million. EBITDA of $2,347 million was slightly lower than the $2,436 million recorded in the prior year. These decreases primarily relate to impairment charges related to goodwill and long-lived assets of $749 million and investments of $205 million. The goodwill and long-lived asset impairments were mainly due to: higher discount factors and lower valuation multiples reflecting present equity market conditions; lower copper price assumptions, which resulted in a significant reduction in production levels and remaining economic life at our Osborne copper mine; a significant decline in the oil price since the acquisition date of Barrick Energy; and the expected closure of the Henty mine on exhausting reserves in 2009. Investment impairment charges are primarily attributable to the write-down of our investment in Highland Gold due to the significant decrease in equity values of companies with significant exposure to the Russian market.
Impairment Charges Related to Goodwill, Property, Plant and Equipment, and Investments
($ millions) |
|
|
|
|
|
|
| |||
For the years ended December 31 |
| 2008 |
| 2007 |
| 2006 |
| |||
Kanowna |
| $ | 272 |
| $ | — |
| $ | — |
|
North Mara |
| 218 |
| — |
| — |
| |||
Investment in Highland Gold |
| 120 |
| — |
| — |
| |||
Osborne |
| 104 |
| — |
| — |
| |||
Barrick Energy |
| 88 |
| — |
| — |
| |||
Henty |
| 30 |
| — |
| — |
| |||
Asset-Backed Commercial Paper |
| 28 |
| 14 |
| — |
| |||
Golden Sunlight |
| — |
| 35 |
| — |
| |||
Eskay Creek |
| — |
| 7 |
| — |
| |||
Other |
| 39 |
| 3 |
| 17 |
| |||
Total (net of tax) |
| $ | 899 |
| $ | 59 |
| $ | 17 |
|
36
Various other factors affected both net income and adjusted net income. The following chart illustrates those factors in the context of adjusted net income.
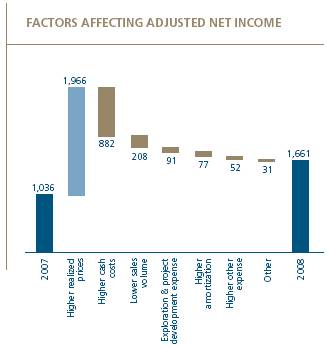
In 2008, we amended our definition of adjusted net income to exclude from this measure the impact of: impairment charges related to goodwill, property, plant and equipment, and investments; gains/losses on the disposition of long-lived assets; foreign currency translation gains/losses; and unrealized gains/losses on non-hedge derivative contracts. Previously, our adjusted net income was defined as net income excluding the impact of deliveries into our Corporate Gold Sales Contracts. Management believes that highlighting the impact of these adjustments provides investors and analysts with a better understanding of our underlying operating results. In addition, management uses this measure to prepare its internal budgets, forecasts and public guidance. Consequently, for these reasons, management believes that the inclusion of this financial measure provides useful information that, when used in conjunction with net income computed in accordance with US GAAP, provides investors and analysts with a better understanding of our performance for the period and our future prospects. Adjusted net income is a non-GAAP financial measure. For a full definition and reconciliation, refer to page 72 of this MD&A.
Operating cash flow increased $474 million from the prior year to a total of $2,206 million. The increase in operating cash flow reflects higher realized gold prices partly offset by higher total cash costs, lower gold sales volumes and higher inventory and working capital balances. Sustaining capital expenditures were $742 million, slightly higher than the prior year. Our share of project capital expenditures was $739 million, compared to $243 million in 2007, reflecting an increase in activity at the Cortez Hills, Pueblo Viejo and Buzwagi projects.
Summary of Key Operational Statistics
($ millions, except per ounce/pound data in dollars) |
| Gold |
| Copper |
| ||||||||||||||
For the years ended December 31 |
| 2008 |
| 2007 |
| 2006 |
| 2008 |
| 2007 |
| 2006 |
| ||||||
Production (000s ounces/millions pounds)(1) |
| 7,657 |
| 8,060 |
| 8,643 |
| 370 |
| 402 |
| 367 |
| ||||||
Reserves (millions of contained ounces/billions of contained pounds)(2) |
| 138.5 |
| 124.6 |
| 123.1 |
| 10.0 |
| 6.2 |
| 6.0 |
| ||||||
Sales |
|
|
|
|
|
|
|
|
|
|
|
|
| ||||||
000s ounces/millions pounds |
| 7,595 |
| 8,055 |
| 8,390 |
| 367 |
| 401 |
| 376 |
| ||||||
$ millions |
| $ | 6,656 |
| $ | 5,027 |
| $ | 4,493 |
| $ | 1,228 |
| $ | 1,305 |
| $ | 1,137 |
|
Market price |
| 872 |
| 695 |
| 604 |
| 3.15 |
| 3.23 |
| 3.05 |
| ||||||
Realized price(3) |
| 870 |
| 619 |
| 543 |
| 3.39 |
| 3.22 |
| 3.06 |
| ||||||
Cost of sales ($ millions) |
| 3,426 |
| 2,805 |
| 2,319 |
| 436 |
| 339 |
| 391 |
| ||||||
Total cash costs(4) |
| $ | 443 |
| $ | 345 |
| $ | 280 |
| $ | 1.19 |
| $ | 0.82 |
| $ | 0.78 |
|
(1) | Gold production and total cash cost per ounce/per pound statistics reflect our equity share of production. |
(2) | Calculated in accordance with National Instrument 43-101 as required by Canadian securities regulatory authorities. For United States reporting purposes, Industry Guide 7, (under the Securities and Exchange Act of 1934), as interpreted by Staff of the SEC, applies different standards in order to classify mineralization as a reserve. Accordingly, for U.S. reporting purposes, Cerro Casale is classified as mineralized material and approximately 600 thousand ounces of reserves for Pueblo Viejo (Barrick’s 60% interest) are classified as mineralized material. For a breakdown of reserves and resources by category and additional information relating to reserves and resources, see pages 141 to 148. |
(3) | Realized price is a non-GAAP financial performance measure with no standardized meaning under US GAAP. For further information and a detailed reconciliation, please see page 75 of this MD&A. |
(4) | Total cash costs per ounce/pound is a non-GAAP financial performance measure with no standardized meaning under US GAAP. For further information and a detailed reconciliation, please see page 73 of this MD&A. |
37
Total revenues of $7.9 billion were up $1.6 billion or 25% compared to the prior year, primarily due to higher realized gold and copper prices, which was partially offset by a decrease in sales volumes. Realized gold prices of $870 per ounce in 2008 were 41% higher than in 2007, principally due to higher market gold prices. Realized gold prices in 2007 reflect a reduction of $636 million (2006: $367 million), or $76 per ounce (2006: $44 per ounce), due to the voluntary delivery of 2.5 million ounces (2006: 1.2 million ounces) into our Corporate Gold Sales Contracts at average prices below the prevailing spot price.
Realized copper prices in 2008 were 5% higher than in 2007, with variability quarter to quarter reflecting the variability of market prices throughout the year, and the impact of our copper hedge positions in fourth quarter 2008. Current spot prices are significantly lower than 2008 realized prices. However, due to our hedge positions, we are largely economically protected from the decline in spot prices in 2009. In 2010, we are fully exposed to copper market prices.
In 2008, cost of sales attributable to gold increased by $621 million, or 22% compared to the prior year. On a total cash costs(1) per ounce basis, costs were up $98 per ounce, or 28% compared to the prior year. Cost of sales and total cash costs were impacted by increased amounts of waste mining at certain of our operations; inflationary pressures for input costs such as labor, oil, electricity and commodities and other consumables; increases in royalties and production taxes, and lower by-product credits and other gold price linked costs. In addition, total cash costs were impacted by lower average head grades.
Cost of sales attributable to copper increased by $97 million, or 29% compared to the prior year. Total cash costs per pound increased by $0.37, or 45% compared to the prior year. The increase in cost of sales attributable to copper and total cash costs per pound was primarily attributable to a significant increase in sulfuric acid prices and higher electricity prices resulting from a new higher-cost power contract at Zaldívar. The increases also reflect inflationary pressures on labor and other consumables and currency exchange impacts.
In 2008, we amended our definition of total cash costs to exclude the impact of unrealized non-hedge gains/losses on derivative contracts and to include the economic impact of our Barrick Energy unit. These changes are consistent with how management prepares its budget, forecasts and public guidance for total cash costs. In addition, many other gold companies present their total cash costs metric in this manner. Consequently, management believes that the changes to the calculation of total cash costs in 2008 provides investors and analysts with more accurate information on our underlying cash costs of production in the periods presented and is more comparable to the measure of total cash costs presented by other gold mining companies.
We produce an insignificant amount of non-gold metals in conjunction with the production of gold at certain of our operating mines, and in particular, copper is contained within the ore concentrate produced at our Bulyanhulu mine. The net economic effect of these non-gold metals is recorded within cost of sales as a by-product credit. In 2008, we recorded by-product credits of $6 million (2007: $15 million).
Some gold producers report a measure of total cash costs per ounce that reflects the net contribution from all non-gold revenue streams as a by-product credit of producing gold. We have provided a measure of total cash costs per ounce on this basis, whether or not these non-gold metals are produced in conjunction with gold, in order to enable investors to better understand our performance in comparison to those other gold producers. Total cash costs on a full credit for non-gold sales basis(2) were $337 per ounce compared to $228 in the prior year.
Cash margins per ounce illustrate the trends in profitability and the impact of fluctuations in realized prices and total cash costs on our ability to generate earnings and operating cash flow.(3) Cash margins per ounce increased in 2008 as the rise in gold prices outpaced rising total cash costs.
(1) | Total cash costs is a financial performance measure with no standardized meaning under US GAAP. For a full definition of total cash costs and a reconciliation to cost of sales, refer to page 73 of this MD&A. |
(2) | Total gold cash costs per ounce — full credit for non-gold sales is a financial performance measure with no standardized meaning under US GAAP. For further information and a detailed reconciliation of this measure, please see page 73 of this MD&A. |
(3) | Cash margins per ounce, is a non-GAAP measure used by management to assess the ability of our gold operations to generate operating cash flow and analyze profitability trends. It has no standardized meaning under US GAAP. For a full definition and calculation, please refer to page 76 of this MD&A. Assuming an average spot gold price in 2009 of $850, we expect to realize cash margins of about $375 to $400 per ounce. |
38
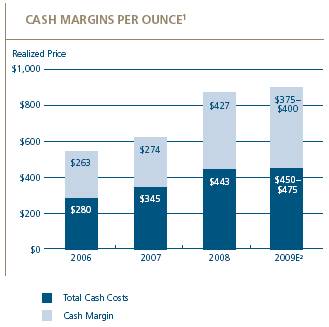
(1) | 2007 cash margins reflect a $76 per ounce (2006: $44 per ounce) impact from our voluntary deliveries into our Corporate Gold Sales Contracts. |
(2) | Assuming an average market gold price of $850 per ounce in 2009. |
Operational Overview
For the years ended |
|
|
|
|
|
|
|
|
|
December 31 |
| 2008 |
| 2007 |
| % Change |
| 2006 |
|
Gold |
|
|
|
|
|
|
|
|
|
Tons mined (millions) |
| 680 |
| 653 |
| 4 | % | 600 |
|
Ore tons processed (millions) |
| 191 |
| 172 |
| 11 | % | 157 |
|
Average grade (ozs/ton) |
| 0.047 |
| 0.055 |
| (15 | )% | 0.067 |
|
Recovery rate |
| 84.4 | % | 84.7 | % | (1 | )% | 82.3 | % |
Gold produced (000s/oz) |
| 7,657 |
| 8,060 |
| (5 | )% | 8,643 |
|
Copper |
|
|
|
|
|
|
|
|
|
Tons mined (millions) |
| 83,221 |
| 89,607 |
| (7 | )% | 92,342 |
|
Ore tons processed (millions) |
| 43,813 |
| 39,016 |
| 12 | % | 28,166 |
|
Average grade (percent) |
| 0.6 |
| 0.7 |
| (14 | )% | 0.10 |
|
Copper produced (millions/lbs) |
| 370 |
| 402 |
| (8 | )% | 367 |
|
Production
Gold production in 2008 was 403 thousand ounces or 5% lower than in 2007, reflecting lower production in Africa, Australia and North America, partially offset by higher production in South America. Copper production was 8% lower than the prior year period due to lower production from both Zaldívar and Osborne in 2008.
Tons Mined and Tons Processed – Gold
Total tons mined and tons processed increased by 4% and 11%, respectively, compared to 2007. The higher tons mined was mainly due to the increased waste stripping activity at Cowal following the East Wall slip and the acquisition of the additional 40% interest in Cortez. Higher tons processed resulted from increased material placed on the leach pad at Veladero and the impact of the acquisition of an additional 40% of Cortez in early 2008.

(1) | All amounts presented are based on equity production. |
39
Average Mill Head Grades – Gold
Average mill head grades decreased by approximately 15% in 2008 compared to the prior year, primarily due to mine sequencing that resulted in lower ore grades at certain mines. We were mining below our average reserve grade in 2008. In 2008, we continued to take advantage of the high gold price environment in order to process material that would otherwise be uneconomical in a lower gold price environment, thereby earning an operational contribution from low-grade material that would otherwise be classified as waste.
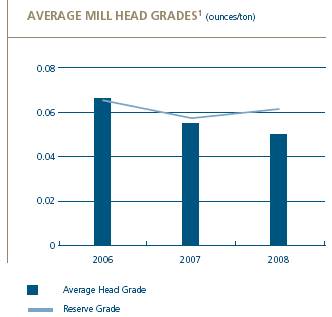
(1) | All amounts presented based on equity production. Average mill head grades are expressed as the number of ounces of gold contained in a ton of ore processed. Reserve grade represents expected grade over the life of the mine and is calculated based on reserves reported at the end of the immediately preceding year. |
Safety
In 2008, we achieved a reduction in the number of total injuries and lost time injuries, continuing a trend of year over year performance improvements. Lost time injuries are recorded when an employee or contractor takes time off the following day or shift following an incident. An incident-free work place is our vision. In addition, we are pleased to announce that seven producing sites achieved zero lost time injury rates in 2008, including Pascua-Lama which has achieved a total of 5 million hours worked with no lost time injury.
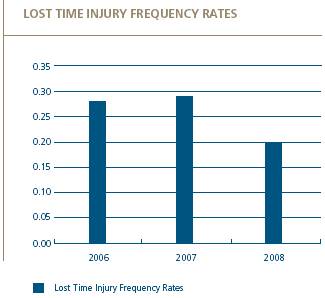
Reserves(4)
At year-end 2008, the Company added 23.0 million ounces, and after depletion of 9.1 million ounces, proven and probable gold reserves increased by 13.9 million ounces to 138.5 million ounces, the largest in the industry, based on an assumed $725 per ounce gold price. The increase reflects the inclusion of 10.8 million ounces attributable to our 51% ownership interest in Cerro Casale in proven and probable reserves; 1.2 million additional ounces at Pueblo Viejo, and 6.4 million ounces at Cortez reflecting 2.4 million ounces at the Cortez-Crossroads deposit and our additional 40% in ownership.
Measured and indicated gold mineral resources grew by 29% to 65.0 million ounces and inferred gold mineral resources grew 9% to 34.8 million ounces based on an $850 per ounce gold price. We recorded 2.3 million ounces in gold mineral resources for Cerro Casale. Reko Diq resources increased by 4.7 million ounces to 8.5 million ounces and Donlin Creek resources increased 3.1 million ounces to 17.7 million ounces at year end 2008. Measured and indicated resources in the Cortez Hills underground increased from 1.1 million ounces to 2.0 million ounces.
(4) | For a breakdown of reserves and resources by category and additional information relating to reserves and resources, see pages 141 to 148 of this Financial Report 2008. |
40
Copper reserves increased to 6.4 billion pounds and measured and indicated resources increased by 7.1 billion pounds to 12.5 billion pounds. Contained silver within reported gold reserves is over one billion ounces.
Replacing gold and copper reserves depleted by production year over year is necessary in order to maintain production levels over the long term. If depletion of reserves exceeds discoveries over the long term, then we may not be able to sustain gold and copper production levels. Reserves can be replaced by expanding known ore bodies, acquiring mines or properties or discovering new deposits. Once a site with gold or copper mineralization is discovered, it takes several years from the initial phases of drilling until production is possible, during which time the economic feasibility of production may change. Substantial expenditures are required to establish proven and probable reserves and to permit and construct mining and processing facilities.
Key Business Transactions
Acquisition of 40% interest in Cortez
On March 5, 2008, we completed our acquisition of the additional 40% interest in the Cortez property for a total cash consideration of $1.7 billion. The acquisition consolidates 100% ownership for Barrick of the existing Cortez mine and the Cortez Hills expansion.
Acquisition of Barrick Energy
In 2008, we acquired all the issued and outstanding shares of Cadence Energy Inc. for cash consideration of $377 million, as well as oil and gas assets at Sturgeon Lake, Alberta, from Daylight Resources Trust, for cash consideration of $83 million. Daylight’s Sturgeon Lake assets are adjacent to Cadence Energy’s Sturgeon Lake assets and the consolidated ownership will allow us to exploit and develop these assets. These acquisitions together comprise Barrick Energy, which was formed as part of our long-term strategy to economically hedge our exposure to oil prices.
Operating Segments Review
We report our results of operations using a geographical business unit approach: North America, South America, Australia Pacific and Africa. In addition, we have a Capital Projects segment, distinct from our regional business units, to focus on managing projects. This structure reflects how we manage our business and how we classify our operations for planning and measuring performance.
In our Financial Statements, we present a measure of historical segment income that reflects gold sales and copper sales at average consolidated realized gold and copper prices, respectively, less segment expenses and amortization of segment property, plant and equipment.
We monitor segment expenses and period to period fluctuations in our total cost of sales on a unit basis, per ounce of gold and per pound of copper, which is referred to as total cash costs. Therefore, the discussion of results for our producing mines focuses primarily on this statistic to explain changes in segment expenses.
North America
Key Operating Statistics
For the years ended |
|
|
|
|
|
|
|
|
| |||
December 31 |
| 2008 |
| 2007 |
| % Change |
| 2006 |
| |||
Tons mined (millions) |
| 360 |
| 335 |
| 7 | % | 274 |
| |||
Ore tons processed (millions) |
| 92 |
| 76 |
| 21 | % | 69 |
| |||
Average grade (ozs/ton) |
| 0.041 |
| 0.051 |
| (20 | )% | 0.045 |
| |||
Gold produced (000s/oz) |
| 3,028 |
| 3,201 |
| (5 | )% | 3,372 |
| |||
Cost of sales ($ millions) |
| $ | 1,517 |
| $ | 1,178 |
| 29 | % | $ | 1,039 |
|
Total cash costs (per oz) |
| $ | 493 |
| $ | 363 |
| 36 | % | $ | 310 |
|
Production for 2008 was 5% lower than the same prior year period due to lower production at Golden Sunlight, Eskay Creek, Turquoise Ridge, Round Mountain and Hemlo; partly offset by higher production at Cortez and Goldstrike.
At Goldstrike, production increased by 77 thousand ounces as a result of a 10% increase in average grade due to processing of higher grade ore as a result of the completion of a significant waste stripping phase in second quarter 2008. At Cortez, production increased by 105 thousand ounces compared to the prior year, primarily reflecting the acquisition of the remaining 40% interest in first quarter 2008. At Golden
41
Sunlight, production decreased by 78 thousand ounces as the mine entered into an extended period of waste stripping due to a mine expansion plan, which extends the mine life to 2015 and adds approximately 400 thousand ounces to proven and probable reserves. At Eskay Creek, planned production ended in late first quarter 2008, and reclamation and closure activities have commenced. At Turquoise Ridge, lower production resulted from the decision to place the Getchell mine on care and maintenance. At Round Mountain and Hemlo, production decreased due to an expected decline in ore tons processed and grade.
Cost of sales applicable to gold increased by $339 million, or 29%, and total cash costs per ounce increased by $130, or 36% compared to the same prior year period. The increase in cost of sales and total cash costs during the current year reflect higher input costs for diesel, propane and labor; higher royalties and production taxes; lower average grade at certain of our mines; and lower silver by-product credits due to the end of operations at Eskay Creek. In addition, total cash costs were impacted by lower production levels.
In 2009, we expect gold production in the range of 2.55 to 2.7 million ounces. Cost of sales applicable to gold is expected to be $1.3 to $1.5 billion, or on a total cash costs basis $520 to $550 per ounce. Production is expected to be lower than 2008 primarily due to lower processed grade and recovery rates of alkaline ore at Goldstrike; Golden Sunlight, where the mine will be entering into an extensive waste stripping phase and due to lower grades at Round Mountain; partially offset by higher production expected at Cortez. In 2008, we conducted tests using a modified pressure technology that would allow the autoclaves at Goldstrike to process alkaline ore that would have been previously treated at the roaster facility, thus extending the life of the autoclave and accelerating the production time-table for this type of ore. However, recovery percentages were lower than expected. Accordingly, expected production from alkaline ore in 2009 is approximately 400 thousand ounces lower than 2008. Cost of sales and total cash costs per ounce are expected to be slightly higher in 2009, mainly due to the impact of lower production levels.
Significant Projects – Cortez Hills
Cortez Hills entered construction in late November following receipt of the Record of Decision and is expected to enter production in the first quarter of 2010, assuming satisfactory resolution of pending litigation regarding the project. In fourth quarter 2008, a number of opponents of the Cortez Hills expansion filed suit in the United States District Court for the District of Nevada seeking to overturn the Bureau of Land Management’s approval of the Cortez Hills project on environmental and religious grounds. The plaintiffs unsuccessfully sought to enjoin construction of the project pending consideration of their claims. The District Court’s denial of the requested injunction is currently being appealed.
Pre-stripping work is currently underway on the open pit along with work on the conveyor, crusher, workshops and access roads. Once completed, the Cortez Hills project is expected to become a key, long life, low cost mine. Total construction costs remain in line with the pre-production capital budget of approximately $500 million. In addition to the original scope of work, we have accelerated our underground development schedule. To date, we have spent $40 million, and we expect to spend an additional $50 to $80 million advancing underground development in the following twelve months. The expanded Cortez operation is expected to have average production of about 1.0 million ounces at total cash costs of about $350 to $400(5) per ounce in its first full five years of production. Total cash costs in the current plan reflect the inclusion of incremental lower grade heap leach ore from the Pipeline area due to a higher gold price assumption, and the associated costs for labor, consumables and stripping. Higher proven and probable reserves of 13.3 million ounces at year-end 2008 for Cortez reflect the 40% interest acquired earlier in the year plus an additional 2.4 million ounces in the Crossroads area. Measured and indicated resources in the Cortez Hills underground increased from 1.1 million ounces to 2.0 million ounces. The Cortez property continues to demonstrate significant exploration potential. As a follow up to the successful 2008 work program, the Company plans to spend $18 million on exploration at Cortez with a total of seven rigs being committed to this extensive, underexplored property in 2009.
(5) Based on an oil price of $75 per barrel and life of mine HFO power.
42
South America
Key Operating Statistics
For the years ended |
|
|
|
|
|
|
|
|
| |||
December 31 |
| 2008 |
| 2007 |
| % Change |
| 2006 |
| |||
Gold |
|
|
|
|
|
|
|
|
| |||
Tons mined (millions) |
| 151 |
| 151 |
| 0 | % | 168 |
| |||
Ore tons processed (millions) |
| 65 |
| 59 |
| 10 | % | 53 |
| |||
Average grade (ozs/ton) |
| 0.037 |
| 0.042 |
| (12 | )% | 0.054 |
| |||
Gold produced (000s/oz) |
| 2,111 |
| 2,079 |
| 2 | % | 2,104 |
| |||
Cost of sales ($ millions) |
| $ | 531 |
| $ | 400 |
| 33 | % | $ | 305 | �� |
Total cash costs (per oz) |
| $ | 251 |
| $ | 193 |
| 30 | % | $ | 147 |
|
Copper |
|
|
|
|
|
|
|
|
| |||
Copper produced (millions of lbs) |
| 295 |
| 315 |
| (6 | )% | 308 |
| |||
Cost of sales ($ millions) |
| $ | 315 |
| $ | 231 |
| 36 | % | $ | 282 |
|
Total cash costs (per lb) |
| $ | 1.08 |
| $ | 0.69 |
| 57 | % | $ | 0.62 |
|
Gold production levels in 2008 were up slightly from the prior year period as an increase in tons processed was partially offset by lower average grades. At Veladero, production was up 62 thousand ounces, or 13% compared to the same prior year period, primarily as a result of a 19% increase in ore placed on the leach pad. Lagunas Norte continued to deliver strong results, with production totaling 1,175 thousand ounces, 18% higher than the prior year. These increases were partially offset by a decrease in production of 120 thousand ounces at Pierina as a result of the planned mining of lower grade ore as the mine nears the end of its economic life.
Cost of sales applicable to gold was $531 million, an increase of $131 million or 33% compared to the same prior year period. Total cash costs per ounce increased by $58 per ounce to $251 per ounce in 2008. The increase in cost of sales and total cash costs is largely due to increased production at our higher cost Veladero mine, which contributed $45 per ounce of the overall increase in total cash costs; higher input costs for consumables and labor used in the production process; higher maintenance expenditures; and higher costs for consumables used within the production process compared to the prior year.
In 2009, we expect gold production in the range of 1.95 to 2.06 million ounces. Cost of sales applicable to gold is expected to be about $550 to $640 million, or $285 to $310 per ounce on a total cash costs basis. Production is expected to be slightly lower than 2008, as higher production at Veladero is expected to be offset by lower production at Pierina. As a result of this production mix, we expect cost of sales and total cash costs per ounce to be higher in 2009.
In 2008, Zaldívar produced 295 million pounds of copper at an applicable cost of sales of $315 million or $1.08 per pound on a total cash costs basis. Lower production compared to the prior year reflects lower tonnage placed on the leach pad and the realization of lower overall recovery rates as a result of poor leaching kinetics due to shortages in the supply of sulfuric acid experienced in 2008. We expect production to increase to a range of 305 to 320 million pounds in 2009 due to higher expected recovery rates reflecting the resolution of sulfuric acid supply constraints. Cost of sales applicable to copper and total cash costs per pound in 2008 were impacted by the increased cost of fuel and acid, along with inflationary pressures on labor and consumables, and higher electricity prices resulting from the transition to a new higher-cost power contract in mid-2008. We expect 2009 cost of sales applicable to copper to be in the range of $350 million to $400 million, and total cash costs to be in the range of $1.15 to 1.25 per pound.
Australia Pacific
Key Operating Statistics
For the years ended |
|
|
|
|
|
|
|
|
| |||
December 31 |
| 2008 |
| 2007 |
| % Change |
| 2006 |
| |||
Gold |
|
|
|
|
|
|
|
|
| |||
Tons mined (millions) |
| 147 |
| 144 |
| 2 | % | 137 |
| |||
Ore tons processed (millions) |
| 29 |
| 33 |
| (12 | )% | 30 |
| |||
Average grade (ozs/ton) |
| 0.077 |
| 0.078 |
| (1 | )% | 0.087 |
| |||
Gold produced (000s/oz) |
| 1,942 |
| 2,123 |
| (9 | )% | 2,220 |
| |||
Cost of sales ($ millions) |
| $ | 1,051 |
| $ | 934 |
| 13 | % | $ | 749 |
|
Total cash costs (per oz) |
| $ | 550 |
| $ | 447 |
| 23 | % | $ | 350 |
|
Copper |
|
|
|
|
|
|
|
|
| |||
Copper produced (millions of lbs) |
| 75 |
| 87 |
| (14 | )% | 59 |
| |||
Cost of sales ($ millions) |
| $ | 121 |
| $ | 108 |
| 12 | % | $ | 109 |
|
Total cash costs (per lb) |
| $ | 1.64 |
| $ | 1.36 |
| 21 | % | $ | 1.52 |
|
43
Total gold production in 2008 was 9% lower than the same prior year period as a result of lower gold production at Kanowna, Yilgarn South(6), Plutonic and Cowal, partially offset by increased production at Porgera.
At Kanowna, production decreased primarily due to decreased processing of open pit material due to the disposition of the Paddington mill in August 2007. In the latter half of 2008, Kanowna transitioned to an underground mining operation. The decrease in production at Plutonic was primarily due to stope sequencing and mine planning issues resulting from blocked paste holes and a backlog of paste requirements. Production was also impacted by an explosion at the Varanus gas processing facility in June 2008, which resulted in the temporary closure of the mill. Yilgarn South production levels were primarily impacted by lower ore feed at Granny Smith as the processing of open pit material ended in early 2008. This decrease was partially offset by the ramp-up of underground operations in the second half of the year. At Cowal, the East Wall slip in December 2007 restricted access to high grade ore in the first half of the year which resulted in the mining of lower grade ore. Access to higher grade ore and increased throughput rates partially improved overall recovery rates in the latter part of the year. At Porgera, production levels benefited from the 20% increase in ownership to 95% and the mining of higher grade ore from both the open pit and underground mine.
Cost of sales applicable to gold was higher by $117 million, or 13% compared to the prior year. Total cash cost per ounce increased by 23% or $103 per ounce compared to the same prior year period. The increase in cost of sales and total cash costs is due to the impact of higher diesel, commodity and consumables prices, primarily at Plutonic where gas was temporarily sourced from higher cost suppliers; increased labor rates; slightly higher currency hedge rates; and higher maintenance costs at Cowal coupled with the ongoing remediation work related to the East Wall. We are approximately 95% hedged in 2009 for expected Australia operating expenditures at a rate of $0.76. In addition, we have a 90% hedge on expected 2010 Australian operating expenditures at a rate of $0.80.
In 2009, we expect gold production in the range of 1.85 to 2.0 million ounces as a result of higher expected production at Cowal as completion of the remediation activities of the East Wall provides access to higher grade ore; and at Kalgoorlie and Plutonic where production is expected to increase based on improved ore grades, equipment availability and the resolution of natural gas supply issues from the gas explosion in 2008; partially offset by lower expected production at Porgera attributable to lower tons processed due to a scheduled maintenance shut down of the ball mill for a major overhaul. Cost of sales is expected to be about $1.1 to $1.2 billion. Total cash costs are expected to be in the range of $580 to $610 per ounce due to labor rate increases, higher royalty costs and increased costs related to diesel consumption and maintenance due to fleet expansion at Kalgoorlie.
At Osborne, copper production decreased by 14% to 75 million pounds from 87 million in the prior year, at cash costs of $1.64 per pound compared to $1.36 per pound in the prior year. Cost of sales applicable to copper increased by $13 million, or 12% compared to the prior year. Production was impacted by the hanging wall issues of the underground mine encountered during the year restricting access to higher grade material. Production levels in 2009 are expected to range from 70 to 80 million pounds with total cash costs of $1.50 to 1.70 per pound. Cost of sales applicable to copper is expected to be in the range of $105 to $140 million.
Africa
Key Operating Statistics
For the years ended |
|
|
|
|
|
|
|
|
| |||
December 31 |
| 2008 |
| 2007 |
| % Change |
| 2006 |
| |||
Tons mined (millions) |
| 22 |
| 23 |
| (4 | )% | 21 |
| |||
Ore tons processed (millions) |
| 4 |
| 4 |
| 0 | % | 5 |
| |||
Average grade (ozs/ton) |
| 0.154 |
| 0.165 |
| (7 | )% | 0.188 |
| |||
Gold produced (000s/oz) |
| 545 |
| 605 |
| (10 | )% | 914 |
| |||
Cost of sales ($ millions) |
| $ | 327 |
| $ | 293 |
| 12 | % | $ | 226 |
|
Total cash costs (per oz) |
| $ | 560 |
| $ | 405 |
| 38 | % | $ | 312 |
|
(6) | Effective first quarter 2008, the Darlot, Lawlers, and Granny Smith mines are being managed as a single unit (Yilgarn South), with shared administrative services in order to achieve operational and administrative efficiencies. |
44
Total gold production in 2008 decreased by 10% compared to the prior year. At North Mara, production was impacted by equipment availability issues resulting from the excavator fire in January and disruption due to local civil disturbances. At Bulyanhulu, lower staffing levels in the first half of the year due to the illegal strike in fourth quarter 2007 led to delays in underground mining activities and limited our ability to access higher grade areas of the ore body. We returned to normal staffing levels in the second half of 2008 and have continued to train the workforce in order to increase future productivity. At Tulawaka, production decreased 18% compared to the prior year as higher grade open pit operations came to an end in September and the start of underground mining was delayed due to ventilation, remodeling and training issues resulting in a revised mine plan.
Cost of sales applicable to gold increased by $34 million, or 12%, and total cash costs per ounce for the region in 2008 were 38% higher than the prior year. Total cash costs per ounce increased primarily due to lower production driven by lower throughput and recoveries at our higher cost mines. Cost of sales and total cash costs were also impacted by higher input costs due to inflationary pressures on labor, commodities, and consumables and lower copper by-product credits at Bulyanhulu due to lower production levels.
In 2009, we expect gold production in the range of 0.71 to 0.8 million ounces. We expect cost of sales applicable to gold to be in the range of $315 to $395 million, or $445 to $495 per ounce on a total cash costs basis. Production is expected to increase primarily due to the commencement of mining operations at Buzwagi in the second quarter and higher production expected at Bulyanhulu due to ongoing training to increase mining productivity, partially offset by lower production expected at Tulawaka due to the ceasing of open pit operations in third quarter 2008. Cost of sales and total cash costs per ounce are expected to be lower in 2009, reflecting the increase in production levels, and inclusion of lower cost Buzwagi production.
Capital Projects
Key Operating Statistics
($ millions) |
|
|
|
|
|
|
| |||
For the years ended December 31 |
| 2008 |
| 2007 |
| 2006 |
| |||
Project expense |
| $ | 185 |
| $ | 173 |
| $ | 111 |
|
Project expense incurred by equity investees |
| 69 |
| 14 |
| — |
| |||
Total project expense |
| 254 |
| 187 |
| 111 |
| |||
Capital expenditures(1) |
| 584 |
| 169 |
| 211 |
| |||
Capital commitments |
| $ | 552 |
| $ | 159 |
| $ | 117 |
|
(1) | Amounts presented represent our share of capital expenditures on a cash basis, and exclude expenditures incurred at our Cortez property (2008: $155 million, 2007: $75 million, and 2006: $47 million) which is not managed by the Capital Projects group. |
We spent $254 million in project expenses and $584 million (our share) in capital expenditures in 2008. Project expenses primarily relate to activities undertaken to advance the Pueblo Viejo ($62 million), Kainantu ($28 million), Pascua-Lama ($21 million) and Fedorova ($24 million) projects. Capital expenditures are mainly attributable to our Buzwagi, Pueblo Viejo and Pascua-Lama projects. We expect capital expenditures to increase in 2009 as construction activities at these three capital projects ramp up.
Project expenses incurred by equity investees reflect our share of expenditures related to the Reko Diq, Cerro Casale and Donlin Creek projects.
Overview
The recent volatility and decline in prices for gold, copper, silver, platinum group metals, energy, foreign currencies, input commodities and consumables, steel and Engineering Procurement Construction Management (EPCM) services could have a significant impact on the pre-production capital costs, operating costs as well as the overall development timeframe of our capital projects. Certain changes such as the decline in the price of precious and base metals may have negative impacts, while others, such as the decline in prices for input commodities and consumables, the strengthening of the US dollar and the increased availability and reduced cost of EPCM services may have positive impacts. In addition, the sharp contraction in credit markets could result in higher financing costs if these conditions persist for an extended period of time and could also impact our project development schedules.
45
The impact of a continuation of the present economic environment for commodity prices and credit markets is also potentially significant to our early stage projects.
The significant decrease in platinum group metals prices in fourth quarter 2008 has negatively impacted the economics of some of our projects, including Sedibelo and Fedorova. Similarly, the significant decline in nickel prices has impacted the viability of our Kabanga project. We are currently reviewing the project economics and timelines for these projects with a view towards optimizing our development schedule in light of the market environment. We will also need to consider the views of our partners on the projects.
Projects
The Buzwagi project in Tanzania was 90% complete at year end and is on schedule to pour first gold in second quarter 2009 in line with its pre-production capital budget of about $400 million, contributing about 200 thousand ounces in 2009 at total cash costs of about $320 to $335(7) per ounce.
The Pueblo Viejo project in the Dominican Republic is advancing on schedule and within its preproduction capital budget of approximately $2.7 billion (100% basis)(8), with initial production anticipated in the fourth quarter of 2011. Barrick’s 60% share of annual gold production in the first full five years of operation is expected to be about 600 to 650 thousand ounces at total cash costs of about $275 to $300(7) per ounce. Pueblo Viejo is a long life asset with an expected mine life of over 25 years and we continue to find new reserves.
At Pascua-Lama, the majority of remaining key sectoral permits, including water rights, have been granted by the government of San Juan province in Argentina. Progress was made on certain fiscal matters at the federal level; however, the resolution of cross-border taxation between Chile and Argentina remains outstanding. Work is ongoing, including project optimization, to finalize project economics. The mix of silver and gold production provided for in the mine plan and assumed silver prices will significantly impact estimated total cash costs. Subject to resolution of cross-border taxation and other matters, we expect to provide updated details on the project economics in second quarter 2009.
At Donlin Creek, a large, undeveloped, refractory gold deposit in Alaska, a preferred design for the Donlin Creek project has been identified and a feasibility study update continues on schedule for completion by the first quarter 2009 after which it may be approved or subject to further update. The project is expected to have a throughput design of approximately 50 thousand tonnes per day using onsite diesel and wind cogeneration for power. Pre-permitting activities are underway concurrent with the feasibility study update.
At Sedibelo, a platinum project in South Africa, regulatory approval was obtained enabling the transfer of the initial 10% stake in the property following the completion of a bankable feasibility study in 2008. During fourth quarter, the right to mine was granted by the Department of Minerals and Energy which expires in June 2009 if mining related activities have not commenced.
Reko Diq is a large copper-gold porphyry mineral deposit on the Tethyan belt, located in southwest Pakistan in the province of Baluchistan. The project feasibility study remains on schedule and is expected to be completed in the second half of 2009.
At Cerro Casale, one of the world’s largest undeveloped gold and copper deposits located in the Maricunga district of Region III in Chile, 145 km southeast of Copiapo, the pre-feasibility study was completed and indicated positive returns. We expect to complete a full feasibility study by the end of third quarter 2009.
Kabanga is one of the world’s largest undeveloped nickel sulfide deposits located in Tanzania. Xstrata Nickel earned a 50% interest in the project under the earn-in agreement during the quarter. All future expenditures will be funded equally by Xstrata Nickel and Barrick. We are committed to completing the final phase of the feasibility in 2009 at an expected cost of $40 million (100% basis).
(7) | Based on an oil price of $75 per barrel and life of mine HFO power. |
(8) | Pre-production, followed by $0.3b to complete phased expansion to 24,000 tpd. |
46
Review of Significant Operating Expenses
Exploration Expense
($ millions) |
|
|
|
|
|
|
|
|
| |||
For the years ended December 31 |
| 2008 |
| 2007 |
| 2006 |
| Comments on significant trends and variances |
| |||
Exploration |
|
|
|
|
|
|
|
|
| |||
North America |
| $ | 69 |
| $ | 66 |
| $ | 61 |
| Mainly due to higher costs incurred at Cortez ($11 million), partially offset by lower costs incurred at Goldstrike ($3 million) and the Grace Property ($5 million) compared to the prior year. |
|
South America |
| 40 |
| 33 |
| 22 |
| Mainly due to higher activity at Lagunas Norte ($4 million) and Zaldívar ($3 million). The increase in 2007 over 2006 was due to higher activity at Lagunas Norte and Zaldívar. |
| |||
Australia Pacific |
| 52 |
| 46 |
| 44 |
| Mainly due to higher activity at Osborne ($8 million) partially offset by Granny Smith ($2 million). |
| |||
Africa |
| 18 |
| 15 |
| 22 |
| No significant change from the prior year. |
| |||
Capital Projects/Global Exploration |
| 25 |
| 11 |
| 3 |
| Mainly due to higher activity at Kainantu ($10 million) and the Pinson Property ($7 million) partially offset by lower expenditures at Pueblo Viejo ($3 million). |
| |||
Other |
| 12 |
| 8 |
| 19 |
| No significant change from 2007. Lower expenditures in 2007 compared to 2006 were mainly due to the sale of exploration properties to Highland and discontinuation of active exploration in China and Turkey. |
| |||
Total |
| $ | 216 |
| $ | 179 |
| $ | 171 |
|
|
|
Project Development Expense
($ millions) |
|
|
|
|
|
|
|
|
| |||
For the years ended December 31 |
| 2008 |
| 2007 |
| 2006 |
| Comments on significant trends and variances |
| |||
Mine development |
| $ | 150 |
| $ | 151 |
| $ | 96 |
| In 2008, higher expenditures at Kainantu ($27 million) and Fedorova ($5 million) were largely offset by lower expenditures at Donlin Creek ($33 million). The increase in 2007 over 2006 was due to increased development activities at Pueblo Viejo (increase of $42 million), and Sedibelo (increase of $12 million), partially offset by Donlin Creek (decrease of $5 million). |
|
Non-capitalizable project costs |
| 51 |
| 32 |
| 15 |
| Non-capitalizable costs mainly represent items incurred in the development/construction phase that cannot be capitalized. 2008 expenditures increased due to additional spending at the Pinson Property ($17 million) and Cortez Hills ($2 million). The increase in 2007 over 2006 was due to an increase at Sedibelo ($11 million), Porgera ($4 million) and South Arturo ($2 million). |
| |||
Business development/other |
| 41 |
| 5 |
| 8 |
| Higher expenses in 2008 reflect an increase in costs related to reserve development ($8 million), corporate development projects ($4 million), research and development spending ($8 million), information technology related to our projects ($7 million) and corporate efficiency programs such as the Business Process Improvement project ($5 million). |
| |||
Total |
| $ | 242 |
| $ | 188 |
| $ | 119 |
|
|
|
47
Amortization Expense
($ millions) |
|
|
|
|
|
|
|
|
| |||
For the years ended December 31 |
| 2008 |
| 2007 |
| 2006 |
| Comments on significant trends and variances |
| |||
Gold mines |
|
|
|
|
|
|
|
|
| |||
North America |
| $ | 350 |
| $ | 314 |
| $ | 247 |
| Lower amortization reflects lower sales volumes across all our regions, an increase in reserve estimates at Pierina resulting in reduced amortization rates and lower amortization incurred at Eskay Creek, which is no longer in production, partially offset by higher amortization at Cortez with the additional 40% ownership and a full year of the additional ownership in Porgera compared to 2007. |
|
South America |
| 165 |
| 234 |
| 127 |
| |||||
Australia Pacific |
| 258 |
| 239 |
| 186 |
| |||||
Africa |
| 62 |
| 78 |
| 88 |
| |||||
Copper mines |
|
|
|
|
|
|
|
|
| |||
South America |
| 66 |
| 80 |
| 51 |
| Lower amortization in South America reflects lower copper sales volumes in 2008 as well as an increase in reserves at Zaldívar compared to the prior year. Higher amortization in Australia is mainly due to a decrease in the reserve base at Osborne compared to the prior year. |
| |||
Australia Pacific |
| 57 |
| 39 |
| 17 |
| |||||
Sub-total |
| $ | 958 |
| $ | 984 |
| $ | 716 |
|
|
|
Other |
| 32 |
| 20 |
| 19 |
| Reflects amortization of corporate assets and the additional amortization related to Barrick Energy. |
| |||
Total |
| $ | 990 |
| $ | 1,004 |
| $ | 735 |
|
|
|
Impairment Charges, Write-down of Investments, Corporate Administration, Interest Income and Interest Expense
($ millions) |
|
|
|
|
|
|
|
|
| |||
For the years ended December 31 |
| 2008 |
| 2007 |
| 2006 |
| Comments on significant trends and variances |
| |||
Impairment charges |
| $ | 749 |
| $ | 42 |
| $ | 17 |
| Impairment charges in 2008 reflect the charges taken for goodwill ($678 million) and impairments of long-lived assets ($71 million). Refer to page 65 of this MD&A for further information on goodwill impairment charges. |
|
Write-down of investments |
| 205 |
| 23 |
| 6 |
| In 2008, we recorded an impairment charge on our investment in Highland Gold ($140 million), on Asset-Backed Commercial Paper ($39 million) which was subsequently reversed into Other Income, and various other investments in junior gold mining companies ($26 million). In 2007, we recorded an impairment charge on Asset Backed Commercial Paper of $20 million. |
| |||
Corporate administration |
| 155 |
| 155 |
| 142 |
| No significant change from the prior year. The increase in 2007 over 2006 was due to the strengthening of the Canadian dollar vs. the US dollar as costs are primarily in Canadian dollars. |
| |||
Interest income |
| 39 |
| 141 |
| 110 |
| Decrease is mainly due to lower average cash balances in 2008. |
| |||
Interest expense |
|
|
|
|
|
|
|
|
| |||
Total incurred |
| 243 |
| 237 |
| 251 |
| Slight increase in 2008 reflects additional interest incurred as part of the bond issuance in third quarter 2008 used to repay the drawdown of $990 million credit facility to finance the additional 40% interest in Cortez, partially offset by lower interest payments due to the repayment of $500 million, 7.5% debentures in 2007 and lower interest on Veladero financing in 2008. |
| |||
Capitalized |
| 222 |
| 124 |
| 102 |
| Higher costs capitalized in 2008 related to Cortez Hills ($40 million), Cerro Casale ($41 million), Buzwagi ($11 million), Kainantu ($7 million) and Pueblo Viejo ($3 million) partially offset by a decrease at Pascua-Lama ($4 million). |
| |||
Interest expense allocated to discontinued operations |
| — |
| — |
| 23 |
| Interest expense in 2006 related to South Deep. |
| |||
Expensed |
| $ | 21 |
| $ | 113 |
| $ | 126 |
|
|
|
48
Income Tax
(percentages) |
|
|
|
|
|
|
|
For the years ended December 31 |
| 2008 |
| 2007 |
| 2006 |
|
Effective tax rate on ordinary income |
| 30 | % | 28 | % | 23 | % |
Impairment charges |
| 13 | % | 1 | % | — |
|
Net currency translation (gains)/losses on deferred tax balances |
| 5 | % | (4 | )% | (1 | )% |
Deliveries into Corporate Gold Sales Contracts |
| — |
| 7 | % | 4 | % |
Canadian tax rate changes |
| — |
| 3 | % | 1 | % |
Release of deferred tax valuation allowances |
| (7 | )% | (12 | )% | (3 | )% |
Impact of change in Australian tax status |
| — |
| — |
| (2 | )% |
Actual effective tax rate |
| 41 | % | 23 | % | 22 | % |
Our effective tax rate on ordinary income increased from 28% to 30% in 2008 primarily due to higher market gold prices, the impact of changes in the mix of production, and on the mix of taxable income in the various tax jurisdictions where we operate. In 2007 we released valuation allowances totaling $156 million in Tanzania due to the impact of higher market gold prices on expected levels of taxable income in Tanzania.
Currency Translation
Deferred tax balances are subject to remeasurement for changes in currency exchange rates each period. The most significant balances are Canadian deferred tax assets with a carrying amount of approximately $334 million and Australian and Papua New Guinea net deferred tax liabilities with a carrying amount of approximately $118 million. In 2007, the appreciation of the Canadian and Australian dollar against the US dollar resulted in net translation gains arising totaling $76 million. These gains are included within deferred tax expense/recovery. In 2008, following the strengthening of the US dollar, we recorded translation losses of $98 million.
In fourth quarter 2008, Barrick Gold Corporation filed an election under Canadian draft legislation to prepare its Canadian tax return using US dollars as the functional currency effective 2008. Upon the expected enactment of the legislation in early 2009, we will be recording a one-time benefit of approximately $50 to $60 million.
Canadian Tax Rate Changes
In the second and fourth quarters of 2007 and the second quarter of 2006, federal rate changes were enacted in Canada that lowered the applicable tax rate. The impact of this tax rate change was to reduce net deferred tax assets in Canada by $64 million in 2007 and $35 million in 2006 which are recorded as a component of deferred income tax expense in the respective year. Also, in second quarter 2006, due to a change in the tax status of a Canadian subsidiary, we recorded a deferred income tax credit of $23 million to reflect the impact on the measurement of deferred income tax assets and liabilities.
Change in Tax Status in Australia
In first quarter 2006, an interpretative decision (“ID”) was issued by the Australia Tax Office that clarified the tax treatment of currency gains and losses on foreign denominated liabilities. Under certain conditions, for taxpayers who have made the functional currency election, and in respect of debt that existed at the time the election was made, the ID provided clarification that unrealized foreign exchange gains that currently exist on inter-company debt will not crystallize upon repayment of the debt. The effect of the ID was recorded as a $31 million reduction of deferred tax liabilities.
49
Financial Outlook
2009 Guidance
|
| 2008 |
| 2009 |
|
|
| Actual |
| Guidance |
|
Gold |
|
|
|
|
|
Production (millions of ounces) |
| 7.7 |
| 7.2–7.6 |
|
Cost of sales |
| $3,426 |
| $3,200–$3,600 |
|
Total cash costs ($ per ounce) |
| $ 443 |
| $450–$475 |
|
Total cash costs – full credit non-gold sales ($ per ounce) |
| $ 337 |
| $360–$385 |
|
Amortization ($ per ounce) |
| 115 |
| $115–$120 |
|
Copper |
|
|
|
|
|
Production (millions of pounds) |
| 370 |
| 375–400 |
|
Cost of sales |
| $ 436 |
| $470–$540 |
|
Total cash costs ($ per pound) |
| $ 1.19 |
| $1.25–$1.35 |
|
Amortization ($ per pound) |
| $ 0.33 |
| $0.20–$0.25 |
|
Corporate administration |
| $ 155 |
| $160 |
|
Exploration expense |
| $ 216 |
| $150–$160 |
|
Project expense(1) (including equity pick-up) |
| $ 229 |
| $250–$270 |
|
Other expense |
| $ 295 |
| $200 |
|
Interest income |
| $ 39 |
| $10 |
|
Interest expense |
| $ 21 |
| $30 |
|
Capital expenditures – sustaining |
| $ 890 |
| $750–$850 |
|
Capital expenditures – projects(2) |
| $ 937 |
| $1,300–$1,500 |
|
Effective income tax rate |
| 30 | % | 30 | % |
1. Represents Barrick’s share of expenditures. For US GAAP purposes, 100% of expenditures are recorded in project expense with a non-controlling interest credit for our partners’ share. In 2009, project expenditures are expected to be in the range of $350 to $$370 million, less $100 million attributable to our partner’s share.
2. Represents Barrick’s share of expenditures including capitalized interest of about $215 million. For US GAAP purposes, capital expenditures are recorded on a 100% basis, with funding from our partners for their share of expenditures recorded as an inflow in other financing activities in the consolidated statement of cash flows. In 2009, capital expenditures – projects is expected to be in the range of $1.7 to $1.9 billion including our partner’s share of $400 million as well as capitalized interest of approximately $250 million. Our 2009 guidance range could increase depending upon progress at Pascua-Lama.
Outlook Assumptions and Economic Sensitivity Analysis
|
| 2009 |
|
|
| |
|
| Guidance |
|
|
| |
Sensitivity |
| Assumption |
| Comments |
| |
Market gold price impact on reported revenues |
| $ | 850/oz |
| A $50/oz increase/decrease in the market gold price causes reported revenues to increase/decrease by $365 million, assuming production at the mid-point of our 2009 guidance range. |
|
|
|
|
|
|
| |
Crude oil price impact on cost of sales |
| $ | 50/bbl |
| In 2009, we are largely protected against movements in the market price for oil due to the combination of our financial fuel contracts and our Barrick Energy production, which together provide us with an economic hedge against rising oil prices. |
|
2009 Guidance Analysis
Production
We prepare estimates of future production based on mine plans that reflect the expected method by which we will mine reserves at each mine. Actual gold and copper production may vary from these estimates due to a number of operational factors, including if the volume and/or grade of ore mined differs from estimates, which could occur because of: changing mining rates; ore dilution; varying metallurgical and other ore characteristics; and short-term mining conditions that require different sequential development of ore bodies or mining in different areas of the mine. Certain non-operating factors, including litigation risk, regulatory environment and the impact of global economic conditions may also cause actual production to vary from guidance. Mining rates are also impacted by various risks and hazards inherent at each operation, including natural phenomena, such as inclement weather conditions, floods and earthquakes, and unexpected civil disturbances, labor shortages or strikes.
We expect 2009 gold production of about 7.2 to 7.6 million ounces and copper production of about 375 to 400 million pounds. Lower gold production is expected primarily in North America as a result of lower production at Goldstrike, Ruby Hill, and Golden Sunlight, partly offset by increased production in Africa as production at Buzwagi is expected to begin in second quarter 2009. Production in South America and Australia is expected to be similar to 2008 levels. Production and cash costs during the year are expected to vary due to mine sequencing. As a result, first quarter operating performance is anticipated to be weaker with expected improvement throughout the remainder of the year reflecting the ramp up at Buzwagi, the crusher expansion at Veladero and higher expected grades from both Veladero and Lagunas Norte.
Beyond 2009, we expect gold production in 2010 to increase to about 7.7 to 8.1 million ounces with the production startup of Cortez Hills, at expected lower cash costs.
50
Cost of Sales and Total Cash Costs
We prepare estimates of cost of sales and total cash costs based on expected costs associated with mine plans that reflect the expected method by which we will mine reserves at each mine. Cost of sales and total cash costs per ounce/pound are also affected by ore metallurgy that impacts gold and copper recovery rates, labor costs, the cost of mining supplies and services, foreign currency exchange rates and stripping costs incurred during the production phase of the mine. In the normal course of our operations, we attempt to manage each of these risks to mitigate where possible, the effect they have on our operating results. The following table provides a reconciliation of our cost of sales guidance to our total cash costs guidance.
Reconciliation of Cost of Sales Guidance to Total Cash Costs per Ounce/Pound Guidance
|
| Gold |
| Copper |
|
Cost of sales ($ millions) |
| $3,200–$3,600 |
| $470–$540 |
|
Production (millions of ounces/lbs) |
| 7.2–7.6 |
| 375–400 |
|
Total cash costs ($ per ounce/per lb) |
| $450–$475 |
| $1.25–$1.35 |
|
Expected copper margin per ounce ($ per ounce) |
| $90 |
| — |
|
Total cash costs on a full non-gold sales basis ($ per ounce) |
| $360–$385 |
| — |
|
Cost of sales applicable to gold is expected to be in the range of $3.2 billion to $3.6 billion, and cost of sales applicable to copper is expected to be about $470 million to $540 million. Total cash costs are expected to be in the range of $450 to $475 per ounce, $360 to $385 per ounce on a full non-gold sales basis, and $1.25 to $1.35 per pound for copper. Gold total cash costs in 2009 are forecast to be about 4% higher than 2008 primarily due to lower production levels as a result of a decrease in gold recovery rates; an increase in waste tons mined; and lower silver and copper by-product credits as a result of decreases in realized prices and the closure of Eskay Creek in first quarter 2008. These cost increases are expected to be partially offset by lower royalties and production taxes and lower energy costs. Total cash costs and total cash costs on a full credit non-gold sales basis for 2009 include currency/fuel hedge opportunity losses totaling about $30 per ounce based on a spot oil price assumption of $50 per barrel (WTI) and a US dollar to Australian dollar exchange rate assumption of $0.70.
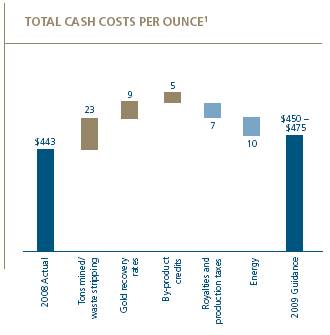
(1) Chart depicts approximate impacts of each category on total cash costs per ounce.
Total cash costs for copper are expected to be approximately $0.06 to $0.16 per pound higher than 2008, primarily as a result of increased costs for electricity and acid at Zaldívar. Total cash costs in 2009 include currency/fuel hedge losses of about $0.04 per pound.
Exploration
Lower costs are expected in 2009 primarily due to reduced global exploration activities due to a focus on more near-term opportunities and mine site exploration expenditures at Kanowna, Osborne, Round Mountain, Zaldívar, and Lagunas Norte.
Project Expenses
Project expenses are classified under a combination of project expenses and equity method investments on our income statement. In aggregate, we expect to expense approximately $250 to $270 million for our share of expenditures in 2009. In 2009, our expected project expenses are primarily attributable to our commitment to complete the feasibility studies at Reko Diq, Cerro Casale, Donlin Creek and Kabanga, as well as the development costs associated with the extension of the mine life at Golden Sunlight.
51
The timing of the funding for project expenditures through equity method investments and the subsequent expense recognition vary. The funding is initially recorded as an increase in the carrying amount of our investment. Our share of expenses is recognized as amounts are spent on the projects through “equity investees” in our consolidated statement of income.
Other Expense
The decrease in other expenses is primarily due to non-hedge derivative losses and currency translation losses recorded in 2008, which are not included in our estimated 2009 guidance.
Interest Income and Interest Expense
We expect lower interest income in 2009 primarily due to lower market interest rates and lower average cash balances. We expect higher interest expense in 2009 mainly due to an increase in net debt outstanding of $689 million.
Capital Expenditures
Projects
The expected increase in capital expenditures is mainly due to higher expenditures at the Pueblo Viejo, Cortez Hills, and Pascua-Lama projects, partly offset by the completion of the Buzwagi project. At the Pueblo Viejo and Cortez Hills projects, construction activities are expected to accelerate significantly in 2009.
Sustaining Capital
Sustaining capital expenditures for the mine sites as well as the corporate office and RBU offices are expected to be in line with the 2008 expenditure levels.
Income Tax Rate
Our expected effective tax rate excludes the impact of currency translation gains/losses and changes in tax valuation allowances. We do not anticipate any signifi-cant change in our effective tax rate for 2009.
Review of Quarterly Results
Quarterly Information
|
| 2008 |
| 2007 |
| ||||||||||||||||||||
($ millions, except where indicated) |
| Q4 |
| Q3 |
| Q2 |
| Q1 |
| Q4 |
| Q3 |
| Q2 |
| Q1 |
| ||||||||
Sales(1) |
| $ | 2,110 |
| $ | 1,878 |
| $ | 1,967 |
| $ | 1,958 |
| $ | 1,917 |
| $ | 1,684 |
| $ | 1,642 |
| $ | 1,089 |
|
Realized price – gold |
| 807 |
| 872 |
| 894 |
| 925 |
| 798 |
| 681 |
| 624 |
| 386 |
| ||||||||
Realized price – copper |
| 3.06 |
| 3.49 |
| 3.65 |
| 3.54 |
| 3.11 |
| 3.38 |
| 3.43 |
| 2.77 |
| ||||||||
Cost of sales |
| 1,191 |
| 1,028 |
| 882 |
| 775 |
| 834 |
| 794 |
| 776 |
| 740 |
| ||||||||
Net income/(loss) |
| (468 | ) | 254 |
| 485 |
| 514 |
| 537 |
| 345 |
| 396 |
| (159 | ) | ||||||||
Per share(2) – (dollars) |
| (0.54 | ) | 0.29 |
| 0.56 |
| 0.59 |
| 0.62 |
| 0.40 |
| 0.46 |
| (0.18 | ) | ||||||||
Adjusted net income(3) |
| 277 |
| 408 |
| 441 |
| 537 |
| 597 |
| 293 |
| 318 |
| (181 | ) | ||||||||
Per share(2) – (dollars) |
| 0.32 |
| 0.47 |
| 0.51 |
| 0.62 |
| 0.69 |
| 0.34 |
| 0.37 |
| (0.21 | ) | ||||||||
EBITDA(4) |
| (a45 | ) | 522 |
| 886 |
| 984 |
| 793 |
| 710 |
| 740 |
| 193 |
| ||||||||
Operating cash flow |
| $ | 439 |
| $ | 508 |
| $ | 531 |
| $ | 728 |
| $ | 676 |
| $ | 557 |
| $ | 336 |
| $ | 163 |
|
1. Per our consolidated financial statements.
2. Calculated using weighted average number of shares outstanding under the basic method of earnings per share.
3. Adjusted net income is a non-GAAP financial performance measure with no standardized meaning under US GAAP. All prior quarters have been restated to reflect the revised definition of adjusted net income. For further information and a detailed reconciliation, please see page 72 of this MD&A.
4. EBITDA is calculated by excluding income tax expense, interest expense, interest income and amortization, and is a non-GAAP financial performance measure with no standardized meaning under US GAAP. For further information and a detailed reconciliation, please see page 75 of this MD&A.
52
Our financial results for the last eight quarters reflect the following general trends: volatile spot gold and copper prices that impact realized sales price and higher production costs largely due to higher inflationary cost pressures.
Fourth Quarter Results
In fourth quarter 2008 we reported a loss of $468 million, compared to net income of $537 million in the prior year period. The loss in fourth quarter 2008 was primarily driven by post-tax impairment charges totaling $773 million. Adjusted net income in fourth quarter 2008, which excludes the impact of impairment charges, was $277 million lower than the prior year period, a decrease of 54%, as higher gold prices and higher sales volumes for gold and copper were offset by higher total cash costs for gold and copper.
Impairment Charges Related to Goodwill, Property, Plant and Equipment, and Investments
($ millions) |
|
|
| |
For the three months ended December 31 |
| 2008 |
| |
Kanowna |
| $ | 272 |
|
North Mara |
| 216 |
| |
Barrick Energy |
| 88 |
| |
Osborne |
| 104 |
| |
Highland |
| 42 |
| |
Henty |
| 30 |
| |
Other |
| 21 |
| |
Total (net of tax) |
| $ | 773 |
|
In fourth quarter 2008, we sold 2.19 million ounces of gold and 105 million pounds of copper, compared to 2.04 million ounces and 93 million pounds in the same prior year quarter. Sales in fourth quarter were higher than the same prior year period reflecting higher market prices and higher sales volumes for both copper and gold. In fourth quarter 2008, cost of sales attributable to gold was $1,058 million or $471 per ounce on a total cash cost basis, an increase of $300 million or $102 per ounce from the prior year. As expected, gold production and cost of sales/total cash costs per ounce in fourth quarter 2008 were impacted by mine sequencing, inflationary pressures for items such as labor, energy, and commodities and consumables, gold-related costs and opportunity losses on currency and commodity hedge contracts. Total cash costs on a full credit for non-gold sales increased by $117 per ounce to $382 per ounce, compared to $265 per ounce in the prior year.
Operating cash flow in fourth quarter was $439 million, or 35% lower than the same prior year period reflecting lower cash margins on copper and gold, as well as higher working capital outflows.
Financial Condition Review
Summary Balance Sheet and Key Financial Ratios
($ millions, except ratios) |
|
|
|
|
| ||
For the years ended December 31 |
| 2008 |
| 2007 |
| ||
Total cash and cash equivalents |
| $ | 1,437 |
| $ | 2,207 |
|
Total current assets |
| 4,112 |
| 4,299 |
| ||
Total current liabilities |
| 1,844 |
| 1,296 |
| ||
Working capital |
| 2,268 |
| 3,003 |
| ||
Total assets |
| 24,161 |
| 21,951 |
| ||
Total liabilities |
| 8,702 |
| 6,613 |
| ||
Net debt(1) |
| $ | 2,889 |
| $ | 941 |
|
Total shareholders’ equity |
| $ | 15,277 |
| $ | 15,256 |
|
Total common shares outstanding(2) |
| 872,723,090 |
| 870,465,549 |
| ||
Key Financial Ratios: |
|
|
|
|
| ||
Current ratio(3) |
| 2.23:1 |
| 3.32:1 |
| ||
Debt-to-market capitalization(4) |
| 0.14:1 |
| 0.09:1 |
| ||
Debt-to-book value(5) |
| 0.19:1 |
| 0.15:1 |
| ||
Debt-to-equity(6) |
| 0.30:1 |
| 0.22:1 |
| ||
1. Represents total long-term debt of $4,326 million (2007: $3,148 million) excluding fair value adjustments less total cash and cash equivalents of $1,437 million ($2,207 million) as at December 31, 2008.
2. Total common shares outstanding does not include: special voting shares 1 (2007:1), scheduled to be cancelled at the end of February 2009, Stock options 13,350,011 (2007: 12,706,450) and Exchangeable shares 503,251 (2007: 3,465,892) which represent Barrick Gold Inc. (“BGI”) exchangeable shares. Each BGI share is exchangeable for 0.53 Barrick common shares. At January 30, 2009, these shares were convertible into approximately 266,929 (2007: 1,836,923) Barrick common shares. Each BGI share is scheduled to be redeemed at the end of February 2009.
3. Represents current assets divided by current liabilities as at December 31, 2008 and December 31, 2007.
4. Represents total debt divided by total market capitalization (share price as at December 31 times the total common shares outstanding) as at December 31, 2008 and December 31, 2007.
5. Represents total debt divided by Total Liabilities and Shareholders’ Equity as at December 31, 2008 and December 31, 2007.
6. Represents total debt divided by Total Shareholders’ Equity as at December 31, 2008 and December 31, 2007.
53
Balance Sheet Review
Total assets were $24.1 billion in 2008, an increase of $2.2 billion or 10.1% compared to the prior year. The increase primarily reflects an increase of $3.0 billion in property, plant and equipment due to the acquisition of a 40% interest in Cortez, the acquisition of Barrick Energy and sustaining and project capital expenditures. These increases were partially offset by a decrease in goodwill, reflecting the impairment charges recorded in fourth quarter 2008, and a decrease in cash and equivalents, which was utilized to partially finance our acquisition activity in 2008. Total liabilities increased by $2.1 billion, or 32% compared to the prior year, primarily due to an increase in long term debt of $1.2 billion reflecting the issuance of fixed rate notes in third quarter 2008 to pay down our line of credit, which was utilized for the Cortez and Barrick Energy transactions.
Our asset base is primarily comprised of non-current assets such as property, plant and equipment and goodwill, reflecting the capital intensive nature of the mining business and our history of growing through acquisitions, production inventories and cash and equivalents. We typically do not carry a material accounts receivable balance, since only sales of concentrate have a settlement period.
Shareholders’ Equity
For information regarding the outstanding shares and stock options, please refer to the Financial Statements and our 2008 Management Information Circular and Proxy Statement.
Dividend Policy
In 2008, we increased our dividend from $0.30 per common share to $0.40 per common share. The 33% increase in the dividend reflects our ability to generate substantial cash flows from our operations in a high gold price environment. With strong cash flow and the industry’s only A-rated balance sheet, we determined that we have the financial resources to return additional value to shareholders while still investing in advanced projects. The amount and timing of any dividends is within the discretion of our Board of Directors. The Board of Directors reviews the dividend policy semi-annually based on our current and projected liquidity profile, and capital requirements for capital projects and potential acquisitions.
Comprehensive Income
Comprehensive income consists of net income or loss, together with certain other economic gains and losses, that collectively are described as “other comprehensive income” or “OCI”, and excluded from the income statement.
In 2008, other comprehensive losses of $507 million, after-tax, mainly included: losses of $301 million on hedge contracts designated for future periods, caused primarily by changes in currency exchange rates, copper prices, and fuel prices; reclassification adjustments totaling $267 million for gains on hedge contracts designated for 2008 that were transferred to earnings in 2008; $17 million transferred to earnings related to gains recorded on the sale of shares in various investments in junior mining companies, $26 million in losses transferred to income due to the impairment of investments; $52 million of losses recorded as a result of changes in the fair value of investments held during the year; and $54 million in losses for currency translation adjustments on Barrick Energy.
Included in accumulated other comprehensive income at December 31, 2008 were unrealized pre-tax losses on currency, commodity and interest rate hedge contracts totaling $213 million, based on December 31, 2008 market foreign exchange rates. The related hedge contracts are designated against operating costs and capital expenditures primarily over the next three years and are expected to help protect against the impact of the strengthening of the Australian and Canadian dollar against the US dollar. The hedge gains/losses are expected to be recorded in earnings at the same time as the corresponding hedged operating costs and amortization of capital expenditures are also recorded in earnings.
54
Financial Position
We maintained a strong financial position throughout the market turbulence that was experienced in 2008. This is reflected in our strong cash and working capital balances and our low debt to equity and debt to market capitalization ratios as at December 31, 2008.
Our strong financial position is reflected in the fact that we have the only A-rated balance sheet in the gold mining industry as measured by S&P. Through 2008, our ratings, as established by S&P, Moody’s and DBRS, have remained stable. Our ability to access unsecured debt markets and the related cost of debt financing is, in part, dependent upon maintaining an acceptable credit rating. Deterioration in our credit rating would not adversely affect existing debt securities, but could impact funding costs for any new debt financing.
Credit Rating from Major Rating Agencies
At January 28, 2009: |
|
|
|
Standard and Poor’s (“S&P”) |
| A– |
|
Moody’s |
| Baa1 |
|
DBRS |
| A |
|
The key factors impacting our financial position, and therefore our credit rating, include the following:
· Our market capitalization and the strength of our balance sheet, including the amount of net debt and our debt-to-equity ratio (refer to liquidity section of this MD&A for discussion of key factors impacting these measures in 2008);
· Our net cash flow, including cash generated by operating activities (refer to liquidity section of this MD&A for discussion of key factors impacting these measures in 2008);
· Expected capital expenditure requirements and other off balance sheet commitments (refer to the guidance and off balance sheet arrangements section of this MD&A for discussion of key factors impacting these measures in future periods);
· The quantity of our gold reserves (refer to pages 141 to 148 for more information); and
· Our geo-political risk profile.
Liquidity
Total cash and cash equivalents at the end of 2008 were $1.4 billion. At year end, our cash position consisted of a mix of term deposits and treasury bills. Net debt was $2.9 billion, with a debt-to-equity ratio of 0.30:1. The majority of our outstanding long-term debt matures at various dates beyond 2012, with approximately $300 million repayable in the period 2009 to 2012. Counterparties to debt and derivative instruments do not have unilateral discretionary rights to accelerate repayment at earlier dates.
Our primary source of liquidity is operating cash flow, and over the past three years we have generated an average of about $2 billion per year. The principal risk factor affecting operating cash flow is market gold and copper prices. We are largely protected in 2009 from the decline in market copper prices by our copper hedge position; beyond 2009 we are subject to market prices. At present production rates, if copper prices remain at present levels of $1.50 per pound, proceeds from copper sales in 2010 would decline by about $722 million from levels in 2008, partly offset by the positive impact of expected higher levels of gold production and sales in 2010 to 7.7 to 8.1 million ounces.
The principal uses of liquidity are sustaining capital expenditures, construction activities at capital projects, acquisitions, dividend payments and interest payments. Sustaining capital expenditures have averaged about $0.7 billion per year over the past three years and assuming 2008 dividend rates, dividends total about $0.35 billion per year. The balance of cash flow generated by operations, after paying for sustaining capital and dividends, is available for investment in capital projects and acquisitions. We have invested $4.7 billion on capital projects and acquisitions in the past three years, partly financed by cash flow from operations and partly by new financings. We expect to spend about $4.2 billion over the next four years to fund remaining construction activities at Buzwagi, Cortez Hills, Pueblo Viejo, and Pascua-Lama, partly funded by project financing for a portion of the construction cost of Pueblo Viejo and Pascua-Lama.
55
For Pueblo Viejo we are in active discussions with a group of export credit agencies to put in place $1 billion of project financing, including our partners’ share, which covers a portion of the total capital cost of the project. We have a $1.5 billion credit facility available as a source of financing and we may also raise new financing if we undertake any other projects, acquisitions, or for other purposes.
Investments in capital projects and acquisitions will be subject to an internal capital allocation review prior to proceeding with new expenditures. This review entails an assessment of our overall liquidity, the overall level of investment required, and the prioritization of investments. The assessment also takes into account expected levels of future operating cash flow and the cost and availability of new financing. If copper remains at recent low levels and there is a decline in market gold prices then this could impact the timing and amount of future investment in capital projects and/or acquisitions.
Alternatives for sourcing our future capital needs include our significant cash position, credit facilities, future operating cash flow, project financings and debt or equity financings. These alternatives are continually evaluated to determine the optimal mix of capital resources of our capital needs.
In light of the current global economic crisis, our ability to secure new financing for our expected capital needs for capital projects could be significantly impacted, particularly if this situation persists for an extended period of time. In particular:
· An increased cost of financing due to rising credit spreads could have a negative impact on overall project economics.
· A lack of availability of credit on acceptable terms could make it difficult for us to raise the capital required to build some or all of our projects on the timelines previously anticipated or at all.
· Our joint venture partners may also have difficulty securing funding for their share of project capital requirements which could impact the ability to build some of the projects.
Sources and Uses of Cash
Cash Inflow (Outflow) Summary
($ millions) |
|
|
|
|
|
|
| |||
For the years ended December 31 |
| 2008 |
| 2007 |
| 2006 |
| |||
Operating activities |
| $ | 2,206 |
| $ | 1,732 |
| $ | 2,122 |
|
Investing activities |
| (3,912 | ) | (1,562 | ) | (1,593 | ) | |||
Financing activities |
| 933 |
| (1,036 | ) | (1,347 | ) | |||
Discontinued operations |
| — |
| 21 |
| 2,828 |
| |||
Effects of exchange rates |
| 3 |
| 9 |
| (4 | ) | |||
Change in cash and equivalents |
| $ | (770 | ) | $ | (836 | ) | $ | 2,006 |
|
In 2008, net cash provided by operating activities totaled $2,206 million, an increase of $474 million compared to the prior year. Higher market gold and copper prices were partially offset by lower sales volumes and higher cash costs for both gold and copper.
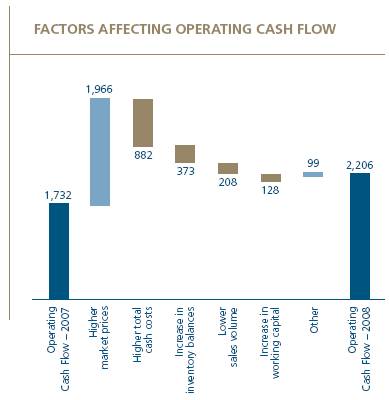
56
Cash used in investing activities amounted to $3,912 million, primarily due to acquisitions and capital expenditures, partially offset by proceeds received from the sale of other investments. Significant investing activities in 2008 included the $1.7 billion cash acquisition of the additional 40% interest in Cortez and the $460 million cash acquisition of Barrick Energy. Capital expenditures, including capitalized interest, amounted to $1,776 million, of which $742 million were sustaining capital expenditures related to our operating mines and $739 million related to our development projects on an equity basis.
Capital Expenditures(1)
($ millions) |
|
|
|
|
|
|
| |||
For the years ended December 31 |
| 2008 |
| 2007 |
| 2006 |
| |||
Project capital expenditures |
|
|
|
|
|
|
| |||
Pascua-Lama |
| $ | 112 |
| $ | 102 |
| $ | 44 |
|
Cortez Hills |
| 155 |
| 75 |
| 47 |
| |||
Buzwagi |
| 273 |
| 66 |
| — |
| |||
Pueblo Viejo |
| 157 |
| — |
| — |
| |||
Kainantu |
| 4 |
| — |
| — |
| |||
Sedibelo |
| 38 |
| — |
| — |
| |||
Cowal |
| — |
| — |
| 141 |
| |||
Ruby Hill |
| — |
| — |
| 26 |
| |||
Sub-total(2) |
| $ | 739 |
| $ | 243 |
| $ | 258 |
|
Capital expenditures attributable to non-controlling interests(3) |
| 104 |
| — |
| — |
| |||
Total project capital expenditures |
| $ | 843 |
| $ | 243 |
| $ | 258 |
|
Regional capital expenditures |
|
|
|
|
|
|
| |||
North America |
| $ | 161 |
| $ | 143 |
| $ | 177 |
|
South America |
| 154 |
| 195 |
| 244 |
| |||
Australia Pacific |
| 215 |
| 218 |
| 202 |
| |||
Africa |
| 172 |
| 106 |
| 85 |
| |||
Other/Barrick Energy |
| 40 |
| 17 |
| 12 |
| |||
Sub-total |
| 742 |
| 679 |
| 720 |
| |||
Capitalized interest |
| 191 |
| 124 |
| 109 |
| |||
Total capital expenditures |
| $ | 1,776 |
| $ | 1,046 |
| $ | 1,087 |
|
(1) These amounts are presented on a cash basis consistent with the amounts presented on the Consolidated Statement of Cash Flows.
(2) On an accrual basis, our share of project capital expenditures is $937 million including capitalized interest.
(3) Amount reflects our partners’ share of expenditures at the Pueblo Viejo project on a cash basis.
Cash provided by financing activities for 2008 was $933 million, including proceeds of $1.25 billion of proceeds from debt issuance in third quarter that was primarily used to repay amounts drawn down on our lines of credit to finance the purchase of the additional 40% in Cortez and the acquisition of Cadence Energy Inc. These amounts were partially offset by dividend payments of $349 million.
Financial Instruments
We use a mixture of cash, long-term debt and shareholders’ equity to maintain an efficient capital structure and ensure adequate liquidity exists to meet the cash needs of our business. We use interest rate contracts to mitigate interest rate risk that is implicit in our cash balances and outstanding long-term debt. In the normal course of business, we are inherently exposed to currency and commodity price risk. We use currency and commodity hedging instruments to mitigate these inherent business risks. We also hold certain derivative instruments that do not qualify for hedge accounting treatment. These non-hedge derivatives are described in note 20 to our Financial Statements. For a discussion of certain risks and assumptions that relate to the use of derivatives, including market risk, market liquidity risk and credit risk, refer to notes 2 and 20 to our Financial Statements. For a discussion of the methods used to value financial instruments, as well as any significant assumptions, refer to note 20 to our Financial Statements.
57
Summary of Financial Instruments(1)
As at and for the year ended December 31, 2008
|
| Principal/ |
|
|
| Gains/(losses) |
| Amounts |
| |||
Financial |
| Notional |
| Associated |
| Recorded in |
| Recorded |
| |||
Instrument |
| Amount |
| Risks |
| Earnings |
| in OCI |
| |||
Cash and equivalents |
| $ | 1,437 million |
| · Interest rate |
| $ | 39 million |
| — |
| |
|
|
|
| · Credit |
|
|
|
|
| |||
Investments in available-for-sale securities |
| $ | 31 million |
| · Market |
| $ | 17 million |
| $ | (2 million | ) |
Long-term debt |
| $ | 4,443 million |
| · Interest rate |
| $ | (17 million | ) | — |
| |
Hedging instruments – currency contracts |
| C$ 286 million |
| · Market/liquidity |
| $ | 121 million |
| $ | (508 million | ) | |
|
| CLP 52,023 million |
|
|
|
|
|
|
| |||
Hedging instruments – copper contracts |
| 402 million lbs |
| · Market/liquidity |
| $ | 112 million |
| $ | 484 million |
| |
Hedging instruments – fuel and propane contracts |
| 4.9 million bbls |
| · Market/liquidity |
| $ | 33 million |
| $ | (169 million | ) | |
Non-hedge derivatives |
| various |
| · Market/liquidity |
| $ | 41 million |
| — |
| ||
|
|
|
| · Credit |
|
|
|
|
| |||
(1) Refer to pages 58 to 61 for information on gold and silver sales contracts.
Off Balance Sheet Arrangements
Project Gold Sales Contracts
We have 9.5 million(9) ounces of existing gold sales contracts. The contracting parties are bullion banks whose business includes entering into contracts to purchase gold from mining companies. The terms of our gold and silver sales contracts enable us to deliver gold and silver whenever we choose over the primarily ten-year terms of the contracts. The forward sales prices on our Project Gold Sales Contracts have not been fully fixed, and thus remain sensitive to long-term interest rates. As part of our Master Trading Agreements (“MTAs”), Project Gold Sales Contracts are not subject to any provisions regarding any financial go-ahead decisions with construction, or any possible delay or change on the projects.
(9) Includes floating spot-price gold contracts under which we are committed to deliver 4.2 million ounces of gold at spot prices less an average fixed-price adjustment of $529 per ounce.
Key Aspects of Project Gold Sales Contracts
As at December 31, 2008 |
|
|
|
| |
Weighted average future price(1) |
| $ | 364/ounce |
| |
Mark-to-market value at December 31, 2008 (millions)(2) |
| $ | (4,865 | ) | |
Duration(3) |
| 2.2 years |
|
| |
(1) Weighted average price based on current contract rates resetting from 2009 to 2017.
(2) At a spot gold price of $870 per ounce and market interest rates.
(3) Calculated as the weighted average years from December 31, 2008 to the first interim reset date for both floating and fixed price contracts.
Included in the 9.5 million ounces committed under our Project Gold Sales Contracts are floating spotprice contracts under which we are committed to deliver 4.2 million ounces of gold at future spot prices less an average price adjustment of $529 per ounce. Project Gold Sales Contracts allow us to move positions between fixed and floating prices. When a contract is converted from a fixed price to a floating price, the difference between the current market price of gold at the date of conversion and the contracted forward sales price is locked-in; i.e. the unrealized loss is fixed. Thereafter, future increases and decreases in market gold prices directly impact the final contract price. In a rising gold price environment, we have the opportunity to improve the price of the contract (assuming the gold price appreciates at a rate more than contango) and participate in higher gold prices
58
by resetting a floating price contract to a fixed price contract. Conversely, a decline in gold price subsequent to the conversion would reduce the final contract price we receive. Therefore, floating price contracts increase our exposure to gold price movements, both upwards and downwards.
US dollar interest rates, gold lease rates, credit spreads relating to both the counterparties and Barrick’s credit quality, and the economic impact on the counterparties associated with funding Project Gold Sales Contracts with negative mark-to-market balances have a material impact on the difference between the forward gold price over the current spot price (“contango”), and, ultimately, the realized price under gold forward sales contracts entered into by Barrick. Low US dollar interest rates, higher gold lease rates and an increase in the credit spreads compared to the prior year, may cause the Project Gold Sales Contracts to be in backwardation when rates are reset, with the result that our realized price under the forward sales contracts will decrease as contracts reset over the next few years. We estimate that the impact of a continuation of present unusual market conditions for US dollar interest rates, credit spreads and gold lease rates in existence as at December 31, 2008 would lead to a decline in the weighted average future contract price by approximately $4 per ounce in 2009 and approximately $15 per ounce in 2010 on the entire position. This was calculated assuming a constant spot gold price of $870 per ounce, the current Project Gold Sales Contracts position as at December 31, 2008, and resetting contracts with current interim delivery dates in 2009 and 2010 to the end of 2010. In 2009, we have no significant exposure to gold lease rates, and about one third of the Project Gold Sales Contracts are exposed to US dollar interest rates and credit spreads.
Counterparty Risk
If a counterparty to a Project Gold Sales Contract is unable to conduct transactions in an accessible international bullion market due to causes beyond its control, including the inability of the counterparty to purchase gold in the open market or to fund any such purchase, and no commercially reasonable alternative means exist for the counterparty to enter into transactions having the same effect, the counterparty has no obligation to extend the scheduled delivery date of such contract and, depending on the circumstances, this may result in early settlement of such contract. To date we have seen no evidence of lack of bullion availability with any of our counterparties.
Counterparty risk is the risk that a third party might fail to fulfill its performance obligations under the terms of a financial instrument. Counterparty risk can be assessed both in terms of credit risk and liquidity risk. For cash and equivalents and accounts receivable, credit risk represents the carrying amount on the balance sheet, net of any overdraft positions.
For derivatives, when the fair value is positive, this creates credit risk. When the fair value of a derivative is negative, we assume no credit risk. However, liquidity risk exists to the extent a counterparty is no longer able to perform in accordance with the terms of the contract due to insolvency. In cases where we have a legally enforceable master netting agreement with a counterparty, credit risk exposure represents the net amount of the positive and negative fair values for similar types of derivatives. For a net negative amount, we regard credit risk as being zero. A net positive amount for a counterparty is a reasonable basis to measure credit risk when there is a legally enforceable master netting agreement. We mitigate credit and liquidity risk by:
· Entering into derivatives with high credit-quality counterparties;
· Limiting the amount of exposure to each counterparty; and
· Monitoring the financial condition of counterparties.
For our Project Gold Sales Contracts, the insolvency of a counterparty could, in certain circumstances, lead to a requirement to settle transactions between ourselves and the insolvent counterparty and may ultimately require the payment of a net amount by us to the counterparty. In determining the amounts owing as a consequence of any such settlement, we would be entitled to claim contractual damages suffered by us as a result of a counterparty default. These damages could include the costs of effecting replacement trades with other counterparties that would put us in the same position as we would have been if the insolvent counterparty had not defaulted. A settlement caused by a counterparty insolvency event would not trigger any crossdefaults under our other financial instruments.
59
We currently have Project Gold Sales Contracts in place with 17 counterparties, which consist primarily of large commercial banks. We proactively manage our exposure to individual counterparties in order to mitigate both credit and liquidity risks. As at December 31, 2008 no counterparty had in excess of 10% of the total ounce or mark-to-market position. Subsequent to December 31, 2008, one counterparty represented 13% of the mark-to-market and total ounce position due to an assignment of another counterparty position. Through December 31, 2008, none of the counterparties with which we held outstanding contracts had declared insolvency. In the event of a potential counterparty default due to insolvency, we would seek to have the contract reassigned to an alternative counterparty who is better able to perform under the contract. In certain circumstances, we have been able to assign contracts to alternative counterparties to manage counterparty risk, and we expect that we will be able to continue to do so to the extent creditworthy counterparties are willing to take on assigned contracts.
Silver Sales Contracts (fixed and floating)
We also have 16 million ounces of silver sales contracts under which we are committed to deliver silver over the next ten years. 8.9 million of these silver sales contracts are floating price contracts at spot prices, less an average fixedprice adjustment of $4.61 per ounce. These floating spot-price contracts were previously fixedprice contracts, for which, under the price-setting mechanisms of the MTAs, we elected to receive a price based on the market silver spot price at the time of delivery, adjusted by the difference between the spot price and the contract price at the time of such election.
Summary of Silver Sales Contracts (fixed and floating)
As at December 31, 2008 |
|
|
| |
Millions of silver ounces |
| 16.0 |
| |
Average future price(1) |
| $ | 8.36 |
|
Mark-to-market value at December 31, 2008(2) |
| $ | (67 | ) |
(1) Barrick may choose to settle any silver sales contract in advance of the termination date at any time, at its discretion. Historically, delivery has occurred in advance of the contractual termination date.
(2) At a spot silver price of $10.79 per ounce.
Key Terms of Gold and Silver Sales Contracts
In all of our MTAs, which govern the terms of gold and silver sales contracts with our 17 counterparties, the following applies.
· The counterparties do not have unilateral discretionary “right to break” provisions.
· There are no credit downgrade provisions.
· We are not subject to any margin calls, regardless of the price of gold or silver.
�� We have the right to settle our gold and silver sales contracts on two days notice at any time during the life of the contracts, or keep these forward gold and silver sales contracts outstanding for up to 10 years.
· At our option, we can sell gold or silver at the market price or the contract price, whichever is higher, up to the termination date of the MTAs. Unless extended further, currently, 250 thousand ounces have a termination date of January 2012, 550 thousand ounces have a termination date of December 2017, and the remaining 8.7 million ounces have termination dates from 2018 to 2022.
The MTAs with our counterparties do provide for early close out of certain transactions in the event of a material adverse change in our ability, or our principal hedging subsidiary’s ability, to perform our or its gold and silver delivery and other obligations under the MTAs and related parent guarantees, a lack of gold or silver market and for customary events of default such as covenant breaches, insolvency or bankruptcy. The principal financial covenants are:
· We must maintain a minimum consolidated net worth of at least $2 billion (approximately $15 billion at year end). The MTAs exclude unrealized mark-to-market valuations in the calculation of consolidated net worth.
· We must maintain a maximum long-term debt to consolidated net worth ratio of less than 2:1; we have consistently been below 1:1 for the entire year.
In all cases, under the terms of the MTAs, the period over which we are required to deliver gold is extended annually by one year, or kept “evergreen”, regardless of the intended delivery dates, unless otherwise notified by the counterparty. This means that, with each year that passes, the termination date of most MTAs is extended into the future by one year. In 2008, three
60
counterparties notified us that they would not be extending the termination date by one year on the basis of credit conditions. All of these termination dates were 10 years or longer, which allows for a current/final termination date of 2017 or later.
As spot gold prices increase or decrease, the value of our gold mineral reserves and amount of potential operating cash inflows generally increase or decrease. The unrealized mark-to-market loss on our fixedprice Project Gold Sales Contracts also increases or decreases. The mark-to-market value represents the cancellation value of these contracts based on current market levels, and does not represent an immediate economic obligation for payment by us. Our obligations under the Project Gold Sales Contracts are to deliver an agreed upon quantity of gold at a contracted price by the termination date of the contracts (currently 2018 in most cases). Project Gold Sales Contracts are not recorded on our balance sheet. The economic impact of these contracts is reflected in our Financial Statements within gold sales based on selling prices under the contracts at the time we record revenue from the physical delivery of gold and silver under the contracts.
Fair Value of Derivative Positions
As at December 31, 2008 |
| Unrealized |
| |
($ millions) |
| Gain/(Loss) |
| |
Fixed Price Gold Sales contracts |
| $ | (2,661 | ) |
Floating Spot-Price Gold Sales contracts |
| (2,204 | ) | |
Silver Sales Contracts |
| (67 | ) | |
Foreign currency contracts |
| (501 | ) | |
Interest rate contracts |
| (8 | ) | |
Copper contracts |
| 654 |
| |
Fuel contracts |
| (185 | ) | |
Steel contracts |
| (3 | ) | |
Total |
| $ | (4,975 | ) |
Commitments and Contingencies
Capital Expenditures Not Yet Committed
We expect to incur capital expenditures during the next five years for both projects and producing mines. The projects are at various stages of development, from primarily exploration or scoping study stage through to the construction execution stage. The ultimate decision to incur capital at each potential site is subject to positive results which allow the project to advance past decision hurdles. Three projects are at an advanced stage, namely Buzwagi, Cortez Hills and Pueblo Viejo at December 31, 2008 (refer to pages 45 to 46 for further details).
Contractual Obligations and Commitments
|
| Payments due |
|
|
| |||||||||||||||||
($ millions) |
|
|
|
|
|
|
|
|
|
|
| 2014 and |
|
|
| |||||||
As at December 31, 2008 |
| 2009 |
| 2010 |
| 2011 |
| 2012 |
| 2013 |
| thereafter |
| Total |
| |||||||
Long-term debt(1) |
|
|
|
|
|
|
|
|
|
|
|
|
|
|
| |||||||
Repayment of principal |
| $ | 68 |
| $ | 30 |
| $ | 10 |
| $ | 130 |
| $ | 564 |
| $ | 3,460 |
| $ | 4,262 |
|
Capital leases |
| 25 |
| 21 |
| 9 |
| 4 |
| 5 |
| — |
| 64 |
| |||||||
Interest |
| 260 |
| 255 |
| 251 |
| 248 |
| 231 |
| 2,763 |
| 4,008 |
| |||||||
Asset retirement obligations(2) |
| 94 |
| 94 |
| 82 |
| 89 |
| 58 |
| 1,017 |
| 1,434 |
| |||||||
Operating leases |
| 12 |
| 7 |
| 4 |
| 3 |
| — |
| — |
| 26 |
| |||||||
Restricted share units |
| 29 |
| 37 |
| 57 |
| — |
| — |
| — |
| 123 |
| |||||||
Pension benefits |
| 57 |
| 29 |
| 24 |
| 24 |
| 24 |
| 116 |
| 274 |
| |||||||
Other post-retirement obligations |
| 3 |
| 3 |
| 3 |
| 3 |
| 2 |
| 11 |
| 25 |
| |||||||
Derivative liabilities(3) |
| 442 |
| 225 |
| 132 |
| 77 |
| — |
| — |
| 876 |
| |||||||
Purchase obligations for supplies and consumables(4) |
| 483 |
| 269 |
| 175 |
| 93 |
| 82 |
| 62 |
| 1,164 |
| |||||||
Capital commitments(5) |
| 426 |
| 77 |
| 26 |
| 10 |
| 12 |
| 1 |
| 552 |
| |||||||
Social development costs |
| 55 |
| 7 |
| 7 |
| 3 |
| 3 |
| 95 |
| 170 |
| |||||||
Total |
| $ | 1,954 |
| $ | 1,054 |
| $ | 780 |
| $ | 684 |
| $ | 981 |
| $ | 7,525 |
| $ | 12,978 |
|
(1) Long-term Debt and Interest – Our debt obligations do not include any subjective acceleration clauses or other clauses that enable the holder of the debt to call for early repayment, except in the event that we breach any of the terms and conditions of the debt or for other customary events of default. The Veladero financing is collateralized by assets at the Veladero mine. Other than this security, we are not required to post any collateral under any debt obligations. The terms of our debt obligations would not be affected by deterioration in our credit rating. Projected interest payments on variable rate debt were based on interest rates in effect at December 31, 2008. Interest is calculated on our long-term debt obligations using both fixed and variable rates.
(2) Asset Retirement Obligations – Amounts presented in the table represent the undiscounted future payments for the expected cost of asset retirement obligations.
(3) Derivative Liabilities – Amounts presented in the table relate to derivative contracts disclosed under notes 2 and 20 to the Financial Statements. Payments related to derivative contracts cannot be reasonably estimated given variable market conditions.
(4) Purchase Obligations for Supplies and Consumables – Includes commitments related to new purchase obligations to secure a supply of acid, tires and cyanide for our production process.
(5) Capital Commitments – Purchase obligations for capital expenditures include only those items where binding commitments have been entered into. Commitments at the end of 2008 mainly related to construction capital at Pueblo Viejo and Pascua-Lama.
61
Litigation and Claims
We are currently subject to various litigation as disclosed in note 29 to the Financial Statements, and we may be involved in disputes with other parties in the future that may result in litigation. If we are unable to resolve these disputes favorably, it may have a material adverse impact on our financial condition, cash flow and results of operations.
Critical Accounting Policies and Estimates
Management has discussed the development and selection of our critical accounting estimates with the Audit Committee of the Board of Directors, and the Audit Committee has reviewed the disclosure relating to such estimates in conjunction with its review of this MD&A. The accounting policies and methods we utilize determine how we report our financial condition and results of operations, and they may require management to make estimates or rely on assumptions about matters that are inherently uncertain.
Our financial condition and results of operations are reported using accounting policies and methods prescribed by US GAAP. In certain cases, US GAAP allows accounting policies and methods to be selected from two or more alternatives, any of which might be reasonable yet result in our reporting materially different amounts. We exercise judgment in selecting and applying our accounting policies and methods to ensure that, while US GAAP compliant, they reflect our judgment of an appropriate manner in which to record and report our financial condition and results of operations.
Accounting Policy Changes in 2008
This section includes a discussion of significant accounting policy changes and critical accounting estimates that were adopted in our 2008 Financial Statements.
FAS 157, Fair Value Measurements (FAS 157)
In 2008, we implemented FAS 157 for financial assets and financial liabilities that are measured at fair value on a recurring basis. The primary assets and liabilities that are recognized and disclosed at fair value in accordance with the provisions of FAS 157 are: available-for-sale securities; receivables from provisional copper and gold sales; derivate assets and derivative liabilities; held-to-maturity investments; equity method investments and long-term debt. The adoption of FAS 157 has resulted in expanded disclosures about our fair value measurements for financial assets and financial liabilities recognized in our financial statements. However, the adoption of FAS 157 did not have an impact on the measurement of fair value as our valuation methodology for these assets and liabilities is consistent with the fair value framework established by FAS 157. Refer to note 21 of the Consolidated Financial Statements for details of the adoption of FAS 157 and related disclosures.
We have not applied the provisions of FAS 157 to nonfinancial assets and nonfinancial liabilities as permitted by the delay specified in FSP FAS 157-2. FSP FAS 157-2 delays the effective date of FAS 157 to fiscal years beginning after November 15, 2008, for non-financial assets and liabilities, except for items that are recognized or disclosed at fair value in the financial statements on a recurring basis. Therefore, beginning in 2009 we will apply the requirements of FAS 157 to nonfinancial assets and nonfinancial liabilities that we periodically measure at fair value under US GAAP, which will principally affect: goodwill, tangible and intangible assets measured and recognized at fair value as a result of an impairment assessment; and nonfinancial assets and nonfinancial liabilities recognized as a result of a business combination. The application of the provisions of FAS 157 is not expected to have a significant impact on our methodology for measuring the fair value of these assets and liabilities, but will result in expanded disclosures.
Changes in Financial Statement Presentation – Accretion expense
In first quarter 2008, we made a change to our accounting policy regarding the financial statement classification of accretion expense. Prior to this change, we recorded accretion expense at producing mines as a component of cost of sales and accretion expense at closed mines as a component of other expense.
Beginning in first quarter 2008, we recorded accretion expense at producing mines and accretion expense at closed mines in amortization and accretion on our Consolidated Statements of Income.
62
Future Accounting Policy Changes
This section includes a discussion of future accounting changes that may have a significant impact on our Financial Statements.
FAS 161, Disclosures about Derivative Instruments and Hedging Activities (FAS 161)
In first quarter 2009, we will begin applying the provisions of FAS 161 to our financial statement note disclosures. FAS 161 requires entities to provide enhanced disclosures about (a) how and why an entity uses derivative instruments; (b) how derivative instruments and related hedged items are accounted for under FAS 133 and its related interpretations; and (c) how derivative instruments and related hedged items affect an entity’s financial position; financial performance and cash flows. We are currently evaluating the impact of adopting FAS 161 on our note disclosures related to derivative instruments and hedging activities.
FAS 141(R), Business Combinations (FAS 141(R))
In first quarter 2009, we will begin applying the provisions of FAS 141(R), which replaced FAS 141, for business combinations consummated after the effective date of December 15, 2008. Early adoption of FAS 141(R) was not permitted. Under FAS 141(R), business acquisitions will be accounted for under the “acquisition method”, compared to the “purchase method” mandated by FAS 141.
The more significant changes to Barrick’s accounting for business combinations that will result from applying the acquisition method include: (i) the definition of a business is broadened to include development stage entities, and therefore more acquisitions will be accounted for as business combinations rather than asset acquisitions; (ii) the measurement date for equity interests issued by the acquirer is the acquisition date instead of a few days before and after terms are agreed to and announced, which may significantly change the amount recorded for the acquired business if share prices differ from the agreement and announcement date to the acquisition date; (iii) all future adjustments to income tax estimates will be recorded to income tax expense, whereas under FAS 141 certain changes in income tax estimates were recorded to goodwill; (iv) acquisition-related costs of the acquirer, including investment banking fees, legal fees, accounting fees, valuation fees, and other professional or consulting fees will be expensed as incurred, whereas under FAS 141 these costs are capitalized as part of the business combination; (v) the assets acquired and liabilities assumed are recorded at 100% of fair value even if less than 100% is obtained, whereas under FAS 141 only the controlling interest’s portion is recorded at fair value; and (vi) the non-controlling interest will be recorded at its share of fair value of net assets acquired, including its share of goodwill, whereas under FAS 141 the non-controlling interest is recorded at its share of carrying value of net assets acquired with no goodwill being allocated.
FAS 160, Non-controlling Interests in Consolidated Financial Statements (FAS 160)
In first quarter 2009, we will begin applying the provisions of FAS 160. Under FAS 160, the non-controlling interest will be measured at 100% of the fair value of assets acquired and liabilities assumed, for transactions consummated after the effective date of December 15, 2008. Under current standards, the non-controlling interest is measured at book value. For presentation and disclosure purposes, non-controlling interests will be classified as a separate component of shareholders’ equity. In addition, FAS 160 will change the manner in which increases/decreases in ownership percentages are accounted for. Changes in ownership percentages will be recorded as equity transactions and no gain or loss will be recognized as long as the parent retains control of the subsidiary. When a parent company deconsolidates a subsidiary but retains a non-controlling interest, the non-controlling interest is re-measured at fair value on the date control is lost and a gain or loss is recognized at that time. Finally, under FAS 160, accumulated losses attributable to the non-controlling interests are no longer limited to the original carrying amount, and therefore non-controlling interests could have a negative carrying balance. The provisions of FAS 160 are to be applied prospectively with the exception of the presentation and disclosure provisions, which are to be applied for all prior periods presented in the financial statements. Early adoption was not permitted. The effect of FAS 160 on our balance sheet in first quarter 2009 will be a reclassification of non-controlling interests in the amount of $182 million as at December 31, 2008 to the shareholders’ equity section of the consolidated balance sheet.
63
Critical Accounting Estimates and Judgments
Certain accounting estimates have been identified as being “critical” to the presentation of our financial condition and results of operations because they require us to make subjective and/or complex judgments about matters that are inherently uncertain; or there is a reasonable likelihood that materially different amounts could be reported under different conditions or using different assumptions and estimates.
Reserve Estimates Used to Measure Amortization of Property, Plant and Equipment
We record amortization expense based on the estimated useful economic lives of long-lived assets. Changes in reserve estimates are generally calculated at the end of each year and cause amortization expense to increase or decrease prospectively. The estimate that most significantly affects the measurement of amortization is quantities of proven and probable gold and copper reserves, because we amortize a large portion of property, plant and equipment using the units-of-production method. The estimation of quantities of gold and copper reserves, in accordance with the principles in Industry Guide No. 7, issued by the US Securities and Exchange Commission (“SEC”) is complex, requiring significant subjective assumptions that arise from the evaluation of geological, geophysical, engineering and economic data for a given ore body. This data could change over time as a result of numerous factors, including new information gained from development activities, evolving production history and a reassessment of the viability of production under different economic conditions. Changes in data and/or assumptions could cause reserve estimates to substantially change from period to period. Actual gold and copper production could differ from expected gold and copper production based on reserves, and an adverse change in gold or copper prices could make a reserve uneconomic to mine. Variations could also occur in actual ore grades and gold, silver and copper recovery rates from estimates.
A key trend that could reasonably impact reserve estimates is rising market mineral prices, because the mineral price assumption used in preparing reserve estimates is calculated based on the trailing three-year average market price. As this assumption rises, it could result in an upward revision to reserve estimates as material not previously classified as a reserve becomes economic at higher gold prices. Following the recent trend in market gold prices over the last three years, the mineral price assumption used to measure reserves has also been rising. The gold price assumption was $725 per ounce in 2008 (2007: $575 per ounce; 2006: $475 per ounce). The copper price assumption was $2.00 per pound in 2008 (2007: $2.00 per pound).
The impact of a change in reserve estimates is generally more significant for mines near the end of the mine life because the overall impact on amortization is spread over a shorter time period. Also, amortization expense is more significantly impacted by changes in reserve estimates at underground mines than open-pit mines due to the following factors:
(i) Underground development costs incurred to access ore at underground mines are significant and amortized using the units-of-production method; and
(ii) Reserves at underground mines are often more sensitive to mineral price assumptions and changes in production costs. Production costs at underground mines are impacted by factors such as dilution, which can significantly impact mining and processing costs per ounce.
64
Impact of Historic Changes in Reserve Estimates on Amortization
|
| 2008 |
| 2007 |
| ||||||
For the years ended December 31 |
| Reserves |
| Amortization |
| Reserves |
| Amortization |
| ||
Gold |
|
|
|
|
|
|
|
|
| ||
North America |
| 3.1 |
| $ | (9 | ) | 5.0 |
| $ | 3 |
|
South America |
| 3.6 |
| (39 | ) | 0.1 |
| 23 |
| ||
Australia Pacific |
| 1.5 |
| (10 | ) | 3.5 |
| (2 | ) | ||
Africa |
| 0.5 |
| (5 | ) | 0.5 |
| (2 | ) | ||
Total Gold |
| 8.7 |
| $ | (63 | ) | 9.1 |
| $ | 22 |
|
Copper |
|
|
|
|
|
|
|
|
| ||
Australia Pacific |
| (51 | ) | 10 |
| 89 |
| (6 | ) | ||
South America |
| 750 |
| (4 | ) | 255 |
| 10 |
| ||
Total Copper |
| 699 |
| $ | 6 |
| 344 |
| $ | 4 |
|
(1) Each year we update our reserve estimates as at the end of the year as part of our normal business cycle. Reserve changes presented were calculated at the beginning of the applicable fiscal year and are in millions of contained ounces.
Impairment Assessments of Operating Mines, Development Projects and Petroleum & Natural Gas Properties
We review and test the carrying amounts of assets when events or changes in circumstances suggest that the carrying amount may not be recoverable. We group assets at the lowest level for which identifiable cash flows are largely independent of the cash flows of other assets and liabilities. For each operating mine site/development project/petroleum and natural gas property, all related assets are included in a single group for impairment testing purposes. If there are indications that impairment may have occurred at a particular mine site/development project/petroleum and natural gas property, we compare the sum of the undiscounted cash flows expected to be generated from that mine site/development project/petroleum and natural gas property to its carrying amount. If the sum of undiscounted cash flows is less than the carrying amount, an impairment loss is recognized if the carrying amount of the individual long-lived assets within the group exceeds their fair values. We used a long term gold price of $850 per ounce (2007: $800 per ounce) and a long term copper price of $1.50 per pound in 2009 and $2.00 per pound (2007: $2.00 per pound) thereafter, in preparing our cash flow estimates.
Long-lived assets subject to potential impairment at mine sites/development projects/petroleum and natural gas properties include buildings, plant and equipment, and capitalized reserve acquisition and development costs, and amounts allocated to value beyond proven and probable reserves (“VBPP”). For impairment assessment purposes, the estimated fair value of buildings, plant and equipment is based on a combination of current depreciated replacement cost and current market value. The estimated fair value of capitalized reserve acquisition, development costs and VBPP is determined using an income approach which measures the present value of the related cash flows expected to be derived from the asset.
In 2008, due to volatile economic conditions we tested the long-lived assets at all of our mines/projects/properties for impairment, and as a result we identified our Marigold gold mine in North America, our Henty and Kanowna gold mines, and Osborne copper mine in Australia as being potentially impaired. Consequently, we compared the estimated fair value of the individual long-lived assets to their carrying amount and as a result, recorded impairments of: Marigold $12 million and Osborne $57 million.
65
Impairment Assessments of Exploration Projects
After acquisition, various factors can affect the recoverability of the capitalized cost of land and mineral rights, particularly the results of exploration drilling. The length of time between the acquisition of land and mineral rights and when we undertake exploration work varies based on the prioritization of our exploration projects and the size of our exploration budget. If we conclude that an impairment condition may exist, we compare the sum of the undiscounted cash flows expected to be generated from the project to its carrying amount. If the sum of the undiscounted cash flows is less than the carrying amount, an impairment charge is recognized if the carrying amount of the individual long-lived assets within the group exceeds their fair value. For projects that do not have reliable cash flow projections, a market approach is applied. We are continuing with our current exploration projects as planned and have not noted any indication of impairment.
Accounting for Goodwill and Goodwill Impairment
We allocate goodwill arising from business combinations to reporting units acquired by preparing estimates of the fair value of the entire reporting unit and comparing this amount to the fair value of assets (including identifiable intangible assets) and liabilities of the reporting unit as at the date of acquisition. The difference represents the amount of goodwill allocated to each reporting unit. We believe that goodwill arises principally because of the following factors: (1) the going concern value implicit in the Company’s ability to sustain/grow its business by increasing reserves and resources through new discoveries whose potential value was not identified at the time of acquisition; (2) the ability to capture unique synergies from a business combination that can be realized from managing a portfolio of mines and mineral properties in the same geographic region; and (3) the requirement to record a deferred tax liability for the difference between the assigned fair values and the tax bases of assets acquired and liabilities assumed in a business combination at amounts that do not reflect fair value.
We test for impairment of goodwill on an annual basis in the fourth quarter of our fiscal year and at any other time if events or a change in circumstances indicate that it is more likely than not that the fair value of a reporting unit has been reduced below its carrying amount. Circumstances that could trigger an impairment test include, but are not limited to: a significant adverse change in the business climate or legal factors; an adverse action or assessment by a regulator; the likelihood that a reporting unit or a significant portion of a reporting unit will be sold or otherwise disposed of; adverse results of testing for recoverability of a significant asset group within a reporting unit; and a significant change to the operating plans for the reporting unit. The impairment test for goodwill is a two-step process. Step one consists of a comparison of the fair value of a reporting unit to its carrying amount, including the allocated goodwill. If the carrying amount of the reporting unit exceeds the fair value, step two requires the fair value of the reporting unit to be allocated to the underlying assets and liabilities of that reporting unit, resulting in an implied fair value of goodwill. If the carrying amount of the reporting unit goodwill exceeds the implied fair value of that goodwill, we record an impairment charge equal to the excess.
Each individual mineral property that is an operating mine is a reporting unit for the purposes of allocating goodwill and testing for goodwill impairment. Goodwill arising on the acquisition of mineral properties is allocated to both existing and acquired reporting units, if the existing reporting unit is expected to benefit from the synergies of the business combination. The amount of goodwill allocated to existing reporting units is based on the estimated fair value of the combination synergies attributable to that reporting unit. Allocating goodwill to reporting units which are individual operating mines, which by their very nature have a limited useful life, will result in future goodwill impairment charges by the end of the mine life. The timing and amount of future goodwill impairment charges is difficult to determine and will be dependent on a multitude of factors that impact valuations of mineral properties, including changes in observed market multiples for valuation purposes, changes in geo-political risk and country specific discount rates, changes in market gold prices and total cash costs, success in finding new reserves, future exploration potential and future capital requirements.
There is no active market for our reporting units. Consequently, when assessing a reporting unit for potential goodwill impairment, we use an income approach (being the present value of expected future net cash flows or net asset value (“NAV”) of the relevant
66
reporting unit) to determine the fair value we could receive for the reporting unit in an arm’s length transaction at the measurement date. Future cash flows are based on our best estimates of projected future revenues, cash costs of production and capital expenditures contained in our long term Life of Mine (“LOM”) plans, which are updated for each reporting unit in the fourth quarter of each fiscal year. Consequently, the process for determining the fair value of a reporting unit is subjective and requires management to make numerous estimates and assumptions, and therefore projected future results prepared using these estimates and assumptions used in our goodwill impairment tests may differ in material respects from actual future results.
Our LOM plans are based on detailed research, analysis and modeling to optimize the internal rate of return generated from each reporting unit. As such, these plans consider an optimal level of investment, overall production levels and sequence of extraction taking into account all relevant characteristics of the ore body, including waste to ore ratios, ore grades, haul distances, chemical and metallurgical properties impacting process recoveries and capacities of available extraction, haulage and processing equipment. Therefore, the LOM plan is the appropriate basis for forecasting production output in each future year and the related production costs and capital expenditures.
Projected future revenues reflect the forecasted future production levels at each of our reporting units as detailed in our LOM plans. Included in these forecasts is the production of mineral resources that do not currently qualify for inclusion in proven and probable ore reserves where there is a high degree of confidence in its economic extraction. This is consistent with the methodology we use to measure value beyond proven and probable reserves when allocating the purchase price of a business combination to acquired mining assets, and is therefore consistent with the provisions of EITF 04-3, Mining Assets: Impairment and Business Combinations.
Projected future revenues also reflect our estimated long term metals prices, which are determined based on current prices, an analysis of the expected total production costs of the producers and forward pricing curves of the particular metal and forecasts of expected long-term metals prices prepared by analysts. These estimates often differ from current price levels, but our methodology is consistent with how a market participant would assess future long term metals prices. In 2008, we have used an estimated long-term future gold price of $850 per ounce (2007: $800 per ounce), and an estimated long-term future copper price of $1.50 per pound for 2009 (2007: $2.50 per pound) and $2.00 per pound thereafter.
Our estimates of future cash costs of production and capital expenditures are based on the LOM plans for each reporting unit. Costs incurred in currencies other than the US dollar are translated to US dollars using expected long-term exchange rates based on the relevant forward pricing curve. Oil prices are a significant component, both direct and indirect, of our expected cash costs of production. We have used an estimated average oil price of $75 per barrel, which is based on the spot price, forward pricing curve, and long term oil price forecasts prepared by analysts.
The discount rates used in determining the present value of a reporting unit are based upon our real weighted average cost of capital, with appropriate adjustment for the remaining life of the mine and risks associated with the relevant cash flows based on the geographic location of the reporting unit. These risk adjustments were based on observed historical country risk premiums and the average credit default swap spreads. In 2008, we used the following real discount rates for our gold mines: United States 2.68%–4.03% (2007: 3.97%); Canada 3.29% (2007: 4.54%); Australia 3.66%–4.29% (2007: 4.98%); Argentina 13.74% (2007: 9.18%); Tanzania 8.49%–9.84% (2007: 7.01%); Papua New Guinea 9.84% (2007: 7.86%); and Peru 6.33%–6.96% (2007: 5.4%). For our copper mines, we used the following real discount rates for 2008: Australia 6.95% (2007: 8.64%); and Chile 8.83% (2007: 8.36%). The increase in discount rates compared to the prior year primarily reflects higher equity premiums over the risk-free borrowing rate, and an increase in country risk premiums due to rising credit spreads and increased political risk in certain jurisdictions.
For our gold reporting units, we apply a market multiple to the NAV computed using the present value of future cash flows approach in order to assess their estimated fair value. Gold companies typically trade at a market capitalization that is based on a multiple of their underlying NAV. Consequently, a market participant would generally apply a NAV multiple when estimating the fair value of an operating gold mine.
67
The selected multiple for a particular reporting unit considers its remaining economic life, the expected potential beyond proven and probable reserves and any other factors relevant to the valuation of a property. For reporting units with operating lives of five years or less, we selected multiples on the lower end of the observed multiples range. Reporting units with operating lives greater than five years were generally based on the median and/or average observed multiples. In 2008, we have used the following multiples in our assessment of the fair value of our gold reporting units: North America 1.0–2.1 (2007: 1.0–2.0); Australia 1.0–1.6 (2007: 1.5–2.1); South America 1.0–1.4 (2007: 1.2–1.7); and Africa 1.0–1.6 (2007: 1.3–2.0).
Due to the fact that goodwill is tested for impairment at a mine site level and operating mines have a finite reserve life, goodwill impairment charges are inevitable. By the end of the life the likelihood of impairment charges increases as mines near the end of their reserve lives. In 2008, we recorded total goodwill impairment charges of $678 million, including: $272 million at our Kanowna gold mine in Australia primarily due to the overall decline in the trading multiples on gold mining companies and higher discount factors; $216 million at our North Mara gold mine in Africa due to the overall decline in trading multiples of gold mining companies and higher discount factors; $88 million at our Barrick Energy business unit due to the significant decline in oil price since its acquisition date; $64 million at our Osborne copper mine in Australia due to a decline in our copper price assumptions, which resulted in a reduction in estimated production levels and remaining mine life; and $30 million at our Henty gold mine in Australia primarily a result of its short remaining mine life.
Individual mines have a finite reserve life. Consequently mines with a short remaining reserve life are generally at greater risk of incurring a goodwill impairment charge. Based on our most recent life of mine plans, Pierina, Tulawaka, Osborne, Henty, Golden Sunlight and Storm have remaining reserve lives of four years or less. The aggregate goodwill carrying amount for these mines at December 31, 2008 was $70 million. The most significant factors impacting the outcome of goodwill impairment tests are market gold and copper prices; and discount rates and market multiple assumptions used in the estimation of the value of reporting units. An adverse change in any one or a combination of these factors could lead to the recognition of further impairment charges in the future periods. The mines most likely to be affected by an adverse change in these factors include the Zaldívar copper mine due to the significant recent decline in copper prices and risk of a further decline in copper prices that could cause us to lower our long-term copper price estimate; and the Porgera gold mine due to an increase in the discount rate largely due to sovereign credit spreads widening for Papua New Guinea and the recent decline in observed market multiples whereby a continuation of these two trends could potentially impact the outcome of the goodwill impairment test in future periods.
Production Stage
We assess each mine construction project to determine when a mine moves into production stage. The criteria used to assess the start date are determined based on the unique nature of each mine construction project, such as the complexity of a plant or its location. We consider various relevant criteria to assess when the mine is substantially complete and ready for its intended use and moved into production stage. Some of the criteria considered would include, but are not limited to, the following: (1) the level of capital expenditures compared to construction cost estimates; (2) completion of a reasonable period of testing of mine plant and equipment; (3) ability to produce minerals in saleable form (within specifications); and (4) ability to sustain ongoing production of minerals.
When a mine construction project moves into the production stage, the capitalization of certain mine construction costs ceases and costs are either capitalized to inventory or expensed, except for capitalizable costs related to property, plant and equipment additions or improvements, underground mine development or reserve development.
Pre-production stripping costs are capitalized until an “other than de minimis” level of mineral is produced, after which time such costs are either capitalized to inventory or expensed. We consider various relevant criteria to assess when an “other than de minimis” level of mineral is produced. Some of the criteria considered would include, but are not limited to, the following: (1) the amount of ounces mined versus total ounces in reserves; (2) the amount of ore tons mined vs. total LOM expected ore tons mined; (3) the current stripping ratio versus the LOM strip ratio; and (4) the ore grade versus the LOM grade.
68
Fair Value of Asset Retirement Obligations (“AROs”)
AROs arise from the acquisition, development, construction and normal operation of mining property, plant and equipment, due to government controls and regulations that protect the environment and public safety on the closure and reclamation of mining properties. We record the fair value of an ARO in our Consolidated Financial Statements when it is incurred and capitalize this amount as an increase in the carrying amount of the related asset. At operating mines, the increase in an ARO is recorded as an adjustment to the corresponding asset carrying amount and results in a prospective increase in amortization expense. At closed mines, any adjustment to an ARO is charged directly to earnings.
The fair values of AROs are measured by discounting the expected cash flows using a discount factor that reflects the credit-adjusted risk-free rate of interest. We prepare estimates of the timing and amounts of expected cash flows when an ARO is incurred, which are updated to reflect changes in facts and circumstances, or if we are required to submit updated mine closure plans to regulatory authorities. In the future, changes in regulations or laws or enforcement could adversely affect our operations; and any instances of non-compliance with laws or regulations that result in fines or injunctions or delays in projects, or any unforeseen environmental contamination at, or related to, our mining properties, could result in us suffering significant costs. We mitigate these risks through environmental and health and safety programs under which we monitor compliance with laws and regulations and take steps to reduce the risk of environmental contamination occurring. We maintain insurance for some environmental risks, however, for some risks, coverage cannot be purchased at a reasonable cost. Our coverage may not provide full recovery for all possible causes of loss. The principal factors that can cause expected cash flows to change are: the construction of new processing facilities; changes in the quantities of material in reserves and a corresponding change in the life of mine plan; changing ore characteristics that ultimately impact the environment; changes in water quality that impact the extent of water treatment required; and changes in laws and regulations governing the protection of the environment. In general, as the end of the mine life nears, the reliability of expected cash flows increases, but earlier in the mine life, the estimation of an ARO is inherently more subjective. Significant judgments and estimates are made when estimating the fair value of AROs. Expected cash flows relating to AROs could occur over periods up to 40 years and the assessment of the extent of environmental remediation work is highly subjective. Considering all of these factors that go into the determination of an ARO, the fair value of AROs can materially change over time.
At our operating mines, we continue to record AROs based on disturbance of the environment over time. It is reasonably possible that circumstances could arise during or by the end of the mine life that will require material revisions to AROs. In particular, the extent of water treatment can have a material effect on the fair value of AROs, and the expected water quality at the end of the mine life, which is the primary driver of the extent of water treatment, can change significantly. We periodically prepare updated studies for our mines, following which it may be necessary to adjust the fair value of AROs. The period of time over which we have assumed that water quality monitoring and treatment will be required has a significant impact on AROs at closed mines. The amount of AROs recorded reflects the expected cost, taking into account the probability of particular scenarios. The difference between the upper end of the range of these assumptions and the lower end of the range can be significant, and consequently changes in these assumptions could have a material effect on the fair value of AROs and future earnings in a period of change.
At one closed mine, the principal uncertainty that could impact the fair value of the ARO is the manner in which a tailings facility will need to be remediated. In measuring the ARO, we have concluded that there are two possible methods that could be used. We have recorded the ARO using the more costly method until such time that the less costly method can be proven as technically feasible and approved.
AROs
($ millions) |
|
|
|
|
| ||
As at December 31 |
| 2008 |
| 2007 |
| ||
Operating mines |
| $ | 832 |
| $ | 769 |
|
Closed mines |
| 201 |
| 197 |
| ||
Development projects |
| 17 |
| — |
| ||
Other |
| 16 |
| — |
| ||
Total |
| $ | 1,066 |
| $ | 966 |
|
69
Deferred Tax Assets and Liabilities
Measurement of Temporary Differences
We are periodically required to estimate the tax basis of assets and liabilities. Where applicable tax laws and regulations are either unclear or subject to varying interpretations, it is possible that changes in these estimates could occur that materially affect the amounts of deferred income tax assets and liabilities recorded in our Financial Statements. Changes in deferred tax assets and liabilities generally have a direct impact on earnings in the period of changes.
Valuation Allowances
Each period, we evaluate the likelihood of whether some portion or all of each deferred tax asset will not be realized. This evaluation is based on historic and future expected levels of taxable income, the pattern and timing of reversals of taxable temporary timing differences that give rise to deferred tax liabilities, and tax planning activities. Levels of future taxable income are affected by, among other things, market gold prices, and production costs, quantities of proven and probable gold and copper reserves, interest rates and foreign currency exchange rates. If we determine that it is more likely than not (a likelihood of more than 50%) that all or some portion of a deferred tax asset will not be realized, we record a valuation allowance against the amount we do not expect to realize. Changes in valuation allowances are recorded as a component of income tax expense or recovery for each period. The most significant recent trend impacting expected levels of future taxable income and the amount of valuation allowances, has been rising market gold prices. A continuation of a trend of higher gold prices could lead to the release of some of the valuation allowances recorded, with a corresponding effect on earnings in the period of release. Conversely, a decline in market gold prices could lead to an increase in valuation allowances and a corresponding increase in income tax expense.
In 2008, we released $175 million of valuation allowances primarily because sources of income became available that enabled tax losses and US Alternative Minimum Tax (“AMT”) credits to be realized.
In 2007, we released $156 million of end of year valuation allowances in Tanzania due to the estimated effect of higher market gold prices on the ability to utilize deferred tax assets. We released other valuation allowances during 2007 totaling $88 million, partly because sources of income became available that enabled tax losses to be realized.
In 2006, we released $25 million of valuation allowances in the United States due to the estimated effect of higher market gold prices on the ability to utilize deferred tax assets. Also in 2006, we released $9 million of valuation allowances in a Chilean entity due to the availability of income, and we released valuation allowances of $19 million in Canada, reflecting utilization of capital losses.
Valuation Allowances
($ millions) |
|
|
|
|
| ||
As at December 31 |
| 2008 |
| 2007 |
| ||
United States |
| $ | 123 |
| $ | 190 |
|
Chile |
| 23 |
| 105 |
| ||
Argentina |
| 61 |
| 26 |
| ||
Canada |
| 50 |
| 55 |
| ||
Tanzania |
| 30 |
| 30 |
| ||
Other |
| 31 |
| 13 |
| ||
Total |
| $ | 318 |
| $ | 419 |
|
United States: most of the valuation allowances relate to AMT credits, which have an unlimited carry-forward period. Increasing levels of future taxable income due to higher gold selling prices and other factors and circumstances may result in our becoming a regular taxpayer under the US regime, which may cause us to release some, or all, of the valuation allowance on the AMT credits.
Chile, Argentina and Tanzania: the valuation allowances relate to the full amount of tax assets in subsidiaries that do not have any present sources of gold production or taxable income. In the event that these subsidiaries have sources of taxable income in the future, we may release some or all of the valuation allowances.
Canada: substantially all of the valuation allowances relate to capital losses that can only be utilized if any capital gains are realized.
70
Internal Control over Financial Reporting and Disclosure Controls and Procedures
Management is responsible for establishing and maintaining adequate internal control over financial reporting and other financial disclosure. Internal control over financial reporting is a process designed to provide reasonable assurance regarding the reliability of financial reporting and the preparation of financial statements for external purposes in accordance with US GAAP.
The Company’s internal control over financial reporting includes those policies and procedures that (i) pertain to the maintenance of records that, in reasonable detail, accurately and fairly reflect the transactions and dispositions of the assets of the Company; (ii) provide reasonable assurance that transactions are recorded as necessary to permit preparation of financial statements in accordance with US GAAP, and that receipts and expenditures of the Company are being made only in accordance with authorizations of management and directors of the Company; and (iii) provide reasonable assurance regarding prevention or timely detection of unauthorized acquisition, use or disposition of the Company’s assets that could have a material effect on the Company’s Financial Statements.
Internal control over other financial disclosure is a process designed to ensure that other financial information included in this MD&A and Barrick’s Annual Report, fairly present in all material respects the financial condition, results of operations and cash flows of the Company for the periods presented in this report. The Company’s disclosure controls and procedures are designed to ensure that material information relating to the Company, including its consolidated subsidiaries, is made known to Management by others within those entities, particularly during the period in which this report is being prepared.
Due to its inherent limitations, internal control over financial reporting and disclosure may not prevent or detect all misstatements. Also, projections of any evaluation of effectiveness to future periods are subject to the risk that controls may become inadequate because of changes in conditions, or that the degree of compliance with the policies or procedures may change.
The management of Barrick, with the participation of our chief executive and financial officers, have evaluated the effectiveness of the design and operation of the internal controls over financial reporting and disclosure controls and procedures as of the end of the period covered by this report and have concluded that they were effective at a reasonable assurance level.
Barrick’s annual management report on internal control over financial reporting and the integrated audit report of Barrick’s auditors for the year ended December 31, 2008 will be included in Barrick’s 2008 Annual Report and its 2008 Form 40-F/Annual Information Form on file with the SEC and Canadian provincial securities regulatory authorities.
International Financial Reporting Standards (IFRS)
Barrick is a ‘domestic issuer’ under Canadian securities law and a ‘foreign private issuer’ under US Securities and Exchange Commission (SEC) regulations. We file our financial statements with both Canadian and US securities regulators in accordance with US GAAP, as permitted under current regulations. Effective January 1, 2011, all publicly accountable Canadian enterprises must apply IFRS. In December 2007, the SEC confirmed that foreign private issuers will be entitled to file financial statements in accordance with IFRS without reconciliation to US GAAP. As a result of these regulatory developments, we completed an initial assessment of the merits of a potential conversion to IFRS and, in third quarter 2008, we made a decision to convert to IFRS and begin filing financial statements prepared under IFRS in our 2011 fiscal year consistent with other Canadian issuers, primarily to improve the comparability of our financial results with those of other gold mining companies.
The conversion to IFRS from US GAAP is a significant undertaking, and as a result, we established a dedicated IFRS conversion team in early 2009 to lead this process. The conversion to IFRS may have a material effect on our:
· reported financial position and results of operations;
· systems of internal controls and procedures over financial reporting, including related business processes;
· information technology and data systems;
71
· disclosure controls and procedures;
· current financial reporting training curriculum; and
· downstream business activities such as our corporate hedging programs, joint venture agreements and other contractual arrangements, debt covenants, compensation programs and tax planning arrangements.
The IFRS conversion team is responsible for preparing our detailed IFRS conversion plan. We expect to complete the detailed IFRS conversion plan by the end of first quarter 2009.
We are in the process of completing our detailed technical analysis of US GAAP-IFRS accounting differences, which we expect to complete by the end of the third quarter 2009. Furthermore, IFRS accounting standards, and the interpretation thereof, are constantly evolving and therefore are subject to change through the end of 2011. Consequently, our IFRS conversion team will continuously monitor IFRS accounting developments and update our conversion plan and public disclosure as necessary.
Non-GAAP Financial Measures
Adjusted Net Income (Adjusted Net Income per Share)
Adjusted net income is a non-GAAP financial measure which excludes the following from net income:
· impairment charges related to goodwill, property, plant and equipment, and investments;
· gains/losses on the disposition of long-lived assets;
· foreign currency translation gains/losses; and
· unrealized gains/losses on non-hedge derivative instruments.
Management uses this measure internally to evaluate the underlying operating performance of the Company as a whole for the reporting periods presented, and to assist with the planning and forecasting of future operating results. We believe that adjusted net income allows investors and analysts to better evaluate the results of the underlying business of the Company.
While the adjustments to net income in this measure include items that are recurring, management believes that adjusted net income is a useful measure of the Company’s performance because impairment charges and gains/losses on asset dispositions do not reflect the underlying operating performance of our core mining business and are not necessarily indicative of future operating results. Further, foreign currency translation gains/losses and unrealized gains/losses from non-hedge derivative contracts are not necessarily reflective of the underlying operating results for the reporting periods presented.
As noted, the Company uses this measure for its own internal purposes. Management’s internal budgets and forecasts and public guidance do not reflect potential impairment charges, potential gains/losses on the disposition of assets, foreign currency translation gains/losses, or unrealized gains/losses on non-hedge derivative contracts. Consequently, the presentation of adjusted net income enables investors and analysts to better understand the underlying operating performance of our core mining business through the eyes of Management. Management periodically evaluates the components of adjusted net income based on an internal assessment of performance measures that are useful for evaluating the operating performance of our business segments and a review of the non-GAAP measures used by mining industry analysts and other mining companies.
Adjusted net income is intended to provide additional information only and does not have any standardized meaning prescribed by US GAAP and should not be considered in isolation or as a substitute for measures of performance prepared in accordance with US GAAP. The measure is not necessarily indicative of operating profit or cash flow from operations as determined under US GAAP. Other companies may calculate this measure differently. The following table reconciles this non-GAAP measure to the most directly comparable US GAAP measure.
72
Reconciliation of Net Income to Adjusted Net Income
|
|
|
|
|
|
|
| For the three months |
| |||||||||
|
| For the years ended December 31 |
| ended December 31 |
| |||||||||||||
($ millions, except per share amounts in dollars) |
| 2008 |
| 2007 |
| 2006 |
| 2008 |
| 2007 |
| |||||||
Net income |
| $ | 785 |
| $ | 1,119 |
| $ | 1,506 |
| $ | (468 | ) | $ | 537 |
| ||
Impairment charges related to goodwill, property, plant and equipment, and investments |
| 899 |
| 59 |
| 17 |
| 773 |
| 54 |
| |||||||
(Gains)/losses on the disposition of long-lived assets |
| (178 | ) | (59 | ) | (301 | ) | (123 | ) | 6 |
| |||||||
Foreign currency translation (gains)/losses |
| 135 |
| (73 | ) | (7 | ) | 84 |
| (11 | ) | |||||||
Unrealized (gains)/losses on non-hedge derivative instruments |
| 20 |
| (10 | ) | 15 |
| 11 |
| 11 |
| |||||||
Adjusted net income |
| $ | 1,661 |
| $ | 1,036 |
| $ | 1,230 |
| $ | 277 |
| $ | 597 |
| ||
Adjusted net income per share(1) |
| $ | 1.90 |
| $ | 1.19 |
| $ | 1.46 |
| $ | 0.32 |
| $ | 0.69 |
| ||
(1) Calculated using net income and weighted average number of shares outstanding under the basic method of earnings per share.
Total Cash Costs
Total cash costs per ounce/pound are non-GAAP financial measures. Total cash costs include all costs absorbed into inventory, as well as royalties, by-product credits, and production taxes, and exclude inventory purchase accounting adjustments, unrealized gains/losses from non-hedge currency and commodity contracts, and amortization and accretion. Total cash costs also includes the gross margin generated by our Barrick Energy business unit, which was acquired to provide a long-term economic hedge of our exposure to oil prices, as a credit against gold cash costs. The presentation of these statistics in this manner allows us to monitor and manage those factors that impact production costs on a monthly basis. We calculate total cash costs based on our equity interest in production from our mines. Total cash costs per ounce/pound are calculated by dividing the aggregate of these costs by gold ounces and copper pounds sold. Total cash costs and total cash costs per ounce/pound are calculated on a consistent basis for the periods presented.
In our income statement, we present amortization separately from cost of sales. Some companies include amortization in cost of sales, which results in a different measurement of cost of sales in the income statement. Under purchase accounting rules, we record the fair value of acquired work in progress and finished goods inventories as at the date of acquisition. As the acquired inventory is sold, any purchase accounting adjustments, reflected in the carrying amount of inventory at acquisition, impacts cost of sales. The method of valuing these inventories is based on estimated selling prices less costs to complete and a reasonable profit margin. Consequently, the fair values do not necessarily reflect costs to produce consistent with ore mined and processed into gold and copper after the acquisition. Many mining companies record the unrealized gains/losses from non-hedge currency and commodity contracts in other income, and therefore these amounts are not reflected in the cost of sales/cash costs measures presented by these companies. Consequently, we believe that removing these unrealized gains/losses provides investors and analysts with a measure of our cash costs of production that is more comparable to the cash costs measures presented by other mining companies. We have provided below reconciliations to illustrate the impact of excluding amortization and accretion, inventory purchase accounting adjustments and unrealized gains/losses from non-hedge currency and commodity contracts from total cash costs per ounce/pound statistics.
We believe that using an equity interest presentation is a fairer, more accurate way to measure economic performance than using a consolidated basis. For mines where we hold less than a 100% share in the production, we exclude the economic share of gold production that flows to our partners who hold a non-controlling interest. Consequently, for the Tulawaka mine, although we fully consolidated the results of operations from this mine in our consolidated financial statements, our production and total cash cost statistics only reflect our equity share of the production.
In 2008, we have provided an alternative measure of total gold cash costs per ounce which treats the gross margin from all non-gold sales, whether or not these non-gold metals are produced in conjunction with gold, as a credit against the cost of producing gold. A number of other gold producers present total
73
cash costs net of the contribution from non-gold sales. We believe that including a measure of total gold cash costs per ounce on this basis provides investors and analysts with information with which to compare our performance to other gold producers, and to assess the overall performance of our gold mining business. In addition, this measure provides information to enable investors and analysts to understand the importance of non-gold revenues to our cost structure.
Total cash costs per ounce/pound statistics are intended to provide additional information, do not have any standardized meaning prescribed by US GAAP and should not be considered in isolation or as a substitute for measures of performance prepared in accordance with US GAAP. The measures are not necessarily indicative of operating profit or cash flow from operations as determined under US GAAP. Other companies may calculate these measures differently.
Reconciliation of Cost of Sales to Total Cash Costs per Ounce/Pound
($ millions, except per ounce/pound information in dollars) |
| Gold |
| Copper |
| ||||||||||||||
For the years ended December 31 |
| 2008 |
| 2007 |
| 2006 |
| 2008 |
| 2007 |
| 2006 |
| ||||||
Cost of sales |
| $ | 3,426 |
| $ | 2,805 |
| $ | 2,319 |
| $ | 436 |
| $ | 339 |
| $ | 391 |
|
Cost of sales attributable to discontinued operations |
| — |
| (9 | ) | 51 |
| — |
| — |
| — |
| ||||||
Cost of sales attributable to non-controlling interests(1) |
| (14 | ) | (15 | ) | (12 | ) | — |
| — |
| — |
| ||||||
Unrealized non-hedge gains/(losses) on currency and commodity contracts |
| (15 | ) | (5 | ) | — |
| — |
| — |
| — |
| ||||||
Inventory purchase accounting adjustments |
| (16 | ) | — |
| (11 | ) | — |
| (9 | ) | (97 | ) | ||||||
Impact of Barrick Energy |
| (14 | ) | — |
| — |
| — |
| — |
| — |
| ||||||
Total cash costs |
| 3,367 |
| 2,776 |
| 2,347 |
| 436 |
| 330 |
| 294 |
| ||||||
Ounces/pounds sold – consolidated basis (000s) |
| 7,658 |
| 8,108 |
| 8,566 |
| 367 |
| 401 |
| 376 |
| ||||||
Ounces/pounds sold – non-controlling interest (000s) |
| (63 | ) | (53 | ) | (176 | ) | — |
| — |
| — |
| ||||||
Ounces/pounds sold – equity basis (000s) |
| 7,595 |
| 8,055 |
| 8,390 |
| 367 |
| 401 |
| 376 |
| ||||||
Total cash costs per ounce/per pound |
| $ | 443 |
| $ | 345 |
| $ | 280 |
| $ | 1.19 |
| $ | 0.82 |
| $ | 0.78 |
|
(1) Relates to a 70% interest in Tulawaka and a 50% interest in South Deep prior to 2007.
Total Gold Cash Costs per Ounce – Full Credit for Non-Gold Sales
|
|
|
|
|
|
|
| For the three months |
| |||||||
|
| For the years ended December 31 |
| ended December 31 |
| |||||||||||
($ millions, except per ounce/pound data in dollars) |
| 2008 |
| 2007 |
| 2006 |
| 2008 |
| 2007 |
| |||||
Ounces gold sold – equity basis (000s) |
| 7,595 |
| 8,055 |
| 8,390 |
| 2,190 |
| 2,042 |
| |||||
Total cash costs per – ounce equity basis |
| $ | 443 |
| $ | 345 |
| $ | 280 |
| $ | 471 |
| $ | 369 |
|
Revenues from copper sales |
| $ | 1,228 |
| $ | 1,305 |
| $ | 1,137 |
| $ | 321 |
| $ | 273 |
|
Unrealized non-hedge gains/(losses) from copper contracts |
| 14 |
| (16 | ) | 13 |
| (3 | ) | 16 |
| |||||
Net revenues from copper excluding unrealized non-hedge gains/losses from copper contracts |
| 1,242 |
| 1,289 |
| 1,150 |
| 318 |
| 289 |
| |||||
Copper cost of sales per consolidated statement of income |
| 436 |
| 339 |
| 391 |
| 122 |
| 76 |
| |||||
Inventory purchase accounting adjustments included in cost of sales |
| — |
| (9 | ) | (97 | ) | — |
| — |
| |||||
Cost of sales – copper |
| $ | 436 |
| $ | 348 |
| $ | 488 |
| $ | 122 |
| $ | 76 |
|
Gross margin – copper |
| 806 |
| 941 |
| 662 |
| 196 |
| 213 |
| |||||
Copper gross margin per ounce |
| 106 |
| 117 |
| 79 |
| 89 |
| 104 |
| |||||
Total gold cash costs per ounce – full credit basis for non-gold sales |
| $ | 337 |
| $ | 228 |
| $ | 201 |
| $ | 382 |
| $ | 265 |
|
74
EBITDA
EBITDA is a non-GAAP financial measure, which excludes the following from net income:
· income tax expense;
· interest expense;
· interest income; and
· depreciation and amortization.
Management believes that EBITDA is a valuable indicator of the Company’s ability to generate liquidity by producing operating cash flow to: fund working capital needs, service debt obligations, and fund capital expenditures. Management uses EBITDA for this purpose. EBITDA is also frequently used by investors and analysts for valuation purposes whereby EBITDA is multiplied by a factor or “EBITDA multiple” that is based on observed or inferred relationship between EBITDA and market values to determine the approximate total enterprise value of a company.
EBITDA is intended to provide additional information to investors and analysts, does not have any standardized meaning prescribed by US GAAP and should not be considered in isolation or as a substitute for measures of performance prepared in accordance with US GAAP.EBITDA excludes the impact of cash costs of financing activities and taxes, and the effects of changes in operating working capital balances, and therefore is not necessarily indicative of operating profit or cash flow from operations as determined under US GAAP. Other companies may calculate EBITDA differently.
The following table provides a reconciliation of EBITDA to net income.
Reconciliation of Net Income to EBITDA
|
|
|
|
|
|
|
| For the three months |
| |||||||
|
| For the years ended December 31 |
| ended December 31 |
| |||||||||||
($ millions, except per share amounts in dollars) |
| 2008 |
| 2007 |
| 2006 |
| 2008 |
| 2007 |
| |||||
Net income |
| $ | 785 |
| $ | 1,119 |
| $ | 1,506 |
| $ | (468 | ) | $ | 537 |
|
Income tax expense |
| 590 |
| 341 |
| 348 |
| 164 |
| 15 |
| |||||
Interest expense |
| 21 |
| 113 |
| 126 |
| — |
| 22 |
| |||||
Interest income |
| (39 | ) | (141 | ) | (110 | ) | (5 | ) | (34 | ) | |||||
Depreciation and amortization |
| 990 |
| 1,004 |
| 735 |
| 264 |
| 253 |
| |||||
EBITDA |
| $ | 2,347 |
| $ | 2,436 |
| $ | 2,605 |
| $ | (45 | ) | $ | 793 |
|
Realized Prices
Realized price is a non-GAAP financial measure which excludes from sales:
· unrealized gains and losses on non-hedge derivative contracts, and
· unrealized mark-to-market gains and losses on outstanding receivables from copper and gold sales contracts.
This measure is intended to enable management to better understand the price realized in each reporting period for gold and copper sales because unrealized mark-to-market value of non-hedge gold and copper derivatives and unrealized mark-to-market gains and losses on outstanding receivables from copper and gold sales contracts are subject to change each period due to changes in market factors such as spot and forward gold and copper prices such that prices ultimately realized may differ from those recorded. The exclusion of such unrealized mark-to-market gains and losses from the presentation of this performance measure enables investors to understand performance based on the realized proceeds of selling gold and copper production. The gains and losses on non-hedge derivatives and receivable balances relate to instruments/balances that mature in future periods, at which time the gains and losses will become realized. The amounts of these gains and losses reflect fair values based on market valuation assumptions at the end of each period and do not necessarily represent the amounts that will become realized on maturity. For those reasons, Management believes that this measure provides a more accurate reflection of the Company’s past performance and is a better indicator of its expected performance in future periods.
The realized price measure is intended to provide additional information, and does not have any standardized meaning prescribed by US GAAP and should not be considered in isolation or as a substitute for measures of performance prepared in accordance with US GAAP. The measure is not necessarily indicative of sales as determined under US GAAP. Other companies may calculate this measure differently. The following table reconciles realized prices to the most directly comparable US GAAP measure.
75
Reconciliation of Sales to Realized Price per Ounce/per Pound
($ millions, except per ounce/pound data in dollars) |
| Gold |
| Copper |
| ||||||||||||||
For the years ended December 31 |
| 2008 |
| 2007 |
| 2006 |
| 2008 |
| 2007 |
| 2006 |
| ||||||
Sales |
| $ | 6,656 |
| $ | 5,027 |
| $ | 4,493 |
| $ | 1,228 |
| $ | 1,305 |
| $ | 1,137 |
|
Sales attributable to non-controlling interests |
| (56 | ) | (38 | ) | 52 |
| — |
| — |
| — |
| ||||||
Unrealized non-hedge gold/copper derivative (gains) losses |
| 2 |
| (2 | ) | 7 |
| (23 | ) | (26 | ) | 13 |
| ||||||
Unrealized mark-to-market provisional price adjustments |
| (1 | ) | (2 | ) | 1 |
| 38 |
| 10 |
| — |
| ||||||
Sales – as adjusted |
| 6,601 |
| 4,985 |
| 4,553 |
| 1,243 |
| 1,289 |
| 1,150 |
| ||||||
Ounces/pounds sold (000s) |
| 7,595 |
| 8,055 |
| 8,390 |
| 367 |
| 401 |
| 376 |
| ||||||
Realized gold/copper price per ounce/pound |
| $ | 870 |
| $ | 619 |
| $ | 543 |
| $ | 3.39 |
| $ | 3.22 |
| $ | 3.06 |
|
Cash Margin per Ounce
Management uses a non-GAAP financial measure cash margin per ounce that represents realized price per ounce less total cash costs per ounce. This measure is used by management to analyze trends in our profitability on a unit basis and to assess the cash generating capabilities of our operating mines in each reporting period for gold and copper sales.
Management believes that this measure reflects the net contribution from our gold sales and is an important indicator of expected performance in future periods. Our cash margin per ounce is intended to provide additional information, does not have any standardized meaning prescribed by US GAAP and should not be considered in isolation or as a substitute for measures of performance prepared in accordance with US GAAP. This measure is not necessarily indicative of operating profit or cash flow from operations as determined under US GAAP. Other companies may calculate cash margin per ounce differently. The following table derives this non-GAAP measure from previously defined non-GAAP measures of realized gold/copper price per ounce and total cash costs per ounce.
Reconciliation of Cash Margin per Ounce
(per ounce data in dollars) |
|
|
|
|
|
|
| |||
For the years ended December 31 |
| 2008 |
| 2007 |
| 2006 |
| |||
Realized gold price per ounce |
| $ | 870 |
| $ | 619 |
| $ | 543 |
|
Total cash costs per ounce |
| 443 |
| 345 |
| 280 |
| |||
Cash margin per ounce |
| $ | 427 |
| $ | 274 |
| $ | 263 |
|
76
Glossary of Technical Terms
AUTOCLAVE: Oxidation process in which high temperatures and pressures are applied to convert refractory sulfide mineralization into amenable oxide ore.
BACKFILL: Primarily waste sand or rock used to support the roof or walls after removal of ore from a stope.
BY-PRODUCT: A secondary metal or mineral product recovered in the milling process such as copper and silver.
CONCENTRATE: A very fine, powder-like product containing the valuable ore mineral from which most of the waste mineral has been eliminated.
CONTAINED OUNCES: Represents ounces in the ground before reduction of ounces not able to be recovered by the applicable metallurgical process.
CONTANGO: The positive difference between the spot market gold price and the forward market gold price. It is often expressed as an interest rate quoted with reference to the difference between inter-bank deposit rates and gold lease rates.
DEVELOPMENT: Work carried out for the purpose of opening up a mineral deposit. In an underground mine this includes shaft sinking, crosscutting, drifting and raising. In an open pit mine, development includes the removal of overburden.
DILUTION: The effect of waste or low-grade ore which is unavoidably included in the mined ore, lowering the recovered grade.
DORÉ: Unrefined gold and silver bullion bars usually consisting of approximately 90 percent precious metals that will be further refined to almost pure metal.
DRILLING:
Core: drilling with a hollow bit with a diamond cutting rim to produce a cylindrical core that is used for geological study and assays. Used in mineral exploration.
In-fill: any method of drilling intervals between existing holes, used to provide greater geological detail and to help establish reserve estimates.
EXPLORATION: Prospecting, sampling, mapping, diamond-drilling and other work involved in searching for ore.
GRADE: The amount of metal in each ton of ore, expressed as troy ounces per ton or grams per tonne for precious metals and as a percentage for most other metals.
Cut-off grade: the minimum metal grade at which an orebody can be economically mined (used in the calculation of ore reserves).
Mill-head grade: metal content of mined ore going into a mill for processing.
Recovered grade: actual metal content of ore determined after processing.
Reserve grade: estimated metal content of an orebody, based on reserve calculations.
HEAP LEACHING: A process whereby gold is extracted by “heaping” broken ore on sloping impermeable pads and continually applying to the heaps a weak cyanide solution which dissolves the contained gold. The gold-laden solution is then collected for gold recovery.
HEAP LEACH PAD: A large impermeable foundation or pad used as a base for ore during heap leaching.
MILL: A processing facility where ore is finely ground and thereafter undergoes physical or chemical treatment to extract the valuable metals.
MINERAL RESERVE: See pages 141 to 148 — “Summary Gold Mineral Reserves and Mineral Resources.”
MINERAL RESOURCE: See pages 141 to 148 — “Summary Gold Mineral Reserves and Mineral Resources.”
MINING CLAIM: That portion of applicable mineral lands that a party has staked or marked out in accordance with applicable mining laws to acquire the right to explore for and exploit the minerals under the surface.
MINING RATE: Tons of ore mined per day or even specified time period.
OPEN PIT: A mine where the minerals are mined entirely from the surface.
ORE: Rock, generally containing metallic or non-metallic minerals, which can be mined and processed at a profit.
ORE BODY: A sufficiently large amount of ore that can be mined economically.
OUNCES: Troy ounces of a fineness of 999.9 parts per 1,000 parts.
RECLAMATION: The process by which lands disturbed as a result of mining activity are modified to support beneficial land use. Reclamation activity may include the removal of buildings, equipment, machinery and other physical remnants of mining, closure of tailings storage facilities, leach pads and other mine features, and contouring, covering and re-vegetation of waste rock and other disturbed areas.
RECOVERY RATE: A term used in process metallurgy to indicate the proportion of valuable material physically recovered in the processing of ore. It is generally stated as a percentage of the material recovered compared to the total material originally present.
REFINING: The final stage of metal production in which impurities are removed from the molten metal.
STRIPPING: Removal of overburden or waste rock overlying an ore body in preparation for mining by open pit methods. Expressed as the total number of tons mined or to be mined for each ounce of gold.
TAILINGS: The material that remains after all economically and technically recoverable precious metals have been removed from the ore during processing.
77
Management’s Responsibility
Management’s Responsibility for Financial Statements
The accompanying consolidated financial statements have been prepared by and are the responsibility of the Board of Directors and Management of the company.
The consolidated financial statements have been prepared in accordance with United States generally accepted accounting principles and reflect Management’s best estimates and judgments based on currently available information. The company has developed and maintains a system of internal accounting controls in order to ensure, on a reasonable and cost effective basis, the reliability of its financial information.
The consolidated financial statements have been audited by PricewaterhouseCoopers LLP, Chartered Accountants. Their report outlines the scope of their examination and opinion on the consolidated financial statements.

Jamie C. Sokalsky
Executive Vice President
and Chief Financial Officer
Toronto, Canada
February 19, 2009
78
Management’s Report on Internal Control Over Financial Reporting
Barrick’s management is responsible for establishing and maintaining adequate internal control over financial reporting.
Barrick’s management assessed the effectiveness of the company’s internal control over financial reporting as at December 31, 2008. Barrick’s Management used the Committee of Sponsoring Organizations of the Treadway Commission (COSO) framework to evaluate the effectiveness of Barrick’s internal control over financial reporting. Based on Barrick management’s assessment, Barrick’s internal control over financial reporting is effective as at December 31, 2008.
The effectiveness of the Company’s internal control over financial reporting as at December 31, 2008 has been audited by PricewaterhouseCoopers LLP, Chartered Accountants, as stated in their report which is located on pages 80—81 of Barrick’s 2008 Annual Financial Statements.
79
Independent Auditors’ Report
Independent Auditors’ Report
To the Shareholders of
Barrick Gold Corporation
We have completed integrated audits of Barrick Gold Corporation’s (the Company) 2008, 2007 and 2006 consolidated financial statements and of its internal control over financial reporting as at December 31, 2008. Our opinions, based on our audits, are presented below.
Consolidated financial statements
We have audited the accompanying consolidated balance sheets of Barrick Gold Corporation as at December 31, 2008 and December 31, 2007, and the related consolidated statements of income, cash flow, shareholders’ equity and comprehensive income for each of the years in the three year period ended December 31, 2008. These consolidated financial statements are the responsibility of the Company’s management. Our responsibility is to express an opinion on these consolidated financial statements based on our audits.
We conducted our audits of the Company’s consolidated financial statements in accordance with Canadian generally accepted auditing standards and the standards of the Public Company Accounting Oversight Board (United States). Those standards require that we plan and perform an audit to obtain reasonable assurance about whether the financial statements are free of material misstatement. An audit of financial statements includes examining, on a test basis, evidence supporting the amounts and disclosures in the financial statements. A financial statement audit also includes assessing the accounting principles used and significant estimates made by management, and evaluating the overall financial statement presentation. We believe that our audits provide a reasonable basis for our opinion.
In our opinion, the consolidated financial statements referred to above present fairly, in all material respects, the financial position of the Company as at December 31, 2008 and December 31, 2007 and the results of its operations and its cash flows for each of the years in the three year period ended December 31, 2008 in accordance with accounting principles generally accepted in the United States of America.
80
Internal control over financial reporting
We have also audited the Company’s internal control over financial reporting as at December 31, 2008, based on criteria established in Internal Control – Integrated Framework issued by the Committee of Sponsoring Organizations of the Treadway Commission (COSO). The Company’s management is responsible for maintaining effective internal control over financial reporting and for its assessment of the effectiveness of internal control over financial reporting, included in the accompanying Report. Our responsibility is to express an opinion on the Company’s internal control over financial reporting based on our audit.
We conducted our audit of internal control over financial reporting in accordance with the standards of the Public Company Accounting Oversight Board (United States). Those standards require that we plan and perform the audit to obtain reasonable assurance about whether effective internal control over financial reporting was maintained in all material respects. An audit of internal control over financial reporting includes obtaining an understanding of internal control over financial reporting, assessing the risk that a material weakness exists, testing and evaluating the design and operating effectiveness of internal control based on the assessed risk, and performing such other procedures as we consider necessary in the circumstances. We believe that our audit provides a reasonable basis for our opinion.
A company’s internal control over financial reporting is a process designed to provide reasonable assurance regarding the reliability of financial reporting and the preparation of financial statements for external purposes in accordance with generally accepted accounting principles. A company’s internal control over financial reporting includes those policies and procedures that (i) pertain to the maintenance of records that, in reasonable detail, accurately and fairly reflect the transactions and dispositions of the assets of the company; (ii) provide reasonable assurance that transactions are recorded as necessary to permit preparation of financial statements in accordance with generally accepted accounting principles, and that receipts and expenditures of the company are being made only in accordance with authorizations of management and directors of the company; and (iii) provide reasonable assurance regarding prevention or timely detection of unauthorized acquisition, use, or disposition of the company’s assets that could have a material effect on the financial statements.
Because of its inherent limitations, internal control over financial reporting may not prevent or detect misstatements. Also, projections of any evaluation of effectiveness to future periods are subject to the risk that controls may become inadequate because of changes in conditions, or that the degree of compliance with the policies or procedures may deteriorate.
In our opinion, the Company maintained, in all material respects, effective internal control over financial reporting as at December 31, 2008 based on criteria established in Internal Control – Integrated Framework issued by the COSO.
![]()
Chartered Accountants, Licensed Public Accountants
Toronto, Canada
February 19, 2009
81
Consolidated Statements of Income
Barrick Gold Corporation |
| 2008 |
| 2007 |
| 2006 |
| |||
Sales (notes 4 and 5) |
| $ | 7,913 |
| $ | 6,332 |
| $ | 5,630 |
|
Costs and expenses |
|
|
|
|
|
|
| |||
Cost of sales (notes 4 and 6)(1) |
| 3,876 |
| 3,144 |
| 2,710 |
| |||
Amortization and accretion (notes 4 and 15) |
| 1,033 |
| 1,054 |
| 774 |
| |||
Corporate administration |
| 155 |
| 155 |
| 142 |
| |||
Exploration (notes 4 and 7) |
| 216 |
| 179 |
| 171 |
| |||
Project development expense (note 7) |
| 242 |
| 188 |
| 119 |
| |||
Other expense (note 8a) |
| 295 |
| 205 |
| 212 |
| |||
Impairment charges (note 8b) |
| 749 |
| 42 |
| 17 |
| |||
|
| 6,566 |
| 4,967 |
| 4,145 |
| |||
Interest income |
| 39 |
| 141 |
| 110 |
| |||
Interest expense (note 20b) |
| (21 | ) | (113 | ) | (126 | ) | |||
Other income (note 8c) |
| 291 |
| 110 |
| 97 |
| |||
Write-down of investments (note 8b) |
| (205 | ) | (23 | ) | (6 | ) | |||
|
| 104 |
| 115 |
| 75 |
| |||
Income from continuing operations before income taxes and other items |
| 1,451 |
| 1,480 |
| 1,560 |
| |||
Income tax expense (note 9) |
| (590 | ) | (341 | ) | (348 | ) | |||
Non-controlling interests (note 2b) |
| (12 | ) | 14 |
| 1 |
| |||
Loss from equity investees (note 12) |
| (64 | ) | (43 | ) | (4 | ) | |||
Income from continuing operations |
| 785 |
| 1,110 |
| 1,209 |
| |||
Income from discontinued operations (note 3) |
| — |
| 9 |
| 297 |
| |||
Net income for the year |
| $ | 785 |
| $ | 1,119 |
| $ | 1,506 |
|
Earnings per share data (note 10) |
|
|
|
|
|
|
| |||
Income from continuing operations |
|
|
|
|
|
|
| |||
Basic |
| $ | 0.90 |
| $ | 1.28 |
| $ | 1.44 |
|
Diluted |
| $ | 0.89 |
| $ | 1.27 |
| $ | 1.42 |
|
Net income |
|
|
|
|
|
|
| |||
Basic |
| $ | 0.90 |
| $ | 1.29 |
| $ | 1.79 |
|
Diluted |
| $ | 0.89 |
| $ | 1.28 |
| $ | 1.77 |
|
(1) Exclusive of amortization.
The accompanying notes are an integral part of these consolidated financial statements.
82
Consolidated Statements of Cash Flow
Barrick Gold Corporation |
| 2008 |
| 2007 |
| 2006 |
| |||
Operating Activities |
|
|
|
|
|
|
| |||
Net income |
| $ | 785 |
| $ | 1,119 |
| $ | 1,506 |
|
Amortization and accretion (notes 4 and 15) |
| 1,033 |
| 1,054 |
| 774 |
| |||
Impairment charges and write-down of investments (notes 8b and 12) |
| 954 |
| 65 |
| 23 |
| |||
Increase in inventory |
| (373 | ) | (252 | ) | (193 | ) | |||
Gain on sale of assets (note 8c) |
| (187 | ) | (2 | ) | (9 | ) | |||
Income tax expense (notes 9 and 24) |
| 590 |
| 341 |
| 348 |
| |||
Income taxes paid |
| (575 | ) | (585 | ) | (280 | ) | |||
Other items (note 11a) |
| (21 | ) | (8 | ) | (47 | ) | |||
Net cash provided by continuing operating activities |
| 2,206 |
| 1,732 |
| 2,122 |
| |||
Investing Activities |
|
|
|
|
|
|
| |||
Property, plant and equipment |
|
|
|
|
|
|
| |||
Capital expenditures (note 4) |
| (1,776 | ) | (1,046 | ) | (1,087 | ) | |||
Sales proceeds |
| 185 |
| 100 |
| 8 |
| |||
Acquisitions (note 3) |
| (2,174 | ) | (1,122 | ) | (208 | ) | |||
Investments (note 12) |
|
|
|
|
|
|
| |||
Purchases |
| (18 | ) | (11 | ) | (369 | ) | |||
Sales |
| 76 |
| 625 |
| 46 |
| |||
Reclassification of asset-backed commercial paper |
| — |
| (66 | ) | — |
| |||
Long-term supply contract (note 12) |
| (35 | ) | — |
| — |
| |||
Other investing activities (note 11b) |
| (170 | ) | (42 | ) | 17 |
| |||
Net cash used in continuing investing activities |
| (3,912 | ) | (1,562 | ) | (1,593 | ) | |||
Financing Activities |
|
|
|
|
|
|
| |||
Capital stock |
|
|
|
|
|
|
| |||
Proceeds on exercise of stock options |
| 74 |
| 142 |
| 74 |
| |||
Long-term debt (note 20b) |
|
|
|
|
|
|
| |||
Proceeds |
| 2,723 |
| 408 |
| 2,189 |
| |||
Repayments |
| (1,603 | ) | (1,128 | ) | (1,581 | ) | |||
Dividends (note 25) |
| (349 | ) | (261 | ) | (191 | ) | |||
Settlement of derivative instruments acquired with Placer Dome |
| — |
| (197 | ) | (1,840 | ) | |||
Funding from non-controlling interests |
| 88 |
| — |
| 2 |
| |||
Net cash provided by (used in) continuing financing activities |
| 933 |
| (1,036 | ) | (1,347 | ) | |||
Cash Flows of Discontinued Operations (note 3) |
|
|
|
|
|
|
| |||
Operating activities |
| — |
| 21 |
| 29 |
| |||
Investing activities |
| — |
| — |
| 2,788 |
| |||
Financing activities |
| — |
| — |
| 11 |
| |||
|
| — |
| 21 |
| 2,828 |
| |||
Effect of exchange rate changes on cash and equivalents |
| 3 |
| 9 |
| (4 | ) | |||
Net increase (decrease) in cash and equivalents |
| (770 | ) | (836 | ) | 2,006 |
| |||
Cash and equivalents at beginning of year (note 20a) |
| 2,207 |
| 3,043 |
| 1,037 |
| |||
Cash and equivalents at end of year (note 20a) |
| $ | 1,437 |
| $ | 2,207 |
| $ | 3,043 |
|
The accompanying notes are an integral part of these consolidated financial statements.
83
Consolidated Balance Sheets
Barrick Gold Corporation |
| 2008 |
| 2007 |
| ||
Assets |
|
|
|
|
| ||
Current assets |
|
|
|
|
| ||
Cash and equivalents (note 20a) |
| $ | 1,437 |
| $ | 2,207 |
|
Accounts receivable (note 14) |
| 197 |
| 256 |
| ||
Inventories (note 13) |
| 1,309 |
| 1,129 |
| ||
Other current assets (note 14) |
| 1,169 |
| 707 |
| ||
|
| 4,112 |
| 4,299 |
| ||
Non-current assets |
|
|
|
|
| ||
Investments (note 12) |
| 1,145 |
| 1,227 |
| ||
Property, plant and equipment (note 15) |
| 11,547 |
| 8,585 |
| ||
Goodwill (note 17) |
| 5,280 |
| 5,847 |
| ||
Intangible assets (note 16) |
| 75 |
| 68 |
| ||
Deferred income tax assets (note 24) |
| 869 |
| 722 |
| ||
Other assets (note 18) |
| 1,133 |
| 1,203 |
| ||
Total assets |
| $ | 24,161 |
| $ | 21,951 |
|
Liabilities and Shareholders’ Equity |
|
|
|
|
| ||
Current liabilities |
|
|
|
|
| ||
Accounts payable |
| $ | 970 |
| $ | 808 |
|
Short-term debt (note 20b) |
| 206 |
| 233 |
| ||
Other current liabilities (note 19) |
| 668 |
| 255 |
| ||
|
| 1,844 |
| 1,296 |
| ||
Non-current liabilities |
|
|
|
|
| ||
Long-term debt (note 20b) |
| 4,350 |
| 3,153 |
| ||
Asset retirement obligations (note 22) |
| 973 |
| 892 |
| ||
Deferred income tax liabilities (note 24) |
| 754 |
| 841 |
| ||
Other liabilities (note 23) |
| 781 |
| 431 |
| ||
Total liabilities |
| 8,702 |
| 6,613 |
| ||
Non-controlling interests |
| 182 |
| 82 |
| ||
Shareholders’ equity |
|
|
|
|
| ||
Capital stock (note 25) |
| 13,372 |
| 13,273 |
| ||
Retained earnings |
| 2,261 |
| 1,832 |
| ||
Accumulated other comprehensive income (loss) (note 26) |
| (356 | ) | 151 |
| ||
Total shareholders’ equity |
| 15,277 |
| 15,256 |
| ||
Contingencies and commitments (notes 15 and 29) |
|
|
|
|
| ||
Total liabilities and shareholders’ equity |
| $ | 24,161 |
| $ | 21,951 |
|
The accompanying notes are an integral part of these consolidated financial statements.
Signed on behalf of the Board,
|
|
|
Aaron Reqent, Director |
| Steven J. Shapiro, Director |


84
Consolidated Statements of Shareholders’ Equity
Barrick Gold Corporation |
| 2008 |
| 2007 |
| 2006 |
| |||
Common shares (number in millions) |
|
|
|
|
|
|
| |||
At January 1 |
| 870 |
| 864 |
| 538 |
| |||
Issued on exercise of stock options (note 27a) |
| 3 |
| 6 |
| 3 |
| |||
Issued on acquisition of Placer Dome (note 3f) |
| — |
| — |
| 323 |
| |||
At December 31 |
| 873 |
| 870 |
| 864 |
| |||
Common shares |
|
|
|
|
|
|
| |||
At January 1 |
| $ | 13,273 |
| $ | 13,106 |
| $ | 4,222 |
|
Issued on exercise of stock options (note 27a) |
| 74 |
| 142 |
| 74 |
| |||
Issued on acquisition of Placer Dome (note 3f) |
| — |
| — |
| 8,761 |
| |||
Options issued on acquisition of Placer Dome (note 3f) |
| — |
| — |
| 22 |
| |||
Recognition of stock option expense (note 27a) |
| 25 |
| 25 |
| 27 |
| |||
At December 31 |
| 13,372 |
| 13,273 |
| 13,106 |
| |||
Retained earnings (deficit) |
|
|
|
|
|
|
| |||
At January 1 |
| 1,832 |
| 974 |
| (341 | ) | |||
Net income |
| 785 |
| 1,119 |
| 1,506 |
| |||
Dividends (note 25a) |
| (349 | ) | (261 | ) | (191 | ) | |||
Repurchase of preferred shares of a subsidiary |
| (7 | ) | — |
| — |
| |||
At December 31 |
| 2,261 |
| 1,832 |
| 974 |
| |||
Accumulated other comprehensive income (loss) (note 26) |
| (356 | ) | 151 |
| 119 |
| |||
Total shareholders’ equity at December 31 |
| $ | 15,277 |
| $ | 15,256 |
| $ | 14,199 |
|
Consolidated Statements of Comprehensive Income
Barrick Gold Corporation |
| 2008 |
| 2007 |
| 2006 |
| |||
Net income |
| $ | 785 |
| $ | 1,119 |
| $ | 1,506 |
|
Other comprehensive income (loss), net of tax (note 26) |
| (507 | ) | 32 |
| 150 |
| |||
Comprehensive income |
| $ | 278 |
| $ | 1,151 |
| $ | 1,656 |
|
The accompanying notes are an integral part of these consolidated financial statements.
85
Notes to Consolidated Financial Statements
Barrick Gold Corporation. Tabular dollar amounts in millions of United States dollars, unless otherwise shown. References to C$, A$, ZAR, CLP, PGK, TZS, JPY, ARS and EUR are to Canadian dollars, Australian dollars, South African rands, Chilean pesos, Papua New Guinea kina, Tanzanian schillings, Japanese yen, Argentinean pesos and Euros, respectively.
1 · Nature of Operations
Barrick Gold Corporation (“Barrick” or the “Company”) principally engages in the production and sale of gold, as well as related activities such as exploration and mine development. We also produce significant amounts of copper and hold interests in a platinum group metals development project and a nickel development project, both located in Africa, a platinum group metals project located in Russia and oil and gas properties located in Canada. Our producing mines are concentrated in four regional business units: North America, South America, Africa and Australia Pacific. We sell our gold production into the world market and we sell our copper production into the world market and to private customers.
2 · Significant Accounting Policies
a) Basis of Preparation
These consolidated financial statements have been prepared under United States generally accepted accounting principles (“US GAAP”). In 2008, we amended the income statement classification of accretion expense (note 2e). Accretion expense is classified within amortization and accretion. Prior to this date, accretion expense was classified as a component of cost of sales and other expense. To ensure comparability of financial information, prior year amounts have been reclassified to reflect changes in the financial statement presentation.
b) Principles of Consolidation
These consolidated financial statements include the accounts of Barrick Gold Corporation and those entities that we have the ability to control either through voting rights or means other than voting rights. These entities include development projects and operating mines in which we hold a less than 100% ownership interest, which generally operate as joint ventures. For these joint ventures, our risk is limited to our investment in the entity. FIN 46(R) provides guidance on the identification and reporting of entities controlled through means other than voting rights and defines such entities as variable interest entities (“VIEs”). We apply this guidance to all of our incorporated joint ventures (“JVs”), including those in the development stage. We determine if we are the primary beneficiary based on whether we expect to participate in the majority of the entities’ future expected gains/ losses, based on the funding requirements set out in their respective agreements. For VIEs where we are the primary beneficiary, we consolidate the entity and record a non-controlling interest, measured initially at its estimated fair value, for the interest held by other entity owners. For VIEs where we are not the primary beneficiary, we use the equity method of accounting (note 12).
For unincorporated JVs under which we hold an undivided interest in the assets and liabilities and receive our share of production from the joint venture, we include our pro rata share of the assets, liabilities, revenue and expenses in our financial statements.
86
The following table illustrates our policy used to account for significant entities where we hold less than a 100% economic interest. We consolidate all wholly-owned entities.
Consolidation Method at December 31, 2008
|
| Entity type at December 31, 2008 |
| Economic Interest at |
| Method |
|
North America |
|
|
|
|
|
|
|
Round Mountain Mine |
| Unincorporated JV |
| 50% |
| Pro Rata |
|
Hemlo Property Mine |
| Unincorporated JV |
| 50% |
| Pro Rata |
|
Marigold Mine |
| Unincorporated JV |
| 33% |
| Pro Rata |
|
Turquoise Ridge Mine |
| Unincorporated JV |
| 75% |
| Pro Rata |
|
Pueblo Viejo Project(2) |
| VIE |
| 60% |
| Consolidation |
|
Donlin Creek Project |
| VIE |
| 50% |
| Equity Method |
|
South America |
|
|
|
|
|
|
|
Cerro Casale Project |
| VIE |
| 51% |
| Equity Method |
|
Australia |
|
|
|
|
|
|
|
Kalgoorlie Mine |
| Unincorporated JV |
| 50% |
| Pro Rata |
|
Porgera Mine(3) |
| Unincorporated JV |
| 95% |
| Pro Rata |
|
Reko Diq Project(4) |
| VIE |
| 37.5% |
| Equity Method |
|
Africa |
|
|
|
|
|
|
|
Tulawaka Mine |
| Unincorporated JV |
| 70% |
| Consolidation |
|
Kabanga Project(5) |
| VIE |
| 50% |
| Equity Method |
|
Sedibelo Project(6) |
| VIE |
| 10% |
| Consolidation |
|
Russia |
|
|
|
|
|
|
|
Fedorova Project(7) |
| VIE |
| 50% |
| Consolidation |
|
(1) Unless otherwise noted, all of our joint ventures are funded by distributions made by their partners in proportion to their economic interest.
(2) In accordance with the terms of the agreement with our partner, Barrick is responsible for 60% of the funding requirements for the Pueblo Viejo project. We consolidate our interest in Pueblo Viejo and record a non-controlling interest for the 40% that we don’t own. In 2008, we recorded project development expenses of $62 million (2007: $67 million) (note 7) and a non-controlling interest of $26 million (2007: $30 million) (note 2b). At December 31, 2008, the carrying value of our Pueblo Viejo project was $447 million (2007: $140 million) (note 15a).
(3) We hold an undivided interest in our share of assets and liabilities at the Porgera mine. In August 2007, we increased our ownership interest from 75% to 95% (note 3d).
(4) We hold a 50% interest in Atacama Copper, which has a 75% interest in the Reko Diq project. We use the equity method to account for our interest in Atacama Copper (note 12).
(5) In accordance with an agreement with our partner, from 2006 until the third quarter of 2008, our partner was responsible for funding 100% of exploration and project expenditures and we did not record any amounts for our economic interest in this period. During the third quarter of 2008, our partner completed the $145 million spending requirement, and we began funding 50% of the exploration and project expenditures (note 12).
(6) In 2008, we completed a bankable feasibility study (“BFS”), for which we recorded project development expenses totaling $17 million (2007: $22 million). Based on the agreement with our partner, we are responsible for funding 100% of the project expenditures. On completion of the BFS, we earned a 10% interest in the project and have a right to obtain a further 55% interest upon a decision to mine. The first 40% can be purchased for 50% of the combined platinum, palladium, rhodium and gold production at $12 per ounce. The final 15% can be purchased for $90 million. If Barrick does not make a decision to mine by May 2009, our partner has the option to acquire our 10% interest at a price based on the BFS costs spent.
(7) In accordance with an agreement with minority shareholders, we have an earn-in option for an additional 30% interest in the entity that owns the rights to the Fedorova project (for a total 80% interest). We are responsible for funding 100% of project expenditures until the BFS is finalized, and therefore a non-controlling interest has not been recorded through December 31, 2008. In 2008, we funded $24 million of project expenditures (2007: $18 million).
87
Entities Consolidated using the Pro Rata Method Income Statement and Cash Flow Information (100%)
For the years ended December 31 |
| 2008 |
| 2007 |
| 2006 |
| |||
Revenues |
| $ | 2,031 |
| $ | 2,076 |
| $ | 1,776 |
|
Costs and expenses |
| (1,565 | ) | (1,665 | ) | (1,457 | ) | |||
Net income |
| $ | 466 |
| $ | 411 |
| $ | 319 |
|
Operating activities(1) |
| $ | 378 |
| $ | 147 |
| $ | 473 |
|
Investing activities(1) |
| $ | (159 | ) | $ | (139 | ) | $ | (284 | ) |
Financing activities(1),(2) |
| $ | (249 | ) | $ | 81 |
| $ | (185 | ) |
Balance Sheet Information (100%)
At December 31 |
| 2008 |
| 2007 |
| ||
Assets |
|
|
|
|
| ||
Inventories |
| $ | 317 |
| $ | 430 |
|
Property, plant and equipment |
| 1,609 |
| 2,620 |
| ||
Other assets(3) |
| 316 |
| 462 |
| ||
|
| $ | 2,242 |
| $ | 3,512 |
|
Liabilities |
|
|
|
|
| ||
Current liabilities |
| $ | 153 |
| $ | 216 |
|
Long-term obligations |
| 244 |
| 267 |
| ||
Deferred income tax liabilities |
| 64 |
| 47 |
| ||
|
| $ | 461 |
| $ | 530 |
|
Non-controlling Interests – Income Statement
For the years ended December 31 |
| 2008 |
| 2007 |
| 2006 |
| |||
Pueblo Viejo project |
| $ | 26 |
| $ | 30 |
| $ | 9 |
|
Tulawaka mine |
| (38 | ) | (16 | ) | (8 | ) | |||
|
| $ | (12 | ) | $ | 14 |
| $ | 1 |
|
(1) Net cash inflow (outflow).
(2) Includes cash flows between the joint ventures and joint venture partners.
(3) The decrease in assets in 2008 reflects 100% ownership of Cortez.
c) Foreign Currency Translation
The functional currency of our gold and copper operations is the US dollar. We translate non-US dollar balances for these operations into US dollars as follows:
· Property, plant and equipment, intangible assets and equity method investments using historical rates;
· Available-for-sale securities using closing rates with translation gains and losses recorded in other comprehensive income;
· Asset retirement obligations using historical rates;
· Deferred tax assets and liabilities using closing rates with translation gains and losses recorded in income tax expense;
· Other assets and liabilities using closing rates with translation gains and losses recorded in other income/expense; and
· Income and expenses using average exchange rates, except for expenses that relate to non-monetary assets and liabilities measured at historical rates, which are translated using the same historical rate as the associated non-monetary assets and liabilities.
The functional currency of our oil and gas operations, (“Barrick Energy”) is the Canadian dollar. We translate balances related to Barrick Energy into US dollars as follows:
· Assets and liabilities using closing exchange rates with translation gains and losses recorded in other comprehensive income; and
· Income and expense using average exchange rates with translation gains and losses recorded in other comprehensive income.
d) Use of Estimates
The preparation of these financial statements requires us to make estimates and assumptions. The most significant ones are: quantities of proven and probable mineral reserves; classification of mineralization as either reserves or nonreserves; fair values of acquired assets and liabilities under business combinations, including the value of mineralized material beyond proven and probable mineral reserves; future costs and expenses to produce proven and probable mineral reserves; future commodity prices for gold, copper, silver and other products; future costs of oil and other consumables; currency exchange rates; the future cost of asset retirement obligations; amounts and likelihood of contingencies; the fair values of reporting units that include goodwill; uncertain tax positions; and credit risk adjustments to discount rates. Using these and other estimates and assumptions, we make various decisions in preparing the financial statements including:
· The treatment of expenditures at mineral properties prior to when production begins as either an asset or an expense (note 15);
· Whether tangible and intangible long-lived assets are impaired, and if so, estimates of the fair value of those assets and any corresponding impairment charge (note 15);
· Our ability to realize deferred income tax assets and amounts recorded for any corresponding valuation allowances and amounts recorded for uncertain tax positions (note 24);
· The useful lives of tangible and intangible long-lived assets and the measurement of amortization (note 15);
· The fair value of asset retirement obligations (note 22);
· Whether to record a liability for loss contingencies and the amount of any liability (notes 15 and 29);
88
· The amount of income tax expense (note 9);
· Allocations of the purchase price in business combinations to assets and liabilities acquired, (notes 3 and 17);
· Whether any impairments of goodwill have occurred and if so the amounts of impairment charges (note 17);
· Transfers of value beyond proven and probable reserves to amortized assets (note 15); and
· Credit risk adjustments to the discount rates in determining the fair value at derivative instruments (notes 20 and 21).
As the estimation process is inherently uncertain, actual future outcomes could differ from present estimates and assumptions, potentially having material future effects on our financial statements.
e) Accounting Changes
Accounting Changes Implemented in 2008
FAS 159, The Fair Value Option for Financial Assets and Financial Liabilities (FAS 159)
In February 2007, the Financial Accounting Standards Board (“FASB”) issued FAS 159, which allows an irrevocable option, the Fair Value Option (FVO), to carry eligible financial assets and liabilities at fair value, with the election made on an instrument-by-instrument basis. Changes in fair value for these instruments would be recorded in earnings. The objective of FAS 159 is to improve financial reporting by providing entities with the opportunity to mitigate volatility in reported earnings caused by measuring related assets and liabilities differently without having to apply complex hedge accounting provisions.
FAS 159 was effective for Barrick beginning in first quarter 2008 and was applied prospectively. We have not adopted the FVO for any of our eligible financial instruments, which primarily include available-for-sale securities, equity method investments and long-term debt.
FAS 157, Fair Value Measurements (FAS 157)
In 2008, we implemented FAS 157 for financial assets and financial liabilities that are measured at fair value on a recurring basis. The primary assets and liabilities that are recognized and disclosed at fair value in accordance with the provisions of FAS 157 are: available-for-sale securities; receivables from provisional copper and gold sales; derivate assets and derivative liabilities and held-to-maturity investments. The adoption of FAS 157 has resulted in expanded disclosures about our fair value measurements for financial assets and financial liabilities recognized in our financial statements. However, the adoption of FAS 157 did not have an impact on the measurement of fair value as our valuation methodology for these assets and liabilities is consistent with the fair value framework established by FAS 157. Refer to note 21 of the Consolidated Financial Statements for details of the adoption of FAS 157 and related disclosures.
We have not applied the provisions of FAS 157 to non-financial assets and nonfinancial liabilities as permitted by the delay specified in FSP FAS 157-2. FSP FAS 157-2 delays the effective date of FAS 157 to fiscal years beginning after November 15, 2008, for non-financial assets and liabilities, except for items that are recognized or disclosed at fair value in the financial statements on a recurring basis. Therefore, beginning in 2009 we will apply the requirements of FAS 157 to non-financial assets and non-financial liabilities that we periodically measure at fair value under US GAAP, which will principally include: goodwill, tangible and intangible assets measured and recognized at fair value as a result of an impairment assessment; and non-financial assets and non-financial liabilities recognized as a result of a business combination. The application of the provisions of FAS 157 is not expected to have a significant impact on our methodology for measuring the fair value of these assets and liabilities, but will result in expanded disclosures.
Changes in Financial Statement Presentation – Accretion Expense
In first quarter 2008, we made a change to our accounting policy regarding the financial statement classification of accretion expense. Prior to this change, we recorded accretion expense at producing mines as a component of cost of sales and accretion expense at closed mines as a component of other expense. Beginning in first quarter 2008, we recorded accretion expense at producing mines and accretion expense at closed mines in amortization and accretion in our Consolidated Statements of Income.
FSP FAS 140-4 and FIN 46(R)-8, Disclosures by Public Entities (Enterprises) about Transfers of Financial Assets and Interests in Variable Interest Entities (FSP FAS 140-4 and FIN 46(R)-8)
In December 2008, the FASB issued FSP FAS 140-4 and FIN 46(R)-8 for the purpose of improving the transparency of transfers of financial assets and an enterprise’s involvement with variable interest entities (VIEs), including qualifying special-purpose entities (QSPEs). The impact on our financial reporting requirements is limited to the new VIE disclosures.
89
The VIE disclosure requirements focus on an enterprise’s involvement with VIEs and its judgments about the accounting for them. The FSP also requires disclosure of the details of any financial or other support provided to a VIE that the enterprise was not previously contractually required to provide, and the primary reasons for providing the support. The primary beneficiary of a VIE is also required to disclose the terms of any arrangements that could require the enterprise to provide future support to the VIE. In addition, FSP FAS 140-4 and FIN 46(R)-8 require disclosure of the carrying amount and classification of the variable interest entity’s assets and liabilities in the Balance Sheet and a reconciliation of those amounts to the enterprise’s maximum exposure to loss.
The adoption of this FSP has resulted in expanded disclosure around our involvement with our VIEs and the significant judgments and assumptions we make in accounting for them. We have also included tables that reflect how our consolidated VIEs are included in our Consolidated Statement of Income and Balance Sheet.
Accounting Changes Implemented in 2007
FASB Interpretation No. 48 – Accounting for Uncertainty in Income Taxes, an interpretation of FASB Statement No. 109 (Accounting for Income Taxes) (FIN 48)
In June 2006, the FASB issued FIN 48 to create a single model to address accounting for uncertainty in tax positions. FIN 48 clarifies the accounting for income taxes, by prescribing a minimum recognition threshold a tax position is required to meet before being recognized in the financial statements. FIN 48 also provides guidance on derecognition, measurement, classification, interest and penalties, accounting in interim periods, disclosure and transition. FIN 48 is effective for fiscal years beginning after December 15, 2006.
We adopted the provisions of FIN 48, Accounting for Uncertainty in Income Taxes, on January 1, 2007. As a result of the implementation of FIN 48, no adjustment was required to the liability for unrecognized tax benefits.
Accounting Changes Implemented in 2006
FAS 158, Employers’ Accounting for Defined Benefit Pension and Other Post-retirement Plans
In September 2006, the FASB issued FAS 158 that requires employers to fully recognize the obligations associated with single-employer defined benefit pension, retiree health care and other post-retirement plans in their financial statements.
FAS 158 requires recognition of the funded status of a benefit plan on the balance sheet. FAS 158 also requires recognition, as a component of other comprehensive income, net of tax, of the gains or losses and prior service costs or credits that arise during the period but are not recorded as components of net periodic benefit cost. FAS 158 requires disclosure of information about certain effects of net periodic benefit cost for the next fiscal year that arise from delayed recognition of the gains or losses, prior service costs or credits, and transition asset or obligation.
We adopted the provisions of FAS 158 in 2006. The adoption of FAS 158 did not significantly impact our financial statements.
f) Significant Accounting Developments
FAS 161, Disclosures about Derivative Instruments and Hedging Activities (FAS 161)
In March 2008, the FASB issued FAS 161, which will require entities to provide enhanced disclosures about (a) how and why an entity uses derivative instruments, (b) how derivative instruments and related hedged items are accounted for under FAS 133 and its related interpretations, and (c) how derivative instruments and related hedged items affect an entity’s financial position, financial performance and cash flows. FAS 161 is effective for financial statements issued for fiscal years and interim periods beginning after November 15, 2008, with early application encouraged. We are currently evaluating the impact of adopting FAS 161 on our note disclosures related to derivative instruments and hedging activities.
FAS 141(R), Business Combinations (FAS 141(R))
In first quarter 2009, we will begin applying the provisions of FAS 141(R), which replaced FAS 141, for business combinations consummated after the effective date of December 15, 2008. Early adoption of FAS 141(R) was not permitted. Under FAS 141(R), business acquisitions will be accounted for under the “acquisition method”, compared to the “purchase method” mandated by FAS 141.
The more significant changes to Barrick’s accounting for business combinations that will result from applying the acquisition method include: (i) the definition of a business
90
is broadened to include development stage entities, and therefore more acquisitions will be accounted for as business combinations rather than asset acquisitions; (ii) the measurement date for equity interests issued by the acquirer is the acquisition date instead of a few days before and after terms are agreed to and announced, which may significantly change the amount recorded for the acquired business if share prices differ from the agreement and announcement date to the acquisition date; (iii) all future adjustments to income tax estimates will be recorded to income tax expense, whereas under FAS 141 certain changes in income tax estimates were recorded to goodwill; (iv) acquisition-related costs of the acquirer, including investment banking fees, legal fees, accounting fees, valuation fees, and other professional or consulting fees will be expensed as incurred, whereas under FAS 141 these costs were capitalized as part of the business combination; (v) the assets acquired and liabilities assumed are recorded at 100% of fair value even if less than 100% is obtained, whereas under FAS 141 only the controlling interest’s portion is recorded at fair value; and (vi) the non-controlling interest will be recorded at its share of fair value of net assets acquired, including its share of goodwill, whereas under FAS 141 the non-controlling interest is recorded at its share of carrying value of net assets acquired with no goodwill being allocated.
FAS 160, Non-controlling Interests in Consolidated Financial Statements (FAS 160)
In December 2007 the FASB issued FAS 160, which is effective for fiscal years beginning after December 15, 2008. Under FAS 160, non-controlling interests are measured at 100% of the fair value of assets acquired and liabilities assumed. Under current standards, the non-controlling interest is measured at book value. For presentation and disclosure purposes, non-controlling interests are classified as a separate component of shareholders’ equity. In addition, FAS 160 changes the manner in which increases/decreases in ownership percentages are accounted for. Changes in ownership percentages are recorded as equity transactions and no gain or loss is recognized as long as the parent retains control of the subsidiary. When a parent company deconsolidates a subsidiary but retains a non-controlling interest, the non-controlling interest is re-measured at fair value on the date control is lost and a gain or loss is recognized at that time. Under FAS 160, accumulated losses attributable to the non-controlling interests are no longer limited to the original carrying amount, and therefore non-controlling interests could have a negative carrying balance.
The provisions of FAS 160 are to be applied prospectively with the exception of the presentation and disclosure provisions, which are to be applied for all prior periods presented in the financial statements. Early adoption is not permitted. The presentation and disclosure provisions of FAS 160 will result in the reclassification of $182 million attributable to non-controlling interests to the Share-holders’ Equity section of the Balance Sheet for 2008.
g) Other Notes to the Financial Statements
|
| Note |
| Page |
|
|
|
|
|
|
|
Acquisitions and divestitures |
| 3 |
| 92 |
|
Segment information |
| 4 |
| 95 |
|
Revenue and gold sales contracts |
| 5 |
| 97 |
|
Cost of sales |
| 6 |
| 99 |
|
Exploration and project development expense |
| 7 |
| 100 |
|
Other charges |
| 8 |
| 101 |
|
Income tax expense |
| 9 |
| 102 |
|
Earnings per share |
| 10 |
| 103 |
|
Cash flow – other items |
| 11 |
| 104 |
|
Investments |
| 12 |
| 105 |
|
Inventories |
| 13 |
| 108 |
|
Accounts receivable and other current assets |
| 14 |
| 109 |
|
Property, plant and equipment |
| 15 |
| 110 |
|
Intangible assets |
| 16 |
| 113 |
|
Goodwill |
| 17 |
| 114 |
|
Other assets |
| 18 |
| 116 |
|
Other current liabilities |
| 19 |
| 116 |
|
Financial instruments |
| 20 |
| 116 |
|
Fair value measurements |
| 21 |
| 126 |
|
Asset retirement obligations |
| 22 |
| 128 |
|
Other non-current liabilities |
| 23 |
| 129 |
|
Deferred income taxes |
| 24 |
| 129 |
|
Capital stock |
| 25 |
| 132 |
|
Other comprehensive income (loss) |
| 26 |
| 132 |
|
Stock-based compensation |
| 27 |
| 133 |
|
Post-retirement benefits |
| 28 |
| 135 |
|
Litigation and claims |
| 29 |
| 138 |
|
91
3 · Acquisitions and Divestitures
For the years ended December 31 |
| 2008 |
| 2007 |
| 2006 |
| |||
Cash paid on acquisition(1) |
|
|
|
|
|
|
| |||
Cortez (additional 40% interest) |
| $ | 1,695 |
| $ | — |
| $ | — |
|
Barrick Energy Inc. |
| 460 |
| — |
| — |
| |||
Cerro Casale |
| 40 |
| 730 |
| — |
| |||
Porgera (additional 20% interest) |
| — |
| 264 |
| — |
| |||
Kainantu |
| 5 |
| 135 |
| — |
| |||
Placer Dome |
| — |
| — |
| 1,262 |
| |||
Other(2) |
| 29 |
| 6 |
| 54 |
| |||
|
| $ | 2,229 |
| $ | 1,135 |
| $ | 1,316 |
|
Less: cash acquired |
| (55 | ) | (13 | ) | (1,108 | ) | |||
|
| $ | 2,174 |
| $ | 1,122 |
| $ | 208 |
|
Cash proceeds on sale(1) |
|
|
|
|
|
|
| |||
Royalty disposition |
| $ | 150 |
| $ | — |
| $ | — |
|
Celtic(2) |
| — |
| 21 |
| �� |
| |||
Paddington Mill(3) |
| — |
| 30 |
| — |
| |||
Other(4),(5) |
| — |
| 54 |
| — |
| |||
|
| $ | 150 |
| $ | 105 |
| $ | — |
|
Cash proceeds on sale of discontinued operations |
|
|
|
|
|
|
| |||
South Deep mine |
| $ | — |
| $ | 21 |
| $ | 1,209 |
|
Operations sold to Goldcorp |
| — |
| — |
| 1,619 |
| |||
|
| $ | — |
| $ | 21 |
| $ | 2,828 |
|
(1) | All amounts represent gross cash paid or received on acquisition or divestiture. |
(2) | In 2008, we acquired an additional 40% interest in the Storm property from Yamana Gold Inc. for $29 million, including $1 million cash acquired, consolidating a 100% ownership interest in Storm. In 2006, we acquired the Grace Property for cash of $60 million, including cash acquired of $6 million. |
(3) | Included within investment sales in the Consolidated Statement of Cash Flow. |
(4) | Included within Property, Plant and Equipment sales in the Consolidated Statement of Cash flow. |
(5) | In 2007, we sold the Grace Property, originally acquired in 2006 for cash proceeds of $54 million. There was no after-tax gain or loss arising on closing. |
a) Acquisition of Barrick Energy Inc. (“Barrick Energy”)
In 2008, we acquired 59.2 million shares of Cadence Energy Inc. (“Cadence”) for cash consideration of $377 million, representing 100% of the issued and outstanding common shares. Subsequent to the acquisition, we rebranded Cadence as Barrick Energy. We have determined that this transaction represented a business combination with Barrick identified as the acquirer.
The tables below present the purchase cost and our preliminary allocation of the purchase price of the assets and liabilities acquired. The purchase price allocation will be finalized in 2009 upon completion of a full internal tax assessment. The revenues and expenses from Barrick Energy have been included in our Consolidated Statement of Income from September 4, 2008.
Purchase Cost |
|
|
|
|
Purchase cost |
| $ | 377 |
|
Less: cash acquired |
| (41 | ) | |
|
| $ | 336 |
|
Preliminary Purchase Price Allocation |
|
|
| |
Current assets |
| $ | 25 |
|
Property, plant and equipment |
|
|
| |
Capitalized reserve acquisition and development costs |
| 278 |
| |
Building, plant and equipment |
| 68 |
| |
Goodwill |
| 96 |
| |
Total assets |
| 467 |
| |
Accounts payable |
| 24 |
| |
Derivative liabilities |
| 10 |
| |
Long-term debt |
| 65 |
| |
Asset retirement obligations |
| 10 |
| |
Deferred income tax liabilities |
| 22 |
| |
Total liabilities |
| 131 |
| |
Net assets acquired |
| $ | 336 |
|
In 2008, we also acquired all of the oil and gas assets at Sturgeon Lake, Alberta, from Daylight Resources Trust for $83 million. The Sturgeon Lake assets are adjacent to Cadence’s Sturgeon Lake assets and the transaction enables us to consolidate 100% ownership of the Sturgeon Lake South Leduc pool. We have determined that this transaction represented an acquisition of assets, which were amalgamated with the Cadence operations to form Barrick Energy.
b) Acquisition of 40% Interest in Cortez
In 2008, we completed our acquisition of an additional 40% interest in the Cortez property from Kennecott Explorations (Australia) Ltd. (“Kennecott”), a subsidiary of Rio Tinto plc, for a total cash consideration of $1.695 billion. A further $50 million will be payable if and when we add an additional 12 million ounces of contained gold resources beyond our December 31, 2007 reserve statement for Cortez. This contingent payment will be recognized as an additional cost of the acquisition only if the resource/production targets are met and the amounts become payable as a result. A sliding scale royalty is payable to Kenne-cott on 40% of all production in excess of 15 million ounces on and after January 1, 2008.
The acquisition consolidates 100% ownership for Barrick of the existing Cortez mine and the Cortez Hills expansion plus any future potential from the property. We have determined that the transaction represents a business combination. The acquisition was effective March 1, 2008 and the revenues and expenses attributable to the 40% interest have been included in our consolidated statements of income from that date onwards. The tables below represent the purchase cost and our final purchase price allocation for the additional 40% of Cortez.
92
Purchase Cost |
|
|
| |
Purchase cost per agreement |
| $ | 1,695 |
|
Less: cash acquired |
| (14 | ) | |
|
| $ | 1,681 |
|
Summary Purchase Price Allocation |
|
|
| |
Inventories |
| $ | 47 |
|
Other current assets |
| 1 |
| |
Property, plant and equipment |
|
|
| |
Building, plant and equipment |
| 184 |
| |
Capitalized reserve acquisition and development costs |
| 1,057 |
| |
Value beyond proven and probable reserves |
| 381 |
| |
Goodwill |
| 20 |
| |
Non-current ore in stockpiles |
| 17 |
| |
Deferred income tax assets |
| 11 |
| |
Total assets |
| 1,718 |
| |
Current liabilities |
| 23 |
| |
Asset retirement obligations |
| 14 |
| |
Total liabilities |
| 37 |
| |
Net assets acquired |
| $ | 1,681 |
|
c) Acquisition of Cerro Casale
In 2007, we acquired 94% of the common shares of Arizona Star, with the remaining common shares pursuant to a statutory right of compulsory acquisition for $40 million in 2008. Arizona Star owns a 51% interest in the Cerro Casale deposit in the Maricunga district of Region III in Chile. The acquisition of Arizona Star has been accounted for as an asset purchase. The tables below represent the purchase cost and final purchase price allocation for the acquisition of 100% of the common shares of Arizona Star.
Purchase Cost |
|
|
| |
Purchase cost |
| $ | 770 |
|
Less: cash acquired |
| (7 | ) | |
|
| $ | 763 |
|
Summary Purchase Price Allocation |
|
|
| |
Other current assets |
| $ | 1 |
|
Equity investment in Cerro Casale project |
| 770 |
| |
Total assets |
| 771 |
| |
Current liabilities |
| 8 |
| |
Net assets acquired |
| $ | 763 |
|
d) Porgera Mine Acquisition
In 2007, we completed the acquisition of an additional 20% interest in the Porgera mine in Papua New Guinea from Emperor Mines Limited, for cash consideration of $264 million. The acquisition has been accounted for as a business combination. Following this transaction our interest in the Porgera mine increased from 75% to 95%. The Government of Papua New Guinea holds the remaining 5% undivided interest in Porgera. The Government of Papua New Guinea and Porgera landowners’ option to purchase up to a 5% interest in the Porgera mine expired in 2008. We are negotiating a six month extension for this option.
Purchase Cost |
|
|
| |
Purchase cost |
| $ | 264 |
|
Less: cash acquired |
| (5 | ) | |
|
| $ | 259 |
|
Summary Purchase Price Allocation |
|
|
| |
Inventories |
| $ | 17 |
|
Other current assets |
| 2 |
| |
Property, plant and equipment |
| 145 |
| |
Non-current ore in stockpiles |
| 60 |
| |
Deferred income tax assets |
| 20 |
| |
Goodwill |
| 34 |
| |
Total assets |
| 278 |
| |
Current liabilities |
| 11 |
| |
Asset retirement obligations |
| 8 |
| |
Total liabilities |
| 19 |
| |
Net assets acquired |
| $ | 259 |
|
e) Kainantu Acquisition
In 2007, we completed the acquisition of the Kainantu mineral property and various exploration licenses in Papua New Guinea from Highlands Pacific Limited for cash consideration of $135 million, which reflects the total purchase price, net of $7 million withheld pending certain permit renewals. In 2008, $4 million was paid in settlement of the permit renewals and $1 million in transaction costs. The acquisition has been accounted for as a purchase of assets, allocating $163 million to the exploration property, $19 million to deferred income tax liabilities and $4 million to an acquired asset retirement obligation liability.
93
f) Acquisition of Placer Dome Inc. (“Placer Dome”)
In 2006, we acquired 100% of the outstanding common shares of Placer Dome. Placer Dome was one of the world’s largest gold mining companies. It had 12 mining operations based in North America, South America, Africa and Australia/Papua New Guinea, as well as four projects that were in various stages of exploration/development. Its most significant mines were Cortez in the United States, Zaldívar in Chile, Porgera in Papua New Guinea, North Mara in Tanzania and South Deep in South Africa.
The Placer Dome acquisition was accounted for as a business combination, with Barrick as the accounting acquirer. The purchase cost was $10 billion and was funded through a combination of common shares issued, the drawdown of a $1 billion credit facility, and cash resources. The table below represents the purchase cost and final purchase price allocation.
Value of 322.8 million Barrick common shares issued at $27.14 per share(1) |
| $ | 8,761 |
|
Value of 2.7 million fully vested stock options |
| 22 |
| |
Cash |
| 1,239 |
| |
Transaction costs |
| 32 |
| |
|
| $ | 10,054 |
|
(1) The measurement of the common share component of the purchase consideration represents the average closing price on the New York Stock Exchange for the two days prior to and two days after the public announcement on December 22, 2005 of our final offer for Placer Dome.
Summary Purchase Price Allocation |
|
|
| |
Cash(1) |
| $ | 1,102 |
|
Inventories |
| 428 |
| |
Other current assets |
| 198 |
| |
Property, plant and equipment |
|
|
| |
Buildings, plant and equipment |
| 2,946 |
| |
Proven and probable reserves |
| 1,571 |
| |
Value beyond proven and probable reserves |
| 419 |
| |
Intangible assets |
| 85 |
| |
Assets of discontinued operations(2) |
| 1,744 |
| |
Deferred income tax assets |
| 93 |
| |
Other assets |
| 254 |
| |
Goodwill |
| 6,506 |
| |
Total assets |
| 15,346 |
| |
Current liabilities |
| 669 |
| |
Liabilities of discontinued operations(2) |
| 107 |
| |
Derivative instrument liabilities |
| 1,729 |
| |
Long-term debt |
| 1,252 |
| |
Asset retirement obligations |
| 387 |
| |
Deferred income tax liabilities |
| 686 |
| |
Total liabilities |
| 4,830 |
| |
Non-controlling interests |
| 462 |
| |
Net assets acquired |
| $ | 10,054 |
|
(1) Cash paid on acquisition of $160 million, as disclosed in the 2007 Annual Report.
(2) Includes operations that were sold to Goldcorp Inc.
At acquisition we recorded liabilities totaling $48 million that primarily relate to employee severance at Placer Dome offices that were closed during 2006. All amounts were settled by the end of 2007.
g) Disposition of Royalties
In 2008, we divested certain non-core royalties to Royal Gold Inc. (“Royal Gold”) in exchange for cash consideration of $150 million and a reduction in various royalties that we are currently obligated to pay to Royal Gold with an estimated fair value of $32 million. The transaction closed on October 2, 2008 and we recorded a pre-tax gain on sale of $167 million in other income.
h) Sale of Paddington Mill
In 2007, we completed the sale of the Paddington Mill and associated land tenements in Australia to Norton Goldfields Limited and the sale of certain land tenements to Apex Minerals for total proceeds of $32 million, $30 million in cash and $2 million in Apex Minerals NL shares, respectively. We recorded a gain of $8 million in other income on closing.
i) Discontinued Operations
Results of Discontinued Operations
For the years ended December 31 |
| 2008 |
| 2007 |
| 2006 |
| ||||
Gold sales |
|
|
|
|
|
|
| ||||
South Deep operations |
| $ | — |
| $ | — |
| $ | 158 |
| |
Operations sold to Goldcorp |
| — |
| — |
| 83 |
| ||||
|
| $ | — |
| $ | — |
| $ | 241 |
| |
Income before tax |
|
|
|
|
|
|
| ||||
South Deep |
| — |
| 9 |
| 8 |
| ||||
Gain on sale of South Deep |
| — |
| — |
| 288 |
| ||||
Operations sold to Goldcorp |
| — |
| — |
| 1 |
| ||||
|
| $ | — |
| $ | 9 |
| $ | 297 |
| |
South Deep
In 2006, we sold our 50% interest in the South Deep mine in South Africa to Gold Fields Limited (“Gold Fields”). The consideration on closing was $1,517 million, of which $1,209 million was received in cash and $308 million in Gold Fields shares. On closing we recorded a gain of $288 million.
In 2007, a final settlement was reached with Gold Fields on the allocation of insurance proceeds from an insurance claim that straddled the acquisition date. As a result of that settlement, we recorded further proceeds of $9 million within income from discontinued operations. Also in 2007, $21 million was received in cash and has been classified under Cash Flows of Discontinued Operations in our Consolidated Statement of Cash Flow.
94
Operations Sold to Goldcorp
In 2006, we sold all of Placer Dome’s Canadian properties and operations (other than Placer Dome’s office in Vancouver), Placer Dome’s interest in the La Coipa mine in Chile, 40% of Placer Dome’s interest in the Pueblo Viejo project, certain related assets and our share in Agua de la Falda S.A. to Goldcorp Inc. (“Goldcorp”) (collectively, the “Operations sold to Goldcorp”).
The sales proceeds for the operations sold to Goldcorp were $1,641 million. The aggregate net amount of assets and liabilities of these operations was recorded in the purchase price allocation at $1,641 million based on the terms of the sale agreement with Goldcorp that was in place at the time we acquired Placer Dome. The results of the operations sold to Goldcorp were included under “discontinued operations” in the income statement and cash flow statement until closing. Interest expense of $21 million was allocated to the results from the operations sold to Goldcorp. No gain or loss arose on closing of the sale.
4 · Segment Information
In first quarter 2008, we formed a dedicated Capital Projects group, distinct from our existing regional business units to focus on managing development projects and building new mines. This specialized group manages all project development activities up to and including the commissioning of new mines, at which point responsibility for mine operations will be handed over to the regional business units. We have revised the format of information provided to the Chief Operating Decision Maker in order to make resource allocation decisions and assess the operating performance of this group. Accordingly, we have revised our operating segment disclosure to be consistent with the internal management structure and reporting changes, with restatement of comparative information to conform to the current period presentation. In third quarter 2008, we completed the acquisition of Barrick Energy (note 3a). The results of Barrick Energy are distinct from our existing regional business units and as such are presented as Other in our segment information.
Income Statement Information
|
| Sales |
| Segment expenses |
| Segment income (loss)(1),(2) |
| |||||||||||||||||||||
For the years ended December 31 |
| 2008 |
| 2007 |
| 2006 |
| 2008 |
| 2007 |
| 2006 |
| 2008 |
| 2007 |
| 2006 |
| |||||||||
Gold |
|
|
|
|
|
|
|
|
|
|
|
|
|
|
|
|
|
|
| |||||||||
North America |
| $ | 2,627 |
| $ | 2,001 |
| $ | 1,791 |
| $ | 1,517 |
| $ | 1,178 |
| $ | 1,039 |
| $ | 739 |
| $ | 483 |
| $ | 484 |
|
South America |
| 1,833 |
| 1,306 |
| 1,131 |
| 531 |
| 400 |
| 305 |
| 1,127 |
| 664 |
| 693 |
| |||||||||
Australia Pacific |
| 1,658 |
| 1,292 |
| 1,144 |
| 1,051 |
| 934 |
| 749 |
| 342 |
| 108 |
| 201 |
| |||||||||
Africa |
| 538 |
| 428 |
| 427 |
| 327 |
| 293 |
| 226 |
| 145 |
| 55 |
| 111 |
| |||||||||
Copper |
|
|
|
|
|
|
|
|
|
|
|
|
|
|
|
|
|
|
| |||||||||
South America |
| 1,007 |
| 1,065 |
| 955 |
| 315 |
| 231 |
| 282 |
| 624 |
| 752 |
| 621 |
| |||||||||
Australia Pacific |
| 221 |
| 240 |
| 182 |
| 121 |
| 108 |
| 109 |
| 44 |
| 92 |
| 55 |
| |||||||||
Capital Projects |
| — |
| — |
| — |
| — |
| — |
| — |
| (254 | ) | (187 | ) | (111 | ) | |||||||||
Other |
| 29 |
| — |
| — |
| 14 |
| — |
| — |
| 2 |
| — |
| — |
| |||||||||
|
| $ | 7,913 |
| $ | 6,332 |
| $ | 5,630 |
| $ | 3,876 |
| $ | 3,144 |
| $ | 2,710 |
| $ | 2,769 |
| $ | 1,967 |
| $ | 2,054 |
|
(1) Segment income (loss) represents segment sales, less cost of sales, less segment amortization and accretion. For the year ended December 31, 2008, accretion expense was $43 million (2007: $50 million; 2006: $39 million), see note 15 for further details. Segment loss for the Capital Projects segment includes project development expense and losses from capital projects held through equity investees, see notes 7 and 12 for further details.
(2) Accretion expense related to capital projects is included within amortization and accretion. All other amounts related to the capital projects segments are included within project development expense.
95
Income Statement Information (cont’d)
|
| Exploration(1) |
| Regional business unit costs(1) |
| ||||||||||||||
For the years ended December 31 |
| 2008 |
| 2007 |
| 2006 |
| 2008 |
| 2007 |
| 2006 |
| ||||||
North America(2) |
| $ | 69 |
| $ | 66 |
| $ | 61 |
| $ | 48 |
| $ | 27 |
| $ | 32 |
|
South America |
| 40 |
| 33 |
| 22 |
| 29 |
| 23 |
| 19 |
| ||||||
Australia Pacific |
| 52 |
| 46 |
| 44 |
| 48 |
| 38 |
| 38 |
| ||||||
Africa |
| 18 |
| 15 |
| 22 |
| 24 |
| 11 |
| 1 |
| ||||||
Other expenses outside reportable segments |
| 12 |
| 8 |
| 19 |
| — |
| — |
| — |
| ||||||
Capital projects |
| 25 |
| 11 |
| 3 |
| — |
| — |
| — |
| ||||||
|
| $ | 216 |
| $ | 179 |
| $ | 171 |
| $ | 149 |
| $ | 99 |
| $ | 90 |
|
(1) Exploration and regional business unit costs are excluded from the measure of segment income but are reported separately by operating segment to the Chief Operating Decision Maker.
(2) In 2008, regional business unit costs include costs for Barrick Energy.
Geographic Information
|
| Long-lived assets(1) |
| Sales(2) |
| ||||||||||||||
For the years ended December 31 |
| 2008 |
| 2007 |
| 2006 |
| 2008 |
| 2007 |
| 2006 |
| ||||||
North America |
|
|
|
|
|
|
|
|
|
|
|
|
| ||||||
United States |
| $ | 4,587 |
| $ | 2,637 |
| $ | 2,518 |
| $ | 2,501 |
| $ | 1,882 |
| $ | 1,702 |
|
Canada |
| 1,017 |
| 796 |
| 852 |
| 126 |
| 119 |
| 89 |
| ||||||
Dominican Republic |
| 446 |
| 139 |
| 133 |
| — |
| — |
| — |
| ||||||
South America |
|
|
|
|
|
|
|
|
|
|
|
|
| ||||||
Peru |
| 337 |
| 392 |
| 492 |
| 1,367 |
| 1,033 |
| 878 |
| ||||||
Chile |
| 2,763 |
| 2,485 |
| 1,599 |
| 1,007 |
| 1,065 |
| 955 |
| ||||||
Argentina |
| 1,123 |
| 1,048 |
| 1,014 |
| 466 |
| 273 |
| 253 |
| ||||||
Australia Pacific |
|
|
|
|
|
|
|
|
|
|
|
|
| ||||||
Australia |
| 1,749 |
| 1,724 |
| 2,142 |
| 1,340 |
| 1,250 |
| 1,116 |
| ||||||
Papua New Guinea |
| 677 |
| 702 |
| 438 |
| 539 |
| 282 |
| 210 |
| ||||||
Africa |
|
|
|
|
|
|
|
|
|
|
|
|
| ||||||
Tanzania |
| 1,816 |
| 1,336 |
| 993 |
| 538 |
| 428 |
| 427 |
| ||||||
Other |
| 179 |
| 478 |
| 603 |
| 29 |
| — |
| — |
| ||||||
|
| $ | 14,694 |
| $ | 11,737 |
| $ | 10,784 |
| $ | 7,913 |
| $ | 6,332 |
| $ | 5,630 |
|
(1) Long-lived assets include property, plant and equipment, investments, deferred income tax assets and other assets.
(2) Presented based on the location in which the sale originated.
Reconciliation of Segment Income to Income from Continuing Operations Before Income Taxes and Other Items
For the years ended December 31 |
| 2008 |
| 2007 |
| 2006 |
| |||
Segment income |
| $ | 2,769 |
| $ | 1,967 |
| $ | 2,054 |
|
Amortization of corporate assets |
| (19 | ) | (20 | ) | (19 | ) | |||
Exploration |
| (216 | ) | (179 | ) | (171 | ) | |||
Other project expenses |
| (57 | ) | (15 | ) | (8 | ) | |||
Corporate administration |
| (155 | ) | (155 | ) | (142 | ) | |||
Other expenses |
| (295 | ) | (205 | ) | (212 | ) | |||
Impairment charges (note 8b) |
| (749 | ) | (42 | ) | (17 | ) | |||
Interest income |
| 39 |
| 141 |
| 110 |
| |||
Interest expense |
| (21 | ) | (113 | ) | (126 | ) | |||
Other income |
| 291 |
| 110 |
| 97 |
| |||
Write-down of investments (note 8b) |
| (205 | ) | (23 | ) | (6 | ) | |||
Loss from capital projects held through equity investees |
| 69 |
| 14 |
| — |
| |||
Income from continuing operations before income taxes and other items |
| $ | 1,451 |
| $ | 1,480 |
| $ | 1,560 |
|
96
Asset Information
|
| Segment |
| Amortization |
| Segment |
| |||||||||||||||||||||
For the years ended December 31 |
| 2008 |
| 2007 |
| 2006 |
| 2008 |
| 2007 |
| 2006 |
| 2008 |
| 2007 |
| 2006 |
| |||||||||
Gold |
|
|
|
|
|
|
|
|
|
|
|
|
|
|
|
|
|
|
| |||||||||
North America |
| $ | 5,083 |
| $ | 3,370 |
| $ | 3,254 |
| $ | 350 |
| $ | 314 |
| $ | 247 |
| $ | 382 |
| $ | 225 |
| $ | 196 |
|
South America |
| 1,223 |
| 1,220 |
| 1,319 |
| 165 |
| 234 |
| 127 |
| 80 |
| 158 |
| 224 |
| |||||||||
Australia Pacific |
| 2,227 |
| 2,173 |
| 2,434 |
| 258 |
| 239 |
| 186 |
| 199 |
| 208 |
| 211 |
| |||||||||
Africa |
| 1,195 |
| 1,031 |
| 810 |
| 62 |
| 78 |
| 88 |
| 133 |
| 118 |
| 85 |
| |||||||||
Copper |
|
|
|
|
|
|
|
|
|
|
|
|
|
|
|
|
|
|
| |||||||||
South America |
| 1,267 |
| 1,271 |
| 1,276 |
| 66 |
| 80 |
| 51 |
| 24 |
| 27 |
| 17 |
| |||||||||
Australia Pacific |
| 28 |
| 116 |
| 146 |
| 57 |
| 39 |
| 17 |
| 57 |
| 11 |
| 22 |
| |||||||||
Capital projects |
| 3,266 |
| 2,195 |
| 1,066 |
| — |
| — |
| — |
| 919 |
| 326 |
| 259 |
| |||||||||
Other |
| 382 |
| — |
| — |
| 13 |
| — |
| — |
| 15 |
| — |
| — |
| |||||||||
Segment total |
| 14,671 |
| 11,376 |
| 10,305 |
| 971 |
| 984 |
| 716 |
| 1,809 |
| 1,073 |
| 1,014 |
| |||||||||
Cash and equivalents |
| 1,437 |
| 2,207 |
| 3,043 |
| — |
| — |
| — |
| — |
| — |
| — |
| |||||||||
Other current assets |
| 2,675 |
| 2,092 |
| 1,753 |
| — |
| — |
| — |
| — |
| — |
| — |
| |||||||||
Intangible assets |
| 75 |
| 68 |
| 75 |
| — |
| — |
| — |
| — |
| — |
| — |
| |||||||||
Goodwill |
| 5,280 |
| 5,847 |
| 5,855 |
| — |
| — |
| — |
| — |
| — |
| — |
| |||||||||
Other items not allocated to segments |
| 23 |
| 361 |
| 479 |
| 19 |
| 20 |
| 19 |
| 134 |
| 17 |
| 17 |
| |||||||||
|
|
|
|
|
|
|
|
|
|
|
|
|
|
|
|
|
|
|
| |||||||||
Enterprise total |
| $ | 24,161 |
| $ | 21,951 |
| $ | 21,510 |
| $ | 990 |
| $ | 1,004 |
| $ | 735 |
| $ | 1,943 |
| $ | 1,090 |
| $ | 1,031 |
|
(1) Segment capital expenditures are presented for internal management reporting purposes on an accrual basis. Capital expenditures in the Consolidated Statements of Cash Flow are presented on a cash basis. In 2008, cash expenditures were $1,776 million (2007: $1,046 million; 2006: $1,087 million) and the increase in accrued expenditures was $167 million in 2008 (2007: $44 million decrease; 2006: $56 million increase).
5 · Revenue and Gold Sales Contracts
For the years ended December 31 |
| 2008 |
| 2007 |
| 2006 |
| |||
Gold bullion sales(2) |
|
|
|
|
|
|
| |||
Spot market sales |
| $ | 6,507 |
| $ | 3,823 |
| $ | 3,957 |
|
Gold sales contracts |
| — |
| 1,026 |
| 369 |
| |||
|
| 6,507 |
| 4,849 |
| 4,326 |
| |||
Concentrate sales(3) |
| 149 |
| 178 |
| 167 |
| |||
|
| $ | 6,656 |
| $ | 5,027 |
| $ | 4,493 |
|
Copper sales(1),(4) |
|
|
|
|
|
|
| |||
Copper cathode sales |
| $ | 1,038 |
| $ | 1,063 |
| $ | 937 |
|
Concentrate sales |
| 190 |
| 242 |
| 200 |
| |||
|
| $ | 1,228 |
| $ | 1,305 |
| $ | 1,137 |
|
Oil and gas sales(5) |
| 29 |
| — |
| — |
| |||
|
| $ | 7,913 |
| $ | 6,332 |
| $ | 5,630 |
|
(1) Revenues include amounts transferred from OCI to earnings for commodity cash flow hedges (see notes 20c and 26).
(2) Gold sales include gains and losses on non-hedge derivative contracts: 2008: $19 million gain (2007: $8 million loss; 2006: $7 million gain).
(3) Concentrate sales include gains and losses on embedded derivatives in smelting contracts: 2008: $3 million loss (2007: $4 million loss; 2006: $4 million gain).
(4) Copper sales include gains and losses on economic copper hedges that do not qualify for hedge accounting treatment: 2008: $67 million gain (2007: $48 million gain; 2006: $14 million loss). Sales also include gains and losses on embedded derivatives in copper smelting contracts: 2008: $38 million loss (2007: $10 million loss; 2006: $nil).
(5) Represents Barrick Energy. Refer to note 3a for further details.
Principal Products
All of our gold mining operations produce gold in doré form, except Eskay Creek, which produces gold concentrate and gold doré; Bulyanhulu which produces both gold doré and gold concentrate; and Osborne which produces a concentrate that contains both gold and copper. Gold doré is unrefined gold bullion bars usually consisting of 90% gold that is refined to pure gold bullion prior to sale to our customers. Gold concentrate is a processing product containing the valuable ore mineral (gold) from which most of the waste mineral has been eliminated, that undergoes a smelting process to convert it into gold bullion. Gold bullion is sold primarily in the London spot market or under gold sales contracts. Gold concentrate is sold to third-party smelters. At our Zaldívar mine we produce pure copper cathode, which consists of 99.9% copper, a form that is deliverable for sale in world metals exchanges.
Revenue Recognition
We record revenue when the following conditions are met: persuasive evidence of an arrangement exists; delivery and transfer of title (gold revenue only) have occurred under the terms of the arrangement; the price is fixed or determinable; and collectability is reasonably assured. Revenue in 2008 is presented net of direct sales taxes of $23 million (2007: $15 million; 2006: $16 million).
97
Gold Bullion Sales
We record revenue from gold and silver bullion sales at the time of physical delivery, which is also the date that title to the gold or silver passes. The sales price is fixed at the delivery date based on either the terms of gold sales contracts or the gold spot price. Incidental revenues from the sale of by-products such as silver are classified within cost of sales.
Gold Sales Contracts
At December 31, 2008, we had Project Gold Sales Contracts with various customers for a total of 9.5 million ounces of future gold production of which 4.2 million ounces are based on floating spot prices.
Our gold sales contracts are excluded from the scope of FAS 133, because our obligations under these contracts will be met by physical delivery of gold produced at our mines and they meet the other requirements set out in paragraph 10(b) of FAS 133. In addition, our past sales practices, productive capacity and delivery intentions are consistent with the definition of normal sales contracts. Accordingly, we have elected to designate our gold sales contracts as “normal sales contracts” with the result that these contracts are not required to be accounted for as derivatives. Instead, we recognize revenue based on the contract sales price at the time of physical delivery per the accounting principles as described above.
The terms of gold sales contracts are governed by master trading agreements (MTAs) that we have in place with each customer. The contracts have final delivery dates primarily over the next 10 years, but we have the right to settle these contracts at any time over this period. Contract prices are established at inception through to an interim date. If we do not deliver at this interim date, a new interim date is set. The price for the new interim date is determined in accordance with the MTAs which have a mechanism to establish the applicable price adjusments. The MTAs have both fixed and floating price mechanisms. Under the fixed-price mechanism, a price is fixed with reference to the gold forward market but the price does not increase or decrease due to changes in the spot gold price, whereas under the floating price mechanism, the future selling price does increase or decrease as spot gold prices increase or decrease. The final realized selling price under a contract primarily depends upon the price mechanism selected at each interim date, the timing of the actual future delivery date, the market price of gold at the start of the contract and the forward gold market at each interim date.
Mark-to-Market Value
|
| Total |
| At Dec. 31, |
| |
|
| ounces in |
| 2008 |
| |
$ millions |
| millions |
| value(1) |
| |
Project Gold Sales Contracts |
| 9.5 |
| $ | (4,865 | ) |
(1) At a spot gold price of $870 per ounce. The fair value of gold sales contracts are the present value of expected cash flows that would be required to financially settle our obligations arising under the contracts. The present value model utilizes inputs, such as the current spot gold price, gold lease rates, US dollar interest rate curves and counterparty credit spreads, that are derived from observable market data. The fair value of the gold sales con- tracts does not impact the reported accounting results when we settle these contracts through physical delivery. Instead, we will recognize revenue at that time based on the appropriate contract sales price.
Concentrate Sales
Under the terms of concentrate sales contracts with independent smelting companies, gold and copper sales prices are provisionally set on a specified future date after shipment based on market prices. We record revenues under these contracts at the time of shipment, which is also when title passes to the smelting companies, using forward market gold and copper prices on the expected date that final sales prices will be fixed. Variations between the price recorded at the shipment date and the actual final price set under the smelting contracts are caused by changes in market gold and copper prices, and result in an embedded derivative in the accounts receivable. The embedded derivative is recorded at fair value each period until final settlement occurs, with changes in fair value classified as provisional price adjustments and included as a component of revenue.
Copper Cathode Sales
Under the terms of copper cathode sales contracts, copper sales prices are provisionally set on a specified future date based upon market commodity prices plus certain price adjustments. Revenue is recognized at the time of shipment when risk of loss passes to the customer, and collectability is reasonably assured. Revenue is provisionally measured using forward market prices on the expected date that final selling prices will be fixed. Variations occur between the price recorded on the date of revenue recognition and the actual final price under the terms of the contracts due to changes in market copper prices, which result in the existence of an embedded derivative in the accounts receivable. This embedded derivative is recorded at fair value each period until final settlement occurs, with changes in fair value classified as provisional price adjustments and included as a component of revenue.
98
Provisional Copper and Gold Sales
We had the following revenues before treatment and refining charges subject to final price adjustments:
At December 31 |
| 2008 |
| 2007 |
| ||
Copper |
| $ | 80 |
| $ | 142 |
|
Gold |
| 15 |
| 9 |
| ||
The final price adjustments were as follows:
For the years ended December 31 |
| 2008 |
| 2007 |
| 2006 |
| |||
Gain (loss) |
|
|
|
|
|
|
| |||
Copper |
| $ | (31 | ) | $ | (6 | ) | $ | 9 |
|
Gold |
| — |
| (1 | ) | 3 |
| |||
Oil and Gas Sales
Revenue from the sale of crude oil, natural gas and natural gas liquids is recorded at the time it enters the pipeline system, which is also when title transfers and there is reasonable assurance of collectability. At the time of delivery of oil and gas, prices are fixed and determinable based upon contracts referenced to monthly market commodity prices plus certain price adjustments. Price adjustments include product quality and transportation adjustments and market differentials.
6 · Cost of Sales
|
| Gold |
| Copper |
| Oil & Gas |
| |||||||||||||||||||||
For the years ended December 31 |
| 2008 |
| 2007 |
| 2006 |
| 2008 |
| 2007 |
| 2006 |
| 2008 |
| 2007 |
| 2006 |
| |||||||||
Cost of goods sold(1) |
| $ | 3,258 |
| $ | 2,715 |
| $ | 2,265 |
| $ | 432 |
| $ | 334 |
| $ | 388 |
| $ | 8 |
| $ | — |
| $ | — |
|
Unrealized losses on non-hedge contracts |
| 14 |
| 5 |
| — |
| — |
| — |
| — |
| — |
| — |
| — |
| |||||||||
By-product revenues(2) |
| (93 | ) | (105 | ) | (123 | ) | (2 | ) | (2 | ) | (1 | ) | — |
| — |
| — |
| |||||||||
Royalty expense |
| 205 |
| 161 |
| 150 |
| 6 |
| 7 |
| 4 |
| 6 |
| — |
| — |
| |||||||||
Mining production taxes |
| 42 |
| 29 |
| 27 |
| — |
| — |
| — |
| — |
| — |
| — |
| |||||||||
|
| $ | 3,426 |
| $ | 2,805 |
| $ | 2,319 |
| $ | 436 |
| $ | 339 |
| $ | 391 |
| $ | 14 |
| $ | — |
| $ | — |
|
(1) Cost of goods sold includes charges to reduce the cost of inventory to net realizable value as follows: $68 million for the year ended December 31, 2008 (2007: $13 million; 2006: $28 million). The cost of inventory sold in the period reflects all components capitalized to inventory, except that, for presentation purposes, the component of inventory cost relating to amortization of property, plant and equipment is classified in the income statement under “amortization”. Some companies present this amount under “cost of sales”. The amount presented in amortization rather than cost of sales was $971 million in the year ended December 31, 2008 (2007: $984 million; 2006: $716 million).
(2) We use silver sales contracts to sell a portion of silver produced as a by-product. Silver sales contracts have similar delivery terms and pricing mechanisms as gold sales contracts and accordingly, are accounted for in a manner similar to our gold sales contracts. At December 31, 2008, we had fixed-price commitments to deliver 7.2 million ounces of silver at an average price of $6.59 per ounce and floating spot price silver sales contracts for 8.9 million ounces over periods primarily of up to 10 years. The mark-to-market on silver sales contracts at December 31, 2008 was negative $67 million (2007: negative $111 million; 2006: $100 million). Refer to note 21 for further information on fair value measurements.
Royalties
Certain of our properties are subject to royalty arrangements based on mineral production at the properties. The most significant royalties are at the Goldstrike, Bulyanhulu and Veladero mines and the Pascua-Lama project. The primary type of royalty is a net smelter return (NSR) royalty. Under this type of royalty we pay the holder an amount calculated as the royalty percentage multiplied by the value of gold production at market gold prices less third-party smelting, refining and transportation costs. Other types of royalties include:
· Net profits interest (NPI) royalty,
· Net smelter return sliding scale (NSRSS) royalty,
· Gross proceeds sliding scale (GPSS) royalty,
· Gross smelter return (GSR) royalty,
· Net value (NV) royalty, and a
· Land tenement (LT) royalty.
Royalty expense is recorded at the time of sale of gold production.
Royalties applicable to our oil and gas properties include:
· Crown royalties,
· Net profits interest (NPI) royalty, and
· Overriding royalty (ORR).
99
Producing mines & |
|
|
development projects |
| Type of royalty |
North America |
|
|
Goldstrike |
| 0%–5% NSR, 0%–6% NPI |
Williams |
| 1.5% NSR, 0.75% NV, 1% NV |
David Bell |
| 3% NSR |
Round Mountain |
| 3.53%–6.35% NSRSS |
Bald Mountain |
| 3.5%–7% NSRSS |
|
| 2.9%–4% NSR |
|
| 10% NPI |
Ruby Hill |
| 3% modified NSR |
Cortez |
| 1.5% GSR |
Cortez – Pipeline/South Pipeline deposit |
| 0.4%–9% GSR |
Cortez – portion of Pipeline/ South Pipeline deposit |
| 5% NV |
South America |
|
|
Veladero |
| 3.75% modified NSR |
Lagunas Norte |
| 2.51% NSR |
Australia Pacific |
|
|
Porgera |
| 2% NSR, 0.25% other |
Queensland & Western Australia production(1) |
| 2.5%–2.7% of gold revenue |
Cowal |
| 4% of net gold revenue |
Henty |
| 2.6%–12% of gold revenue |
Africa |
|
|
Bulyanhulu |
| 3% NSR |
Tulawaka |
| 3% NSR |
North Mara |
| 3% NSR |
North Mara – Gokona pit |
| 3% NSR, 1.1% LT |
Capital Projects |
|
|
Donlin Creek Project |
| 1.5% NSR (first 5 years), |
|
| 4.5% NSR (thereafter) |
Pascua-Lama Project – Chile gold production |
| 1.5%–9.8% GPSS |
Pascua-Lama Project – Chile copper production |
| 2% NSR |
Pascua-Lama Project – Argentina production |
| 3% NSR |
Pueblo Viejo |
| 3.2% NSR, 0–25% NPI |
Buzwagi |
| 3%–3.1% NSR |
Other |
|
|
Barrick Energy |
| 1.1% NPI |
|
| 1.3% ORR |
|
| 21.6% Crown royalty, net |
(1) Includes the Kalgoorlie, Kanowna, Granny Smith, Plutonic, Darlot, Lawlers and Osborne mines.
7 · Exploration and Project Development Expense
For the years ended December 31 |
| 2008 |
| 2007 |
| 2006 |
| |||
Exploration: |
|
|
|
|
|
|
| |||
Minesite exploration |
| $ | 80 |
| $ | 63 |
| $ | 54 |
|
Projects |
| 136 |
| 116 |
| 117 |
| |||
|
| $ | 216 |
| $ | 179 |
| $ | 171 |
|
Project development expense: |
|
|
|
|
|
|
| |||
Pueblo Viejo(1) |
| 62 |
| 67 |
| 25 |
| |||
Donlin Creek(2) |
| — |
| 32 |
| 37 |
| |||
Sedibelo |
| 17 |
| 22 |
| 10 |
| |||
Fedorova |
| 24 |
| 18 |
| — |
| |||
Pascua-Lama |
| 21 |
| 12 |
| 8 |
| |||
Kainantu |
| 28 |
| — |
| — |
| |||
Pinson |
| 17 |
| — |
| — |
| |||
Buzwagi |
| 1 |
| 5 |
| 12 |
| |||
Other |
| 15 |
| 17 |
| 19 |
| |||
|
| $ | 185 |
| $ | 173 |
| $ | 111 |
|
Other project expenses |
| 57 |
| 15 |
| 8 |
| |||
|
| $ | 242 |
| $ | 188 |
| $ | 119 |
|
(1) Represents 100% of project expenditures. We record a non-controlling interest recovery for our partner’s share of expenditures within “non-controlling interests” in the income statement.
(2) Amounts for 2007 include a recovery of $64 million of cumulative project costs from our partner. See note 12 for further details.
Accounting Policy for Exploration and Project Expenditures
Exploration Expenditures
Exploration expenditures relate to the initial search for deposits with economic potential, including costs incurred at both greenfield sites (sites where we do not have any mineral deposits that are already being mined or developed) and brownfield sites (sites that are adjacent to a mineral deposit that is classified within proven and probable reserves as defined by United States reporting standards and are already being mined or developed). Exploration expenditures relate to costs incurred to evaluate and assess deposits that have been identified as having economic potential, including exploratory drilling.
Expenditures on exploration activity conducted at greenfield sites are expensed as incurred. Exploratory drilling and related costs are capitalized when incurred at brownfield sites where the activities are directed at obtaining additional information on the ore body that is classified within proven and probable reserves or for the purpose of converting a mineral resource into a proven and probable reserve and, prior to the commencement of the drilling program, we can conclude that it is probable that such a conversion will take place. Our assessment of probability is based on the following factors: results from previous drill
100
programs; results from geological models; results from a mine scoping study confirming economic viability of the resource; and preliminary estimates of mine inventory, ore grade, cash flow and mine life. Costs incurred at brownfield sites that meet the above criteria are capitalized as mine development costs. All other drilling and related exploration costs incurred at these sites are expensed as mine site exploration.
Project Expenditures
We capitalize the costs of activities at projects after mineralization is classified as proven and probable reserves. Before classifying mineralization as proven and probable reserves, the costs of project activities are expensed as incurred, except for costs incurred to construct tangible assets that are capitalized within property, plant and equipment. Project activities include: preparation of engineering scoping, prefeasibility and feasibility studies; metallurgical testing; permitting; and sample mining. The costs of start-up activities at mines and projects such as recruiting and training are also expensed as incurred within project expense.
The Pueblo Viejo, Donlin Creek, Sedibelo, Kabanga, Cerro Casale and Fedorova projects are in various stages; however, none of these projects had met the criteria for cost capitalization at December 31, 2008. The Reko Diq project is owned through an equity investee and project expenses are included in equity investees in the income statement (see note 12). Effective May 1, 2007, we determined that mineralization at Buzwagi met the definition of proven and probable reserves for United States reporting purposes. Following this determination, we began capitalizing the cost of project activities at Buzwagi. Effective January 1, 2009, we determined that mineralization of Pueblo Viejo met the definition of proven and probable reserves.
8 · Other Charges
a) Other Expense
For the years ended December 31 |
| 2008 |
| 2007 |
| 2006 |
| |||
Regional business unit costs(1) |
| $ | 149 |
| $ | 99 |
| $ | 90 |
|
Community development costs(2) |
| 21 |
| 28 |
| 15 |
| |||
Environmental costs |
| 16 |
| 15 |
| 11 |
| |||
World Gold Council fees |
| 11 |
| 12 |
| 13 |
| |||
Changes in estimate of AROs at closed mines(3) |
| 9 |
| 6 |
| 53 |
| |||
Non-hedge derivative losses |
| 17 |
| 8 |
| — |
| |||
Currency translation losses(4) |
| 30 |
| 1 |
| — |
| |||
Pension and other post-retirement benefit expense (notes 28b and 28e)(5) |
| 5 |
| 5 |
| 3 |
| |||
Other items |
| 37 |
| 31 |
| 27 |
| |||
|
| $ | 295 |
| $ | 205 |
| $ | 212 |
|
(1) Relates to costs incurred at regional business unit offices.
(2) In 2008 and 2007, amounts mainly related to community programs in Peru, Argentina and Papua New Guinea. In 2006, amounts mainly related to community programs in Peru.
(3) In 2006, amount relates to change in estimate of the ARO at the Nickel Plate property in British Columbia, Canada.
(4) In 2008, amounts primarily relate to translation losses on working capital balances in Australia and South America.
(5) For the year ended December 31, 2008, $nil million of pension credit that relates to active employees at producing mines is included in cost of sales (2007: $nil; 2006: $4 million) and $nil million is included in corporate administration (2007: $nil; 2006: $2 million).
Environmental Costs
During the production phases of a mine, we incur and expense the cost of various activities connected with environmental aspects of normal operations, including compliance with and monitoring of environmental regulations; disposal of hazardous waste produced from normal operations; and operation of equipment designed to reduce or eliminate environmental effects. In limited circumstances, costs to acquire and install plant and equipment are capitalized during the production phase of a mine if the costs are expected to mitigate risk or prevent future environmental contamination from normal operations.
When a contingent loss arises from the improper use of an asset, a loss accrual is recorded if the loss is probable and reasonably estimable. Amounts recorded are measured on an undiscounted basis, and adjusted as further information develops or if circumstances change. Recoveries of environmental remediation costs from other parties are recorded as assets when receipt is deemed probable.
101
b) Impairment Charges
For the years ended December 31 |
| 2008 |
| 2007 |
| 2006 |
| |||
Impairment of goodwill (note 17) |
| $ | 678 |
| $ | 42 |
| $ | — |
|
Impairment of long-lived assets(1) |
| 71 |
| — |
| 17 |
| |||
|
| $ | 749 |
| $ | 42 |
| $ | 17 |
|
Write-down of investments (note 12)(2) |
| 205 |
| 23 |
| 6 |
| |||
|
| $ | 954 |
| $ | 65 |
| $ | 23 |
|
(1) In 2008, an impairment charge of $69 million was recorded to reduce the carrying amount to the estimated fair value for Osborne and Marigold. In 2006, the carrying amount of Cuerpo Sur, an extension of Pierina, was tested for impairment on completion of the annual life of mine planning process. An impairment charge of $17 million was recorded to reduce the carrying amount to the estimated fair value.
(2) In 2008, we recorded an impairment charge on our investment in Highland Gold ($140 million), on Asset-Backed Commercial Paper ($39 million) and various other investments in junior gold mining companies ($26 million). In 2007, we recorded an impairment charge on Asset-Backed Commercial Paper of $20 million.
c) Other Income
For the years ended December 31 |
| 2008 |
| 2007 |
| 2006 |
| |||
Gains on sale of assets(1) |
| $ | 187 |
| $ | 2 |
| $ | 9 |
|
Gains on sale of investments(2) (note 12) |
| 59 |
| 71 |
| 6 |
| |||
Royalty income |
| 25 |
| 17 |
| 10 |
| |||
Non-hedge derivative gains |
| — |
| — |
| 2 |
| |||
Currency translation gains |
| — |
| — |
| 2 |
| |||
Gain on vend-in to Highland Gold (note 12) |
| — |
| — |
| 51 |
| |||
Interest income(3) |
| 4 |
| 2 |
| 1 |
| |||
Sale of water rights |
| 4 |
| 5 |
| 5 |
| |||
Other |
| 12 |
| 13 |
| 11 |
| |||
|
| $ | 291 |
| $ | 110 |
| $ | 97 |
|
(1) In 2008, we recorded a gain of $167 million on the disposition of royalties to Royal Gold and a gain of $9 on the sale of Doyon royalty. In 2007, we sold certain properties in South America and Australia, including an $8 million gain on the sale of the Paddington Mill. In 2006, we sold certain properties in Canada and Chile.
(2) In 2008, we recorded a gain of $12 million on the sale of our investment in QGX Ltd. We also sold Asset-Backed Commercial Paper for cash proceeds of $49 million and recorded a gain on sale of $42 million. Refer to note 12 for further details.
(3) Represents interest income on our note receivable from NovaGold (note 12).
9 · Income Tax Expense
For the years ended December 31 |
| 2008 |
| 2007 |
| 2006 |
| |||
Current |
|
|
|
|
|
|
| |||
Canada |
| $ | 22 |
| $ | (3 | ) | $ | 13 |
|
International |
| 613 |
| 518 |
| 444 |
| |||
|
| $ | 635 |
| $ | 515 |
| $ | 457 |
|
Deferred |
|
|
|
|
|
|
| |||
Canada |
| $ | 3 |
| $ | 19 |
| $ | (131 | ) |
International |
| (146 | ) | (25 | ) | 46 |
| |||
|
| $ | (143 | ) | $ | (6 | ) | $ | (85 | ) |
Income tax expense before elements below |
| $ | 492 |
| $ | 509 |
| $ | 372 |
|
Net currency translation (gains) losses on deferred tax balances |
| 98 |
| (76 | ) | (5 | ) | |||
Canadian tax rate changes |
| — |
| 64 |
| 12 |
| |||
Change in tax status in Australia |
| — |
| — |
| (31 | ) | |||
Release of end of year valuation allowances – Tanzania |
| — |
| (156 | ) | — |
| |||
Total expense |
| $ | 590 |
| $ | 341 |
| $ | 348 |
|
Currency Translation
Deferred tax balances are subject to remeasurement for changes in currency exchange rates each period. The most significant balances are Canadian deferred tax assets with a carrying amount of approximately $334 million and Australian and Papua New Guinea net deferred tax liabilities with a carrying amount of approximately $118 million. In 2007, the appreciation of the Canadian and Australian dollar against the US dollar resulted in net translation gains arising totaling $76 million. These gains are included within deferred tax expense/recovery. In 2008, following the strengthening of the US dollar, we recorded translation losses of $98 million.
Canadian Tax Rate Changes
In the second and fourth quarters of 2007 and the second quarter of 2006, federal rate changes were enacted in Canada that lowered the applicable tax rate. The impact of these tax rate changes was to reduce net deferred tax assets in Canada by $64 million in 2007 and $35 million in 2006 that were recorded as a component of deferred income tax expense. Also in second quarter 2006, on change of tax status of a Canadian subsidiary, we recorded a deferred income tax credit of $23 million to reflect the impact on the measurement of deferred income tax assets and liabilities.
102
Change in Tax Status in Australia
In first quarter 2006, an interpretative decision (“ID”) was issued by the Australia Tax Office that clarified the tax treatment of currency gains and losses on foreign denominated liabilities. Under certain conditions, for taxpayers who have made the functional currency election, and in respect of debt that existed at the time the election was made, the ID provided clarification that unrealized foreign exchange gains that currently exist on intercompany debt will not crystallize upon repayment of the debt. The effect of the ID was recorded as a $31 million reduction of deferred tax liabilities.
Release of Tanzanian Valuation Allowances
In 2007, we released $156 million of end of year deferred tax valuation allowances in Tanzania due to the impact of higher market gold prices.
Reconciliation to Canadian Statutory Rate
For the years ended December 31 |
| 2008 |
| 2007 |
| 2006 |
| |||
At 33.50% (2006 and 2005: 36.12%) statutory rate |
| $ | 486 |
| $ | 535 |
| $ | 563 |
|
Increase (decrease) due to: |
|
|
|
|
|
|
| |||
Allowances and special tax deductions(1) |
| (100 | ) | (99 | ) | (55 | ) | |||
Impact of foreign tax rates(2) |
| (82 | ) | 38 |
| (131 | ) | |||
Expenses not tax-deductible |
| 13 |
| 48 |
| 14 |
| |||
Impairment charges not tax deductible |
| 227 |
| 15 |
| 6 |
| |||
Net currency translation (gains)/losses on deferred tax balances |
| 98 |
| (76 | ) | (5 | ) | |||
Release of end of year valuation allowances – Tanzania |
| — |
| (156 | ) | — |
| |||
Release of valuation allowances – Other |
| (175 | ) | (88 | ) | (53 | ) | |||
Valuation allowances set up against current year tax losses |
| 74 |
| 5 |
| 7 |
| |||
Impact of changes in tax status in Australia |
| — |
| — |
| (31 | ) | |||
Canadian tax rate changes |
| — |
| 64 |
| 12 |
| |||
Withholding taxes |
| 21 |
| 17 |
| 19 |
| |||
Mining taxes |
| 19 |
| 19 |
| 9 |
| |||
Other items |
| 9 |
| 19 |
| (7 | ) | |||
Income tax expense |
| $ | 590 |
| $ | 341 |
| $ | 348 |
|
(1) We are able to claim certain allowances and tax deductions unique to extractive industries that result in a lower effective tax rate.
(2) We operate in multiple foreign tax jurisdictions that have tax rates different than the Canadian statutory rate. Additionally, we have reinvested earnings and cash flow generated by the Zaldívar mine in Chile to fund a portion of the construction cost of Pascua-Lama. The reinvestment of these earnings and cash flow resulted in a lower tax rate applied for the period. Amounts in 2007 included the impact of losses realized on deliveries into corporate gold sales contracts in a low tax jurisdiction.
10 · Earnings per share
For the years ended December 31 |
|
|
|
|
|
|
|
|
|
|
|
|
| ||||||
($ millions, except shares in millions |
| 2008 |
| 2007 |
| 2006 |
| ||||||||||||
and per share amounts in dollars) |
| Basic |
| Diluted |
| Basic |
| Diluted |
| Basic |
| Diluted |
| ||||||
Income from continuing operations |
| $ | 785 |
| $ | 785 |
| $ | 1,110 |
| $ | 1,110 |
| $ | 1,209 |
| $ | 1,209 |
|
Plus: interest on convertible debentures |
| — |
| 3 |
| — |
| 2 |
| — |
| 4 |
| ||||||
Income available to common shareholders and after assumed conversions |
| 785 |
| 788 |
| 1,110 |
| 1,112 |
| 1,209 |
| 1,213 |
| ||||||
Income from discontinued operations |
| — |
| — |
| 9 |
| 9 |
| 297 |
| 297 |
| ||||||
Net income |
| $ | 785 |
| $ | 788 |
| $ | 1,119 |
| $ | 1,121 |
| $ | 1,506 |
| $ | 1,510 |
|
Weighted average shares outstanding |
| 872 |
| 872 |
| 867 |
| 867 |
| 842 |
| 842 |
| ||||||
Effect of dilutive securities |
|
|
|
|
|
|
|
|
|
|
|
|
| ||||||
Stock options |
| — |
| 4 |
| — |
| 3 |
| — |
| 4 |
| ||||||
Convertible debentures |
| — |
| 9 |
| — |
| 9 |
| — |
| 9 |
| ||||||
|
| 872 |
| 885 |
| 867 |
| 879 |
| 842 |
| 855 |
| ||||||
Earnings per share |
|
|
|
|
|
|
|
|
|
|
|
|
| ||||||
Income from continuing operations |
| $ | 0.90 |
| $ | 0.89 |
| $ | 1.28 |
| $ | 1.27 |
| $ | 1.44 |
| $ | 1.42 |
|
Net income |
| $ | 0.90 |
| $ | 0.89 |
| $ | 1.29 |
| $ | 1.28 |
| $ | 1.79 |
| $ | 1.77 |
|
103
Earnings per share is computed by dividing net income available to common shareholders by the weighted average number of common shares outstanding for the period. Diluted earnings per share reflect the potential dilution that could occur if additional common shares are assumed to be issued under securities that entitle their holders to obtain common shares in the future. For stock options, the number of additional shares for inclusion in diluted earnings per share calculations is determined using the treasury stock method. Under this method, stock options, whose exercise price is less than the average market price of our common shares, are assumed to be exercised and the proceeds are used to repurchase common shares at the average market price for the period. The incremental number of common shares issued under stock options and repurchased from proceeds is included in the calculation of diluted earnings per share. For convertible debentures, the number of additional shares for inclusion in diluted earnings per share calculations is determined using the as if converted method. The incremental number of common shares issued is included in the number of weighted average shares outstanding and interest on the convertible debentures is excluded from the calculation of income.
11 · Cash Flow – Other Items
a) Operating Cash Flows – Other Items
For the years ended December 31 |
| 2008 |
| 2007 |
| 2006 |
| |||
Adjustments for non-cash income statement items: |
|
|
|
|
|
|
| |||
Currency translation (gains) losses (notes 8a and 8c) |
| $ | 30 |
| $ | 1 |
| $ | (2 | ) |
Amortization of discount/premium on debt securities (note 20b) |
| (7 | ) | (3 | ) | (12 | ) | |||
Amortization of debt issue costs (note 20b) |
| 7 |
| 9 |
| 12 |
| |||
Stock option expense (note 27a) |
| 25 |
| 25 |
| 27 |
| |||
Equity in investees (note 12) |
| 64 |
| 43 |
| 4 |
| |||
Gain on sale of investments (note 8c) |
| (59 | ) | (71 | ) | (6 | ) | |||
Losses on write-down of inventory (note 13) |
| 68 |
| 13 |
| 28 |
| |||
Non-controlling interests (note 2b) |
| 12 |
| (14 | ) | (1 | ) | |||
Net change in operating assets and liabilities, excluding inventory |
| (128 | ) | (7 | ) | 51 |
| |||
Revisions to AROs at closed mines (note 22) |
| 9 |
| 6 |
| 53 |
| |||
Settlement of AROs (note 22) |
| (40 | ) | (33 | ) | (32 | ) | |||
Non-hedge derivative gold options |
| — |
| 30 |
| 14 |
| |||
Hedge losses on acquired gold hedge position |
| (2 | ) | 2 |
| 165 |
| |||
Gain on Highland vend-in (note 8c) |
| — |
| — |
| (51 | ) | |||
Income from discontinued operations |
| — |
| (9 | ) | (297 | ) | |||
Other net operating activities |
| $ | (21 | ) | $ | (8 | ) | $ | (47 | ) |
Operating cash flow includes payments for: |
|
|
|
|
|
|
| |||
Pension plan contributions (note 28a) |
| $ | 47 |
| $ | 49 |
| $ | 36 |
|
Cash interest paid (note 20b) |
| $ | 213 |
| $ | 236 |
| $ | 211 |
|
b) Investing Cash Flows – Other Items
For the years ended December 31 |
| 2008 |
| 2007 |
| 2006 |
| |||
Loans to joint venture partners |
| $ | (4 | ) | $ | (47 | ) | $ | — |
|
Purchase of land and water rights |
| (16 | ) | — |
| — |
| |||
Purchases of royalties |
| (42 | ) | — |
| — |
| |||
Funding for equity investees |
| (99 | ) | — |
| — |
| |||
Decrease in restricted cash (note 14) |
| 18 |
| 19 |
| — |
| |||
Non-hedge derivative copper options |
| — |
| (23 | ) | — |
| |||
Other |
| (27 | ) | 9 |
| 17 |
| |||
Other net investing activities |
| $ | (170 | ) | $ | (42 | ) | $ | 17 |
|
c) Non-Cash Investing and Financing Activities
Placer Dome Acquisition
In 2006, we purchased all of the common shares of Placer Dome for $10,054 million, of which $8,761 million was share consideration (see note 3f). In conjunction with the acquisition, liabilities were assumed as follows:
Fair value of assets acquired(1) |
| $ | 15,346 |
|
Consideration paid |
| 10,054 |
| |
Liabilities assumed(2) |
| $ | 4,830 |
|
(1) Includes cash of $1,102 million.
(2) Includes debt obligations of $1,252 million (note 20b).
104
Vend-in of Assets to Highland Gold (“Highland”)
In 2006, we exchanged various interests in mineral properties for 34.3 million Highland shares with a value of $95 million at the time of closing of the transaction (see note 12).
Sale of South Deep
In 2006, we sold the South Deep mine to Gold Fields Limited (“Gold Fields”) for $1,517 million. The proceeds included 18.7 million Gold Fields common shares with a value of $308 million (see note 3i).
12 · Investments
At December 31 |
| 2008 |
| 2007 |
| ||||||
Available-for-sale securities |
|
|
|
|
| $ | 31 |
| $ | 96 |
|
Held-to-maturity securities |
|
|
|
|
| — |
| 46 |
| ||
Other investments |
|
|
|
|
| 29 |
| — |
| ||
Equity investments |
|
|
|
|
| 1,085 |
| 1,085 |
| ||
|
|
|
|
|
| $ | 1,145 |
| $ | 1,227 |
|
|
| 2008 |
| 2007 |
| ||||||||
|
|
|
| Gains |
|
|
| Gains |
| ||||
|
| Fair |
| (losses) |
| Fair |
| (losses) |
| ||||
At December 31 |
| value(1) |
| in OCI |
| value |
| in OCI |
| ||||
Available-for-sale securities Securities in an unrealized gain position |
|
|
|
|
|
|
|
|
| ||||
Allied Gold |
| $ | 6 |
| $ | 1 |
| $ | — |
| $ | — |
|
QGX Ltd. |
| — |
| — |
| 13 |
| 6 |
| ||||
Midway Gold Corp. |
| 3 |
| — |
| 17 |
| 9 |
| ||||
Other equity securities |
| 6 |
| 2 |
| 43 |
| 26 |
| ||||
|
| 15 |
| 3 |
| 73 |
| 41 |
| ||||
Securities in an unrealized loss position |
|
|
|
|
|
|
|
|
| ||||
Benefit plans(2) |
|
|
|
|
|
|
|
|
| ||||
Fixed-income |
| $ | 2 |
| $ | — |
| $ | 4 |
| $ | — |
|
Equity |
| 7 |
| (3 | ) | 14 |
| 1 |
| ||||
Other equity securities(3) |
| 7 |
| (2 | ) | 5 |
| (1 | ) | ||||
|
| 16 |
| (5 | ) | 23 |
| — |
| ||||
|
| 31 |
| (2 | ) | 96 |
| 41 |
| ||||
Held-to-maturity securities |
|
|
|
|
|
|
|
|
| ||||
Asset-Backed |
|
|
|
|
|
|
|
|
| ||||
Commercial Paper |
| — |
| — |
| 46 |
| — |
| ||||
Other investments |
|
|
|
|
|
|
|
|
| ||||
Long-term loan receivable from Yokohama Rubber Co. Ltd.(4) |
| 29 |
| — |
| — |
| — |
| ||||
|
| $ | 60 |
| $ | (2 | ) | $ | 142 |
| $ | 41 |
|
(1) Refer to note 21 for further information on the measurement of fair value.
(2) Under various benefit plans for certain former Homestake executives, a portfolio of marketable fixed-income and equity securities are held in a rabbi trust that is used to fund obligations under the plans.
(3) Other equity securities in a loss position consist of investments in various junior mining companies.
(4) The long-term loan receivable is measured at amortized cost.
Accounting Policy for Available-for-Sale Securities
Available-for-sale securities are recorded at fair value with unrealized gains and losses recorded in other comprehensive income (“OCI”). Realized gains and losses are recorded in earnings when investments mature or on sale, calculated using the average cost of securities sold. If the fair value of an investment declines below its carrying amount, we undertake an assessment of whether the impairment is other than temporary. We consider all relevant facts and circumstances in this assessment, particularly: the length of time and extent to which fair value has been less than the carrying amount; the financial condition and near-term prospects of the investee, including any specific events that have impacted its fair value; both positive and negative evidence that the carrying amount is recoverable within a reasonable period of time; and our ability and intent to hold the investment for a reasonable period of time sufficient for an expected recovery of the fair value up to or beyond the carrying amount. We record in earnings any unrealized declines in fair value judged to be other than temporary.
Available-for-Sale Securities Continuity
|
| Gold Fields |
| NovaGold |
| Other |
| Total |
| ||||
January 1, 2006 |
| $ | — |
| $ | — |
| $ | 62 |
| $ | 62 |
|
Purchases |
| — |
| 218 |
| 27 |
| 245 |
| ||||
Received in consideration for sale of South Deep (note 3i) |
| 308 |
| — |
| — |
| 308 |
| ||||
Sales proceeds |
| — |
| — |
| (46 | ) | (46 | ) | ||||
Mark-to-market adjustments |
| 6 |
| 13 |
| 58 |
| 77 |
| ||||
January 1, 2007 |
| 314 |
| 231 |
| 101 |
| 646 |
| ||||
Purchases |
| — |
| — |
| 11 |
| 11 |
| ||||
Sales proceeds |
| (356 | ) | (221 | ) | (48 | ) | (625 | ) | ||||
Mark-to-market adjustments |
| 42 |
| (10 | ) | 32 |
| 64 |
| ||||
January 1, 2008 |
| — |
| — |
| 96 |
| 96 |
| ||||
Purchases |
| — |
| — |
| 18 |
| 18 |
| ||||
Sales proceeds |
| — |
| — |
| (26 | ) | (26 | ) | ||||
Mark-to-market adjustments |
| — |
| — |
| (57 | ) | (57 | ) | ||||
December 31, 2008 |
| $ | — |
| $ | — |
| $ | 31 |
| $ | 31 |
|
105
Gold Fields Limited (“Gold Fields”)
The investment in Gold Fields was acquired on December 1, 2006, as partial consideration for the sale of our interest in South Deep and was recorded net of an initial liquidity discount of $48 million to reflect a 120-day restriction on our ability to trade the shares. During 2007, we sold our entire position of 18.7 million shares for proceeds of $356 million and recorded a gain of $48 million.
NovaGold Resources Inc. (“NovaGold”)
During 2007, we sold our entire investment in NovaGold for proceeds of $221 million and we recorded a gain of $3 million on the sale.
Asset-Backed Commercial Paper (“ABCP”)
In 2007, we recorded impairment charges of $20 million, resulting in a carrying value of $46 million at the end of 2007. An additional $39 million impairment charge was recorded in 2008, resulting in cumulative impairments totaling $59 million and a carrying value of $7 million. Subsequently, we reached an agreement with a third party to sell $66 million of our Asset Backed Commercial Paper (“ABCP”). We received $49 million in proceeds from this sale resulting in a recovery of $42 million which was recorded in Other income.
Agreement with Yokohama Rubber Co. Ltd. (“Yokohama”)
In 2008, we advanced $35 million (“the loan”) to Yokohama to fund expansion of their production facility and secure a guaranteed supply of OTR tires. Interest on the loan is receivable at a lower than market rate, due to the benefit of the supply agreement, and is compounded annually. The principal amount and accrued interest is to be repaid in full no later than seven years from the initial date of the loan. In the event that Barrick does not satisfy certain minimum monthly purchase commitments, Yokohama has the right to apply the dollar value of the purchase shortfall against the principal balance of the loan.
The loan was initially recorded at its fair value, based on an estimated market borrowing rate for a comparable loan without the related tire supply agreement. After initial recognition, the loan is recorded at amortized cost and interest income is recognized at an effective rate of 6%. We determined that the supply contract component of the agreement is an intangible asset with an initial fair value of $8 million. The intangible asset is amortized on a straight line basis over its useful life.
Equity Method Investment Continuity
|
| Highland |
| Atacama |
| Cerro Casale |
| Donlin Creek |
| Other |
| Total |
| ||||||
At January 1, 2006 |
| $ | 131 |
| $ | — |
| $ | — |
| $ | — |
| $ | 7 |
| $ | 138 |
|
Purchases |
| — |
| 123 |
| — |
| — |
| 1 |
| 124 |
| ||||||
Vend-in |
| 71 |
| — |
| — |
| — |
| — |
| 71 |
| ||||||
Equity pick-up |
| (3 | ) | — |
| — |
| — |
| (1 | ) | (4 | ) | ||||||
Capitalized interest |
| — |
| 1 |
| — |
| — |
| — |
| 1 |
| ||||||
Impairment charges |
| — |
| — |
| — |
| — |
| (2 | ) | (2 | ) | ||||||
At January 1, 2007 |
| 199 |
| 124 |
| — |
| — |
| 5 |
| 328 |
| ||||||
Acquired under Arizona Star acquisition |
| — |
| — |
| 732 |
| — |
| — |
| 732 |
| ||||||
Reclassifications |
| — |
| — |
| — |
| 64 |
| (4 | ) | 60 |
| ||||||
Equity pick-up |
| (30 | ) | (14 | ) | — |
| — |
| 1 |
| (43 | ) | ||||||
Capitalized interest |
| — |
| 8 |
| 2 |
| — |
| — |
| 10 |
| ||||||
Impairment charges |
| — |
| — |
| — |
| — |
| (2 | ) | (2 | ) | ||||||
At January 1, 2008 |
| 169 |
| 118 |
| 734 |
| 64 |
| — |
| 1,085 |
| ||||||
Purchases |
| 1 |
| — |
| 41 |
| — |
| — |
| 42 |
| ||||||
Funding |
| — |
| 62 |
| 1 |
| 27 |
| 9 |
| 99 |
| ||||||
Equity pick-up |
| 5 |
| (32 | ) | (11 | ) | (17 | ) | (9 | ) | (64 | ) | ||||||
Elimination of non-controlling interest and inter-company loans |
| — |
| — |
| 8 |
| — |
| — |
| 8 |
| ||||||
Capitalized interest |
| — |
| 9 |
| 42 |
| 4 |
| — |
| 55 |
| ||||||
Impairment charges |
| (140 | ) | — |
| — |
| — |
| — |
| (140 | ) | ||||||
At December 31, 2008 |
| $ | 35 |
| $ | 157 |
| $ | 815 |
| $ | 78 |
| $ | — |
| $ | 1,085 |
|
Publicly traded |
| Yes |
| No |
| No |
| No |
|
|
|
|
| ||||||
106
Accounting Policy for Equity Method Investments
Under the equity method, we record our equity share of the income or loss of equity investees each period. On acquisition of an equity investment, the underlying identifiable assets and liabilities of an equity investee are recorded at fair value and the income or loss of equity investees is based on these fair values. For an investment in a company that represents a business, if the cost of any equity investment exceeds the total amount of the fair value of identifiable assets and liabilities, any excess is accounted for in a manner similar to goodwill, with the exception that an annual goodwill impairment test is not required. Additional funding into an investee is recorded as an increase in the carrying value of the investment. The carrying amount of each investment in a publicly traded equity investee is evaluated for impairment using the same method as an available-for-sale security.
Our investments in non-publicly traded equity investees are exploration and development projects; therefore, we assess if there has been a potential impairment triggering event for an other-than-temporary impairment by: testing the underlying assets of the equity investee for recoverability; and assessing if there has been a change in our mining plan or strategy for the project. If we determine underlying assets are recoverable and no other potential impairment conditions were identified, then our investment in the non-publicly traded equity investee is carried at cost. If the other underlying assets are not recoverable, we record an impairment charge equal to the difference between the carrying amount of the investee and its fair value. Where reliable information is available, we determine fair value based on the present value if cash flows are expected to be generated by the investee. Where reliable cash flow information is not available, we determine fair value using a market approach.
Highland Gold Mining Ltd. (“Highland”)
In 2006, we acquired 34.3 million common shares as part of a vend-in transaction. On closing of this transaction, the fair value of Highland common shares exceeded the carrying amount of assets exchanged by $76 million. We recorded this difference as a gain of $51 million in Other income and the balance of $25 million as a reduction in the carrying amount of our investment in Highland.
In 2007, Highland announced the issue of 130.1 million new shares for $400 million, decreasing our ownership stake in Highland to 20.4% . The equity was purchased by Millhouse LLC (“Millhouse”) in two tranches. On completion of the transactions, Millhouse was entitled to appoint 3 of 9 Directors to the Board and the CEO of Highland who will not serve on the Board. Our ability to appoint Directors has been reduced from 3 to 2. We continue to account for the investment using the equity method of accounting.
In 2008, we recorded an impairment charge of $140 million against the carrying value at December 31, 2008 of Highland following an other-than-temporary decline in the market value of its publicly traded shares.
Donlin Creek
In 2006, as part of the acquisition of Placer Dome, we acquired an interest in the Donlin Creek project. In 2007, we restructured our agreement with our joint venture partner and formed a limited liability company, Donlin Creek LLC, to advance the Donlin Creek project. We determined that we share joint control with NovaGold, and that Donlin Creek LLC is a VIE. Neither party is the primary beneficiary as we jointly share in the expected earnings or losses of the project. We use the equity method of accounting for our investment in Donlin Creek. The initial cost of our investment in Donlin Creek was $64 million and represents the cost basis of assets transferred into the limited liability company.
Our maximum exposure to loss in this entity is limited to the carrying amount of our investment in Donlin Creek, which totaled $78 million and accounts receivable from our partner totaling a further $56 million that are collateralized against NovaGold’s interest in the value of Donlin Creek as of December 31, 2008.
107
Atacama Copper Pty Limited (“Atacama Copper”)
In 2006, we acquired a 50% interest in Atacama Copper. The other 50% interest in Atacama Copper is owned by Antofagasta plc. Atacama Copper is responsible for advancing the Reko Diq project.
We determined that we share joint control with Antofagasta, and that Atacama is a VIE. Neither party is the primary beneficiary as we jointly share in the expected earnings or losses of the project. We use the equity method of accounting for our investment.
Our maximum exposure to loss in this entity is limited to our investment in Atacama, which totaled $157 million as of December 31, 2008, and amounts we will prospectively fund for Atacama’s interim exploration program.
Compañía Minera Casale (“Cerro Casale”)
During 2008, we completed our acquisition of Arizona Star for $732 million. Arizona Star has an interest in the entity that holds the Cerro Casale deposit. We determined that we share joint control with Kinross and that Cerro Casale is a VIE. Neither party is the primary beneficiary as we jointly share in the expected earnings or losses of the project. We use the equity method of accounting for Arizona Star’s investment in Cerro Casale. Our maximum exposure to loss in this entity is limited to our investment in Cerro Casale, which totaled $815 million as of December 31, 2008.
13 · Inventories
|
| Gold |
| Copper |
| ||||||||
At December 31 |
| 2008 |
| 2007 |
| 2008 |
| 2007 |
| ||||
Raw materials |
|
|
|
|
|
|
|
|
| ||||
Ore in stockpiles |
| $ | 825 |
| $ | 698 |
| $ | 41 |
| $ | 63 |
|
Ore on leach pads |
| 161 |
| 149 |
| 189 |
| 81 |
| ||||
Mine operating supplies |
| 434 |
| 351 |
| 34 |
| 20 |
| ||||
Work in process |
| 188 |
| 109 |
| 8 |
| 5 |
| ||||
Finished products |
|
|
|
|
|
|
|
|
| ||||
Gold doré/bullion |
| 65 |
| 87 |
| — |
| — |
| ||||
Copper cathode |
| — |
| — |
| 13 |
| 9 |
| ||||
Copper concentrate |
| — |
| — |
| 18 |
| 16 |
| ||||
Gold concentrate |
| 21 |
| 40 |
| — |
| — |
| ||||
|
| 1,694 |
| 1,434 |
| 303 |
| 194 |
| ||||
Non-current ore in stockpiles(1) |
| (595 | ) | (414 | ) | (93 | ) | (85 | ) | ||||
|
| $ | 1,099 |
| $ | 1,020 |
| $ | 210 |
| $ | 109 |
|
(1) Ore that we do not expect to process in the next 12 months is classified within other assets.
Accounting Policy for Inventory
Material extracted from our mines is classified as either ore or waste. Ore represents material that, at the time of extraction, we expect to process into a saleable form, and sell at a profit. Ore is recorded as an asset that is classified within inventory as material is extracted from the open pit or underground mine. Ore is accumulated in stockpiles that are subsequently processed into gold/copper in a saleable form under a mine plan that takes into consideration optimal scheduling of production of our reserves, present plant capacity, and the market price of gold/copper. Gold/copper work in process represents gold/copper in the processing circuit that has not completed the production process, and is not yet in a saleable form.
Gold and copper ore contained in stockpiles is measured by estimating the number of tons added and removed from the stockpile, and the associated estimate of gold and copper contained therein (based on assay data) and applying estimated metallurgical recovery rates (based on the expected processing method). Stockpile ore tonnages are verified by periodic surveys. Costs are allocated to ore stockpiles based on quantities of material stockpiled using current mining costs incurred up to the point of stockpiling the ore and including allocations of waste mining costs, overheads, depreciation, depletion and amortization relating to mining operations. As ore is processed, costs are removed based on recoverable quantities of gold and/or copper and each stockpile’s average cost per unit. Ore stockpiles are reduced by provisions required to reduce inventory to net realizable value.
We record gold in process, gold doré and gold in concentrate form at average cost, less provisions required to reduce inventory to market value. Average cost is calculated based on the cost of inventory at the beginning of a period, plus the cost of inventory produced in a period. Costs capitalized to in process and finished goods inventory include the cost of stockpiles processed; direct and indirect materials and consumables; direct labor; repairs and maintenance; utilities; amortization of property, plant and equipment; and local mine administrative expenses. Costs are removed from inventory and recorded in cost of sales and amortization expense based on the average cost per ounce of gold in inventory. Mine operating supplies are recorded at the lower of purchase cost and market value.
108
We record provisions to reduce inventory to net realizable value, to reflect changes in economic factors that impact inventory value or to reflect present intentions for the use of slow moving and obsolete supplies inventory.
For the years ended December 31 |
| 2008 |
| 2007 |
| 2006 |
| |||
Inventory impairment charges |
| $ | 68 |
| $ | 13 |
| $ | 28 |
|
Ore on leach pads
The recovery of gold and copper from certain oxide ores is achieved through the heap leaching process. Our Pierina, Lagunas Norte, Veladero, Cortez, Bald Mountain, Round Mountain, Ruby Hill and Marigold mines all use a heap leaching process for gold and our Zaldívar mine uses a heap leaching process for copper. Under this method, ore is placed on leach pads where it is treated with a chemical solution, which dissolves the gold or copper contained in the ore. The resulting “pregnant” solution is further processed in a plant where the gold or copper is recovered. For accounting purposes, costs are added to ore on leach pads based on current mining and leaching costs, including applicable depreciation, depletion and amortization relating to mining operations. Costs are removed from ore on leach pads as ounces or pounds are recovered based on the average cost per recoverable ounce of gold or pound of copper on the leach pad.
Estimates of recoverable gold or copper on the leach pads are calculated from the quantities of ore placed on the leach pads (measured tons added to the leach pads), the grade of ore placed on the leach pads (based on assay data) and a recovery percentage (based on ore type). In general, leach pads recover between 35% and 95% of the ounces or pounds placed on the pads.
Although the quantities of recoverable gold or copper placed on the leach pads are reconciled by comparing the grades of ore placed on pads to the quantities of gold or copper actually recovered (metallurgical balancing), the nature of the leaching process inherently limits the ability to precisely monitor inventory levels. As a result, the metallurgical balancing process is frequently monitored and estimates are refined based on actual results over time. Historically, our operating results have not been materially impacted by variations between the estimated and actual recoverable quantities of gold or copper on our leach pads. At December 31, 2008, the weighted average cost per recoverable ounce of gold and recoverable pound of copper on leach pads was $439 per ounce and $1.07 per pound, respectively (2007: $287 per ounce of gold and $0.39 per pound of copper). Variations between actual and estimated quantities resulting from changes in assumptions and estimates that do not result in write-downs to net realizable value are accounted for on a prospective basis.
The ultimate recovery of gold or copper from a leach pad will not be known until the leaching process is concluded. Based on current mine plans, we expect to place the last ton of ore on our current leach pads at dates for gold ranging from 2009 to 2024 and for copper ranging from 2014 to 2020. Including the estimated time required for residual leaching, rinsing and reclamation activities, we expect that our leaching operations will terminate within a period of up to six years following the date that the last ton of ore is placed on the leach pad.
The current portion of ore inventory on leach pads is determined based on estimates of the quantities of gold or copper at each balance sheet date that we expect to recover during the next 12 months.
Ore in Stockpiles
At December 31 |
| 2008 |
| 2007 |
| Year(1) |
| ||
Gold |
|
|
|
|
|
|
| ||
Goldstrike |
|
|
|
|
|
|
| ||
Ore that requires roasting |
| $ | 375 |
| $ | 320 |
| 2034 |
|
Ore that requires autoclaving |
| 47 |
| 67 |
| 2010 |
| ||
Kalgoorlie |
| 74 |
| 75 |
| 2020 |
| ||
Porgera |
| 113 |
| 88 |
| 2022 |
| ||
Cowal |
| 70 |
| 36 |
| 2020 |
| ||
Veladero |
| 24 |
| 23 |
| 2024 |
| ||
Cortez |
| 54 |
| 19 |
| 2012 |
| ||
Turquoise Ridge |
| 12 |
| 15 |
| 2031 |
| ||
Other |
| 56 |
| 55 |
|
|
| ||
Copper |
|
|
|
|
|
|
| ||
Zaldívar |
| 41 |
| 63 |
| 2021 |
| ||
|
| $ | 866 |
| $ | 761 |
|
|
|
(1) Year in which we expect to fully process the ore in stockpiles.
Purchase Commitments
At December 31, 2008, we had purchase obligations for supplies and consumables of approximately $1,164 million.
14 · Accounts Receivable and Other Current Assets
At December 31 |
| 2008 |
| 2007 |
| ||
Accounts receivable |
|
|
|
|
| ||
Amounts due from concentrate sales |
| $ | 8 |
| $ | 19 |
|
Amounts due from copper cathode sales |
| 42 |
| 89 |
| ||
Other receivables |
| 147 |
| 148 |
| ||
|
| $ | 197 |
| $ | 256 |
|
Other current assets |
|
|
|
|
| ||
Derivative assets (note 20c) |
| $ | 817 |
| $ | 334 |
|
Goods and services taxes recoverable |
| 153 |
| 161 |
| ||
Restricted cash |
| 113 |
| 131 |
| ||
Prepaid expenses |
| 47 |
| 40 |
| ||
Other |
| 39 |
| 41 |
| ||
|
| $ | 1,169 |
| $ | 707 |
|
109
15 · Property, Plant and Equipment
|
|
|
| Exploration |
|
|
|
|
|
|
| |||||
|
| Assets |
| properties, |
|
|
|
|
|
|
| |||||
|
| subject to |
| capital projects |
| Construction |
| Accumulated |
|
|
| |||||
|
| amortization(1),(2) |
| and VBPP |
| in progress(3) |
| amortization |
| Total |
| |||||
At January 1, 2007 |
| $ | 13,410 |
| $ | 1,494 |
| $ | 404 |
| $ | (6,919 | ) | $ | 8,389 |
|
Additions/disposals |
| 778 |
| 84 |
| — |
| 20 |
| 882 |
| |||||
Acquisitions |
| 145 |
| 135 |
| — |
| — |
| 280 |
| |||||
Capitalized interest |
| 16 |
| 97 |
| — |
| — |
| 113 |
| |||||
Amortization |
| — |
| — |
| — |
| (1,004 | ) | (1,004 | ) | |||||
Reclassification(4) |
| — |
| (66 | ) | — |
| — |
| (66 | ) | |||||
Transfers between categories(5) |
| 189 |
| (198 | ) | — |
| — |
| (9 | ) | |||||
At January 1, 2008 |
| $ | 14,538 |
| $ | 1,546 |
| $ | 404 |
| $ | (7,903 | ) | $ | 8,585 |
|
Additions/disposals |
| 611 |
| 756 |
| 626 |
| (155 | ) | 1,838 |
| |||||
Acquisitions |
| 1,609 |
| 409 |
| — |
| — |
| 2,018 |
| |||||
Capitalized interest |
| 57 |
| 110 |
| — |
| — |
| 167 |
| |||||
Amortization |
| — |
| — |
| — |
| (990 | ) | (990 | ) | |||||
Impairments |
| (71 | ) | — |
| — |
| — |
| (71 | ) | |||||
Transfers between categories(5) |
| 481 |
| (209 | ) | (272 | ) | — |
| — |
| |||||
At December 31, 2008 |
| $ | 17,225 |
| $ | 2,612 |
| $ | 758 |
| $ | (9,048 | ) | $ | 11,547 |
|
(1) | Represents capitalized reserve acquisition and development costs and buildings, plant and equipment. |
(2) | Includes assets under capital leases, leach pads and tailings dams. |
(3) | Includes construction in process for tangible assets at operating mines and deposits on long lead items. Once the asset is available for use, it is transferred to Buildings, plant and equipment and amortized over its estimated useful life. |
(4) | Represents the reclassification of Donlin Creek to equity investments. |
(5) | Includes construction in process that is transferred to Buildings, plant and equipment as the asset is available for use and Value beyond proven and probable reserves (“VBPP”) that is transferred to capitalized reserve acquisition and development costs, once mineralized material is converted into proven and probable reserves. |
a) Accounting Policy for Property, Plant and Equipment
Capitalized Reserve Acquisition Costs
We capitalize the cost of acquisition of land and mineral rights. On acquiring a mineral or petroleum and natural gas property, we estimate the fair value of proven and probable reserves, and we record these amounts as assets at the date of acquisition. When production begins, capitalized reserve acquisition costs are amortized using the “units-of-production” method, whereby the numerator is the number of ounces of gold/pounds of copper/barrels of oil equivalent (boe) produced and the denominator is the estimated recoverable ounces of gold/pounds of copper/boe contained in proven and probable reserves.
Capitalized Development Costs
Capitalized development costs include the costs of removing overburden and waste materials at our open pit mining operations prior to the commencement of production; costs incurred to access reserves at our underground mining operations; drilling and related costs incurred that meet the definition of an asset (refer to note 7 for capitalization criteria for drilling and related costs), and qualifying development costs incurred at our petroleum and natural gas properties.
The cost of removing overburden and waste materials to access the ore body at an open pit mine prior to the production phase are referred to as “pre-stripping costs”. Pre-stripping costs are capitalized during the development of an open pit mine. Where a mine operates several open pits that utilize common processing facilities, we capitalize the pre-stripping costs associated with each pit. The production phase of an open pit mine commences when saleable materials, beyond a de minimus amount, are produced. Stripping costs incurred during the production phase of a mine are variable production costs that are included as a component of inventory to be recognized as a component of cost of sales in the same period as the revenue from the sale of inventory. Capitalized pre-stripping costs are amortized using the units-of-production method, whereby the denominator is the estimated recoverable ounces of gold/pounds of copper in the associated open pit.
At our underground mines, we incur development costs to build new shafts, drifts and ramps that will enable us to physically access ore underground. The time over which we will continue to incur these costs depends on the mine life, which could in some cases be up to 25 years. These underground development costs are capitalized as incurred. Costs incurred and capitalized to enable access to specific ore blocks or areas of the mine, and which only
110
provide an economic benefit over the period of mining that ore block or area, are amortized using the units-of-production method, whereby the denominator is estimated recoverable ounces of gold/pounds of copper contained in proven and probable reserves within that ore block or area. If capitalized underground development costs provide an economic benefit over the entire mine life, the costs are amortized using the units-of-production method, whereby the denominator is the estimated recoverable ounces of gold/pounds of copper contained in total accessible proven and probable reserves.
For our petroleum and natural gas properties, we follow the successful efforts method of accounting, whereby exploration expenditures which are either general in nature or related to an unsuccessful drilling program are written off. Only costs which relate directly to the discovery and development of specific commercial oil and gas reserves are capitalized as development costs and amortized using the units-of-production method, whereby the denominator is the estimated recoverable amount of boe.
Buildings, Plant and Equipment
We record buildings, plant and equipment at cost, which includes all expenditures incurred to prepare an asset for its intended use. Cost includes the purchase price; brokers’ commissions; and installation costs including architectural, design and engineering fees, legal fees, survey costs, site preparation costs, freight charges, transportation insurance costs, duties, testing and preparation charges. In addition, if the cost of an asset acquired other than through a business combination is different from its tax basis on acquisition, the cost is adjusted to reflect the related future income tax consequences.
We capitalize costs that extend the productive capacity or useful economic life of an asset. Costs incurred that do not extend the productive capacity or useful economic life of an asset are considered repairs and maintenance and expensed as incurred. We amortize the capitalized cost of assets less any estimated residual value, using the straight line method over the estimated useful economic life of the asset based on their expected use in our business. The longest estimated useful economic life for buildings and equipment at ore processing facilities is 25 years and for mining equipment is 15 years. Depreciation of oil and gas plants and related facilities is calculated using the units-of-production method.
In the normal course of our business, we have entered into certain leasing arrangements whose conditions meet the criteria for the leases to be classified as capital leases. For capital leases, we record an asset and an obligation at an amount equal to the present value at the beginning of the lease term of minimum lease payments over the lease term. In the case of our capital leasing arrangements, there is transfer of ownership of the leased assets to us at the end of the lease term and therefore we amortize these assets on a basis consistent with our other owned assets.
Exploration Properties and Capital Projects
The amounts capitalized to exploration and development projects comprise the cost of mineral interests acquired either as individual asset purchases or as part of a business combination. The value of such assets is primarily driven by the nature and amount of mineralized material contained in such properties. Exploration and development stage mineral interests represent interests in properties that contain proven and probable reserves or are believed to potentially contain mineralized material consisting of (i) other mineralized material such as measured, indicated and inferred material within pits; (ii) other mine exploration potential such as inferred material not immediately adjacent to existing reserves and mineralization but located within the immediate mine area; (iii) other mine-related exploration potential that is not part of measured, indicated or inferred material greenfield exploration potential; (v) any acquired right to explore or extract a potential mineral deposit. Amounts capitalized to capital projects include costs associated with the construction of tangible assets, such as processing plants, permanent housing facilities and other tangible infrastructure associated with the project.
Value Beyond Proven and Probable Reserves (“VBPP”)
On acquisition of mineral property, we prepare an estimate of the fair value of the resources and exploration potential of that property and record this amount as an asset (“VBPP”) as at the date of acquisition. At the time mineralized material is converted into proven and probable reserves, we classify any associated VBPP, which is not subject to amortization, as a component of amounts allocated to proven and probable reserves, which are subject to amortization. As part of our annual business cycle, we prepare estimates of proven and probable gold and copper mineral reserves for each mineral property. The change in reserves,
111
net of production is, among other things, used to determine the amount to be converted from VBPP to proven and probable reserves. For the year ended December 31, 2008, we transferred $178 million of VBPP to proven and probable reserves (2007: $54 million). In 2008, we added $381 million to VBPP on acquiring the additional 40% of Cortez, based on the preliminary purchase price allocation.
Exploration Properties, Capital Projects and VBPP
|
| Carrying amount |
| Carrying amount |
| ||
|
| at December 31, |
| at December 31, |
| ||
|
| 2008 |
| 2007 |
| ||
Exploration projects and other land positions PNG land positions |
| $ | 171 |
| $ | 135 |
|
Value beyond proven and probable reserves at producing mines |
| 525 |
| 322 |
| ||
Capital projects |
|
|
|
|
| ||
Pascua-Lama |
| 777 |
| 609 |
| ||
Pueblo Viejo |
| 439 |
| 140 |
| ||
Sedibelo |
| 123 |
| 81 |
| ||
Buzwagi |
| 495 |
| 224 |
| ||
Punta Colorado Wind Farm |
| 82 |
| 35 |
| ||
|
| $ | 2,612 |
| $ | 1,546 |
|
Capitalized Interest
Interest cost is considered an element of the historical cost of an asset when a period of time is necessary to prepare it for its intended use. We capitalize interest costs to exploration properties and capital projects prior to when production begins while exploration, development or construction activities are in progress. We also capitalize interest costs on the cost of certain equity method investments, wherein the only significant assets are exploration properties or capital projects, and while exploration, development or construction activities are in progress.
Gold and Copper Mineral Reserves
At the end of each fiscal year, as part of our annual business cycle, we prepare estimates of proven and probable gold and copper mineral reserves for each mineral property, including the transfer of amounts allocated to VBPP to proven and probable reserves subject to amortization. We prospectively revise calculations of amortization of property, plant and equipment. The effect of changes in reserve estimates and transfers of VBPP amounts to proven and probable reserves subject to amortization on amortization expense for 2008 was a decrease of $52 million (2007: $31 million increase; 2006: $75 million decrease).
b) Amortization and Accretion
|
| 2008 |
| 2007 |
| 2006 |
| |||
Amortization |
| $ | 990 |
| $ | 1,004 |
| $ | 735 |
|
Accretion (note 22) |
| 43 |
| 50 |
| 39 |
| |||
|
| $ | 1,033 |
| $ | 1,054 |
| $ | 774 |
|
c) Impairment Evaluations
Producing Mines, Capital Projects and Petroleum & Natural Gas Properties
We review and test the carrying amounts of assets when events or changes in circumstances suggest that the carrying amount may not be recoverable. We group assets at the lowest level for which identifiable cash flows are largely independent of the cash flows of other assets and liabilities. For operating mines, capital projects and petroleum and natural gas properties, the individual mine/project/property is included in a single group for impairment testing purposes. If there are indications that impairment may have occurred at a particular mine site/capital project/petroleum and natural gas property, we compare the sum of the undiscounted cash flows expected to be generated from that mine site/capital project/petroleum and natural gas property to its carrying amount, including goodwill. If the sum of undiscounted cash flows is less than the carrying amount, an impairment loss is recognized if the carrying amount of the individual long-lived assets within the group exceeds their fair values.
Long-lived assets subject to potential impairment at mine sites/capital projects/petroleum and natural gas properties include buildings, plant and equipment, and capitalized reserve acquisition and development costs and VBPP. For impairment assessment purposes, the estimated fair value of buildings, plant and equipment is based on a combination of current depreciated replacement cost and current market value. The estimated fair value of capitalized reserve acquisition, development costs and VBPP is determined using an income approach which measures the present value of the related cash flows expected to be derived from the asset.
As at December 31, 2008, we decreased our long-term gold and copper price assumptions, which we determined was, in combination with an overall downturn in the economy, a triggering event to test the long-lived assets at all of our mines/projects/properties for impairment. As a result we identified our Marigold gold mine in North America, our Henty and Kanowna gold mines, and Osborne copper mine in Australia as being potentially impaired. Consequently, we compared the estimated fair value of the individual long-lived assets to their carrying amount and noted impairments of: Marigold $12 million and Osborne $57 million; and no impairments at Kanowna or Henty.
112
Exploration Projects
After acquisition, various factors can affect the recoverability of the capitalized cost of land and mineral rights, particularly the results of exploration drilling. The length of time between the acquisition of land and mineral rights and when we undertake exploration work varies based on the prioritization of our exploration projects and the size of our exploration budget. If we determine that a potential impairment condition may exist, we compare the sum of the undiscounted cash flows expected to be generated from the project to its carrying amount. If the sum of undiscounted cash flows is less than the carrying amount, an impairment charge is recognized if the carrying amount of the individual long-lived assets within the group exceeds their fair value. For projects that do not have reliable cash flow projections, a market approach is applied. We are continuing with our current exploration projects as planned and have not noted any indications of impairment.
d) Capital Commitments
In addition to entering into various operational commitments in the normal course of business, we had commitments of approximately $552 million at December 31, 2008 for construction activities at our capital projects.
e) Insurance
We purchase insurance coverage for certain insurable losses, subject to varying deductibles, at our mineral properties including losses such as property damage and business interruption. We record losses relating to insurable events as they occur. Proceeds receivable from insurance coverage are recorded at such time as receipt is probable and the amount receivable is fixed or determinable.
Insurance Proceeds
|
| 2008 |
| 2007 |
| 2006 |
| |||
Cost of sales |
| $ | 30 |
| $ | 16 |
| $ | — |
|
Other income |
| 2 |
| — |
| — |
| |||
Discontinued operations |
| — |
| 21 |
| 12 |
| |||
|
| $ | 32 |
| $ | 37 |
| $ | 12 |
|
16 · Intangible Assets
|
| 2008 |
| 2007 |
| ||||||||||||||
|
| Gross carrying |
| Accumulated |
| Net carrying |
| Gross carrying |
| Accumulated |
| Net carrying |
| ||||||
For the years ended December 31 |
| amount |
| amortization |
| amount |
| amount |
| amortization |
| amount |
| ||||||
Water rights(1) |
| $ | 48 |
| $ | — |
| $ | 48 |
| $ | 28 |
| $ | — |
| $ | 28 |
|
Technology(2) |
| 17 |
| — |
| 17 |
| 17 |
| — |
| 17 |
| ||||||
Supply contracts(3) |
| 23 |
| 21 |
| 2 |
| 23 |
| 15 |
| 8 |
| ||||||
Royalties(4) |
| — |
| — |
| — |
| 17 |
| 2 |
| 15 |
| ||||||
Supply agreement(5) |
| 8 |
| — |
| 8 |
| — |
| — |
| — |
| ||||||
|
| $ | 96 |
| $ | 21 |
| $ | 75 |
| $ | 85 |
| $ | 17 |
| $ | 68 |
|
Aggregate period amortization expense |
| $ | — |
| $ | 6 |
| $ | — |
| $ | — |
| $ | 7 |
| $ | — |
|
For the years ended December 31 |
| 2009 |
| 2010 |
| 2011 |
| 2012 |
| 2013 |
| |||||
Estimated aggregate amortization expense |
| $ | 3 |
| $ | 1 |
| $ | 1 |
| $ | 1 |
| $ | 1 |
|
(1) | Water rights in South America ($38 million) and Africa ($10 million) are subject to annual impairment testing and will be amortized when used in the future. |
(2) | The amount will be amortized using the units-of-production method over the estimated proven and probable reserves of the Pueblo Viejo mine, with no assumed residual value. |
(3) | Supply contracts are being amortized over the weighted average contract lives of 4–10 years, with no assumed residual value. |
(4) | In 2008, we sold the Mulatos royalty as part of the sale of non-core royalties to Royal Gold (note 3G). The Mulatos royalty had a carrying value of $15 million, net of accumulated amortization of $2 million. |
(5) | The supply agreement with Yokohama Rubber Company to secure a supply of tires will be amortized evenly over the 120-month term of the agreement. |
Accounting Policy for Intangible Assets
Intangible assets acquired as part of an acquisition of a business are recognized separately from goodwill if the asset is separable or arises from contractual or legal rights. Intangible assets are also recognized when acquired individually or with a group of other assets.
Intangible assets are initially recorded at their estimated fair value. Intangible assets with a finite life are amortized over their useful economic lives on a straight line or units-of-production basis, as appropriate. Intangible assets having indefinite lives and intangible assets that are not yet ready for use are not amortized and are reviewed annually for impairment.
113
17 · Goodwill
|
|
|
| Gold |
|
|
| Copper |
| Other |
|
|
| ||||||||||||
|
| North |
|
|
| South |
|
|
|
|
| South |
| Barrick |
|
|
| ||||||||
|
| America |
| Australia |
| America |
| Africa |
| Australia |
| America |
| Energy |
| Total |
| ||||||||
Opening balance, January 1, 2007 |
| $ | 2,423 |
| $ | 1,811 |
| $ | 441 |
| $ | 373 |
| $ | 64 |
| $ | 743 |
| $ | — |
| $ | 5,855 |
|
Additions(1) |
| — |
| 34 |
| — |
| — |
| — |
| — |
| — |
| 34 |
| ||||||||
Impairments(2) |
| (42 | ) | — |
| — |
| — |
| — |
| — |
| — |
| (42 | ) | ||||||||
Closing balance, December 31, 2007 |
| $ | 2,381 |
| $ | 1,845 |
| $ | 441 |
| $ | 373 |
| $ | 64 |
| $ | 743 |
| $ | — |
| $ | 5,847 |
|
Additions(3) |
| 23 |
| — |
| — |
| — |
| — |
| — |
| 96 |
| 119 |
| ||||||||
Other(4) |
| — |
| — |
| — |
| — |
| — |
| — |
| (8 | ) | (8 | ) | ||||||||
Impairments(5) |
| (8 | ) | (302 | ) | — |
| (216 | ) | (64 | ) | — |
| (88 | ) | (678 | ) | ||||||||
Closing balance, December 31, 2008 |
| $ | 2,396 |
| $ | 1,543 |
| $ | 441 |
| $ | 157 |
| $ | — |
| $ | 743 |
| $ | — |
| $ | 5,280 |
|
(1) | Represents goodwill acquired as a result of the acquisition of an additional 20% interest in Porgera. This goodwill is expected to be deductible for income tax purposes (note 3d). |
(2) | Impairment charges recorded in 2007 related to the Golden Sunlight ($35 million) and Eskay Creek ($7 million) mines, as a result of our annual goodwill impairment test. The goodwill impairment charges are primarily due to the short remaining lives of these mines. |
(3) | Represents goodwill acquired as a result of the acquisitions of an additional 40% interest in Cortez ($20 million), an additional 40% interest in Storm ($3 million) and Barrick Energy ($96 million). See note 3. |
(4) | Represents the impact of foreign exchange rate changes on the translation of Barrick Energy from CAD$to US$. |
(5) | Impairment charges recorded in 2008 related to Kanowna ($272 million), North Mara ($216 million), Barrick Energy ($88 million), Osborne ($64 million), Henty ($30 million) and Marigold ($8 million). |
Accounting Policy for Goodwill and Goodwill Impairment
Under the purchase method, the costs of business acquisitions are allocated to the assets acquired and liabilities assumed based on the estimated fair value at the date of acquisition. The excess of purchase cost over the net fair value of identified tangible and intangible assets and liabilities acquired represents goodwill that is allocated to reporting units. We believe that goodwill arises principally because of the following factors: 1) The going concern value implicit in our ability to sustain and/or grow our business by increasing reserves and resources through new discoveries; 2) The ability to capture unique synergies that can be realized from managing a portfolio of both acquired and existing mines and mineral properties in our regional business units; and 3) the requirement to record a deferred tax liability for the difference between the assigned values and the tax bases of assets acquired and liabilities assumed in a business combination at amounts that do not reflect fair value.
Each individual mineral property that is an operating mine is a reporting unit for goodwill impairment testing purposes. On an annual basis, as at October 1, and at any other time if events or changes in circumstances indicate that the fair value of a reporting unit has been reduced below its carrying amount, we evaluate the carrying amount of goodwill for potential impairment. In 2008, we determined that due to volatile economic conditions it was appropriate to reassess the carrying amount of goodwill for potential impairment as at December 31.
There is no active market for our reporting units. Consequently, when assessing a reporting unit for potential goodwill impairment, we use an income approach (being the net present value of expected future cash flows or net asset value (“NAV”) of the relevant reporting unit) to determine the fair value we could receive for the reporting unit in an arm’s length transaction at the measurement date. Expected future cash flows are based on a probability-weighted approach applied to potential outcomes. Estimates of expected future cash flow reflect estimates of projected future revenues, cash costs of production and capital expenditures contained in our long-term life of mine (“LOM”) plans, which are updated for each reporting unit in the fourth quarter of each fiscal year.
Our LOM plans are based on detailed research, analysis and modeling to optimize the internal rate of return generated from each reporting unit. As such, these plans consider the optimal level of investment, overall production levels and sequence of extraction taking into account all relevant characteristics of the ore body, including waste to ore ratios, ore grades, haul distances, chemical and metallurgical properties impacting process recoveries and capacities of available extraction, haulage and processing equipment. Therefore, the LOM plan is the appropriate basis for forecasting production output in each future year and the related production costs and capital expenditures.
114
Projected future revenues reflect the forecasted future production levels at each of our reporting units as detailed in our LOM plans. Included in these forecasts is the production of mineral resources that do not currently qualify for inclusion in proven and probable ore reserves where there is a high degree of confidence in its economic extraction. This is consistent with the methodology we use to measure value beyond proven and probable reserves when allocating the purchase price of a business combination to acquired mining assets, and is therefore consistent with the provisions of EITF 04-3, Mining Assets: Impairment and Business Combinations.
Projected future revenues also reflect our estimated long-term metals prices, which are determined based on current prices, an analysis of the expected total production costs of the producers and forward pricing curves of the particular metal and forecasts of expected long-term metals prices prepared by analysts. These estimates often differ from current price levels, but our methodology is consistent with how a market participant would assess future long-term metals prices. In 2008, we have used an estimated future gold price of $850 per ounce (2007: $800), and estimated year one and long-term copper prices of $1.50 and $2.00 per pound, respectively (2007: $3.25 year one and $2.00 long-term).
Our estimates of future cash costs of production and capital expenditures are based on the LOM plans for each reporting unit. Costs incurred in currencies other than the US dollar are translated to US dollars using expected long-term exchange rates based on the relevant forward pricing curve. Oil prices are a significant component, both direct and indirect, of our expected cash costs of production. We have used an estimated average oil price of $75 per barrel, which is based on the spot price, forward pricing curve, and long-term oil price forecasts prepared by analysts.
The discount rate applied to present value the net future cash flows is based upon our real weighted average cost of capital with an appropriate adjustment for the remaining life of a mine and risks associated with the relevant cash flows based on the geographic location of the reporting unit. These risk adjustments were based on observed historical country risk premiums and the average credit default swap spreads for the period. In 2008, we used the following real discount rates for our gold mines: United States 2.68%–4.03% (2007: 3.97%); Canada 3.29% (2007: 4.54%); Australia 3.66%–4.29% (2007: 4.98%); Argentina 13.74% (2007: 9.18%); Tanzania 8.77%–9.84% (2007: 7.01%); Papua New Guinea 9.84% (2007: 7.86%); and Peru 6.33%–6.96% (2007: 5.4%). For our copper mines, we used the following real discount rates in 2008: Australia 6.95% (2007: 8.64%); and Chile 8.83% (2007: 8.36%). The increase in discount rates compared to the prior year primarily reflects higher equity premiums over the risk-free borrowing rate, and an increase in country risk premiums due to rising credit spreads and increased political risk in certain jurisdictions.
For our gold reporting units, we apply a market multiple to the NAV computed using the present value of future cash flows approach in order to assess their estimated fair value. Gold companies typically trade at a market capitalization that is based on a multiple of their underlying NAV. Consequently, a market participant would generally apply a NAV multiple when estimating the fair value of an operating gold mine. For each reporting unit, the selection of an appropriate NAV multiple to apply considers the change in our total Enterprise value from October 1, 2007 and compares this to companies within each region.
To assess the NAV multiple on comparable companies, we considered the following:
· Target prices per Analyst Reports;
· Trading prices on the date of Analyst Reports; and
· Trading prices on October 1, 2008.
The selected multiple for a particular reporting unit considers its remaining economic life. For reporting units with operating lives of five years or less, we selected multiples on the lower end of the observed multiples range. Reporting units with operating lives of twenty years or greater were given multiples on the higher end of the observed multiples. In 2008, we have used the following multiples in our assessment of the fair value of our gold reporting units: North America 1.0–2.1 (2007: 1.0–2.0); Australia 1.0–1.6 (2007: 1.5–2.1); South America 1.0–1.4 (2007: 1.2–1.7); and Africa 1.0–1.6 (2007: 1.3–2.0).
115
We determined the fair value of our Barrick Energy reporting unit based on observed trading multiples relating to boe production per day and proven and probable reserves of boe.
In 2008, we recorded a goodwill impairment charge of $30 million at our Henty gold mine in Australia, primarily as a result of its short remaining mine life. We recorded a $64 million goodwill impairment at our Osborne copper mine in Australia due to a decline in our price assumption, which resulted in a reduction in estimated production levels and remaining mine life. We recorded a goodwill impairment of $272 million at our Kanowna gold mine in Australia and $216 million at our North Mara gold mine in Africa, primarily due to the overall decline in trading multiples of gold mining companies and higher discount factors; and $8 million at our Marigold mine in North America, primarily due to an increase in costs. We also recorded a goodwill impairment charge of $88 million for Barrick Energy due to the significant decline in oil prices since its acquisition date.
18 · Other Assets
At December 31 |
| 2008 |
| 2007 |
| ||
Non-current ore in stockpiles (note 13) |
| $ | 688 |
| $ | 499 |
|
Derivative assets (note 20c) |
| 15 |
| 220 |
| ||
Goods and services taxes recoverable |
| 117 |
| 54 |
| ||
Debt issue costs |
| 29 |
| 27 |
| ||
Deferred share-based compensation (note 27b) |
| 84 |
| 75 |
| ||
Notes receivable |
| 96 |
| 97 |
| ||
Deposits receivable |
| 45 |
| 147 |
| ||
Other |
| 59 |
| 84 |
| ||
|
| $ | 1,133 |
| $ | 1,203 |
|
Debt Issue Costs
In 2008, an addition of $11 million of debt issue costs arose on the issuance of $1,250 million in debentures. In 2007, no new debt financings were put into place and there were no additions to debt issue costs.
Amortization of debt issue costs is calculated using the interest method over the term of each debt obligation, and classified as a component of interest cost (see note 20b).
19 · Other Current Liabilities
At December 31 |
| 2008 |
| 2007 |
| ||
Asset retirement obligations (note 22) |
| $ | 93 |
| $ | 74 |
|
Derivative liabilities (note 20c) |
| 440 |
| 100 |
| ||
Post-retirement benefits (note 28) |
| 10 |
| 11 |
| ||
Deferred revenue |
| 15 |
| 23 |
| ||
Income taxes payable (note 9) |
| 48 |
| 38 |
| ||
Other |
| 62 |
| 9 |
| ||
|
| $ | 668 |
| $ | 255 |
|
20 · Financial Instruments
Financial instruments include cash; evidence of ownership in an entity; or a contract that imposes an obligation on one party and conveys a right to a second entity to deliver/receive cash or another financial instrument. Information on certain types of financial instruments is included elsewhere in these financial statements as follows: accounts receivable – note 14; investments – note 12; restricted share units – note 27b.
a) Cash and Equivalents
Cash and equivalents include cash, term deposits, treasury bills and money markets with original maturities of less than 90 days.
At December 31 |
| 2008 |
| 2007 |
| ||
Cash deposits |
| $ | 426 |
| $ | 1,239 |
|
Term deposits |
| 107 |
| 114 |
| ||
Treasury bills |
| 203 |
| 852 |
| ||
Money market investments |
| 701 |
| 2 |
| ||
|
| $ | 1,437 |
| $ | 2,207 |
|
116
b) Long-Term Debt(1)
|
|
|
|
|
|
|
|
|
|
|
|
|
|
|
|
|
|
|
|
|
|
|
|
|
|
|
|
|
|
|
|
|
|
|
|
|
|
|
|
|
|
|
|
|
| 2008 |
| 2007 |
| 2006 |
| ||||||||||||||||||||||||||||||||||||
|
| At |
| Proceeds |
| Repayments |
| Amortization(2) |
| Assumed |
| At |
| Proceeds |
| Repayments |
| Amortization(2) |
| At |
| Proceeds |
| Repayments |
| Amortization(2) |
| Assumed |
| ||||||||||||||
Fixed rate notes |
| $ | 1,250 |
| $ | 1,250 |
| $ | — |
| $ | — |
| $ | — |
| $ | — |
| $ | — |
| $ | — |
| $ | — |
| $ | — |
| $ | — |
| $ | — |
| $ | — |
| $ | — |
|
5.80%/4.875% notes |
| 747 |
| — |
| — |
| (2 | ) | — |
| 745 |
| — |
| — |
| — |
| 745 |
| — |
| — |
| — |
| — |
| ||||||||||||||
Copper-linked notes |
| 190 |
| — |
| 325 |
| — |
| — |
| 515 |
| — |
| 393 |
| — |
| 908 |
| 995 |
| 87 |
| — |
| — |
| ||||||||||||||
US dollar notes |
| 805 |
| 325 |
| — |
| — |
| — |
| 480 |
| 393 |
| — |
| — |
| 87 |
| 87 |
| — |
| — |
| — |
| ||||||||||||||
Senior convertible debentures |
| 289 |
| — |
| — |
| 4 |
| — |
| 293 |
| — |
| — |
| 3 |
| 296 |
| — |
| — |
| 4 |
| 300 |
| ||||||||||||||
Project financing |
| 115 |
| — |
| 99 |
| — |
| — |
| 214 |
| — |
| 91 |
| — |
| 305 |
| 13 |
| 64 |
| — |
| — |
| ||||||||||||||
Capital leases |
| 70 |
| 6 |
| 21 |
| — |
| — |
| 85 |
| 15 |
| 24 |
| — |
| 94 |
| 7 |
| 16 |
| — |
| 6 |
| ||||||||||||||
Other debt obligations(3) |
| 977 |
| 152 |
| 150 |
| 5 |
| 57 |
| 923 |
|
|
| 101 |
| — |
| 1,024 |
| 50 |
| — |
| 6 |
| 867 |
| ||||||||||||||
7.50% debentures(4) |
| — |
| — |
| — |
| — |
| — |
| — |
| — |
| 500 |
| — |
| 498 |
| — |
| — |
| — |
| — |
| ||||||||||||||
Series B Preferred Securities |
| — |
| — |
| — |
| — |
| — |
| — |
| — |
| — |
| — |
| — |
| — |
| 77 |
| 2 |
| 79 |
| ||||||||||||||
First credit facility(5) |
| — |
| 990 |
| 990 |
| — |
| — |
| — |
| — |
| — |
| — |
| — |
| 1,000 |
| 1,000 |
| — |
| — |
| ||||||||||||||
|
| 4,443 |
| 2,723 |
| 1,585 |
| 7 |
| 57 |
| 3,255 |
| 408 |
| 1,109 |
| 3 |
| 3,957 |
| 2,152 |
| 1,244 |
| 12 |
| 1,252 |
| ||||||||||||||
Less: current portion |
| (93 | ) | — |
| — |
| — |
| — |
| (102 | ) | — |
| — |
| — |
| (713 | ) | — |
| — |
| — |
| — |
| ||||||||||||||
|
| $ | 4,350 |
| $ | 2,723 |
| $ | 1,585 |
| $ | 7 |
| $ | 57 |
| $ | 3,153 |
| $ | 408 |
| $ | 1,109 |
| $ | 3 |
| $ | 3,244 |
| $ | 2,152 |
| $ | 1,244 |
| $ | 12 |
| $ | 1,252 |
|
Short-term debt |
|
|
|
|
|
|
|
|
|
|
|
|
|
|
|
|
|
|
|
|
|
|
|
|
|
|
|
|
| ||||||||||||||
Demand financing facility |
| 113 |
| — |
| 18 |
| — |
| — |
| 131 |
| — |
| 19 |
| — |
| 150 |
| — |
| — |
| — |
| 150 |
| ||||||||||||||
Second credit facility(6) |
| — |
| — |
| — |
| — |
| — |
| — |
| — |
| — |
| — |
| — |
| 37 |
| 337 |
| — |
| 300 |
| ||||||||||||||
|
| $ | 113 |
| $ | — |
| $ | 18 |
| $ | — |
| $ | — |
| $ | 131 |
| $ | — |
| $ | 19 |
| $ | — |
| $ | 150 |
| $ | 37 |
| $ | 337 |
| $ | — |
| $ | 450 |
|
(1) | The agreements which govern our long-term debt each contain various provisions which are not summarized herein. In certain cases, these provisions allow Barrick to, at its option, redeem indebtedness prior to maturity at specified prices and also may permit redemption of debt by Barrick upon the occurrence of certain specified changes in tax legislation. |
(2) | Amortization of debt discount/premium. |
(3) | The obligations have an aggregate principal amount of $977 million, of which $163 million is subject to floating interest rates and $814 million is subject to fixed interest rates ranging from 4.75% to 8.05%. The obligations mature at various times between 2009 and 2035. |
(4) | During second quarter 2007, we repaid the $500 million 7.5% debentures from existing cash balances and proceeds from the sale of investments. |
(5) | We have a credit and guarantee agreement with a group of banks (the “Lenders”), which requires the Lenders to make available to us a credit facility of up to $1.5 billion or the equivalent amount in Canadian currency. The credit facility, which is unsecured, has an interest rate of Libor plus 0.25% to 0.35% on drawn down amounts, and a commitment rate of 0.07% to 0.08% on undrawn amounts. We increased the limit of this facility from $1 billion in August 2006. $200 million matures in 2012 and the remaining $1.3 billion matures in 2013. |
(6) | During third quarter 2006, we terminated a second credit facility which consisted of unused bank lines of credit of $850 million with an international consortium of banks. |
117
Fixed Rate Notes
In September, 2008, we issued an aggregate of $1,250 million of notes through our wholly-owned indirect subsidiaries Barrick North America Finance LLC and Barrick Gold Financeco LLC (collectively the “LLCs”) consisting of $500 million of 5-year notes with a coupon rate of 6.125%, $500 million of 10-year notes with a coupon rate of 6.8%, and $250 million of 30-year notes with a coupon rate of 7.5% (collectively the “Notes”). The LLCs used the proceeds to provide loans to us. We provide sufficient funds to the LLCs to meet the principal and interest obligations on the notes. We also provided an unconditional and irrevocable guarantee of these payments and will provide an unconditional and irrevocable guarantee for any additional securities issued by these entities where the conditions of issuance require a guarantee to be issued, which will rank equally with our other unsecured and unsubordinated obligations.
We used these proceeds to repay the $990 million we drew down in first quarter 2008, which was used to partially fund our acquisition of the 40% interest in Cortez. The amounts were drawn down using our existing $1.5 billion credit facility.
Copper-Linked Notes/US Dollar Notes
In October 2006, we issued $1,000 million of Copper-Linked Notes. During the first three years, the full $1,000 million obligation of these notes is to be repaid through the delivery of (the US dollar equivalent of) 324 million pounds of copper. At December 31, 2008, 53 million pounds of copper remained to be delivered. Coincident with the repayment of (the US dollar equivalent of) 324 million pounds of copper, we will reborrow $1,000 million. Over the next year, the total amount outstanding under these notes will continue to be $1,000 million, with a portion repayable in a copper-linked equivalent and a portion repayable in a fixed amount of US dollars at the maturity of the notes (2016 and 2036). As the copper-linked equivalent is repaid, the fixed US dollar obligation will increase. After 2009, only the fixed US dollar obligation will remain. The accounting principles applicable to these Copper-Linked Notes require separate accounting for the future delivery of copper (a fixed-price forward sales contract that meets the definition of a derivative that must be separately accounted for) and for the underlying bond (see note 20c). $400 million of US dollar notes with a coupon of 5.75% mature in 2016 and $600 million of US dollar notes with a coupon of 6.35% mature in 2036.
Senior Convertible Debentures
The convertible senior debentures (the “Securities”) mature in 2023 and had an aggregate principal amount of $289 million outstanding as at the end of 2008. Holders of the Securities may, upon the occurrence of certain circumstances and within specified time periods, convert their Securities into common shares of Barrick. These circumstances are: if the closing price of our common shares exceeds 120% of the conversion price for at least 20 trading days in the 30 consecutive trading days ending on the last trading day of the immediately preceding fiscal quarter; if certain credit ratings assigned to the Securities fall below specified levels or if the Securities cease to be rated by specified rating agencies or such ratings are suspended or withdrawn; if for each of five consecutive trading days, the trading price per $1,000 principal amount of the Securities was less than 98% of the product of the closing price of our common shares and the then current conversion rate; if the Securities have been called for redemption provided that only such Securities called for redemption may be converted and upon the occurrence of specified corporate transactions. On December 31, 2008, the conversion rate per each $1,000 principal amount of Securities was 40.3766 common shares and the effective conversion price was $24.77 per common share. The conversion rate is subject to adjustment in certain circumstances. As such, the effective conversion price may also change.
The Securities were convertible from October 1, 2007 through December 31, 2008. During the period January 1, 2008 to December 31, 2008, $29 thousand principal amount of Securities was converted for 1,156 common shares of Barrick. If all the Securities had been converted and settlement occurred on December 31, 2008, we would have issued approximately 9.3 million common shares with an aggregate fair value of approximately $341.5 million based on our closing share price on December 31, 2008. The Securities are also convertible from January 1, 2009 through March 31, 2009.
We may redeem the Securities at any time on or after October 20, 2010 and prior to maturity, in whole or in part, at a prescribed redemption price that varies depending upon the date of redemption from 100.825% to 100% of the principal amount, plus accrued and unpaid interest. The maximum amount we could be required to pay to redeem the securities is $232 million plus accrued interest. Holders of the Securities can require the repurchase of the Securities for 100% of their principal amount, plus accrued and unpaid interest, on October 15, 2013 and October 15, 2018.
118
In addition, if specified designated events occur prior to maturity of the Securities, we will be required to offer to purchase all outstanding Securities at a repurchase price equal to 100% of the principal amount, plus accrued and unpaid interest. For accounting purposes the Securities are classified as a “conventional convertible debenture” and the conversion feature has not been bifurcated from the host instrument.
Project Financing
One of our wholly-owned subsidiaries, Minera Argentina Gold S.A. in Argentina, had a limited recourse amortizing loan of $115 million outstanding at December 31, 2008, the majority of which has a variable interest rate. We have guaranteed the loan until completion occurs, after which it will become non-recourse to the parent company. As at December 31, 2008, completion as defined in the loan agreement has not occurred. The loan is insured for political risks by branches of the Canadian and German governments.
Series B Preferred Securities
On December 18, 2006, we redeemed all of the outstanding 8.5% Series B Preferred Securities due December 31, 2045 for total cash of $80 million. The redemption price was comprised of the outstanding principal amount of $77 million plus accrued and unpaid interest to December 17, 2006 of $3 million.
Demand Financing Facility
We have a demand financing facility that permits borrowings of up to $150 million. The terms of the facility require us to maintain cash on deposit with the lender as a compensating balance equal to the amount outstanding under the facility, which is restricted as to use. The net effective interest rate is 0.4% per annum. At December 31, 2008, $113 million had been drawn on the facility and an equal amount had been placed on deposit that is included in restricted cash within other current assets (see note 14).
|
| For the years ended December 31 |
| |||||||||||||
|
| 2008 |
| 2007 |
| 2006 |
| |||||||||
Interest |
| Interest |
| Effective |
| Interest |
| Effective |
| Interest |
| Effective |
| |||
Fixed rate debentures |
| $ | 26 |
| 7.0 | % | $ | — |
| — |
| $ | — |
| — |
|
5.80%/4.875% notes |
| 42 |
| 5.7 | % | 41 |
| 5.6 | % | 41 |
| 5.5 | % | |||
Copper-linked notes/US dollar notes |
| 62 |
| 6.2 | % | 63 |
| 6.2 | % | 13 |
| 5.8 | % | |||
Senior convertible debentures |
| 4 |
| 1.5 | % | 2 |
| 0.8 | % | 6 |
| 2.0 | % | |||
Project financing |
| 19 |
| 11.0 | % | 26 |
| 9.1 | % | 31 |
| 8.8 | % | |||
Capital leases |
| 4 |
| 5.0 | % | 6 |
| 7.7 | % | 6 |
| 6.7 | % | |||
Other debt obligations |
| 50 |
| 5.3 | % | 60 |
| 6.1 | % | 53 |
| 5.4 | % | |||
7.50% debentures |
| — |
| — |
| 16 |
| 9.9 | % | 49 |
| 9.8 | % | |||
Series B Preferred Securities |
| — |
| — |
| — |
| — |
| 3 |
| 4.4 | % | |||
First credit facility |
| 17 |
| 3.3 | % | 1 |
| — |
| 29 |
| 7.4 | % | |||
Demand financing facility |
| 11 |
| 8.9 | % | 13 |
| 8.9 | % | 12 |
| 8.8 | % | |||
Second credit facility |
| — |
| — |
| — |
| — |
| 6 |
| 5.0 | % | |||
Other interest |
| 8 |
|
|
| 9 |
|
|
| 2 |
|
|
| |||
|
| 243 |
|
|
| 237 |
|
|
| 251 |
|
|
| |||
Less: interest allocated to discontinued operations |
| — |
|
|
| — |
|
|
| (23 | ) |
|
| |||
Less: interest capitalized |
| (222 | ) |
|
| (124 | ) |
|
| (102 | ) |
|
| |||
|
| $ | 21 |
|
|
| $ | 113 |
|
|
| $ | 126 |
|
|
|
Cash interest paid |
| $ | 213 |
|
|
| $ | 236 |
|
|
| $ | 211 |
|
|
|
Amortization of debt issue costs |
| 7 |
|
|
| 9 |
|
|
| 12 |
|
|
| |||
Amortization of premium |
| (7 | ) |
|
| (3 | ) |
|
| (12 | ) |
|
| |||
Losses on interest rate hedges |
| 1 |
|
|
| 4 |
|
|
| 12 |
|
|
| |||
Increase (decrease) in interest accruals |
| 29 |
|
|
| (9 | ) |
|
| 28 |
|
|
| |||
Interest cost |
| $ | 243 |
|
|
| $ | 237 |
|
|
| $ | 251 |
|
|
|
(1) | The effective rate includes the stated interest rate under the debt agreement, amortization of debt issue costs and debt discount/premium and the impact of interest rate contracts designated in a hedging relationship with long-term debt. |
119
Scheduled Debt Repayments
|
| 2009 |
| 2010 |
| 2011 |
| 2012 |
| 2013 and |
| |||||
Fixed rate debentures |
| $ | — |
| $ | — |
| $ | — |
| $ | — |
| $ | 1,250 |
|
5.80%/4.875% notes |
| — |
| — |
| — |
| — |
| 750 |
| |||||
Project financing |
| 52 |
| 30 |
| 10 |
| 23 |
| — |
| |||||
US dollar notes |
| — |
| — |
| — |
| — |
| 1,000 |
| |||||
Other debt obligations |
| 16 |
| — |
| — |
| 107 |
| 794 |
| |||||
Senior convertible debentures |
| — |
| — |
| — |
| — |
| 230 |
| |||||
|
| $ | 68 |
| $ | 30 |
| $ | 10 |
| $ | 130 |
| $ | 4,024 |
|
Minimum annual payments under capital leases |
| $ | 25 |
| $ | 21 |
| $ | 9 |
| $ | 4 |
| $ | 5 |
|
c) Use of Derivative Instruments (“Derivatives”) in Risk Management
In the normal course of business, our assets, liabilities and forecasted transactions are impacted by various market risks including, but not limited to:
Item |
| Impacted by | |||
· | Sales |
| · | Prices of gold and copper | |
· | Cost of sales |
|
|
| |
| · | Consumption of diesel fuel, propane and natural gas |
| · | Prices of diesel fuel, propane and natural gas |
| · | Non-US dollar expenditures |
| · | Currency exchange rates – US dollar versus A$, ARS, C$, CLP, JPY, PGK, TZS and ZAR |
| · | By-product credits |
| · | Prices of silver and copper |
· | Corporate administration, exploration and business development costs |
| · | Currency exchange rates – US dollar versus A$, ARS, C$, CLP, JPY, PGK, TZS and ZAR | |
· | Capital expenditures |
|
|
| |
| · | Non-US dollar capital expenditures |
| · | Currency exchange rates – US dollar versus A$, ARS, C$, CLP, EUR and PGK |
| · | Consumption of steel |
| · | Price of steel |
· | Interest earned on cash |
| · | US dollar interest rates | |
· | Fair value of fixed-rate debt |
| · | US dollar interest rates | |
Under our risk management policy, we seek to mitigate the impact of these risks to provide certainty for a portion of our revenues and to control costs and enable us to plan our business with greater certainty. The timeframe and manner in which we manage these risks varies for each item based upon our assessment of the risk and available alternatives for mitigating risk. For these particular risks, we believe that derivatives are an appropriate way of managing the risk.
The primary objective of the hedging elements of our derivative instrument positions is that changes in the values of hedged items are offset by changes in the values of derivatives. Many of the derivatives we use meet the FAS 133 hedge effectiveness criteria and are designated in a hedge accounting relationship. Some of the derivative instruments are effective in achieving our risk management objectives, but they do not meet the strict FAS 133 hedge effectiveness criteria, and they are classified as “economic hedges”. The change in fair value of these economic hedges is recorded in current period earnings, classified with the income statement line item that is consistent with the derivative instruments’ intended risk objective.
120
Summary of Derivatives at December 31, 2008(1)
|
| Notional amount by term to maturity |
| Accounting |
|
|
| ||||||||||||||||||
|
| Within |
| 2 to 3 |
| 4 to 5 |
| Total |
| Cash flow |
| Fair value |
| Non- |
| Fair value |
| ||||||||
US dollar interest rate contracts |
|
|
|
|
|
|
|
|
|
|
|
|
|
|
|
|
| ||||||||
Net pay-fixed swap positions (millions) |
| $ | — |
| $ | (75 | ) | $ | — |
| $ | (75 | ) | $ | — |
| $ | — |
| $ | (75 | ) | $ | (8 | ) |
Currency contracts |
|
|
|
|
|
|
|
|
|
|
|
|
|
|
|
|
| ||||||||
C$:US$ contracts (C$millions) |
| 259 |
| 17 |
| — |
| 276 |
| 286 |
| — |
| (10 | ) | $ | (31 | ) | |||||||
A$:US$ contracts (A$millions) |
| 1,558 |
| 2,456 |
| 713 |
| 4,727 |
| 4,709 |
| — |
| 18 |
| $ | (464 | ) | |||||||
CLP:US$ contracts (CLP billions) |
| 52,023 |
| — |
| — |
| 52,023 |
| 52,023 |
| — |
| — |
| $ | (7 | ) | |||||||
JPY:US$ contracts (JPY millions) |
| 900 |
| — |
| — |
| 900 |
| 900 |
| — |
| — |
| $ | 1 |
| |||||||
ZAR:US$ contracts (ZAR millions) |
| — |
| — |
| — |
| — |
| — |
| — |
| — |
| $ | 1 |
| |||||||
PGK:US$ contracts (PGK millions) |
| 45 |
| — |
| — |
| 45 |
| — |
| — |
| 45 |
| $ | (1 | ) | |||||||
Commodity contracts |
|
|
|
|
|
|
|
|
|
|
|
|
|
|
|
|
| ||||||||
Copper call option spread contracts (millions of pounds) |
| 53 |
| — |
| — |
| 53 |
| — |
| — |
| 53 |
|
|
| ||||||||
$ | — |
| |||||||||||||||||||||||
Copper sold forward contracts (millions of pounds) |
| 74 |
| — |
| — |
| 74 |
| 74 |
| — |
| — |
| $ | 123 |
| |||||||
Copper collar sell contracts (millions of pounds) |
| 327 |
| — |
| — |
| 327 |
| 129 |
| — |
| 198 |
| $ | 585 |
| |||||||
Copper collar buy contracts (millions of pounds) |
| (198 | ) | — |
| — |
| (198 | ) | — |
| — |
| (198 | ) | $ | (54 | ) | |||||||
Diesel contracts (thousands of barrels)(2) |
| 2,104 |
| 1,940 |
| 1,030 |
| 5,074 |
| 4,876 |
| — |
| 198 |
| $ | (147 | ) | |||||||
Propane contracts (thousands of gallons) |
| 30,000 |
| — |
| — |
| 30,000 |
| 30,000 |
| — |
| — |
| $ | (38 | ) | |||||||
Steel contracts (metric tonnes) |
| 3,000 |
| — |
| — |
| 3,000 |
| — |
| — |
| 3,000 |
| $ | (3 | ) | |||||||
(1) | Excludes gold and silver sales contracts (see notes 5 and 6); refer to note 21 for further information on fair value measurements. |
(2) | Diesel commodity contracts represent a combination of WTI, WTB, MOPS and JET hedge contracts and diesel price contracts based on the price of WTI, WTB, MOPS, and JET, respectively, plus a spread. WTI represents West Texas Intermediate, WTB represents Waterborne, MOPS represents Mean of Platts Singapore, JET represents Jet Fuel. |
Fair Values of Derivative Instruments at December 31
|
| Asset Derivatives |
| Liability Derivatives |
| ||||
At December 31 |
| 2008 |
| 2007 |
| 2008 |
| 2007 |
|
Derivatives classified as hedging instruments for accounting purposes |
|
|
|
|
|
|
|
|
|
Currency contracts |
| 22 |
| 302 |
| (526 | ) | (43 | ) |
Commodity contracts |
| 402 |
| 144 |
| (205 | ) | (31 | ) |
Total derivatives classified as hedging instruments for accounting purposes |
| 424 |
| 446 |
| (731 | ) | (74 | ) |
Derivatives not classified as hedging instruments for accounting purposes |
| — |
| — |
|
|
|
|
|
US dollar interest rate contracts |
|
|
|
|
| (8 | ) | (10 | ) |
Currency contracts |
| 4 |
| 13 |
| (1 | ) | (30 | ) |
Commodity contracts |
| 404 |
| 95 |
| (135 | ) | (51 | ) |
Total derivatives not classified as hedging instruments for accounting purposes |
| 408 |
| 108 |
| (144 | ) | (91 | ) |
Total derivatives |
| 832 |
| 554 |
| (875 | ) | (165 | ) |
121
US Dollar Interest Rate Contracts
Cash Flow Hedges
During the third quarter of 2008, we added $500 million of pay-fixed interest rate swaps that were designated as hedges against the movement of interest rates for an anticipated fixed-rate debt issuance. We issued the debt in September and subsequently closed out the swaps at a cost of $18 million. This hedge loss remains as a component of OCI and will be amortized as a component of interest expense over the 10-year term of the debt.
Non-hedge Contracts
We have a net US dollar pay-fixed interest rate swap position outstanding that was used to economically hedge the US dollar interest rate risk implicit in a prior gold lease rate swap position. Changes in the fair value of these interest rate swaps are recognized in current period earnings through interest expense.
Currency Contracts
Cash Flow Hedges
Currency contracts have been designated against forecasted non-US dollar denominated expenditures as a hedge of the variability of the US dollar amount of those expenditures caused by changes in currency exchange rates over the next four years. Hedged items are identified as the first stated quantity of dollars of forecasted expenditures in a future month. For C$286 million, A$4,653 million and CLP52,023 million portions of the contracts, we have concluded that the hedges are 100% effective under FAS 133 because the critical terms (including notional amount and maturity date) of the hedged items and currency contracts are the same. For the remaining A$56 million prospective and retrospective hedge effectiveness is assessed using the hypothetical derivative method under FAS 133. The retrospective test involves comparing the effect of historic changes in exchange rates each period on the fair value of both the actual and hypothetical derivative using a dollar offset approach. The effective portion of changes in fair value of the currency contracts is recorded in OCI until the forecasted expenditure impacts earnings; for expenditures capitalized to the cost of inventory, this is upon sale of inventory, and for capital expenditures, this is when amortization of the capital assets is recorded in earnings. The prospective test involves comparing the effect of a theoretical shift in forward exchange rates on the fair value of both the actual and hypothetical derivative. Where applicable, the fair value of derivatives has been evaluated to account for counterparty credit risk.
Non-hedge Contracts
Non-hedge currency contracts are used to mitigate the variability of the US dollar amount of non-US dollar denominated exposures that do not meet the criterion in FAS 133. Changes in the fair value of non-hedge currency contracts are recorded in current period cost of sales, corporate administration, other income, other expense or income tax expense according to the intention of the hedging instrument.
Commodity Contracts
Cash Flow Hedges
Diesel Fuel/Propane
Commodity contracts have been designated against forecasted purchases of the commodities for expected consumption at our mining operations. The contracts act as a hedge of the impact of variability in market prices on the cost of future commodity purchases over the next five years. Hedged items are identified as the first stated quantity in thousands of barrels of forecasted purchases in a future month. Prospective and retrospective hedge effectiveness is assessed using the hypothetical derivative method under FAS 133. The prospective test is based on regression analysis of the month-on-month change in fair value of both the actual derivative and a hypothetical derivative caused by actual historic changes in commodity prices over the last three years. The retrospective test involves comparing the effect of historic changes in commodity prices each period on the fair value of both the actual and hypothetical derivative using a dollar offset approach. The effective portion of changes in fair value of the commodity contracts is recorded in OCI until the forecasted transaction impacts earnings. The cost of commodity consumption is capitalized to the cost of inventory, and therefore this is upon the sale of inventory. Where applicable, the fair value of derivatives has been evaluated to account for counterparty credit risk.
Non-hedge Contracts
Non-hedge fuel contracts are used to mitigate the risk of price changes on fuel consumption at various sites. On completion of regression analysis, we concluded that contracts totaling 198 thousand barrels of fuel do not meet the “highly effective” criterion in FAS 133 due to currency and basis differences between derivative contract prices and the prices charged to the sites by oil suppliers. Although not qualifying as an accounting hedge, the contracts protect the Company to a significant extent from the effects of changes in fuel prices. Changes in the fair value of non-hedge fuel contracts are recorded in current period cost of sales.
122
Cash Flow Hedges
Copper
The copper-linked notes contain an embedded fixed-price forward copper sales contract that meets the definition of a derivative and must be separately accounted for. At December 31, 2008, 53 million pounds of embedded fixed-price forward copper sales contracts were outstanding at a price of $3.08/lb. The resulting copper derivative has been designated against future copper cathode at the Zaldívar mine as a cash flow hedge of the variability in market prices of those future sales.
In addition to the embedded fixed-price forward copper sales contracts outstanding, there are 21 million pounds of copper forwards outstanding at an average price of $3.05/lb hedging future sales at Zaldívar.
Copper collar contracts totaling 129 million pounds have also been designated as hedges against copper cathode sales at our Zaldívar mine. The contracts contain purchased put and sold call options with average strike prices of $3.00/lb and $3.80/lb respectively.
Hedged items are identified as the first stated quantity of pounds of forecasted sales in a future month. Prospective hedge effectiveness is assessed on these hedges using a dollar offset method. The dollar offset assessment involves comparing the effect of theoretical shifts in forward copper prices on the fair value of both the actual hedging derivative and a hypothetical hedging derivative. The retrospective assessment involves comparing the effect of historic changes in copper prices each period on the fair value of both the actual and hypothetical derivative using a dollar offset approach. The effective portion of changes in fair value of the copper contracts is recorded in OCI until the forecasted copper sale impacts earnings. Where applicable, the fair value of derivatives has been evaluated to account for counterparty credit risk.
Non-hedge Contracts
We have purchased and sold call options on copper that, when combined with the aforementioned embedded fixed-price forward copper sales contracts, economically lock in copper sales prices between $3.08/lb and $3.58/lb. At December 31, 2008, the notional amount of these options outstanding was 53 million pounds.
During 2008 we de-designated collar sell contracts for 153 million pounds and crystallized $213 million of gains in OCI, of which $192 million remains at year-end. These hedges were originally designated against future copper production at our Zaldívar and Osborne mines. The exposure is still expected to occur and therefore amounts crystallized in OCI will be recorded in copper revenue when the originally designated sales occur. We continue to hold these collar contracts as non-hedge contracts. When combined with existing non-hedge collar sell contracts, 198 million pounds of collar sell contracts were outstanding at December 31, 2008. The contracts contain purchased put and sold call options with an average strike of $3.09/lb and $3.88/lb, respectively.
During 2008 we entered into collar buy contracts for 198 million pounds to economically lock in the gains on the de-designated and existing non-hedge contracts. The contracts contain sold put and purchased call options with average strike prices of $1.57/lb and $2.01/lb, respectively.
These contracts do not meet the “highly effective” criterion for hedge accounting under FAS 133. Changes in the fair value of these copper options are recorded in current period revenue.
123
Non-hedge Gains (Losses)
For the years ended December 31 |
| 2008 |
| 2007 |
| 2006 |
| Income statement classification | |||
Commodity contracts |
|
|
|
|
|
|
|
| |||
Copper |
| $ | 67 |
| $ | 48 |
| $ | (14 | ) | Revenue |
Gold |
| 19 |
| (8 | ) | 7 |
| Revenue | |||
Silver |
| — |
| — |
| (5 | ) | Cost of sales | |||
Fuel |
| (30 | ) | 7 |
| 1 |
| Cost of sales | |||
Steel |
| (3 | ) | — |
| — |
| Project expense | |||
Currency contracts |
| (8 | ) | (7 | ) | — |
| Cost of sales/corporate administration/ other income/expense/ income tax expense | |||
Interest rate contracts |
| (4 | ) | (2 | ) | 8 |
| Interest income/expense | |||
Share purchase warrants |
| — |
| (1 | ) | — |
| Other income/expense | |||
|
| 41 |
| 37 |
| (3 | ) |
| |||
Hedge ineffectiveness |
| — |
| 4 |
| 3 |
| Various | |||
|
| $ | 41 |
| $ | 41 |
| $ | — |
|
|
Derivative Assets and Liabilities
|
| 2008 |
| 2007 |
| ||
At January 1 |
| $ | 389 |
| $ | 178 |
|
Derivatives cash (inflow) outflow |
|
|
|
|
| ||
Operating activities |
| (147 | ) | (309 | ) | ||
Investing activities |
|
|
| 23 |
| ||
Financing activities |
| 23 |
| 197 |
| ||
Change in fair value of: |
|
|
|
|
| ||
Non-hedge derivatives |
| (1 | ) | 33 |
| ||
Cash flow hedges |
|
|
|
|
| ||
Effective portion |
| (301 | ) | 257 |
| ||
Ineffective portion |
| (6 | ) | 9 |
| ||
Share purchase warrants |
| — |
| (1 | ) | ||
Fair value hedges |
| — |
| 2 |
| ||
At December 31 |
| $ | (43 | ) | $ | 389 |
|
Classification: |
|
|
|
|
| ||
Other current assets |
| $ | 817 |
| $ | 334 |
|
Other assets |
| 15 |
| 220 |
| ||
Other current liabilities |
| (440 | ) | (100 | ) | ||
Other long-term obligations |
| (435 | ) | (65 | ) | ||
|
| $ | (43 | ) | $ | 389 |
|
124
Cash Flow Hedge Gains (Losses) in OCI
|
| Commodity |
| Currency hedges |
| Interest rate hedges |
|
|
| |||||||||||||||||||
|
| Gold/ |
| Copper |
| Fuel |
| Operating |
| Administration |
| Capital |
| Cash |
| Long-term |
| Total |
| |||||||||
At December 31, 2005 |
| $ | — |
| $ | — |
| $ | 38 |
| $ | 102 |
| $ | 30 |
| $ | 39 |
| $ | (2 | ) | $ | (18 | ) | $ | 189 |
|
Effective portion of change in fair value of hedging instruments |
| (148 | ) | 29 |
| (1 | ) | 137 |
| (2 | ) | 4 |
| (2 | ) | — |
| 17 |
| |||||||||
Transfers to earnings: |
|
|
|
|
|
|
|
|
|
|
|
|
|
|
|
|
|
|
| |||||||||
On recording hedged items in earnings |
| 165 |
| 28 |
| (16 | ) | (84 | ) | (14 | ) | (4(1 | ) | 1 |
| 1 |
| 77 |
| |||||||||
At December 31, 2006 |
| $ | 17 |
| $ | 57 |
| $ | 21 |
| $ | 155 |
| $ | 14 |
| $ | 39 |
| $ | (3 | ) | $ | (17 | ) | $ | 283 |
|
Effective portion of change in fair value of hedging instruments |
| — |
| (75 | ) | 87 |
| 249 |
| 32 |
| (35 | ) | — |
| (1 | ) | 257 |
| |||||||||
Transfers to earnings: |
|
|
|
|
|
|
|
|
|
|
|
|
|
|
|
|
|
|
| |||||||||
On recording hedged items in earnings |
| (2 | ) | 32 |
| (29 | ) | (166 | ) | (19 | ) | (5 | (1) | 3 |
| 1 |
| (185 | ) | |||||||||
At December 31, 2007 |
| $ | 15 |
| $ | 14 |
| $ | 79 |
| $ | 238 |
| $ | 27 |
| $ | (1 | ) | $ | — |
| $ | (17 | ) | $ | 355 |
|
Effective portion of change in fair value of hedging instruments |
| — |
| 582 |
| (215 | ) | (610 | ) | (46 | ) | 5 |
| — |
| (17 | ) | (301 | ) | |||||||||
Transfers to earnings: |
|
|
|
|
|
|
|
|
|
|
|
|
|
|
|
|
|
|
| |||||||||
On recording hedged items in earnings |
| (2 | ) | (112 | ) | (33 | ) | (106 | ) | (11 | ) | (4 | ) | — |
| 1 |
| (267 | ) | |||||||||
At December 31, 2008 |
| $ | 13 |
| $ | 484 |
| $ | (169 | ) | $ | (478 | ) | $ | (30 | ) | $ | — |
| $ | — |
| $ | (33 | ) | $ | (213 | ) |
Hedge gains/losses classified within |
| Gold |
| Copper |
| Cost of |
| Cost of |
| Administration |
| Amortization |
| Interest |
| Interest |
|
|
| |||||||||
Portion of hedge gain (loss) expected to affect 2009 earnings(2) |
| $ | 9 |
| $ | 484 |
| $ | (109 | ) | $ | (126 | ) | $ | (23 | ) | $ | 3 |
| $ | — |
| $ | (3 | ) | $ | 235 |
|
(1) | On determining that certain forecasted capital expenditures were no longer likely to occur within two months of the originally specified time frame. |
(2) | Based on the fair value of hedge contracts at December 31, 2008. |
d) Credit Risk
Credit risk is the risk that a third party might fail to fulfill its performance obligations under the terms of a financial instrument. For cash and equivalents and accounts receivable, credit risk represents the carrying amount on the balance sheet, net of any overdraft positions.
For derivatives, when the fair value is positive, this creates credit risk. When the fair value of a derivative is negative, we assume no credit risk. In cases where we have a legally enforceable master netting agreement with a counter-party, credit risk exposure represents the net amount of the positive and negative fair values for similar types of derivatives. For a net negative amount, we regard credit risk as being zero. A net positive amount for a counterparty is a reasonable measure of credit risk when there is a legally enforceable master netting agreement. We mitigate credit risk by:
· | entering into derivatives with high credit-quality counterparties; |
· | limiting the amount of exposure to each counterparty; and |
· | monitoring the financial condition of counterparties. |
Location of credit risk is determined by physical location of the bank branch, customer or counterparty.
125
Credit Quality of Financial Assets
|
| S&P Credit rating |
| |||||||||||||
At December 31, 2008 |
| AA – or |
| A – or |
| BBB or |
| Not |
| Total |
| |||||
Cash and equivalents(1),(2) |
| $ | 231 |
| $ | 1,181 |
| $ | 25 |
| $ | — |
| $ | 1,437 |
|
Derivatives(2) |
| 87 |
| 354 |
| — |
| — |
| 441 |
| |||||
Accounts receivable |
| 22 |
| 6 |
| 38 |
| 131 |
| 197 |
| |||||
|
| $ | 340 |
| $ | 1,541 |
| $ | 63 |
| $ | 131 |
| $ | 2,075 |
|
Number of counterparties |
| 27 |
| 21 |
| 16 |
|
|
|
|
| |||||
Largest counterparty (%) |
| 26 | % | 44 | % | 21 | % |
|
|
|
| |||||
Concentrations of Credit Risk
|
| United |
|
|
| Other |
|
|
| ||||
At December 31, 2008 |
| States |
| Canada |
| International |
| Total |
| ||||
Cash and equivalents(1),(2) |
| $ | 1,190 |
| $ | 86 |
| $ | 161 |
| $ | 1,437 |
|
Derivatives(3) |
| 184 |
| 18 |
| 239 |
| 441 |
| ||||
Accounts receivable |
| 29 |
| 36 |
| 132 |
| 197 |
| ||||
|
| $ | 1,403 |
| $ | 140 |
| $ | 532 |
| $ | 2,075 |
|
(1) Based on where the parent entity of the counterparties we transact with is domiciled.
(2) The amounts presented reflect the outstanding bank balance held with institutions as at December 31, 2008.
(3) The amounts presented reflect the net credit exposure after considering the effect of master netting agreements.
e) Risks Relating to the Use of Derivatives
By using derivatives, in addition to credit risk, we are affected by market risk and market liquidity risk. Market risk is the risk that the fair value of a derivative might be adversely affected by a change in commodity prices, interest rates, gold lease rates, or currency exchange rates, and that this in turn affects our financial condition. We manage market risk by establishing and monitoring parameters that limit the types and degree of market risk that may be undertaken. We mitigate this risk by establishing trading agreements with counterparties under which we are not required to post any collateral or make any margin calls on our derivatives. Our counterparties cannot require settlement solely because of an adverse change in the fair value of a derivative.
Market liquidity risk is the risk that a derivative cannot be eliminated quickly, by either liquidating it or by establishing an offsetting position. Under the terms of our trading agreements, counterparties cannot require us to immediately settle outstanding derivatives, except upon the occurrence of customary events of default such as covenant breaches, including financial covenants, insolvency or bankruptcy. We generally mitigate market liquidity risk by spreading out the maturity of our derivatives over time.
21 · Fair Value Measurements
In 2008, we adopted FAS 157 for financial assets and liabilities that are measured at fair value on a recurring basis. FAS 157 defines fair value, establishes a framework for measuring fair value under US GAAP, and requires expanded disclosures about fair value measurements. The primary assets and liabilities affected were available-for-sale securities and derivative instruments. The adoption of FAS 157 did not change the valuation techniques that we use to value financial assets and financial liabilities. We have elected to present information for derivative instruments on a net basis. Beginning in 2009, we will also apply FAS 157 to non-financial assets and liabilities that we periodically measure at fair value under US GAAP. The principal assets and liabilities that will be affected are: goodwill, tangible and intangible assets measured and recognized at fair value as a result of an impairment assessment; and non-financial assets and non-financial liabilities recognized as a result of a business combination. The application of FAS 157 is not expected to have a significant impact on our methodology for measuring the fair value of these assets and liabilities, but will result in expanded disclosures.
The fair value hierarchy established by FAS 157 establishes three levels to classify the inputs to valuation techniques used to measure fair value. Level 1 inputs are quoted prices (unadjusted) in active markets for identical assets or liabilities. Level 2 inputs are quoted prices in markets that are not active, quoted prices for similar assets or liabilities in active markets, inputs other than quoted prices that are observable for the asset or liability (for example, interest rate and yield curves observable at commonly quoted intervals, forward pricing curves used to value currency and
126
commodity contracts and volatility measurements used to value option contracts), or inputs that are derived principally from or corroborated by observable market data or other means. Level 3 inputs are unobservable (supported by little or no market activity). The fair value hierarchy gives the highest priority to Level 1 inputs and the lowest priority to Level 3 inputs.
FAS 157 defines fair value as the price that would be received to sell an asset or paid to transfer a liability in an orderly transaction between market participants at the measurement date. In assessing the fair value of a particular contract, the market participant would consider the credit risk of the counterparty to the contract. Consequently, when it is appropriate to do so, we adjust our valuation models to incorporate a measure of credit risk.
a) Assets and Liabilities Measured at Fair Value on a Recurring Basis
Fair Value Measurements at December 31, 2008
|
| Quoted prices |
| Significant |
|
|
|
|
| ||||||
|
| in active |
| other |
| Significant |
|
|
| ||||||
|
| markets for |
| observable |
| unobservable |
| Aggregate |
| ||||||
|
| identical assets |
| inputs |
| inputs |
| fair |
| ||||||
|
| (Level 1) |
| (Level 2) |
| (Level 3) |
| value |
| ||||||
Cash equivalents |
| $ | 904 |
| $ | — |
| $ | — |
| $ | 904 |
| ||
Available-for-sale securities |
| 31 |
| — |
| — |
| 31 |
| ||||||
Receivables from provisional copper and gold sales |
| — |
| 50 |
| — |
| 50 |
| ||||||
Derivative instruments |
| — |
| (43 | ) | — |
| (43 | ) | ||||||
|
| $ | 935 |
| $ | 7 |
| $ | — |
| $ | 942 |
| ||
b) Assets Measured at Fair Value on a Recurring Basis Using Significant Unobservable Inputs
Fair Value Measurements Using Significant Unobservable Inputs (Level 3)
|
| Held-to-maturity |
| |
|
| securities |
| |
At January 1, 2008 |
| $ | 46 |
|
Impairment charge(1) |
| (39 | ) | |
Sales(2) |
| (7 | ) | |
At December 31, 2008 |
| $ | — |
|
(1) In the first quarter, we recorded an impairment charge on ABCP of $39 million.
(2) In the second quarter, we reached a settlement agreement with respect to ABCP for proceeds of $49 million.
c) Valuation Techniques
Cash Equivalents
The fair value of our cash equivalents are classified within Level 1 of the fair value hierarchy because they are valued using quoted market prices in active markets. Our cash equivalents are comprised of U.S. Treasury bills and money market securities that are invested primarily in U.S. Treasury bills.
Available-for-Sale Securities
The fair value of available-for-sale securities is determined based on a market approach reflecting the closing price of each particular security at the balance sheet date. The closing price is a quoted market price obtained from the exchange that is the principal active market for the particular security, and therefore available-for-sale securities are classified within Level 1 of the fair value hierarchy established by FAS 157.
Derivative Instruments
The fair value of derivative instruments is determined using either present value techniques or option pricing models that utilize a variety of inputs that are a combination of quoted prices and market-corroborated inputs. Due to the recent instability of the financial markets, counterparty credit risk has had a larger impact on our derivative valuations than in previous periods. The fair value of our derivative contracts is adjusted for credit risk based upon the observed credit default swap spread for each particular counterparty, as appropriate. The fair value of US dollar interest rate and currency swap contracts is determined by discounting contracted cash flows using a discount rate derived from observed LIBOR and swap rate curves for comparable assets and liabilities. In the case of currency contracts, we convert non-US dollar cash flows into US dollars using an exchange rate derived from currency swap curves for comparable assets and liabilities. The fair value of commodity forward contracts is determined by discounting contractual cash flows using a discount rate derived from observed LIBOR and swap rate curves. Contractual cash flows are calculated using a forward pricing
127
curve derived from observed forward prices for each commodity. The fair value of commodity options is determined using option-pricing models that utilize a combination of inputs including quoted market prices and market-corroborated inputs. Derivative instruments are classified within Level 2 of the fair value hierarchy.
Receivables from Provisional Copper and Gold Sales
The fair value of receivables rising from copper and gold sales contracts that contain provisional pricing mechanisms is determined using the appropriate quoted forward price from the exchange that is the principal active market for the particular metal. As such, these receivables are classified within Level 2 of the fair value hierarchy.
d) Fair Value Information
|
| 2008 |
| 2007 |
| ||||||||
|
|
|
| Estimated |
|
|
| Estimated |
| ||||
|
| Carrying |
| fair |
| Carrying |
| fair |
| ||||
At December 31 |
| amount |
| value |
| amount |
| value |
| ||||
Financial assets |
|
|
|
|
|
|
|
|
| ||||
Cash and equivalents(1) |
| $ | 1,437 |
| $ | 1,437 |
| $ | 2,207 |
| $ | 2,207 |
|
Accounts receivable(1) |
| 197 |
| 197 |
| 256 |
| 256 |
| ||||
Available-for-sale securities(2) |
| 31 |
| 31 |
| 96 |
| 96 |
| ||||
Equity-method investments(3) |
| 1,085 |
| 1,085 |
| 1,085 |
| 1,113 |
| ||||
Derivative assets |
| 832 |
| 832 |
| 554 |
| 554 |
| ||||
Held-to-maturity securities(3) |
| — |
| — |
| 46 |
| 46 |
| ||||
|
| $ | 3,582 |
| $ | 3,582 |
| $ | 4,244 |
| $ | 4,272 |
|
Financial liabilities |
|
|
|
|
|
|
|
|
| ||||
Accounts payable(1) |
| $ | 970 |
| $ | 970 |
| $ | 808 |
| $ | 808 |
|
Long-term debt(4) |
| 4,350 |
| 3,507 |
| 3,255 |
| 3,151 |
| ||||
Derivative liabilities |
| 875 |
| 875 |
| 165 |
| 165 |
| ||||
Restricted share units(5) |
| 120 |
| 120 |
| 100 |
| 100 |
| ||||
Deferred share units(5) |
| 5 |
| 5 |
| 4 |
| 4 |
| ||||
|
| $ | 6,320 |
| $ | 5,477 |
| $ | 4,332 |
| $ | 4,228 |
|
(1) Recorded at cost. Fair value approximates the carrying amounts due to the short-term nature and generally negligible credit losses.
(2) Recorded at fair value. Quoted market prices are used to determine fair value.
(3) Includes ABCP.
(4) Long-term debt is generally recorded at cost except for obligations that are designated in a fair-value hedge relationship, which are recorded at fair value in periods when a hedge relationship exists. The fair value of long-term debt is primarily determined using quoted market prices.
(5) Recorded at fair value based on our period-end closing market share price.
22 · Asset Retirement Obligations
Asset Retirement Obligations (AROs) |
| 2008 |
| 2007 |
| ||
At January 1 |
| $ | 966 |
| $ | 893 |
|
AROs acquired during the year |
| 37 |
| — |
| ||
AROs arising in the period |
| 56 |
| 53 |
| ||
Impact of revisions to expected cash flows Recorded in earnings |
| 9 |
| 6 |
| ||
Settlements |
|
|
|
|
| ||
Cash payments |
| (40 | ) | (33 | ) | ||
Settlement gains |
| (5 | ) | (3 | ) | ||
Accretion |
| 43 |
| 50 |
| ||
At December 31 |
| 1,066 |
| 966 |
| ||
Current portion |
| (93 | ) | (74 | ) | ||
|
| $ | 973 |
| $ | 892 |
|
Each period we assess cost estimates and other assumptions used in the valuation of AROs at each of our mineral properties to reflect events, changes in circumstances and new information available. Changes in these cost estimates and assumptions have a corresponding impact on the fair value of the ARO. For closed mines, any change in the fair value of AROs results in a corresponding charge or credit within other expense, whereas at operating mines the charge is recorded as an adjustment to the carrying amount of the corresponding asset. In 2008, charges of $9 million were recorded for changes in cost estimates for AROs at closed mines (2007: $6 million; 2006: $53 million).
At December 31 |
| 2008 |
| 2007 |
| ||
Operating mines |
|
|
|
|
| ||
ARO increase(1) |
| $ | 56 |
| $ | 53 |
|
ARO decrease(2) |
| (7 | ) | — |
| ||
Closed mines |
|
|
|
|
| ||
ARO increase(3) |
| 9 |
| 6 |
| ||
(1) These adjustments were recorded with a corresponding adjustment to property, plant and equipment.
(2) Represents a decrease in AROs at a mine where the corresponding ARO asset had been fully amortized and was therefore recorded as a recovery in other income.
(3) For closed mines, any change in the fair value of AROs results in a corresponding charge or credit to other expense or other income, respectively.
AROs arise from the acquisition, development, construction and normal operation of mining property, plant and equipment, due to government controls and regulations that protect the environment on the closure and reclamation of mining properties. The major parts of the carrying amount of AROs relate to tailings and heap leach pad closure/rehabilitation; demolition of buildings/mine facilities;
128
ongoing water treatment; and ongoing care and maintenance of closed mines. The fair values of AROs are measured by discounting the expected cash flows using a discount factor that reflects the credit-adjusted risk-free rate of interest. We prepare estimates of the timing and amount of expected cash flows when an ARO is incurred. We update expected cash flows to reflect changes in facts and circumstances. The principal factors that can cause expected cash flows to change are: the construction of new processing facilities; changes in the quantities of material in reserves and a corresponding change in the life-of-mine plan; changing ore characteristics that impact required environmental protection measures and related costs; changes in water quality that impact the extent of water treatment required; and changes in laws and regulations governing the protection of the environment. When expected cash flows increase, the revised cash flows are discounted using a current discount factor whereas when expected cash flows decrease the reduced cash flows are discounted using a historic discount factor, and then in both cases any change in the fair value of the ARO is recorded. We record the fair value of an ARO when it is incurred. At producing mines AROs incurred and changes in the fair value of AROs are recorded as an adjustment to the corresponding asset carrying amounts. At closed mines, any adjustment to the fair value of an ARO is charged directly to earnings. AROs are adjusted to reflect the passage of time (accretion) calculated by applying the discount factor implicit in the initial fair-value measurement to the beginning-of-period carrying amount of the AROs. For producing mines, development projects and closed mines, accretion is recorded in amortization and accretion. Upon settlement of an ARO, we record a gain or loss if the actual cost differs from the carrying amount of the ARO. Settlement gains/losses are recorded in Other (income) expense. Other environmental remediation costs that are not AROs as defined by FAS 143 are expensed as incurred (see note 8a).
23 · Other Non-current Liabilities
At December 31 |
| 2008 |
| 2007 |
| ||
Pension benefits (note 28) |
| $ | 113 |
| $ | 87 |
|
Other post-retirement benefits (note 28) |
| 29 |
| 27 |
| ||
Derivative liabilities (note 20c) |
| 435 |
| 65 |
| ||
Restricted share units (note 27) |
| 120 |
| 94 |
| ||
Deferred revenue |
| 8 |
| 88 |
| ||
Other |
| 76 |
| 70 |
| ||
|
| $ | 781 |
| $ | 431 |
|
24 · Deferred Income Taxes
Recognition and Measurement
We record deferred income tax assets and liabilities where temporary differences exist between the carrying amounts of assets and liabilities in our balance sheet and their tax bases. The measurement and recognition of deferred income tax assets and liabilities takes into account: enacted rates that will apply when temporary differences reverse; interpretations of relevant tax legislation; tax planning strategies; estimates of the tax bases of assets and liabilities; and the deductibility of expenditures for income tax purposes. We recognize the effect of changes in our assessment of these estimates and factors when they occur. Changes in deferred income tax assets, liabilities and valuation allowances are allocated between net income, other comprehensive income and goodwill based on the source of the change.
Deferred income taxes have not been provided on the undistributed earnings of foreign subsidiaries, which are considered to be reinvested indefinitely outside Canada. The determination of the unrecorded deferred income tax liability is not considered practicable.
Sources of Deferred Income Tax Assets and Liabilities
At December 31 |
| 2008 |
| 2007 |
| ||
Deferred tax assets |
|
|
|
|
| ||
Tax loss carry forwards |
| $ | 657 |
| $ | 729 |
|
Alternative minimum tax (“AMT”) credits |
| 251 |
| 247 |
| ||
Asset retirement obligations |
| 366 |
| 342 |
| ||
Property, plant and equipment |
| 232 |
| 279 |
| ||
Post-retirement benefit obligations |
| 32 |
| 23 |
| ||
Derivative instruments |
| 90 |
| — |
| ||
Accrued interest payable |
| 70 |
| 45 |
| ||
Other |
| 3 |
| 10 |
| ||
|
| 1,701 |
| 1,675 |
| ||
Valuation allowances |
| (318 | ) | (419 | ) | ||
|
| 1,383 |
| 1,256 |
| ||
Deferred tax liabilities |
|
|
|
|
| ||
Property, plant and equipment |
| (1,102 | ) | (1,145 | ) | ||
Derivative instruments |
| — |
| (122 | ) | ||
Inventory |
| (162 | ) | (98 | ) | ||
Other |
| (4 | ) | (10 | ) | ||
|
| $ | 115 |
| $ | (119 | ) |
Classification: |
|
|
|
|
| ||
Non-current assets |
| $ | 869 |
| $ | 722 |
|
Non-current liabilities |
| (754 | ) | (841 | ) | ||
|
| $ | 115 |
| $ | (119 | ) |
129
Expiry Dates of Tax Losses and AMT Credits
|
|
|
|
|
|
|
|
|
|
|
| No |
|
|
| |||||||
|
|
|
|
|
|
|
|
|
|
|
| expiry |
|
|
| |||||||
|
| 2009 |
| 2010 |
| 2011 |
| 2012 |
| 2013+ |
| date |
| Total |
| |||||||
Tax losses(1) |
|
|
|
|
|
|
|
|
|
|
|
|
|
|
| |||||||
Canada |
| $ | 5 |
| $ | — |
| $ | — |
| $ | — |
| $ | 1,193 |
| $ | — |
| $ | 1,198 |
|
Australia |
| — |
| — |
| — |
| — |
| — |
| 157 |
| 157 |
| |||||||
Barbados |
| — |
| — |
| — |
| — |
| 967 |
| — |
| 967 |
| |||||||
Chile |
| — |
| — |
| — |
| — |
| — |
| 684 |
| 684 |
| |||||||
Tanzania |
| — |
| — |
| — |
| — |
| — |
| 230 |
| 230 |
| |||||||
U.S. |
| — |
| — |
| — |
| — |
| 143 |
| — |
| 143 |
| |||||||
Other |
| — |
| 4 |
| — |
| — |
| — |
| 50 |
| 54 |
| |||||||
|
| $ | 5 |
| $ | 4 |
| $ | — |
| $ | — |
| $ | 2,303 |
| $ | 1,121 |
| $ | 3,433 |
|
AMT credits(2) |
| — |
| — |
| — |
| — |
| — |
| $ | 251 |
| $ | 251 |
| |||||
(1) Represents the gross amount of tax loss carry forwards translated at closing exchange rates at December 31, 2008.
(2) Represents the amounts deductible against future taxes payable in years when taxes payable exceed “minimum tax” as defined by United States tax legislation.
Net Deferred Tax Assets
|
| 2008 |
| 2007 |
| ||
Gross deferred tax assets |
|
|
|
|
| ||
Canada |
| $ | 384 |
| $ | 494 |
|
Chile |
| 41 |
| 117 |
| ||
Argentina |
| 61 |
| 37 |
| ||
Australia |
| 171 |
| 14 |
| ||
Tanzania |
| 199 |
| 197 |
| ||
United States |
| 289 |
| 225 |
| ||
Other |
| 42 |
| 57 |
| ||
|
| 1,187 |
| 1,141 |
| ||
Valuation allowances |
|
|
|
|
| ||
Canada |
| (50 | ) | (55 | ) | ||
Chile |
| (23 | ) | (105 | ) | ||
Argentina |
| (61 | ) | (26 | ) | ||
Australia |
| (9 | ) | (2 | ) | ||
Tanzania |
| (30 | ) | (30 | ) | ||
United States |
| (123 | ) | (190 | ) | ||
Other |
| (22 | ) | (11 | ) | ||
|
| $ | (318 | ) | $ | (419 | ) |
Non-current assets |
| $ | 869 |
| $ | 722 |
|
Valuation Allowances
We consider the need to record a valuation allowance against deferred tax assets, taking into account the effects of local tax law. A valuation allowance is not recorded when we conclude that sufficient positive evidence exists to demonstrate that it is more likely than not that a deferred tax asset will be realized. The main factors considered are:
· Historic and expected future levels of taxable income;
· Tax plans that affect whether tax assets can be realized; and
· The nature, amount and expected timing of reversal of taxable temporary differences.
Levels of future taxable income are mainly affected by: market gold and silver prices; forecasted future costs and expenses to produce gold reserves; quantities of proven and probable gold reserves; market interest rates; and foreign currency exchange rates. If these factors or other circumstances change, we record an adjustment to valuation allowances to reflect our latest assessment of the amount of deferred tax assets that will more likely than not be realized.
A deferred income tax asset totaling $334 million has been recorded in Canada. This deferred tax asset primarily arose due to mark-to-market losses realized for acquired Placer Dome derivative instruments. Projections of various sources of income support the conclusion that the realizability of this deferred tax asset is more likely than not, and consequently no valuation allowance has been set up for this deferred tax asset.
A deferred tax asset of $169 million has been recorded in Tanzania following the release of tax valuation allowances totaling $189 million in 2007. The release of tax valuation allowances resulted from the impact of rising market gold prices on expectations of future taxable income and the ability to realize these tax assets.
A partial valuation allowance of $123 million has been set up against deferred tax assets in the United States at December 31, 2008. The majority of this valuation allowance relates to AMT credits in periods when partly due to low market gold prices, Barrick was an AMT taxpayer in the United States. If market gold prices continue to rise, it is reasonably possible that some or all of these valuation allowances could be released in future periods.
130
Source of Changes in Deferred Tax Balances
For the years ended December 31 |
| 2008 |
| 2007 |
| 2006 |
| |||
Temporary differences |
|
|
|
|
|
|
| |||
Property, plant and equipment |
| $ | (3 | ) | $ | 24 |
| $ | (1,111 | ) |
Asset retirement obligations |
| 24 |
| 39 |
| 128 |
| |||
Tax loss carry forwards |
| (72 | ) | (69 | ) | 546 |
| |||
Derivatives |
| 212 |
| (113 | ) | 52 |
| |||
Other |
| (2 | ) | 9 |
| (17 | ) | |||
|
| $ | 159 |
| $ | (110 | ) | $ | (402 | ) |
Net currency translation gains/(losses) on deferred tax balances |
| (98 | ) | 76 |
| 5 |
| |||
Canadian tax rate changes |
| — |
| (64 | ) | (12 | ) | |||
Adjustment to deferred tax balances due to change in tax status(1) |
| — |
| — |
| 31 |
| |||
Release of end of year Tanzanian valuation allowances |
| — |
| 156 |
| — |
| |||
Release of other valuation allowances |
| 175 |
| 88 |
| 53 |
| |||
|
| $ | 236 |
| $ | 146 |
| $ | (325 | ) |
Intraperiod allocation to: |
|
|
|
|
|
|
| |||
Income from continuing operations before income taxes |
| $ | 45 |
| $ | 174 |
| $ | 109 |
|
Placer Dome acquisition (note 3f) |
| — |
| — |
| (432 | ) | |||
Porgera mine acquisition (note 3d) |
| — |
| 20 |
| — |
| |||
Cortez acquisition (note 3b) |
| 11 |
| — |
| — |
| |||
Barrick Energy Inc. acquisition (note 3a) |
| (22 | ) | — |
| — |
| |||
Kainantu acquisition (note 3e) |
| (19 | ) | — |
| — |
| |||
Other acquisition |
| 2 |
| — |
| — |
| |||
OCI (note 26) |
| 219 |
| (48 | ) | (2 | ) | |||
Other |
| (2 | ) | 5 |
| 28 |
| |||
|
| $ | 234 |
| $ | 151 |
| $ | (297 | ) |
(1) Relates to changes in tax status in Australia (note 9).
Unrecognized Tax Benefits
|
| 2008 |
| 2007 |
| ||
Balance at January 1 |
| $ | 15 |
| $ | 20 |
|
Additions based on tax positions related to the current year |
| 2 |
| 1 |
| ||
Additions for tax positions of prior years |
| 40 |
| — |
| ||
Reductions for tax positions of prior years |
| — |
| (2 | ) | ||
Settlements |
| (11 | ) | (4 | ) | ||
Balance at December 31(1),(2) |
| $ | 46 |
| $ | 15 |
|
(1) If recognized, the total amount of $46 million would be recognized as a benefit to income taxes on the income statement, and therefore would impact the reported effective tax rate.
(2) Includes interest and penalties of $1 million.
We expect the amount of unrecognized tax benefits to decrease within 12 months of the reporting date by approximately $21 to $22 million, related primarily to the expected settlement of Canadian and US income tax and Canadian mining tax assessments.
Tax Years Still Under Examination
Canada |
| 2004–2008 |
|
United States |
| 2005–2008 |
|
Peru |
| 2004–2008 |
|
Chile(1) |
| 2005–2008 |
|
Argentina |
| 2003–2008 |
|
Australia |
| all years open |
|
Papua New Guinea |
| 2003–2008 |
|
Tanzania |
| all years open |
|
(1) In addition, operating loss carry forwards from earlier periods are still open for examination.
Peruvian Tax Assessment
On September 30, 2004, the Tax Court of Peru issued a decision in our favor in the matter of our appeal of a 2002 income tax assessment for an amount of $32 million, excluding interest and penalties. The assessment mainly related to the validity of a revaluation of the Pierina mining concession, which affected its tax basis for the years 1999 and 2000. The full life-of-mine effect on current and deferred income tax liabilities totaling $141 million was fully recorded at December 31, 2002, as well as other related costs of about $21 million.
In January 2005, we received written confirmation that there would be no appeal of the September 30, 2004 Tax Court of Peru decision. In December 2004, we recorded a $141 million reduction in current and deferred income tax liabilities and a $21 million reduction in other accrued costs. The confirmation concluded the administrative and judicial appeals process with resolution in Barrick’s favor.
Notwithstanding the favorable Tax Court decision we received in 2004 on the 1999 to 2000 revaluation matter, in an audit concluded in 2005, SUNAT has reassessed us on the same issue for tax years 2001 to 2003. On October 19, 2007, SUNAT confirmed their reassessment. The tax assessment is for $49 million of tax, plus interest and penalties of $116 million. We filed an appeal to the Tax Court of Peru within the statutory period. We believe that the audit reassessment has no merit, that we will prevail in court again, and accordingly no liability has been recorded for this reassessment.
131
25 · Capital Stock
a) Common Shares
Our authorized capital stock includes an unlimited number of common shares (issued 872,738,664 common shares); 9,764,929 First preferred shares Series A (issued nil); 9,047,619 Series B (issued nil); 1 Series C special voting share (issued 1); and 14,726,854 Second preferred shares Series A (issued nil).
In 2008, we declared and paid dividends in US dollars totaling $0.40 per share ($349 million) (2007: $0.30 per share, $261 million; 2006: $0.22 per share, $191 million).
b) Exchangeable Shares
In connection with a 1998 acquisition, Barrick Gold Inc. (“BGI”) issued 11.1 million BGI exchangeable shares, which are each exchangeable for 0.53 of a Barrick common share at any time at the option of the holder, and have essentially the same voting, dividend (payable in Canadian dollars), and other rights as 0.53 of a Barrick common share. BGI is a subsidiary that holds our interest in the Hemlo and Eskay Creek Mines.
At December 31, 2008, 0.5 million (2007: 1.4 million) BGI exchangeable shares were outstanding, which are equivalent to 0.3 million Barrick common shares (2007: 0.7 million common shares), and are reflected in the number of common shares outstanding. We have the right to require the exchange of each outstanding BGI exchangeable share for 0.53 of a Barrick common share.
26 · Other Comprehensive Income (Loss) (“OCI”)
|
| 2008 |
| 2007 |
| 2006 |
| |||
Accumulated OCI at January 1 |
|
|
|
|
|
|
| |||
Cash flow hedge gains, net of tax of $105, $60, $61 |
| $ | 250 |
| $ | 223 |
| $ | 128 |
|
Investments, net of tax of $4, $7, $nil |
| 37 |
| 46 |
| 12 |
| |||
Currency translation adjustments, net of tax of $nil, $nil, $nil |
| (143 | ) | (143 | ) | (143 | ) | |||
Pension plans and other post-retirement benefits, net of tax of $2, $4, $nil |
| 7 |
| (7 | ) | (28 | ) | |||
|
| $ | 151 |
| $ | 119 |
| $ | (31 | ) |
Other comprehensive income (loss) for the period: |
|
|
|
|
|
|
| |||
Changes in fair value of cash flow hedges |
| (301 | ) | 257 |
| 17 |
| |||
Changes in fair value of investments |
| (52 | ) | 58 |
| 43 |
| |||
Currency translation adjustments(1) |
| (54 | ) | — |
| — |
| |||
Pension plans and other post-retirement benefits: |
|
|
|
|
|
|
| |||
Adjustments to minimum pension liability prior to adoption of FAS 158 |
| — |
| — |
| 15 |
| |||
FAS 158 adjustments (note 28c): |
|
|
|
|
|
|
| |||
Elimination of minimum pension liability |
| — |
| — |
| 13 |
| |||
Net actuarial gain (loss) |
| (62 | ) | 19 |
| (9 | ) | |||
Transition obligation (asset) |
| 1 |
| 1 |
| (2 | ) | |||
Less: reclassification adjustments for gains/losses recorded in earnings: |
|
|
|
|
|
|
| |||
Transfers of cash flow hedge (gains) losses to earnings: |
|
|
|
|
|
|
| |||
On recording hedged items in earnings |
| (267 | ) | (185 | ) | 77 |
| |||
Investments: |
|
|
|
|
|
|
| |||
Other than temporary impairment charges |
| 26 |
| 1 |
| 4 |
| |||
Gains realized on sale |
| (17 | ) | (71 | ) | (6 | ) | |||
Other comprehensive income (loss), before tax |
| (726 | ) | 80 |
| 152 |
| |||
Income tax recovery (expense) related to OCI |
| 219 |
| (48 | ) | (2 | ) | |||
Other comprehensive income (loss), net of tax |
| $ | (507 | ) | $ | 32 |
| $ | 150 |
|
Accumulated OCI at December 31 |
|
|
|
|
|
|
| |||
Cash flow hedge gains (losses), net of tax of $89, $105, $60 |
| (124 | ) | 250 |
| 223 |
| |||
Investments, net of tax of $nil, $4, $7 |
| (2 | ) | 37 |
| 46 |
| |||
Currency translation adjustments, net of tax of $nil, $nil, $nil |
| (197 | ) | (143 | ) | (143 | ) | |||
Pension plans and other post-retirement benefits, net of tax of $19, $2, $4 |
| (33 | ) | 7 |
| (7 | ) | |||
|
| $ | (356 | ) | $ | 151 |
| $ | 119 |
|
(1) Represents currency transiation adjustments for Barrick Energy.
132
27 · Stock-based Compensation
a) Stock Options
Under Barrick’s stock option plan, certain officers and key employees of the Corporation may purchase common shares at an exercise price that is equal to the closing share price on the day before the grant of the option. The grant date is the date when the details of the award, including the number of options granted by individual and the exercise price, are approved. Stock options vest evenly over four years, beginning in the year after granting. Options granted in July 2004 and prior are exercisable over 10 years, whereas options granted since December 2004 are exercisable over seven years. At December 31, 2008, 7.4 million (2007: 10 million; 2006: 13 million) common shares, in addition to those currently outstanding, were available for granting options. Stock options when exercised result in an increase to the number of common shares issued by Barrick.
Compensation expense for stock options was $25 million in 2008 (2007: $25 million; 2006: $27 million), and is presented as a component of cost of sales, corporate administration and other expense, consistent with the classification of other elements of compensation expense for those employees who had stock options. The recognition of compensation expense for stock options reduced earnings per share for 2008 by $0.03 per share (2007: $0.03 per share, 2006: $0.03 per share).
Total intrinsic value relating to options exercised in 2008 was $61 million (2007: $58 million; 2006: $27 million).
Employee Stock Option Activity (Number of Shares in Millions)
|
| 2008 |
| 2007 |
| 2006 |
| |||||||||
|
|
|
| Average |
|
|
| Average |
|
|
| Average |
| |||
|
| Shares |
| price |
| Shares |
| price |
| Shares |
| price |
| |||
C$ options |
|
|
|
|
|
|
|
|
|
|
|
|
| |||
At January 1 |
| 7.1 |
| $ | 27 |
| 11.9 |
| $ | 28 |
| 14.7 |
| $ | 28 |
|
Issued on acquisition of Placer Dome |
| — |
| — |
| — |
| — |
| 1.7 |
| 34 |
| |||
Exercised |
| (2.1 | ) | 28 |
| (3.9 | ) | 28 |
| (2.4 | ) | 26 |
| |||
Forfeited |
| — |
| — |
| (0.1 | ) | 29 |
| (0.2 | ) | 27 |
| |||
Cancelled/expired |
| (0.2 | ) | 28 |
| (0.8 | ) | 35 |
| (1.9 | ) | 40 |
| |||
At December 31 |
| 4.8 |
| $ | 27 |
| 7.1 |
| $ | 27 |
| 11.9 |
| $ | 28 |
|
US$ options |
|
|
|
|
|
|
|
|
|
|
|
|
| |||
At January 1 |
| 7.0 |
| $ | 28 |
| 7.7 |
| $ | 25 |
| 6.9 |
| $ | 24 |
|
Granted |
| 2.8 |
| 34 |
| 1.4 |
| 40 |
| 1.1 |
| 30 |
| |||
Issued on acquisition of Placer Dome |
| — |
| — |
| — |
| — |
| 1.0 |
| 19 |
| |||
Exercised |
| (0.8 | ) | 24 |
| (1.7 | ) | 23 |
| (0.9 | ) | 21 |
| |||
Forfeited |
| (0.1 | ) | 31 |
| (0.3 | ) | 25 |
| (0.4 | ) | 24 |
| |||
Cancelled/expired |
| — |
| — |
| (0.1 | ) | 22 |
| — |
| 25 |
| |||
At December 31 |
| 8.9 |
| $ | 28 |
| 7.0 |
| $ | 28 |
| 7.7 |
| $ | 25 |
|
Stock Options Outstanding (Number of Shares in Millions)
|
| Outstanding |
| Exercisable |
| ||||||||||||||
|
|
|
|
|
|
|
| Intrinsic |
|
|
|
|
| Intrinsic |
| ||||
|
|
|
| Average |
| Average |
| value(1) |
|
|
| Average |
| value(1) |
| ||||
Range of exercise prices |
| Shares |
| price |
| life (years) |
| ($ millions) |
| Shares |
| price |
| ($ millions) |
| ||||
C$ options |
|
|
|
|
|
|
|
|
|
|
|
|
|
|
| ||||
$22 – $27 |
| 2.8 |
| $ | 24 |
| 3 |
| $ | 58 |
| 2.8 |
| $ | 24 |
| $ | 58 |
|
$28 – $31 |
| 2.0 |
| 29 |
| 5 |
| 30 |
| 2.0 |
| 29 |
| 30 |
| ||||
|
| 4.8 |
| $ | 26 |
| 4 |
| $ | 88 |
| 4.8 |
| $ | 26 |
| $ | 88 |
|
US$ options |
|
|
|
|
|
|
|
|
|
|
|
|
|
|
| ||||
$ 9 – $19 |
| 0.1 |
| $ | 13 |
| 4 |
| $ | 4 |
| 0.1 |
| $ | 13 |
| $ | 3 |
|
$20 – $27 |
| 5.0 |
| 25 |
| 4 |
| 58 |
| 3.2 |
| 24 |
| 41 |
| ||||
$28 – $32 |
| 1.3 |
| 30 |
| 7 |
| 8 |
| 0.6 |
| 30 |
| 4 |
| ||||
$33 – $42 |
| 2.5 |
| 42 |
| 6 |
| (13 | ) | 0.3 |
| 41 |
| (1 | ) | ||||
|
| 8.9 |
| $ | 30 |
| 5 |
| $ | 57 |
| 4.2 |
| $ | 26 |
| $ | 47 |
|
(1) Based on the closing market share price on December 31, 2008 of C$44.71 and US$36.77.
133
Option Information
For the years ended December 31 |
|
|
|
|
|
|
| |||
(per share and per option amounts in dollars) |
| 2008 |
| 2007 |
| 2006 |
| |||
Valuation assumptions |
| Lattice | (1),(2) | Lattice | (1),(2) | Lattice | (1),(2) | |||
Expected term (years) |
| 4.5–5.2 |
| 4.5–5 |
| 4.5–5 |
| |||
Expected volatility(2) |
| 30%–70% |
| 30%–38% |
| 30%–38% |
| |||
Weighted average expected volatility(2) |
| 43% |
| 36.6% |
| 31.6% |
| |||
Expected dividend yield |
| 0.7%–1.5% |
| 0.7%–0.9% |
| 0.7%–0.9% |
| |||
Risk-free interest rate(2) |
| 0.25%–5.1% |
| 3.2%–5.1% |
| 4.3%–5.1% |
| |||
|
|
|
|
|
|
|
| |||
Options granted (in millions) |
| 2.8 |
| 1.4 |
| 1.1 |
| |||
Weighted average fair value per option |
| $ | 12.07 |
| $ | 12.91 |
| $ | 9.42 |
|
(1) Different assumptions were used for the multiple stock option grants during the year.
(2) The volatility and risk-free interest rate assumption varied over the expected term of these stock option grants.
The expected volatility assumptions have been developed taking into consideration both historical and implied volatility of our US dollar share price. The risk-free rate for periods within the contractual life of the option is based on the US Treasury yield curve in effect at the time of the grant.
We use the straight-line method for attributing stock option expense over the vesting period. Stock option expense incorporates an expected forfeiture rate. The expected forfeiture rate is estimated based on historical forfeiture rates and expectations of future forfeitures rates. We make adjustments if the actual forfeiture rate differs from the expected rate.
The expected term assumption is derived from the option valuation model and is in part based on historical data regarding the exercise behavior of option holders based on multiple share-price paths. The Lattice model also takes into consideration employee turnover and voluntary exercise patterns of option holders.
As at December 31, 2008, there was $42 million (2007: $33 million; 2006: $39 million) of total unrecognized compensation cost relating to unvested stock options. We expect to recognize this cost over a weighted average period of two years (2007: two years; 2006: two years).
b) Restricted Share Units (RSUs) and Deferred Share Units (DSUs)
Under our RSU plan, selected employees are granted RSUs where each RSU has a value equal to one Barrick common share. RSUs vest at the end of a two and a half or three-year period and are settled in cash on the third anniversary of the grant date. Additional RSUs are credited to reflect dividends paid on Barrick common shares over the vesting period.
A liability for RSUs is recorded at fair value on the grant date, with a corresponding amount recorded as a deferred compensation asset that is amortized on a straight-line basis over the vesting period. Changes in the fair value of the RSU liability are recorded each period, with a corresponding adjustment to the deferred compensation asset. Compensation expense for RSUs incorporates an expected forfeiture rate. The expected forfeiture rate is estimated based on historical forfeiture rates and expectations of future forfeiture rates. We make adjustments if the actual forfeiture rate differs from the expected rate. At December 31, 2008, the weighted average remaining contractual life of RSUs was 1.90 years.
Compensation expense for RSUs was $33 million in 2008 (2007: $16 million; 2006: $6 million) and is presented as a component of cost of sales, corporate administration and other expense, consistent with the classification of other elements of compensation expense for those employees who had RSUs. As at December 31, 2008 there was $84 million of total unamortized compensation cost relating to unvested RSUs (2007: $75 million; 2006: $36 million).
Under our DSU plan, Directors must receive a specified portion of their basic annual retainer in the form of DSUs, with the option to elect to receive 100% of such retainer in DSUs. Each DSU has the same value as one Barrick common share. DSUs must be retained until the Director leaves the Board, at which time the cash value of the DSUs will be paid out. Additional DSUs are credited to reflect dividends paid on Barrick common shares. DSUs are recorded at fair value on the grant date and are adjusted for changes in fair value. The fair value of amounts granted each period together with changes in fair value are expensed.
134
DSU and RSU Activity
|
|
|
| Fair |
|
|
| Fair |
| ||
|
| DSUs |
| value |
| RSUs |
| value |
| ||
|
| (thousands) |
| (millions) |
| (thousands) |
| (millions) |
| ||
At December 31, 2005 |
| 47 |
| $ | 1.4 |
| 611 |
| $ | 16.4 |
|
Settled for cash |
| — |
| — |
| (82 | ) | (2.5 | ) | ||
Forfeited |
| — |
| — |
| (58 | ) | (1.6 | ) | ||
Granted(1) |
| 22 |
| 0.7 |
| 893 |
| 27 |
| ||
Converted to stock options(1) |
| — |
| — |
| (18 | ) | (0.5 | ) | ||
Credits for dividends |
| — |
| — |
| 8 |
| 0.2 |
| ||
Change in value |
| — |
| — |
| — |
| 2.6 |
| ||
At December 31, 2006 |
| 69 |
| $ | 2.1 |
| 1,354 |
| $ | 41.6 |
|
Settled for cash |
| (11 | ) | (0.3 | ) | (119 | ) | (4.9 | ) | ||
Forfeited |
| — |
| — |
| (38 | ) | (1.4 | ) | ||
Granted |
| 42 |
| 1.4 |
| 1,174 |
| 47.5 |
| ||
Credits for dividends |
| — |
| — |
| 12 |
| 0.4 |
| ||
Change in value |
| — |
| 0.9 |
| — |
| 17.0 |
| ||
At December 31, 2007 |
| 100 |
| $ | 4.1 |
| 2,383 |
| $ | 100.2 |
|
Settled for cash |
| (4 | ) | (0.1 | ) | (348 | ) | (10.3 | ) | ||
Forfeited |
| — |
| — |
| (262 | ) | (10.6 | ) | ||
Granted |
| 34 |
| 1.2 |
| 1,493 |
| 42.0 |
| ||
Credits for dividends |
| — |
| — |
| 20 |
| 0.7 |
| ||
Change in value |
| — |
| (0.5 | ) | — |
| (1.7 | ) | ||
At December 31, 2008 |
| 130 |
| $ | 4.7 |
| 3,286 |
| $ | 120.3 |
|
(1) In January 2006, under our RSU plan, 18,112 restricted share units were converted to 72,448 stock options.
c) Performance Restricted Share Units (PRSUs)
In 2008, Barrick launched a PRSU plan. Under this plan, selected employees are granted PRSUs, where each PRSU has a value equal to one Barrick common share. PRSUs vest at the end of a three-year period and are settled in cash on the third anniversary of the grant date. Additional RSUs are credited to reflect dividends paid on Barrick common shares over the vesting period. Vesting is based on the achievement of performance goals and the target settlement will range from 0% to 200% of the value. At December 31, 2008, 133 thousand units were outstanding.
d) Employee Share Purchase Plan (ESPP)
In 2008, Barrick launched an Employee Share Purchase Plan. This plan enables Barrick employees to purchase Company shares through payroll deduction. Each year, employees may contribute 1%–6% of their combined base salary and annual bonus, and Barrick will match 50% of the contribution, up to a maximum of $5,000 per year. During 2008, Barrick contributed $0.5 million to this plan.
28 · Post-retirement Benefits
a) Defined Contribution Pension Plans
Certain employees take part in defined contribution employee benefit plans. We also have a retirement plan for certain officers of the Company, under which we contribute 15% of the officer’s annual salary and bonus. Our share of contributions to these plans, which is expensed in the year it is earned by the employee, was $47 million in 2008, $49 million in 2007 and $36 million in 2006.
b) Defined Benefit Pension Plans
We have qualified defined benefit pension plans that cover certain of our United States and Canadian employees and provide benefits based on employees’ years of service. Through the acquisition of Placer Dome, we acquired pension plans in the United States, Canada and Australia. Our policy is to fund the amounts necessary on an actuarial basis to provide enough assets to meet the benefits payable to plan members. Independent trustees administer assets of the plans, which are invested mainly in fixed income and equity securities. In 2007, one of our qualified defined benefit plans in Canada was wound up. No curtailment gain or loss resulted and the obligations of the plans are expected to be settled at the end of 2009. Also in 2007, both of our defined benefit plans in Australia were wound up. No curtailment gain or loss resulted for either plan. In 2006, actuarial assumptions were amended for one of our qualified defined benefit plans in Canada and another one of our other plans in Canada was partially wound up; no curtailment gain or loss resulted for either plan. Also in 2006, one of our qualified defined benefit plans in the United States was amended to freeze benefits accruals for all employees, resulting in a curtailment gain of $8 million.
As well as the qualified plans, we have non-qualified defined benefit pension plans covering certain employees and former directors of the Company. An irrevocable trust (“rabbi trust”) was set up to fund these plans. The fair value of assets held in this trust was $9 million in 2008 (2007: $19 million), and is recorded in our consolidated balance sheet under available-for-sale securities.
Actuarial gains and losses arise when the actual return on plan assets differs from the expected return on plan assets for a period, or when the expected and actuarial accrued benefit obligations differ at the end of the year. We amortize actuarial gains and losses over the average remaining life expectancy of plan participants, in excess of a 10% corridor.
135
Pension Expense (Credit)
For the years ended December 31 |
| 2008 |
| 2007 |
| 2006 |
| |||
Expected return on plan assets |
| $ | (19 | ) | $ | (21 | ) | $ | (20 | ) |
Service cost |
| — |
| 2 |
| 4 |
| |||
Interest cost |
| 21 |
| 21 |
| 22 |
| |||
Actuarial losses |
| 1 |
| 1 |
| 1 |
| |||
Curtailment gains |
| — |
| — |
| (8 | ) | |||
|
| $ | 3 |
| $ | 3 |
| $ | (1 | ) |
c) Pension Plan Information
Fair Value of Plan Assets
For the years ended December 31 |
| 2008 |
| 2007 |
| 2006 |
| |||
Balance at January 1 |
| $ | 293 |
| $ | 301 |
| $ | 166 |
|
Increase for plans assumed on acquisitions |
| 9 |
| — |
| 127 |
| |||
Actual return on plan assets |
| (41 | ) | 31 |
| 35 |
| |||
Company contributions |
| 12 |
| 10 |
| 10 |
| |||
Settlements |
| — |
| (14 | ) | — |
| |||
Benefits paid |
| (33 | ) | (35 | ) | (37 | ) | |||
Foreign currency adjustments |
| (3 | ) | — |
| — |
| |||
Balance at December 31 |
| $ | 237 |
| $ | 293 |
| $ | 301 |
|
|
|
|
|
|
| |||||
|
| 2008 |
| 2008 |
| |||||
At December 31 |
| Target(1) |
| Actual |
| Actual |
| |||
Composition of plan assets: |
|
|
|
|
|
|
| |||
Equity securities |
| 43 | % | 43 | % | $ | 103 |
| ||
Fixed income securities |
| 57 | % | 57 | % | 134 |
| |||
|
| 100 | % | 100 | % | $ | 237 |
| ||
(1) Based on the weighted average target for all defined benefit plans.
Projected Benefit Obligation (PBO)
For the years ended December 31 |
| 2008 |
| 2007 |
| ||
Balance at January 1 |
| $ | 364 |
| $ | 389 |
|
Increase for plans assumed on acquisition of 40% of Cortez |
| 9 |
| — |
| ||
Service cost |
| — |
| 2 |
| ||
Interest cost |
| 21 |
| 21 |
| ||
Actuarial (gains) losses |
| 4 |
| 1 |
| ||
Benefits paid |
| (33 | ) | (35 | ) | ||
Foreign currency adjustments |
| (8 | ) | — |
| ||
Curtailments |
| — |
| (14 | ) | ||
Balance at December 31 |
| $ | 357 |
| $ | 364 |
|
Funded status(1) |
| $ | (120 | ) | $ | (71 | ) |
ABO(2),(3) |
| $ | 357 |
| $ | 254 |
|
(1) Represents the fair value of plan assets less projected benefit obligations. Plan assets exclude investments held in a rabbi trust that are recorded separately on our balance sheet under Investments (fair value $9 million at December 31, 2008).
(2) For 2008, we used a measurement date of December 31, 2008 to calculate accumulated benefit obligations.
(3) Represents the accumulated benefit obligation (“ABO”) for all plans. The ABO for plans where the PBO exceeds the fair value of plan assets was $326 million (2007: $254 million).
Pension Plan Assets/Liabilities
For the years ended December 31 |
| 2008 |
| 2007 |
| ||
Non-current assets |
| $ | — |
| $ | 25 |
|
Current liabilities |
| (7 | ) | (8 | ) | ||
Non-current liabilities |
| (113 | ) | (87 | ) | ||
Other comprehensive income(1) |
| 52 |
| (9 | ) | ||
|
| $ | (68 | ) | $ | (79 | ) |
(1) Amounts represent actuarial (gains) losses.
The projected benefit obligation and fair value of plan assets for pension plans with a projected benefit obligation in excess of plan assets at December 31, 2008 and 2007 were as follows:
For the years ended December 31 |
| 2008 |
| 2007 |
| ||
Projected benefit obligation, end of year |
| $ | 326 |
| $ | 329 |
|
Fair value of plan assets, end of year |
| $ | 205 |
| $ | 258 |
|
136
The projected benefit obligation and fair value of plan assets for pension plans with an accumulated benefit obligation in excess of plan assets at December 31, 2008 and 2007 were as follows:
For the years ended December 31 |
| 2008 |
| 2007 |
| ||
Projected benefit obligation, end of year |
| $ | 357 |
| $ | 329 |
|
Accumulated benefit obligation, end of year |
| $ | 326 |
| $ | 330 |
|
Fair value of plan assets, end of year |
| $ | 205 |
| $ | 258 |
|
Expected Future Benefit Payments
|
|
|
|
|
For the years ending December 31 |
|
|
| |
2009 |
| $ | 57 |
|
2010 |
| 29 |
| |
2011 |
| 24 |
| |
2012 |
| 24 |
| |
2013 |
| 24 |
| |
2014 – 2018 |
| $ | 116 |
|
d) Actuarial Assumptions
For the years ended December 31 |
| 2008 |
| 2007 |
| 2006 |
|
Discount rate(1) |
|
|
|
|
|
|
|
Benefit obligation |
| 4.50–6.25 | % | 4.50–6.30 | % | 4.40–5.90 | % |
Pension cost |
| 4.50–6.25 | % | 4.50–5.81 | % | 4.40–5.90 | % |
Return on plan assets(1) |
| 3.75–7.00 | % | 4.50–7.25 | % | 7.00–7.25 | % |
Wage increases |
| 3.50–5.00 | % | 3.50–5.00 | % | 3.50–5.00 | % |
(1) Effect of a one-percent change: Discount rate: $25 million decrease in ABO and $1 million increase in pension cost; Return on plan assets: $3 million decrease in pension cost.
Pension plan assets, which consist primarily of fixed-income and equity securities, are valued using current market quotations. Plan obligations and the annual pension expense are determined on an actuarial basis and are affected by numerous assumptions and estimates including the market value of plan assets, estimates of the expected return on plan assets, discount rates, future wage increases and other assumptions. The discount rate, assumed rate of return on plan assets and wage increases are the assumptions that generally have the most significant impact on our pension cost and obligation.
The discount rate for benefit obligation and pension cost purposes is the rate at which the pension obligation could be effectively settled. This rate was developed by matching the cash flows underlying the pension obligation with a spot rate curve based on the actual returns available on high-grade (Moody’s Aa) US corporate bonds. Bonds included in this analysis were restricted to those with a minimum outstanding balance of $50 million. Only non-callable bonds, or bonds with a make-whole provision, were included. Finally, outlying bonds (highest and lowest 10%) were discarded as being non-representative and likely to be subject to a change in investment grade. The resulting discount rate from this analysis was rounded to the nearest five basis points. The procedure was applied separately for pension and post-retirement plan purposes, and produced the same rate in each case.
The assumed rate of return on assets for pension cost purposes is the weighted average of expected long-term asset return assumptions. In estimating the long-term rate of return for plan assets, historical markets are studied and long-term historical returns on equities and fixed-income investments reflect the widely accepted capital market principle that assets with higher volatility generate a greater return over the long run. Current market factors such as inflation and interest rates are evaluated before long-term capital market assumptions are finalized.
Wage increases reflect the best estimate of merit increases to be provided, consistent with assumed inflation rates.
e) Other Post-retirement Benefits
We provide post-retirement medical, dental, and life insurance benefits to certain employees. We use the corridor approach in the accounting for post-retirement benefits. Actuarial gains and losses resulting from variances between actual results and economic estimates or actuarial assumptions are deferred and amortized over the average remaining life expectancy of participants when the net gains or losses exceed 10% of the accumulated post-retirement benefit obligation.
Other Post-retirement Benefits Expense
For the years ended December 31 |
| 2008 |
| 2007 |
| 2006 |
| |||
Interest cost |
| $ | 2 |
| $ | 2 |
| $ | 2 |
|
Other |
| — |
| — |
| — |
| |||
|
| $ | 2 |
| $ | 2 |
| $ | 2 |
|
137
Fair Value of Plan Assets
For the years ended December 31 |
| 2008 |
| 2007 |
| 2006 |
| |||
Balance at January 1 |
| $ | — |
| $ | — |
| $ | — |
|
Contributions |
| 2 |
| 2 |
| 3 |
| |||
Benefits paid |
| (2 | ) | (2 | ) | (3 | ) | |||
Balance at December 31 |
| $ | — |
| $ | — |
| $ | — |
|
Accumulated Post-retirement Benefit Obligation (APBO)
For the years ended December 31 |
| 2008 |
| 2007 |
| 2006 |
| |||
Balance at January 1 |
| $ | 30 |
| $ | 37 |
| $ | 39 |
|
Interest cost |
| 2 |
| 2 |
| 2 |
| |||
Actuarial (gains) losses |
| 2 |
| (7 | ) | (1 | ) | |||
Benefits paid |
| (2 | ) | (2 | ) | (3 | ) | |||
Balance at December 31 |
| $ | 32 |
| $ | 30 |
| $ | 37 |
|
Funded status |
| (32 | ) | (30 | ) | (37 | ) | |||
Unrecognized net transition obligation |
| n/a |
| n/a |
| n/a |
| |||
Unrecognized actuarial losses |
| n/a |
| n/a |
| n/a |
| |||
Net benefit liability recorded |
| n/a |
| n/a |
| n/a |
| |||
Other Post-retirement Assets/Liabilities
For the years ended December 31 |
| 2008 |
| 2007 |
| ||
Current liability |
| $ | (3 | ) | $ | (3 | ) |
Non-current liability |
| (29 | ) | (27 | ) | ||
Accumulated other comprehensive income |
| — |
| (1 | ) | ||
|
| $ | (32 | ) | $ | (31 | ) |
Amounts recognized in accumulated other comprehensive income consist of : (1)
For the years ended December 31 |
| 2008 |
| 2007 |
| ||
Net actuarial loss (gain) |
| $ | 1 |
| $ | (2 | ) |
Transition obligation (asset) |
| (1 | ) | 1 |
| ||
|
| $ | — |
| $ | (1 | ) |
(1) The estimated amounts that will be amortized into net periodic benefit cost in 2008.
We have assumed a health care cost trend of 8% in 2008, decreasing ratability to 5% in 2011 and thereafter. The assumed health care cost trend had a minimal effect on the amounts reported. A one percentage point change in the assumed health care cost trend rate at December 31, 2008 would have had no significant effect on the post-retirement obligation and would have had no significant effect on the benefit expense for 2008.
Expected Future Benefit Payments
For the years ending December 31 |
|
|
| |
2009 |
| $ | 3 |
|
2010 |
| 3 |
| |
2011 |
| 3 |
| |
2012 |
| 3 |
| |
2013 |
| 2 |
| |
2014 – 2018 |
| $ | 11 |
|
29 · Litigation and Claims
Certain conditions may exist as of the date the financial statements are issued, which may result in a loss to the Company but which will only be resolved when one or more future events occur or fail to occur. In assessing loss contingencies related to legal proceedings that are pending against us or unasserted claims that may result in such proceedings, the Company and its legal counsel evaluate the perceived merits of any legal proceedings or unasserted claims as well as the perceived merits of the amount of relief sought or expected to be sought.
If the assessment of a contingency suggests that a loss is probable, and the amount can be reliably estimated, then a loss is recorded. When a contingent loss is not probable but is reasonably possible, or is probable but the amount of loss cannot be reliably estimated, then details of the contingent loss are disclosed. Loss contingencies considered remote are generally not disclosed unless they involve guarantees, in which case we disclose the nature of the guarantee. Legal fees incurred in connection with pending legal proceedings are expensed as incurred.
Wagner Complaint
On June 12, 2003, a complaint was filed against Barrick and several of its current or former officers in the U.S. District Court for the Southern District of New York. The complaint is on behalf of Barrick shareholders who purchased Barrick shares between February 14, 2002 and September 26, 2002. It alleges that Barrick and the individual defendants violated U.S. securities laws by making false and misleading statements concerning Barrick’s projected operating results and earnings in 2002. The complaint seeks an unspecified amount of damages. In November 2008, near the completion of discovery, this matter was scheduled for trial in March 2009. The trial date has since been adjourned because of a settlement in principle among the parties. Efforts to finalize the settlement and seek the necessary Court approval are ongoing. No amounts have been accrued for any potential loss under this complaint.
138
Cortez Hills Complaint
On November 12, 2008, the United States Bureau of Land Management issued a Record of Decision approving the Cortez Hills Expansion Project. On November 20, 2008, the TeMoak Shoshone Tribe, the East Fork Band Council of the TeMoak Shoshone Tribe and the Timbisha Shoshone Tribe, the Western Shoshone Defense Project, and Great Basin Resource Watch filed a lawsuit against the United States seeking to enjoin the majority of the activities comprising the Project on grounds that it violated the Western Shoshone rights under the Religious Freedom Restoration Act (“RFRA”), that it violated the Federal Land Policy and Management Act’s prohibition on “unnecessary and undue degradation,” and that the Project’s Environment Impact Statement did not meet the requirements of the National Environmental Policy Act. The Plaintiffs’ RFRA claim is based on the assertion that the Project and adjoining areas are sacred to certain Western Shoshone. On November 24, 2008, the Plaintiffs filed a Motion for a Temporary Restraining Order and a Preliminary Injunction barring work on the Project until after a trial on the merits. After a four day hearing, on January 26, 2009, the Court denied the Plaintiffs’ Motion for a Preliminary Injunction, concluding that the Plaintiffs had failed to demonstrate a likelihood of success on the merits. The Plaintiffs have appealed that decision to the United States Court of Appeals for the Ninth Circuit.
Marinduque Complaint
Placer Dome has been named the sole defendant in a Complaint filed on October 4, 2005, by the Provincial Government of Marinduque, an island province of the Philippines (“Province”), with the District Court in Clark County, Nevada. The action was removed to the Nevada Federal District Court on motion of Placer Dome. The Complaint asserts that Placer Dome is responsible for alleged environmental degradation with consequent economic damages and impacts to the environment in the vicinity of the Marcopper mine that was owned and operated by Marcopper Mining Corporation (“Marcopper”). Placer Dome indirectly owned a minority shareholding of 39.9% in Marcopper until the divestiture of its shareholding in 1997. The Province seeks “to recover damages for injuries to the natural, ecological and wildlife resources within its territory”, but “does not seek to recover damages for individual injuries sustained by its citizens either to their persons or their property”. In addition to damages for injury to natural resources, the Province seeks compensation for the costs of restoring the environment, an order directing Placer Dome to undertake and complete “the remediation, environmental cleanup, and balancing of the ecology of the affected areas,” and payment of the costs of environmental monitoring. The Complaint addresses the discharge of mine tailings into Calancan Bay, the 1993 Maguila - guila dam breach, the 1996 Boac river tailings spill, and alleged past and continuing damage from acid rock drainage.
At the time of the amalgamation of Placer Dome and Barrick Gold Corporation, a variety of motions were pending before the District Court, including motions to dismiss the action for lack of personal jurisdiction and for forum non conveniens (improper choice of forum). On June 29, 2006, the Province filed a Motion to join Barrick Gold Corporation as an additional named Defendant and for leave to file a Third Amended Complaint which the Court granted on March 2, 2007. On March 6, 2007, the Court issued an order setting a briefing schedule on the Company’s motion to dismiss on grounds of forum non conveniens. On June 7, 2007, the Court issued an order granting the Company’s motion to dismiss. On June 25, 2007, the Province filed a motion requesting the Court to reconsider its Order dismissing the action. On January 16, 2008, the district court issued an order denying the Province’s motion for reconsideration. Following the district court’s order, the Province filed Notice of Appeal to the U.S. Court of Appeals for the Ninth Circuit. Under the briefing schedule established by the Court of Appeals the Province’s initial brief in the Appeal was filed on August 15, 2008, the Company’s responsive brief was filed on September 15, 2008, and the Province’s reply brief was filed on October 15, 2008. Oral argument before the U.S. Court of Appeals is set for March 10, 2009. We will challenge the claims of the Province on various grounds and otherwise vigorously defend the action. No amounts have been accrued for any potential loss under this complaint.
139
Calancan Bay (Philippines) Complaint
On July 23, 2004, a complaint was filed against Marcopper and Placer Dome Inc. (“PDI”) in the Regional Trial Court of Boac, on the Philippine island of Marinduque, on behalf of a putative class of fishermen who reside in the communities around Calancan Bay, in northern Marinduque. The complaint alleges injuries to health and economic damages to the local fisheries resulting from the disposal of mine tailings from the Marcopper mine. The total amount of damages claimed is approximately US$900 million.
On October 16, 2006, the court granted the plaintiffs’ application for indigent status, allowing the case to proceed without payment of filing fees. On January 17, 2007, the Court issued a summons to Marcopper and PDI. On March 25, 2008, an attempt was made to serve PDI by serving the summons and complaint on Placer Dome Technical Services (Philippines) Inc. (“PDTS”). PDTS has returned the summons and complaint with a manifestation stating that PDTS is not an agent of PDI for any purpose and is not authorized to accept service or to take any other action on behalf of PDI. On April 3, 2008, PDI made a special appearance by counsel to move to dismiss the complaint for lack of personal jurisdiction and on other grounds. The plaintiffs have opposed the motion to dismiss. A hearing on the motion to dismiss originally set by the trial court for November 27, 2008 has been rescheduled for March 11, 2009.
The Company intends to defend the action vigorously. No amounts have been accrued for any potential loss under this complaint.
Pakistani Constitutional Litigation
On November 28, 2006, a Constitutional Petition was filed in the High Court of Balochistan by three Pakistani citizens against: Barrick, the governments of Balochistan and Pakistan, the Balochistan Development Authority (“BDA”), Tethyan Copper Company (“TCC”), Antofagasta Plc (“Antofagasta”), Muslim Lakhani and BHP (Pakistan) Pvt Limited (“BHP”).
The Petition alleged, among other things, that the entry by the BDA into the 1993 Joint Venture Agreement (“JVA”) with BHP to facilitate the exploration of the Reko Diq area and the grant of related exploration licenses were illegal and that the subsequent transfer of the interests of BHP in the JVA and the licenses to TCC was also illegal and should therefore be set aside. Barrick currently indirectly holds 50% of the shares of TCC, with Antofagasta indirectly holding the other 50%.
On June 26, 2007, the High Court of Balochistan dismissed the Petition against Barrick and the other respondents in its entirety. On August 23, 2007, the petitioners filed a Civil Petition for Leave to Appeal in the Supreme Court of Pakistan. The Supreme Court of Pakistan has not yet considered the Civil Petition for Leave to Appeal. Barrick intends to defend this action vigorously. No amounts have been accrued for any potential loss under this complaint.
140
Mineral Reserves and Mineral Resources
The table on the next two pages sets forth Barrick’s interest in the total proven and probable gold reserves and in the total measured and indicated gold resources at each property. For further details of proven and probable mineral reserves and measured, indicated and inferred mineral resources by category, metal and property, see pages 144 to 148.
The Company has carefully prepared and verified the mineral reserve and mineral resource figures and believes that its method of estimating mineral reserves has been verified by mining experience. These figures are estimates, however, and no assurance can be given that the indicated quantities of metal will be produced. Metal price fluctuations may render mineral reserves containing relatively lower grades of mineralization uneconomic. Moreover, short-term operating factors relating to the mineral reserves, such as the need for orderly development of ore bodies or the processing of new or different ore grades, could affect the Company’s profitability in any particular accounting period.
Definitions
A mineral resource is a concentration or occurrence of diamonds, natural solid inorganic material, or natural solid fossilized organic material including base and precious metals, coal, and industrial minerals in or on the Earth’s crust in such form and quantity and of such a grade or quality that it has reasonable prospects for economic extraction. The location, quantity, grade, geological characteristics and continuity of a mineral resource are known, estimated or interpreted from specific geological evidence and knowledge. Mineral resources are sub-divided, in order of increasing geological confidence, into inferred, indicated and measured categories.
An inferred mineral resource is that part of a mineral resource for which quantity and grade or quality can be estimated on the basis of geological evidence and limited sampling and reasonably assumed, but not verified, geological and grade continuity. The estimate is based on limited information and sampling gathered through appropriate techniques from locations such as outcrops, trenches, pits, workings and drill holes.
An indicated mineral resource is that part of a mineral resource for which quantity, grade and quality, densities, shape and physical characteristics, can be estimated with a level of confidence sufficient to allow the appropriate application of technical and economic parameters, to support mine planning and evaluation of the economic viability of the deposit. The estimate is based on detailed and reliable exploration and testing information gathered through appropriate techniques from locations such as outcrops, trenches, pits, workings and drill holes that are spaced closely enough for geological and grade continuity to be reasonably assumed.
A measured mineral resource is that part of a mineral resource for which quantity, grade or quality, densities, shape and physical characteristics are so well established that they can be estimated with confidence sufficient to allow the appropriate application of technical and economic parameters, to support production planning and evaluation of the economic viability of the deposit. The estimate is based on detailed and reliable exploration, sampling and testing information gathered through appropriate techniques from locations such as outcrops, trenches, pits, workings and drill holes that are spaced closely enough to confirm both geological and grade continuity.
Mineral resources, which are not mineral reserves, do not have demonstrated economic viability.
A mineral reserve is the economically mineable part of a measured or indicated mineral resource demonstrated by at least a preliminary feasibility study. This study must include adequate information on mining, processing, metallurgical, economic and other relevant factors that demonstrate, at the time of reporting, that economic extraction can be justified. A mineral reserve includes diluting materials and allowances for losses that may occur when the material is mined. Mineral reserves are sub-divided in order of increasing confidence into probable mineral reserves and proven mineral reserves.
A probable mineral reserve is the economically mineable part of an indicated and, in some circumstances, a measured mineral resource demonstrated by a least a preliminary feasibility study. This study must include adequate information on mining, processing, metallurgical, economic and other relevant factors that demonstrate, at the time of reporting, that economic extraction can be justified.
A proven mineral reserve is the economically mineable part of a measured mineral resource demonstrated by at least a preliminary feasibility study. This study must include adequate information on mining, processing, metallurgical, economic and other relevant factors that demonstrate, at the time of reporting, that economic extraction can be justified.
141
Summary Gold Mineral Reserves and Mineral Resources(1),(2)
|
|
|
| 2008 |
| 2007 |
| ||||||||
For the years ended December 31 |
|
|
| Tons |
| Grade |
| Ounces |
| Tons |
| Grade |
| Ounces |
|
Based on attributable ounces |
|
|
| (000s) |
| (oz/ton) |
| (000s) |
| (000s) |
| (oz/ton) |
| (000s) |
|
North America |
|
|
|
|
|
|
|
|
|
|
|
|
|
|
|
Goldstrike Open Pit |
| (proven and probable) |
| 86,254 |
| 0.119 |
| 10,294 |
| 94,914 |
| 0.128 |
| 12,194 |
|
|
| (mineral resource) |
| 15,751 |
| 0.055 |
| 868 |
| 34,532 |
| 0.052 |
| 1,788 |
|
Goldstrike Underground |
| (proven and probable) |
| 6,923 |
| 0.368 |
| 2,545 |
| 7,423 |
| 0.364 |
| 2,700 |
|
|
| (mineral resource) |
| 4,467 |
| 0.323 |
| 1,444 |
| 4,129 |
| 0.329 |
| 1,359 |
|
Goldstrike Property Total |
| (proven and probable) |
| 93,177 |
| 0.138 |
| 12,839 |
| 102,337 |
| 0.146 |
| 14,894 |
|
|
| (mineral resource) |
| 20,218 |
| 0.114 |
| 2,312 |
| 38,661 |
| 0.081 |
| 3,147 |
|
Pueblo Viejo (60%) |
| (proven and probable) |
| 147,946 |
| 0.091 |
| 13,440 |
| 129,125 |
| 0.095 |
| 12,258 |
|
|
| (mineral resource) |
| 77,068 |
| 0.056 |
| 4,330 |
| 41,674 |
| 0.064 |
| 2,655 |
|
Cortez (100%)(3) |
| (proven and probable) |
| 222,125 |
| 0.060 |
| 13,384 |
| 86,457 |
| 0.080 |
| 6,884 |
|
|
| (mineral resource) |
| 81,088 |
| 0.046 |
| 3,743 |
| 45,744 |
| 0.045 |
| 2,076 |
|
Bald Mountain |
| (proven and probable) |
| 157,675 |
| 0.018 |
| 2,846 |
| 128,093 |
| 0.024 |
| 3,059 |
|
|
| (mineral resource) |
| 90,374 |
| 0.019 |
| 1,718 |
| 36,493 |
| 0.024 |
| 861 |
|
Turquoise Ridge (75%) |
| (proven and probable) |
| 7,961 |
| 0.501 |
| 3,985 |
| 8,429 |
| 0.458 |
| 3,858 |
|
|
| (mineral resource) |
| 2,467 |
| 0.435 |
| 1,074 |
| 2,469 |
| 0.409 |
| 1,010 |
|
Round Mountain (50%) |
| (proven and probable) |
| 92,581 |
| 0.018 |
| 1,621 |
| 78,117 |
| 0.018 |
| 1,442 |
|
|
| (mineral resource) |
| 28,570 |
| 0.019 |
| 529 |
| 16,883 |
| 0.022 |
| 366 |
|
Ruby Hill |
| (proven and probable) |
| 18,844 |
| 0.044 |
| 831 |
| 18,763 |
| 0.050 |
| 930 |
|
|
| (mineral resource) |
| 11,919 |
| 0.040 |
| 480 |
| 3,202 |
| 0.077 |
| 245 |
|
Hemlo (50%) |
| (proven and probable) |
| 7,075 |
| 0.080 |
| 564 |
| 7,419 |
| 0.085 |
| 633 |
|
|
| (mineral resource) |
| 1,314 |
| 0.079 |
| 104 |
| 2,971 |
| 0.122 |
| 361 |
|
Marigold (33%) |
| (proven and probable) |
| 25,462 |
| 0.020 |
| 511 |
| 31,106 |
| 0.020 |
| 631 |
|
|
| (mineral resource) |
| 15,673 |
| 0.016 |
| 253 |
| 17,053 |
| 0.020 |
| 346 |
|
Golden Sunlight |
| (proven and probable) |
| 8,665 |
| 0.062 |
| 540 |
| 2,495 |
| 0.056 |
| 140 |
|
|
| (mineral resource) |
| 131 |
| 0.061 |
| 8 |
| 8,300 |
| 0.054 |
| 451 |
|
Eskay Creek |
| (proven and probable) |
| — |
| — |
| — |
| 35 |
| 0.457 |
| 16 |
|
|
| (mineral resource) |
| — |
| — |
| — |
| — |
| — |
| — |
|
South Arturo (60%) |
| (proven and probable) |
| — |
| — |
| — |
| — |
| — |
| — |
|
|
| (mineral resource) |
| 22,114 |
| 0.045 |
| 987 |
| 10,757 |
| 0.070 |
| 752 |
|
Donlin Creek (50%) |
| (proven and probable) |
| — |
| — |
| — |
| — |
| — |
| — |
|
|
| (mineral resource) |
| 269,496 |
| 0.066 |
| 17,737 |
| 204,869 |
| 0.072 |
| 14,668 |
|
South America |
|
|
|
|
|
|
|
|
|
|
|
|
|
|
|
Cerro Casale (51%)(4) |
| (proven and probable) |
| 612,273 |
| 0.018 |
| 10,831 |
| — |
| — |
| — |
|
|
| (mineral resource) |
| 194,722 |
| 0.012 |
| 2,372 |
| — |
| — |
| — |
|
Pascua-Lama |
| (proven and probable) |
| 440,226 |
| 0.040 |
| 17,806 |
| 444,610 |
| 0.040 |
| 17,978 |
|
|
| (mineral resource) |
| 131,494 |
| 0.036 |
| 4,687 |
| 99,158 |
| 0.038 |
| 3,760 |
|
Veladero |
| (proven and probable) |
| 491,316 |
| 0.025 |
| 12,233 |
| 388,445 |
| 0.030 |
| 11,660 |
|
|
| (mineral resource) |
| 50,191 |
| 0.014 |
| 706 |
| 27,344 |
| 0.018 |
| 503 |
|
Lagunas Norte |
| (proven and probable) |
| 230,635 |
| 0.039 |
| 8,949 |
| 222,176 |
| 0.039 |
| 8,733 |
|
|
| (mineral resource) |
| 55,573 |
| 0.023 |
| 1,278 |
| 105,075 |
| 0.025 |
| 2,644 |
|
Pierina |
| (proven and probable) |
| 29,182 |
| 0.023 |
| 683 |
| 40,108 |
| 0.027 |
| 1,073 |
|
|
| (mineral resource) |
| 11,141 |
| 0.014 |
| 156 |
| 12,480 |
| 0.016 |
| 194 |
|
(1) Resources which are not reserves do not have demonstrated economic viability.
(2) See accompanying footnote #1.
(3) See accompanying footnote #2.
(4) See accompanying footnote #3.
142
Summary Gold Mineral Reserves and Mineral Resources(1),(2)
|
|
|
| 2008 |
| 2007 |
| ||||||||
For the years ended December 31 |
|
|
| Tons |
| Grade |
| Ounces |
| Tons |
| Grade |
| Ounces |
|
Based on attributable ounces |
|
|
| (000s) |
| (oz/ton) |
| (000s) |
| (000s) |
| (oz/ton) |
| (000s) |
|
Australia Pacific |
|
|
|
|
|
|
|
|
|
|
|
|
|
|
|
Porgera (95%) |
| (proven and probable) |
| 78,975 |
| 0.099 |
| 7,828 |
| 79,060 |
| 0.104 |
| 8,239 |
|
|
| (mineral resource) |
| 61,025 |
| 0.066 |
| 4,031 |
| 56,610 |
| 0.074 |
| 4,199 |
|
Kalgoorlie (50%) |
| (proven and probable) |
| 77,516 |
| 0.056 |
| 4,360 |
| 79,412 |
| 0.058 |
| 4,589 |
|
|
| (mineral resource) |
| 8,611 |
| 0.059 |
| 512 |
| 2,835 |
| 0.062 |
| 175 |
|
Cowal |
| (proven and probable) |
| 79,500 |
| 0.035 |
| 2,795 |
| 81,463 |
| 0.035 |
| 2,876 |
|
|
| (mineral resource) |
| 31,463 |
| 0.034 |
| 1,072 |
| 23,076 |
| 0.035 |
| 819 |
|
Plutonic |
| (proven and probable) |
| 5,828 |
| 0.179 |
| 1,042 |
| 12,111 |
| 0.151 |
| 1,824 |
|
|
| (mineral resource) |
| 11,037 |
| 0.157 |
| 1,733 |
| 18,819 |
| 0.144 |
| 2,704 |
|
Kanowna |
| (proven and probable) |
| 6,294 |
| 0.200 |
| 1,256 |
| 8,874 |
| 0.171 |
| 1,519 |
|
|
| (mineral resource) |
| 5,234 |
| 0.164 |
| 859 |
| 4,318 |
| 0.157 |
| 677 |
|
Darlot |
| (proven and probable) |
| 4,394 |
| 0.127 |
| 557 |
| 5,208 |
| 0.126 |
| 655 |
|
|
| (mineral resource) |
| 3,598 |
| 0.125 |
| 451 |
| 3,531 |
| 0.121 |
| 428 |
|
Granny Smith |
| (proven and probable) |
| 3,620 |
| 0.136 |
| 491 |
| 3,449 |
| 0.133 |
| 458 |
|
|
| (mineral resource) |
| 2,514 |
| 0.168 |
| 423 |
| 3,035 |
| 0.155 |
| 469 |
|
Lawlers |
| (proven and probable) |
| 2,484 |
| 0.142 |
| 353 |
| 3,199 |
| 0.127 |
| 407 |
|
|
| (mineral resource) |
| 6,791 |
| 0.151 |
| 1,023 |
| 6,777 |
| 0.166 |
| 1,128 |
|
Henty |
| (proven and probable) |
| 402 |
| 0.229 |
| 92 |
| 626 |
| 0.236 |
| 148 |
|
|
| (mineral resource) |
| 199 |
| 0.231 |
| 46 |
| 79 |
| 0.165 |
| 13 |
|
Osborne |
| (proven and probable) |
| 2,174 |
| 0.021 |
| 45 |
| 4,181 |
| 0.020 |
| 82 |
|
|
| (mineral resource) |
| 3,410 |
| 0.026 |
| 89 |
| 3,602 |
| 0.027 |
| 97 |
|
Reko Diq (37.5%) |
| (proven and probable) |
| — |
| — |
| — |
| — |
| — |
| — |
|
|
| (mineral resource) |
| 1,125,071 |
| 0.008 |
| 8,487 |
| 444,831 |
| 0.008 |
| 3,741 |
|
Africa |
|
|
|
|
|
|
|
|
|
|
|
|
|
|
|
Bulyanhulu |
| (proven and probable) |
| 37,728 |
| 0.317 |
| 11,977 |
| 36,052 |
| 0.334 |
| 12,043 |
|
|
| (mineral resource) |
| 4,936 |
| 0.339 |
| 1,675 |
| 1,516 |
| 0.427 |
| 647 |
|
North Mara |
| (proven and probable) |
| 30,505 |
| 0.099 |
| 3,031 |
| 36,461 |
| 0.099 |
| 3,594 |
|
|
| (mineral resource) |
| 19,046 |
| 0.063 |
| 1,191 |
| 12,537 |
| 0.064 |
| 801 |
|
Buzwagi |
| (proven and probable) |
| 65,088 |
| 0.050 |
| 3,284 |
| 72,687 |
| 0.049 |
| 3,593 |
|
|
| (mineral resource) |
| 20,371 |
| 0.043 |
| 886 |
| 19,993 |
| 0.030 |
| 608 |
|
Tulawaka (70%) |
| (proven and probable) |
| 514 |
| 0.156 |
| 80 |
| 739 |
| 0.307 |
| 227 |
|
|
| (mineral resource) |
| 267 |
| 0.330 |
| 88 |
| 178 |
| 0.281 |
| 50 |
|
Other |
| (proven and probable) |
| 538 |
| 0.468 |
| 252 |
| 346 |
| 0.419 |
| 145 |
|
|
| (mineral resource) |
| — |
| — |
| — |
| — |
| — |
| — |
|
Total |
| (proven and probable) |
| 2,980,703 |
| 0.046 |
| 138,506 |
| 2,111,583 |
| 0.059 |
| 124,588 |
|
|
| (mineral resource) |
| 2,367,126 |
| 0.027 |
| 65,040 |
| 1,274,870 |
| 0.040 |
| 50,595 |
|
(1) Resources which are not reserves do not have demonstrated economic viability.
(2) See accompanying footnote #1.
143
Gold Mineral Reserves(1)
|
| Proven |
| Probable |
| Total |
| ||||||||||||
|
|
|
|
|
| Contained |
|
|
|
|
| Contained |
|
|
|
|
| Contained |
|
As at December 31, 2008 |
| Tons |
| Grade |
| ounces |
| Tons |
| Grade |
| ounces |
| Tons |
| Grade |
| ounces |
|
Based on attributable ounces |
| (000s) |
| (oz/ton) |
| (000s) |
| (000s) |
| (oz/ton) |
| (000s) |
| (000s) |
| (oz/ton) |
| (000s) |
|
North America |
|
|
|
|
|
|
|
|
|
|
|
|
|
|
|
|
|
|
|
Goldstrike Open Pit |
| 56,404 |
| 0.113 |
| 6,397 |
| 29,850 |
| 0.131 |
| 3,897 |
| 86,254 |
| 0.119 |
| 10,294 |
|
Goldstrike Underground |
| 2,815 |
| 0.461 |
| 1,299 |
| 4,108 |
| 0.303 |
| 1,246 |
| 6,923 |
| 0.368 |
| 2,545 |
|
Goldstrike Property Total |
| 59,219 |
| 0.130 |
| 7,696 |
| 33,958 |
| 0.151 |
| 5,143 |
| 93,177 |
| 0.138 |
| 12,839 |
|
Pueblo Viejo (60%) |
| 7,658 |
| 0.103 |
| 787 |
| 140,288 |
| 0.090 |
| 12,653 |
| 147,946 |
| 0.091 |
| 13,440 |
|
Cortez (100%)(2) |
| 19,379 |
| 0.077 |
| 1,491 |
| 202,746 |
| 0.059 |
| 11,893 |
| 222,125 |
| 0.060 |
| 13,384 |
|
Bald Mountain |
| 77,326 |
| 0.019 |
| 1,491 |
| 80,349 |
| 0.017 |
| 1,355 |
| 157,675 |
| 0.018 |
| 2,846 |
|
Turquoise Ridge (75%) |
| 5,746 |
| 0.507 |
| 2,914 |
| 2,215 |
| 0.484 |
| 1,071 |
| 7,961 |
| 0.501 |
| 3,985 |
|
Round Mountain (50%) |
| 34,305 |
| 0.021 |
| 723 |
| 58,276 |
| 0.015 |
| 898 |
| 92,581 |
| 0.018 |
| 1,621 |
|
Ruby Hill |
| 846 |
| 0.056 |
| 47 |
| 17,998 |
| 0.044 |
| 784 |
| 18,844 |
| 0.044 |
| 831 |
|
Hemlo (50%) |
| 5,993 |
| 0.076 |
| 455 |
| 1,082 |
| 0.101 |
| 109 |
| 7,075 |
| 0.080 |
| 564 |
|
Marigold (33%) |
| 9,929 |
| 0.023 |
| 228 |
| 15,533 |
| 0.018 |
| 283 |
| 25,462 |
| 0.020 |
| 511 |
|
Golden Sunlight |
| 2,188 |
| 0.077 |
| 168 |
| 6,477 |
| 0.057 |
| 372 |
| 8,665 |
| 0.062 |
| 540 |
|
South America |
|
|
|
|
|
|
|
|
|
|
|
|
|
|
|
|
|
|
|
Cerro Casale (51%)(3) |
| 126,562 |
| 0.019 |
| 2,375 |
| 485,711 |
| 0.017 |
| 8,456 |
| 612,273 |
| 0.018 |
| 10,831 |
|
Pascua-Lama |
| 42,680 |
| 0.050 |
| 2,132 |
| 397,546 |
| 0.039 |
| 15,674 |
| 440,226 |
| 0.040 |
| 17,806 |
|
Veladero |
| 31,720 |
| 0.025 |
| 804 |
| 459,596 |
| 0.025 |
| 11,429 |
| 491,316 |
| 0.025 |
| 12,233 |
|
Lagunas Norte |
| 13,515 |
| 0.045 |
| 606 |
| 217,120 |
| 0.038 |
| 8,343 |
| 230,635 |
| 0.039 |
| 8,949 |
|
Pierina |
| 10,900 |
| 0.026 |
| 286 |
| 18,282 |
| 0.022 |
| 397 |
| 29,182 |
| 0.023 |
| 683 |
|
Australia Pacific |
|
|
|
|
|
|
|
|
|
|
|
|
|
|
|
|
|
|
|
Porgera (95%) |
| 48,836 |
| 0.097 |
| 4,758 |
| 30,139 |
| 0.102 |
| 3,070 |
| 78,975 |
| 0.099 |
| 7,828 |
|
Kalgoorlie (50%) |
| 37,486 |
| 0.049 |
| 1,854 |
| 40,030 |
| 0.063 |
| 2,506 |
| 77,516 |
| 0.056 |
| 4,360 |
|
Cowal |
| 9,960 |
| 0.025 |
| 247 |
| 69,540 |
| 0.037 |
| 2,548 |
| 79,500 |
| 0.035 |
| 2,795 |
|
Plutonic |
| 298 |
| 0.181 |
| 54 |
| 5,530 |
| 0.179 |
| 988 |
| 5,828 |
| 0.179 |
| 1,042 |
|
Kanowna |
| 3,189 |
| 0.217 |
| 692 |
| 3,105 |
| 0.182 |
| 564 |
| 6,294 |
| 0.200 |
| 1,256 |
|
Darlot |
| 2,900 |
| 0.118 |
| 341 |
| 1,494 |
| 0.145 |
| 216 |
| 4,394 |
| 0.127 |
| 557 |
|
Granny Smith |
| 1,067 |
| 0.105 |
| 112 |
| 2,553 |
| 0.148 |
| 379 |
| 3,620 |
| 0.136 |
| 491 |
|
Lawlers |
| 261 |
| 0.084 |
| 22 |
| 2,223 |
| 0.149 |
| 331 |
| 2,484 |
| 0.142 |
| 353 |
|
Henty |
| — |
| — |
| — |
| 402 |
| 0.229 |
| 92 |
| 402 |
| 0.229 |
| 92 |
|
Osborne |
| 1,282 |
| 0.026 |
| 33 |
| 892 |
| 0.013 |
| 12 |
| 2,174 |
| 0.021 |
| 45 |
|
Africa |
|
|
|
|
|
|
|
|
|
|
|
|
|
|
|
|
|
|
|
Bulyanhulu |
| 2,122 |
| 0.313 |
| 664 |
| 35,606 |
| 0.318 |
| 11,313 |
| 37,728 |
| 0.317 |
| 11,977 |
|
North Mara |
| 17,944 |
| 0.102 |
| 1,824 |
| 12,561 |
| 0.096 |
| 1,207 |
| 30,505 |
| 0.099 |
| 3,031 |
|
Buzwagi |
| 833 |
| 0.047 |
| 39 |
| 64,255 |
| 0.051 |
| 3,245 |
| 65,088 |
| 0.050 |
| 3,284 |
|
Tulawaka (70%) |
| 382 |
| 0.079 |
| 30 |
| 132 |
| 0.379 |
| 50 |
| 514 |
| 0.156 |
| 80 |
|
Other |
| — |
| — |
| — |
| 538 |
| 0.468 |
| 252 |
| 538 |
| 0.468 |
| 252 |
|
Total |
| 574,526 |
| 0.057 |
| 32,873 |
| 2,406,177 |
| 0.044 |
| 105,633 |
| 2,980,703 |
| 0.046 |
| 138,506 |
|
Copper Mineral Reserves(1)
|
| Proven |
| Probable |
| Total |
| ||||||||||||
|
|
|
|
|
| Contained |
|
|
|
|
| Contained |
|
|
|
|
| Contained |
|
As at December 31, 2008 |
| Tons |
| Grade |
| lbs |
| Tons |
| Grade |
| lbs |
| Tons |
| Grade |
| lbs |
|
Based on attributable pounds |
| (000s) |
| (%) |
| (millions) |
| (000s) |
| (%) |
| (millions) |
| (000s) |
| (%) |
| (millions) |
|
Zaldívar |
| 241,550 |
| 0.555 |
| 2,681 |
| 351,041 |
| 0.515 |
| 3,613 |
| 592,591 |
| 0.531 |
| 6,294 |
|
Osborne |
| 1,282 |
| 2.652 |
| 68 |
| 892 |
| 1.682 |
| 30 |
| 2,174 |
| 2.254 |
| 98 |
|
Total |
| 242,832 |
| 0.566 |
| 2,749 |
| 351,933 |
| 0.518 |
| 3,643 |
| 594,765 |
| 0.537 |
| 6,392 |
|
(1) See accompanying footnote #1.
(2) See accompanying footnote #2.
(3) See accompanying footnote #3.
144
Gold Mineral Resources(1),(2)
|
| Measured (M) |
| Indicated (I) |
| (M) + (I) |
| Inferred |
| ||||||||||||
|
|
|
|
|
| Contained |
|
|
|
|
| Contained |
| Contained |
|
|
|
|
| Contained |
|
As at December 31, 2008 |
| Tons |
| Grade |
| ounces |
| Tons |
| Grade |
| ounces |
| ounces |
| Tons |
| Grade |
| ounces |
|
Based on attributable ounces |
| (000s) |
| (oz/ton) |
| (000s) |
| (000s) |
| (oz/ton) |
| (000s) |
| (000s) |
| (000s) |
| (oz/ton) |
| (000s) |
|
North America |
|
|
|
|
|
|
|
|
|
|
|
|
|
|
|
|
|
|
|
|
|
Goldstrike Open Pit |
| 11,584 |
| 0.056 |
| 654 |
| 4,167 |
| 0.051 |
| 214 |
| 868 |
| 479 |
| 0.092 |
| 44 |
|
Goldstrike Underground |
| 1,465 |
| 0.362 |
| 531 |
| 3,002 |
| 0.304 |
| 913 |
| 1,444 |
| 3,424 |
| 0.393 |
| 1,346 |
|
Goldstrike Property Total |
| 13,049 |
| 0.091 |
| 1,185 |
| 7,169 |
| 0.157 |
| 1,127 |
| 2,312 |
| 3,903 |
| 0.356 |
| 1,390 |
|
Pueblo Viejo (60%) |
| 2,613 |
| 0.054 |
| 142 |
| 74,455 |
| 0.056 |
| 4,188 |
| 4,330 |
| 7,823 |
| 0.059 |
| 461 |
|
Cortez (100%)(3) |
| 5,997 |
| 0.030 |
| 177 |
| 75,091 |
| 0.047 |
| 3,566 |
| 3,743 |
| 29,912 |
| 0.129 |
| 3,848 |
|
Bald Mountain |
| 28,951 |
| 0.023 |
| 660 |
| 61,423 |
| 0.017 |
| 1,058 |
| 1,718 |
| 71,004 |
| 0.021 |
| 1,525 |
|
Turquoise Ridge (75%) |
| 1,708 |
| 0.436 |
| 745 |
| 759 |
| 0.433 |
| 329 |
| 1,074 |
| 3,330 |
| 0.505 |
| 1,683 |
|
Round Mountain (50%) |
| 7,649 |
| 0.021 |
| 163 |
| 20,921 |
| 0.017 |
| 366 |
| 529 |
| 6,491 |
| 0.012 |
| 77 |
|
Ruby Hill |
| 415 |
| 0.048 |
| 20 |
| 11,504 |
| 0.040 |
| 460 |
| 480 |
| 3,495 |
| 0.037 |
| 129 |
|
Hemlo (50%) |
| 939 |
| 0.063 |
| 59 |
| 375 |
| 0.120 |
| 45 |
| 104 |
| 1,410 |
| 0.134 |
| 189 |
|
Marigold (33%) |
| 3,268 |
| 0.017 |
| 55 |
| 12,405 |
| 0.016 |
| 198 |
| 253 |
| 16,461 |
| 0.014 |
| 229 |
|
Golden Sunlight |
| 57 |
| 0.070 |
| 4 |
| 74 |
| 0.054 |
| 4 |
| 8 |
| 1,050 |
| 0.043 |
| 45 |
|
South Arturo (60%) |
| — |
| — |
| — |
| 22,114 |
| 0.045 |
| 987 |
| 987 |
| 1,952 |
| 0.013 |
| 26 |
|
Donlin Creek (50%) |
| 5,443 |
| 0.073 |
| 397 |
| 264,053 |
| 0.066 |
| 17,340 |
| 17,737 |
| 38,098 |
| 0.064 |
| 2,428 |
|
South America |
|
|
|
|
|
|
|
|
|
|
|
|
|
|
|
|
|
|
|
|
|
Cerro Casale (51%)(4) |
| 15,281 |
| 0.011 |
| 162 |
| 179,441 |
| 0.012 |
| 2,210 |
| 2,372 |
| 129,204 |
| 0.011 |
| 1,476 |
|
Pascua-Lama |
| 12,505 |
| 0.039 |
| 487 |
| 118,989 |
| 0.035 |
| 4,200 |
| 4,687 |
| 16,423 |
| 0.036 |
| 593 |
|
Veladero |
| 1,944 |
| 0.014 |
| 28 |
| 48,247 |
| 0.014 |
| 678 |
| 706 |
| 79,038 |
| 0.009 |
| 683 |
|
Lagunas Norte |
| 1,557 |
| 0.024 |
| 38 |
| 54,016 |
| 0.023 |
| 1,240 |
| 1,278 |
| 8,171 |
| 0.043 |
| 353 |
|
Pierina |
| 2,320 |
| 0.015 |
| 34 |
| 8,821 |
| 0.014 |
| 122 |
| 156 |
| 134 |
| 0.022 |
| 3 |
|
Australia Pacific |
|
|
|
|
|
|
|
|
|
|
|
|
|
|
|
|
|
|
|
|
|
Porgera (95%) |
| 26,960 |
| 0.076 |
| 2,042 |
| 34,065 |
| 0.058 |
| 1,989 |
| 4,031 |
| 17,800 |
| 0.130 |
| 2,306 |
|
Kalgoorlie (50%) |
| 2,964 |
| 0.060 |
| 177 |
| 5,647 |
| 0.059 |
| 335 |
| 512 |
| 1,625 |
| 0.135 |
| 220 |
|
Cowal |
| — |
| — |
| — |
| 31,463 |
| 0.034 |
| 1,072 |
| 1,072 |
| 1,458 |
| 0.030 |
| 44 |
|
Plutonic |
| 118 |
| 0.186 |
| 22 |
| 10,919 |
| 0.157 |
| 1,711 |
| 1,733 |
| 4,888 |
| 0.246 |
| 1,204 |
|
Kanowna |
| 2,781 |
| 0.157 |
| 438 |
| 2,453 |
| 0.172 |
| 421 |
| 859 |
| 8,122 |
| 0.117 |
| 950 |
|
Darlot |
| 512 |
| 0.133 |
| 68 |
| 3,086 |
| 0.124 |
| 383 |
| 451 |
| 137 |
| 0.212 |
| 29 |
|
Granny Smith |
| 470 |
| 0.172 |
| 81 |
| 2,044 |
| 0.167 |
| 342 |
| 423 |
| 5,354 |
| 0.237 |
| 1,267 |
|
Lawlers |
| 53 |
| 0.113 |
| 6 |
| 6,738 |
| 0.151 |
| 1,017 |
| 1,023 |
| 1,889 |
| 0.136 |
| 256 |
|
Henty |
| — |
| — |
| — |
| 199 |
| 0.231 |
| 46 |
| 46 |
| 35 |
| 0.200 |
| 7 |
|
Osborne |
| 1,175 |
| 0.023 |
| 27 |
| 2,235 |
| 0.028 |
| 62 |
| 89 |
| 3,527 |
| 0.020 |
| 71 |
|
Reko Diq (37.5%) |
| 639,161 |
| 0.008 |
| 4,968 |
| 485,910 |
| 0.007 |
| 3,519 |
| 8,487 |
| 895,089 |
| 0.009 |
| 8,398 |
|
Africa |
|
|
|
|
|
|
|
|
|
|
|
|
|
|
|
|
|
|
|
|
|
Bulyanhulu |
| — |
| — |
| — |
| 4,936 |
| 0.339 |
| 1,675 |
| 1,675 |
| 12,415 |
| 0.370 |
| 4,592 |
|
North Mara |
| 9,209 |
| 0.061 |
| 563 |
| 9,837 |
| 0.064 |
| 628 |
| 1,191 |
| 682 |
| 0.063 |
| 43 |
|
Buzwagi |
| 1 |
| — |
| — |
| 20,370 |
| 0.043 |
| 886 |
| 886 |
| 983 |
| 0.039 |
| 38 |
|
Tulawaka (70%) |
| — |
| — |
| — |
| 267 |
| 0.330 |
| 88 |
| 88 |
| 44 |
| 0.364 |
| 16 |
|
Other |
| — |
| — |
| — |
| — |
| — |
| — |
| — |
| 592 |
| 0.294 |
| 174 |
|
Total |
| 787,100 |
| 0.016 |
| 12,748 |
| 1,580,026 |
| 0.033 |
| 52,292 |
| 65,040 |
| 1,372,539 |
| 0.025 |
| 34,753 |
|
Copper Mineral Resources(1),(2)
|
| Measured (M) |
| Indicated (I) |
| (M) + (I) |
| Inferred |
| ||||||||||||
|
|
|
|
|
| Contained |
|
|
|
|
| Contained |
| Contained |
|
|
|
|
| Contained |
|
As at December 31, 2008 |
| Tons |
| Grade |
| lbs |
| Tons |
| Grade |
| lbs |
| lbs |
| Tons |
| Grade |
| lbs |
|
Based on attributable pounds |
| (000s) |
| (%) |
| (millions) |
| (000s) |
| (%) |
| (millions) |
| (millions) |
| (000s) |
| (%) |
| (millions) |
|
Zaldívar |
| 27,416 |
| 0.474 |
| 260 |
| 72,249 |
| 0.430 |
| 621 |
| 881 |
| 135,182 |
| 0.470 |
| 1,271 |
|
Osborne |
| 1,175 |
| 1.830 |
| 43 |
| 2,235 |
| 1.655 |
| 74 |
| 117 |
| 3,527 |
| 1.375 |
| 97 |
|
Reko Diq (37.5%) |
| 639,161 |
| 0.535 |
| 6,842 |
| 485,910 |
| 0.477 |
| 4,631 |
| 11,473 |
| 895,089 |
| 0.478 |
| 8,549 |
|
Total |
| 667,752 |
| 0.535 |
| 7,145 |
| 560,394 |
| 0.475 |
| 5,326 |
| 12,471 |
| 1,033,798 |
| 0.480 |
| 9,917 |
|
(1) Resources which are not reserves do not have demonstrated economic viability.
(2) See accompanying footnote #1.
(3) See accompanying footnote #2.
(4) See accompanying footnote #3.
145
Contained Silver Within Reported Gold Reserves(1)
|
| In proven |
| In probable |
| Total |
| ||||||||||||||
For the year ended |
|
|
|
|
| Contained |
|
|
|
|
| Contained |
|
|
|
|
| Contained |
| Process |
|
December 31, 2008 |
| Tons |
| Grade |
| ounces |
| Tons |
| Grade |
| ounces |
| Tons |
| Grade |
| ounces |
| recovery |
|
Based on attributable ounces |
| (000s) |
| (oz/ton) |
| (000s) |
| (000s) |
| (oz/ton) |
| (000s) |
| (000s) |
| (oz/ton) |
| (000s) |
| % |
|
North America |
|
|
|
|
|
|
|
|
|
|
|
|
|
|
|
|
|
|
|
|
|
Pueblo Viejo (60%) |
| 7,658 |
| 0.66 |
| 5,052 |
| 140,288 |
| 0.53 |
| 73,733 |
| 147,946 |
| 0.53 |
| 78,785 |
| 87.1 | % |
South America |
|
|
|
|
|
|
|
|
|
|
|
|
|
|
|
|
|
|
|
|
|
Cerro Casale (51%)(2) |
| 126,562 |
| 0.06 |
| 7,302 |
| 485,711 |
| 0.05 |
| 22,810 |
| 612,273 |
| 0.05 |
| 30,112 |
| 46.0 | % |
Pascua-Lama |
| 42,680 |
| 1.77 |
| 75,544 |
| 397,546 |
| 1.62 |
| 642,080 |
| 440,226 |
| 1.63 |
| 717,624 |
| 78.5 | % |
Lagunas Norte |
| 13,515 |
| 0.11 |
| 1,527 |
| 217,120 |
| 0.11 |
| 22,800 |
| 230,635 |
| 0.11 |
| 24,327 |
| 20.3 | % |
Veladero |
| 31,720 |
| 0.40 |
| 12,561 |
| 459,596 |
| 0.46 |
| 213,629 |
| 491,316 |
| 0.46 |
| 226,190 |
| 6.4 | % |
Pierina |
| 10,900 |
| 0.27 |
| 2,924 |
| 18,282 |
| 0.20 |
| 3,728 |
| 29,182 |
| 0.23 |
| 6,652 |
| 43.9 | % |
Africa |
|
|
|
|
|
|
|
|
|
|
|
|
|
|
|
|
|
|
|
|
|
Bulyanhulu |
| 2,122 |
| 0.18 |
| 390 |
| 35,606 |
| 0.25 |
| 9,073 |
| 37,728 |
| 0.25 |
| 9,463 |
| 65.0 | % |
Total |
| 235,157 |
| 0.45 |
| 105,300 |
| 1,754,149 |
| 0.56 |
| 987,853 |
| 1,989,306 |
| 0.55 |
| 1,093,153 |
| 61.7 | % |
(1) Silver is accounted for as a by-product credit against reported or projected gold production costs.
(2) See accompanying footnote #3.
Contained Copper Within Reported Gold Reserves(1)
|
| In proven |
| In probable |
| Total |
| ||||||||||||||
For the year ended |
|
|
|
|
| Contained |
|
|
|
|
| Contained |
|
|
|
|
| Contained |
| Process |
|
December 31, 2008 |
| Tons |
| Grade |
| lbs |
| Tons |
| Grade |
| lbs |
| Tons |
| Grade |
| lbs |
| recovery |
|
Based on attributable pounds |
| (000s) |
| (%) |
| (millions) |
| (000s) |
| (%) |
| (millions) |
| (000s) |
| (%) |
| (millions) |
| % |
|
North America |
|
|
|
|
|
|
|
|
|
|
|
|
|
|
|
|
|
|
|
|
|
Pueblo Viejo (60%) |
| 7,658 |
| 0.119 |
| 18.2 |
| 140,288 |
| 0.091 |
| 254.8 |
| 147,946 |
| 0.092 |
| 273.0 |
| 79.5 | % |
South America |
|
|
|
|
|
|
|
|
|
|
|
|
|
|
|
|
|
|
|
|
|
Cerro Casale (51%)(2) |
| 126,562 |
| 0.192 |
| 486.2 |
| 485,711 |
| 0.229 |
| 2,221.0 |
| 612,273 |
| 0.221 |
| 2,707.2 |
| 82.8 | % |
Pascua-Lama |
| 42,680 |
| 0.093 |
| 79.6 |
| 397,546 |
| 0.072 |
| 569.9 |
| 440,226 |
| 0.074 |
| 649.5 |
| 57.6 | % |
Africa |
|
|
|
|
|
|
|
|
|
|
|
|
|
|
|
|
|
|
|
|
|
Buzwagi |
| 833 |
| 0.006 |
| 0.1 |
| 64,255 |
| 0.137 |
| 176.5 |
| 65,088 |
| 0.136 |
| 176.6 |
| 76.4 | % |
Bulyanhulu |
| 2,122 |
| 0.339 |
| 14.4 |
| 35,606 |
| 0.604 |
| 429.9 |
| 37,728 |
| 0.589 |
| 444.3 |
| 84.9 | % |
Total |
| 179,855 |
| 0.166 |
| 598.5 |
| 1,123,406 |
| 0.163 |
| 3,652.1 |
| 1,303,261 |
| 0.163 |
| 4,250.6 |
| 72.4 | % |
(1) Copper is accounted for as a by-product credit against reported or projected gold production costs.
(2) See accompanying footnote #3.
146
Contained Silver Within Reported Gold Resources(1)
|
| Measured (M) |
| Indicated (I) |
| (M) + (I) |
| Inferred |
| ||||||||||||
|
|
|
|
|
| Contained |
|
|
|
|
| Contained |
| Contained |
|
|
|
|
| Contained |
|
For the year ended December 31, 2008 |
| Tons |
| Grade |
| ounces |
| Tons |
| Grade |
| ounces |
| ounces |
| Tons |
| Grade |
| ounces |
|
Based on attributable ounces |
| (000s) |
| (oz/ton) |
| (000s) |
| (000s) |
| (oz/ton) |
| (000s) |
| (000s) |
| (000s) |
| (oz/ton) |
| (000s) |
|
North America |
|
|
|
|
|
|
|
|
|
|
|
|
|
|
|
|
|
|
|
|
|
Pueblo Viejo (60%) |
| 2,613 |
| 0.37 |
| 969 |
| 74,455 |
| 0.33 |
| 24,591 |
| 25,560 |
| 7,823 |
| 0.63 |
| 4,932 |
|
South America |
|
|
|
|
|
|
|
|
|
|
|
|
|
|
|
|
|
|
|
|
|
Cerro Casale (51%)(2) |
| 15,281 |
| 0.04 |
| 569 |
| 179,441 |
| 0.03 |
| 6,061 |
| 6,630 |
| 129,204 |
| 0.03 |
| 3,825 |
|
Pascua-Lama |
| 12,505 |
| 0.69 |
| 8,625 |
| 118,989 |
| 0.66 |
| 79,064 |
| 87,689 |
| 16,423 |
| 0.69 |
| 11,397 |
|
Lagunas Norte |
| 1,557 |
| 0.12 |
| 191 |
| 54,016 |
| 0.09 |
| 4,813 |
| 5,004 |
| 8,171 |
| 0.08 |
| 673 |
|
Veladero |
| 1,944 |
| 0.39 |
| 763 |
| 48,247 |
| 0.35 |
| 17,017 |
| 17,780 |
| 79,038 |
| 0.33 |
| 25,731 |
|
Pierina |
| 2,320 |
| 0.35 |
| 802 |
| 8,821 |
| 0.33 |
| 2,912 |
| 3,714 |
| 134 |
| 0.11 |
| 15 |
|
Africa |
|
|
|
|
|
|
|
|
|
|
|
|
|
|
|
|
|
|
|
|
|
Bulyanhulu |
| — |
| — |
| — |
| 4,936 |
| 0.32 |
| 1,600 |
| 1,600 |
| 12,415 |
| 0.29 |
| 3,644 |
|
Total |
| 36,220 |
| 0.33 |
| 11,919 |
| 488,905 |
| 0.28 |
| 136,058 |
| 147,977 |
| 253,208 |
| 0.20 |
| 50,217 |
|
Contained Copper Within Reported Gold Resources(1)
|
| In measured (M) |
| In indicated (I) |
| (M) + (I) |
| Inferred |
| ||||||||||||
|
|
|
|
|
| Contained |
|
|
|
|
| Contained |
| Contained |
|
|
|
|
| Contained |
|
For the year ended December 31, 2008 |
| Tons |
| Grade |
| lbs |
| Tons |
| Grade |
| lbs |
| lbs |
| Tons |
| Grade |
| lbs |
|
Based on attributable pounds |
| (000s) |
| (%) |
| (millions) |
| (000s) |
| (%) |
| (millions) |
| (millions) |
| (000s) |
| (%) |
| (millions) |
|
North America |
|
|
|
|
|
|
|
|
|
|
|
|
|
|
|
|
|
|
|
|
|
Pueblo Viejo (60%) |
| 2,613 |
| 0.086 |
| 4.5 |
| 74,455 |
| 0.072 |
| 107.9 |
| 112.4 |
| 7,823 |
| 0.040 |
| 6.2 |
|
South America |
|
|
|
|
|
|
|
|
|
|
|
|
|
|
|
|
|
|
|
|
|
Cerro Casale (51%)(2) |
| 15,281 |
| 0.159 |
| 48.6 |
| 179,441 |
| 0.194 |
| 697.1 |
| 745.7 |
| 129,204 |
| 0.194 |
| 500.5 |
|
Pascua-Lama |
| 12,505 |
| 0.080 |
| 20.1 |
| 118,989 |
| 0.068 |
| 160.9 |
| 181.0 |
| 16,423 |
| 0.030 |
| 10.0 |
|
Africa |
|
|
|
|
|
|
|
|
|
|
|
|
|
|
|
|
|
|
|
|
|
Buzwagi |
| 1 |
| 0.001 |
| 0.0 |
| 20,370 |
| 0.145 |
| 59.2 |
| 59.2 |
| 237 |
| 0.148 |
| 0.7 |
|
Total |
| 30,400 |
| 0.120 |
| 73.2 |
| 393,255 |
| 0.130 |
| 1,025.1 |
| 1,098.3 |
| 153,687 |
| 0.168 |
| 517.4 |
|
Nickel Mineral Resources(1)
|
| Measured (M) |
| Indicated (I) |
| (M) + (I) |
| Inferred |
| ||||||||||||
|
|
|
|
|
| Contained |
|
|
|
|
| Contained |
| Contained |
|
|
|
|
| Contained |
|
For the year ended December 31, 2008 |
| Tons |
| Grade |
| lbs |
| Tons |
| Grade |
| lbs |
| lbs |
| Tons |
| Grade |
| lbs |
|
Based on attributable pounds |
| (000s) |
| (%) |
| (millions) |
| (000s) |
| (%) |
| (millions) |
| (millions) |
| (000s) |
| (%) |
| (millions) |
|
Africa |
|
|
|
|
|
|
|
|
|
|
|
|
|
|
|
|
|
|
|
|
|
Kabanga (50%) |
| — |
| — |
| — |
| 5,346 |
| 2.376 |
| 254.0 |
| 254.0 |
| 20,007 |
| 2.802 |
| 1,121.0 |
|
(1) Resources, which are not reserves, do not have demonstrated economic viability.
(2) See accompanying footnote #3.
147
Platinum Mineral Resources(1)
|
| Measured (M) |
| Indicated (I) |
| (M) + (I) |
| Inferred |
| ||||||||||||
|
|
|
|
|
| Contained |
|
|
|
|
| Contained |
| Contained |
|
|
|
|
| Contained |
|
For the year ended December 31, 2008 |
| Tons |
| Grade |
| ounces |
| Tons |
| Grade |
| ounces |
| ounces |
| Tons |
| Grade |
| ounces |
|
Based on attributable ounces |
| (000s) |
| (oz/ton) |
| (000s) |
| (000s) |
| (oz/ton) |
| (000s) |
| (000s) |
| (000s) |
| (oz/ton) |
| (000s) |
|
Russia |
|
|
|
|
|
|
|
|
|
|
|
|
|
|
|
|
|
|
|
|
|
Fedorova (50%) |
| — |
| — |
| — |
| 189,947 |
| 0.01 |
| 1,136 |
| 1,136 |
| 17,433 |
| 0.01 |
| 88 |
|
Africa |
|
|
|
|
|
|
|
|
|
|
|
|
|
|
|
|
|
|
|
|
|
Sedibelo (10%) |
| — |
| — |
| — |
| 5,841 |
| 0.08 |
| 440 |
| 440 |
| 3,528 |
| 0.10 |
| 352 |
|
Total |
| — |
| — |
| — |
| 195,788 |
| 0.01 |
| 1,576 |
| 1,576 |
| 20,961 |
| 0.02 |
| 440 |
|
Palladium Mineral Resources(1)
|
| Measured (M) |
| Indicated (I) |
| (M) + (I) |
| Inferred |
| ||||||||||||
|
|
|
|
|
| Contained |
|
|
|
|
| Contained |
| Contained |
|
|
|
|
| Contained |
|
For the year ended December 31, 2008 |
| Tons |
| Grade |
| ounces |
| Tons |
| Grade |
| ounces |
| ounces |
| Tons |
| Grade |
| ounces |
|
Based on attributable ounces |
| (000s) |
| (oz/ton) |
| (000s) |
| (000s) |
| (oz/ton) |
| (000s) |
| (000s) |
| (000s) |
| (oz/ton) |
| (000s) |
|
Russia |
|
|
|
|
|
|
|
|
|
|
|
|
|
|
|
|
|
|
|
|
|
Fedorova (50%) |
| — |
| — |
| — |
| 189,947 |
| 0.03 |
| 5,100 |
| 5,100 |
| 17,433 |
| 0.03 |
| 465 |
|
Africa |
|
|
|
|
|
|
|
|
|
|
|
|
|
|
|
|
|
|
|
|
|
Sedibelo (10%) |
| — |
| — |
| — |
| 5,841 |
| 0.04 |
| 206 |
| 206 |
| 3,528 |
| 0.05 |
| 177 |
|
Total |
| — |
| — |
| — |
| 195,788 |
| 0.03 |
| 5,306 |
| 5,306 |
| 20,961 |
| 0.03 |
| 642 |
|
(1) Resources, which are not reserves, do not have demonstrated economic viability.
Mineral Reserves and Resources Notes
1. Mineral reserves (“reserves”) and mineral resources (“resources”) have been calculated as at December 31, 2008 in accordance with National Instrument 43-101 as required by Canadian securities regulatory authorities. For United States reporting purposes, Industry Guide 7, (under the Securities and Exchange Act of 1934), as interpreted by Staff of the SEC, applies different standards in order to classify mineralization as a reserve. Accordingly, for U.S. reporting purposes, Cerro Casale is classified as mineralized material and approximately 600,000 ounces of reserves for Pueblo Viejo (Barrick’s 60% interest) are classified as mineralized material. In addition, while the terms “measured”, “indicated” and “inferred” mineral resources are required pursuant to National Instrument 43-101, the U.S. Securities and Exchange Commission does not recognize such terms. Canadian standards differ significantly from the requirements of the U.S. Securities and Exchange Commission, and mineral resource information contained herein is not comparable to similar information regarding mineral reserves disclosed in accordance with the requirements of the U.S. Securities and Exchange Commission. U.S. investors should understand that “inferred” mineral resources have a great amount of uncertainty as to their existence and great uncertainty as to their economic and legal feasibility. In addition, U.S. investors are cautioned not to assume that any part or all of Barrick’s mineral resources constitute or will be converted into reserves. Calculations have been prepared by employees of Barrick, its joint venture partners or its joint venture operating companies, as applicable, under the supervision of Ivan Mullany, Senior Director, Metallurgy and Process Development, Technical Services of Barrick, Rick Allan, Senior Director, Mining of Barrick, and Rick Sims, Senior Director, Resources and Reserves of Barrick. Reserves have been calculated using an assumed long-term average gold price of $US 725 ($Aus. 850) per ounce, a silver price of $US 13.50 per ounce, a copper price of $US 2.00 per pound and exchange rates of $1.10 $Can/$US and $0.85 $US/$Aus. Reserve calculations incorporate current and/or expected mine plans and cost levels at each property. Varying cut-off grades have been used depending on the mine and type of ore contained in the reserves. Barrick’s normal data verification procedures have been employed in connection with the calculations. Resources as at December 31, 2008 have been estimated using varying cut-off grades, depending on both the type of mine or project, its maturity and ore types at each property. For a breakdown of reserves and resources by category and for a more detailed description of the key assumptions, parameters and methods used in calculating Barrick’s reserves and resources, see Barrick’s most recent Annual Information Form/Form 40-F on file with Canadian provincial securities regulatory authorities and the U.S. Securities and Exchange Commission.
2. In March 2008, Barrick increased its interest in the Cortez property from 60% to 100%. 2008 reserves and resources for the Cortez property reflect Barrick’s 100% interest. 2007 reserves and resources for the Cortez property reflect Barrick’s then 60% interest.
3. In December 2007, Barrick acquired a 51% interest in the Cerro Casale project through its acquisition of Arizona Star Resources Corp. 2008 reserves and resources for the Cerro Casale project reflect Barrick’s 51% interest. 2007 reserves and resources do not reflect Barrick’s acquisition of its 51% interest in the Cerro Casale project.
148
Corporate Governance and Committees of the Board
Corporate Governance
Over the past several years, there has been an increased focus on corporate governance in both the United States and Canada. Among other regulatory initiatives, the New York Stock Exchange added corporate governance standards to its listing rules. Although, as a regulatory matter, the vast majority of the NYSE corporate governance standards are not directly applicable to Barrick as a Canadian company, Barrick has implemented a number of structures and procedures to comply with the NYSE standards. There are no significant differences between Barrick’s corporate governance practices and the NYSE standards applicable to U.S. companies.
The Board of Directors has approved a set of Corporate Governance Guidelines to promote the effective functioning of the Board of Directors and its Committees and to set forth a common set of expectations as to how the Board should manage its affairs and perform its responsibilities. Barrick has also adopted a Code of Business Conduct and Ethics that is applicable to all directors, officers and employees of Barrick. In conjunction with the adoption of the Code, Barrick established a toll-free compliance hotline to allow for anonymous reporting of any suspected Code violations, including concerns regarding accounting, internal accounting controls or other auditing matters. A copy of the Corporate Governance Guidelines, the Code of Business Conduct and Ethics and the mandates of the Board of Directors and each of the Committees of the Board, including the Audit Committee, the Compensation Committee and the Corporate Governance and Nominating Committee, is posted on Barrick’s website at www.barrick.com and is available in print from the Company to any shareholder upon request.
Committees of the Board
Audit Committee
(S.J. Shapiro, D.J. Carty, P.A. Crossgrove, R.M. Franklin)
Reviews the Company’s financial statements and management’s discussion and analysis of financial and operating results, and assists the Board in its oversight of the integrity of Barrick’s financial statements and other relevant public disclosures, the Company’s compliance with legal and regulatory requirements relating to financial reporting, the external auditors’ qualifications and independence, and the performance of the internal and external auditors.
Compensation Committee
(D.J. Carty, P.C. Godsoe, M.A. Cohen, J.B. Harvey, S.J. Shapiro)
Assists the Board in monitoring, reviewing and approving Barrick’s compensation policies and practices, and administering Barrick’s share compensation plans. The Committee is responsible for reviewing and recommending director and senior management compensation and for succession planning with respect to senior executives.
Corporate Governance and Nominating Committee
(M.A. Cohen, R.M. Franklin, P.C. Godsoe)
Assists the Board in establishing Barrick’s corporate governance policies and practices. The Committee also identifies individuals qualified to become members of the Board and reviews the composition and functioning of the Board and its Committees.
Environmental, Health and Safety Committee
(P.A. Crossgrove, C.W.D. Birchall, J.B. Harvey)
Reviews environmental and health and safety policies and programs, oversees the Company’s environmental and health and safety performance, and monitors current and future regulatory issues.
Finance Committee
(C.W.D. Birchall, H.L. Beck, A. Munk, G.C.Wilkins)
Reviews the Company’s investment strategies, hedging program and general debt and equity structure.
149
Shareholder Information
Barrick shares are traded on two stock exchanges:
New York
Toronto
Ticker Symbol
ABX
Number of Registered Shareholders
18,399
Index Listings
S&P/TSX Composite Index
S&P/TSX 60 Index
S&P Global 1200 Index
Philadelphia Gold/Silver Index
AMEX Gold Miners Index
Dow Jones Sustainability Index (DJSI) – North America
Dow Jones Sustainability Index (DJSI) – World
2008 Dividend per Share
US$0.40
Common Shares
(millions) |
|
|
|
Outstanding at December 31, 2008 |
| 873 | * |
|
|
|
|
Weighted average 2008 |
|
|
|
Basic |
| 872 | * |
Fully diluted |
| 885 | * |
The Company’s shares were split on a two-for-one basis in 1987, 1989 and 1993.
* Includes shares issuable upon conversion of Barrick Gold Inc. exchangeable shares.
Volume of Shares Traded
(millions) |
| 2008 |
| 2007 |
|
TSX |
| 1,154 |
| 683 |
|
NYSE |
| 1,153 |
| 715 |
|
Closing Price of Shares
December 31, 2008 |
|
|
| ||
TSX |
| C$ | 44.71 |
| |
NYSE |
| $ | 36.77 |
| |
Share Trading Information
Toronto Stock Exchange
|
| Share Volume |
|
|
|
|
|
|
|
|
| ||||||
|
| (millions) |
| High |
| Low |
| ||||||||||
Quarter |
| 2008 |
| 2007 |
| 2008 |
| 2007 |
| 2008 |
| 2007 |
| ||||
First |
| 282 |
| 152 |
| C$ | 54.11 |
| C$ | 37.25 |
| C$ | 42.51 |
| C$ | 32.21 |
|
Second |
| 225 |
| 143 |
| 46.71 |
| 34.43 |
| 37.76 |
| 29.97 |
| ||||
Third |
| 301 |
| 196 |
| 52.47 |
| 40.92 |
| 28.01 |
| 31.54 |
| ||||
Fourth |
| 346 |
| 192 |
| 45.34 |
| 43.30 |
| 22.00 |
| 37.40 |
| ||||
|
| 1,154 |
| 683 |
|
|
|
|
|
|
|
|
| ||||
New York Stock Exchange
|
| Share Volume |
|
|
|
|
|
|
|
|
| ||||||
|
| (millions) |
| High |
| Low |
| ||||||||||
Quarter |
| 2008 |
| 2007 |
| 2008 |
| 2007 |
| 2008 |
| 2007 |
| ||||
First |
| 234 |
| 177 |
| US$ | 54.74 |
| US$ | 32.11 |
| US$ | 41.54 |
| US$ | 27.42 |
|
Second |
| 162 |
| 180 |
| 46.20 |
| 31.17 |
| 37.00 |
| 27.99 |
| ||||
Third |
| 362 |
| 188 |
| 52.47 |
| 40.94 |
| 26.03 |
| 29.60 |
| ||||
Fourth |
| 395 |
| 170 |
| 39.23 |
| 46.98 |
| 17.95 |
| 37.39 |
| ||||
|
| 1,153 |
| 715 |
|
|
|
|
|
|
|
|
| ||||
150
Dividend Payments
In 2008, the Company paid a cash dividend of $0.40 per share – $0.20 on June 16 and December 15. A cash dividend of $0.30 per share was paid in 2007 – $0.15 on June 15 and $0.15 on December 17.
Dividend Policy
The Board of Directors reviews the dividend policy semi-annually based on the cash requirements of the Company’s operating assets, exploration and development activities, as well as potential acquisitions, combined with the current and projected financial position of the Company.
Form 40-F
The Company’s Annual Report on Form 40-F is filed with the United States Securities and Exchange Commission. This report is available on Barrick’s website www.barrick.com and will be made available to shareholders, without charge, upon written request to the Secretary of the Company at the Corporate Office.
Other Language Reports
French and Spanish versions of this annual report are available from Investor Relations at the Corporate Office and on Barrick’s website www.barrick.com.
Shareholder Contacts
Shareholders are welcome to contact the Company for information or questions concerning their shares. For general information on the Company, contact the Investor Relations Department:
Deni Nicoski
Vice President, Investor Relations
Telephone: (416) 307-7410
Email: dnicoski@barrick.com
Susan Muir
Senior Director, Investor Relations
Telephone: (416) 307-5107
Email: s-muir@barrick.com
Amy Schwalm
Senior Director, Investor Relations
Telephone: (416) 307-7422
Email: aschwalm@barrick.com
For information on such matters as share transfers, dividend cheques and change of address, inquiries should be directed to the Transfer Agents.
Transfer Agents and Registrars
CIBC Mellon Trust Company
P.O. Box 7010
Adelaide Street Postal Station
Toronto, Ontario M5C 2W9
Telephone: (416) 643-5500
Toll-free within the United States and Canada:
1-800-387-0825
Fax: 416-643-5501
Email: inquiries@cibcmellon.com
Website: www.cibcmellon.com
Mellon Investor Services, L.L.C.
480 Washington Boulevard – 27th Floor
Jersey City, NJ 07310
Telephone: 1-800-589-9836
Fax: (201) 680-4665
Email: shrrelations@mellon.com
Website: www.mellon-investor.com
Auditors
PricewaterhouseCoopers LLP
Toronto, Canada
Annual Meeting
The Annual Meeting of Shareholders will be held on Wednesday, April 29, 2009 at 10:00 a.m. in the Metro Toronto Convention Centre, 255 Front Street West, Toronto, Ontario.
151
Board of Directors and Senior Officers
Board of Directors
Howard L. Beck, Q.C.
Toronto, Ontario
Corporate Director
C. William D. Birchall
Toronto, Ontario
Vice Chairman, Barrick Gold Corporation
Donald J. Carty, O.C.
Dallas, Texas
Corporate Director
Gustavo A. Cisneros
Caracas, Venezuela
Chairman and Chief Executive Officer, Cisneros Group of Companies
Marshall A. Cohen, O.C.
Toronto, Ontario
Counsel, Cassels Brock & Blackwell LLP
Peter A. Crossgrove, O.C.
Toronto, Ontario
Corporate Director
Robert M. Franklin
Toronto, Ontario
President, Signalta Capital Corporation
Peter C. Godsoe, O.C.
Toronto, Ontario
Corporate Director
J. Brett Harvey
Venetia, Pennsylvania
President and Chief Executive Officer, CONSOL Energy Inc.
The Right Honourable Brian Mulroney, P.C.
Montreal, Quebec
Senior Partner, Ogilvy Renault
Anthony Munk
New York, New York
Managing Director, Onex Corporation
Peter Munk, C.C.
Toronto, Ontario
Founder and Chairman, Barrick Gold Corporation
Aaron W. Regent
Toronto, Ontario
President and Chief Executive Officer, Barrick Gold Corporation
Steven J. Shapiro
Houston, Texas
Corporate Director
Gregory C. Wilkins
Toronto, Ontario
Executive Vice Chairman, Barrick Gold Corporation
Senior Officers
Peter Munk
Chairman
Gregory C. Wilkins
Executive Vice Chairman
C. William D. Birchall
Vice Chairman
Aaron W. Regent
President and Chief Executive Officer
Vincent A. Borg
Executive Vice President, Corporate Communications
Alexander J. Davidson
Executive Vice President, Exploration and Corporate Development
Kelvin P.M. Dushnisky
Executive Vice President, Corporate Affairs
Gordon F. Fife
Executive Vice President, Organizational Effectiveness
Patrick J. Garver
Executive Vice President and General Counsel
Peter J. Kinver
Executive Vice President and Chief Operating Officer
Jamie C. Sokalsky
Executive Vice President and Chief Financial Officer
George M. Potter
Senior Vice President, Capital Projects
International Advisory Board
The International Advisory Board was established to provide advice to Barrick’s Board of Directors and management as the Company expands internationally.
Chairman
The Right Honourable Brian Mulroney
Former Prime Minister of Canada
Members
Gustavo A. Cisneros
Venezuela
Secretary William S. Cohen
United States
Vernon E. Jordan, Jr.
United States
Andrónico Luksic
Chile
Angus A. MacNaughton
United States
Karl Otto Pöhl
Germany
Lord Charles Powell of Bayswater KCMG
United Kingdom
The Honourable Nathaniel Rothschild
Switzerland
The Honorable Andrew Young
United States
152
Cautionary Statement on Forward-Looking Information
Certain information contained in this Annual Report 2008, including any information as to our strategy, plans or future financial or operating performance and other statements that express management’s expectations or estimates of future performance, constitute “forward-looking statements”. All statements, other than statements of historical fact, are forward-looking statements. The words “believe”, “expect”, “will”, “anticipate”, “contemplate”, “target”, “plan”, “continue”, “budget”, “may”, “intend”, “estimate” and similar expressions identify forward-looking statements. Forward-looking statements are necessarily based upon a number of estimates and assumptions that, while considered reasonable by management, are inherently subject to significant business, economic and competitive uncertainties and contingencies. The Company cautions the reader that such forward-looking statements involve known and unknown risks, uncertainties and other factors that may cause the actual financial results, performance or achievements of Barrick to be materially different from the Company’s estimated future results, performance or achievements expressed or implied by those forward-looking statements and the forward-looking statements are not guarantees of future performance. These risks, uncertainties and other factors include, but are not limited to: the impact of global liquidity and credit availability on the timing of cash flows and the values of assets and liabilities based on projected future cash flows; changes in the worldwide price of gold, copper or certain other commodities (such as silver, fuel and electricity); fluctuations in currency markets; changes in U.S. dollar interest rates or gold lease rates; risks arising from holding derivative instruments; ability to successfully complete announced transactions and integrate acquired assets; legislative, political or economic developments in the jurisdictions in which the Company carries on business; operating or technical difficulties in connection with mining or development activities; employee relations; availability and increasing costs associated with mining inputs and labor; the speculative nature of exploration and development, including the risks of obtaining necessary licenses and permits and diminishing quantities or grades of reserves; adverse changes in our credit rating; level of indebtedness and liquidity; contests over title to properties, particularly title to undeveloped properties; and the risks involved in the exploration, development and mining business. Certain of these factors are discussed in greater detail in the Company’s most recent Form 40-F/Annual Information Form on file with the U.S. Securities and Exchange Commission and Canadian provincial securities regulatory authorities.
The Company disclaims any intention or obligation to update or revise any forward-looking statements whether as a result of new information, future events or otherwise, except as required by applicable law.
Ove Design & Communications Ltd. / Moveable Inc. / Merrill Corporation Canada / Location Photography Peter Christopher / Portrait Photography Craig Samuel
WWW.BARRICK.COM
Barrick Gold Corporation
Corporate Office:
Brookfield Place
TD Canada Trust Tower
161 Bay Street, Suite 3700
P.O. Box 212
Toronto, Canada M5J 2S1
Tel: 416.861.9911
Toll-free (within Canada and United States): 1.800.720.7415
Fax: 416.861.2492
Email: investors@barrick.com
