Exhibit 99.1
| Barrick Gold A New Era in Barrick Gold Corporation Annual Report 2009 |
| 4 Message from the Chairman 7 Message from the President and CEO 10 Exceptional Gold Leverage 12 Operations 15 Projects in Construction 20 Reserve and Resource Development 22 Responsible Mining 28 Management’s Discussion and Analysis 96 Financial Statements 100 Notes to Consolidated Financial Statements 155 Mineral Reserves and Resources 163 Corporate Governance and Committees of the Board 164 Shareholder Information 166 Board of Directors and Senior Officers Gold surged to new highs in 2009 supported by strong investment demand and a shift by Central Banks to become net purchasers as gold re-emerges as an important asset class. |

| Exceptional leverage to higher gold prices with the industry’s largest fully unhedged production and reserves and with new low cost production from its next generation of world-class mines. Barrick Gold |
FINANCIAL HIGHLIGHTS
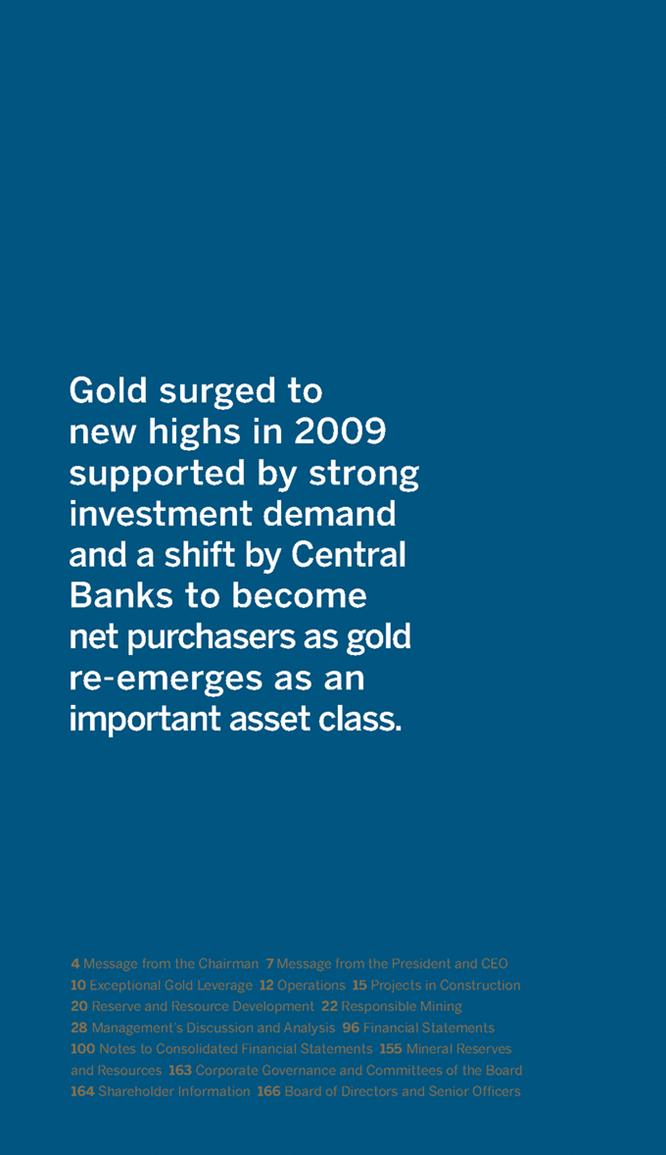
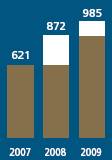
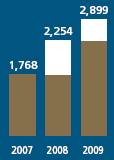
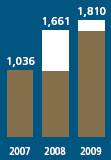
REALIZED GOLD PRICES(1) | CASH MARGINS(1) | ADJUSTED OPERATING CASH FLOW(1) | ADJUSTED NET INCOME(1) |
(US dollars per ounce) | (US dollars per ounce) | (US dollars millions) | (US dollars millions) |
| | | |
| 
| 
| 
|
| | | |
Record realized price in 2009 | Record cash margins in 2009 | Record adjusted operating cash flow in 2009 | Record adjusted net income in 2009 |
Barrick reported a record realized gold price, cash margins, adjusted operating cash flow and adjusted net income in 2009.
(in millions of US dollars, except per share data) | | | | | | | |
(US GAAP basis) | | 2009 | | 2008 | | 2007 | |
Sales | | $ | 8,136 | | $ | 7,613 | | $ | 6,014 | |
Net income (loss) | | (4,274 | ) | 785 | | 1,119 | |
per share | | (4.73 | ) | 0.90 | | 1.29 | |
Adjusted net income(1) | | 1,810 | | 1,661 | | 1,036 | |
per share | | 2.00 | | 1.90 | | 1.19 | |
Operating cash flow | | (2,322 | ) | 2,254 | | 1,768 | |
Adjusted operating cash flow(1) | | 2,899 | | 2,254 | | 1,768 | |
Cash and equivalents | | 2,564 | | 1,437 | | 2,207 | |
Dividends per share | | 0.40 | | 0.40 | | 0.30 | |
| | | | | | | |
Operating Highlights | | | | | | | |
Gold production (000s oz) | | 7,423 | | 7,657 | | 8,060 | |
Average realized gold price per ounce(1) | | $ | 985 | | $ | 872 | | $ | 621 | |
Total cash costs per ounce(1) | | $ | 466 | | $ | 443 | | $ | 345 | |
Net cash costs per ounce(1) | | $ | 363 | | $ | 337 | | $ | 228 | |
| | | | | | | |
Copper production (M lbs) | | 393 | | 370 | | 402 | |
Average realized copper price per pound(1) | | $ | 3.16 | | $ | 3.39 | | $ | 3.22 | |
Total cash costs per pound(1) | | $ | 1.17 | | $ | 1.19 | | $ | 0.82 | |
(1) Non-GAAP measure – see pages 85–90 of the 2009 Financial Report.
2
Exceptional Leverage to Gold Price | On Gold Industry’s Largest Fully Unhedged Production and Reserves |
| |
New Low Cost Production | From World-class Projects in Construction |
| |
Project Development Excellence | Built 7 Mines in 5 Years on Schedule |
| |
Consistent Track Record of Achieving Operating Targets | From a Diversified and Balanced Geopolitical Portfolio of Operations |
| |
History of Reserve Replacement | From Consistent Funding in Exploration and Disciplined Acquisitions |
| |
Unwavering Commitment To Responsible Mining | Maintained Listings on Dow Jones Sustainability Indexes
Achieved 25% Improvement in Lost-time Injury Rate |
| |
Financial Strength | With Gold Industry’s Only ‘A’ Credit Rating |
Barrick Annual Report 2009
3
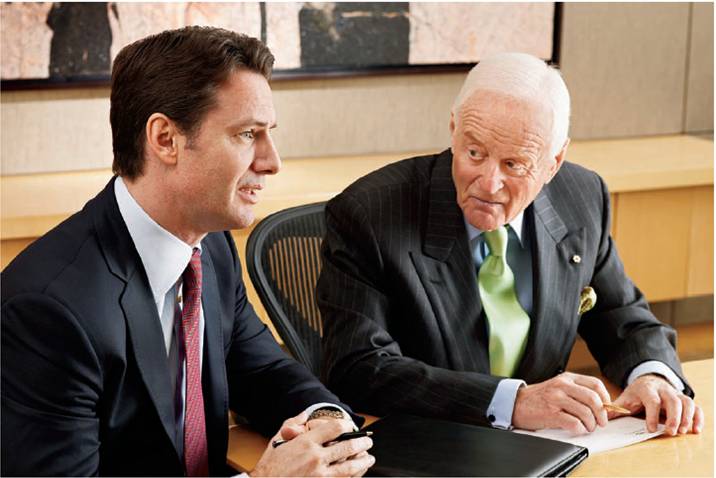
Peter Munk, Founder and Chairman (right)
Aaron Regent, President and Chief Executive Officer
Message from the Chairman
Fellow shareholders,
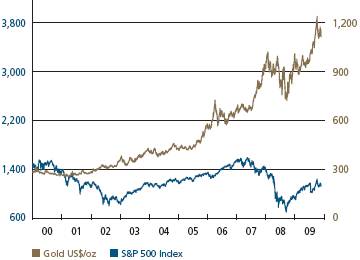
If we look back over the past decade, gold’s performance has been quite exceptional. Virtually no other asset class can claim such a remarkable record and, as such, we have seen gold reassert itself as an increasingly important asset for global investors. In all but one of the past 10 years, gold closed higher than it did the previous year. Over the same period, gold has significantly outpaced the S&P 500.
Buyers of all stripes, be they institutional funds, retail investors or even coin collectors poured new money into gold. They were joined by a smattering of central banks, and above all, an international group of professional wealth managers, seeking to protect the value of their assets, thus pushing investment demand for gold to ever-higher levels.
After last year’s business failures, which were followed by even more dramatic government bailouts for global banks and insurance companies, we now see sovereign states exposed to the dangers of financial implosion, further undermining confidence in the world’s leading currencies.
Governments could only counter the unprecedented economic upheaval of recent years by pumping enormous sums of “rescue” money into their systems — leaving the critical question of repayments to an even more uncertain future. These debt levels, arguably unsustainable, further explain why many informed
4
people are questioning the wisdom of holding their assets in currencies exposed to a risk of significant devaluation. Their uncertainty has led to an ever-growing bias towards asset diversification, with a clear preference for gold. The enormous growth in exchange traded funds that hold pure, physical gold is a clear manifestation of this trend.
When we consider the nearly universal and continuing concern about the global economy and its prospects, it is difficult not to be optimistic about gold. Whereas some investors, particularly the perennial gold bugs, predict a doubling, or even a tripling, of the current gold price, we at Barrick are expecting more realistic increases, similar to those we experienced over the past decade. While daily trading activities and unforeseen political and economic factors will undoubtedly cause short-term swings in the gold market, the fundamental trend is relatively predictable. This is because, in both of the two most likely economic scenarios — a steady, universal recovery, or a sluggish and deteriorating global economy — the fundamental reasons to buy gold remain valid. In the first case, concerns about inflation will likely emerge, spurring gold buying to higher levels; in the second, concerns about currencies will increasingly encourage more purchasing of gold.
In both scenarios, the memory of recent events (talk of major economic upheaval and informed comments referring to the near collapse of the financial system), will remain longer with those whose occupation is to conserve wealth (whether their own or as managers) than in any of the previous post-war recessions. Likewise, the fact that gold performed so strongly in all major currencies during an entire decade, and outperformed virtually all other asset classes, will not be forgotten quickly.
Of course gold, like any other commodity, depends on supply as well as demand. And the supply side of the equation also encourages an optimistic outlook. In contrast to growing investment demand, gold supply from mines peaked in 2001, and has since experienced a declining trend. This reflects the increasing difficulty of finding, permitting and building mines. Moreover, the same financial market upheaval that is driving gold prices higher is also making it more difficult to finance new mine developments, especially considering the substantially higher costs of new projects today.
While, on balance, I remain somewhat pessimistic about the short-term health of the global economy, I am optimistic about Barrick’s prospects. In the midst of a new era for gold, we are the gold industry leader. In 2009, we translated our bullish outlook into action, by eliminating all of our remaining Gold Hedges. As a result, Barrick offers shareholders unique leverage to gold with both the largest production and largest reserves in the industry.
We continue to believe that our shares offer investors an exceptional opportunity to participate in the gold market relative to our peers or to the gold exchange traded funds. Over the long term, Barrick management — with an excellent track record of acquisition-led growth and major new mine development — has proven its ability to ensure Barrick shares outperform spot gold.
Despite the multi-billion dollar cost of fully eliminating our Gold Hedges during 2009, we have maintained our ‘A’ rated balance sheet, the only one in our industry. Conservative fiscal management has always contributed to our financial strength and has defined Barrick since its inception. Our financial capacity is that much more
5
important, considering we have a large pipeline of economically viable projects to provide us with organic growth — projects that will continue to lower our cash cost profile. Two of these projects, Buzwagi in Tanzania and Cortez Hills in Nevada, are now in production. Equally, both the Pueblo Viejo project in the Dominican Republic, and the Pascua-Lama project in Chile and Argentina, are in construction and remain on track and on budget. When complete, these world-class, long-life mines will add low cost production to our portfolio.
On a personal and sombre level, our optimism for the future, evolving during 2009, was cruelly tempered late last year by a personal tragedy for all of us at Barrick. In December 2009, Greg Wilkins, my dear friend and colleague of over 25 years, passed away following a courageous battle with cancer. As our President and CEO, Greg, with his bold leadership, strategic vision and an unyielding passion for success, helped to cement Barrick’s position as the global leader in our industry. Since the day we started Barrick, Greg remained focused on our primary commitment: to deliver strong performance and returns for our shareholders. As Barrick’s Founder and Chairman, I can assure you that we shall carry on this tradition.
I would also like to extend my gratitude and appreciation to Peter Godsoe, who retires from our Board of Directors this year. Peter has been a member of the Board since 2004 and his wise and level-headed counsel will be greatly missed.
Equally, I wish to thank Barrick’s talented and dedicated team of more than 20,000 employees on virtually every continent of the globe, who every day contribute to the success of this great Company in so many ways. Your passion for Barrick and your
GOLD VS THE S&P 500
commitment to the Company are fully recognized by us and greatly appreciated.
In conclusion, I must acknowledge and congratulate Aaron Regent on his first year as our new President and Chief Executive Officer. Over the past year, he has consistently demonstrated the creativity and keen strategic insight we were looking for in a chief executive. As Barrick’s first CEO appointed from outside the Company, Aaron continues to introduce ideas that are creative, innovative and invigorating. He also adds a new and dynamic dimension to our strategic decision-making process. I am absolutely confident that, matched with Barrick’s track record of excellence and our tradition of integrity, Aaron will build exceptional value for shareholders, now and well into the future.
| /s/ Peter Munk |
| Peter Munk |
| Founder and Chairman |
6
Message from the President and CEO
2009 was a year of significant change for both the gold industry and for Barrick. After decades of selling gold, central banks became net purchasers, which has helped to reinforce gold’s role as a diversifying asset within investment portfolios. This was further supported by increased investment demand and the accumulation of gold in global exchange traded funds. These factors drove gold prices through the $1,000 per ounce level, setting a new record just above $1,225 per ounce. Many of the conditions that have supported rising gold prices remain. Continued concern about the status of the world’s economies, global currency imbalances and the growth of US dollar reserves, as well as government monetary and fiscal policies, have increased gold’s attractiveness as an investment. In addition, the gold mining industry has struggled to replace and grow production levels. The trend of falling mine supply over the last decade is likely to continue into the foreseeable future. Combined, all of these factors should help ensure a firmly supportive environment for gold prices.
It was against this backdrop that Barrick took the dramatic step of eliminating its legacy Gold Hedges to gain full exposure to rising gold prices and minimize any further cost to the Company. At the time this decision was made, a $100 per ounce increase in the gold price would have increased the associated mark-to-market liability of the Gold Hedges by about $300 million. To eliminate the Gold Hedges, we made the difficult decision to issue $4 billion in new equity. This was done with great hesitation. We considered many different options but determined that it was important to eliminate the Gold Hedges in a definitive way, while protecting the balance sheet to preserve the Company’s ability to fund our large, low cost projects currently under construction. As a result of this step and previous initiatives over the last two years, Barrick has eliminated its legacy Gold Hedge position of 9.5 million ounces at a weighted average gold price of approximately $930 per ounce, which is meaningfully below today’s market prices of about $1,100 per ounce (as of March 9, 2010).
In addition to eliminating the Gold Hedges, we also made progress on a number of other fronts. Operating results were in line with forecasts. Gold production was 7.4 million ounces at total cash costs of $466 per ounce, or $363 per ounce on a net cash cost basis. We also produced 393 million pounds of copper at total cash costs of $1.17 per pound. This reflects the strength of our diversified portfolio of 26 operating mines around the world.
These production results were achieved while maintaining an unwavering commitment to responsible mining practices, which was once again recognized by our inclusion on the Dow Jones Sustainability Indexes. Also, Barrick’s safety performance significantly improved in 2009, with a 25% reduction in our lost-time injury frequency rate.
Underpinning our production is the gold industry’s largest reserve base. Through a combination of acquisitions and exploration success, Barrick has consistently grown its reserves in each of the last four years and we achieved this once again in 2009. Today we have gold reserves of about 140 million ounces and just over 93 million ounces of resources.
Our track record of converting reserves into producing assets continued in 2009, as we advanced our portfolio of new projects. The Buzwagi mine in Tanzania was completed on time and on budget.
Construction of the Cortez Hills project is complete and the site is transitioning into the operating phase. The Cortez property is expected to contribute over one million ounces of gold at attractive total cash costs of between $295 — $315 per ounce in 2010. However, Cortez Hills is currently the subject of a legal action in the US courts which could impact 2010 operating targets. Opponents of the project have sought an injunction to stop operations. The Ninth Circuit Court of Appeals has denied the opponents’ claims in part, but ordered additional environmental analysis on two specific matters and mandated that the District Court decide the extent of appropriate injunctive relief in the interim. We have submitted a motion to the District Court for a limited injunction whereby Barrick would operate under a modified mine plan that would not impact on the matters raised by the Court of Appeals, while at the same time preventing significant economic
7
hardship to the region. A hearing and a decision from the District Court on an injunction is expected in the second quarter of 2010. In addition, a supplemental Environmental Impact Statement (EIS) that addresses the two issues raised by the Court of Appeals is expected to be completed in the fourth quarter of 2010.
Barrick’s 60%-owned Pueblo Viejo project, located in the Dominican Republic, is advancing according to schedule. On a 100% basis, Pueblo Viejo has gold reserves of over 23 million ounces, and in its first full five years of operation, Barrick’s share of annual gold production is expected to be 625,000 — 675,000 ounces at total cash costs of between $250 — $275 per ounce.
Construction on the Pascua-Lama project also began in 2009. Pascua-Lama is a large, world-class project with gold reserves of about 18 million ounces and 671 million ounces of silver contained within gold reserves. Once operating, it is expected to produce between 750,000 — 800,000 ounces of gold annually at total cash costs of $20 — $50 per ounce, assuming a $12 per ounce silver price. This makes Pascua-Lama one of the lowest cost gold mines in the world.
Altogether, these new mines will add over 2.4 million ounces of production at lower cash costs than our current profile.
In addition to these advanced projects, we have a pipeline of next-generation projects which continue to progress well: Cerro Casale, Donlin Creek, Reko Diq and Kabanga. Collectively, our share of reserves and resources at these projects is over 52 million ounces of gold, 20 billion pounds of copper, and almost 1.6 billion pounds of nickel. They provide us with additional leverage to metal prices, the opportunity to deploy capital at attractive rates of return and the potential to further grow our production base.
Our financial position at year-end was sound, with about $2.6 billion in cash on hand and a further $1.5 billion undrawn line of credit. Combined with strong operating cash flows, we are well positioned to support our operations, fund our projects and pursue disciplined acquisitions as well.
The net results of our efforts were reflected in our 2009 financial results where underlying earnings and cash flows both increased. Adjusted net income was $1.8 billion, an increase of 9% from 2008. This resulted in an adjusted return on equity of 12%. Adjusted cash flow from operations was $2.9 billion, up 29% from 2008. Rising gold prices led to a significant increase in our cash cost margins, which rose to $519 per ounce, or $622 per ounce on a net cash cost basis after deducting copper credits.
What We Did in 2009
· Met production and cash cost targets
· Advanced low cost projects on schedule and within budget
· Grew reserves through disciplined acquisitions and exploration success
· Retained listings on the Dow Jones Sustainability Indexes
· Achieved 25% improvement in lost-time injury rate to 0.15
· Completed organization review with expected annual savings of about $50 million
· Eliminated all Gold Hedges
· Maintained financial strength and the gold industry’s only ‘A’ credit rating
· Generated record adjusted net income and cash flow
What We Plan To Do in 2010
· Deliver higher production at lower cash costs
· Progress Pueblo Viejo, Pascua-Lama and complete Cortez Hills on schedule and on budget
· Grow the net asset value of the Company and increase metal exposure per share by:
· maximizing free cash flow from existing operations
· growing reserves and resources
· advancing our pipeline of low cost, high-quality projects and
· pursuing acquisitions which are accretive to shareholder value
· Maintain license to operate
· Preserve financial strength and the industry’s highest-rated balance sheet
· Continue trend of strong earnings and cash flow generation
8
The progress we made in 2009 has established a solid foundation from which to move the Company forward. With the completion of the Cortez Hills project, our production is anticipated to increase in 2010 at lower cash costs. Barrick’s production base and cash cost profile will be further improved with Pueblo Viejo, expected to begin production late in 2011, and Pascua-Lama, expected in early 2013.
Many of our investors have told me they are disappointed with the performance of gold equities relative to the gold price and we share their frustration. Over the last two years, the gold price has risen by roughly 30%, while the benchmark Philadelphia Gold and Silver Index has remained flat. The challenge for Barrick and for our industry is to offer an investment case which is better than owning gold directly. In the case of Barrick I believe we can.
We are focused, on a per share basis, on growing the net asset value of Barrick and increasing our leverage to the gold price. This means that even if the gold price doesn’t change, the value of the Company, and our share price, should increase as we continue to create new value. And by increasing our leverage, our shareholders will realize higher returns in a rising gold price environment than those who hold physical gold. While it is imperative that we pursue value creation initiatives, it is also essential that we do so while minimizing the risks inherent in our business to ensure that we are able to operate and build our projects without interruption.
To achieve this, we are refining our life-of-mine plans and capital management processes to maximize the free cash flow that we are able to generate, but also to ensure that we are extracting the full economic potential of our mines and operating platforms. One such initiative is the creation of African Barrick Gold (ABG), a new public company that will be listed on the London Stock Exchange. ABG plans to offer around 25% of its equity for purchase by investors, while Barrick retains an ownership position of roughly 75%. ABG will hold Barrick’s four gold mines in Tanzania, as well as our exploration portfolio in that country. ABG will be better positioned to invest in and acquire smaller assets typical of Africa, which would have a negligible impact on Barrick, but could be quite meaningful to the growth profile of this smaller entity. The new company will be better positioned to pursue these opportunities, overseen by a strong Board of Directors with both mining and African experience, and where the value created can be better reflected as a separate public entity.
At Barrick, we continue to grow our reserves and resources through a combination of acquisitions and exploration programs. Early in 2010, we agreed to acquire a further 25% interest in the Cerro Casale project. Cerro Casale is one of the world’s largest undeveloped gold and copper deposits, with over 23 million ounces of gold and about six billion pounds of copper. It is also located in Chile, a country with a very attractive mining environment and one familiar to Barrick. Following this acquisition, Barrick holds 75% of the project, and with this increased position, now has control over project parameters and timing.
By maximizing the free cash flow and the economic potential of our existing mines, deploying capital at returns greater than our cost of capital, and given our track record of growing reserves and resources and turning those resources into producing mines, Barrick is well positioned to increase its net asset value and its leverage to the gold price for the benefit of our shareholders.
In conclusion, I would like to thank all of the people at Barrick who are focused on delivering results in a safe and responsible manner every day. I would also like to thank our shareholders who supported us, particularly as we unwound our legacy Gold Hedges. Finally, I would like to thank the Board of Directors, led by our Founder and Chairman, Peter Munk, for the inspiration, guidance and support they have provided to me and the entire management team.
/s/ Aaron Regent | |
Aaron Regent | |
President and Chief Executive Officer | |
9
Exceptional Gold Leverage
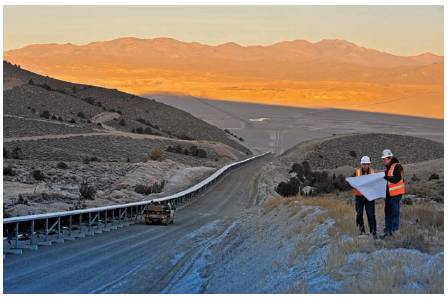
The 15 kilometer ore conveyor transports crushed material from the Cortez Hills deposit across Crescent Valley to the processing facilities at the existing Cortez mine.
Barrick offers investors exceptional leverage to gold prices on the largest unhedged reserves and production in the industry. In 2009, we produced about 40% more gold than our nearest competitor and the Company has the largest gold reserves by more than 48 million ounces. From this industry-leading production base, the Company reported record adjusted earnings of $1.8 billion ($2.00 per share), and record adjusted operating cash flow of $2.9 billion. And Barrick continued its trend of margin expansion, generating record cash margins of $519 per ounce or $622 per ounce on a net cash cost basis, in 2009. We offer leverage to strong gold prices today and we are positioned to enhance our leverage in the future as our advanced, high-quality projects start to contribute substantial new low cost production, beginning with Cortez Hills in Nevada, which is expected to help grow production to 7.6 — 8.0 million ounces of gold in 2010(1). Cortez Hills will be followed by the Pueblo Viejo project in the Dominican Republic in late 2011 and the Pascua-Lama project in Chile and Argentina in early 2013. Barrick has a proven history of successful mine development, delivering seven mines on schedule in the last five years. Beyond this, we see significant potential in three additional projects: Cerro Casale, Donlin Creek and Reko Diq. These continue to progress well and all have large gold inventories, which provide further development opportunities in what we believe is a supportive environment for gold prices.
Jamie Sokalsky, Executive Vice
President and Chief Financial Officer
“Our positive view on the gold price led us to accelerate the elimination of the Gold Hedges ahead of the schedule we had established, further increasing our gold price leverage with the industry’s largest unhedged production and reserves.”
10
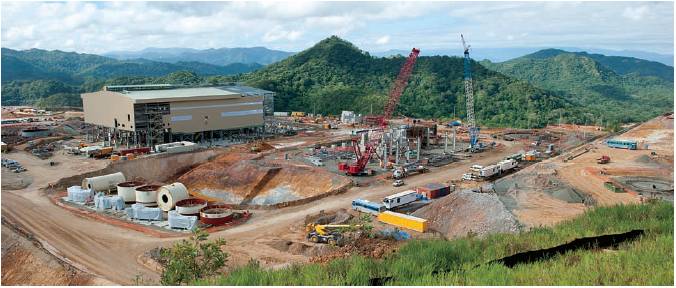
The Pueblo Viejo project remains on schedule to deliver first production in the fourth quarter of 2011. In its first full five years of operation, Barrick’s share of annual gold production is expected to be 625,000—675,000 ounces at total cash costs of $250—$275 per ounce.
In 2009, we announced the elimination of our remaining Gold Hedges(2) and remain committed to a “no gold hedge policy”. Barrick used the net proceeds from a $4.0 billion equity issue and $1.25 billion debt issue to eliminate the Gold Hedges and the majority of the Floating Contracts. As a result, the Company recorded a $5.9 billion charge to earnings and a $5.2 billion cash outflow in 2009, primarily related to the settlement of the Gold Sales Contracts. Barrick made this strategic decision to gain full leverage to the gold price due to an increasingly positive outlook for gold. As well, the Company felt that the Hedges were adversely impacting Barrick’s appeal to the broader investment community and hence, its share price performance.
Gold has surged to new, record-breaking levels. Following the financial crisis in late 2008 and subsequent deleveraging, the precious metal’s appeal has broadened as a store of value and a diversifying investment alternative. Ongoing global fiscal and monetary policies designed to stimulate an economic recovery increase the risk of higher inflation. As a result, there has been a structural shift by investors in favor of holding more gold. We saw central banks become net buyers — significantly reversing a 40-year trend — right down to individual investors buying gold coins. Constrained supply will provide further support for an increasing gold price as mine production remains challenged over the long term. New deposits are scarce and harder to find and development timelines have lengthened.
Barrick is positioned to be a major beneficiary of a strong gold price environment. Investors cannot adequately evaluate their return on investment without considering risk. As the gold industry leader, we believe we offer investors a compelling risk-return proposition relative to our peers and the gold exchange traded funds. Barrick provides tremendous leverage to the gold price and a history of meeting operational targets and project development timelines and budgets. Our track record is one of long-established reliability, built on a foundation of a diversified and geopolitically balanced portfolio of operations, depth of expertise and experience, as well as our strong balance sheet.
(1) | This assumes that Barrick’s motion for a limited preliminary injunction at Cortez Hills is accepted. In December 2009, the appeal of the denial of a preliminary injunction sought by certain opponents of the Cortez Hills Project was denied in part and granted in part. As a result, the Company has sought a limited injunction that would restrict two discrete activities relating to the deficiencies while allowing the balance of the project to proceed. The plaintiffs have sought a broader injunction that would enjoin further construction and operation of the Project pending completion of the supplemental EIS. |
| |
(2) | The Gold Hedges are fixed price (non-participating) gold contracts and the Floating Contracts are floating spot-price (fully-participating) gold contracts. The Gold Hedges with the Floating Contracts comprise the Gold Sales Contracts. |
11
Operations
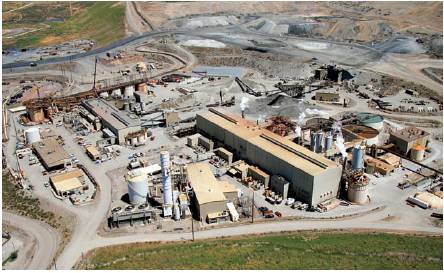
The Goldstrike mine in Nevada continued to be a significant contributor in 2009 with gold production of 1.36 million ounces.
In 2009, Barrick produced 7.4 million ounces of gold. This represents the industry’s highest production in a year of record highs for the gold price. Once again, the Company was within its production and cost targets. The strength of our 26-mine portfolio allows Barrick to absorb unplanned disruptions at certain sites, while continuing to meet expectations.
Barrick’s operational structure is another key strength for the Company. Our operations are organized in regional business units (RBUs), allowing local management to customize corporate strategies to meet the unique conditions of each region. Each RBU draws on the strengths of other regions as well as the corporate head office.
In February 2010, Barrick announced the creation of African Barrick Gold (ABG), a new company whose equity it will seek to list with the United Kingdom Listing Authority and to admit to trading on the London Stock Exchange, subject to market conditions. ABG also intends to seek a future listing on the Dar es Salaam Stock Exchange in Tanzania. African Barrick Gold will hold Barrick’s African gold mines and exploration properties. ABG will offer approximately 25% of its equity in an initial public offering (IPO) and Barrick will retain the remaining interest. This return of capital to Barrick is expected to provide increased financial capacity to fund the Company’s pipeline of development projects.
African Barrick Gold is expected to produce approximately 800,000—850,000 ounces of gold in 2010 and had total reserves of 16.8 million ounces (100% basis) as of December 31, 2009. As an Africa-focused public company, Barrick expects that ABG will be better positioned to generate shareholder value from its operating platform and that its range of growth options and ability to finance those options will be expanded and the intensity with which these options will be pursued will be improved. ABG will have an incentivized management team and an experienced Board of Directors. In addition, Barrick expects that listing on the Dar es Salaam Stock Exchange will enhance the profile of the new company in Tanzania and allow for local participation in this national champion.
Barrick expects production to grow to 7.6—8.0 million ounces in 2010, net of the ABG IPO, at lower total cash costs of $425—$455 per ounce or net cash costs of $345—$375 per ounce. Higher production is driven by the start-up of Cortez Hills, a full year of operations at our new Buzwagi mine in Tanzania and higher production from the Veladero mine in Argentina as a result of access to higher grades and increased throughput from a crusher expansion completed in the latter half of 2009.
12
The Veladero mine in Argentina is expected to increase production to 1.09—1.16 million ounces in 2010 as a result of increased throughput from a crusher expansion completed in 2009 and access to higher grades.
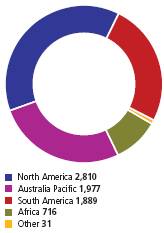
The North America business unit continued to be our largest contributor, delivering 2.8 million ounces of gold in 2009. Nevada drives the region and is home to seven of its 10 mines including the flagship Goldstrike operation. Goldstrike produced about 1.4 million ounces of gold in 2009, while entering a high waste stripping phase in the latter half of the year; this is expected to be complete in mid-2010.
The Cortez mine in Nevada produced about 518,000 ounces of gold in 2009. The Cortez property is expected to produce 1.08—1.12 million ounces at low total cash costs of $295—$315 per ounce in 2010. We have continued to add new reserves and resources since acquiring this highly prospective asset.
South America remains our lowest cash cost region, producing 1.9 million ounces in 2009. Lagunas Norte in Peru produced just over 1.0 million ounces for the fourth year in a row at low cash costs below $140 per ounce. At the Pierina mine, also in Peru, successful in-fill drilling results have extended its expected life to mid-2013.
Production from the Veladero mine in Argentina benefited from access to higher grades in the Amable and Federico pits, as well as from a crusher expansion completed in the latter half of 2009, which increased throughput from 50,000 to 85,000 tons per day.

Peter Kinver, Executive Vice
President and Chief Operating Officer
“In 2009, our portfolio of operations continued its track record of achieving operating targets. These results demonstrate one of the key strengths of our diversified asset portfolio — dependability.”
13
The Buzwagi mine in Tanzania was commissioned in May 2009 on time and on budget — another example of Barrick’s successful track record of mine development.
Veladero’s production is expected to grow significantly to 1.09—1.16 million ounces in 2010.
The Australia Pacific business unit produced about 2.0 million ounces of gold in 2009. The Porgera mine in Papua New Guinea remains the largest contributor to the region with production of about 551,000 ounces. Our extensive land position in the highly prospective country of Papua New Guinea will be a key focus of our exploration programs in the Australia Pacific RBU, with about 15% of our total global exploration budget allocated to this country. We believe Papua New Guinea will provide opportunities for longer-term growth.
The Africa business unit produced about 716,000 ounces and benefited from the start-up of our new Buzwagi mine in Tanzania in May 2009, on schedule and on budget. Buzwagi successfully ramped up by the end of 2009 and is expected to produce 240,000—260,000 ounces in 2010 at low total cash costs of $310—$350 per ounce to Barrick’s account.
2009 PRODUCTION
(thousands of ounces)
Our copper business continued to generate significant cash flow for reinvestment in our core gold business. Production from our two copper mines, the Zaldívar operation in Chile and the Osborne mine in Australia, was 393 million pounds in 2009. Copper cash margins per ounce were robust at about 63% of the average realized price as the Company benefited from its copper hedge position. The average realized price of $3.16 was $0.82 per pound higher than the average spot price for the year.
Utilizing option collar strategies, the Company has put in place floor protection on approximately 80% of expected copper production for 2010 at an average price of $2.19 per pound, but can fully participate in copper price upside on approximately 100% of 2010 production up to a maximum average price of $3.63 per pound.
Barrick continues to look for opportunities to increase the value of its portfolio of operations. In 2009, we acquired the remaining 50% interest in the Hemlo operation in Ontario, and have subsequently increased the expected mine life of this operation. In our key region of Nevada, reserves grew at a number of operations including Cortez, South Arturo (located on the Goldstrike property) and Bald Mountain, where the Company plans to increase production capacity in the future.
14
Projects in Construction
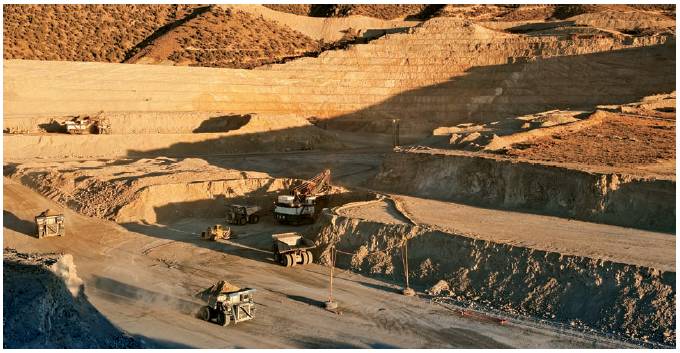
Cortez Hills is expected to materially benefit Barrick’s overall production and cost profile. The existing process infrastructure blends ore from the Pipeline deposit with ore from Cortez Hills.
Barrick has a history of project development excellence. We have built seven new mines in the last five years on time. The Cortez Hills project is just the latest example of a mine developed on schedule and on budget. Experience is vital to this success. We have acquired a deep understanding of how to handle challenges related to designing, permitting, financing and building major projects. We also have a strong balance sheet with the industry’s only ‘A’ credit rating and are positioned to generate robust cash flow to support our project development activities.
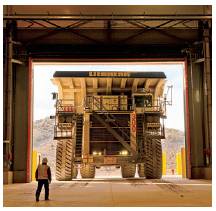
A new fleet of heavy equipment has been commissioned for Cortez Hills.
Cortez Hills in Nevada is a key project for us, and is expected to materially benefit our production and cash cost profile. With proven and probable reserves of over 14 million ounces at the end of 2009, the entire Cortez property is anticipated to contribute substantial production to the Barrick portfolio for many years to come. We will continue to focus exploration efforts here in 2010 where we see further upside potential at this underexplored property on the highly prospective Cortez Trend.
In addition to Cortez Hills, Barrick has two other advanced projects, Pueblo Viejo in the Dominican Republic and Pascua-Lama straddling the border of Chile and Argentina. These world-class projects are also expected to deliver significant production and have a meaningful positive impact on our overall cash cost profile.
15
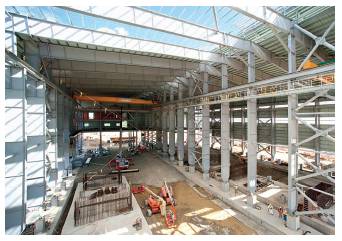
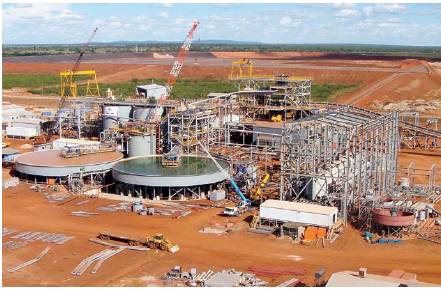
Large scale autoclaving of gold, pioneered by Barrick at Goldstrike, is being constructed at the Pueblo Viejo project in the Dominican Republic.
Consistent with Barrick’s history of successful development, they remain on schedule and in line with their pre-production capital budgets.
Our 60%-owned Pueblo Viejo project remains on track to deliver first production in the fourth quarter of 2011. As a result of a plan to accelerate the previously phased expansion of the processing plant from 18,000 to 24,000 tonnes per day, and other changes to the mine plan, Barrick’s share of gold production is now expected to be higher at 625,000—675,000 ounces, up from 600,000—650,000 ounces, at a lower cash cost of $250—$275 per ounce(1), compared to total cash costs of $275—$300 per ounce. Since Barrick acquired the project with the Placer Dome acquisition, reserves have increased by approximately 77% or 10.3 million ounces to 23.7 million ounces (100% basis), resulting in a mine life of over 25 years.
Significant progress has been made at Pueblo Viejo. As of February 2010, the majority of site preparation earthworks has been completed, with about 44,000 cubic meters of concrete poured and 1,500 tons of steel erected. Pre-production capital is expected to be $3.0 billion (100% basis) including the expansion capital of $0.3 billion for the increased processing capacity.
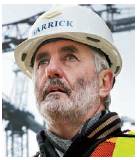
George Potter, Senior Vice
President, Capital Projects
“This is an exciting time for Barrick shareholders as we bring on substantial new low cost production. Buzwagi was completed on time and on budget in 2009 as was Cortez Hills in 2010. We look forward to continuing our trend of successful development with the delivery of Pueblo Viejo in Q4 2011 and Pascua-Lama in Q1 2013.”
(1) Based on gold and oil price assumptions of $950 per ounce and $75 per barrel, respectively.
16
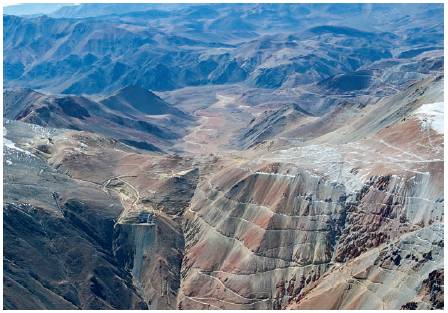
A platform is already in place and the portal for the ore conveyor tunnel, shown in the foreground of this photo, has been completed. The tunnel will be used to transport the ore from Chile into Argentina where the process facilities will rest in the valley beyond. Close proximity to Veladero is shown with the Filo Federico pit in the upper right.
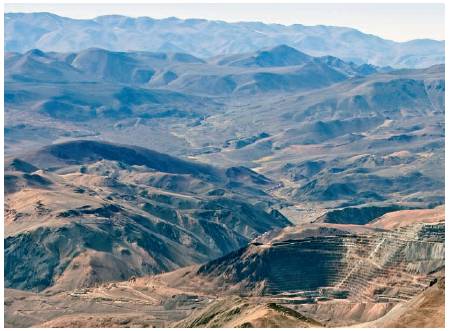
In May 2009, we announced a construction decision on the Pascua-Lama project following the resolution of the cross-border tax agreement with Chile and Argentina and the receipt of remaining sectoral permits. This was a significant milestone for Barrick. Pascua-Lama is one of the largest undeveloped gold-silver deposits in the world with almost 18 million ounces in gold reserves and about 671 million ounces of silver contained within the gold reserves, for a mine life of over 25 years.
Within 10 kilometers of our Veladero mine, the deposit sits in the Frontera district. Project development and subsequent mine operations are expected to benefit from our experience at Veladero and from the significant infrastructure in the area. The development of Pascua-Lama opens up the Frontera gold district where we see significant potential to surface further value through exploration on our extensive land position.
In its first full five years of operation, average annual gold production at Pascua-Lama is expected to be 750,000—800,000 ounces at total cash costs of $20—$50 per ounce(2) assuming a silver price of $12 per ounce. For every one dollar per ounce increase in the price of silver, total cash costs are expected to decrease by about $35 per ounce. Pascua-Lama remains on schedule to deliver first gold in the first quarter of 2013 and in line with its $2.8—$3.0 billion pre-production capital budget.

Jobs and skills training for Dominicans at the Pueblo Viejo site.
In 2009, Barrick entered into a transaction with Silver Wheaton Corp. to sell 25% of the life-of-mine silver production from the Pascua-Lama project and 100% of silver production from the Lagunas Norte, Pierina and Veladero mines until project completion at Pascua-Lama. Barrick receives a cash deposit of $625 million payable over three years as well as ongoing payments for each ounce of silver delivered under the agreement. This transaction is expected to enhance Pascua-Lama’s economics and introduces a partner to share the risks inherent in a project of this size. Further, the upfront cash consideration increases returns and
(2) | Total Cash costs are calculated net of silver credits assuming silver, gold, and oil prices of $12 per ounce, $950 per ounce, $75 barrel, respectively. |
17
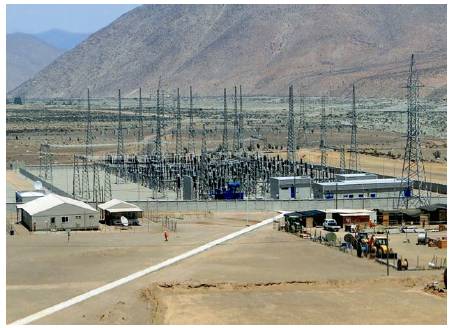
The primary substation at Punta Colorada, Chile connecting to the main power grid from which Pascua-Lama will obtain its electrical energy.
represents an attractive source of financing for the project while maintaining Barrick’s upside on 100% of the gold and 75% of silver production at Pascua-Lama.
By February 2010, detailed engineering at the project was about 90% complete. Major earthworks on the Chilean side are advancing, the portal for the ore conveyor tunnel between Chile and Argentina has been established, and the Barrealis camp has been progressing well with about 540 people currently on site. In Argentina, contractors for early earthworks preparation have mobilized to site. About 25% of the capital has been committed securing the mining fleet, processing mills, camp accommodation and earthworks contractors.
Next Generation of Projects
Beyond these advanced projects, we have four other late-stage projects, including Cerro Casale in Chile, Donlin Creek in Alaska, Reko Diq in Pakistan and Kabanga in Tanzania. This next generation of projects provides us with considerable development options for the future, representing significant latent value within our portfolio.
The feasibility study optimization work at the Cerro Casale joint venture project in Chile has been completed. Cerro Casale is one of the world’s largest undeveloped gold-copper deposits, with gold reserves of about 23 million ounces and just under 6 billion pounds of copper within gold reserves (100% basis) and an expected mine life of about 20 years. The project is located in the Maricunga district of Region III in Chile, 130 kilometers north of the Pascua-Lama project. Its proximity to Pascua-Lama is expected to provide opportunities for construction and operating synergies. Pre-production capital is expected to be about $4.2 billion (100% basis) with a construction period of about three years following the receipt of key permits.
In February 2010, Barrick agreed to acquire an additional 25% interest in the Cerro Casale project from Kinross Gold Corporation for total consideration of $475 million, thereby increasing the Company’s interest in the project to 75%. Upon completion of the transaction with Kinross Gold, Barrick’s 75% share of average annual production is anticipated to be about 750,000—825,000 ounces of gold and 170—190 million pounds of copper in its first full five years of operation at total cash costs of about $240—$260 per ounce1 assuming a copper price of $2.50 per pound. A $0.25 per pound change in the copper price would result in an approximate $50 per ounce impact on the expected total cash cost per ounce over this period. On a life-of-mine basis, the Company’s share of average annual production is anticipated to be about
18
600,000—650,000 ounces of gold and about 170—190 million pounds of copper at total cash costs of about $140—$160 per ounce.
Further optimization work on the Donlin Creek project in Alaska, with almost 37 million ounces in measured and indicated gold resources (100% basis) is underway, primarily focused on the potential to utilize natural gas to reduce operating costs. These studies are expected to be completed by mid-2010.
Reko Diq is an immense copper-gold porphyry deposit on the Tethyan belt in the Balochistan province in southwest Pakistan with a total of about 25 million ounces of measured and indicated gold resources, 17 million ounces of inferred gold resources as well as 31 billion pounds of measured and indicated copper resources and 22 billion pounds of inferred copper resources, of which our share is 37.5% . Antofagasta plc and the Balochistan government hold interests in the project of 37.5% and 25%, respectively. The feasibility study is being finalized and is now under review, while progress continues with the expansion studies and the baseline environmental and social impact assessment, which is expected to be completed in the first half of 2010.
Our Kabanga project in Tanzania, a 50-50 joint venture with Xstrata Plc, is a world-class-sized nickel sulfide deposit acquired as part of the portfolio of a gold company in the late 1990s. Kabanga has a compelling combination of high tonnage and high grade. The feasibility study is expected to be finalized early in the third quarter of 2010 at which point we will evaluate how best to maximize the value of this asset for the benefit of Barrick’s shareholders.

Early in 2010, Barrick agreed to increase its ownership interest in Cerro Casale from 50% to 75%. Barrick’s 75% share of average annual production is expected to be about 750,000—825,000 ounces of gold and about 170—190 million pounds of copper at total cash costs of about $240—$260 per ounce in its first full five years of operation.
(1) | Based on gold price, copper price, and oil price assumptions of $950 per ounce, $2.50 per pound and $75 per barrel, respectively, and assuming a Chilean peso foreign exchange rate of 525:1. |
19
Reserve and Resource Development
Reserves are the lifeblood of any mining company. In 2009, Barrick grew the world’s largest gold reserve base for the fourth consecutive year to 139.8 million ounces. Our reserve base is well situated in geopolitically secure countries. Just over 60% of our reserves are located in investment grade countries(1), including the United States, Canada, Chile, Australia and Peru.
One of Barrick’s key priorities is to increase reserves and resources per share. Our exploration(2) growth strategy is a three-fold balanced approach that focuses on: finding new discoveries; adding reserves and resources at our existing mines; and identifying and delivering exploration upside following acquisitions. Since 1990, we havemined 100 million ounces; acquired 103 million ounces and found 135 million ounces. Over this period, we spent about $2.1 billion to discover approximately 135 million ounces for a discovery cost of about $16 per ounce.
Our success can largely be attributed to the fact that we have maintained our commitment to exploration, sustaining substantial budgets through the years. We also have an integrated and aligned exploration and corporate development team to identify early stage opportunities, acquire them, and then find the ounces.
The 2010 exploration budget is $170—$180 million. The budget supports a deep pipeline of projects and is weighted towards near-term resource additions and conversion at our existing mines while still providing support for earlier stage exploration in our operating districts. Nevada remains a key priority in 2010 with 38% of the total budget allocated to the region.
The 2010 exploration budget is weighted towards resource additions and conversions around our mines.

Darren Blasutti, Senior Vice
President, Corporate Development
“Working in close collaboration with the Exploration team, we have an integrated approach to evaluating and pursuing accretive acquisition opportunities. Our collective knowledge and extensive expertise give Barrick a strong competitive advantage in this area.”
(1) | BBB— or higher as rated by Standard & Poor’s. |
| |
(2) | Barrick’s exploration programs are designed and conducted under the supervision of Robert Krcmarov, Senior Vice President, Global Exploration of Barrick. For information on the geology, exploration activities generally, and drilling and analysis procedures on Barrick’s material properties, see Barrick’s most recent Annual Information Form/Form 40-F on file with Canadian provincial securities regulatory authorities and the U.S. Securities and Exchange Commission. |
20

Rob Krcmarov, Senior Vice
President, Global Exploration
“We have extensive land positions on many of the world’s most prospective trends and, due in large part to our consistent funding and disciplined approach to exploration, we were successful at growing reserves again in 2009.”
Reserves and Resources Summary (1),(2),(3)
at December 31, 2009 | | Proven and | | Measured and | | Inferred | |
(Barrick’s equity share) | | Probable Reserves | | Indicated Resources | | Resources | |
Gold (000s oz) | | 139,751 | | 61,788 | | 31,594 | |
North America | | 55,219 | | 32,510 | | 12,110 | |
South America | | 49,581 | | 7,856 | | 4,396 | |
Australia Pacific | | 18,048 | | 16,228 | | 11,368 | |
Africa | | 16,763 | | 5,170 | | 3,546 | |
Other | | 140 | | 24 | | 174 | |
Other Metals | | | | | | | |
Copper (M lbs) | | 6,063 | | 12,899 | | 9,355 | |
Nickel (M lbs) | | — | | 1,066 | | 525 | |
��
Other Metals Contained in:
| | Proven and | | Measured and | | Inferred | |
| | Probable Gold Reserves | | Indicated Gold Resources | | Gold Resources | |
Silver (000s oz) | | 1,058,424 | | 194,917 | | 53,053 | |
Copper (M lbs) | | 4,403.5 | | 778.6 | | 979.1 | |
(1) | Mineral reserves (“reserves”) and mineral resources (“resources”) have been calculated as at December 31, 2009 in accordance with National Instrument 43-101 as required by Canadian securities regulatory authorities. For United States reporting purposes, Industry Guide 7, (under the Securities and Exchange Act of 1934), as interpreted by Staff of the SEC, applies different standards in order to classify mineralization as a reserve. Accordingly, for U.S. reporting purposes, Cerro Casale is classified as mineralized material. In addition, while the terms “measured”, “indicated” and “inferred” mineral resources are required pursuant to National Instrument 43-101, the U.S. Securities and Exchange Commission does not recognize such terms. Canadian standards differ significantly from the requirements of the U.S. Securities and Exchange Commission, and mineral resource information contained herein is not comparable to similar information regarding mineral reserves disclosed in accordance with the requirements of the U.S. Securities and Exchange Commission. U.S. investors should understand that “inferred” mineral resources have a great amount of uncertainty as to their existence and great uncertainty as to their economic and legal feasibility. In addition, U.S. investors are cautioned not to assume that any part or all of Barrick’s mineral resources constitute or will be converted into reserves. Calculations have been prepared by employees of Barrick, its joint venture partners or its joint venture operating companies, as applicable, under the supervision of Ivan Mullany, Vice President, Operations Support of Barrick, Rick Allan, Senior Director, Mining of Barrick, and Rick Sims, Senior Director, Resources and Reserves of Barrick. Except as noted below, reserves have been calculated using an assumed long-term average gold price of $US 825 ($Aus. 1,030) per ounce, a silver price of $US 14.00 per ounce, a copper price of $US 2.00 per pound and exchange rates of $1.10 $Can/$US and $0.80 $US/$Aus. Reserves at Cerro Casale and Round Mountain have been calculated using an assumed long-term average gold price of $US 800. Reserve calculations incorporate current and/or expected mine plans and cost levels at each property. Varying cut-off grades have been used depending on the mine and type of ore contained in the reserves. Barrick’s normal data verification procedures have been employed in connection with the calculations. Resources as at December 31, 2009 have been estimated using varying cut-off grades, depending on both the type of mine or project, its maturity and ore types at each property. For a breakdown of reserves and resources by category and for a more detailed description of the key assumptions, parameters and methods used in calculating Barrick’s reserves and resources, see Barrick’s most recent Annual Information Form/Form 40-F on file with Canadian provincial securities regulatory authorities and the U.S. Securities and Exchange Commission. |
| |
(2) | In April 2009, Barrick acquired the remaining 50% interest in the Hemlo property. 2009 reserves and resources for Hemlo reflect Barrick’s 100% interest. 2008 reserves and resources reflect Barrick’s 50% interest. |
| |
(3) | 2009 reserves and resources for Cerro Casale reflect the change in Barrick’s interest to 50% of the Cerro Casale project but do not reflect the increase to 75% following the agreement to acquire an additional 25% entered into in February 2010. 2008 reserves and resources reflect Barrick’s then 51% interest. |
21
Responsible Mining
At Barrick, we strive to be a global leader in responsible mining. Our priority is to safeguard the environment, to protect the safety of our employees, and to improve the quality of life in the communities and countries where we operate. In 2009, we continued to make substantial progress in these areas and were recognized for our leadership. For the second consecutive year, Barrick was named to the Dow Jones Sustainability World Index (DJSI), ranking the Company as a global leader in social and environmental responsibility. Barrick was also named one of the best 50 corporate citizens in Canada for 2009 by Corporate Knights, the Canadian Magazine for Responsible Business.
Globally, Barrick’s strategy is to engage with communities, governments and other stakeholders to earn support for our operations and build effective community programs. In Tanzania, Papua New Guinea, Peru and other developing countries, where nine Barrick mines are located, the Company provides direct employment to nearly 10,000 people and generates important revenue to governments. In these countries, we invest in health care, nutrition, education and other necessities of life that are the building blocks of development. Our extensive training programs enable us to hire locally and assist area businesses to become suppliers to our operations.
Education and Training
At the Pascua-Lama project on the border of Chile and Argentina, nearly 10,000 people have taken part in wide-ranging training programs to build capacity and enhance the local skill base. Nearby, in Chile’s Atacama Region, Barrick and a growing alliance of non-governmental partners (NGOs) are moving forward with a series of targeted programs to alleviate poverty in the region. Through the Atacama Commitment, isolated communities have gained internet access for the first time and 400 school children are now using new wireless laptop computers in the classroom.
In Tanzania, Barrick was instrumental in opening three new schools in 2009 near our new Buzwagi operation, while at North Mara about 2,000 students were able to pursue their studies as a result of royalty payments to local villages in 2009. Barrick is also investing approximately $4.5 million to finance a new government-industry national training program to develop the technical skills of Tanzanians and reduce reliance on expatriate workers.

Working with the Dominican Republic’s Ministry of Education, Barrick is helping to raise academic standards at Primary and Secondary schools like Sabana Del Rey Public School. Programs at local schools are receiving strong support from teachers and principals.
22

The Lake Zone Health Initiative was established by Barrick to help combat HIV/AIDS, malaria and tuberculosis and improve access to health services for underserved populations. This collaborative effort involves the Tanzanian government, aid agencies, NGOs and other partners.
Community Health
In Papua New Guinea, where a severe shortage of health services exists, Barrick invests in health care infrastructure and supports a comprehensive HIV/AIDS program in partnership with the government and the Asian Development Bank. Community health programs to combat HIV/ AIDS, malaria and tuberculosis continue to make a positive difference in Tanzania, where Barrick has established the Lake Zone Health Initiative. This strategic public-private sector partnership involves the Tanzanian government, aid agencies, NGOs and others in a collaborative effort to improve the provision of health services to underserved populations in the country’s Lake Zone Region.
Near the Company’s Lagunas Norte mine in Peru, our $1.3 million partnership with World Vision is enabling about 4,000 children and families in 30 communities to improve their health and nutrition and break the cycle of poverty. In Pakistan, at our Reko Diq project, we are training women health workers to address a serious gap in basic health care services to women and children.
Indigenous Peoples
Since 2006, Barrick has contributed nearly $1.6 million toward education, cultural

Kelvin Dushnisky, Executive Vice
President, Corporate Affairs
“We believe our host communities have a legitimate stake in our operations and should benefit from them.We have built our reputation as a company committed to responsible business practices and to sharing the benefits of the projects we develop. The relationships we have established with communities and governments around the world reflect our values as a company.”
23
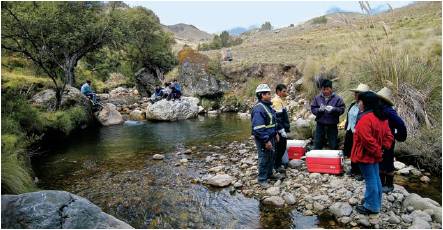
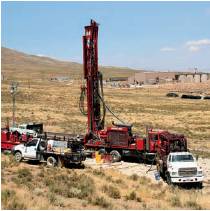
Community members take water samples and select an independent laboratory to test water quality near the Lagunas Norte mine in Peru. This activity provides transparency and builds trust within the community.
preservation and community initiatives benefiting Western Shoshone tribes in Nevada. The establishment of an historic Collaborative Agreement in 2008 has led to increased training and employment for Western Shoshone and created 150 scholarships for Shoshone students. Barrick has recently committed to provide majority financing to build the new Ely Shoshone Elders’ Center, which will serve the growing seniors population in the Shoshone community of Ely. Strong partnerships also exist with the Wiradjuri people in Australia and the Diaguita community near our Pascua-Lama project.
Environment
Barrick has continued to meet high environmental standards, while pursuing new avenues for industry leadership.
The Company’s climate change program is helping to set the standard within the gold mining industry. In 2009, we completed a risk assessment to identify and address the business risks associated with climate change, while continuing to improve overall energy efficiency. In 2010, Barrick will adopt a global climate change standard that will be applied at all operations.
Building on our record of responsible mine closure, in 2009 Barrick adopted a Global Mine Closure Standard, which formalizes our existing environmental and technical guidelines in this area. The Standard integrates a wide range of mine closure activities, including the practice of concurrent environmental reclamation. Under new Company guidelines, an assessment of the socio-economic aspects of mine closure will also be conducted, with the goal of mitigating potential negative outcomes and identifying post-closure opportunities in affected local communities. This innovative, multidisciplinary approach will take into account such issues as local employment, economic diversification and alternative uses for former mine property.
In 2009, the Company adopted a new biodiversity standard to preserve biodiversity and protect habitats around our operations. The standard will apply from the exploration stage to post-mine closure with the goal of no net loss to biodiversity. Barrick will also expand its engagement with Conservation International, establishing a multi-year partnership in the Dominican Republic at our Pueblo Viejo project, where the Company has been engaged in a major clean-up of historic environmental impacts associated with a former mining operation at the site. Barrick will also continue to support Conservation International’s important biodiversity research in Papua New Guinea, near the Porgera Joint Venture.
We have strengthened our company-wide focus on water conservation, setting our sights on industry leadership in this area following the adoption of a global water conservation standard in 2008. Barrick has also achieved certification of 19 operations under
24
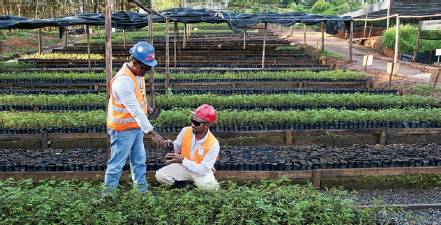
At the Pueblo Viejo project in the Dominican Republic, Barrick has partnered with the Dominican Government to clean up historic environmental damage from a former mine. Pictured are nurseries used to grow plants for environmental remediation and reclamation at the site.
the International Cyanide Management Code — more than any other gold producer — with a further four mines on track for certification in the future.
Safety and Health
Barrick is focused on continually improving our safety approach with a goal of achieving zero incidents across the entire Company. Barrick has a comprehensive Safety and Health Management system that addresses such areas as leadership, training, risk management, operational controls, health and wellness, emergency preparedness and performance measurement.
Over the past 10 years, the Company has dramatically improved its safety performance through a concerted program of training, awareness, and improved procedures. This improvement continued in 2009 as evidenced by a decline of 25% in the overall lost-time frequency rate, and a decline in the total recordable injury rate of 10%. Thirteen reporting locations, including five operating mines and all of Barrick’s project sites, completed the year with no lost-time injuries. The Ruby Hill mine in Nevada completed the entire year with zero recordable injuries, a world-class performance. Barrick’s Pascua-Lama project has now achieved more than seven million hours (or five years) with no lost-time injuries. In addition, the Exploration group, which is active in many locations around the world, had no lost-time injuries in 2009. The South America regional business unit completed an entire quarter with no lost-time injuries — a new benchmark for the Company.
Despite these positive achievements, there were four work-related
Don Ritz, Senior Vice President,
Safety and Leadership
“When we talk about creating a safety culture at Barrick, we mean that safety becomes such an engrained priority for everyone that it is an integral part of what we believe and the way we approach our work every day.”
25

Emergency preparedness is part of every site’s regular safety training. High altitude evacuations practiced here at Pascua-Lama are relevant in the challenging working conditions in the Andes mountains.
fatalities at Barrick sites during 2009. One employee died from a bee sting; the others fell from height. We were deeply saddened by these incidents. It is Company policy to conduct a full investigation and take corrective actions. Barrick developed new procedures for identifying bee hives on site and removing them safely, as well as recording known allergies and stocking EpiPens and special protective gear for such emergencies. Barrick reviewed its procedures related to working from height and issued new policies and guidelines. The Company also renewed efforts to increase employee awareness about how to work safely at height and around open holes.
During 2009, Barrick introduced new policies and procedures for lightning protection and health screening for people working at high altitudes.
Driving incidents account for about half of all high potential safety incidents. In 2009, the Company banned the use of cell phones and electronic devices while operating vehicles. Barrick installed driver training simulators in each business region to help drivers improve their skills. The Company also introduced its Drive First program — a series of online training modules to help employees improve their driving behaviors. At Bald Mountain and Cortez, Barrick conducted a trial with in-vehicle monitoring devices that coach drivers on safe driving behaviors. Barrick will begin global implementation of these devices during the second quarter of 2010. Throughout 2010, the Safety and Health group will focus on risk management and health standard compliance, as well as safe driving initiatives.
Patrick Garver, Executive Vice
President and General Counsel
“It has to be the responsibility of each of us, no matter what our position is, no matter what part of the Company we work in, to consistently demonstrate the best of Barrick. And the best of Barrick is an unwavering commitment to responsible mining.”
26
Financial Report
28 Management’s Discussion and Analysis 96 Financial Statements 100 Notes to Consolidated Financial Statements 155 Mineral Reserves and Resources 163 Corporate Governance and Committees of the Board 164 Shareholder Information 166 Board of Directors and Senior Officers
27
Management’s Discussion and Analysis (“MD&A”)
Management’s Discussion and Analysis (“MD&A”) is intended to help the reader understand Barrick Gold Corporation (“Barrick”, “we”, “our” or the “Company”), our operations, financial performance and present and future business environment. This MD&A, which has been prepared as of February 17, 2010, should be read in conjunction with our unaudited consolidated financial statements for the year ended December 31, 2009. Unless otherwise indicated, all amounts are presented in US dollars.
For the purposes of preparing our MD&A, we consider the materiality of information. Information is considered material if: (i) such information results in, or would reasonably be expected to result in, a significant change in the market price or value of our shares; or (ii) there is a substantial likelihood that a reasonable investor would consider it important in making an investment decision; or (iii) if it would significantly alter the total mix of information available to investors. We evaluate materiality with reference to all relevant circumstances, including potential market sensitivity.
Continuous disclosure materials, including our most recent Form 40-F/Annual Information Form, annual MD&A, audited consolidated financial statements, and Notice of Annual Meeting of Shareholders and Proxy Circular will be available on our website at www.barrick.com, on SEDAR at www.sedar.com and on EDGAR at www.sec.gov. For an explanation of terminology unique to the mining industry, readers should refer to the glossary on page 91.
Cautionary Statement on Forward-Looking Information and Changes in Definition of Non-GAAP Performance Measures
Certain information contained or incorporated by reference in this MD&A, including any information as to our strategy, projects, plans or future financial or operating performance, constitutes “forward-looking statements”. All statements, other than statements of historical fact, are forward-looking statements. The words “believe”, “expect”, “anticipate”, “contemplate”, “target”, “plan”, “intend”, “continue”, “budget”, “estimate”, “may”, “will”, “schedule” and similar expressions identify forward-looking statements. Forward-looking statements are necessarily based upon a number of estimates and assumptions that, while considered reasonable by us, are inherently subject to significant business, economic and competitive uncertainties and contingencies. Known and unknown factors could cause actual results, including costs, production and returns, to differ materially from those projected in the forward-looking statements. Such factors include, but are not limited to: the impact of global liquidity and credit availability on the timing of cash flows and the values of assets and liabilities based on projected future cash flows; fluctuations in the currency markets (such as Canadian and Australian dollars, South African rand, Chilean peso, Argentinean peso, Peruvian sol and Papua New Guinean kina versus US dollar); fluctuations in the spot and forward price of gold and copper or certain other commodities (such as silver, diesel fuel and electricity); changes in US dollar interest rates or gold lease rates that could impact the mark-to-market value of outstanding derivative instruments and ongoing payments/receipts under interest rate swaps and variable rate debt obligations; risks arising from holding derivative instruments (such as credit risk, market liquidity risk and mark-to-market risk); changes in national and local government legislation, taxation, controls, regulations and political or economic developments in Canada, the United States, the Dominican Republic, Australia, Papua New Guinea, Chile, Peru, Argentina, South Africa, Tanzania, Russia, Pakistan or Barbados or
28
other countries in which we do or may carry on business in the future; business opportunities that may be presented to, or pursued by, us; our ability to successfully integrate acquisitions; operating or technical difficulties in connection with mining or development activities; employee relations; availability and increased costs associated with mining inputs and labor; litigation; the speculative nature of exploration and development, including the risks of obtaining necessary licenses and permits; diminishing quantities or grades of reserves; changes in costs and estimates associated with our projects; adverse changes in our credit rating; and contests over title to properties, particularly title to undeveloped properties. In addition, there are risks and hazards associated with the business of exploration, development and mining, including environmental hazards, industrial accidents, unusual or unexpected formations, pressures, cave-ins, flooding and gold bullion or copper cathode losses (and the risk of inadequate insurance, or inability to obtain insurance, to cover these risks). Many of these uncertainties and contingencies can affect our actual results and could cause actual results to differ materially from those expressed or implied in any forward-looking statements made by, or on behalf of, us. Readers are cautioned that forward-looking statements are not guarantees of future performance. All of the forward-looking statements made in this MD&A are qualified by these cautionary statements. Specific reference is made to Barrick’s most recent Form 40-F/Annual Information Form on file with the SEC and Canadian provincial securities regulatory authorities for a discussion of some of the factors underlying forward-looking statements. We disclaim any intention or obligation to update or revise any forward-looking statements whether as a result of new information, future events or otherwise, except to the extent required by applicable law.
Changes in Definitions of Non-GAAP Financial Performance Measures
We use certain non-GAAP financial performance measures in our MD&A. For a detailed description of each of the non-GAAP measures used in this MD&A, please see the discussion under “Non-GAAP Financial Performance Measures” beginning on page 85 of our MD&A.
Adjusted Operating Cash Flow
Starting in this MD&A, we are introducing “Adjusted Operating Cash Flow” as a non-GAAP measure. We have adjusted our operating cash flow to remove the effect of “Elimination of gold sales contracts.” This settlement activity is not reflective of the underlying capacity of our operations to generate operating cash flow and therefore this adjustment will result in a more meaningful operating cash flow measure for investors and analysts to evaluate our performance in the period and assess our future operating cash flow generating capability. For a more fulsome description of this new measure, please refer to page 86 in the Non-GAAP Financial Performance Measures section of this MD&A.
Adjusted EBITDA
Starting in this MD&A, we are introducing “Adjusted EBITDA” as a non-GAAP measure. We have adjusted our EBITDA to remove the effect of “Elimination of gold sales contracts.” This settlement activity is not reflective of the underlying capacity of our operations to generate earnings and therefore this adjustment will result in a more meaningful earnings measure for investors and analysts to evaluate our performance in the period and assess our future earnings generating capability. For a more fulsome description of this new measure please refer to page 88 in the Non-GAAP Financial Performance Measures section of this MD&A.
Adjusted Net Income
In 2009, we updated the items included in our reconciliation of net income to adjusted net income for items that are not reflective of the ongoing operational results. These adjustments will result in a more meaningful adjusted net income for investors and analysts to assess our current operating performance and to predict future operating results:
· Added “Effect of tax rate changes” to exclude the effect of corporate income tax rate changes beyond the control of management.
· Added “Elimination of gold sales contracts” to exclude any gains/losses related to the elimination of the contracts. Included in this line is the loss incurred upon initial recognition of the liability and any gains/losses due to mark-to-market adjustments through the date contracts were settled.
29
· Added “Non-recurring restructuring costs” to exclude the non-recurring charges related to our Organization Review. Restructuring costs related to our mine closures are not included in this adjustment.
· Adjusted “Gains/losses on the disposition of long-lived assets” to “Gains/losses on acquisitions/dispositions” to include bargain purchase gains and gains on step acquisitions.
We believe that each of these changes is consistent with our definition of adjusted net income, as described in the Non-GAAP Financial Performance Measures on page 85.
Realized Price per Ounce/Pound
In 2009, we updated the items in our Reconciliation of Sales to Realized Price per ounce/pound to include export duties that are paid upon sale and currently netted against revenues. We believe this provides investors and analysts with a more accurate measure with which to compare to market gold prices and to assess our gold sales performance and is consistent with our definition as described in the Non-GAAP Financial Performance Measures on page 89.
Net Cash Costs/Net Cash Margin
In 2009, we changed the non-GAAP measure “total gold cash costs per ounce — full credit basis for non-gold sales” to “net cash costs per ounce” in name only. Starting in 2009, we have placed greater emphasis on our net cash costs per ounce measure because we believe that it illustrates the performance of our business on a consolidated basis and enables investors to better understand our performance in comparison to other gold producers who present results on a similar basis. As part of this emphasis, we also introduced the measure “net cash margin”, which is calculated as the difference between realized price and net cash costs per ounce, as opposed to the measure “cash margin” which was previously disclosed by us and was calculated using total cash costs per ounce.
Index | | | |
| | | |
31 | Business Overview |
| | | |
| 31 | | Our Business |
| 32 | | Our Strategy |
| 32 | | Capability to Execute our Strategy |
| 36 | | 2009 Results at a Glance |
| 38 | | 2009 Business Developments |
| 40 | | Outlook for 2010 |
| | | |
44 | Market Review |
| | | |
50 | Financial and Operating Results |
| | | |
| 50 | | Review of Financial Results |
| 52 | | Review of Operating Results |
| 55 | | Reserves |
| 55 | | Review of Operating Segment Performance |
| 59 | | Review of Capital Projects |
| 62 | | Review of Significant Income and Expenses |
| 64 | | Income Tax |
| | | |
65 | Financial Condition Review |
| | | |
| 66 | | Balance Sheet Review |
| 67 | | Liquidity and Cash Flow |
| 70 | | Financial Instruments |
| 71 | | Commitments and Contingencies |
| | | |
73 | Review of Quarterly Results |
| |
74 | US GAAP Critical Accounting Policies and Estimates |
| |
82 | International Financial Reporting Standards (IFRS) |
| |
85 | Non-GAAP Financial Performance Measures |
| |
91 | Glossary of Technical Terms |
30
Business Overview
Our Business
Barrick’s vision is to be the world’s best gold mining company by finding, acquiring, developing and producing quality reserves in a safe, profitable and socially responsible manner. Guided by our five core values, behave like an owner, act with a sense of urgency, be a team player, continually improve, and deliver results, we have become the world’s preeminent gold mining company.
We have the largest market capitalization and our annual gold production and gold reserves are the largest in the industry. We also produce significant amounts of copper at some of our operating mines. We sell our production in the world market through three primary distribution channels: gold bullion is sold in the gold spot market; gold and copper concentrate is sold to independent smelting companies; and copper cathode is sold to various manufacturers and traders.
MARKET CAPITALIZATION as at December 31, 2009
($USD billions)
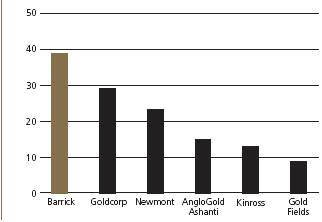
PROVEN AND PROBABLE GOLD RESERVES(1)
(millions of ounces)
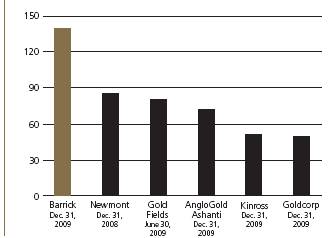
(1) Based on most recent public information as at date noted.
Our large mineral inventory is well situated in geopolitically secure countries. Approximately 61% of our reserves are located in investment grade(1) countries, including the United States, Chile, Australia, Peru and Canada, which minimizes our concentration risk to any one country and provides a lower overall risk profile.
(1) Defined as being rated BBB- or higher by S&P.
2009 GOLD PRODUCTION(1)
(millions of ounces)

(1) Based on 2009 actual results, where available. Newmont is based on the most recent public guidance issued.
31
2009 TOTAL CASH COSTS(1)
($USD per ounce)
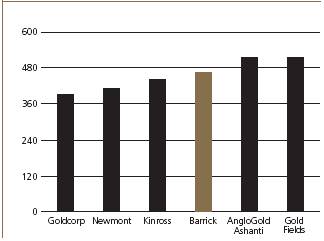
(1) | Based on 2009 actual results for Barrick, AngloGold Ashanti and Gold Fields. All others are based on the most recent public guidance issued. |
We have operating mines or projects in Canada, the United States, the Dominican Republic, Australia, Papua New Guinea, Peru, Chile, Argentina, Pakistan and Tanzania. We manage our business using a regional business unit (“RBU”) structure. We have four RBUs, each of which is led by its own Regional President: North America, South America, Australia Pacific, and Africa. In addition, we have a Capital Projects group, distinct from our RBUs, to focus on managing our project pipeline. The geographic split of gold production for the year ended December 31, 2009 was as follows:
GOLD PRODUCTION BY REGION IN 2009
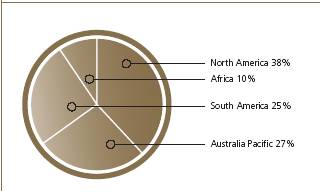
Our Strategy
Our core objective is to maximize long-term value for our shareholders by following a strategy that emphasizes return on capital, as well as earnings and cash flow growth, while providing full leverage of production and reserves/resources to market gold prices. To deliver on this objective, we focus on the following strategic priorities:
Financial Strength
· Optimize realized gold price
· Contain production costs
· Optimize return on capital expenditures
· Maintain a strong financial position and good liquidity
Gold Leverage
· Meet annual production targets
· Grow reserve/resource base
· Unhedged on all future gold production
Growth
· Develop advanced projects on time and on budget
· Acquire future growth opportunities
Responsible Mining
· Improve safety and environmental performance, and
· Maintain our social license to operate.
Capability to Execute our Strategy
Our capability to execute our strategy comes from the strength of our experienced management team, skilled workforce and organizational structure, a strong pipeline of projects that facilitates the long-term sustainability of our business, our strong financial position, and our commitment to corporate social responsibility.
Experienced Management Team, Skilled Workforce and Organizational Structure
In 2009 we experienced a number of changes in our senior management team. The Company appointed Aaron Regent, an experienced executive with combined expertise in the mining and finance sectors, as the President and Chief Executive Officer of the Company. Mr. Regent’s new leadership is complemented by an experienced senior management team with a proven track record at Barrick and within the mining industry. Strong leadership and governance are critical to the successful implementation of our core business strategies.
32
Acquisitions have always been an integral part of our growth strategy. Our corporate development team has demonstrated their ability to identify and acquire targets that have been successfully integrated into our operations. In 2006, we acquired Placer Dome Inc., one of the world’s largest gold mining companies, strengthening our position as the industry leader. Since then we have made a number of all cash acquisitions designed to expand our project pipeline, or increase our current production profile. These acquisitions include: a 75% interest in Cerro Casale in Chile; a 100% interest in the Kainantu exploration property in Papua New Guinea; the remaining 40% interest in our Cortez mine in the United States; the remaining 50% interests in our Storm (United States) and Hemlo (Canada) mines; and an additional 20% interest in our Porgera mine in Papua New Guinea. We have also made a number of recent divestitures that have allowed us to realize value in non-core assets that can then be redeployed into our gold portfolio. These all cash acquisitions and non-core divestitures are important to our growth strategy as they meet our goal of growing our production/reserves and resources without diluting current shareholders, thus increasing shareholder leverage to gold prices.
A skilled workforce has a significant impact on the efficiency and effectiveness of our operations, particularly our ability to meet our annual production targets and contain costs. The remote nature of many of our mine sites presents some challenges in maintaining a well-trained and skilled workforce. We continue to focus on training and development for key members of our senior mine management, technical professionals and frontline workers through our talent management processes, enhanced distance learning programs and e-learning technologies in order to meet this challenge. We have also expanded our technical training and development programs beyond our technical mining disciplines (mining, metallurgy, maintenance and geology) to include our critical support functions. This program is now improving the technical and leadership skills of over 1,000 professionals. Leadership development for key leadership positions and high potential employees will be an area of focus in the coming year in order to support our continued growth plans by maintaining a robust leadership pipeline.
We manage our business using an RBU structure to ensure that each region is able to customize corporate strategies to meet the unique conditions in which they operate. Each of our RBUs is led by its own Regional President: North America, South America, Australia Pacific, and Africa, operating as a standalone business unit with a range of functional groups. Since their inception, the RBUs have added value to our business by realizing operational efficiencies in the region, allocating resources more effectively and understanding and better managing the local business environment, including labor, consumable costs and supply and government and community relations.
In the second half of 2009 we completed an internal organization review with the objective of improving organizational efficiency and strengthening our RBU structure. This review was focused on ensuring clear alignment within the Company on key priorities, that appropriate resources were in place to support these priorities and that there was clarity around roles and responsibilities. An additional goal was to identify ways to simplify work practices and reduce our overall general and administrative cost structure.
Key results of the review included:
· Elimination of identified areas of overlap;
· More responsibility and accountability at the RBU level; and
· A net reduction of about 80 positions, primarily at our corporate office in Toronto.
Exploration and Development of New Mines
Our inventory of exploration and development projects represents an important component of our long-term strategy of growing our reserves and resources. We have an Exploration Group that is focused on finding new discoveries, adding reserves and resources at our existing mines and identifying and delivering exploration upside following acquisitions. We have been successful in adding reserves as a company. Since 1990, we have spent approximately $2 billion on exploration, which has resulted in the discovery of approximately 135 million ounces of reserves, substantially more than the 99 million ounces that we have produced in the same time period. The per ounce cost of reserve additions of approximately $16 has added substantial value to the Company. We prioritize exploration targets to optimize the investment in our exploration programs and are currently focused on Nevada, Chile and Papua New Guinea, where we believe there is excellent potential to make new discoveries and to expand reserves and resources at our existing mines and projects.
33
RESERVES AND RESOURCES (millions of ounces)
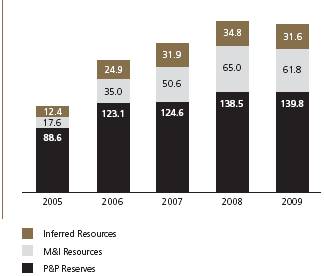
Building new mines is key to our long-term goal of increasing profitability and building long-term shareholder value. It can take a number of years for a project to move from the exploration stage through to mine construction and into production and this time frame has increased in recent years, as considerable opposition to new mining projects can develop from institutional NGOs or unstable political climates. The development of a new mine requires successful permitting and government relations, community dialogue and engagement, and significant financial and human capital. This significant increase in the timeline and cost of developing projects is reflected in our business strategy by ensuring that we have an inventory of projects combined with effective management of current operating mines.
The projects in our portfolio are at various stages of development, ranging from scoping to feasibility to construction. We have a dedicated Capital Projects group to focus on managing our large projects through this process, up to and including the building of new mines. This specialized group manages all project activities up to and including the commissioning of new mines, at which point responsibility for mine operations is handed over to the RBUs. Over the past five years, we have built seven new projects on time and near budget, namely Tulawaka, Lagunas Norte, Veladero, Cowal, Ruby Hill, Buzwagi and Cortez Hills. We expect that this experience will allow us to develop the two projects currently at an advanced stage (Pueblo Viejo and Pascua-Lama), which we expect to be commissioned over the next three years and which are expected to contribute significant low cost production.
Financial Strength
The recent global economic crisis has underlined the importance of maintaining adequate levels of liquidity and a strong balance sheet. We actively manage our liquidity by focusing on maintaining and growing operating cash flows; effective capital allocation, including prioritization of capital projects; and putting in place financing, when appropriate, for our capital needs. Of critical strategic importance is the ability to optimize capital employed through an effective and efficient capital allocation process. Ownership of Barrick’s capital allocation processes and standards is provided by a Business Strategy and Capital Allocation group. Through this group, the capital allocation strategy for the Company is developed and regularly updated by compiling and analyzing information regarding spend alternatives and opportunities. Capital is deployed in alignment with the strategic priorities of the Company, and appropriate performance management activities are in place to ensure that expected returns on capital are achieved.
In 2009, we completed a $4.0 billion equity offering and completed two debt issues, totaling $2.0 billion, while maintaining our S&P “A” credit rating. This capital enabled us to eliminate all of our Gold Hedges(2) and a significant portion of our Floating Contracts(2), providing our investors with full leverage to gold prices. Our strong balance sheet and ability to generate significant operating cash flows in a high gold price environment should enable us to maintain our strong financial position and good liquidity, and to fund our development projects and acquisitions.
(2) | The Gold Hedges are fixed price (non-participating) gold contracts and the Floating Contracts are floating spot-price (fully-participating) gold contracts. The Gold Hedges, together with the Floating Contracts, comprise the “Gold Sales Contracts”. |
34
Corporate Responsibility
Operating in a socially responsible manner is critical in maintaining a license to operate in our industry. We are committed to making a positive difference in the communities in which we live and work. We recognize that responsible behavior is our calling card, creating opportunities to generate greater value for our shareholders, while at the same time fostering sustainable development in the communities and countries where we operate. In 2009, we were named to the Dow Jones Sustainability World Index (DJSI), ranking the Company as a top performer in corporate social responsibility worldwide for the second consecutive year. The renewed listing on the index reinforces Barrick’s position among the most sustainability-driven companies in the world.
Responsible environmental management is central to our success as a leading gold mining company. In order to accomplish this goal across our 26 mines and four regions, we have an Environmental Management System which guides all of our sites. We have also developed and are continuing to develop specific performance standards. Our new Global Water Conservation Standard, completed in 2008, is now being implemented as a company-wide priority. In 2009, we drafted three additional Standards, including a Biodiversity Standard, a Mine Closure Standard and an Incident Reporting Standard, which are currently being implemented. In certain respects, these Standards exceed regulatory requirements and represent industry best practices.
Barrick was a leading participant in the development of the International Cyanide Management Code and, by the end of 2009, we had achieved Cyanide Code certification at 19 of our 26 operations. Of the balance, four do not currently use cyanide and the remaining three are working towards certification, which we expect they will receive before the end of 2012.
Barrick recognizes the risks that climate change represents to society and to our long-term success. We have adopted a Climate Change program with a focus on energy efficiency and the use of renewable energy to reduce the Company’s carbon footprint. The program builds on energy efficiency programs and renewable energy projects already underway at our operations and embeds climate change considerations into business management processes and investment decision-making. All 26 Barrick mines have conducted energy self-assessments and are working toward greater energy efficiency and conservation. A small hydroelectric project in Chile’s Atacama Desert was brought on line in 2009. This end-of-pipe power generator produces power from water pumped 90 km to the minesite from the Negrillar aquifer at the base of the Andes. The underground mines in Nevada have successfully implemented bio-diesel use which has the combined benefit of reduced GHG emissions and lower particulate matter in engine exhaust.
We believe that the health and safety of our workers is fundamental to our business. Our vision is: “Every person going home safe and healthy every day”. We are committed to the identification and elimination or control of workplace hazards for the protection of ourselves and others. Our long-term goal is to be a zero incident company.
For us to succeed in fulfilling this goal, we:
· Provide the expertise and resources needed to maintain safe and healthy working environments;
· Established clearly defined safety and occupational health programs and measure safety and health performance, making improvements as warranted;
· Operate in accordance with recognized industry standards, while complying with applicable regulations;
· Investigate the causes of accidents and incidents and develop effective preventative and remedial action;
· Train employees to carry out their jobs safely and productively;
· Maintain a high degree of emergency preparedness; and
· Require that vendors and contractors comply with our applicable safety and health standards.
35
2009 Results at a Glance
Financial Highlights for the Years Ended December 31(1)
(in millions, except where indicated) | | 2009 | | 2008 | | $ Change | | % Change | |
Sales | | $ | 8,404 | | $ | 7,913 | | $ | 491 | | 6 | % |
Net income | | (4,274 | ) | 785 | | (5,059 | ) | (644 | )% |
Per share | | (4.73 | ) | 0.90 | | (5.63 | ) | (626 | )% |
Adjusted net income | | 1,810 | | 1,661 | | 149 | | 9 | % |
Per share | | 2.00 | | 1.90 | | 0.10 | | 5 | % |
EBITDA | | (2,514 | ) | 2,347 | | (4,861 | ) | (207 | )% |
Adjusted EBITDA | | 3,419 | | 2,347 | | 1,072 | | 46 | % |
Operating cash flow | | (2,322 | ) | 2,254 | | (4,576 | ) | (203 | )% |
Adjusted operating cash flow | | 2,899 | | 2,254 | | 645 | | 29 | % |
Cash and equivalents | | $ | 2,564 | | $ | 1,437 | | $ | 1,127 | | 78 | % |
(1) The amounts presented in this table include the results of discontinued operations.
Financial Results
· Net loss of $4.3 billion, reflecting the decision to eliminate our Gold Hedges and Floating Contracts
· Adjusted net income of $1.8 billion, a 9% increase over the prior year largely due to higher cash margins with the rise in realized gold prices and continuing the five year trend of increasing adjusted net income
· Net outflow of $2.3 billion of operating cash flow, reflecting the $5.2 billion spent on settlement of our Gold Hedges and a significant portion of our Floating Contracts
· Record $2.9 billion of adjusted operating cash flow, a 29% increase over the prior year largely reflecting growing cash margins and the continuing trend of robust cash flows from operations
· EBITDA of $(2.5) billion reflecting the elimination of our Gold Hedges and Floating Contracts
· Adjusted EBITDA of $3.4 billion, a 46% increase over the prior year largely due to higher cash margins with the rise in realized gold prices and a new high for the Company
· Maintained the only “A” credit rating in the industry (as established by S&P) after issuing $4 billion in equity and $2 billion in debt during 2009
· $2.6 billion in cash at year end and an undrawn credit facility of $1.5 billion
· Net debt increased to $4.4 billion, a 51% increase over the prior year largely due to the debt issued to settle the gold sales contracts and the remaining obligation to settle the Floating Contracts. The increase in net debt over the past five years has moved in line with our activities to invest in our business, through building new projects and making all cash acquisitions.
ADJUSTED NET INCOME ($USD millions)
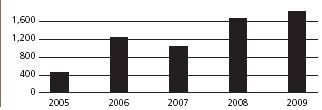
ADJUSTED OPERATING CASH FLOWS ($USD millions)
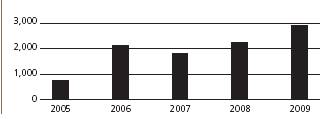
ADJUSTED EBITDA ($USD millions)
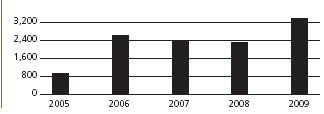
NET DEBT AND INVESTING ACTIVITIES ($USD millions)
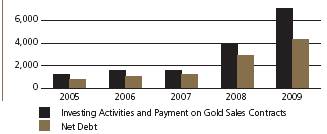
36
Operational Highlights for the Years Ended December 31(1)
| | 2009 | | 2008 | | $ Change | | % Change | |
Gold produced (000s ounces) | | 7,423 | | 7,657 | | (234 | ) | (3 | )% |
Realized price ($ per ounce) | | $ | 985 | | $ | 872 | | $ | 113 | | 13 | % |
Net cash costs ($ per ounce) | | $ | 363 | | $ | 337 | | $ | 26 | | 8 | % |
Total cash costs ($ per ounce) | | $ | 466 | | $ | 443 | | $ | 23 | | 5 | % |
Copper produced (millions of pounds) | | 393 | | 370 | | 23 | | 6 | % |
Total cash costs ($ per pound) | | $ | 1.17 | | $ | 1.19 | | $ | (0.02 | ) | (2 | )% |
(1) The amounts presented in this table include the results of discontinued operations.
Gold Leverage
· 7.4 million ounces of production, once again the largest in the industry, within our original guidance range, 3% lower than the prior year
· Gold total cash costs of $466 per ounce were within our original guidance range, 5% higher than the prior year
· Realized gold prices increased 13% in 2009 to $985 per ounce, an all-time annual high
· Cash margins increased by 21%, reflecting an increasing trend over the past five years
· Eliminated our Gold Hedges, giving us full leverage to gold price appreciation
· Copper production of 393 million pounds at lower cash costs than the previous year, continues to provide excellent margin contribution to our gold business
Growth
· Buzwagi entered into production in May 2009, contributing 189 thousand ounces at total cash costs lower than the Company average
· Significant progress on our advanced projects
· Cortez Hills expected to start production in first quarter 2010(3)
· Pueblo Viejo on track to commence production in fourth quarter 2011, with expanded capacity and within its revised $3.0 billion pre-production capital budget
· Decision to construct Pascua-Lama project in May 2009, with first production expected in first quarter 2013
· Acquired an additional 50% interest in our Hemlo mine in Canada
· Grew industry’s largest reserves to 139.8 million ounces
Responsible Mining
· Included in Dow Jones Sustainability Index (World and North America) for the second consecutive year
· 19 of 22 operations using cyanide have been certified under the International Cyanide Management Code, with the other three expected to be certified by the end of 2012
· 25% improvement in Lost Time Injury incidents in 2009
(3) | In December 2009, the appeal of the denial of a preliminary injunction sought by certain opponents of the Cortez Hills Project was denied in part and granted in part. As a result, the Company has sought a limited injunction that would restrict groundwater pumping to current levels and enjoin trucking of refractory ore (representing approximately 3% of the ore) to Goldstrike pending completion of a supplemental EIS. The plaintiffs have sought a broader injunction that would enjoin further construction and operation of the Project pending completion of the supplemental EIS. |
GOLD PRODUCTION (000s of ounces)
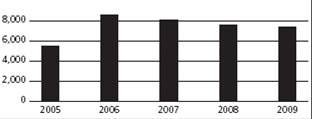
GOLDEN MARGIN ($USD per ounce)

COPPER PRODUCTION (millions of pounds)
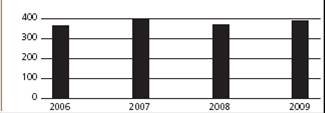
GOLD REVENUES AND REALIZED PRICES ($USD millions and per ounce)
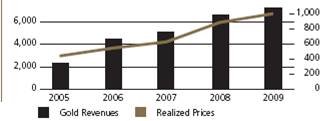
37
2009 Business Developments
Elimination of Gold Sales Contracts
In 2009, we eliminated our Gold Hedges and a substantial portion of our Floating Contracts. We made this strategic decision to gain full leverage to the gold price on all future production due to an increasingly positive outlook on the gold price and continuing robust gold supply/demand fundamentals. In addition, we believe that the Gold Sales Contracts were adversely impacting Barrick’s appeal to the broader investment community and, hence, its share price performance.
Our Gold Hedges were fixed price contracts which did not participate in gold price movements. At the time we announced the plan to eliminate them, our Gold Hedges totaled 3.0 million ounces with a mark-to-market (“MTM”) position (calculated at a spot price of $993 per ounce) of negative $1.9 billion.
Our Floating Contracts are essentially Gold Hedges that have been offset against future movements in the gold price but not yet settled. At the time we announced the plan to eliminate a significant portion of our Floating Contracts, they had a MTM position of negative $3.7 billion. This liability does not change with gold prices and is therefore economically similar to a fixed US dollar obligation as it is only subject to interest rate risk. No activity in the gold market is required to settle our Floating Contracts and we fully participate in any subsequent increase in the price of gold. As at December 31, 2009, the obligation relating to the Floating Contracts has been reduced to approximately $0.7 billion. The obligations related to the Floating Contracts are non-amortizing and primarily have 10-year terms with a current weighted average financing charge of 2%—3%. Any further reductions in the obligation related to the Floating Contracts will be subject to the same capital allocation process as our other liabilities.
| | Gold Hedges | | Floating | | | |
($ billions, except ounce | | | | MTM | | Contracts | | Total | |
amounts in millions) | | Ounces | | Liability | | Liability | | Liability(1) | |
As at September 7, 2009 | | 3.0 | | $ | 1.9 | | $ | 3.7 | | $ | 5.6 | |
MTM adjustment(2) | | — | | 0.2 | | — | | 0.2 | |
Ounces eliminated/net proceeds used to date | | (3.0 | ) | (2.1 | ) | (3.0 | ) | (5.1 | ) |
Remaining liability as at December 31, 2009 | | — | | $ | — | | $ | 0.7 | | $ | 0.7 | |
(1) | The total liability excludes a $0.1 billion settlement obligation for silver sales contracts. |
(2) | The change in liability is net of an increase in the MTM of the Gold Hedges of $0.3 billion and $0.1 billion of certain balance sheet reclassifications. |
New Sources of Capital
Equity Offering
In September 2009, we completed an equity bought deal offering of 109 million common shares at a price of $36.95 per common share for net proceeds of $3.9 billion (the “Common Share Offering”), which was used to eliminate the Gold Hedges and a portion of the Floating Contracts. The Common Share Offering was the largest equity bought deal in Canadian history and underscores the investor appetite for our stock. The increase in our common shares outstanding to 983 million shares represented a dilution to the ownership interests of shareholders prior to the Common Share Offering of approximately 12%. This dilution will have a similarly dilutive impact on our earnings per share performance on a go forward basis.
Debt Offerings
In March 2009, we issued an aggregate of $750 million of 10 year notes with a coupon rate of 6.95% for general corporate purposes. The notes are unsecured, unsubordinated obligations and will rank equally with our other unsecured, unsubordinated obligations
In October 2009, we issued $1.25 billion in debt securities comprised of: $400 million of 4.95% notes due 2020 and $850 million of 5.95% notes due 2039 (the “Debt Offering”). The net proceeds from this transaction were used to fund a further reduction of our Floating Contracts. We continue to maintain the only “A” credit rating in the industry following these transactions.
38
Silver Agreement
In September 2009, we entered into an agreement with Silver Wheaton Corp. (“Silver Wheaton”) to sell a portion of the life-of-mine silver production from the Pascua-Lama project and silver production from the Lagunas Norte, Pierina and Veladero mines until Pascua-Lama is in production. Silver Wheaton has made a cash payment of $212.5 million and will make further payments for a total cash deposit of $625 million, plus an ongoing payment for each ounce of silver delivered under the agreement.
The upfront payment stream allows us to monetize some of Pascua-Lama’s value immediately, which also enhances the overall return on investment of Pascua-Lama and leaving us with significant exposure on the remaining silver production from Pascua-Lama. We commenced the sale of silver to Silver Wheaton from the Lagunas Norte, Pierina and Veladero mines effective September 1, 2009.
Project Financing
We continue to work towards obtaining project financing for our Pueblo Viejo and Pascua-Lama projects. This external financing will assist in funding the large capital cost associated with building these mines at terms that meet our internal return on capital metrics.
Advanced Project Development
Buzwagi Production Start-up
Mine construction of our Buzwagi project in Tanzania was completed in May 2009, on time and in line with budget, and the mine has since contributed significant gold production at lower total cash costs.
Cortez Hills Commissioning
Our Cortez Hills(4) project is essentially complete and in the final stages of commissioning. The project is anticipated to be completed in line with its $500 million pre-production budget and is expected to become the seventh project in five years that we have delivered on time.
Pueblo Viejo Development
Our Pueblo Viejo project is progressing well and initial production is anticipated in the fourth quarter of 2011. The project continues to track within its budget estimate, but as a result of the plan to accelerate the expansion in processing capacity, the previously disclosed expansion capital of $0.3 billion will be brought forward such that pre-production capital is expected to be about $3.0 billion (100% basis). This will have an impact of increasing average production and lowering cash costs in the first five years of production. This project is a long life asset with an expected mine life of over 25 years.
Pascua-Lama Construction
In 2009, we began construction of Pascua-Lama with initial production expected in first quarter 2013. When complete, it is expected to be one of the lowest operating cost gold producing mines in the world. This project is a long life asset with an expected mine life of over 20 years.
Cerro Casale Advancement
We recently completed the feasibility study optimization work at our Cerro Casale joint venture project in Chile. The pre-production capital is expected to be about $4.2 billion (100% basis) with a construction period of approximately 3 years following the receipt of key permits. Cerro Casale is one of the world’s largest undeveloped gold-copper deposits.
Acquisitions and Divestitures
IPO of African Gold Mining Operations
On February 17, 2010, our Board of Directors approved a plan to create African Barrick Gold, a new company whose equity it will seek to list with the United Kingdom Listing Authority and to admit to trading on the London Stock Exchange, subject to market conditions. The new company also intends to seek a future listing on the Dar es Salaam Stock
(4) | In December 2009, the appeal of the denial of a preliminary injunction sought by certain opponents of the Cortez Hills Project was denied in part and granted in part. As a result, the Company has sought a limited injunction that would restrict groundwater pumping to current levels and enjoin trucking of refractory ore (representing approximately 3% of the ore) to Goldstrike pending completion of a supplemental EIS. The plaintiffs have sought a broader injunction that would enjoin further construction and operation of the Project pending completion of the supplemental EIS. |
39
Exchange in Tanzania. African Barrick Gold will hold Barrick’s African gold mines and exploration properties. The new company will offer about 25% of its equity in an initial public offering and Barrick will retain the remaining interest. The pricing and terms are yet to be determined; however, the offering is expected to be priced in late March, with closing expected to occur by the end of March.
Acquisitions
In February 2010, we agreed to acquire an additional 25% interest in the Cerro Casale project in Chile from Kinross Gold Corporation for consideration of $475 million, comprised of $455 million cash and the elimination of a $20 million contingent obligation which was payable by Kinross to Barrick on a production decision, thereby increasing our interest in the project to 75%.
Also in February 2010, we entered into an Implementation Agreement with Tusker Gold Limited (“Tusker”) setting out the basis of a takeover bid for net consideration of approximately $75 million. Tusker holds the other 49% interest in our Nyanzaga joint venture in Tanzania. If and when acquired, Tusker will be held in African Barrick Gold.
In September 2009, we completed the acquisition of 50% interest in the Valhalla oil and gas field, which is close to our existing Sturgeon Lake field, for total cash consideration of $53 million. This transaction was considered an asset purchase. This asset acquisition will increase the production capacity of Barrick Energy by approximately 900 boe/day in 2010.
In April 2009, we acquired the remaining 50% interest in the Williams and David Bell gold mines (“Hemlo”) for cash consideration of $50 million, thereby increasing our interest to 100%.
Asset Sales
In December 2009, we committed to a plan to dispose of our Osborne mine in Australia and we expect to finalize a transaction in first half of 2010. In July 2009, we sold our Henty mine also in our Australia Pacific operating segment for consideration of $4 million cash and $2 million in Bendigo Mining Limited shares. Both of these mines were nearing the end of their planned life.
Outlook for 2010
2010 Guidance Summary
| | 2009 | | 2010 | |
| | Actual(1) | | Guidance | |
| | | | | |
Gold | | | | | |
Production (millions of ounces) | | 7.4 | | 7.6 – 8.0 | |
Cost of Sales | | 3,431 | | 3,400 – 3,800 | |
Net cash costs ($ per ounce)(2) | | 363 | | 345 – 375 | |
Total cash costs ($ per ounce) | | 466 | | 425 – 455 | |
Amortization ($ per ounce) | | 119 | | 130 – 135 | |
Copper | | | | | |
Production (millions of pounds) | | 393 | | 340 – 365 | |
Cost of sales | | 444 | | 440 – 460 | |
Total cash costs ($ per pound) | | 1.17 | | 1.10 – 1.20 | |
Amortization ($ per pound) | | 0.20 | | 0.20 – 0.25 | |
Other amortization and accretion | | 140 | | 125 | |
Corporate administration | | 171 | | 155 | |
Exploration expense | | 144 | | 170 – 180 | |
Project expense, net (including equity)(3) | | 178 | | 210 – 230 | |
Other expense | | 359 | | 280 – 300 | |
Interest income | | 10 | | 15 | |
Interest expense | | 57 | | 190 – 220 | |
Capital expenditures — minesite sustaining | | 784 | | 1,000 – 1,200 | |
Capital expenditures — minesite expansion | | 60 | | 225 – 275 | |
Capital expenditures — projects(4) | | 1,514 | | 1,600 – 1,800 | |
Effective income tax rate | | 29 | % | 30 | % |
(1) | The amounts presented in this table include the results of discontinued operations. |
(2) | Assuming a copper price of $2.75 per pound. |
(3) | Represents Barrick’s share of expenditures. |
(4) | Represent’s Barrick’s share of expenditures including capitalized interest of about $250 million in 2010 (2009: $257 million). |
40
2010 Guidance Analysis
Production
We prepare estimates of future production based on mine plans that reflect the expected method by which we will mine reserves at each site. Actual gold and copper production may vary from these estimates due to a number of operational factors, including if the volume and/or grade of ore mined differs from estimates, which could occur because of changing mining rates, ore dilution, varying metallurgical and other ore characteristics, and/or short-term mining conditions that require different sequential development of ore bodies or mining in different areas of the mine. Certain non-operating factors may also cause actual production to vary from guidance, including litigation risk, the regulatory environment and the impact of global economic conditions. Mining rates are also impacted by various risks and hazards inherent at each operation, including natural phenomena, such as inclement weather conditions, floods and earthquakes, and unexpected civil disturbances, labor shortages or strikes.
We expect 2010 gold production to increase from its 2009 level of 7.4 million ounces to about 7.6 to 8.0 million ounces subject to the US District Court allowing Cortez Hills to operate consistent with Barrick’s motion for a limited preliminary injunction of activities. This is 0.1 million ounces lower than previously disclosed, reflecting Barrick’s reduced equity interest in production from African Barrick Gold. Increased gold production is expected primarily in North America and Africa as a result of a full year of production from both Cortez Hills and Buzwagi, respectively, as well as in South America as a result of the completion of the overland conveyor, crusher expansion and higher ore grades at Veladero; partly offset by lower production in Australia Pacific due to the divestiture of Henty during 2009, the planned divestiture of Osborne in Australia and the impact of the IPO of our African gold mining operations. Production in 2010 is expected to be higher than 2009 throughout the year, in the first half principally due to Veladero and Buzwagi, and in the second half principally due to Cortez and Goldstrike, with overall production levels higher in the second half of the year. Production for 2011 is expected to be in a similar range to 2010.
Decreased copper production is expected from 393 million pounds in 2009 to about 340 to 365 million pounds due to the planned divestiture of the Osborne mine in the second half of 2010. Accordingly, copper production is expected to be weighted to the first half of 2010.
Cost of Sales, Net Cash Costs and Total Cash Costs
We prepare estimates of cost of sales, net cash costs and total cash costs based on expected costs associated with mine plans that reflect the expected method by which we will mine reserves at each site. Cost of sales, net cash costs and total cash costs per ounce/pound are also affected by ore metallurgy that impacts gold and copper recovery rates, labor costs, the cost of mining supplies and services, foreign currency exchange rates and stripping costs incurred during the production phase of the mine. In the normal course of our operations, we attempt to manage each of these risks to mitigate, where possible, the effect they have on our operating results. The following table provides a reconciliation of our cost of sales guidance to our net cash costs and total cash costs guidance.
Cost of sales applicable to gold is expected to be in the range of $3.4 to $3.8 billion and total cash costs are expected to be in the range of $425 to $455 per ounce. Gold total cash costs in 2010 are forecast to be about 5% lower than 2009 primarily due to higher production levels from an increase in recovery rates, a
41
decrease in waste tons mined, higher silver and copper by-product credits due to increases in realized prices, and lower expected maintenance costs due to a general focus on cost reduction and effectiveness of our maintenance programs. These cost decreases are expected to be partly offset by lower tons processed, higher royalties and production taxes due to higher spot prices for gold and copper, and higher energy costs. Total gold cash costs and net cash costs for 2010 include forecasted currency and fuel hedge net gains of about $11 per ounce based on a spot oil price assumption of $75 per barrel (WTI) and a U.S. dollar to Australian dollar exchange rate assumption of $0.90.
Gold total cash costs during the year are expected to vary due to mine sequencing. Total cash costs are expected to be higher in the second quarter of 2010 due to the production mix, but year over year total cash costs are expected to decrease, particularly in the second half of 2010 with the mining of higher ore grades at Cortez and Goldstrike. Total cash costs for 2011 are expected to be slightly higher after factoring in inflation and subsequently are expected to benefit from lower cost projects, primarily Pascua Lama and Pueblo Viejo, as these come on stream.
TOTAL CASH COSTS PER OUNCE(1)
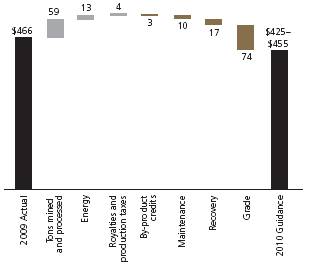
(1) Chart depicts approximate impacts of each category on total cash costs per ounce.
Cost of sales applicable to copper is expected to be about $440 to $460 million. Total cash costs are expected to be in the range of $1.10 to $1.20 per pound for copper. Total cash costs for copper are expected to be approximately $0.04 per pound lower than 2009, primarily as a result of the reduction in the price of sulfuric acid at Zaldívar.
Net cash costs are expected to be in the range of $345 to $375 per ounce(5), as the expected copper margin is expected to be approximately $80 per ounce.
(5) Assuming a copper price of $2.75 per pound
Reconciliation of Cost of Sales Guidance to Total Cash Costs per Ounce/Pound and Net Cash Costs per Ounce Guidance
| | Gold | | Copper | |
| | | | | |
Cost of sales ($ millions) | | $3,400 – $3,800 | | $440 – $460 | |
Production (millions of ounces/lbs) | | 7.6 – 8.0 | | 340 – 365 | |
| | | | | |
Total cash costs ($ per ounce/per lb) | | $425 – $455 | | $1.10 – $1.20 | |
| | | | | |
Expected copper margin per ounce(1) | | ~$80 | | | |
| | | | | |
Net cash costs ($ per ounce) | | $345 – $375 | | | |
(1) Assuming a copper price of $2.75 per pound
Exploration
Higher costs are expected in 2010 primarily reflecting ongoing mine site reserve and resource development programs, principally at Cortez, Turquoise Ridge and Porgera.
Project Expenses
Project expenses are classified under a combination of project expenses and equity method investments on our income statement. The timing of the funding for project expenditures through equity method investments and the subsequent expense recognition vary. The funding is initially recorded as an increase in the carrying amount of our investment. Our share of expenses is recognized as amounts are spent on the projects through “equity investees” in our consolidated statement of income.
42
In aggregate, we expect to expense approximately $210 to $230 million for our share of expenditures in 2010, compared to actual 2009 expense of $178 million. Our expected project expenses are primarily attributable to our commitment to complete feasibility studies at Reko Diq, Donlin Creek and Kabanga; further project optimization at Cerro Casale; the cost of studies to evaluate additional reserve and resource potential at Cortez Hills; and project feasibility studies at Lagunas Norte.
Other
The expected decrease in other expenses is primarily due to restructuring costs and non-hedge derivative and currency translation losses incurred in 2009 not presently expected to reoccur, as well as lower regional business unit costs expected in 2010.
Interest Income and Interest Expense
We expect slightly higher interest income in 2010 primarily due to higher average cash balances. We expect higher interest expense in 2010 due to higher annualized interest expense attributable to the $2 billion in debt securities issued in 2009 and project financing for the Pueblo Viejo expected to be finalized in 2010 and Pascua-Lama shortly thereafter. We also expect less interest to be capitalized mainly as a result of the startup of operations at Cortez Hills.
Capital Expenditures
Projects
The expected increase in our share of capital expenditures from $1,514 million in 2009 to about $1,600 to $1,800 million in 2010 is mainly due to accelerated construction activities at the Pueblo Viejo and Pascua-Lama projects, partly offset by the completion of the Cortez Hills and Buzwagi projects.
Expansion
The expected increase in expansion capital relates to development projects at Goldstrike, Bald Mountain, Golden Sunlight and Cortez in North America, and Veladero and Lagunas Norte in South America.
Sustaining Capital
Sustaining capital expenditures for the mine sites and corporate and regional offices are expected to increase from 2009 expenditure levels of $784 million to about $1,000 to $1,200 million, primarily due to mine development, pit dewatering, leach pad and tailings pond expansion, and other projects designed to improve plant capacity and/or efficiency. Capital expenditures for drilling at Barrick Energy are also expected to increase, to take advantage of the Alberta government drilling incentives.
Income Tax Rate
Our underlying expected effective tax rate excludes the impact of currency translation gains/losses and changes in tax valuation allowances. We do not anticipate any significant change in our underlying effective tax rate for 2010.
Outlook Assumptions and Economic Sensitivity Analysis
| | 2010 Guidance | | Hypothetical | | Impact on | | Impact on EBITDA | |
| | Assumption | | Change | | Total Cash Costs | | (millions) | |
Gold revenue | | $ | 1,050/oz | | $ | 50/oz | | n/a | | $ | 380 – $400 | |
Copper revenue | | $ | 2.75/lb | | $ | 0.25/lb | | n/a | | $ | 85 – $90 | |
Gold total cash costs | | | | | | | | | |
Gold royalties and production taxes | | $ | 1,050/oz | | $ | 50/oz | | $ | 2/oz | | $ | 14 | |
Crude oil price(1) | | $ | 75/bbl | | $ | 10/bbl | | $ | 1/oz | | $ | 8 | |
Australian dollar exchange rate(1) | | 0.90 : 1 | | 10 | % | — | | — | |
Argentinean peso exchange rate | | 4 : 1 | | 10 | % | $ | 1/oz | | $ | 9 | |
Copper total cash costs | | | | | | | | | |
Crude oil price(1) | | $ | 75/bbl | | $ | 10/bbl | | $ | 0.01/lb | | $ | 3 | |
Chilean peso exchange rate | | 525 : 1 | | 10 | % | $ | 0.01/lb | | $ | 5 | |
(1) Due to hedging activities we are largely protected against changes in these factors.
43
Market Review
In 2009, the global economy once again experienced a tumultuous year, as many commodity and stock market indices experienced historically high levels of volatility in the face of the global economic downturn and the subsequent start of the recovery process. Financial market conditions improved in the latter half of the year as global credit markets started to ease up, investor confidence began to return and many economies returned to positive growth. However, global unemployment rates are still high, global monetary conditions remain at historic lows and the prospects for a sustained recovery remain uncertain.
During the year, the US dollar was generally in decline, primarily as a result of the low interest rates offered on US dollars, investment into riskier assets, and concerns about the level of US government borrowings and deficits. Gold has historically been inversely correlated to the US dollar and that trend continued in 2009, with gold prices trading to all-time highs in a number of major currencies.
In 2009, we sold all our gold production in the spot market at market prices, providing shareholders with maximum leverage to gold prices, which allowed us to capitalize on record high gold prices. A weakening US dollar, while acting as a catalyst to higher market gold prices, also causes costs denominated in other currencies to rise when reported in US dollar terms. To the extent costs in other currencies are not hedged, the growth in gross margins from higher gold prices is eroded by appreciation in US dollar terms of those costs. To provide better leverage to market gold prices and secure higher cash margins in a rising gold price environment, we have hedged a significant portion of our input costs that are sensitive to a decline in the US dollar, particularly operating costs denominated in Australian dollars and fuel prices. Our strategy of being fully leveraged to market gold prices while hedging our exposure to input costs that are sensitive to a decline in the US dollar helped us to grow cash margin from gold sales in 2009 as US dollar weakness contributed significantly to higher market gold prices. Should gold prices decline due to US dollar appreciation, then we would not participate under this strategy from depreciating costs in other currencies since the currency component of those costs has been fixed. This strategy has the result of increasing the upside potential to generate better cash margins in a rising gold price environment, to the extent US dollar gold price increases are driven by US dollar currency depreciation.
Gold
The market price of gold is the most significant factor in determining the earnings and cash flow generating capacity of Barrick’s operations. The price of gold is subject to volatile price movements over short periods of time, especially in the current market environment, and is affected by numerous industry and macroeconomic factors that are beyond our control. Gold price volatility remained high in 2009, with the price ranging from $803 to $1,227 per ounce during the year. The average market price for the year of $972 per ounce was an all-time high. The market price of gold has been influenced by low US dollar interest rates, volatility in the credit and financial markets, investment demand and the monetary policies put in place by the world’s most prominent central banks. As a result of the global easing of monetary policy, as well as increases in announced government spending, particularly in the US, we believe that there is a possibility that both inflation and US dollar depreciation could emerge in the coming years. Gold is viewed as a hedge against inflation and has historically been inversely correlated to the US dollar. Therefore, higher inflation
44
and/or depreciation in the US dollar should be positive for the price of gold. While gold prices have come down and the US dollar has strengthened slightly in early 2010, we believe this to be a short-term movement and the long-term upward trend in prices will continue.
Average MONTHLY SPOT GOLD PRICES VS. USD INDEX
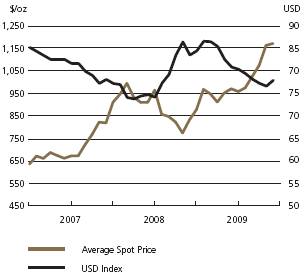
Throughout 2009, we have continued to see increased interest in holding gold as an investment, through global Exchange Traded Funds (ETFs), exchange holdings and coins. This was evidenced by the increased volumes held by ETFs and also the backlog that mints worldwide had in meeting consumer demand for gold coins.
GOLD ETF HOLDINGS(1) as at December 31
(millions of ounces)
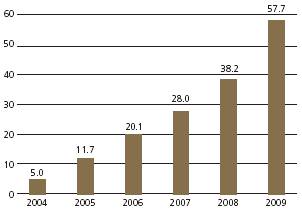
(1) | Includes the holdings of GBS (ASX), GBS (LSE), NewGoPld (JSE), GLD (NYSE), IAU (Amex), ZKB (Swiss), ETFS (London), XETRA (DAX), Julius Baer (SWX), ETFS (NYSE), CS-XMTCH (SIX), UBS-IS (USD). |
We believe that the outlook for global gold mine production will be one of declining supply in the years to come. The industry has seen a declining trend over much of the past decade, and although there has been an increase in 2009, we expect a decline over the long term. The primary drivers for the global decline are a trend of lower grade production by many producers; increasing delays and impediments in bringing projects — especially large-scale projects — to the production stage; a lack of global exploration success in recent years; and a scarcity of new, promising regions for gold exploration and production. A decrease in global industry production raises the potential for a higher sustainable long-term gold price.
INDUSTRY GOLD PRODUCTION
(millions of ounces)
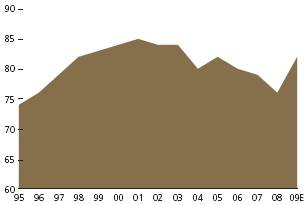
Source: GFMS
45
Gold sales from the official sector under the Central Bank Gold Agreement (CBGA) also have a significant impact on gold prices. Sales for the year ended in September 2009 were about 70% below the 500 tonnes full-year quota. A renewed CBGA took effect in September 2009 upon the expiry of the previous accord, with the quota lowered to 400 tonnes per year over this 5-year agreement. This renewal is structured to accommodate the expected sales of up to 403 tonnes of gold from the International Monetary Fund (IMF). Net official sector sales have been declining in recent years and during the final three quarters of 2009, central banks became net buyers. In November 2009, the IMF announced the sale of 200 tonnes of gold to the Reserve Bank of India and earlier in the year China announced that it has added more than 400 tonnes to its reserves since the last report of their holdings in 2003.
OFFICIAL SECTOR GOLD SALES
(tonnes)
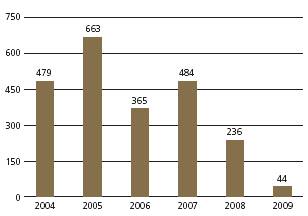
Source: World Gold Council and GFMS
The reserve gold holdings of emerging market countries, such as the BRIC countries (Brazil, Russia, India, and China), are significantly lower than the reserve holdings of more developed countries. The central banks of these developing economies hold a significant portion of their reserves in US dollars and as they identify a need to diversify their portfolio and reduce their exposure to the US dollar, we believe that gold will be one of the main benefactors. In conjunction with the below quota selling of gold under the CBGA, which is expected to continue in the current year of the agreement, these recent purchases of gold by global central banks provide a strong indication that the view of gold as a reserve asset is returning to favor.
OFFICIAL GOLD HOLDINGS as at December 31, 2009
(% of reserves)
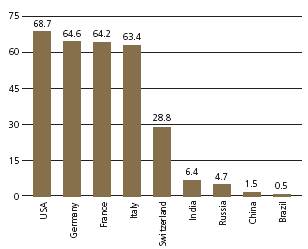
Source: World Gold Council
Copper
Copper prices generally rose throughout 2009, as London Metals Exchange (LME) copper prices traded in a wide range of $1.37 to $3.37 per pound, averaging $2.34 per pound, and closing the year at $3.33 per pound. Our realized price of $3.16 per pound in 2009 exceeded LME spot prices by $0.82 per pound due to the benefit from our copper hedging program. Copper’s rise during the year occurred mainly as a result of strong Chinese demand and increasingly positive sentiments about the prospects of future global economic expansion, including the expected impact on copper demand from government stimulus spending on infrastructure projects. Copper prices should continue to be positively influenced by demand from Asia, a return to global economic growth, the limited availability of scrap metal and production levels of mines and smelters in the future.
Utilizing option collar strategies, we have put in place floor protection on approximately 80% of our expected copper production for 2010 at an average price of $2.19 per pound but can fully participate in copper price upside on approximately 100% of our expected 2010 copper production up to a maximum average price of $3.63 per pound.
46
AVERAGE MONTHLY SPOT COPPER PRICES
(dollars per pound)
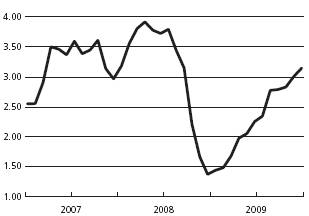
Silver
Silver traded in a range of $10.35 to $19.46 per ounce in 2009, averaged $14.70 per ounce and closed the year at $16.87 per ounce. Despite weak industrial demand, silver managed to rise during the year due to very strong investor demand. The ounces held by major global ETFs increased by 123 million ounces during the year with holdings totaling 396 million ounces at the end of 2009. The silver market is currently in surplus and while a return to global economic growth will help improve industrial demand, the primary influence of prices should continue to be investor demand.
In Q3 2009, the Company eliminated all of its silver sales hedge contracts at a total cost of $114 million. This amount was paid from the Company’s cash balances.
In September 2009, the Company entered into a transaction with Silver Wheaton Corp. where we have sold 25% of the life-of-mine Pascua-Lama silver production upon the later of January 1, 2014 or completion of construction at the project, and 100% of silver production from the Lagunas Norte, Pierina and Veladero mines until that time, for a total cash deposit of $625 million. Silver Wheaton will also make ongoing payments of $3.90 per ounce in cash (subject to a 1% annual inflation adjustment starting three years after completing construction at Pascua-Lama) for each ounce of silver delivered under the agreement.
Currency Exchange Rates
The results of our mining operations outside of the United States are affected by US dollar exchange rates. The largest single exposure we have is to the Australian dollar/US dollar exchange rate. We also have exposure to the Canadian dollar through a combination of Canadian mine operating costs and corporate administration costs and increasing exposure to the Chilean peso as a result of the construction of our Pascua-Lama project. In addition, we have exposure to the Papua New Guinea kina, Peruvian sol, and Argentinean peso through mine operating and capital costs.
In 2009, the US dollar was generally in decline, primarily as a result of the low interest rates offered on US dollars, re-leveraging by investors into riskier assets, and concerns about the level of US government borrowing and deficits. In early 2010, the US dollar experienced a small rally as money flows moved from Euros to the US dollar on the news of debt concerns for certain EMU countries. However, we feel there is more risk for the US dollar to decline from these levels, which should be supportive of gold prices.
Fluctuations in the US dollar increase the volatility of our costs reported in US dollars, subject to protection that we have put in place through our currency hedging program. In 2009, the Canadian dollar traded in a wide range of $0.77 to $0.98 and closed at $0.96 due to volatility in the global economy, as well as energy and commodity prices. The Australian dollar also experienced high volatility, trading in a range of $0.63 to $0.94 and closed at $0.90, strengthening towards the end of the year due in part to increasing interest rate differentials and higher commodity prices.
About 60—65% of our consolidated production costs are denominated in US dollars and are not exposed to fluctuations in US dollar exchange rates. For the remaining portion, our currency hedge position allows for more accurate forecasting of our anticipated expenditures in US dollar terms and mitigates our exposure to volatility in the US dollar. Over the last three years, our currency hedge position has provided benefits to us in the form of hedge gains when contract exchange rates are compared to prevailing market exchange rates as follows: 2009 — $27 million; 2008 — $106 million; and 2007 — $166 million. These gains are recorded within our operating costs. We have also recorded hedge losses increasing corporate administration costs in 2009 by $7 million (2008 — $11 million gain and 2007 — $19 million gain).
47
For 2010, our average Australian and Canadian dollar hedge rates are favorable when compared to the year-end market rates for these currencies. The average hedge rates vary depending on when the contracts were put in place. We are approximately 90% hedged in 2010 for expected Australian and Canadian operating costs, and sustainable and eligible project capital expenditures at rates of $0.80 and $0.93, respectively. In addition, we have hedged 83%, 68%, and 62% of our total expected 2011, 2012, and 2013 Australian expenditures at rates of $0.76, $0.74, and $0.70, respectively. Assuming market exchange rates at the December 31st levels of $0.90 and $0.95, we expect to record opportunity gains of approximately $106 million in 2010 (about $13 per ounce on total 2010 production), or approximately $97 million for the Australian dollar and approximately $9 million for the Canadian dollar. Further information on our currency hedge positions is included in note 20 to the consolidated financial statements.
A$ Currency Contracts
| | A$:US$ Contracts | | Effective | | % of Expected | |
| | (A$ millions) | | Hedge Rate | | A$ Exposure(1) | |
2010 | | 1,423 | | 0.80 | | 93 | % |
2011 | | 1,322 | | 0.76 | | 83 | % |
2012 | | 964 | | 0.74 | | 68 | % |
2013 | | 750 | | 0.70 | | 62 | % |
C$ Currency Contracts
| | C$:US$ Contracts | | Effective | | % of Expected | |
| | (C$ millions) | | Hedge Rate | | C$ Exposure(1) | |
2010 | | 381 | | 0.93 | | 89 | % |
2011 | | 27 | | 0.95 | | 7 | % |
CLP Currency Contracts
| | CLP:US$ Contracts | | Effective | | % of Expected | |
| | (CLP millions)(2) | | Hedge Rate | | CLP Exposure(3) | |
2010 | | 96,240 | | 519.21 | | 44 | % |
2011 | | 60,000 | | 507.57 | | 27 | % |
(1) | Includes all forecasted operating, sustainable and eligible project capital expenditures. |
(2) | CLP 120,000 million collar contracts are an economic hedge on pre-production expenditures at our Pascua-Lama project with a cap and floor of 500 and 550, respectively. The CLP exchange rate was 507.57 at December 31, 2009. |
(3) | Includes all forecasted operating, sustainable and forecasted project capital expenditures. |
AVERAGE MONTHLY AUD$ SPOT AND HEDGE RATES
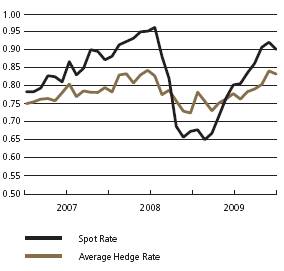
AVERAGE MONTHLY CAD$ SPOT AND HEDGE RATES
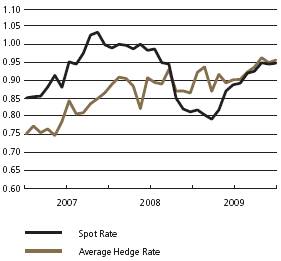
Fuel
Oil prices were volatile during 2009, trading between $34 and $82 per barrel and averaged $62 per barrel. Oil prices closed the year at $79 per barrel as the global economy appears to be returning to growth conditions.
We consume on average approximately 3.8 million barrels of diesel fuel annually across all our mines. Diesel fuel is refined from crude oil and is therefore subject to the same price volatility affecting crude oil prices. Volatility in crude prices has a significant direct and indirect impact on our production costs. In
48
order to mitigate this volatility, we employ a strategy of combining the use of financial contracts and our production from Barrick Energy to effectively hedge our exposure to high oil prices. We currently have financial contracts in place totaling 4.2 million barrels, which represents 60% of our total estimated direct consumption in 2010 and 16% of our total estimated direct consumption over the following three years. Those contracts are primarily designated for our Nevada-based mines, and have an average price of $90 per barrel. In 2009, we recorded hedge losses in earnings of approximately $97 million on our fuel hedge positions (2008: $33 million gain; 2007: $29 million gain). Assuming market rates at the December 31st level of $79 per barrel, we expect to realize opportunity losses of approximately $30 million in 2010 from our financial contracts.
Financial Fuel Hedge Summary
| | Barrels(1) | | | | % of Expected | |
| | (thousands) | | Average Price | | Exposure | |
2010 | | 2,340 | | $ | 101 | | 60 | % |
2011 | | 804 | | 87 | | 20 | % |
2012 | | 590 | | 69 | | 16 | % |
2013 | | 440 | | 63 | | 12 | % |
| | 4,174 | | $ | 90 | | 27 | % |
(1) Refers to hedge contracts for a combination of WTI, WTB, MOPS and JET.
In 2010, we expect Barrick Energy to produce about 1.5 million barrels of oil equivalent at a cash cost of approximately $40 per barrel. Barrick Energy production mitigates our exposure on approximately 15% of our 2010 fuel requirements.
CRUDE OIL MARKET PRICE (WIT) (dollars per barrel)
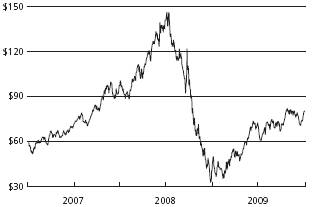
US Dollar Interest Rates
Beginning in 2008, in response to the contraction of global credit markets and in an effort to spur economic activity and avoid potential deflation, the US Federal Reserve reduced its benchmark rate to between 0% and 0.25% . The benchmark rate was kept at this level throughout 2009. We expect that short-term rates will remain at low levels well into 2010, with the US Federal Reserve continuing to use monetary policy initiatives in an effort to keep long-term interest rates low. We expect such initiatives to be followed by incremental increases to short-term rates once economic conditions and credit markets normalize.
At present, our interest rate exposure mainly relates to interest receipts on our cash balances ($2.6 billion at the end of the year); the mark-to-market value of derivative instruments, including our remaining Floating Contracts ($0.7 billion at December 31, 2009); the fair value and ongoing payments under US dollar interest-rate swaps; and to the interest payments on our variable-rate debt ($0.3 billion at December 31, 2009). Currently, the amount of interest expense recorded in our consolidated statement of income is not materially impacted by changes in interest rates, because the majority of debt was issued at fixed interest costs rates. The relative amounts of variable-rate financial assets and liabilities may change in the future, depending on the amount of operating cash flow we generate, as well as the level of capital expenditures and our ability to borrow on favorable terms using fixed rate debt instruments.
US DOLLAR INTEREST RATES (%)
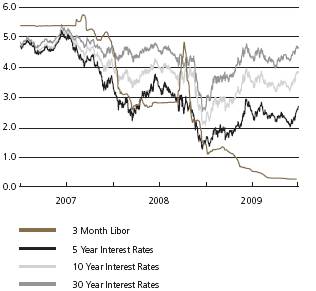
49
The historically low near-term rates and the upward-sloping yield curve are enabling more consumers to avoid defaulting on debt and are helping previously at-risk financial institutions to stabilize their businesses through borrowing at low short-term rates and lending at higher medium-to-long term rates. This yield curve impacts the net amounts of interest income and expense since our debt issuances were set at predominantly 10-year and 30-year interest rates, while our cash and equivalents balances are generating interest income at lower rates in the 30 to 90 day range.
If shorter term interest rates rise, this should result in us generating higher amounts of interest income on our cash balances, while our interest expense is largely at fixed rates and insensitive to increasing interest rates.
Financial and Operational Results
Review of Financial Results(1)
($ millions, except per share data in dollars)
For the years ended December 31 | | 2009 | | 2008 | | $ Change | | % Change | | 2007 | |
Revenues | | $ | 8,404 | | $ | 7,913 | | 491 | | 6 | % | $ | 6,332 | |
Net income/(loss) | | (4,274 | ) | 785 | | (5,059 | ) | (644 | )% | 1,119 | |
Per share(2) | | (4.73 | ) | 0.90 | | (5.63 | ) | (626 | )% | 1.29 | |
Net income/(loss) | | (4,274 | ) | 785 | | (5,059 | ) | (644 | )% | 1,119 | |
Elimination of gold sales contracts | | 5,901 | | — | | 5,901 | | 100 | % | — | |
Effect of tax rate changes | | 59 | | — | | 59 | | 100 | % | — | |
Impairment charges related to goodwill, property, plant and equipment, and investments | | 259 | | 899 | | (640 | ) | (71 | )% | 59 | |
Gains on acquisitions/dispositions | | (85 | ) | (178 | ) | 93 | | 52 | % | (59 | ) |
Foreign currency translation (gains)/losses | | (95 | ) | 135 | | (230 | ) | (170 | )% | (73 | ) |
Non-recurring restructuring costs | | 15 | | — | | 15 | | 100 | % | — | |
Unrealized (gains)/losses on non-hedge derivative instruments | | 30 | | 20 | | 10 | | 50 | % | (10 | ) |
Adjusted net income(3) | | 1,810 | | 1,661 | | 149 | | 9 | % | 1,036 | |
Per share(2) | | 2.00 | | 1.90 | | 0.10 | | 5 | % | 1.19 | |
EBITDA(4) | | (2,514 | ) | 2,347 | | (4,861 | ) | (207 | )% | 2,436 | |
Adjusted EBITDA(5) | | 3,419 | | 2,347 | | 1,072 | | 46 | % | 2,436 | |
Operating cash flow | | (2,322 | ) | 2,254 | | (4,576 | ) | (203 | )% | 1,768 | |
Adjusted operating cash flow(6) | | 2,899 | | 2,254 | | 645 | | 29 | % | 1,768 | |
Capital expenditures — minesite sustaining(7) | | 784 | | 742 | | 42 | | 6 | % | 679 | |
Capital expenditures — minesite expansionary(7) | | 60 | | — | | 60 | | 100 | % | — | |
Capital expenditures — projects(7) | | 965 | | 739 | | 226 | | 31 | % | 243 | |
Total assets | | 27,075 | | 24,161 | | 2,914 | | 12 | % | 21,951 | |
Total liabilities | | 11,528 | | 8,702 | | 2,826 | | 32 | % | 6,613 | |
Dividends declared | | $ | 369 | | $ | 349 | | 20 | | 6 | % | $ | 261 | |
(1) | The amounts presented in this table include the results of discontinued operations. |
(2) | Calculated using weighted average number of shares outstanding under the basic method. |
(3) | Adjusted net income is a non-GAAP financial performance measure with no standardized meaning under US GAAP. For further information and a detailed reconciliation, please see page 85 of this MD&A. |
(4) | EBITDA is a non-GAAP financial performance measure with no standardized meaning under US GAAP. For further information and a detailed reconciliation, please see page 88 of this MD&A. |
(5) | Adjusted EBITDA is a non-GAAP financial performance measure with no standardized meaning under US GAAP. For further information and a detailed reconciliation, please see page 88 of this MD&A. |
(6) | Adjusted operating cash flow is a non-GAAP financial performance measure with no standardized meaning under US GAAP. For further information and a detailed reconciliation, please see page 86 of this MD&A. |
(7) | Amount presented is on a cash basis and projects amount reflects our equity share of capital expenditures on our advanced projects. For a detailed reconciliation and further discussion, please see page 70 of this MD&A. |
50
In 2009, we reported a net loss of $4,274 million compared to net income of $785 million in the prior year. The $5,059 million decrease in net income was primarily driven by the $5,901 million post-tax loss on the elimination of our gold sales contracts; lower gold production; higher gold cash costs and lower realized copper prices. These decreases were partially offset by higher realized gold prices; lower impairment charges; and lower project development expense as costs at Pueblo Viejo were capitalized in 2009.
Adjusted net income was $1,810 million in 2009, compared to $1,661 recorded in the prior year. The significant adjusting items in 2009 include: the elimination of our gold sales contracts; a $248 million impairment charge related to goodwill and long-lived assets at our Plutonic mine and Sedibelo project; a $72 million gain recognized on the acquisition of the additional 50% interest in our Hemlo gold mine; a $70 million currency translation gain on deferred tax assets due to an election to adopt a US dollar functional currency for Canadian tax purposes; and a $59 million loss on deferred tax assets due to a reduction in corporate income tax rates in Ontario.
FACTORS AFFECTING ADJUSTED NET INCOME
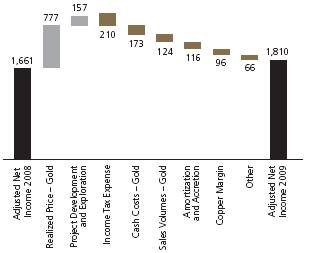
EBITDA was a loss of $2,514 million in 2009, compared to income of $2,347 in the same prior year period. The significant decrease is primarily attributable to the $5,933 million, before tax, charge relating to the elimination of our gold sales contracts. EBITDA was also impacted by the same factors affecting net income with the exception of income tax expense. Excluding the impact of the gold sales contracts, Adjusted EBITDA was $3,419 million in 2009, compared to $2,347 in the same prior year period.
Operating cash flow for 2009 was $(2,322) million, a significant decrease over the prior year due to the $5,221 million in payments related to the settlement of our gold sales contracts. Operating cash flow was positively affected by higher realized gold prices, and lower income taxes paid as a result of the production mix and the use of tax loss carry forwards. These increases were partially offset by higher gold cash costs, lower realized copper prices, and lower gold sales volumes.
Adjusted operating cash flow in 2009 was $2,899 million, representing a $645 million increase over the prior year. Adjusted operating cash flow was affected by the same factors as operating cash flow and was adjusted for the $5,221 million in payments related to the settlement of our gold sales contracts. The 29% increase over the prior year period illustrates the underlying capability of our business to generate robust operating cash flow.
51
Review of Operating Results(1)
($ millions, except per ounce/pound data in dollars) | | Gold | | Copper | |
For the years ended December 31 | | 2009 | | 2008 | | 2007 | | 2009 | | 2008 | | 2007 | |
Production (000s ounces/millions pounds)(2) | | 7,423 | | 7,657 | | 8,060 | | 393 | | 370 | | 402 | |
Reserves (millions of contained ounces/billions of contained pounds)(3) | | 139.8 | | 138.5 | | 124.6 | | 6.1 | | 6.4 | | 6.2 | |
Sales(4) | | | | | | | | | | | | | |
000s ounces/millions pounds | | 7,306 | | 7,595 | | 8,055 | | 380 | | 367 | | 401 | |
$millions | | $ | 7,191 | | $ | 6,656 | | $ | 5,027 | | $ | 1,155 | | $ | 1,228 | | $ | 1,305 | |
Market price(5) | | 972 | | 872 | | 695 | | 2.34 | | 3.15 | | 3.23 | |
Realized price(5),(6) | | 985 | | 872 | | 621 | | 3.16 | | 3.39 | | 3.22 | |
Cost of sales ($ millions) | | 3,431 | | 3,426 | | 2,805 | | 444 | | 436 | | 339 | |
Total cash costs(5),(7),(8) | | $ | 466 | | $ | 443 | | $ | 345 | | $ | 1.17 | | $ | 1.19 | | $ | 0.82 | |
Net cash costs(5),(7),(9) | | $ | 363 | | $ | 337 | | $ | 228 | | | | | | | |
(1) | The amounts presented in this table include the results of discontinued operations. |
(2) | Gold production reflects our equity share of production. |
(3) | Calculated in accordance with National Instrument 43-101 as required by Canadian securities regulatory authorities. For United States reporting purposes, Industry Guide 7, (under the Securities and Exchange Act of 1934), as interpreted by Staff of the SEC, applies different standards in order to classify mineralization as a reserve. Accordingly, for U.S. reporting purposes, Cerro Casale is classified as mineralized material. For a breakdown of reserves and resources by category and additional information relating to reserves and resources, see pages 155 to 162. |
(4) | Gold sales reflect our equity share of sales. |
(5) | Per ounce/pound weighted average. |
(6) | Realized price is a non-GAAP financial performance measure with no standard meaning under US GAAP. For further information and a detailed reconciliation, please see page 89 of this MD&A. |
(7) | Reflects our equity share of production. |
(8) | Total cash costs is a non-GAAP financial performance measure with no standard meaning under US GAAP. For further information and a detailed reconciliation to cost of sales, please see page 87 of this MD&A. |
(9) | Net cash costs is a non-GAAP financial performance measure with no standard meaning under US GAAP. For further information and a detailed reconciliation to cost of sales, please see page 87 of this MD&A. |
In 2009, total revenues of $8.4 billion were up 6% compared to the prior year, primarily due to higher realized gold prices and copper sales volumes. These factors were partially offset by lower gold sales volumes and lower realized copper prices. Realized gold prices of $985 per ounce in 2009 were up $113 per ounce compared to the prior year, consistent with the year over year increase in average market price of $100 per ounce. The higher realized price compared to the market price in 2009 is primarily due to the timing of gold sales and additional trading activities utilizing various gold market contracts. Realized copper prices for the year were 7% lower than in the prior year period; however, they were 35% higher than market prices due to the impact of our copper hedges. Our copper hedge position resulted in an additional $283 million in realized revenue during 2009.
Cost of sales applicable to gold was $3.4 billion for 2009, representing a slight increase over the prior year. Cost of sales was impacted by increased labor costs and maintenance costs, partially offset by decreasing costs of commodities and consumables used in the production process. For the year, cost of sales was within our original cost of sales guidance of $3.2 billion to $3.6 billion.
Net cash costs per ounce were 8% higher in 2009 compared to the prior year. The increase reflects higher labor costs, maintenance costs, realized losses from fuel hedges, and lower copper credits from Zaldívar and Osborne as a result of lower realized copper prices. Net cash costs per ounce were also impacted by our relative production mix in 2009, with South America, our lowest cost region, contributing a smaller share of total gold production when compared to 2008, largely due to the sequencing of production. Net cash costs of $363 per ounce were within our original guidance of $360 to $385 per ounce.
Total cash costs per ounce were 5% higher in 2009 compared to the prior year. The changes in total cash costs reflect the factors impacting net cash costs described above, except for the impact of lower copper credits. Total cash costs of $466 per ounce were within our original guidance of $450 to $475 per ounce.
In 2009, cost of sales applicable to copper of $444(6) million and total cash costs of $1.17 were in line with the $436(6) million in cost of sales and $1.19 per pound recorded in 2008. When compared to the prior
(6) Cost of sales applicable to copper includes $83 million (2008: $121 million) related to Osborne, which is classified as a discontinued operation in the consolidated financial statements.
52
year, lower direct mining costs were offset by higher electricity prices resulting from a higher-cost power contract at Zaldívar, which came into effect in July 2008. Both cost of sales applicable to copper and total cash costs per pound were below our original 2009 guidance for cost of sales of $470 to $540 million and total cash costs per pound of $1.25 to $1.35 per ounce.
Net cash margins per ounce illustrate the trends in profitability and the impact of fluctuations in realized prices and net cash costs on our ability to generate earnings and operating cash flow. Net cash margins per ounce increased in 2009 as the rise in gold prices outpaced the rise in net cash costs.
NET CASH MARGINS PER OUNCE
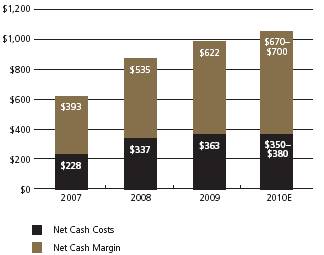
Operational Overview(1)
For the years ended | | | | | | | | | |
December 31 | | 2009 | | 2008 | | % Change | | 2007 | |
Gold | | | | | | | | | |
Ore tons mined (millions) | | 174 | | 182 | | (4 | )% | 167 | |
Waste tons mined (millions) | | 555 | | 498 | | 11 | % | 486 | |
Total tons mined (millions) | | 729 | | 680 | | 7 | % | 653 | |
Ore tons processed (millions) | | 171 | | 191 | | (10 | )% | 172 | |
Average grade (ozs/ton) | | 0.052 | | 0.047 | | 11 | % | 0.055 | |
Recovery rate | | 82.1 | % | 84.4 | % | (3 | )% | 84.7 | % |
Gold produced (000s/oz) | | 7,423 | | 7,657 | | (3 | )% | 8,060 | |
Copper | | | | | | | | | |
Ore tons mined (millions) | | 50 | | 45 | | 11 | % | 41 | |
Waste tons mined (millions) | | 30 | | 38 | | (21 | )% | 49 | |
Total tons mined (millions) | | 80 | | 83 | | (4 | )% | 90 | |
Ore tons processed (millions) | | 49 | | 44 | | 11 | % | 39 | |
Average grade (percent) | | 0.6 | | 0.6 | | — | | 0.7 | |
Copper produced (millions/lbs) | | 393 | | 370 | | 6 | % | 402 | |
(1) The amounts presented in this table include the results of discontinued operations.
Production
Gold production in 2009 was 234 thousand ounces or 3% lower than in the prior year, reflecting lower production in South America and North America, partially offset by higher production in Africa and Australia. Production of 7,423 thousand ounces was within our original guidance range of 7,200 to 7,600 thousand ounces. Copper production was 6% higher than the prior year period due to higher production from both Zaldívar and Osborne in 2009. Production of 393 million pounds was within our original guidance range of 375 to 400 million pounds.
Tons Mined and Tons Processed — Gold
Total tons mined increased by 7% and tons processed decreased by 10% when compared to 2008. The higher tons mined was mainly due to the start up of our new Buzwagi mine; an increase in stockpiles at our Veladero mine as a result of an increase in the mining fleet in 2009, in preparation for the processing capacity increase as a result of the crusher expansion completed in third quarter 2009; and increased waste stripping at Golden Sunlight. These increases were
53
partially offset by a decrease at Cowal, where wall failure remediation activities increased the number of tons mined in 2008. Ore tons processed decreased by 10% due to decreases at Cortez, where a shift towards more underground ore led to fewer tons processed at higher grades, partly offset by increases at Veladero, due to an increase in the cut-off grade, thereby making it economical to process material that would have previously been classified as waste.
TONS MINED AND TONS PROCESSED(1)
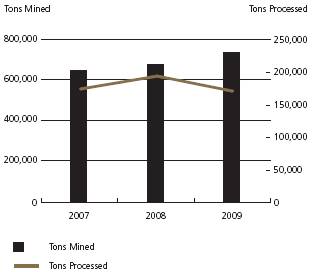
(1) All amounts presented are based on equity production.
Average Recovery Rates — Gold
Average recovery rates decreased by approximately 3% in 2009 compared to the prior year, primarily due to an increase in ore tons placed on the leach pad at Veladero in the fourth quarter 2009 as a result of the crusher expansion completed in the third quarter, which resulted in a reduction in gold recovered and an increase in leach pad inventory. The recovery of the ore in leach pad inventory is expected to have a positive impact on recovery rates in 2010. This was partially offset by an increase in recovery rates at Cortez as more ounces were recovered through the carbon in pulp process plant than the heap leach facility.
Average Mill Head Grades — Gold
Average mill head grades increased by approximately 11% in 2009 compared to the prior year, primarily due to mine sequencing that resulted in higher ore grades at certain mines. Reserve grades have been trending downwards in recent years, primarily as a result of rising gold prices which make it economical to process lower grade material.
AVERAGE MILL HEAD GRADES(1) (ounces/ton)
(1) | All amounts presented based on equity production. Average mill head grades are expressed as the number of ounces of gold contained in a ton of ore processed. Reserve grade represents expected grade over the life of the mine and is calculated based on reserves reported at the end of the immediately preceding year. |
Safety
In 2009, we achieved a 10% reduction in the number of recordable injuries and a 25% decrease in lost time injuries, continuing a trend of year over year performance improvements. Lost time injuries are recorded when an employee or contractor takes time off the following day or shift following an incident. Thirteen sites achieved zero lost time injury rates in 2009, including Pascua-Lama which has achieved a total of 7 million hours and five years worked without a lost time injury. In addition, our Ruby Hill operation completed the entire year with zero recordable injuries, an outstanding achievement. Despite these positive achievements, there were four work related fatalities at Barrick sites during 2009 and we were deeply saddened by these incidents. We conducted full investigations and have
54
developed new policies and procedures to reduce the risk of similar incidents occurring. An incident-free work place is our vision and our safety culture continues to improve, which is evidenced by our continued improvement in incident rates.
LOST TIME INJURY FREQUENCY RATES
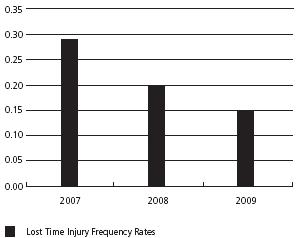
Reserves(7)
At year-end 2009, we added 10.3 million ounces of proven and probable reserves. After depletion of 9.0 million ounces, proven and probable gold reserves increased by 1.3 million ounces to 139.8 million ounces, the largest in the industry, based on an assumed $825(8) per ounce gold price. The increase primarily reflects additions at Bald Mountain, South Arturo, Cortez and Hemlo partially offset by a decrease at Bulyanhulu.
Measured and indicated gold mineral resources declined by 5% to 61.8 million ounces and inferred gold mineral resources declined 9% to 31.6 million ounces based on a $900 per ounce gold price.
Copper reserves decreased slightly to 6.1 billion pounds and measured and indicated resources increased by 0.4 billion pounds to 12.9 billion pounds. Contained silver within reported gold reserves is over one billion ounces.
Replacing gold and copper reserves depleted by production year over year is necessary in order to maintain production levels over the long term.
(7) | For a breakdown of reserves and resources by category and additional information relating to reserves and resources, see pages 155 to 162 of this Financial Report. |
(8) | Reserves at Cerro Casale and Round Mountain have been calculated using an assumed price of $800 per ounce. |
If depletion of reserves exceeds discoveries over the long term, then we may not be able to sustain gold and copper production levels. Reserves can be replaced by expanding known ore bodies, acquiring mines or properties or discovering new deposits. Once a site with gold or copper mineralization is discovered, it takes several years from the initial phases of drilling until production is possible, during which time the economic feasibility of production may change. Substantial expenditures are required to establish proven and probable reserves and to permit and construct mining and processing facilities.
Review of Operating Segment Performance
We report our results of operations using a geographical business unit approach: North America, South America, Australia Pacific and Africa. In addition, we have a Capital Projects segment, distinct from our regional business units, to focus on managing projects. This structure reflects how we manage our business and how we classify our operations for planning and measuring performance.
In our consolidated financial statements, we present a measure of historical segment income that reflects gold sales and copper sales at average consolidated realized gold and copper prices, respectively, less segment expenses and amortization of segment property, plant and equipment.
We monitor segment expenses and period to period fluctuations in our total cost of sales on a unit basis, per ounce of gold and per pound of copper, which is referred to as total cash costs. Therefore, the discussion of results for our producing mines focuses primarily on this statistic to explain changes in segment expenses.
North America
Key Operating Statistics
For the years ended | | | | | | | | | |
December 31 | | 2009 | | 2008 | | % Change | | 2007 | |
Tons mined (millions) | | 397 | | 360 | | 10 | % | 335 | |
Ore tons processed (millions) | | 64 | | 92 | | (30 | )% | 76 | |
Average grade (ozs/ton) | | 0.053 | | 0.041 | | 29 | % | 0.051 | |
Gold produced (000s/oz) | | 2,810 | | 3,028 | | (7 | )% | 3,201 | |
Cost of sales ($ millions) | | $ | 1,423 | | $ | 1,534 | | (7 | )% | $ | 1,178 | |
Total cash costs (per oz) | | $ | 504 | | $ | 493 | | 2 | % | $ | 363 | |
Segment income ($ millions) | | $ | 970 | | $ | 722 | | 34 | % | $ | 483 | |
55
Segment income was $970 million, a 34% increase over the prior year, primarily as a result of higher realized prices, partially offset by higher total cash costs and lower production.
Production for 2009 was 7% lower than the prior year mainly due to lower production at Goldstrike, Golden Sunlight and Bald Mountain, partly offset by higher production at Cortez, Hemlo and Storm.
At Goldstrike, production for the year was down 351 thousand ounces over the prior year, mainly as a result of the planned partial shutdown of the autoclaves in the second half of 2009. Golden Sunlight production decreased by 92 thousand ounces from 2008 as it has entered an extended development phase and is not expected to produce gold again until 2011. Bald Mountain’s production was lower due to unplanned permitting delays in 2009. These permitting issues have been addressed in conjunction with a mine expansion plan and Bald Mountain should return to higher production levels within three years.
Higher production of 90 thousand ounces at Cortez was mainly a result of increasing ore grades as we expand operations at the Cortez Hills underground, as well as the acquisition of our joint venture partner’s 40% interest, which was effective March 2008. At Hemlo and Storm, production increased 145 thousand and 43 thousand ounces, respectively, reflecting our increased ownership interest in those mines effective April 2009 and October 2008, respectively.
In 2009, cost of sales was 7% lower than the prior year period mainly due to lower production levels and decreasing commodity costs, while total cash costs per ounce were up 2% compared to the prior year. The decrease in cost of sales is due to a decrease in commodity costs, which was partially offset by increases attributable to the acquisitions of additional interests in Hemlo and Storm, which are higher cost operations, and planned increases in labor as we ramp up underground activities at Cortez Hills. The increase in total cash costs per ounce reflects the lower production partially offset by the cost of sales decreases.
In 2010, we expect gold production in the range of 2.95 to 3.10 million ounces. Production is expected to be higher than 2009 primarily due to production from Cortez Hills(9) partly offset by the anticipated decrease in ore suitable for acidic autoclaving at Goldstrike. 2010 production at Goldstrike is expected to be lower than 2009 due to lower grade areas being mined after mine sequencing in which deeper areas of the pit containing higher grade ore were mined in 2009, resulting in fewer ore tons to feed to the roaster in 2010. The life of mine plan also anticipated a decrease in ore suitable for acidic autoclaving. Although we are evaluating options to extend its life, we currently plan to phase out the autoclave facility throughout 2010 and cease its operation in 2011. In 2010, the autoclave will be operating at about half the capacity as it was in 2009, resulting in fewer ore tons processed. In order to utilize the potential available capacity, ore tons from Storm will be shipped to Goldstrike for processing. Cost of sales applicable to gold is expected to be $1.3 to $1.5 billion, or $450 to $475 per ounce on a total cash costs basis. Cost of sales and total cash costs per ounce are expected to decrease as a result of the production mix shift towards lower cost Cortez Hills production.
South America
Key Operating Statistics
For the years ended | | | | | | | | | |
December 31 | | 2009 | | 2008 | | % Change | | 2007 | |
Gold | | | | | | | | | |
Tons mined (millions) | | 158 | | 151 | | 5 | % | 151 | |
Ore tons processed (millions) | | 70 | | 65 | | 8 | % | 59 | |
Average grade (ozs/ton) | | 0.036 | | 0.037 | | (3 | )% | 0.042 | |
Gold produced (000s/oz) | | 1,889 | | 2,111 | | (11 | )% | 2,079 | |
Cost of sales ($ millions) | | $ | 499 | | $ | 531 | | (6 | )% | $ | 400 | |
Total cash costs (per oz) | | $ | 265 | | $ | 251 | | 6 | % | $ | 193 | |
Segment income ($ millions) | | $ | 1,189 | | $ | 1,127 | | 6 | % | $ | 664 | |
Copper | | | | | | | | | |
Copper produced (millions of lbs) | | 302 | | 295 | | 2 | % | 315 | |
Cost of sales ($ millions) | | $ | 361 | | $ | 315 | | 15 | % | $ | 232 | |
Total cash costs (per lb) | | $ | 1.17 | | $ | 1.08 | | 8 | % | $ | 0.69 | |
Segment income ($ millions) | | $ | 504 | | $ | 624 | | (19 | )% | $ | 751 | |
(9) | In December 2009, the appeal of the denial of a preliminary injunction sought by certain opponents of the Cortez Hills Project was denied in part and granted in part. As a result, the Company has sought a limited injunction that would restrict groundwater pumping to current levels and enjoin trucking of refractory ore (representing approximately 3% of the ore) to Goldstrike pending completion of a supplemental EIS. The plaintiffs have sought a broader injunction that would enjoin further construction and operation of the Project pending completion of the supplemental EIS. |
56
Gold segment income was $1,189 million, a 6% increase over the prior year, primarily as a result of higher realized prices, partially offset by higher total cash costs and lower gold production.
Gold production for the year was 11% lower than 2008 due to the planned mining of lower grade ore at Pierina and Lagunas Norte, partially offset by higher production at Veladero. Production at Veladero increased in the second half of 2009 as we started to access higher grades from both the Amable and Federico pits and increased crushing capacity due to the start-up of the crusher circuit expansion.
Cost of sales applicable to gold decreased by 6% in 2009 compared to the prior year, primarily due to lower production levels and lower blasting and contract costs at Veladero, and higher silver credits due to higher market silver prices. Total cash costs per ounce for the year were up 6% to $265 over the prior year, as the decrease in cost of sales was more than offset by the decrease in production.
In 2010, we expect gold production in the range of 2.11 to 2.25 million ounces, compared to 2009 production of 1.89 million ounces. The expected increase in production is primarily due to higher production at Veladero as a result of an increase in tons processed due to the availability of the overland conveyor and completion of the crusher expansion, as well as an increase in ore grade and recovery. The increase in Veladero production is expected to be partly offset by lower production at Lagunas Norte, due to lower ore grades, and Pierina. Cost of sales applicable to gold is expected to be about $550 to $650 million, or $240 to $270 per ounce on a total cash costs basis, similar to 2009 levels.
Copper segment income was $504 million, a 19% decrease over the prior year. Slightly higher production was more than offset by lower realized prices and lower cost of sales.
Copper production for 2009 increased slightly compared to the prior year, mainly due to increases in heap leach ore and improved leaching kinetics, which was adversely affected by acid supply shortages in 2008. Copper cost of sales increased by 15% as higher production levels combined with higher total cash costs. The 8% increase in total cash costs per pound was mainly due to higher prices for electricity under a new contract effective July 2008. The cost of power under the new contract fluctuates with market oil prices.
We expect 2010 copper production to be in the range of 305 to 325 million pounds and cost of sales applicable to copper to be in the range of $310 to $360 million, with total cash costs in the range of $1.05 to $1.20 per pound.
Australia Pacific
Key Operating Statistics(1)
For the years ended | | | | | | | | | |
December 31 | | 2009 | | 2008 | | % Change | | 2007 | |
Gold | | | | | | | | | |
Tons mined (millions) | | 133 | | 147 | | 10 | % | 144 | |
Ore tons processed (millions) | | 30 | | 29 | | 3 | % | 33 | |
Average grade (ozs/ton) | | 0.075 | | 0.077 | | (3 | )% | 0.078 | |
Gold produced (000s/oz) | | 1,977 | | 1,942 | | 2 | % | 2,123 | |
Cost of sales ($ millions) | | $ | 1,144 | | $ | 1,079 | | 6 | % | $ | 934 | |
Total cash costs (per oz) | | $ | 588 | | $ | 550 | | 7 | % | $ | 447 | |
Segment income ($ millions) | | $ | 457 | | $ | 314 | | 46 | % | $ | 108 | |
Copper | | | | | | | | | |
Copper produced (millions of lbs) | | 91 | | 75 | | 21 | % | 87 | |
Cost of sales ($ millions) | | $ | 83 | | $ | 121 | | (31 | )% | $ | 107 | |
Total cash costs (per lb) | | $ | 1.15 | | $ | 1.64 | | (30 | )% | $ | 1.36 | |
Segment income ($ millions) | | $ | 125 | | $ | 44 | | 184 | % | $ | 92 | |
(1) The amounts presented in this table include the results of discontinued operations.
Gold segment income was $457 million, a 46% increase over the prior year, primarily as a result of higher realized prices and higher production, partially offset by higher cost of sales.
Total gold production in 2009 was 2% higher than the prior year as a result of increased gold production at Kalgoorlie, Cowal and Yilgarn South(10), partially offset by lower production at Porgera and Henty.
At Kalgoorlie, production increased by 42 thousand ounces, primarily due to an 18% increase in the ore grade over the prior year. At Cowal, the slip on the east wall restricted access to high grade ore for the majority of 2008, leading to a 22% increase in production for 2009. At Yilgarn South, higher production in 2009 was principally due to better ore grades and an increase in ore tons processed as a result of an ore purchase arrangement with a third party mining company. In 2009, production at Porgera decreased by
(10) | Effective first quarter 2008, the Darlot, Lawlers, and Granny Smith mines are being managed as a single unit (Yilgarn South), with shared administrative services in order to achieve operational and administrative efficiencies. |
57
76 thousand ounces over the prior year, as wall stability issues affected production in the second and third quarters of 2009. In the fourth quarter production was affected by power supply issues due to vandalism. By the end of the year, production levels at Porgera had returned to expected levels.
Cost of sales applicable to gold in 2009 was 6% higher than the prior year, mainly due to higher contractor costs, maintenance expense and royalties. Total cash costs per ounce were up $38 per ounce compared to 2008. This 7% increase in total cash costs per ounce reflected the higher cost of sales, which was partially offset by marginally higher production levels.
In 2010, we expect gold production in the range of 1.85 to 2.0 million ounces as a result of lower expected production at Kanowna due to lower ore tons from the underground and a reduction in ounces recovered, the divestiture of Henty during 2009, and the expected divestiture of Osborne in 2010, partly offset by higher expected production at Kalgoorlie and Plutonic as operations progress to higher grade areas of the mine, and at Granny Smith as development allows access to mine additional zones in the underground. Cost of sales is expected to be about $1.1 to $1.3 billion. Total cash costs are expected to be in the range of $600 to $625 per ounce, similar to 2009 levels.
Copper segment income was $125 million, a 184% increase over the prior year. Higher production and lower cost of sales was partially offset by lower realized prices.
Copper production at Osborne was up 21% compared to the prior year. This increase was achieved due to better ore grades and recovery rates in 2009. Cost of sales decreased by 31% in 2009 due to lower activity levels across the site as the mine nears closure. The higher production levels and lower cost of sales resulted in total cash costs per pound being 30% lower for 2009, when compared to the prior year.
We expect 2010 copper production in the period prior to the expected disposition of Osborne to be in the range of 35 to 40 million pounds and cost of sales applicable to copper to be in the range of $45 to $55 million, with total cash costs in the range of $1.30 to $1.40 per pound. The decision to dispose of Osborne was made due to the short remaining economic life in an attempt to monetize some of the remaining value of the property.
Africa
Key Operating Statistics
For the years ended | | | | | | | | | |
December 31 | | 2009 | | 2008 | | % Change | | 2007 | |
Tons mined (millions) | | 41 | | 22 | | 86 | % | 23 | |
Ore tons processed (millions) | | 7 | | 4 | | 75 | % | 4 | |
Average grade (ozs/ton) | | 0.114 | | 0.154 | | (26 | )% | 0.165 | |
Gold produced (000s/oz) | | 716 | | 545 | | 31 | % | 605 | |
Cost of sales ($ millions) | | $ | 377 | | $ | 327 | | 15 | % | $ | 293 | |
Total cash costs (per oz) | | $ | 545 | | $ | 560 | | (3 | )% | $ | 405 | |
Segment income ($ millions) | | $ | 215 | | $ | 145 | | 48 | % | $ | 55 | |
Segment income was $215 million, a 48% increase over the prior year, primarily as a result of higher realized prices and higher production, partially offset by higher cost of sales.
Total gold production in 2009 increased by 31% compared to the prior year. The increase primarily reflects new production from Buzwagi and an increase in production at Bulyanhulu, partially offset by lower production at Tulawaka. The start of production at Buzwagi in May 2009 contributed 189 thousand ounces at lower total cash costs than the regional average. Higher production at Bulyanhulu was reflective of a more stable operating environment in 2009 as the prior year saw the lingering effects of the illegal strike in late 2007. Tulawaka production was 55% lower than the prior year, due to the planned shift from open pit to underground mining in 2009.
Cost of sales increased 15% in 2009 over the prior year period. The increase resulted from higher production volumes, partly offset by lower total cash costs. Total cash costs were slightly lower in the current year as they were positively impacted by the low cost production from Buzwagi and lower diesel costs offset by increases in labor at Bulyanhulu.
In 2010, we expect equity gold production, reflecting the reduced ownership as a result of the IPO of African Barrick Gold, in the range of 0.65 to 0.69 million ounces. We expect cost of sales applicable to gold to be in the range of $375 to $455 million on an equity basis, or $500 to $550 per ounce on a total cash costs basis. Production in this region is expected to increase; however, we will report lower production due to the decreased ownership. The increase in production is primarily due to a full year of mining operations at Buzwagi and higher ore grades at Bulyanhulu, partly offset by lower production expected at Tulawaka and
58
North Mara due to lower ore grades. Cost of sales and total cash costs per ounce are expected to be lower in 2010, reflecting the increase in production levels and the production mix favoring lower cost production from Buzwagi.
Capital Projects
Key Operating Statistics
($ millions) | | | | | | | |
For the years ended December 31 | | 2009 | | 2008 | | 2007 | |
Project expenses(1) | | $ | 49 | | $ | 140 | | $ | 173 | |
Project expense incurred by equity investees(2) | | 93 | | 69 | | 14 | |
Total project expense | | 142 | | 209 | | 187 | |
Capital expenditures(3) | | 691 | | 584 | | 169 | |
Capital commitments(4) | | $ | 1,018 | | $ | 552 | | $ | 159 | |
(1) | Amounts presented represent our share of project development expense. |
(2) | Amounts presented represent our share of project development expense from projects for which we use the equity accounting method, including Reko Diq, Cerro Casale, Kabanga and Donlin Creek. |
(3) | Amounts presented represent our share of capital expenditures on a cash basis, and exclude expenditures incurred at our Cortez Hills property (2009: $278 million, 2008: $155 million). |
(4) | Capital commitments represent purchase obligations as at December 31 where binding commitments have been entered into for long lead capital items related to construction activities at our projects. |
We spent $142 million in project expenses and $691 million (our share) in capital expenditures in 2009. The decrease in project expenses primarily relates to expenditures at Pueblo Viejo now being capitalized and lower activity at Kainantu and Fedorova. Capital expenditures are mainly attributable to construction of our Pueblo Viejo and Pascua-Lama projects and the completion of our Buzwagi mine. We expect capital expenditures to increase in 2010 as construction activities at these two capital projects ramp up.
Overview
The successful advancement and exploitation of development projects is determined by the deposit knowledge, optimization of the technical design, metal and input costs, financing and execution of plans. We utilize a system called the Barrick Development System (BDS) to govern advancement of projects as they progress from scoping through execution stages. In our opinion this disciplined system of standards and processes, which includes the involvement of multiple functional groups, ensures completeness; enhances the study quality and consistency; and enhances the identification of risk and development of related mitigation plans, thus improving the overall certainty of assessment and project delivery in accordance with plans developed.
The foundation of the assessment of any project is a strong knowledge of the deposit. We have established processes and procedures for resource modeling, subject to strict quality control, peer reviews and audit which must be met before mineralized material is included in our mine plans.
We utilize a combination of contractors and in house resources to develop the technical design and cost estimates for our projects. Our Capital Projects group is made up of functional experts, which complement and enhance project teams’ ability to optimize design, encourage transfer of knowledge between projects and provide an ongoing quality control process through continuous peer reviews as studies and construction advance. In addition, we have an in house research and development facility that has added significant value to our projects in recent years which we believe is a competitive advantage. Successful project execution is determined by the availability of quality personnel, inputs and adherence to schedule.
The fluctuations in prices for gold, copper, silver, nickel, energy, input commodities and consumables and foreign currencies could have a significant impact on the pre-production capital costs, operating costs as well as the overall development time frame of our projects. Coming out of the recent global economic downturn, the environment for developing projects has become more favorable as lead times for equipment have shrunk and prices are stable. Pueblo Viejo has benefited from the recent stability in pricing and we are accelerating procurement for Pascua-Lama in an attempt to lock in current pricing.
Barrick’s ability to finance its project pipeline is aided by its ‘A’ rated balance sheet. Credit markets have stabilized from earlier in the year but remain tight in historic terms. Our experience is that lenders for project financing are becoming progressively more sensitive to non-monetary factors that slow the speed at which facilities can be arranged and add cost pressure to the process.
59
Project Summaries
Our Cortez Hills project(11) in Nevada is essentially complete and in the final stages of commissioning. The project is anticipated to be completed in line with its $500 million pre-production capital budget and is expected to become the seventh project in five years which Barrick has delivered on time. The entire Cortez property is expected to produce 1.08— 1.12 million ounces of gold at total cash costs of $295— $315 per ounce in 2010, subject to Cortez Hills being allowed to operate consistent with Barrick’s motion for a limited preliminary injunction of activities, currently before the US District Court(12).
The Pueblo Viejo project in the Dominican Republic is advancing on schedule with initial production anticipated in the fourth quarter of 2011. The majority of site preparation earthworks has been completed, about 44,000 cubic meters of concrete poured and 1,500 tons of steel has been erected. As a result of a plan to accelerate the previously phased expansion of the processing plant from 18,000 to 24,000 tonnes per day and other updates to the mine plan, Barrick’s 60% share of annual gold production in its first full five years of operation is now expected to increase to an average of 625,000—675,000 ounces up from 600,000—650,000 ounces at lower total cash costs of $250—$275 per ounce compared to $275—$300 per ounce. The project continues to track within its budget estimate, but as a result of the plan to accelerate the expansion in processing capacity, the previously disclosed expansion capital of $0.3 billion will be brought forward such that pre-production capital is expected to be about $3.0 billion (100% basis). Barrick has continued to grow the reserves at Pueblo Viejo. Since acquiring the project with the Placer Dome acquisition, reserves have increased approximately 77% or 10.3 million ounces to 23.7 million ounces (100% basis), resulting in an expected mine life of over 25 years.
At the Pascua-Lama(13) project on the border of Chile and Argentina, detailed engineering is about 90% complete. Major earthworks on the Chilean side are advancing, the portal for the tunnel which provides access for the shipment of ore between Chile and Argentina has been established and the Barrealis camp has been progressing well with about 540 people currently on site. In Argentina, contractors for early earthworks site preparation have mobilized to site. Over 25% of the capital has been committed, securing the mining fleet, processing mills, camp accommodation and earthworks contractors. The project remains in line with its pre-production capital budget of $2.8— $3.0 billion and is on schedule to enter production in the first quarter of 2013. Average annual gold production is expected to be 750,000—800,000 ounces in its first full five years of operation at total cash costs of $20—$50 per ounce(14) assuming a silver price of $12 per ounce. For every $1 per ounce increase in the silver spot price, total cash costs are expected to decrease by $35 per ounce over this period.
The feasibility study optimization work at Cerro Casale has been completed. Pre-production capital is expected to be about $4.2 billion (100% basis) with a construction period of approximately 3 years following the receipt of key permits. Pre-production capital is higher than indicated in the pre-feasibility study due to additional expected expenditures related to increased processing capacity, a change from SAG milling to High Pressure Grinding Rolls, and an increase in the Chilean peso foreign exchange rate. Total cash costs are expected to be lower than the prefeasibility study indicated as a result of further optimization of the mine plan, improved metallurgical recoveries and cost efficiencies as a result of the change to High Pressure Grinding Rolls. The next step is to review additional permit requirements before considering a construction decision.
(11) | The Cortez Hills project is managed by our North America regional business unit and not our Capital Projects Group. An update of the project has been included in this section so that it has been grouped with the other Barrick projects. |
(12) | In December 2009, the appeal of the denial of a preliminary injunction sought by certain opponents of the Cortez Hills Project was denied in part and granted in part. As a result, the Company has sought a limited injunction that would restrict groundwater pumping to current levels and enjoin trucking of refractory ore (representing approximately 3% of the ore) to Goldstrike pending completion of a supplemental EIS. The plaintiffs have sought a broader injunction that would enjoin further construction and operation of the Project pending completion of the supplemental EIS. |
(13) | The Company is aware of a number of actions that have been initiated against the Government of Argentina, the Province of San Juan in Argentina or the Government of Chile relating to approvals granted in respect of or actions affecting the Pascua-Lama project. The Company is not party to such actions and has limited information with respect to the nature or status of the claims or complaints. In addition, certain complaints or actions relating to the project have been brought against subsidiaries of the Company. Based on the information currently available to the Company, none of such actions or complaints are believed to present a significant risk to the construction of the project. |
(14) | Total cash costs are calculated net of silver credits assuming silver, gold and oil prices of $12 per ounce, $950 per ounce and $75 per barrel, respectively. |
60
Barrick has agreed to acquire an additional 25% interest in the Cerro Casale project in Chile from Kinross Gold Corporation for consideration of $475 million, comprised of $455 million cash and the elimination of a $20 million contingent obligation which was payable by Kinross to Barrick on a production decision, thereby increasing our interest in the project to 75%. Cerro Casale is one of the world’s largest undeveloped gold-copper deposits, with gold reserves of 23.2 million ounces and 5.8 billion pounds of copper in gold reserves (100% basis) providing for an expected mine life of about 20 years. The project is located in the Maricunga district of Region III in Chile, 130 kilometers north of the Pascua-Lama project. Its proximity to Pascua-Lama is expected to provide opportunities for construction and operating synergies. Upon completion of the transaction with Kinross Gold, our 75% share of average annual production is anticipated to be about 750,000—825,000 ounces of gold and 170—190 million pounds of copper in its first full five years of operation at total cash costs of about $240—$260 per ounce assuming a copper price of $2.50 per pound. A $0.25 per pound change in the copper price would result in an approximate $50 per ounce impact on the expected total cash cost per ounce over this period. On a life of mine basis, our share of average annual production is anticipated to be about 600,000 to 650,000 ounces of gold and 170—190 million pounds of copper at total cash costs of about $140—$160 per ounce.
At Donlin Creek, a large, undeveloped, refractory gold deposit in Alaska, a feasibility study update of our 50% owned project was approved by the Board of Donlin Creek LLC in second quarter 2009. Further optimization studies are underway primarily focused on the potential to utilize natural gas to reduce operating costs. These studies are expected to be completed by mid-2010, at which point the Donlin Creek LLC will either file permit applications for the original project design or, upon unanimous Donlin Creek LLC board approval, approve a supplemental budget and proceed to revise the feasibility study to include the natural gas option.
Reko Diq is a large copper-gold porphyry mineral deposit on the Tethyan belt, located in southwest Pakistan in the province of Balochistan in which we hold a 37.5% interest. The feasibility study is being finalized and is now under review, and progress continues with the expansion studies and the baseline environmental and social impact assessment which is expected to be completed in the first half of 2010. Discussions continue with the government to advance the project(15).
Kabanga is one of the world’s largest undeveloped nickel sulfide deposits located in Tanzania in which we hold a 50% interest. Xstrata Nickel earned a 50% interest in the project under the earn-in agreement during the fourth quarter 2008 and is currently the operator of this project. Expenditures are funded equally by Xstrata Nickel and Barrick. The project specifications continue to evolve and finalization of a feasibility study has been extended through to July 2010 to allow optimization of project engineering and associated capital requirements.
Barrick holds a 10% interest in Sedibelo, a platinum project in South Africa. During the third quarter 2009, the decision was made to halt work and we recorded an impairment charge of $158 million, reducing the carrying amount of our investment in the project and related assets to their estimated fair values. Since that time efforts have been underway to wind down the project in accordance with the shareholder agreement.
(15) | Certain media reports have indicated that the Government of Bolochistan has threatened to terminate the exploration license for the project. No official notice of any such termination has been received. |
61
Review of Significant Income and Expenses(1)
Exploration Expense
($ millions) | | | | | | | | | |
For the years ended December 31 | | 2009 | | 2008 | | 2007 | | Comments on significant trends and variances | |
| | | | | | | | | |
North America | | $ | 62 | | $ | 79 | | $ | 70 | | Decrease mainly due to lower expenditures incurred at Cortez ($8 million) and Bald Mountain ($5 million) and the termination of exploration activities at Pinson ($9 million), partially offset by higher activity at Turquoise Ridge ($3 million). Prior year increase reflects higher activity at Pinson. | |
| | | | | | | | | | | | |
South America | | 23 | | 40 | | 33 | | Mainly due to lower expenditures at Zaldívar ($15 million) compared to the prior year. The increase in 2008 over 2007 reflects higher activity at both Lagunas Norte and Zaldívar. | |
| | | | | | | | | |
Australia Pacific | | 42 | | 62 | | 46 | | Decrease mainly due to reduced expenditures at Osborne ($14 million), Kainantu ($11 million) and Lawlers ($4 million), partially offset by increased exploration activities in areas of Papua New Guinea ($5 million). Prior year increase reflects higher activity at Osborne and Kainantu, partially offset by Granny Smith. | |
| | | | | | | | | |
Africa | | 8 | | 18 | | 15 | | Decrease in 2009 mainly reflects reduced expenditures at North Mara ($7 million) and Golden Ridge ($3 million). | |
| | | | | | | | | |
Capital Projects | | — | | 5 | | 7 | | Decrease in the current year is mainly due to capitalization of costs related to Pueblo Viejo in the current year. Prior year decrease reflects lower expenditures at Pueblo Viejo. | |
| | | | | | | | | |
Other | | 9 | | 12 | | 8 | | Decrease in expenditures mainly reflects lower exploration-related administrative expenses ($3 million). | |
| | | | | | | | | |
Total | | $ | 144 | | $ | 216 | | $ | 179 | | | |
Project Development Expense
($ millions) | | | | | | | | | |
For the years ended December 31 | | 2009 | | 2008 | | 2007 | | Comments on significant trends and variances | |
| | | | | | | | | |
Mine development | | $ | 50 | | $ | 150 | | $ | 151 | | Decrease is mainly due to the capitalization of all development costs incurred at Pueblo Viejo in 2009 that were expensed in 2008 ($67 million), decreased activity at both Fedorova ($22 million) and Kainantu ($17 million), partially offset by increased spending in development-related support expenses ($8 million). In 2008, higher expenditures at Kainantu ($27 million) and Fedorova ($5 million) were largely offset by lower expenditures at Donlin Creek ($33 million). | |
| | | | | | | | | |
Non-capitalizable project costs | | 12 | | 51 | | 32 | | Non-capitalizable costs mainly represent items incurred in the development/construction phase that cannot be capitalized. Decreased expenditures in 2009 reflect lower spending at the Pinson property ($15 million), Sedibelo ($9 million), Golden Sunlight ($9 million) and Cortez Hills ($2 million). The increase in the prior year was mainly due to higher spending at the Pinson property ($17 million) and Cortez Hills ($2 million). | |
| | | | | | | | | |
Other projects | | 23 | | 41 | | 5 | | Decrease mainly reflects management fees received from our partner at Pueblo Viejo ($11 million) and lower expenditures related to corporate development and corporate efficiency programs ($8 million). | |
| | | | | | | | | |
Total | | $ | 85 | | $ | 242 | | $ | 188 | | | |
(1) | The amounts presented in the Review of Significant Income and Expenses tables include the results of discontinued operations. |
62
Amortization and Accretion Expense
($ millions) | | | | | | | | | |
For the years ended December 31 | | 2009 | | 2008 | | 2007 | | Comments on significant trends and variances | |
| | | | | | | | | |
Gold mines | | | | | | | | | |
| | | | | | | | | |
North America | | $ | 361 | | $ | 350 | | $ | 314 | | Higher amortization reflects our acquisition of the remaining 50% of Hemlo ($42 million) and increased sales volume at Storm ($6 million), partially offset by lower sales volume at Golden Sunlight ($27 million), Cortez ($6 million), and Bald Mountain ($4 million). Increase in 2008 reflects the additional 40% ownership interest at Cortez. | |
| | | | | | | | | | | | |
South America | | 133 | | 165 | | 234 | | Decrease in 2009 is mainly due to lower sales volume at Pierina ($24 million) and Lagunas Norte ($8 million). Lower amortization in the prior year reflects an increase in reserve estimates at Pierina. | |
| | | | | | | | | |
Australia Pacific | | 279 | | 258 | | 239 | | Higher amortization in the current year is mainly due to the impact of one time accounting adjustments made in early 2009. Increase in 2008 reflects a full year of amortization at Porgera compared to 2007. | |
| | | | | | | | | |
Africa | | 91 | | 62 | | 78 | | Higher amortization is mainly due to the production start up at Buzwagi in 2009 ($24 million), as well as the shift from open pit to underground mining at Tulawaka ($5 million). Decrease in the prior year reflects lower sales volumes across all mines. | |
| | | | | | | | | |
Copper mines | | | | | | | | | |
| | | | | | | | | |
South America | | 75 | | 66 | | 80 | | Increase in 2009 reflects higher sales volume at our Zaldívar mine ($9 million) compared to the prior year. Lower expenditures in 2008 compared to 2007 are as a result of lower copper sales volumes as well as an increase in reserves. | |
| | | | | | | | | |
Australia Pacific | | 3 | | 57 | | 39 | | Current year amortization reflects impairments taken in fourth quarter 2008 which reduced property, plant and equipment amounts to salvage values. Prior year increase in amortization expense is mainly due to a decrease in the reserve base at Osborne. | |
| | | | | | | | | |
Barrick Energy | | 30 | | 13 | | — | | Increase reflects a full year of amortization at Barrick Energy. | |
| | | | | | | | | |
Other | | 52 | | 19 | | 20 | | Year over year increase reflects higher amortization at our corporate and regional administrative offices as a result of one time accounting adjustments made in early 2009. | |
| | | | | | | | | |
Amortization total | | 1,024 | | 990 | | 1,004 | | | |
| | | | | | | | | |
Accretion | | 58 | | 43 | | 50 | | Increase in 2009 reflects higher ARO balances at our operating mines compared to the prior year. | |
| | | | | | | | | |
Total | | $ | 1,082 | | $ | 1,033 | | $ | 1,054 | | | |
63
Other Significant Income and Expenses
($ millions) | | | | | | | | | |
For the years ended December 31 | | 2009 | | 2008 | | 2007 | | Comments on significant trends and variances | |
| | | | | | | | | |
Impairment charges | | $ | 277 | | $ | 749 | | $ | 42 | | Impairments in 2009 mainly reflect a write-down of our assets at Sedibelo ($158 million) and Plutonic ($43 million) and an impairment of goodwill at Plutonic ($63 million). Impairment charges in 2008 reflect charges taken for goodwill ($678 million) and impairment of long-lived assets ($71 million). | |
| | | | | | | | | |
Write-down of investments | | 1 | | 205 | | 23 | | We recorded no significant impairments in 2009. In 2008, we recorded an impairment charge on our investment in Highland Gold ($140 million), on Asset-Backed Commercial Paper ($39 million) which was subsequently reversed into Other Income, and various other investments in junior gold mining companies ($26 million). In 2007, we recorded an impairment charge on Asset-Backed Commercial Paper of $20 million. | |
| | | | | | | | | |
Corporate administration | | 171 | | 155 | | 155 | | Increase in 2009 mainly reflects higher compensation expense ($7 million), higher spending related to our information technology infrastructure ($4 million) and technical services ($4 million). | |
| | | | | | | | | |
Interest income | | 10 | | 39 | | 141 | | Decrease is mainly due to lower interest rates in 2009. Significant decrease in 2008 reflects lower average cash balances compared to the prior year. | |
| | | | | | | | | |
Interest costs | | | | | | | | | |
| | | | | | | | | |
Total incurred | | 326 | | 243 | | 237 | | Increase mainly reflects additional interest from bond issuances (Q3 2008: $1,250 million, Q1 2009: $750 million, Q4 2009: $1,250 million). | |
| | | | | | | | | |
Capitalized | | 269 | | 222 | | 124 | | Higher interest capitalized primarily relates to additional capital expenditure as mine construction continued. Increases in 2009 related to Pueblo Viejo ($22 million), Pascua-Lama ($14 million), and Cortez Hills ($12 million). Increase in 2008 reflects costs capitalized at Cortez Hills ($40 million), Cerro Casale ($41 million), and Buzwagi ($11 million). | |
| | | | | | | | | |
Expensed | | $ | 57 | | $ | 21 | | $ | 113 | | | |
Income Tax
(percentages) | | | | | | | |
For the years ended December 31 | | 2009 | | 2008 | | 2007 | |
Effective tax rate on ordinary income | | 29 | % | 30 | % | 28 | % |
Elimination of gold sales contracts | | (48 | )% | — | | — | |
Non-taxable goodwill impairment charges | | 2 | % | 10 | % | 1 | % |
Net currency translation (gains)/losses on deferred tax balances | | (1 | )% | 5 | % | (4 | )% |
Canadian functional currency election | | (2 | )% | — | | — | |
Deliveries into corporate gold sales contracts | | — | | — | | 7 | % |
Canadian tax rate changes | | 2 | % | — | | 3 | % |
Release of deferred tax valuation allowances | | — | | (7 | )% | (12 | )% |
Actual effective tax rate | | (18 | )% | 38 | % | 23 | % |
Our effective tax rate on ordinary income decreased from 30% to 29% in 2009 primarily due to the impact of changes in the mix of production and on the mix of taxable income in the various tax jurisdictions where we operate.
Release of Deferred Tax Valuation Allowances
In 2008, we released $175 million of valuation allowances primarily because sources of income became available that enabled tax losses and US Alternative Minimum Tax (“AMT”) credits to be realized.
In 2007, we released $156 million of end of year valuation allowances in Tanzania due to the estimated effect of higher market gold prices on the ability to utilize deferred tax assets. We released other valuation allowances during 2007 totaling $88 million, partly because sources of income became available that enabled tax losses to be realized.
Currency Translation
Deferred tax balances are subject to remeasurement for changes in currency exchange rates each period. The most significant balances are Canadian deferred
64
tax liabilities with a carrying amount of approximately $30 million, Argentinean deferred tax liabilities with a carrying amount of approximately $32 million, and Australian and Papua New Guinea net deferred tax liabilities with a carrying amount of approximately $105 million. In 2009 and 2007, the appreciation of the Canadian and Australian dollar against the US dollar, and the weakening of the Argentinean peso against the US dollar resulted in net translation gains arising totaling $40 million and $76 million, respectively. These gains are included within deferred tax expense/recovery.
Canadian Functional Currency Election
In fourth quarter 2008, we filed an election under Canadian draft legislation to prepare some of our Canadian tax returns using US dollar functional currency effective January 1, 2008. The legislation was enacted in first quarter 2009 which resulted in a one-time deferred tax benefit of $70 million.
Canadian Tax Rate Changes
In the fourth quarter of 2009, a provincial rate change was enacted in Canada that lowered the applicable tax rate. The impact of this tax rate change was to reduce net deferred tax assets in Canada by $59 million, recorded as a component of deferred tax expense.
In the second and fourth quarters of 2007, federal rate changes were enacted in Canada that lowered the applicable tax rate. The impact of these tax rate changes was to reduce net deferred tax assets in Canada by $64 million which was recorded as a component of deferred income tax expense.
Financial Condition Review
Summary Balance Sheet and Key Financial Ratios
($ millions, except ratios) | | | | | |
As at December 31 | | 2009 | | 2008 | |
Total cash and cash equivalents | | $ | 2,564 | | $ | 1,437 | |
Non-cash working capital | | 1,575 | | 1,842 | |
Non-current assets | | 22,137 | | 20,049 | |
Non-current liabilities excluding debt | | 2,827 | | 2,508 | |
Debt(1) | | 6,919 | | 4,326 | |
Total shareholders’ equity | | 15,063 | | 15,277 | |
Net Debt | | 4,355 | | 2,889 | |
Total common shares outstanding (millions of shares)(2) | | 984 | | 873 | |
Key Financial Ratios: | | | | | |
Current ratio(3) | | 2.79:1 | | 2.23:1 | |
Net debt-to-equity(4) | | 0.29:1 | | 0.19:1 | |
| | | | | | | |
(1) | Represents total long-term debt of $6,264 million (2008: $4,326 million) excluding fair value adjustments plus the remaining settlement obligation to close out gold sales contracts of $655 million (2008: nil). |
(2) | Total common shares outstanding do not include 12.4 million stock options. The increase from December 31, 2008 is caused by the Common Share Offering and the exercise of stock options. |
(3) | Represents current assets divided by current liabilities as at December 31, 2009 and December 31, 2008. |
(4) | Represents net debt divided by total shareholders’ equity as at December 31, 2009 and December 31, 2008. |
Net Debt Summary
($ millions) | | | | | |
For the years ended December 31 | | 2009 | | 2008 | |
Long-term debt excluding fair value adjustments(1) | | $ | 6,264 | | $ | 4,326 | |
Settlement obligation to close out gold sales contracts(2) | | 655 | | — | |
Cash | | (2,564 | ) | (1,437 | ) |
Total net debt | | $ | 4,355 | | $ | 2,889 | |
(1) | Represents total long-term debt excluding fair value adjustments. |
(2) | Based on the final settlement value of these contracts. |
Non-cash Working Capital
($ millions) | | | | | |
For the years ended December 31 | | 2009 | | 2008 | |
Inventories(1) | | $ | 2,336 | | $ | 1,966 | |
Other current assets | | 422 | | 1,092 | |
Trade and other receivables | | 251 | | 197 | |
VAT and fuel tax receivables(2) | | 285 | | 225 | |
Accounts payable and other current liabilities | | (1,719 | ) | (1,638 | ) |
Non-cash working capital | | $ | 1,575 | | $ | 1,842 | |
(1) | Includes long-term stockpiles of $796 million (2008: $688 million). |
(2) | Includes long-term VAT and fuel tax receivables of $124 million (2008: $117 million). |
65
The decrease in non-cash working capital primarily relates to a decrease in derivative assets, as we have realized a majority of the unrealized copper gains that existed at December 31, 2008, offset by an increase in ore inventories.
Balance Sheet Review
Total assets were $27.1 billion in 2009, an increase of $2.9 billion or 12% compared to the prior year. The increase primarily reflects an increase of $1.6 billion in property, plant and equipment from sustaining and project capital expenditures and growth in our cash balance as a result of strong operating cash flows, excluding the settlement of the gold sales contracts, which was financed through the Common Share Offering and the Debt Offering. These increases were partially offset by a decrease in derivative assets. Total liabilities increased by $2.8 billion, or 32% compared to the prior year, primarily due to an increase in long-term debt of $1.9 billion reflecting the Debt Offering and the issuance of fixed rate notes in March 2009; $0.7 billion related to the remaining obligation of the Floating Contracts; and an increase in our deferred tax liabilities.
Our asset base is primarily comprised of non-current assets such as property, plant and equipment and goodwill, reflecting the capital intensive nature of the mining business and our history of growing through acquisitions, plus production inventories and cash and equivalents. We typically do not carry a material accounts receivable balance, since only sales of concentrate have a settlement period.
Shareholders’ Equity
Shares outstanding
As at January 29, 2010 | | No. of shares | |
Common shares | | 984,355,181 | |
Stock options | | 12,413,187 | |
In September 2009, we completed the Common Share Offering of 109 million common shares at a price of $36.95 per common share for net proceeds of $3.9 billion. This increase in our common shares outstanding represented a dilution of the ownership interests of shareholders prior to the offering of approximately 12%.
During first quarter 2009, we redeemed the remainder (0.5 million) of the Barrick Gold Inc. exchangeable shares into Barrick common shares. The special voting share was also redeemed and cancelled in the first quarter 2009.
For further information regarding the outstanding shares and stock options, please refer to note 28 of the consolidated financial statements and our 2009 Management Information Circular and Proxy Statement.
Dividend Policy
Our 2009 dividend rate was $0.40 per common share. This dividend reflects our ability to generate substantial cash flows from our operations in a high gold price environment. With strong cash flow and the industry’s only ‘A’-rated balance sheet, we determined that we have the financial resources to return additional value to shareholders while still investing in advanced projects. The amount and timing of any dividends is within the discretion of our Board of Directors. The Board of Directors reviews the dividend policy semi-annually based on our current and projected liquidity profile, and capital requirements for capital projects and potential acquisitions.
Comprehensive Income
Comprehensive income consists of net income or loss, together with certain other economic gains and losses, that collectively are described as “other comprehensive income” or “OCI”, and excluded from the income statement.
In 2009, other comprehensive gains of $411 million, after-tax, mainly included: gains of $705 million on hedge contracts designated for future periods, caused primarily by changes in currency exchange rates, copper prices, and fuel prices; reclassification adjustments totaling $216 million for gains on hedge contracts designated for 2009 that were transferred to earnings in 2009; $6 million transferred to earnings related to gains recorded on the sale of shares in various investments in junior mining companies; $1 million in losses transferred to income due to the impairment of investments; $34 million of gains recorded as a result of changes in the fair value of investments held during the year; and $56 million in gains for currency translation adjustments on Barrick Energy.
66
Included in accumulated other comprehensive income at December 31, 2009 were unrealized pre-tax gains on currency, commodity and interest rate hedge contracts totaling $276 million. The balance primarily relates to currency hedge contracts which are designated against operating costs and capital expenditures mostly over the next three years and are expected to help protect against the impact of the strengthening of the Australian and Canadian dollar against the US dollar. These hedge gains/losses are expected to be recorded in earnings at the same time as the corresponding hedged operating costs and amortization of capital expenditures are also recorded in earnings.
Financial Position
We have maintained a sound financial position in 2009 despite the market turbulence that was experienced in late 2008 and throughout 2009. This is illustrated by our significant cash and working capital balances and our relatively low debt to equity and debt to total capitalization ratios as at December 31, 2009.
Our sound financial position is reflected in the fact that we have the only A-rated balance sheet in the gold mining industry as measured by S&P. Our credit ratings, as established by S&P and Moody’s, have remained stable. Our ability to access unsecured debt markets and the related cost of debt financing is, in part, dependent upon maintaining an acceptable credit rating. Deterioration in our credit rating would not adversely affect existing debt securities, but could impact funding costs for any new debt financing.
Credit Rating from Major Rating Agencies
At January 29, 2009 | | | |
Standard and Poor’s (“S&P”) | | A— | |
Moody’s | | Baa1 | |
The key factors impacting our financial position, and therefore our credit rating, include the following:
· Our market capitalization and the strength of our balance sheet, including the amount of net debt and our debt-to-equity ratio (refer to liquidity section of this MD&A for discussion of key factors impacting these measures in 2009);
· Our net cash flow, including cash generated by operating activities (refer to liquidity section of this MD&A for discussion of key factors impacting these measures in 2009);
· Expected capital expenditure requirements (refer to the outlook section of this MD&A for a discussion of key factors impacting these measures in future periods);
· The quantity of our gold reserves (refer to page 155 to 162 for more information); and
· Our geo-political risk profile.
Liquidity and Cash Flow
Total cash and cash equivalents at the end of 2009 were $2.6 billion. At year end, our cash position consisted of a mix of term deposits, treasury bills and money market investments.
Cash Summary
As as December 31 | | 2009 | | 2008 | |
US dollars | | $ | 2,392 | | $ | 1,265 | |
Canadian dollars | | 71 | | 74 | |
Australian dollars | | 57 | | 54 | |
Other | | 44 | | 44 | |
| | $ | 2,564 | | $ | 1,437 | |
Net debt was $4.4 billion, with a net debt-to-equity ratio of 0.29:1. The majority of our outstanding long-term debt matures at various dates beyond 2012, with approximately $227 million repayable in the period 2010 to 2012. In addition, counterparties to debt and derivative instruments do not have unilateral discretionary rights to accelerate repayment at earlier dates, and therefore we are largely protected from short-term liquidity fluctuations.
67
Sources and Uses of Net Debt
($ millions) | | | | | |
For the years ended December 31 | | 2009 | | 2008 | |
Operating activities | | | | | |
Adjusted operating cash flow | | $ | 2,899 | | $ | 2,254 | |
Settlement of gold sales contracts | | (5,221 | ) | — | |
Total operating activities | | (2,322 | ) | 2,254 | |
Investing activities | | | | | |
Capital expenditures — minesite sustaining | | (784 | ) | (742 | ) |
Capital expenditures — minesite expansion | | (60 | ) | — | |
Capital expenditures — projects(1) | | (1,514 | ) | (1,034 | ) |
Acquisitions | | (101 | ) | (2,174 | ) |
Other investing activities | | 44 | | 30 | |
Total investing activities | | (2,415 | ) | (3,920 | ) |
Financing activities | | | | | |
Common share offering | | 3,885 | | — | |
Dividends | | (369 | ) | (349 | ) |
Funding from non-controlling interests | | 304 | | 88 | |
Deposit on silver sale agreement | | 213 | | — | |
Other financing activities | | 39 | | 40 | |
Total financing activities | | 4,072 | | (221 | ) |
Repayment with restricted cash | | (113 | ) | (18 | ) |
Other non-cash movements | | (33 | ) | (43 | ) |
Remaining settlement obligation to close out gold sales contracts | | (655 | ) | — | |
Net increase in net debt | | (1,466 | ) | (1,948 | ) |
Net debt at beginning of period | | (2,889 | ) | (941 | ) |
Net debt at end of period | | $ | (4,355 | ) | $ | (2,889 | ) |
(1) | The amounts include capitalized interest of $257 million (2008: $191 million). |
One of our primary ongoing sources of liquidity is operating cash flow and, in 2009, adjusting for the settlement of Gold Hedges and Floating Contracts, we generated $2.9 billion in operating cash flow. We have generated an average of $2.3 billion in adjusted operating cash flow over the past three years. The principal risk factor affecting operating cash flow is realized gold prices which, in turn, are impacted by market gold prices. Lower market copper prices also impact operating cash flow. Utilizing option collar strategies, we have put in place floor protection on approximately 80% of our expected copper production for 2010 at an average price of $2.19 per pound but can fully participate in copper price upside on approximately 100% of our expected 2010 copper production up to a maximum average price of $3.63 per pound. Beyond 2010, we are fully exposed to market copper prices.
The principal uses of liquidity were settlement of gold sales contracts, sustaining capital expenditures, construction activities at capital projects, acquisitions, and dividend payments. The $5.2 billion settlement of gold sales contracts in 2009 was funded primarily by the proceeds of the Common Share Offering in September 2009 and the $1.25 billion Debt Offering in October 2009.
In 2009, cash flow generated by operations, adjusted for the settlement of gold sales contracts and after paying for sustaining capital, was $2.2 billion. Assuming we are able to sustain this level of cash generation and current dividend rates totaling about $0.4 billion per year, $1.8 billion per year would be available for investment in capital projects and acquisitions. The most significant factor impacting whether this level of cash generation is sustainable is market gold and copper prices. We expect to spend about $3.6 billion over the next four years to fund remaining construction activities at Pueblo Viejo and Pascua-Lama, partly funded by deposits received from Silver Wheaton and external project financing for a portion of the construction cost of Pueblo Viejo and Pascua-Lama. For Pueblo Viejo, we remain in active discussions with a group of export credit agencies and commercial banks to put in place $1 billion of project financing, including our partner’s share, which covers a portion of the total capital cost of the project. We have also finalized a feasibility study for Cerro Casale that, subject to approving the project to go forward into construction, would require us to spend about $3.15 billion for our share of the cost of construction over a three year period following the receipt of key permits. We are also finalizing feasibility studies for various other projects, which would require substantial up front capital investments to bring them into production, and are still subject to a final capital allocation review.
Investments in capital projects and acquisitions are subject to an internal capital allocation review prior to proceeding with new expenditures. This review entails an assessment of our overall liquidity, the overall level of investment required, and the prioritization of investments. The assessment also takes into account expected levels of future operating cash
68
flow and the cost and availability of new financing. A decline in market gold prices and/or copper prices could impact the timing and amount of future investment in capital projects and/or other uses of capital.
Alternatives for sourcing our future capital or other liquidity needs include other credit facilities, future operating cash flow, sale of non-core assets, project financings and debt or equity financings. These alternatives are continually evaluated to determine the optimal mix of capital resources of our capital needs.
In light of current global economic conditions, our ability to secure new financing for our expected capital needs for capital projects could be significantly impacted, particularly if these conditions persist for an extended period of time. In particular:
· An increased cost of financing due to rising credit spreads could have a negative impact on overall project economics.
· A lack of availability of credit on acceptable terms could make it difficult for us to raise the capital required to build some or all of our projects on the timelines previously anticipated or at all.
· Our joint venture partners may also have difficulty securing funding for their share of project capital requirements which could impact the ability to build some of the projects.
Sources and Uses of Cash
In 2009, net cash used by operating activities totaled $2,322 million, an increase of $4,576 million compared to the prior year, primarily related to the $5,221 million in payments related to the settlement of our gold sales contracts. Operating cash flow was also affected by higher realized gold prices, lower income taxes paid as a result of the production mix and the use of tax loss carry forwards, partially offset by higher gold cash costs, lower realized copper prices, and lower gold sales volumes.
Adjusted operating cash flow in 2009 was $2,899 million, representing a $645 million increase over 2008. Adjusted operating cash flow was affected by the same factors as operating cash flow and was adjusted for the $5,221 million charge related to the elimination of our gold sales contracts.
FACTORS AFFECTING OPERATING CASH FLOW
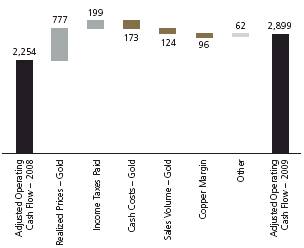
Cash used in investing activities amounted to $2,415 million, a decrease of $1,505 million compared to the prior year, primarily related to a decrease in acquisitions, partially offset by an increase in capital expenditures. Significant investing activities in 2008 included the $1.7 billion cash acquisition of the additional 40% interest in Cortez and the $460 million cash acquisition of Barrick Energy. Capital expenditures, including capitalized interest, amounted to $2,358 million, of which $784 million were sustaining capital expenditures related to our operating mines and $965 million related to our development projects on an equity basis.
69
Capital Expenditures(1),(2)
($ millions) | | | | | | | |
For the years ended December 31 | | 2009 | | 2008 | | 2007 | |
Project capital expenditures | | | | | | | |
Buzwagi(3) | | $ | 52 | | $ | 273 | | $ | 66 | |
Pascua-Lama | | 202 | | 112 | | 102 | |
Pueblo Viejo | | 433 | | 157 | | — | |
Cortez Hills | | 278 | | 155 | | 75 | |
Kainantu | | — | | 4 | | — | |
Sedibelo | | — | | 38 | | — | |
Sub-total(4) | | $ | 965 | | $ | 739 | | $ | 243 | |
Capital expenditures attributable to non-controlling interests(5) | | 292 | | 104 | | — | |
Total project capital expenditures | | $ | 1,257 | | $ | 843 | | $ | 243 | |
Minesite expansionary capital expenditures | | | | | | | |
Golden Sunlight | | $ | 37 | | — | | — | |
Veladero(6) | | 23 | | — | | — | |
Total capital expenditures — minesite expansionary | | $ | 60 | | — | | — | |
Sustaining capital expenditures | | | | | | | |
North America | | $ | 170 | | $ | 161 | | $ | 143 | |
South America | | 181 | | 154 | | 195 | |
Australia Pacific | | 245 | | 215 | | 218 | |
Africa(3) | | 134 | | 172 | | 106 | |
Other(7) | | 54 | | 40 | | 17 | |
Total capital expenditures — minesite sustaining | | $ | 784 | | $ | 742 | | $ | 679 | |
Capitalized interest | | 257 | | 191 | | 124 | |
Total | | $ | 2,358 | | $ | 1,776 | | $ | 1,046 | |
(1) | The amounts presented in this table include the results of discontinued operations. |
(2) | These amounts are presented on a cash basis consistent with the amounts presented on the consolidated statement of cash flows. |
(3) | Buzwagi entered into production as of May 1, 2009. Capital expenditures from May onwards have been reflected in minesite sustaining, although construction continued until third quarter 2009. |
(4) | On an accrual basis, our share of project capital expenditures is $1,364 million including capitalized interest. |
(5) | Amount reflects our partner’s share of expenditures at the Pueblo Viejo project on a cash basis. |
(6) | These amounts include capital expenditures related to the development of a new pit at our Veladero mine. |
(7) | These amounts include capital expenditures at Barrick Energy. |
Cash provided by financing activities for 2009 was $5,829 million. The significant financing activities were the Common Share Offering and Debt Offering, representing combined net proceeds of $5,104 million used in the fourth quarter settlement of the gold sales contracts. Other financing activities included proceeds of $750 million from debt issuance in first quarter, and the silver sale deposit received from Silver Wheaton for $213 million. These amounts were partially offset by debt repayments of $397 million and dividend payments of $369 million.
Financial Instruments
We use a mixture of cash, long-term debt and shareholders’ equity to maintain an efficient capital structure and ensure adequate liquidity exists to meet the cash needs of our business. We use interest rate contracts to mitigate interest rate risk that is implicit in our cash balances and outstanding long-term debt. In the normal course of business, we are inherently exposed to currency and commodity price risk. We use currency and commodity hedging instruments to mitigate these inherent business risks. We also hold certain derivative instruments that do not qualify for hedge accounting treatment. These non-hedge derivatives are described in note 20 to our consolidated financial statements. For a discussion of certain risks and assumptions that relate to the use of derivatives, including market risk, market liquidity risk and credit risk, refer to notes 2 and 20 to our consolidated financial statements. For a discussion of the methods used to value financial instruments, as well as any significant assumptions, refer to note 20 to our consolidated financial statements.
Counterparty Risk
Our financial position is also dependent, in part, on our exposure to the risk of counterparty defaults related to the net fair value of our derivative contracts, including the liabilities related to our Floating Contracts. Counterparty risk is the risk that a third party might fail to fulfill its performance obligations under the terms of a financial instrument. Counterparty risk can be assessed both in terms of credit risk and liquidity risk. For cash and equivalents and accounts receivable, credit risk represents the carrying amount on the balance sheet, net of any overdraft positions.
For derivatives, when the fair value is positive, this creates credit risk. When the fair value of a derivative is negative, we assume no credit risk. However, liquidity risk exists to the extent a counterparty is no longer able to perform in accordance with the terms of the contract due to insolvency. In cases where we have a legally enforceable master netting agreement with a counterparty, credit risk exposure represents
70
the net amount of the positive and negative fair values for similar types of derivatives. For a net negative amount, we regard credit risk as being zero. For a net positive amount, this is a reasonable basis to measure credit risk when there is a legally enforceable master netting agreement. We mitigate credit and liquidity risk by:
· Entering into derivatives with high credit-quality counterparties;
· Limiting the amount of exposure to each counterparty; and
· Monitoring the financial condition of counterparties.
As of December 31, 2009, we had 26 counterparties to our derivative positions, including the Floating Contracts, consisting primarily of large commercial banks. We proactively manage our exposure to individual counterparties in order to mitigate both credit and liquidity risks. For those counterparties in a net asset position, three hold greater than 10% of our mark-to-market asset position, with the largest counterparty holding 28%. For those counterparties in a net liability position, four hold greater than 10% of our mark-to-market liability position, with the largest counterparty holding 18%. Through January 29, 2010, none of the counterparties with which we held outstanding contracts had declared insolvency.
Summary of Financial Instruments
As at and for the year ended December 31, 2009
Financial
Instrument | | Principal/
Notional Amount | | Associated
Risks | |
Cash and equivalents | | $ 2,564 million | | · Interest rate | |
| | | | · Credit | |
Accounts receivable | | $ 251 million | | · Credit | |
Available-for-sale securities | | $ 61 million | | · Market | |
Floating Contracts | | $ 655 million | | · Interest rate | |
Accounts payable | | $ 1,221 million | | · Interest rate | |
Long-term debt | | $ 6,264 million | | · Interest rate | |
Restricted share units | | $ 124 million | | · Market | |
Deferred share units | | $ 6 million | | · Market | |
Derivative instruments — currency contracts | | C $ 408 million
A $ 4,459 million
CLP 36,240 million | | · Market/liquidity | |
Derivative instruments — copper contracts | | 203 million lbs | | · Market/liquidity | |
| | | | · Credit | |
Derivative instruments — energy contracts | | Fuel 4.1 million bbls
Propane 12 million gallons
Natural Gas 0.8 million gigajoules | | · Market/liquidity · Credit | |
Non-hedge derivatives | | various | | · Market/liquidity · Credit | |
Commitments and Contingencies
Capital Expenditures Not Yet Committed
We expect to incur capital expenditures during the next five years for both projects and producing mines. The projects are at various stages of development, from preliminary exploration or scoping study stage through to the construction execution stage. The ultimate decision to incur capital expenditures at each potential site is subject to positive results which allow the project to advance past decision hurdles. Three projects were at an advanced stage at December 31, 2009, namely Cortez Hills, Pueblo Viejo and Pascua-Lama (refer to page 60 for further details).
71
Contractual Obligations and Commitments
| | Payments due | | | |
($ millions) | | | | | | | | | | | | 2015 and | | | |
As at December 31, 2009 | | 2010 | | 2011 | | 2012 | | 2013 | | 2014 | | thereafter | | Total | |
Long-term debt(1) | | | | | | | | | | | | | | | |
Repayment of principal | | $ | 30 | | $ | 10 | | $ | 139 | | $ | 565 | | $ | 350 | | $ | 5,108 | | $ | 6,202 | |
Capital leases | | 24 | | 14 | | 10 | | 9 | | 3 | | 2 | | 62 | |
Interest | | 366 | | 359 | �� | 361 | | 345 | | 320 | | 4,075 | | 5,826 | |
Asset retirement obligations(2) | | 89 | | 77 | | 52 | | 56 | | 128 | | 1,269 | | 1,671 | |
Operating leases | | 13 | | 7 | | 3 | | — | | — | | — | | 24 | |
Restricted share units | | 38 | | 47 | | 39 | | — | | — | | — | | 124 | |
Pension benefits | | 29 | | 23 | | 23 | | 23 | | 23 | | 111 | | 232 | |
Other post-retirement obligations | | 3 | | 3 | | 3 | | 3 | | 2 | | 11 | | 25 | |
Derivative liabilities(3) | | 538 | | 79 | | 170 | | 56 | | 2 | | — | | 845 | |
Purchase obligations for supplies and consumables(4) | | 497 | | 206 | | 126 | | 98 | | 89 | | 191 | | 1,207 | |
Capital commitments(5) | | 855 | | 241 | | 51 | | 1 | | — | | — | | 1,148 | |
Social development costs | | 101 | | 10 | | 9 | | 9 | | 39 | | 42 | | 210 | |
Total | | $ | 2,584 | | $ | 1,076 | | $ | 986 | | $ | 1,165 | | $ | 956 | | $ | 10,809 | | $ | 17,576 | |
(1) | Long-term Debt and Interest — Our debt obligations do not include any subjective acceleration clauses or other clauses that enable the holder of the debt to call for early repayment, except in the event that we breach any of the terms and conditions of the debt or for other customary events of default. The Veladero financing is collateralized by assets at the Veladero mine. Pursuant to the terms of the Veladero financing, certain operational and technical requirements must be achieved prior to December 31, 2009. An extension was granted until March 31, 2010 to amend the relevant documents, with an expectation that these necessary operational and technical requirement deadlines will be postponed until December 31, 2010. If the amendments are not obtained, Barrick may be required to repay the debt prior to its scheduled maturity. As at December 31, 2009, the outstanding debt is about $62 million. Other than this security, we are not required to post any collateral under any debt obligations. The terms of our debt obligations would not be affected by deterioration in our credit rating. Projected interest payments on variable rate debt were based on interest rates in effect at December 31, 2009. Interest is calculated on our long-term debt obligations using both fixed and variable rates. |
(2) | Asset Retirement Obligations — Amounts presented in the table represent the undiscounted future payments for the expected cost of asset retirement obligations. |
(3) | Derivative Liabilities — Amounts presented in the table relate to derivative contracts disclosed under notes 2 and 20 to the consolidated financial statements. Payments related to derivative contracts cannot be reasonably estimated given variable market conditions. |
(4) | Purchase Obligations for Supplies and Consumables — Includes commitments related to new purchase obligations to secure a supply of acid, tires and cyanide for our production process. |
(5) | Capital Commitments — Purchase obligations for capital expenditures include only those items where binding commitments have been entered into. Commitments at the end of 2009 mainly related to construction capital at Pueblo Viejo and Pascua-Lama. |
Litigation and Claims
We are currently subject to various litigation as disclosed in note 30 to the consolidated financial statements, and we may be involved in disputes with other parties in the future that may result in litigation. If we are unable to resolve these disputes favorably, it may have a material adverse impact on our financial condition, cash flow and results of operations.
72
Review of Quarterly Results
Quarterly Information(1) | | 2009 | | 2008 | |
($ millions, except where indicated) | | Q4 | | Q3 | | Q2 | | Q1 | | Q4 | | Q3 | | Q2 | | Q1 | |
Sales(2) | | $ | 2,452 | | $ | 2,096 | | $ | 2,029 | | $ | 1,827 | | $ | 2,110 | | $ | 1,878 | | $ | 1,967 | | $ | 1,958 | |
Realized price(3) — gold | | 1,119 | | 971 | | 931 | | 915 | | 809 | | 874 | | 898 | | 930 | |
Realized price(3) — copper | | 3.44 | | 2.90 | | 3.18 | | 2.93 | | 3.06 | | 3.49 | | 3.65 | | 3.50 | |
Cost of sales | | 1,013 | | 971 | | 975 | | 955 | | 1,191 | | 1,028 | | 882 | | 775 | |
Net income/(loss) | | 215 | | (5,350 | ) | 492 | | 371 | | (468 | ) | 254 | | 485 | | 514 | |
Per share(4) — (dollars) | | 0.22 | | (6.07 | ) | 0.56 | | 0.42 | | (0.54 | ) | 0.29 | | 0.56 | | 0.59 | |
Adjusted net income(5) | | 604 | | 473 | | 431 | | 296 | | 277 | | 404 | | 442 | | 537 | |
Per share(4) — (dollars) | | 0.61 | | 0.54 | | 0.49 | | 0.34 | | 0.32 | | 0.46 | | 0.51 | | 0.62 | |
EBITDA(6) | | 813 | | (4,933 | ) | 954 | | 655 | | (45 | ) | 522 | | 886 | | 984 | |
Operating cash flow | | (4,300 | ) | 911 | | 718 | | 349 | | 439 | | 544 | | 505 | | 718 | |
Adjusted operating cash flow(7) | | $ | 921 | | $ | 911 | | $ | 718 | | $ | 349 | | $ | 439 | | $ | 544 | | $ | 505 | | $ | 718 | |
(1) | The amounts presented in this table include the results of discontinued operations. |
(2) | Per our consolidated financial statements. |
(3) | Per ounce/pound weighted average. Realized price is a non-GAAP financial performance measure with no standard meaning under US GAAP. For further information and a detailed reconciliation, please see page 89 of this MD&A. |
(4) | Calculated using weighted average number of shares outstanding under the basic method of earnings per share. |
(5) | Adjusted net income is a non-GAAP financial performance measure with no standard meaning under US GAAP. For further information and a detailed reconciliation, please see page 85 of this MD&A. |
(6) | EBITDA is a non-GAAP financial performance measure with no standard meaning under US GAAP. For further information and a detailed reconciliation, please see page 88 of this MD&A. |
(7) | Adjusted operating cash flow is a non-GAAP financial performance measure with no standard meaning under US GAAP. For further information and a detailed reconciliation, please see page 86 of this MD&A. |
Our financial results for the last eight quarters reflect: volatile spot gold and copper prices that impact realized sales price and generally higher gold and copper production costs mainly caused by inflationary pressures. The net loss realized in third quarter 2009 includes a $5.7 billion charge relating to a decision to eliminate our gold sales contracts. In fourth quarter 2008, the net loss included write-downs of goodwill and property, plant and equipment, and investments totaling $773 million, net of tax.
Fourth Quarter Results
In fourth quarter 2009, we reported net income of $215 million, compared to a loss of $468 million in the same prior year period. The loss in fourth quarter 2008 was primarily driven by post-tax impairment charges totaling $773 million. Adjusted net income in fourth quarter 2009, which excludes the impact of impairment charges, was $327 million higher than the same prior year period, an increase of 118%, as higher gold and copper prices and higher copper sales volumes were offset by lower gold sales volumes and higher total cash costs for gold and copper.
In fourth quarter 2009, we sold 1.82 million ounces of gold and 118 million pounds of copper, compared to 2.19 million ounces and 105 million pounds in the same prior year quarter. Sales in fourth quarter 2009 were higher than the same prior year period reflecting higher market prices for both copper and gold and higher copper sales volumes. In fourth quarter 2009, cost of sales applicable to gold was $872 million or $474 per ounce on a total cash cost basis, a decrease of $186 million and increase of $3 per ounce from the prior year, respectively. Cost of sales applicable to gold was impacted by lower production in fourth quarter 2009, compared to the same prior year period. Total cash costs for gold were slightly higher, as the regional production mix shifted to our higher cost regions in fourth quarter 2009. Net cash costs decreased by $61 per ounce to $321 per ounce, compared to $382 per ounce in the prior year reflecting higher realized copper prices and lower copper total cash costs.
Operating cash flow in fourth quarter 2009 was $(4,300) million, a significant decrease from the same prior year period as a result of the cost of settling the gold sales contracts amounting to $5,221 million. Adjusted operating cash flow in fourth quarter 2009, which excludes the cost of settling the gold sales contracts, was $921 million, a 110% increase over the same prior year period reflecting higher market prices for gold and copper and an increase in copper sales volumes.
73
US GAAP Critical Accounting Policies and Estimates
Management has discussed the development and selection of our critical accounting estimates with the Audit Committee of the Board of Directors, and the Audit Committee has reviewed the disclosure relating to such estimates in conjunction with its review of this MD&A. The accounting policies and methods we utilize determine how we report our financial condition and results of operations, and they may require management to make estimates or rely on assumptions about matters that are inherently uncertain.
Our financial condition and results of operations are reported using accounting policies and methods prescribed by US GAAP. In certain cases, US GAAP allows accounting policies and methods to be selected from two or more alternatives, any of which might be reasonable yet result in our reporting materially different amounts. We exercise judgment in selecting and applying our accounting policies and methods to ensure that, while US GAAP compliant, they reflect our judgment of an appropriate manner in which to record and report our financial condition and results of operations.
Accounting Policy Changes in 2009
This section includes a discussion of significant accounting policy changes and critical accounting estimates that were adopted in our 2009 consolidated financial statements.
On July 1, 2009, the Financial Accounting Standards Board’s (FASB) Codification of US GAAP was launched as the sole source of authoritative non-governmental US GAAP. The Accounting Standards Codification (“ASC”) is not intended to change US GAAP, but rather reorganize existing guidance by accounting topic to allow easier identification of applicable standards. We have updated any references to US GAAP to reflect the Codification.
Measuring Fair Value of Liabilities
In August 2009, the FASB issued Accounting Standards Update (ASU) 2009-05, Measuring Fair Value of Liabilities which is effective prospectively for interim periods beginning after August 1, 2009, with early adoption permitted. Existing guidance required that the fair value of liabilities be measured under the assumption that the liability is transferred to a market participant. ASU 2009-05 provides further clarification that fair value measurement of a liability should assume transfer to a market participant as of the measurement date without settlement with the counterparty. Therefore, the fair value of the liability shall reflect non-performance risk, including but not limited to a reporting entity’s own credit risk. We have adopted ASU 2009-05 in fourth quarter 2009.
Interim Disclosures about Fair Value of Financial Instruments
In April 2009, to enhance the transparency surrounding the treatment of financial instruments, the FASB issued new guidance requiring disclosures relating to the fair value of financial instruments to be made at each interim reporting period regardless of how these instruments are recognized in the financial statements. We adopted the increased disclosure requirements beginning in first quarter 2009. Refer to note 21 for related disclosures.
Disclosures by Public Entities (Enterprises) about Transfers of Financial Assets and Interests in Variable Interest Entities
In December 2008, the FASB issued guidance for the purpose of improving the transparency of transfers of financial assets and an enterprise’s involvement with variable interest entities (VIEs), including qualifying special-purpose entities (QSPEs). The impact on our financial reporting requirements is limited to the new VIE disclosures.
The VIE disclosure requirements focus on an enterprise’s involvement with VIEs and its judgments about the accounting for them. The new guidance also required disclosure of the details of any financial or other support provided to a VIE that the enterprise was not previously contractually required to provide, and the primary reasons for providing the support. The primary beneficiary of a VIE is also required to disclose the terms of any arrangements that could require the enterprise to provide future support to the VIE. In addition, it required disclosure of the carrying amount and classification of the variable interest entity’s assets and liabilities in the Balance Sheet and a reconciliation of those amounts to the enterprise’s maximum exposure to loss.
74
The adoption of this guidance has resulted in expanded disclosure around our involvement with our VIEs and the significant judgments and assumptions we make in accounting for them. We have also included tables that reflect how our consolidated VIEs are included in our Consolidated Statement of Income and Balance Sheet.
Disclosures about Derivative Instruments and Hedging Activities
In first quarter 2009, we adopted new disclosure requirements for derivative instruments and hedging activities issued by the FASB in March 2008. Under this new guidance, entities are required to provide enhanced disclosures about (a) how and why an entity uses derivative instruments, (b) how derivative instruments and related hedged items are accounted for, and (c) how derivative instruments and related hedged items affect an entity’s financial position, financial performance and cash flows. To the extent the required information was not previously disclosed in our 2008 annual consolidated financial statements, we incorporated new disclosures in note 20.
Business Combinations
In first quarter 2009, we began applying the new provisions for business combinations consummated after December 31, 2008. Under the new guidance, business acquisitions are accounted for under the “acquisition method”, compared to the “purchase method” mandated previously.
The more significant changes to our accounting for business combinations that will result from applying the acquisition method include: (i) the definition of a business is broadened to include some development stage entities, and therefore more acquisitions may be accounted for as business combinations rather than asset acquisitions; (ii) the measurement date for equity interests issued by the acquirer is the acquisition date instead of a few days before and after terms are agreed to and announced, which may significantly change the amount recorded for the acquired business if share prices differ from the agreement and announcement date to the acquisition date; (iii) all future adjustments to income tax estimates will be recorded to income tax expense, whereas under the previous requirements, certain changes in income tax estimates were recorded to goodwill; (iv) acquisition-related costs of the acquirer, including investment banking fees, legal fees, accounting fees, valuation fees, and other professional or consulting fees will be expensed as incurred, whereas under the previous guidance these costs were capitalized as part of the business combination; (v) the assets acquired and liabilities assumed as part of a business combination, whether full, partial or step acquisition, result in all assets and liabilities recorded at 100% of fair value, whereas under the previous requirements only the controlling interest’s portion is recorded at fair value; (vi) recognition of a bargain purchase gain when the fair value of the identifiable assets exceeds the purchase price, whereas under the previous guidance, the net book value of the identifiable assets would have been adjusted downward; and (vii) the non-controlling interest will be recorded at its share of fair value of net assets acquired, including its share of goodwill, whereas under previous guidance the non-controlling interest is recorded at its share of carrying value of net assets acquired with no goodwill being allocated.
Non-controlling Interests in Consolidated Financial Statements
In first quarter 2009, we adopted the provisions for non-controlling interests issued by the FASB in December 2007. Under the new guidance, non-controlling interests are measured at 100% of the fair value of assets acquired and liabilities assumed. Prior to the effective date of the new guidance, non-controlling interests were measured at book value. For presentation and disclosure purposes, non-controlling interests are now classified as a separate component of equity. In addition, the new guidance changes the manner in which increases/decreases in ownership percentages are accounted for. Changes in ownership percentages are recorded as equity transactions and no gain or loss is recognized as long as the parent retains control of the subsidiary. When a parent company deconsolidates a subsidiary but retains a non-controlling interest, the non-controlling interest is re-measured at fair value on the date control is lost and a gain or loss is recognized at that time. Further, accumulated losses attributable to the non-controlling interests are no longer limited to the original carrying amount, and therefore non-controlling interests could have a negative carrying balance.
75
The new provisions are to be applied prospectively with the exception of the presentation and disclosure provisions, which are to be applied for all prior periods presented in the consolidated financial statements. The presentation and disclosure provisions resulted in the reclassification of non-controlling interests to the Equity section of the Balance Sheet totaling $484 million as at December 31, 2009 (December 31, 2008: $182 million).
Employers’ Disclosures about Post Retirement Benefit Plan Assets
In December 2008, the FASB issued guidance on employers’ disclosures about their post retirement benefit plan assets. The objectives of the disclosures about plan assets in an employer’s defined benefit pension or other post retirement plan are to provide users of financial statements with an understanding of: (i) how investment allocation decisions are made, including the factors that are pertinent to an understanding of investment policies and strategies; (ii) the major categories of plan assets; (iii) the inputs and valuation techniques used to measure the fair value of plan assets; (iv) the effect of fair value measurements using significant unobservable inputs (Level 3) on changes in plan assets for the period; and (v) significant concentrations of risk within plan assets. We adopted the increased disclosure requirements beginning in fourth quarter 2009. Refer to note 29 for related disclosures.
Future Accounting Policy Changes
This section includes a discussion of future accounting changes that may have a significant impact on our consolidated financial statements.
Amendments to Accounting for VIEs
In second quarter 2009, the FASB issued an amendment to its guidance on VIEs. Although not effective until first quarter 2010, this new guidance makes significant changes to the model for determining who should consolidate a VIE and how often this assessment should be performed. We are assessing the impact of these changes on our consolidated financial statements.
Critical Accounting Estimates and Judgments
Certain accounting estimates have been identified as being “critical” to the presentation of our financial condition and results of operations because they require us to make subjective and/or complex judgments about matters that are inherently uncertain; or there is a reasonable likelihood that materially different amounts could be reported under different conditions or using different assumptions and estimates.
Reserve Estimates Used to Measure Amortization of Property, Plant and Equipment
We record amortization expense based on the estimated useful economic lives of long-lived assets. Changes in reserve estimates are generally calculated at the end of each year and cause amortization expense to increase or decrease prospectively. The estimate that most significantly affects the measurement of amortization is quantities of proven and probable gold and copper reserves, because we amortize a large portion of property, plant and equipment using the units-of-production method. The estimation of quantities of gold and copper reserves, in accordance with the principles in Industry Guide No. 7, issued by the US Securities and Exchange Commission (“SEC”) is complex, requiring significant subjective assumptions that arise from the evaluation of geological, geophysical, engineering and economic data for a given ore body. This data could change over time as a result of numerous factors, including new information gained from development activities, evolving production history and a reassessment of the viability of production under different economic conditions. Changes in data and/or assumptions could cause reserve estimates to substantially change from period to period. Actual gold and copper production could differ from expected gold and copper production based on reserves, and an adverse change in gold or copper prices could make a reserve uneconomic to mine. Variations could also occur in actual ore grades and gold, silver and copper recovery rates from estimates.
A key trend that could reasonably impact reserve estimates is rising market mineral prices, because the mineral price assumption used in preparing reserve estimates is calculated based on the trailing three-year average market price. As this assumption rises, it could result in an upward revision to reserve estimates as material not previously classified as a reserve becomes economic at higher gold prices. Following the recent trend in market gold prices over the last three years, the mineral price assumption used to measure reserves has also been rising. The gold price
76
assumption was $825(16) per ounce in 2009 (2008: $725 per ounce; 2007: $575 per ounce). The copper price assumption was $2.00 per pound in 2009 (2008: $2.00 per pound; 2007: $2.00 per pound).
The impact of a change in reserve estimates is generally more significant for mines near the end of the mine life because the overall impact on amortization is spread over a shorter time period. Also, amortization expense is more significantly impacted by changes in reserve estimates at underground mines than open-pit mines due to the following factors:
(i) | Underground development costs incurred to access ore at underground mines are significant and amortized using the units-of-production method; and |
| |
(ii) | Reserves at underground mines are often more sensitive to mineral price assumptions and changes in production costs. Production costs at underground mines are impacted by factors such as dilution, which can significantly impact mining and processing costs per ounce. |
Impact of Historic Changes in Reserve Estimates on Amortization for the years ended December 31
| | 2009 | | 2008 | |
($ millions, except reserves in millions of contained oz/pounds) | | Reserves
increase
(decrease)(1) | | Amortization
increase
(decrease) | | Reserves
increase
(decrease)(1) | | Amortization
increase
(decrease) | |
Gold | | | | | | | | | |
North America(2) | | 9.6 | | $ | (32 | ) | 3.1 | | $ | (9 | ) |
Australia Pacific | | 0.3 | | (11 | ) | 3.6 | | (39 | ) |
Africa | | (0.5 | ) | (2 | ) | 1.5 | | (10 | ) |
South America(3) | | 13.5 | | (9 | ) | 0.5 | | (5 | ) |
Total Gold | | 22.9 | | $ | (54 | ) | 8.7 | | $ | (63 | ) |
Copper | | | | | | | | | |
Australia Pacific(4) | | (153 | ) | $ | (3 | ) | (51 | ) | $ | 10 | |
South America(3) | | 1,023 | | (13 | ) | 750 | | (4 | ) |
Total Copper | | 870 | | $ | (16 | ) | 699 | | $ | 6 | |
(1) | Each year we update our reserve estimates as at the end of the year as part of our normal business cycle. We then use those updated reserve estimates to calculate amortization expense in the following fiscal year on assets which use the units-of-production method of amortization. Reserve changes presented were calculated as at the end of 2008 and 2007 and are in millions of contained ounces/pounds. |
(2) | The increase in reserves attributable to North America is primarily due to the acquisitions of the additional 40% interest of Cortez reflected in third quarter 2008 and the additional 50% of Hemlo reflected in third quarter 2009. The impact of this reserve increase on amortization is partially offset by the increase in property, plant and equipment at Cortez and Hemlo as a result of the purchase price allocation. |
(3) | The increase in gold and copper reserves in South America is primarily due to the inclusion of Cerro Casale in reserves at the end of 2008. Cerro Casale is a development project and therefore this increase does not impact current amortization expense. |
(4) | Amortization expense in 2009 reflects the impairment charges at Osborne in fourth quarter 2008 which reduced property, plant and equipment to salvage values. Consequently, the decrease in reserves had an insignificant impact on amortization expense recorded in 2009. |
Long-Lived Asset and Goodwill Impairment Evaluations
Producing Mines and Development Projects
On an annual basis, as at October 1, and at any other time if events or changes in circumstances indicate that the fair value of a reporting unit has been reduced below its carrying amount, we evaluate the carrying amount of goodwill for potential impairment by comparing its fair value to its carrying amount. We also evaluate the long-lived assets of a reporting unit for potential impairment when events or changes in circumstances indicate that its fair value has been reduced below its carrying amount by comparing that reporting unit’s undiscounted cash flows to its carrying amount (referred to as a “screen test”.) When a potential long-lived asset impairment is identified as a result of the screen test, the amount of impairment is calculated by comparing its fair value to its carrying amount.
There is no active market for our reporting units. Consequently, when assessing a reporting unit for impairment, we use an income approach (being the net present value of expected future cash flows from our LOM plans, or net asset value (“NAV”) of the relevant reporting unit) to determine the fair value we could receive for the reporting unit in an arm’s length transaction at the measurement date. For our gold
(16) Reserves at Cerro Casale and Round Mountain have been calculated using an assumed price of $800 per ounce.
77
reporting units, we apply a market multiple to the NAV in order to assess their estimated fair value. Gold companies typically trade at a market capitalization that is based on a multiple of their underlying NAV. Consequently, a market participant would generally apply a NAV multiple when estimating the fair value of an operating gold mine.
Included in these forecasts is the production of mineral resources that do not currently qualify for inclusion in proven and probable ore reserves where there is a high degree of confidence in its economic extraction. This is consistent with the methodology we use to measure value beyond proven and probable reserves when allocating the purchase price of a business combination to acquired mining assets. Other significant estimates employed in our assessment of fair value include, short-term and long-term metal prices, foreign exchange rates, the price of oil, weighted average cost of capital used in discounting and the NAV multiple. For further information on these estimates refer to note 17 of our consolidated financial statements.
In fourth quarter 2009, we finalized our long-term life of mine (“LOM”) plans. Based on a review of those plans, we identified Darlot, Kanowna and Plutonic gold mines in Australia as being potentially impaired as a result of the screen test. Consequently, we compared the estimated fair value of each reporting unit to its carrying amount and recorded an impairment charge of $43 million at Plutonic, primarily as a result of a significant reduction in its proven and probable reserves and its remaining mine life. No impairments were recorded at Darlot or Kanowna (2008: Marigold $12 million and Osborne $57 million, included in discontinued operations).
In fourth quarter 2009, we also conducted our annual goodwill impairment test on all of our reporting units to which goodwill has been assigned, by comparing their estimated fair value to their carrying amounts. As a result, we recorded a goodwill impairment charge of $63 million at our Plutonic gold mine in Australia (2008: Kanowna $272 million; North Mara $216 million; Osborne $64 million, included in discontinued operations; Henty $30 million, included in discontinued operations; Marigold $8 million; and Barrick Energy $88 million).
Exploration Properties
After acquisition, various factors can affect the recoverability of the capitalized cost of land and mineral rights, particularly the results of exploration drilling. The length of time between the acquisition of land and mineral rights and when we undertake exploration work varies based on the prioritization of our exploration projects and the size of our exploration budget. If we determine that a potential impairment condition may exist, we compare the sum of the undiscounted cash flows expected to be generated from the project to its carrying amount. If the sum of undiscounted cash flows is less than the carrying amount, an impairment charge is recognized if the carrying amount of the individual long-lived assets within the group exceeds their fair value. For projects that do not have reliable cash flow projections, a market approach is applied.
In 2008, we completed a bankable feasibility study (“BFS”) for our Sedibelo platinum project in South Africa meeting the conditions for a 10% interest in the property. We also held the right to increase our interest to 65% in return for a decision to develop Sedibelo and payment of approximately $106 million in fourth quarter 2009. In third quarter 2009, after conducting a thorough review of development alternatives to maximize the project’s potential, we decided not to increase our ownership interest in Sedibelo. As a result of this decision, we recorded an impairment charge of $158 million in third quarter 2009, reducing the carrying amount of our investment in the project and related assets to their estimated fair values. Further, as a result of Barrick’s decision to not develop the Sedibelo project, our partner’s right to purchase our 10% interest by reimbursing us for direct and proven costs of prospecting activities and compiling the BFS, was triggered. This 90 day right expires at the end of February 2010.
Intangible Assets
Intangible assets having indefinite lives and intangible assets that are not yet ready for use are not amortized and are reviewed annually for impairment. We also review and test the carrying amounts of all intangible assets when events or changes in circumstances suggest that their carrying amount may not be recoverable.
78
In third quarter, after making a decision not to continue developing the Sedibelo project, we recorded an impairment charge of $34 million for water rights (2008: Nil). No other indications of impairment were noted in 2009.
Production Stage
We assess each mine construction project to determine when a mine moves into production stage. The criteria used to assess the start date are determined based on the unique nature of each mine construction project, such as the complexity of a plant or its location. We consider various relevant criteria to assess when the mine is substantially complete and ready for its intended use and moved into production stage. Some of the criteria considered would include, but are not limited to, the following: (1) the level of capital expenditures compared to construction cost estimates; (2) completion of a reasonable period of testing of mine plant and equipment; (3) ability to produce minerals in saleable form (within specifications); and (4) ability to sustain ongoing production of minerals.
When a mine construction project moves into the production stage, the capitalization of certain mine construction costs ceases and costs are either capitalized to inventory or expensed, except for capitalizable costs related to property, plant and equipment additions or improvements, underground mine development or reserve development.
Pre-production stripping costs are capitalized until an “other than de minimis” level of mineral is produced, after which time such costs are either capitalized to inventory or expensed. We consider various relevant criteria to assess when an “other than de minimis” level of mineral is produced. Some of the criteria considered would include, but are not limited to, the following: (1) the amount of ounces mined versus total ounces in reserves; (2) the amount of ore tons mined vs. total LOM expected ore tons mined; (3) the current stripping ratio versus the LOM strip ratio; and (4) the ore grade versus the LOM grade.
Fair Value of Asset Retirement Obligations (“AROs”)
AROs arise from the acquisition, development, construction and normal operation of mining property, plant and equipment, due to government controls and regulations that protect the environment and public safety on the closure and reclamation of mining properties. We record the fair value of an ARO in our consolidated financial statements when it is incurred and capitalize this amount as an increase in the carrying amount of the related asset. At operating mines, the increase in an ARO is recorded as an adjustment to the corresponding asset carrying amount and results in a prospective increase in amortization expense. At closed mines, any adjustment to an ARO is charged directly to earnings.
The fair values of AROs are measured by discounting the expected cash flows using a discount factor that reflects the credit-adjusted risk-free rate of interest. We prepare estimates of the timing and amounts of expected cash flows when an ARO is incurred, which are updated to reflect changes in facts and circumstances, or if we are required to submit updated mine closure plans to regulatory authorities. In the future, changes in regulations or laws or enforcement could adversely affect our operations; and any instances of non-compliance with laws or regulations that result in fines or injunctions or delays in projects, or any unforeseen environmental contamination at, or related to, our mining properties, could result in us suffering significant costs. We mitigate these risks through environmental and health and safety programs under which we monitor compliance with laws and regulations and take steps to reduce the risk of environmental contamination occurring. We maintain insurance for some environmental risks; however, for some risks, coverage cannot be purchased at a reasonable cost. Our coverage may not provide full recovery for all possible causes of loss. The principal factors that can cause expected cash flows to change are: the construction of new processing facilities; changes in the quantities of material in reserves and a corresponding change in the life of mine plan; changing ore characteristics that ultimately impact the environment; changes in water quality that impact the extent of water treatment required; and changes in laws and regulations governing the protection of the environment. In general, as the end of the mine life nears, the reliability of expected cash flows increases, but earlier in the mine life, the estimation of an ARO is inherently more subjective. Significant judgments and estimates are made when estimating the fair value of AROs. Expected cash flows relating to AROs could occur over periods up to 40 years and the assessment of the
79
extent of environmental remediation work is highly subjective. Considering all of these factors that go into the determination of an ARO, the fair value of AROs can materially change over time.
At our operating mines, we continue to record AROs based on disturbance of the environment over time. It is reasonably possible that circumstances could arise during or by the end of the mine life that will require material revisions to AROs. In particular, the extent of water treatment can have a material effect on the fair value of AROs, and the expected water quality at the end of the mine life, which is the primary driver of the extent of water treatment, can change significantly. We periodically prepare updated studies for our mines, following which it may be necessary to adjust the fair value of AROs. The period of time over which we have assumed that water quality monitoring and treatment will be required has a significant impact on AROs at closed mines. The amount of AROs recorded reflects the expected cost, taking into account the probability of particular scenarios. The difference between the upper end of the range of these assumptions and the lower end of the range can be significant, and consequently changes in these assumptions could have a material effect on the fair value of AROs and future earnings in a period of change.
At one closed mine, the principal uncertainty that could impact the fair value of the ARO is the manner in which a tailings facility will need to be remediated. In measuring the ARO, we have concluded that there are two possible methods that could be used. We have recorded the ARO using the more costly method until such time that the less costly method can be proven as technically feasible and approved.
AROs
($ millions) | | | | | |
As at December 31 | | 2009 | | 2008 | |
Operating mines | | $ | 958 | | $ | 832 | |
Closed mines | | 208 | | 201 | |
Development projects | | 40 | | 17 | |
Other | | 24 | | 16 | |
Total | | $ | 1,230 | | $ | 1,066 | |
Deferred Tax Assets and Liabilities
Measurement of Temporary Differences
We are periodically required to estimate the tax basis of assets and liabilities. Where applicable tax laws and regulations are either unclear or subject to varying interpretations, it is possible that changes in these estimates could occur that materially affect the amounts of deferred income tax assets and liabilities recorded in our consolidated financial statements. Changes in deferred tax assets and liabilities generally have a direct impact on earnings in the period of changes.
Valuation Allowances
Each period, we evaluate the likelihood of whether some portion or all of each deferred tax asset will not be realized. This evaluation is based on historic and future expected levels of taxable income, the pattern and timing of reversals of taxable temporary timing differences that give rise to deferred tax liabilities, and tax planning activities. Levels of future taxable income are affected by, among other things, market gold prices, and production costs, quantities of proven and probable gold and copper reserves, interest rates and foreign currency exchange rates. If we determine that it is more likely than not (a likelihood of more than 50%) that all or some portion of a deferred tax asset will not be realized, we record a valuation allowance against the amount we do not expect to realize. Changes in valuation allowances are recorded as a component of income tax expense or recovery for each period. The most significant recent trend impacting expected levels of future taxable income and the amount of valuation allowances, has been rising market gold prices. A continuation of a trend of higher gold prices could lead to the release of some of the valuation allowances recorded, with a corresponding effect on earnings in the period of release. Conversely, a decline in market gold prices could lead to an increase in valuation allowances and a corresponding increase in income tax expense.
In 2008, we released $175 million of valuation allowances primarily because sources of income became available that enabled tax losses and US Alternative Minimum Tax (“AMT”) credits to be realized.
Valuation Allowances
($ millions) | | | | | |
As at December 31 | | 2009 | | 2008 | |
United States | | $ | 136 | | $ | 123 | |
Argentina | | 119 | | 61 | |
Canada | | 45 | | 50 | |
Tanzania | | 30 | | 30 | |
Chile | | 22 | | 23 | |
Barbados | | 69 | | 10 | |
Other | | 60 | | 21 | |
Total | | $ | 481 | | $ | 318 | |
80
United States: most of the valuation allowances relate to AMT credits, which have an unlimited carry-forward period. Increasing levels of future taxable income due to higher gold selling prices and other factors and circumstances may result in our becoming a regular taxpayer under the US regime, which may cause us to release some, or all, of the valuation allowance on the AMT credits.
Chile, Argentina, Tanzania and Other: the valuation allowances relate to the full amount of tax assets in subsidiaries that do not have any present sources of gold production or taxable income. In the event that these subsidiaries have sources of taxable income in the future, we may release some or all of the valuation allowances.
Canada: most of the valuation allowances relate to capital losses that can only be utilized if any capital gains are realized.
Internal Control over Financial Reporting and Disclosure Controls and Procedures
Management is responsible for establishing and maintaining adequate internal control over financial reporting and other financial disclosure. Internal control over financial reporting is a process designed to provide reasonable assurance regarding the reliability of financial reporting and the preparation of consolidated financial statements for external purposes in accordance with US GAAP.
The Company’s internal control over financial reporting includes those policies and procedures that (i) pertain to the maintenance of records that, in reasonable detail, accurately and fairly reflect the transactions and dispositions of the assets of the Company; (ii) provide reasonable assurance that transactions are recorded as necessary to permit preparation of consolidated financial statements in accordance with US GAAP, and that receipts and expenditures of the Company are being made only in accordance with authorizations of management and directors of the Company; and (iii) provide reasonable assurance regarding prevention or timely detection of unauthorized acquisition, use or disposition of the Company’s assets that could have a material effect on the Company’s consolidated financial statements.
Internal control over other financial disclosure is a process designed to ensure that other financial information included in this MD&A and Barrick’s Annual Report, fairly present in all material respects the financial condition, results of operations and cash flows of the Company for the periods presented in this report. The Company’s disclosure controls and procedures are designed to ensure that material information relating to the Company, including its consolidated subsidiaries, is made known to Management by others within those entities, particularly during the period in which this report is being prepared.
Due to inherent limitations, internal control over financial reporting and disclosure may not prevent or detect all misstatements. Also, projections of any evaluation of effectiveness to future periods are subject to the risk that controls may become inadequate because of changes in conditions, or that the degree of compliance with the policies or procedures may change. Fourth quarter changes as a result of the organizational review described on page 33 included the simplification and clarification of roles and responsibilities related to internal control over financial reporting and disclosure. The Company has acted to largely maintain the organizational structure as regards year end reporting, thereby minimizing the impact to 2009. However, it is reasonable to conclude that these organizational changes will impact the internal control over financial reporting and disclosure frameworks in the upcoming year.
The management of Barrick, with the participation of our chief executive and financial officers, have evaluated the effectiveness of the design and operation of the internal controls over financial reporting and disclosure controls and procedures as of the end of the period covered by this report and have concluded that they were effective at a reasonable assurance level.
Barrick’s annual management report on internal control over financial reporting and the integrated audit report of Barrick’s auditors for the year ended December 31, 2009 will be included in Barrick’s 2009 Annual Report and its 2009 Form 40-F/Annual Information Form on file with the SEC and Canadian provincial securities regulatory authorities.
81
International Financial Reporting Standards (IFRS)
We have commenced the process to convert our basis of accounting from US GAAP to IFRS effective for our first quarter report in 2011. The transition date of January 1, 2010 will require the conversion, for comparative purposes, of our previously reported balance sheets as at December 31, 2009 and December 31, 2010 and our interim and annual consolidated statements of income and cash flows for 2010 from US GAAP to an IFRS basis.
The conversion to IFRS from US GAAP is a significant undertaking, and as a result, we established a dedicated IFRS conversion team in early 2009 to lead this process.
The implementation project consists of three primary phases: initial diagnostic phase; impact analysis, evaluation and solution development phase; and an implementation and review phase. We are now in the implementation and review phase, having completed the impact analysis, evaluation and solution development phase in the fourth quarter of 2009.
The following chart provides a summary of the key activities contained in our conversion plan, the estimated completion date for each of these activities as well as a current status update.
Key Activities | | Timing | | Current Status |
Financial Statement Preparation · Analyze and select ongoing policies where alternatives are permitted including IFRS 1 exemptions · Quantify key differences between IFRS and the Company’s application of US GAAP · Revise Accounting Policy Manual · Prepare IFRS consolidated financial statements including first-time adoption reconciliations | | · Quantification of impact of key differences on opening balance sheet by Q2 2010 · Revised Accounting Policy Manual in place by January 1, 2011 · Skeleton IFRS consolidated financial statements to be prepared for senior management approval in Q3 2010 · Audit Committee review of the skeleton consolidated financial statements in Q4 2010 | | · Finalization of key accounting differences completed in Q4 2009 · Senior management approval and audit committee review of accounting/policy changes and IFRS 1 elections obtained in Q4 2009 · Development of Accounting Policy Manual is in progress · Development of draft consolidated financial statements and first-time adoption reconciliations in progress |
Training · Provide technical training to key finance and accounting personnel in each of our RBUs · Provide specialized training to selected employees involved with the conversion to IFRS | | · Ongoing training to key personnel as needed | | · Technical training provided to key personnel in each of our RBUs in Q4 2009 · Specific training provided to selected groups involved with the IFRS conversion in Q4 2009 · Further training is planned for 2010 |
Business Activities · Identify conversion impacts on financial covenants, executive compensation and contracts · Assess impact on budgeting and long-range plans · Identify impact on taxation | | · Financial covenant, executive compensation and contract analysis to be completed by Q3 2010 · Budgeting and long-range planning impact to be completed by Q4 2010 · Taxation analysis to be completed by Q2 2010 | | · Analysis is underway · Identification of taxation impacts is in progress |
Financial information systems · Identify changes required to financial information systems and implement solutions · Determine and implement solution for capturing financial information under US GAAP and IFRS in 2010 (for comparative information) | | · Necessary changes to financial information systems implemented by transition date · Solution for capturing financial information under US GAAP and IFRS in Q1 2010 | | · Necessary changes to financial information systems is in progress · IFRS reporting application has been implemented to enable the capturing of financial information under both US GAAP and IFRS |
Control environment · Maintain effective Disclosure Controls & Procedures (DC&P) and Internal Controls over Financial Reporting (ICFR) throughout the IFRS project · Design and implement new IFRS control environment | | · Incremental controls to be developed by Q2 2010 for the review of IFRS comparative financial information · Redesigned business process standards and controls to be in place by Q1 2011 | | · Completed impact assessment of IFRS technical accounting differences on financial reporting risks, procedures, systems and controls · Business processes are being assessed and redesigned (as needed) as the project progresses |
82
Set out below are the key areas where changes in accounting policies are expected that could have a significant impact on our consolidated financial statements. The list and components below should not be regarded as a complete list of changes that will result from the transition to IFRS. It is intended to highlight those areas we believe to be most significant. In addition, the differences described below are based on US GAAP and IFRS standards as they exist today. At this stage, we have not completed quantifying the impact of these differences on our consolidated financial statements.
Production phase stripping costs
Under US GAAP, the removal of overburden and other waste materials to access ore from which minerals can be extracted during the production phase at a mine, referred to as production phase stripping costs, are treated as variable production costs and are included in the costs of the inventory produced during the period in which the stripping costs are incurred. Under IFRS, there is currently no specific guidance on the accounting treatment of production phase stripping costs and, as a result, industry practice varies.
We have selected an accounting policy for production phase stripping costs whereby stripping costs that generate a future economic benefit will be capitalized as a mine development cost and amortized on a units of production basis over the attributable reserves that benefit from the stripping activity. This policy is consistent with the IFRS conceptual framework and the asset recognition criteria in IAS 16, Property, Plant and Equipment. The impact of this change in accounting policy will be a decrease in direct operating costs and an increase in amortization expense on the consolidated statement of income as well as a decrease in our total cash costs and net cash costs per ounce non-GAAP performance measures; an increase in operating cash flow and investing cash outflow on the consolidated statement of cash flow; and a decrease in inventory and an increase in property, plant and equipment on the consolidated balance sheet.
Definition of proven and probable (“2P”) reserves
Development costs incurred at a mineral property prior to establishment of 2P reserves are accounted for as current period operating expenses under US GAAP. We use SEC Industry Guide 7 (“Guide 7”) to determine when we have established 2P reserves. Development costs incurred after the establishment of 2P reserves are accounted for as capital expenditures. Under IFRS, we will use 2P reserves as defined by the Canadian Securities Administrators National Instrument 43-101 (“NI 43-101”) as the basis for our accounting. Generally, reserves are established under NI 43-101 at an earlier date than reserves under Guide 7, primarily due to the fact that Guide 7 requires a final feasibility study to be completed whereas NI 43-101 only requires a pre-feasibility level of study to be completed before mineralized material can be classified as a 2P reserve. Consequently, the impact of using NI 43-101 as the basis of our reserves for accounting purposes will be a decrease in operating costs and an increase in amortization expense on the consolidated statement of income; an increase in operating cash flow and investing cash outflow on the consolidated statement of cash flows; and an increase in property, plant and equipment on the consolidated balance sheet.
Impairment of non-current assets
Under US GAAP, long-lived asset impairment testing is done using a two-step approach whereby long-lived assets are first tested for recoverability based on the undiscounted cash flows they are expected to generate. If the undiscounted cash flow expected to be generated is higher than the carrying amount, then no impairment charge is required to be recorded. If the undiscounted cash flow is lower than the carrying amount of the assets, the assets are written down to their estimated fair value. Under IFRS, impairment testing is done using a one-step approach for both testing and measurement of impairment, with asset carrying amounts compared directly with the higher of fair value less costs to sell and value in use (which uses discounted cash flows). This may result in more frequent write-downs where carrying amounts of assets were previously supported under US GAAP on an undiscounted cash flow basis, but could not be supported on a discounted basis. However, the extent of any asset write-downs may be partially offset by the requirement under IFRS to reverse any previous impairment losses where circumstances have changed such that the impairments have reduced. US GAAP prohibits reversal of impairment losses.
Under US GAAP, we test goodwill for impairment at the individual mineral property level. Under IFRS, individual mineral properties can be aggregated for goodwill impairment testing purposes up to an
83
operating segment level, provided that each of the mineral properties are expected to benefit from the synergies of the business combinations from which the goodwill arose and management does not internally manage goodwill at a lower level. Consequently, under IFRS we will test for goodwill impairment at the operating segment level. The impact of this change in accounting will be a reduction in the frequency and amounts of any future goodwill impairment charges.
Asset Retirement Obligations
Under US GAAP, we would only record an asset retirement obligation (“ARO”) if there is a legal requirement to incur restoration costs. Under IFRS, the threshold for recognizing a liability is a legal or constructive obligation. Consequently, based on our established pattern for carrying out restoration activities and/or based on our internal environmental policies, we have identified a number of sites where we have a constructive obligation and, as a result, have to record an ARO upon adoption of IFRS. In addition, under US GAAP, we are required to use a credit-adjusted risk-free interest rate to present value an ARO. Under IFRS, we will utilize a US dollar risk-free interest rate in order to present value an ARO. At this stage, we have not determined the net impact of these changes on our consolidated statement of income or our consolidated balance sheet. There will be no impact on our consolidated statement of cash flow.
First-time adoption of IFRS
Most adjustments required on transition to IFRS will be made retrospectively as of the date of the first comparative balance sheet presented, which is January 1, 2010. IFRS 1 provides entities adopting IFRS for the first time with a number of optional exemptions and mandatory exceptions, in certain areas, to the general requirement for full retrospective application of IFRS. The purpose of the election is to provide relief to companies and simplify the conversion process by not requiring them to recreate information that may not exist or may not have been collected at the inception of the transaction. We have analyzed the various exemptions available and are working towards implementing those most appropriate in our circumstances. Our IFRS 1 exemption decisions have been approved by senior management and reviewed by the Audit Committee of the Board of Directors in Q4 2009. The most significant IFRS 1 exemptions which we expect to apply in preparation of our first consolidated financial statements under IFRS are summarized in the following table:
Areas of key differences | | Summary of Exemptions Available and Decisions |
Asset Retirement Obligations | | Under IFRS, when an ARO is established, we are required to set up a corresponding asset and depreciate it over the remaining useful life of the asset. Any changes in the ARO are added or deducted from the cost of the asset to which the obligation relates. Under IFRS 1, we have the option to take a simplified approach to calculate and record the asset related to the ARO on our opening IFRS balance sheet. We intend to take this election as it will simplify the conversion process. |
Property, Plant and Equipment | | We have the option to record property, plant and equipment at their fair value on transition to IFRS. This fair value becomes the deemed cost of the asset. The election can be taken on an asset-by-asset basis. We are currently analyzing the potential for utilizing this election on certain assets. |
Business Combinations | | Under IFRS, we have the option to either retroactively apply IFRS 3R Business Combinations to all business combinations or may elect to apply the standard prospectively only to those acquisitions which meet the expanded definition of a business combination after the date of transition. |
Cumulative Translation Account (“CTA”) | | We have the option to reclassify all cumulative translation gains or losses in accumulated other comprehensive income to retained earnings on transition. We intend to take the election as it will simplify the conversion process (cumulative translation differences will not have to be recalculated). |
IFRS accounting standards, and the interpretation thereof, are constantly evolving. As a result, we expect that there may be additional new or revised IFRSs in relation to joint ventures, provisions, financial instruments, fair value and consolidation prior to the issuance of our first IFRS statements. Our conversion team monitors and evaluates IFRS accounting developments and updates our conversion plan as necessary. The future impacts of IFRS will also depend on the particular circumstances prevailing in those years. As noted above, the differences described above are those existing based on US GAAP and IFRS today.
84
Non-GAAP Financial Performance Measures(17)
Adjusted Net Income (Adjusted Net Income per Share)
Adjusted net income is a non-GAAP financial measure which excludes the following from net income:
· Elimination of gold sales contracts
· Effect of tax rate changes
· Impairment charges related to goodwill, property, plant and equipment, and investments;
· Gains/losses on acquisitions/dispositions;
· Foreign currency translation gains/losses;
· Non-recurring restructuring costs; and
· Unrealized gains/losses on non-hedge derivative instruments
Management uses this measure internally to evaluate the underlying operating performance of the Company as a whole for the reporting periods presented, and to assist with the planning and forecasting of future operating results. We believe that adjusted net income allows investors and analysts to better evaluate the results of the underlying business of the Company. While the adjustments to net income in this measure include items that are recurring, management believes that adjusted net income is a useful measure of the Company’s performance because impairment charges and gains/losses on asset acquisitions/dispositions do not reflect the underlying operating performance of our core mining business and are not necessarily indicative of future operating results. Further, foreign currency translation gains/losses and unrealized gains/losses from non-hedge derivative contracts are not necessarily reflective of the underlying operating results for the reporting periods presented.
As noted, the Company uses this measure for its own internal purposes. Management’s internal budgets and forecasts and public guidance do not reflect potential impairment charges, potential gains/losses on the acquisition/disposition of assets, foreign currency translation gains/losses, or unrealized gains/losses on non-hedge derivative contracts. Consequently, the presentation of adjusted net income enables investors and analysts to better understand the underlying operating performance of our core mining business through the eyes of Management. Management periodically evaluates the components of adjusted net income based on an internal assessment of performance measures that are useful for evaluating the operating performance of our business segments and a review of the non-GAAP measures used by mining industry analysts and other mining companies.
In 2009, we updated the items included in our reconciliation of net income to adjusted net income for items that are not reflective of the ongoing operational results. These adjustments will result in a more meaningful adjusted net income for investors and analysts to assess our current operating performance and to predict future operating results:
· Added “Effect of tax rate changes” to exclude the effect of corporate income tax rate changes beyond the control of management.
· Added “Elimination of gold sales contracts” to exclude any gains/losses related to the elimination of the contracts. Included in this line is the loss incurred upon initial recognition of the liability and any gains/losses due to mark-to-market adjustments through the date contracts were settled.
· Added “Non-recurring restructuring costs” to exclude the non-recurring charges related to our Organization Review. Restructuring costs related to our mine closures are not included in this adjustment.
· Adjusted “Gains/losses on the disposition of long-lived assets” to “Gains/losses on acquisitions/ dispositions” to include bargain purchase gains and gains on step acquisitions.
Adjusted net income is intended to provide additional information only and does not have any standardized meaning prescribed by US GAAP and should not be considered in isolation or as a substitute for measures of performance prepared in accordance with US GAAP. The measure is not necessarily indicative of operating profit or cash flow from operations as determined under US GAAP. Other companies may calculate this measure differently. The following table reconciles this non-GAAP measure to the most directly comparable US GAAP measure.
(17) The amounts presented in the non-GAAP financial performance measure tables include the results of discontinued operations.
85
Reconciliation of Net Income to Adjusted Net Income
| | For the years ended December 31 | | For the three months
ended December 31 | |
($ millions, except per share amounts in dollars) | | 2009 | | 2008 | | 2007 | | 2009 | | 2008 | |
Net income | | $ | (4,274 | ) | $ | 785 | | $ | 1,119 | | $ | 215 | | $ | (468 | ) |
Elimination of gold sales contracts | | 5,901 | | — | | — | | 241 | | — | |
Effect of tax rate changes | | 59 | | — | | — | | 59 | | — | |
Impairment charges related to goodwill, property, plant and equipment, and investments | | 259 | | 899 | | 59 | | 102 | | 773 | |
Gains on acquisitions/dispositions(1) | | (85 | ) | (178 | ) | (59 | ) | (1 | ) | (123 | ) |
Foreign currency translation (gains)/losses(2) | | (95 | ) | 135 | | (73 | ) | (22 | ) | 84 | |
Unrealized (gains)/losses on non-hedge derivative instruments | | 30 | | 20 | | (10 | ) | 4 | | 11 | |
Restructuring costs | | 15 | | — | | — | | 6 | | — | |
Adjusted net income | | $ | 1,810 | | $ | 1,661 | | $ | 1,036 | | $ | 604 | | $ | 277 | |
Net income per share(3) | | (4.73 | ) | 0.90 | | 1.29 | | 0.22 | | (0.54 | ) |
Adjusted net income per share(3) | | $ | 2.00 | | $ | 1.90 | | $ | 1.19 | | $ | 0.61 | | $ | 0.32 | |
(1) | Includes gains recorded on the Hemlo acquisition of $72 million. Refer to page 40 of this MD&A for further information. |
(2) | Includes a currency translation gain of $70 million recorded in first quarter 2009 relating to Canadian deferred tax assets due to an election to adopt a US dollar functional currency for Canadian tax purposes. |
(3) | Calculated using adjusted net income and weighted average number of shares outstanding under the basic method of earnings per share. |
Adjusted Operating Cash Flow
Adjusted operating cash flow is a non-GAAP financial measure which excludes the effect of “Elimination of gold sales contracts.”
Management uses this measure internally to evaluate the underlying operating cash flow performance of the Company as a whole for the reporting periods presented, and to assist with the planning and forecasting of future operating cash flow. This settlement activity is not reflective of the underlying capacity of our operations to generate operating cash flow and therefore this adjustment will result in a more meaningful operating cash flow measure for investors and analysts to evaluate our performance in the period and assess our future operating cash flow generating capability.
Adjusted operating cash flow is intended to provide additional information only and does not have any standardized meaning prescribed by US GAAP and should not be considered in isolation or as a substitute for measures of performance prepared in accordance with US GAAP. The measure is not necessarily indicative of operating profit or cash flow from operations as determined under US GAAP. Other companies may calculate this measure differently. The following table reconciles this non-GAAP measure to the most directly comparable US GAAP measure.
Reconciliation of Operating Cash Flow to Adjusted Operating Cash Flow
| | For the years ended December 31 | | For the three months
ended December 31 | |
($ millions) | | 2009 | | 2008 | | 2007 | | 2009 | | 2008 | |
Operating cash flow | | $ | (2,322 | ) | $ | 2,254 | | $ | 1,768 | | $ | (4,300 | ) | $ | 439 | |
Elimination of gold sales contracts | | 5,221 | | — | | — | | 5,221 | | — | |
Adjusted operating cash flow | | $ | 2,899 | | $ | 2,254 | | $ | 1,768 | | $ | 921 | | $ | 439 | |
86
Total Cash Costs per Ounce and Net Cash Costs per Ounce
Total cash costs per ounce/pound and net cash costs per ounce are non-GAAP financial measures. Both measures include all costs absorbed into inventory, as well as royalties, by-product credits, and production taxes, and exclude inventory purchase accounting adjustments, unrealized gains/losses from non-hedge currency and commodity contracts, and amortization and accretion. These measures also include the gross margin generated by our Barrick Energy business unit, which was acquired to mitigate our exposure to oil prices as a credit against gold production costs. The presentation of these statistics in this manner allows us to monitor and manage those factors that impact production costs on a monthly basis. These measures are calculated by dividing the aggregate of the applicable costs by gold ounces or copper pounds sold. These measures are calculated on a consistent basis for the periods presented.
Under purchase accounting rules, we record the fair value of acquired work in progress and finished goods inventories as at the date of acquisition. As the acquired inventory is sold, any purchase accounting adjustments, reflected in the carrying amount of inventory at acquisition, impacts cost of sales. The method of valuing these inventories is based on estimated selling prices less costs to complete and a reasonable profit margin. Consequently, the fair values do not necessarily reflect costs to produce consistent with ore mined and processed into gold and copper after the acquisition. Hence, we have removed such costs from our cash costs measurements. Many mining companies record the unrealized gains/losses from non-hedge currency and commodity contracts in other income, and therefore these amounts are not reflected in the cost of sales measures presented by these companies. Consequently, we believe that removing these unrealized gains/losses provides investors and analysts with a measure of our costs of production that is more comparable to the measures presented by other mining companies. We have provided below reconciliations to illustrate the impact of excluding inventory purchase accounting adjustments and unrealized gains/losses from non-hedge currency and commodity contracts from our total cash costs and net cash costs measures.
We calculate total cash costs and net cash costs based on our equity interest in production from our mines. We believe that using an equity interest presentation is a fairer, more accurate way to measure economic performance than using a consolidated basis. For mines where we hold less than a 100% share in the production, we exclude the economic share of gold production that flows to our partners who hold a non-controlling interest. Consequently, for the Tulawaka mine, although we fully consolidated the results of operations from this mine in our consolidated financial statements, our production and total cash costs and net cash costs statistics only reflect our equity share of the production.
Starting in 2008, we provided a net cash costs measure which treats the gross margin from all non-gold sales, whether or not these non-gold metals are produced in conjunction with gold, as a credit against the cost of producing gold. In 2009, we have begun using this measure to evaluate the overall performance of our business on a consolidated basis. A number of other gold producers present their costs net of the contribution from non-gold sales. We believe that including a measure of net cash costs per ounce on this basis provides investors and analysts with information with which to compare our performance to other gold producers, and to better assess the overall performance of our business. In addition, this measure provides information to enable investors and analysts to understand the importance of non-gold revenues to our cost structure.
Cash costs per ounce/pound statistics are intended to provide additional information, do not have any standardized meaning prescribed by US GAAP and should not be considered in isolation or as a substitute for measures of performance prepared in accordance with US GAAP. The measures are not necessarily indicative of operating profit or cash flow from operations as determined under US GAAP. Other companies may calculate these measures differently.
87
Reconciliation of Cost of Sales to Total Cash Costs per Ounce/Pound
($ millions, except per ounce/pound information in dollars) | | Gold | | Copper | |
For the years ended December 31 | | 2009 | | 2008 | | 2007 | | 2009 | | 2008 | | 2007 | |
Cost of sales | | $ | 3,407 | | $ | 3,377 | | $ | 2,766 | | $ | 361 | | $ | 315 | | $ | 232 | |
Cost of sales applicable to discontinued operations | | 24 | | 49 | | 30 | | 83 | | 121 | | 107 | |
Cost of sales applicable to non-controlling interests(1) | | (12 | ) | (14 | ) | (15 | ) | — | | — | | — | |
Unrealized non-hedge gains/(losses) on currency and commodity contracts | | 7 | | (14 | ) | (5 | ) | — | | — | | — | |
Inventory purchase accounting adjustments | | — | | (16 | ) | — | | — | | — | | (9 | ) |
Impact of Barrick Energy | | (20 | ) | (14 | ) | — | | — | | — | | — | |
Total cash costs | | $ | 3,406 | | $ | 3,368 | | $ | 2,776 | | $ | 444 | | $ | 436 | | $ | 330 | |
Ounces/pounds sold — consolidated basis (000s ounces/millions pounds) | | 7,334 | | 7,658 | | 8,108 | | 380 | | 367 | | 401 | |
Ounces/pounds sold(1) — non-controlling interest (000s ounces) | | (28 | ) | (63 | ) | (53 | ) | — | | — | | — | |
Ounces/pounds sold — equity basis (000s ounces/millions pounds) | | 7,306 | | 7,595 | | 8,055 | | 380 | | 367 | | 401 | |
Total cash costs per ounce/per pound | | $ | 466 | | $ | 443 | | $ | 345 | | $ | 1.17 | | $ | 1.19 | | $ | 0.82 | |
(1) Relates to our partner’s 30% interest in Tulawaka.
Net Cash Costs per Ounce
| | For the years ended December 31 | | For the three months
ended December 31 | |
($ millions, except per ounce/pound data in dollars) | | 2009 | | 2008 | | 2007 | | 2009 | | 2008 | |
Ounces gold sold — equity basis (000s) | | 7,306 | | 7,595 | | 8,055 | | 1,823 | | 2,190 | |
Total cash costs per ounce — equity basis | | $ | 466 | | $ | 443 | | $ | 345 | | $ | 474 | | $ | 471 | |
Revenues from copper sales | | $ | 943 | | $ | 1,007 | | $ | 1,065 | | $ | 398 | | $ | 321 | |
Revenues from copper sales at discontinued operations | | 212 | | 221 | | 240 | | — | | — | |
Unrealized non-hedge gold/copper derivative (gains) losses | | 49 | | (23 | ) | (26 | ) | 13 | | (3 | ) |
Unrealized mark-to-market provisional price adjustments | | (4 | ) | 38 | | 10 | | (4 | ) | — | |
Net revenues from copper excluding unrealized non-hedge gains/losses from copper contracts | | 1,200 | | 1,243 | | 1,289 | | 407 | | 318 | |
Copper cost of sales per consolidated statement of income | | 361 | | 315 | | 232 | | 128 | | 122 | |
Copper cost of sales from discontinued operations | | 83 | | 121 | | 107 | | — | | — | |
Copper credits | | $ | 756 | | $ | 807 | | $ | 950 | | $ | 279 | | $ | 196 | |
Copper credits per ounce | | 103 | | 106 | | 117 | | 153 | | 89 | |
Net cash costs per ounce | | $ | 363 | | $ | 337 | | $ | 228 | | $ | 321 | | $ | 382 | |
EBITDA and Adjusted EBITDA
EBITDA is a non-GAAP financial measure, which excludes the following from net income:
· income tax expense;
· interest expense;
· interest income; and
· depreciation and amortization.
Management believes that EBITDA is a valuable indicator of the Company’s ability to generate liquidity by producing operating cash flow to: fund working capital needs, service debt obligations, and fund capital expenditures. Management uses EBITDA for this purpose. EBITDA is also frequently used by investors and analysts for valuation purposes whereby EBITDA is multiplied by a factor or “EBITDA multiple” that is based on observed or inferred relationship between EBITDA and market values to determine the approximate total enterprise value of a company.
EBITDA is intended to provide additional information to investors and analysts, does not have any standardized meaning prescribed by US GAAP and should not be considered in isolation or as a substitute for measures of performance prepared in accordance with US GAAP. EBITDA excludes the impact of cash costs of financing activities and taxes, and the effects
88
of changes in operating working capital balances, and therefore is not necessarily indicative of operating profit or cash flow from operations as determined under US GAAP. Other companies may calculate EBITDA differently.
Starting in this MD&A, we are introducing “Adjusted EBITDA” as a non-GAAP measure. We have adjusted our EBITDA to remove the effect of “Elimination of gold sales contracts.” This settlement activity is not reflective of the underlying capacity of our operations to generate earnings and therefore this adjustment will result in a more meaningful earnings measure for investors and analysts to evaluate our performance in the period and assess our future earnings generating capability.
The following table provides a reconciliation of net income to EBITDA and adjusted EBITDA.
Reconciliation of Net Income to EBITDA and Adjusted EBITDA
| | For the years ended December 31 | | For the three months
ended December 31 | |
($ millions, except per share amounts in dollars) | | 2009 | | 2008 | | 2007 | | 2009 | | 2008 | |
Net income | | $ | (4,274 | ) | $ | 785 | | $ | 1,119 | | $ | 215 | | $ | (468 | ) |
Income tax expense | | 689 | | 590 | | 341 | | 313 | | 164 | |
Interest expense | | 57 | | 21 | | 113 | | 29 | | — | |
Interest income | | (10 | ) | (39 | ) | (141 | ) | (3 | ) | (5 | ) |
Depreciation and amortization | | 1,024 | | 990 | | 1,004 | | 259 | | 264 | |
EBITDA | | $ | (2,514 | ) | $ | 2,347 | | $ | 2,436 | | $ | 813 | | $ | (45 | ) |
Elimination of gold sales contracts | | 5,933 | | — | | — | | 241 | | — | |
Adjusted EBITDA | | $ | 3,419 | | $ | 2,347 | | $ | 2,436 | | $ | 1,054 | | $ | (45 | ) |
Realized Prices
Realized price is a non-GAAP financial measure which excludes from sales:
· Unrealized gains and losses on non-hedge derivative contracts;
· Unrealized mark-to-market gains and losses on provisional pricing from copper and gold sales contracts; and
· Export duties
This measure is intended to enable management to better understand the price realized in each reporting period for gold and copper sales because unrealized mark-to-market value of non-hedge gold and copper derivatives and unrealized mark-to-market gains and losses on outstanding receivables from copper and gold sales contracts are subject to change each period due to changes in market factors such as spot and forward gold and copper prices such that prices ultimately realized may differ from those recorded. The exclusion of such unrealized mark-to-market gains and losses from the presentation of this performance measure enables investors to understand performance based on the realized proceeds of selling gold and copper production. The gains and losses on non-hedge derivatives and receivable balances relate to instruments/balances that mature in future periods, at which time the gains and losses will become realized. The amounts of these gains and losses reflect fair values based on market valuation assumptions at the end of each period and do not necessarily represent the amounts that will become realized on maturity. For those reasons, management believes that this measure provides a more accurate reflection of the Company’s past performance and is a better indicator of its expected performance in future periods.
Starting with second quarter 2009, we have begun to adjust our realized price calculation for export duties that are paid upon sale and are currently netted against revenues. We believe this provides investors and analysts with a more accurate measure with which to compare to market gold prices and to assess our gold sales performance.
The realized price measure is intended to provide additional information, and does not have any standardized meaning prescribed by US GAAP and should not be considered in isolation or as a substitute for measures of performance prepared in accordance with
89
US GAAP. The measure is not necessarily indicative of sales as determined under US GAAP. Other companies may calculate this measure differently. The following table reconciles realized prices to the most directly comparable US GAAP measure.
Reconciliation of Sales to Realized Price per Ounce/per Pound
($ millions, except per ounce/pound data in dollars) | | Gold | | Copper | |
For the years ended December 31 | | 2009 | | 2008 | | 2007 | | 2009 | | 2008 | | 2007 | |
Sales | | $ | 7,135 | | $ | 6,577 | | $ | 4,949 | | $ | 943 | | $ | 1,007 | | $ | 1,065 | |
Sales applicable to discontinued operations | | 56 | | 79 | | 78 | | 212 | | 221 | | 240 | |
Sales applicable to non-controlling interests | | (27 | ) | (56 | ) | (38 | ) | — | | — | | — | |
Unrealized non-hedge gold/copper derivative (gains) losses | | — | | 2 | | (2 | ) | 49 | | (23 | ) | (26 | ) |
Unrealized mark-to-market provisional price adjustments | | — | | (1 | ) | (2 | ) | (4 | ) | 38 | | 10 | |
Export duties | | 30 | | 23 | | 15 | | — | | — | | — | |
Sales — as adjusted | | $ | 7,194 | | $ | 6,624 | | $ | 5,000 | | $ | 1,200 | | $ | 1,243 | | $ | 1,289 | |
Ounces/pounds sold (000s) | | 7,306 | | 7,595 | | 8,055 | | 380 | | 367 | | 401 | |
Realized gold/copper price per ounce/pound | | $ | 985 | | $ | 872 | | $ | 621 | | $ | 3.16 | | $ | 3.39 | | $ | 3.22 | |
Net Cash Margin
Management uses a non-GAAP financial measure, net cash margin, which represents realized price per ounce less net cash costs per ounce. This measure is used by management to analyze profitability trends and to assess the cash generating capability from the sale of gold on a consolidated basis in each reporting period, expressed on a unit basis. In this MD&A, we have placed greater emphasis on our net cash costs per ounce measure because we believe that it illustrates the performance of our business on a consolidated basis and enables investors to better understand our performance in comparison to other gold producers who present results on a similar basis. As part of this emphasis, we have introduced the measure “net cash margin”, to reflect the net contribution from our gold sales and is an important indicator of expected performance in future periods.
Our net cash margin is intended to provide additional information, does not have any standardized meaning prescribed by US GAAP and should not be considered in isolation or as a substitute for measures of performance prepared in accordance with US GAAP. This measure is not necessarily indicative of operating profit or cash flow from operations as determined under US GAAP. Other companies may calculate cash margin differently. The following table derives this non-GAAP measure from previously defined non- GAAP measures of realized gold price per ounce, total cash costs per ounce, and copper credit per ounce, as determined in the net cash cost reconciliation. Net cash margin could also be derived from realized price per ounce and net cash costs per ounce.
Reconciliation of Net Cash Margin per Ounce
| | For the years ended December 31 | | For the three months
ended December 31 | |
(per ounce data in dollars) | | 2009 | | 2008 | | 2007 | | 2009 | | 2008 | |
Realized gold price per ounce | | $ | 985 | | $ | 872 | | $ | 621 | | $ | 1,119 | | $ | 809 | |
Total cash costs per ounce | | 466 | | 443 | | 345 | | 474 | | 471 | |
Total cash margin per ounce | | $ | 519 | | $ | 429 | | $ | 276 | | $ | 645 | | $ | 338 | |
Copper credit per ounce(1) | | 103 | | 106 | | 117 | | 153 | | 89 | |
Net cash margin per ounce | | $ | 622 | | $ | 535 | | $ | 393 | | $ | 798 | | $ | 427 | |
(1) | Copper credit per ounce is calculated as the margin from copper sales divided by gold ounces sold. Refer to the calculation in the net cash costs reconciliation on page 88. |
90
Glossary of Technical Terms
AUTOCLAVE: Oxidation process in which high temperatures and pressures are applied to convert refractory sulfide mineralization into amenable oxide ore.
BACKFILL: Primarily waste sand or rock used to support the roof or walls after removal of ore from a stope.
BY-PRODUCT: A secondary metal or mineral product recovered in the milling process such as copper and silver.
CONCENTRATE: A very fine, powder-like product containing the valuable ore mineral from which most of the waste mineral has been eliminated.
CONTAINED OUNCES: Represents ounces in the ground before reduction of ounces not able to be recovered by the applicable metallurgical process.
DEVELOPMENT: Work carried out for the purpose of opening up a mineral deposit. In an underground mine this includes shaft sinking, crosscutting, drifting and raising. In an open pit mine, development includes the removal of overburden.
DILUTION: The effect of waste or low-grade ore which is unavoidably included in the mined ore, lowering the recovered grade.
DORÉ: Unrefined gold and silver bullion bars usually consisting of approximately 90 percent precious metals that will be further refined to almost pure metal.
DRILLING:
Core: drilling with a hollow bit with a diamond cutting rim to produce a cylindrical core that is used for geological study and assays. Used in mineral exploration.
In-fill: any method of drilling intervals between existing holes, used to provide greater geological detail and to help establish reserve estimates.
EXPLORATION: Prospecting, sampling, mapping, diamond-drilling and other work involved in searching for ore.
GRADE: The amount of metal in each ton of ore, expressed as troy ounces per ton or grams per tonne for precious metals and as a percentage for most other metals.
Cut-off grade: the minimum metal grade at which an ore body can be economically mined (used in the calculation of ore reserves).
Mill-head grade: metal content of mined ore going into a mill for processing.
Recovered grade: actual metal content of ore determined after processing.
Reserve grade: estimated metal content of an ore body, based on reserve calculations.
HEAP LEACHING: A process whereby gold is extracted by “heaping” broken ore on sloping impermeable pads and continually applying to the heaps a weak cyanide solution which dissolves the contained gold. The gold-laden solution is then collected for gold recovery.
HEAP LEACH PAD: A large impermeable foundation or pad used as a base for ore during heap leaching.
MILL: A processing facility where ore is finely ground and thereafter undergoes physical or chemical treatment to extract the valuable metals.
MINERAL RESERVE: See pages 155 to 162 — “Summary Gold Mineral Reserves and Mineral Resources.”
MINERAL RESOURCE: See pages 155 to 162 — “Summary Gold Mineral Reserves and Mineral Resources.”
MINING CLAIM: That portion of applicable mineral lands that a party has staked or marked out in accordance with applicable mining laws to acquire the right to explore for and exploit the minerals under the surface.
MINING RATE: Tons of ore mined per day or even specified time period.
OPEN PIT: A mine where the minerals are mined entirely from the surface.
ORE: Rock, generally containing metallic or non-metallic minerals, which can be mined and processed at a profit.
ORE BODY: A sufficiently large amount of ore that can be mined economically.
OUNCES: Troy ounces of a fineness of 999.9 parts per 1,000 parts.
RECLAMATION: The process by which lands disturbed as a result of mining activity are modified to support beneficial land use. Reclamation activity may include the removal of buildings, equipment, machinery and other physical remnants of mining, closure of tailings storage facilities, leach pads and other mine features, and contouring, covering and re-vegetation of waste rock and other disturbed areas.
RECOVERY RATE: A term used in process metallurgy to indicate the proportion of valuable material physically recovered in the processing of ore. It is generally stated as a percentage of the material recovered compared to the total material originally present.
REFINING: The final stage of metal production in which impurities are removed from the molten metal.
STRIPPING: Removal of overburden or waste rock overlying an ore body in preparation for mining by open pit methods. Expressed as the total number of tons mined or to be mined for each ounce of gold.
TAILINGS: The material that remains after all economically and technically recoverable precious metals have been removed from the ore during processing.
91
Management’s Responsibility for Financial Statements
The accompanying consolidated financial statements have been prepared by and are the responsibility of the Board of Directors and Management of the company.
The consolidated financial statements have been prepared in accordance with United States generally accepted accounting principles and reflect Management’s best estimates and judgments based on currently available information. The company has developed and maintains a system of internal accounting controls in order to ensure, on a reasonable and cost effective basis, the reliability of its financial information.
The consolidated financial statements have been audited by PricewaterhouseCoopers LLP, Chartered Accountants. Their report outlines the scope of their examination and opinion on the consolidated financial statements.
/s/ Jamie C. Sokalsky | |
Jamie C. Sokalsky | |
Executive Vice President | |
and Chief Financial Officer | |
Toronto, Canada | |
February 17, 2010 | |
92
Management’s Report on Internal Control Over Financial Reporting
Barrick’s management is responsible for establishing and maintaining adequate internal control over financial reporting.
Barrick’s management assessed the effectiveness of the company’s internal control over financial reporting as at December 31, 2009, Barrick’s Management used the Committee of Sponsoring Organizations of the Treadway Commission (COSO) framework to evaluate the effectiveness of Barrick’s internal control over financial reporting. Based on Barrick management’s assessment, Barrick’s internal control over financial reporting is effective as at December 31, 2009.
The effectiveness of the Company’s internal control over financial reporting as at December 31, 2009 has been audited by PricewaterhouseCoopers LLP, Chartered Accountants, as stated in their report which is located on pages 94—95 of Barrick’s 2009 Annual Financial Statements.
93
Independent Auditors’ Report
To the Shareholders of Barrick Gold Corporation
We have completed integrated audits of Barrick Gold Corporation’s (the Company) 2009, 2008 and 2007 consolidated financial statements and of its internal control over financial reporting as at December 31, 2009. Our opinions, based on our audits, are presented below.
Consolidated financial statements
We have audited the accompanying consolidated balance sheets of Barrick Gold Corporation as at December 31, 2009 and December 31, 2008, and the related consolidated statements of income, cash flow, equity and comprehensive income for each of the years in the three year period ended December 31, 2009. These consolidated financial statements are the responsibility of the Company’s management. Our responsibility is to express an opinion on these consolidated financial statements based on our audits.
We conducted our audits of the Company’s consolidated financial statements in accordance with Canadian generally accepted auditing standards and the standards of the Public Company Accounting Oversight Board (United States). Those standards require that we plan and perform an audit to obtain reasonable assurance about whether the financial statements are free of material misstatement. An audit of financial statements includes examining, on a test basis, evidence supporting the amounts and disclosures in the financial statements. A financial statement audit also includes assessing the accounting principles used and significant estimates made by management, and evaluating the overall financial statement presentation. We believe that our audits provide a reasonable basis for our opinion.
In our opinion, the consolidated financial statements referred to above present fairly, in all material respects, the financial position of the Company as at December 31, 2009 and December 31, 2008 and the results of its operations and its cash flows for each of the years in the three year period ended December 31, 2009 in accordance with accounting principles generally accepted in the United States of America.
As discussed in Note 2e to the consolidated financial statements, the Company changed the manner in which it accounts for Business Combinations and Non-Controlling Interests effective January 1, 2009.
94
Internal control over financial reporting
We have also audited the Company’s internal control over financial reporting as at December 31, 2009, based on criteria established in Internal Control — Integrated Framework issued by the Committee of Sponsoring Organizations of the Treadway Commission (COSO). The Company’s management is responsible for maintaining effective internal control over financial reporting and for its assessment of the effectiveness of internal control over financial reporting, included in the 2009 Annual Report to Shareholders. Our responsibility is to express an opinion on the Company’s internal control over financial reporting based on our audit.
We conducted our audit of internal control over financial reporting in accordance with the standards of the Public Company Accounting Oversight Board (United States). Those standards require that we plan and perform the audit to obtain reasonable assurance about whether effective internal control over financial reporting was maintained in all material respects. An audit of internal control over financial reporting includes obtaining an understanding of internal control over financial reporting, assessing the risk that a material weakness exists, testing and evaluating the design and operating effectiveness of internal control based on the assessed risk, and performing such other procedures as we consider necessary in the circumstances. We believe that our audit provides a reasonable basis for our opinion.
A company’s internal control over financial reporting is a process designed to provide reasonable assurance regarding the reliability of financial reporting and the preparation of financial statements for external purposes in accordance with generally accepted accounting principles. A company’s internal control over financial reporting includes those policies and procedures that (i) pertain to the maintenance of records that, in reasonable detail, accurately and fairly reflect the transactions and dispositions of the assets of the company; (ii) provide reasonable assurance that transactions are recorded as necessary to permit preparation of financial statements in accordance with generally accepted accounting principles, and that receipts and expenditures of the company are being made only in accordance with authorizations of management and directors of the company; and (iii) provide reasonable assurance regarding prevention or timely detection of unauthorized acquisition, use, or disposition of the company’s assets that could have a material effect on the financial statements.
Because of its inherent limitations, internal control over financial reporting may not prevent or detect misstatements. Also, projections of any evaluation of effectiveness to future periods are subject to the risk that controls may become inadequate because of changes in conditions, or that the degree of compliance with the policies or procedures may deteriorate.
In our opinion, the Company maintained, in all material respects, effective internal control over financial reporting as at December 31, 2009 based on criteria established in Internal Control — Integrated Framework issued by the COSO.

Chartered Accountants, Licensed Public Accountants
Toronto, Canada
February 17, 2010
95
Consolidated Statements of Income
Barrick Gold Corporation | | | | | | | |
For the years ended December 31 (in millions of United States dollars, except per share data) | | 2009 | | 2008 | | 2007 | |
Sales (notes 4 and 5) | | $ | 8,136 | | $ | 7,613 | | $ | 6,014 | |
Costs and expenses | | | | | | | |
Cost of sales (notes 4 and 6)(1) | | 3,807 | | 3,706 | | 2,998 | |
Amortization and accretion (notes 4 and 15b) | | 1,073 | | 957 | | 990 | |
Corporate administration | | 171 | | 155 | | 155 | |
Exploration (notes 4 and 7) | | 141 | | 198 | | 168 | |
Project development expense (note 7) | | 85 | | 242 | | 188 | |
Elimination of gold sales contracts (note 20h) | | 5,933 | | — | | — | |
Other expense (note 8a) | | 343 | | 302 | | 200 | |
Impairment charges (note 8b) | | 277 | | 598 | | 42 | |
| | 11,830 | | 6,158 | | 4,741 | |
Interest income | | 10 | | 39 | | 141 | |
Interest expense (note 20b) | | (57 | ) | (21 | ) | (113 | ) |
Other income (note 8c) | | 112 | | 291 | | 110 | |
Write-down of investments (note 8b) | | (1 | ) | (205 | ) | (23 | ) |
| | 64 | | 104 | | 115 | |
Income (loss) from continuing operations before income taxes and other items | | (3,630 | ) | 1,559 | | 1,388 | |
Income tax expense (note 9) | | (648 | ) | (594 | ) | (313 | ) |
Loss from equity investees (note 12) | | (87 | ) | (64 | ) | (43 | ) |
Income (loss) from continuing operations before non-controlling interests | | (4,365 | ) | 901 | | 1,032 | |
Income (loss) from discontinued operations (note 3j) | | 97 | | (104 | ) | 73 | |
Income (loss) before non-controlling interests | | (4,268 | ) | 797 | | 1,105 | |
Non-controlling interests (note 27) | | (6 | ) | (12 | ) | 14 | |
Net income (loss) | | $ | (4,274 | ) | $ | 785 | | $ | 1,119 | |
Earnings (loss) per share data (note 10) | | | | | | | |
Income (loss) from continuing operations | | | | | | | |
Basic | | $ | (4.84 | ) | $ | 1.02 | | $ | 1.21 | |
Diluted | | $ | (4.84 | ) | $ | 1.01 | | $ | 1.19 | |
Income (loss) from discontinued operations | | | | | | | |
Basic | | $ | 0.11 | | $ | (0.12 | ) | $ | 0.08 | |
Diluted | | $ | 0.11 | | $ | (0.12 | ) | $ | 0.09 | |
Net income (loss) | | | | | | | |
Basic | | $ | (4.73 | ) | $ | 0.90 | | $ | 1.29 | |
Diluted | | $ | (4.73 | ) | $ | 0.89 | | $ | 1.28 | |
(1) Exclusive of amortization.
The accompanying notes are an integral part of these consolidated financial statements.
96
Consolidated Statements of Cash Flow
Barrick Gold Corporation | | | | | | | |
For the years ended December 31 (in millions of United States dollars) | | 2009 | | 2008 | | 2007 | |
Operating Activities | | | | | | | |
Net income (loss) | | $ | (4,274 | ) | $ | 785 | | $ | 1,119 | |
Amortization and accretion (notes 4 and 15b) | | 1,073 | | 957 | | 990 | |
Impairment charges and write-down of investments (note 8b) | | 278 | | 803 | | 65 | |
Income tax expense (note 9) | | 648 | | 594 | | 313 | |
Income taxes paid | | (376 | ) | (575 | ) | (585 | ) |
Increase in inventory | | (372 | ) | (370 | ) | (258 | ) |
Elimination of gold sales contracts (note 20h) | | 5,933 | | — | | — | |
Payment on obligation of gold sales contracts (note 20h) | | (5,221 | ) | — | | — | |
Gain on sale/acquisition of long-lived assets (note 8c) | | (85 | ) | (187 | ) | (2 | ) |
Income (loss) from discontinued operations (note 3j) | | (97 | ) | 104 | | (73 | ) |
Operating cash flows of discontinued operations (note 3j) | | 7 | | 26 | | 35 | |
Other items (note 11a) | | 164 | | 117 | | 164 | |
Net cash provided by (used in) operating activities | | (2,322 | ) | 2,254 | | 1,768 | |
Investing Activities | | | | | | | |
Property, plant and equipment | | | | | | | |
Capital expenditures (note 4) | | (2,351 | ) | (1,749 | ) | (1,035 | ) |
Sales proceeds | | 10 | | 185 | | 100 | |
Acquisitions (note 3) | | (101 | ) | (2,174 | ) | (1,122 | ) |
Investments (note 12) | | | | | | | |
Purchases | | (3 | ) | (18 | ) | (11 | ) |
Sales | | 7 | | 76 | | 625 | |
Decrease in restricted cash (note 14) | | 113 | | 18 | | 19 | |
Investing cash flows of discontinued operations (note 3j) | | (3 | ) | (27 | ) | (11 | ) |
Other investing activities (note 11b) | | (87 | ) | (231 | ) | (127 | ) |
Net cash used in investing activities | | (2,415 | ) | (3,920 | ) | (1,562 | ) |
Financing Activities | | | | | | | |
Capital stock | | | | | | | |
Proceeds on exercise of stock options | | 65 | | 74 | | 142 | |
Proceeds on common share offering (note 25) | | 3,885 | | — | | — | |
Long-term debt (note 20b) | | | | | | | |
Proceeds | | 2,154 | | 2,717 | | 393 | |
Repayments | | (397 | ) | (1,603 | ) | (1,128 | ) |
Dividends | | (369 | ) | (349 | ) | (261 | ) |
Funding from non-controlling interests | | 304 | | 88 | | — | |
Deposit on silver sale agreement (notes 6 and 23) | | 213 | | — | | — | |
Financing cash flows of discontinued operations (note 3j) | | — | | — | | — | |
Other financing activities (note 11c) | | (26 | ) | (34 | ) | (197 | ) |
Net cash provided by (used in) financing activities | | 5,829 | | 893 | | (1,051 | ) |
Effect of exchange rate changes on cash and equivalents | | 35 | | 3 | | 9 | |
Net increase (decrease) in cash and equivalents | | 1,127 | | (770 | ) | (836 | ) |
Cash and equivalents at beginning of period (note 20a) | | 1,437 | | 2,207 | | 3,043 | |
Cash and equivalents at end of period (note 20a) | | $ | 2,564 | | $ | 1,437 | | $ | 2,207 | |
The accompanying notes are an integral part of these consolidated financial statements.
97
Consolidated Balance Sheets
Barrick Gold Corporation | | | | | |
At December 31 (in millions of United States dollars) | | 2009 | | 2008 | |
Assets | | | | | |
Current assets | | | | | |
Cash and equivalents (note 20a) | | $ | 2,564 | | $ | 1,437 | |
Accounts receivable (note 14) | | 251 | | 197 | |
Inventories (note 13) | | 1,540 | | 1,278 | |
Other current assets (note 14) | | 524 | | 1,167 | |
Assets of discontinued operations (note 3j) | | 59 | | 33 | |
| | 4,938 | | 4,112 | |
Non-current assets | | | | | |
Equity in investees (note 12a) | | 1,136 | | 1,085 | |
Other investments (note 12b) | | 92 | | 60 | |
Property, plant and equipment (note 15) | | 13,125 | | 11,505 | |
Goodwill (note 17) | | 5,197 | | 5,280 | |
Intangible assets (note 16) | | 66 | | 74 | |
Deferred income tax assets (note 24) | | 949 | | 869 | |
Other assets (note 18) | | 1,531 | | 1,133 | |
Assets of discontinued operations (note 3j) | | 41 | | 43 | |
Total assets | | $ | 27,075 | | $ | 24,161 | |
Liabilities and Equity | | | | | |
Current liabilities | | | | | |
Accounts payable | | $ | 1,221 | | $ | 953 | |
Short-term debt (note 20b) | | 54 | | 206 | |
Other current liabilities (note 19) | | 475 | | 627 | |
Liabilities of discontinued operations (note 3j) | | 23 | | 58 | |
| | 1,773 | | 1,844 | |
Non-current liabilities | | | | | |
Long-term debt (note 20b) | | 6,281 | | 4,350 | |
Settlement obligation to close out gold sales contracts (note 20h) | | 647 | | — | |
Asset retirement obligations (note 22) | | 1,122 | | 943 | |
Deferred income tax liabilities (note 24) | | 1,184 | | 754 | |
Other liabilities (note 23) | | 498 | | 778 | |
Liabilities of discontinued operations (note 3j) | | 23 | | 33 | |
Total liabilities | | 11,528 | | 8,702 | |
Equity | | | | | |
Capital stock (note 25) | | 17,390 | | 13,372 | |
Retained earnings (deficit) | | (2,382 | ) | 2,261 | |
Accumulated other comprehensive income (loss) (note 26) | | 55 | | (356 | ) |
Total shareholders’ equity | | 15,063 | | 15,277 | |
Non-controlling interests (note 27) | | 484 | | 182 | |
Total equity | | 15,547 | | 15,459 | |
Contingencies and commitments (notes 15 and 30) | | | | | |
Total liabilities and equity | | $ | 27,075 | | $ | 24,161 | |
The accompanying notes are an integral part of these consolidated financial statements.
Signed on behalf of the Board,
/s/ Aaron Regent | | /s/ Steven J. Shapiro |
Aaron Regent, Director | | Steven J. Shapiro, Director |
98
Consolidated Statements of Equity
Barrick Gold Corporation | | | | | | | |
For the years ended December 31 (in millions of United States dollars) | | 2009 | | 2008 | | 2007 | |
Common shares (number in thousands) | | | | | | | |
At January 1 | | 872,739 | | 869,887 | | 864,195 | |
Issued on public equity offering (note 25) | | 108,973 | | — | | — | |
Issued on exercise of stock options | | 2,349 | | 2,383 | | 5,680 | |
Issued on redemption of exchangeable shares (note 25b) | | 267 | | 469 | | 12 | |
At December 31 | | 984,328 | | 872,739 | | 869,887 | |
Common shares | | | | | | | |
At January 1 | | $ | 13,372 | | $ | 13,273 | | $ | 13,106 | |
Issued on public equity offering (note 25) | | 3,926 | | — | | — | |
Issued on exercise of stock options | | 65 | | 74 | | 142 | |
Recognition of stock option expense | | 27 | | 25 | | 25 | |
At December 31 | | 17,390 | | 13,372 | | 13,273 | |
Retained earnings (deficit) | | | | | | | |
At January 1 | | 2,261 | | 1,832 | | 974 | |
Net income (loss) | | (4,274 | ) | 785 | | 1,119 | |
Dividends | | (369 | ) | (349 | ) | (261 | ) |
Repurchase of preferred shares of a subsidiary | | — | | (7 | ) | — | |
At December 31 | | (2,382 | ) | 2,261 | | 1,832 | |
Accumulated other comprehensive income (loss) (note 26) | | 55 | | (356 | ) | 151 | |
Total shareholders’ equity | | 15,063 | | 15,277 | | 15,256 | |
Non-controlling interests (note 27) | | | | | | | |
At January 1 | | 182 | | 82 | | 56 | |
Net income (loss) attributable to non-controlling interests | | 6 | | 12 | | (14 | ) |
Funding from non-controlling interests | | 299 | | 90 | | 35 | |
Other increase (decrease) in non-controlling interests | | (3 | ) | (2 | ) | 5 | |
At December 31 | | 484 | | 182 | | 82 | |
Total equity at December 31 | | $ | 15,547 | | $ | 15,459 | | $ | 15,338 | |
Consolidated Statements of Comprehensive Income
Barrick Gold Corporation | | | | | | | |
For the years ended December 31 (in millions of United States dollars) | | 2009 | | 2008 | | 2007 | |
Net income (loss) | | $ | (4,274 | ) | $ | 785 | | $ | 1,119 | |
Other comprehensive income (loss), net of tax (note 26) | | 411 | | (507 | ) | 32 | |
Comprehensive income (loss) | | $ | (3,863 | ) | $ | 278 | | $ | 1,151 | |
The accompanying notes are an integral part of these consolidated financial statements.
99
Notes to Consolidated Financial Statements
Barrick Gold Corporation. Tabular dollar amounts in millions of United States dollars, unless otherwise shown. References to C$, A$, ZAR, CLP, PGK, TZS, JPY, ARS and EUR are to Canadian dollars, Australian dollars, South African rand, Chilean pesos, Papua New Guinea kina, Tanzanian schillings, Japanese yen, Argentinean pesos and Euros, respectively.
1 · Nature of Operations
Barrick Gold Corporation (“Barrick” or the “Company”) principally engages in the production and sale of gold, as well as related activities such as exploration and mine development. We also produce significant amounts of copper and hold interests in oil and gas properties located in Canada. Our producing mines are concentrated in four regional business units: North America, South America, Africa and Australia Pacific. We sell our gold production into the world market and we sell our copper production into the world market and to private customers.
2 · Significant Accounting Policies
a) Basis of Preparation
These consolidated financial statements have been prepared under United States generally accepted accounting principles (“US GAAP”). To ensure comparability of financial information, prior year amounts have been reclassified to reflect changes in the financial statement presentation.
b) Principles of Consolidation
These consolidated financial statements include the accounts of Barrick Gold Corporation and those entities that we have the ability to control either through voting rights or means other than voting rights. These entities include development projects and operating mines in which we hold a less than 100% ownership interest, which generally operate as joint ventures. For these joint ventures, our risk is limited to our investment in the entity. We have assessed all of our incorporated joint ventures (“JVs”), including those in the development stage to determine if they are variable interest entities (“VIEs”). We determine if we are the primary beneficiary based on whether we expect to participate in the majority of the entities’ future expected gains/losses, based on the funding requirements set out in their respective agreements. For VIEs where we are the primary beneficiary, we consolidate the entity and record a non-controlling interest, measured initially at its estimated fair value, for the interest held by other entity owners. For our projects that qualify as VIEs and for which we expect to participate equally in future expected gains/losses with our partners, we are not the primary beneficiary, and therefore use the equity method of accounting to report their results (note 12).
For unincorporated JVs under which we hold an undivided interest in the assets and liabilities and receive our share of production from the joint venture, we include our pro rata share of the assets, liabilities, revenue and expenses in our financial statements.
100
The following table illustrates our policy used to account for significant entities where we hold less than a 100% economic interest. We consolidate all wholly owned entities.
Consolidation Method at December 31, 2009
| | | | Economic interest at | | | |
| | Entity type at December 31, 2009 | | December 31, 2009(1) | | Method | |
North America | | | | | | | |
Round Mountain Mine | | Unincorporated JV | | 50 | % | Pro Rata | |
Marigold Mine | | Unincorporated JV | | 33 | % | Pro Rata | |
Turquoise Ridge Mine | | Unincorporated JV | | 75 | % | Pro Rata | |
Pueblo Viejo Project(2) | | VIE | | 60 | % | Consolidation | |
Donlin Creek Project | | VIE | | 50 | % | Equity Method | |
South America | | | | | | | |
Cerro Casale Project | | VIE | | 50 | % | Equity Method | |
Australia | | | | | | | |
Kalgoorlie Mine | | Unincorporated JV | | 50 | % | Pro Rata | |
Porgera Mine(3) | | Unincorporated JV | | 95 | % | Pro Rata | |
Reko Diq Project(4) | | VIE | | 37.5 | % | Equity Method | |
Africa | | | | | | | |
Tulawaka Mine | | Unincorporated JV | | 70 | % | Consolidation | |
Kabanga Project(5) | | VIE | | 50 | % | Equity Method | |
(1) | Unless otherwise noted, all of our joint ventures are funded by contributions made by their partners in proportion to their economic interest. |
(2) | In accordance with the terms of the agreement with our partner, Barrick is responsible for 60% of the funding requirements for the Pueblo Viejo project. We consolidate our interest in Pueblo Viejo and record a non-controlling interest for the 40% that we don’t own. In 2009, we determined that mineralization at Pueblo Viejo met the definition of proven and probable reserves for United States reporting purposes and began capitalizing the cost of project activities. We recorded a non-controlling interest gain of $1 million (2008: loss of $26 million) (note 27). At December 31, 2009, the consolidated carrying amount (100%) of the Pueblo Viejo project was $1,321 million (2008: $439 million) (note 15a). |
(3) | We hold an undivided interest in our share of assets and liabilities at the Porgera mine. In August 2007, we increased our ownership interest from 75% to 95%. |
(4) | We hold a 50% interest in Atacama Copper, which has a 75% interest in the Reko Diq project. We use the equity method to account for our interest in Atacama Copper (note 12). |
(5) | In accordance with an agreement with our partner, from 2006 until the third quarter of 2008, our partner was responsible for funding 100% of exploration and project expenditures and we did not record any amounts for our economic interest in this period. During the third quarter of 2008, our partner completed the $145 million spending requirement, and we began funding 50% of the exploration and project expenditures (note 12). |
c) Foreign Currency Translation
The functional currency of our gold and copper operations is the US dollar. We translate non-US dollar balances for these operations into US dollars as follows:
· Property, plant and equipment, intangible assets and equity method investments using historical rates;
· Available-for-sale securities using closing rates with translation gains and losses recorded in other comprehensive income;
· Asset retirement obligations using historical rates;
· Deferred tax assets and liabilities using closing rates with translation gains and losses recorded in income tax expense;
· Other assets and liabilities using closing rates with translation gains and losses recorded in other income/expense; and
· Income and expenses using average exchange rates, except for expenses that relate to non-monetary assets and liabilities measured at historical rates, which are translated using the same historical rate as the associated non-monetary assets and liabilities.
The functional currency of our oil and gas operations, (“Barrick Energy”) is the Canadian dollar. We translate balances related to Barrick Energy into US dollars as follows:
· Assets and liabilities using closing exchange rates with translation gains and losses recorded in other comprehensive income; and
· Income and expense using average exchange rates with translation gains and losses recorded in other comprehensive income.
d) Use of Estimates
The preparation of these financial statements requires us to make estimates and assumptions. The most significant ones are: quantities of proven and probable mineral reserves; classification of mineralization as either reserves or non-reserves; fair values of acquired assets and liabilities under business combinations, including the value of mineralized material beyond proven and probable mineral reserves; future costs and expenses to produce proven and probable mineral reserves; future commodity prices for gold, copper, silver and other products; future costs of oil
101
and other consumables; currency exchange rates; the future cost of asset retirement obligations; amounts and likelihood of contingencies; the fair values of reporting units that include goodwill; uncertain tax positions; and credit risk adjustments to discount rates. Using these and other estimates and assumptions, we make various decisions in preparing the financial statements including:
· The treatment of expenditures at mineral properties prior to when production begins as either an asset or an expense (note 15);
· Whether tangible, intangible long-lived assets and equity investments are impaired, and if so, estimates of the fair value of those assets and any corresponding impairment charge (note 15);
· Our ability to realize deferred income tax assets and amounts recorded for any corresponding valuation allowances and amounts recorded for uncertain tax positions (note 24);
· The useful lives of tangible and intangible long-lived assets and the measurement of amortization (note 15);
· The fair value of asset retirement obligations (note 22);
· Whether to record a liability for loss contingencies and the amount of any liability (notes 15 and 30);
· The amount of income tax expense (note 9);
· Allocations of the purchase price in business combinations to assets and liabilities acquired (notes 3 and 17);
· Whether any impairments of goodwill have occurred and if so the amounts of impairment charges (note 17);
· Transfers of value beyond proven and probable reserves to amortized assets (note 15); and
· Credit risk adjustments to the discount rates in determining the fair value at derivative instruments (notes 20 and 21).
As the estimation process is inherently uncertain, actual future outcomes could differ from present estimates and assumptions, potentially having material future effects on our financial statements.
e) Accounting Changes
Accounting Changes Implemented in 2009
On July 1, 2009, the Financial Accounting Standards Board’s (FASB) Codification of US GAAP was launched as the sole source of authoritative non-governmental US GAAP. The Accounting Standards Codification (“ASC”) is not intended to change US GAAP, but rather reorganize existing guidance by accounting topic to allow easier identification of applicable standards. We have updated any references to US GAAP to reflect the Codification.
Measuring Fair Value of Liabilities
In August 2009, the FASB issued Accounting Standards Update (ASU) 2009-05, Measuring Fair Value of Liabilities which is effective prospectively for interim periods beginning after August 1, 2009, with early adoption permitted. Existing guidance required that the fair value of liabilities be measured under the assumption that the liability is transferred to a market participant. ASU 2009-05 provides further clarification that fair value measurement of a liability should assume transfer to a market participant as of the measurement date without settlement with the counter-party. Therefore, the fair value of the liability shall reflect non-performance risk, including but not limited to a reporting entity’s own credit risk. We have adopted ASU 2009-05 in fourth quarter 2009, resulting in an insignificant adjustment to our liabilities.
Disclosures about Derivative Instruments and Hedging Activities
In first quarter 2009, we adopted new disclosure requirements for derivative instruments and hedging activities issued by the FASB in March 2008. Under this new guidance, entities are required to provide enhanced disclosures about (a) how and why an entity uses derivative instruments, (b) how derivative instruments and related hedged items are accounted for, and (c) how derivative instruments and related hedged items affect an entity’s financial position, financial performance and cash flows. To the extent the required information was not previously disclosed in our 2008 annual financial statements, we incorporated new disclosures in note 20.
Business Combinations
In first quarter 2009, we began applying the new provisions for business combinations consummated after December 31, 2008. Under the new guidance, business acquisitions are accounted for under the “acquisition method”, as opposed to the “purchase method”.
The more significant changes to our accounting for business combinations that will result from applying the acquisition method include: (i) the definition of a business is broadened to include some development stage entities, and therefore more acquisitions may be accounted for as business combinations rather than asset acquisitions; (ii) the measurement date for equity interests issued by the acquirer is the acquisition date instead of a few days before and after terms are agreed to and announced, which may significantly change the amount recorded for the acquired business if share prices differ from the agreement and announcement date to the acquisition date; (iii) all future adjustments to income tax estimates will be recorded to income tax expense, whereas under the previous requirements, certain changes in income tax estimates were recorded to goodwill;
102
(iv) acquisition-related costs of the acquirer, including investment banking fees, legal fees, accounting fees, valuation fees, and other professional or consulting fees will be expensed as incurred, whereas under the previous guidance these costs were capitalized as part of the business combination; (v) the assets acquired and liabilities assumed as part of a business combination, whether full, partial or step acquisition, result in all assets and liabilities recorded at 100% of fair value, whereas under the previous requirements only the controlling interest’s portion was recorded at fair value; (vi) recognition of a bargain purchase gain when the fair value of the identifiable assets exceeds the purchase price, whereas under the previous guidance, the net book value of the identifiable assets would have been adjusted downward; and (vii) the non-controlling interest will be recorded at its share of fair value of net assets acquired, including its share of goodwill, whereas under previous guidance the non-controlling interest is recorded at its share of carrying value of net assets acquired with no goodwill being allocated.
Non-controlling Interests in Consolidated Financial Statements
In first quarter 2009, we adopted the provisions for non-controlling interests issued by the FASB in December 2007. Under the new guidance, non-controlling interests are measured at 100% of the fair value of assets acquired and liabilities assumed. Prior to the effective date of the new guidance, non-controlling interests were measured at book value. For presentation and disclosure purposes, non-controlling interests are now classified as a separate component of equity. In addition, the new guidance changes the manner in which increases/decreases in ownership percentages are accounted for. Changes in ownership percentages are recorded as equity transactions and no gain or loss is recognized as long as the parent retains control of the subsidiary. When a parent company deconsolidates a subsidiary but retains a non-controlling interest, the non-controlling interest is re-measured at fair value on the date control is lost and a gain or loss is recognized at that time. Further, accumulated losses attributable to the non-controlling interests are no longer limited to the original carrying amount, and therefore non-controlling interests could have a negative carrying balance.
The new provisions have been applied prospectively with the exception of the presentation and disclosure provisions, which have been applied for all prior periods presented in the financial statements. The presentation and disclosure provisions resulted in the reclassification of non-controlling interests to the Equity section of the Balance Sheet totaling $484 million as at December 31, 2009 (December 31, 2008: $182 million).
Employers’ Disclosures about Post Retirement Benefit Plan Assets
In December 2008, the FASB issued guidance on employers’ disclosures about their post retirement benefit plan assets. The objectives of the disclosures about plan assets in an employer’s defined benefit pension or other postretirement plan are to provide users of financial statements with an understanding of: (i) how investment allocation decisions are made, including the factors that are pertinent to an understanding of investment policies and strategies; (ii) the major categories of plan assets; (iii) the inputs and valuation techniques used to measure the fair value of plan assets; (iv) the effect of fair value measurements using significant unobservable inputs (Level 3) on changes in plan assets for the period; (v) significant concentrations of risk within plan assets. We adopted the increased disclosure requirements beginning in fourth quarter 2009. Refer to note 29 for related disclosures.
Accounting Changes Implemented in 2008
Fair Value Measurements and Disclosures
In 2008, we implemented new FASB guidance for financial assets and financial liabilities that are measured at fair value on a recurring basis. The primary financial assets and financial liabilities that are recognized and disclosed at fair value on a recurring basis are: available-for-sale securities; receivables from provisional copper and gold sales; derivate assets and derivative liabilities and held-to-maturity investments. Beginning in 2009, we applied this new guidance to non-financial assets and liabilities when we periodically measure at fair value under US GAAP, which include: goodwill, tangible and intangible assets measured and recognized at fair value as a result of an impairment assessment; and non-financial assets and non-financial liabilities recognized as a result of a business combination.
The adoption of this guidance resulted in expanded disclosures about our fair value measurements for financial assets and financial liabilities recognized in our financial statements. However, the adoption did not have an impact on the measurement of fair value as our valuation methodology for these assets and liabilities is consistent with the fair value framework established by the new guidance. Refer to note 21 of the Consolidated Financial Statements for details of the adoption and related disclosures.
103
Disclosures by Public Entities (Enterprises) About Transfers of Financial Assets and Interests in VIEs
In December 2008, the FASB issued guidance for the purpose of improving the transparency of transfers of financial assets and an enterprise’s involvement with variable interest entities (“VIEs”), including qualifying special-purpose entities (“QSPEs”). The impact on our financial reporting requirements is limited to the new VIE disclosures.
The VIE disclosure requirements focus on an enterprise’s involvement with VIEs and its judgments about the accounting for them. The new guidance also requires disclosure of the details of any financial or other support provided to a VIE that the enterprise was not previously contractually required to provide, and the primary reasons for providing the support. The primary beneficiary of a VIE is also required to disclose the terms of any arrangements that could require the enterprise to provide future support to the VIE. In addition, it requires disclosure of the carrying amount and classification of the variable interest entity’s assets and liabilities in the Balance Sheet and a reconciliation of those amounts to the enterprise’s maximum exposure to loss.
The adoption of this guidance has resulted in expanded disclosure around our involvement with our VIEs and the significant judgments and assumptions we make in accounting for them. We have also included tables that reflect how our consolidated VIEs are included in our Consolidated Statement of Income and Balance Sheet.
f) Significant Accounting Developments Amendments to Accounting for VIEs
In second quarter 2009, the FASB issued an amendment to its guidance on VIEs. Although not effective until first quarter 2010, this new guidance makes significant changes to the model for determining who should consolidate a VIE by specifically eliminating the quantitative approach to determining the primary beneficiary. The amendment requires the use of a qualitative approach to determine the primary beneficiary, based on the power to direct activities of the VIE that most significantly impact its economic performance and an obligation to absorb losses or to receive benefits of the VIE. If the power is shared, then no party is the primary beneficiary. We are assessing the impact of these changes on our Consolidated Financial Statements.
g) Other Notes to the Financial Statements
| | Note | | Page | |
Acquisitions and divestitures | | 3 | | 105 | |
Segment information | | 4 | | 108 | |
Revenues | | 5 | | 110 | |
Cost of sales | | 6 | | 111 | |
Exploration and project development expense | | 7 | | 113 | |
Other charges | | 8 | | 114 | |
Income tax expense | | 9 | | 115 | |
Earnings (loss) per share | | 10 | | 116 | |
Cash flow — other items | | 11 | | 117 | |
Equity in investees and other investments | | 12 | | 118 | |
Inventories | | 13 | | 120 | |
Accounts receivable and other current assets | | 14 | | 121 | |
Property, plant and equipment | | 15 | | 122 | |
Intangible assets | | 16 | | 126 | |
Goodwill | | 17 | | 127 | |
Other assets | | 18 | | 129 | |
Other current liabilities | | 19 | | 129 | |
Financial instruments | | 20 | | 129 | |
Fair value measurements | | 21 | | 140 | |
Asset retirement obligations | | 22 | | 142 | |
Other non-current liabilities | | 23 | | 142 | |
Deferred income taxes | | 24 | | 143 | |
Capital stock | | 25 | | 145 | |
Other comprehensive income (loss) (“OCI”) | | 26 | | 146 | |
Non-controlling interests | | 27 | | 146 | |
Stock-based compensation | | 28 | | 147 | |
Post-retirement benefits | | 29 | | 149 | |
Litigation and claims | | 30 | | 152 | |
Subsequent events | | 31 | | 154 | |
104
3 · Acquisitions and Divestitures
For the years ended December 31 | | 2009 | | 2008 | |
Cash paid on acquisition(1) | | | | | |
Valhalla | | $ | 53 | | $ | — | |
Hemlo | | 50 | | — | |
Barrick Energy Inc. | | — | | 460 | |
Cortez (additional 40% interest) | | — | | 1,695 | |
Other(2) | | — | | 74 | |
| | $ | 103 | | $ | 2,229 | |
Less: cash acquired | | (2 | ) | (55 | ) |
| | $ | 101 | | $ | 2,174 | |
Cash proceeds on sale(1) | | | | | |
Royalty disposition | | $ | — | | $ | 150 | |
| | $ | — | | $ | 150 | |
(1) | All amounts represent gross cash paid or received on acquisition or divestiture. |
(2) | Includes $40 million for the remaining 6% interest in Arizona Star, which owned a 51% interest in Cerro Casale pursuant to a statutory right of compulsory acquisition; $29 million for the additional 40% interest in our Storm property; and $5 million related to the 2007 acquisition of Kainantu. |
a) IPO of African Gold Mining Operations
On February 17, 2010, our Board of Directors approved a plan to create African Barrick Gold, a new company whose equity it will seek to list with the United Kingdom Listing Authority and to admit to trading on the London Stock Exchange, subject to market conditions. The new company also intends to seek a future listing on the Dar es Salaam Stock Exchange in Tanzania. African Barrick Gold will hold Barrick’s African gold mines, projects and exploration properties. The new company will offer about 25% of its equity in an initial public offering and Barrick will retain the remaining interest. The pricing and terms are yet to be determined; however, the offering is expected to be priced in mid-March, with closing expected to occur by the end of March.
b) Acquisition of 25% Interest in Cerro Casale
On February 17, 2010, we agreed to acquire an additional 25% interest in the Cerro Casale project in Chile from Kinross Gold Corporation for consideration of $475 million, comprised of $455 million cash and the elimination of a $20 million contingent obligation which was payable by Kinross to Barrick on a production decision, thereby increasing our interest in the project to 75%. We currently account for Cerro Casale using the equity method of accounting. Upon the closing of this transaction, we will obtain control over the project and therefore will consolidate 100% of its operating results, cash flows and net assets, with an offsetting non-controlling interest of 25%, from that time.
c) Acquisition of Tusker Gold Limited
On February 8, 2010, we entered into an Implementation Agreement with Tusker Gold Limited (“Tusker”) setting out the basis on which Barrick or one of its subsidiaries would make a takeover bid for Tusker for aggregate net consideration of approximately $75 million. Tusker’s board of directors have unanimously recommended that Tusker shareholders accept the offer. Barrick has entered into pre bid acceptance agreements with three Tusker shareholders that collectively hold 20% of Tusker’s outstanding shares. Tusker holds the other 49% interest in our Nyanzaga joint venture in Tanzania, as well as certain other exploration interests in Tanzania. If and when acquired, Tusker will be held in African Barrick Gold plc, which will use cash on hand to make the acquisition. The offer, which is subject to certain conditions, is expected to be made in March 2010 and close in April 2010.
d) Acquisition of 70% Interest in El Morro
On October 11, 2009, we entered into an agreement to acquire a 70% interest in the El Morro project from Xstrata Plc. for $465 million in cash. El Morro is an advanced stage gold-copper project located near our Pascua-Lama and Cerro Casale projects in Chile. On January 7, 2010, New Gold Inc. announced that it had given Xstrata notice of its intention to exercise a right of first refusal and on February 1, 2010 Xstrata notified Barrick that it was terminating its agreement with Barrick. The Company has filed an action in the Ontario Superior Court of Justice against New Gold and Goldcorp, challenging the purported exercise of New Gold’s right of first refusal on the basis that, among other things, it was not lawfully exercised. Barrick does not accept the termination by Xstrata and intends to bring a motion to add Xstrata as a party and seeking to compel Xstrata to complete the sale to Barrick, as well as certain other remedies.
e) Acquisition of 50% Interest in Valhalla
On September 17, 2009, we completed the acquisition of 50% interest in the Valhalla oil and gas field, which is close to our existing Sturgeon Lake field, for total cash consideration of $53 million. This transaction was considered an asset purchase.
105
f) Acquisition of 50% Interest in Hemlo
On April 22, 2009, we completed the acquisition of the remaining 50% interest in the Williams and David Bell gold mines (“Hemlo”) in Canada from Teck Resources Ltd. for cash consideration of $50 million, thereby increasing our interest to 100%. We recognized a bargain purchase gain of $43 million, resulting from the excess fair value of the net assets acquired over the cash consideration paid. Following this transaction, we remeasured our existing 50% interest in the assets and liabilities of Hemlo held prior to this transaction to their fair values, recognizing a gain of approximately $29 million. The total gain of $72 million is recorded in other income (note 8c).
The tables below represent the purchase cost, our final purchase price allocation, and the bargain purchase recorded in other income (note 8c).
Purchase Cost
Purchase cost | | $ | 65 | |
Purchase price adjustment | | (15 | ) |
Less: cash acquired | | (2 | ) |
| | $ | 48 | |
Summary Purchase Price Allocation
Current assets | | $ | 10 | |
Property, plant and equipment | | | |
Buildings, plant and equipment | | 25 | |
Capitalized development costs | | 21 | |
Capitalized reserve acquisition costs | | 81 | |
Total assets | | 137 | |
Current liabilities | | 8 | |
Asset retirement obligations | | 32 | |
Deferred income tax liabilities | | 21 | |
Total liabilities | | 61 | |
Net assets acquired | | $ | 76 | |
g) Acquisition of Barrick Energy Inc. (“Barrick Energy”)
In 2008, we acquired 59.2 million shares of Cadence Energy Inc. (“Cadence”) for cash consideration of $377 million, representing 100% of the issued and outstanding common shares. Subsequent to the acquisition, we renamed Cadence as Barrick Energy.
In 2008, we also acquired all of the oil and gas assets at Sturgeon Lake, Alberta, from Daylight Resources Trust for $83 million. The Sturgeon Lake assets are adjacent to Cadence’s Sturgeon Lake assets and the transaction enabled us to consolidate 100% ownership of the Sturgeon Lake South Leduc pool. We determined that this transaction represented an acquisition of assets, which were amalgamated with the Cadence operations to form Barrick Energy.
The tables below represent the purchase cost and the final purchase price allocation.
Purchase Cost
Purchase cost | | $ | 377 | |
Less: cash acquired | | (41 | ) |
| | $ | 336 | |
Summary Purchase Price Allocation
Current assets | | $ | 25 | |
Property, plant and equipment | | | |
Capitalized reserve acquisition and development costs | | 278 | |
Buildings, plant and equipment | | 68 | |
Goodwill | | 96 | |
Total assets | | 467 | |
Accounts payable | | 24 | |
Derivative liabilities | | 10 | |
Long-term debt | | 65 | |
Asset retirement obligations | | 10 | |
Deferred income tax liabilities | | 22 | |
Total liabilities | | 131 | |
Net assets acquired | | $ | 336 | |
h) Acquisition of 40% Interest in Cortez
In 2008, we completed our acquisition of an additional 40% interest in the Cortez property from Kennecott Explorations (Australia) Ltd. (“Kennecott”), a subsidiary of Rio Tinto plc, for a total cash consideration of $1,695 million. A further $50 million will be payable if and when we add an additional 12 million ounces of contained gold resources beyond our December 31, 2007 reserve statement for Cortez. This contingent payment will be recognized as an additional cost of the acquisition only if the resource/production targets are met and the amounts become payable as a result. A sliding scale royalty is payable to Kennecott on 40% of all production in excess of 15 million ounces on and after January 1, 2008.
The acquisition consolidates 100% ownership for Barrick of the existing Cortez mine and the Cortez Hills expansion plus any future potential from the property. We have determined that the transaction represents a business combination. The acquisition was effective March 1, 2008 and the revenues and expenses attributable to the 40% interest have been included in our Consolidated Statements of Income from that date onwards. The tables below represent the purchase cost and our final purchase price allocation for the additional 40% of Cortez.
Purchase Cost
Purchase cost per agreement | | $ | 1,695 | |
Less: cash acquired | | (14 | ) |
| | $ | 1,681 | |
106
Summary Purchase Price Allocation
Inventories | | $ | 47 | |
Other current assets | | 1 | |
Property, plant and equipment | | | |
Buildings, plant and equipment | | 184 | |
Capitalized reserve acquisition and development costs | | 1,057 | |
Value beyond proven and probable reserves | | 381 | |
Goodwill | | 20 | |
Non-current ore in stockpiles | | 17 | |
Deferred income tax assets | | 11 | |
Total assets | | 1,718 | |
Current liabilities | | 23 | |
Asset retirement obligations | | 14 | |
Total liabilities | | 37 | |
Net assets acquired | | $ | 1,681 | |
i) Disposition of Royalties
In 2008, we divested certain non-core royalties to Royal Gold Inc. (“Royal Gold”) in exchange for cash consideration of $150 million and a reduction in various royalties that we are currently obligated to pay to Royal Gold with an estimated fair value of $32 million. The transaction closed on October 2, 2008 and we recorded a pre-tax gain on sale of $167 million in other income (note 8c).
j) Discontinued Operations
Results of Discontinued Operations
For the years ended December 31 | | 2009 | | 2008 | | 2007 | |
Gold sales | | | | | | | |
Osborne | | $ | 31 | | $ | 27 | | $ | 26 | |
Henty | | 25 | | 52 | | 52 | |
Copper sales | | | | | | | |
Osborne | | 212 | | 221 | | 240 | |
| | $ | 268 | | $ | 300 | | $ | 318 | |
Income (loss) before tax | | | | | | | |
Osborne | | 129 | | (85 | ) | 88 | |
Henty | | 9 | | (23 | ) | 4 | |
| | $ | 138 | | $ | (108 | ) | $ | 92 | |
Cash Proceeds on Sale of Discontinued Operations
| | 2009 | | 2008 | | 2007 | |
Henty | | $ | 4 | | $ | — | | $ | — | |
South Deep mine(1) | | — | | — | | 21 | |
| | $ | 4 | | $ | — | | $ | 21 | |
(1) In 2007, we received $21 million in cash relating to the sale of our 50% interest in the South Deep mine in 2006.
Osborne
Due to the short remaining economic life, in December 2009 we committed to a plan to dispose of our Osborne mine in our Australia Pacific regional business unit. We expect to have a sale agreement finalized in first quarter 2010. Osborne meets the criteria of an asset held for sale, and accordingly, the results of operations and the assets and liabilities of Osborne have been presented as discontinued operations in the Consolidated Statements of Income, the Consolidated Statements of Cash Flow and the Consolidated Balance Sheets. In fourth quarter 2008, Osborne’s property, plant and equipment was impaired and written down to salvage value. As such, amortization was recorded only on additions made during 2009 and, therefore, the classification of Osborne as an asset held for sale has minimal impact on amortization expense.
Henty
On July 6, 2009, we finalized an agreement with Bendigo Mining Limited (“Bendigo”) to divest our Henty mine in our Australia Pacific segment for consideration of $4 million cash, adjusted for the benefit of production from July 1, 2009 and Bendigo shares with a value of $2 million on closing. We are also entitled to receive a royalty payable on production from future exploration discoveries, capped at approximately $17 million. A gain of $4 million was recorded on the sale and recognized in income from discontinued operations (note 3j). The results of operations and the assets and liabilities of Henty have been presented as discontinued operations in the Consolidated Statements of Income, the Consolidated Statements of Cash Flow and the Consolidated Balance Sheets.
107
4 · Segment Information
In 2008, we formed a dedicated Capital Projects group, distinct from our existing regional business units to focus on managing development projects and building new mines. This specialized group manages all project development activities up to and including the commissioning of new mines, at which point responsibility for mine operations will be handed over to the regional business units. We revised the format of information provided to the Chief Operating Decision Maker in order to make resource allocation decisions and assess the operating performance of this group. Accordingly, we revised our operating segment disclosure to be consistent with the internal management structure and reporting changes, with restatement of comparative information to conform to the current period presentation. Also in 2008, we completed the acquisition of Barrick Energy (note 3g). The results of Barrick Energy are distinct from our existing regional business units and as such are presented separately in our segment information.
| | Sales | | Segment expenses(1) | | Amortization
and accretion | | Segment income (loss) | |
For the years ended December 31 | | 2009 | | 2008 | | 2007 | | 2009 | | 2008 | | 2007 | | 2009 | | 2008 | | 2007 | | 2009 | | 2008 | | 2007 | |
Gold | | | | | | | | | | | | | | | | | | | | | | | | | |
North America | | $ | 2,780 | | $ | 2,627 | | $ | 2,001 | | $ | 1,423 | | $ | 1,534 | | $ | 1,178 | | $ | 387 | | $ | 371 | | $ | 340 | | $ | 970 | | $ | 722 | | $ | 483 | |
South America | | 1,831 | | 1,833 | | 1,306 | | 499 | | 531 | | 400 | | 143 | | 175 | | 242 | | 1,189 | | 1,127 | | 664 | |
Australia Pacific | | 1,836 | | 1,579 | | 1,214 | | 1,120 | | 1,030 | | 895 | | 286 | | 245 | | 226 | | 430 | | 304 | | 93 | |
Africa | | 688 | | 538 | | 428 | | 377 | | 327 | | 293 | | 96 | | 66 | | 80 | | 215 | | 145 | | 55 | |
Copper | | | | | | | | | | | | | | | | | | | | | | | | | |
South America | | 943 | | 1,007 | | 1,065 | | 361 | | 315 | | 232 | | 78 | | 68 | | 82 | | 504 | | 624 | | 751 | |
Capital Projects | | — | | — | | — | | 142 | | 209 | | 187 | | — | | — | | — | | (142 | ) | (209 | ) | (187 | ) |
Barrick Energy | | 58 | | 29 | | — | | 39 | | 14 | | — | | 31 | | 13 | | — | | (12 | ) | 2 | | — | |
| | $ | 8,136 | | $ | 7,613 | | $ | 6,014 | | $ | 3,961 | | $ | 3,960 | | $ | 3,185 | | $ | 1,021 | | $ | 938 | | $ | 970 | | $ | 3,154 | | $ | 2,715 | | $ | 1,859 | |
(1) | Segment expenses related to capital projects includes project development expense and losses from capital projects held through equity investees, see notes 7 and 12 for further details. |
Income Statement Information (cont’d)
| | Exploration(1) | | Regional business unit costs(1) | |
For the years ended December 31 | | 2009 | | 2008 | | 2007 | | 2009 | | 2008 | | 2007 | |
North America | | $ | 62 | | $ | 79 | | $ | 70 | | $ | 43 | | $ | 46 | | $ | 27 | |
South America | | 23 | | 40 | | 33 | | 32 | | 29 | | 23 | |
Australia Pacific | | 39 | | 44 | | 35 | | 50 | | 48 | | 38 | |
Africa | | 8 | | 18 | | 15 | | 32 | | 24 | | 11 | |
Barrick Energy | | — | | — | | — | | 6 | | 2 | | — | |
Other expenses outside reportable segments | | 9 | | 12 | | 8 | | — | | — | | — | |
Capital projects | | — | | 5 | | 7 | | — | | — | | — | |
| | $ | 141 | | $ | 198 | | $ | 168 | | $ | 163 | | $ | 149 | | $ | 99 | |
(1) | Exploration and regional business unit costs are excluded from the measure of segment income but are reported separately by operating segment to the Chief Operating Decision Maker. |
108
Geographic Information
| | Long-lived assets(1) | | Sales(2) | |
For the years ended December 31 | | 2009 | | 2008 | | 2007 | | 2009 | | 2008 | | 2007 | |
North America | | | | | | | | | | | | | |
United States | | $ | 5,118 | | $ | 4,587 | | $ | 2,637 | | $ | 2,552 | | $ | 2,501 | | $ | 1,882 | |
Canada | | 1,423 | | 1,017 | | 796 | | 228 | | 126 | | 119 | |
Dominican Republic | | 1,352 | | 446 | | 139 | | — | | — | | — | |
South America | | | | | | | | | | | | | |
Peru | | 293 | | 337 | | 392 | | 1,291 | | 1,367 | | 1,033 | |
Chile | | 3,063 | | 2,763 | | 2,485 | | 943 | | 1,007 | | 1,065 | |
Argentina | | 1,233 | | 1,123 | | 1,048 | | 540 | | 466 | | 273 | |
Australia Pacific | | | | | | | | | | | | | |
Australia | | 1,764 | | 1,707 | | 1,574 | | 1,306 | | 1,040 | | 932 | |
Papua New Guinea | | 682 | | 677 | | 702 | | 530 | | 539 | | 282 | |
Africa | | | | | | | | | | | | | |
Tanzania | | 1,725 | | 1,816 | | 1,336 | | 688 | | 538 | | 428 | |
Other | | 180 | | 179 | | 478 | | 58 | | 29 | | — | |
| | $ | 16,833 | | $ | 14,652 | | $ | 11,587 | | $ | 8,136 | | $ | 7,613 | | $ | 6,014 | |
(1) | Long-lived assets include property, plant and equipment, equity in investments, other investments, deferred income tax assets and other assets. |
(2) | Presented based on the location in which the sale originated. |
Reconciliation of Segment Income to Income from Continuing Operations Before Income Taxes and Other Items
For the years ended December 31 | | 2009 | | 2008 | | 2007 | |
Segment income | | $ | 3,154 | | $ | 2,715 | | $ | 1,859 | |
Amortization of corporate assets | | (52 | ) | (19 | ) | (20 | ) |
Exploration | | (141 | ) | (198 | ) | (168 | ) |
Other project expenses | | (24 | ) | (57 | ) | (15 | ) |
Elimination of gold sales contracts | | (5,933 | ) | — | | — | |
Corporate administration | | (171 | ) | (155 | ) | (155 | ) |
Other expense | | (343 | ) | (302 | ) | (200 | ) |
Impairment charges | | (277 | ) | (598 | ) | (42 | ) |
Interest income | | 10 | | 39 | | 141 | |
Interest expense | | (57 | ) | (21 | ) | (113 | ) |
Other income | | 112 | | 291 | | 110 | |
Write-down of investments | | (1 | ) | (205 | ) | (23 | ) |
Loss from capital projects held through equity investees | | 93 | | 69 | | 14 | |
Income (loss) from continuing operations before income taxes and other items | | $ | (3,630 | ) | $ | 1,559 | | $ | 1,388 | |
109
Asset Information
| | Segment | | | | Segment | |
| | long-lived assets | | Amortization | | capital expenditures(1) | |
For the years ended December 31 | | 2009 | | 2008 | | 2007 | | 2009 | | 2008 | | 2007 | | 2009 | | 2008 | | 2007 | |
Gold | | | | | | | | | | | | | | | | | | | |
North America | | $ | 5,883 | | $ | 5,063 | | $ | 3,370 | | $ | 361 | | $ | 350 | | $ | 314 | | $ | 553 | | $ | 434 | | $ | 227 | |
South America | | 1,198 | | 1,220 | | 1,220 | | 133 | | 165 | | 234 | | 161 | | 84 | | 158 | |
Australia Pacific | | 2,259 | | 2,213 | | 2,139 | | 274 | | 237 | | 216 | | 221 | | 207 | | 214 | |
Africa | | 1,713 | | 1,195 | | 1,031 | | 91 | | 62 | | 78 | | 126 | | 138 | | 118 | |
Copper | | | | | | | | | | | | | | | | | | | |
South America | | 1,239 | | 1,261 | | 1,271 | | 75 | | 66 | | 80 | | 37 | | 57 | | 27 | |
Capital projects | | 4,017 | | 3,295 | | 2,195 | | — | | — | | — | | 1,317 | | 919 | | 326 | |
Barrick Energy | | 501 | | 382 | | — | | 30 | | 13 | | — | | 31 | | 15 | | — | |
Segment total | | 16,810 | | 14,629 | | 11,226 | | 964 | | 893 | | 922 | | 2,446 | | 1,854 | | 1,070 | |
Cash and equivalents | | 2,564 | | 1,437 | | 2,207 | | — | | — | | — | | — | | — | | — | |
Other current assets | | 2,315 | | 2,642 | | 2,070 | | — | | — | | — | | — | | — | | — | |
Intangible assets | | 66 | | 74 | | 68 | | — | | — | | — | | — | | — | | — | |
Assets of discontinued operations | | 100 | | 76 | | 172 | | — | | — | | — | | — | | — | | — | |
Goodwill | | 5,197 | | 5,280 | | 5,847 | | — | | — | | — | | — | | — | | — | |
Other items not allocated to segments | | 23 | | 23 | | 361 | | 52 | | 19 | | 20 | | 21 | | 62 | | 8 | |
Enterprise total | | $ | 27,075 | | $ | 24,161 | | $ | 21,951 | | $ | 1,016 | | $ | 912 | | $ | 942 | | $ | 2,467 | | $ | 1,916 | | $ | 1,078 | |
(1) | Segment capital expenditures are presented for internal management reporting purposes on an accrual basis. Capital expenditures in the Consolidated Statements of Cash Flow are presented on a cash basis. In 2009, cash expenditures were $2,351 million (2008: $1,749 million; 2007: $1,035 million) and the increase in accrued expenditures was $116 million in 2009 (2008: $167 million increase; 2007: $43 million increase). |
5 · Revenues
For the years ended December 31 | | 2009 | | 2008 | | 2007 | |
Gold bullion sales(2) | | | | | | | |
Spot market sales | | $ | 6,991 | | $ | 6,455 | | $ | 3,771 | |
Gold sales contracts(6) | | — | | — | | 1,026 | |
| | 6,991 | | 6,455 | | 4,797 | |
Concentrate sales(3) | | 144 | | 122 | | 152 | |
| | $ | 7,135 | | $ | 6,577 | | $ | 4,949 | |
Copper sales(1),(4) | | | | | | | |
Copper cathode sales | | $ | 943 | | $ | 1,007 | | $ | 1,065 | |
| | $ | 943 | | $ | 1,007 | | $ | 1,065 | |
Oil and gas sales(5) | | $ | 58 | | $ | 29 | | $ | — | |
| | $ | 8,136 | | $ | 7,613 | | $ | 6,014 | |
(1) | Revenues include amounts transferred from OCI to earnings for commodity cash flow hedges (see notes 20e and 26). |
(2) | Gold sales include gains and losses on non-hedge derivative contracts: 2009: $56 million gain (2008: $19 million gain; 2007: $8 million loss). |
(3) | Concentrate sales include gains and losses on embedded derivatives in smelting contracts: 2009: $1 million gain (2008: $3 million loss; 2007: $4 million loss). |
(4) | Copper sales include gains and losses on economic copper hedges that do not qualify for hedge accounting treatment and non-hedge derivative contracts: 2009: $55 million loss (2008: $67 million gain; 2007: $48 million gain). |
(5) | Represents Barrick Energy. Refer to note 3g for further details. |
(6) | Represents the impact of deliveries into corporate gold sales contracts which were eliminated in second quarter 2007. |
Principal Products
All of our gold mining operations produce gold in doré form, except Bulyanhulu and Buzwagi which produce both gold doré and gold concentrate; and Osborne which produces a concentrate that contains both gold and copper. Gold doré is unrefined gold bullion bars usually consisting of 90% gold that is refined to pure gold bullion prior to sale to our customers. Gold concentrate is a processing product containing the valuable ore mineral (gold) from which most of the waste mineral has been eliminated, that undergoes a smelting process to convert it into gold bullion. Gold bullion is sold primarily in the London spot market. Gold concentrate is sold to third-party smelters. At our Zaldívar mine we produce copper cathode, which consists of 99.9% copper. Copper cathodes are sold directly under copper cathode sales contracts with various third-party buyers.
Revenue Recognition
We record revenue when the following conditions are met: persuasive evidence of an arrangement exists; delivery and transfer of title (gold revenue only) have occurred under the terms of the arrangement; the price is fixed or determinable; and collectability is reasonably assured. Revenue in 2009 is presented net of direct sales taxes of $30 million (2008: $23 million; 2007: $15 million).
110
Gold Bullion Sales
We record revenue from gold and silver bullion sales at the time of physical delivery, which is also the date that title to the gold or silver passes. The sales price is fixed at the delivery date based on either the terms of gold sales contracts or the gold spot price. Incidental revenues from the sale of by-products, primarily silver, are classified within cost of sales.
Concentrate Sales
Under the terms of concentrate sales contracts with independent smelting companies, gold and copper sales prices are provisionally set on a specified future date after shipment based on market prices. We record revenues under these contracts at the time of shipment, which is also when title passes to the smelting companies, using forward market gold and copper prices on the expected date that final sales prices will be fixed. Variations between the price recorded at the shipment date and the actual final price set under the smelting contracts are caused by changes in market gold and copper prices, and result in an embedded derivative in the accounts receivable. The embedded derivative is recorded at fair value each period until final settlement occurs, with changes in fair value classified as provisional price adjustments and included as a component of revenue.
Copper Cathode Sales
Under the terms of copper cathode sales contracts, copper sales prices are provisionally set on a specified future date based upon market commodity prices plus certain price adjustments. Revenue is recognized at the time of shipment when risk of loss passes to the customer, and collectability is reasonably assured. Revenue is provisionally measured using forward market prices on the expected date that final selling prices will be fixed. Variations occur between the price recorded on the date of revenue recognition and the actual final price under the terms of the contracts due to changes in market copper prices, which result in the existence of an embedded derivative in the accounts receivable. This embedded derivative is recorded at fair value each period until final settlement occurs, with changes in fair value classified as provisional price adjustments and included as a component of revenue.
Provisional Copper and Gold Sales
We had the following revenues before treatment and refining charges subject to final price adjustments:
At December 31 | | 2009 | | 2008 | |
Copper | | $ | 88 | | $ | 45 | |
Gold | | 8 | | 15 | |
| | | | | | | |
Final price adjustments recorded during the year:
For the years ended December 31 | | 2009 | | 2008 | | 2007 | |
Gain (loss) | | | | | | | |
Copper | | $ | 45 | | $ | (36 | ) | $ | (7 | ) |
Gold | | — | | — | | (1 | ) |
| | | | | | | | | | |
Oil and Gas Sales
Revenue from the sale of crude oil, natural gas and natural gas liquids is recorded at the time it enters the pipeline system, which is also when title transfers and there is reasonable assurance of collectability. At the time of delivery of oil and gas, prices are fixed and determinable based upon contracts referenced to monthly market commodity prices plus certain price adjustments. Price adjustments include product quality and transportation adjustments and market differentials.
6 · Cost of Sales
| | Gold | | Copper | | Oil & Gas | |
For the years ended December 31 | | 2009 | | 2008 | | 2007 | | 2009 | | 2008 | | 2007 | | 2009 | | 2008 | | 2007 | |
Cost of goods sold(1) | | $ | 3,230 | | $ | 3,211 | | $ | 2,678 | | $ | 362 | | $ | 315 | | $ | 232 | | $ | 29 | | $ | 8 | | $ | — | |
Unrealized (gains) losses on non-hedge contracts | | (7 | ) | 14 | | 5 | | — | | — | | — | | — | | — | | — | |
By-product revenues | | (73 | ) | (92 | ) | (104 | ) | (1 | ) | — | | — | | — | | — | | — | |
Royalty expense | | 218 | | 202 | | 158 | | — | | — | | — | | 10 | | 6 | | — | |
Mining production taxes | | 39 | | 42 | | 29 | | — | | — | | — | | — | | — | | — | |
| | $ | 3,407 | | $ | 3,377 | | $ | 2,766 | | $ | 361 | | $ | 315 | | $ | 232 | | $ | 39 | | $ | 14 | | $ | — | |
(1) | Cost of goods sold includes charges to reduce the cost of inventory to net realizable value as follows: $6 million for the year ended December 31, 2009 (2008: $62 million; 2007: $13 million). The cost of inventory sold in the period reflects all components capitalized to inventory, except that, for presentation purposes, the component of inventory cost relating to amortization of property, plant and equipment is classified in the income statement under “amortization”. Some companies present this amount under “cost of sales”. The amount presented in amortization rather than cost of sales was $964 million in the year ended December 31, 2009 (2008: $893 million; 2007: $922 million). |
111
Silver Sale Agreement
On September 22, 2009, we entered into an agreement with Silver Wheaton Corp. to sell the equivalent of 25% of the life-of-mine silver production from the Pascua-Lama project and 100% of silver production from the Lagunas Norte, Pierina and Veladero mines until project completion at Pascua-Lama. In return, we are entitled to an upfront cash payment of $625 million payable over three years from the date of the agreement, as well as ongoing payments in cash of the lesser of $3.90 (subject to an annual inflation adjustment of 1% starting three years after project completion at Pascua-Lama) and the prevailing market price for each ounce of silver delivered under the agreement.
In third quarter 2009, we received cash of $213 million which is recorded in other non-current liabilities on the Consolidated Balance Sheet. Providing that construction continues to progress at Pascua-Lama, we are entitled to receive additional cash payments totaling $412 million in aggregate over the next three anniversary dates of the agreement. An imputed interest expense is being recorded on the liability at the rate implicit in the agreement. The liability plus imputed interest will be amortized based on the difference between the effective contract price for silver and the amount of the ongoing cash payment per ounce of silver delivered under the agreement.
Royalties
Certain of our properties are subject to royalty arrangements based on mineral production at the properties. The primary type of royalty is a net smelter return (NSR) royalty. Under this type of royalty we pay the holder an amount calculated as the royalty percentage multiplied by the value of gold production at market gold prices less third-party smelting, refining and transportation costs. Other types of royalties include:
· Net profits interest (NPI) royalty,
· Modified Net smelter return (NSR) royalty,
· Net smelter return sliding scale (NSRSS) royalty,
· Gross proceeds sliding scale (GPSS) royalty,
· Gross smelter return (GSR) royalty,
· Net value (NV) royalty, and a
· Land tenement (LT) royalty.
Royalty expense is recorded at the time of sale of gold production.
Royalties applicable to our oil and gas properties include:
· Crown royalties,
· Net profits interest (NPI) royalty, and
· Overriding royalty (ORR).
Producing mines & | | |
development projects | | Type of royalty |
North America | | |
Goldstrike | | 0%–5% NSR, 0%–6% NPI |
Williams | | 1.5% NSR, 0.75% NV, 1% NV |
David Bell | | 3% NSR |
Round Mountain | | 3.53%–6.35% NSRSS |
Bald Mountain | | 3.5%–7% NSRSS |
| | 2.9%–4% NSR |
| | 10% NPI |
Ruby Hill | | 3% modified NSR |
Cortez | | 1.5% GSR |
Cortez – Pipeline/South Pipeline deposit | | 0.4%–9% GSR |
Cortez – portion of Pipeline/ South Pipeline deposit | | 5% NV |
South America | | |
Veladero | | 3.75% modified NSR |
Lagunas Norte | | 2.51% NSR |
Australia Pacific | | |
Porgera | | 2% NSR, 0.25% other |
Queensland & Western Australia production(1) | | 2.5%–2.7% of gold revenue |
Cowal | | 4% of net gold revenue |
Africa | | |
Bulyanhulu | | 3% NSR |
Tulawaka | | 3% NSR |
North Mara – Nyabirama and Nyabigena pit | | 3% NSR, 1% LT |
North Mara – Gokona pit | | 3% NSR, 1.1% LT |
Buzwagi | | 3% NSR, 30% NPI(2) |
Capital Projects | | |
Donlin Creek Project | | 1.5% NSR (first 5 years), 4.5% NSR (thereafter) |
Pascua-Lama Project – Chile gold production | | 1.5%–9.8% GPSS |
Pascua-Lama Project – Chile copper production | | 2% NSR |
Pascua-Lama Project – Argentina production | | 3% modified NSR |
Pueblo Viejo | | 3.2% NSR, 0–25% NPI |
Cerro Casale | | 3% NSR (capped at $3 million cumulative) |
Reko Diq | | 5% NSR |
Kabanga | | 3% NSR |
Other | | |
Barrick Energy | | 1.1% NPI |
| | 1.3% ORR |
| | 21.6% Crown royalty, net |
(1) | Includes the Kalgoorlie, Kanowna, Granny Smith, Plutonic, Darlot, Lawlers and Osborne mines. |
(2) | The NPI is calculated as a percentage of profits realized from the Buzwagi mine after all capital, exploration, and development costs and interest incurred in relation to the Buzwagi mine have been recouped and all operating costs relating to the Buzwagi mine have been paid. No amount is currently payable. |
112
7 · Exploration and Project Development Expense
For the years ended December 31 | | 2009 | | 2008 | | 2007 | |
Exploration: | | | | | | | |
Minesite exploration | | $ | 42 | | $ | 62 | | $ | 52 | |
Projects | | 99 | | 136 | | 116 | |
| | $ | 141 | | $ | 198 | | $ | 168 | |
Project development expense: | | | | | | | |
Pueblo Viejo(1) | | (3 | ) | 62 | | 67 | |
Donlin Creek(2) | | — | | — | | 32 | |
Sedibelo | | 8 | | 17 | | 22 | |
Fedorova | | 2 | | 24 | | 18 | |
Pascua-Lama | | 17 | | 21 | | 12 | |
Kainantu | | 10 | | 28 | | — | |
Pinson | | 2 | | 17 | | — | |
Other | | 25 | | 16 | | 22 | |
| | $ | 61 | | $ | 185 | | $ | 173 | |
Other projects(3) | | 24 | | 57 | | 15 | |
| | $ | 85 | | $ | 242 | | $ | 188 | |
(1) | In 2009, the costs above represent 100% of start-up costs and include a reimbursement of historical remediation expenditures. We record a non-controlling interest recovery for our partner’s share of expenditures within “non-controlling interests” in the income statement. |
(2) | Amounts for 2007 include a recovery of $64 million of cumulative project costs from our partner. 2008 and 2009 amounts are included in equity in investees. |
(3) | Includes corporate development, research and development, and other corporate projects. |
Accounting Policy for Exploration and Project Expenditures
Exploration Expenditures
Exploration expenditures relate to the initial search for deposits with economic potential, including costs incurred at both greenfield sites (sites where we do not have any mineral deposits that are already being mined or developed) and brownfield sites (sites that are adjacent to a mineral deposit that is classified within proven and probable reserves as defined by United States reporting standards and are already being mined or developed). Exploration expenditures relate to costs incurred to evaluate and assess deposits that have been identified as having economic potential, including exploratory drilling.
Expenditures on exploration activity conducted at greenfield sites are expensed as incurred. Exploratory drilling and related costs are capitalized when incurred at brownfield sites where the activities are directed at obtaining additional information on the ore body that is classified within proven and probable reserves or for the purpose of converting a mineral resource into a proven and probable reserve and, prior to the commencement of the drilling program, we can conclude that it is probable that such a conversion will take place. Our assessment of probability is based on the following factors: results from previous drill programs; results from geological models; results from a mine scoping study confirming economic viability of the resource; and preliminary estimates of mine inventory, ore grade, cash flow and mine life. Costs incurred at brownfield sites that meet the above criteria are capitalized as mine development costs. All other drilling and related exploration costs incurred at these sites are expensed as mine site exploration.
Project Expenditures
We capitalize the costs of activities at projects after mineralization is classified as proven and probable reserves. Before classifying mineralization as proven and probable reserves, the costs of project activities are expensed as incurred, except for costs incurred to construct tangible assets that are capitalized within property, plant and equipment. Project activities include: preparation of engineering scoping, prefeasibility and feasibility studies; metallurgical testing; permitting; and sample mining. The costs of start-up activities at mines and projects such as recruiting and training are also expensed as incurred within project expense.
The Donlin Creek, Sedibelo, Kabanga, Cerro Casale and Fedorova projects are in various stages; however, none of these projects had met the criteria for cost capitalization at December 31, 2009. The Reko Diq project is owned through an equity investee and project expenses are included in “equity investees” in the Consolidated Income Statement (see note 12). Effective January 1, 2009, we determined that mineralization of Pueblo Viejo met the definition of proven and probable reserves for United States reporting purposes. Effective May 1, 2007, we determined that mineralization at Buzwagi met the definition of proven and probable reserves for United States reporting purposes. Following these determinations, we began capitalizing the cost of project activities at Pueblo Viejo and Buzwagi.
113
8 · Other Charges
a) Other Expense
For the years ended December 31 | | 2009 | | 2008 | | 2007 | |
Regional business unit costs(1) | | $ | 163 | | $ | 149 | | $ | 99 | |
Community development costs(2) | | 14 | | 21 | | 28 | |
Environmental costs | | 13 | | 7 | | 15 | |
World Gold Council fees | | 14 | | 11 | | 12 | |
Changes in estimate of AROs at closed mines | | 8 | | 9 | | 6 | |
Non-hedge derivative losses | | 1 | | 17 | | 8 | |
Currency translation losses (gains)(3) | | 8 | | 37 | | (4 | ) |
Pension and other post-retirement benefit expense (notes 29b and 29e) | | 9 | | 5 | | 5 | |
Severance and other restructuring costs(4) | | 41 | | 1 | | 6 | |
Other items | | 72 | | 45 | | 25 | |
| | $ | 343 | | $ | 302 | | $ | 200 | |
(1) | Relates to costs incurred at regional business unit offices. |
(2) | Amounts mainly related to community programs and other related expenses in Peru. |
(3) | In 2009 and 2008, amounts primarily relate to translation losses on working capital balances in Australia and South America. |
(4) | Includes $21 million in restructuring costs related to an organizational review, and other termination and restructuring costs. |
Environmental Costs
During the production phases of a mine, we incur and expense the cost of various activities connected with environmental aspects of normal operations, including compliance with and monitoring of environmental regulations; disposal of hazardous waste produced from normal operations; and operation of equipment designed to reduce or eliminate environmental effects. In limited circumstances, costs to acquire and install plant and equipment are capitalized during the production phase of a mine if the costs are expected to mitigate risk or prevent future environmental contamination from normal operations.
When a contingent loss arises from the improper use of an asset, a loss accrual is recorded if the loss is probable and reasonably estimable. Amounts recorded are adjusted as further information develops or if circumstances change. Recoveries of environmental remediation costs from other parties are recorded as assets when receipt is deemed probable.
b) Impairment Charges
For the years ended December 31 | | 2009 | | 2008 | | 2007 | |
Impairment of goodwill (note 17)(1) | | $ | 63 | | $ | 584 | | $ | 42 | |
Impairment of long-lived assets(2) | | 214 | | 14 | | — | |
| | $ | 277 | | $ | 598 | | $ | 42 | |
Write-down of investments(3) (note 12) | | 1 | | 205 | | 23 | |
| | $ | 278 | | $ | 803 | | $ | 65 | |
(1) | In 2009, we recorded an impairment charge of $63 million for Plutonic. 2008 does not include impairment charges for Osborne ($64 million) and Henty ($30 million), which are reflected in the results of discontinued operations. |
(2) | In 2009, impairment charges of $43 million and $158 million were recorded to reduce the carrying amount of long-lived assets to the estimated fair value for Plutonic and Sedibelo, respectively. In 2008, impairment charges primarily relate to $12 million recorded to reduce the carrying amount of long-lived assets at Marigold to their estimated fair value. |
(3) | In 2008, we recorded impairment charges on our investment in Highland Gold ($140 million), on Asset-Backed Commercial Paper ($39 million) and various other investments in junior gold mining companies ($26 million). In 2007, impairment charges primarily relate to an impairment charge on Asset-Backed Commercial Paper of $20 million. |
c) Other Income
For the years ended December 31 | | 2009 | | 2008 | | 2007 | |
Gains on sale of assets(1) | | $ | 13 | | $ | 187 | | $ | 2 | |
Gain on acquisition of assets(2) | | 72 | | — | | — | |
Gains on sale of investments(3) (note 12) | | 6 | | 59 | | 71 | |
Royalty income | | 5 | | 25 | | 17 | |
Sale of water rights | | 4 | | 4 | | 5 | |
Other | | 12 | | 16 | | 15 | |
| | $ | 112 | | $ | 291 | | $ | 110 | |
(1) | In 2008, we recorded a gain of $167 million on the disposition of royalties to Royal Gold and a gain of $9 million on the sale of Doyon royalty. |
(2) | In 2009, we recorded a gain of $72 million on the acquisition of the remaining 50% interest in Hemlo. Refer to note 3f for further details. |
(3) | In 2008, we recorded a gain of $12 million on the sale of our investment in QGX Ltd. We also sold Asset-Backed Commercial Paper for cash proceeds of $49 million and recorded a gain on sale of $42 million. In 2007, we recorded a gain of $71 million related primarily to the sale of our investment in Gold Fields and Nova Gold. |
114
9 · Income Tax Expense
For the years ended December 31 | | 2009 | | 2008 | | 2007 | |
Current | | | | | | | |
Canada | | $ | (21 | ) | $ | 22 | | $ | (3 | ) |
International | | 562 | | 613 | | 518 | |
| | $ | 541 | | $ | 635 | | $ | 515 | |
Deferred | | | | | | | |
Canada | | $ | (11 | ) | $ | 3 | | $ | 19 | |
International | | 210 | | (146 | ) | (25 | ) |
| | $ | 199 | | $ | (143 | ) | $ | (6 | ) |
Income tax expense before elements below | | $ | 740 | | $ | 492 | | $ | 509 | |
Net currency translation (gains) losses on deferred tax balances | | (40 | ) | 98 | | (76 | ) |
Canadian functional currency election | | (70 | ) | — | | — | |
Canadian tax rate changes | | 59 | | — | | 64 | |
Release of end of year valuation allowances – Tanzania | | — | | — | | (156 | ) |
Total expense | | $ | 689 | | $ | 590 | | $ | 341 | |
Deferred income tax (expense) recovery – discontinued operations | | (41 | ) | 4 | | (28 | ) |
Income tax expense – continuing operations | | $ | 648 | | $ | 594 | | $ | 313 | |
Currency Translation
Deferred tax balances are subject to remeasurement for changes in currency exchange rates each period. The most significant balances are Canadian deferred tax liabilities with a carrying amount of approximately $30 million, Argentinean deferred tax liabilities with a carrying amount of approximately $32 million, and Australian and Papua New Guinea net deferred tax liabilities with a carrying amount of approximately $105 million. In 2009 and 2007, the appreciation of the Canadian and Australian dollar against the US dollar, and the weakening of the Argentine peso against the US dollar resulted in net translation gains totaling $40 million and $76 million, respectively. These gains are included within deferred tax expense/recovery.
Canadian Functional Currency Election
In fourth quarter 2008, we filed an election under Canadian draft legislation to prepare some of our Canadian tax returns using US dollar functional currency effective January 1, 2008. The legislation was enacted in first quarter 2009 which resulted in a one-time deferred tax benefit of $70 million.
Canadian Tax Rate Changes
In the fourth quarter of 2009, a provincial rate change was enacted in Canada that lowered the applicable tax rate. The impact of this tax rate change was to reduce net deferred tax assets in Canada by $59 million, recorded as a component of deferred tax expense.
In 2007, federal rate changes were enacted in Canada that lowered the applicable tax rate. The impact of these tax rate changes was to reduce net deferred tax assets in Canada by $64 million and was recorded as a component of deferred income tax expense.
Release of Tanzanian Valuation Allowances
In 2007, we released $156 million of end of year deferred tax valuation allowances in Tanzania due to the impact of higher market gold prices.
Reconciliation to Canadian Statutory Rate
For the years ended December 31 | | 2009 | | 2008 | | 2007 | |
At 33% (2008: 33.50%; 2007: 36.12%) statutory rate | | $ | (1,198 | ) | $ | 522 | | $ | 501 | |
Increase (decrease) due to: | | | | | | | |
Allowances and special tax deductions(1) | | (110 | ) | (100 | ) | (99 | ) |
Impact of foreign tax rates(2) | | 1,786 | | (86 | ) | 44 | |
Expenses not tax deductible | | 16 | | 13 | | 48 | |
Impairment charges not tax deductible | | 21 | | 199 | | 15 | |
Gain on acquisition of assets not taxable | | (18 | ) | — | | — | |
Net currency translation (gains)/losses on deferred tax balances | | (40 | ) | 98 | | (76 | ) |
Canadian functional currency election | | (70 | ) | — | | — | |
Release of end of year valuation allowances — Tanzania | | — | | — | | (156 | ) |
Release of valuation allowances — Other | | — | | (175 | ) | (88 | ) |
Valuation allowances set up against current year tax losses | | 163 | | 74 | | 5 | |
Canadian tax rate changes | | 59 | | — | | 64 | |
Withholding taxes | | 16 | | 21 | | 17 | |
Mining taxes | | 21 | | 19 | | 19 | |
Other items | | 2 | | 9 | | 19 | |
Income tax expense | | $ | 648 | | $ | 594 | | $ | 313 | |
(1) | We are able to claim certain allowances and tax deductions unique to extractive industries that result in a lower effective tax rate. |
(2) | We operate in multiple foreign tax jurisdictions that have tax rates different than the Canadian statutory rate. Additionally, we have reinvested earnings and cash flow generated by the Zaldívar mine in Chile to fund a portion of the construction cost of Pascua-Lama. The reinvestment of these earnings and cash flow resulted in a lower tax rate applied for the period. Amounts in 2009 include the impact of the elimination of gold sales contracts in a low tax jurisdiction. Amounts in 2007 included the impact of losses realized on deliveries into corporate gold sales contracts in a low tax jurisdiction. |
115
10 · Earnings (loss) per share
For the years ended December 31 | | | | | | | | | | | | | |
($ millions, except shares in millions | | 2009 | | 2008 | | 2007 | |
and per share amounts in dollars) | | Basic | | Diluted | | Basic | | Diluted | | Basic | | Diluted | |
Income (loss) from continuing operations | | $ | (4,371 | ) | $ | (4,371 | ) | $ | 889 | | $ | 889 | | $ | 1,046 | | $ | 1,046 | |
Plus: interest on convertible debentures | | — | | — | | — | | 3 | | — | | 2 | |
Income (loss) available to common shareholders and after assumed conversions | | (4,371 | ) | (4,371 | ) | 889 | | 892 | | 1,046 | | 1,048 | |
Income (loss) from discontinued operations | | 97 | | 97 | | (104 | ) | (104 | ) | 73 | | 73 | |
Net income (loss) | | $ | (4,274 | ) | $ | (4,274 | ) | $ | 785 | | $ | 788 | | $ | 1,119 | | $ | 1,121 | |
Weighted average shares outstanding | | 903 | | 903 | | 872 | | 872 | | 867 | | 867 | |
Effect of dilutive securities | | | | | | | | | | | | | |
Stock options | | — | | — | (1) | — | | 4 | | — | | 3 | |
Convertible debentures | | — | | — | (1) | — | | 9 | | — | | 9 | |
| | 903 | | 903 | | 872 | | 885 | | 867 | | 879 | |
Earnings (loss) per share | | | | | | | | | | | | | |
Income (loss) from continuing operations | | $ | (4.84 | ) | $ | (4.84 | ) | $ | 1.02 | | $ | 1.01 | | $ | 1.21 | | $ | 1.19 | |
Net income (loss) | | $ | (4.73 | ) | $ | (4.73 | ) | $ | 0.90 | | $ | 0.89 | | $ | 1.29 | | $ | 1.28 | |
(1) | The impact of any additional securities issued under our stock option plan or as a result of conversion of convertible debentures would be anti-dilutive as a result of the net loss position. Consequently, diluted earnings per share would be computed in the same manner as basic earnings per share. |
Earnings per share is computed by dividing net income available to common shareholders by the weighted average number of common shares outstanding for the period. Diluted earnings per share reflect the potential dilution that could occur if additional common shares are assumed to be issued under securities that entitle their holders to obtain common shares in the future. For stock options, the number of additional shares for inclusion in diluted earnings per share calculations is determined using the treasury stock method. Under this method, stock options, whose exercise price is less than the average market price of our common shares, are assumed to be exercised and the proceeds are used to repurchase common shares at the average market price for the period. The incremental number of common shares issued under stock options and repurchased from proceeds is included in the calculation of diluted earnings per share. For convertible debentures, the number of additional shares for inclusion in diluted earnings per share calculations is determined using the as if converted method. The incremental number of common shares issued is included in the number of weighted average shares outstanding and interest on the convertible debentures is excluded from the calculation of income.
116
11 · Cash Flow — Other Items
a) Operating Cash Flows — Other Items
For the years ended December 31 | | 2009 | | 2008 | | 2007 | |
Adjustments for non-cash income statement items: | | | | | | | |
Currency translation (gains) losses (note 8a) | | $ | 8 | | $ | 37 | | $ | (4 | ) |
Amortization of premium on debt securities (note 20b) | | (6 | ) | (7 | ) | (3 | ) |
Amortization of debt issue costs (note 20b) | | 6 | | 7 | | 9 | |
Stock option expense (note 28a) | | 27 | | 25 | | 25 | |
Loss from equity in investees (note 12) | | 87 | | 64 | | 43 | |
Gain on sale of investments (note 8c) | | (6 | ) | (59 | ) | (71 | ) |
Losses on write-down of inventory (note 13) | | 6 | | 62 | | 13 | |
Non-controlling interests (notes 2b and 27) | | 6 | | 12 | | (14 | ) |
Net change in operating assets and liabilities, excluding inventory | | 75 | | 7 | | 161 | |
Revisions to AROs at closed mines and Barrick Energy (note 22) | | 10 | | 9 | | 6 | |
Settlement of AROs (note 22) | | (39 | ) | (38 | ) | (33 | ) |
Amortization of hedge gains/losses on acquired gold hedge position | | (10 | ) | (2 | ) | 32 | |
Other net operating activities | | $ | 164 | | $ | 117 | | $ | 164 | |
Operating cash flow includes payments for: | | | | | | | |
Pension plan contributions (note 29a) | | $ | 50 | | $ | 47 | | $ | 49 | |
Cash interest paid (note 20b) | | $ | 311 | | $ | 213 | | $ | 236 | |
b) Investing Cash Flows — Other Items
For the years ended December 31 | | 2009 | | 2008 | | 2007 | |
Loans to joint venture partners | | $ | — | | $ | (4 | ) | $ | (47 | ) |
Purchase of land and water rights | | — | | (16 | ) | — | |
Purchases of royalties | | — | | (42 | ) | — | |
Funding for equity investees (note 12a) | | (80 | ) | (107 | ) | — | |
Long-term supply contract | | — | | (35 | ) | — | |
Reclassification of asset-backed commercial paper | | — | | — | | (66 | ) |
Other | | (7 | ) | (27 | ) | (14 | ) |
Other net investing activities | | $ | (87 | ) | $ | (231 | ) | $ | (127 | ) |
c) Financing Cash Flows — Other Items
For the years ended December 31 | | 2009 | | 2008 | | 2007 | |
Financing fees on long-term debt (note 18) | | $ | (16 | ) | $ | (11 | ) | $ | — | |
Derivative settlements (note 20e) | | (10 | ) | (23 | ) | (197 | ) |
Other net financing activities | | $ | (26 | ) | $ | (34 | ) | $ | (197 | ) |
117
12 · Equity in Investees and Other Investments
a) Equity Method Investment Continuity
| | Highland | | Atacama(1) | | Cerro Casale | | Donlin Creek | | Other(2) | | Total | |
At January 1, 2007 | | $ | 199 | | $ | 124 | | $ | — | | $ | — | | $ | 5 | | $ | 328 | |
Acquired under Arizona Star acquisition | | — | | — | | 732 | | — | | — | | 732 | |
Reclassifications | | — | | — | | — | | 64 | | (4 | ) | 60 | |
Equity pick-up gain (loss) | | (30 | ) | (14 | ) | — | | — | | 1 | | (43 | ) |
Capitalized interest | | — | | 8 | | 2 | | — | | — | | 10 | |
Impairment charges | | — | | — | | — | | — | | (2 | ) | (2 | ) |
At January 1, 2008 | | 169 | | 118 | | 734 | | 64 | | — | | 1,085 | |
Purchases | | 1 | | — | | 41 | | — | | — | | 42 | |
Funding | | — | | 62 | | 9 | | 27 | | 9 | | 107 | |
Equity pick-up gain (loss) | | 5 | | (32 | ) | (11 | ) | (17 | ) | (9 | ) | (64 | ) |
Capitalized interest | | — | | 9 | | 42 | | 4 | | — | | 55 | |
Impairment charges | | (140 | ) | — | | — | | — | | — | | (140 | ) |
At January 1, 2009 | | 35 | | 157 | | 815 | | 78 | | — | | 1,085 | |
Funding | | — | | 31 | | 21 | | 11 | | 17 | | 80 | |
Equity pick-up gain (loss) | | 6 | | (39 | ) | (21 | ) | (18 | ) | (15 | ) | (87 | ) |
Capitalized interest | | — | | 8 | | 46 | | 4 | | — | | 58 | |
At December 31, 2009 | | $ | 41 | | $ | 157 | | $ | 861 | | $ | 75 | | $ | 2 | | $ | 1,136 | |
Publicly traded | | Yes | | No | | No | | No | | | | | |
(1) | Represents our investment in Reko Diq. |
(2) | Represents our investment in Kabanga. |
Accounting Policy for Equity Method Investments
Under the equity method, we record our equity share of the income or loss of equity investees each period. On acquisition of an equity investment, the underlying identifiable assets and liabilities of an equity investee are recorded at fair value and the income or loss of equity investees is based on these fair values. For an investment in a company that represents a business, if the cost of any equity investment exceeds the total amount of the fair value of identifiable assets and liabilities, any excess is accounted for in a manner similar to goodwill, with the exception that an annual goodwill impairment test is not required. Additional funding into an investee is recorded as an increase in the carrying value of the investment. The carrying amount of each investment in a publicly traded equity investee is evaluated for impairment using the same method as an available-for-sale security.
Our investments in non-publicly traded equity investees are exploration and development projects; therefore, we assess if there has been a potential impairment triggering event for an other-than-temporary impairment by: testing the underlying assets of the equity investee for recoverability; and assessing if there has been a change in the mining plan or strategy for the project. If we determine underlying assets are recoverable and no other potential impairment conditions were identified, then our investment in the non-publicly traded equity investee is carried at cost. If the other underlying assets are not recoverable, we record an impairment charge equal to the difference between the carrying amount of the investee and its fair value. Where reliable information is available, we determine fair value based on the present value if cash flows are expected to be generated by the investee. Where reliable cash flow information is not available, we determine fair value using a market approach.
Highland Gold Mining Ltd. (“Highland”)
In 2008, we recorded an impairment charge of $140 million against the carrying value at December 31, 2008 of Highland following an other-than-temporary decline in the market value of its publicly traded shares.
Compañía Minera Casale (“Cerro Casale”)
During 2008, we completed our acquisition of Arizona Star for $732 million. Arizona Star has an interest in the entity that holds the Cerro Casale deposit. We determined that we share joint control with Kinross and that Cerro Casale is a VIE. Neither party is the primary beneficiary as we jointly share in the expected earnings or losses of the project. We use the equity method of accounting for Arizona Star’s investment in Cerro Casale. Our maximum exposure to loss in this entity is limited to our investment in Cerro Casale, which totaled $861 million as of December 31, 2009.
118
b) Other Investments
At December 31 | | | | | | 2009 | | 2008 | |
Available-for-sale securities | | | | | | $ | 61 | | $ | 31 | |
Other investments | | | | | | 31 | | 29 | |
| | | | | | $ | 92 | | $ | 60 | |
| | 2009 | | 2008 | |
| | | | Gains | | | | Gains | |
| | Fair | | (losses) | | Fair | | (losses) | |
At December 31 | | value(1) | | in OCI | | value | | in OCI | |
Available-for-sale securities | | | | | | | | | |
Securities in an unrealized gain position | | | | | | | | | |
Equity securities | | $ | 54 | | $ | 27 | | $ | 15 | | $ | 3 | |
| | 54 | | 27 | | 15 | | 3 | |
Securities in an unrealized gain (loss) position | | | | | | | | | |
Benefit plans(2) | | | | | | | | | |
Fixed-income | | $ | 1 | | $ | — | | $ | 2 | | $ | — | |
Equity | | 5 | | — | | 7 | | (3 | ) |
Other equity securities(3) | | 1 | | — | | 7 | | (2 | ) |
| | 7 | | — | | 16 | | (5 | ) |
| | 61 | | 27 | | 31 | | (2 | ) |
Other investments | | | | | | | | | |
Long-term loan receivable from Yokohama Rubber Co. Ltd.(4) | | 31 | | n/a | | 29 | | n/a | |
| | $ | 92 | | $ | 27 | | $ | 60 | | $ | (2 | ) |
(1) | Refer to note 21 for further information on the measurement of fair value. |
(2) | Under various benefit plans for certain former Homestake executives, a portfolio of marketable fixed-income and equity securities are held in a rabbi trust that is used to fund obligations under the plans. |
(3) | Other equity securities in a loss position consist of investments in various junior mining companies. |
(4) | The long-term loan receivable is measured at amortized cost. |
Gains on Investments Recorded in Earnings
| | 2009 | | 2008 | | 2007 | |
Gains realized on sales | | $ | 6 | | $ | 59 | | $ | 71 | |
Cash proceeds from sales | | $ | 7 | | $ | 76 | | $ | 625 | |
Accounting Policy for Available-for-Sale Securities
Available-for-sale securities are recorded at fair value with unrealized gains and losses recorded in other comprehensive income (“OCI”). Realized gains and losses are recorded in earnings when investments mature or on sale, calculated using the average cost of securities sold. If the fair value of an investment declines below its carrying amount, we undertake an assessment of whether the impairment is other than temporary. We consider all relevant facts and circumstances in this assessment, particularly: the length of time and extent to which fair value has been less than the carrying amount; the financial condition and near-term prospects of the investee, including any specific events that have impacted its fair value; both positive and negative evidence that the carrying amount is recoverable within a reasonable period of time; and our ability and intent to hold the investment for a reasonable period of time sufficient for an expected recovery of the fair value up to or beyond the carrying amount. We record in earnings any unrealized declines in fair value judged to be other than temporary.
Asset-Backed Commercial Paper (“ABCP”)
In 2007, we recorded impairment charges of $20 million, resulting in a carrying value of $46 million at the end of 2007. An additional $39 million impairment charge was recorded in 2008, resulting in cumulative impairments totaling $59 million and a carrying value of $7 million. Subsequently, we reached an agreement with a third party to sell $66 million of our Asset Backed Commercial Paper (“ABCP”). We received $49 million in proceeds from this sale resulting in a recovery of $42 million which was recorded in Other income.
119
13 · Inventories
| | Gold | | Copper | |
At December 31 | | 2009 | | 2008 | | 2009 | | 2008 | |
Raw materials | | | | | | | | | |
Ore in stockpiles | | $ | 1,052 | | $ | 825 | | $ | 77 | | $ | 41 | |
Ore on leach pads | | 215 | | 161 | | 172 | | 189 | |
Mine operating supplies | | 488 | | 432 | | 19 | | 27 | |
Work in process | | 215 | | 187 | | 5 | | 5 | |
Finished products | | | | | | | | | |
Gold doré | | 69 | | 65 | | — | | — | |
Copper cathode | | — | | — | | 4 | | 13 | |
Gold concentrate | | 20 | | 21 | | — | | — | |
| | 2,059 | | 1,691 | | 277 | | 275 | |
Non-current ore in stockpiles(1) | | (679 | ) | (595 | ) | (117 | ) | (93 | ) |
| | $ | 1,380 | | $ | 1,096 | | $ | 160 | | $ | 182 | |
(1) Ore that we do not expect to process in the next 12 months is classified within other assets.
Accounting Policy for Inventory
Material extracted from our mines is classified as either ore or waste. Ore represents material that, at the time of extraction, we expect to process into a saleable form, and sell at a profit. Ore is recorded as an asset that is classified within inventory as material is extracted from the open pit or underground mine. Ore is accumulated in stockpiles that are subsequently processed into gold/copper in a saleable form under a mine plan that takes into consideration optimal scheduling of production of our reserves, present plant capacity, and the market price of gold/copper. Gold/copper work in process represents gold/copper in the processing circuit that we count as production but is not yet in a saleable form.
Gold and copper ore contained in stockpiles is measured by estimating the number of tons added and removed from the stockpile, and the associated estimate of gold and copper contained therein (based on assay data) and applying estimated metallurgical recovery rates (based on the expected processing method). Stockpile ore tonnages are verified by periodic surveys. Costs are allocated to ore stockpiles based on quantities of material stockpiled using current mining costs incurred up to the point of stockpiling the ore and including allocations of waste mining costs, overheads, depreciation, depletion and amortization relating to mining operations. As ore is processed, costs are removed based on recoverable quantities of gold and/or copper and each stockpile’s average cost per unit. Ore stockpiles are reduced by provisions required to reduce inventory to net realizable value.
We record gold in process, gold doré and gold in concentrate form at average cost, less provisions required to reduce inventory to market value. Average cost is calculated based on the cost of inventory at the beginning of a period, plus the cost of inventory produced in a period. Costs capitalized to in process and finished goods inventory include the cost of stockpiles processed; direct and indirect materials and consumables; direct labor; repairs and maintenance; utilities; amortization of property, plant and equipment; and local mine administrative expenses. Costs are removed from inventory and recorded in cost of sales and amortization expense based on the average cost per ounce of gold in inventory. Mine operating supplies are recorded at the lower of purchase cost and market value.
We record provisions to reduce inventory to net realizable value, to reflect changes in economic factors that impact inventory value or to reflect present intentions for the use of slow moving and obsolete supplies inventory.
For the years ended December 31 | | 2009 | | 2008 | | 2007 | |
Inventory impairment charges | | $ | 6 | | $ | 62 | | $ | 13 | |
| | | | | | | | | | |
Ore on leach pads
The recovery of gold and copper from certain oxide ores is achieved through the heap leaching process. Our Pierina, Lagunas Norte, Veladero, Cortez, Bald Mountain, Round Mountain, Ruby Hill and Marigold mines all use a heap leaching process for gold and our Zaldívar mine uses a heap leaching process for copper. Under this method, ore is placed on leach pads where it is treated with a chemical solution, which dissolves the gold or copper contained in the ore. The resulting “pregnant” solution is further processed in a plant where the gold or copper is recovered. For accounting purposes, costs are added to ore on leach pads based on current mining and leaching costs, including applicable depreciation, depletion and amortization relating to mining operations. Costs are removed from ore on leach pads as ounces or pounds are recovered based on the average cost per recoverable ounce of gold or pound of copper on the leach pad.
Estimates of recoverable gold or copper on the leach pads are calculated from the quantities of ore placed on the leach pads (measured tons added to the leach pads), the grade of ore placed on the leach pads (based on assay data) and a recovery percentage (based on ore type).
120
Although the quantities of recoverable gold or copper placed on the leach pads are reconciled by comparing the grades of ore placed on pads to the quantities of gold or copper actually recovered (metallurgical balancing), the nature of the leaching process inherently limits the ability to precisely monitor inventory levels. As a result, the metallurgical balancing process is regularly monitored and estimates are refined based on actual results over time. Historically, our operating results have not been materially impacted by variations between the estimated and actual recoverable quantities of gold or copper on our leach pads. At December 31, 2009, the weighted average cost per recoverable ounce of gold and recoverable pound of copper on leach pads was $383 per ounce and $1.01 per pound, respectively (2008: $439 per ounce of gold and $1.07 per pound of copper). Variations between actual and estimated quantities resulting from changes in assumptions and estimates that do not result in write-downs to net realizable value are accounted for on a prospective basis.
The ultimate recovery of gold or copper from a leach pad will not be known until the leaching process is concluded. Based on current mine plans, we expect to place the last ton of ore on our current leach pads at dates for gold ranging from 2010 to 2027 and for copper ranging from 2010 to 2024. Including the estimated time required for residual leaching, rinsing and reclamation activities, we expect that our leaching operations will terminate within a period of up to six years following the date that the last ton of ore is placed on the leach pad.
The current portion of ore inventory on leach pads is determined based on estimates of the quantities of gold or copper at each balance sheet date that we expect to recover during the next 12 months.
Ore in Stockpiles
At December 31 | | 2009 | | 2008 | | Year(1) | |
Gold | | | | | | | |
Goldstrike | | | | | | | |
Ore that requires roasting | | $ | 452 | | $ | 375 | | 2035 | |
Ore that requires autoclaving | | 46 | | 47 | | 2011 | |
Kalgoorlie | | 80 | | 74 | | 2021 | |
Porgera | | 117 | | 113 | | 2023 | |
Cowal | | 88 | | 70 | | 2019 | |
Veladero | | 26 | | 24 | | 2024 | |
Cortez | | 98 | | 54 | | 2032 | |
Turquoise Ridge | | 15 | | 12 | | 2035 | |
Other | | 130 | | 56 | | | |
Copper | | | | | | | |
Zaldívar | | 77 | | 41 | | 2024 | |
| | $ | 1,129 | | $ | 866 | | | |
(1) Year in which we expect to fully process the ore in stockpiles.
Ore on Leachpads
At December 31 | | 2009 | | 2008 | | Year(1) | |
Gold | | | | | | | |
Veladero | | $ | 75 | | $ | 30 | | 2024 | |
Cortez | | 25 | | 50 | | 2021 | |
Ruby Hill | | 24 | | 13 | | 2015 | |
Bald Mountain | | 24 | | 20 | | 2027 | |
Lagunas Norte | | 22 | | 14 | | 2024 | |
Round Mountain | | 18 | | 10 | | 2013 | |
Pierina | | 14 | | 16 | | 2024 | |
Marigold | | 13 | | 8 | | 2011 | |
Copper | | | | | | | |
Zaldívar | | 172 | | 189 | | 2024 | |
| | $ | 387 | | $ | 350 | | | |
(1) Year in which we expect to complete full processing of the ore on leachpads.
Purchase Commitments
At December 31, 2009, we had purchase obligations for supplies and consumables of approximately $1,207 million.
14 · Accounts Receivable and Other Current Assets
At December 31 | | 2009 | | 2008 | |
Accounts receivable | | | | | |
Amounts due from concentrate sales | | $ | 9 | | $ | 8 | |
Amounts due from copper cathode sales | | 109 | | 42 | |
Other receivables | | 133 | | 147 | |
| | $ | 251 | | $ | 197 | |
Other current assets | | | | | |
Derivative assets (note 20e) | | $ | 214 | | $ | 817 | |
Goods and services taxes recoverable(1) | | 201 | | 153 | |
Restricted cash | | — | | 113 | |
Deferred share-based compensation (note 28b) | | 7 | | — | |
Prepaid expenses | | 92 | | 45 | |
Other | | 10 | | 39 | |
| | $ | 524 | | $ | 1,167 | |
(1) | 2009 includes $111 million and $50 million in VAT and fuel tax receivables in South America and Africa, respectively (2008: $108 million and nil, respectively). |
121
15 · Property, Plant and Equipment
| | | | | | Exploration | | | | | |
| | Assets | | | | properties, | | | | | |
| | subject to | | Accumulated | | capital projects | | Construction | | | |
| | amortization(1),(2) | | amortization | | & VBPP | | in progress(3) | | Total | |
At January 1, 2007 | | $ | 12,956 | | $ | (6,676 | ) | $ | 1,511 | | $ | 397 | | $ | 8,188 | |
Additions | | 758 | | 20 | | 84 | | — | | 862 | |
Acquisitions | | 145 | | — | | 135 | | — | | 280 | |
Capitalized interest(6) | | 16 | | — | | 97 | | — | | 113 | |
Amortization | | — | | (942 | ) | — | | — | | (942 | ) |
Reclassification(4) | | — | | — | | (66 | ) | — | | (66 | ) |
Transfers between categories(5) | | 198 | | — | | (198 | ) | — | | — | |
At January 1, 2008 | | $ | 14,073 | | $ | (7,598 | ) | $ | 1,563 | | $ | 397 | | $ | 8,435 | |
Additions | | 584 | | (155 | ) | 756 | | 626 | | 1,811 | |
Acquisitions | | 1,609 | | — | | 409 | | — | | 2,018 | |
Capitalized interest(6) | | 57 | | — | | 110 | | — | | 167 | |
Amortization | | — | | (912 | ) | — | | — | | (912 | ) |
Impairments | | (14 | ) | — | | — | | — | | (14 | ) |
Transfers between categories(5) | | 481 | | — | | (209 | ) | (272 | ) | — | |
At January 1, 2009 | | $ | 16,790 | | $ | (8,665 | ) | $ | 2,629 | | $ | 751 | | $ | 11,505 | |
Additions | | 445 | | 21 | | 1,210 | | 608 | | 2,284 | |
Acquisitions | | 276 | | — | | — | | — | | 276 | |
Capitalized interest(6) | | 71 | | — | | 140 | | — | | 211 | |
Amortization | | — | | (1,033 | ) | — | | — | | (1,033 | ) |
Impairments | | (56 | ) | — | | (122 | ) | — | | (178 | ) |
Currency translation adjustment | | 60 | | — | | — | | — | | 60 | |
Transfers between categories(5) | | 1,121 | | — | | (699 | ) | (422 | ) | — | |
At December 31, 2009 | | $ | 18,707 | | $ | (9,677 | ) | $ | 3,158 | | $ | 937 | | $ | 13,125 | |
(1) | Represents capitalized reserve acquisition and development costs and buildings, plant and equipment. |
(2) | Includes assets under capital leases, leach pads and tailings dams. |
(3) | Includes construction in process for tangible assets at capital projects and operating mines, as well as deposits on long lead capital items. Once an asset is available for use, it is transferred to assets subject to amortization and amortized over its estimated useful life. |
(4) | Represents the reclassification of Donlin Creek to equity investments. |
(5) | Includes construction in process that is transferred to buildings, plant and equipment as the asset is available for use and value beyond proven and probable reserves (“VBPP”) that is transferred to capitalized reserve acquisition and development costs, once mineralized material is converted into proven and probable reserves. In 2009, Buzwagi transitioned from a development project to an operating mine and its property, plant, and equipment balance was transferred from exploration properties, capital projects & VBPP to assets subject to amortization and construction in progress. |
(6) | Capitalized interest for assets subject to amortization primarily reflects capitalized interest at Cortez Hills. |
122
a) Accounting Policy for Property, Plant and Equipment
Capitalized Reserve Acquisition Costs
We capitalize the cost of acquisition of land and mineral rights. On acquiring a mineral or petroleum and natural gas property, we estimate the fair value of proven and probable reserves, and we record these amounts as assets at the date of acquisition. When production begins, capitalized reserve acquisition costs are amortized using the “units-of-production” method, whereby the numerator is the number of ounces of gold/pounds of copper/barrels of oil equivalent (boe) produced and the denominator is the estimated recoverable ounces of gold/pounds of copper/boe contained in proven and probable reserves.
Value Beyond Proven and Probable Reserves (“VBPP”)
On acquisition of mineral property, we prepare an estimate of the fair value of the resources and exploration potential of that property and record this amount as an asset (VBPP) as at the date of acquisition. As part of our annual business cycle, we prepare estimates of proven and probable gold and copper mineral reserves for each mineral property. The change in reserves, net of production is, among other things, used to determine the amount to be converted from VBPP to proven and probable reserves subject to amortization. For 2009 the effect on amortization expense of transfers from VBPP to proven and probable reserves is an increase of $3 million (2008: $5 million increase; 2007: $5 million increase).
| | VBPP | |
At January 1, 2008 | | $ | 313 | |
VBPP conversion to reserves | | (178 | ) |
Acquisitions(1) | | 381 | |
At January 1, 2009 | | 516 | |
VBPP conversion to reserves | | (93 | ) |
At December 31, 2009 | | $ | 423 | |
(1) Represents VBPP acquired on acquisition of the additional 40% interest in Cortez.
Capitalized Development Costs
Capitalized development costs include the costs of removing overburden and waste materials at our open pit mining operations prior to the commencement of production; costs incurred to access reserves at our underground mining operations; drilling and related costs incurred that meet the definition of an asset (refer to note 7 for capitalization criteria for drilling and related costs), and qualifying development costs incurred at our petroleum and natural gas properties.
The costs of removing overburden and waste materials to access the ore body at an open pit mine prior to the production phase are referred to as “pre-stripping costs”. Pre-stripping costs are capitalized during the development of an open pit mine. Where a mine operates several open pits that utilize common processing facilities, we capitalize the pre-stripping costs associated with each pit. The production phase of an open pit mine commences when saleable materials, beyond a de minimus amount, are produced. Stripping costs incurred during the production phase of a mine are variable production costs that are included as a component of inventory to be recognized as a component of cost of sales in the same period as the revenue from the sale of inventory. Capitalized pre-stripping costs are amortized using the units-of-production method, whereby the denominator is the estimated recoverable ounces of gold/pounds of copper in the associated open pit.
At our underground mines, we incur development costs to build new shafts, drifts and ramps that will enable us to physically access ore underground. The time over which we will continue to incur these costs depends on the mine life, which could in some cases be greater than 25 years. These underground development costs are capitalized as incurred. Costs incurred and capitalized to enable access to specific ore blocks or areas of the mine, and which only provide an economic benefit over the period of mining that ore block or area, are amortized using the units-of-production method, whereby the denominator is estimated recoverable ounces of gold/pounds of copper contained in proven and probable reserves within that ore block or area. If capitalized underground development costs provide an economic benefit over the entire mine life, the costs are amortized using the units-of-production method, whereby the denominator is the estimated recoverable ounces of gold/pounds of copper contained in total accessible proven and probable reserves.
For our petroleum and natural gas properties, we follow the successful efforts method of accounting, whereby exploration expenditures which are either general in nature or related to an unsuccessful drilling program are written off. Only costs which relate directly to the discovery and development of specific commercial oil and gas reserves are capitalized as development costs and amortized using the units-of-production method, whereby the denominator is the estimated recoverable amount of boe.
123
Buildings, Plant and Equipment
We record buildings, plant and equipment at cost, which includes all expenditures incurred to prepare an asset for its intended use. Cost includes the purchase price; brokers’ commissions; and installation costs including architectural, design and engineering fees, legal fees, survey costs, site preparation costs, freight charges, transportation insurance costs, duties, testing and preparation charges. In addition, if the cost of an asset acquired other than through a business combination is different from its tax basis on acquisition, the cost is adjusted to reflect the related future income tax consequences.
We capitalize costs that extend the productive capacity or useful economic life of an asset. Costs incurred that do not extend the productive capacity or useful economic life of an asset are considered repairs and maintenance and expensed as incurred. We amortize the capitalized cost of assets less any estimated residual value, using the straight line method over the estimated useful economic life of the asset based on their expected use in our business. The longest estimated useful economic life for buildings and equipment at ore processing facilities is 25 years and for mining equipment is 15 years. Depreciation of oil and gas plants and related facilities is calculated using the units-of-production method.
In the normal course of our business, we have entered into certain leasing arrangements whose conditions meet the criteria for the leases to be classified as capital leases. For capital leases, we record an asset and an obligation at an amount equal to the present value at the beginning of the lease term of minimum lease payments over the lease term. In the case of our capital leasing arrangements, there is transfer of ownership of the leased assets to us at the end of the lease term and therefore we amortize these assets on a basis consistent with our other owned assets. As at December 31, 2009, the carrying value of our capital leases is $62 million.
Exploration Properties and Development Projects
The amounts capitalized to exploration and development projects comprise the cost of mineral interests acquired either as individual asset purchases or as part of a business combination. The amount capitalized to development projects, having established proven and probable reserves, also includes the capitalization cost associated with developing and constructing the mine. The value of such assets is primarily driven by the nature and amount of mineralized material contained in such properties. Exploration and development stage mineral interests represent interests in properties that contain proven and probable reserves or are believed to potentially contain mineralized material consisting of (i) other mineralized material such as measured, indicated and inferred material within pits; (ii) other mine exploration potential such as inferred material not immediately adjacent to existing reserves and mineralization but located within the immediate mine area; (iii) other mine-related exploration potential that is not part of measured, indicated or inferred material greenfield exploration potential; and (iv) any acquired right to explore or extract a potential mineral deposit. Amounts capitalized to capital projects include costs associated with the construction of tangible assets, such as processing plants, permanent housing facilities and other tangible infrastructure associated with the project.
Exploration Properties, Capital Projects and VBPP
| | Carrying amount | | Carrying amount | |
| | at December 31, | | at December 31, | |
| | 2009 | | 2008 | |
Exploration projects and other land positions | | | | | |
PNG land positions | | $ | 187 | | $ | 171 | |
Other | | 22 | | 26 | |
VBPP at producing mines | | 423 | | 516 | |
Capital projects(1) | | | | | |
Pascua-Lama | | 1,081 | | 777 | |
Pueblo Viejo | | 1,321 | | 439 | |
Sedibelo | | 9 | | 123 | |
Buzwagi | | — | | 495 | |
Punta Colorado Wind Farm | | 115 | | 82 | |
| | $ | 3,158 | | $ | 2,629 | |
(1) | The carrying amounts for the Cerro Casale, Donlin Creek, Reko Diq, and Kabanga projects are reflected in the carrying amounts of the equity investments through which they are owned. Refer to note 12. |
Capitalized Interest
Interest cost is considered an element of the historical cost of an asset when a period of time is necessary to prepare it for its intended use. We capitalize interest costs to exploration properties and development projects prior to when production begins while exploration, development or construction activities are in progress. We also capitalize interest costs on the cost of certain equity method investments, wherein the only significant assets are exploration properties or capital projects, and while exploration, development or construction activities are in progress. For 2009, we capitalized $269 million of interest costs (2008: $222 million).
Gold and Copper Mineral Reserves
At the end of each fiscal year, as part of our annual business cycle, we prepare estimates of proven and probable gold and copper mineral reserves for each mineral property. We prospectively revise calculations of amortization expense for property, plant and equipment amortized using the units-of-production method, whereby the denominator is estimated recoverable ounces of gold/pounds of copper. The effect of changes in reserve estimates on amortization expense for 2009 was a decrease of $70 million (2008: $57 million decrease; 2007: $26 million increase).
124
b) Amortization and Accretion
| | 2009 | | 2008 | | 2007 | |
Amortization | | $ | 1,016 | | $ | 912 | | $ | 942 | |
Accretion (note 22) | | 57 | | 45 | | 48 | |
| | $ | 1,073 | | $ | 957 | | $ | 990 | |
c) Impairment Evaluations
Producing Mines, Development Projects and Petroleum & Natural Gas Properties
We review and test the carrying amounts of assets when events or changes in circumstances suggest that the carrying amount may not be recoverable. We group assets at the lowest level for which identifiable cash flows are largely independent of the cash flows of other assets and liabilities. For operating mines, capital projects and petroleum and natural gas properties, the individual mine/project/property is included in a single group/reporting unit for impairment testing purposes. A potential impairment is identified if the sum of the reporting unit’s undiscounted cash flows is less than its carrying amount. When a potential long-lived asset impairment is identified, the amount of impairment is calculated by comparing its fair value to its carrying amount.
Long-lived assets subject to potential impairment at mine sites/capital projects/petroleum and natural gas properties include buildings, plant and equipment, and capitalized reserve acquisition and development costs and VBPP. For impairment assessment purposes, the estimated fair value of buildings, plant and equipment is based on a combination of current depreciated replacement cost and current market value. The estimated fair value of capitalized reserve acquisition, development costs and VBPP is determined using an income approach which measures the present value of the related cash flows expected to be derived from the asset.
In fourth quarter 2009, we finalized our long-term life of mine (“LOM”) plans, and reviewed the LOM plans for our mines/projects/properties for indications of impairment. As a result we identified the long-lived assets of our Darlot, Kanowna and Plutonic gold mines in Australia as being potentially impaired with carrying amounts in excess of their undiscounted cash flows. Consequently, we compared their estimated fair values to their carrying amounts and recorded an impairment charge of $43 million at Plutonic and no impairments at Darlot or Kanowna (2008: Marigold $12 million and Osborne, included in discontinued operations $57 million).
Exploration Properties
After acquisition, various factors can affect the recoverability of the capitalized cost of land and mineral rights, particularly the results of exploration drilling. The length of time between the acquisition of land and mineral rights and when we undertake exploration work varies based on the prioritization of our exploration projects and the size of our exploration budget. If we determine that a potential impairment condition may exist, we compare the sum of the undiscounted cash flows expected to be generated from the project to its carrying amount. If the sum of undiscounted cash flows is less than the carrying amount, an impairment charge is recognized if the carrying amount of the individual long-lived assets within the group exceeds their fair value. For projects that do not have reliable cash flow projections, a market approach is applied.
In 2008, we completed a bankable feasibility study (“BFS”) for our Sedibelo platinum project in South Africa meeting the conditions for a 10% interest in the property. We also held the right to increase our interest to 65% in return for a decision to develop Sedibelo and payment of approximately $106 million in fourth quarter 2009. In third quarter 2009, after conducting a thorough review of development alternatives to maximize the project’s potential, we decided not to proceed with this payment to increase our ownership interest in Sedibelo. As a consequence of this decision, we recorded an impairment charge of $158 million in third quarter 2009, reducing the carrying amount of our investment in the project and related assets to their estimated fair values. In fourth quarter 2009, as a result of Barrick’s decision to not develop the Sedibelo project, our partner’s right to purchase our 10% interest by reimbursing us for direct and proven costs of prospecting activities and compiling the BFS, was triggered. This 90 day right expires at the end of February 2010.
There is no active market for our investment in Sedibelo, and consequently, we used an income approach, being the net present value of expected future cash flows, to determine its fair value. Based on this approach, the fair value assigned to our 10% investment in Sedibelo and the related PP&E was $6 million, resulting in an impairment charge of $122 million. We took an additional impairment charge of $36 million which was primarily attributable to water rights related to the project that were classified in Intangible assets.
125
d) Capital Commitments
In addition to entering into various operational commitments in the normal course of business, we had commitments of approximately $1,018 million at December 31, 2009 for construction activities at our capital projects.
e) Insurance
We purchase insurance coverage for certain insurable losses, subject to varying deductibles, at our mineral properties and corporate locations including losses such as property damage and business interruption. We record losses relating to insurable events as they occur. Proceeds receivable from insurance coverage are recorded at such time as receipt is probable and the amount receivable is fixed or determinable.
Insurance Proceeds
| | 2009 | | 2008 | | 2007 | |
Cost of sales | | $ | 18 | | $ | 30 | | $ | 16 | |
Other income | | 26 | | 2 | | — | |
Discontinued operations | | — | | — | | 21 | |
| | $ | 44 | | $ | 32 | | $ | 37 | |
16 · Intangible Assets
| | 2009 | | 2008 | |
| | Gross carrying | | Accumulated | | Net carrying | | Gross carrying | | Accumulated | | Net carrying | |
For the years ended December 31 | | amount | | amortization | | amount | | amount | | amortization | | amount | |
Water rights(1) | | $ | 40 | | $ | — | | $ | 40 | | $ | 48 | | $ | — | | $ | 48 | |
Technology(2) | | 17 | | — | | 17 | | 17 | | — | | 17 | |
Supply contracts(3) | | 16 | | 15 | | 1 | | 16 | | 15 | | 1 | |
Supply agreement(4) | | 8 | | — | | 8 | | 8 | | — | | 8 | |
| | $ | 81 | | $ | 15 | | $ | 66 | | $ | 89 | | $ | 15 | | $ | 74 | |
Aggregate period amortization expense | | | | $ | — | | | | | | $ | 5 | | | |
| | | | | | | | | | | | | |
For the years ended December 31 | | 2010 | | 2011 | | 2012 | | 2013 | | 2014 | |
Estimated aggregate amortization expense | | $ | 1 | | $ | 1 | | $ | 1 | | $ | 1 | | $ | 1 | |
(1) | Water rights in South America ($40 million) are subject to annual impairment testing and will be amortized when used in the future. In 2009, we increased our investment in water rights for our Sedibelo project by $26 million. We subsequently recorded an impairment charge for water rights related to Sedibelo ($34 million) in third quarter 2009 (note 15c). |
(2) | The amount will be amortized using the units-of-production method over the estimated proven and probable reserves of the Pueblo Viejo mine, with no assumed residual value. |
(3) | Supply contracts are being amortized over the weighted average contract lives of 4–10 years, with no assumed residual value. |
(4) | Primarily relates to a supply agreement with Yokohama Rubber Company to secure a supply of tires, which is being amortized evenly over the 120-month term of the agreement. |
Accounting Policy for Intangible Assets
Intangible assets acquired as part of an acquisition of a business are recognized separately from goodwill if the asset is separable or arises from contractual or legal rights. Intangible assets are also recognized when acquired individually or with a group of other assets.
Intangible assets are initially recorded at their estimated fair value. Intangible assets with a finite life are amortized over their useful economic lives on a straight line or units-of-production basis, as appropriate. Intangible assets having indefinite lives and intangible assets that are not yet ready for use are not amortized and are reviewed annually for impairment. We also review and test the carrying amounts of all intangible assets when events or changes in circumstances suggest that their carrying amount may not be recoverable.
In third quarter 2009, after making a decision not to continue developing the Sedibleo project, we recorded an impairment charge of $34 million for water rights (2008: nil). No other indications of impairment were noted in 2009.
126
17 · Goodwill
| | Gold | | Copper | | Other | | | |
| | North | | | | South | | | | South | | Barrick | | | |
| | America | | Australia | | America | | Africa | | America | | Energy | | Total | |
Opening balance, January 1, 2007 | | $ | 2,423 | | $ | 1,781 | | $ | 441 | | $ | 373 | | $ | 743 | | $ | — | | $ | 5,761 | |
Additions(1) | | — | | 34 | | — | | — | | — | | — | | 34 | |
Impairments(2) | | (42 | ) | — | | — | | — | | — | | — | | (42 | ) |
Closing balance, December 31, 2007 | | $ | 2,381 | | $ | 1,815 | | $ | 441 | | $ | 373 | | $ | 743 | | $ | — | | $ | 5,753 | |
Additions(3) | | 23 | | — | | — | | — | | — | | 96 | | 119 | |
Other(4) | | — | | — | | — | | — | | — | | (8 | ) | (8 | ) |
Impairments(5) | | (8 | ) | (272 | ) | — | | (216 | ) | — | | (88 | ) | (584 | ) |
Closing balance, December 31, 2008 | | $ | 2,396 | | $ | 1,543 | | $ | 441 | | $ | 157 | | $ | 743 | | $ | — | | $ | 5,280 | |
Other(6) | | (20 | ) | — | | — | | — | | — | | — | | (20 | ) |
Impairments(7) | | — | | (63 | ) | — | | — | | — | | — | | (63 | ) |
Closing balance, December 31, 2009 | | $ | 2,376 | | $ | 1,480 | | $ | 441 | | $ | 157 | | $ | 743 | | $ | — | | $ | 5,197 | |
(1) | Represents goodwill acquired as a result of the acquisition of an additional 20% interest in Porgera. |
(2) | Impairment charges recorded in 2007 related to Golden Sunlight ($35 million) and Eskay Creek ($7 million). |
(3) | Represents goodwill acquired as a result of the acquisitions of an additional 40% interest in Cortez ($20 million), an additional 40% interest in Storm ($3 million) and Barrick Energy ($96 million) (note 3). |
(4) | Represents the impact of foreign exchange rate changes on the translation of Barrick Energy from C$ to US$. |
(5) | Impairment charges recorded in 2008 related to Kanowna ($272 million), North Mara ($216 million), Barrick Energy ($88 million), and Marigold ($8 million). |
(6) | Represents a reduction of goodwill as a result of the acquisition of an additional 50% interest in the Hemlo mine (note 3f). |
(7) | Impairment charge recorded in 2009 related to Plutonic ($63 million). |
Accounting Policy for Goodwill and Goodwill Impairment
Under the purchase method, the costs of business acquisitions are allocated to the assets acquired and liabilities assumed based on the estimated fair value at the date of acquisition. The excess of purchase cost over the net fair value of identified tangible and intangible assets and liabilities acquired represents goodwill that is allocated to reporting units. We believe that goodwill arises principally because of the following factors: 1) the going concern value implicit in our ability to sustain and/or grow our business by increasing reserves and resources through new discoveries; 2) the ability to capture unique synergies that can be realized from managing a portfolio of both acquired and existing mines and mineral properties in our regional business units; and 3) the requirement to record a deferred tax liability for the difference between the assigned values and the tax bases of assets acquired and liabilities assumed in a business combination at amounts that do not reflect fair value. We do not allocate goodwill to exploration properties or development projects as they do not have the inputs and processes applied to those inputs to have the ability to create outputs, and therefore do not meet the definition of a business or a reporting unit.
Each individual mineral property that is an operating mine is a reporting unit for goodwill impairment testing purposes. On an annual basis, as at October 1, and at any other time if events or changes in circumstances indicate that the fair value of a reporting unit has been reduced below its carrying amount, we evaluate the carrying amount of goodwill for potential impairment.
There is no active market for our reporting units. Consequently, when assessing a reporting unit for potential goodwill impairment, we use an income approach (being the net present value of expected future cash flows or net asset value (“NAV”) of the relevant reporting unit) to determine the fair value we could receive for the reporting unit in an arm’s length transaction at the measurement date. Expected future cash flows are based on a probability-weighted approach applied to potential outcomes. Estimates of expected future cash flows reflect estimates of projected future revenues, cash costs of production and capital expenditures contained in our long-term life of mine (“LOM”) plans, which are updated for each reporting unit in the fourth quarter of each fiscal year.
127
Our LOM plans are based on detailed research, analysis and modeling to optimize the internal rate of return generated from each reporting unit. As such, these plans consider the optimal level of investment, overall production levels and sequence of extraction taking into account all relevant characteristics of the ore body, including waste to ore ratios, ore grades, haul distances, chemical and metallurgical properties impacting process recoveries and capacities of available extraction, haulage and processing equipment. Therefore, the LOM plan is the appropriate basis for forecasting production output in each future year and the related production costs and capital expenditures.
Projected future revenues reflect the forecasted future production levels at each of our reporting units as detailed in our LOM plans. Included in these forecasts is the production of mineral resources that do not currently qualify for inclusion in proven and probable ore reserves where there is a high degree of confidence in its economic extraction. This is consistent with the methodology we use to measure value beyond proven and probable reserves when allocating the purchase price of a business combination to acquired mining assets.
Projected future revenues also reflect our estimated long-term metals prices, which are determined based on current prices, an analysis of the expected total production costs of the producers and forward pricing curves of the particular metal and forecasts of expected long-term metals prices prepared by analysts. These estimates often differ from current price levels, but our methodology is consistent with how a market participant would assess future long-term metals prices. In 2009, we have used estimated 2010 and long-term gold prices of $1,050 and $950 per ounce, respectively (2008: $850), and estimated 2010 and long-term copper prices of $2.50 and $2.25 per pound, respectively (2008: $1.50 and $2.00).
Our estimates of future cash costs of production and capital expenditures are based on the LOM plans for each reporting unit. Costs incurred in currencies other than the US dollar are translated to US dollars using expected long-term exchange rates based on the relevant forward pricing curve. Oil prices are a significant component, both direct and indirect, of our expected cash costs of production. We have used an estimated average oil price of $75 per barrel (2008: $75), which is based on the spot price, forward pricing curve, and long- term oil price forecasts prepared by analysts.
The discount rate applied to present value the net future cash flows is based upon our real weighted average cost of capital with an appropriate adjustment for the remaining life of a mine and risks associated with the relevant cash flows based on the geographic location of the reporting unit. These risk adjustments were based on observed historical country risk premiums and the average credit default swap spreads for the period. In 2009, we used the following real discount rates for our gold mines: United States 3.03% – 4.61% (2008: 2.68% – 4.03%); Canada 3.15% (2008: 3.29%); Australia 3.53% – 4.45% (2008: 3.66% – 4.29%); Argentina 12.52% (2008: 13.74%); Tanzania 8.79% – 10.37% (2008: 8.77% – 9.84%); Papua New Guinea 8.46% (2008: 9.84%); and Peru 4.87% – 5.78% (2008: 6.33% – 6.96%). For our copper mines, we used the following real discount rates in 2009: Australia 7.09% (2008: 6.95%); and Chile 8.82% (2008: 8.83%). The increase in discount rates in North America, Australia and Africa compared to the prior year primarily reflects higher risk premiums over the risk free borrowing rate. The decrease in discount rates in South America and Papua New Guinea compared to the prior year primarily reflects lower country risk premiums due to declining credit spreads.
For our gold reporting units, we apply a market multiple to the NAV computed using the present value of future cash flows approach in order to assess their estimated fair value. Gold companies typically trade at a market capitalization that is based on a multiple of their underlying NAV. Consequently, a market participant would generally apply a NAV multiple when estimating the fair value of an operating gold mine. For each reporting unit, the selection of an appropriate NAV multiple to apply considers the change in our total Enterprise value from December 31, 2008 and compares this to companies within each region.
When selecting NAV multiples to arrive at fair value, we considered trading prices of comparable gold mining companies on October 1, 2009. The selected ranges of multiples for all operating gold mines were also based on mine life. The range of selected multiples in respect of operating gold mines with lives of five years or less were based on the lower end of the observed multiples. Mines with lives greater than five years were generally based on median and/or average observation. Mines with lives of twenty years or greater were based on a 20% increase on the median and/or average observations. In 2009, we have
128
used the following multiples in our assessment of the fair value of our gold reporting units: North America 1.2 – 2.2 (2008: 1.0 – 2.1); Australia 1.3 – 1.8 (2008: 1.0 – 1.6); South America 1.1 – 1.6 (2008: 1.0 – 1.4); and Africa 1.2 – 2.0 (2008: 1.0 – 1.6).
In 2009, we recorded a goodwill impairment charge of $63 million at our Plutonic gold mine in Australia, primarily as a result of a significant reduction in their proven and probable reserves and its short remaining mine life (2008: Kanowna $272 million; North Mara $216 million; Osborne, included in discontinued operations $64 million; Henty, included in discontinued operations $30 million; Marigold $8 million; and Barrick Energy $88 million).
In second quarter 2009, we acquired the remaining 50% interest in our Hemlo mine, which resulted in a $20 million reduction of goodwill (note 3f).
18 · Other Assets
At December 31 | | 2009 | | 2008 | |
Non-current ore in stockpiles (note 13) | | $ | 796 | | $ | 688 | |
Derivative assets (note 20e) | | 290 | | 15 | |
Goods and services taxes recoverable(1) | | 124 | | 117 | |
Debt issue costs | | 42 | | 29 | |
Unamortized share-based compensation (note 28b) | | 67 | | 84 | |
Notes receivable | | 94 | | 96 | |
Deposits receivable | | 11 | | 45 | |
Other | | 107 | | 59 | |
| | $ | 1,531 | | $ | 1,133 | |
(1) | 2009 includes $94 million and $30 million in VAT and fuel tax receivables in South America and Africa, respectively (2008: $68 million and $49 million, respectively). |
Debt Issue Costs
In 2009, $10 million and $6 million of debt issue costs arose on the debenture issuances of $1.25 billion and $750 million, respectively.
In 2008, an addition of $11 million of debt issue costs arose on the issuance of $1,250 million in debentures.
Amortization of debt issue costs is calculated using the interest method over the term of each debt obligation, and classified as a component of interest cost (see note 20b).
19 · Other Current Liabilities
At December 31 | | 2009 | | 2008 | |
Asset retirement obligations (note 22) | | $ | 85 | | $ | 93 | |
Derivative liabilities (note 20e) | | 180 | | 440 | |
Post-retirement benefits (note 29) | | 16 | | 10 | |
Income taxes payable (note 9) | | 94 | | 48 | |
Restricted stock units (note 28b) | | 33 | | — | |
Other | | 67 | | 36 | |
| | $ | 475 | | $ | 627 | |
20 · Financial Instruments
Financial instruments include cash; evidence of ownership in an entity; or a contract that imposes an obligation on one party and conveys a right to a second entity to deliver/receive cash or another financial instrument. Information on certain types of financial instruments is included elsewhere in these financial statements as follows: accounts receivable — note 14; investments — note 12; restricted share units — note 28b.
a) Cash and Equivalents
Cash and equivalents include cash, term deposits, treasury bills and money markets with original maturities of less than 90 days.
At December 31 | | 2009 | | 2008 | |
Cash deposits | | $ | 509 | | $ | 482 | |
Term deposits | | 298 | | 160 | |
Treasury bills | | 125 | | 185 | |
Money market investments | | 1,632 | | 610 | |
| | $ | 2,564 | | $ | 1,437 | |
129
b) Long-Term Debt(1)
| | | | | | | | | | | | | | | | | | | | | | | | | | | | | | | | | | | | | | | | | | | | | | |
| | 2009 | | 2008 | | 2007 | |
| | | | | | | | | | | | | | | | | | | | Assumed | | | | | | | | | | | |
| | | | | | | | | | Currency | | | | | | | | | | on | | | | | | | | | | | |
| | | | | | | | | | translation | | | | | | | | | | acquisition of | | | | | | | | | | | |
| | At | | | | | | | | and | | At | | | | | | | | Barrick | | At | | | | | | | | At | |
| | Dec. 31 | | Proceeds | | Repayments | | Amortization(2) | | other | | Dec. 31 | | Proceeds | | Repayments | | Amortization(2) | | Energy | | Dec. 31 | | Proceeds | | Repayments | | Amortization(2) | | Jan. 1 | |
| | | | | | | | | | | | | | | | | | | | | | | | | | | | | | | |
Fixed rate notes | | $ | 3,214 | | $ | 1,964 | | $ | — | | $ | — | | $ | — | | $ | 1,250 | | $ | 1,250 | | $ | — | | $ | — | | $ | — | | $ | — | | $ | — | | $ | — | | $ | — | | $ | — | |
5.80%/4.875% notes(3) | | 748 | | — | | — | | (1 | ) | — | | 747 | | — | | — | | (2 | ) | — | | 745 | | — | | — | | — | | 745 | |
Copper-linked notes | | — | | — | | 190 | | — | | | | 190 | | — | | 325 | | — | | — | | 515 | | — | | 393 | | — | | 908 | |
US dollar notes | | 996 | | 190 | | — | | (1 | ) | — | | 805 | | 325 | | — | | — | | — | | 480 | | 393 | | — | | — | | 87 | |
Convertible senior debentures | | 285 | | — | | — | | 4 | | — | | 289 | | — | | — | | 4 | | — | | 293 | | — | | — | | 3 | | 296 | |
Project financing | | 62 | | — | | 53 | | — | | — | | 115 | | — | | 99 | | — | | — | | 214 | | — | | 91 | | — | | 305 | |
Capital leases | | 62 | | 22 | | 25 | | — | | (5 | ) | 70 | | 6 | | 21 | | — | | — | | 85 | | 15 | | 24 | | — | | 94 | |
Other debt obligations(4) | | 968 | | — | | 16 | | 4 | | 11 | | 977 | | 152 | | 150 | | 5 | | 57 | | 923 | | | | 101 | | — | | 1,024 | |
7.50% debentures(5) | | — | | — | | — | | — | | — | | — | | — | | — | | — | | — | | — | | — | | 500 | | — | | 498 | |
First credit facility(6) | | — | | — | | — | | — | | — | | — | | 990 | | 990 | | — | | — | | — | | — | | — | | — | | — | |
| | 6,335 | | 2,176 | | 284 | | 6 | | 6 | | 4,443 | | 2,723 | | 1,585 | | 7 | | 57 | | 3,255 | | 408 | | 1,109 | | 3 | | 3,957 | |
Less: current portion(7) | | (54 | ) | — | | — | | — | | — | | (93 | ) | — | | — | | — | | — | | (102 | ) | — | | — | | — | | (713 | ) |
| | $ | 6,281 | | $ | 2,176 | | $ | 284 | | $ | 6 | | $ | 6 | | $ | 4,350 | | $ | 2,723 | | $ | 1,585 | | $ | 7 | | $ | 57 | | $ | 3,153 | | $ | 408 | | $ | 1,109 | | $ | 3 | | $ | 3,244 | |
| | | | | | | | | | | | | | | | | | | | | | | | | | | | | | | |
Short-term debt | | | | | | | | | | | | | | | | | | | | | | | | | | | | | | | |
Demand financing facility | | — | | — | | 113 | | — | | — | | 113 | | — | | 18 | | — | | — | | 131 | | — | | 19 | | — | | 150 | |
| | $ | — | | $ | — | | $ | 113 | | $ | — | | $ | — | | $ | 113 | | $ | — | | $ | 18 | | $ | — | | $ | — | | $ | 131 | | $ | — | | $ | 19 | | $ | — | | $ | 150 | |
| | | | | | | | | | | | | | | | | | | | | | | | | | | | | | | | | | | | | | | | | | | | | | |
(1) | The agreements that govern our long-term debt each contain various provisions which are not summarized herein. In certain cases, these provisions allow Barrick to, at its option, redeem indebtedness prior to maturity at specified prices and also may permit redemption of debt by Barrick upon the occurrence of certain specified changes in tax legislation. |
(2) | Amortization of debt premium/discount. |
(3) | During third quarter 2004, we issued $400 million of debentures at a $3 million discount that mature on November 15, 2034 and $350 million of debentures at a $2 million discount that mature on November 15, 2014. |
(4) | The obligations have an aggregate amount of $968 million, of which $163 million is subject to floating interest rates and $805 million is subject to fixed interest rates ranging from 4.75% to 8.05%. The obligations mature at various times between 2010 and 2035. |
(5) | During second quarter 2007, we repaid the $500 million 7.5% debentures from existing cash balances and proceeds from the sale of investments. |
(6) | We have a credit and guarantee agreement with a group of banks (the “Lenders”), which requires the Lenders to make available to us a credit facility of up to $1.5 billion or the equivalent amount in Canadian currency. The credit facility, which is unsecured, has an interest rate of Libor plus 0.25% to 0.35% on drawn down amounts, and a commitment rate of 0.07% to 0.08% on undrawn amounts. $50 million matures in 2012 and the remaining $1.45 billion matures in 2013. |
(7) | The current portion of long-term debt consists of capital leases ($24 million) and project financing ($30 million). |
Fixed Rate Notes
On October 16, 2009, we issued two tranches of debentures totaling $1.25 billion through our wholly-owned indirect subsidiary Barrick (PD) Australia Finance Pty Ltd. (“BPDAF”) consisting of $850 million of 30 year notes with a coupon rate of 5.95%, and $400 million of 10 year notes with a coupon rate of 4.95% (collectively the “Notes”). BPDAF used the proceeds to provide loans to us for settling the Gold Hedges and some of the Floating Contracts. In exchange, we provide sufficient funds to BPDAF to meet the principal and interest obligations on the notes. We also provided an unconditional and irrevocable guarantee of these payments, which will rank equally with our other unsecured and unsubordinated obligations.
On March 19, 2009, we issued an aggregate of $750 million of 10 year notes with a coupon rate of 6.95% for general corporate purposes. The notes are unsecured, unsub-ordinated obligations and will rank equally with our other unsecured, unsubordinated obligations.
In September, 2008, we issued an aggregate of $1,250 million of notes through our wholly-owned indirect subsidiaries Barrick North America Finance LLC and Barrick Gold Financeco LLC (collectively the “LLCs”) consisting of $500 million of 5-year notes with a coupon rate of 6.125%, $500 million of 10-year notes with a coupon rate of 6.8%, and $250 million of 30-year notes with a coupon rate of 7.5% (collectively the “Notes”). The LLCs used the proceeds to provide loans to us. We provide sufficient funds to the
130
LLCs to meet the principal and interest obligations on the notes. We also provided an unconditional and irrevocable guarantee of these payments, which will rank equally with our other unsecured and unsubordinated obligations.
We used these proceeds to repay the $990 million we drew down in first quarter 2008, which was used to partially fund our acquisition of the 40% interest in Cortez. The amounts were drawn down using our existing $1.5 billion credit facility.
Copper-Linked Notes/US Dollar Notes
In October 2006, we issued $1 billion of Copper-Linked Notes. During the first three years, the full $1 billion obligation of these notes was to be repaid through the delivery of (the US dollar equivalent of) 324 million pounds of copper. At December 31, 2009, all of the required copper had been delivered. Coincident with the repayment of (the US dollar equivalent of) 324 million pounds of copper, we reborrowed $1 billion. As the copper-linked equivalent was repaid, the fixed US dollar obligation increased ($190 million during the year). The accounting principles applicable to these Copper-Linked Notes require separate accounting for the future delivery of copper (a fixed-price forward sales contract that meets the definition of a derivative that must be separately accounted for) and for the underlying bond (see note 20 c). $400 million of US dollar notes with a coupon of 5.75% mature in 2016 and $600 million of US dollar notes with a coupon of 6.35% mature in 2036.
Convertible Senior Debentures
The convertible senior debentures (the “Securities”) mature in 2023 and had an aggregate amount of $285 million outstanding as at the end of 2009. Holders of the Securities may, upon the occurrence of certain circumstances and within specified time periods, convert their Securities into common shares of Barrick. These circumstances are: if the closing price of our common shares exceeds 120% of the conversion price for at least 20 trading days in the 30 consecutive trading days ending on the last trading day of the immediately preceding fiscal quarter; if certain credit ratings assigned to the Securities fall below specified levels or if the Securities cease to be rated by specified rating agencies or such ratings are suspended or withdrawn; if for each of five consecutive trading days, the trading price per $1,000 principal amount of the Securities was less than 98% of the product of the closing price of our common shares and the then current conversion rate; if the Securities have been called for redemption provided that only such Securities called for redemption may be converted and upon the occurrence of specified corporate transactions. On December 31, 2009, the conversion rate per each $1,000 principal amount of Securities was 40.6849 common shares and the effective conversion price was $24.58 per common share. The conversion rate is subject to adjustment in certain circumstances. As such, the effective conversion price may also change.
The Securities were convertible from October 1, 2007 through December 31, 2009. During the period January 1, 2009 to December 31, 2009, $40 thousand principal amount of Securities was converted for 1,619 common shares of Barrick. If all the Securities had been converted and settlement occurred on December 31, 2009, we would have issued approximately 9.3 million common shares with an aggregate fair value of approximately $368.4 million based on our closing share price on December 31, 2009. The Securities are also convertible from January 1, 2010 through March 31, 2010.
We may redeem the Securities at any time on or after October 20, 2010 and prior to maturity, in whole or in part, at a prescribed redemption price that varies depending upon the date of redemption from 100.825% to 100% of the principal amount, plus accrued and unpaid interest. The maximum amount we could be required to pay to redeem the securities is $232 million plus accrued interest. Holders of the Securities can require the repurchase of the Securities for 100% of their principal amount, plus accrued and unpaid interest, on October 15, 2013 and October 15, 2018. In addition, if specified designated events occur prior to maturity of the Securities, we will be required to offer to purchase all outstanding Securities at a repurchase price equal to 100% of the principal amount, plus accrued and unpaid interest. For accounting purposes the Securities are classified as a “conventional convertible debenture” and the conversion feature has not been bifurcated from the host instrument.
Project Financing
One of our wholly-owned subsidiaries, Minera Argentina Gold S.A. in Argentina, had a limited recourse amortizing loan of $62 million outstanding at December 31, 2009, the majority of which has a variable interest rate. We have guaranteed the loan until completion occurs, after which it will become non-recourse to the parent company. Pursuant to the terms of the loan, completion, as defined in the loan agreement, must be achieved prior to December 31, 2009. An extension was granted until March 31, 2010 to amend the loan documentation, with an expectation that the completion deadline would be postponed until December 31, 2010. The loan is insured for political risks by branches of the Canadian and German governments.
Demand Financing Facility
We had a demand financing facility that permits borrowings of up to $150 million. The terms of the facility require us to maintain cash on deposit with the lender as a compensating balance equal to the amount outstanding under the facility, which is restricted as to use. The net effective interest rate is 0.4% per annum. In second quarter 2009, we repaid the remaining $113 million drawn and terminated the facility. An equal amount required to be placed on deposit that was included in restricted cash has been released.
131
Interest
| | For the years ended December 31 | |
| | 2009 | | 2008 | | 2007 | |
| | Interest | | Effective | | Interest | | Effective | | Interest | | Effective | |
| | cost | | rate(1) | | cost | | rate(1) | | cost | | rate(1) | |
Fixed rate notes | | $ | 142 | | 6.4 | % | $ | 26 | | 7.0 | % | $ | — | | — | |
5.80%/4.875% notes | | 44 | | 5.8 | % | 42 | | 5.7 | % | 41 | | 5.6 | % |
Copper-linked notes/US dollar notes | | 62 | | 6.2 | % | 62 | | 6.2 | % | 63 | | 6.2 | % |
Convertible senior debentures | | 3 | | 0.8 | % | 4 | | 1.5 | % | 2 | | 0.8 | % |
Project financing | | 8 | | 8.2 | % | 19 | | 11.0 | % | 26 | | 9.1 | % |
Capital leases | | 2 | | 5.6 | % | 4 | | 5.0 | % | 6 | | 7.7 | % |
Other debt obligations | | 49 | | 5.1 | % | 50 | | 5.3 | % | 60 | | 6.1 | % |
7.50% debentures | | — | | — | | — | | — | | 16 | | 9.9 | % |
Deposit on silver sale agreement (notes 6 and 23) | | 6 | | 9.5 | % | — | | — | | — | | — | |
First credit facility | | — | | — | | 17 | | 3.3 | % | 1 | | — | |
Demand financing facility | | 5 | | 8.7 | % | 11 | | 8.9 | % | 13 | | 8.9 | % |
Other interest | | 5 | | | | 8 | | | | 9 | | | |
| | 326 | | | | 243 | | | | 237 | | | |
Less: interest capitalized | | (269 | ) | | | (222 | ) | | | (124 | ) | | |
| | $ | 57 | | | | $ | 21 | | | | $ | 113 | | | |
Cash interest paid | | $ | 311 | | | | $ | 213 | | | | $ | 236 | | | |
Amortization of debt issue costs | | 6 | | | | 7 | | | | 9 | | | |
Amortization of premium/discount | | (6 | ) | | | (7 | ) | | | (3 | ) | | |
Losses on interest rate hedges | | 3 | | | | 1 | | | | 4 | | | |
Increase (decrease) in interest accruals | | 12 | | | | 29 | | | | (9 | ) | | |
Interest cost | | $ | 326 | | | | $ | 243 | | | | $ | 237 | | | |
(1) | The effective rate includes the stated interest rate under the debt agreement, amortization of debt issue costs and debt discount/premium and the impact of interest rate contracts designated in a hedging relationship with long-term debt. |
Scheduled Debt Repayments
| | | | | | | | | | 2014 and | |
| | 2010 | | 2011 | | 2012 | | 2013 | | thereafter | |
Fixed rate notes | | $ | — | | $ | — | | $ | — | | $ | 500 | | $ | 2,750 | |
5.80%/4.875% notes | | — | | — | | — | | — | | 750 | |
Project financing | | 30 | | 10 | | 22 | | — | | — | |
US dollar notes | | — | | — | | — | | — | | 1,000 | |
Other debt obligations | | — | | — | | 117 | | 65 | | 728 | |
Convertible senior debentures | | — | | — | | — | | — | | 230 | |
| | $ | 30 | | $ | 10 | | $ | 139 | | $ | 565 | | $ | 5,458 | |
Minimum annual payments under capital leases | | $ | 24 | | $ | 14 | | $ | 10 | | $ | 9 | | $ | 5 | |
132
c) Use of Derivative Instruments (“Derivatives”) in Risk Management
In the normal course of business, our assets, liabilities and forecasted transactions, as reported in US dollars, are impacted by various market risks including, but not limited to:
Item | | Impacted by |
· Sales | | · Prices of gold, copper, oil and natural gas |
· Cost of sales | | |
· Consumption of diesel fuel, propane, natural gas and electricity | | · Prices of diesel fuel, propane, natural gas and electricity |
· Non-US dollar expenditures | | · Currency exchange rates — US dollar versus A$, ARS, C$, CLP, JPY, PGK, TZS and ZAR |
· By-product credits | | · Prices of silver and copper |
· Corporate and regional administration, exploration and business development costs | | · Currency exchange rates — US dollar versus A$, ARS, C$, CLP, JPY, PGK, TZS and ZAR |
· Capital expenditures | | |
· Non-US dollar capital expenditures | | · Currency exchange rates — US dollar versus A$, ARS, C$, CLP, EUR and PGK |
· Consumption of steel | | · Price of steel |
· Interest earned on cash and equivalents | | · US dollar interest rates |
· Interest paid on fixed-rate debt | | · US dollar interest rates |
The timeframe and manner in which we manage risks varies for each item based upon our assessment of the risk and available alternatives for mitigating risk. For these particular risks, we believe that derivatives are an appropriate way of managing the risk.
The primary objective of our risk management program is to mitigate variability associated with changing market values related to the hedged item. Many of the derivatives we use meet the hedge effectiveness criteria and are designated in a hedge accounting relationship. Some of the derivative instruments are effective in achieving our risk management objectives, but they do not meet the strict hedge effectiveness criteria, and they are classified as “economic hedges”. The change in fair value of these economic hedges is recorded in current period earnings, classified with the income statement line item that is consistent with the derivative instruments’ intended risk objective.
d) Other Use of Derivative Instruments
We also enter into derivative instruments with the objective of realizing trading gains to increase our reported net income.
During the year, we wrote $500 million net USD pay-fixed swaptions. Changes in the fair value of the swaptions and the premiums earned were recognized in current period earnings through interest expense. For the year, we recognized a gain on premiums of $3 million in current period earnings. There were no swaptions outstanding at December 31, 2009.
We enter into purchased and written contracts with the primary objective of increasing the realized price on our gold and copper sales. During 2009, we wrote gold put and call options with an average outstanding notional volume of 0.3 million and 0.3 million ounces, respectively, on a net basis. We also held other net purchased gold long positions during the year with an average outstanding notional volume of 0.1 million ounces. During the year, we wrote copper put and call options averaging 0.5 and 5 million pounds, respectively, and purchased other net long copper positions averaging 9 million pounds.
As a result of these activities, we recorded realized gains in revenue of $56 million on gold contracts and realized losses of $2 million on copper contracts in 2009. There are no outstanding gold or copper positions at December 31, 2009.
133
e) Summary of Derivatives at December 31, 2009
| | | | | | | | | | Accounting | | | |
| | | | | | | | | | classification by | | | |
| | Notional amount by term to maturity | | notional amount | | | |
| | Within | | 2 to 3 | | 4 to 5 | | | | Cash flow | | Fair value | | Non- | | Fair value | |
| | 1 year | | years | | years | | Total | | hedge | | hedge | | hedge | | (USD) | |
| | | | | | | | | | | | | | | | | |
US dollar interest rate contracts | | | | | | | | | | | | | | | | | |
Net receive-fixed swap positions (millions) | | $ | (75 | ) | $ | — | | $ | 100 | | $ | 25 | | $ | — | | $ | — | | $ | 25 | | $ | (6 | ) |
Currency contracts | | | | | | | | | | | | | | | | | |
A$:US$ contracts (A$ millions) | | 1,426 | | 2,286 | | 750 | | 4,462 | | 4,459 | | — | | 3 | | $ | 348 | |
C$:US$ contracts (C$ millions) | | 381 | | 27 | | — | | 408 | | 408 | | — | | — | | 12 | |
CLP:US$ contracts (CLP millions)(1) | | 96,240 | | 60,000 | | — | | 156,240 | | 36,240 | | — | | 120,000 | | 10 | |
EUR:US$ contracts (EUR millions) | | 23 | | 19 | | — | | 42 | | 42 | | — | | — | | 1 | |
PGK:US$ contracts (PGK millions) | | 76 | | — | | — | | 76 | | 76 | | — | | — | | — | |
| | | | | | | | | | | | | | | | | |
Commodity contracts | | | | | | | | | | | | | | | | | |
Copper collar sell contracts (millions of pounds) | | 282 | | — | | — | | 282 | | 203 | | — | | 79 | | $ | (42 | ) |
Copper net sold call contracts (millions of pounds) | | 79 | | — | | — | | 79 | | — | | — | | 79 | | (13 | ) |
Diesel contracts (thousands of barrels)(2) | | 2,355 | | 1,366 | | 440 | | 4,161 | | 4,161 | | — | | — | | (7 | ) |
Propane contracts (millions of gallons) | | 12 | | — | | — | | 12 | | 12 | | — | | — | | 2 | |
Natural gas contracts (thousands of gigajoules) | | 805 | | — | | — | | 805 | | 805 | | — | | — | | — | |
Electricity contracts (thousands of megawatt hours) | | 31 | | 22 | | — | | 53 | | — | | — | | 53 | | — | |
| | | | | | | | | | | | | | | | | | | | | | | | | |
(1) | Non-hedge contracts economically hedge pre-production capital expenditures at our Pascua Lama project. |
(2) | Diesel commodity contracts represent a combination of WTI and ULSD/WTI Crack spread swaps, WTB, MOPS and JET hedge contracts. These derivatives hedge physical supply contracts based on the price of ULSD, WTB, MOPS and JET respectively, plus a spread. WTI represents West Texas Intermediate, WTB represents Waterborne, MOPS represents Mean of Platts Singapore, JET represents Jet Fuel, ULSD represents Ultra Low Sulfur Diesel US Gulf Coast. |
Fair Values of Derivative Instruments
| | Asset Derivatives | | Liability Derivatives | |
| | At Dec. 31, 2009 | | At Dec. 31, 2008 | | At Dec. 31, 2009 | | At Dec. 31, 2008 | |
| | Balance sheet | | Fair | | Balance sheet | | Fair | | Balance sheet | | Fair | | Balance sheet | | Fair | |
| | classification | | value | | classification | | value | | classification | | value | | classification | | value | |
| | | | | | | | | | | | | | | | | |
Derivatives designated as hedging instruments | | | | | | | | | | | | | | | | | |
Currency contracts | | Other assets | | $ | 374 | | Other assets | | $ | 22 | | Other liabilities | | $ | 9 | | Other liabilities | | $ | 526 | |
Commodity contracts | | Other assets | | 53 | | Other assets | | 402 | | Other liabilities | | 131 | | Other liabilities | | 205 | |
Total derivatives classified as hedging instruments | | | | $ | 427 | | | | $ | 424 | | | | $ | 140 | | | | $ | 731 | |
Derivatives not designated as hedging instruments | | | | | | | | | | | | | | | | | |
US dollar interest rate contracts | | Other assets | | $ | 1 | | Other assets | | $ | — | | Other liabilities | | $ | 7 | | Other liabilities | | $ | 8 | |
Currency contracts | | Other assets | | 15 | | Other assets | | 4 | | Other liabilities | | 9 | | Other liabilities | | 1 | |
Commodity contracts | | Other assets | | 61 | | Other assets | | 404 | | Other liabilities | | 43 | | Other liabilities | | 135 | |
Total derivatives not designated as hedging instruments | | | | $ | 77 | | | | $ | 408 | | | | $ | 59 | | | | $ | 144 | |
Total derivatives | | | | $ | 504 | | | | $ | 832 | | | | $ | 199 | | | | $ | 875 | |
134
US Dollar Interest Rate Contracts
Non-hedge Contracts
We have a $75 million net US dollar pay-fixed interest rate swap position outstanding that was used to economically hedge the US dollar interest rate risk implicit in a prior gold lease rate swap position. Changes in the fair value of these interest rate swaps are recognized in current period earnings through interest expense. We also have a $100 million US dollar receive-fixed interest rate swap outstanding that is used to economically hedge US dollar interest rate risk on our outstanding cash balance.
Currency Contracts
Cash Flow Hedges
During the year, currency contracts totaling A$1,407 million, C$462 million, EUR 73 million, PGK 160 million, and CLP 37,656 million have been designated against forecasted non-US dollar denominated expenditures, some of which are hedges that matured within the year. The outstanding contracts hedge the variability of the US dollar amount of those expenditures caused by changes in currency exchange rates over the next four years.
Hedged items that relate to operating and/or sustaining capital expense are identified as the first stated quantity of dollars of forecasted expenditures in a future month. For C$193 million, A$110 million, and CLP 12,000 million of collar contracts, we have concluded that the hedges are 100% effective because the critical terms (including notional amount and maturity date) of the hedged items and the currency contracts are the same. For all remaining currency hedges, prospective and retrospective hedge effectiveness is assessed using the hypothetical derivative method. The prospective test is based on regression analysis of the month-on-month change in fair value of both the actual derivative and a hypothetical derivative caused by actual historic changes in forward exchange rates over the last three years. The retrospective test involves comparing the effect of historic changes in exchange rates each period on the fair value of both the actual and hypothetical derivative, and ineffectiveness is measured using a dollar offset approach. The effective portion of changes in fair value of the currency contracts is recorded in OCI until the forecasted expenditure impacts earnings.
Hedged items that relate to pre-production expenditures at our development projects are identified as the stated quantity of dollars of the forecasted expenditures associated with a specific transaction in a pre-defined time period. For C$29 million, A$55 million and EUR 42 million hedge, effectiveness is assessed using the dual spot method, where changes in fair value attributable to changes in spot prices are calculated on a discounted basis for the actual derivative and an undiscounted basis for the hypothetical derivative. The effectiveness testing excludes time value of the hedging instrument. Prospective and retrospective hedge effectiveness uses a dollar offset method.
Non-hedge Contracts
We concluded that CLP 120,000 million of collar contracts do not meet the effectiveness criteria of the dual spot method. These contracts represent an economic hedge of pre-production capital expenditures at our Pascua Lama project. Although not qualifying as an accounting hedge, the contracts protect us against variability of the CLP to the US dollar on pre-production expenditures at our Pascua Lama project. Changes in the fair value of the non-hedge CLP contracts are recorded in current period project expense. In 2009, we recorded an unrealized loss of $4 million on the outstanding collar contracts. Non-hedge currency contracts are used to mitigate the variability of the US dollar amount of non-US dollar denominated exposures that do not meet the strict hedge effectiveness criteria. Changes in the fair value of non-hedge currency contracts are recorded in current period cost of sales, corporate administration, other income, other expense or income tax expense according to the intention of the hedging instrument.
Commodity Contracts
Diesel/Propane/Electricity/Natural Gas
Cash Flow Hedges
During the year, we entered into 734 thousand barrels of WTI/ULSD crack spread swaps, 762 thousand barrels of MOPS forwards, 199 thousand barrels of WTB forwards, 199 thousand barrels of JET forwards, and 12 million gallons of propane designated against forecasted fuel purchases for expected consumption at our mines. The designated contracts act as a hedge against variability in market prices on the cost of future fuel purchases over the next four years. We also entered into 867 thousand gigajoules of natural gas contracts that are used to mitigate the risk of price changes on natural gas sales at Barrick Energy. Hedged items are identified as the first stated quantity of forecasted consumption purchased in a future month. Prospective and retrospective hedge effectiveness is assessed using the hypothetical derivative method. The prospective test is based on regression analysis of the month-on-month change in fair value of both the actual derivative and a hypothetical derivative caused by actual historic changes in commodity prices over the last three years. The retrospective test involves comparing the effect of historic changes in commodity prices each period on the fair value of both the actual and hypothetical derivative, and ineffectiveness is measured using a dollar offset approach. The effective portion of changes in fair value of the commodity contracts is recorded in OCI until the forecasted transaction impacts earnings.
135
On April 1, 2009, we entered into a new diesel fuel supply contract. Under the terms of the new contract, fuel purchased for consumption at our Nevada based mines is priced based on the ULSD index. We have continued to hedge our exposure to diesel using our existing WTI forward contracts. Retrospective hedge effectiveness testing shows a strong correlation between ULSD and WTI and thus we expect that these hedges will continue to be effective. The prospective and retrospective testing will continue to be assessed using the hypothetical derivative method.
Non-hedge Contracts
Non-hedge electricity contracts of 53 thousand megawatt hours are used to mitigate the risk of price changes on electricity consumption at Barrick Energy. Although not qualifying as an accounting hedge, the contracts protect the Company to a significant extent from the effects of changes in electricity prices. Changes in the fair value of non-hedge electricity contracts are recorded in current period cost of sales.
Copper
Cash Flow Hedges
Copper collar contracts totaling 200 million pounds have been designated as hedges against copper cathode sales at our Zaldívar mine. The contracts contain purchased put and sold call options with weighted average strike prices of $2.25/lb and $3.53/lb, respectively. We also have copper collar contracts of 3 million pounds that have been designated as hedges against copper concentrate sales at our Osborne mine. The contracts contain purchased put and sold call options with average strike prices of $2.49/lb and $3.79/lb, respectively.
For collars designated against copper cathode production, the hedged items are identified as the first stated quantity of pounds of forecasted sales in a future month. Prospective hedge effectiveness is assessed on these hedges using a dollar offset method. The dollar offset assessment involves comparing the effect of theoretical shifts in forward copper prices on the fair value of both the actual hedging derivative and a hypothetical hedging derivative. The retrospective assessment involves comparing the effect of historic changes in copper prices each period on the fair value of both the actual and hypothetical derivative using a dollar offset approach. The effective portion of changes in fair value of the copper contracts is recorded in OCI until the forecasted copper sale impacts earnings.
Concentrate sales at our Osborne mine contain both gold and copper, and as a result, are exposed to price changes of both commodities. For collars designated against copper concentrate production, the hedged items are identified as the first stated quantity of pounds of forecasted sales in a future month. Prospective hedge effectiveness is assessed using a regression method. The regression method involves comparing month-by-month changes in fair value of both the actual hedging derivative and a hypothetical derivative (derived from the price of concentrate) caused by actual historical changes in commodity prices over the last three years. The retrospective assessment involves comparing the effect of historic changes in copper prices each period on the fair value of both the actual and hypothetical derivative using a dollar offset approach. The effective portion of changes in fair value of the copper contracts is recorded in OCI until the forecasted copper sale impacts earnings.
Non-hedge Contracts
During 2009, we de-designated collar sell contracts for 79 million pounds and crystallized $31 million of losses in OCI, of which $30 million remains at year-end. These hedges were originally designated against future copper production at our Zaldívar mine. The exposure is still expected to occur and therefore amounts crystallized in OCI will be recorded in copper revenue when the originally designated sales occur. We continue to hold these collars as non-hedge contracts. At December 31, 2009, we had 79 million pounds of collar sell contracts outstanding. The contracts contain purchased put and sold call options with an average strike of $2.00/lb and $3.00/lb, respectively.
During 2009, we purchased 79 million call options at an average strike of $2.99/lb and sold 158 million call options at an average strike of $3.74/lb for a net premium of $8 million. Premiums paid have been recorded as a reduction of current period revenue. The options mature evenly throughout 2010.
These contracts are not designated as cash flow hedges. Changes in the fair value of these copper options are recorded in current period revenue.
136
Non-hedge Gains (Losses)
| | | | | | | | | |
For the years ended December 31 | | 2009 | | 2008 | | 2007 | | Income statement classification | |
Risk management activities | | | | | | | | | |
Commodity contracts | | | | | | | | | |
Copper | | $ | (53 | ) | $ | 73 | | $ | 48 | | Revenue | |
Fuel | | 1 | | (30 | ) | 7 | | Cost of sales | |
Steel | | — | | (3 | ) | — | | Project expense | |
Currency contracts | | (4 | ) | (8 | ) | (7 | ) | Cost of sales/corporate administration/other income/expense/ income tax expense | |
Interest rate contracts | | (7 | ) | (4 | ) | (2 | ) | Interest income/expense | |
Share purchase warrants | | — | | — | | (1 | ) | Other income/expense | |
| | (63 | ) | 28 | | 45 | | | |
Other use of derivative instruments | | | | | | | | | |
Commodity contracts | | | | | | | | | |
Gold | | 56 | | 19 | | (8 | ) | Revenue | |
Copper | | (2 | ) | — | | — | | Revenue | |
Interest rate contracts | | 3 | | — | | — | | Interest income/expense | |
| | 57 | | 19 | | (8 | ) | | |
Other gains (losses) | | | | | | | | | |
Embedded derivatives(1) | | 1 | | (3 | ) | (4 | ) | Revenue | |
Hedge ineffectiveness | | (3 | ) | (6 | ) | 4 | | Cost of sales/revenue/other income | |
Amounts excluded from effectiveness test | | — | | — | | — | | | |
Share purchase warrants | | — | | — | | (1 | ) | Other income/expense | |
| | $ | (2 | ) | $ | (9 | ) | $ | (1 | ) | | |
(1) Includes embedded derivatives on gold concentrate sales.
Derivative Assets and Liabilities
| | 2009 | | 2008 | |
| | | | | |
At January 1 | | $ | (43 | ) | $ | 389 | |
Derivatives cash (inflow) outflow | | | | | |
Operating activities | | (328 | ) | (147 | ) |
Financing activities | | 10 | | 23 | |
Change in fair value of: | | | | | |
Non-hedge derivatives | | (39 | ) | (7 | ) |
Cash flow hedges | | | | | |
Effective portion | | 708 | | (295 | ) |
Ineffective portion | | (3 | ) | (6 | ) |
At December 31 | | $ | 305 | | $ | (43 | ) |
Classification: | | | | | |
Other current assets | | $ | 214 | | $ | 817 | |
Other assets | | 290 | | 15 | |
Other current liabilities | | (180 | ) | (440 | ) |
Other long-term obligations | | (19 | ) | (435 | ) |
| | $ | 305 | | $ | (43 | ) |
137
Cash Flow Hedge Gains (Losses) in OCI
| | Commodity | | | | | | | | | | | | | |
| | price hedges | | Currency hedges | | Interest rate hedges | |
| | Gold/ | | | | | | Operating | | Administration | | Capital | | Cash | | Long-term | | | |
| | silver | | Copper | | Fuel | | costs | | costs | | expenditures | | balances | | debt | | Total | |
At January 1, 2007 | | $ | 17 | | $ | 57 | | $ | 21 | | $ | 155 | | $ | 14 | | $ | 39 | | $ | (3 | ) | $ | (17 | ) | $ | 283 | |
Effective portion of change in fair value of hedging instruments | | — | | (75 | ) | 87 | | 249 | | 32 | | (35 | ) | — | | (1 | ) | 257 | |
Transfers to earnings: | | | | | | | | | | | | | | | | | | | |
On recording hedged items in earnings | | (2 | ) | 32 | | (29 | ) | (166 | ) | (19 | ) | (5 | )(1) | 3 | | 1 | | (185 | ) |
At December 31, 2007 | | $ | 15 | | $ | 14 | | $ | 79 | | $ | 238 | | $ | 27 | | $ | (1 | ) | $ | — | | $ | (17 | ) | $ | 355 | |
Effective portion of change in fair value of hedging instruments | | — | | 582 | | (215 | ) | (610 | ) | (46 | ) | 5 | | — | | (17 | ) | (301 | ) |
Transfers to earnings: | | | | | | | | | | | | | | | | | | | |
On recording hedged items in earnings | | (2) | | (112) | | (33 | ) | (106 | ) | (11 | ) | (4 | ) | — | | 1 | | (267 | ) |
At December 31, 2008 | | $ | 13 | | $ | 484 | | $ | (169 | ) | $ | (478 | ) | $ | (30 | ) | $ | — | | $ | — | | $ | (33 | ) | $ | (213 | ) |
Effective portion of change in fair value of hedging instruments | | — | | (273 | ) | 68 | | 820 | | 42 | | 48 | | — | | — | | 705 | |
Transfers to earnings: | | | | | | | | | | | | | | | | | | | |
On recording hedged items in earnings | | (10) | | (283) | | 95 | | (22 | ) | 7 | | (3 | ) | — | | 3 | | (213 | ) |
Hedge ineffectiveness due to changes in original forecasted transaction | | — | | — | | 2 | | (5 | ) | — | | — | | — | | — | | (3 | ) |
At December 31, 2009 | | $ | 3 | | $ | (72 | ) | $ | (4 | ) | $ | 315 | | $ | 19 | | $ | 45 | | $ | — | | $ | (30 | ) | $ | 276 | |
| | Gold | | Copper | | Cost of | | Cost of | | | | | | Interest | | Interest | | | |
Hedge gains/losses classified within | | sales | | sales | | sales | | sales | | Administration | | Amortization | | income | | expense | | | |
Portion of hedge gain (loss) expected to affect 2010 earnings(2) | | $ | 2 | | $ | (72 | ) | $ | (27 | ) | $ | 98 | | $ | 14 | | $ | — | | $ | — | | $ | (3 | ) | $ | 12 | |
| | | | | | | | | | | | | | | | | | | | | | | | | | | | |
(1) | On determining that certain forecasted capital expenditures were no longer likely to occur within two months of the originally specified time frame. |
(2) | Based on the fair value of hedge contracts at December 31, 2009. |
Cash Flow Hedge Gains (Losses) at December 31
| | | | | | | | | | Amount of gain (loss) | |
| | | | | | Amount of gain (loss) | | Location of gain (loss) | | recognized in income | |
| | Amount of gain | | | | transferred from | | recognized in income | | (ineffective portion and | |
| | (loss) recognized | | Location of gain (loss) | | OCI into income | | (ineffective portion and | | amount excluded from | |
Derivatives in cash flow | | in OCI | | transferred from OCI into | | (effective portion) | | amount excluded from | | effectiveness testing) | |
hedging relationships | | 2009 | | 2008 | | income (effective portion) | | 2009 | | 2008 | | effectiveness testing) | | 2009 | | 2008 | |
Interest rate contracts | | $ | — | | $ | (17 | ) | Interest income/expense | | $ | (3 | ) | $ | (1 | ) | Interest income/expense | | $ | — | | $ | — | |
Foreign exchange contracts | | 910 | | (651 | ) | Cost of sales/corporate administration/amortization | | 21 | | 121 | | Cost of sales/ corporate administration | | 2 | | — | |
Commodity contracts | | (205 | ) | 367 | | Revenue/cost of sales | | 198 | | 147 | | Revenue/cost of sales | | (2 | ) | (6 | ) |
Total | | $ | 705 | | $ | (301 | ) | | | $ | 216 | | $ | 267 | | | | $ | — | | $ | (6 | ) |
138
f) Credit Risk
The fair value of derivative contracts is adjusted for credit risk based on observed credit default swap spreads. In cases where we have a legally enforceable master netting agreement with a counterparty, credit risk exposure represents the net amount of the positive and negative fair values by counterparty.
For derivatives in a net asset position, credit risk is measured using credit default swap spreads for each particular counterparty, as appropriate. For derivatives in a net liability position, credit risk is measured using Barrick’s credit default swap spreads. We mitigate credit risk on derivatives in a net asset position by:
· entering into derivatives with high credit-quality counterparties (investment grade);
· limiting the amount of exposure to each counterparty; and
· monitoring the financial condition of counterparties.
Location of credit risk is determined by physical location of the bank branch, customer or counterparty.
Credit Quality of Financial Assets
| | S&P Credit rating | |
| | AA– or | | A– or | | BBB or | | Not | | | |
At December 31, 2009 | | higher | | higher | | lower | | rated | | Total | |
Cash and equivalents(1) | | $ | 1,940 | | $ | 585 | | $ | 20 | | $ | 19 | | $ | 2,564 | |
Derivatives(2) | | 177 | | 195 | | — | | — | | 372 | |
Accounts receivable | | — | | 18 | | 48 | | 185 | | 251 | |
| | $ | 2,117 | | $ | 798 | | $ | 68 | | $ | 204 | | $ | 3,187 | |
Number of counterparties | | 15 | | 22 | | 16 | | | | | |
Largest counterparty (%) | | 19 | % | 49 | % | 25 | % | | | | |
Concentrations of Credit Risk
| | | | Other | | | | | |
| | | | investment | | | | | |
| | United | | grade | | Other | | | |
At December 31, 2009 | | States | | countries(3) | | international | | Total | |
Cash and equivalents(1) | | $ | 2,354 | | $ | 162 | | $ | 48 | | $ | 2,564 | |
Derivatives(2) | | 61 | | 99 | | 212 | | 372 | |
Accounts receivable | | 20 | | 87 | | 144 | | 251 | |
| | $ | 2,435 | | $ | 348 | | $ | 404 | | $ | 3,187 | |
(1) | Based on where the parent entity of the counterparties we transact with is domiciled. |
(2) | The amounts presented reflect the net credit exposure after considering the effect of master netting agreements. |
(3) | Investment grade countries include Canada, Chile, Australia, and Peru. Investment grade countries are defined as being rated BBB– or higher by S&P. |
g) Risks Relating to the Use of Derivatives
By using derivatives, in addition to credit risk, we are affected by market risk. Market risk is the risk that the fair value of a derivative might be adversely affected by a change in commodity prices, interest rates, or currency exchange rates, and that this in turn affects our financial condition. We manage market risk by establishing and monitoring parameters that limit the types and degree of market risk that may be undertaken.
h) Settlement Obligation to Close Out Gold Sales Contracts
In September 2009, we announced a plan to eliminate our “Gold Hedges” and a significant portion of our “Floating Contracts”.
Our “Gold Hedges” were fixed price contracts which did not participate in gold price movements. At the time we announced the plan to eliminate them, our Gold Hedges totaled 3.0 million ounces with a mark-to-market (“MTM”) position (calculated at a spot price of $993 per ounce) of negative $1.9 billion.
Our “Floating Contracts” are essentially Gold Hedges that have been offset against future movements in the gold price but not yet settled. At the time we announced the plan to eliminate a significant portion of our Floating Contracts, they had a MTM position of negative $3.7 billion. This liability does not change with gold prices and is therefore economically similar to a fixed US dollar obligation. No activity in the gold market is required to settle the Floating Contracts and we fully participate in any subsequent increase in the price of gold. As at December 31, 2009, the obligation relating to the Floating Contracts has been reduced to $0.6 billion. The obligation related to the Floating Contracts are non-amortizing and primarily have 10-year terms with a current weighted average financing charge of approximately 2%–3%. Any further reductions in the obligation related to the Floating Contracts will be subject to the same capital allocation process as our other liabilities.
139
21 · Fair Value Measurements
Fair value is the price that would be received to sell an asset or paid to transfer a liability in an orderly transaction between market participants at the measurement date. The fair value hierarchy establishes three levels to classify the inputs to valuation techniques used to measure fair value. Level 1 inputs are quoted prices (unadjusted) in active markets for identical assets or liabilities. Level 2 inputs are quoted prices in markets that are not active, quoted prices for similar assets or liabilities in active markets, inputs other than quoted prices that are observable for the asset or liability (for example, interest rate and yield curves observable at commonly quoted intervals, forward pricing curves used to value currency and commodity contracts and volatility measurements used to value option contracts), or inputs that are derived principally from or corroborated by observable market data or other means. Level 3 inputs are unobservable (supported by little or no market activity). The fair value hierarchy gives the highest priority to Level 1 inputs and the lowest priority to Level 3 inputs.
a) Assets and Liabilities Measured at Fair Value on a Recurring Basis
Fair Value Measurements at December 31, 2009
| | Quoted prices | | Significant | | | | | |
| | in active | | other | | Significant | | | |
| | markets for | | observable | | unobservable | | Aggregate | |
| | identical assets | | inputs | | inputs | | fair | |
| | (Level 1) | | (Level 2) | | (Level 3) | | value | |
| | | | | | | | | |
Cash equivalents | | $ | 2,055 | | $ | — | | $ | — | | $ | 2,055 | |
Available-for-sale securities | | 61 | | — | | — | | 61 | |
Receivables from provisional copper and gold sales | | — | | 118 | | — | | 118 | |
Derivative instruments | | — | | 305 | | — | | 305 | |
Settlement obligation to close out gold sales contracts | | — | | (647 | ) | — | | (647 | ) |
| | $ | 2,116 | | $ | (224 | ) | $ | — | | $ | 1,892 | |
b) Fair Values of Financial Instruments
| | 2009 | | 2008 | |
| | | | Estimated | | | | Estimated | |
| | Carrying | | fair | | Carrying | | fair | |
At December 31 | | amount | | value | | amount | | value | |
Financial assets | | | | | | | | | |
Cash and equivalents(1) | | $ | 2,564 | | $ | 2,564 | | $ | 1,437 | | $ | 1,437 | |
Accounts receivable(1) | | 251 | | 251 | | 197 | | 197 | |
Available-for-sale securities(2) | | 61 | | 61 | | 31 | | 31 | |
Derivative assets | | 504 | | 504 | | 832 | | 832 | |
| | $ | 3,380 | | $ | 3,380 | | $ | 2,497 | | $ | 2,497 | |
Financial liabilities | | | | | | | | | |
Accounts payable(1) | | $ | 1,221 | | $ | 1,221 | | $ | 953 | | $ | 953 | |
Long-term debt(3) | | 6,335 | | 6,723 | | 4,556 | | 3,620 | |
Derivative liabilities | | 199 | | 199 | | 875 | | 875 | |
Settlement obligation to close out gold sales contracts | | 647 | | 647 | | — | | — | |
Restricted share units(4) | | 124 | | 124 | | 120 | | 120 | |
Deferred share units(4) | | 6 | | 6 | | 5 | | 5 | |
| | $ | 8,532 | | $ | 8,920 | | $ | 6,509 | | $ | 5,573 | |
(1) | Fair value approximates the carrying amounts due to the short-term nature and historically negligible credit losses. |
(2) | Recorded at fair value. Quoted market prices are used to determine fair value. |
(3) | Long-term debt is generally recorded at cost except for obligations that are designated in a fair-value hedge relationship, which are recorded at fair value in periods when a hedge relationship exists. The fair value of long-term debt is primarily determined using quoted market prices. Balance includes current portion of long-term debt. |
(4) | Recorded at fair value based on our period-end closing market share price. |
c) Assets Measured at Fair Value on a Non-recurring Basis
| | Quoted prices | | Significant | | | | | |
| | in active | | other | | Significant | | | |
| | markets for | | observable | | unobservable | | Aggregate | |
| | identical assets | | inputs | | inputs | | fair | |
| | (Level 1) | | (Level 2) | | (Level 3) | | value | |
Property, plant and equipment(1) | | $ | — | | $ | — | | $ | 125 | | $ | 125 | |
Intangible assets(2) | | — | | — | | — | | — | |
Goodwill(3) | | $ | — | | $ | — | | $ | 25 | | $ | 25 | |
(1) | Property plant and equipment with a carrying amount of $290 million were written down to their fair value of $125 million, resulting in an impairment of $165 million, which was included in earnings this period. Refer to note 15. |
(2) | Intangible assets with a carrying amount of $34 million were written down to their fair value of nil, resulting in an impairment of $34 million, which was included in earnings this period. Refer to note 16. |
(3) | Goodwill with a carrying amount of $88 million was written down to its fair value of $25 million, resulting in an impairment of $63 million, which was included in earnings this period. Refer to note 17. |
140
d) Valuation Techniques
Cash Equivalents
The fair value of our cash equivalents are classified within Level 1 of the fair value hierarchy because they are valued using quoted market prices in active markets. Our cash equivalents are comprised of U.S. Treasury bills and money market securities that are invested primarily in U.S. Treasury bills.
Available-for-Sale Securities
The fair value of available-for-sale securities is determined based on a market approach reflecting the closing price of each particular security at the balance sheet date. The closing price is a quoted market price obtained from the exchange that is the principal active market for the particular security, and therefore available-for-sale securities are classified within Level 1 of the fair value hierarchy.
Derivative Instruments
The fair value of derivative instruments is determined using either present value techniques or option pricing models that utilize a variety of inputs that are a combination of quoted prices and market-corroborated inputs. The fair values of all our derivative contracts include an adjustment for credit risk. For counterparties in a net asset position credit risk is based upon the observed credit default swap spread for each particular counterparty, as appropriate. For counterparties in a net liability position credit risk is based upon Barrick’s observed credit default swap spread. The fair value of US dollar interest rate and currency swap contracts is determined by discounting contracted cash flows using a discount rate derived from observed LIBOR and swap rate curves and CDS rates. In the case of currency contracts, we convert non-US dollar cash flows into US dollars using an exchange rate derived from currency swap curves and CDS rates. The fair value of commodity forward contracts is determined by discounting contractual cash flows using a discount rate derived from observed LIBOR and swap rate curves and CDS rates. Contractual cash flows are calculated using a forward pricing curve derived from observed forward prices for each commodity. Derivative instruments are classified within Level 2 of the fair value hierarchy.
Receivables from Provisional Copper and Gold Sales
The fair value of receivables rising from copper and gold sales contracts that contain provisional pricing mechanisms is determined using the appropriate quoted forward price from the exchange that is the principal active market for the particular metal. As such, these receivables are classified within Level 2 of the fair value hierarchy.
Property Plant and Equipment, Intangible Assets and Goodwill
The fair value of property plant and equipment and intangible assets is determined primarily using an income approach based on unobservable cash flows and, as a result, are classified within Level 3 of the fair value hierarchy. Refer to notes 15, 16, and 17.
141
22 · Asset Retirement Obligations
Asset Retirement Obligations (AROs)
| | 2009 | | 2008 | |
At January 1 | | $ | 1,036 | | $ | 932 | |
AROs acquired during the year | | 30 | | 37 | |
AROs arising in the year | | 119 | | 56 | |
Impact of revisions to expected cash flows | | | | | |
Recorded in earnings | | 10 | | 9 | |
Settlements | | | | | |
Cash payments | | (39 | ) | (38 | ) |
Settlement gains | | (6 | ) | (5 | ) |
Accretion | | 57 | | 45 | |
At December 31 | | 1,207 | | 1,036 | |
Current portion (note 19) | | (85 | ) | (93 | ) |
| | $ | 1,122 | | $ | 943 | |
Each period we assess cost estimates and other assumptions used in the valuation of AROs at each of our mineral properties to reflect events, changes in circumstances and new information available. Changes in these cost estimates and assumptions have a corresponding impact on the fair value of the ARO. For closed mines, any change in the fair value of AROs results in a corresponding charge or credit within other expense, whereas at operating mines the charge is recorded as an adjustment to the carrying amount of the corresponding asset. In 2009, charges of $10 million were recorded for changes in cost estimates for AROs at closed mines and at Barrick Energy (2008: $9 million; 2007: $6 million).
At December 31 | | 2009 | | 2008 | |
Operating mines | | | | | |
ARO increase(1) | | $ | 119 | | $ | 56 | |
ARO decrease(2) | | (1 | ) | (3 | ) |
Closed mines | | | | | |
ARO increase(3) | | 8 | | 9 | |
Barrick Energy | | | | | |
ARO increase | | 2 | | — | |
| | | | | | | |
(1) | These adjustments were recorded with a corresponding adjustment to property, plant and equipment. |
(2) | Represents a decrease in AROs at a mine where the corresponding ARO asset had been fully amortized and was therefore recorded as a recovery in other income. |
(3) | For closed mines, any change in the fair value of AROs results in a corresponding charge or credit to other expense or other income, respectively. |
AROs arise from the acquisition, development, construction and normal operation of mining property, plant and equipment, due to government controls and regulations that protect the environment on the closure and reclamation of mining properties. The major parts of the carrying amount of AROs relate to tailings and heap leach pad closure/rehabilitation; demolition of buildings/mine facilities; ongoing water treatment; and ongoing care and maintenance of closed mines. The fair values of AROs are measured by discounting the expected cash flows using a discount factor that reflects the credit-adjusted risk-free rate of interest. We prepare estimates of the timing and amount of expected cash flows when an ARO is incurred. We update expected cash flows to reflect changes in facts and circumstances. The principal factors that can cause expected cash flows to change are: the construction of new processing facilities; changes in the quantities of material in reserves and a corresponding change in the life-of-mine plan; changing ore characteristics that impact required environmental protection measures and related costs; changes in water quality that impact the extent of water treatment required; and changes in laws and regulations governing the protection of the environment. When expected cash flows increase, the revised cash flows are discounted using a current discount factor whereas when expected cash flows decrease the reduced cash flows are discounted using a historic discount factor, and then in both cases any change in the fair value of the ARO is recorded. We record the fair value of an ARO when it is incurred. At producing mines AROs incurred and changes in the fair value of AROs are recorded as an adjustment to the corresponding asset carrying amounts. At closed mines, any adjustment to the fair value of an ARO is charged directly to earnings. AROs are adjusted to reflect the passage of time (accretion) calculated by applying the discount factor implicit in the initial fair-value measurement to the beginning-of-period carrying amount of the AROs. For producing mines, development projects and closed mines, accretion is recorded in amortization and accretion. Upon settlement of an ARO, we record a gain or loss if the actual cost differs from the carrying amount of the ARO. Settlement gains/losses are recorded in other (income) expense. Other environmental remediation costs that are not AROs are expensed as incurred (see note 8a).
23 · Other Non-current Liabilities
At December 31 | | 2009 | | 2008 | |
Deposit on silver sale agreement (note 6) | | $ | 196 | | $ | — | |
Pension benefits (note 29c) | | 96 | | 113 | |
Other post-retirement benefits (note 29e) | | 26 | | 29 | |
Derivative liabilities (note 20e) | | 19 | | 435 | |
Restricted share units (note 28b) | | 91 | | 120 | |
Other | | 70 | | 81 | |
| | $ | 498 | | $ | 778 | |
142
24 · Deferred Income Taxes
Recognition and Measurement
We record deferred income tax assets and liabilities where temporary differences exist between the carrying amounts of assets and liabilities in our balance sheet and their tax bases. The measurement and recognition of deferred income tax assets and liabilities takes into account: enacted rates that will apply when temporary differences reverse; interpretations of relevant tax legislation; tax planning strategies; estimates of the tax bases of assets and liabilities; and the deductibility of expenditures for income tax purposes. We recognize the effect of changes in our assessment of these estimates and factors when they occur. Changes in deferred income tax assets, liabilities and valuation allowances are allocated between net income and other comprehensive income based on the source of the change.
Deferred income taxes have not been provided on the undistributed earnings of foreign subsidiaries, which are considered to be reinvested indefinitely outside Canada. The determination of the unrecorded deferred income tax liability is not considered practicable.
Sources of Deferred Income Tax Assets and Liabilities
At December 31 | | 2009 | | 2008 | |
Deferred tax assets | | | | | |
Tax loss carry forwards | | $ | 659 | | $ | 657 | |
Alternative minimum tax (“AMT”) credits | | 287 | | 251 | |
Asset retirement obligations | | 413 | | 366 | |
Property, plant and equipment | | 268 | | 232 | |
Post-retirement benefit obligations | | 16 | | 32 | |
Derivative instruments | | — | | 90 | |
Accrued interest payable | | 108 | | 70 | |
Other | | — | | 3 | |
| | 1,751 | | 1,701 | |
Valuation allowances | | (481 | ) | (318 | ) |
| | 1,270 | | 1,383 | |
Deferred tax liabilities | | | | | |
Property, plant and equipment | | (1,328 | ) | (1,102 | ) |
Derivative instruments | | (81 | ) | — | |
Inventory | | (70 | ) | (162 | ) |
Other | | (26 | ) | (4 | ) |
| | $ | (235 | ) | $ | 115 | |
Classification: | | | | | |
Non-current assets | | 949 | | 869 | |
Non-current liabilities | | (1,184 | ) | (754 | ) |
| | $ | (235 | ) | $ | 115 | |
Expiry Dates of Tax Losses and AMT Credits
| | | | | | | | | | | | No | | | |
| | | | | | | | | | | | expiry | | | |
| | 2010 | | 2011 | | 2012 | | 2013 | | 2014+ | | date | | Total | |
Tax losses(1) | | | | | | | | | | | | | | | |
Canada | | $ | 9 | | $ | — | | $ | 2 | | $ | — | | $ | 1,530 | | $ | — | | $ | 1,541 | |
Barbados | | — | | — | | — | | — | | 6,933 | | — | | 6,933 | |
Chile | | — | | — | | — | | — | | — | | 369 | | 369 | |
Tanzania | | — | | — | | — | | — | | — | | 101 | | 101 | |
U.S. | | — | | — | | — | | — | | 219 | | — | | 219 | |
Other | | — | | 1 | | 3 | | — | | 12 | | 98 | | 114 | |
| | $ | 9 | | $ | 1 | | $ | 5 | | $ | — | | $ | 8,694 | | $ | 568 | | $ | 9,277 | |
AMT credits(2) | | — | | — | | — | | — | | — | | $ | 287 | | $ | 287 | |
(1) | Represents the gross amount of tax loss carry forwards translated at closing exchange rates at December 31, 2009. |
(2) | Represents the amounts deductible against future taxes payable in years when taxes payable exceed “minimum tax” as defined by United States tax legislation. |
Net Deferred Tax Assets
| | 2009 | | 2008 | |
Gross deferred tax assets | | | | | |
Canada | | $ | 366 | | $ | 384 | |
Chile | | 44 | | 41 | |
Argentina | | 119 | | 61 | |
Australia | | 109 | | 171 | |
Tanzania | | 122 | | 199 | |
United States | | 542 | | 289 | |
Barbados | | 69 | | 10 | |
Other | | 59 | | 32 | |
| | 1,430 | | 1,187 | |
Valuation allowances | | | | | |
Canada | | (45 | ) | (50 | ) |
Chile | | (22 | ) | (23 | ) |
Argentina | | (119 | ) | (61 | ) |
Australia | | (11 | ) | (9 | ) |
Tanzania | | (30 | ) | (30 | ) |
United States | | (136 | ) | (123 | ) |
Barbados | | (69 | ) | (10 | ) |
Other | | (49 | ) | (12 | ) |
| | $ | (481 | ) | $ | (318 | ) |
Net | | $ | 949 | | $ | 869 | |
143
Valuation Allowances
We consider the need to record a valuation allowance against deferred tax assets, taking into account the effects of local tax law. A valuation allowance is not recorded when we conclude that sufficient positive evidence exists to demonstrate that it is more likely than not that a deferred tax asset will be realized. The main factors considered are:
· Historic and expected future levels of taxable income;
· Tax plans that affect whether tax assets can be realized; and
· The nature, amount and expected timing of reversal of taxable temporary differences.
Levels of future taxable income are mainly affected by: market gold and silver prices; forecasted future costs and expenses to produce gold reserves; quantities of proven and probable gold reserves; market interest rates; and foreign currency exchange rates. If these factors or other circumstances change, we record an adjustment to valuation allowances to reflect our latest assessment of the amount of deferred tax assets that will more likely than not be realized.
A deferred income tax asset totaling $321 million has been recorded in Canada. This deferred tax asset primarily arose due to mark-to-market losses realized for acquired Placer Dome derivative instruments. Projections of various sources of income support the conclusion that the realizability of this deferred tax asset is more likely than not, and consequently no valuation allowance has been set up for this deferred tax asset.
A deferred tax asset of $92 million has been recorded in Tanzania following the release of tax valuation allowances totaling $189 million in 2007. The release of tax valuation allowances resulted from the impact of rising market gold prices on expectations of future taxable income and the ability to realize these tax assets.
A partial valuation allowance of $136 million has been set up against deferred tax assets in the United States at December 31, 2009. The majority of this valuation allowance relates to AMT credits in periods when partly due to low market gold prices, Barrick was an AMT taxpayer in the United States. If market gold prices continue to rise, it is reasonably possible that some or all of these valuation allowances could be released in future periods.
Source of Changes in Deferred Tax Balances
For the years ended December 31 | | 2009 | | 2008 | | 2007 | |
Temporary differences | | | | | | | |
Property, plant and equipment | | $ | (279 | ) | $ | (3 | ) | $ | 24 | |
Asset retirement obligations | | 47 | | 24 | | 39 | |
Tax loss carry forwards | | 2 | | (72 | ) | (69 | ) |
Derivatives | | (171 | ) | 212 | | (113 | ) |
Other | | 8 | | (2 | ) | 9 | |
| | $ | (393 | ) | $ | 159 | | $ | (110 | ) |
Net currency translation gains/(losses) on deferred tax balances | | 40 | | (98 | ) | 76 | |
Canadian tax rate changes | | (59 | ) | — | | (64 | ) |
Canadian functional currency election | | 70 | | — | | — | |
Release of end of year Tanzanian valuation allowances | | — | | — | | 156 | |
Release of other valuation allowances | | — | | 175 | | 88 | |
| | $ | (342 | ) | $ | 236 | | $ | 146 | |
Intraperiod allocation to: | | | | | | | |
Income (loss) from continuing operations before income taxes | | $ | (107 | ) | $ | 41 | | $ | 202 | |
Income (loss) from discontinued operations | | (41 | ) | 4 | | (28 | ) |
Porgera mine acquisition | | — | | — | | 20 | |
Acquisition of Hemlo | | (56 | ) | — | | — | |
Share issue costs | | 40 | | — | | — | |
Cortez acquisition (note 3h) | | — | | 11 | | — | |
Barrick Energy Inc. acquisition (note 3g) | | — | | (22 | ) | — | |
Kainantu acquisition | | — | | (19 | ) | — | |
Other acquisition | | — | | 2 | | — | |
OCI (note 26) | | (178 | ) | 219 | | (48 | ) |
Other | | (8 | ) | (2 | ) | 5 | |
| | $ | (350 | ) | $ | 234 | | $ | 151 | |
| | | | | | | |
Unrecognized Tax Benefits | | | | | | | |
| | | | | | | |
| | | | 2009 | | 2008 | |
Balance at January 1 | | | | $ | 46 | | $ | 15 | |
Additions based on tax positions related to the current year | | | | — | | 2 | |
Additions for tax positions of prior years | | | | 38 | | 40 | |
Reductions for tax positions of prior years | | | | — | | — | |
Settlements | | | | (17 | ) | (11 | ) |
Balance at December 31(1),(2) | | | | $ | 67 | | $ | 46 | |
(1) | If recognized, the total amount of $67 million would be recognized as a benefit to income taxes on the income statement, and therefore would impact the reported effective tax rate. |
(2) | Includes interest and penalties of $1 million. |
144
We anticipate the amount of unrecognized tax benefits to decrease within 12 months of the reporting date by approximately $5 million to $7 million, related primarily to the expected settlement of income tax and mining tax assessments.
We further anticipate that it is reasonably possible for the amount of unrecognized tax benefits to decrease within 12 months of the reporting date by approximately $37 million through a potential settlement with tax authorities that may result in a reduction of available tax pools.
Tax Years Still Under Examination
Canada | | 2005–2009 |
United States | | 2006, 2007, 2009 |
Peru | | 2005–2009 |
Chile(1) | | 2006–2009 |
Argentina | | 2004–2009 |
Australia | | all years open |
Papua New Guinea | | 2004–2009 |
Tanzania | | all years open |
(1) In addition, operating loss carry forwards from earlier periods are still open for examination.
Peruvian Tax Assessment
On September 30, 2004, the Tax Court of Peru issued a decision in our favor in the matter of our appeal of a 2002 income tax assessment for an amount of $32 million, excluding interest and penalties. The assessment mainly related to the validity of a revaluation of the Pierina mining concession, which affected its tax basis for the years 1999 and 2000. The full life-of-mine effect on current and deferred income tax liabilities totaling $141 million was fully recorded at December 31, 2002, as well as other related costs of about $21 million.
In January 2005, we received written confirmation that there would be no appeal of the September 30, 2004 Tax Court of Peru decision. In December 2004, we recorded a $141 million reduction in current and deferred income tax liabilities and a $21 million reduction in other accrued costs. The confirmation concluded the administrative and judicial appeals process with resolution in Barrick’s favor.
Notwithstanding the favorable Tax Court decision we received in 2004 on the 1999 to 2000 revaluation matter, in an audit concluded in 2005, SUNAT has reassessed us on the same issue for tax years 2001 to 2003. On October 19, 2007, SUNAT confirmed their reassessment. The tax assessment is for $51 million of tax, plus interest and penalties of $182 million updated as of December 31, 2009. We filed an appeal to the Tax Court of Peru within the statutory period. We believe that the audit reassessment has no merit, that we will prevail in court again, and accordingly no liability has been recorded for this reassessment.
25 · Capital Stock
a) Common Shares
Our authorized capital stock includes an unlimited number of common shares (issued 984,327,816 common shares); 9,764,929 First preferred shares Series A (issued nil); 9,047,619 Series B (issued nil); and 14,726,854 Second preferred shares Series A (issued nil).
Common Share Offering
On September 23, 2009, we issued 109 million common shares of Barrick at a price of $36.95 per share, for net proceeds of $3,885 million.
In 2009, we declared and paid dividends in US dollars totaling $0.40 per share ($369 million) (2008: $0.40 per share, $349 million; 2007: $0.30 per share, $261 million).
b) Exchangeable Shares
In connection with a 1998 acquisition, Barrick Gold Inc. (“BGI”) issued 11.1 million BGI exchangeable shares, which were each exchangeable for 0.53 of a Barrick common share at any time at the option of the holder, and had essentially the same voting, dividend (payable in Canadian dollars), and other rights as 0.53 of a Barrick common share. BGI is a subsidiary that holds our interest in the Hemlo and Eskay Creek Mines. We had the right to require the exchange of each outstanding BGI exchangeable share for 0.53 of a Barrick common share. In first quarter 2009, the remaining 0.5 million BGI exchangeable shares were redeemed for 0.3 million Barrick common shares.
145
26 · Other Comprehensive Income (Loss) (“OCI”)
| | 2009 | | 2008 | | 2007 | |
Accumulated OCI at January 1 | | | | | | | |
Cash flow hedge gains (losses), net of tax of $89, $105, $60 | | $ | (124 | ) | $ | 250 | | $ | 223 | |
Investments, net of tax of $nil, $4, $7 | | (2 | ) | 37 | | 46 | |
Currency translation adjustments, net of tax of $nil, $nil, $nil | | (197 | ) | (143 | ) | (143 | ) |
Pension plans and other post-retirement benefits, net of tax of $19, $2, $4 | | (33 | ) | 7 | | (7 | ) |
| | $ | (356 | ) | $ | 151 | | $ | 119 | |
Other comprehensive income (loss) for the period: | | | | | | | |
Changes in fair value of cash flow hedges | | 705 | | (301 | ) | 257 | |
Changes in fair value of investments | | 34 | | (52 | ) | 58 | |
Currency translation adjustments(1) | | 56 | | (54 | ) | — | |
Pension plan and other post-retirement benefit adjustments (note 29c): | | | | | | | |
Net actuarial gain (loss) | | 15 | | (62 | ) | 19 | |
Transition obligation (asset) | | — | | 1 | | 1 | |
Less: reclassification adjustments for gains/losses recorded in earnings: | | | | | | | |
Transfers of cash flow hedge gains to earnings on recording hedged items in earnings | | (216 | ) | (267 | ) | (185 | ) |
Investments: | | | | | | | |
Other than temporary impairment charges | | 1 | | 26 | | 1 | |
Gains realized on sale | | (6 | ) | (17 | ) | (71 | ) |
Other comprehensive income (loss), before tax | | 589 | | (726 | ) | 80 | |
Income tax recovery (expense) related to OCI | | (178 | ) | 219 | | (48 | ) |
Other comprehensive income (loss), net of tax | | $ | 411 | | $ | (507 | ) | $ | 32 | |
Accumulated OCI at December 31 | | | | | | | |
Cash flow hedge gains (losses), net of tax of $81, $89, $105 | | 195 | | (124 | ) | 250 | |
Investments, net of tax of $3, $nil, $4 | | 24 | | (2 | ) | 37 | |
Currency translation adjustments, net of tax of $nil, $nil, $nil | | (141 | ) | (197 | ) | (143 | ) |
Pension plans and other post-retirement benefits, net of tax of $14, $19, $2 | | (23 | ) | (33 | ) | 7 | |
| | $ | 55 | | $ | (356 | ) | $ | 151 | |
(1) Represents currency translation adjustments for Barrick Energy.
27 · Non-controlling Interests
| | Pueblo Viejo project | | Tulawaka mine | | Other(1) | | Total | |
At January 1, 2007 | | $ | 55 | | $ | 1 | | $ | — | | $ | 56 | |
Share of income (loss) | | (30 | ) | 16 | | — | | (14 | ) |
Cash contributed | | 35 | | — | | — | | 35 | |
Increase in non-controlling interest | | — | | — | | 5 | | 5 | |
At December 31, 2007 | | $ | 60 | | $ | 17 | | $ | 5 | | $ | 82 | |
Share of income (loss) | | (26 | ) | 38 | | — | | 12 | |
Cash contributed (withdrawn) | | 120 | | (30 | ) | — | | 90 | |
Decrease in non-controlling interest | | — | | — | | (2 | ) | (2 | ) |
At December 31, 2008 | | $ | 154 | | $ | 25 | | $ | 3 | | $ | 182 | |
Share of income (loss) | | 1 | | 5 | | — | | 6 | |
Cash contributed (withdrawn) | | 307 | | (8 | ) | — | | 299 | |
Decrease in non-controlling interest | | — | | — | | (3 | ) | (3 | ) |
At December 31, 2009 | | $ | 462 | | $ | 22 | | $ | — | | $ | 484 | |
(1) | Represents non-controlling interest in Arizona Star and Minera Sierra Mariposa. In 2007, Barrick acquired 94% of the common shares of Arizona Star and in 2008, the remaining common shares were acquired. In 2008, Barrick acquired 76.3% of the common shares of Minera Sierra Mariposa and in 2009, these common shares were sold. |
146
28 · Stock-based Compensation
a) Stock Options
Under Barrick’s stock option plan, certain officers and key employees of the Corporation may purchase common shares at an exercise price that is equal to the closing share price on the day before the grant of the option. The grant date is the date when the details of the award, including the number of options granted by individual and the exercise price, are approved. Stock options vest evenly over four years, beginning in the year after granting. Options granted in July 2004 and prior are exercisable over 10 years, whereas options granted since December 2004 are exercisable over seven years. At December 31, 2009, 6.9 million (2008: 7.4 million; 2007: 10 million) common shares, in addition to those currently outstanding, were available for granting options. Stock options when exercised result in an increase to the number of common shares issued by Barrick.
Compensation expense for stock options was $27 million in 2009 (2008: $25 million; 2007: $25 million), and is presented as a component of corporate administration and other expense, consistent with the classification of other elements of compensation expense for those employees who had stock options. The recognition of compensation expense for stock options reduced earnings per share for 2009 by $0.03 per share (2008: $0.03 per share; 2007: $0.03 per share).
Total intrinsic value relating to options exercised in 2009 was $38 million (2008: $61 million; 2007: $58 million).
Employee Stock Option Activity (Number of Shares in Millions)
| | 2009 | | 2008 | | 2007 | |
| | | | Average | | | | Average | | | | Average | |
| | Shares | | price | | Shares | | price | | Shares | | price | |
C$ options | | | | | | | | | | | | | |
At January 1 | | 4.8 | | $ | 27 | | 7.1 | | $ | 27 | | 11.9 | | $ | 28 | |
Exercised | | (1.4 | ) | 26 | | (2.1 | ) | 28 | | (3.9 | ) | 28 | |
Forfeited | | — | | — | | — | | — | | (0.1 | ) | 29 | |
Cancelled/expired | | (0.1 | ) | 23 | | (0.2 | ) | 28 | | (0.8 | ) | 35 | |
At December 31 | | 3.3 | | $ | 27 | | 4.8 | | $ | 27 | | 7.1 | | $ | 27 | |
US$ options | | | | | | | | | | | | | |
At January 1 | | 8.9 | | $ | 28 | | 7.0 | | $ | 28 | | 7.7 | | $ | 25 | |
Granted | | 1.6 | | 41 | | 2.8 | | 34 | | 1.4 | | 40 | |
Exercised | | (1.3 | ) | 24 | | (0.8 | ) | 24 | | (1.7 | ) | 23 | |
Forfeited | | (0.1 | ) | 35 | | (0.1 | ) | 31 | | (0.3 | ) | 25 | |
Cancelled/expired | | — | | — | | — | | — | | (0.1 | ) | 22 | |
At December 31 | | 9.1 | | $ | 33 | | 8.9 | | $ | 28 | | 7.0 | | $ | 28 | |
Stock Options Outstanding (Number of Shares in Millions)
| | Outstanding | | Exercisable | |
| | | | | | | | Intrinsic | | | | | | Intrinsic | |
| | | | Average | | Average | | value(1) | | | | Average | | value(1) | |
Range of exercise prices | | Shares | | price | | life (years) | | ($ millions) | | Shares | | price | | ($ millions) | |
C$ options | | | | | | | | | | | | | | | |
$ 22 – $ 27 | | 1.8 | | $ | 24 | | 2 | | $ | 31 | | 1.8 | | $ | 24 | | $ | 31 | |
$ 28 – $ 31 | | 1.5 | | 30 | | 4 | | 18 | | 1.5 | | 30 | | 18 | |
| | 3.3 | | $ | 27 | | 3 | | $ | 49 | | 3.3 | | $ | 27 | | $ | 49 | |
US$ options | | | | | | | | | | | | | | | |
$ 9 – $ 19 | | 0.1 | | $ | 13 | | 3 | | $ | 3 | | 0.1 | | $ | 13 | | $ | 3 | |
$ 20 – $ 27 | | 3.9 | | 25 | | 4 | | 55 | | 2.6 | | 25 | | 39 | |
$ 28 – $ 32 | | 1.1 | | 30 | | 6 | | 10 | | 0.8 | | 30 | | 7 | |
$ 33 – $ 42 | | 4.0 | | 41 | | 5 | | (8 | ) | 0.9 | | 42 | | — | |
| | 9.1 | | $ | 33 | | 4 | | $ | 60 | | 4.4 | | $ | 29 | | $ | 49 | |
(1) Based on the closing market share price on December 31, 2009 of C$41.46 and US$39.38.
147
Option Information
For the years ended December 31 | | | | | | | |
(per share and per option amounts in dollars) | | 2009 | | 2008 | | 2007 | |
| | | | | | | |
Valuation assumptions | | Lattice | (1),(2) | Lattice | (1),(2) | Lattice | (1),(2) |
Expected term (years) | | 5.0–5.1 | | 4.5–5.2 | | 4.5–5 | |
Expected volatility(2) | | 35%–60% | | 30%–70% | | 30%–38% | |
Weighted average expected volatility(2) | | 51% | | 43% | | 36.6% | |
Expected dividend yield | | 1%–1.1% | | 0.7%–1.5% | | 0.7%–0.9% | |
Risk-free interest rate(2) | | 0.16%–3.44% | | 0.25%–5.1% | | 3.2%–5.1% | |
| | | | | | | |
Options granted (in millions) | | 1.6 | | 2.8 | | 1.4 | |
Weighted average fair value per option | | $ | 12.92 | | $ | 12.07 | | $ | 12.91 | |
| | | | | | | | | | |
(1) | Different assumptions were used for the multiple stock option grants during the year. |
(2) | The volatility and risk-free interest rate assumption varied over the expected term of these stock option grants. |
The expected volatility assumptions have been developed taking into consideration both historical and implied volatility of our US dollar share price. The risk-free rate for periods within the contractual life of the option is based on the US Treasury yield curve in effect at the time of the grant.
We use the straight-line method for attributing stock option expense over the vesting period. Stock option expense incorporates an expected forfeiture rate. The expected forfeiture rate is estimated based on historical forfeiture rates and expectations of future forfeiture rates. We make adjustments if the actual forfeiture rate differs from the expected rate.
The expected term assumption is derived from the option valuation model and is in part based on historical data regarding the exercise behavior of option holders based on multiple share-price paths. The Lattice model also takes into consideration employee turnover and voluntary exercise patterns of option holders.
As at December 31, 2009, there was $58 million (2008: $42 million; 2007: $33 million) of total unrecognized compensation cost relating to unvested stock options. We expect to recognize this cost over a weighted average period of 2 years (2008: two years; 2007: two years).
b) Restricted Share Units (RSUs) and Deferred Share Units (DSUs)
Under our RSU plan, selected employees are granted RSUs where each RSU has a value equal to one Barrick common share. RSUs vest at the end of a two and a half or three-year period and are settled in cash on the third anniversary of the grant date. Additional RSUs are credited to reflect dividends paid on Barrick common shares over the vesting period.
A liability for RSUs is recorded at fair value on the grant date, with a corresponding amount recorded as a deferred compensation asset that is amortized on a straight-line basis over the vesting period. Changes in the fair value of the RSU liability are recorded each period, with a corresponding adjustment to the deferred compensation asset.
Compensation expense for RSUs incorporates an expected forfeiture rate. The expected forfeiture rate is estimated based on historical forfeiture rates and expectations of future forfeiture rates. We make adjustments if the actual forfeiture rate differs from the expected rate. At December 31, 2009, the weighted average remaining contractual life of RSUs was 1.64 years.
Compensation expense for RSUs was $40 million in 2009 (2008: $33 million; 2007: $16 million) and is presented as a component of corporate administration and other expense, consistent with the classification of other elements of compensation expense for those employees who had RSUs. As at December 31, 2009 there was $74 million of total unamortized compensation cost relating to unvested RSUs (2008: $84 million; 2007: $75 million).
Under our DSU plan, Directors must receive a specified portion of their basic annual retainer in the form of DSUs, with the option to elect to receive 100% of such retainer in DSUs. Each DSU has the same value as one Barrick common share. DSUs must be retained until the Director leaves the Board, at which time the cash value of the DSUs will be paid out. Additional DSUs are credited to reflect dividends paid on Barrick common shares. DSUs are recorded at fair value on the grant date and are adjusted for changes in fair value. The fair value of amounts granted each period together with changes in fair value are expensed.
148
DSU and RSU Activity
| | | | Fair | | | | Fair | |
| | DSUs | | value | | RSUs | | value | |
| | (thousands) | | (millions) | | (thousands) | | (millions) | |
At January 1, 2007 | | 69 | | $ | 2.1 | | 1,354 | | $ | 41.6 | |
Settled for cash | | (11 | ) | (0.3 | ) | (119 | ) | (4.9 | ) |
Forfeited | | — | | — | | (38 | ) | (1.4 | ) |
Granted | | 42 | | 1.4 | | 1,174 | | 47.5 | |
Credits for dividends | | — | | — | | 12 | | 0.4 | |
Change in value | | — | | 0.9 | | — | | 17.0 | |
At December 31, 2007 | | 100 | | $ | 4.1 | | 2,383 | | $ | 100.2 | |
Settled for cash | | (4 | ) | (0.1 | ) | (348 | ) | (10.3 | ) |
Forfeited | | — | | — | | (262 | ) | (10.6 | ) |
Granted | | 34 | | 1.2 | | 1,493 | | 42.0 | |
Credits for dividends | | — | | — | | 20 | | 0.7 | |
Change in value | | — | | (0.5 | ) | — | | (1.7 | ) |
At December 31, 2008 | | 130 | | $ | 4.7 | | 3,286 | | $ | 120.3 | |
Settled for cash | | — | | — | | (897 | ) | (35.7 | ) |
Forfeited | | — | | — | | (279 | ) | (11.1 | ) |
Granted | | 37 | | 1.2 | | 1,013 | | 42.1 | |
Credits for dividends | | — | | — | | 27 | | 1.0 | |
Change in value | | — | | 0.7 | | — | | 7.4 | |
At December 31, 2009 | | 167 | | $ | 6.6 | | 3,150 | | $ | 124.0 | |
c) Performance Restricted Share Units (PRSUs)
In 2008, Barrick launched a PRSU plan. Under this plan, selected employees are granted PRSUs, where each PRSU has a value equal to one Barrick common share. PRSUs vest at the end of a three-year period and are settled in cash on the third anniversary of the grant date. Additional PRSUs are credited to reflect dividends paid on Barrick common shares over the vesting period. Vesting, and therefore, the liability is based on the achievement of performance goals and the target settlement will range from 0% to 200% of the value. At December 31, 2009, 250 thousand units were outstanding (2008: 133 thousand units).
d) Employee Share Purchase Plan (ESPP)
In 2008, Barrick launched an Employee Share Purchase Plan. This plan enables Barrick employees to purchase Company shares through payroll deduction. Each year, employees may contribute 1%–6% of their combined base salary and annual bonus, and Barrick will match 50% of the contribution, up to a maximum of $5,000 per year. During 2009, Barrick contributed $0.8 million to this plan (2008: $0.5 million).
29 · Post-retirement Benefits
a) Defined Contribution Pension Plans
Certain employees take part in defined contribution employee benefit plans. We also have a retirement plan for certain officers of the Company, under which we contribute 15% of the officer’s annual salary and bonus. Our share of contributions to these plans, which is expensed in the year it is earned by the employee, was $50 million in 2009, $47 million in 2008 and $49 million in 2007.
b) Defined Benefit Pension Plans
We have qualified defined benefit pension plans that cover certain of our United States and Canadian employees and provide benefits based on employees’ years of service. Through the acquisition of Placer Dome, we acquired pension plans in the United States, Canada and Australia. Our policy is to fund the amounts necessary on an actuarial basis to provide enough assets to meet the benefits payable to plan members. Independent trustees administer assets of the plans, which are invested mainly in fixed income and equity securities. In 2009, two of our qualified defined benefit plans in Canada were wound up. No curtailment gain or loss resulted and the obligations of the plans were settled in 2009. In 2007, one of our qualified defined benefit plans in Canada was wound up. No curtailment gain or loss resulted and the obligations of the plans were settled in 2009. Also in 2007, both of our defined benefit plans in Australia were wound up. No curtailment gain or loss resulted for either plan.
As well as the qualified plans, we have non-qualified defined benefit pension plans covering certain employees and former directors of the Company. An irrevocable trust (“rabbi trust”) was set up to fund these plans. The fair value of assets held in this trust was $6 million in 2009 (2008: $9 million), and is recorded in our consolidated balance sheet under available-for-sale securities.
Actuarial gains and losses arise when the actual return on plan assets differs from the expected return on plan assets for a period, or when the expected and actuarial accrued benefit obligations differ at the end of the year. We amortize actuarial gains and losses over the average remaining life expectancy of plan participants, in excess of a 10% corridor.
Pension Expense (Credit)
For the years ended December 31 | | 2009 | | 2008 | | 2007 | |
Expected return on plan assets | | $ | (14 | ) | $ | (19 | ) | $ | (21 | ) |
Service cost | | — | | — | | 2 | |
Interest cost | | 19 | | 21 | | 21 | |
Actuarial losses | | 2 | | 1 | | 1 | |
| | $ | 7 | | $ | 3 | | $ | 3 | |
149
c) Pension Plan Information
Fair Value of Plan Assets
For the years ended December 31 | | 2009 | | 2008 | | 2007 | |
Balance at January 1 | | $ | 237 | | $ | 293 | | $ | 301 | |
Increase for plans assumed on acquisitions(1) | | 8 | | 9 | | — | |
Actual return on plan assets | | 36 | | (41 | ) | 31 | |
Company contributions | | 9 | | 12 | | 10 | |
Settlements | | (24 | ) | — | | (14 | ) |
Benefits paid | | (52 | ) | (33 | ) | (35 | ) |
Foreign currency adjustments | | 1 | | (3 | ) | — | |
Balance at December 31 | | $ | 215 | | $ | 237 | | $ | 293 | |
(1) | In 2009, represents plan acquired on acquisition of additional 50% in Hemlo. In 2008, represents plan acquired on acquisition of additional 40% in Cortez. |
| | 2009 | | 2009 | |
At December 31 | | Target(1) | | Actual | | Actual | |
Composition of plan assets(2): | | | | | | | |
Equity securities | | 54 | % | 54 | % | $ | 115 | |
Fixed income securities | | 46 | % | 46 | % | 100 | |
| | 100 | % | 100 | % | $ | 215 | |
(1) Based on the weighted average target for all defined benefit plans.
(2) Holdings in Equity and Fixed income securities consist only of Level 1 assets within the fair value hierarchy.
Projected Benefit Obligation (PBO)
For the years ended December 31 | | 2009 | | 2008 | |
Balance at January 1 | | $ | 357 | | $ | 364 | |
Increase for plans assumed on acquisitions | | 6 | | 9 | |
Service cost | | — | | — | |
Interest cost | | 19 | | 21 | |
Actuarial losses | | 6 | | 4 | |
Benefits paid | | (52 | ) | (33 | ) |
Foreign currency adjustments | | 8 | | (8 | ) |
Settlements | | (23 | ) | — | |
Balance at December 31 | | $ | 321 | | $ | 357 | |
Funded status(1) | | $ | (106 | ) | $ | (120 | ) |
ABO(2),(3) | | $ | 321 | | $ | 357 | |
(1) | Represents the fair value of plan assets less projected benefit obligations. Plan assets exclude investments held in a rabbi trust that are recorded separately on our balance sheet under Investments (fair value $6 million at December 31, 2009). |
(2) | For 2009, we used a measurement date of December 31, 2009 to calculate accumulated benefit obligations. |
(3) | Represents the accumulated benefit obligation (“ABO”) for all plans. The ABO for plans where the PBO exceeds the fair value of plan assets was $314 million (2008: $326 million). Based on actuarial reports at December 31, 2009, our funding requirements for 2010 is nil. |
Pension Plan Assets/Liabilities
For the years ended December 31 | | 2009 | | 2008 | |
Non-current assets | | $ | 3 | | $ | — | |
Current liabilities | | (13 | ) | (7 | ) |
Non-current liabilities | | (96 | ) | (113 | ) |
Other comprehensive income(1) | | 34 | | 52 | |
| | $ | (72 | ) | $ | (68 | ) |
(1) Amounts represent actuarial losses.
The projected benefit obligation and fair value of plan assets for pension plans with a projected benefit obligation in excess of plan assets at December 31, 2009 and 2008 were as follows:
For the years ended December 31 | | 2009 | | 2008 | |
Projected benefit obligation, end of year | | $ | 314 | | $ | 326 | |
Fair value of plan assets, end of year | | $ | 206 | | $ | 205 | |
The projected benefit obligation and fair value of plan assets for pension plans with an accumulated benefit obligation in excess of plan assets at December 31, 2009 and 2008 were as follows:
For the years ended December 31 | | 2009 | | 2008 | |
Projected benefit obligation, end of year | | $ | 314 | | $ | 357 | |
Accumulated benefit obligation, end of year | | $ | 314 | | $ | 326 | |
Fair value of plan assets, end of year | | $ | 206 | | $ | 205 | |
Expected Future Benefit Payments
For the years ending December 31 | | | |
2010 | | $ | 29 | |
2011 | | 23 | |
2012 | | 23 | |
2013 | | 23 | |
2014 | | 23 | |
2015 – 2019 | | $ | 111 | |
d) Actuarial Assumptions
For the years ended December 31 | | 2009 | | 2008 | | 2007 | |
Discount rate(1) | | | | | | | |
Benefit obligation | | 5.55–6.87% | | 4.50–6.25% | | 4.50–6.30% | |
Pension cost | | 6.00–6.25% | | 4.50–6.25% | | 4.50–5.81% | |
Return on plan assets(1) | | 4.50–7.00% | | 3.75–7.00% | | 4.50–7.25% | |
Wage increases | | 5.00% | | 3.50–5.00% | | 3.50–5.00% | |
(1) | Effect of a one-percent change: Discount rate: $32 million increase in ABO and $0.3 million decrease in pension cost; Return on plan assets: $0.4 million decrease in pension cost. |
Pension plan assets, which consist primarily of fixed-income and equity securities, are valued using current market quotations. Plan obligations and the annual pension expense are determined on an actuarial basis and are affected by numerous assumptions and estimates including the market value of plan assets, estimates of the expected return on plan assets, discount rates, future wage increases and other assumptions. The discount rate, assumed rate of return on plan assets and wage increases are the assumptions that generally have the most significant impact on our pension cost and obligation.
150
The discount rate used to calculate the benefit obligation and pension cost is the rate at which the pension obligation could be effectively settled. This rate was developed by matching the cash flows underlying the pension obligation with a spot rate curve based on the actual returns available on high-grade (Moody’s Aa) US corporate bonds. Bonds included in this analysis were restricted to those with a minimum outstanding balance of $50 million. Only non-callable bonds, or bonds with a make-whole provision, were included. Finally, outlying bonds (highest and lowest 10%) were discarded as being non-representative and likely to be subject to a change in investment grade. The resulting discount rate from this analysis was rounded to the nearest five basis points. The procedure was applied separately for pension and post-retirement plan purposes, and produced the same rate in each case.
The assumed rate of return on assets for pension cost purposes is the weighted average of expected long-term asset return assumptions. In estimating the long-term rate of return for plan assets, historical markets are studied and long-term historical returns on equities and fixed-income investments reflect the widely accepted capital market principle that assets with higher volatility generate a greater return over the long run. Current market factors such as inflation and interest rates are evaluated before long-term capital market assumptions are finalized.
Wage increases reflect the best estimate of merit increases to be provided, consistent with assumed inflation rates.
e) Other Post-retirement Benefits
We provide post-retirement medical, dental, and life insurance benefits to certain employees. We use the corridor approach in the accounting for post-retirement benefits. Actuarial gains and losses resulting from variances between actual results and economic estimates or actuarial assumptions are deferred and amortized over the average remaining life expectancy of participants when the net gains or losses exceed 10% of the accumulated post-retirement benefit obligation.
Other Post-retirement Benefits Expense
For the years ended December 31 | | 2009 | | 2008 | | 2007 | |
Interest cost | | $ | 2 | | $ | 2 | | $ | 2 | |
| | | | | | | | | | |
Fair Value of Plan Assets
For the years ended December 31 | | 2009 | | 2008 | | 2007 | |
Balance at January 1 | | $ | — | | $ | — | | $ | — | |
Contributions | | 1 | | 2 | | 2 | |
Benefits paid | | (1 | ) | (2 | ) | (2 | ) |
Balance at December 31 | | $ | — | | $ | — | | $ | — | |
Accumulated Post-retirement Benefit Obligation (APBO)
For the years ended December 31 | | 2009 | | 2008 | | 2007 | |
Balance at January 1 | | $ | 32 | | $ | 30 | | $ | 37 | |
Interest cost | | 2 | | 2 | | 2 | |
Actuarial (gains) losses | | (3 | ) | 2 | | (7 | ) |
Benefits paid | | (2 | ) | (2 | ) | (2 | ) |
Balance at December 31 | | $ | 29 | | $ | 32 | | $ | 30 | |
Funded status | | (29 | ) | (32 | ) | (30 | ) |
Unrecognized net transition obligation | | n/a | | n/a | | n/a | |
Unrecognized actuarial losses | | n/a | | n/a | | n/a | |
Net benefit liability recorded | | n/a | | n/a | | n/a | |
Other Post-retirement Liabilities
For the years ended December 31 | | 2009 | | 2008 | |
Current liability | | $ | 3 | | $ | 3 | |
Non-current liability | | 26 | | 29 | |
| | $ | 29 | | $ | 32 | |
Amounts recognized in accumulated other comprehensive income consist of:(1)
For the years ended December 31 | | 2009 | | 2008 | |
Net actuarial loss (gain) | | $ | (4 | ) | $ | 1 | |
Transition obligation (asset) | | 1 | | (1 | ) |
| | $ | (3 | ) | $ | — | |
(1) The estimated amounts that will be amortized into net periodic benefit cost in 2010.
We have assumed a health care cost trend of 8% in 2010, decreasing ratability to 5% in 2016 and thereafter. The assumed health care cost trend had a minimal effect on the amounts reported. A one percentage point change in the assumed health care cost trend rate at December 31, 2009 would have had no significant effect on the post-retirement obligation and would have had no significant effect on the benefit expense for 2009.
Expected Future Benefit Payments
For the years ending December 31 | | | |
2010 | | $ | 3 | |
2011 | | 3 | |
2012 | | 3 | |
2013 | | 3 | |
2014 | | 2 | |
2015 – 2019 | | $ | 11 | |
151
30 · Litigation and Claims
Certain conditions may exist as of the date the financial statements are issued, which may result in a loss to the Company but which will only be resolved when one or more future events occur or fail to occur. In assessing loss contingencies related to legal proceedings that are pending against us or unasserted claims that may result in such proceedings, the Company and its legal counsel evaluate the perceived merits of any legal proceedings or unasserted claims as well as the perceived merits of the amount of relief sought or expected to be sought.
If the assessment of a contingency suggests that a loss is probable, and the amount can be reliably estimated, then a loss is recorded. When a contingent loss is not probable but is reasonably possible, or is probable but the amount of loss cannot be reliably estimated, then details of the contingent loss are disclosed. Loss contingencies considered remote are generally not disclosed unless they involve guarantees, in which case we disclose the nature of the guarantee. Legal fees incurred in connection with pending legal proceedings are expensed as incurred.
Cortez Hills Complaint
On November 12, 2008, the United States Bureau of Land Management issued a Record of Decision approving the Cortez Hills Expansion Project. On November 20, 2008, the TeMoak Shoshone Tribe, the East Fork Band Council of the TeMoak Shoshone Tribe and the Timbisha Shoshone Tribe, the Western Shoshone Defense Project, and Great Basin Resource Watch filed a lawsuit against the United States seeking to enjoin the majority of the activities comprising the Project on grounds that it violated the Western Shoshone rights under the Religious Freedom Restoration Act (“RFRA”), that it violated the Federal Land Policy and Management Act’s (“FLPMA”) prohibition on “unnecessary and undue degradation,” and that the Project’s Environment Impact Statement did not meet the requirements of the National Environmental Policy Act (“NEPA”). The Plaintiffs subsequently dismissed their RFRA claim, with prejudice, conceding that it was without merit, in light of a decision in another case.
On November 24, 2008, the Plaintiffs filed a Motion for a Temporary Restraining Order and a Preliminary Injunction barring work on the Project until after a trial on the merits. On January 26, 2009, the Court denied the Plaintiffs’ Motion for a Preliminary Injunction, concluding that the Plaintiffs had failed to demonstrate a likelihood of success on the merits and that the Plaintiffs had otherwise failed to satisfy the necessary elements for a preliminary injunction. The Plaintiffs appealed that decision to the United States Court of Appeals for the Ninth Circuit, which heard oral arguments on June 10, 2009. On December 3, 2009, the Ninth Circuit issued an opinion in which it held that the Plaintiffs had failed to show that they were likely to succeed on the merits of their FLPMA claims, and thus were not entitled to an injunction based on those claims. The Ninth Circuit, however, held that Plaintiffs were likely to succeed on two of their NEPA claims and ordered that a supplemental EIS be prepared by Barrick that specifically provided more information on (i) the effectiveness of proposed mitigation measures for seeps and springs that might be affected by groundwater pumping, and (ii) the air quality impact of the shipment of refractory ore to Goldstrike for processing and that additional air quality modeling for fine particulate matter using updated EPA procedures should be performed and included in the supplemental EIS. The Ninth Circuit decision directed the District Court to enter an injunction consistent with the decision.
In late January 2010, the matter was remanded by the Ninth Circuit to the District Court, where it is currently pending. Barrick has filed a motion seeking a preliminary injunction that is tailored to the recent decision of the Ninth Circuit. The Plaintiffs have filed a motion seeking a broad injunction. The District Court will determine the appropriate scope of any preliminary injunction.
Marinduque Complaint
Placer Dome was named the sole defendant in a Complaint filed on October 4, 2005, by the Provincial Government of Marinduque, an island province of the Philippines (“Province”), with the District Court in Clark County, Nevada. The action was removed to the Nevada Federal District Court on motion of Placer Dome. The Complaint asserted that Placer Dome was responsible for alleged environmental degradation with consequent economic damages and impacts to the environment in the vicinity of the Marcopper mine that was owned and operated by Mar-copper Mining Corporation (“Marcopper”). Placer Dome indirectly owned a minority shareholding of 39.9% in Marcopper until the divestiture of its shareholding in 1997. The Province seeks “to recover damages for injuries to the natural, ecological and wildlife resources within its territory”, but “does not seek to recover damages for individual injuries sustained by its citizens either to their persons or their property”. In addition to damages for injury to natural resources, the Province seeks compensation for the costs of restoring the environment, an order directing Placer Dome to undertake and complete “the remediation, environmental cleanup, and balancing of the ecology of the
152
affected areas,” and payment of the costs of environmental monitoring. The Complaint addresses the discharge of mine tailings into Calancan Bay, the 1993 Maguila-guila dam breach, the 1996 Boac river tailings spill, and alleged past and continuing damage from acid rock drainage.
At the time of the amalgamation of Placer Dome and Barrick Gold Corporation, a variety of motions were pending before the District Court, including motions to dismiss the action for lack of personal jurisdiction and for forum non conveniens (improper choice of forum). On June 29, 2006, the Province filed a Motion to join Barrick Gold Corporation as an additional named Defendant and for leave to file a Third Amended Complaint which the Court granted on March 2, 2007. On March 6, 2007, the Court issued an order setting a briefing schedule on the Company’s motion to dismiss on grounds of forum non conveniens. On June 7, 2007, the Court issued an order granting the Company’s motion to dismiss. On June 25, 2007, the Province filed a motion requesting the Court to reconsider its Order dismissing the action. On January 16, 2008, the district court issued an order denying the Province’s motion for reconsideration. Following the District Court’s order, the Province filed Notice of Appeal to the U.S. Court of Appeals for the Ninth Circuit. On September 29, 2009 the Ninth Circuit reversed the decision of the District Court on the ground that the District Court lacked subject matter jurisdiction over the case and removal from the Nevada State Court was improper. On October 13, 2009 the Company filed a petition requesting the Ninth Circuit to reconsider its decision and for a rehearing on the issues before a nine judge panel (en banc) on the grounds that the decision is contrary to a recent United States Supreme Court decision, which petition was subsequently denied. The formal mandate entering the judgment of the Ninth Circuit was entered on November 23, 2009. The District Court has not yet entered an order of remand to Nevada state court. Barrick has filed a petition with the U.S. Supreme Court seeking review of the Ninth Circuit’s decision and will continue to challenge the claims of the Province in Nevada state court on various grounds and otherwise vigorously defend the action. No amounts have been accrued for any potential loss under this complaint.
Calancan Bay (Philippines) Complaint
On July 23, 2004, a complaint was filed against Marcopper and Placer Dome Inc. (“PDI”) in the Regional Trial Court of Boac, on the Philippine island of Marinduque, on behalf of a putative class of fishermen who reside in the communities around Calancan Bay, in northern Marinduque. The complaint alleges injuries to health and economic damages to the local fisheries resulting from the disposal of mine tailings from the Marcopper mine. The total amount of damages claimed is approximately US$1 billion.
On October 16, 2006, the court granted the plaintiffs’ application for indigent status, allowing the case to proceed without payment of filing fees. On January 17, 2007, the Court issued a summons to Marcopper and PDI. On March 25, 2008, an attempt was made to serve PDI by serving the summons and complaint on Placer Dome Technical Services (Philippines) Inc. (“PDTS”). PDTS has returned the summons and complaint with a manifestation stating that PDTS is not an agent of PDI for any purpose and is not authorized to accept service or to take any other action on behalf of PDI. On April 3, 2008, PDI made a special appearance by counsel to move to dismiss the complaint for lack of personal jurisdiction and on other grounds. The plaintiffs have opposed the motion to dismiss. The motion has been briefed and is currently pending.
In October 2008, the plaintiffs filed their motion challenging PDI’s legal capacity to participate in the proceedings in light of its alleged “acquisition” by Barrick. PDI opposed this motion. The motion has been briefed and is currently pending.
The Company intends to defend the action vigorously. No amounts have been accrued for any potential loss under this complaint.
Perilla Complaint
On August 5, 2009, Barrick Gold Inc. was purportedly served in Ontario with a complaint filed on November 25, 2008 in the Regional Trial Court of Boac, on the Philippine island of Marinduque, on behalf of two named individuals and purportedly on behalf of the approximately 200,000 residents of Marinduque. In December 2009, the complaint was also purportedly served in Ontario in the name of Placer Dome Inc. The complaint alleges injury to the economy and the ecology of Marinduque as a result of the discharge of mine tailings from the Marcopper mine into the Calancan Bay, the Boac River, and the Mogpog River. The plaintiffs are claiming for abatement of a public nuisance allegedly caused by the tailings discharge and for nominal damages for an alleged violation of their constitutional right to a balanced and healthful ecology. Barrick Gold Inc. has moved to dismiss the complaint on a variety of grounds, which motion is now pending a decision of the Court following the failure of plaintiffs’ counsel to appear at the hearing on February 2, 2010 or to timely file any comment or opposition to the motion. Motions to dismiss the complaint on a variety of grounds have also been filed in the name of Placer Dome Inc. No amounts have been accrued for any potential loss under this complaint.
153
Pakistani Constitutional Litigation
On November 28, 2006, a Constitutional Petition was filed in the High Court of Balochistan by three Pakistani citizens against: Barrick, the governments of Balochistan and Pakistan, the Balochistan Development Authority (“BDA”), Tethyan Copper Company (“TCC”), Antofagasta Plc (“Antofagasta”), Muslim Lakhani and BHP (Pakistan) Pvt Limited (“BHP”).
The Petition alleged, among other things, that the entry by the BDA into the 1993 Joint Venture Agreement (“JVA”) with BHP to facilitate the exploration of the Reko Diq area and the grant of related exploration licenses were illegal and that the subsequent transfer of the interests of BHP in the JVA and the licenses to TCC was also illegal and should therefore be set aside. Barrick currently indirectly holds 50% of the shares of TCC, with Antofagasta indirectly holding the other 50%.
On June 26, 2007, the High Court of Balochistan dismissed the Petition against Barrick and the other respondents in its entirety. On August 23, 2007, the petitioners filed a Civil Petition for Leave to Appeal in the Supreme Court of Pakistan. No court date has been set for the hearing of this matter. Barrick intends to defend this action vigorously. No amounts have been accrued for any potential loss under this complaint.
31 · Subsequent Events
We examined all significant transactions from our year-end close date of December 31, 2009 up to and including the date the financial statements were available to be issued, February 17, 2010, and have not noted any significant events or transactions that would materially impact the financial statements as they are presented.
154
Mineral Reserves and Mineral Resources
The tables on the next seven pages set forth Barrick’s interest in the total proven and probable gold and copper reserves and in the total measured and indicated gold, copper and nickel resources and certain related information at each property. For further details of proven and probable mineral reserves and measured, indicated and inferred mineral resources by category, metal and property, see pages 158 to 162.
The Company has carefully prepared and verified the mineral reserve and mineral resource figures and believes that its method of estimating mineral reserves has been verified by mining experience. These figures are estimates, however, and no assurance can be given that the indicated quantities of metal will be produced. Metal price fluctuations may render mineral reserves containing relatively lower grades of mineralization uneconomic. Moreover, short-term operating factors relating to the mineral reserves, such as the need for orderly development of ore bodies or the processing of new or different ore grades, could affect the Company’s profitability in any particular accounting period.
Definitions
A mineral resource is a concentration or occurrence of diamonds, natural solid inorganic material, or natural solid fossilized organic material including base and precious metals, coal, and industrial minerals in or on the Earth’s crust in such form and quantity and of such a grade or quality that it has reasonable prospects for economic extraction. The location, quantity, grade, geological characteristics and continuity of a mineral resource are known, estimated or interpreted from specific geological evidence and knowledge. Mineral resources are sub-divided, in order of increasing geological confidence, into inferred, indicated and measured categories.
An inferred mineral resource is that part of a mineral resource for which quantity and grade or quality can be estimated on the basis of geological evidence and limited sampling and reasonably assumed, but not verified, geological and grade continuity. The estimate is based on limited information and sampling gathered through appropriate techniques from locations such as outcrops, trenches, pits, workings and drill holes.
An indicated mineral resource is that part of a mineral resource for which quantity, grade or quality, densities, shape and physical characteristics, can be estimated with a level of confidence sufficient to allow the appropriate application of technical and economic parameters, to support mine planning and evaluation of the economic viability of the deposit. The estimate is based on detailed and reliable exploration and testing information gathered through appropriate techniques from locations such as outcrops, trenches, pits, workings and drill holes that are spaced closely enough for geological and grade continuity to be reasonably assumed.
A measured mineral resource is that part of a mineral resource for which quantity, grade or quality, densities, shape and physical characteristics are so well established that they can be estimated with confidence sufficient to allow the appropriate application of technical and economic parameters, to support production planning and evaluation of the economic viability of the deposit. The estimate is based on detailed and reliable exploration, sampling and testing information gathered through appropriate techniques from locations such as outcrops, trenches, pits, workings and drill holes that are spaced closely enough to confirm both geological and grade continuity.
Mineral resources, which are not mineral reserves, do not have demonstrated economic viability.
A mineral reserve is the economically mineable part of a measured or indicated mineral resource demonstrated by at least a preliminary feasibility study. This study must include adequate information on mining, processing, metallurgical, economic and other relevant factors that demonstrate, at the time of reporting, that economic extraction can be justified. A mineral reserve includes diluting materials and allowances for losses that may occur when the material is mined. Mineral reserves are sub-divided in order of increasing confidence into probable mineral reserves and proven mineral reserves.
A probable mineral reserve is the economically mineable part of an indicated and, in some circumstances, a measured mineral resource demonstrated by a least a preliminary feasibility study. This study must include adequate information on mining, processing, metallurgical, economic and other relevant factors that demonstrate, at the time of reporting, that economic extraction can be justified.
A proven mineral reserve is the economically mineable part of a measured mineral resource demonstrated by at least a preliminary feasibility study. This study must include adequate information on mining, processing, metallurgical, economic and other relevant factors that demonstrate, at the time of reporting, that economic extraction is justified.
155
Summary Gold Mineral Reserves and Mineral Resources(1),(2)
| | | | 2009 | | 2008 | |
For the years ended December 31 | | | | Tons | | Grade | | Ounces | | Tons | | Grade | | Ounces | |
Based on attributable ounces | | | | (000s) | | (oz/ton) | | (000s) | | (000s) | | (oz/ton) | | (000s) | |
North America | | | | | | | | | | | | | | | |
Goldstrike Open Pit | | (proven and probable) | | 82,902 | | 0.112 | | 9,296 | | 86,254 | | 0.119 | | 10,294 | |
| | (mineral resource) | | 16,687 | | 0.052 | | 870 | | 15,751 | | 0.055 | | 868 | |
Goldstrike Underground | | (proven and probable) | | 8,998 | | 0.318 | | 2,860 | | 6,923 | | 0.368 | | 2,545 | |
| | (mineral resource) | | 4,436 | | 0.334 | | 1,483 | | 4,467 | | 0.323 | | 1,444 | |
Goldstrike Property Total | | (proven and probable) | | 91,900 | | 0.132 | | 12,156 | | 93,177 | | 0.138 | | 12,839 | |
| | (mineral resource) | | 21,123 | | 0.111 | | 2,353 | | 20,218 | | 0.114 | | 2,312 | |
Pueblo Viejo (60%) | | (proven and probable) | | 166,638 | | 0.085 | | 14,244 | | 147,946 | | 0.091 | | 13,440 | |
| | (mineral resource) | | 70,834 | | 0.061 | | 4,287 | | 77,068 | | 0.056 | | 4,330 | |
Cortez | | (proven and probable) | | 243,669 | | 0.058 | | 14,100 | | 222,125 | | 0.060 | | 13,384 | |
| | (mineral resource) | | 46,622 | | 0.074 | | 3,467 | | 81,088 | | 0.046 | | 3,743 | |
Bald Mountain | | (proven and probable) | | 227,346 | | 0.020 | | 4,489 | | 157,675 | | 0.018 | | 2,846 | |
| | (mineral resource) | | 99,338 | | 0.012 | | 1,178 | | 90,374 | | 0.019 | | 1,718 | |
Turquoise Ridge (75%) | | (proven and probable) | | 8,030 | | 0.507 | | 4,072 | | 7,961 | | 0.501 | | 3,985 | |
| | (mineral resource) | | 1,730 | | 0.431 | | 745 | | 2,467 | | 0.435 | | 1,074 | |
Round Mountain (50%) | | (proven and probable) | | 78,807 | | 0.019 | | 1,466 | | 92,581 | | 0.018 | | 1,621 | |
| | (mineral resource) | | 43,912 | | 0.021 | | 939 | | 28,570 | | 0.019 | | 529 | |
South Arturo (60%) | | (proven and probable) | | 26,314 | | 0.051 | | 1,350 | | — | | — | | — | |
| | (mineral resource) | | 3,377 | | 0.048 | | 162 | | 22,114 | | 0.045 | | 987 | |
Ruby Hill | | (proven and probable) | | 13,933 | | 0.050 | | 702 | | 18,844 | | 0.044 | | 831 | |
| | (mineral resource) | | 8,960 | | 0.057 | | 514 | | 11,919 | | 0.040 | | 480 | |
Hemlo(3) | | (proven and probable) | | 17,500 | | 0.076 | | 1,325 | | 7,075 | | 0.080 | | 564 | |
| | (mineral resource) | | 2,545 | | 0.070 | | 179 | | 1,314 | | 0.079 | | 104 | |
Marigold (33%) | | (proven and probable) | | 49,997 | | 0.016 | | 807 | | 25,462 | | 0.020 | | 511 | |
| | (mineral resource) | | 14,064 | | 0.016 | | 218 | | 15,673 | | 0.016 | | 253 | |
Golden Sunlight | | (proven and probable) | | 8,239 | | 0.062 | | 508 | | 8,665 | | 0.062 | | 540 | |
| | (mineral resource) | | 282 | | 0.067 | | 19 | | 131 | | 0.061 | | 8 | |
Donlin Creek (50%) | | (proven and probable) | | — | | — | | — | | — | | — | | — | |
| | (mineral resource) | | 270,022 | | 0.068 | | 18,449 | | 269,496 | | 0.066 | | 17,737 | |
South America | | | | | | | | | | | | | | | |
Cerro Casale (50%)(4) | | (proven and probable) | | 668,481 | | 0.017 | | 11,585 | | 612,273 | | 0.018 | | 10,831 | |
| | (mineral resource) | | 119,855 | | 0.011 | | 1,365 | | 194,722 | | 0.012 | | 2,372 | |
Pascua-Lama | | (proven and probable) | | 423,858 | | 0.042 | | 17,839 | | 440,226 | | 0.040 | | 17,806 | |
| | (mineral resource) | | 153,371 | | 0.031 | | 4,821 | | 131,494 | | 0.036 | | 4,687 | |
Veladero | | (proven and probable) | | 503,787 | | 0.024 | | 12,008 | | 491,316 | | 0.025 | | 12,233 | |
| | (mineral resource) | | 65,253 | | 0.014 | | 884 | | 50,191 | | 0.014 | | 706 | |
Lagunas Norte | | (proven and probable) | | 234,423 | | 0.032 | | 7,501 | | 230,635 | | 0.039 | | 8,949 | |
| | (mineral resource) | | 39,419 | | 0.017 | | 678 | | 55,573 | | 0.023 | | 1,278 | |
Pierina | | (proven and probable) | | 43,595 | | 0.015 | | 648 | | 29,182 | | 0.023 | | 683 | |
| | (mineral resource) | | 6,366 | | 0.017 | | 108 | | 11,141 | | 0.014 | | 156 | |
(1) | Resources which are not reserves do not have demonstrated economic viability. |
(2) | See accompanying footnote #1. |
(3) | See accompanying footnote #2. |
(4) | See accompanying footnote #3. |
156
Summary Gold Mineral Reserves and Mineral Resources(1),(2)
| | | | 2009 | | 2008 | |
For the years ended December 31 | | | | Tons | | Grade | | Ounces | | Tons | | Grade | | Ounces | |
Based on attributable ounces | | | | (000s) | | (oz/ton) | | (000s) | | (000s) | | (oz/ton) | | (000s) | |
Australia Pacific | | | | | | | | | | | | | | | |
Porgera (95%) | | (proven and probable) | | 77,534 | | 0.099 | | 7,683 | | 78,975 | | 0.099 | | 7,828 | |
| | (mineral resource) | | 23,960 | | 0.067 | | 1,602 | | 61,025 | | 0.066 | | 4,031 | |
Kalgoorlie (50%) | | (proven and probable) | | 75,080 | | 0.056 | | 4,205 | | 77,516 | | 0.056 | | 4,360 | |
| | (mineral resource) | | 6,479 | | 0.056 | | 362 | | 8,611 | | 0.059 | | 512 | |
Cowal | | (proven and probable) | | 76,928 | | 0.035 | | 2,697 | | 79,500 | | 0.035 | | 2,795 | |
| | (mineral resource) | | 25,705 | | 0.034 | | 881 | | 31,463 | | 0.034 | | 1,072 | |
Plutonic | | (proven and probable) | | 4,225 | | 0.182 | | 771 | | 5,828 | | 0.179 | | 1,042 | |
| | (mineral resource) | | 10,257 | | 0.195 | | 1,995 | | 11,037 | | 0.157 | | 1,733 | |
Kanowna | | (proven and probable) | | 7,337 | | 0.168 | | 1,233 | | 6,294 | | 0.200 | | 1,256 | |
| | (mineral resource) | | 5,649 | | 0.141 | | 798 | | 5,234 | | 0.164 | | 859 | |
Darlot | | (proven and probable) | | 3,305 | | 0.134 | | 444 | | 4,394 | | 0.127 | | 557 | |
| | (mineral resource) | | 2,856 | | 0.126 | | 359 | | 3,598 | | 0.125 | | 451 | |
Granny Smith | | (proven and probable) | | 3,024 | | 0.169 | | 510 | | 3,620 | | 0.136 | | 491 | |
| | (mineral resource) | | 1,505 | | 0.150 | | 226 | | 2,514 | | 0.168 | | 423 | |
Lawlers | | (proven and probable) | | 3,108 | | 0.156 | | 486 | | 2,484 | | 0.142 | | 353 | |
| | (mineral resource) | | 1,883 | | 0.204 | | 384 | | 6,791 | | 0.151 | | 1,023 | |
Henty | | (proven and probable) | | — | | — | | — | | 402 | | 0.229 | | 92 | |
| | (mineral resource) | | — | | — | | — | | 199 | | 0.231 | | 46 | |
Osborne | | (proven and probable) | | 813 | | 0.023 | | 19 | | 2,174 | | 0.021 | | 45 | |
| | (mineral resource) | | 4,379 | | 0.026 | | 115 | | 3,410 | | 0.026 | | 89 | |
Reko Diq (37.5%) | | (proven and probable) | | — | | — | | — | | — | | — | | — | |
| | (mineral resource) | | 1,232,986 | | 0.008 | | 9,506 | | 1,125,071 | | 0.008 | | 8,487 | |
Africa | | | | | | | | | | | | | | | |
Bulyanhulu | | (proven and probable) | | 27,630 | | 0.374 | | 10,320 | | 37,728 | | 0.317 | | 11,977 | |
| | (mineral resource) | | 11,350 | | 0.316 | | 3,585 | | 4,936 | | 0.339 | | 1,675 | |
North Mara | | (proven and probable) | | 31,905 | | 0.092 | | 2,949 | | 30,505 | | 0.099 | | 3,031 | |
| | (mineral resource) | | 8,810 | | 0.098 | | 861 | | 19,046 | | 0.063 | | 1,191 | |
Buzwagi | | (proven and probable) | | 72,611 | | 0.047 | | 3,401 | | 65,088 | | 0.050 | | 3,284 | |
| | (mineral resource) | | 20,573 | | 0.034 | | 692 | | 20,371 | | 0.043 | | 886 | |
Tulawaka (70%) | | (proven and probable) | | 406 | | 0.229 | | 93 | | 514 | | 0.156 | | 80 | |
| | (mineral resource) | | 192 | | 0.167 | | 32 | | 267 | | 0.330 | | 88 | |
Other | | (proven and probable) | | 325 | | 0.431 | | 140 | | 538 | | 0.468 | | 252 | |
| | (mineral resource) | | 65 | | 0.369 | | 24 | | — | | — | | — | |
Total | | (proven and probable) | | 3,190,748 | | 0.044 | | 139,751 | | 2,980,703 | | 0.046 | | 138,506 | |
| | (mineral resource) | | 2,323,722 | | 0.027 | | 61,788 | | 2,367,126 | | 0.027 | | 65,040 | |
(1) | Resources which are not reserves do not have demonstrated economic viability. |
(2) | See accompanying footnote #1. |
157
Gold Mineral Reserves(1)
| | Proven | | Probable | | Total |
| | | | | | Contained | | | | | | Contained | | | | | | Contained | |
As at December 31, 2009 | | Tons | | Grade | | ounces | | Tons | | Grade | | ounces | | Tons | | Grade | | ounces | |
Based on attributable ounces | | (000s) | | (oz/ton) | | (000s) | | (000s) | | (oz/ton) | | (000s) | | (000s) | | (oz/ton) | | (000s) | |
North America | | | | | | | | | | | | | | | | | | | |
Goldstrike Open Pit | | 41,888 | | 0.107 | | 4,477 | | 41,014 | | 0.117 | | 4,819 | | 82,902 | | 0.112 | | 9,296 | |
Goldstrike Underground | | 3,614 | | 0.405 | | 1,464 | | 5,384 | | 0.259 | | 1,396 | | 8,998 | | 0.318 | | 2,860 | |
Goldstrike Property Total | | 45,502 | | 0.131 | | 5,941 | | 46,398 | | 0.134 | | 6,215 | | 91,900 | | 0.132 | | 12,156 | |
Pueblo Viejo (60%) | | 8,498 | | 0.097 | | 826 | | 158,140 | | 0.085 | | 13,418 | | 166,638 | | 0.085 | | 14,244 | |
Cortez | | 23,288 | | 0.092 | | 2,149 | | 220,381 | | 0.054 | | 11,951 | | 243,669 | | 0.058 | | 14,100 | |
Bald Mountain | | 77,454 | | 0.021 | | 1,653 | | 149,892 | | 0.019 | | 2,836 | | 227,346 | | 0.020 | | 4,489 | |
Turquoise Ridge (75%) | | 3,418 | | 0.481 | | 1,643 | | 4,612 | | 0.527 | | 2,429 | | 8,030 | | 0.507 | | 4,072 | |
Round Mountain (50%) | | 30,696 | | 0.022 | | 670 | | 48,111 | | 0.017 | | 796 | | 78,807 | | 0.019 | | 1,466 | |
South Arturo (60%) | | — | | — | | — | | 26,314 | | 0.051 | | 1,350 | | 26,314 | | 0.051 | | 1,350 | |
Ruby Hill | | 669 | | 0.055 | | 37 | | 13,264 | | 0.050 | | 665 | | 13,933 | | 0.050 | | 702 | |
Hemlo(2) | | 13,902 | | 0.072 | | 1,006 | | 3,598 | | 0.089 | | 319 | | 17,500 | | 0.076 | | 1,325 | |
Marigold (33%) | | 15,500 | | 0.018 | | 281 | | 34,497 | | 0.015 | | 526 | | 49,997 | | 0.016 | | 807 | |
Golden Sunlight | | 1,967 | | 0.074 | | 146 | | 6,272 | | 0.058 | | 362 | | 8,239 | | 0.062 | | 508 | |
South America | | | | | | | | | | | | | | | | | | | |
Cerro Casale (50%)(3) | | 127,619 | | 0.019 | | 2,383 | | 540,862 | | 0.017 | | 9,202 | | 668,481 | | 0.017 | | 11,585 | |
Pascua-Lama | | 42,132 | | 0.050 | | 2,126 | | 381,726 | | 0.041 | | 15,713 | | 423,858 | | 0.042 | | 17,839 | |
Veladero | | 29,734 | | 0.031 | | 927 | | 474,053 | | 0.023 | | 11,081 | | 503,787 | | 0.024 | | 12,008 | |
Lagunas Norte | | 18,673 | | 0.034 | | 631 | | 215,750 | | 0.032 | | 6,870 | | 234,423 | | 0.032 | | 7,501 | |
Pierina | | 21,370 | | 0.016 | | 345 | | 22,225 | | 0.014 | | 303 | | 43,595 | | 0.015 | | 648 | |
Australia Pacific | | | | | | | | | | | | | | | | | | | |
Porgera (95%) | | 46,172 | | 0.092 | | 4,247 | | 31,362 | | 0.110 | | 3,436 | | 77,534 | | 0.099 | | 7,683 | |
Kalgoorlie (50%) | | 35,450 | | 0.049 | | 1,730 | | 39,630 | | 0.062 | | 2,475 | | 75,080 | | 0.056 | | 4,205 | |
Cowal | | 12,891 | | 0.024 | | 305 | | 64,037 | | 0.037 | | 2,392 | | 76,928 | | 0.035 | | 2,697 | |
Plutonic | | 138 | | 0.152 | | 21 | | 4,087 | | 0.184 | | 750 | | 4,225 | | 0.182 | | 771 | |
Kanowna | | 3,609 | | 0.187 | | 675 | | 3,728 | | 0.150 | | 558 | | 7,337 | | 0.168 | | 1,233 | |
Darlot | | 2,111 | | 0.126 | | 265 | | 1,194 | | 0.150 | | 179 | | 3,305 | | 0.134 | | 444 | |
Granny Smith | | 838 | | 0.156 | | 131 | | 2,186 | | 0.173 | | 379 | | 3,024 | | 0.169 | | 510 | |
Lawlers | | 226 | | 0.128 | | 29 | | 2,882 | | 0.159 | | 457 | | 3,108 | | 0.156 | | 486 | |
Osborne | | 680 | | 0.024 | | 16 | | 133 | | 0.023 | | 3 | | 813 | | 0.023 | | 19 | |
Africa | | | | | | | | | | | | | | | | | | | |
Bulyanhulu | | 1,414 | | 0.380 | | 537 | | 26,216 | | 0.373 | | 9,783 | | 27,630 | | 0.374 | | 10,320 | |
North Mara | | 15,125 | | 0.098 | | 1,477 | | 16,780 | | 0.088 | | 1,472 | | 31,905 | | 0.092 | | 2,949 | |
Buzwagi | | 3,634 | | 0.035 | | 127 | | 68,977 | | 0.047 | | 3,274 | | 72,611 | | 0.047 | | 3,401 | |
Tulawaka (70%) | | 166 | | 0.084 | | 14 | | 240 | | 0.329 | | 79 | | 406 | | 0.229 | | 93 | |
Other | | 19 | | 0.263 | | 5 | | 306 | | 0.441 | | 135 | | 325 | | 0.431 | | 140 | |
Total | | 582,895 | | 0.052 | | 30,343 | | 2,607,853 | | 0.042 | | 109,408 | | 3,190,748 | | 0.044 | | 139,751 | |
Copper Mineral Reserves(1)
| | Proven | | Probable | | Total | |
| | | | | | Contained | | | | | | Contained | | | | | | Contained | |
As at December 31, 2009 | | Tons | | Grade | | lbs | | Tons | | Grade | | lbs | | Tons | | Grade | | lbs | |
Based on attributable pounds | | (000s) | | (%) | | (millions) | | (000s) | | (%) | | (millions) | | (000s) | | (%) | | (millions) | |
Zaldívar | | 353,638 | | 0.538 | | 3,803 | | 222,113 | | 0.502 | | 2,229 | | 575,751 | | 0.524 | | 6,032 | |
Osborne | | 680 | | 1.765 | | 24 | | 133 | | 2.632 | | 7 | | 813 | | 1.907 | | 31 | |
Total | | 354,318 | | 0.540 | | 3,827 | | 222,246 | | 0.503 | | 2,236 | | 576,564 | | 0.526 | | 6,063 | |
(1) | See accompanying footnote #1. |
(2) | See accompanying footnote #2. |
(3) | See accompanying footnote #3. |
158
Gold Mineral Resources(1),(2)
| | Measured (M) | | Indicated (I) | | (M) + (I) | | Inferred | |
| | | | | | Contained | | | | | | Contained | | Contained | | | | | | Contained | |
As at December 31, 2009 | | Tons | | Grade | | ounces | | Tons | | Grade | | ounces | | ounces | | Tons | | Grade | | ounces | |
Based on attributable ounces | | (000s) | | (oz/ton) | | (000s) | | (000s) | | (oz/ton) | | (000s) | | (000s) | | (000s) | | (oz/ton) | | (000s) | |
North America | | | | | | | | | | | | | | | | | | | | | |
Goldstrike Open Pit | | 10,446 | | 0.055 | | 577 | | 6,241 | | 0.047 | | 293 | | 870 | | 3,568 | | 0.116 | | 413 | |
Goldstrike Underground | | 952 | | 0.401 | | 382 | | 3,484 | | 0.316 | | 1,101 | | 1,483 | | 1,858 | | 0.341 | | 633 | |
Goldstrike Property Total | | 11,398 | | 0.084 | | 959 | | 9,725 | | 0.143 | | 1,394 | | 2,353 | | 5,426 | | 0.193 | | 1,046 | |
Pueblo Viejo (60%) | | 2,113 | | 0.058 | | 123 | | 68,721 | | 0.061 | | 4,164 | | 4,287 | | 11,654 | | 0.056 | | 656 | |
Cortez | | 3,652 | | 0.047 | | 170 | | 42,970 | | 0.077 | | 3,297 | | 3,467 | | 30,128 | | 0.144 | | 4,325 | |
Bald Mountain | | 29,552 | | 0.013 | | 373 | | 69,786 | | 0.012 | | 805 | | 1,178 | | 40,184 | | 0.012 | | 468 | |
Turquoise Ridge (75%) | | 906 | | 0.412 | | 373 | | 824 | | 0.451 | | 372 | | 745 | | 3,775 | | 0.456 | | 1,721 | |
Round Mountain (50%) | | 10,560 | | 0.029 | | 303 | | 33,352 | | 0.019 | | 636 | | 939 | | 28,604 | | 0.017 | | 497 | |
Ruby Hill | | 428 | | 0.051 | | 22 | | 8,532 | | 0.058 | | 492 | | 514 | | 2,928 | | 0.051 | | 148 | |
Hemlo(3) | | 1,986 | | 0.064 | | 128 | | 559 | | 0.091 | | 51 | | 179 | | 1,036 | | 0.150 | | 155 | |
Marigold (33%) | | — | | — | | — | | 14,064 | | 0.016 | | 218 | | 218 | | 25,049 | | 0.015 | | 388 | |
Golden Sunlight | | 113 | | 0.071 | | 8 | | 169 | | 0.065 | | 11 | | 19 | | 801 | | 0.045 | | 36 | |
South Arturo (60%) | | — | | — | | — | | 3,377 | | 0.048 | | 162 | | 162 | | 2,539 | | 0.018 | | 45 | |
Donlin Creek (50%) | | 3,983 | | 0.075 | | 300 | | 266,039 | | 0.068 | | 18,149 | | 18,449 | | 40,295 | | 0.065 | | 2,625 | |
South America | | | | | | | | | | | | | | | | | | | | | |
Cerro Casale (50%)(4) | | 8,098 | | 0.010 | | 79 | | 111,757 | | 0.012 | | 1,286 | | 1,365 | | 244,644 | | 0.011 | | 2,660 | |
Pascua-Lama | | 13,316 | | 0.041 | | 543 | | 140,055 | | 0.031 | | 4,278 | | 4,821 | | 24,298 | | 0.041 | | 1,007 | |
Veladero | | 4,269 | | 0.011 | | 46 | | 60,984 | | 0.014 | | 838 | | 884 | | 64,086 | | 0.008 | | 529 | |
Lagunas Norte | | 1,089 | | 0.017 | | 18 | | 38,330 | | 0.017 | | 660 | | 678 | | 9,302 | | 0.016 | | 151 | |
Pierina | | 3,337 | | 0.018 | | 59 | | 3,029 | | 0.016 | | 49 | | 108 | | 4,066 | | 0.012 | | 49 | |
Australia Pacific | | | | | | | | | | | | | | | | | | | | | |
Porgera (95%) | | 10,642 | | 0.077 | | 818 | | 13,318 | | 0.059 | | 784 | | 1,602 | | 12,465 | | 0.111 | | 1,383 | |
Kalgoorlie (50%) | | 2,341 | | 0.059 | | 139 | | 4,138 | | 0.054 | | 223 | | 362 | | 1,604 | | 0.136 | | 218 | |
Cowal | | — | | — | | — | | 25,705 | | 0.034 | | 881 | | 881 | | 3,017 | | 0.028 | | 85 | |
Plutonic | | 612 | | 0.374 | | 229 | | 9,645 | | 0.183 | | 1,766 | | 1,995 | | 6,216 | | 0.243 | | 1,511 | |
Kanowna | | 2,985 | | 0.131 | | 392 | | 2,664 | | 0.152 | | 406 | | 798 | | 3,174 | | 0.152 | | 484 | |
Darlot | | 386 | | 0.148 | | 57 | | 2,470 | | 0.122 | | 302 | | 359 | | 93 | | 0.226 | | 21 | |
Granny Smith | | 148 | | 0.189 | | 28 | | 1,357 | | 0.146 | | 198 | | 226 | | 4,509 | | 0.241 | | 1,088 | |
Lawlers | | — | | — | | — | | 1,883 | | 0.204 | | 384 | | 384 | | 442 | | 0.235 | | 104 | |
Osborne | | 523 | | 0.019 | | 10 | | 3,856 | | 0.027 | | 105 | | 115 | | 3,137 | | 0.024 | | 75 | |
Reko Diq (37.5%) | | 718,521 | | 0.009 | | 6,466 | | 514,465 | | 0.006 | | 3,040 | | 9,506 | | 1,192,569 | | 0.005 | | 6,399 | |
Africa | | | | | | | | | | | | | | | | | | | | | |
Bulyanhulu | | — | | — | | — | | 11,350 | | 0.316 | | 3,585 | | 3,585 | | 7,362 | | 0.429 | | 3,159 | |
North Mara | | 1,600 | | 0.137 | | 219 | | 7,210 | | 0.089 | | 642 | | 861 | | 1,447 | | 0.082 | | 119 | |
Buzwagi | | 94 | | 0.043 | | 4 | | 20,479 | | 0.034 | | 688 | | 692 | | 7,377 | | 0.036 | | 268 | |
Tulawaka (70%) | | — | | — | | — | | 192 | | 0.167 | | 32 | | 32 | | 1 | | — | | — | |
Other | | — | | — | | — | | 65 | | 0.369 | | 24 | | 24 | | 592 | | 0.294 | | 174 | |
Total | | 832,652 | | 0.014 | | 11,866 | | 1,491,070 | | 0.033 | | 49,922 | | 61,788 | | 1,782,820 | | 0.018 | | 31,594 | |
Copper Mineral Resources(1),(2)
| | Measured (M) | | Indicated (I) | | (M) + (I) | | Inferred | |
| | | | | | Contained | | | | | | Contained | | Contained | | | | | | Contained | |
As at December 31, 2009 | | Tons | | Grade | | lbs | | Tons | | Grade | | lbs | | lbs | | Tons | | Grade | | lbs | |
Based on attributable pounds | | (000s) | | (%) | | (millions) | | (000s) | | (%) | | (millions) | | (millions) | | (000s) | | (%) | | (millions) | |
Zaldívar | | 62,298 | | 0.411 | | 512 | | 61,154 | | 0.428 | | 524 | | 1,036 | | 83,293 | | 0.530 | | 883 | |
Osborne | | 523 | | 1.530 | | 16 | | 3,856 | | 1.504 | | 116 | | 132 | | 3,137 | | 1.259 | | 79 | |
Reko Diq (37.5%) | | 718,521 | | 0.536 | | 7,697 | | 514,465 | | 0.392 | | 4,034 | | 11,731 | | 1,192,569 | | 0.352 | | 8,393 | |
Total | | 781,342 | | 0.526 | | 8,225 | | 579,475 | | 0.403 | | 4,674 | | 12,899 | | 1,278,999 | | 0.366 | | 9,355 | |
(1) | Resources which are not reserves do not have demonstrated economic viability. |
(2) | See accompanying footnote #1. |
(3) | See accompanying footnote #2. |
(4) | See accompanying footnote #3. |
159
Contained Silver Within Reported Gold Reserves(1)
| | In proven
gold reserves | | In probable
gold reserves | | Total | |
For the year ended | | | | | | Contained | | | | | | Contained | | | | | | Contained | | Process | |
December 31, 2009 | | Tons | | Grade | | ounces | | Tons | | Grade | | ounces | | Tons | | Grade | | ounces | | recovery | |
Based on attributable ounces | | (000s) | | (oz/ton) | | (000s) | | (000s) | | (oz/ton) | | (000s) | | (000s) | | (oz/ton) | | (000s) | | % | |
North America | | | | | | | | | | | | | | | | | | | | | |
Pueblo Viejo (60%) | | 8,498 | | 0.63 | | 5,358 | | 158,140 | | 0.50 | | 79,707 | | 166,638 | | 0.51 | | 85,065 | | 86.7 | % |
South America | | | | | | | | | | | | | | | | | | | | | |
Cerro Casale (50%)(2) | | 127,619 | | 0.05 | | 6,988 | | 540,862 | | 0.04 | | 22,376 | | 668,481 | | 0.04 | | 29,364 | | 46.1 | % |
Pascua-Lama | | 42,132 | | 1.75 | | 73,548 | | 381,726 | | 1.57 | | 597,573 | | 423,858 | | 1.58 | | 671,121 | | 80.4 | % |
Lagunas Norte | | 18,673 | | 0.12 | | 2,160 | | 215,750 | | 0.11 | | 22,753 | | 234,423 | | 0.11 | | 24,913 | | 21.4 | % |
Veladero | | 29,734 | | 0.40 | | 11,802 | | 474,053 | | 0.45 | | 212,802 | | 503,787 | | 0.45 | | 224,604 | | 6.3 | % |
Pierina | | 21,370 | | 0.37 | | 7,837 | | 22,225 | | 0.34 | | 7,571 | | 43,595 | | 0.35 | | 15,408 | | 37.0 | % |
Africa | | | | | | | | | | | | | | | | | | | | | |
Bulyanhulu | | 1,414 | | 0.20 | | 276 | | 26,216 | | 0.29 | | 7,673 | | 27,630 | | 0.29 | | 7,949 | | 77.5 | % |
Total | | 249,440 | | 0.43 | | 107,969 | | 1,818,972 | | 0.52 | | 950,455 | | 2,068,412 | | 0.51 | | 1,058,424 | | 62.2 | % |
(1) Silver is accounted for as a by-product credit against reported or projected gold production costs.
(2) See accompanying footnote #2.
Contained Copper Within Reported Gold Reserves(1)
| | In proven gold reserves | | In probable gold reserves | | Total | |
For the year ended | | | | | | Contained | | | | | | Contained | | | | | | Contained | | Process | |
December 31, 2009 | | Tons | | Grade | | lbs | | Tons | | Grade | | lbs | | Tons | | Grade | | lbs | | recovery | |
Based on attributable pounds | | (000s) | | (%) | | (millions) | | (000s) | | (%) | | (millions) | | (000s) | | (%) | | (millions) | | % | |
North America | | | | | | | | | | | | | | | | | | | | | |
Pueblo Viejo (60%) | | 8,498 | | 0.114 | | 19.4 | | 158,140 | | 0.090 | | 283.8 | | 166,638 | | 0.091 | | 303.2 | | 79.5 | % |
South America | | | | | | | | | | | | | | | | | | | | | |
Cerro Casale (50%)(2) | | 127,619 | | 0.189 | | 481.3 | | 540,862 | | 0.223 | | 2,409.6 | | 668,481 | | 0.216 | | 2,890.9 | | 82.7 | % |
Pascua-Lama | | 42,132 | | 0.096 | | 81.2 | | 381,726 | | 0.075 | | 574.5 | | 423,858 | | 0.077 | | 655.7 | | 63.0 | % |
Africa | | | | | | | | | | | | | | | | | | | | | |
Buzwagi | | 3,634 | | 0.014 | | 1.0 | | 68,977 | | 0.122 | | 168.1 | | 72,611 | | 0.116 | | 169.1 | | 76.9 | % |
Bulyanhulu | | 1,414 | | 0.396 | | 11.2 | | 26,216 | | 0.712 | | 373.4 | | 27,630 | | 0.696 | | 384.6 | | 93.3 | % |
Total | | 183,297 | | 0.162 | | 594.1 | | 1,175,921 | | 0.162 | | 3,809.4 | | 1,359,218 | | 0.162 | | 4,403.5 | | 80.2 | % |
(1) Copper is accounted for as a by-product credit against reported or projected gold production costs.
(2) See accompanying footnote #2.
160
Contained Silver Within Reported Gold Resources(1)
| | Measured (M) | | Indicated (I) | | (M) + (I) | | Inferred | |
| | | | | | Contained | | | | | | Contained | | Contained | | | | | | Contained | |
For the year ended December 31, 2009 | | Tons | | Grade | | ounces | | Tons | | Grade | | ounces | | ounces | | Tons | | Grade | | ounces | |
Based on attributable ounces | | (000s) | | (oz/ton) | | (000s) | | (000s) | | (oz/ton) | | (000s) | | (000s) | | (000s) | | (oz/ton) | | (000s) | |
North America | | | | | | | | | | | | | | | | | | | | | |
Pueblo Viejo (60%) | | 2,113 | | 0.36 | | 760 | | 68,721 | | 0.32 | | 21,792 | | 22,552 | | 11,654 | | 0.51 | | 5,981 | |
South America | | | | | | | | | | | | | | | | | | | | | |
Cerro Casale (50%)(2) | | 8,098 | | 0.04 | | 299 | | 111,757 | | 0.03 | | 3,425 | | 3,724 | | 244,644 | | 0.03 | | 7,607 | |
Pascua-Lama | | 13,316 | | 0.91 | | 12,148 | | 140,055 | | 0.89 | | 123,986 | | 136,134 | | 24,298 | | 0.55 | | 13,398 | |
Lagunas Norte | | 909 | | 0.10 | | 91 | | 36,651 | | 0.08 | | 2,880 | | 2,971 | | 9,784 | | 0.05 | | 451 | |
Veladero | | 4,269 | | 0.21 | | 878 | | 60,984 | | 0.39 | | 23,980 | | 24,858 | | 64,086 | | 0.33 | | 21,427 | |
Pierina | | 3,337 | | 0.28 | | 920 | | 3,029 | | 0.23 | | 700 | | 1,620 | | 4,066 | | 0.40 | | 1,632 | |
Africa | | | | | | | | | | | | | | | | | | | | | |
Bulyanhulu | | — | | — | | — | | 11,350 | | 0.27 | | 3,058 | | 3,058 | | 7,296 | | 0.35 | | 2,557 | |
Total | | 32,042 | | 0.47 | | 15,096 | | 432,547 | | 0.42 | | 179,821 | | 194,917 | | 365,828 | | 0.15 | | 53,053 | |
(1) Resources which are not reserves do not have demonstrated economic viability.
(2) See accompanying footnote #2.
Contained Copper Within Reported Gold Resources(1)
| | In measured (M) | | In indicated (I) | | | | | |
| | gold resources | | gold resources | | (M) + (I) | | Inferred | |
| | | | | | Contained | | | | | | Contained | | Contained | | | | | | Contained | |
For the year ended December 31, 2009 | | Tons | | Grade | | lbs | | Tons | | Grade | | lbs | | lbs | | Tons | | Grade | | lbs | |
Based on attributable pounds | | (000s) | | (%) | | (millions) | | (000s) | | (%) | | (millions) | | (millions) | | (000s) | | (%) | | (millions) | |
North America | | | | | | | | | | | | | | | | | | | | | |
Pueblo Viejo (60%) | | 2,113 | | 0.097 | | 4.1 | | 68,721 | | 0.073 | | 100.8 | | 104.9 | | 11,654 | | 0.037 | | 8.6 | |
South America | | | | | | | | | | | | | | | | | | | | | |
Cerro Casale (50%)(2) | | 8,098 | | 0.157 | | 25.5 | | 111,757 | | 0.185 | | 414.4 | | 439.9 | | 244,644 | | 0.191 | | 936.3 | |
Pascua-Lama | | 13,316 | | 0.077 | | 20.6 | | 140,055 | | 0.062 | | 173.4 | | 194.0 | | 24,298 | | 0.044 | | 21.4 | |
Africa | | | | | | | | | | | | | | | | | | | | | |
Buzwagi | | 94 | | 0.104 | | 0.2 | | 20,479 | | 0.097 | | 39.6 | | 39.8 | | 7,377 | | 0.087 | | 12.8 | |
Total | | 23,621 | | 0.107 | | 50.4 | | 341,012 | | 0.107 | | 728.2 | | 778.6 | | 287,973 | | 0.170 | | 979.1 | |
(1) Resources which are not reserves do not have demonstrated economic viability.
(2) See accompanying footnote #2.
Nickel Mineral Resources(1)
| | Measured (M) | | Indicated (I) | | (M) + (I) | | Inferred | |
| | | | | | Contained | | | | | | Contained | | Contained | | | | | | Contained | |
For the year ended December 31, 2009 | | Tons | | Grade | | lbs | | Tons | | Grade | | lbs | | lbs | | Tons | | Grade | | lbs | |
Based on attributable pounds | | (000s) | | (%) | | (millions) | | (000s) | | (%) | | (millions) | | (millions) | | (000s) | | (%) | | (millions) | |
Africa | | | | | | | | | | | | | | | | | | | | | |
Kabanga (50%) | | 7,601 | | 2.480 | | 377.0 | | 12,985 | | 2.653 | | 689.0 | | 1,066.0 | | 8,874 | | 2.958 | | 525.0 | |
(1) Resources, which are not reserves, do not have demonstrated economic viability.
161
Mineral Reserves and Resources Notes
(1) | Mineral reserves (“reserves”) and mineral resources (“resources”) have been calculated as at December 31, 2009 in accordance with National Instrument 43-101 as required by Canadian securities regulatory authorities. For United States reporting purposes, Industry Guide 7, (under the Securities and Exchange Act of 1934), as interpreted by Staff of the SEC, applies different standards in order to classify mineralization as a reserve. Accordingly, for U.S. reporting purposes, Cerro Casale is classified as mineralized material. In addition, while the terms “measured”, “indicated” and “inferred” mineral resources are required pursuant to National Instrument 43-101, the U.S. Securities and Exchange Commission does not recognize such terms. Canadian standards differ significantly from the requirements of the U.S. Securities and Exchange Commission, and mineral resource information contained herein is not comparable to similar information regarding mineral reserves disclosed in accordance with the requirements of the U.S. Securities and Exchange Commission. U.S. investors should understand that “inferred” mineral resources have a great amount of uncertainty as to their existence and great uncertainty as to their economic and legal feasibility. In addition, U.S. investors are cautioned not to assume that any part or all of Barrick’s mineral resources constitute or will be converted into reserves. Calculations have been prepared by employees of Barrick, its joint venture partners or its joint venture operating companies, as applicable, under the supervision of Ivan Mullany, Vice President, Operations Support of Barrick, Rick Allan, Senior Director, Mining of Barrick, and Rick Sims, Senior Director, Resources and Reserves of Barrick. Except as noted below, reserves have been calculated using an assumed long-term average gold price of $US 825 ($Aus. 1,030) per ounce, a silver price of $US 14.00 per ounce, a copper price of $US 2.00 per pound and exchange rates of $1.10 $Can/$US and $0.80 $US/$Aus. Reserves at Cerro Casale and Round Mountain have been calculated using an assumed long-term average gold price of $US 800. Reserve calculations incorporate current and/or expected mine plans and cost levels at each property. Varying cut-off grades have been used depending on the mine and type of ore contained in the reserves. Barrick’s normal data verification procedures have been employed in connection with the calculations. Resources as at December 31, 2009 have been estimated using varying cut-off grades, depending on both the type of mine or project, its maturity and ore types at each property. For a breakdown of reserves and resources by category and for a more detailed description of the key assumptions, parameters and methods used in calculating Barrick’s reserves and resources, see Barrick’s most recent Annual Information Form/Form 40-F on file with Canadian provincial securities regulatory authorities and the U.S. Securities and Exchange Commission. |
| |
(2) | In January 2009, Barrick acquired the remaining 50% interest of the Hemlo mine. 2008 reserves and resources reflect Barrick’s then 50% interest. 2009 reserves and resources reflect Barrick’s 100% interest. |
| |
(3) | 2008 reserves and resources for the Cerro Casale project reflect Barrick’s then 51% interest. 2009 reserves and resources reflect the change in Barrick’s interest to 50% of the Cerro Casale project. |
162
Corporate Governance and Committees of the Board
Corporate Governance
Over the past several years, there has been an increased focus on corporate governance in both the United States and Canada. Among other regulatory initiatives, the New York Stock Exchange added corporate governance standards to its listing rules. Although, as a regulatory matter, the vast majority of the NYSE corporate governance standards are not directly applicable to Barrick as a Canadian company, Barrick has implemented a number of structures and procedures to comply with the NYSE standards. There are no significant differences between Barrick’s corporate governance practices and the NYSE standards applicable to U.S. companies.
The Board of Directors has approved a set of Corporate Governance Guidelines to promote the effective functioning of the Board of Directors and its Committees and to set forth a common set of expectations as to how the Board should manage its affairs and perform its responsibilities. Barrick has also adopted a Code of Business Conduct and Ethics that is applicable to all directors, officers and employees of Barrick. In conjunction with the adoption of the Code, Barrick established a toll-free compliance hotline to allow for anonymous reporting of any suspected Code violations, including concerns regarding accounting, internal accounting controls or other auditing matters. A copy of the Corporate Governance Guidelines, the Code of Business Conduct and Ethics, and the mandates of the Board of Directors and each of the Committees of the Board, including the Audit Committee, Compensation Committee and Corporate Governance and Nominating Committee, is posted on Barrick’s website at www.barrick.com and is available in print from the Company to any shareholder upon request.
Committees of the Board
Audit Committee
(S.J. Shapiro, D.J. Carty, P.A. Crossgrove, R.M. Franklin)
Reviews the Company’s financial statements and management’s discussion and analysis of financial and operating results, and assists the Board in its oversight of the integrity of Barrick’s financial reporting process and the quality, transparency, and integrity of Barrick’s financial statements and other relevant public disclosures, the Company’s compliance with legal and regulatory requirements relating to financial reporting, the external auditors’ qualifications and independence, and the performance of the internal and external auditors.
Compensation Committee
(D.J. Carty, M.A. Cohen, P.C. Godsoe, J.B. Harvey, S.J. Shapiro)
Assists the Board in monitoring, reviewing and approving Barrick’s compensation policies and practices, and administering Barrick’s share compensation plans. The Committee is responsible for reviewing and recommending director and senior management compensation and for succession planning with respect to senior executives.
Corporate Governance and Nominating Committee
(M.A. Cohen, R.M. Franklin, P.C. Godsoe)
Assists the Board in establishing Barrick’s corporate governance policies and practices. The Committee also identifies individuals qualified to become members of the Board and reviews the composition and functioning of the Board and its Committees.
Environmental, Health and Safety Committee
(P.A. Crossgrove, C.W.D. Birchall, J.B. Harvey, A.W. Regent)
Reviews environmental, health and safety, and corporate social responsibility policies and programs, oversees the Company’s environmental, health and safety, and corporate social responsibility performance, and monitors current and future regulatory issues.
Finance Committee
(C.W.D. Birchall, H.L. Beck, A. Munk)
Reviews the Company’s financial structure and investment and financial risk management programs.
163
Shareholder Information
Barrick shares are traded on two stock exchanges:
New York
Toronto
Ticker Symbol
ABX
Number of Registered Shareholders at December 31, 2009
17,974
Index Listings
S&P/TSX Composite Index
S&P/TSX 60 Index
S&P Global 1200 Index
Philadelphia Gold/Silver Index
AMEX Gold Miners Index
Dow Jones Sustainability Index (DJSI) — North America
Dow Jones Sustainability Index (DJSI) — World
2009 Dividend per Share
US$0.40
Common Shares
(millions) | | | |
Outstanding at December 31, 2009 | | 984 | |
Weighted average 2009 | | | |
Basic | | 903 | |
Fully diluted | | 903 | |
The Company’s shares were split on a two-for-one basis in 1987, 1989 and 1993.
Volume of Shares Traded
(millions) | | 2009 | | 2008 | |
NYSE | | 1,203 | | 1,153 | |
TSX | | 1,078 | | 1,154 | |
Closing Price of Shares
December 31, 2009 | | | |
NYSE | | US$39.38 | |
TSX | | C$41.46 | |
Share Trading Information
New York Stock Exchange
| | Share Volume | | | | | | | | | |
| | (millions) | | High | | Low | |
Quarter | | 2009 | | 2008 | | 2009 | | 2008 | | 2009 | | 2008 | |
First | | 361 | | 234 | | US$40.90 | | US$54.74 | | US$25.54 | | US$41.54 | |
Second | | 246 | | 162 | | 38.96 | | 46.20 | | 27.09 | | 37.00 | |
Third | | 258 | | 362 | | 41.98 | | 52.47 | | 30.67 | | 26.03 | |
Fourth | | 338 | | 395 | | 48.02 | | 39.23 | | 34.50 | | 17.95 | |
| | 1,203 | | 1,153 | | | | | | | | | |
Toronto Stock Exchange
| | Share Volume | | | | | | | | | |
| | (millions) | | High | | Low | |
Quarter | | 2009 | | 2008 | | 2009 | | 2008 | | 2009 | | 2008 | |
First | | 331 | | 282 | | C$49.87 | | C$54.11 | | C$32.69 | | C$42.51 | |
Second | | 251 | | 225 | | 43.24 | | 46.71 | | 33.01 | | 37.76 | |
Third | | 237 | | 301 | | 43.97 | | 52.47 | | 35.50 | | 28.01 | |
Fourth | | 259 | | 346 | | 50.33 | | 45.34 | | 37.04 | | 22.00 | |
| | 1,078 | | 1,154 | | | | | | | | | |
164
Dividend Payments
In 2009, the Company paid a cash dividend of $0.40 per share — $0.20 on June 15 and $0.20 on December 15. A cash dividend of $0.40 per share was paid in 2008 — $0.20 on June 16 and $0.20 on December 15.
Dividend Policy
The Board of Directors reviews the dividend policy semi-annually based on the cash requirements of the Company’s operating assets, exploration and development activities, as well as potential acquisitions, combined with the current and projected financial position of the Company.
Form 40-F
The Company’s Annual Report on Form 40-F is filed with the United States Securities and Exchange Commission. This report is available on Barrick’s website www.barrick.com and will be made available to shareholders, without charge, upon written request to the Secretary of the Company at the Corporate Office.
Other Language Reports
French and Spanish versions of this annual report are available from Investor Relations at the Corporate Office and on Barrick’s website www.barrick.com.
Shareholder Contacts
Shareholders are welcome to contact the Investor Relations Department for general information on the Company:
Deni Nicoski
Vice President, Investor Relations
Telephone: 416-307-7410
Email: dnicoski@barrick.com
Susan Muir
Senior Director, Investor Relations
Telephone: 416-307-5107
Email: s.muir@barrick.com
Amy Schwalm
Senior Director, Investor Relations
Telephone: 416-307-7422
Email: aschwalm@barrick.com
For information on such matters as share transfers, dividend cheques and change of address, inquiries should be directed to the Transfer Agents:
Transfer Agents and Registrars
CIBC Mellon Trust Company
P.O. Box 7010
Adelaide Street Postal Station
Toronto, Ontario M5C 2W9
Telephone: 416-643-5500
Toll-free throughout North America: 1-800-387-0825
Fax: 416-643-5501
Email: inquiries@cibcmellon.com
Website: www.cibcmellon.com
BYN Mellon Shareowner Services, L.L.C.
480 Washington Boulevard — 27th Floor
Jersey City, NJ 07310
Telephone: Toll-free throughout North America: 1-800-589-9836
Fax: 201-680-4665
Email: shrrelations@mellon.com
Website: www.melloninvestor.com
Auditors
PricewaterhouseCoopers LLP
Toronto, Canada
Annual Meeting
The Annual Meeting of Shareholders will be held on Wednesday, April 28, 2010 at 10:00 a.m. (Toronto time) in the Metro Toronto Convention Centre, John Bassett Theatre, 255 Front Street West, Toronto, Ontario.
165
Board of Directors and Senior Officers
Board of Directors
Howard L. Beck, Q.C.
Toronto, Ontario
Corporate Director
C. William D. Birchall
Toronto, Ontario
Vice Chairman,
Barrick Gold Corporation
Donald J. Carty, O.C.
Dallas, Texas
Chairman,
Porter Airlines Inc. and
Virgin America Airlines
Gustavo A. Cisneros
Caracas, Venezuela
Chairman,
Cisneros Group of Companies
Marshall A. Cohen, O.C.
Toronto, Ontario
Counsel,
Cassels Brock & Blackwell LLP
Peter A. Crossgrove, O.C.
Toronto, Ontario
Corporate Director
Robert M. Franklin
Toronto, Ontario
President, Signalta Capital
Corporation
Peter C. Godsoe, O.C.
Toronto, Ontario
Corporate Director
J. Brett Harvey
Canonsburg, Pennsylvania
President and
Chief Executive Officer,
CONSOL Energy Inc.
The Right Honourable
Brian Mulroney, P.C.
Montreal, Quebec
Chairman, Barrick
International Advisory Board
Senior Partner, Ogilvy Renault
Anthony Munk
New York, New York
Managing Director,
Onex Corporation
Peter Munk, C.C.
Toronto, Ontario
Founder and Chairman,
Barrick Gold Corporation
Aaron W. Regent
Toronto, Ontario
President and
Chief Executive Officer,
Barrick Gold Corporation
Steven J. Shapiro
Houston, Texas
Corporate Director
Senior Officers
Peter Munk
Chairman
C. William D. Birchall
Vice Chairman
Aaron W. Regent
President and
Chief Executive Officer
Vincent A. Borg
Executive Vice President,
Corporate Communications
Kelvin P.M. Dushnisky
Executive Vice President,
Corporate Affairs
Patrick J. Garver
Executive Vice President
and General Counsel
Peter J. Kinver
Executive Vice President
and Chief Operating Officer
Jamie C. Sokalsky
Executive Vice President
and Chief Financial Officer
George M. Potter
Senior Vice President,
Capital Projects
International Advisory Board
The International Advisory Board was established to provide advice to Barrick’s Board of Directors and management on geopolitical and other strategic issues affecting the Company.
Chairman
The Right Honourable
Brian Mulroney
Former Prime Minister
of Canada
Members
Gustavo A. Cisneros
Venezuela
Secretary William S. Cohen
United States
Vernon E. Jordan, Jr.
United States
Andrónico Luksic
Chile
Angus A. MacNaughton
United States
Karl Otto Pöhl
Germany
Lord Charles Powell of
Bayswater KCMG
United Kingdom
The Honourable
Nathaniel P. Rothschild
Switzerland
The Honorable
Andrew Young
United States
166
Cautionary Statement on Forward-Looking Information
Certain information contained in this Annual Report 2009, including any information as to our strategy, projects, plans or future financial or operating performance and other statements that express management’s expectations or estimates of future performance, constitute “forward-looking statements”. All statements, other than statements of historical fact, are forward-looking statements. The words “believe”, “expect”, “will”, “anticipate”, “contemplate”, “target”, “plan”, “continue”, “budget”, “may”, “intend”, “estimate” and similar expressions identify forward-looking statements. Forward-looking statements are necessarily based upon a number of estimates and assumptions that, while considered reasonable by management, are inherently subject to significant business, economic and competitive uncertainties and contingencies. The Company cautions the reader that such forward-looking statements involve known and unknown risks, uncertainties and other factors that may cause the actual financial results, performance or achievements of Barrick to be materially different from the Company’s estimated future results, performance or achievements expressed or implied by those forward-looking statements and the forward-looking statements are not guarantees of future performance. These risks, uncertainties and other factors include, but are not limited to: the impact of global liquidity and credit availability on the timing of cash flows and the values of assets and liabilities based on projected future cash flows; changes in the worldwide price of gold, copper or certain other commodities (such as silver, fuel and electricity); fluctuations in currency markets; changes in U.S. dollar interest rates; risks arising from holding derivative instruments; ability to successfully complete announced transactions and integrate acquired assets; legislative, political or economic developments in the jurisdictions in which the Company carries on business; operating or technical difficulties in connection with mining or development activities; employee relations; availability and costs associated with mining inputs and labor; the speculative nature of exploration and development, including the risks of obtaining necessary licenses and permits and diminishing quantities or grades of reserves; changes in costs and estimates associated with our projects; adverse changes in our credit rating, level of indebtedness and liquidity, contests over title to properties, particularly title to undeveloped properties; the risks involved in the exploration, development and mining business. Certain of these factors are discussed in greater detail in the Company’s most recent Form 40-F/Annual Information Form on file with the U.S. Securities and Exchange Commission and Canadian provincial securities regulatory authorities.
The Company disclaims any intention or obligation to update or revise any forward-looking statements whether as a result of new information, future events or otherwise, except as required by applicable law.
barrick.com
Barrick Gold Corporation
Corporate Office:
Brookfield Place
TD Canada Trust Tower
161 Bay Street, Suite 3700
P.O. Box 212
Toronto, Canada M5J 2S1
Tel: 416.861.9911
Toll-free throughout North America:
1.800.720.7415
Fax: 416.861.2492
Email: investors@barrick.com