Exhibit 99.1

| | Focus on Value Creation | 9 |
| Strategy of Increasing Net Asset Value, Production, | |
| Reserves and Earnings – All on a Per Share Basis | |
| | |
| Exceptional Gold Price Leverage | 10 |
| Generating Record Earnings and Cash Flow · | |
| Nine Million Ounce Production Target within Five Years | |
| | |
| Financial Strength and Flexibility | 11 |
| ‘A’ Credit Rating and Strong Balance Sheet to | |
| Support Our Objectives | |
| | |
| Operational Excellence | 12 |
| Consistent Track Record of Achieving Targets | |
| | |
| Project Development Expertise | 15 |
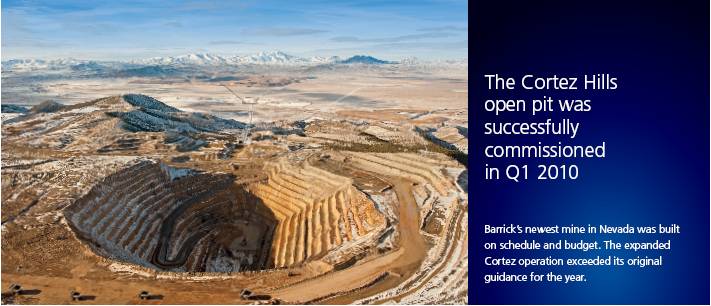
| Cortez Hills Built on Time and Budget · World-Class | |
| Pueblo Viejo and Pascua-Lama Projects in Construction | |
| | |
| Surfacing Hidden Value | 19 |
| Optimizing Our High Quality, Diversified Portfolio | |
| of Assets | |
| | |
| Industry’s Largest Gold Reserves | 21 |
| Replaced or Grown for the Last Five Straight Years | |
| | |
| Strong Focus on Responsible Mining | 23 |
| Relisted on Dow Jones World Sustainability Index · | |
| Added to NASDAQ Global Sustainability Index | |
Barrick’s strategy is focused on maximizing shareholder value by building gold and copper reserves through exploration, investing in high return development projects, realizing the potential of existing mines, pursuing disciplined acquisitions and strengthening our social and environmental performance.
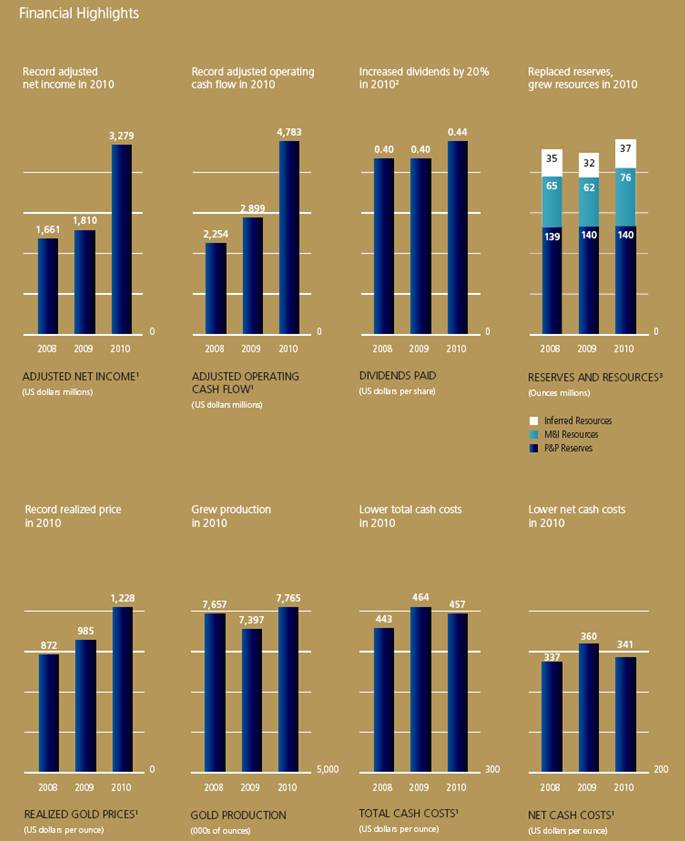
Barrick delivered a strong operating performance in 2010 with higher gold production and lower total cash costs, and achieved record financial results as the gold price reached new highs.
(in millions of US dollars, except per share data) | | | | | | | |
(US GAAP basis) | | 2010 | | 2009 | | 2008 | |
Sales | | $ | 10,924 | | $ | 8,136 | | $ | 7,613 | |
Net income (loss) | | 3,274 | | (4,274 | ) | 785 | |
per share | | 3.32 | | (4.73 | ) | 0.90 | |
Adjusted net income(1) | | 3,279 | | 1,810 | | 1,661 | |
per share | | 3.32 | | 2.00 | | 1.90 | |
Operating cash flow | | 4,127 | | (2,322 | ) | 2,254 | |
Adjusted operating cash flow(1) | | 4,783 | | 2,899 | | 2,254 | |
Cash and equivalents | | 3,968 | | 2,564 | | 1,437 | |
Dividends paid per share(2) | | 0.44 | | 0.40 | | 0.40 | |
| | | | | | | |
Operating Highlights | | | | | | | |
Gold production (000s oz) | | 7,765 | | 7,397 | | 7,657 | |
Average realized gold price per ounce(1) | | $ | 1,228 | | $ | 985 | | $ | 872 | |
Total cash costs per ounce(1) | | $ | 457 | | $ | 464 | | $ | 443 | |
Net cash costs per ounce(1) | | $ | 341 | | $ | 360 | | $ | 337 | |
Copper production (M lbs) | | 368 | | 393 | | 370 | |
Average realized copper price per pound(1) | | $ | 3.41 | | $ | 3.16 | | $ | 3.39 | |
Total cash costs per pound(1) | | $ | 1.11 | | $ | 1.17 | | $ | 1.19 | |
(1) Non-GAAP financial measure – see pages 78–85 of the 2010 Financial Report.
(2) In July 2010, Barrick increased its dividend by 20% to $0.12 per share on a quarterly basis; based on converting the previous semi-annual dividend of $0.20 per share to a quarterly equivalent.
(3) See page 22 of the 2010 Annual Report for additional information on Barrick’s reserves and resources.
Message from the Chairman
Message from the Chairman

Peter Munk
Founder and Chairman
Fellow shareholders,
There are countless theories that attempt to explain why gold prices behave the way they do. At its core, however, the gold market is not all that complicated: generally speaking, when people feel secure, gold prices fall; when people feel insecure, prices rise.
There was a time not that long ago – for about a decade, between 1988 and 2000 – that most of us in the West felt not just secure, but exuberant. The Berlin Wall came down. The Cold War ended. American power was at its zenith. In short, our confidence was unsurpassed. In his best-selling book of 1992, The End of History and the Last Man, Francis Fukuyama declared that in the long struggle between political ideologies, liberal democracy and market capitalism had clearly won the day. What was there to be worried about?
During this period of euphoria, gold prices dropped in half, from about $500 per ounce to a low of around $250 per ounce by 1999. You know what happened next. First, in 2000, the “dot-com” bubble burst and the stock market collapsed. One year later, on September 11, 2001, the whole world changed. We were not so secure, after all.
What has followed would have been unthinkable only a few years earlier: two intractable wars in the Middle East; a massive global economic recession; the collapse of the U.S. housing market; the bankruptcy of Lehman Brothers and the demise of Bear Stearns; and on and on. Investors lost faith in the world’s two most powerful currencies – the U.S. dollar and the new Euro. Then came fears of sovereign default in Europe, where governments, desperate to restore confidence in their rattled markets, were forced to intervene.
As I write this letter, amid spreading chaos and violence in the Mideast and North Africa, there continues to be little news to stir the confidence of investors. Our world is uncertain. More and more people are afraid of the future. The optimism of the 1990s has faded into an era of global pessimism.
With their confidence shaken, an ever-growing number of investors are moving into gold, and have been now for some 10 years. As a result, of course, the price of gold has climbed continually, increasing more than 400% in a decade. This, even while the S&P 500 Index has fallen by 5%.
Given how strongly gold has performed, it’s not surprising that some people now wonder if we’re in a bubble. They suggest we’re at a moment not unlike 1980, when gold prices, having reached unprecedented and historic highs, suddenly plummeted.
I don’t think we are in a bubble today; not at all. For one thing, the situation today could not be more different than it was in the late 1970s and early 1980s. What happened 30 years ago was clearly a kind of mania: in a single year, the price of gold shot up by more
2
Barrick Annual Report 2010 | Message from the Chairman
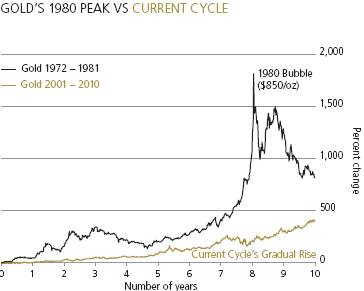
than 250%, hitting an all-time record of $850 per ounce in January 1980. It was madness! People around the world lined up outside banks to buy a few ounces of the metal, as prices rose daily. Then, almost as quickly as it had soared, gold collapsed.
By contrast, the past decade’s rise in gold prices has displayed neither extreme volatility nor irrationality; instead, the ascent of gold since 2001 has been steady, measured, and rational. What’s more, when compared to other commodities such as copper and oil, gold prices have not appreciated disproportionately. A simple glance at a chart comparing gold’s frenzied rise in 1979 to the gradual build-up of the past 10 years tells the story graphically: to me, it clearly suggests that the behavior of gold today has none of the attributes of a “bubble.”
If the last decade, fraught with insecurity, has driven up demand for gold, the question is, what happens next? None of us has a crystal ball, but all of us are determined to protect the assets we own or manage – and for the moment at least there is little doubt that gold is one of the best ways to protect the value of those assets.
While equities, debt markets, property and currencies – to name some of the more obvious forms of investment alternatives – have begun to recover in the past 18 months or so, there remain many ominous clouds on the geopolitical front. New risks continue to emerge, from growing political instability in the Middle East to the continued threat of terrorism. Meanwhile, excessive sovereign debt, huge unfunded government entitlement programs, an ever-greater use of quantitative easing, stalled economic growth in developed countries, stubbornly high unemployment, and an aging population are just some of the problems we have yet to resolve.
As we embark on a new decade, I can only conclude that the world is a long way from feeling secure. In fact, I believe we in the developed world have more reason today to be concerned and pessimistic than at any time in recent history – and with the outlook gloomy, there is, in my mind, no doubt that investors will continue to turn to gold as a rare safe haven.
Having made the case for gold generally, I’d like to comment on the past year at our Company, the world’s biggest gold producer. In 2010, Barrick recorded the most profitable year in its 27-year history, earning just under $3.3 billion. We increased production to 7.8 million ounces last year – and, despite the fact that currencies in most countries where we operate have appreciated against the U.S. dollar, our cash costs decreased to $457 per ounce.
Barrick’s remarkable performance led not only to record earnings, but also to record margins and cash flow. Thanks to the strength of our balance sheet, we were able to increase our dividend by 20%. Barrick’s share
3
Message from the Chairman
price, up 35% in 2010, outperformed both the price of gold and our peer group.
Meanwhile, our gold reserves now total 140 million ounces. And as the price of gold climbs, those reserves become increasingly valuable. Our new Cortez Hills mine in Nevada, for example, produced over 1.1 million ounces of gold in its first full year of operation – at a total cash cost of only $312 per ounce. Our Pueblo Viejo and Pascua-Lama projects, both of which we inherited through past acquisitions, will soon be contributing significant quantities of gold to our total production, again at low cash costs. Looking further ahead, our next generation of projects, including Cerro Casale and Donlin Creek, represent some of the most valuable gold assets in the world.
Whether it’s a question of financial strength or fiscal responsibility, basic operations or long-term strategic execution, Barrick’s track record is unmatched. For eight years in a row we have met or surpassed our annual targets. I’m also proud that we have achieved these extraordinary results while maintaining the highest commitment to corporate responsibility and integrity. We believe firmly in supporting the communities in which we operate, respecting the environment, and treating our employees and their families with dignity. From our senior management team to the individuals who work in our mines, from our directors to our support staff, Barrick’s team is composed of the most motivated and passionate people I have ever known. I am grateful to them all.
The newest member of our Board of Directors, Nathaniel Rothschild, represents yet another invaluable addition to Barrick’s brain trust. Nat is not only a member of one of Europe’s most prominent banking families, he is also an enormously successful financier and entrepreneur in his own right. Already, Nat’s knowledge of and experience in mining and resources have proven to be great assets to Barrick.
I noted earlier that I, unfortunately, don’t have a crystal ball. For one thing, I can’t promise that gold prices will keep rising. However, I can, with confidence, assure you that whatever happens in the world, Barrick will continue to lead the industry, always acting in the best interest of its shareholders. For nearly 30 years now, regardless of the price of gold, we’ve done just that.
/s/ Peter Munk | |
Peter Munk | |
Founder and Chairman | |
4
Barrick Annual Report 2010 | Message from the President and CEO
Message from the President and CEO

Aaron Regent
President and Chief Executive Officer
2010 was a record-breaking year for the gold industry. The appeal of gold as an investment grew significantly, reflecting persistent concerns about the global economy, geopolitical uncertainties and the outlook for global currencies. In many respects, the factors that have propelled gold prices to new highs intensified, pushing the metal to a new record of $1,431 per ounce.
The macroeconomic environment continues to be price supportive for gold. Expansionary monetary policies and quantitative easing programs have continued in order to stimulate economic growth and address high unemployment. In 2010, new sovereign debt concerns also emerged. The European Union announced bailouts for Greece and Ireland, while Spain and Portugal were also subject to credit concerns. The response to the bailouts has also led to a continued bias towards expansionary monetary policies. Global trade imbalances continue and a rebalancing will have an impact on the value of global currencies. As a monetary asset, gold’s value is determined relative to the value of other currencies. With downward pressure on currencies, gold’s relative value should continue to perform well. Meanwhile, geopolitical concerns have intensified with civil unrest and the potential for regime change throughout the Middle East, creating an increased environment of uncertainty and unpredictability.
Against this backdrop, investment demand for gold reached new records in 2010 and physical buying was strong. Central banks became net purchasers of gold after 21 years of selling. Physical demand, particularly from India and China, has also been very strong and is expected to continue. All of these factors underpin our positive outlook for gold prices going forward.
Our efforts to position Barrick as a prime beneficiary of a rising gold price, including the elimination of the Company’s gold hedges in 2009, helped to deliver record results for shareholders in 2010.
Operating results for the year met expectations, with higher gold production at lower cash costs compared to 2009. Gold production increased to 7.8 million ounces at total cash costs of $457 per ounce, or $341 per ounce on a net cash cost basis. Barrick also produced 368 million pounds of copper at total cash costs of $1.11 per pound. Strong operational results and consistent execution reflect the quality of the Company’s diversified portfolio, with 25 mines on four continents.
Our solid operational performance, combined with the increase in the gold price, resulted in record financial results. Adjusted net income for the year was $3.3 billion, an increase of 81% over 2009. This resulted in a return on equity of 19%. Adjusted cash flow from operations was $4.8 billion, up 65% from 2009.
Our leverage to the gold price was reflected in our financial results. While the gold price increased by 26% last year, Barrick realized record cash margins, which rose 48% to $771 per ounce, or $887 per ounce on a net cash cost basis. The Company’s earnings and cash flows per share have also significantly outpaced gold prices over the last six years, demonstrating the leverage we offer investors. While gold was up just over 200% in this period, Barrick’s cash flows per share have increased by over 400%, and earnings per share are up over 600%.
With record operating cash flows and expanding margins, Barrick continues to have the financial strength
5
Message from the President and CEO
to continue to invest in the business and meet our capital requirements while at the same time maintaining a strong balance sheet and returning capital back to shareholders. At year-end, the Company had about $4.0 billion in cash and a further $1.5 billion available through an undrawn line of credit, and we continue to have the gold industry’s only ‘A’ rated balance sheet. Given our financial position and the positive outlook for the Company, the Board of Directors authorized a 20% increase in the common share dividend in 2010. Over the past five years, the dividend has increased by about 120%.
Underpinning our annual production is a high quality and growing resource base. Targeted global exploration programs delivered excellent results, allowing Barrick to replace gold reserves in 2010 and grow gold resources. The Company has consistently replaced its reserves in each of the last five years, and we did so again in 2010. Gold reserves now stand at about 140 million ounces, the largest in the industry. In addition, measured and indicated gold resources grew 24% to 76 million ounces and inferred gold resources increased by 18% to 37 million ounces. Complementing our gold reserves and resources are 6.5 billion pounds of copper reserves, 13.0 billion pounds of measured and indicated copper resources and 9.1 billion pounds of inferred copper resources, plus 1.1 billion ounces of silver contained within gold reserves.
We continued to turn our resources into producing ounces with the advancement of our project pipeline. The Cortez Hills project in Nevada exceeded expectations in its first full year of production, boosting output at the Cortez property to 1.14 million ounces of gold in 2010.
We continued to make significant progress on our 60%-owned Pueblo Viejo project, located in the Dominican Republic. On a 100% basis, the project has gold reserves of over 23 million ounces. Barrick’s share of annual gold production in the first full five years of production is expected to average 625,000–675,000 ounces at total cash costs of $275–$300 per ounce. Work continues toward achieving key milestones.
What We Did in 2010
· Generated record net income and cash flow
· Return on equity increased to 19% from 12%
· Met targets to increase production at lower cash costs
· Completed Cortez Hills project on time and budget; ramp-up exceeded expectations
· Significantly advanced high return Pueblo Viejo and Pascua-Lama projects
· Acquired additional 25% ownership of Cerro Casale, a high quality, long life asset in a key region
· Identified significant new organic growth opportunities such as the potential to transform Turquoise Ridge into a large open pit operation
· Increased dividend by 20%
· Maintained license to operate:
· Achieved 22% improvement in total reportable injury frequency rate to 0.93
· Retained listings on the Dow Jones World and North America Sustainability Indexes and named to NASDAQ Global Sustainability Index
· First Canadian mining company to join the Voluntary Principles on Security and Human Rights
· Implemented Environmental Management System at all sites
· Maintained strong financial position and the industry’s only ‘A’ credit rating
· Replaced reserves and grew resources
· Completed IPO of African Barrick Gold
6
Barrick Annual Report 2010 | Message from the President and CEO
Construction at the Pascua-Lama project in Chile and Argentina is also progressing well, with initial production expected in 2013. This large, world-class project has approximately 18 million ounces of gold in reserves and 671 million ounces of contained silver. Once in operation, average annual production in the first full five years is expected to be 750,000–800,000 ounces of gold at total cash costs of $20–$50 per ounce, making Pascua-Lama one of the lowest cost gold mines in the world.
Looking further into the future, we continue to advance our next-generation projects, including Cerro Casale, Donlin Creek, Reko Diq and Kabanga. We have completed bankable feasibility studies for both Cerro Casale and Reko Diq, and we continue to work on improving the Donlin Creek feasibility study with the evaluation of a natural gas pipeline option for the project. In 2010, we also completed the acquisition of an additional 25% of Cerro Casale in Chile, which enabled us to gain control over this project and increase our metal exposure on a per share basis at attractive rates of return.
A greater emphasis on internal value creation has also surfaced some excellent opportunities within the Company’s existing portfolio. Combined with the production from our new mines under construction, this has positioned us to increase our production target to nine million ounces within five years. Beyond that horizon, we are currently evaluating an opportunity to transform the Turquoise Ridge Joint Venture in Nevada from a small underground mine to a large open pit operation. This would add another world-class asset to our portfolio.
The progress we made last year and the current position of the Company have been recognized by the market, as reflected by our strong share price performance in 2010. Barrick shares appreciated 35% last year, outperforming our peer group, and importantly, the gold price.
Our ability to meet our operating targets and advance our project pipeline is dependent upon maintaining a strong social license to operate. This means maintaining a strong safety culture, respecting the environment and achieving high standards of corporate and social responsibility.
What We Plan to Do in 2011
· Continue focus on increasing shareholder returns
· Meet production and cash cost targets
· Advance construction of Pueblo Viejo and Pascua-Lama and progress Cerro Casale towards a construction decision
· Continue to grow the net asset value of the Company and increase metal exposure per share by:
· maximizing free cash flow from existing operations
· growing reserves and resources
· advancing our pipeline of low cost, high quality projects
· pursuing selective acquisitions which are accretive to shareholder value
· Advance plans to achieve nine million ounce production target within five years
· Ensure license to operate through expanded CSR initiatives
· Preserve financial strength and the industry’s highest-rated balance sheet
· Continue trend of strong earnings and cash flow generation
7
Message from the President and CEO
As such, we continue to focus our efforts on enhancing and improving our performance in these areas.
At Barrick, we announced several initiatives in 2010 to further strengthen the Company’s corporate social responsibility (CSR) performance. We became the first Canadian mining company to join the Voluntary Principles on Security and Human Rights, a set of guidelines by which companies in the extractive sector can maintain the safety and security of their operations while ensuring respect for human rights and fundamental freedoms.
We also announced a plan to establish an external CSR Advisory Board that will provide advice and guidance to Barrick on challenging social and environmental issues and encourage further innovation and leadership in CSR. Consistent with these objectives, Barrick will also appoint an independent Director to its Board of Directors to support our commitment to CSR.
Our efforts in this area continue to be recognized. Barrick was once again listed on the Dow Jones World Sustainability Index, and the Company was added to the NASDAQ Global Sustainability Index, which tracks the world’s top 100 companies in this area.
Improving our safety performance will continue to be a priority in 2011. We achieved a significant reduction in total reportable injuries in 2010, however, the success we achieved was overshadowed by six fatalities during the year. This is unacceptable to me, and to everyone at Barrick. We will not rest in our efforts to improve until every person goes home safe and healthy every day. We have redoubled our efforts and have intensified our focus on critical risks, Visible Felt Leadership and incident investigation.
Looking ahead, the outlook for Barrick and our industry continues to be very bright. We expect the gold price will continue to be well supported. Our production levels in 2011 should be comparable to 2010 and will continue to trend higher as we make progress towards reaching our nine million ounce target. We have made considerable progress in controlling our operating costs but they will be higher in 2011 as we mine lower grade material, however, the impact is expected to be more than offset by higher gold prices. As a result, we should have another strong year of financial performance. Looking beyond 2011, Barrick’s cost profile should be stable as we benefit from the contribution of our new, low cost projects, including Pueblo Viejo and Pascua-Lama. In addition to these, we have a deep pipeline of other projects which will be augmented over time as a result of exploration success and the acquisition of new properties. Our focus on value creation, leveraging Barrick’s expertise and capabilities, has yielded significant results and I am confident that more can be done in this area to create further value for our shareholders.
In conclusion, I want to finish by recognizing the more than 20,000 employees around the world who work tirelessly to achieve the results that drive our performance. When I joined Barrick, I visited the Company’s mines and offices on four continents, and one thing struck me everywhere I went: the exceptional quality of our people. Two years later, my initial impressions have only intensified, and I want to thank the entire Barrick team for making this a great Company. Finally, I would also like to extend my gratitude to our Founder and Chairman, Peter Munk, and to the Board of Directors and our shareholders for their continued support and advice over the past year.
/s/ Aaron Regent | |
Aaron Regent | |
President and Chief Executive Officer | |
8
Barrick Annual Report 2010 | Focus on Value Creation
Focus on Value Creation
At Barrick, our primary goal is to maximize the value of the Company in a socially responsible way for the benefit of all our stakeholders. Our strategy is focused on increasing net asset value, production, reserves and earnings – all on a per share basis.
Barrick has a strong track record of creating value at its existing mines and projects. In 2010, our regional business units were given a clear mandate to unlock the full potential of our assets and took a fresh look at their portfolios to identify value creation opportunities and maximize free cash flow. This has resulted in our target to profitably increase production to nine million ounces within five years(1), and has uncovered some exciting prospects, including the open pit potential at Turquoise Ridge and other options to surface hidden value at our existing mines.
In support of this sharpened focus on value creation, our strategy is centered on investing in high return development projects such as Pueblo Viejo and Pascua-Lama, increasing our gold and copper reserves through both exploration and selective, accretive acquisitions, maximizing the value of our existing mines and leveraging our technical skills and regional infrastructure to commercialize new deposits. We recognize that our ability to be successful in the long run depends on a high standard of corporate social responsibility, and while Barrick has a strong social license, we continually strive to improve our social and environmental performance.
Our efforts are supported by our ‘A’ rated balance sheet, our management bench strength and the high quality of our employees, all of which position us to meet our goals. Barrick is focused on building long life, high return projects and is one of the few companies with the expertise and broad set of resources to develop large scale mines that are expected to provide lower cost ounces to the Company for the next several decades. The quality of these projects also enables us to be highly disciplined with respect to external opportunities, which are consistently benchmarked against our existing pipeline.
Our commitment to creating value should not only help us achieve our targeted production growth in what we expect to be a strong gold price environment, but also enable the Company to continue returning additional value to our shareholders.

From left: Jamie Sokalsky, Kelvin Dushnisky, Peter Kinver and Aaron Regent.
(1) The target of nine million ounces of annual production within five years reflects a current assessment of the expected production and timeline to complete and commission Barrick’s projects currently in construction (Pueblo Viejo and Pascua-Lama); and the Company’s current assessment of existing mine site opportunities, some of which are sensitive to metal price and various capital and input cost assumptions.
9
Exceptional Gold Price Leverage
Exceptional Gold Price Leverage

Gold surged to record-breaking highs in 2010 above $1,430 per ounce, recording its tenth straight year of price gains. Bullion continues to benefit from a myriad of price supportive factors which have driven robust investment demand, including a macroeconomic environment reflecting accommodative fiscal policies and ongoing monetary reflation, persistent sovereign debt issues in Europe and significant global trade and current account imbalances.
The global fiscal and monetary policies designed to stimulate economic recovery have had the dual effect of reducing the value of the world’s major currencies and affirming gold’s role in global portfolios. Central banks became net buyers of gold in 2010 for the first time in 21 years in an effort to diversify their holdings and address excessive foreign exchange reserves. Investor demand in the emerging economies of China and India is just beginning to ramp up, particularly following further measures to liberalize the Chinese gold market in 2010. We expect these trends to continue, along with a longer term contraction in mine supply as new discoveries become scarcer and as permitting timelines and requirements to bring new production on line have lengthened and become more complex.
Against this positive backdrop, Barrick offers investors a compelling combination of exceptional leverage through the benefits of active management relative to the gold ETF and lower risk compared to less diversified gold producers through our global portfolio of operations, as well as a competitive dividend yield. This leverage is backed by the industry’s largest gold reserves and production, a disciplined focus on value creation, and a strong balance sheet that enables us to pursue our strategy and goals.
10
Barrick Annual Report 2010 | Financial Strength and Flexibility
Financial Strength and Flexibility
In 2010, Barrick successfully grew its production and lowered its cash costs, bucking the industry trend to higher costs. The Company achieved its fifth straight year of margin expansion with record cash margins of $771 per ounce(1) or $887 per ounce(1) on a net cash cost basis, reflecting cash margin growth of 48% versus gold’s 26% rise. Combined with higher production of 7.8 million ounces, this resulted in record 2010 adjusted earnings and adjusted operating cash flow of $3.3 billion and $4.8 billion, respectively, as well as significant free cash flow of $1.5 billion(1), despite making substantial investments in our projects. Our ‘A’ credit rating and robust financial position – including cash of $4.0 billion, a $1.5 billion undrawn line of credit and strong operating cash flow – position us to continue executing on our project development plans and give us the flexibility to pursue other high return value creation opportunities within our portfolio.
Our excellent financial results have driven growth in our return on equity to 19% and enabled us to return additional capital to shareholders, while continuing to invest in our high return projects. Barrick has raised its dividend by nearly 120% in the past five years as gold prices have appreciated, including a 20% increase in 2010. This steady dividend growth reflects both the Company’s continued financial strength and our favorable outlook for gold.

Going forward, we expect to increase Barrick’s superior leverage to gold as our long life, high quality projects in construction – Pueblo Viejo and Pascua-Lama – begin contributing substantial new low cost production in the coming years. Beyond this, we see tremendous potential in our feasibility stage projects such as Cerro Casale, Donlin Creek and Reko Diq and in value creation opportunities underway at operating mines such as Turquoise Ridge and Zaldívar.
(1) Non-GAAP financial measure – see pages 78–85 of the 2010 Financial Report.
“Barrick generated record earnings and cash flow in 2010 as we increased production at lower cash costs, while continuing to invest in our high return projects. We were also able to return more capital to shareholders, raising the dividend by 20%.” Jamie Sokalsky, Executive Vice President and Chief Financial Officer | 
|
11
Operational Excellence
Operational Excellence
Our high quality, diversified asset base is a key driver that enables us to consistently meet targets and expectations. Barrick produced 7.8 million ounces of gold in 2010 at total cash costs of $457 per ounce or net cash costs of $341 per ounce, remaining the industry production leader at competitive cash costs. The Company delivered on its production target and, despite higher royalties and taxes associated with a year of record gold prices, was able to maintain cash costs in line with guidance, illustrating the flexibility of our 25-mine portfolio, the active management of our input costs and another year of strong operating performance from our regional business units.
Our largest operating region, North America, contributed 3.11 million ounces of gold in 2010, primarily from its cluster of seven mines in Nevada. The expanded Cortez mine had an excellent year, producing 1.14 million ounces of gold at total cash costs of $312 per ounce with nearly a full year of production from Cortez Hills, which had a smooth ramp-up from both the open pit and underground operations. We expect to receive a Record of Decision in early 2011, allowing the mine to revert to its original scope. Barrick has added significant value to the Cortez

The Cortez Hills underground operation had a smooth ramp-up.
12
Barrick Annual Report 2010 | Operational Excellence
Cortez Case Study – Value Added Since Acquisition
2006 | | 2010 | | Future Value Creation Opportunities |
| | | | |
6.3 M oz of reserves(1) | | 14.5 M oz of reserves(1) | | Cortez Hills Middle and Lower |
60% interest | | 100% interest | | Zone extensions |
Pipeline: declining, | | Cortez: 1.1 M oz low cost | | Significant regional opportunities |
higher cost mine | | mine generating significant | | on underexplored 1,080 square |
| | cash flow | | mile property |
(1) 2006 and 2010 reserves reflect Barrick’s 60% and 100% interest, respectively. See page 22 of the 2010 Annual Report for additional information on Barrick’s reserves.
property since its acquisition in 2006 (see case study) by consolidating 100% ownership, expanding reserves and resources and bringing the world-class Cortez Hills deposit into production. We expect to create additional value through exploration success on this highly prospective property.
Our low cost South America region contributed 2.12 million ounces in 2010. The Veladero mine in Argentina had an outstanding year, producing more than 1.1 million ounces at total cash costs of $256 per ounce on higher grades and expanded throughput, while the Lagunas Norte mine in Peru contributed over 0.8 million ounces at total cash costs of $182 per ounce after producing more than one million ounces for four straight years. As a result of higher gold prices, the Pierina mine in Peru is now expected to continue operations until the end of 2014.
Led by the Porgera mine in Papua New Guinea, which celebrated its 20th year of production, our Australia Pacific business unit produced 1.94 million ounces in 2010. As of year-end 2010, the Company is 92% hedged on all of its Australian operating and capital expenditures for 2011 at an average rate of $0.79, 84% hedged for 2012 at an average rate of $0.75, and has substantial coverage for the following two years at rates at or below $0.75.
African Barrick Gold produced 0.56 million equity ounces to Barrick as issues with transitional oxide ore and the impact of actions taken in
“ Our diverse portfolio of operations enabled us to meet guidance for the eighth straight year in 2010. We also made excellent progress advancing our high quality projects – Cortez Hills had a successful ramp-up and we expect Pueblo Viejo and Pascua-Lama to contribute significant new low cost ounces in the coming years.” Peter Kinver, Executive Vice President and Chief Operating Officer | | 
|
13
Operational Excellence
response to the fuel theft at Buzwagi resulted in lower than expected production for the year. The Company was admitted to the benchmark FTSE 100 Index during the year, signaling its stature among the most highly capitalized London-listed companies.
Barrick’s core gold business continued to profit from the reinvestment of strong cash flow from our two copper operations in 2010 as copper prices strengthened. Production from the large Zaldívar operation in Chile and the smaller Osborne mine in Australia, which was sold during the year, was 368 million pounds at total cash costs of $1.11 per pound, generating cash margins of 67%.
For 2011, Barrick forecasts equity production comparable to 2010 in the range of 7.6–8.0 million ounces at total cash costs and net cash costs of $450–$480 per ounce and $340–$380 per ounce(1), respectively. The Cortez Hills and Goldstrike mines in Nevada, the Veladero mine in Argentina and Porgera in Papua New Guinea are anticipated to make strong contributions.
Beyond 2011, the Company is targeting organic production growth to nine million ounces within five years and total cash costs to benefit from the start-up of its low cost Pueblo Viejo and Pascua-Lama projects.


(1) Net cash costs assume a realized copper price of $3.75 per pound for 2011.
14
Barrick Annual Report 2010 | Project Development Expertise
Project Development Expertise

One of Barrick’s distinctive hallmarks is its industry-leading technical expertise and strong track record of commercializing deposits from its pipeline of world-class development projects. Having delivered seven new mines in the past five years, Barrick has a reputation for successful mine development and a history of extracting further value from its assets post discovery or acquisition. This tradition of excellence and value creation is built on decades of experience acquired in building and operating a diverse set of mines in remote and often challenging operating environments around the globe.
The Cortez Hills project in Nevada is Barrick’s newest achievement, completed on time and budget in early 2010.
Our two world-class projects in construction, Pueblo Viejo in the Dominican Republic and Pascua-Lama on the border of Chile and Argentina, are forecast to contribute an average annual total of 1.4 million ounces(1) at low total cash costs when in full production, illustrating the significant impact these mega projects will have in strengthening the quality of Barrick’s portfolio.
As of February 2011, the 24,000 tonne per day Pueblo Viejo project was about 50% complete, with approximately 75% of its pre-production capital budget of about $3.3–$3.5 billion (100% basis) committed and first production expected in Q1 2012. All four autoclaves, the gold industry’s largest, have been installed and are in the process of being bricklined, and the main columns for the 4,000 tonne per day oxygen plant have been erected. In December
(1) Based on average production for both projects in their first full five years once both are at full capacity.
15
Project Development Expertise
2010, the Environmental Impact Assessment for the 240 kV power transmission line was approved, allowing associated construction activities to commence. Barrick’s 60% share of gold production from Pueblo Viejo in the first full five years of operation is expected to average 625,000–675,000 ounces at total cash costs of $275–$300 per ounce(2). Barrick has added considerable value to Pueblo Viejo since acquiring it in the 2006 Placer Dome transaction (see case study), expanding reserves by more than 75% and transforming this asset into a high return project with a mine life of more than 25 years. Applying in-house expertise, Barrick’s metallurgists dramatically improved silver and copper recoveries and the overall flowsheet, creating a significantly more robust project. A circuit to recover about three billion pounds of contained zinc is under evaluation, and the Company continues to explore options for longer term, lower cost power options.
Major progress was made in 2010 on advancing construction of the world-class Pascua-Lama gold-silver project on the border of Chile and Argentina, which is expected to enter production in the first half of 2013. As of February 2011, approximately 40% of the pre-production budget of about $3.3–$3.6 billion had been committed. Anticipated average annual production of 750,000–800,000 ounces at

High purity oxygen from the plant will be injected into the Pueblo Viejo autoclaves to release the gold.
Pueblo Viejo Case Study – Value Added Since Acquisition
2006 | | 2010 | | Future Value Creation Opportunities |
13.4 M oz of reserves(3) | | 23.7 M oz of reserves(3) | | Circuit to recover ~three billion |
Modest economics | | Robust economics | | pounds of contained zinc |
Technical challenges, | | Improved flowsheet, | | Longer term, lower cost |
low recoveries | | increased recoveries | | power options |
Au: 92% | | Au: 92% | | Reserve/resource upside |
Ag: 5% | | Ag: 87% | | |
Cu: 0% | | Cu: 79% | | |
(2) Based on gold and oil price assumptions of $1,100 per ounce and $85 per barrel, respectively.
(3) 100% basis. Barrick has a 60% interest in Pueblo Viejo. See page 22 of the 2010 Annual Report for additional information on Barrick’s reserves.
16
Barrick Annual Report 2010 | Project Development Expertise

total cash costs of $20–$50 per ounce(4) in the first full five years illustrates the positive impact this mega project will have on the Company’s overall portfolio. Each $1 per ounce increase in the price of silver is expected to reduce total cash costs by about $35 per ounce over this period.
As of February 2011, detailed engineering had been advanced to more than 90% completion. The four kilometer long ore tunnel connecting the mine in Chile with the processing plant in Argentina has been collared from both sides and is expected to be completed in the second half of 2012. Construction of the power transmission line is underway and the new access road is about 75% complete. With 17.8 million ounces of gold reserves and 671 million ounces of silver contained within the gold reserves, Pascua-Lama is expected to contribute very low cost ounces to Barrick over a mine life in excess of 25 years.
At the large Cerro Casale gold-copper project in Chile’s Maricunga district, detailed engineering was about 30% complete as of February 2011.

An excavator preparing the pebble crusher platform frames the tunnel portal in Argentina.
(4) Based on gold and oil price assumptions of $1,100 per ounce and $85 per barrel, respectively, and applying silver credits assuming a by-product silver price of $16 per ounce and assuming a Chilean peso f/x rate of 500:1.
17
Project Development Expertise
The review and timing of additional permitting requirements to accommodate changes to project design before considering a construction decision are being assessed alongside consultation with local communities and indigenous peoples.
A review is currently underway to determine the impact of a stronger Chilean peso and higher labor costs in Chile on expected capital and operating costs. An update will be provided by the end of the second quarter.
Next Generation of Projects
Barrick’s next tier of projects includes the Donlin Creek gold project in Alaska, the Reko Diq project in Pakistan and the Kabanga nickel project in Tanzania, all of which have progressed to the feasibility stage and represent significant option value within our portfolio.
The Donlin Creek 50-50 joint venture is one of the largest undeveloped gold projects in the world, with nearly 39 million ounces of measured and indicated gold resources and the potential to produce more than one million ounces per year (100% basis). Additional optimization work to evaluate the use of natural gas to reduce operating costs is expected to be completed in the third quarter of 2011.
At the 37.5% -owned Reko Diq copper-gold project in Pakistan, the initial mine development feasibility study and the environmental and social impact assessment are both complete. A copy of the feasibility study has been delivered to the government of Balochistan in accordance with the terms of the joint venture agreement with the government. The project company, Tethyan Copper, made an application for a mining lease on February 15, 2011(1).
A feasibility study and environmental and social impact assessment for the Kabanga nickel project in Tanzania, one of the world’s largest undeveloped nickel sulfide deposits, is expected to be completed in the first half of 2011. Acquired through an earlier gold acquisition, the project is a 50-50 joint venture with operator Xstrata Plc and hosts a measured and indicated resource of 2.2 billion pounds of nickel (100% basis). Barrick will consider how to extract the best value from this high quality asset for its shareholders.

Barrick’s 75%-owned Cerro Casale project in Chile is one of the world’s largest undeveloped gold-copper deposits and is located in a core region for the Company.
(1) As of February 2011, the Supreme Court of Pakistan was hearing several constitutional petitions relating to the Reko Diq project, which, among other things, challenge the government’s right to grant a mining lease to Tethyan Copper.
18
Barrick Annual Report 2010 | Surfacing Hidden Value
Surfacing Hidden Value
In addition to the world-class Pueblo Viejo and Pascua-Lama projects, which are expected to contribute significant new ounces at costs substantially lower than our current profile, we are focused on maximizing the value of our existing mines where we see new potential to organically grow production and extend mine life. With a strong mandate to create value, our regions carried out a rigorous re-evaluation of their portfolios in 2010 and identified a number of exciting options to surface hidden value.
The most significant of these came to light with a fresh look at our 75%-owned Turquoise Ridge mine in Nevada, which unearthed the potential to develop a large scale open pit to mine the lower grade halo around the high grade core. An open pit operation could conceptually quadruple total annual production to up to about 800,000 ounces a year from current annual production of 150,000–200,000 ounces based on 2010 reserves of 5.6 million ounces, measured and indicated resources of 11.2 million ounces and inferred resources of 6.9 million ounces(1). A scoping study and Phase 2 infill drill program is currently underway in support of a prefeasibility study which is expected to be completed in 2012, followed by a feasibility study in 2013. Early metallurgical testing indicates strong recoveries using acid autoclaving. While this project is beyond our nine million ounce target production timeframe, it provides excellent potential to make substantial contributions to production in the future.
At the Goldstrike Complex in Nevada, our metallurgists have been successful in piloting a thiosulphate leaching flow sheet after the autoclave process that enables treatment of mixed carbonaceous material previously routed to the roaster. We expect this will extend the life of the autoclaves and help support production rates at Goldstrike. There is good potential to apply this process and enhance efficiencies at other mines.
(1) 100% basis. Assumes a gold price of $975 per ounce. Feasibility, permitting and construction are estimated to take ~8 years. Key permits and approvals needed include: Environmental Impact Statement, Plan of Operations Approval, Clean Water Act Section 404 Permitting, Mercury Control Permits, Water Pollution Control Permit.

19
Surfacing Hidden Value

With the receipt of permits in 2010, a significant expansion commenced at the Bald Mountain mine in Nevada and is expected to be complete by late 2011, increasing annual production from 100,000 ounces to 150,000–200,000 ounces per year and extending the mine life by 10 years. The unified plan includes expanded process facilities, the merger of the North pits and the inclusion of several satellite pits. A proposed layback at the Hemlo mine in Ontario may also significantly extend the mine life at this operation.
The Lagunas Norte mine in Peru is one of the Company’s lowest cost producers, and has consistently outperformed our expectations since its start-up in 2005. We have defined some viable targets around the mine site, including the deeper sulfide ore, which have good potential to extend the mine life by four years with an additional two million ounces.
At Zaldívar, our large copper producer in Chile, where there are existing reserves of 6.5 billion pounds of copper plus a measured and indicated resource of 1.3 billion pounds, the deeper primary sulfides underneath the current open pit potentially offer an additional six billion pounds of copper containing about 2.4 million ounces of gold. The sulfides potentially represent an additional one billion tonnes that could overlap with the existing operation and extend the mine life by about 16 years(2). A prefeasibility study is expected to commence in the second quarter of 2011.
Our 2010 review also identified other brownfield opportunities which could increase production or extend the mine lives at the Kalgoorlie, Cowal, Granny Smith, and Porgera mines in our Australia Pacific region.
(2) Additional exploration and engineering is required to define the deep sulfide potential and it is uncertain whether Barrick will be able to define this potential resource. Development of Zaldívar deep sulfides assumes copper and gold prices of $2.50 per pound and $900 per ounce, respectively.
20
Barrick Annual Report 2010 | Industry’s Largest Gold Reserves
Industry’s Largest Gold Reserves
Barrick has a strong history of finding new ounces to replenish its gold reserves and resources, and we continued this tradition in 2010 by replacing our industry leading reserves of about 140 million ounces, despite reducing our equity interest in African Barrick Gold. Just as importantly, we strengthened our underlying resources, growing measured and indicated ounces by 24% to over 76 million ounces and increasing inferred resources by 18% to over 37 million ounces.
Our success at maintaining the industry’s largest reserve base can be largely attributed to our sustained approach to funding exploration, our deep technical expertise and disciplined approach to pipeline management, and an integrated alignment with corporate development. This strategy(1) has resulted in Barrick’s significant land positions on many of the world’s most prospective gold and copper trends, including the underexplored El Indio belt in Chile and Argentina and the Cortez Trend in Nevada. Barrick’s reserves continue to be largely situated in lower risk areas, with about 65% located in investment grade countries(2) including Chile, Australia, the United States and Canada.
As a result of exploration success in 2010, our 2011 exploration budget is expected to increase by over 50% to $320–$340 million. Of the total, about 43% will be allocated to North America, with the majority targeted for Nevada to upgrade resources at Turquoise Ridge, where drilling continues in support of the scoping study, and to outline additional resources at Cortez. The Cortez property remains highly prospective, with excellent potential to add new ounces to the current 14.5 million ounce reserve from the Cortez Hills Middle and Lower Zones and from regional targets on our 1,080 square mile land position. The 2011 budget continues to be heavily weighted towards brown-field exploration around our existing operations, while still supporting substantial generative efforts to explore for large deposits, particularly in highly endowed, underexplored areas such as Papua New Guinea and El Indio. Activities in the El Indio area have been refocused to explore for gold-copper porphyry targets and have outlined 19 high priority targets, several of which will be drilled in 2011.
Over the past 20 years, Barrick’s exploration group has had excellent success at finding high quality, lower
(1) Barrick’s exploration programs are designed and conducted under the supervision of Robert Krcmarov, Senior Vice President, Global Exploration of Barrick. For information on the geology, exploration activities generally, and drilling and analysis procedures on Barrick’s material properties, see Barrick’s most recent Annual Information Form/Form 40-F on file with Canadian provincial securities regulatory authorities and the U.S. Securities and Exchange Commission.
(2) BBB- or higher as rated by Standard and Poor’s.
“Our exploration group is aligned with Barrick’s business needs and understands how to maximize the chances of success. In 2010, Barrick successfully replaced its reserves, marking the fifth straight year we have done so, and substantially grew resources. It’s a testament to the depth and quality of our project pipeline and people.” Rob Krcmarov, Senior Vice President, Global Exploration | | 
|
21
Industry’s Largest Gold Reserves
cost ounces, identifying and delivering notable increases at Pascua-Lama, Lagunas Norte, Veladero, Pueblo Viejo, Cortez, Turquoise Ridge, and Donlin Creek.
Our key mines and projects continue to demonstrate strong exploration potential, positioning the Company to extract further value from its high quality portfolio through the drill bit.

Night drilling tests regional targets on Barrick’s highly prospective Nevada land package.
Reserves and Resources Summary(1),(2),(3)
at December 31, 2010 | | Proven and | | Measured and | | Inferred | |
(Barrick’s equity share) | | Probable Reserves | | Indicated Resources | | Resources | |
Gold (000s oz) | | 139,786 | | 76,319 | | 37,202 | |
North America | | 56,783 | | 45,573 | | 16,772 | |
South America | | 53,922 | | 10,265 | | 6,284 | |
Australia Pacific | | 16,568 | | 16,464 | | 11,331 | |
Africa | | 12,429 | | 3,967 | | 2,748 | |
Other | | 84 | | 50 | | 67 | |
| | | | | | | |
Other Metals | | | | | | | |
Copper (M lbs) | | 6,514 | | 13,014 | | 9,149 | |
Nickel (M lbs) | | — | | 1,080 | | 596 | |
Other Metals Contained in:
| | Proven and | | Measured and | | Inferred | |
| | Probable Gold Reserves | | Indicated Gold Resources | | Gold Resources | |
Silver (000s oz) | | 1,066,332 | | 232,890 | | 61,647 | |
Copper (M lbs) | | 5,735 | | 1,164 | | 1,563 | |
(1) Mineral reserves (“reserves”) and mineral resources (“resources”) have been calculated as at December 31, 2010 in accordance with National Instrument 43-101 as required by Canadian securities regulatory authorities. For United States reporting purposes, Industry Guide 7, (under the Securities and Exchange Act of 1934), as interpreted by Staff of the SEC, applies different standards in order to classify mineralization as a reserve. Accordingly, for U.S. reporting purposes, Cerro Casale is classified as mineralized material. In addition, while the terms “measured”, “indicated” and “inferred” mineral resources are required pursuant to National Instrument 43-101, the U.S. Securities and Exchange Commission does not recognize such terms. Canadian standards differ significantly from the requirements of the U.S. Securities and Exchange Commission, and mineral resource information contained herein is not comparable to similar information regarding mineral reserves disclosed in accordance with the requirements of the U.S. Securities and Exchange Commission. U.S. investors should understand that “inferred” mineral resources have a great amount of uncertainty as to their existence and great uncertainty as to their economic and legal feasibility. In addition, U.S. investors are cautioned not to assume that any part or all of Barrick’s mineral resources constitute or will be converted into reserves. Calculations have been prepared by employees of Barrick, its joint venture partners or its joint venture operating companies, as applicable, under the supervision of Rick Sims, Senior Director, Resources and Reserves of Barrick, Chris Woodall, Senior Director, Mining of Barrick and John Lindsay, Senior Director Metallurgy, of Barrick. Except as noted below, reserves have been calculated using an assumed long-term average gold price of $US 1,000 ($Aus. 1,180) per ounce, a silver price of $US 16.00 per ounce, a copper price of $US 2.00 per pound and exchange rates of $1.05 $Can/$US and $0.85 $US/$Aus. Reserves at Round Mountain have been calculated using an assumed long-term average gold price of $US 900. Reserve calculations incorporate current and/or expected mine plans and cost levels at each property. Varying cut-off grades have been used depending on the mine and type of ore contained in the reserves. Barrick’s normal data verification procedures have been employed in connection with the calculations. Resources as at December 31, 2010 have been estimated using varying cut-off grades, depending on both the type of mine or project, its maturity and ore types at each property. For a breakdown of reserves and resources by category and for a more detailed description of the key assumptions, parameters and methods used in calculating Barrick’s reserves and resources, see Barrick’s most recent Annual Information Form/Form 40-F on file with Canadian provincial securities regulatory authorities and the U.S. Securities and Exchange Commission.
(2) 2009 reserves and resources for the Cerro Casale project reflect Barrick’s then 50% interest. In March 2010, Barrick acquired an additional 25% of Cerro Casale. 2010 reserves and resources reflect Barrick’s 75% interest.
(3) In March 2010, Barrick created African Barrick Gold plc to hold its African gold mines, gold projects and gold exploration properties. As of April 2010, Barrick owns approximately 73.9% of African Barrick Gold plc.
22
Barrick Annual Report 2010 | Strong Focus on Responsible Mining
Strong Focus on Responsible Mining
Corporate Social Responsibility
As public expectations of the mining industry continue to rise, corporate social responsibility has never been more important. Barrick renewed and increased its focus on CSR in 2010. Efforts were aimed at further strengthening Barrick’s global performance in such areas as community relations, environmental management, security and human rights, and corporate governance.

Barrick works with governments and NGOs to ensure the provision of basic health services and improve community health.
Barrick’s CSR performance and alignment with international standards continue to be recognized. We are proud to be listed for the third consecutive year as a world leader in social and environmental responsibility by the Dow Jones World Sustainability Index. This also marks the first year that the Company has earned a place on the NASDAQ Global Sustainability Index of the top 100 companies worldwide. In addition, the Carbon Disclosure Project named Barrick a climate disclosure leader for the Company’s climate change strategy and reporting practices.

Strengthening Corporate Governance
To enhance expertise in CSR at the most senior level of the Company, Barrick announced a plan to establish an external CSR Advisory Board that will provide advice and guidance to Barrick on challenging social and environmental issues and encourage further innovation and leadership. Barrick will also appoint an independent Director to its Board of Directors to support our commitment to CSR. A search is underway to fill this position in 2011.
Commitment to Human Rights

Since 2005, Barrick has invested more than $33 million to build schools and improve education around the world.
Barrick is committed to protecting human rights and dignity at its operations around the world. In 2010, Barrick became the first Canadian mining company to be admitted to formally join the Voluntary Principles on Security and Human Rights, a set of guidelines by which companies in the extractive sector can maintain the safety and security of their operations while ensuring respect for human rights. We are advancing the implementation of the Voluntary Principles, engaging in the tripartite process with NGOs, extractive sector companies and government members, while working closely with local communities. This is particularly important in the complex environments in
23
Strong Focus on Responsible Mining
which Barrick operates and faces ongoing challenges, and where it is further strengthening its policies and compliance with these human rights principles.
Effective Engagement with our Stakeholders
At Barrick, we understand the value of relationships. Our ability to be successful as a company depends on being able to engage effectively with governments, civil society and our host communities. By being responsive to the issues and expectations of our stakeholders, we build trust and reduce business risks over the long term.
In 2010, Barrick completed a third-party assurance process of our performance and alignment with the International Council on Mining and Metals Sustainable Development Framework. While the overall results of this evaluation were positive, we also received constructive feedback and recommendations for improvements.

More than 5,000 people have participated in Barrick’s adult literacy program in Papua New Guinea.
For example, based on the input received, we have enhanced communications on issues of concern to our external stakeholders. Going forward, this assurance process will be conducted on an annual basis. We are also further strengthening our grievance mechanisms at all sites to ensure communities have a voice and a systematic way to resolve complaints, while building the capacity of the Company’s community relations function.
Creating a Positive Legacy
Barrick continues to make significant investments in community programs that take into account local development needs and priorities. As the Company has grown, our investments in such areas as health and education continue to expand. Our community programs are wide-ranging: from

24
Barrick Annual Report 2010 | Strong Focus on Responsible Mining
fighting HIV/AIDS and bringing electricity to towns in Tanzania to improving child nutrition and maternal health in Peru, assisting local farmers and suppliers in Chile and Argentina and providing adult literacy programs in Papua New Guinea and the Dominican Republic.
Globally, our operations are a catalyst for social and economic development and contribute to a higher standard of living. A study of the impact of the Pierina mine in Peru documented a decline in the poverty rate from 80% to 31% in one local district from 1993–2007. In developing regions, large-scale skills training programs are conducted to enable thousands of local people to join our workforce, while entrepreneurs can receive training to become suppliers to our operations. These are just some of the ways Barrick is maximizing the positive benefits of our operations and improving our CSR performance globally.
Environmental Stewardship
Around the world, Barrick operates to high environmental standards and is committed to continuous improvement. Consistent with this commitment, Barrick’s Environmental Management System (EMS) was implemented at all sites in 2010 and underwent a third-party review to identify possible areas of improvement. The Company also completed a three-year risk assessment to review the safety of tailings impoundments at all operations and closed sites. A tailings guidance manual was developed to ensure the Company is meeting or exceeding industry best practice in this area.
Pursuing Industry Leadership
In 2010, the Company also set its sights on industry-wide issues, such as addressing water use, safeguarding biodiversity, and reducing energy use and greenhouse gas (GHG) emissions.
Water conservation is an area where Barrick is demonstrating leadership, reflected in improved, more systematic management and monitoring of water use at our operations. Three industry-leading water conservation pilot projects are now underway at sites in Australia, Tanzania and North America. Eighteen Barrick mines are zero water discharge operations, with all water recycled and reused for mining processes on site. In 2011, Barrick will participate in the Water Disclosure Project to contribute to greater understanding of global industrial water use.
“Barrick made significant strides in its approach to responsible mining in 2010. We recognize the importance of proactively engaging with communities, governments and other stakeholders to ensure we maintain strong support for our operations. By challenging ourselves to improve, we have become a stronger and better company, positioned for even greater success in the future.” Kelvin Dushnisky, Executive Vice President, Corporate and Legal Affairs | 
|
25
Strong Focus on Responsible Mining

In the area of biodiversity, Barrick is pursuing new territory for the industry. The Company is engaging with leading experts to put our biodiversity standard into practice and better manage, mitigate and offset biodiversity impacts. At the Kanowna Belle mine in Australia, Barrick is piloting the Nature Conservancy’s Development by Design strategy, a science-based approach to conservation planning and mitigation. In the Dominican Republic, a second pilot project to protect local species near the Pueblo Viejo project is also underway.
For the second year, the Company has established regional targets to improve energy and carbon efficiency at all operations. Overall, Barrick has improved ore processes, resulting in less GHG emissions per tonne of ore processed. Using this measure, Barrick’s emissions decreased 15% from 2006 to 2009. Barrick is also now completing a mercury abatement program which aims to control and reduce mercury emissions from processing facilities at our operations.
Barrick has long been a leading advocate of the International Cyanide Management Code, having achieved Code certification at 20 operations – more than any other gold producer. Code recertification of six operations has already been completed. In collaboration with the Mining Association of Canada, the Company is taking this commitment one step further by publicly advocating that Code safety standards and certification become standard practice within the gold mining industry.
Environmental Leadership from Within
Looking ahead, Barrick also plans to participate in a World Wildlife Fund (WWF) internship program that will provide future company leaders with an unparalleled opportunity to participate in the environmental programs of this respected organization around the world. Participants will work with WWF’s world-class scientists to gain a greater appreciation of the need to manage environmental impacts as well as the significance of company decision-making on the environment. This internship program complements new employee awards to acknowledge environmental leadership. Finally, in 2011, Barrick will begin a process to make annual
26
Barrick Annual Report 2010 | Strong Focus on Responsible Mining
environmental data at each operation publicly available.
Safety and Health
Barrick’s safety vision is every person going home safe and healthy every day. During 2010, Barrick continued to implement initiatives to reinforce a zero incident culture.
Barrick’s Courageous Leadership for Safety and Health training continues to be the catalyst for improved performance. During 2010, more than 8,000 employees and contractors participated in Courageous Leadership safety training. Through its concerted safety systems and implementation of standards in 2010, the Company’s overall reportable injury frequency rate decreased from 1.02 to 0.93. The Australia Pacific region improved significantly, with a 70% reduction in its lost-time injury frequency rate. A notable achievement was reached at the Pueblo Viejo project, when it exceeded 22 million hours without a lost-time incident. Three additional sites accumulating over 16 million hours also worked through 2010 without a lost-time injury. Sadly, our 2010 progress was overshadowed by six fatalities – which is unacceptable.
Nearly half of all high potential incidents are related to driving and mobile equipment. In recent years, Barrick has introduced a Mobile Equipment Operating Policy, Drive First education modules and the use of training simulators. In 2010, Barrick began installing WaySmartTM driver monitors in all vehicles. These devices monitor driver behavior and alert drivers if they are speeding, driving aggressively, or not wearing a seatbelt. If the driver does not correct the undesired behavior, the unit records the data and alerts the supervisor. By the end of 2010, more than 2,200 of these units had been installed and further installations will ensue in 2011.

North Mara’s Josephine Mkono receives the new CSR Champion Award.
In addition to these initiatives, Barrick continues to be an active member of the Earth Moving Equipment Safety Round Table (EMESRT). Since 2006, Barrick has been one of 10 major mining companies working directly with original equipment manufacturers to develop safe design

| “At Barrick, the values that define us as a company include a commitment to upholding human rights wherever we operate. That means respecting people — respecting our fellow employees and respecting those in the communities in which we work.” Sybil Veenman, Senior Vice President and General Counsel |
27
Strong Focus on Responsible Mining

philosophies for heavy equipment. In September 2010, EMESRT met again with major equipment manufacturers to review progress to mitigate risks defined by the EMESRT design philosophies.
Barrick’s efforts in 2011 will focus on three key areas: risk management of high potential risks, Visible Felt Leadership, and incident investigation. The Safety group has conducted an assessment of incidents to define the highest priority risks. Standards exist to mitigate each of these risks, and efforts will focus on ensuring effective implementation and compliance at every site. Barrick continues to invest in training to maintain a pool of Barrick Certified Investigators who conduct thorough investigations to determine the root cause of any failure of these existing controls and recommend mitigating actions. In 2011, efforts will focus on ensuring that final recommended mitigating actions from these investigations be implemented company-wide.
“Achieving zero incidents requires people to stop and think before undertaking any task to determine what risks are involved and how to eliminate or mitigate them. We reinforce this field level risk assessment process to make it part of our safety culture.” Don Ritz, Senior Vice President, Safety and Leadership | 
|
28
Financial Report
Management’s Discussion and Analysis | 30 |
| |
Financial Statements | 104 |
| |
Notes to Consolidated Financial Statements | 108 |
| |
Mineral Reserves and Resources | 163 |
| |
Corporate Governance and Committees of the Board | 171 |
| |
Shareholder Information | 172 |
| |
Board of Directors and Senior Officers | 174 |
29
Management’s Discussion and Analysis
Management’s Discussion and Analysis (“MD&A”)
Management’s Discussion and Analysis (“MD&A”) is intended to help the reader understand Barrick Gold Corporation (“Barrick”, “we”, “our” or the “Company”), our operations, financial performance and present and future business environment. This MD&A, which has been prepared as of February 16, 2011, should be read in conjunction with our audited consolidated financial statements for the year ended December 31, 2010. Unless otherwise indicated, all amounts are presented in US dollars.
For the purposes of preparing our MD&A, we consider the materiality of information. Information is considered material if: (i) such information results in, or would reasonably be expected to result in, a significant change in the market price or value of our shares; or (ii) there is a substantial likelihood that a reasonable investor would consider it important in making an investment decision; or (iii) if it would significantly alter the total mix of information available to investors. We evaluate materiality with reference to all relevant circumstances, including potential market sensitivity.
Continuous disclosure materials, including our most recent Form 40-F/Annual Information Form, annual MD&A, audited consolidated financial statements, and Notice of Annual Meeting of Shareholders and Proxy Circular will be available on our website at www.barrick.com, on SEDAR at www.sedar.com and on EDGAR at www.sec.gov. For an explanation of terminology unique to the mining industry, readers should refer to the glossary on page 99.
Cautionary Statement On Forward-Looking Information
Certain information contained or incorporated by reference in this MD&A, including any information as to our strategy, plans or future financial or operating performance, constitutes “forward-looking statements”. All statements, other than statements of historical fact, are forward-looking statements. The words “believe”, “expect”, “anticipate”, “contemplate”, “target”, “plan”, “intend”, “continue”, “budget”, “estimate”, “may”, “will”, “schedule” and similar expressions identify forward-looking statements. Forward-looking statements are necessarily based upon a number of estimates and assumptions that, while considered reasonable by us, are inherently subject to significant business, economic and competitive uncertainties and contingencies. Known and unknown factors could cause actual results to differ materially from those projected in the forward-looking statements. Such factors include, but are not limited to: fluctuations in the market and forward price of gold and copper or certain other commodities (such as silver, diesel fuel and electricity); the impact of global liquidity and credit availability on the timing of cash flows and the values of assets and liabilities based on projected future cash flows; fluctuations in the currency markets (such as Canadian and Australian dollars, South African rand, Chilean peso, Argentinean peso, British pound, Peruvian sol and Papua New Guinean kina versus US dollar); changes in US dollar interest rates that could impact the mark-to-market value of outstanding derivative instruments and ongoing payments/receipts under interest rate swaps and variable rate debt obligations; risks arising from holding derivative instruments (such as credit risk, market liquidity risk and mark-to-market risk); changes in national and local government legislation, taxation, controls, regulations and political or economic developments
30
Barrick Financial Report 2010 | Management’s Discussion and Analysis
in Canada, the United States, Dominican Republic, Australia, Papua New Guinea, Chile, Peru, Argentina, South Africa, Tanzania, United Kingdom, Pakistan or Barbados or other countries in which we do or may carry on business in the future; business opportunities that may be presented to, or pursued by, us; our ability to successfully integrate acquisitions; operating or technical difficulties in connection with mining or development activities; employee relations; availability and increased costs associated with mining inputs and labor; litigation; the speculative nature of exploration and development, including the risks of obtaining necessary licenses and permits; diminishing quantities or reserve grades; adverse changes in our credit rating; and contests over title to properties, particularly title to undeveloped properties. In addition, there are risks and hazards associated with the business of exploration, development and mining, including environmental hazards, industrial accidents, unusual or unexpected formations, pressures, cave-ins, flooding and gold bullion or copper cathode losses (and the risk of inadequate insurance, or inability to obtain insurance, to cover these risks). Many of these uncertainties and contingencies can affect our actual results and could cause actual results to differ materially from those expressed or implied in any forward-looking statements made by, or on behalf of, us. Readers are cautioned that forward-looking statements are not guarantees of future performance. All of the forward-looking statements made in this MD&A are qualified by these cautionary statements. Specific reference is made to Barrick’s most recent Form 40-F/Annual Information Form on file with the SEC and Canadian provincial securities regulatory authorities for a discussion of some of the factors underlying forward-looking statements. We disclaim any intention or obligation to update or revise any forward-looking statements whether as a result of new information, future events or otherwise, except to the extent required by applicable law.
Changes in Presentation of Non-GAAP Financial Performance Measures
We use certain non-GAAP financial performance measures in our MD&A. For a detailed description of each of the non-GAAP measures used in this MD&A, please see the discussion under “Non-GAAP Financial Performance Measures” beginning on page 78 of our MD&A.
Adjusted Debt and Net Debt
Starting in 2010, we introduced adjusted debt and net debt as new non-GAAP measures. We have adjusted our long-term debt to exclude fair value adjustments and our partner’s share of project financing and to include the settlement obligation to close out the gold sales contracts and issue costs. We have excluded the impact of fair value adjustments in order to reflect the actual settlement obligation in relation to the debt instrument. We have excluded our partner’s share of project financing, in situations where we report 100% of the debt on a consolidated basis but have only provided a guarantee for our proportionate share of the debt. We have included the settlement obligation related to gold sales contracts because they have terms similar to long-term debt instruments and have been settled in cash. Our cash and equivalents (net of our partner’s share of cash where we have excluded their proportionate share of the project financing from our adjusted debt calculation) is deducted from the adjusted total to arrive at net debt.
These adjusted debt and net debt figures are more indicative of how we manage our debt levels internally than the equivalent US GAAP measures and provide a meaningful measure for investors and analysts to evaluate our overall debt capacity, liquidity and capital structure. They are intended to provide additional information only and do not have any standardized meaning prescribed by US GAAP and should not be considered in isolation or as substitutes for measures of performance prepared in accordance with US GAAP. Other companies may calculate these measures differently.
Adjustment to Cash Costs
Also starting in 2010, we adjusted our gold total cash costs to remove the impact of ore purchase agreements that have economic characteristics similar to toll milling arrangements. The cost of producing these ounces is not indicative of our normal production costs. Hence, we have removed such costs from total cash costs.
31
Management’s Discussion and Analysis
Free Cash Flow
Starting in 2010, we introduced free cash flow as a new non-GAAP measure. We have deducted capital expenditures from adjusted operating cash flow to arrive at free cash flow.
Free cash flow is a measure that management believes to be a useful indicator of the Company’s ability to operate without reliance on additional borrowing or usage of existing cash. It is intended to provide additional information only and does not have any standardized meaning prescribed by US GAAP and should not be considered in isolation or as a substitute for measures of performance prepared in accordance with US GAAP. The measure is not necessarily indicative of operating profit or cash flow from operations as determined under US GAAP. Other companies may calculate this measure differently.
Return on Equity
Starting in 2010, we introduced return on equity as a new non-GAAP measure. Return on equity has been defined as adjusted net income divided by average shareholders’ equity.
Return on equity is a measure that management believes to be a useful indicator of the Company’s performance. It is intended to provide additional information only and does not have any standardized meaning prescribed by US GAAP and should not be considered in isolation or as a substitute for measures of performance prepared in accordance with US GAAP. Other companies may calculate this measure differently.
Index |
| |
33 | Financial and Operating Highlights |
| | |
| 33 | 2010 Fourth Quarter and Year-End Results |
| 35 | 2010 Business Developments |
| 38 | Outlook for 2011 |
| | |
42 | Business Overview |
| | |
| 42 | Our Business |
| 43 | Our Strategy |
| 43 | Capability to Execute our Strategy |
| 46 | Enterprise Risk Management |
| 47 | Market Review |
| | |
54 | Financial and Operating Results |
| | |
| 54 | Summary of Financial Performance |
| 55 | Summary of Operating Performance |
| 59 | Mineral Reserves and Mineral Resources Update |
| 59 | Review of Operating Segment Performance |
| | |
65 | Financial Condition Review |
| | |
| 65 | Balance Sheet Review |
| 67 | Liquidity and Cash Flow |
| 69 | Financial Instruments |
| 70 | Commitments and Contingencies |
| | |
72 | Review of Quarterly Results |
| |
73 | US GAAP Critical Accounting Policies and Estimates |
| |
78 | Non-GAAP Financial Performance Measures |
| |
85 | International Financial Reporting Standards (IFRS) |
| |
99 | Glossary of Technical Terms |
32
Barrick Financial Report 2010 | Management’s Discussion and Analysis
Financial and Operating Highlights(1)
2010 Fourth Quarter and Year-End Results
Summary of Financial and Operating Data
| | For the three months ended | | For the years ended | |
| | December 31 | | December 31 | |
($ millions, except where indicated) | | 2010 | | 2009 | | 2010 | | 2009 | |
Financial Data | | | | | | | | | |
Sales | | $ | 3,033 | | $ | 2,452 | | $ | 11,211 | | $ | 8,404 | |
Net income/(loss) | | 896 | | 215 | | 3,274 | | (4,274 | ) |
Per share (“EPS”)(2) | | 0.90 | | 0.22 | | 3.32 | | (4.73 | ) |
Adjusted net income(3) | | 947 | | 604 | | 3,279 | | 1,810 | |
Per share (“adjusted EPS”)(2),(3) | | 0.95 | | 0.61 | | 3.32 | | 2.00 | |
EBITDA(3) | | 1,635 | | 794 | | 5,900 | | (2,563 | ) |
Adjusted EBITDA(3) | | 1,635 | | 1,035 | | 5,900 | | 3,370 | |
Capital expenditures | | 1,145 | | 748 | | 3,323 | | 2,358 | |
Operating cash flow | | 781 | | (4,300 | ) | 4,127 | | (2,322 | ) |
Adjusted operating cash flow(3) | | 1,437 | | 921 | | 4,783 | | 2,899 | |
Free Cash Flow(3) | | $ | 292 | | $ | 173 | | 1,460 | | 541 | |
Cash and equivalents | | | | | | 3,968 | | 2,564 | |
Adjusted debt(3) | | | | | | 6,392 | | 6,919 | |
Net debt(3) | | | | | | $ | 2,542 | | $ | 4,355 | |
Return on equity(3) | | | | | | 19 | % | 12 | % |
| | | | | | | | | |
Operating Data | | | | | | | | | |
Gold | | | | | | | | | |
Gold produced (000s ounces)(4) | | 1,700 | | 1,871 | | 7,765 | | 7,397 | |
Gold sold (000s ounces) | | 1,825 | | 1,797 | | 7,734 | | 7,279 | |
Realized price ($ per ounce)(3) | | $ | 1,368 | | $ | 1,119 | | $ | 1,228 | | $ | 985 | |
Net cash costs ($ per ounce)(3) | | $ | 326 | | $ | 310 | | $ | 341 | | $ | 360 | |
Total cash costs ($ per ounce)(3) | | $ | 486 | | $ | 465 | | $ | 457 | | $ | 464 | |
| | | | | | | | | |
Copper | | | | | | | | | |
Copper produced (millions of pounds) | | 82 | | 98 | | 368 | | 393 | |
Copper sold (millions of pounds) | | 103 | | 118 | | 391 | | 380 | |
Realized price ($ per pound)(3) | | $ | 3.99 | | $ | 3.44 | | $ | 3.41 | | $ | 3.16 | |
Total cash costs ($ per pound)(3) | | $ | 1.12 | | $ | 1.08 | | $ | 1.11 | | $ | 1.17 | |
(1) The amounts presented in this table include the results of discontinued operations.
(2) Calculated using weighted average number of shares outstanding under the basic method.
(3) Adjusted net income, adjusted EPS, EBITDA, adjusted EBITDA, adjusted operating cash flow, free cash flow, adjusted debt, net debt, return on equity, realized price, net cash costs and total cash costs are non-GAAP financial performance measures with no standardized meaning under US GAAP. For further information and a detailed reconciliation, please see pages 78 – 85 of this MD&A.
(4) Production includes our equity share of gold production at Highland Gold.
33
Management’s Discussion and Analysis
Fourth Quarter and Full Year Financial and Operating Highlights
· Net income and adjusted net income for the fourth quarter 2010 were $896 million and $947 million, respectively, compared to net income of $215 million and adjusted net income of $604 million for fourth quarter 2009. Net income for the year 2010 was $3,274 million, compared to a net loss of $4,274 million in 2009, which included a $5,901 million charge related to the elimination of our gold sales contracts. Adjusted net income for the year 2010 was $3,279 million, compared to $1,810 million for full year 2009.
· EPS and adjusted EPS for the fourth quarter 2010 were $0.90 and $0.95, respectively, compared to EPS of $0.22 and adjusted EPS of $0.61 for the fourth quarter 2009. EPS for the year 2010 was $3.32, compared to the loss of $4.73 for full year 2009. Adjusted EPS for the year 2010 was $3.32, compared to $2.00 for full year 2009. The significant increase in adjusted EPS in 2010 largely reflects the increase of gold production and realized gold prices. EPS and adjusted EPS reflect the impact of the issuance of 109 million common shares in third quarter 2009, which represented a 12% increase in common shares then outstanding with a corresponding dilutive impact on both EPS and adjusted EPS.
· EBITDA and adjusted EBITDA for the fourth quarter 2010 were both $1,635 million, compared to EBITDA of $794 million and adjusted EBITDA of $1,035 million for the fourth quarter 2009. EBITDA and adjusted EBITDA for the year 2010 was $5,900 million, compared to EBITDA of $(2,563) million and adjusted EBITDA of $3,370 million for full year 2009.
· Operating cash flow and adjusted operating cash flow for the fourth quarter 2010 were $781 million and $1,437 million, respectively, compared to operating cash outflow of $4,300 million and adjusted operating cash flow of $921 million for the fourth quarter 2009. Operating cash flow for the year 2010 was $4,127 million, compared to operating cash outflow of $2,322 million in 2009. Operating cash flow reflects payments related to the settlement of gold sales contracts of $5,221 million in 2009 and $656 million in 2010. Adjusted operating cash flow, which excludes the impact of these payments, totaled $4,783 million in 2010 compared to $2,899 million in 2009.
· Free cash flow for the fourth quarter 2010 was $292 million, compared to $173 million for the fourth quarter 2009. Free cash flow for the year 2010 was $1,460 million, compared to $541 million for full year 2009. The increases reflect higher adjusted operating cash flow, partially offset by higher capital expenditures.
· Primary factors driving the increase in net income, adjusted net income, EPS, adjusted EPS, EBITDA, adjusted EBITDA, operating cash flow, adjusted operating cash flow and free cash flow were higher realized gold and copper prices and higher gold sales volume. Net income and adjusted net income were impacted by higher amortization, higher income tax expense, and higher interest expense as a result of debt issuance in fourth quarter 2009.Net income, EPS, EBITDA and operating cash flow were also impacted by the elimination of the gold sales contracts.
· Gold production and total cash costs for the fourth quarter 2010 were 1.7 million ounces and $486 per ounce, respectively, compared to production of 1.9 million ounces and total cash costs of $465 per ounce for fourth quarter 2009. Gold production and total cash costs for the year 2010 were 7.8 million ounces and $457 per ounce, respectively, compared to production of 7.4 million and total cash costs of $464 per ounce for full year 2009. Gold sales totaled 1.8 million ounces for the fourth quarter 2010 and 7.7 million ounces for the year 2010, compared to 1.8 million ounces and 7.3 million ounces, respectively, for the comparable prior year periods. Gold production increased for the year primarily due to increased production at Cortez, Veladero, Kalgoorlie and Cowal, partially offset by decreases in production at Goldstrike, Pierina and Lagunas Norte.
· Copper production and total cash costs for the fourth quarter 2010 were 82 million pounds and $1.12 per pound, respectively, compared to production of 98 million pounds and total cash costs of $1.08 per pound for fourth quarter 2009. Copper production and total cash costs for the year 2010 were 368 million pounds and $1.11 per pound, respectively, compared to production of 393 million pounds and $1.17 per pound for full year 2009. Copper sales totaled 103 million pounds for the fourth quarter 2010 and 391 million pounds for the year 2010, compared to 118 million pounds and 380 million pounds, respectively, for the comparable prior year periods. Copper sales were higher than copper produced in 2010 primarily due to higher sales volume in Osborne, where shipping delays moved part of 2009 production into 2010 sales. Copper production decreased for the year 2010 primarily due to a decrease in copper production as a result of the divestiture of Osborne in third quarter 2010.
34
Barrick Financial Report 2010 | Management’s Discussion and Analysis
· Realized gold price for the fourth quarter 2010 was $1,368 per ounce, compared to $1,119 per ounce for fourth quarter 2009. Realized gold price for the year 2010 was $1,228 per ounce, compared to $985 per ounce for full year 2009. The increases principally reflect higher market gold prices.
· Realized copper price for the fourth quarter 2010 was $3.99 per pound, compared to $3.44 per pound for fourth quarter 2009. Realized copper price for the year 2010 was $3.41 per pound, compared to $3.16 per pound for full year 2009. The increases reflect higher market copper prices.
· Net cash costs for the fourth quarter 2010 were $326 per ounce, compared to $310 per ounce for the fourth quarter 2009. Net cash costs for the year were $341 per ounce, compared to $360 per ounce for the full year 2009. Net cash costs decreased in 2010, primarily due to higher copper credits as a result of higher market copper prices.
· Capital expenditures totaled $1,145 million for fourth quarter 2010 and $3,323 million for the year 2010, compared to $748 million and $2,358 million, respectively, for the comparable prior year periods. The increases largely reflect higher project capital expenditures and higher minesite sustaining capital expenditures.
· At December 31, 2010, cash and equivalents totaled $3,968 million, adjusted debt totaled $6,392 million and net debt totaled $2,542 million, compared to the equivalent December 31, 2009 totals of $2,564 million, $6,919 million and $4,355 million, respectively. During 2010, we received $469 million in project financing for Pueblo Viejo ($782 million on a 100% basis) and repaid $805 million in debt, including $656 million to settle the remaining obligation for the gold sales contracts.
2010 Business Developments
Economic, Fiscal and Legislative Developments
The current global economic situation has impacted Barrick in a number of ways. The response from many governments to the ongoing economic crisis has led to continuing low interest rates and a reflationary environment that has supported higher commodity prices. The increase in gold, copper and silver market prices in particular (refer to Market Review section of this MD&A for more details) have been key drivers of higher income and operating cash flows for Barrick. The fiscal pressures currently experienced by many governments have resulted in a search for new sources of revenues, and the mining industry, which is generating significant profits and cash flow in this high metal price environment, is facing the possibility of higher income taxes and royalties. The proposed Australian Mineral Resources Rent Tax (“MRRT”) is one example. While the MRRT has been greatly revised to its current form, and is no longer expected to apply to our gold operations, we continue to monitor developments related to this proposal. In addition, in order to finance reconstruction stemming from the devastating 2010 earthquake, the Chilean government recently enacted a temporary first tier income tax increase from 17% to 20% in 2011 and 18.5% in 2012 as well as a new elective mining royalty. In January 2011 we adopted the new royalty. The impact of adoption was a $26 million increase in 2010 income tax expense and an expected increase of about $15 million in 2011 income tax expense. The impact of the temporary income tax rate increase on 2011 income tax expense is expected to be about $20 million.
On the legislative front, Argentina recently passed a federal glacier protection law that restricts mining in areas on or near the nation’s glaciers. Our activities do not take place on glaciers, and are undertaken pursuant to existing environmental approvals issued on the basis of comprehensive environmental impact studies that fully considered potential impacts on water resources, glaciers and other sensitive environmental areas around Veladero and Pascua-Lama. We have a comprehensive range of measures in place to protect such areas and resources. Further, we believe that
35
Management’s Discussion and Analysis
the new federal law is unconstitutional, as it seeks to legislate matters that are within the constitutional domain of the provinces. The Province of San Juan, where our operations are located, previously enacted glacier protection legislation with which we comply. We believe we are legally entitled to continue our current activities on the basis of existing approvals. In this regard, the Federal Court in San Juan has granted injunctions, based on the unconstitutionality of the federal law, suspending its application in the Province and in particular to Veladero and Pascua-Lama pending consideration of the constitutionality of the law by the Supreme Court of Argentina. It is possible that others may attempt to bring legal challenges seeking to restrict our activities based on the new federal law. We will vigorously oppose any such challenges.
Financing Developments
IPO of African Gold Mining Operations
In March 2010, the initial public offering (“IPO”) for African Barrick Gold plc (“ABG”) closed and its approximately 404 million ordinary shares were admitted to the Official List of the UK Listing Authority and to trading on the London Stock Exchange’s main market for listed securities. ABG sold approximately 101 million ordinary shares in the offering, or about 25% of its equity and Barrick retained an interest in approximately 303 million ordinary shares, or about 75% of the equity of ABG. In April 2010, the over-allotment option was partially exercised, resulting in a 1.1% dilution of our interest in ABG to 73.9%.
The net proceeds from the IPO and the exercise of the over-allotment option were approximately $884 million. As Barrick retained a controlling financial interest in ABG, we have consolidated ABG and accounted for the disposition of ABG shares as an equity transaction. Accordingly, the difference between the proceeds received and the carrying value has been recorded as additional paid-in capital in equity, and we have set up a non-controlling interest to reflect the change in our ownership interest in ABG.
Pueblo Viejo Project Financing Agreement
In April 2010, Barrick and Goldcorp finalized terms for $1.035 billion (100% basis) in non-recourse project financing for our Pueblo Viejo project. The lending syndicate is comprised of international financial institutions, including two export credit agencies, and a syndicate of commercial banks. The financing is divided into three tranches of $400 million, $375 million and $260 million with terms of 15, 15 and 12 years, respectively. Barrick and Goldcorp have each provided a guarantee for their proportionate share, which will terminate upon Pueblo Viejo meeting certain operating completion tests, and which is subject to a carve out for certain political risk events. In June 2010, we received $782 million (100% basis) in the first draw on this financing arrangement and these funds are being used to fund ongoing construction at the project.
Increased Dividend
As a result of our positive outlook on the gold price, our strong financial position and robust operating cash flows, Barrick’s Board of Directors authorized an annual dividend increase from $0.40 per common share to $0.48 per common share. The Board also approved moving from a semi-annual dividend to a quarterly dividend(1).
Acquisitions and Divestitures
Acquisition of Additional 25% Interest in Cerro Casale
In March 2010, we completed the acquisition of an additional 25% interest in Cerro Casale from Kinross Gold Corporation (“Kinross”) for cash consideration of $454 million and the elimination of a $20 million contingent obligation that was payable by Kinross to Barrick on a construction decision. Our interest in the project is now 75% and we have obtained control over the project. As a result, we began consolidating 100% of the operating results, cash flows and net assets of Cerro Casale, with an offsetting non-controlling interest of 25%, prospectively as at March 31, 2010. As a result of becoming the primary beneficiary of the Variable Interest Entity (“VIE”), we have remeasured our previously held 50% ownership interest to fair value and recorded a corresponding gain of $29 million.
(1) The declaration and payment of dividends remains at the discretion of the Board of Directors and will depend on our financial results, cash requirements, future prospects and other factors deemed relevant by the Board.
36
Barrick Financial Report 2010 | Management’s Discussion and Analysis
Barrick Energy Acquisitions
In 2010, Barrick Energy completed three acquisitions. In May 2010, Barrick Energy acquired all of the outstanding shares of Bountiful Resources (“Bountiful”), a privately held corporation, for approximately $109 million. In June 2010, Barrick Energy acquired the Puskwa property from Galleon Energy Inc. (“Puskwa”) for approximately $130 million. In September 2010, Barrick Energy acquired the assets of Dolomite Resources (“Dolomite”) for approximately $25 million. We have determined that all of these transactions represent business combinations, with Barrick Energy identified as the acquirer. Barrick Energy began consolidating the operating results, cash flows, and net assets of Bountiful, Puskwa, and Dolomite from their respective acquisition dates. The properties acquired in these transactions are in close proximity to our existing operations and we expect to realize operational synergies once they have been integrated. Barrick Energy provides a natural economic hedge against our fuel price exposure and with the benefit of these acquisitions, total production for 2010 increased to approximately 2.1 million barrels of oil equivalent (“boe”).
Sedibelo
In February 2011, we entered into agreements to dispose of our 10% interest in the Sedibelo platinum project (“Sedibelo”) and certain assets to the Bakgatla-Ba-Kgafela Tribe (“BBK”), owner of the remaining 90% interest in Sedibelo, as well as the transfer of certain long lead items required for the development of Sedibelo to Newshelf 1101 (Proprietary) Limited, for total consideration of approximately $44 million; and to settle various outstanding matters between Barrick and the BBK regarding Sedibelo and their respective interests. The agreements are subject to certain customary conditions. We expect to realize a gain of approximately $65 million upon closing of these transactions, which is expected by the end of first quarter 2011.
Project Development Progress
Pueblo Viejo Construction
At our Pueblo Viejo project, construction is progressing with first production expected in first quarter 2012. Preproduction capital is expected to increase by 10 – 15% from the previous estimate to $3.3 – $3.5 billion (100% basis). The increased capital cost estimate is largely due to higher labor, power supply, freight and steel product related costs as well as general inflation. Once in production, this project will begin to contribute to Barrick’s annual gold production at lower cash costs than the Company average. The project is a long life asset with an expected mine life of over 25 years.
Pascua-Lama Construction
In 2009, we began construction of the Pascua-Lama project on the border between Chile and Argentina, which is on track to commence production in the first half of 2013. Pre-production capital is expected to increase by 10 – 20% to $3.3 – $3.6 billion as a result of a stronger Chilean peso and labor, commodity and other input cost increases in both countries and higher inflation, particularly in Argentina. When complete, it is expected to be one of the lowest operating cost gold producing mines in the world. The project is a long life asset with an expected mine life of over 20 years.
Cerro Casale Advancement
At the Cerro Casale project in Chile, the review of additional permitting requirements before considering a construction decision is progressing. A review is currently underway to determine the impact of a stronger Chilean peso and higher labor costs in Chile on costs. Early indications suggest that the capital cost may be higher by about 20 – 25% from the previous estimate of $4.2 billion, which is based on the feasibility study completed in 2009 and reflects the impact of a stronger Chilean peso, higher labor, commodity and other input costs. An update will be provided by the end of the second quarter. Cerro Casale is one of the world’s largest undeveloped gold-copper deposits.
37
Management’s Discussion and Analysis
Outlook for 2011
2011 Guidance Summary
| | 2010 | | 2011 | |
| | Actual IFRS basis (unaudited)(1) | | Guidance IFRS basis(1) | |
Gold production and costs | | | | | |
Production (millions of ounces)(2) | | 7.8 | | 7.6 – 8.0 | |
Cost of sales(3) | | 4,566 | | 5,100 – 5,300 | |
Gold unit production costs | | | | | |
Total cash costs ($ per ounce)(4) | | 409 | | 450 – 480 | |
Net cash costs ($ per ounce)(5) | | 292 | | 340 – 380 | |
Depreciation ($ per ounce)(6) | | 136 | | 150 – 160 | |
Copper production and costs | | | | | |
Production (millions of pounds) | | 368 | | ~300 | |
Cost of sales(7) | | 430 | | 500 – 520 | |
Copper unit production costs | | | | | |
Total cash costs ($ per pound) | | 1.10 | | 1.35 – 1.45 | |
Depreciation ($ per pound) | | 0.23 | | 0.25 – 0.30 | |
Other depreciation(8) | | 50 | | 35 – 45 | |
Exploration and evaluation expense(9) | | 234 | | 330 – 350 | |
Exploration(10) | | 152 | | 210 – 220 | |
Evaluation | | 82 | | 120 – 130 | |
Corporate administration | | 157 | | 160 – 170 | |
Other expense(11) | | 473 | | 325 – 350 | |
Other income(11) | | 142 | | 25 – 30 | |
Finance income | | 14 | | 20 – 25 | |
Finance costs(12) | | 158 | | 60 – 80 | |
Capital expenditures: | | | | | |
Minesite sustaining | | 863 | | 900 – 1,000 | |
Open pit and underground mine development(13) | | 571 | | 750 – 850 | |
Minesite expansion(13) | | 251 | | 450 – 500 | |
Capital projects(14) | | 1,691 | | 2,100 – 2,300 | |
Effective income tax rate(15) | | TBD | | 33 | % |
(1) The preliminary 2010 IFRS results are unaudited. Final 2010 IFRS results are subject to management’s final review as well as audit by the Company’s independent registered accounting firm and may vary significantly from these preliminary results because of a number of factors, including, without limitation, additional or revised information and changes in accounting standards or policies or in how these standards are applied.
(2) Guidance for gold production reflects Barrick’s equity share of ABG (73.9%) and Highland Gold (20%).
(3) Cost of sales applicable to gold includes depreciation expense and cost of sales applicable to the outside equity interests in ABG. Guidance for cost of sales reflects the full 100% consolidation of ABG gold sales. Under IFRS, the outside equity interest in ABG’s share of cost of sales is reflected as a reduction in income attributable to non-controlling interests, which we do not provide guidance for. Cost of sales guidance does not include proceeds from by-product metal sales or the net contribution from Barrick Energy, whereas guidance for gold total cash costs and gold net cash costs do reflect these items. See page 91 of this MD&A for a reconciliation of 2010 cost of sales reported in accordance with US GAAP to cost of sales reported in accordance with IFRS.
(4) Gold total cash costs includes expected proceeds of approximately $150 million (2010: $120 million) from the sale of by-product metals and the net contribution of approximately $95 million from Barrick Energy (2010: $56 million). See page 92 of this MD&A for a reconciliation of 2010 total cash costs reported in accordance with US GAAP to total cash costs reported in accordance with IFRS.
(5) Assuming a realized copper price of $3.75 per pound.
(6) Includes depreciation expense related to Barrick Energy.
(7) Cost of sales applicable to copper includes depreciation expense. See page 91 of this MD&A for a reconciliation of cost of sales reported in accordance with US GAAP to cost of sales reported in accordance with IFRS.
(8) Represents depreciation for the Corporate office and Regional Business Unit offices. Excludes accretion expense since it is now classified as part of finance costs under IFRS.
(9) Represents Barrick’s share of expenditures for 2011 after deducting $8 million for non-controlling interests (2010: $18 million) and includes expected costs of $13 million for Reko Diq and Donlin Creek that will be classified under “income (loss) from equity investees” (2010: $23 million).
(10) Total exploration expenditures in 2011 are expected to be about $320 – $340 million including $210 – $220 million (2010: $152 million) in exploration expense and $110 – $120 million (2010: $60 million) in capitalized exploration costs. The capitalized exploration costs are included in the guidance for open pit and underground mine development and minesite expansion. See page 91 of this MD&A for a reconciliation of 2010 exploration and project development expenses reported in accordance with US GAAP to exploration and project development expenses reported in accordance with IFRS.
(11) Other expense and other income are expected to be lower in 2011 as 2010 costs include special items of approximately $100 million in other expense, primarily due to severance and restructuring costs, and approximately $120 million in other income, primarily due to the gain recorded on the acquisition of the additional 25% interest in Cerro Casale. Other income guidance for 2011 excludes gain of $65 million expected from sale of Sedibelo.
(12) See page 92 of this MD&A for a reconciliation of 2010 interest expense reported in accordance with US GAAP to finance costs reported in accordance with IFRS.
(13) Includes capitalized exploration costs.
(14) Represents Barrick’s share of project capital expenditures including capitalized interest of about $350 million in 2011 (2010: $309 million).
(15) Effective income tax rate has not been presented since final IFRS assessment has not been completed.
38
Barrick Financial Report 2010 | Management’s Discussion and Analysis
In 2011, Barrick will move to reporting its results on an International Financial Reporting Standards (“IFRS”) basis from US GAAP. This change will bring our basis of reporting in line with the other large international mining companies that already report their results in accordance with IFRS, and therefore the conversion to IFRS will improve the comparability of our financial performance to these companies. There are significant accounting policy differences between IFRS and US GAAP, particularly the accounting for production phase waste stripping costs and exploration and evaluation costs. IFRS allows greater flexibility in determining whether these costs are eligible for capitalization. As a result, the conversion to IFRS will result in a decrease in operating costs, an increase in net assets and an increase in operating cash flow and capital expenditures compared to our equivalent results presented in accordance with US GAAP. Guidance for 2011 has been prepared on an IFRS basis with comparative information based on our preliminary calculation of the results under IFRS for 2010. For a reconciliation of results for 2010 prepared under US GAAP compared to the preliminary results prepared under IFRS, please refer to page 87 of this MD&A.
2011 Guidance Analysis
Production
We prepare estimates of future production based on mine plans that reflect the expected method by which we will mine reserves at each site. Actual gold and copper production may vary from these estimates due to a number of operational factors, including whether the volume and/or grade of ore mined differs from estimates, which could occur because of changing mining rates, ore dilution, varying metallurgical and other ore characteristics, and/or short-term mining conditions that require different sequential development of ore bodies or mining in different areas of the mine. Certain non-operating factors may also cause actual production to vary from guidance, including litigation risk, the regulatory environment and the impact of global economic conditions. Mining rates are also impacted by various risks and hazards inherent at each operation, including natural phenomena, such as inclement weather conditions, floods and earthquakes, and unexpected civil disturbances, labor shortages or strikes.
We expect 2011 gold production to be about 7.6 to 8.0 million ounces, which is consistent with the 2010 level of 7.8 million ounces. Gold production in North America is expected to increase due to an increase in tons processed and higher average head grades at Cortez Hills and the recommencement of production at Golden Sunlight after a two-year mine development period. The increase in North America is offset by lower production in South America, primarily due to lower ore grades at Veladero. Production in Australia Pacific and our share of ABG production are expected to be similar to 2010 production levels.
Copper production is expected to decrease from 368 million pounds in 2010 to about 300 million pounds, largely due to the divestiture of the Osborne mine in third quarter 2010.
Beyond 2010, we are targeting to increase our gold production to 9 million ounces within the next five years. The significant drivers of this production growth include our Pueblo Viejo and Pascua-Lama projects, as well as various expansionary opportunities at our existing operating mines.
Revenues
Revenues include consolidated sales of gold, copper, oil and metal by-products. Revenues from oil and metal by-products are reflected in our guidance for gold total cash costs. Revenues from gold and copper reported in 2011 will reflect the sale of production at market gold and copper prices and the impact of copper hedge contracts. Barrick does not provide guidance on 2011 gold and copper prices.
Cost of Sales, Net Cash Costs and Total Cash Costs
We prepare estimates of cost of sales, net cash costs and total cash costs based on expected costs associated with mine plans that reflect the expected method by which we will mine reserves at each site. Cost of sales, net cash costs and total cash costs per ounce/pound are also affected by ore metallurgy that impacts gold and copper recovery rates, labor costs, the cost of mining supplies and services, foreign currency exchange rates and stripping costs incurred during the production phase of the mine. In the normal course of our operations, we attempt to manage each of these risks to mitigate, where possible, the effect they have on our operating results.
Cost of sales applicable to gold is expected to be in the range of $5.1 to $5.3 billion, compared to $4.6 billion in 2010. The increase is primarily due to an increase in tons mined and tons processed compared to 2010 levels, and higher labor costs and inflationary cost pressures, particularly in South America and Australia Pacific.
39
Management’s Discussion and Analysis
Total cash costs are expected to be in the range of $450 to $480 per ounce compared to $409 per ounce in 2010. The increase in 2011 principally reflects the impact of lower ore grades, particularly in South America, which is expected to be partially offset by an increase in production levels due to higher tons processed and the impact of higher labor costs in South America and Australia. These increases are expected to be partially offset by higher by-product credits due to expected higher copper and silver prices.
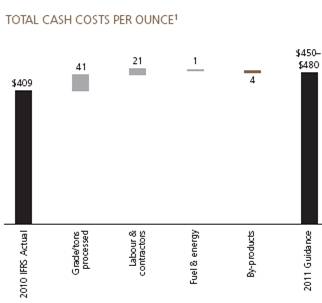
(1) Chart depicts approximate impacts of each category on total cash costs per ounce.
Cost of sales applicable to copper is expected to be in the range of $500 to $520 million compared to $430 million in 2010. Total cash costs are expected to be in the range of $1.35 to $1.45 per pound for copper. The increase in total cash costs of approximately $0.30 per pound is primarily as a result of the increase in the price of sulfuric acid and the processing of lower ore grades at Zaldívar.
Net gold cash costs are expected to be in the range of $340 to $380 per ounce, assuming an average market copper price of $3.75 for 2011.
Exploration and Evaluation
Exploration and Evaluation (“E&E”) costs will be classified under both the “exploration and evaluation” line and the “loss from equity investees” line on our consolidated statements of income. The timing of the funding provided to equity investees for E&E expenditures and the recognition of the related income or expense as loss from equity investees in our consolidated statement of income may vary. The funding is initially recorded as an increase in the carrying amount of our investment. Our share of expenses is recognized when the expenditures are incurred by the equity investee.
We expect to expense approximately $330 to $350 million for our share of E&E expenditures in 2011, up from $234 million in 2010. Higher costs primarily reflect ongoing minesite reserve and resource development programs, principally at Cortez, Porgera, Lagunas Norte, Granny Smith and Goldstrike. E&E expenses also includes non-capitalizable project costs at Pueblo Viejo, Pascua-Lama and Cerro Casale and costs classified under income (loss) from equity investees.
Finance Costs
Finance costs primarily represent interest expense on long-term debt. We expect lower finance costs in 2011 primarily due to higher capitalized interest as a result of the continuation of construction at Pueblo Viejo and Pascua-Lama.
Capital Expenditures
Total capital expenditures for 2011 are expected to be in the range of $4.20 billion to $4.65 billion. The level of spend is particularly high in 2011 primarily due to the intensity of construction activity at both our Pueblo Viejo and Pascua-Lama projects, and significant open pit mine development activity, particularly at Goldstrike and Cortez. Based on our current portfolio of development projects, we expect total capital expenditures to decrease in 2012.
40
Barrick Financial Report 2010 | Management’s Discussion and Analysis
Minesite Sustaining
Sustaining capital expenditures are expected to slightly increase from 2010 expenditure levels of $863 million to about $900 to $1,000 million.
Open Pit and Underground Mine Development
Open pit and underground mine development capital includes capitalized waste stripping, underground mine development and exploration drilling expenditures that meet our criteria for capitalization. In 2011, expenditures primarily relate to mine development activities at Goldstrike, Cortez, North Mara, Veladero, Porgera and Granny Smith. Expenditures are expected to increase from 2010 levels primarily due to North America, where both Goldstrike and Cortez are scheduled to commence a period of high waste stripping as anticipated in their life of mine plans. The high levels of waste stripping activity at both mines are expected to be substantially complete by the end of 2011.
Minesite Expansion
The expected increase in expansion capital relates to various projects at Goldstrike, Bald Mountain, Golden Sunlight, Cortez and Turquoise Ridge in North America, Lagunas Norte in South America; and ABG’s North Mara mine. The increase also reflects capitalized exploration costs to advance the expansion projects at Turquoise Ridge and North Mara; as well various expansion projects at our Cortez property.
Capital Projects
The expected increase in our share of capital project capital expenditures from $1,691 million in 2010 to about $2,100 to $2,300 million in 2011 is mainly due to the continuing construction activity at Pueblo Viejo and increased levels of construction activity at Pascua-Lama. Guidance for 2011 also includes early stage capital expenditures at Cerro Casale.
| | 2010 | | 2011 | |
| | Actual IFRS | | Guidance IFRS | |
($ millions) | | basis (unaudited) | | basis | |
Pueblo Viejo (60% basis) | | $ | 592 | | $475 to $525 | |
Pascua-Lama | | 724 | | $1,110 to $1,200 | |
Cerro Casale (75% basis) and other | | 66 | | $175 to $225 | |
Capitalized interest | | 309 | | ~$350 | |
| | $ | 1,691 | | $2,100 to $2,300 | |
Income Taxes
Our underlying expected effective tax rate excludes the impact of currency translation gains/losses and changes in tax valuation allowances.
At the end of 2010, income taxes payable amounted to $535 million due to the significant increase in income generated in the year. Operating cash flow in 2011 will be reduced by the settlement of this liability in the second quarter as well as higher income tax installments based on the income levels for 2010.
Outlook Assumptions and Economic Sensitivity Analysis
| | 2011 Guidance | | Hypothetical | | Impact on | | Impact on EBITDA | |
| | Assumption | | Change | | Total Cash Costs | | (millions) | |
Gold revenue | | $ | 1,300/oz | | $ | 50/oz | | n/a | | $380–$400 | |
Copper revenue | | $ | 3.75/lb | | $ | 0.25/lb | | n/a | | $ | 75 | |
Gold total cash costs | | | | | | | | | |
Gold price effect on royalties and production taxes | | $ | 1,300/oz | | $ | 50/oz | | $ | 1.25/oz | | $ | 9 | |
WTI crude oil price(1) | | $ | 85/bbl | | $ | 10/bbl | | $ | 0.20/oz | | $ | 2 | |
Australian dollar exchange rate(1) | | 0.95 : 1 | | 10 | % | — | | — | |
Copper total cash costs | | | | | | | | | |
WTI crude oil price(1) | | $ | 85/bbl | | $ | 10/bbl | | $ | 0.01/lb | | $ | 3 | |
Chilean peso exchange rate(1) | | 500 : 1 | | 10 | % | $ | 0.01/lb | | $ | 5 | |
(1) Due to hedging activities we are largely protected against changes in these factors.
41
Management’s Discussion and Analysis
Business Overview
Our Business
Barrick’s vision is to be the world’s best gold mining company by finding, acquiring, developing and producing gold in a safe, profitable and socially responsible manner. Guided by our five core values – behave like an owner, act with a sense of urgency, be a team player, continually improve, and deliver results – we have become the world’s preeminent gold mining company.
Barrick’s market capitalization, annual gold production and gold reserves are also the largest in the industry. We also produce significant amounts of copper and have significant silver reserves contained within our gold reserves at our Pascua-Lama project. We sell our production in the world market through the following distribution channels: gold bullion is sold in the gold spot market; gold and copper concentrate is sold to independent smelting companies; and copper cathode is sold to various manufacturers and traders.
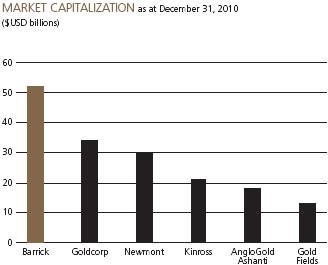

(1) Based on the most recent public information as at date noted.
Our large mineral inventory is well situated primarily in geopolitically secure countries. Approximately 65% of our reserves are located in investment grade(2) countries, including the United States, Chile, Australia, Peru and Canada, which provides a lower overall risk profile.

(2) Defined as being rated BBB- or higher by S&P.
42
Barrick Financial Report 2010 | Management’s Discussion and Analysis
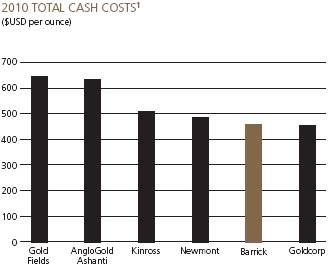
(1) Based on actual results for Barrick, Gold Fields and Kinross. All others are based on the most recent public guidance issued as at February 16, 2011.

(1) Based on actual results for Barrick, Gold Fields, Goldcorp and Kinross. All others are based on the most recent public guidance issued as at February 16, 2011.
We, along with our subsidiaries, have operating mines or projects in Canada, the United States, Dominican Republic, Australia, Papua New Guinea, Peru, Chile, Argentina, Pakistan and Tanzania. The geographic split of gold production for the year ended December 31, 2010 was as follows:
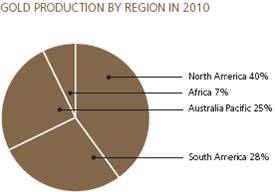
Our Strategy
Our core objective is to maximize long-term value for our shareholders by following a strategy that emphasizes return on capital, as well as earnings and cash flow growth, while providing full leverage of production and reserves/resources to market gold prices. To deliver on this objective, we focus on the following strategic priorities:
Financial Strength
· Optimize realized gold and copper prices;
· Contain and/or reduce production costs;
· Optimize return on capital expenditures;
· Maintain a strong financial position and good liquidity;
Gold Leverage
· Meet annual production targets;
· Grow reserve/resource base;
· Unhedged on all future gold production;
Growth
· Develop advanced projects on time and on budget;
· Identify and develop growth opportunities at operating mines;
· Selectively acquire future accretive growth opportunities;
Responsible Mining
· Improve safety and environmental performance; and
· Maintain our social license to operate.
Capability to Execute our Strategy
Our capability to execute our strategy comes from the strength of our experienced management team, skilled workforce and organizational structure, a strong pipeline of projects that facilitates the long-term sustainability of our business, our strong financial position, and our commitment to corporate social responsibility.
43
Management’s Discussion and Analysis
Experienced Management Team, Skilled Workforce and Organizational Structure
We have an experienced board of directors and senior management team with a proven track record at Barrick and within the mining industry. Strong leadership and governance are critical to the successful implementation of our core business strategies.
Our senior management is complemented by a skilled workforce that enhances the efficiency and effectiveness of our operations, particularly our ability to meet our annual production targets and contain costs. The remote nature of many of our mine sites presents some challenges in maintaining a well-trained and skilled workforce. We continue to focus on training and development for key members of our senior mine management, technical professionals and frontline workers through our talent management processes, enhanced distance learning programs and e-learning technologies in order to meet this challenge. We have also expanded our technical training and development programs beyond our technical mining disciplines (mining, metallurgy, maintenance and geology) to include our critical support functions. This program is now improving the technical and leadership skills of over 1,000 professionals. Leadership development for key leadership positions and high potential employees will be an area of focus in the coming year in order to support our continued growth plans by maintaining a robust leadership pipeline.
We manage our business using a Regional Business Unit (“RBU”) structure to ensure that each region is able to customize corporate strategies to meet the unique conditions in which they operate. We have three RBUs, each of which is led by its own Regional President: North America, South America and Australia Pacific. We also hold a 73.9% equity interest in ABG, which is listed on the London Stock Exchange (“LSE”) and comprises our African gold mining business. In addition, Barrick Energy manages our oil & gas business and provides support for energy savings initiatives undertaken by our RBUs. Since their inception, the RBUs have added value to our business by realizing operational efficiencies in the region, allocating resources more effectively and understanding and better managing the local business environment, including labor, consumable costs and supply and government and community relations.
Exploration and Development of New Mines
Barrick’s exploration strategy is aligned with our business objectives. It is a three-pronged, balanced approach that ensures we can meet both our short and long-term growth needs. The annual exploration program is focused on replacing and adding reserves and resources at our mines and projects. Our exploration group works closely with our corporate development group to identify acquisition opportunities with exploration upside. Finally, the exploration group looks for the next flagship deposit that will sustain Barrick for decades.
The exploration budget supports a strong pipeline of projects and is weighted towards near-term resource additions and conversion at our existing mines where we believe there is excellent potential to make new discoveries and to expand reserves and resources. The budget also provides support for earlier stage exploration in our operating districts and a smaller percentage of the budget is directed at emerging areas in order to generate quality projects for future years.
Total exploration expenditure in 2011 is budgeted to be about $320 – $340 million and includes expenditures that will meet the criteria for capitalization. These expenditures will support exploration activity across all regions, with the largest share in North America where 43% of the total budget is allocated. This split is largely consistent in comparison to previous years.
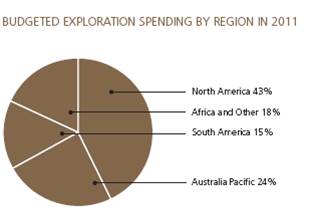
Barrick has been successful at consistently finding reserves and resources. We have extensive land positions on many of the world’s most prospective trends and, due in large part to our consistent funding and disciplined approach to exploration, we were successful at replacing reserves in 2010 and growing resources. Since 1990, we have spent approximately $2.2 billion on exploration, which has resulted in the
44
Barrick Financial Report 2010 | Management’s Discussion and Analysis
discovery of approximately 139 million ounces of reserves, substantially more than the 109 million ounces that we have produced in the same time period. The per ounce cost of reserve additions of approximately $16 has added substantial value to the Company.

Building new mines is key to our long-term goal of increasing profitability and creating long-term shareholder value. It can take a number of years for a project to move from the exploration stage through to mine construction and into production and this time frame has increased in recent years as considerable opposition to new mining projects can develop from influential NGOs or unstable political climates. The development of a new mine requires successful permitting and government relations, community dialogue and engagement, and significant financial and human capital. This significant increase in the timeline and cost of developing projects is reflected in our business strategy by ensuring that we have an inventory of projects combined with effective management of current operating mines.
The projects in our portfolio are at various stages of development, ranging from scoping to feasibility to construction. We have a dedicated Capital Projects group to focus on managing our large projects through this process, up to and including the commissioning of new mines, at which point responsibility for mine operations is handed over to the relevant RBUs. Over the past seven years, we have built seven new projects on time and near budget, namely Tulawaka, Lagunas Norte, Veladero, Cowal, Ruby Hill, Buzwagi and Cortez Hills. We expect that this experience will allow us to successfully commission the two projects currently in construction (Pueblo Viejo and Pascua-Lama), over the next three years. These projects are expected to contribute substantial low cost production and support a growing production profile for the Company over the next five years.
Financial Strength
The recent global economic crisis has underlined the importance of maintaining adequate levels of liquidity and a strong balance sheet. We actively manage our liquidity by focusing on maintaining and growing operating cash flows. Our cash flows are dependent on prices realized from gold and copper sales, our production levels, production costs, exploration spend, cash payments for income taxes, interest and other factors. Although weak global economic conditions have persisted, our strong operating performance, along with rising gold and copper prices, has enabled us to enhance our financial position. In 2010, we reduced net debt and increased dividends, while funding capital expenditure requirements for projects in construction and maintaining our financial flexibility to pursue future growth opportunities.
Corporate Responsibility
Operating in a socially responsible manner is critical in maintaining a license to operate in our industry. We are committed to making a positive difference in the communities in which we live and work. We recognize that responsible behavior is our calling card, creating opportunities to generate greater value for our shareholders, while at the same time fostering sustainable development in the communities and countries where we operate. In 2010, we were named to the Dow Jones Sustainability World Index (“DJSI”), ranking the Company as a top performer in corporate social responsibility worldwide for the third consecutive year. The renewed listing on the index reinforces Barrick’s position among the most sustainability-driven companies in the world.
Responsible environmental management is central to our success as the gold mining leader. To accomplish this goal across our 25 mines and four regions (including ABG) we have implemented an Environmental Management System which guides all of our sites. We have also developed, and are continuing to develop, specific performance standards. Our global Water Conservation Standard, completed in 2008, has been implemented as a company-wide priority.
45
Management’s Discussion and Analysis
In 2009, we drafted four additional Standards, including a Biodiversity Standard, a Climate Change Standard, a Mine Closure Standard and an Incident Reporting Standard, which were all implemented in 2010. In certain respects, these Standards exceed regulatory requirements and represent industry best practices.
Barrick was a leading participant in the development of the International Cyanide Management Code and, by the end of 2010, we had achieved Cyanide Code certification at 20 of the 23 operations where cyanide is used. Of the balance, two are pursuing certification, which they expect to achieve before 2012, and one will certify once an additional ore body is developed and processing resumes.
Barrick recognizes the risks that climate change represents to society and to our long-term success. Our Climate Change Standard focuses on energy efficiency and the use of renewable energy to reduce the Company’s carbon footprint. The program builds on energy efficiency programs and renewable energy projects already underway at our operations and embeds climate change considerations into business management processes and investment decision-making. All 25 Barrick mines have conducted energy self-assessments and are working toward greater energy efficiency and conservation. One such example is a small hydroelectric project in Chile’s Atacama Desert that was brought on line in 2009. This end-of-pipe power generator produces power from water pumped 90 km to the minesite from the Negrillar aquifer at the base of the Andes. Also, the underground mines in Nevada have successfully implemented bio-diesel use, which has the combined benefit of reducing GHG emissions and diesel particulate matter in engine exhaust.
We believe that the health and safety of our workers is fundamental to our business. Our vision is: “Every person going home safe and healthy every day”. We are committed to the identification and elimination or control of workplace hazards for the protection of ourselves and others. Our long-term goal is to be a zero incident company.
For us to succeed in fulfilling this goal, we:
· Provide the expertise and resources needed to maintain safe and healthy working environments;
· Established clearly defined safety and occupational health programs and measure safety and health performance, making improvements as warranted;
· Operate in accordance with recognized industry standards, while complying with applicable regulations;
· Investigate the causes of accidents and incidents and develop effective preventative and remedial action;
· Train employees to carry out their jobs safely and productively;
· Maintain a high degree of emergency preparedness; and
· Require that vendors and contractors comply with our applicable safety and health standards.
Enterprise Risk Management
As our Board recognizes that creating shareholder value is the reward for taking and accepting risk, our primary objective is to maximize long-term value for our shareholders. Our enterprise risk management vision is to implement a company-wide culture of risk management where risks are promptly identified, assessed, reported, and monitored at all levels of the organization through the use of simple and effective risk management processes. Actively managing risks improves our ability to effectively execute on our business strategy and thereby create shareholder value by finding, acquiring, developing and producing quality reserves in a safe, profitable and socially responsible manner. Consequently, we have established a process for identifying, evaluating and managing company-wide risks. All risks are reported through our RBU and corporate leaders. These risks are ranked and prioritized and effective and efficient action plans are developed as necessary. Analysis is also performed to ensure there is proper assessment of risks that may interfere with achieving the strategic objectives of the Company as a whole.
The following is a summary of what management has determined to be the most significant risk factors affecting Barrick. There may be additional risks, currently believed to be less significant, that either individually or collectively, may significantly affect our business and financial results in the future. For a more detailed description of risks facing the Company, please refer to the most recently filed Annual Information Form. A description of some of the risks currently viewed as significant follows:
Exposure to gold price
Barrick’s revenues are primarily derived from the sale of gold and the market price of gold can fluctuate widely due to macroeconomic factors that are beyond our control. Consequently, the market price of gold is one of the most significant factors in determining the profitability of our operations. All of our future gold production is unhedged, providing full leverage to changes in the market gold price.
46
Barrick Financial Report 2010 | Management’s Discussion and Analysis
To maximize our realized gold price, we have a corporate treasury function which monitors the gold market and is responsible for our gold sales.
License to operate
Maintaining our social license to operate is critical for Barrick to operate our existing mines and develop our projects around the world. Some of the risks to our social license include: compliance with environmental laws and regulations; community relations and human rights issues; and the health and safety of our employees. To manage these risks and maintain our social license, we have developed global environmental standards which, in many cases, exceed regulatory requirements and represent industry best practice. We have a globally coordinated community relations strategy that utilizes our corporate and local expertise to improve relations in the communities in which we operate. We have recently joined the Voluntary Principles on Security and Human Rights and are undertaking two new corporate social responsibility (“CSR”) initiatives to further strengthen our CSR performance. We will appoint an independent Director to its Board of Directors to support its commitment to CSR. The search is underway to fill this position in 2011. We will also establish an external CSR Advisory Board that will provide advice and guidance on challenging social and environmental issues and encourage further innovation and leadership in CSR. Additionally, we have an extensive Safety and Health program, committed to the protection of our employees and the residents of communities in proximity to our operations.
Project development
The development of our significant capital projects represents a key driver to our plans for future growth. The process to bring these projects into operation may be subject to unexpected delays that could increase the cost of development and the ultimate operating cost of the relevant project. Our Capital Projects group is responsible for completing relevant studies, obtaining the necessary approvals and managing construction. We utilize a formal system to govern advancement of projects as they progress from scoping through the execution and commissioning stages. This disciplined system of standards and procedures, which includes the involvement of multiple functional groups, enhances the study quality and consistency; and enables the development of mitigation plans where necessary, thereby improving the overall certainty of project delivery on schedule and on budget.
Global economic conditions
Barrick’s operating results and financial condition depend significantly on commodity prices and foreign exchange rates, which are largely dependent on worldwide economic conditions. Changes in general economic conditions could result in: adverse changes in key input commodity prices; adverse changes in foreign exchange rates, disruption in financial and credit markets; and negative impacts on our supply chain. To manage these risks, we actively hedge foreign exchange economic risks and key input commodities, including the fuel hedge provided by Barrick Energy. We continuously monitor the credit markets as part of our capital allocation function and will seek to minimize disruption to our liquidity or our supply chain to ensure the optimal operation of the Company.
Market Review
Gold
The market price of gold is the most significant factor in determining the earnings and cash flow-generating capacity of Barrick’s operations. The price of gold is subject to volatile price movements over short periods of time and is affected by numerous industry and macroeconomic factors that are beyond our control. Gold price volatility remained high in 2010, with the price ranging from $1,045 to $1,431 per ounce during the year. The average market price for the year of $1,225 per ounce was an all-time high. The financial crisis of 2008, the subsequent slow pace of the economic recovery and government stimulus measures adopted in response by the largest developed economies, including the United States, the Eurozone and Japan, has resulted in large fiscal deficits in these jurisdictions. These deficits have triggered concerns of sovereign debt defaults, particularly in the Eurozone. Further, the monetary policies put in place by the world’s most prominent central banks remain very accommodative in an attempt to increase the rate of economic growth and reduce unemployment levels, with short-term US interest rates at historic lows. Gold has historically played an important role as a constant measure of value. The continuing uncertain macroeconomic environment and loose monetary policies have resulted in gold performing its traditional role as a store of value and an alternative to fiat currency. Consequently, gold continues to be viewed as a safe haven investment, which has resulted in a strong increase in investment demand. Throughout 2010, we have continued to see increased interest in holding gold as an investment. This was evidenced by the increased volumes
47
Management’s Discussion and Analysis
held by Exchange Traded Funds (ETFs) and global exchanges, as well as the worldwide demand for physical gold in forms such as bars and coins as investors seek a safe haven against the uncertain global economic outlook. A continuation of these trends is supportive of high long-term gold prices.
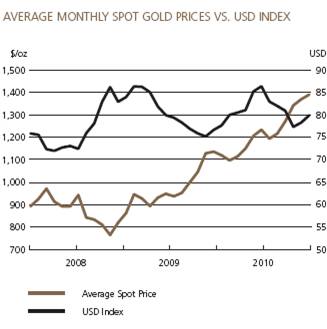

(1) Includes the holdings of GBS (ASX), GBS (LSE), NewGold (JSE), GLD (NYSE), IAU (Amex), ZKB (Swiss), ETFS (London), XETRA (DAX), Julius Baer (SWX), ETFS (NYSE), CS-XMTCH (SIX), UBS-IS (USD).
We believe that the outlook for global gold mine production will be one of declining supply in the years to come. While modest increases in production have occurred in recent years primarily as a result of the increase in gold prices, we continue to expect a decline over the long term. The primary drivers for the global decline are a trend of lower grade production by many producers; increasing time requirements and impediments in bringing projects – especially large-scale projects – to the production stage; a lack of global exploration success in recent years; and a scarcity of new, promising regions for gold exploration and production. A decrease in global industry production raises the potential for a higher sustainable long-term gold price.

Gold sales from the official sector under the Central Bank Gold Agreement (CBGA) also have a significant impact on gold prices. Sales for the year ended in September 2010 were less than 2% of the full-year quota of 400 tonnes, excluding sales from the International Monetary Fund (“IMF”). We are now in the second year of the current CBGA which runs to September 2014 and allows for the sale of up to 400 tonnes per year. In 2010, the IMF completed its previously announced sale of 403 tonnes of gold, with no future sales anticipated at this time. Net official sector sales have been declining in recent years and, in fact, central banks were net buyers of gold in 2010 for the first time since 1988.
48
Barrick Financial Report 2010 | Management’s Discussion and Analysis

The reserve gold holdings of emerging market countries, such as the BRIC countries (Brazil, Russia, India, and China) are significantly lower than the reserve holdings of more developed countries. The central banks of these developing economies hold a significant portion of their reserves in US dollars and as they identify a need to diversify their portfolio and reduce their exposure to the US dollar, we believe that gold will be one of the main beneficiaries. In conjunction with the below quota selling of gold under the CBGA, which is expected to continue in the current year of the agreement, the net purchases of gold by global central banks provide a strong indication that gold is viewed as a reserve asset and a de-facto currency.

Copper
Copper prices generally rose throughout 2010, particularly in the second half, as London Metals Exchange (LME) copper prices traded in a wide range of $2.74 to $4.42 per pound, averaging $3.42 per pound, and closing the year at an all-time high of $4.42 per pound. Copper’s rise to all-time highs occurred mainly as a result of strong demand from emerging markets, especially China, decreasing exchange stockpiles and increasing investor interest in base metals with strong forward-looking supply/demand fundamentals. Copper prices should continue to be positively influenced by demand from Asia, global economic growth, the limited availability of scrap metal and production levels of mines and smelters in the future.
Utilizing option collar strategies, we have put in place floor protection on approximately 60% of our expected copper production for 2011 at an average floor price of $3.00 per pound. In addition, we have sold net call options on approximately 70% of our 2011 production at an average price of approximately $4.85 per pound. Our realized price on all 2011 production is expected to be reduced by approximately $0.12 per pound in 2011 as a result of the net premium paid on option hedging strategies. Our remaining copper production is subject to market prices.
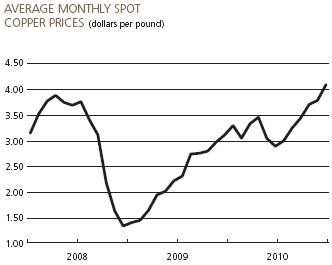
49
Management’s Discussion and Analysis
Silver
Silver traded in a wide range of $14.64 to $30.94 per ounce in 2010, averaged $20.19 per ounce and closed the year at $30.63 per ounce. Despite weak industrial demand, silver managed to rise during the year to a 30-year high due to very strong investment demand, which is driven by the similar factors influencing investment demand for gold. The ounces held by major global silver ETFs increased by 91 million ounces during the year, with holdings totaling 487 million ounces at the end of 2010. The physical silver market is currently in surplus and, while continuing global economic growth is expected to improve industrial demand, the primary influence of prices should continue to be investment demand in the near term.
Silver prices have a significant impact on the overall economics and expected gold total cash costs for our Pascua-Lama project, which is currently in the construction phase. Silver prices do not significantly impact our current operating earnings, cash flows or gold total cash costs.
In the fourth quarter, utilizing zero-cost option collar strategies, we took advantage of high spot silver prices and attractive option pricing by adding hedge protection on three million ounces per year of expected silver production from 2013 to 2017, inclusive, with a floor price of $20 per ounce and an average ceiling price of $55 per ounce.
In 2009, we entered into a transaction with Silver Wheaton Corp. (“Silver Wheaton”) whereby we sold 25% of the life-of-mine Pascua-Lama silver production from the later of January 1, 2014 or completion of project construction, and 100% of silver production from the Lagunas Norte, Pierina and Veladero mines until that time. Silver Wheaton will make up front payments totaling $625 million ($350 million received as at December 31, 2010). Silver Wheaton will also make ongoing payments of $3.90 per ounce in cash (subject to a 1% annual inflation adjustment starting three years after completing construction at Pascua-Lama) for each ounce of silver delivered under the agreement.
Currency Exchange Rates
The results of our mining operations outside of the United States are affected by US dollar exchange rates. The largest single exposure we have is to the Australian dollar/US dollar exchange rate. We also have exposure to the Canadian dollar through a combination of Canadian mine operating costs and corporate administration costs and increasing exposure to the Chilean peso as a result of the construction of our Pascua-Lama project. In addition, we have exposure to the Papua New Guinea kina, Peruvian sol, and Argentinean peso through mine operating and capital costs.
In 2010, the US dollar generally declined against our currency exposures, primarily as a result of the low interest rates offered on US dollars, concerns about the level of US government borrowing and deficits, and increasing investor appetite for riskier assets.
Fluctuations in the US dollar increase the volatility of our costs reported in US dollars, subject to protection that we have put in place through our currency hedging program. Canada and Australia have emerged from the global economic crisis better than most OECD countries. The Bank of Canada and the Reserve Bank of Australia raised benchmark interest rates by 75 basis points and 100 basis points, respectively, during the year, while the US Federal Reserve held rates constant. In 2010, the Canadian dollar traded in a range of $0.92 to $1.01 and closed at $1.00. The Australian dollar experienced higher volatility, trading in a range of $0.81 to $1.03 and closed at $1.02, with the strengthening occurring towards the end of the year due in part to higher commodity prices and economic growth in Asia-Pacific.
About 60% of our consolidated production costs are denominated in US dollars and are not exposed to fluctuations in US dollar exchange rates. For the remaining portion, our currency hedge position allows for more accurate forecasting of our anticipated expenditures in US dollar terms and mitigates our exposure to volatility in the US dollar. Our currency hedge position has provided benefits to us in the form of hedge gains recorded within our operating costs when contract exchange rates are compared to prevailing market exchange rates as follows: 2010 – $146 million; 2009 – $27 million; and 2008 – $106 million. For 2010, we also recorded currency hedge gains in our corporate administration costs of $33 million (2009 – $7 million loss and 2008 – $11 million gain).
For 2011, our average Australian and Canadian dollar hedge rates are favorable when compared to the year-end market rates for these currencies. The average hedge rates vary depending on when the contracts were put in place. We have hedged approximately AUD $1,638 million and CAD $353 million in 2011 for expected Australian and Canadian operating costs and sustainable and eligible
50
Barrick Financial Report 2010 | Management’s Discussion and Analysis
project capital expenditures at average rates of $0.79 and $1.02, respectively. Total expected Australian and Canadian operating and capital expenditures in 2011 are expected to be AUD $1,776 million and CAD $477 million, and as a result we are approximately 92% and 74% hedged, respectively. In addition, we have hedged approximately 84%, 72%, and 46% of our total expected 2012, 2013, and 2014 Australian dollar expenditures at average rates of $0.75, $0.72, and $0.75, respectively. Assuming market exchange rates at the December 31, 2010 levels of $1.02 for AUD and $1.00 for CAD, we expect to record gains on our operating expenditures of approximately $360 million in 2011 ($340 million for the Australian dollar; $10 million for the Canadian dollar; and $10 million for the Chilean peso), or about $45 – $47 per ounce based on total forecast 2011 production. We also expect to record gains on our capital expenditures of approximately $30 million in 2011. In addition, we have Chilean peso contracts in place to hedge a portion of our operating expenditures, primarily at Zaldívar, and our capital expenditures, primarily at the Pascua-Lama project. Further information on our currency hedge positions is included in note 20 to the consolidated financial statements.
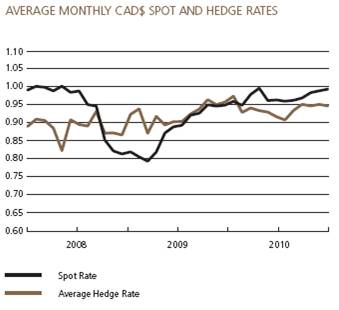
AUD Currency Contracts
| | | | Effective Average | | | |
| | Contracts | | Hedge | | % of Expected | |
| | (AUD millions) | | Rate (AUDUSD) | | AUD Exposure(1) | |
2011 | | 1,638 | | 0.79 | | 92 | % |
2012 | | 1,182 | | 0.75 | | 84 | % |
2013 | | 882 | | 0.72 | | 72 | % |
2014 | | 515 | | 0.75 | | 46 | % |
CAD Currency Contracts
| | | | Effective | | | |
| | Contracts(2) | | Average Hedge | | % of Expected | |
| | (CAD millions) | | Rate (USDCAD) | | CAD Exposure(1) | |
2011 | | 353 | | 1.02 | | 74 | % |
2012 | | 19 | | 1.02 | | 5 | % |
CLP Currency Contracts
| | | | Effective | | | |
| | Contracts | | Average Hedge | | % of Expected | |
| | (CLP millions)(3) | | Rate (USDCLP) | | CLP Exposure(4) | |
2011 | | 172,595 | | 507 | | 57 | % |
2012 | | 71,800 | | 513 | | 27 | % |
(1) Includes all forecasted operating, sustainable and eligible project capital expenditures.
(2) Includes $301 million CAD contracts with a cap and floor of $1.01 and $1.11, respectively.
(3) Includes CLP 146,100 million collar contracts that are an economic hedge of capital expenditures, primarily at our Pascua-Lama project with a cap and floor of 509 and 575, respectively.
(4) Includes all forecasted operating, sustainable and forecasted project capital expenditures.

51
Management’s Discussion and Analysis

Fuel
For 2010, oil prices traded between $63 and $92 per barrel, averaged $80 per barrel and closed the year at $91 per barrel as the global economy returned to growth.
On average we consume approximately 3.8 million barrels of diesel fuel annually across all our mines. Diesel fuel is refined from crude oil and is therefore subject to the same price volatility affecting crude oil prices. Volatility in crude prices has a significant direct and indirect impact on our production costs. To mitigate this volatility, we employ a strategy of combining the use of financial contracts and our production from Barrick Energy to effectively hedge our exposure to high oil prices. We currently have financial contracts in place totaling 4.7 million barrels, which represents 56% of our total estimated direct consumption in 2011 and 34% of our total estimated direct consumption over the following two years. Those contracts are primarily designated for our Nevada-based mines, and have average prices below current forward prices. In 2010, we recorded hedge losses in earnings of approximately $28 million on our fuel hedge positions (2009: $97 million loss; 2008: $33 million gain). Assuming market rates at the December 31, 2010 level of $91 per barrel, we expect to realize hedge gains of approximately $20 million in 2011 from our financial fuel contracts.
Financial Fuel Hedge Summary | | | | |
| | Barrels(1) | | | | % of Expected | |
| | (thousands) | | Average Price | | Exposure | |
2011 | | 2,394 | | $ | 94 | | 56 | % |
2012 | | 1,273 | | 83 | | 38 | % |
2013 | | 1,068 | | 78 | | 30 | % |
| | 4,735 | | $ | 88 | | 42 | % |
(1) Refers to contracts for a combination of WTI, ULSD, WTB, MOPS and JET. Products other than WTI have market prices in excess of WTI due to refining and location premiums. As a result, our average price on hedged barrels for 2011 – 2013 is $81 per barrel on a WTI-equivalent basis.
In 2011, we expect Barrick Energy to produce about 2.9 million boe. The net contribution from the Barrick Energy production is expected to provide a natural offset equivalent to about 1.0 million boe. The Barrick Energy contribution, along with our financial fuel hedges, provides hedge protection for approximately 92% of our estimated fuel consumption for 2011.

52
Barrick Financial Report 2010 | Management’s Discussion and Analysis
US Dollar Interest Rates
Beginning in 2008, in response to the contraction of global credit markets and in an effort to spur economic activity and avoid potential deflation, the US Federal Reserve reduced its benchmark rate to between 0% and 0.25% . The benchmark was kept at this level through 2010. We expect that short-term rates will remain at low levels through 2011 and into 2012, with the US Federal Reserve continuing to use monetary policy initiatives in an effort to keep long-term interest rates low and increase employment. We expect such initiatives to be followed by incremental increases to short-term rates once economic conditions and credit markets normalize.
At present, our interest rate exposure mainly relates to interest receipts on our cash balances ($4.0 billion at the end of the year); the mark-to-market value of derivative instruments; the fair value and ongoing payments under US dollar interest-rate swaps; and to the interest payments on our variable-rate debt ($1.0 billion at December 31, 2010). Currently, the amount of interest expense recorded in our consolidated statement of income is not materially impacted by changes in interest rates, because the majority of debt was issued at fixed interest rates. The relative amounts of variable-rate financial assets and liabilities may change in the future, depending on the amount of operating cash flow we generate, as well as the level of capital expenditures and our ability to borrow on favorable terms using fixed rate debt instruments.

The steep US yield curve has a significant impact on the net amount of interest expense since our debt issuances were set at predominantly 10-year and 30-year interest rates, while our cash and equivalents balances are generating interest income at much lower rates in the 1 to 90 day range.
If shorter term interest rates rise, this should result in us generating higher amounts of interest income on our cash balances, while our interest expense is largely at fixed rates and is therefore insensitive to increasing interest rates.
53
Management’s Discussion and Analysis
Financial and Operational Results
Summary of Financial Performance (1)
($ millions, except per share data in dollars) | | | | | | | | | | | |
For the years ended December 31 | | 2010 | | 2009 | | $ Change | | % Change | | 2008 | |
Sales | | $ | 11,211 | | $ | 8,404 | | $ | 2,807 | | 33 | % | $ | 7,913 | |
Net income/(loss) | | 3,274 | | (4,274 | ) | 7,548 | | — | | 785 | |
Per share(2) | | 3.32 | | (4.73 | ) | 8.05 | | — | | 0.90 | |
Adjusted net income(3) | | 3,279 | | 1,810 | | 1,469 | | 81 | % | 1,661 | |
Per share(2) | | 3.32 | | 2.00 | | 1.32 | | 66 | % | 1.90 | |
EBITDA(3) | | 5,900 | | (2,563 | ) | 8,463 | | — | | 2,273 | |
Adjusted EBITDA(3) | | 5,900 | | 3,370 | | 2,530 | | 75 | % | 2,273 | |
Operating cash flow | | 4,127 | | (2,322 | ) | 6,449 | | — | | 2,254 | |
Adjusted operating cash flow(3) | | 4,783 | | 2,899 | | 1,884 | | 65 | % | 2,254 | |
Free cash flow(3) | | $ | 1,460 | | $ | 541 | | $ | 919 | | 170 | % | $ | 478 | |
(1) | The amounts presented in this table include the results of discontinued operations. |
(2) | Calculated using weighted average number of shares outstanding under the basic method. |
(3) | Adjusted net income, EBITDA, adjusted EBITDA, adjusted operating cash flow and free cash flow are non-GAAP financial performance measure with no standardized meaning under US GAAP. For further information and a detailed reconciliation, please see pages 78–85 of this MD&A. |
In 2010, we recorded net income of $3,274 million compared to a net loss of $4,274 million in 2009, which included a $5,901 million charge related to the elimination of the gold sales contracts.
Adjusted net income was $3,279 million in 2010, compared to $1,810 million in 2009. The increases in net income and adjusted net income compared to 2009 were primarily driven by higher gold sales volumes and higher realized gold and copper prices. The increase in net income also reflects the $5,901 million charge related to the gold sales contracts recorded in 2009. The significant adjusting items in 2010 include: a $29 million gain related to the re-measurement of our 50% interest in Cerro Casale on closing the acquisition of an additional 25% interest in 2010; $32 million of unrealized non-hedge gains primarily relating to Chilean peso contracts; partially offset by $43 million in restructuring charges relating to costs for a long-term tire supply contract and severance arrangements and $34 million in unrealized foreign currency translation losses related to deferred income tax and working capital balances in our regional business units.

EBITDA was $5,900 million in 2010, compared to a loss of $2,563 million in 2009. The significant increase is primarily attributable to the $5,933 million pre-tax charge relating to the gold sales contracts recorded in 2009. Adjusted EBITDA was impacted by the same factors affecting net income and adjusted net income with the exception of income tax expense. Adjusted EBITDA, which excludes the impact of the gold sales contracts, was $5,900 million in 2010, a 75% increase compared to the total of $3,370 million in 2009.
54
Barrick Financial Report 2010 | Management’s Discussion and Analysis
Operating cash flow was an inflow of $4,127 million in 2010 compared to a cash outflow of $2,322 million in 2009. Operating cash flow reflects payments related to the settlement of gold sales contracts of $5,221 million in 2009 and $656 million in 2010. Adjusted operating cash flow, which excludes the impact of these payments, totaled $4,783 million in 2010 compared to $2,899 million in 2009. Adjusted operating cash flow in 2010 was positively affected by higher realized gold and copper prices and higher gold sales, partially offset by lower copper sales volumes.
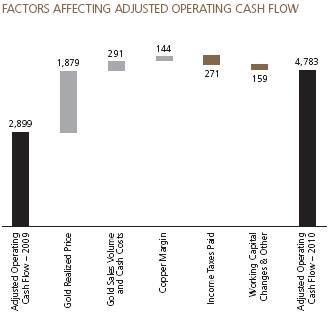
Summary of Operating Performance(1)
($ millions, except per ounce/pound data in dollars) | | Gold | | Copper | |
For the years ended December 31 | | 2010 | | 2009 | | 2008 | | 2010 | | 2009 | | 2008 | |
Production (000s oz/millions of lbs)(2) | | 7,765 | | 7,397 | | 7,657 | | 368 | | 393 | | 370 | |
Sales | | | | | | | | | | | | | |
000s oz/millions lbs | | 7,734 | | 7,279 | | 7,595 | | 391 | | 380 | | 367 | |
$ millions(3) | | $ | 9,742 | | $ | 7,191 | | $ | 6,656 | | $ | 1,346 | | $ | 1,155 | | $ | 1,228 | |
Market price(4) | | 1,225 | | 972 | | 872 | | 3.42 | | 2.34 | | 3.15 | |
Realized price(4),(5) | | 1,228 | | 985 | | 872 | | 3.41 | | 3.16 | | 3.39 | |
Cost of sales ($ millions) | | 3,799 | | 3,431 | | 3,426 | | 433 | | 444 | | 436 | |
Total cash costs(2),(4),(5) | | 457 | | 464 | | 443 | | $ | 1.11 | | $ | 1.17 | | $ | 1.19 | |
Net cash costs(2),(4),(5) | | $ | 341 | | $ | 360 | | $ | 337 | | | | | | | |
(1) | The amounts presented in this table include the results of discontinued operations. |
(2) | Reflects our equity share of production. |
(3) | Represents sales on a 100% consolidated basis. |
(4) | Per ounce/pound weighted average. |
(5) | Realized price, total cash costs and net cash costs are non-GAAP financial performance measures with no standard meaning under US GAAP. For further information and a detailed reconciliation, please see pages 78–85 of this MD&A. |
Sales
In 2010, sales totaled $11.2 billion, up 33% compared to the 2009 total of $8.4 billion, primarily due to higher realized gold and copper prices and higher gold and copper sales volumes. Realized gold prices of $1,228 per ounce in 2010 were up $243 per ounce compared to 2009, reflecting an increase in market gold prices, which averaged $1,225 per ounce in 2010, compared to $972 per ounce in 2009. Realized copper prices in 2010 were 8% higher than in 2009 as copper traded at record levels in 2010.
Cost of sales
Cost of sales applicable to gold was $3.8 billion in 2010, up 11%, compared to $3.4 billion in 2009. The increase reflects the impact of higher production and sales, partly offset by lower total cash costs. In 2010, cost of sales applicable to gold was outside our most recent guidance range of $3.5 billion to $3.6 billion due to higher gold sales volumes at our North American region in the fourth quarter.
55
Management’s Discussion and Analysis
Cost of sales applicable to copper was $433 million in 2010, down 2% compared to $444 million in 2009. The decrease reflects lower costs at Osborne in 2010, due to the divestiture at the end of third quarter 2010.
Total cash costs and net cash costs(3)
Gold total cash costs were $457 per ounce in 2010, down 2% compared to $464 per ounce in 2009. Higher royalties and production taxes, energy, consumables and maintenance costs were more than offset by higher mill grades, gold production and sales volumes which resulted in lower unit production costs. For the year, total cash costs per ounce were in line with the 2010 guidance range of $425 to $455 per ounce, and also in line with the most recent guidance of about $455 per ounce.
Copper total cash costs were $1.11 per pound in 2010, down 5% compared to $1.17 per pound in 2009. The decrease principally reflects lower direct operating costs at Zaldívar primarily due to lower sulfuric acid prices. In 2010, total cash costs per pound were within our most recent 2010 guidance range of $1.10 to $1.15 per pound.
Gold net cash costs were $341 per ounce in 2010, down 5% compared to $360 per ounce in 2009. The decrease reflects lower gold total cash costs per ounce and higher copper credits from Zaldívar and Osborne, mainly due to higher realized copper prices. In 2010, net cash costs per ounce were lower than our most recent guidance range of $350 to $360 per ounce, primarily due to higher realized copper prices.
Net cash margins
Net cash margins per ounce illustrate the trends in profitability and the impact of fluctuations in realized prices and net cash costs on our ability to generate earnings and operating cash flow.
Net cash margins per ounce increased 42% in 2010, largely due to the rise in gold prices in conjunction with the decrease in net cash costs.

Other operating expenses
Amortization expense was $1,149 million in 2010, up 13% compared to $1,016 million in 2009. The increase is primarily due to increased amortization charges in North America as Cortez Hills entered production in 2010 and in South America, where production and sales almost doubled at Veladero. Amortization expense per ounce was $127, up 4% compared to $122 in 2009.
Exploration expense was $180 million in 2010, up 28% compared to $141 million in 2009. The increase is primarily due to increased minesite and projects exploration. Project development expense was $153 million in 2010, up 80% compared to $85 million in 2009. The increase is primarily due to $63 million spent to update the feasibility study for Cerro Casale.
Other expense was $463 million in 2010, up 35% compared to $343 million in 2009. The increase is primarily due to $46 million in charges related to restructuring a long-term tire supply contract, $22 million in finance charges related to the remaining floating gold sales contracts, and $21 million in incremental community relations costs, partially offset by $25 million in reduced severance costs.
(3) Total cash costs and net cash costs are non-GAAP financial performance measures with no standardized meaning under US GAAP. For further information and a detailed reconciliation, please see page 81 of this MD&A.
56
Barrick Financial Report 2010 | Management’s Discussion and Analysis
Interest expense
(in $ millions)
For the years ended December 31 | | 2010 | | 2009 | |
Interest costs | | | | | |
Incurred | | 410 | | 326 | |
Capitalized | | (289 | ) | (269 | ) |
Interest expensed | | 121 | | 57 | |
Interest expense was $121 million in 2010, up 112% compared to $57 million in 2009. The increase is primarily due to additional debt issued in Q4 2009 and imputed interest on deposits received for the silver sale agreement with Silver Wheaton.
Impairment Charges
Impairment charges were $7 million, compared to $277 million in 2009. The amount for 2009 included write-downs for Plutonic ($106 million) and Sedibelo ($158 million).
Income Tax
(Percentages)
For the years ended December 31 | | 2010 | | 2009 | | 2008 | |
Effective tax rate on ordinary income | | 30 | % | 29 | % | 30 | % |
Elimination of gold sales contracts | | — | | (48 | )% | — | |
Non-taxable goodwill impairment charges | | — | | 2 | % | 10 | % |
Net currency translation (gains)/losses on deferred tax balances | | — | | (1 | )% | 5 | % |
Canadian functional currency election | | — | | (2 | )% | — | |
Impact of legislative amendment in Australia | | (2 | )% | — | | — | |
Dividend withholding tax | | 2 | % | — | | — | |
Canadian tax rate changes | | — | | 2 | % | — | |
Release of deferred tax valuation allowances | | — | | — | | (7 | )% |
Actual effective tax rate | | 30 | % | (18 | )% | 38 | % |
Our effective tax rate on ordinary income increased from 29% to 30% in 2010 primarily due to the impact of changes in the mix of production and on the mix of taxable income in the various tax jurisdictions where we operate. The more significant items impacting income tax expense in 2010 and 2009 include the following:
Currency Translation
Deferred tax balances are subject to remeasurement for changes in currency exchange rates each period. The most significant balances are Canadian deferred tax liabilities with a carrying amount of approximately $25 million, Argentinean deferred tax liabilities with a carrying amount of approximately $106 million, and Australian and Papua New Guinea deferred tax liabilities with a carrying amount of approximately $144 million. In 2010 and 2009, the appreciation of the Canadian and Australian dollar against the US dollar, and the weakening of the Argentine peso against the US dollar resulted in net translation gains totaling $2 million and $40 million, respectively. These gains are included within deferred tax expense/recovery.
Impact of Legislative Amendments in Australia
In Australia, we elected to enter into the consolidated tax regime in 2004 (in 2002 for the former Placer Dome Inc. subsidiaries). At the time the elections were made, there were certain accrued gains that were required to be included in taxable income upon subsequent realization. In second quarter 2010, clarifying legislative amendments to the Australian consolidation tax rules were enacted. These amendments enabled us to reduce the inclusion of certain of these accrued gains, resulting in a permanent decrease in taxable income. The impact of the amendment is a current tax recovery of $78 million recorded in second quarter 2010.
Dividend Withholding Tax
In fourth quarter 2010, we recorded a $74 million dollar dividend withholding current tax expense in respect of funds available to be repatriated from a foreign subsidiary.
Canadian Functional Currency Election
In fourth quarter 2008, we filed an election under Canadian draft legislation to prepare some of our Canadian tax returns using US dollar functional currency effective January 1, 2008. The legislation was enacted in first quarter 2009 which resulted in a one-time benefit of $70 million.
Canadian Tax Rate Changes
In fourth quarter 2009, a provincial rate change was enacted in Canada that lowered the applicable tax rate. The impact of this tax rate change was to reduce net deferred tax assets in Canada by $59 million, recorded as a component of deferred tax expense.
Chilean Income Tax
Following the earthquake in Chile in first quarter 2010, the government presented a package of certain tax increases to Congress for approval. With respect to corporate income taxes, a temporary first tier income tax increase from 17% to 20% in 2011, and 18.5% in 2012 was presented to and approved by Congress. The income tax changes were enacted in third quarter 2010, but do not result in any changes to income tax expense for the current year. We anticipate that the corporate income tax changes will result in an increase to income tax expense in 2011 of about $20 million.
57
Management’s Discussion and Analysis
Chilean Royalty
In October 2010, the Chilean government enacted legislation for a specific mining tax (“royalty”). Under this royalty, for new projects, the royalty rates would change from 5% of operating margin after depreciation to a range of 5%—14% based on the level of operating margin. For those companies currently operating under a stabilized regime (at 4% until 2017), the law contemplates an option to voluntarily, (i) apply a rate of 4%—9% for 2010—2012, then (ii) return the current stabilized rate of 0% or 4% until the current stability period ends, and (iii) obtain an extension of the stability period at rates in the range of 5%—14% for an additional 6 years. In January 2011, Barrick adopted the new royalty. The impact of adoption was a $26 million increase in 2010 income tax expense and an expected increase of about $15 million in 2011 income tax expense.
Mining Overview(1)
For the years ended December 31 | | 2010 | | 2009 | | % Change | | 2008 | |
Gold | | | | | | | | | |
Ore tons mined (millions) | | 155 | | 174 | | (11 | )% | 182 | |
Waste tons mined (millions) | | 539 | | 555 | | (3 | )% | 498 | |
Total tons mined (millions) | | 694 | | 729 | | (5 | )% | 680 | |
Ore tons processed (millions) | | 145 | | 171 | | (15 | )% | 191 | |
Average grade (ozs/ton) | | 0.063 | | 0.052 | | 23 | % | 0.047 | |
Recovery rate | | 85.0 | % | 83.2 | % | 2 | % | 84.4 | % |
Gold produced (000s/oz) | | 7,765 | | 7,397 | | 5 | % | 7,657 | |
Copper | | | | | | | | | |
Ore tons mined (millions) | | 48 | | 50 | | (4 | )% | 45 | |
Waste tons mined (millions) | | 24 | | 30 | | (20 | )% | 38 | |
Total tons mined (millions) | | 72 | | 80 | | (10 | )% | 83 | |
Ore tons processed (millions) | | 46 | | 49 | | (6 | )% | 44 | |
Average grade (percent) | | 0.6 | | 0.6 | | — | | 0.6 | |
Copper produced (millions of lbs) | | 368 | | 393 | | (6 | )% | 370 | |
(1) The amounts presented in this table include the results of discontinued operations.
Production
Gold production in 2010 was 0.4 million ounces or 5% higher than in 2009, reflecting higher production in South America and North America, partially offset by lower production in Africa. Production of 7.8 million ounces was within our most recent guidance range of 7.6 to 7.8 million ounces. Copper production in 2010 was 6% lower than in 2009 due to lower production from Osborne as mining ceased in the third quarter, partially offset by higher production at Zaldívar. Production of 368 million pounds was slightly higher than our most recent guidance of approximately 360 million pounds.
Tons Mined and Tons Processed — Gold
Total tons mined decreased in 2010 by 5% and tons processed decreased by 15% when compared to 2009. The decreases were primarily due to decreased mining activity at Goldstrike, Ruby Hill, Veladero, Kalgoorlie and Buzwagi, partially offset by increased mining activity at Bald Mountain and Pierina. The decrease in ore tons processed was primarily due to fewer ore tons processed at Cortez and Bald Mountain. At Cortez, higher grade ore from both the underground and the open pit was processed in 2010, whereas in 2009, the ore was of lower grade and contained significant amounts of heap leach material. At Bald Mountain, mine sequencing resulted in less leach material being mined and more mine development waste stripping activities being undertaken. The decreased tons processed did not have any impact on overall production due to the increase in average head grades.
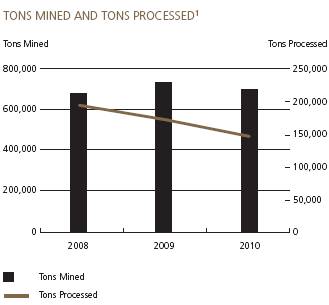
(1) All amounts presented are based on equity production.
Average Mill Head Grades — Gold
Average mill head grades increased by approximately 23% in 2010 compared to 2009, primarily due to mine sequencing that resulted in higher ore grades from Cortez, Cowal and Veladero, partially offset by lower grades processed at Tulawaka and at Buzwagi, where suspension of a number of employees led to a period of processing lower grade stockpiles while replacement personnel were being hired. In general, reserve grades have been trending downwards in recent years, partly as a result of rising gold prices which make it economic to process lower grade material.
58
Barrick Financial Report 2010 | Management’s Discussion and Analysis
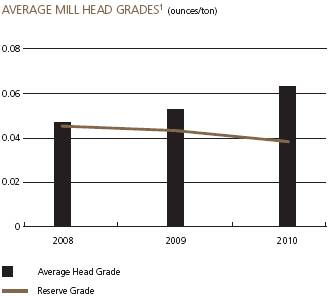
(1) All amounts presented based on equity production. Average mill head grades are expressed as the number of ounces of gold contained in a ton of ore processed. Reserve grade represents expected grade over the life of the mine and is calculated based on reserves reported at the end of the immediately preceding year.
Mineral Reserves and Mineral Resources Update(4)
At year-end 2010, we added 9 million ounces of proven and probable reserves. After depletion of 9 million ounces, proven and probable gold reserves remained unchanged at 139.8 million ounces, still the largest in the industry, based on an assumed $1,000 (5) per ounce gold price. The increase primarily reflects incremental reserves due to the acquisition of an additional 25% interest in Cerro Casale and reserve additions at Goldstrike, Cortez, Veladero and Ruby Hill, partially offset by a decrease as a result of disposition of our 26.1% interest in ABG.
Measured and indicated gold mineral resources increased by 24% to 76.3 million ounces and inferred gold mineral resources increased 18% to 37.2 million ounces based on a $1,200 per ounce gold price.
Copper reserves increased 7% to 6.5 billion pounds and measured and indicated resources increased 1% to 13.0 billion pounds, based on an assumed $2.00 per pound copper price. Contained silver within reported gold reserves is over one billion ounces.
Replacing gold and copper reserves depleted by production year over year is necessary in order to maintain production levels over the long term. If depletion of reserves exceeds discoveries over the long term, then we may not be able to sustain gold and copper production levels. Reserves can be replaced by expanding known ore bodies, acquiring mines or properties or discovering new deposits. Once a site with gold or copper mineralization is discovered, it takes many years from the initial phases of drilling until production is possible, during which time the economic feasibility of production may change. Substantial expenditures are required to establish proven and probable reserves and to permit and construct mining and processing facilities.
Review of Operating Segments Performance
We report our results of operations using a geographical business unit approach, with producing mines concentrated in three regional business units: North America, South America and Australia Pacific. We also hold a 73.9% equity interest in ABG, which includes our previously held African gold mines and exploration properties. In addition, we have a Capital Projects segment, distinct from our regional business units, to focus on managing projects. This structure reflects how we manage our business and how we classify our operations for business planning and measuring performance.
In 2010, we revised the format of information provided to the Chief Operating Decision Maker to better reflect management’s view of the operations. The primary change involves the presentation of minesite exploration and project development, RBU costs and other expenses (income) as a component of Segment Income. Previously, these expenditures were monitored separately. Accordingly, we have revised our operating segment review to be consistent with those reporting changes, with restatement of comparative information to conform to the current period presentation.
North America
Summary of Financial and Operating Data
For the years ended December 31 | | 2010 | | 2009 | | % Change | | 2008 | |
Total tons mined (millions) | | 396 | | 397 | | — | | 360 | |
Ore tons processed (millions) | | 44 | | 64 | | (31 | )% | 92 | |
Average grade (ozs/ton) | | 0.084 | | 0.053 | | 58 | % | 0.041 | |
Gold produced (000s/oz) | | 3,110 | | 2,810 | | 11 | % | 3,028 | |
Cost of sales ($ millions) | | $ | 1,511 | | $ | 1,421 | | 6 | % | $ | 1,517 | |
Total cash costs (per oz) | | $ | 489 | | $ | 504 | | (3 | )% | $ | 493 | |
Segment income ($ millions)(1) | | $ | 1,670 | | $ | 897 | | 86 | % | $ | 618 | |
Amortization ($ millions) | | $ | 444 | | $ | 362 | | 23 | % | $ | 354 | |
Segment EBITDA ($ millions)(2) | | $ | 2,114 | | $ | 1,259 | | 68 | % | $ | 972 | |
Capital expenditures ($ millions) | | $ | 489 | | $ | 207 | | 136 | % | $ | 161 | |
(1) Segment income excludes income taxes.
(2) EBITDA is a non-GAAP financial performance measure with no standardized meaning under US GAAP. For further information and a detailed reconciliation, please see page 82 of this MD&A.
(4) For a breakdown of reserves and resources by category and additional information relating to reserves and resources, see pages 163 170 of this Financial Report.
(5) Reserves at Round Mountain have been calculated using an assumed price of $900 per ounce.
59
Management’s Discussion and Analysis
Segment EBITDA and segment income for 2010 were $2,114 million and $1,670 million, an increase of 68% and 86%, respectively, over 2009. The increases were primarily the result of higher realized gold prices and higher sales volume at lower total cash costs. Segment income was also impacted by higher amortization expense as a result of the Cortez Hills open pit entering production in early 2010.
Gold production for 2010 was 11% higher than 2009, and in line with the top end of our original regional guidance range of 2.95 to 3.10 million ounces. Higher production at Cortez was partially offset by lower production at Goldstrike, Hemlo, Ruby Hill and Golden Sunlight.
Production at Cortez increased by 120% over 2009, mainly as a result of the commencement of production at the Cortez Hills open pit operations in the first quarter of 2010. At Goldstrike, production for the year was down by 13% compared to 2009, primarily as a result of the planned partial shutdown of the autoclave facility which occurred during the second half of 2009 due to a decrease in ore suitable for acidic autoclaving, as well as mine sequencing that resulted in lower grade areas being mined in the first half of 2010. Hemlo’s production for the year decreased by 12% over the prior year due to the processing of lower grade ore. Ruby Hill’s production for the year decreased by 21% over the prior year due to increased waste stripping, which resulted in a decrease in ore tons available to process. Golden Sunlight was not in production in 2010 as it entered an extended redevelopment phase during 2009, but is expected to start production of gold again during the first quarter of 2011.
Cost of sales for 2010 increased by 6% over 2009, primarily as a result of higher royalties and production taxes, labor, consumables and energy costs. Over the same period, total cash costs per ounce were down 3% to $489, and were within our most recent regional guidance range of $480 to $500 per ounce. The increase in cost of sales was more than offset by higher production and sales volumes, particularly from the lower cost Cortez Hills operations, resulting in decreased total cash costs per ounce.
In 2011, we expect gold production to be in the range of 3.30 to 3.46 million ounces. Production is expected to be higher than 2010 primarily due to an increase in tons processed and higher average head grades from the Cortez Hills open pit mine and the recommencement of production at Golden Sunlight after a two-year period of mine development. This is expected to be partly offset by lower production at Goldstrike due to a significant waste stripping campaign and the processing of lower grade stockpile ore. Total gold cash costs are expected to be $425 to $450 per ounce and similar to the 2010 level of $429 per ounce on an IFRS basis.
Beyond 2010, we have identified various opportunities to add production within North America, including the potential of expanding our current Turquoise Ridge underground operation into a large scale open pit to mine low-grade mineralization; the Bald Mountain North Area expansion; and the use of thiosulphate technology at Goldstrike to extend the life of the autoclaves. We continue to progress evaluation of these opportunities to create value at our existing operations.
South America
Summary of Financial and Operating Data
For the years ended December 31 | | 2010 | | 2009 | | % Change | | 2008 | |
Gold | | | | | | | | | |
Total tons mined (millions) | | 145 | | 158 | | (8 | )% | 151 | |
Ore tons processed (millions) | | 67 | | 70 | | (4 | )% | 65 | |
Average grade (ozs/ton) | | 0.039 | | 0.036 | | 8 | % | 0.037 | |
Gold produced (000s/oz) | | 2,120 | | 1,889 | | 12 | % | 2,111 | |
Cost of sales ($ millions) | | $ | 515 | | $ | 499 | | 3 | % | $ | 531 | |
Total cash costs (per oz) | | $ | 243 | | $ | 265 | | (8 | )% | $ | 251 | |
Segment income ($ millions)(1) | | $ | 1,749 | | $ | 1,111 | | 57 | % | $ | 1,031 | |
Amortization ($ millions) | | $ | 165 | | $ | 134 | | 23 | % | $ | 163 | |
Segment EBITDA ($ millions)(2) | | $ | 1,914 | | $ | 1,245 | | 54 | % | $ | 1,194 | |
Capital expenditures ($ millions) | | $ | 199 | | $ | 171 | | 16 | % | $ | 92 | |
Copper | | | | | | | | | |
Copper produced (millions of lbs) | | 318 | | 302 | | 5 | % | 295 | |
Cost of sales ($ millions) | | $ | 345 | | $ | 361 | | (4 | )% | $ | 315 | |
Total cash costs (per lb) | | $ | 1.09 | | $ | 1.17 | | (7 | )% | $ | 1.08 | |
Segment income ($ millions)(1) | | $ | 648 | | $ | 488 | | 33 | % | $ | 607 | |
Amortization ($ millions) | | $ | 84 | | $ | 76 | | 11 | % | $ | 66 | |
Segment EBITDA ($ millions)(2) | | $ | 732 | | $ | 564 | | 30 | % | $ | 673 | |
Capital expenditures ($ millions) | | $ | 55 | | $ | 33 | | 67 | % | $ | 62 | |
(1) Segment income excludes income taxes.
(2) EBITDA is a non-GAAP financial performance measure with no standardized meaning under US GAAP. For further information and a detailed reconciliation, please see page 82 of this MD&A.
Segment EBITDA and segment income for the gold segment for 2010 were $1,914 million and $1,749 million, an increase of 54% and 57%, respectively, over 2009. These increases were primarily as a result of higher realized gold prices and sales volumes at lower total cash costs.
Gold production for 2010 was 12% higher than 2009, and was within our regional guidance range of 2.11 to 2.25 million ounces. Production increased at Veladero, due to higher grade ore mined at both the Amable and Federico pits, as well as an increase in tons processed as a result of the
60
Barrick Financial Report 2010 | Management’s Discussion and Analysis
start-up of the crusher circuit expansion in the second half of 2009 and the overland conveyor in the first half of 2010. The increase at Veladero was partly offset by lower production at Pierina and Lagunas Norte. Production at Lagunas Norte decreased in the second half of 2010, as expected, due to a change in the mine plan, which resulted in the mining of lower grade ore in the second half of 2010.
As a result of rising gold prices, Pierina’s mine life has been extended to the end of 2014. Previously, Pierina was expected to stop producing in mid-2013.
In 2010, cost of sales attributable to the gold segment increased by 3% over 2009, primarily due to higher production and sales taxes and higher energy and maintenance costs. Total cash costs of $243 per ounce were within our most recent regional guidance range of $240 to $260 per ounce. The increase in cost of sales was more than offset by significantly higher production and sales volumes at Veladero due to the increase in average head grade and in tons processed and resulted in an 8% decrease from the prior year cash cost per ounce.
In 2011, we expect gold production to be in the range of 1.8 to 1.935 million ounces. Production is expected to be lower than 2010 primarily due to Veladero and, to a lesser extent, Lagunas Norte and Pierina. Mining activity at Veladero is expected to shift away from the higher grade areas of the Filo Federico pit to lower grade areas as anticipated in the life-of-mine plan. At Lagunas Norte, higher ore grades are expected to be more than offset by lower recoveries due to leaching of more carbonaceous materials as well as longer leach cycles compared to 2010. Total gold cash costs are expected to be $350 to $380 per ounce compared to $208 per ounce in 2010 on an IFRS basis. Total cash costs per ounce are expected to be higher in 2011 due to lower grades and inflation in Argentina.
Segment EBITDA and segment income for the copper segment for 2010 were $732 million and $648 million, an increase of 30% and 33%, respectively, over 2009. The increases were primarily as a result of higher realized copper prices, and sales volumes at lower total cash costs.
Copper production in 2010 was 5% higher than 2009, and was within our original guidance range of 305 to 325 million pounds, mainly due to increased tons processed and higher grades as a result of mining higher grade areas of the open pit and improved recoveries from the leach pad.
Total cash costs per pound decreased by 7%, compared to 2009 due to lower cost of sales and higher production and sales volumes. Total cash costs were within our original guidance range of $1.05 to $1.20 per pound.
We expect 2011 copper production to be around 300 million pounds and cash costs per pound to be in the range of $1.35 to $1.45 per pound. We expect cash costs to increase in 2011 due to the increase in the price of sulfuric acid and lower grades at Zaldívar.
Beyond 2010, we have identified various opportunities to add production within South America, including extending mining at Lagunas Norte as a result of incremental mineralization, which would improve output in future years and also extend the mine life by approximately 6 years. We have also identified the potential of mining primary sulfide mineralization at Zaldívar, which is situated below the current reserves and could extend the mine life by as much as 16 years. We continue to progress our evaluation of these opportunities to create value at our existing operations.
Australia Pacific
Summary of Financial and Operating Data(1)
For the years ended December 31 | | 2010 | | 2009 | | % Change | | 2008 | |
Gold | | | | | | | | | |
Total tons mined (millions) | | 118 | | 133 | | (11 | )% | 147 | |
Ore tons processed (millions) | | 27 | | 30 | | (10 | )% | 29 | |
Average grade (ozs/ton) | | 0.082 | | 0.075 | | 9 | % | 0.077 | |
Gold produced (000s/oz) | | 1,939 | | 1,950 | | (1 | )% | 1,942 | |
Cost of sales ($ millions) | | $ | 1,286 | | $ | 1,134 | | 13 | % | $ | 1,051 | |
Total cash costs (per oz) | | $ | 613 | | $ | 581 | | 6 | % | $ | 550 | |
Segment income ($ millions)(2) | | $ | 776 | | $ | 315 | | 146 | % | $ | 267 | |
Amortization ($ millions) | | $ | 251 | | $ | 282 | | (11 | )% | $ | 240 | |
Segment EBITDA ($ millions)(3) | | $ | 1,027 | | $ | 597 | | 72 | % | $ | 507 | |
Capital expenditures ($ millions) | | $ | 289 | | $ | 239 | | 21 | % | $ | 191 | |
Copper | | | | | | | | | |
Copper produced (millions of lbs) | | 50 | | 91 | | (45 | )% | 75 | |
Cost of sales ($ millions) | | $ | 88 | | $ | 83 | | 6 | % | $ | 121 | |
Total cash costs (per lb) | | $ | 1.18 | | $ | 1.15 | | 3 | % | $ | 1.64 | |
Segment income (loss) ($ millions)(2) | | $ | 104 | | $ | 82 | | 27 | % | $ | (35 | ) |
Amortization ($ millions) | | $ | — | | $ | — | | $ | — | | $ | — | |
Segment EBITDA ($ millions)(3) | | $ | 104 | | $ | 82 | | 27 | % | $ | (35 | ) |
Capital expenditures ($ millions) | | $ | — | | $ | 6 | | — | | $ | 24 | |
| | | | | | | | | | | | | |
(1) The amounts presented in this table include the results of discontinued operations.
(2) Segment income includes income taxes related to Osborne only.
(3) EBITDA is a non-GAAP financial performance measure with no standardized meaning under US GAAP. For further information and a detailed reconciliation, please see page 82 of this MD&A.
Segment EBITDA and segment income for the gold segment for 2010 were $1,027 million and $776 million, an increase of 72% and 146%, respectively, over 2009. The increases were primarily as a result of higher realized gold prices.
61
Management’s Discussion and Analysis
Gold production for 2010 was slightly lower than 2009, and was within our regional guidance range of 1.85 to 2.0 million ounces. Higher production at Cowal and Kalgoorlie was offset by lower production at Kanowna, Porgera and Yilgarn. The divestiture of Henty in the second quarter of 2009 and cessation of mining at Osborne in July 2010 also contributed to the slightly lower year over year production.
Production at Cowal increased by 28% over 2009 due to the mining of higher grade ore. At Kalgoorlie, production increased 14% over 2009, due to mining in higher grade areas of the pit and higher mill throughput. Production at Kanowna decreased by 12% from 2009 as a result of lower underground tons mined as mining at Bullant was completed at the end of 2009, and as fewer open pit tons were mined in 2010. Production at Porgera decreased 6% from 2009 due to a water shortage from lack of adequate rainfall which impacted mill throughput and wall stability issues which restricted mining in higher grade zones. At Yilgarn, production decreased 11% due to lower ore grades processed and lower throughput due to a decrease in ore tons mined.
In 2010, cost of sales attributable to gold has increased by 13% over 2009, reflecting higher royalties and production taxes as gold prices traded at higher levels than in 2009, an increase in our effective Australian dollar currency hedge rates and higher labor and maintenance costs. Cost of sales also includes $104 million related to ore purchases processed at Granny Smith, compared to $29 million in 2009. These increases were partially offset by lower costs as a result of the disposal of the Henty mine in the first half of 2009. Total cash costs per ounce were up 6% to $613 over 2009, due to the same factors that affected cost of sales with the exception of the costs related to the ore purchases at Granny Smith, which are excluded from our calculation of total cash cost per ounce as the cost of producing these ounces is not indicative of our normal production costs. Total cash costs were within our most recent 2010 regional guidance range of $610 to $625 per ounce.
In 2011, we expect gold production to be in the range of 1.85 to 2.0 million ounces, which is consistent with 2010. Higher production is expected at Porgera due to the aforementioned pit wall stability issues and lack of adequate rainfalls that negatively impacted the process plant in 2010. Kalgoorlie and Cowal production is expected to decrease due to mining lower grade areas. Total gold cash costs are expected to be $610 to $635 per ounce compared to $576 per ounce in 2010 on an IFRS basis. Total cash costs per ounce are expected to be higher primarily due to labor inflation.
Both segment EBITDA and segment income for the copper segment for the year were $104 million, an increase of 27% over the prior year as a result of higher copper sales volume, due to the continued clearing of copper concentrate stockpiles, as well as shipping delays that moved the timing of 2009 production into 2010 sales.
Copper production for 2010 was down 45% compared to 2009 largely due to the cessation of operations in July 2010.
In 2010, cost of sales attributable to copper increased by 6% compared to 2009 as a result of higher sales volume, while total cash costs per pound were up 3%.
Beyond 2010, we have identified various opportunities to add gold production within Australia Pacific, including a potential expansion at Cowal that could extend the mine life by about 4 years and an expansion at Granny Smith. We continue to progress our evaluation of these opportunities to create value at our existing operations.
African Barrick Gold(1)
Summary Financial and Operating Data
For the years ended December 31 | | 2010 | | 2009 | | % Change | | 2008 | |
100% basis | | | | | | | | | |
Total tons mined (millions) | | 44 | | 41 | | 7 | % | 22 | |
Ore tons processed (millions) | | 8 | | 7 | | 14 | % | 4 | |
Average grade (ozs/ton) | | 0.094 | | 0.114 | | (18 | )% | 0.154 | |
Gold produced (000s/oz) | | 701 | | 716 | | (2 | )% | 545 | |
Cost of sales ($ millions) | | $ | 487 | | $ | 377 | | 29 | % | $ | 327 | |
Total cash costs (per oz) | | $ | 646 | | $ | 545 | | 19 | % | $ | 560 | |
Segment income ($ millions)(3) | | $ | 226 | | $ | 143 | | 58 | % | $ | 94 | |
Amortization ($ millions) | | $ | 119 | | $ | 93 | | 28 | % | $ | 63 | |
Segment EBITDA ($ millions)(4) | | $ | 345 | | $ | 236 | | 46 | % | $ | 157 | |
Capital expenditures ($ millions) | | $ | 131 | | $ | 134 | | (2 | )% | $ | 172 | |
73.9% equity basis(2) | | | | | | | | | |
Total tons mined (millions) | | 35 | | 41 | | (15 | )% | 22 | |
Ore tons processed (millions) | | 7 | | 7 | | — | | 4 | |
Average grade (ozs/ton) | | 0.094 | | 0.114 | | (18 | )% | 0.154 | |
Gold produced (000s/oz) | | 564 | | 716 | | (21 | )% | 545 | |
Cost of sales ($ millions) | | $ | 390 | | $ | 377 | | 3 | % | $ | 327 | |
Total cash costs (per oz) | | $ | 646 | | $ | 545 | | 19 | % | $ | 560 | |
Segment income ($ millions)(3) | | $ | 180 | | $ | 143 | | 26 | % | $ | 94 | |
Amortization ($ millions) | | $ | 95 | | $ | 93 | | 2 | % | $ | 63 | |
Segment EBITDA ($ millions)(4) | | $ | 275 | | $ | 236 | | 17 | % | $ | 157 | |
Capital expenditures ($ millions) | | $ | 104 | | $ | 134 | | (22 | )% | $ | 172 | |
(1) ABG reports its results under IFRS while we report our results under US GAAP. All figures represented in this table are prepared in accordance with US GAAP.
(2) These amounts represent our equity share of results. The dilution of our ownership interest in ABG to approximately 73.9% impacts our operating statistics from second quarter 2010 onwards.
(3) Segment income excludes income taxes.
(4) EBITDA is a non-GAAP financial performance measure with no standardized meaning under US GAAP. For further information and a detailed reconciliation, please see page 82 of this MD&A.
62
Barrick Financial Report 2010 | Management’s Discussion and Analysis
Segment EBITDA and segment income for 2010, on a 100% basis, were $345 million and $226 million, an increase of 46% and 58%, respectively, over 2009. The increases were primarily as a result of higher realized gold prices, partially offset by higher total cash costs. Segment income was also affected by higher amortization expense as a result of Buzwagi entering production in second quarter 2009.
Barrick’s equity interest in 2010 production came in slightly lower than the most recent regional guidance of 0.575 million ounces. The original guidance range was 0.65 to 0.69 million ounces (based on Barrick’s equity interest). Lower than originally expected production in 2010 was mainly due to mining equipment availability issues at Tulawaka and issues at Buzwagi, including the mining of lower grade transitional oxide ore and the impact of the actions taken in response to the discovery of widespread fuel theft at the mine site.
In 2010, cost of sales, on a 100% basis, increased by 29% over 2009, reflecting higher royalties and production taxes as gold prices traded at higher levels than 2009 along with higher labor, energy and maintenance costs. Compared to 2009, 2010 total cash costs per ounce were up 19% and was outside our regional guidance range of $620 to $640 per ounce. The increase in total cash costs was primarily due to higher costs at Buzwagi due to plant and equipment repair costs and higher total cash costs at North Mara due to higher drilling costs and higher waste tons mined.
In 2011, we expect equity gold production, reflecting our 73.9% ownership of ABG, to be in the range of 0.515 to 0.560 million ounces. Production is expected to be lower than 2010 as our effective full year share of production in 2010 was about 80%, due to the recognition of 100% ownership in the first quarter 2010 and 73.9% ownership for the remainder of the year. Buzwagi production is expected to be higher in 2011 due to successfully addressing production difficulties that arose in 2010 due to fuel theft. North Mara is expected to have lower production as the mine plan focuses on waste stripping at the Gokona pit, with production coming from lower grade stockpiles. Total gold cash costs are expected to be $590 to $650 per ounce compared to $570 per ounce in 2010 on an IFRS basis. Total cash costs per ounce are expected to be higher due to lower North Mara grades and an increase in energy, labor and contractor costs across most sites.
Beyond 2010, ABG has identified various opportunities to add production, including a potential underground zone at North Mara, the Bulyanhulu Upper East Zone; and at the Golden Ridge exploration property. ABG continues to progress its evaluation of these opportunities to create value at its existing operations and to develop acquired exploration properties.
Capital Projects
Summary Financial Data
($ millions) | | | | | | | |
For the years ended December 31 | | 2010 | | 2009 | | 2008 | |
Project expenses(1) | | $ | 100 | | $ | 49 | | $ | 140 | |
Project expenses incurred by equity investees(2) | | 53 | | 93 | | 69 | |
Total project expenses | | 153 | | 142 | | 209 | |
Capital expenditures(3) | | | | | | | |
Buzwagi | | — | | 52 | | 273 | |
Pascua-Lama | | 724 | | 202 | | 112 | |
Pueblo Viejo | | 592 | | 433 | | 157 | |
Subtotal | | 1,316 | | 687 | | 542 | |
Capital commitments(4) | | $ | 1,253 | | $ | 1,018 | | $ | 552 | |
(1) Amounts presented represent our share of project development expense.
(2) Amounts presented represent our share of project development expense from projects for which we use the equity accounting method, including Reko Diq, Kabanga, Donlin Creek and Cerro Casale (until March 31, 2010).
(3) Amounts presented represent our share of capital expenditures on a cash basis.
(4) Capital commitments represent purchase obligations as at December 31 where binding commitments have been entered into for long lead capital items related to construction activities at our projects.
We spent $153 million in project expenses and $1,316 million (our share) in capital expenditures in 2010. The increase in project expenses compared to 2009 primarily relates to increased spending at Cerro Casale, partially offset by decreased expenses at Reko Diq and Kabanga. Increases in capital expenditures compared to 2009 are primarily due to increased expenditures at our Pueblo Viejo and Pascua-Lama projects, partially offset by decreased expenditures at Buzwagi, as it entered production in 2009. Our 2011 expenditures are expected to increase due to continued construction activities at both the Pascua-Lama and Pueblo Viejo projects.
Project Updates
Pueblo Viejo
At the Pueblo Viejo project in the Dominican Republic, preproduction capital is expected to increase by 10–15% from the previous estimate to $3.3–$3.5 billion (100% basis). The increased capital cost estimate is largely due to higher labor, power supply, freight and steel product related costs as well as general inflation. In December, the Environmental Impact Assessment for the 240 kV power transmission line was approved allowing associated construction activities to commence. Alternative temporary power sources are being
63
Management’s Discussion and Analysis
secured which will allow project commissioning in the fourth quarter of 2011. First production is expected in the first quarter of 2012. Overall construction is about 50% complete, approximately 75% of the capital has been committed and all four of the autoclaves are on site and have been placed on their footings. About 80% of the planned concrete has been poured, 55% of the steel has been erected and more than 600,000 tons of ore have been stockpiled. Work continues toward achieving key milestones including the connection of power to the site. Barrick’s 60% share of annual gold production in the first full five years of operation is expected to average 625,000–675,000 ounces at total cash costs of $275–$300 per ounce.(6)
Pascua-Lama
At the Pascua-Lama project on the border of Chile and Argentina, pre-production capital is expected to increase by 10–20% to $3.3–$3.6 billion. Pressure on capital costs are primarily as a result of a stronger Chilean peso, labor, commodity and other input cost increases in both countries and higher inflation particularly in Argentina. First production is expected in the first half of 2013. Approximately 40% of the capital has been committed, detailed engineering and procurement are more than 90% complete and about 60% of the earthworks necessary for the process plant and mining support facilities have been moved. Construction of the power transmission line has commenced and the new access road is almost 75% complete. Development of the tunnel, which connects the mine in Chile and the process plant in Argentina, is progressing on both sides. Occupancy of the construction camps in Chile and Argentina continues to ramp up with more than 2,000 housed on site. Average annual gold production from Pascua-Lama is expected to be 750,000–800,000 ounces in the first full five years of operation at total cash costs of $20–$50 per ounce(7) based on a silver price of $16 per ounce. For every $1 per ounce increase in the silver price, total cash costs are expected to decrease by about $35 per ounce over this period.
Cerro Casale
At the Cerro Casale project in Chile, the review of additional permitting requirements before considering a construction decision is progressing alongside discussions with the government and meetings with local communities and indigenous groups. Given the changed operating environment in Chile and the Company’s experience at Pascua-Lama, a review of the capital cost of the project has been initiated. Early indications suggest that the capital cost may be higher by about 20–25% from the previous estimate of $4.2 billion, which is based on the feasibility study completed in 2009 and reflects the impact of a stronger Chilean peso, higher labor, commodity and other input costs. An update will be provided by the end of the second quarter. Barrick’s 75% share of average annual production is anticipated to be about 750,000–825,000 ounces of gold and 170–190 million pounds of copper in the first full five years of operation at total cash costs of about $240–$260 per ounce(8) also based on the feasibility study completed in 2009. A $0.25 per pound change in the copper price would result in an approximate $50 per ounce impact on the expected total cash costs per ounce over the first full five years of operation.
Donlin Creek
At Donlin Creek, a large, undeveloped, refractory gold deposit in Alaska, a feasibility study on this 50% owned project was approved by the Board of Donlin Creek LLC in second quarter 2009. Further optimization studies are underway, primarily focused on the potential to utilize natural gas to reduce operating costs. The feasibility study revisions, inclusive of updated costs are expected to be completed in the third quarter of 2011 for consideration by the Board of Donlin Creek LLC.
Reko Diq
Reko Diq is a large copper-gold porphyry mineral deposit on the Tethyan belt, located in southwest Pakistan in the province of Balochistan, in which we hold a 37.5% interest. The initial mine development feasibility study and the environmental and social impact assessment are both complete. The feasibility study indicates pre-production capital of approximately $3.3 billion (100% basis) based on a 120,000 ton-per-day processing plant, which is capable of future expansions. Barrick’s share of average annual production for the first five full years is expected to be about 100,000 ounces of gold at total cash costs of $420–$450 per ounce and 150–160 million pounds of copper at total cash costs of about $1.00–$1.10 per pound. A copy of the feasibility study has been delivered to the Government of Balochistan (“GOB”) in accordance with the terms of the joint venture agreement to which the GOB is a party. Currently, the Supreme Court
(6) Based on gold price and oil price assumptions of $1,100 per ounce and $85 per barrel, respectively.
(7) In addition to silver price assumption, based on a gold price and oil price assumption of $1,100 per ounce and $85 per barrel, respectively, and assuming a Chilean peso foreign exchange rate of 500:1
(8) Based on a gold price, copper price and oil price assumptions of $1,100 per ounce, $2.75 per pound and $85 per barrel, respectively, and a Chilean peso foreign exchange rate of 500:1.
64
Barrick Financial Report 2010 | Management’s Discussion and Analysis
of Pakistan is hearing several constitutional petitions which, among other things, challenge the GOB’s right to grant a mining lease to the project company. On February 3, 2011, the Supreme Court issued an interim order providing, among other things, that the GOB may not take any decision in respect of the grant or otherwise of a mining lease to the project company until the matters before the Supreme Court are decided. The project company filed its application for the mining lease on February 15, 2011.
Kabanga
Barrick holds a 50% interest in the Kabanga project located in Tanzania, which is one of the world’s largest undeveloped nickel sulfide deposits. Xstrata Nickel is currently the operator of this project. Expenditures are funded equally by Xstrata Nickel and Barrick. A peer review of the draft Social, Environmental Impact Assessment report was completed and the report is being revised concurrently with the draft feasibility study report. Both reports are now expected to be submitted in the first half of 2011.
Financial Condition Review
Summary Balance Sheet and Key Financial Ratios
($ millions, except ratios and share amounts) | | | | | |
As at December 31 | | 2010 | | 2009 | |
Total cash and equivalents | | $ | 3,968 | | $ | 2,564 | |
Non-cash working capital | | 1,806 | | 1,473 | |
Non-current assets | | 26,209 | | 22,137 | |
Other assets | | 1,339 | | 901 | |
Total Assets | | 33,322 | | 27,075 | |
Non-current liabilities excluding adjusted debt | | 3,421 | | 2,827 | |
Adjusted debt(1) | | 6,392 | | 6,919 | |
Other liabilities | | 2,775 | | 1,782 | |
Total Liabilities | | 12,588 | | 11,528 | |
Total shareholders’ equity | | 19,065 | | 15,063 | |
Non-controlling interests | | 1,669 | | 484 | |
Total Equity | | $ | 20,734 | | $ | 15,547 | |
Dividends | | 436 | | 369 | |
Net debt(1) | | $ | 2,542 | | $ | 4,355 | |
Total common shares outstanding (millions of shares)(2) | | 999 | | 984 | |
Key Financial Ratios: | | | | | |
Current ratio(3) | | 2.86:1 | | 2.79:1 | |
Adjusted debt-to-equity(4) | | 0.34:1 | | 0.46:1 | |
Net debt-to-equity(5) | | 0.13:1 | | 0.29:1 | |
Return on equity(6) | | 19 | % | 12 | % |
(1) Adjusted debt and net debt are non-GAAP financial performance measures with no standardized meaning under US GAAP. For further information and a detailed reconciliation, please see page 84 of this MD&A.
(2) Total common shares outstanding do not include 8,432,418 stock options. The increase from December 31, 2009 is due to exercise of stock options and the conversion of debentures.
(3) Represents current assets divided by current liabilities as at December 31, 2010 and December 31, 2009.
(4) Represents adjusted debt divided by total shareholders’ equity as at December 31, 2010 and December 31, 2009.
(5) Represents net debt divided by total shareholders’ equity as at December 31, 2010 and December 31, 2009.
(6) Represents adjusted net income divided by average shareholders’ equity as at December 31, 2010 and December 31, 2009.
Balance Sheet Review
Total assets were $33.3 billion in 2010, an increase of $6.2 billion or 23% compared to 2009. The increase primarily reflects an increase in property, plant and equipment, largely due to the impact of acquisitions and capital expenditures, and cash and equivalents. Our asset base is primarily comprised of non-current assets such as property, plant and equipment and goodwill, reflecting the capital intensive nature of the mining business and our history of growing through acquisitions, production inventories and cash and equivalents. We typically do not carry a material accounts receivable balance, since only sales of concentrate and copper cathode have a settlement period.
65
Management’s Discussion and Analysis
Total liabilities increased by $1.1 billion or 9% compared to 2009, as an increase in asset retirement obligations and derivative liabilities was partially offset by a reduction in adjusted debt, due to the repayment of the remaining settlement obligation in gold sales contracts and the conversion of convertible debentures into common shares in fourth quarter 2010.
Sources and Uses of Net Debt
($ millions) | | | | | |
For the years ended December 31 | | 2010 | | 2009 | |
Operating activities | | | | | |
Adjusted operating cash flow | | $ | 4,783 | | $ | 2,899 | |
Settlement of gold sales contracts | | (656 | ) | (5,221 | ) |
Total operating inflows (outflows) | | 4,127 | | (2,322 | ) |
Investing activities | | | | | |
Capital expenditures–minesite sustaining | | (1,077 | ) | (784 | ) |
Capital expenditures–minesite expansionary(1) | | (242 | ) | (60 | ) |
Capital expenditures–projects(1) | | (2,004 | ) | (1,514 | ) |
Acquisitions | | (813 | ) | (101 | ) |
Other investing activities | | (36 | ) | 44 | |
Total investing outflows | | (4,172 | ) | (2,415 | ) |
Financing activities (excluding debt) | | | | | |
Proceeds from public issuance of common shares by a subsidiary | | 884 | | — | |
Common share offering | | — | | 3,885 | |
Dividends | | (436 | ) | (369 | ) |
Funding from non-controlling interests | | 114 | | 304 | |
Deposit on silver sale agreement | | 137 | | 213 | |
Other financing activities | | 102 | | 39 | |
Total financing inflows | | 801 | | 4,072 | |
Repayment with restricted cash | | — | | (113 | ) |
Other non-cash movements | | (75 | ) | (33 | ) |
Conversion of convertible debt | | 281 | | — | |
Settlement (recognition) of obligation to close out gold sales contracts | | 656 | | (655 | ) |
Adjustment for Pueblo Viejo financing (partner’s share), net of cash | | 195 | | — | |
Net decrease (increase) in net debt | | 1,813 | | (1,466 | ) |
Net debt at beginning of period | | (4,355 | ) | (2,889 | ) |
Net debt at end of period | | $ | (2,542 | ) | $ | (4,355 | ) |
(1) The amounts include capitalized interest of $281 million (2009: $257 million).
Net debt decreased to $2.5 billion, and our net debt-to-equity ratio decreased to 0.13:1 during the year. The majority of our outstanding long-term debt matures at various dates beyond 2013, with approximately $774 million repayable in the period 2011 to 2013. In addition, counterparties to debt and derivative instruments do not have unilateral discretionary rights to accelerate repayment at earlier dates; therefore we are largely protected from short-term liquidity fluctuations.
Shareholders’ Equity
Outstanding Share Data
As at January 28, 2011 | | Number of shares | |
Common shares | | 998,546,376 | |
Stock options | | 8,432,418 | |
Dividend Policy
In 2010, we increased our annual dividend from $0.40 per common share to $0.48 per common share and we also moved from a semi-annual dividend to a quarterly dividend. This 20% increase in dividends reflects our ability to generate substantial cash flows from our operations in a high gold price environment. With strong cash flow and the industry’s only A-rated balance sheet, we determined that we have the financial resources to return additional value to shareholders while still investing in advanced projects. The amount and timing of any dividends is within the discretion of our Board of Directors. The Board of Directors reviews the dividend policy quarterly based on our current and projected liquidity profile, and capital requirements for capital projects and potential acquisitions.
Comprehensive Income
Comprehensive income consists of net income or loss, together with certain other economic gains and losses, which, collectively, are described as “other comprehensive income” or “OCI”, and excluded from the income statement.
In 2010, other comprehensive income was $476 million on an after-tax basis consisting primarily of gains of $612 million on hedge contracts designated for future periods, caused primarily by changes in currency exchange rates, copper prices, and fuel prices; reclassification adjustments totaling $104 million for gains on hedge contracts designated for 2010 that were transferred to earnings in 2010; $12 million transferred to earnings related to gains recorded on the sale of shares in various investments in junior mining companies; $69 million of gains recorded as a result of changes in the fair value of investments held during the year; and $22 million in gains for currency translation adjustments on Barrick Energy.
Included in accumulated other comprehensive income at December 31, 2010 were unrealized pre-tax gains on currency, commodity and interest rate hedge contracts totaling
66
Barrick Financial Report 2010 | Management’s Discussion and Analysis
$784 million. The balance primarily relates to currency hedge contracts which are designated against operating costs and capital expenditures mostly over the next three years and are expected to help protect against the impact of the strengthening of the Australian and Canadian dollar against the US dollar. These hedge gains/losses are expected to be recorded in earnings at the same time as the corresponding hedged operating costs and amortization of capital expenditures are also recorded in earnings.
Financial Position
We maintained a sound financial position in 2010 despite the market turbulence that has been experienced over the past three years. This is illustrated by our significant cash and working capital balances and our relatively low debt-to-equity and debt to total capitalization ratios as at December 31, 2010.
Our sound financial position is reflected in the fact that we have the only A-rated balance sheet in the gold mining industry as measured by S&P. Our credit ratings, as established by S&P and Moody’s, have remained stable. Our ability to access unsecured debt markets and the related cost of debt financing is, in part, dependent upon maintaining an acceptable credit rating. Deterioration in our credit rating would not adversely affect existing debt securities, but could impact funding costs for any new debt financing.
Credit Rating from Major Rating Agencies
At January 28, 2011: | | | |
Standard and Poor’s (“S&P”) | | A– | |
Moody’s | | Baa1 | |
The key factors impacting our financial position, and therefore our credit rating, include the following:
· Our market capitalization and the strength of our balance sheet, including the amount of net debt and our net debt-to-equity ratio (refer to balance sheet review section of this MD&A for discussion of key factors impacting these measures in 2010);
· Our net cash flow, including cash generated by operating activities (refer to liquidity and cash flow section of this MD&A for discussion of key factors impacting these measures in 2010);
· Expected capital expenditure requirements (refer to the outlook section of this MD&A for a discussion of key factors impacting these measures in future periods);
· The quantity of our gold reserves (refer to page 166 for more information); and
· Our geo-political risk profile.
Liquidity and Cash Flow
Total cash and cash equivalents at the end of 2010 were $4.0 billion(9). At year end, our cash position consisted of a mix of term deposits, treasury bills and money market investments. We also have a $1.5 billion credit facility available as a source of financing and we may raise new financing for projects, acquisitions, or for other purposes on an as needed basis.
Cash Summary
As at December 31 | | 2010 | | 2009 | |
US dollars | | $ | 3,692 | | $ | 2,392 | |
Canadian dollars | | 36 | | 71 | |
Australian dollars | | 29 | | 57 | |
Other | | 211 | | 44 | |
| | $ | 3,968 | | $ | 2,564 | |
One of our primary ongoing sources of liquidity is operating cash flow. In 2010, we generated $4.1 billion in operating cash flow, compared to a $2.3 billion operating cash outflow in 2009. Operating cash flow reflects payments related to the settlement of gold sales contracts of $5.2 billion in 2009 and $656 million in 2010. Adjusted operating cash flow, which excludes the impact of these payments, totaled $4.8 billion in 2010, an increase of 65% compared to 2009. The increase in adjusted operating cash flow was primarily due to growing cash margins with the rise in realized gold and copper prices and higher gold sales, partially offset by higher income taxes paid.
Non-cash Working Capital
($ millions) | | | | | |
For the years ended December 31 | | 2010 | | 2009 | |
Inventories(1) | | $ | 2,958 | | $ | 2,336 | |
Other current assets | | 648 | | 320 | |
Accounts receivable | | 346 | | 251 | |
VAT and fuel tax receivables(2) | | 329 | | 285 | |
Accounts payable and other current liabilities | | (2,475 | ) | (1,719 | ) |
Non-cash working capital | | $ | 1,806 | | $ | 1,473 | |
(1) Includes long-term stockpiles of $1,106 million (2009: $796 million).
(2) Includes long-term VAT and fuel tax receivables of $138 million (2009: $124 million).
(9) Includes $401 million cash held at ABG, which may not be readily deployed outside ABG. It also includes $296 million held at Pueblo Viejo as a result of the first draw on the project financing. These funds are to be used to fund the further construction of the project and are not readily deployable by Barrick for other purposes.
67
Management’s Discussion and Analysis
Adjusted operating cash flow was also impacted by a $333 million increase in non-cash working capital. The increase in non-cash working capital primarily relates to an increase in inventories, partially offset by an increase in accounts payable and other current liabilities. The increase in inventory related to approximately $400 million increase in ore in stockpiles, primarily at Cortez, Goldstrike and Porgera.
The principal uses of 2010 adjusted operating cash flow were settlement of gold sales contracts, sustaining capital expenditures, construction activities at capital projects, acquisitions, and dividend payments.
In 2010, our adjusted operating cash flow was $4.8 billion. Assuming we are able to sustain this level of cash generation, dividends at current rates totaling about $0.5 billion per year and minesite sustaining capital expenditures of about $1.0 billion, $3.3 billion per year would be available for investment in capital projects, minesite expansion opportunities and acquisitions. The most significant factor impacting whether this level of cash generation is sustainable is market gold and copper prices. Over the next three years, we expect to spend an average of $0.5 billion per year on minesite expansion projects and a total of $2.8 billion to fund the remaining construction activities at Pueblo Viejo and Pascua-Lama. For Pueblo Viejo, we expect to fund about $250 million of the remaining spend from the future proceeds of the project financing. At Pascua-Lama, we expect to fund remaining construction activities with up to $1.25 billion from new project financing and $275 million from future proceeds of the Silver Wheaton Agreement.
Investments in capital projects and acquisitions are subject to an internal capital allocation review prior to proceeding with new expenditures. This review entails an assessment of our overall liquidity, the overall level of investment required, and the prioritization of investments. The assessment also takes into account expected levels of future operating cash flow and the cost and availability of new financing. A decline in market gold prices and/or copper prices could impact the timing and amount of future investment in capital projects and/or other uses of capital.
Alternatives for sourcing our future capital or other liquidity needs include other credit facilities, future operating cash flow, sale of non-core assets, project financings and debt or equity financings. These alternatives are continually evaluated to determine the optimal mix of capital resources for our capital needs.
Cash used in investing activities amounted to $4,172 million in 2010, an increase of $1,757 million compared to 2009, primarily due to total capital expenditures of $3,323 million, which includes capitalized interest, the $447 million related to the acquisition of an additional 25% interest in Cerro Casale in the first quarter and $264 million related to the acquisitions by Barrick Energy in the second and third quarter.
Capital Expenditures(1),(2)
($ millions) | | | | | | | |
For the years ended December 31 | | 2010 | | 2009 | | 2008 | |
Capital expenditures – projects | | | | | | | |
Buzwagi(3) | | $ | — | | $ | 52 | | $ | 273 | |
Pascua-Lama | | 724 | | 202 | | 112 | |
Pueblo Viejo | | 592 | | 433 | | 157 | |
Cortez Hills | | 19 | | 278 | | 155 | |
Kainantu | | — | | — | | 4 | |
Sedibelo | | — | | — | | 38 | |
Subtotal(4) | | $ | 1,335 | | $ | 965 | | $ | 739 | |
Capital expenditures attributable to non-controlling interests(5) | | 394 | | 292 | | 104 | |
Total project capital expenditures | | $ | 1,729 | | $ | 1,257 | | $ | 843 | |
Minesite expansionary capital expenditures | | | | | | | |
Golden Sunlight | | $ | 49 | | $ | 37 | | $ | — | |
Goldstrike | | 3 | | — | | — | |
Veladero(6) | | 23 | | 23 | | — | |
Cortez | | 20 | | — | | — | |
Bald Mountain | | 139 | | — | | — | |
South Arturo | | 2 | | — | | — | |
Total capital expenditures – minesite expansionary | | $ | 236 | | $ | 60 | | $ | — | |
Sustaining capital expenditures | | | | | | | |
North America | | $ | 270 | | $ | 170 | | $ | 161 | |
South America | | 231 | | 181 | | 154 | |
Australia Pacific | | 289 | | 245 | | 215 | |
African Barrick Gold | | 131 | | 134 | | 172 | |
Other(7) | | 156 | | 54 | | 40 | |
Subtotal | | | | | | | |
Total capital expenditures – minesite sustaining | | $ | 1,077 | | $ | 784 | | $ | 742 | |
Capitalized interest | | 281 | | 257 | | 191 | |
Total | | $ | 3,323 | | $ | 2,358 | | $ | 1,776 | |
(1) The amounts presented in this table include the results of discontinued operations.
(2) These amounts are presented on a cash basis consistent with the amounts presented on the consolidated statement of cash flows.
(3) Buzwagi entered into production as of May 1, 2009. Capital expenditures from May onwards have been reflected in minesite sustaining, although construction continued until third quarter 2009.
(4) On an accrual basis, our share of project capital expenditures is $1,791 million including capitalized interest.
(5) Amount reflects our partner’s share of expenditures at the Pueblo Viejo project on a cash basis.
(6) These amounts include capital expenditures related to the development of a new pit at our Veladero mine.
(7) These amounts include $86 million of capital expenditures at Barrick Energy (2009: $32 million and 2008: $15 million).
68
Barrick Financial Report 2010 | Management’s Discussion and Analysis
Cash provided by financing activities for 2010 was $1,434 million. The significant financing activities in 2010 included $884 million in proceeds from public issuance of common shares by ABG in the first quarter 2010 and the drawdown of $782 million of Pueblo Viejo project financing in second quarter 2010. These amounts were partially offset by dividend payments of $436 million and debt repayments of $149 million. This compares to financing inflows in 2009 of $5,829 million largely from the proceeds from the Common Share offering of $3,885 million and debt proceeds of $2,154 million, partially offset by debt repayments of $397 million and dividend payments of $369 million.
Financial Instruments
We use a mixture of cash, long-term debt and shareholders’ equity to maintain an efficient capital structure and ensure adequate liquidity exists to meet the cash needs of our business. We use interest rate contracts to mitigate interest rate risk that is implicit in our cash balances and outstanding long-term debt. In the normal course of business, we are inherently exposed to currency and commodity price risk. We use currency and commodity hedging instruments to mitigate these inherent business risks. We also hold certain derivative instruments that do not qualify for hedge accounting treatment. These non-hedge derivatives are described in note 20 to our consolidated financial statements. For a discussion of certain risks and assumptions that relate to the use of derivatives, including market risk, market liquidity risk and credit risk, refer to notes 2 and 20 to our consolidated financial statements. For a discussion of the methods used to value financial instruments, as well as any significant assumptions, refer to note 21 to our consolidated financial statements.
Counterparty Risk
Our financial position is also dependent, in part, on our exposure to the risk of counterparty defaults related to the net fair value of our derivative contracts. Counterparty risk is the risk that a third party might fail to fulfill its performance obligations under the terms of a financial instrument. Counterparty risk can be assessed both in terms of credit risk and liquidity risk. For cash and equivalents and accounts receivable, credit risk represents the carrying amount on the balance sheet, net of any overdraft positions.
For derivatives, when the fair value is positive, this creates credit risk. When the fair value of a derivative is negative, we assume no credit risk. However, liquidity risk exists to the extent a counterparty is no longer able to perform in accordance with the terms of the contract due to insolvency. In cases where we have a legally enforceable master netting agreement with a counterparty, credit risk exposure represents the net amount of the positive and negative fair values for similar types of derivatives. For a net negative amount, we regard credit risk as being zero. For a net positive amount, this is a reasonable basis to measure credit risk when there is a legally enforceable master netting agreement. We mitigate credit and liquidity risk by:
· Entering into derivatives with high credit-quality counterparties;
· Limiting the amount of exposure to each counterparty; and
· Monitoring the financial condition of counterparties.
As of December 31, 2010, we had 23 counterparties to our derivative positions. We proactively manage our exposure to individual counterparties in order to mitigate both credit and liquidity risks. For those counterparties in a net asset position (total balance attributable to the counterparties is $899 million), two hold greater than 10% of our mark-to-market asset position, with the largest counterparty holding 17% (or $154 million). For those counterparties in a net liability position (total balance attributable to the counterparties is $52 million), one holds greater than 10% of our mark-to-market liability position, with the largest counterparty holding 93% (or $49 million). On an ongoing basis, we monitor our exposures and ensure that none of the counterparties with which we hold outstanding contracts has declared insolvency.
69
Management’s Discussion and Analysis
Summary of Financial Instruments
As at and for the year ended December 31, 2010
Financial | | Principal/ | | Associated |
Instrument | | Notional Amount | | Risks |
Cash and equivalents | | $ 3,968 million | | · Interest rate
· Credit |
Accounts receivable | | $ 346 million | | · Credit |
Available-for-sale securities | | $ 171 million | | · Market |
Accounts payable | | $ 1,511 million | | · Interest rate |
Long-term debt | | $ 6,705 million | | · Interest rate |
Restricted share units | | $ 153 million | | · Market |
Deferred share units | | $ 9 million | | · Market |
Performance restricted share units | | $ 11 million | | · Market |
Derivative instruments – currency contracts | | CAD
CLP
AUD | 372 million
244,395 million
4,217 million | | · Credit
· Market/liquidity |
Derivative instruments – copper contracts | | 207 million lbs | | · Market/liquidity
· Credit |
Derivative instruments – energy contracts | | Fuel
Propane | 4.7 million bbls
19 million gallons | | · Market/liquidity
· Credit |
Derivative instruments – interest rate contracts | | Pay float interest rate swaps
Receive float interest rate swaps
Receive float interest rate swaptions | ($200) million
$ 100 million
$ 200 million | | · Credit
· Market/liquidity |
Non-hedge derivatives | | various | | · Market/liquidity
· Credit |
| | | | | | |
Commitments and Contingencies
Capital Expenditures Not Yet Committed
We expect to incur capital expenditures during the next five years for both projects and producing mines. The projects are at various stages of development, from preliminary exploration or scoping study stage through to the construction execution stage. The ultimate decision to incur capital expenditures at each potential site is subject to positive results which allow the project to advance past decision hurdles. Two projects were at an advanced stage at December 31, 2010, namely Pueblo Viejo and Pascua-Lama (refer to pages 63–64 for further details).
70
Barrick Financial Report 2010 | Management’s Discussion and Analysis
Contractual Obligations and Commitments
| | Payments due | | | |
($ millions) | | | | | | | | | | | | 2016 and | | | |
As at December 31 | | 2011 | | 2012 | | 2013 | | 2014 | | 2015 | | thereafter | | Total | |
Long-term debt(1) | | | | | | | | | | | | | | | |
Repayment of principal | | $ | — | | $ | 120 | | $ | 603 | | $ | 426 | | $ | 176 | | $ | 5,308 | | $ | 6,633 | |
Capital leases | | 18 | | 17 | | 16 | | 10 | | 8 | | 3 | | 72 | |
Interest | | 373 | | 372 | | 363 | | 337 | | 309 | | 3,838 | | 5,592 | |
Asset retirement obligations(2) | | 89 | | 100 | | 70 | | 48 | | 83 | | 1,456 | | 1,846 | |
Operating leases | | 12 | | 10 | | 8 | | 7 | | 7 | | 35 | | 79 | |
Restricted share units | | 60 | | 93 | | — | | — | | — | | — | | 153 | |
Pension benefits and other post-retirement benefits | | 26 | | 26 | | 34 | | 26 | | 25 | | 119 | | 256 | |
Derivative liabilities(3) | | 215 | | 2 | | 7 | | 10 | | 12 | | 32 | | 278 | |
Purchase obligations for supplies and consumables(4) | | 595 | | 185 | | 134 | | 105 | | 93 | | 337 | | 1,449 | |
Capital commitments(5) | | 1,333 | | 69 | | 1 | | — | | — | | — | | 1,403 | |
Social development costs | | 11 | | 3 | | 16 | | 3 | | 6 | | 72 | | 111 | |
Total | | $ | 2,732 | | $ | 997 | | $ | 1,252 | | $ | 972 | | $ | 719 | | $ | 11,200 | | $ | 17,872 | |
(1) Long-term Debt and Interest–Our debt obligations do not include any subjective acceleration clauses or other clauses that enable the holder of the debt to call for early repayment, except in the event that we breach any of the terms and conditions of the debt or for other customary events of default. The debt and interest amounts include 100% of the Pueblo Viejo financing, even though we have only guaranteed our 60% share. We are not required to post any collateral under any debt obligations. The terms of our debt obligations would not be affected by deterioration in our credit rating. Projected interest payments on variable rate debt were based on interest rates in effect at December 31, 2010. Interest is calculated on our long-term debt obligations using both fixed and variable rates.
(2) Asset Retirement Obligations–Amounts presented in the table represent the undiscounted future payments for the expected cost of asset retirement obligations.
(3) Derivative Liabilities–Amounts presented in the table relate to derivative contracts disclosed under notes 2 and 20 to the consolidated financial statements. Payments related to derivative contracts cannot be reasonably estimated given variable market conditions.
(4) Purchase Obligations for Supplies and Consumables–Includes commitments related to new purchase obligations to secure a supply of acid, tires and cyanide for our production process.
(5) Capital Commitments–Purchase obligations for capital expenditures include only those items where binding commitments have been entered into. Commitments at the end of 2010 mainly relate to construction capital at Pueblo Viejo and Pascua-Lama.
Litigation and Claims
We are currently subject to various litigation as disclosed in note 30 to the consolidated financial statements, and we may be involved in disputes with other parties in the future that may result in litigation. If we are unable to resolve these disputes favorably, it may have a material adverse impact on our financial condition, cash flow and results of operations.
71
Management’s Discussion and Analysis
Review of Quarterly Results
Quarterly Information(1)
| | 2010 | | 2009 | |
($ millions, except where indicated) | | Q4 | | Q3 | | Q2 | | Q1 | | Q4 | | Q3 | | Q2 | | Q1 | |
Sales | | $ | 3,033 | | $ | 2,811 | | $ | 2,731 | | $ | 2,636 | | $ | 2,452 | | $ | 2,096 | | $ | 2,029 | | $ | 1,827 | |
Realized price – gold(2) | | 1,368 | | 1,237 | | 1,205 | | 1,114 | | 1,119 | | 971 | | 931 | | 915 | |
Realized price – copper(2) | | 3.99 | | 3.39 | | 2.93 | | 3.29 | | 3.44 | | 2.90 | | 3.18 | | 2.93 | |
Cost of sales | | 1,110 | | 1,076 | | 1,072 | | 1,041 | | 1,013 | | 971 | | 975 | | 955 | |
Net income/(loss)(4) | | 896 | | 837 | | 783 | | 758 | | 215 | | (5,350 | ) | 492 | | 371 | |
Per share (dollars)(3),(4) | | 0.90 | | 0.85 | | 0.79 | | 0.77 | | 0.22 | | (6.07 | ) | 0.56 | | 0.42 | |
Adjusted net income(5) | | 947 | | 829 | | 759 | | 741 | | 604 | | 473 | | 431 | | 298 | |
Per share (dollars)(3),(4) | | 0.95 | | 0.84 | | 0.77 | | 0.75 | | 0.61 | | 0.54 | | 0.49 | | 0.34 | |
EBITDA(5) | | 1,635 | | 1,542 | | 1,328 | | 1,395 | | 794 | | (4,946 | ) | 943 | | 648 | |
Operating cash flow | | 781 | | 1,276 | | 1,019 | | 1,051 | | (4,300 | ) | 911 | | 718 | | 349 | |
Adjusted operating cash flow(5) | | $ | 1,437 | | $ | 1,276 | | $ | 1,019 | | $ | 1,051 | | $ | 921 | | $ | 911 | | $ | 718 | | $ | 349 | |
(1) The amounts presented in this table include the results of discontinued operations.
(2) Per ounce/pound weighted average. Realized price is a non-GAAP financial performance measure with no standard meaning under US GAAP. For further information and a detailed reconciliation, please see page 83 of this MD&A.
(3) Calculated using weighted average number of shares outstanding under the basic method of earnings per share.
(4) Sum of all the quarters may not add up to the yearly total due to rounding.
(5) Adjusted net income, EBITDA and adjusted operating cash flow are non-GAAP financial performance measures with no standard meaning under US GAAP. For further information and a detailed reconciliation, please see pages 78 – 82 of this MD&A.
Our financial results for the last eight quarters reflect: volatile spot gold and copper prices that impact realized sales price and generally higher gold and copper production costs mainly caused by inflationary pressures. The net loss realized in third quarter 2009 includes a $5.9 billion charge relating to a decision to eliminate our gold sales contracts.
Fourth Quarter Results
In fourth quarter 2010, we reported net income and adjusted net income of $896 million and $947 million, respectively, compared to $215 million and $604 million, respectively, in fourth quarter 2009.
The increases in both net income and adjusted net income were as a result of record high gold and copper prices and higher gold sales volume, partially offset by lower copper sales volume and higher total cash costs for gold and copper.
In fourth quarter 2010, we sold 1.83 million ounces of gold and 103 million pounds of copper, compared to 1.8 million ounces of gold and 118 million pounds of copper in fourth quarter 2009. Sales in fourth quarter 2010 were higher than the same prior year period reflecting higher market prices for both copper and gold and higher gold sales volumes. In fourth quarter 2010, cost of sales was $1,110 million or $486 per ounce on a total cash cost basis, an increase of $97 million and $21 per ounce, respectively, from fourth quarter 2009. Cost of sales was impacted by higher sales volume in fourth quarter 2010, compared to fourth quarter 2009. Total gold cash costs were slightly higher, as the regional production mix shifted to our higher cost regions in fourth quarter 2010. In fourth quarter 2010, net cash costs increased by $16 per ounce to $326 per ounce, compared to $310 per ounce in fourth quarter 2009, reflecting higher cash costs, partially offset by higher copper credits.
Operating cash flow in fourth quarter 2010 was $781 million, a significant increase from fourth quarter 2009. Fourth quarter operating cash flow reflected the cost of settling the gold sales contracts of $656 million and $5,221 million in 2010 and 2009, respectively.
Adjusted operating cash flow in fourth quarter 2010, which excludes the cost of settling the gold sales contracts, was $1,437 million, a 56% increase over fourth quarter 2009, reflecting higher market prices for gold and copper and an increase in gold sales volumes.
72
Barrick Financial Report 2010 | Management’s Discussion and Analysis
US GAAP Critical Accounting Policies and Estimates
Management has discussed the development and selection of our critical accounting estimates with the Audit Committee of the Board of Directors, and the Audit Committee has reviewed the disclosure relating to such estimates in conjunction with its review of this MD&A. The accounting policies and methods we utilize determine how we report our financial condition and results of operations, and they may require management to make estimates or rely on assumptions about matters that are inherently uncertain.
Our financial condition and results of operations are reported using accounting policies and methods prescribed by US GAAP. In certain cases, US GAAP allows accounting policies and methods to be selected from two or more alternatives, any of which might be reasonable yet result in our reporting materially different amounts. We exercise judgment in selecting and applying our accounting policies and methods to ensure that, while US GAAP compliant, they reflect our judgment of an appropriate manner in which to record and report our financial condition and results of operations.
Accounting Changes Implemented in 2010
Amendments to Accounting for Variable Interest Entities (“VIEs”)
In second quarter 2009, the FASB issued an amendment to its guidance on VIEs which makes significant changes to the model for determining which entity should consolidate a VIE and how often this assessment should be performed. Based on our assessment, these changes do not have an impact on the accounting for our existing VIEs. We have updated our financial statement notes to reflect the increased disclosure requirements (note 2b).
Future Accounting Policy Changes
We have not identified any changes in US GAAP that may have a significant impact on our future financial statements. With the transition to reporting under IFRS in 2011, new US GAAP pronouncements effective from 2011 onwards do not impact our 2010 financial statements prepared in accordance with US GAAP.
Internal Control over Financial Reporting and Disclosure Controls and Procedures
Management is responsible for establishing and maintaining adequate internal control over financial reporting and disclosure controls and procedures. Internal control over financial reporting is a framework designed to provide reasonable assurance regarding the reliability of financial reporting and the preparation of financial statements in accordance with US GAAP. The Company’s internal control over financial reporting framework includes those policies and procedures that (i) pertain to the maintenance of records that, in reasonable detail, accurately and fairly reflect the transactions and dispositions of the assets of the Company; (ii) provide reasonable assurance that transactions are recorded as necessary to permit preparation of financial statements in accordance with US GAAP, and that receipts and expenditures of the Company are being made only in accordance with authorizations of management and directors of the Company; and (iii) provide reasonable assurance regarding prevention or timely detection of unauthorized acquisition, use or disposition of the Company’s assets that could have a material effect on the Company’s consolidated financial statements.
Disclosure controls and procedures form a broader framework designed to ensure that other financial information disclosed publicly fairly presents in all material respects the financial condition, results of operations and cash flows of the company for the periods presented in this MD&A and Barrick’s Annual Report. The Company’s disclosure controls and procedures framework includes processes designed to ensure that material information relating to the Company, including its consolidated subsidiaries, is made known to management by others within those entities to allow timely decisions regarding required disclosure.
Together, the internal control over financial reporting and disclosure controls and procedures frameworks provide internal control over financial reporting and disclosure. Due to its inherent limitations, internal control over financial reporting and disclosure may not prevent or detect all misstatements. Further, the effectiveness of internal control is subject to the risk that controls may become inadequate because of changes in conditions, or that the degree of compliance with policies or procedures may change. Management will continue to monitor the effectiveness of its internal control over financial reporting and disclosure and may make modifications from time to time as considered necessary or desirable. It is not expected that the 2011 conversion to IFRS described on page 85 will impact the effectiveness of the internal control over financial reporting and disclosure in the upcoming year.
73
Management’s Discussion and Analysis
The management of Barrick, at the direction of our chief executive and financial officers, have evaluated the effectiveness of the design and operation of the internal controls over financial reporting and disclosure controls and procedures as of the end of the period covered by this report and have concluded that they were effective at a reasonable assurance level.
Barrick’s annual management report on internal control over financial reporting and the integrated audit report of Barrick’s auditors for the year ended December 31, 2010 will be included in Barrick’s 2010 Annual Report and its 2010 Form 40-F/Annual Information Form on file with the US Securities and Exchange Commission (“SEC”) and Canadian provincial securities regulatory authorities.
Critical Accounting Estimates and Judgments
Certain accounting estimates have been identified as being “critical” to the presentation of our financial condition and results of operations because they require us to make subjective and/or complex judgments about matters that are inherently uncertain; or there is a reasonable likelihood that materially different amounts could be reported under different conditions or using different assumptions and estimates.
Reserve Estimates Used to Measure Amortization of Property, Plant and Equipment
We record amortization expense based on the estimated useful economic lives of long-lived assets. Changes in reserve estimates are generally calculated at the end of each year and cause amortization expense to increase or decrease prospectively. The estimate that most significantly affects the measurement of amortization is quantities of proven and probable gold and copper reserves, because we amortize a large portion of property, plant and equipment using the units-of-production method. The estimation of quantities of gold and copper reserves, in accordance with the principles in Industry Guide No. 7, issued by the SEC is complex, requiring significant subjective assumptions that arise from the evaluation of geological, geophysical, engineering and economic data for a given ore body. This data could change over time as a result of numerous factors, including new information gained from development activities, evolving production history and a reassessment of the viability of production under different economic conditions. Changes in data and/or assumptions could cause reserve estimates to substantially change from period to period. Actual gold and copper production could differ from expected gold and copper production based on reserves, and an adverse change in gold or copper prices could make a reserve uneconomic to mine. Variations could also occur in actual ore grades and gold, silver and copper recovery rates from estimates.
A key trend that could reasonably impact reserve estimates is rising market mineral prices, because the mineral price assumption used in preparing reserve estimates is calculated based on the trailing three-year average market price. As this assumption rises, it could result in an upward revision to reserve estimates as material not previously classified as a reserve becomes economic at higher gold prices. Following the recent trend in market gold prices over the last three years, the mineral price assumption used to measure reserves has also been rising.
The gold price assumption was $1,000(10) per ounce in 2010 (2009: $825 per ounce; 2008: $725 per ounce). The copper price assumption was $2.00 per pound in 2010 (2009: $2.00 per pound; 2008: $2.00 per pound).
The impact of a change in reserve estimates is generally more significant for mines near the end of the mine life because the overall impact on amortization is spread over a shorter time period. Also, amortization expense is more significantly impacted by changes in reserve estimates at underground mines than open-pit mines due to the following factors:
(i) Underground development costs incurred to access ore at underground mines are significant and amortized using the units-of-production method; and
(ii) Reserves at underground mines are often more sensitive to mineral price assumptions and changes in production costs. Production costs at underground mines are impacted by factors such as dilution, which can significantly impact mining and processing costs per ounce.
(10) Reserves at Round Mountain have been calculated using an assumed price of $900 per ounce.
74
Barrick Financial Report 2010 | Management’s Discussion and Analysis
Impact of Historic Changes in Reserve Estimates on Amortization for the years ended December 31
| | 2010 | | 2009 | |
| | Reserves | | Amortization | | Reserves | | Amortization | |
| | increase | | increase | | increase | | increase | |
($ millions, except reserves in millions of contained oz/pounds) | | (decrease)(1) | | (decrease) | | (decrease)(1) | | (decrease) | |
Gold | | | | | | | | | |
North America | | 5.7 | | $ | (13 | ) | 9.6 | | $ | (32 | ) |
Australia Pacific | | 1.6 | | 3 | | 0.3 | | (11 | ) |
African Barrick Gold | | (0.8 | ) | — | | (0.5 | ) | (2 | ) |
South America | | 0.8 | | 4 | | 13.5 | | (9 | ) |
Total Gold | | 7.3 | | $ | (6 | ) | 22.9 | | $ | (54 | ) |
Copper | | | | | | | | | |
Australia Pacific | | 30 | | $ | — | | (153 | ) | $ | (3 | ) |
South America | | 308 | | 6 | | 1,023 | | (13 | ) |
Total Copper | | 338 | | $ | 6 | | 870 | | $ | (16 | ) |
(1) Each year we update our reserve estimates as at the end of the year as part of our normal business cycle. We then use those updated reserve estimates to calculate amortization expense in the following fiscal year on assets which use the units-of-production method of amortization. Reserve changes presented were calculated as at the end of 2009 and 2008 and are in millions of contained ounces/pounds.
Long- Lived Asset and Goodwill Impairment Evaluations
Producing Mines and Development Projects
On an annual basis, as at October 1, and at any other time if events or changes in circumstances indicate that the fair value of a reporting unit has been reduced below its carrying amount, we evaluate the carrying amount of goodwill for potential impairment by comparing its fair value to its carrying amount. We also evaluate the long-lived assets of a reporting unit for potential impairment when events or changes in circumstances indicate that its fair value has been reduced below its carrying amount by comparing that reporting unit’s undiscounted cash flows to its carrying amount (referred to as a “screen test”). When a potential long-lived asset impairment is identified as a result of the screen test, the amount of impairment is calculated by comparing its fair value to its carrying amount.
There is no active market for our reporting units. Consequently, when assessing a reporting unit for impairment, we use an income approach (being the net present value of expected future cash flows from our LOM plans, or net asset value (“NAV”) of the relevant reporting unit) to determine the fair value we could receive for the reporting unit in an arm’s length transaction at the measurement date. For our gold reporting units, we apply a market multiple to the NAV in order to assess their estimated fair value. Gold companies typically trade at a market capitalization that is based on a multiple of their underlying NAV. Consequently, a market participant would generally apply a NAV multiple when estimating the fair value of an operating gold mine.
Included in these forecasts is the production of mineral resources that do not currently qualify for inclusion in proven and probable ore reserves where there is a high degree of confidence in its economic extraction. This is consistent with the methodology we use to measure value beyond proven and probable reserves when allocating the purchase price of a business combination to acquired mining assets. Other significant estimates employed in our assessment of fair value include short-term and long-term metal prices, foreign exchange rates, the price of oil, weighted average cost of capital used in discounting and the NAV multiple. For further information on these estimates refer to note 17 of our consolidated financial statements.
In fourth quarter 2010, we conducted our annual goodwill impairment test on all of our reporting units to which goodwill has been assigned, by comparing their estimated fair value to their carrying amounts. We did not record any goodwill impairments at any of our mine sites.
75
Management’s Discussion and Analysis
Exploration Property
After acquisition, various factors can affect the recoverability of the capitalized cost of land and mineral rights, particularly the results of exploration drilling. The length of time between the acquisition of land and mineral rights and when we undertake exploration work varies based on the prioritization of our exploration projects and the size of our exploration budget. If we determine that a potential impairment condition may exist, we compare the sum of the undiscounted cash flows expected to be generated from the project to its carrying amount. If the sum of undiscounted cash flows is less than the carrying amount, an impairment charge is recognized if the carrying amount of the individual long-lived assets within the group exceeds their fair value. For projects that do not have reliable cash flow projections, a market approach is applied.
Intangible Asset
Intangible assets having indefinite lives and intangible assets that are not yet ready for use are not amortized and are reviewed annually for impairment. We also review and test the carrying amounts of all intangible assets when events or changes in circumstances suggest that their carrying amount may not be recoverable. Based on the review, we noted that there were no indications of impairment in 2010.
Production Stage
We assess each mine construction project to determine when a mine moves into production stage. The criteria used to assess the start date are determined based on the unique nature of each mine construction project, such as the complexity of a plant or its location. We consider various relevant criteria to assess when the mine is substantially complete and ready for its intended use and moved into the production stage. Some of the criteria considered would include, but are not limited to, the following: (1) the level of capital expenditures compared to construction cost estimates; (2) the completion of a reasonable period of testing of mine plant and equipment; (3) the ability to produce minerals in saleable form (within specifications); and (4) the ability to sustain ongoing production of minerals.
When a mine construction project moves into the production stage, the capitalization of certain mine construction costs ceases and costs are either capitalized to inventory or expensed, except for capitalizable costs related to property, plant and equipment additions or improvements, underground mine development or reserve development.
Pre-production stripping costs are capitalized until an “other than de minimis” level of mineral is produced, after which time such costs are either capitalized to inventory or expensed. We consider various relevant criteria to assess when an “other than de minimis” level of mineral is produced. Some of the criteria considered would include, but are not limited to, the following: (1) the amount of ounces mined versus total ounces in reserves; (2) the amount of ore tons mined vs. total LOM expected ore tons mined; (3) the current stripping ratio versus the LOM strip ratio; and (4) the ore grade versus the LOM grade.
Fair Value of Asset Retirement Obligations (“AROs”)
AROs arise from the acquisition, development, construction and normal operation of mining property, plant and equipment, due to government controls and regulations that protect the environment and public safety on the closure and reclamation of mining properties. We record the fair value of an ARO in our consolidated financial statements when it is incurred and capitalize this amount as an increase in the carrying amount of the related asset. At operating mines, the increase in an ARO is recorded as an adjustment to the corresponding asset carrying amount and results in a prospective increase in amortization expense. At closed mines, any adjustment to an ARO is charged directly to earnings.
The fair values of AROs are measured by discounting the expected cash flows using a discount factor that reflects the credit-adjusted risk-free rate of interest. We prepare estimates of the timing and amounts of expected cash flows when an ARO is incurred, which are updated to reflect changes in facts and circumstances, or if we are required to submit updated mine closure plans to regulatory authorities. In the future, changes in regulations or laws or enforcement could adversely affect our operations; and any instances of non-compliance with laws or regulations that result in fines or injunctions or delays in projects, or any unforeseen environmental contamination at, or related to, our mining properties, could result in us suffering significant costs. We mitigate these risks through environmental and health and safety programs under which we monitor compliance with laws and regulations and take steps to reduce the risk of environmental contamination occurring. We maintain insurance for some environmental risks; however, for some risks, coverage cannot be purchased at a reasonable cost. Our coverage may not provide full recovery for all possible causes of loss. The principal factors that can cause expected cash flows to change are: the construction of new processing facilities; changes in the quantities of material in reserves and a corresponding change in the life-of-mine plan; changing ore characteristics that ultimately impact
76
Barrick Financial Report 2010 | Management’s Discussion and Analysis
the environment; changes in water quality that impact the extent of water treatment required; and changes in laws and regulations governing the protection of the environment. In general, as the end of the mine life nears, the reliability of expected cash flows increases, but earlier in the mine life, the estimation of an ARO is inherently more subjective. Significant judgments and estimates are made when estimating the fair value of AROs. Expected cash flows relating to AROs could occur over periods up to 40 years and the assessment of the extent of environmental remediation work is highly subjective. Considering all of these factors that go into the determination of an ARO, the fair value of AROs can materially change over time.
At our operating mines, we continue to record AROs based on disturbance of the environment over time. It is reasonably possible that circumstances could arise during or by the end of the mine life that will require material revisions to AROs. In particular, the extent of water treatment can have a material effect on the fair value of AROs, and the expected water quality at the end of the mine life, which is the primary driver of the extent of water treatment, can change significantly. We periodically prepare updated studies for our mines, following which it may be necessary to adjust the fair value of AROs. The period of time over which we have assumed that water quality monitoring and treatment will be required has a significant impact on AROs at closed mines. The amount of AROs recorded reflects the expected cost, taking into account the probability of particular scenarios. The difference between the upper end of the range of these assumptions and the lower end of the range can be significant, and consequently changes in these assumptions could have a material effect on the fair value of AROs and future earnings in a period of change.
AROs
($ millions) | | | | | |
As at December 31 | | 2010 | | 2009 | |
Operating mines | | $ | 1,186 | | $ | 958 | |
Closed mines | | 210 | | 208 | |
Development projects | | 95 | | 40 | |
Other | | 36 | | 24 | |
Total | | $ | 1,527 | | $ | 1,230 | |
Deferred Tax Assets and Liabilities
Measurement of Temporary Differences
We are periodically required to estimate the tax basis of assets and liabilities. Where applicable tax laws and regulations are either unclear or subject to varying interpretations, it is possible that changes in these estimates could occur that materially affect the amounts of deferred income tax assets and liabilities recorded in our consolidated financial statements. Changes in deferred tax assets and liabilities generally have a direct impact on earnings in the period of changes.
Valuation Allowances
Each period, we evaluate the likelihood of whether some portion or all of each deferred tax asset will not be realized. This evaluation is based on historic and future expected levels of taxable income, the pattern and timing of reversals of taxable temporary timing differences that give rise to deferred tax liabilities, and tax planning activities. Levels of future taxable income are affected by, among other things, market gold prices, and production costs, quantities of proven and probable gold and copper reserves, interest rates and foreign currency exchange rates. If we determine that it is more likely than not (a likelihood of more than 50%) that all or some portion of a deferred tax asset will not be realized, we record a valuation allowance against the amount we do not expect to realize. Changes in valuation allowances are recorded as a component of income tax expense or recovery for each period. The most significant recent trend impacting expected levels of future taxable income and the amount of valuation allowances, has been rising market gold prices. A continuation of a trend of higher gold prices could lead to the release of some of the valuation allowances recorded, with a corresponding effect on earnings in the period of release. Conversely, a decline in market gold prices could lead to an increase in valuation allowances and a corresponding increase in income tax expense.
In 2010, we released $129 million of valuation allowances primarily because sources of income became available that enabled tax losses and US Alternative Minimum Tax (“AMT”) credits to be realized.
77
Management’s Discussion and Analysis
Valuation Allowances
($ millions) | | | | | |
As at December 31 | | 2010 | | 2009 | |
Australia | | $ | 104 | | $ | 11 | |
Argentina | | 97 | | 119 | |
Barbados | | 73 | | 69 | |
Canada | | 52 | | 45 | |
Tanzania | | 30 | | 30 | |
Chile | | 20 | | 22 | |
United States | | 7 | | 136 | |
Other | | 42 | | 49 | |
Total | | $ | 425 | | $ | 481 | |
Chile, Argentina, Tanzania and Other: the valuation allowances relate to the full amount of tax assets in subsidiaries that do not have any present sources of gold production or taxable income. In the event that these subsidiaries have sources of taxable income in the future, we may release some or all of the valuation allowances.
Canada: most of the valuation allowances relate to tax pools which can only be utilized by income from specific sources.
Australia: most of the valuation allowances relate to capital losses that can only be utilized if any capital gains are realized.
Non-GAAP Financial Performance Measures(11)
Adjusted Net Income (Adjusted Net Income per Share) and Return on Equity
Adjusted net income is a non-GAAP financial measure which excludes the following from net income:
· Elimination of gold sales contracts;
· Non-recurring tax adjustments;
· Impairment charges related to goodwill, property, plant and equipment, and investments;
· Gains/losses on acquisitions/dispositions;
· Foreign currency translation gains/losses;
· Non-recurring restructuring costs; and
· Unrealized gains/losses on non-hedge derivative instruments
Management uses this measure internally to evaluate the underlying operating performance of the Company as a whole for the reporting periods presented, and to assist with the planning and forecasting of future operating results. We believe that adjusted net income allows investors and analysts to better evaluate the results of the underlying business of the Company. While the adjustments to net income in this measure include items that are recurring, management believes that adjusted net income is a useful measure of the Company’s performance because the elimination of gold sales contracts, non-recurring tax adjustments, impairment charges, gains/losses on asset acquisitions/dispositions and non-recurring restructuring charges do not reflect the underlying operating performance of our core mining business and are not necessarily indicative of future operating results. Furthermore, foreign currency translation gains/losses and unrealized gains/losses from non-hedge derivative contracts are not necessarily reflective of the underlying operating results for the reporting periods presented.
As noted, the Company uses this measure for its own internal purposes. Management’s internal budgets and forecasts and public guidance do not reflect potential impairment charges, potential gains/losses on the acquisition/disposition of assets, foreign currency translation gains/losses, or unrealized gains/losses on non-hedge derivative contracts. Consequently, the presentation of adjusted net income enables investors and analysts to better understand the underlying operating performance of our core mining business through the eyes of Management. Management periodically evaluates the components of adjusted net income based on an internal assessment of performance measures that are useful for evaluating the operating performance of our business segments and a review of the non-GAAP measures used by mining industry analysts and other mining companies.
We also present return on equity as a measure which is calculated by dividing adjusted net income by average shareholders’ equity. Management believes this to be a useful indicator of the Company’s performance.
Adjusted net income and return on equity are intended to provide additional information only and do not have any standardized meaning prescribed by US GAAP and should not be considered in isolation or as substitutes for measures of performance prepared in accordance with US GAAP. The measures are not necessarily indicative of operating profit or cash flow from operations as determined under US GAAP. Other companies may calculate these measures differently. The following table reconciles these non-GAAP measures to the most directly comparable US GAAP measure.
(11) The amounts presented in the non-GAAP financial performance measure tables include the results of discontinued operations.
78
Barrick Financial Report 2010 | Management’s Discussion and Analysis
Reconciliation of Net Income to Adjusted Net Income and Return on Equity(1)
| | | | | | | | For the three months | |
| | For the years ended December 31 | | ended December 31 | |
($ millions, except per share amounts in dollars) | | 2010 | | 2009 | | 2008 | | 2010 | | 2009 | |
Net income (loss) | | $ | 3,274 | | $ | (4,274 | ) | $ | 785 | | $ | 896 | | $ | 215 | |
Elimination of gold sales contracts | | — | | 5,901 | | — | | — | | 241 | |
Non-recurring tax adjustments | | (4 | ) | 59 | | — | | 74 | | 59 | |
Impairment charges related to intangibles, property, plant and equipment, and investments | | 5 | | 259 | | 899 | | — | | 102 | |
Gains on acquisitions/dispositions(2) | | (41 | ) | (85 | ) | (178 | ) | (10 | ) | (1 | ) |
Foreign currency translation (gains)/losses(3) | | 34 | | (95 | ) | 135 | | (11 | ) | (22 | ) |
Restructuring costs | | 43 | | 15 | | — | | 3 | | 6 | |
Unrealized (gains)/losses on non-hedge derivative instruments | | (32 | ) | 30 | | 20 | | (5 | ) | 4 | |
Adjusted net income | | $ | 3,279 | | $ | 1,810 | | $ | 1,661 | | $ | 947 | | $ | 604 | |
Net income per share(4) | | 3.32 | | (4.73 | ) | 0.90 | | 0.90 | | 0.22 | |
Adjusted net income per share(4) | | 3.32 | | 2.00 | | 1.90 | | $ | 0.95 | | $ | 0.61 | |
Average Shareholders’ Equity | | $ | 17,064 | | $ | 15,170 | | $ | 15,267 | | | | | |
Return on equity(5) | | 19 | % | 12 | % | 11 | % | | | | |
(1) Amounts presented in this table are post-tax.
(2) Includes gains recorded on the Cerro Casale acquisition of $29 million. Refer to page 36 of this MD&A for further information.
(3) Includes a currency translation gain of $70 million recorded in first quarter 2009 relating to Canadian deferred tax assets due to an election to adopt a US dollar functional currency for Canadian tax purposes.
(4) Calculated using weighted average number of shares outstanding under the basic method of earnings per share.
(5) Calculated as adjusted net income divided by average shareholders’ equity.
Adjusted Operating Cash Flow and Free Cash Flow
Adjusted operating cash flow is a non-GAAP financial measure which excludes the effect of elimination of gold sales contracts.
Management uses adjusted operating cash flow as a measure internally to evaluate the underlying operating cash flow performance of the Company as a whole for the reporting periods presented, and to assist with the planning and forecasting of future operating cash flow. The elimination of gold sales contracts is an activity that is not reflective of the underlying capacity of our operations to generate operating cash flow and therefore this adjustment will result in a more meaningful operating cash flow measure for investors and analysts to evaluate our performance in the period and assess our future operating cash flow generating capability.
We also present free cash flow as a measure which excludes capital expenditures from adjusted operating cash flow. Management believes this to be a useful indicator of the Company’s ability to operate without reliance on additional borrowing or usage of existing cash.
Adjusted operating cash flow and free cash flow are intended to provide additional information only and do not have any standardized meaning prescribed by US GAAP and should not be considered in isolation or as substitutes for measures of performance prepared in accordance with US GAAP. The measures are not necessarily indicative of operating profit or cash flow from operations as determined under US GAAP. Other companies may calculate these measures differently. The following table reconciles these non-GAAP measures to the most directly comparable US GAAP measures.
79
Management’s Discussion and Analysis
Reconciliation of Adjusted Operating Cash Flow and Free Cash Flow
| | | | | | | | For the three months | |
| | For the years ended December 31 | | ended December 31 | |
($ millions) | | 2010 | | 2009 | | 2008 | | 2010 | | 2009 | |
Operating cash flow | | $ | 4,127 | | $ | (2,322 | ) | $ | 2,254 | | $ | 781 | | $ | (4,300 | ) |
Elimination of gold sales contracts | | 656 | | 5,221 | | — | | 656 | | 5,221 | |
Adjusted operating cash flow | | $ | 4,783 | | $ | 2,899 | | $ | 2,254 | | $ | 1,437 | | $ | 921 | |
Capital expenditures | | (3,323 | ) | (2,358 | ) | (1,776 | ) | (1,145 | ) | (748 | ) |
Free Cash Flow | | $ | 1,460 | | $ | 541 | | $ | 478 | | $ | 292 | | $ | 173 | |
Total Cash Costs per ounce and Net Cash Costs per ounce
Total cash costs per ounce/pound and net cash costs per ounce are non-GAAP financial measures. Both measures include all costs absorbed into inventory, as well as royalties, by-product credits, and production taxes, and exclude inventory purchase accounting adjustments, unrealized gains/losses from non-hedge currency and commodity contracts, and amortization and accretion. These measures also include the gross margin generated by our Barrick Energy business unit, which was acquired to mitigate our exposure to oil prices as a credit against gold production costs. The presentation of these statistics in this manner allows us to monitor and manage those factors that impact production costs on a monthly basis. These measures are calculated by dividing the aggregate of the applicable costs by gold ounces or copper pounds sold. These measures are calculated on a consistent basis for the periods presented.
We have also adjusted our gold total cash costs to remove the impact of ore purchase agreements that have economic characteristics similar to a toll milling arrangement. The cost of producing these ounces is not indicative of our normal production costs. Hence, we have removed such costs from total cash costs.
We calculate total cash costs and net cash costs based on our equity interest in production from our mines. We believe that using an equity interest presentation is a fairer, more accurate way to measure economic performance than using a consolidated basis. For mines where we hold less than a 100% share in the production, we exclude the economic share of gold production attributable to the non-controlling interest. Consequently, our production and total cash costs and net cash costs statistics only reflect our equity share of production.
Net cash costs measures the gross margin from all non-gold sales, whether or not these non-gold metals are produced in conjunction with gold, as a credit against the cost of producing gold. A number of other gold producers present their costs net of the contribution from non-gold sales. We believe that including a measure of net cash costs per ounce on this basis provides investors and analysts with information with which to compare our performance to other gold producers, and to better assess the overall performance of our business. In addition, this measure provides information to enable investors and analysts to understand the importance of non-gold revenues to our cost structure.
Total cash cost and net cash cost statistics are intended to provide additional information only and do not have any standardized meaning prescribed by US GAAP and should not be considered in isolation or as a substitute for measures of performance prepared in accordance with US GAAP. The measures are not necessarily indicative of operating profit or cash flow from operations as determined under US GAAP. Other companies may calculate these measures differently. The following tables reconcile these non-GAAP measures to the most directly comparable US GAAP measure.
80
Barrick Financial Report 2010 | Management’s Discussion and Analysis
Reconciliation of Cost of Sales to Total Cash Costs per Ounce/Pound
($ millions, except per ounce/pound information in dollars) | | Gold | | Copper | |
For the years ended December 31 | | 2010 | | 2009 | | 2008 | | 2010 | | 2009 | | 2008 | |
Cost of sales | | $ | 3,789 | | $ | 3,407 | | $ | 3,377 | | $ | 345 | | $ | 361 | | $ | 315 | |
Cost of sales applicable to discontinued operations | | 10 | | 24 | | 49 | | 88 | | 83 | | 121 | |
Cost of sales applicable to non-controlling interests(1) | | (107 | ) | (12 | ) | (14 | ) | — | | — | | — | |
Cost of sales applicable to ore purchase arrangement | | (104 | ) | (29 | ) | — | | — | | — | | — | |
Inventory purchase accounting adjustments | | — | | — | | (16 | ) | — | | — | | — | |
Unrealized non-hedge gains/(losses) on currency and commodity contracts | | 5 | | 7 | | (14 | ) | — | | — | | — | |
Impact of Barrick Energy | | (56 | ) | (20 | ) | (14 | ) | — | | — | | — | |
Total cash costs | | $ | 3,537 | | $ | 3,377 | | $ | 3,368 | | $ | 433 | | $ | 444 | | $ | 436 | |
Ounces/pounds sold – consolidated basis (000s ounces/millions pounds) | | 7,963 | | 7,307 | | 7,658 | | 391 | | 380 | | 367 | |
Ounces/pounds sold – non-controlling interest (000s ounces)(1) | | (229 | ) | (28 | ) | (63 | ) | — | | — | | — | |
Ounces/pounds sold – equity basis (000s ounces/millions pounds) | | 7,734 | | 7,279 | | 7,595 | | 391 | | 380 | | 367 | |
Total cash costs per ounce/per pound | | $ | 457 | | $ | 464 | | $ | 443 | | $ | 1.11 | | $ | 1.17 | | $ | 1.19 | |
(1) Relates to ABG’s partner’s 30% interest in Tulawaka.
Net Cash Costs per Ounce
| | | | | | | | For the three months | |
| | For the years ended December 31 | | ended December 31 | |
($ millions, except per ounce/pound data in dollars) | | 2010 | | 2009 | | 2008 | | 2010 | | 2009 | |
Ounces gold sold – equity basis (000s) | | 7,734 | | 7,279 | | 7,595 | | 1,825 | | 1,797 | |
Total cash costs per ounce – equity basis | | $ | 457 | | $ | 464 | | $ | 443 | | $ | 486 | | $ | 465 | |
Revenues from copper sales | | $ | 1,102 | | $ | 943 | | $ | 1,007 | | $ | 333 | | $ | 398 | |
Revenues from copper sales of discontinued operations | | 244 | | 212 | | 221 | | 74 | | — | |
Unrealized non-hedge gold/copper derivative (gains) losses | | (14 | ) | 49 | | (23 | ) | 2 | | 13 | |
Unrealized mark-to-market provisional price adjustments | | — | | (4 | ) | 38 | | — | | (4 | ) |
Net revenues from copper excluding unrealized non-hedge gains/losses from copper contracts | | $ | 1,332 | | $ | 1,200 | | $ | 1,243 | | $ | 409 | | $ | 407 | |
Copper cost of sales per consolidated statement of income | | 345 | | 361 | | 315 | | 93 | | 128 | |
Copper cost of sales from discontinued operations | | 88 | | 83 | | 121 | | 23 | | — | |
Copper credits | | 899 | | 756 | | 807 | | 293 | | 279 | |
Copper credits per ounce | | 116 | | 104 | | 106 | | 160 | | 155 | |
Net cash costs per ounce | | $ | 341 | | $ | 360 | | $ | 337 | | $ | 326 | | $ | 310 | |
EBITDA and Adjusted EBITDA
EBITDA is a non-GAAP financial measure, which excludes the following from net income:
· Income tax expense;
· Interest expense;
· Interest income; and
· Depreciation and amortization.
Management believes that EBITDA is a valuable indicator of the Company’s ability to generate liquidity by producing operating cash flow to: fund working capital needs, service debt obligations, and fund capital expenditures. Management uses EBITDA for this purpose. EBITDA is also frequently used by investors and analysts for valuation purposes whereby EBITDA is multiplied by a factor or “EBITDA multiple” that is based on observed or inferred relationship between EBITDA and market values to determine the approximate total enterprise value of a company.
81
Management’s Discussion and Analysis
EBITDA is intended to provide additional information to investors and analysts, does not have any standardized meaning prescribed by US GAAP and should not be considered in isolation or as a substitute for measures of performance prepared in accordance with US GAAP. EBITDA excludes the impact of cash costs of financing activities and taxes, and the effects of changes in operating working capital balances, and therefore is not necessarily indicative of operating profit or cash flow from operations as determined under US GAAP. Other companies may calculate EBITDA differently.
We also present adjusted EBITDA as a non-GAAP measure, which removes the effect of the elimination of gold sales contracts. The elimination of gold sales contracts is an activity that is not reflective of the underlying capacity of our operations to generate earnings and therefore this adjustment will result in a more meaningful earnings measure for investors and analysts to evaluate our performance in the period and assess our future earnings generating capability.
The following table provides a reconciliation of EBITDA and adjusted EBITDA to net income.
Reconciliation of Net Income to EBITDA and Adjusted EBITDA
| | | | | | | | For the three months | |
| | For the years ended December 31 | | ended December 31 | |
($ millions, except per share amounts in dollars) | | 2010 | | 2009 | | 2008 | | 2010 | | 2009 | |
Net income | | $ | 3,274 | | $ | (4,274 | ) | $ | 785 | | $ | 896 | | $ | 215 | |
Income tax expense | | 1,370 | | 648 | | 594 | | 472 | | 295 | |
Interest expense | | 121 | | 57 | | 21 | | 6 | | 29 | |
Interest income | | (14 | ) | (10 | ) | (39 | ) | (3 | ) | (3 | ) |
Depreciation and amortization | | 1,149 | | 1,016 | | 912 | | 264 | | 258 | |
EBITDA | | $ | 5,900 | | $ | (2,563 | ) | $ | 2,273 | | $ | 1,635 | | $ | 794 | |
Elimination of gold sales contracts | | — | | 5,933 | | — | | — | | 241 | |
Adjusted EBITDA | | $ | 5,900 | | $ | 3,370 | | $ | 2,273 | | $ | 1,635 | | $ | 1,035 | |
Reported as: | | | | | | | | | | | |
Gold | | | | | | | | | | | |
North America | | $ | 2,114 | | $ | 1,259 | | $ | 972 | | $ | 588 | | $ | 317 | |
South America | | 1,914 | | 1,245 | | 1,194 | | 441 | | 428 | |
Australia Pacific | | 1,027 | | 597 | | 507 | | 312 | | 174 | |
African Barrick Gold | | 345 | | 236 | | 157 | | 110 | | 59 | |
Copper | | | | | | | | | | | |
South America | | 732 | | 564 | | 673 | | 231 | | 210 | |
Australia Pacific | | 104 | | 82 | | (35 | ) | 35 | | 33 | |
Capital Projects | | (88 | ) | (106 | ) | (176 | ) | (32 | ) | (16 | ) |
Barrick Energy | | 45 | | 9 | | 12 | | 15 | | 5 | |
Other | | (293 | ) | (6,449 | ) | (1,031 | ) | (65 | ) | (416 | ) |
EBITDA | | $ | 5,900 | | $ | (2,563 | ) | $ | 2,273 | | $ | 1,635 | | $ | 794 | |
Elimination of gold sales contracts | | — | | 5,933 | | — | | — | | 241 | |
Adjusted EBITDA | | $ | 5,900 | | $ | 3,370 | | $ | 2,273 | | $ | 1,635 | | $ | 1,035 | |
82
Barrick Financial Report 2010 | Management’s Discussion and Analysis
Realized Prices
Realized price is a non-GAAP financial measure which excludes from sales:
· Unrealized gains and losses on non-hedge derivative contracts;
· Unrealized mark-to-market gains and losses on provisional pricing from copper and gold sales contracts;
· Sales attributable to ore purchase arrangement; and
· Export duties.
This measure is intended to enable management to better understand the price realized in each reporting period for gold and copper sales because unrealized mark-to-market value of non-hedge gold and copper derivatives and unrealized mark-to-market gains and losses on outstanding receivables from copper and gold sales contracts are subject to change each period due to changes in market factors such as market and forward gold and copper prices so that prices ultimately realized may differ from those recorded. The exclusion of such unrealized mark-to-market gains and losses from the presentation of this performance measure enables investors to understand performance based on the realized proceeds of selling gold and copper production.
The gains and losses on non-hedge derivatives and receivable balances relate to instruments/balances that mature in future periods, at which time the gains and losses will become realized. The amounts of these gains and losses reflect fair values based on market valuation assumptions at the end of each period and do not necessarily represent the amounts that will become realized on maturity. We also exclude export duties that are paid upon sale and netted against revenues. We believe this provides investors and analysts with a more accurate measure with which to compare to market gold prices and to assess our gold sales performance. For those reasons, management believes that this measure provides a more accurate reflection of the Company’s past performance and is a better indicator of its expected performance in future periods.
The realized price measure is intended to provide additional information, and does not have any standardized meaning prescribed by US GAAP and should not be considered in isolation or as a substitute for measures of performance prepared in accordance with US GAAP. The measure is not necessarily indicative of sales as determined under US GAAP. Other companies may calculate this measure differently. The following table reconciles realized prices to the most directly comparable US GAAP measure.
Reconciliation of Sales to Realized Price per Ounce/per Pound
($ millions, except per ounce/pound information in dollars) | | Gold | | Copper | |
For the years ended December 31 | | 2010 | | 2009 | | 2008 | | 2010 | | 2009 | | 2008 | |
Sales | | $ | 9,699 | | $ | 7,135 | | $ | 6,577 | | $ | 1,102 | | $ | 943 | | $ | 1,007 | |
Sales applicable to discontinued operations | | 43 | | 56 | | 79 | | 244 | | 212 | | 221 | |
Sales applicable to non-controlling interests | | (204 | ) | (27 | ) | (56 | ) | — | | — | | — | |
Sales attributable to ore purchase agreement | | (111 | ) | (26 | ) | — | | — | | — | | — | |
Unrealized non-hedge gold/copper derivative (gains) losses | | — | | — | | 2 | | (14 | ) | 49 | | (23 | ) |
Unrealized mark-to-market provisional price adjustments | | (1 | ) | — | | (1 | ) | — | | (4 | ) | 38 | |
Export duties | | 68 | | 30 | | 23 | | — | | — | | — | |
Sales – as adjusted | | $ | 9,494 | | $ | 7,168 | | $ | 6,624 | | $ | 1,332 | | $ | 1,200 | | $ | 1,243 | |
Ounces/pounds sold (000s ounces/millions pounds) | | 7,734 | | 7,279 | | 7,595 | | 391 | | 380 | | 367 | |
Realized gold/copper price per ounce/pound | | $ | 1,228 | | $ | 985 | | $ | 872 | | $ | 3.41 | | $ | 3.16 | | $ | 3.39 | |
83
Management’s Discussion and Analysis
Net Cash Margin
Management uses a non-GAAP financial measure, net cash margin, which represents realized price per ounce less net cash costs per ounce. This measure is used by management to analyze profitability trends and to assess the cash-generating capability from the sale of gold on a consolidated basis in each reporting period, expressed on a unit basis. We believe that it illustrates the performance of our business on a consolidated basis and enables investors to better understand our performance in comparison to other gold producers who present results on a similar basis and is an important indicator of expected performance in future periods.
Our net cash margin is intended to provide additional information, does not have any standardized meaning prescribed by US GAAP and should not be considered in isolation or as a substitute for measures of performance prepared in accordance with US GAAP. This measure is not necessarily indicative of operating profit or cash flow from operations as determined under US GAAP. Other companies may calculate cash margin differently. The following table derives this non-GAAP measure from previously defined non-GAAP measures of realized gold price per ounce, total cash costs per ounce, and copper credit per ounce, as determined in the net cash cost reconciliation. Net cash margin could also be derived from realized price per ounce and net cash costs per ounce.
Reconciliation of Net Cash Margin per Ounce
| | | | | | | | For the three months | |
| | For the years ended December 31 | | ended December 31 | |
(per ounce data in dollars) | | 2010 | | 2009 | | 2008 | | 2010 | | 2009 | |
Realized gold price per ounce | | $ | 1,228 | | $ | 985 | | $ | 872 | | $ | 1,368 | | $ | 1,119 | |
Total cash costs per ounce | | 457 | | 464 | | 443 | | 486 | | 465 | |
Total cash margin per ounce | | $ | 771 | | $ | 521 | | $ | 429 | | $ | 882 | | $ | 654 | |
Copper credit per ounce(1) | | 116 | | 104 | | 106 | | 160 | | 155 | |
Net cash margin per ounce | | $ | 887 | | $ | 625 | | $ | 535 | | $ | 1,042 | | $ | 809 | |
(1) Copper credit per ounce is calculated as the margin from copper sales divided by gold ounces sold. Refer to the calculation in the net cash costs reconciliation on page 81.
Adjusted Debt and Net Debt
Management uses non-GAAP financial measures “adjusted debt” and “net debt” since they are more indicative of how we manage our debt levels internally than the US GAAP measure. We believe these measures provide a meaningful measure for investors and analysts to evaluate our overall debt capacity, liquidity and capital structure. Adjusted debt and net debt are intended to provide additional information, do not have any standardized meaning prescribed by US GAAP and should not be considered in isolation or as a substitute for measures of performance prepared in accordance with US GAAP.
We have adjusted our long-term debt to exclude fair value on other adjustments and our partner’s share of project financing and to include the remaining settlement obligation to close out the gold sales contracts to arrive at adjusted debt. We have excluded the impact of fair value and other adjustments in order to reflect the actual settlement obligation in relation to the debt instrument. We have excluded our partner’s share of project financing, where Barrick has provided a guarantee only for its proportionate share of the debt. We have included the settlement obligation related to gold sales contracts because they have terms similar to long-term debt instruments and have been settled in cash. We then deduct our cash and equivalents (net of our partner’s share of cash held at Pueblo Viejo) to arrive at net debt.
84
Barrick Financial Report 2010 | Management’s Discussion and Analysis
Adjusted Debt and Net Debt Summary
As at December 31 | | | | | |
(in $ millions) | | 2010 | | 2009 | |
Debt per financial statements | | $ | 6,692 | | $ | 6,335 | |
Fair value and other adjustments(1) | | 13 | | (71 | ) |
Pueblo Viejo financing partner’s share(2) | | (313 | ) | — | |
Settlement obligation to close out gold sales contracts(3) | | — | | 655 | |
Adjusted debt | | $ | 6,392 | | $ | 6,919 | |
Cash and equivalents | | (3,968 | ) | (2,564 | ) |
Cash and equivalents – partner’s share at Pueblo Viejo(2) | | 118 | | — | |
Net debt | | $ | 2,542 | | $ | 4,355 | |
(1) Other adjustments primarily relate to issue costs which have been netted against the debts.
(2) We consolidate 100% of Pueblo Viejo in our financial statements; however we have guaranteed only our 60% share of the $782 million financing received to this point. Therefore, we have removed our partner’s share of both the financing and cash and equivalents to ensure comparability.
(3) Based on the final settlement value of these contracts.
International Financial Reporting Standards (IFRS)
We are in the process of converting our basis of accounting from US GAAP to IFRS effective for our first quarter report in 2011. The transition date of January 1, 2010 requires the conversion, for comparative purposes, of our previously reported balance sheets as at December 31, 2009 and December 31, 2010 and our interim and annual consolidated statements of income and cash flows for 2010 from US GAAP to IFRS.
In this MD&A, we are providing an update on our conversion project; a preliminary consolidated balance sheet as at January 1, 2010 prepared under IFRS with reconciliations to our December 31, 2009 unaudited balance sheet prepared in accordance with US GAAP; a summary of the IFRS 1, First-time Adoption of International Financial Reporting Standards, (IFRS 1) elections we expect to apply on our transition to IFRS; a preliminary impact assessment of the IFRS conversion on our operating results for the year ended December 31, 2010; and a summary of our IFRS policies where there are significant changes from our US GAAP policies. IFRS accounting standards, and the interpretation thereof, are constantly evolving; accordingly, there may be additional new or revised IFRS accounting standards prior to the issuance of our first IFRS financial statements that could affect the opening IFRS balance sheet, 2010 operating results and related policies presented herein.
IFRS Project Update
The following chart provides an update of the key activities contained in our conversion plan, the estimated completion date for each of these activities as well as a current status update. The following information will allow investors and others to obtain a better understanding of our IFRS conversion plan and its impacts on the Company.
85
Management’s Discussion and Analysis
Key Activities | | Timing | | Current Status |
Financial Statement Preparation: · Analyze and select ongoing policies where alternatives are permitted including IFRS 1 exemptions · Quantify key differences between IFRS and the Company’s application of US GAAP · Revise Accounting Policy Manual · Prepare IFRS consolidated financial statements including first-time adoption reconciliations | | · Revised Accounting Policy Manual in place by January 1, 2011 · Quantification of impact of key differences on opening balance sheet to be completed in draft in Q2 2010 · Quantification of impact of key differences on Q1 and Q2 to be completed in draft in Q3 2010; Q3 to be completed in draft in Q4 2010; Q4 to be completed in draft in Q1 2011 · Skeleton IFRS consolidated financial statements to be prepared for senior management review in Q3 2010 · Audit Committee review of the skeleton consolidated financial statements in Q4 2010 | | · Finalization of key accounting policy differences completed in Q4 2009 · Senior management approval and Audit Committee review of accounting/policy changes and IFRS 1 elections completed in Q4 2009 · Development of IFRS Accounting Policy Manual completed · Quantification of preliminary opening balance sheet completed in Q3 2010 · Quantification of impact of key differences on Q1, Q2, Q3 and Q4 completed in draft · Development and review of preliminary Q1 skeleton consolidated financial statements completed in Q4 2010 |
Training: · Provide technical training to key finance and accounting personnel in each of our RBUs | | · Ongoing training to key personnel as needed | | · Technical training provided to key personnel in each of our RBUs and Corporate in Q4 2009 |
· Provide specialized training to selected employees involved with the conversion to IFRS | | | | · Specific and refresher training provided to selected groups throughout 2010 |
Business Activities: · Identify conversion impacts on financial covenants, executive compensation and contracts · Assess impact on budgeting and long-range plans · Identify impact on taxation | | · Financial covenant, executive compensation and contract analysis to be completed by Q4 2010 · Budgeting and long-range planning impact to be completed by Q4 2010 · Taxation analysis to be completed in Q2 2010 | | · Financial covenant and contract analysis completed · Budgeting and long-range planning completed in Q4 2010 and Q1 2011 · Identification of potential significant taxation differences completed in Q2 2010 with final assessments completed in Q3 2010 |
Financial Information Systems: | | · Solution for capturing financial information under US GAAP and IFRS in Q1 2010 · Necessary changes to financial information systems implemented by transition date | | · IFRS reporting application has been implemented to enable the capturing of consolidated financial information under both US GAAP and IFRS · Necessary changes to general ledger and financial information systems are complete and regularly updated |
· Identify required changes to financial information systems and implement solutions · Determine and implement solution for capturing financial information under US GAAP and IFRS in 2010 (for comparative information) | |
Control Environment: · Maintain effective Disclosure Controls & Procedures (DC&P) and Internal Control over Financial Reporting (ICFR) throughout the IFRS project · Design and implement new IFRS processes and controls | | · Incremental controls to be developed in Q2 2010 for the review of IFRS comparative financial information · Redesigned processes and controls to be in place by Q1 2011 | | · Completed an impact assessment of IFRS technical accounting differences on financial reporting risks, procedures, systems and controls · Incremental controls implemented for development of Opening Balance Sheet and 2010 comparative financial information · Completed an impact assessment of 2011 steady state processes and controls · Amendments to specific business processes and controls are being finalized during Q1 2011 |
Preliminary IFRS Consolidated Opening Balance Sheet
In third quarter of 2010, we completed our preliminary opening consolidated IFRS balance sheet as at January 1, 2010. Our preliminary opening consolidated IFRS balance sheet reflects the impact of the applicable IFRS 1 elections that we expect to apply on transition to IFRS. The opening consolidated IFRS balance sheet also reflects the impact of accounting policy differences arising from the transition
86
Barrick Financial Report 2010 | Management’s Discussion and Analysis
from US GAAP to IFRS. The opening consolidated IFRS balance sheet presented in this MD&A is preliminary and the final opening consolidated IFRS balance sheet may reflect adjustments relating to any new IFRS pronouncements or other adjustments identified through fiscal year 2011.
Reconciliation of Consolidated Balance Sheets as Reported Under US GAAP and IFRS
| | | | As at December 31, | | | | As at January 1, | |
(Unaudited) | | | | 2009 | | Effect of | | 2010 | |
(millions of US $) | | Ref | | US GAAP basis | | conversion to IFRS | | IFRS basis | |
Assets | | | | | | | | | |
Current assets | | | | | | | | | |
Cash and equivalents | | | | $ | 2,564 | | $ | — | | $ | 2,564 | |
Accounts receivable | | | | 251 | | 8 | | 259 | |
Inventories | | A | | 1,540 | | (52 | ) | 1,488 | |
Other current assets | | | | 524 | | (6 | ) | 518 | |
Assets held for sale | | | | 59 | | 41 | | 100 | |
| | | | 4,938 | | (9 | ) | 4,929 | |
Non-current assets | | | | | | | | | |
Equity in investees | | B | | 1,136 | | (12 | ) | 1,124 | |
Other investments | | | | 92 | | — | | 92 | |
Property, plant and equipment | | C | | 13,125 | | 254 | | 13,379 | |
Goodwill | | | | 5,197 | | — | | 5,197 | |
Intangible assets | | C | (2) | 66 | | 209 | | 275 | |
Deferred income tax assets | | D | | 949 | | (348 | ) | 601 | |
Other assets | | E | | 1,531 | | (203 | ) | 1,328 | |
Assets of discontinued operations | | | | 41 | | (41 | ) | — | |
Total assets | | | | $ | 27,075 | | $ | (150 | ) | $ | 26,925 | |
Liabilities and Equity | | | | | | | | | |
Current liabilities | | | | | | | | | |
Accounts payable | | | | $ | 1,221 | | $ | — | | $ | 1,221 | |
Short-term debt | | | | 54 | | — | | 54 | |
Current income tax liabilities | | | | 93 | | — | | 93 | |
Other current liabilities | | | | 382 | | (16 | ) | 366 | |
Liabilities held for sale | | | | 23 | | 26 | | 49 | |
| | | | 1,773 | | 10 | | 1,783 | |
Non-current liabilities | | | | | | | | | |
Long-term debt | | F | | 6,281 | | (157 | ) | 6,124 | |
Provisions | | G | | 1,122 | | 286 | | 1,408 | |
Deferred income tax liabilities | | D | | 1,184 | | (224 | ) | 960 | |
Other liabilities | | G | | 1,145 | | (261 | ) | 884 | |
Liabilities of discontinued operations | | | | 23 | | (23 | ) | — | |
Total liabilities | | | | 11,528 | | (369 | ) | 11,159 | |
Equity | | | | | | | | | |
Capital stock | | | | 17,390 | | 2 | | 17,392 | |
Convertible borrowings — equity component | | F | | — | | 143 | | 143 | |
Retained earnings | | J | | (2,382 | ) | (142 | ) | (2,524 | ) |
Accumulated other comprehensive income (“AOCI”) | | H | | 55 | | 178 | | 233 | |
Total equity attributable to Barrick Gold Corporation shareholders | | | | 15,063 | | 181 | | 15,244 | |
Non-controlling interests | | I | | 484 | | 38 | | 522 | |
Total equity | | | | 15,547 | | 219 | | 15,766 | |
Total liabilities and equity | | | | $ | 27,075 | | $ | (150 | ) | $ | 26,925 | |
87
Management’s Discussion and Analysis
References
A. Inventories
(millions of US $) | | Incr./(Decr.) | |
Capitalization of production phase stripping(1) | | $ | (142 | ) |
Other adjustments | | 3 | |
| | $ | (139 | ) |
Short-term inventories | | $ | (52 | ) |
Long-term inventories (included in other assets) | | (87 | ) |
| | $ | (139 | ) |
(1) Refer to footnote C1.
B. Equity In Investees
(millions of US $) | | Incr./(Decr.) | |
Reversal of Highland Gold impairment | | $ | 55 | |
Elimination of interest capitalized on equity investees(1) | | (125 | ) |
Capitalization of exploration and evaluation costs within equity investees | | 22 | |
Reclassification of hedge losses relating to capital expenditures within equity investees | | 36 | |
| | $ | (12 | ) |
(1) Under IFRS, our investment in equity investees, where the activities are development of mining projects, are not qualifying assets that are eligible for interest capitalization.
C. Property, Plant and Equipment
(millions of US $) | | Incr./(Decr.) | |
Capitalization of production phase stripping (net of accumulated depreciation of $275 million)(1) | | $ | 560 | |
Reclassification of acquired exploration properties to intangible assets(2) | | (209 | ) |
Capitalization of exploration and evaluation costs(3) | | 188 | |
Adjustment due to deemed cost election for oil & gas properties(4) | | (166 | ) |
Reclassification of hedge gains relating to capital expenditures from AOCI(5) | | (56 | ) |
Adjustments to asset retirement costs | | (41 | ) |
Other adjustments | | (22 | ) |
| | $ | 254 | |
(1) Under IFRS, certain waste stripping costs qualify for capitalization, which were previously expensed under US GAAP. Refer to page 94 for an explanation of the policy under IFRS.
(2) Under IFRS, acquired exploration properties meet the definition of an intangible asset and consequently were reclassified.
(3) Under IFRS, the criteria to determine costs that qualify for capitalization differ from US GAAP. Refer to page 93 for an explanation of the policy under IFRS.
(4) Under IFRS 1 exemptions, we elected to take fair value as deemed cost for certain properties. For our oil and gas properties this election resulted in an adjustment to the carrying value of some assets. Refer to page 89 for an explanation of the IFRS 1 exemptions.
(5) Under IFRS, accumulated hedge gains relating to capital expenditures are presented as a reduction of the cost of the asset.
D. Deferred Income Taxes
The adjustments to deferred income tax assets and liabilities principally reflect the tax effects of other IFRS adjustments.
E. Other Assets
(millions of US $) | | Incr./(Decr.) | |
Reclassification of debt issue costs(1) | | $ | (45 | ) |
Long-term inventory adjustments (refer to A) | | (87 | ) |
Adjustments relating to restricted stock units(2) | | (68 | ) |
Other adjustments | | (3 | ) |
| | $ | (203 | ) |
(1) Under IFRS, direct and incremental costs incurred to issue debt securities are recorded as a reduction in the carrying amount of the related debt instrument and are unwound as a finance cost over the term of the debt.
(2) Under IFRS, for restricted stock units, the long-term asset and corresponding liability are not recognized and were therefore reversed.
F. Long-Term Debt
(millions of US $) | | Incr./(Decr.) | |
Bifurcation of equity portion of senior convertible debt(1) | | $ | (143 | ) |
Reclassification of debt issue costs | | (45 | ) |
Reversal to retained earnings of previously amortized debt premium | | 31 | |
| | $ | (157 | ) |
(1) Under IFRS, the convertible debt instruments were bifurcated, and the debt and equity portions were separately recognized.
G. Provisions
(millions of US $) | | Incr./(Decr.) | |
Reclassification of employee benefits and stock-based compensation from other liabilities | | $ | 261 | |
Adjustments to Provisions for Environmental Rehabilitation (PER) relating to discount rates and foreign exchange rates | | 73 | |
Recognition of constructive obligations under IFRS | | 39 | |
De-recognition of a provision that does not meet IFRS recognition criteria | | (30 | ) |
Adjustments to account for restricted stock units | | (68 | ) |
Other adjustments | | 11 | |
| | $ | 286 | |
H. AOCI
(millions of US $) | | Incr./(Decr.) | |
Reset of cumulative translation losses(1) | | $ | 141 | |
Reset of actuarial losses relating to pension plans(1) | | 37 | |
Reclassifications of accumulated hedge gains relating to capital expenditures | | (20 | ) |
Adjustments to hedge accounting to exclude the time value of options | | 33 | |
Other adjustments | | (13 | ) |
| | $ | 178 | |
(1) Under IFRS 1 exemptions we chose to reset the balance within AOCI relating to cumulative translation losses and actuarial losses on pension plans. Refer to page 89 for an explanation of the IFRS 1 exemptions.
I. Non-Controlling Interests
The impact on non-controlling interests of capitalization of exploration and evaluation costs was an increase of $38 million, principally relating to Pueblo Viejo.
88
Barrick Financial Report 2010 | Management’s Discussion and Analysis
J. Retained Earnings Reconciliation
(millions of US $) | | | |
As at January 1, 2010 | | | |
US GAAP, as reported | | $ | (2,382 | ) |
IFRS 1 Exemptions | | | |
Reset of actuarial gains and losses relating to pension plans | | (37 | ) |
Reset of cumulative translation account | | (141 | ) |
IFRS Policy choices | | | |
Capitalized production phase stripping | | 408 | |
Capitalized exploration & evaluation costs | | 160 | |
Reversal of Highland Gold impairment | | 55 | |
Adjustment due to deemed cost election for oil & gas properties | | (166 | ) |
Elimination of capitalized interest on equity investees | | (125 | ) |
Increase in PERs(1) | | (69 | ) |
Decrease in asset relating to the rehabilitation provision(2) | | (32 | ) |
Bifurcation of senior convertible debt | | (31 | ) |
Adjustments to hedge accounting to exclude time value of options | | (33 | ) |
Tax effect of adjustments, net | | (108 | ) |
Other adjustments | | (23 | ) |
IFRS basis | | $ | (2,524 | ) |
(1) Under IFRS, increase in PERS resulted from changes due to using current vs. historical discount and foreign exchange rates, and changes in cash flows due to additional constructive obligations.
(2) Calculated using the IFRS 1 simplified approach (see (iii) on page 89).
Elected IFRS 1 Exemptions from Full Retrospective Application
Our transition to IFRS follows IFRS 1, which offers the possibility to utilize certain exemptions from full retrospective implementation of IFRS. We evaluated the options available in IFRS 1 and elected to adopt transitional implementation policies in the areas of business combinations, employee benefits, rehabilitation provisions, cumulative translation differences and fair value as a deemed cost election.
A summary of these transitional accounting policies is given below.
i) Business Combinations
We elected to utilize the option in IFRS 1 to not apply IFRS 3 retrospectively to business combinations completed prior to January 1, 2010. The impact of this policy decision is that all prior business combinations will continue to be accounted for as they originally were under US GAAP, including recognition of any goodwill identified in these transactions.
ii) Employee Future Benefits
IFRS 1 allows for all cumulative actuarial gains and losses at the date of transition to be reset to zero within AOCI as of the date of transition as an alternative to full retrospective application of IAS 19 Employee Benefits. We chose to adopt this transition policy.
iii) Rehabilitation Provision
Under IFRS, when a rehabilitation provision is established, we are required to set up a corresponding asset and depreciate it over the remaining useful life of the asset. Any changes in the rehabilitation provision are added or deducted from the cost of the asset to which the obligation relates. Under IFRS 1, we elected to take a simplified approach to calculate and record the asset related to the rehabilitation provision on our opening IFRS consolidated balance sheet. As permitted under IFRS, the rehabilitation provision calculated on the transition date in accordance with IAS 37 is discounted back to the date when the provision first arose, at which date the corresponding asset is set up. This asset is then depreciated to its carrying amount at the transition date.
iv) Cumulative Translation Differences
We elected to utilize the option under IFRS 1 to reset the cumulative translation account within AOCI to zero as of the date of transition to IFRS as an alternative to establishing a retrospective cumulative translation difference under the principles of IAS 21.
v) Fair Value as Deemed Cost
IFRS 1 provides the option to record certain assets at fair value on transition or at an earlier date as an alternate to full retrospective application of IFRS in accounting for the asset. The option is available on an individual asset by asset basis. We chose to adopt this transition election on selected assets at the following properties: Pascua-Lama, Goldstrike, Plutonic, Marigold, Pierina, Osborne and Barrick Energy.
89
Management’s Discussion and Analysis
Preliminary Impact of the IFRS Conversion on our Statement of Income for the year ended December 31, 2010
During 2010 and in the first quarter of 2011, we continued to perform preliminary calculations of the quantitative differences arising from our conversion from US GAAP to IFRS on the operating results for the year ended December 31, 2010. Presented in the tables below are the preliminary impacts identified to date of our conversion to IFRS on our consolidated statement of income for the year ended December 31, 2010. The actual impact of our conversion to IFRS is subject to management’s final review as well as audit by the Company’s independent registered accounting firm and may vary significantly from the preliminary impacts identified below because of a number of factors including without limitation, additional or revised information and changes in accounting standards or policies or in how these standards are applied.
| | | | For the year ended December 31, 2010 | |
| | | | US GAAP | | Effect of IFRS | | | |
(Unaudited) | | | | measurement | | measurement | | | |
(millions of US $) | | Ref | | basis(1) | | differences | | IFRS basis | |
Sales | | K | | $ | 10,991 | | $ | 14 | | $ | 11,005 | |
Costs and expenses | | | | | | | | | |
Cost of sales | | L | | 5,390 | | (228 | ) | 5,162 | |
Corporate administration | | | | 154 | | 3 | | 157 | |
Exploration and evaluation | | M | | 333 | | (104 | ) | 229 | |
Other expense | | N | | 459 | | 14 | | 473 | |
Impairment charges (reversals) | | O | | 7 | | (80 | ) | (73 | ) |
| | | | 6,343 | | (395 | ) | 5,948 | |
Other income | | P | | 100 | | 42 | | 142 | |
Income (loss) from equity investees | | Q | | (41 | ) | 18 | | (23 | ) |
Gain (loss) on non-hedge derivatives | | R | | 103 | | (38 | ) | 65 | |
Income before finance items and income taxes | | | | 4,810 | | 431 | | 5,241 | |
Finance items | | | | | | | | | |
Finance income | | | | 14 | | — | | 14 | |
Finance costs | | S | | (168 | ) | 10 | | (158 | ) |
Income before income taxes | | | | 4,656 | | 441 | | 5,097 | |
Income tax expense | | TBD | (2) | (1,480 | ) | TBD | | TBD | |
Income from continuing operations | | | | 3,176 | | TBD | | TBD | |
Income from discontinued operations | | | | 121 | | — | | 121 | |
Net income(3) | | | | $ | 3,297 | | $ | TBD | | $ | TBD | |
Attributable to: | | | | | | | | | |
Equity holders of Barrick Gold Corporation | | | | $ | 3,274 | | $ | TBD | | $ | TBD | |
Non-controlling interests | | | | $ | 23 | | $ | TBD | | $ | TBD | |
(1) Certain US GAAP figures have been reclassified to conform to our expected IFRS financial statement presentation.
(2) TBD = to be determined.
(3) Net income under IFRS has not been presented since final assessment of differences has not been completed.
90
Barrick Financial Report 2010 | Management’s Discussion and Analysis
References
K. Sales
| | For the year ended | |
(millions of US $) | | Dec. 31, 2010 | |
US GAAP, as reported | | $ | 10,924 | |
By-product revenue reclassified from cost of sales(1) | | 131 | |
Gain on non-hedge derivatives(2) | | (64 | ) |
US GAAP, as adjusted for IFRS format | | 10,991 | |
Revenue recognition(3) | | 14 | |
IFRS basis | | $ | 11,005 | |
(1) Recognition of incidental by-product sales previously recorded as a credit to costs of sales will be presented as part of sales commencing January 1, 2010.
(2) Under IFRS, all realized and unrealized non-hedge derivative gains or losses, hedge ineffectiveness and amounts not qualifying for hedge accounting are presented as a separate line on the consolidated income statement. Under US GAAP these amounts were presented in the respective income statement line item to which the gain or loss is related.
(3) Sales increased on transition due to earlier recognition of revenue for our concentrate sales at Bulyanhulu mine. Under IFRS, revenue is recognized on transfer of risk and rewards as compared to recognition on transfer of title under US GAAP.
L. Cost of Sales
| | For the year ended | |
(millions of US $) | | Dec. 31, 2010 | |
US GAAP cost of sales, as reported | | $ | 4,201 | |
US GAAP amortization and accretion, as reported | | 1,196 | |
By-product revenue reclassified from cost of sales(1) | | 131 | |
Reclassification of certain royalty payments to income tax(2) | | (101 | ) |
Reclassification of accretion expense to finance costs(3) | | (47 | ) |
Gain on non-hedge derivatives(4) | | 10 | |
US GAAP, as adjusted for IFRS format | | 5,390 | |
Capitalization of production phase stripping(5) | | (292 | ) |
Depreciation expense(6) | | 63 | |
Other adjustments | | 1 | |
IFRS basis | | $ | 5,162 | |
IFRS cost of sales applicable to: | | | |
Gold | | $ | 4,566 | |
Copper | | 430 | |
Oil & Gas | | 115 | |
Others | | 51 | |
Total | | $ | 5,162 | |
(1) Refer to footnote K1.
(2) Under IFRS, certain payments that are made to government bodies and are calculated based on net profit are classified as taxes. We reclassified the following to income tax expense: Nevada Net Proceeds Tax and Cowal royalty.
(3) For IFRS purposes, accretion expense is presented as part of “Finance Costs”.
(4) Refer to footnote K2.
(5) Costs of sales were lower primarily due to capitalized production phase stripping costs.
(6) Depreciation expense increased under IFRS due to higher book values resulting from capitalization of production phase stripping costs and exploration and evaluation costs, and the impact of the calculation on the asset related to the environmental rehabilitation provisions under IFRS 1 for opening balance sheet as at January 1, 2010.
M. Exploration and Evaluation
| | For the year ended | |
(millions of US $) | | Dec. 31, 2010 | |
US GAAP Exploration, as reported | | $ | 180 | |
US GAAP Project Development Costs, as reported | | 153 | |
US GAAP, as adjusted for IFRS format(1) | | 333 | |
Capitalized exploration expenditures(2) | | (26 | ) |
Capitalized project development costs(2) | | (78 | ) |
IFRS basis | | $ | 229 | |
(1) For IFRS purposes, exploration costs and project development costs are combined and presented as “Exploration and Evaluation Costs”.
(2) Under IFRS the criteria to determine costs that qualify for capitalization differs from US GAAP. We capitalized additional exploration and evaluation costs at certain properties, mainly Cerro Casale, where management assessed under IFRS that it is probable that these expenditures will result in future economic benefits.
N. Other Expense
| | For the year ended | |
(millions of US $) | | Dec. 31, 2010 | |
US GAAP, as reported | | $ | 463 | |
Reclassification of certain payments to income tax(1) | | (9 | ) |
Gain on non-hedge derivatives(2) | | 5 | |
US GAAP, as adjusted for IFRS format | | 459 | |
PER adjustments for closed mines(3) | | 19 | |
Others | | (5 | ) |
IFRS basis | | $ | 473 | |
(1) Under IFRS certain payments that are made to government bodies and are calculated based on net profit are classified as taxes. We reclassified the Peru voluntary payments to income tax expense.
(2) Refer to footnote K2.
(3) Under IFRS, PERs are updated each reporting period based on the current discount and foreign exchange rates.
O. Impairment Charges (Reversals)
| | For the year ended | |
(millions of US $) | | Dec. 31, 2010 | |
US GAAP, as reported | | $ | 7 | |
Reversal of Highland Gold impairment(1) | | (84 | ) |
Others | | 4 | |
IFRS basis | | $ | (73 | ) |
(1) Under IFRS past impairments of equity investments can be reversed in the future if there is a recovery in the realizable value of the investment. In 2008, we recorded an impairment of $140 million on our investment in Highland Gold. The fair value of the investment has increased since the write down; therefore, partial reversals were recorded under IFRS at transition date and in subsequent quarters.
91
Management’s Discussion and Analysis
P. Other Income
| | For the year ended | |
(millions of US $) | | Dec. 31, 2010 | |
US GAAP, as reported | | $ | 124 | |
Gain on non-hedge derivatives(1) | | (24 | ) |
US GAAP, as adjusted for IFRS format | | 100 | |
Gain on Cerro Casale acquisition(2) | | 40 | |
Other adjustments | | 2 | |
IFRS basis | | $ | 142 | |
(1) Refer to footnote K2.
(2) In the first quarter of 2010, Barrick acquired an additional 25% ownership interest in the Cerro Casale project. Due to the elimination of capitalized interest under IFRS, the assets had a lower book value on equity investments which resulted in a higher gain on acquisition recorded as other income.
Q. Income (Loss) from Equity Investees
| | For the year ended | |
(millions of US $) | | Dec. 31, 2010 | |
US GAAP, as reported | | $ | (41 | ) |
Capitalization of exploration and evaluation costs within equity investees(1) | | 18 | |
IFRS basis | | $ | (23 | ) |
(1) Refer to footnote M2.
R. Gain (Loss) on Non-Hedge Derivatives(1)
| | For the year ended | |
(millions of US $) | | Dec. 31, 2010 | |
US GAAP, as reported | | $ | Nil | |
Net realized and unrealized gains on non-hedge derivative positions | | 93 | |
Unrealized gains due to hedge ineffectiveness | | 10 | |
US GAAP, as adjusted for IFRS format | | 103 | |
Reclassification of loss on time value of options from AOCI | | (38 | ) |
IFRS basis | | $ | 65 | |
(1) Under IFRS, all realized and unrealized non-hedge derivative gains or losses, hedge ineffectiveness and amounts not qualifying for hedge accounting are presented as a separate line on the consolidated income statement. Under US GAAP these amounts were presented in the respective income statement line item to which the gain or loss is related.
S. Finance Costs
| | For the year ended | |
(millions of US $) | | Dec. 31, 2010 | |
US GAAP interest expense, as reported | | $ | (121 | ) |
Reclassification of accretion expense(1) | | (47 | ) |
US GAAP, as adjusted for IFRS format | | (168 | ) |
Elimination of interest capitalized on equity investees(2) | | (25 | ) |
Interest capitalized to Property Plant and Equipment(3) | | 20 | |
Changes in accretion expense(4) | | 26 | |
Other adjustments | | (11 | ) |
IFRS basis | | $ | (158 | ) |
(1) For IFRS purposes, interest expense and accretion are combined and presented as “Finance Costs”.
(2) Under IFRS, our investment in equity investees where the activities are development of mining projects are not qualifying assets that are eligible for interest capitalization. On transition and in subsequent quarters, this resulted in the reversal of previously capitalized interest primarily related to Cerro Casale.
(3) Under IFRS, capitalization of production phase stripping and capitalized exploration and evaluation costs resulted in an increase in capitalized interest relating to those expenditures.
(4) Under IFRS, accretion expense changed due to changes in discount and foreign exchange rates on PER.
Preliminary impact of conversion to IFRS on 2010 Total Cash Costs per ounce, Depreciation per ounce and Capital Expenditures
Total Cash Costs — Gold
| | For the year ended | |
($ per ounce) | | Dec. 31, 2010 | |
US GAAP, as reported | | $ | 457 | |
Capitalized stripping costs(1) | | (36 | ) |
Reclassification of certain payments to income tax(2) | | (13 | ) |
Other adjustments | | 1 | |
IFRS basis | | $ | 409 | |
(1) Refer to footnote L5.
(2) Refer to footnote L2.
Depreciation — Gold
| | For the year ended | |
($ per ounce) | | Dec. 31, 2010 | |
US GAAP, as reported | | $ | 127 | |
Depreciation of capitalized stripping costs(1) | | 8 | |
Depreciation of capitalized exploration and evaluation costs(1) | | 2 | |
Other adjustments | | (1 | ) |
IFRS basis | | $ | 136 | |
(1) Refer to footnote L6.
92
Barrick Financial Report 2010 | Management’s Discussion and Analysis
Capital Expenditures
| | For the year ended | |
| | Dec. 31, 2010 | |
| | US GAAP | | | | IFRS | |
(millions of US $) | | 100% basis | | Adj | | 100% basis | |
Sustaining capital | | $ | 863 | | $ | — | | $ | 863 | |
Open pit and underground mine development(1) | | 214 | | 357 | | 571 | |
Expansion capital(1) | | 236 | | 15 | | 251 | |
Capital projects(1),(2) | | 1,729 | | 63 | | 1,792 | |
Capitalized interest | | 281 | | 28 | | 309 | |
Total | | $ | 3,323 | | $ | 463 | | $ | 3,786 | |
(1) Capital expenditures increased due to the capitalization of production phase stripping costs and exploration and evaluation expenditures.
(2) Represents total project expenditures on a consolidated basis. Under IFRS, our partner’s share of project capital expenditures is $410 million (US GAAP: $394 million).
Key IFRS Accounting Policies
The following is a summary of key IFRS accounting policies which differ significantly from the comparable US GAAP policies and which were applied in preparing the preliminary consolidated IFRS balance sheet as at January 1, 2010 and the preliminary IFRS operating results for the year ended December 31, 2010.
Exploration and Evaluation Expenditures
Exploration expenditures reflect the costs related to the initial search for mineral deposits with economic potential or obtaining more information about existing mineral deposits. Exploration expenditures typically include costs associated with prospecting, sampling, mapping, diamond drilling and other work involved in searching for ore. Generally, expenditures relating to exploration activities are expensed as incurred. Capitalization of exploration expenditure commences when it is probable that future economic benefits will flow to the Company. The assessment of probability is based on factors such as whether the drilling is performed in a resource that is contiguous or adjacent to an existing reserve.
Evaluation expenditures reflect costs incurred at development projects related to establishing the technical and commercial viability of developing mineral deposits identified through exploration or acquired through a business combination or asset acquisition. Evaluation expenditures include the cost of (i) establishing the volume and grade of deposits through drilling of core samples, trenching and sampling activities in an ore body that is classified as either a mineral resource or a proven and probable reserve, (ii) determining the optimal methods of extraction and metallurgical and treatment processes, (iii) studies related to surveying, transportation and infrastructure requirements, (iv) permitting activities, and (v) economic evaluations to determine whether development of the mineralized material is commercially justified, including scoping, prefeasibility and final feasibility studies. Evaluation expenditures and the subsequent mine development costs are capitalized if management determines that there is sufficient evidence to support probability of generating positive economic returns in the future.
If an exploration and evaluation activity does not prove viable, all irrecoverable costs with the project are written off.
Cash flows attributable to capitalized exploration and evaluation costs are classified as investing activities in the consolidated statements of cash flow.
For our petroleum and natural gas properties, we follow the successful efforts method of accounting, whereby exploration expenditures that are either general in nature or related to an unsuccessful drilling program are written off. Only costs that relate directly to the discovery and development of specific commercial oil and gas reserves are capitalized as development costs.
Property, Plant and Equipment
Land, Buildings, Plant and Equipment
We record buildings, plant and equipment at cost, less accumulated depreciation and applicable impairment losses. Cost includes all expenditures incurred to prepare an asset for its intended use, including the purchase price; brokers’ commissions; and installation costs including architectural, design and engineering fees, legal fees, survey costs, site preparation costs, freight charges, transportation insurance costs, duties, testing and preparation charges. Depreciation commences when buildings, plant and equipment are considered available for use. Land is not depreciated and is measured at historical cost less impairments.
We capitalize costs that extend the productive capacity or useful economic life of an asset. Costs incurred that do not extend the productive capacity or useful economic life of an asset are considered repairs and maintenance that may be part of production cost and capitalized to inventory.
We enter into leasing arrangements and arrangements that are in substance leasing arrangements. The determination of whether an arrangement is, or contains, a lease is based on the substance of the arrangement at inception date, including whether the fulfillment of the arrangement is dependent on the use of a specific asset or assets or whether the arrangement conveys a right to use the asset. A reassessment after inception is only made in specific
93
Management’s Discussion and Analysis
circumstances. Leasing arrangements that transfer substantially all the risks and rewards of ownership of the asset to Barrick are classified as finance leases.
Finance leases are recorded as an asset with a corresponding liability at an amount equal to the lower of the fair value of the leased property and the present value at the beginning of the lease term of the minimum lease payments over the term of the lease. Each lease payment is allocated between the liability and finance costs using the effective interest method, whereby a constant rate of interest expense is recognized on the balance of the liability outstanding. The interest element of the lease is charged to the consolidated statements of income as a finance cost.
All other leases are classified as operating leases. Operating lease payments are recognized as an operating cost in the consolidated statements of income on a straight-line basis over the lease term.
Mining Interests
Mining interests consist of capitalized costs that include:
(i) Acquired mineral reserves and resources,
(ii) Underground mine development costs,
(iii) Open pit mine development costs,
(iv) Capitalized exploration and evaluation cost, and
(v) Capitalized interest.
Depreciation commences when assets are available for their intended use.
(i) Acquired Mineral Reserves and Resources
Acquired Mining Properties
On acquisition of a mining property in the development or production stage, we prepare an estimate of the fair value attributable to the proven and probable mineral reserves, mineral resources and exploration potential that management has determined to be probable for future economic extraction over the life of mine. The estimated fair value of these reserves, resources and exploration potential is recorded as an asset as at the date of acquisition at cost, less accumulated depreciation and applicable accumulated impairment losses.
Acquired Petroleum and Natural Gas Properties
On acquiring petroleum and natural gas property, we estimate the fair value of reserves and resources and we record this amount as an asset at the date of acquisition. Capitalized reserve acquisition costs are depreciated when the asset is available for its intended use.
(ii) Underground Mine Development Costs
At our underground mines, we incur development costs to build new shafts, drifts and ramps that will enable us to physically access ore underground. The time over which we will continue to incur these costs depends on the mine life. These underground development costs are capitalized as incurred.
(iii) Open Pit Development Costs
In open pit mining operations, it is necessary to remove overburden and other waste materials to access ore from which minerals can be extracted economically. The process of mining overburden and waste materials is referred to as stripping.
Stripping costs incurred during the development stage of a mine in order to provide initial access to the ore body (referred to as pre-production stripping) are capitalized as mine development costs. Stripping costs incurred during the production stage (referred to as production phase stripping) are accounted for as current period production costs unless these costs result in a future economic benefit. Production phase stripping costs generate a future economic benefit when the related stripping activity: (i) provides access to ore to be mined in the future; (ii) increases the fair value of the mine (or pit) as access to future mineral reserves becomes less costly; (iii) increases the productive capacity or extends the productive life of the pit. Such production phase stripping costs are capitalized as mine development costs.
For periods where production phase stripping activity generates a future economic benefit, the life-of-pit waste tons to ore tons ratio (the “strip ratio”) is considered, along with other factors such as the length and intensity of the stripping campaign, to determine the amount of production stripping costs incurred that is related to current production versus the amount that relates to the future economic benefit.
Where a mine operates several open pits that are regarded as separate operations for the purpose of mine planning, stripping costs are accounted for separately by reference to the ore reserves from each separate pit (i.e. the initial stripping of the second and subsequent pits is considered to be pre-production stripping). If, however, the pits are highly integrated for the purpose of mine planning, the second and subsequent pits are regarded as extensions of the first pit in accounting for stripping costs. In such cases, the initial stripping of the second and subsequent pits is considered to be production phase stripping relating to the combined operation.
94
Barrick Financial Report 2010 | Management’s Discussion and Analysis
(iv) Capitalized Exploration and Evaluation Costs
Exploration and evaluation expenditures that result in a probable future economic benefit are capitalized (refer to page 93).
(v) Capitalized Interest
Interest cost is considered an element of the historical cost of an asset when a period of time is necessary to prepare it for its intended use. We capitalize interest costs for qualifying assets including our exploration properties and capital projects prior to when production begins while exploration, development or construction activities are in progress and borrowings have been incurred. Capitalization ceases when construction is interrupted for an extended period or when the asset is substantially complete. Where funds are borrowed specifically to finance a project, the amount capitalized represents the actual borrowing costs incurred. Where surplus funds available out of money borrowed specifically to finance a project are temporarily invested, the total capitalized interest is reduced by income generated from short-term investments of such funds. Where the funds used to finance a project form part of general borrowings, the amount capitalized is calculated using a weighted average of rates applicable to the relevant borrowings during the period.
Other Assets Not Subject to Depreciation
Non-Depreciable Mining Interest
On acquisition of a mining property in the development or production stage, we prepare an estimate of the fair value attributable to the mineral resources that management has determined not to be probable of future economic extraction, as well as the fair value attributable to the exploration potential of the property. The estimated fair value of these acquired resources and exploration potential is recorded as an asset (non-depreciable mining interest) as at the acquisition date. As part of our annual business cycle, we prepare estimates of gold and copper mineral reserves and resources for each mineral property. The changes in reserves and resources are, among other things, used to determine the amount to be converted from non-depreciable mining interests to depreciable mining interests.
Construction-in-Progress
Assets under construction at both our development projects and operating mines are capitalized as construction-in-progress. Construction-in-progress amounts related to development projects are included in the carrying amount of the development project. Construction-in-progress amounts incurred at operating mines are presented as a separate asset within Property Plant & Equipment (“PP&E”). The cost of PP&E comprises its purchase price and any costs directly attributable to bringing it into working condition for its intended use, at which point, it is transferred to PP&E and depreciation commences. Construction-in-progress also contains deposits on long lead items. Construction-in-progress is not depreciated.
Depreciation
Property, plant and equipment are depreciated over their useful life, or over the remaining life of the mine if shorter. The property, plant and equipment assets acquired under finance leases are depreciated over the shorter of the useful life of the asset and the lease term. The residual value of the asset is considered when determining the amount to be depreciated. Land is not depreciated and is measured at historical cost less impairments.
For mining interests, the economic benefits of the assets are consumed in a pattern which is linked to the production level. Such assets are depreciated on a units-of-production basis (“UOP”).
Capitalized costs associated with acquired mining properties and capitalized exploration and evaluation costs are depreciated on a UOP basis, whereby the denominator is the estimated ounces of gold/pounds of copper in proven and probable reserves and a portion of resources at the mine where it is considered probable that those resources will be extracted economically. The depreciation is included as a component of inventory cost as the applicable ore is extracted.
Acquired petroleum and natural gas reserves and resources and capitalized exploration costs are depreciated on a UOP basis, whereby the denominator is the estimated barrels of oil equivalent in proven reserves.
Capitalized underground development costs incurred and capitalized to enable access to specific ore blocks or areas of the underground mine, and which only provide an economic benefit over the period of mining that ore block or area, are depreciated on a UOP basis, whereby the denominator is estimated ounces of gold/pounds of copper
95
Management’s Discussion and Analysis
in proven and probable reserves and a portion of resources within that ore block or area where it is considered probable that those resources will be extracted economically.
If capitalized underground development costs provide an economic benefit over the entire mine life, the costs are depreciated on a UOP basis, whereby the denominator is the estimated ounces of gold/pounds of copper in total accessible proven and probable reserves and a portion of resources where it is considered probable that those resources will be extracted economically.
Production phase stripping costs that generate a future economic benefit to Barrick are capitalized as mine development costs and depreciated on a UOP basis whereby the denominator is the estimated ounces of gold/pounds of copper in the associated open pit in proven and probable reserves and a portion of resources where it is considered probable that those resources will be extracted economically. The depreciation is included as a component of inventory cost as the applicable ore is extracted.
Depreciation on equipment utilized in the development of assets, including open pit and underground mine development, is depreciated and recapitalized as development costs attributable to the related asset.
Annual Depreciation Rates of Major Assets Categories
Land | | Not depreciated | |
Mining Interests | | UOP | |
Plant and equipment | | 5 — 25 years | |
Underground mobile equipment | | 5 — 7 years | |
Light vehicles and other mobile equipment | | 2 — 3 years | |
Furniture, computer and office equipment | | 2 — 3 years | |
Oil and gas plants and related facilities | | 3 — 15 years | |
Each asset’s estimated residual value and useful life is reviewed, and adjusted if appropriate, on an annual basis. The estimate of residual value and useful life is based on the physical condition and life limitations of buildings, plant and equipment and the present assessment of economically recoverable ounces of the mine for the mining property and development cost asset. Changes to the estimated residual values or useful lives are accounted for prospectively.
Update of Gold and Copper Mineral Reserves and Resources
At the end of each fiscal year, as part of our annual business cycle, we update our life-of mine plans and prepare estimates of Proven and Probable gold and copper mineral reserves as well as measured, indicated and inferred mineral resources for each mineral property. We prospectively revise calculations of depreciation of property, plant and equipment based on these updated life-of-mine plans.
Impairment Evaluations
We review and test the carrying amounts of long-lived assets when events or changes in circumstances suggest that the carrying amount may not be recoverable. Impairment assessments are conducted at the level of cash-generating units (“CGUs”), which is the lowest level for which identifiable cash flows are largely independent of the cash flows of other assets. For operating mines, capital projects and petroleum and natural gas properties, the individual mine/project/property represents a CGU for impairment testing of long-lived assets.
The recoverable amount of a CGU is the higher of Value In Use (“VIU”) and Fair Value Less Cost to Sell (“FVLCS”). An impairment loss is recognized for any excess of carrying amount of a CGU over its recoverable amount. Impairment losses are allocated pro-rata based on relative carrying values. Any impairment is recognized as an expense in the consolidated statements of income in the reporting period in which the write-down occurs.
Long-lived assets subject to potential impairment at mine sites/capital projects/petroleum and natural gas properties include land, buildings, plant and equipment, mineral properties and capitalized development costs, construction-in-progress and development projects.
Impairment Reversals
An impairment loss recognized in prior years for long-lived assets shall be reversed if, and only if, there has been a change in the estimates used to determine the asset’s recoverable amount since the last impairment loss was recognized. This reversal is recognized in the consolidated statements of income and is limited to the carrying amount that would have been determined, net of any depreciation, had no impairment been recognized in prior years. After such a reversal, any depreciation charge is adjusted prospectively.
96
Barrick Financial Report 2010 | Management’s Discussion and Analysis
Goodwill and Intangible Assets
Goodwill
Under the acquisition method, the costs of business acquisitions are allocated to the assets acquired and liabilities assumed based on the estimated fair values at the date of acquisition. The excess of acquisition cost over the net fair value of identified tangible and intangible assets acquired and liabilities and contingent liabilities assumed represents goodwill that is allocated to CGUs.
Impairment Evaluations
Goodwill is not amortized; rather it is evaluated for impairment annually as of October 1 or at any time during the year if an indicator of impairment is considered to exist. We test goodwill at the operating segment level, since each CGU in a segment derives synergy benefits from the business combinations within that segment that give rise to goodwill, and management does not internally monitor goodwill at a lower level. An impairment loss is recognized for the amount by which the operating segment’s carrying amount exceeds its recoverable amount.
The recoverable amount of an operating segment is the higher of Value In Use (“VIU”) and Fair Value Less Cost to Sell (“FVLCS”). An impairment loss is recognized for any excess of carrying amount of an operating segment over its recoverable amount. Any impairment is recognized as an expense in the consolidated statements of income in the reporting period in which the write-down occurs. The impairment loss is allocated to reduce the carrying amount of the assets of the operating segment in the following order: (a) first, to reduce the carrying amount of goodwill allocated to the operating segment, (b) then, to the other assets of the operating segment pro rata on the basis of the carrying amount of each asset.
Impairment Reversals
An impairment loss recognized for goodwill shall not be reversed in a subsequent period.
Intangible Assets
Intangible assets acquired by way of an asset acquisition or business combination are recognized if the asset is separable or arises from contractual or legal rights and the fair value can be measured reliably on initial recognition. On acquisition of a mineral property in the exploration stage, we prepare an estimate of the fair value attributable to the exploration potential, including mineral resources, if any, of that property. The fair value of the exploration potential is recorded as an intangible asset (acquired exploration potential) as at the date of acquisition. When an exploration stage property moves into development, any acquired exploration intangible asset balance attributable to that property is transferred to non-depreciable mining interests within property, plant and equipment.
Impairment Evaluations
We review and test the carrying amounts of intangible assets when events or changes in circumstances suggest that the carrying amount may not be recoverable. Intangible assets that are currently in use and subject to amortization are included in the carrying amount of the appropriate CGU and tested for impairment together with the other long lived assets of that CGU. Intangible assets that are not subject to amortization are tested at an individual asset level.
Impairment Reversals
An impairment loss recognized in prior years for intangible assets is reversed if there has been a change in the circumstances that led to the impairment loss and it has been determined that the asset is no longer impaired as a result. This reversal is recognized in the consolidated statements of income and is limited to the carrying amount that would have been determined, net of any depreciation where applicable, had no impairment been recognized in prior years. After such a reversal, any depreciation charge where applicable is adjusted prospectively.
Provision for Environmental Rehabilitation
Mining, extraction and processing activities normally give rise to obligations for environmental rehabilitation. Rehabilitation work can include facility decommissioning and dismantling; removal or treatment of waste materials; site and land rehabilitation, including compliance with and monitoring of environmental regulations; security and other site-related costs required to perform the rehabilitation work; and operation of equipment designed to reduce or eliminate environmental effects. The extent of work required and the associated costs are dependent on the requirements of relevant authorities and our environmental policies. Routine operating costs that may impact the ultimate closure and rehabilitation activities, such as waste material handling conducted as an integral part of a mining or production process, are not included in the provision. Costs arising from unforeseen circumstances, such as the contamination caused
97
Management’s Discussion and Analysis
by unplanned discharges, are recognized as an expense and liability when the event occurs that gives rise to an obligation and reliable estimates of the required rehabilitation costs can be made.
Provisions for the cost of each rehabilitation program are normally recognized at the time that an environmental disturbance occurs or a constructive obligation is determined. When the extent of disturbance increases over the life of an operation, the provision is increased accordingly. The major parts of the carrying amount of provisions relate to tailings pond closure/rehabilitation; demolition of buildings/mine facilities; ongoing water treatment; and ongoing care and maintenance of closed mines. Costs included in the provision encompass all closure and rehabilitation activity expected to occur progressively over the life of the operation and at the time of closure in connection with disturbances as at the reporting date. Estimated costs included in the determination of the provision reflect the risks and probabilities of alternative estimates of cash flows required to settle the obligation at each particular operation. The costs are estimated using either the work of external consultants or internal experts depending on management’s intention.
The timing of the actual rehabilitation expenditure is dependent upon a number of factors such as the life and nature of the asset, the operating license conditions and the environment in which the mine operates. Expenditure may occur before and after closure and can continue for an extended period of time depending on rehabilitation requirements. Rehabilitation provisions are measured at the expected value of future cash flows, discounted to their present value using a current, US dollar real risk-free pre-tax discount rate. The unwinding of the discount is included in finance expense and results in an increase in the amount of the provision. Provisions are updated each reporting period for the effect of a change in the discount rate and foreign exchange rate, and the change in estimate is added or deducted from the related asset and depreciated prospectively over the asset’s useful life.
Significant judgments and estimates are involved in forming expectations of future activities and the amount and timing of the associated cash flows. Those expectations are formed based on existing environmental and regulatory requirements or, if more stringent, our environmental policies which give rise to a constructive obligation. When expected cash flows change, the revised cash flows are discounted using the current US dollar real risk-free pre-tax discount rate and an adjustment is made to the provision.
When provisions for closure and rehabilitation are initially recognized, the corresponding cost is capitalized as an asset, representing part of the cost of acquiring the future economic benefits of the operation. The capitalized cost of closure and rehabilitation activities is recognized in property, plant and equipment and depreciated over the future production from the operations to which it relates.
Adjustments to the estimated amount and timing of future closure and rehabilitation cash flows are a normal occurrence in light of the significant judgments and estimates involved. The principal factors that can cause expected cash flows to change are: the construction of new processing facilities; changes in the quantities of material in reserves and resources with a corresponding change in the life-of-mine plan; changing ore characteristics that impact required environmental protection measures and related costs; changes in water quality that impact the extent of water treatment required; foreign exchange rates and changes in laws and regulations governing the protection of the environment.
Rehabilitation provisions are adjusted as a result of changes in estimates. Those adjustments are accounted for as a change in the corresponding value of the related assets including the related mineral property, except where a reduction in the provision is greater than the remaining net book value of the related assets, in which case the value is reduced to nil and the remaining adjustment is recognized in the consolidated statements of income. In the case of closed sites, changes to estimated costs are recognized immediately in the consolidated statements of income. The adjusted cost of the asset is depreciated prospectively. Changes also result in an adjustment to future finance costs.
98
Barrick Financial Report 2010 | Management’s Discussion and Analysis
Glossary of Technical Terms
AUTOCLAVE: Oxidation process in which high temperatures and pressures are applied to convert refractory sulfide mineralization into amenable oxide ore.
BACKFILL: Primarily waste sand or rock used to support the roof or walls after removal of ore from a stope.
BY-PRODUCT: A secondary metal or mineral product recovered in the milling process such as copper and silver.
CONCENTRATE: A very fine, powder-like product containing the valuable ore mineral from which most of the waste mineral has been eliminated.
CONTAINED OUNCES: Represents ounces in the ground before reduction of ounces not able to be recovered by the applicable metallurgical process.
DEVELOPMENT: Work carried out for the purpose of opening up a mineral deposit. In an underground mine this includes shaft sinking, crosscutting, drifting and raising. In an open pit mine, development includes the removal of overburden.
DILUTION: The effect of waste or low-grade ore which is unavoidably included in the mined ore, lowering the recovered grade.
DORÉ: Unrefined gold and silver bullion bars usually consisting of approximately 90 percent precious metals that will be further refined to almost pure metal.
DRILLING:
Core: drilling with a hollow bit with a diamond cutting rim to produce a cylindrical core that is used for geological study and assays. Used in mineral exploration.
In-fill: any method of drilling intervals between existing holes, used to provide greater geological detail and to help establish reserve estimates.
EXPLORATION: Prospecting, sampling, mapping, diamond-drilling and other work involved in searching for ore.
GRADE: The amount of metal in each ton of ore, expressed as troy ounces per ton or grams per tonne for precious metals and as a percentage for most other metals.
Cut-off grade: the minimum metal grade at which an ore body can be economically mined (used in the calculation of ore reserves).
Mill-head grade: metal content of mined ore going into a mill for processing.
Recovered grade: actual metal content of ore determined after processing.
Reserve grade: estimated metal content of an ore body, based on reserve calculations.
HEAP LEACHING: A process whereby gold is extracted by “heaping” broken ore on sloping impermeable pads and continually applying to the heaps a weak cyanide solution which dissolves the contained gold. The gold-laden solution is then collected for gold recovery.
HEAP LEACH PAD: A large impermeable foundation or pad used as a base for ore during heap leaching.
MILL: A processing facility where ore is finely ground and thereafter undergoes physical or chemical treatment to extract the valuable metals.
MINERAL RESERVE: See pages 164—165 — “Summary Gold Mineral Reserves and Mineral Resources.”
MINERAL RESOURCE: See pages 164—165 — “Summary Gold Mineral Reserves and Mineral Resources.”
MINING CLAIM: That portion of applicable mineral lands that a party has staked or marked out in accordance with applicable mining laws to acquire the right to explore for and exploit the minerals under the surface.
MINING RATE: Tons of ore mined per day or even specified time period.
OPEN PIT: A mine where the minerals are mined entirely from the surface.
ORE: Rock, generally containing metallic or non-metallic minerals, which can be mined and processed at a profit.
ORE BODY: A sufficiently large amount of ore that can be mined economically.
OUNCES: Troy ounces of a fineness of 999.9 parts per 1,000 parts.
RECLAMATION: The process by which lands disturbed as a result of mining activity are modified to support beneficial land use. Reclamation activity may include the removal of buildings, equipment, machinery and other physical remnants of mining, closure of tailings storage facilities, leach pads and other mine features, and contouring, covering and re-vegetation of waste rock and other disturbed areas.
RECOVERY RATE: A term used in process metallurgy to indicate the proportion of valuable material physically recovered in the processing of ore. It is generally stated as a percentage of the material recovered compared to the total material originally present.
REFINING: The final stage of metal production in which impurities are removed from the molten metal.
STRIPPING: Removal of overburden or waste rock overlying an ore body in preparation for mining by open pit methods. Expressed as the total number of tons mined or to be mined for each ounce of gold.
TAILINGS: The material that remains after all economically and technically recoverable precious metals have been removed from the ore during processing.
99
Management’s Responsibility
Management’s Responsibility
Management’s Responsibility for Financial Statements
The accompanying consolidated financial statements have been prepared by and are the responsibility of the Board of Directors and Management of the Company.
The consolidated financial statements have been prepared in accordance with United States generally accepted accounting principles and reflect Management’s best estimates and judgments based on currently available information. The Company has developed and maintains a system of internal accounting controls in order to ensure, on a reasonable and cost effective basis, the reliability of its financial information.
The consolidated financial statements have been audited by PricewaterhouseCoopers LLP, Chartered Accountants. Their report outlines the scope of their examination and opinion on the consolidated financial statements.
/s/ Jamie C. Sokalsky | |
| |
Jamie C. Sokalsky | |
Executive Vice President | |
and Chief Financial Officer | |
Toronto, Canada | |
February 16, 2011 | |
100
Barrick Financial Report 2010 | Management’s Report on Internal Controls Over Financial Reporting
Management’s Report on Internal Controls Over Financial Reporting
Barrick’s Management is responsible for establishing and maintaining adequate internal control over financial reporting.
Barrick’s Management assessed the effectiveness of the Company’s internal control over financial reporting as at December 31, 2010. Barrick’s Management used the Committee of Sponsoring Organizations of the Treadway Commission (COSO) framework to evaluate the effectiveness of Barrick’s internal control over financial reporting. Based on Barrick Management’s assessment, Barrick’s internal control over financial reporting is effective as at December 31, 2010.
The effectiveness of the Company’s internal control over financial reporting as at December 31, 2010 has been audited by PricewaterhouseCoopers LLP, Chartered Accountants, as stated in their report which is located on pages 102—103 of Barrick’s 2010 Annual Financial Statements.
101
Independent Auditor’s Report
Independent Auditor’s Report
Independent Auditor’s Report
February 16, 2011
To the Shareholders of
Barrick Gold Corporation
We have completed integrated audits of Barrick Gold Corporation’s (the Company) 2010, 2009 and 2008 consolidated financial statements and of its internal control over financial reporting as at December 31, 2010. Our opinions, based on our audits, are presented below.
Report on the consolidated financial statements
We have audited the accompanying consolidated financial statements of Barrick Gold Corporation, which comprise the consolidated balance sheets as at December 31, 2010 and December 31, 2009 and the consolidated statements of income, cash flow, equity and comprehensive income for each of the years in the three-year period ended December 31, 2010 and the related notes.
Management’s responsibility for the consolidated financial statements
Management is responsible for the preparation and fair presentation of these consolidated financial statements in accordance with accounting principles generally accepted in the United States of America and for such internal control as management determines is necessary to enable the preparation of consolidated financial statements that are free from material misstatement, whether due to fraud or error.
Auditor’s responsibility
Our responsibility is to express an opinion on these consolidated financial statements based on our audits. We conducted our audits in accordance with Canadian generally accepted auditing standards and the standards of the Public Company Accounting Oversight Board (United States). Those standards require that we plan and perform an audit to obtain reasonable assurance about whether the consolidated financial statements are free from material misstatement. Canadian generally accepted auditing standards also require that we comply with ethical requirements.
An audit involves performing procedures to obtain audit evidence, on a test basis, about the amounts and disclosures in the consolidated financial statements. The procedures selected depend on the auditor’s judgment, including the assessment of the risks of material misstatement of the consolidated financial statements, whether due to fraud or error. In making those risk assessments, the auditor considers internal control relevant to the Company’s preparation and fair presentation of the consolidated financial statements in order to design audit procedures that are appropriate in the circumstances. An audit also includes evaluating the appropriateness of accounting principles and policies used and the reasonableness of accounting estimates made by management, as well as evaluating the overall presentation of the consolidated financial statements.
We believe that the audit evidence we have obtained in our audits is sufficient and appropriate to provide a basis for our audit opinion on the consolidated financial statements.
102
Barrick Financial Report 2010 | Independent Auditor’s Report
Opinion
In our opinion, the consolidated financial statements present fairly, in all material respects, the financial position of Barrick Gold Corporation as at December 31, 2010 and December 31, 2009 and the results of its operations and its cash flows for each of the years in the three-year period ended December 31, 2010 in accordance with accounting principles generally accepted in the United States of America.
Report on internal control over financial reporting
We have also audited Barrick Gold Corporation’s internal control over financial reporting as at December 31, 2010, based on criteria established in Internal Control — Integrated Framework, issued by the Committee of Sponsoring Organizations of the Treadway Commission (COSO).
Management’s responsibility for internal control over financial reporting
Management is responsible for maintaining effective internal control over financial reporting and for its assessment of the effectiveness of internal control over financial reporting, included in Management’s Report on Internal Control Over Financial Reporting.
Auditor’s responsibility
Our responsibility is to express an opinion on the Company’s internal control over financial reporting based on our audit. We conducted our audit of internal control over financial reporting in accordance with the standards of the Public Company Accounting Oversight Board (United States). Those standards require that we plan and perform the audit to obtain reasonable assurance about whether effective internal control over financial reporting was maintained in all material respects.
An audit of internal control over financial reporting includes obtaining an understanding of internal control over financial reporting, assessing the risk that a material weakness exists, testing and evaluating the design and operating effectiveness of internal control based on the assessed risk, and performing such other procedures as we consider necessary in the circumstances. We believe that our audit provides a reasonable basis for our audit opinion on the Company’s internal control over financial reporting.
Definition of internal control over financial reporting
A Company’s internal control over financial reporting is a process designed to provide reasonable assurance regarding the reliability of financial reporting and the preparation of financial statements for external purposes in accordance with generally accepted accounting principles. A company’s internal control over financial reporting includes those policies and procedures that (i) pertain to the maintenance of records that, in reasonable detail, accurately and fairly reflect the transactions and dispositions of the assets of the Company; (ii) provide reasonable assurance that transactions are recorded as necessary to permit preparation of financial statements in accordance with generally accepted accounting principles, and that receipts and expenditures of the Company are being made only in accordance with authorizations of management and directors of the Company; and (iii) provide reasonable assurance regarding prevention or timely detection of unauthorized acquisition, use, or disposition of the Company’s assets that could have a material effect on the financial statements.
Inherent limitations
Because of its inherent limitations, internal control over financial reporting may not prevent or detect misstatements. Also, projections of any evaluation of effectiveness to future periods are subject to the risk that controls may become inadequate because of changes in conditions, or that the degree of compliance with the policies or procedures may deteriorate.
Opinion
In our opinion, Barrick Gold Corporation maintained, in all material respects, effective internal control over financial reporting as at December 31, 2010 based on criteria established in Internal Control — Integrated Framework issued by COSO.

| |
| |
Chartered Accountants, Licensed Public Accountants | |
Toronto, Canada | |
103
Financial Statements
Consolidated Statements of Income
Barrick Gold Corporation
For the years ended December 31 (in millions of United States dollars, except per share data) | | 2010 | | 2009 | | 2008 | |
Sales (notes 4 and 5) | | $ | 10,924 | | $ | 8,136 | | $ | 7,613 | |
Costs and expenses | | | | | | | |
Cost of sales (notes 4 and 6)(1) | | 4,201 | | 3,807 | | 3,706 | |
Amortization and accretion (notes 4 and 15b) | | 1,196 | | 1,073 | | 957 | |
Corporate administration | | 154 | | 171 | | 155 | |
Exploration (notes 4 and 7) | | 180 | | 141 | | 198 | |
Project development expense (notes 4 and 7) | | 153 | | 85 | | 242 | |
Elimination of gold sales contracts | | — | | 5,933 | | — | |
Other expense (note 8a) | | 463 | | 343 | | 302 | |
Impairment charges (note 8b) | | 7 | | 277 | | 598 | |
| | 6,354 | | 11,830 | | 6,158 | |
Interest income | | 14 | | 10 | | 39 | |
Interest expense (note 20b) | | (121 | ) | (57 | ) | (21 | ) |
Other income (note 8c) | | 124 | | 112 | | 291 | |
Write-down of investments (note 8b) | | — | | (1 | ) | (205 | ) |
| | 17 | | 64 | | 104 | |
Income (loss) from continuing operations before income taxes and other items | | 4,587 | | (3,630 | ) | 1,559 | |
Income tax expense (note 9) | | (1,370 | ) | (648 | ) | (594 | ) |
Loss from equity investees (note 12) | | (41 | ) | (87 | ) | (64 | ) |
Income (loss) from continuing operations before non-controlling interests | | 3,176 | | (4,365 | ) | 901 | |
Income (loss) from discontinued operations (note 3i) | | 121 | | 97 | | (104 | ) |
Income (loss) before non-controlling interests | | 3,297 | | (4,268 | ) | 797 | |
Non-controlling interests (note 27) | | (23 | ) | (6 | ) | (12 | ) |
Net income (loss) | | $ | 3,274 | | $ | (4,274 | ) | $ | 785 | |
Earnings (loss) per share data (note 10) | | | | | | | |
Income (loss) from continuing operations | | | | | | | |
Basic | | $ | 3.19 | | $ | (4.84 | ) | $ | 1.02 | |
Diluted | | $ | 3.16 | | $ | (4.84 | ) | $ | 1.01 | |
Income (loss) from discontinued operations | | | | | | | |
Basic | | $ | 0.13 | | $ | 0.11 | | $ | (0.12 | ) |
Diluted | | $ | 0.12 | | $ | 0.11 | | $ | (0.12 | ) |
Net income (loss) | | | | | | | |
Basic | | $ | 3.32 | | $ | (4.73 | ) | $ | 0.90 | |
Diluted | | $ | 3.28 | | $ | (4.73 | ) | $ | 0.89 | |
(1) Exclusive of amortization.
The accompanying notes are an integral part of these consolidated financial statements.
104
Barrick Financial Report 2010 | Financial Statements
Consolidated Statements of Cash Flow
Barrick Gold Corporation
For the years ended December 31 (in millions of United States dollars) | | 2010 | | 2009 | | 2008 | |
Operating Activities | | | | | | | |
Net income (loss) | | $ | 3,274 | | $ | (4,274 | ) | $ | 785 | |
Amortization and accretion (notes 4 and 15b) | | 1,196 | | 1,073 | | 957 | |
Impairment charges and write-down of investments (note 8b) | | 7 | | 278 | | 803 | |
Income tax expense (note 9) | | 1,370 | | 648 | | 594 | |
Income taxes paid | | (647 | ) | (376 | ) | (575 | ) |
Net proceeds taxes paid | | (85 | ) | (66 | ) | — | |
Increase in inventory | | (403 | ) | (372 | ) | (370 | ) |
Elimination of gold sales contracts | | — | | 5,933 | | — | |
Payment on settlement for gold sales contracts | | (656 | ) | (5,221 | ) | — | |
Gain on sale/acquisition of long-lived assets (note 8c) | | (50 | ) | (85 | ) | (187 | ) |
(Income) loss from discontinued operations (note 3i) | | (121 | ) | (97 | ) | 104 | |
Operating cash flows of discontinued operations (note 3i) | | (8 | ) | 7 | | 26 | |
Other operating activities (note 11a) | | 250 | | 230 | | 117 | |
Net cash provided by (used in) operating activities | | 4,127 | | (2,322 | ) | 2,254 | |
Investing Activities | | | | | | | |
Property, plant and equipment | | | | | | | |
Capital expenditures (note 4) | | (3,323 | ) | (2,351 | ) | (1,749 | ) |
Sales proceeds | | 61 | | 10 | | 185 | |
Acquisitions (note 3) | | (813 | ) | (101 | ) | (2,174 | ) |
Investments (note 12) | | | | | | | |
Purchases | | (61 | ) | (3 | ) | (18 | ) |
Sales | | 15 | | 7 | | 76 | |
Decrease in restricted cash | | — | | 113 | | 18 | |
Investing cash flows of discontinued operations (note 3i) | | — | | (3 | ) | (27 | ) |
Other investing activities (note 11b) | | (51 | ) | (87 | ) | (231 | ) |
Net cash used in investing activities | | (4,172 | ) | (2,415 | ) | (3,920 | ) |
Financing Activities | | | | | | | |
Capital stock | | | | | | | |
Proceeds on exercise of stock options | | 127 | | 65 | | 74 | |
Proceeds on common share offering (note 25) | | — | | 3,885 | | — | |
Proceeds from public issuance of common shares by a subsidiary (note 3e) | | 884 | | — | | — | |
Long-term debt (note 20b) | | | | | | | |
Proceeds | | 782 | | 2,154 | | 2,717 | |
Repayments | | (149 | ) | (397 | ) | (1,603 | ) |
Dividends (note 25) | | (436 | ) | (369 | ) | (349 | ) |
Funding from non-controlling interests | | 114 | | 304 | | 88 | |
Deposit on silver sale agreement | | 137 | | 213 | | — | |
Financing cash flows of discontinued operations (note 3i) | | — | | — | | — | |
Other financing activities (note 11c) | | (25 | ) | (26 | ) | (34 | ) |
Net cash provided by financing activities | | 1,434 | | 5,829 | | 893 | |
Effect of exchange rate changes on cash and equivalents | | 15 | | 35 | | 3 | |
Net increase (decrease) in cash and equivalents | | 1,404 | | 1,127 | | (770 | ) |
Cash and equivalents at beginning of period (note 20a) | | 2,564 | | 1,437 | | 2,207 | |
Cash and equivalents at end of period (note 20a) | | $ | 3,968 | | $ | 2,564 | | $ | 1,437 | |
The accompanying notes are an integral part of these consolidated financial statements.
105
Financial Statements
Consolidated Balance Sheets
Barrick Gold Corporation
At December 31 (in millions of United States dollars) | | 2010 | | 2009 | |
Assets | | | | | |
Current assets | | | | | |
Cash and equivalents (note 20a) | | $ | 3,968 | | $ | 2,564 | |
Accounts receivable (note 14) | | 346 | | 251 | |
Inventories (note 13) | | 1,852 | | 1,540 | |
Other current assets (note 14) | | 947 | | 524 | |
Assets of discontinued operations (note 3i) | | — | | 59 | |
| | 7,113 | | 4,938 | |
Non-current assets | | | | | |
Equity in investees (note 12a) | | 291 | | 1,136 | |
Other investments (note 12b) | | 203 | | 92 | |
Property, plant and equipment (note 15) | | 17,751 | | 13,125 | |
Goodwill (note 17) | | 5,287 | | 5,197 | |
Intangible assets (note 16) | | 140 | | 66 | |
Deferred income tax assets (note 24) | | 467 | | 949 | |
Other assets (note 18) | | 2,070 | | 1,531 | |
Assets of discontinued operations (note 3i) | | — | | 41 | |
Total assets | | $ | 33,322 | | $ | 27,075 | |
Liabilities and Equity | | | | | |
Current liabilities | | | | | |
Accounts payable | | $ | 1,511 | | $ | 1,221 | |
Current portion of long-term debt (note 20b) | | 14 | | 54 | |
Other current liabilities (note 19) | | 964 | | 475 | |
Liabilities of discontinued operations (note 3i) | | — | | 23 | |
| | 2,489 | | 1,773 | |
Non-current liabilities | | | | | |
Long-term debt (note 20b) | | 6,678 | | 6,281 | |
Asset retirement obligations (note 22) | | 1,439 | | 1,122 | |
Deferred income tax liabilities (note 24) | | 1,114 | | 1,184 | |
Other liabilities (note 23) | | 868 | | 1,145 | |
Liabilities of discontinued operations (note 3i) | | — | | 23 | |
Total liabilities | | 12,588 | | 11,528 | |
Equity | | | | | |
Capital stock (note 25) | | 17,790 | | 17,390 | |
Additional paid-in capital | | 288 | | — | |
Retained earnings (deficit) | | 456 | | (2,382 | ) |
Accumulated other comprehensive income (note 26) | | 531 | | 55 | |
Total shareholders’ equity | | 19,065 | | 15,063 | |
Non-controlling interests (note 27) | | 1,669 | | 484 | |
Total equity | | 20,734 | | 15,547 | |
Contingencies and commitments (notes 15 and 30) | | | | | |
Total liabilities and equity | | $ | 33,322 | | $ | 27,075 | |
The accompanying notes are an integral part of these consolidated financial statements.
Signed on behalf of the Board,
/s/ Aaron Regent | | /s/ Steven J. Shapiro | |
| | | |
Aaron Regent, Director | | Steven J. Shapiro, Director | |
106
Barrick Financial Report 2010 | Financial Statements
Consolidated Statements of Equity
Barrick Gold Corporation
For the years ended December 31 (in millions of United States dollars) | | 2010 | | 2009 | | 2008 | |
Common shares (number in thousands) | | | | | | | |
At January 1 | | 984,328 | | 872,739 | | 869,887 | |
Issued on public equity offering (note 25) | | — | | 108,973 | | — | |
Issued on exercise of stock options | | 4,760 | | 2,349 | | 2,383 | |
Issued on conversion of debentures (note 20b) | | 9,412 | | — | | — | |
Issued on redemption of exchangeable shares (note 25b) | | — | | 267 | | 469 | |
At December 31 | | 998,500 | | 984,328 | | 872,739 | |
Common shares | | | | | | | |
At January 1 | | $ | 17,390 | | $ | 13,372 | | $ | 13,273 | |
Issued on public equity offering (note 25) | | — | | 3,926 | | — | |
Issued on conversion of debentures (note 20b) | | 268 | | — | | — | |
Issued on exercise of stock options | | 127 | | 65 | | 74 | |
Recognition of stock option expense | | 14 | | 20 | | 25 | |
Other adjustments | | (9 | ) | 7 | | — | |
At December 31 | | 17,790 | | 17,390 | | 13,372 | |
Additional paid-in capital | | | | | | | |
At January 1 | | — | | — | | — | |
Recognized on initial public offering of African Barrick Gold (note 3e) | | 288 | | — | | — | |
At December 31 | | 288 | | — | | — | |
Retained earnings (deficit) | | | | | | | |
At January 1 | | (2,382 | ) | 2,261 | | 1,832 | |
Net income (loss) | | 3,274 | | (4,274 | ) | 785 | |
Dividends (note 25) | | (436 | ) | (369 | ) | (349 | ) |
Repurchase of preferred shares of a subsidiary | | — | | — | | (7 | ) |
At December 31 | | 456 | | (2,382 | ) | 2,261 | |
Accumulated other comprehensive income (loss) (note 26) | | 531 | | 55 | | (356 | ) |
Total shareholders’ equity | | 19,065 | | 15,063 | | 15,277 | |
Non-controlling interests (note 27) | | | | | | | |
At January 1 | | 484 | | 182 | | 82 | |
Net income attributable to non-controlling interests | | 23 | | 6 | | 12 | |
Funding from non-controlling interests | | 114 | | 299 | | 90 | |
Other increase (decrease) in non-controlling interests | | 1,048 | | (3 | ) | (2 | ) |
At December 31 | | 1,669 | | 484 | | 182 | |
Total equity at December 31 | | $ | 20,734 | | $ | 15,547 | | $ | 15,459 | |
Consolidated Statements of Comprehensive Income
Barrick Gold Corporation | | | | | | | |
For the years ended December 31 (in millions of United States dollars) | | 2010 | | 2009 | | 2008 | |
Net income (loss) | | $ | 3,274 | | $ | (4,274 | ) | $ | 785 | |
Other comprehensive income (loss), net of tax (note 26) | | 476 | | 411 | | (507 | ) |
Comprehensive income (loss) | | $ | 3,750 | | $ | (3,863 | ) | $ | 278 | |
The accompanying notes are an integral part of these consolidated financial statements.
107
Notes to Consolidated Financial Statements
Notes to Consolidated Financial Statements
Barrick Gold Corporation. Tabular dollar amounts in millions of United States dollars, unless otherwise shown. References to C$, A$, ZAR, CLP, PGK, TZS, JPY, ARS, GBP and EUR are to Canadian dollars, Australian dollars, South African rand, Chilean pesos, Papua New Guinea kina, Tanzanian schillings, Japanese yen, Argentinean pesos, British Pound Sterling and Euros, respectively.
1 · Nature of Operations
Barrick Gold Corporation (“Barrick” or the “Company”) principally engages in the production and sale of gold, as well as related activities such as exploration and mine development. We also produce significant amounts of copper and hold interests in oil and gas properties located in Canada through our oil and gas subsidiary, Barrick Energy. Our producing mines are concentrated in three regional business units: North America, South America, and Australia Pacific. We also hold a 73.9% equity interest in a listed company, African Barrick Gold plc (“ABG”), which includes our African gold mines and exploration properties. We sell our gold production into the world market and we sell our copper production into the world market and to private customers.
2 · Significant Accounting Policies
a) Basis of Preparation
These consolidated financial statements have been prepared under United States generally accepted accounting principles (“US GAAP”). To ensure comparability of financial information, certain prior year amounts have been reclassified to reflect current financial statement presentation.
b) Principles of Consolidation
These consolidated financial statements include the accounts of Barrick Gold Corporation and those entities that we have the ability to control either through voting rights or means other than voting rights. For these entities, we record 100% of the revenues, expenses, cash flows, assets and liabilities in our consolidated financial statements. For entities that we control but hold less than a 100% ownership interest, a non-controlling interest is recorded in the consolidated income statement to reflect the non-controlling interest’s share of the net income (loss), and a non-controlling interest is recorded in the consolidated balance sheet to reflect the non-controlling interest’s share of the net assets of the entity. For entities that are subject to joint control (“joint ventures” or “JVs”) we account for our interest using the equity method of accounting where our interest is held through a corporate structure.
For unincorporated JVs in which we hold an undivided interest in the assets and liabilities and receive our share of production from the joint venture, we include our pro rata share of the assets, liabilities, revenues, expenses and cash flows in our financial statements.
We have assessed all entities including those entities that hold economic interests in projects that are in the exploration or development stage, in which we hold an economic interest, to determine if they are variable interest entities (“VIEs”). If they are determined to be VIEs, we assess on an ongoing basis who the primary beneficiary is based on who has the power to direct matters that most significantly impact the activities of the VIE and who has the obligation to absorb losses or the right to receive benefits of the VIE that could potentially be significant to the VIE. Matters that may have a significant impact on the activities of VIEs include, but are not limited to, approval of budgets and programs, construction decisions and delegation of certain responsibilities to the operator of the project. For VIEs where we are the primary beneficiary, we consolidate the entity and record a non-controlling interest, measured initially at its estimated fair value, for the interest held by other equity owners. For VIEs where we have shared power with unrelated parties over the aforementioned matters that most significantly impact the activities of the VIE, we use the equity method of accounting to report their results (note 12). For all VIEs, our risk is limited to our investment in the entity.
The following table illustrates our policy used to account for significant operating mines/projects where we hold less than a 100% economic interest. We consolidate all operating mines/projects where we hold a 100% economic interest.
108
Barrick Financial Report 2010 | Notes to Consolidated Financial Statements
Consolidation Method at December 31, 2010
| | Entity type at December 31, 2010 | | Economic interest at
December 31, 2010(1) | | Method | |
African Barrick Gold(2) | | Non-Wholly Owned Subsidiary | | 73.9 | % | Consolidation | |
Australia | | | | | | | |
Kalgoorlie Mine | | Unincorporated JV | | 50 | % | Pro Rata | |
Porgera Mine(3) | | Unincorporated JV | | 95 | % | Pro Rata | |
North America | | | | | | | |
Round Mountain Mine | | Unincorporated JV | | 50 | % | Pro Rata | |
Marigold Mine | | Unincorporated JV | | 33 | % | Pro Rata | |
Turquoise Ridge Mine | | Unincorporated JV | | 75 | % | Pro Rata | |
Capital Projects | | | | | | | |
Pueblo Viejo Project(4) | | VIE | | 60 | % | Consolidation | |
Cerro Casale Project(5) | | VIE | | 75 | % | Consolidation | |
Donlin Creek Project(6) | | VIE | | 50 | % | Equity Method | |
Reko Diq Project(6),(7) | | VIE | | 37.5 | % | Equity Method | |
Kabanga Project(6),(8) | | VIE | | 50 | % | Equity Method | |
(1) Unless otherwise noted, all of our joint ventures are funded by contributions made by their partners in proportion to their economic interest.
(2) In 2010, we completed an initial public offering (“IPO”) for a non-controlling interest in our African gold mining operations. As a result of this transaction, our economic interest in the North Mara, Bulyanhulu and Buzwagi gold mines was reduced from 100% to 73.9% and our economic interest in the Tulawaka gold mine (an unincorporated JV held through ABG) was reduced from 70% to 51.7% (note 3e).
(3) We hold an undivided interest in our share of assets and liabilities at the Porgera mine.
(4) In accordance with the terms of the agreement with our partner, Barrick is responsible for 60% of the funding requirements for the Pueblo Viejo project. We consolidate Pueblo Viejo and record a non-controlling interest for the 40% interest held by our partner. In 2009, we determined that the mineralization at Pueblo Viejo met the definition of proven and probable reserves for United States reporting purposes and began capitalizing development costs attributable to the project. At December 31, 2010, the consolidated carrying amounts (100%) of the Pueblo Viejo project were: assets of $2,889 million (2009: $1,385 million) and liabilities of $1,392 million (2009: $182 million). The maximum exposure to loss related to this VIE is $898 million (2009: $722 million), calculated as 60% of the shareholder’s equity of the entity.
(5) On March 31, 2010, we obtained control over the Cerro Casale project by acquiring an additional 25% interest, which increased our ownership interest to 75%. As a result, we began to consolidate Cerro Casale and record a non-controlling interest for the 25% interest held by our partner, prospectively from March 31, 2010. Previously, we had joint control over Cerro Casale and accounted for our ownership interest using the equity method of accounting. At December 31, 2010, the consolidated carrying amounts (100%) of the Cerro Casale project were: assets of $1,883 million (2009: $861 million) and of liabilities $22 million (2009: $nil). The maximum exposure to loss related to this VIE is $1,396 million (2009: $861 million), calculated as 75% of the shareholder’s equity of the entity.
(6) Our Donlin Creek, Reko Diq and Kabanga projects are VIEs that we account for ownership interests using the equity method of accounting. Our maximum exposure to loss is limited to the carrying amount of the investment (note 12).
(7) We hold a 50% interest in Atacama Copper, which has a 75% interest in the Reko Diq project. We use the equity method to account for our interest in Atacama Copper (note 12).
(8) In accordance with an agreement with our partner, from 2006 until the third quarter of 2008, our partner was responsible for funding 100% of exploration and project expenditures and we did not incur any costs attributable to our economic interest in this period. During the third quarter of 2008, our partner reached the $145 million funding cap for these expenditures, and thereafter we began funding 50% of the exploration and project expenditures (note 12).
c) Foreign Currency Translation
The functional currency of our gold and copper operations is the US dollar. We translate non-US dollar balances for these operations into US dollars as follows:
· Property, plant and equipment, intangible assets and equity method investments using historical rates;
· Available-for-sale securities using closing rates with translation gains and losses recorded in other comprehensive income;
· Asset retirement obligations using historical rates;
· Deferred tax assets and liabilities using closing rates with translation gains and losses recorded in income tax expense;
· Other assets and liabilities using closing rates with translation gains and losses recorded in other income/expense; and
· Income and expenses using average exchange rates, except for expenses that relate to non-monetary assets and liabilities measured at historical rates, which are translated using the same historical rate as the associated non-monetary assets and liabilities.
The functional currency of our oil and gas operations, (“Barrick Energy”) is the Canadian dollar. We translate balances related to Barrick Energy into US dollars as follows:
· Assets and liabilities using closing exchange rates with translation gains and losses recorded in other comprehensive income; and
· Income and expense using average exchange rates with translation gains and losses recorded in other comprehensive income.
d) Use of Estimates
The preparation of these financial statements requires us to make estimates and assumptions. The most significant ones are: classification of mineralization as either reserves or non-reserves; quantities of proven and probable mineral reserves; fair values of acquired assets and liabilities under business combinations, including the value of mineralized material beyond proven and probable mineral reserves; future costs and
109
Notes to Consolidated Financial Statements
expenses to produce proven and probable mineral reserves; future commodity prices for gold, copper, silver and other products; future costs of oil and other consumables; future currency exchange rates; the future cost of asset retirement obligations; amounts and likelihood of contingencies; the fair values of reporting units that include goodwill; uncertain tax positions; and credit risk adjustments to discount rates. Using these and other estimates and assumptions, we make various decisions in preparing the financial statements including:
· The treatment of expenditures at mineral properties prior to when production begins as either an asset or an expense (note 15);
· Whether tangible, intangible long-lived assets and equity investments are impaired, and if so, estimates of the fair value of those assets and any corresponding impairment charge (note 15);
· Our ability to realize deferred income tax assets and amounts recorded for any corresponding valuation allowances and amounts recorded for uncertain tax positions (note 24);
· The useful lives of tangible and intangible long-lived assets and the measurement of amortization (note 15);
· The fair value of asset retirement obligations (note 22);
· Whether to record a liability for loss contingencies and the amount of any such liability (notes 15 and 30);
· The amount of income tax expense (note 9);
· Allocations of the purchase price in business combinations to assets and liabilities acquired (notes 3 and 17);
· Whether any impairments of goodwill have occurred and if so the amounts of impairment charges (note 17);
· Transfers of value beyond proven and probable reserves to assets subject to amortization (note 15); and
· Fair value of derivative instruments including credit risk adjustments to the discount rates in determining fair value (notes 20 and 21).
As the estimation process is inherently uncertain, actual future outcomes could differ from our present estimates and assumptions, potentially having material future effects on our financial statements.
e) Accounting Changes
Future Accounting Policy Changes
Barrick has made the decision to convert our basis of accounting from US GAAP to International Financial Reporting Standards (“IFRS”) for periods beginning January 1, 2011, preparing its first interim financial statements in accordance with IFRS for the three-month period ending March 31, 2011. As a result of our transition to reporting under IFRS, new US GAAP pronouncements effective from 2011 onwards will not have an impact on our consolidated financial statements.
Accounting Pronouncements Implemented in 2010
Variable Interest Entities (“VIEs”)
As a result of recently issued ASU 2009-17 guidance, we reassessed our VIEs in first quarter 2010, and determined that these changes did not have an impact on our classification of VIEs. We have also increased our disclosures in respect of VIEs (note 2b).
Accounting Pronouncements Implemented in 2009
Measuring Fair Value of Liabilities
In August 2009, the FASB issued Accounting Standards Update (“ASU 2009-05”), Measuring Fair Value of Liabilities which is effective prospectively for interim periods beginning after August 1, 2009, with early adoption permitted. Previous guidance required that the fair value of liabilities be measured under the assumption that the liability is transferred to a market participant. ASU 2009-05 provides further clarification that the fair value measurement of a liability should assume transfer to a market participant as of the measurement date without settlement with the counterparty. Therefore, the fair value of the liability shall reflect non-performance risk, including but not limited to a reporting entity’s own credit risk. The application of ASU 2009-05 in fourth quarter 2009 did not have a material impact on the measurement of our liabilities.
Business Combinations
In first quarter 2009, we began applying the new FASB guidance for business combinations consummated after December 31, 2008. Under the new guidance, business combinations are accounted for under the “acquisition method”, as opposed to the “purchase method”.
The more significant changes to our accounting for business combinations resulting from the application of the acquisition method include: (i) the definition of a business is broadened to include some development stage entities, and therefore more acquisitions may be accounted for as business combinations rather than asset acquisitions; (ii) the measurement date for equity interests issued by the acquirer is the acquisition date instead of a few days before and after terms are agreed to and announced, which may significantly change the amount recorded for the acquired business if share prices differ from the agreement and announcement date to the acquisition date; (iii) all future adjustments to income tax estimates will be recorded as a component of income tax expense, whereas under the previous guidance, certain changes in income tax estimates were recorded to goodwill; (iv) acquisition-related costs of the acquirer, including investment banking fees, legal fees, accounting fees, valuation fees, and other professional or consulting fees will be expensed as incurred, whereas under the previous guidance these costs were capitalized as part of the cost of the
110
Barrick Financial Report 2010 | Notes to Consolidated Financial Statements
business combination; (v) the assets acquired and liabilities assumed as part of a business combination, whether full, partial or step acquisition, result in the recording of assets and liabilities at 100% of their fair value, whereas under the previous guidance only the controlling interest’s portion was recorded at fair value; (vi) recognition of a bargain purchase gain when the fair value of the identifiable assets exceeds the purchase price, whereas under the previous guidance, the net book value of the identifiable assets would have been adjusted downward; and (vii) the non-controlling interest will be recorded at its share of fair value of net assets acquired, including its share of goodwill, whereas under previous guidance the non-controlling interest is recorded at its share of the carrying value of net assets acquired with no goodwill being allocated. See note 3 for our disclosure of the accounting impact of business combinations and asset acquisitions.
Non-controlling Interests in Consolidated Financial Statements
In first quarter 2009, we adopted the new FASB guidance for non-controlling interests. Under the new guidance, non-controlling interests are measured at 100% of the fair value of assets acquired and liabilities assumed. Prior to the effective date of the new guidance, non-controlling interests were measured at book value. For presentation and disclosure purposes, non-controlling interests are now classified as a separate component of equity. In addition, the new guidance changes the manner in which increases/decreases in ownership percentages are accounted for. Changes in ownership percentages are recorded as equity transactions and no gain or loss is recognized as long as the parent retains control of the subsidiary. When a parent company deconsolidates a subsidiary but retains a non-controlling interest, the non-controlling interest is remeasured at fair value on the date control is lost and a gain or loss is recognized at that time. Further, accumulated losses attributable to the non-controlling interests are no longer limited to the original carrying amount, and therefore non-controlling interests could have a negative carrying balance.
The new provisions have been applied prospectively with the exception of the presentation and disclosure provisions, which have been applied for all prior periods presented in the financial statements. The presentation and disclosure provisions resulted in the reclassification of non-controlling interests to the Equity section of the Balance Sheet totaling $484 million as at December 31, 2009 (December 31, 2008: $182 million).
f) Other Notes to the Financial Statements
| | Note | | Page | |
Acquisitions and divestitures | | 3 | | 112 | |
Segment information | | 4 | | 115 | |
Sales | | 5 | | 118 | |
Cost of sales | | 6 | | 119 | |
Exploration and project development expense | | 7 | | 120 | |
Other expense and income | | 8 | | 121 | |
Income tax expense | | 9 | | 122 | |
Earnings (loss) per share | | 10 | | 124 | |
Cash flow — other items | | 11 | | 125 | |
Equity in investees and other investments | | 12 | | 126 | |
Inventories | | 13 | | 127 | |
Accounts receivable and other current assets | | 14 | | 129 | |
Property, plant and equipment | | 15 | | 130 | |
Intangible assets | | 16 | | 134 | |
Goodwill | | 17 | | 135 | |
Other assets | | 18 | | 137 | |
Other current liabilities | | 19 | | 137 | |
Financial instruments | | 20 | | 137 | |
Fair value measurements | | 21 | | 147 | |
Asset retirement obligations | | 22 | | 148 | |
Other non-current liabilities | | 23 | | 149 | |
Deferred income taxes | | 24 | | 150 | |
Capital stock | | 25 | | 152 | |
Other comprehensive income (loss) (“OCI”) | | 26 | | 153 | |
Non-controlling interests | | 27 | | 153 | |
Stock-based compensation | | 28 | | 154 | |
Post-retirement benefits | | 29 | | 157 | |
Litigation and claims | | 30 | | 160 | |
111
Notes to Consolidated Financial Statements
3 · Acquisitions and Divestitures
For the years ended December 31 | | 2010 | | 2009 | |
Cash paid on acquisition(1) | | | | | |
Cerro Casale | | $ | 454 | | $ | — | |
Barrick Energy acquisitions | | 264 | | 53 | |
Tusker Gold Limited | | 74 | | — | |
REN joint venture | | 36 | | — | |
Hemlo | | — | | 50 | |
| | $ | 828 | | $ | 103 | |
Less: cash acquired | | (15 | ) | (2 | ) |
| | $ | 813 | | $ | 101 | |
Cash proceeds on divestiture(1) | | | | | |
ABG | | $ | 884 | | $ | — | |
Osborne | | 17 | | — | |
| | $ | 901 | | $ | — | |
(1) All amounts represent gross cash paid or received on acquisition or divestiture.
a) Barrick Energy Acquisitions
In 2010, Barrick Energy completed three acquisitions. On May 17, 2010, Barrick Energy acquired all of the outstanding shares of Bountiful Resources (“Bountiful”), a privately held corporation, for approximately $109 million. On June 25, 2010, Barrick Energy acquired the Puskwa property from Galleon Energy Inc. (“Puskwa”) for approximately $130 million. On September 17, 2010, Barrick Energy acquired the assets of Dolomite Resources (“Dolomite”) for approximately $25 million. We have determined that all of these transactions represent business combinations, with Barrick Energy identified as the acquirer. We have recognized goodwill on these acquisitions due to expected synergies and the deferred tax impact. The tables below present the combined purchase cost and purchase price allocation for these transactions. Barrick Energy began consolidating the operating results, cash flows, and net assets of Bountiful, Puskwa, and Dolomite, from the respective acquisition dates.
Total Costs to Allocate
Allocation of Fair Values to Bountiful, Puskwa, and Dolomite’s Net Assets
Current assets | | $ | 8 | |
Property, plant and equipment | | 252 | |
Goodwill | | 64 | |
Total assets | | 324 | |
Current liabilities | | 2 | |
Asset retirement obligations | | 8 | |
Bank debt | | 13 | |
Deferred income tax liabilities | | 37 | |
Total liabilities | | 60 | |
Net assets acquired | | $ | 264 | |
b) Acquisition of Tusker Gold Limited
On April 27, 2010, ABG acquired 100% of the issued and outstanding shares of Tusker Gold Limited (“Tusker”) for aggregate net consideration of approximately $74 million. As a result of this acquisition, ABG has increased its interest in the Nyanzaga joint venture from 51% to 100%. We have determined that this transaction represents a business combination, with ABG identified as the acquirer. The tables below present the purchase cost and our preliminary purchase price allocation. The purchase price allocation will be finalized upon the determination of the deferred tax impact. Any adjustments to deferred tax impact will have a corresponding impact on goodwill.
ABG began consolidating the operating results, cash flows and net assets of Tusker from the date of acquisition.
Total Costs to Allocate
Purchase cost | | $ | 74 | |
Less: cash acquired | | (8 | ) |
Cash consideration paid | | $ | 66 | |
Preliminary Allocation of Fair Values to Tusker’s Net Assets
Property, plant and equipment | | $ | 80 | |
Goodwill | | 22 | |
Total assets | | 102 | |
Current liabilities | | 10 | |
Other non-current liabilities | | 4 | |
Deferred income tax liabilities | | 22 | |
Total liabilities | | 36 | |
Net assets acquired | | $ | 66 | |
112
Barrick Financial Report 2010 | Notes to Consolidated Financial Statements
c) Disposition of Sedibelo
On February 4, 2011, we entered into agreements to dispose of our 10% interest in the Sedibelo platinum project (“Sedibelo”) and certain assets to the Bakgatla-Ba-Kgafela Tribe (“BBK”), owner of the remaining 90% interest in Sedibelo, as well as the transfer of certain long lead items required for the development of Sedibelo to Newshelf 1101 (Proprietary) Limited, for total consideration of approximately $44 million; and to settle various outstanding matters between Barrick and the BBK regarding Sedibelo and their respective interests. The agreements are subject to certain customary conditions and the transactions are expected to close by the end of first quarter 2011.
d) Acquisition of 64% Interest in REN Joint Venture
On April 8, 2010, we entered into an agreement to acquire the remaining 64% interest in the REN joint venture from Centerra Gold Inc. for $36 million. The REN property is located next to the Goldstrike operations in Nevada. The transaction closed on July 2, 2010. The acquisition was accounted for as an asset purchase.
e) IPO of African Gold Mining Operations
On March 24, 2010, the initial public offering (“IPO”) for ABG closed and its approximately 404 million ordinary shares were admitted to the Official List of the UK Listing Authority and to trading on the London Stock Exchange’s main market for listed securities. ABG sold approximately 101 million ordinary shares in the offering, or about 25% of its equity and Barrick retained an interest in approximately 303 million ordinary shares, or about 75% of the equity of ABG. In April 2010, the over-allotment option was partially exercised resulting in a 1.1% dilution of our interest in ABG to 73.9% .
The net proceeds from the IPO and the exercise of the over-allotment option were approximately $884 million. As Barrick has retained a controlling financial interest in ABG, we will continue to consolidate ABG and we accounted for the disposition of ABG shares as an equity transaction. Accordingly, the difference between the proceeds received and the carrying value of $596 million has been recorded as $288 million of additional paid-in capital in shareholders’ equity, and we set up a non-controlling interest to reflect our ownership interest in ABG.
f) Acquisition of Additional 25% Interest in Cerro Casale
On March 31, 2010, we completed the acquisition of the additional 25% interest in Cerro Casale from Kinross Gold Corporation (“Kinross”) for cash consideration of $454 million and the elimination of a $20 million contingent obligation, which was payable by Kinross to Barrick on a construction decision. Our interest in the project is now 75% and we have obtained control over the project. As a result, we began consolidating 100% of the operating results, cash flows and net assets of Cerro Casale, and we recorded a non-controlling interest for the 25% ownership interest held by Kinross, prospectively from March 31, 2010. We have remeasured our previously held 50% ownership interest to fair value and recorded a corresponding gain of $29 million.
The tables below present the purchase cost and preliminary purchase price allocation.
Total Costs to Allocate
Purchase cost (25% interest) | | $ | 455 | |
Purchase price adjustment | | (1 | ) |
Less: cash acquired | | (7 | ) |
Cash consideration paid | | 447 | |
Equity method investment | | 879 | |
Non-controlling interest | | 454 | |
Subtotal | | 1,780 | |
Fair value of net assets | | 1,809 | |
Gain on acquisition | | $ | 29 | |
Preliminary Allocation of Purchase Price to Cerro Casale’s Net Assets (100% basis)
Current assets | | $ | 1 | |
Water rights | | 75 | |
VAT receivables | | 11 | |
Property, plant and equipment | | 1,732 | |
Total assets | | 1,819 | |
Current liabilities | | 10 | |
Net assets acquired | | $ | 1,809 | |
g) Acquisition of 50% Interest in Valhalla
On September 17, 2009, Barrick Energy completed the acquisition of 50% interest in the Valhalla oil and gas field, which is close to our existing Sturgeon Lake field, for total cash consideration of $53 million. This transaction was considered an asset purchase.
113
Notes to Consolidated Financial Statements
h) Acquisition of 50% Interest in Hemlo
On April 22, 2009, we completed the acquisition of the remaining 50% interest in the Williams and David Bell gold mines (“Hemlo”) in Canada from Teck Resources Ltd. for cash consideration of $50 million, thereby increasing our interest to 100%. We recognized a bargain purchase gain of $43 million, resulting from the excess fair value of the net assets acquired over the cash consideration paid. Following this transaction, we remeasured our existing 50% interest in the assets and liabilities of Hemlo held prior to this transaction to their fair values, recognizing a gain of approximately $29 million. The total gain of $72 million was recorded in other income (note 8c).
The tables below represent the purchase cost, purchase price allocation and the bargain purchase gain recorded in other income in 2009 (note 8c).
Total Costs to Allocate
Purchase cost | | $ | 65 | |
Purchase price adjustment | | (15 | ) |
Less: cash acquired | | (2 | ) |
| | $ | 48 | |
Preliminary Allocation of Fair Values to Hemlo’s Net Assets
Current assets | | $ | 10 | |
Property, plant and equipment | | | |
Buildings, plant and equipment | | 25 | |
Capitalized development costs | | 21 | |
Capitalized reserve acquisition costs | | 81 | |
Total assets | | 137 | |
Current liabilities | | 8 | |
Asset retirement obligations | | 32 | |
Deferred income tax liabilities | | 21 | |
Total liabilities | | 61 | |
Net assets acquired | | $ | 76 | |
i) Discontinued Operations
Results of Discontinued Operations
For the years ended December 31 | | 2010 | | 2009 | | 2008 | |
Gold sales | | | | | | | |
Osborne | | $ | 43 | | $ | 31 | | $ | 27 | |
Henty | | — | | 25 | | 52 | |
Copper sales | | | | | | | |
Osborne | | 244 | | 212 | | 221 | |
| | $ | 287 | | $ | 268 | | $ | 300 | |
Income before tax | | | | | | | |
Osborne | | $ | 173 | | $ | 129 | | $ | (85 | ) |
Henty | | — | | 9 | | (23 | ) |
| | $ | 173 | | $ | 138 | | $ | (108 | ) |
Net income | | | | | | | |
Osborne | | $ | 121 | | $ | 91 | | $ | (81 | ) |
Henty | | — | | 6 | | (23 | ) |
| | $ | 121 | | $ | 97 | | $ | (104 | ) |
Osborne
On September 30, 2010, we divested our Osborne copper mine to Ivanhoe Australia Limited (“Ivanhoe”), for consideration of approximately $17 million cash and a royalty payable from any future production, capped at approximately $14 million. Ivanhoe has agreed to assume all site environmental obligations. A loss of approximately $7 million, primarily due to severance obligations, was recognized in the third quarter of 2010. The results of operations, including the loss on disposition, and the assets and liabilities of Osborne have been presented as discontinued operations in these consolidated financial statements.
Henty
On July 6, 2009, we finalized an agreement with Bendigo Mining Limited (“Bendigo”) to divest our Henty mine in our Australia Pacific segment for cash consideration of $4 million and Bendigo shares with a fair value of $2 million as at the closing date. We are also entitled to receive a royalty payable on production from future exploration discoveries, capped at approximately $17 million. A gain of $4 million was recognized in the third quarter. The results of operations and the assets and liabilities of Henty have been presented as discontinued operations in these consolidated financial statements.
114
Barrick Financial Report 2010 | Notes to Consolidated Financial Statements
4 · Segment Information
In first quarter 2010 we revised the format of information provided to the Chief Operating Decision Maker to better reflect management’s view of the operations. The primary change involves the presentation of Exploration and Project Development, RBU Costs and Other Expenses (Income) as a component of Segment Income. Previously, these expenditures were monitored separately. Accordingly, we have revised our operating segment disclosure to be consistent with the reporting changes, with adjustments to comparative information to conform to the current period presentation.
Income Statement Information
For the year ended December 31, 2010 | | Sales | | Cost of Sales | | Exploration &
Project
Development | | RBU Costs | | Other
Expenses
(Income)(1) | | Amortization | | Segment
Income
(Loss)(2) | |
Gold | | | | | | | | | | | | | | | |
North America | | $ | 3,823 | | $ | 1,511 | | $ | 106 | | $ | 39 | | $ | 53 | | $ | 444 | | $ | 1,670 | |
South America | | 2,523 | | 515 | | 17 | | 41 | | 36 | | 165 | | 1,749 | |
Australia Pacific | | 2,434 | | 1,276 | | 61 | | 51 | | 36 | | 251 | | 759 | |
African Barrick Gold | | 919 | | 487 | | 23 | | 38 | | 26 | | 119 | | 226 | |
Copper | | | | | | | | | | | | | | | |
South America | | 1,102 | | 345 | | — | | 5 | | 20 | | 84 | | 648 | |
Capital Projects(3) | | — | | — | | 134 | | 3 | | (49 | ) | 4 | | (92 | ) |
Barrick Energy | | 123 | | 67 | | — | | 7 | | 4 | | 60 | | (15 | ) |
| | $ | 10,924 | | $ | 4,201 | | $ | 341 | | $ | 184 | | $ | 126 | | $ | 1,127 | | $ | 4,945 | |
Income Statement Information
For the year ended December 31, 2009 | | Sales | | Cost of Sales | | Exploration &
Project
Development | | RBU Costs | | Other
Expenses
(Income)(1) | | Amortization | | Segment
Income
(Loss)(2) | |
Gold | | | | | | | | | | | | | | | |
North America | | $ | 2,780 | | $ | 1,421 | | $ | 66 | | $ | 43 | | $ | (9 | ) | $ | 362 | | $ | 897 | |
South America | | 1,831 | | 499 | | 30 | | 24 | | 33 | | 134 | | 1,111 | |
Australia Pacific | | 1,836 | | 1,110 | | 38 | | 50 | | 56 | | 282 | | 300 | |
African Barrick Gold | | 688 | | 377 | | 8 | | 32 | | 35 | | 93 | | 143 | |
Copper | | | | | | | | | | | | | | | |
South America | | 943 | | 361 | | 1 | | 3 | | 14 | | 76 | | 488 | |
Capital Projects(3) | | — | | — | | 107 | | 5 | | (6 | ) | 3 | | (109 | ) |
Barrick Energy | | 58 | | 39 | | — | | 6 | | 4 | | 30 | | (21 | ) |
| | $ | 8,136 | | $ | 3,807 | | $ | 250 | | $ | 163 | | $ | 127 | | $ | 980 | | $ | 2,809 | |
115
Notes to Consolidated Financial Statements
Income Statement Information
For the year ended December 31, 2008 | | Sales | | Cost of Sales | | Exploration &
Project
Development | | RBU Costs | | Other
Expenses
(Income)(1) | | Amortization | | Segment
Income
(Loss)(2) | |
Gold | | | | | | | | | | | | | | | |
North America | | $ | 2,627 | | $ | 1,517 | | $ | 108 | | $ | 46 | | $ | (16 | ) | $ | 354 | | $ | 618 | |
South America | | 1,833 | | 531 | | 55 | | 20 | | 33 | | 163 | | 1,031 | |
Australia Pacific | | 1,579 | | 1,002 | | 47 | | 48 | | — | | 240 | | 242 | |
African Barrick Gold | | 538 | | 327 | | 16 | | 24 | | 14 | | 63 | | 94 | |
Copper | | | | | | | | | | | | | | | |
South America | | 1,007 | | 315 | | 11 | | 4 | | 4 | | 66 | | 607 | |
Capital Projects(3) | | — | | — | | 162 | | 5 | | 9 | | — | | (176 | ) |
Barrick Energy | | 29 | | 14 | | 1 | | 2 | | — | | 13 | | (1 | ) |
| | $ | 7,613 | | $ | 3,706 | | $ | 400 | | $ | 149 | | $ | 44 | | $ | 899 | | $ | 2,415 | |
(1) Other expenses include accretion expense. For the year ended December 31, 2010, accretion expense was $47 million (2009: $57 million; 2008: $45 million). See note 15 for further details.
(2) We manage the performance of our regional business units using a measure of income before interest and taxes, consequently interest income, interest expense and income taxes are not allocated to our regional business units.
(3) Segment loss for the Capital Projects segment includes project development expense and losses from equity investees that hold capital projects. See notes 7 and 12 for further details. For the year ended December 31, 2010, Capital Projects other expenses (income) includes a $29 million pre-tax gain on the acquisition of the 25% interest in Cerro Casale (note 3f).
Reconciliation of Segment Income to Income (Loss) from Continuing Operations Before Income Taxes and Other Items
For the years ended December 31 | | 2010 | | 2009 | | 2008 | |
Segment income | | $ | 4,945 | | $ | 2,809 | | $ | 2,415 | |
Amortization of corporate assets | | (22 | ) | (36 | ) | (13 | ) |
Exploration not attributable to segments | | (9 | ) | (11 | ) | (12 | ) |
Project development not attributable to segments | | (36 | ) | (58 | ) | (97 | ) |
Corporate administration | | (154 | ) | (171 | ) | (155 | ) |
Other expense not attributable to segments | | (76 | ) | 2 | | 137 | |
Elimination of gold sales contracts | | — | | (5,933 | ) | — | |
Impairment charges | | (7 | ) | (277 | ) | (598 | ) |
Interest income | | 14 | | 10 | | 39 | |
Interest expense | | (121 | ) | (57 | ) | (21 | ) |
Write-down of investments | | — | | (1 | ) | (205 | ) |
Loss from capital projects held through equity investees | | 53 | | 93 | | 69 | |
Income (loss) from continuing operations before income taxes and other items | | $ | 4,587 | | $ | (3,630 | ) | $ | 1,559 | |
116
Barrick Financial Report 2010 | Notes to Consolidated Financial Statements
Geographic Information
| | Long-lived assets(1) | | Sales(2) | |
For the years ended December 31 | | 2010 | | 2009 | | 2008 | | 2010 | | 2009 | | 2008 | |
North America | | | | | | | | | | | | | |
United States | | $ | 4,746 | | $ | 4,618 | | $ | 4,322 | | $ | 3,520 | | $ | 2,552 | | $ | 2,501 | |
Canada | | 1,528 | | 1,040 | | 643 | | 426 | | 286 | | 155 | |
Dominican Republic | | 2,550 | | 1,352 | | 446 | | — | | — | | — | |
South America | | | | | | | | | | | | | |
Peru | | 415 | | 283 | | 318 | | 1,200 | | 1,291 | | 1,367 | |
Chile | | 4,395 | | 2,181 | | 1,930 | | 1,102 | | 943 | | 1,007 | |
Argentina | | 1,758 | | 1,214 | | 1,104 | | 1,323 | | 540 | | 466 | |
Australia Pacific | | | | | | | | | | | | | |
Australia | | 1,680 | | 1,646 | | 1,536 | | 1,823 | | 1,306 | | 1,040 | |
Papua New Guinea | | 868 | | 682 | | 677 | | 611 | | 530 | | 539 | |
Africa | | | | | | | | | | | | | |
Tanzania | | 1,864 | | 1,628 | | 1,645 | | 919 | | 688 | | 538 | |
Other | | 17 | | 12 | | 17 | | — | | — | | — | |
Segment total | | $ | 19,821 | | $ | 14,656 | | $ | 12,638 | | $ | 10,924 | | $ | 8,136 | | $ | 7,613 | |
(1) Long-lived assets include property, plant and equipment and other assets.
(2) Presented based on the location in which the sale originated.
Asset Information
| | Segment
assets | | Segment
capital expenditures(1) | |
For the years ended December 31 | | 2010 | | 2009 | | 2008 | | 2010 | | 2009 | | 2008 | |
Gold | | | | | | | | | | | | | |
North America | | $ | 4,877 | | $ | 4,779 | | $ | 4,304 | | $ | 523 | | $ | 553 | | $ | 434 | |
South America | | 1,311 | | 1,166 | | 1,183 | | 202 | | 161 | | 84 | |
Australia Pacific | | 2,548 | | 2,328 | | 2,212 | | 295 | | 221 | | 207 | |
African Barrick Gold | | 1,855 | | 1,621 | | 1,024 | | 137 | | 126 | | 138 | |
Copper | | | | | | | | | | | | | |
South America | | 1,231 | | 1,242 | | 1,267 | | 63 | | 37 | | 57 | |
Capital projects | | 6,643 | | 2,686 | | 1,904 | | 2,187 | | 1,317 | | 919 | |
Barrick Energy | | 808 | | 501 | | 382 | | 86 | | 31 | | 15 | |
Segment total | | 19,273 | | 14,323 | | 12,276 | | 3,493 | | 2,446 | | 1,854 | |
Cash and equivalents | | 3,968 | | 2,564 | | 1,437 | | | | | | | |
Other current assets | | 3,145 | | 2,315 | | 2,642 | | | | | | | |
Equity in investees | | 291 | | 1,136 | | 1,085 | | | | | | | |
Other investments | | 203 | | 92 | | 60 | | | | | | | |
Intangible assets | | 140 | | 66 | | 74 | | | | | | | |
Deferred income tax assets | | 467 | | 949 | | 869 | | | | | | | |
Assets of discontinued operations | | — | | 100 | | 76 | | | | | | | |
Goodwill | | 5,287 | | 5,197 | | 5,280 | | | | | | | |
Other items not allocated to segments | | 548 | | 333 | | 362 | | 67 | | 21 | | 62 | |
Enterprise total | | $ | 33,322 | | $ | 27,075 | | $ | 24,161 | | $ | 3,560 | | $ | 2,467 | | $ | 1,916 | |
(1) Segment capital expenditures are presented for internal management reporting purposes on an accrual basis. Capital expenditures in the Consolidated Statements of Cash Flow are presented on a cash basis. In 2010, cash expenditures were $3,323 million (2009: $2,351 million; 2008: $1,749 million) and the increase in accrued expenditures was $237 million in 2010 (2009: $116 million increase; 2008: $167 million increase).
117
Notes to Consolidated Financial Statements
5 · Sales
For the years ended December 31 | | 2010 | | 2009 | | 2008 | |
Gold bullion sales(1),(2) | | | | | | | |
Spot market sales | | $ | 9,374 | | $ | 6,991 | | $ | 6,455 | |
Concentrate sales(3) | | 325 | | 144 | | 122 | |
| | 9,699 | | 7,135 | | 6,577 | |
Copper sales(1),(4) | | | | | | | |
Copper cathode sales | | 1,098 | | 943 | | 1,007 | |
Concentrate sales | | 4 | | — | | — | |
| | 1,102 | | 943 | | 1,007 | |
Oil and gas sales | | 123 | | 58 | | 29 | |
| | $ | 10,924 | | $ | 8,136 | | $ | 7,613 | |
(1) Revenues include amounts transferred from OCI to earnings for commodity cash flow hedges (see notes 20e and 26).
(2) Gold sales include gains and losses on non-hedge derivative contracts: For the year ended December 31, 2010: $26 million gain (2009: $56 million gain; 2008: $19 million gain).
(3) Concentrate sales include gains and losses on the mark-to-market receivable balances arising from smelting contracts, which are accounted for as embedded derivatives: For the year ended December 31, 2010: $3 million gain (2009: $1 million gain; 2008: $3 million loss).
(4) Copper sales include gains and losses on economic copper hedges that do not qualify for hedge accounting treatment: For the year ended December 31, 2010: $40 million gain (2009: $55 million loss; 2008: $67 million gain). Sales also include gains and losses on the mark-to-market receivable balances arising from copper smelting contracts, which are accounted for as embedded derivatives: For the year ended December 31, 2010: $10 million gain (2009: $4 million gain; 2008: $nil).
Principal Products
All of our gold mining operations produce gold in doré form, except Bulyanhulu and Buzwagi which produce both gold doré and gold concentrate. Gold doré is unrefined gold bullion bars usually consisting of 90% gold that is refined to pure gold bullion prior to sale to our customers. Gold concentrate is a processing product containing the valuable ore mineral (gold) from which most of the waste mineral has been eliminated. This concentrate undergoes a smelting process to convert it into gold bullion. Gold bullion is sold primarily in the London spot market. Gold concentrate is sold to third-party smelters. At our Zaldívar mine we produce copper cathode, which consists of 99.9% copper. Copper cathodes are sold directly under copper cathode sales contracts with various third-party buyers.
Revenue Recognition
We record revenue when the following conditions are met: persuasive evidence of an arrangement exists; delivery and transfer of title (gold revenue only) have occurred under the terms of the arrangement; the price is fixed or determinable; and collectability is reasonably assured. Revenue is presented net of direct sales taxes of $68 million (2009: $30 million; 2008: $23 million). Incidental revenues from the sale of by-products, primarily copper and silver, are classified within cost of sales.
Bullion Sales
We record revenue from gold and silver bullion sales at the time of physical delivery, which is also the date that title to the gold or silver passes. The sales price is fixed at the delivery date based on either the terms of gold sales contracts or the gold spot price.
Concentrate Sales
Under the terms of concentrate sales contracts with independent smelting companies, gold and copper sales prices are provisionally set on a specified future date after shipment based on market prices. We record revenues under these contracts at the time of shipment, which is also when title passes to the smelting companies, using forward market gold and copper prices on the expected date that final sales prices will be determined. Variations between the price recorded at the shipment date and the actual final price set under the smelting contracts are caused by changes in market gold and copper prices and result in an embedded derivative in the accounts receivable. The embedded derivative is recorded at fair value each period until final settlement occurs, with changes in fair value included as a component of revenue.
Copper Cathode Sales
Under the terms of copper cathode sales contracts, copper sales prices are provisionally set on a specified future date based upon market commodity prices plus certain price adjustments. Revenue is recognized at the time of shipment when risk of loss passes to the customer, and collectability is reasonably assured. Revenue is provisionally measured using forward market prices on the expected date that final selling prices will be determined. Variations occur between the price recorded on the date of revenue recognition and the actual final price under the terms of the contracts due to changes in market copper prices and result in an embedded derivative in the accounts receivable. The embedded derivative is recorded at fair value each period until final settlement occurs, with changes in fair value included as a component of revenue.
118
Barrick Financial Report 2010 | Notes to Consolidated Financial Statements
Provisional Copper and Gold Sales
Revenues before treatment and refining charges subject to final price adjustments as at December 31 and final provisional price adjustments recorded within the year were as follows:
At December 31 | | 2010 | | 2009 | | 2008 | |
Copper | | $ | 143 | | $ | 88 | | $ | 45 | |
Gold | | 66 | | 8 | | 15 | |
| | | | | | | | | | |
Final price adjustments recorded during the year:
For the years ended December 31 | | 2010 | | 2009 | | 2008 | |
Gain (loss) | | | | | | | |
Copper | | $ | 21 | | $ | 45 | | $ | (36 | ) |
Gold | | — | | — | | — | |
| | | | | | | | | | |
Oil and Gas Sales
Revenue from the sale of crude oil, natural gas and natural gas liquids is recorded at the time it enters the pipeline system, which is also when title transfers and there is reasonable assurance of collectability. At the time of delivery of oil and gas, prices are fixed and determinable based upon contracts referenced to monthly market commodity prices plus certain price adjustments. Price adjustments include product quality and transportation adjustments and market differentials.
6 · Cost of Sales
| | Gold | | Copper | | Oil & Gas | |
For the years ended December 31 | | 2010 | | 2009 | | 2008 | | 2010 | | 2009 | | 2008 | | 2010 | | 2009 | | 2008 | |
Cost of goods sold(1) | | $ | 3,542 | | $ | 3,230 | | $ | 3,211 | | $ | 349 | | $ | 362 | | $ | 315 | | $ | 39 | | $ | 29 | | $ | 8 | |
Unrealized (gains) losses on non-hedge contracts | | (6 | ) | (7 | ) | 14 | | — | | — | | — | | — | | — | | — | |
By-product revenues | | (124 | ) | (73 | ) | (92 | ) | (4 | ) | (1 | ) | — | | — | | — | | — | |
Royalty expense | | 287 | | 218 | | 202 | | — | | — | | — | | 28 | | 10 | | 6 | |
Mining production taxes | | 90 | | 39 | | 42 | | — | | — | | — | | — | | — | | — | |
| | $ | 3,789 | | $ | 3,407 | | $ | 3,377 | | $ | 345 | | $ | 361 | | $ | 315 | | $ | 67 | | $ | 39 | | $ | 14 | |
(1) Cost of goods sold includes charges to reduce the cost of inventory to net realizable value as follows: $3 million for the year ended December 31, 2010 (2009: $6 million; 2008: $62 million). The cost of inventory sold in the period reflects all components capitalized to inventory, except that, for presentation purposes, the component of inventory cost relating to amortization of property, plant and equipment is classified in the income statement under “amortization”. Some companies present this amount under “cost of sales”. The amount presented in amortization rather than cost of sales was $1,097 million in the year ended December 31, 2010 (2009: $964 million; 2008: $893 million).
Royalties
Certain of our properties are subject to royalty arrangements based on mineral production at the properties. The primary type of royalty is a net smelter return (NSR) royalty. Under this type of royalty we pay the holder an amount calculated as the royalty percentage multiplied by the value of gold production at market gold prices less third-party smelting, refining and transportation costs. Other types of royalties include:
· Net profits interest (NPI) royalty,
· Modified net smelter return (NSR) royalty,
· Net smelter return sliding scale (NSRSS) royalty,
· Gross proceeds sliding scale (GPSS) royalty,
· Gross smelter return (GSR) royalty,
· Net value (NV) royalty, and a
· Land tenement (LT) royalty.
Royalty expense is recorded on completion of the production process.
Royalties applicable to our oil and gas properties include:
· Crown royalties,
· Net profits interest (NPI) royalty, and
· Overriding royalty (ORR).
119
Notes to Consolidated Financial Statements
Producing mines & | | | |
development projects | | Type of royalty | |
| | | |
North America | | | |
Goldstrike | | 0%–5% NSR, 0%–6% NPI | |
Williams | | 1.5% NSR, 0.75% NV, | |
| | 1% NV | |
David Bell | | 3%–3.5% NSR | |
Round Mountain | | 3.53%–6.35% NSRSS | |
Bald Mountain | | 3.5%–7% NSRSS, | |
| | 2.9%–4% NSR, | |
| | 10% NPI | |
Ruby Hill | | 3% modified NSR | |
Cortez | | 1.5% GSR | |
Cortez – Pipeline/South Pipeline deposit | | 0.4%–9% GSR | |
Cortez – portion of Pipeline/South Pipeline deposit | | 5% NV | |
| | | |
South America | | | |
Veladero | | 3.75% modified NSR | |
Lagunas Norte | | 2.51% NSR | |
| | | |
Australia Pacific | | | |
Porgera | | 2% NSR, 0.25% other | |
Queensland & Western Australia production(1) | | 2.5%–2.7% of gold revenue | |
Cowal | | 4% of net gold revenue | |
Africa | | | |
Bulyanhulu | | 3% NSR | |
Tulawaka | | 3% NSR | |
North Mara – Nyabirama and Nyabigena pit | | 3% NSR, 1% LT | |
North Mara – Gokona pit | | 3% NSR, 1.1% LT | |
Buzwagi | | 3% NSR, 30% NPI(2) | |
Capital Projects | | | |
Donlin Creek Project | | 1.5% NSR (first 5 years), | |
| | 4.5% NSR (thereafter), | |
| | 8.0% NPI(3) | |
Pascua-Lama Project – Chile gold production | | 1.5%–9.8% GPSS | |
Pascua-Lama Project – Chile copper production | | 2% NSR | |
Pascua-Lama Project – Argentina production | | 3% modified NSR | |
Pueblo Viejo | | 3.2% NSR (for gold & silver), | |
| | 28.75% NPI(3) | |
Cerro Casale | | 3% NSR (capped at | |
| | $3 million cumulative) | |
Reko Diq | | 2% NSR | |
Kabanga | | 3% NSR | |
Other | | | |
Barrick Energy | | 0.40% NPI, 0.54% ORR, | |
| | 22.1% Crown royalty, net | |
(1) Includes the Kalgoorlie, Kanowna, Granny Smith, Plutonic, Darlot and Lawlers mines.
(2) The NPI is calculated as a percentage of profits realized from the Buzwagi mine after all capital, exploration, and development costs and interest incurred in relation to the Buzwagi mine have been recouped and all operating costs relating to the Buzwagi mine have been paid. No amount is currently payable.
(3) The NPI is calculated as a percentage of profits realized from the mine until all funds invested to date with interest at an agreed upon rate are recovered. No amount is currently payable.
7 · Exploration and Project Development Expense
For the years ended December 31 | | 2010 | | 2009 | | 2008 | |
| | | | | | | |
Exploration: | | | | | | | |
Minesite exploration | | $ | 66 | | $ | 42 | | $ | 62 | |
Projects | | 114 | | 99 | | 136 | |
| | $ | 180 | | $ | 141 | | $ | 198 | |
Project development expense: | | | | | | | |
Pueblo Viejo(1) | | $ | 3 | | $ | (3 | ) | $ | 62 | |
Sedibelo | | 2 | | 8 | | 17 | |
Fedorova | | 1 | | 2 | | 24 | |
Pascua-Lama | | 12 | | 17 | | 21 | |
Kainantu | | 3 | | 10 | | 28 | |
Cerro Casale | | 63 | | — | | — | |
Other | | 19 | | 27 | | 33 | |
| | 103 | | 61 | | 185 | |
Other project expenses(2) | | 50 | | 24 | | 57 | |
| | $ | 153 | | $ | 85 | | $ | 242 | |
(1) | We record a non-controlling interest balance for our partner’s share of expenditures within “non-controlling interests” in the income statement. In 2009, the costs include a reimbursement of historical remediation expenditures. |
(2) | Includes costs related to corporate development activities, research and development costs, and other corporate project expenditures. |
Accounting Policy for Exploration and Project Expenditures
Exploration Expenditures
Exploration activities relate to the initial search for deposits with economic potential and the evaluation and assessment of deposits that have been identified as having economic potential. Exploration activity is undertaken at both greenfield sites (sites where we do not have any mineral deposits that are already being mined or developed) and brownfield sites (sites that are adjacent or in close proximity to a mineral deposit that is classified within proven and probable reserves as defined by United States reporting standards and is already being mined or developed). Exploration expenditures reflect the costs of such activities, including exploratory drilling costs.
Expenditures on exploration activity conducted at greenfield sites are expensed as incurred. Exploration expenditures are capitalized when incurred at brownfield sites where the activities are directed at obtaining additional information on an ore body that is classified within proven and probable reserves or for the purpose of converting a mineral resource into a proven and probable reserve and, prior to the commencement of the exploration program, we can conclude that it is probable that such a conversion will take place. Our assessment
120
Barrick Financial Report 2010 | Notes to Consolidated Financial Statements
of probability is based on the following factors: results from previous exploration programs; results from geological models; results from a mine scoping study confirming economic viability of the resource; and preliminary estimates of mine inventory, ore grade, cash flow and mine life. Costs incurred at brownfield sites that meet the above criteria are capitalized as mine development costs. All other exploration expenditures incurred at these sites are expensed as mine site exploration.
Project Expenditures
Project expenditures reflect costs incurred at development projects related to establishing the technical and commercial viability of developing mineral deposits identified through exploration or acquired through a business combination or asset acquisition. Project expenditures include the cost of: i) establishing the volume and grade of deposits through drilling of core samples, trenching and sampling activities in an ore body that is classified as either a mineral resource or a proven and probable reserve; ii) determining the optimal methods of extraction and metallurgical and treatment processes; iii) studies related to surveying, transportation and infrastructure requirements; iv) permitting activities; and v) economic evaluations to determine whether development of the mineralized material is commercially justified, including scoping, prefeasibility and final feasibility studies.
We capitalize the costs of activities at projects after mineralization is classified as proven and probable reserves. Before classifying mineralization as proven and probable reserves, the costs of project activities are expensed as incurred, except for costs incurred to construct tangible assets that are capitalized within property, plant and equipment. The costs of start-up activities at mines and projects, such as recruiting and training costs, are also expensed as incurred within project development expense.
The Cerro Casale, Donlin Creek, Reko Diq and Kabanga projects are in various stages of development; however, none of these projects had met the criteria for cost capitalization at December 31, 2010. We account for our interests in the Reko Diq and Kabanga projects using the equity method of accounting and project expenses are included in “equity investees” in the Consolidated Income Statement (see note 12). Effective January 1, 2009, we determined that mineralization of Pueblo Viejo met the definition of proven and probable reserves for United States reporting purposes. Following this determination, we began capitalizing the cost of project activities at Pueblo Viejo.
8 · Other Expense and Income
a) Other Expense
For the years ended December 31 | | 2010 | | 2009 | | 2008 | |
Regional business unit costs(1) | | $ | 184 | | $ | 163 | | $ | 149 | |
Severance costs(2) | | 16 | | 41 | | 1 | |
Currency translation losses(3) | | 26 | | 8 | | 37 | |
Changes in estimate of AROs at closed mines | | 14 | | 8 | | 9 | |
Finance charges(4) | | 22 | | — | | — | |
Community relations(5) | | 35 | | 14 | | 21 | |
Environmental costs | | 8 | | 13 | | 7 | |
World Gold Council fees | | 16 | | 14 | | 11 | |
Non-hedge derivative losses | | — | | 1 | | 17 | |
Provision for supply contract restructuring costs(6) | | 46 | | — | | — | |
Pension and other post-retirement benefit expense | | 6 | | 9 | | 5 | |
Other items | | 90 | | 72 | | 45 | |
| | $ | 463 | | $ | 343 | | $ | 302 | |
(1) Relates to costs incurred at regional business unit offices.
(2) In 2009, includes $21 million in restructuring costs related to an organizational review, and other termination and restructuring costs.
(3) Amounts attributable to currency translation losses on working capital balances.
(4) Represents financing charges on the settlement obligation to close out gold sales contracts. Those contracts were settled in fourth quarter 2010 (note 23).
(5) Amounts mainly related to community programs and other related expenses.
(6) Amount relates to the present value of required payments to restructure a tire supply contract.
Environmental Costs
During the production phases of a mine, we incur and expense the cost of various activities connected with environmental aspects of normal operations, including compliance with and monitoring of environmental regulations; disposal of hazardous waste produced from normal operations; and operation of equipment designed to reduce or eliminate environmental effects. In limited circumstances, costs to acquire and install plant and equipment are capitalized during the production phase of a mine if the costs are expected to mitigate risk or prevent future environmental contamination from normal operations.
When a contingent loss arises from the improper use of an asset, a loss accrual is recorded if the loss is probable and reasonably estimable. Amounts recorded are adjusted as further information develops or if circumstances change. Recoveries of environmental remediation costs from other parties are recorded as assets when receipt is deemed probable.
121
Notes to Consolidated Financial Statements
b) Impairment Charges
For the years ended December 31 | | 2010 | | 2009 | | 2008 | |
Impairment of goodwill (note 17)(1) | | $ | — | | $ | 63 | | $ | 584 | |
Impairment of long-lived assets(2) | | 7 | | 214 | | 14 | |
| | 7 | | 277 | | 598 | |
Write-down of investments (note 12)(3) | | — | | 1 | | 205 | |
| | $ | 7 | | $ | 278 | | $ | 803 | |
(1) In 2009, we recorded an impairment charge of $63 million for Plutonic. Impairment charges for Osborne ($64 million) and Henty ($30 million) in 2008 are reflected in the results of discontinued operations. Impairment charges recorded in 2008 related to Kanowna ($272 million), North Mara ($216 million), Barrick Energy ($88 million) and Marigold ($8 million).
(2) In 2010, an impairment charge of $7 million was recorded to write off the remaining carrying amount of an intangible asset relating to a tire supply contract. In 2009, impairment charges of $43 million and $158 million were recorded to reduce the carrying amount of long-lived assets for Plutonic and Sedibelo to their estimated fair values, respectively. In 2008, impairment charges primarily relate to a $12 million charge recorded to reduce the carrying amount of long-lived assets at Marigold to their estimated fair value.
(3) In 2008, we recorded impairment charges on our investments in Highland Gold ($140 million), on Asset-Backed Commercial Paper ($39 million) and various other investments in junior gold mining companies ($26 million).
c) Other Income
For the years ended December 31 | | 2010 | | 2009 | | 2008 | |
Gains on sale of assets(1) | | $ | 21 | | $ | 13 | | $ | 187 | |
Gain on sale of investments(2) | | 12 | | 6 | | 59 | |
Gain on acquisition of assets(3) | | 29 | | 72 | | — | |
Royalty income | | 7 | | 5 | | 25 | |
Sale of water rights | | 3 | | 4 | | 4 | |
Non-hedge derivative gains | | 24 | | — | | — | |
Other | | 28 | | 12 | | 16 | |
| | $ | 124 | | $ | 112 | | $ | 291 | |
(1) In 2008, we recorded a gain of $167 million on the disposition of royalties to Royal Gold and a gain of $9 million on the sale of the Doyon royalty.
(2) In 2008, we recorded a gain of $12 million on the sale of available-for-sale investments. We also sold Asset-Backed Commercial Paper for cash proceeds of $49 million and recorded a gain on sale of $42 million.
(3) Relates to a $29 million gain recorded on gaining control of Cerro Casale following the acquisition of an additional 25% interest (note 3f). In 2009, we recorded a gain of $72 million on the acquisition of the remaining 50% interest in Hemlo (note 3h).
9 · Income Tax Expense
For the years ended December 31 | | 2010 | | 2009 | | 2008 | |
Current | | | | | | | |
Canada | | $ | 15 | | $ | (21 | ) | $ | 22 | |
International | | 1,180 | | 562 | | 613 | |
| | $ | 1,195 | | $ | 541 | | $ | 635 | |
Deferred | | | | | | | |
Canada | | $ | 54 | | $ | (11 | ) | $ | 3 | |
International | | 179 | | 210 | | (146 | ) |
| | $ | 233 | | $ | 199 | | $ | (143 | ) |
Income tax expense before elements below | | $ | 1,428 | | $ | 740 | | $ | 492 | |
Net currency translation (gains) losses on deferred tax balances | | (2 | ) | (40 | ) | 98 | |
Impact of legislative amendments in Australia | | (78 | ) | — | | — | |
Dividend withholding tax | | 74 | | — | | — | |
Canadian functional currency election | | — | | (70 | ) | — | |
Canadian tax rate changes | | — | | 59 | | — | |
Total expense | | 1,422 | | 689 | | 590 | |
Current (2010) and deferred income tax (expense) recovery (2009 and 2008) – discontinued operations | | (52 | ) | (41 | ) | 4 | |
Income tax expense – continuing operations | | $ | 1,370 | | $ | 648 | | $ | 594 | |
Currency Translation
Deferred tax balances are subject to remeasurement for changes in currency exchange rates each period. The most significant balances are Canadian deferred tax liabilities with a carrying amount of approximately $25 million, Argentinean deferred tax liabilities with a carrying amount of approximately $106 million, and Australian and Papua New Guinea deferred tax liabilities with a carrying amount of approximately $144 million. In 2010 and 2009, the appreciation of the Canadian and Australian dollar against the US dollar, and the weakening of the Argentine peso against the US dollar resulted in net translation gains totaling $2 million and $40 million, respectively. These gains are included within deferred tax expense/recovery.
122
Barrick Financial Report 2010 | Notes to Consolidated Financial Statements
Impact of Legislative Amendments in Australia
In Australia, we elected to enter into the consolidated tax regime in 2004 (in 2002 for the former Placer Dome Inc. subsidiaries). At the time the elections were made, there were certain accrued gains that were required to be included in taxable income upon subsequent realization. In second quarter 2010, clarifying legislative amendments to the Australian consolidation tax rules were enacted. These amendments enable us to reduce the inclusion of certain of these accrued gains, resulting in a permanent decrease in taxable income. The impact of the amendment is a current tax recovery of $78 million recorded in second quarter 2010.
Dividend Withholding Tax
In fourth quarter 2010, we recorded a $74 million dollar dividend withholding current tax expense in respect of funds available to be repatriated from a foreign subsidiary.
Canadian Functional Currency Election
In fourth quarter 2008, we filed an election under Canadian draft legislation to prepare some of our Canadian tax returns using US dollar functional currency effective January 1, 2008. The legislation was enacted in first quarter 2009 which resulted in a one-time benefit of $70 million.
Canadian Tax Rate Changes
In fourth quarter 2009, a provincial rate change was enacted in Canada that lowered the applicable tax rate. The impact of this tax rate change was to reduce net deferred tax assets in Canada by $59 million, recorded as a component of deferred tax expense.
Reconciliation to Canadian Statutory Rate
For the years ended December 31 | | 2010 | | 2009 | | 2008 | |
At 31% (2009: 33%; 2008: 33.50%) statutory rate | | $ | 1,422 | | $ | (1,198 | ) | $ | 522 | |
Increase (decrease) due to: | | | | | | | |
Allowances and special tax deductions(1) | | (168 | ) | (110 | ) | (100 | ) |
Impact of foreign tax rates(2) | | 73 | | 1,786 | | (86 | ) |
Expenses not tax deductible | | 25 | | 16 | | 13 | |
Impairment charges not tax deductible | | — | | 21 | | 199 | |
Gain on acquisition of assets not taxable | | — | | (18 | ) | — | |
Net currency translation (gains)/losses on deferred tax balances | | (2 | ) | (40 | ) | 98 | |
Canadian functional currency election | | — | | (70 | ) | — | |
Impact of legislative amendments in Australia | | (78 | ) | — | | — | |
Release of valuation allowances | | (129 | ) | — | | (175 | ) |
Valuation allowances set up against current year tax losses | | 73 | | 163 | | 74 | |
Canadian tax rate changes | | — | | 59 | | — | |
Dividend withholding tax | | 74 | | — | | — | |
Other withholding taxes | | 21 | | 16 | | 21 | |
Mining taxes(3) | | 48 | | 21 | | 19 | |
Other items | | 11 | | 2 | | 9 | |
Income tax expense | | $ | 1,370 | | $ | 648 | | $ | 594 | |
(1) We are able to claim certain allowances and tax deductions unique to extractive industries that result in a lower effective tax rate.
(2) We operate in multiple foreign tax jurisdictions that have tax rates different than the Canadian statutory rate. Additionally, we have reinvested earnings and cash flow generated by the Zaldívar mine in Chile to fund a portion of the construction cost of Pascua-Lama. The reinvestment of these earnings and cash flow resulted in a lower tax rate applied for the period. Amounts in 2009 include the impact of the elimination of gold sales contracts in a low tax jurisdiction.
(3) For 2010, this includes the impact of adopting the new Chilean specific mining tax (royalty).
123
Notes to Consolidated Financial Statements
10 · Earnings (loss) per share
For the years ended December 31
($ millions, except shares in millions | | 2010 | | 2009 | | 2008 | |
and per share amounts in dollars) | | Basic | | Diluted | | Basic | | Diluted | | Basic | | Diluted | |
Income (loss) from continuing operations | | $ | 3,153 | | $ | 3,153 | | $ | (4,371 | ) | $ | (4,371 | ) | $ | 889 | | $ | 889 | |
Plus: interest on convertible debentures | | — | | — | | — | | — | | — | | 3 | |
Income (loss) available to common shareholders and after assumed conversions | | 3,153 | | 3,153 | | (4,371 | ) | (4,371 | ) | 889 | | 892 | |
Income (loss) from discontinued operations | | 121 | | 121 | | 97 | | 97 | | (104 | ) | (104 | ) |
Net income (loss) | | $ | 3,274 | | $ | 3,274 | | $ | (4,274 | ) | $ | (4,274 | ) | $ | 785 | | $ | 788 | |
Weighted average shares outstanding | | 987 | | 987 | | 903 | | 903 | | 872 | | 872 | |
Effect of dilutive securities | | | | | | | | | | | | | |
Stock options | | — | | 2 | | — | | — | | — | | 4 | |
Convertible debentures | | — | | 8 | | — | | — | | — | | 9 | |
| | 987 | | 997 | | 903 | | 903 | | 872 | | 885 | |
Earnings (loss) per share | | | | | | | | | | | | | |
Income (loss) from continuing operations | | $ | 3.19 | | $ | 3.16 | | $ | (4.84 | ) | $ | (4.84 | ) | $ | 1.02 | | $ | 1.01 | |
Net income (loss) | | $ | 3.32 | | $ | 3.28 | | $ | (4.73 | ) | $ | (4.73 | ) | $ | 0.90 | | $ | 0.89 | |
Earnings per share is computed by dividing net income available to common shareholders by the weighted average number of common shares outstanding for the period. Diluted earnings per share reflect the potential dilution that could occur if additional common shares are assumed to be issued under securities that entitle their holders to obtain common shares in the future. For stock options, the number of additional shares for inclusion in diluted earnings per share calculations is determined using the treasury stock method. Under this method, stock options, whose exercise price is less than the average market price of our common shares, are assumed to be exercised and the proceeds are used to repurchase common shares at the average market price for the period. The incremental number of common shares issued under stock options and repurchased from proceeds is included in the calculation of diluted earnings per share. For convertible debentures, the number of additional shares for inclusion in diluted earnings per share calculations is determined using the as if converted method. The incremental number of common shares issued is included in the number of weighted average shares outstanding and interest on the convertible debentures is excluded from the calculation of income.
124
Barrick Financial Report 2010 | Notes to Consolidated Financial Statements
11 · Cash Flow – Other Items
a) Operating Cash Flows – Other Items
For the years ended December 31 | | 2010 | | 2009 | | 2008 | |
Adjustments for non-cash income statement items: | | | | | | | |
Currency translation losses (note 8a) | | $ | 26 | | $ | 8 | | $ | 37 | |
Amortization of premium on debt securities (note 20b) | | (6 | ) | (6 | ) | (7 | ) |
Amortization of debt issue costs (note 20b) | | 4 | | 6 | | 7 | |
Stock option expense (note 28a) | | 14 | | 20 | | 25 | |
Loss from equity in investees (note 12) | | 41 | | 87 | | 64 | |
Gain on sale of investments (note 8c) | | (12 | ) | (6 | ) | (59 | ) |
Losses on write-down of inventory (note 13) | | 3 | | 6 | | 62 | |
Non-controlling interests (notes 2b and 27) | | 23 | | 6 | | 12 | |
Net change in current operating assets and liabilities, excluding inventory | | 195 | | 148 | | 7 | |
Revisions to AROs (note 22) | | 8 | | 10 | | 9 | |
Settlement of AROs (note 22) | | (44 | ) | (39 | ) | (38 | ) |
Amortization of hedge gains/losses on acquired gold hedge position | | (2 | ) | (10 | ) | (2 | ) |
Other net operating activities | | $ | 250 | | $ | 230 | | $ | 117 | |
Operating cash flow includes payments for: | | | | | | | |
Pension plan contributions (note 29a) | | $ | 56 | | $ | 50 | | $ | 47 | |
Cash interest paid | | 400 | | 311 | | 213 | |
b) Investing Cash Flows – Other Items
For the years ended December 31 | | 2010 | | 2009 | | 2008 | |
Funding for equity investees (note 12) | | $ | (51 | ) | $ | (80 | ) | $ | (107 | ) |
Loans to joint venture partners | | — | | — | | (4 | ) |
Purchase of land and water rights | | — | | — | | (16 | ) |
Purchases of royalties | | — | | — | | (42 | ) |
Long-term supply contract | | — | | — | | (35 | ) |
Other | | — | | (7 | ) | (27 | ) |
Other net investing activities | | $ | (51 | ) | $ | (87 | ) | $ | (231 | ) |
c) Financing Cash Flows – Other Items
For the years ended December 31 | | 2010 | | 2009 | | 2008 | |
Financing fees on long-term debt | | $ | (37 | ) | $ | (16 | ) | $ | (11 | ) |
Derivative settlements | | 12 | | (10 | ) | (23 | ) |
Other net financing activities | | $ | (25 | ) | $ | (26 | ) | $ | (34 | ) |
125
Notes to Consolidated Financial Statements
12 · Equity in Investees and Other Investments
a) Equity Method Investment Continuity
| | Highland | | Atacama(1) | | Cerro Casale | | Donlin Creek | | Kabanga | | Total | |
At January 1, 2008 | | $ | 169 | | $ | 118 | | $ | 734 | | $ | 64 | | $ | — | | $ | 1,085 | |
Purchases | | 1 | | — | | 41 | | — | | — | | 42 | |
Equity pick-up (loss) from equity investees | | 5 | | (32 | ) | (11 | ) | (17 | ) | (9 | ) | (64 | ) |
Capitalized interest | | — | | 9 | | 42 | | 4 | | — | | 55 | |
Funding | | — | | 62 | | 9 | | 27 | | 9 | | 107 | |
Impairment charges | | (140 | ) | — | | — | | — | | — | | (140 | ) |
At January 1, 2009 | | 35 | | 157 | | 815 | | 78 | | — | | 1,085 | |
Equity pick-up (loss) from equity investees | | 6 | | (39 | ) | (21 | ) | (18 | ) | (15 | ) | (87 | ) |
Capitalized interest | | — | | 8 | | 46 | | 4 | | — | | 58 | |
Funding | | — | | 31 | | 21 | | 11 | | 17 | | 80 | |
At January 1, 2010 | | 41 | | 157 | | 861 | | 75 | | 2 | | 1,136 | |
Equity pick-up (loss) from equity investees | | 12 | | (19 | ) | (6 | ) | (22 | ) | (6 | ) | (41 | ) |
Capitalized interest | | — | | 8 | | 12 | | 4 | | — | | 24 | |
Funding | | — | | 12 | | 12 | | 22 | | 5 | | 51 | |
Transfer to property, plant and equipment(2) | | — | | — | | (879 | ) | — | | — | | (879 | ) |
At December 31, 2010 | | $ | 53 | | $ | 158 | | $ | — | | $ | 79 | | $ | 1 | | $ | 291 | |
Publicly traded | | Yes | | No | | No | | No | | No | | | |
(1) Represents our investment in Reko Diq.
(2) The carrying amount of the Cerro Casale investment has been transferred to property, plant and equipment as a result of our obtaining control over the entity due to the acquisition of an additional 25% interest. See note 3f for further details.
Accounting Policy for Equity Method Investments
Under the equity method, we record our equity share of the income or loss of equity investees each period. On acquisition of an equity investment, the underlying identifiable assets and liabilities of an equity investee are recorded at fair value and the income or loss of equity investees is based on these fair values. For an investment in a company that represents a business, if the cost of any equity investment exceeds the total amount of the fair value of identifiable assets and liabilities, any excess is accounted for in a manner similar to goodwill, with the exception that an annual goodwill impairment test is not required. Additional funding into an investee is recorded as an increase in the carrying value of the investment. The carrying amount of each investment in a publicly traded equity investee is evaluated for impairment using the same method as an available-for-sale security.
Our investments in non-publicly traded equity investees are exploration and development projects; therefore, we assess if there has been a potential impairment triggering event for an other-than-temporary impairment by: testing the underlying assets of the equity investee for recoverability; and assessing if there has been a change in the mining plan or strategy for the project. If we determine underlying assets are recoverable and no other potential impairment conditions were identified, then our investment in the non-publicly traded equity investee is carried at cost. If the other underlying assets are not recoverable, we record an impairment charge equal to the difference between the carrying amount of the investee and its fair value. Where reliable information is available, we determine fair value based on the present value of cash flows expected to be generated by the investee. Where reliable cash flow information is not available, we determine fair value using a market comparable approach.
126
Barrick Financial Report 2010 | Notes to Consolidated Financial Statements
b) Other Investments
At December 31 | | 2010 | | 2009 | |
Available-for-sale securities | | $ | 171 | | $ | 61 | |
Other investments | | 32 | | 31 | |
| | $ | 203 | | $ | 92 | |
Available-for-sale Securities
| | | | 2010 | | | | 2009 | |
| | Fair | | Gains | | Fair | | Gains | |
At December 31 | | value(1) | | in OCI | | value | | in OCI | |
Securities in an unrealized gain position | | | | | | | | | |
Equity securities | | $ | 169 | | $ | 85 | | $ | 54 | | $ | 27 | |
Benefit plans(2) | | | | | | | | | |
Fixed-income | | — | | — | | 1 | | — | |
Equity | | — | | — | | 5 | | — | |
| | 169 | | 85 | | 60 | | 27 | |
Securities in an unrealized loss position | | | | | | | | | |
Other equity securities(3) | | 2 | | — | | 1 | | — | |
| | 171 | | 85 | | 61 | | 27 | |
Other investments | | | | | | | | | |
Long-term loan receivable(4) | | 32 | | — | | 31 | | — | |
| | $ | 203 | | $ | 85 | | $ | 92 | | $ | 27 | |
(1) Refer to note 21 for further information on the measurement of fair value.
(2) Under various benefit plans for certain former Homestake executives, a portfolio of marketable fixed-income and equity securities are held in a rabbi trust that is used to fund obligations under the plans.
(3) Other equity securities in a loss position consist of investments in various junior mining companies.
(4) The long-term loan receivable is measured at amortized cost. The principal amount is $35 million.
Gains on Investments Recorded in Earnings
| | 2010 | | 2009 | | 2008 | |
Gains realized on sales | | $ | 12 | | $ | 6 | | $ | 59 | |
Cash proceeds from sales | | $ | 15 | | $ | 7 | | $ | 76 | |
Accounting Policy for Available-for-Sale Securities
Available-for-sale securities are recorded at fair value with unrealized gains and losses recorded in other comprehensive income (“OCI”). Realized gains and losses are recorded in earnings when investments mature or on sale, calculated using the average cost of securities sold. If the fair value of an investment declines below its carrying amount, we undertake an assessment of whether the impairment is other than temporary. We consider all relevant facts and circumstances in this assessment, particularly: the length of time and extent to which fair value has been less than the carrying amount; the financial condition and near-term prospects of the investee, including any specific events that have impacted its fair value; both positive and negative evidence that the carrying amount is recoverable within a reasonable period of time; and our ability and intent to hold the investment for a reasonable period of time sufficient for an expected recovery of the fair value up to or beyond the carrying amount. We record in earnings any unrealized declines in fair value judged to be other than temporary.
13 · Inventories
| | Gold | | Copper | |
At December 31 | | 2010 | | 2009 | | 2010 | | 2009 | |
Raw materials | | | | | | | | | |
Ore in stockpiles | | $ | 1,440 | | $ | 1,052 | | $ | 110 | | $ | 77 | |
Ore on leach pads | | 242 | | 215 | | 156 | | 172 | |
Mine operating supplies | | 563 | | 488 | | 25 | | 19 | |
Work in process | | 265 | | 215 | | 48 | | 5 | |
Finished products | | | | | | | | | |
Gold doré | | 75 | | 69 | | — | | — | |
Copper cathode | | — | | — | | 15 | | 4 | |
Gold concentrate | | 19 | | 20 | | — | | — | |
| | 2,604 | | 2,059 | | 354 | | 277 | |
Non-current ore in stockpiles(1) | | (958 | ) | (679 | ) | (148 | ) | (117 | ) |
| | $ | 1,646 | | $ | 1,380 | | $ | 206 | | $ | 160 | |
(1) Ore that we do not expect to process in the next 12 months is classified within other assets.
Accounting Policy for Inventory
Material extracted from our mines is classified as either ore or waste. Ore represents material that, at the time of extraction, we expect to process into a saleable form, and sell at a profit. Ore is recorded as an asset that is classified within inventory as material is extracted from the open pit or underground mine. Ore is accumulated in stockpiles that are subsequently processed into gold/copper in a saleable form under a mine plan that takes into consideration optimal scheduling of production of our reserves, present plant capacity, and the market price of gold/copper. Gold/copper work in process represents gold/copper in the processing circuit that we count as production but is not yet in a saleable form.
Gold and copper ore contained in stockpiles is measured by estimating the number of tons added and removed from the stockpile, and the associated estimate of gold and copper contained therein (based on assay data) and applying estimated metallurgical recovery rates (based on the expected processing method). Stockpile ore tonnages are verified by periodic surveys. Costs are allocated to ore stockpiles based on quantities
127
Notes to Consolidated Financial Statements
of material stockpiled using current mining costs incurred up to the point of stockpiling the ore and including allocations of waste mining costs, overheads, depreciation, depletion and amortization relating to mining operations. As ore is processed, costs are removed based on recoverable quantities of gold and/or copper and each stockpile’s average cost per unit. Ore stockpiles are reduced by provisions required to reduce inventory to net realizable value.
We record gold in process, gold doré and gold in concentrate form at average cost, less provisions required to reduce inventory to market value. Average cost is calculated based on the cost of inventory at the beginning of a period, plus the cost of inventory produced in a period. Costs capitalized to in process and finished goods inventory include the cost of stockpiles processed; direct and indirect materials and consumables; direct labor; repairs and maintenance; utilities; amortization of property, plant and equipment; and local mine administrative expenses. Costs are removed from inventory and recorded in cost of sales and amortization expense based on the average cost per ounce of gold in inventory. Mine operating supplies are recorded at the lower of purchase cost and market value.
We record provisions to reduce inventory to net realizable value, to reflect changes in economic factors that impact inventory value or to reflect present intentions for the use of slow moving and obsolete supplies inventory.
For the years ended December 31 | | 2010 | | 2009 | | 2008 | |
Inventory impairment charges | | $ | 3 | | $ | 6 | | $ | 62 | |
| | | | | | | | | | |
Ore on leach pads
The recovery of gold and copper from certain oxide ores is achieved through the heap leaching process. Our Pierina, Lagunas Norte, Veladero, Cortez, Bald Mountain, Round Mountain, Ruby Hill and Marigold mines all use a heap leaching process for gold and our Zaldívar mine uses a heap leaching process for copper. Under this method, ore is placed on leach pads where it is treated with a chemical solution, which dissolves the gold or copper contained in the ore. The resulting “pregnant” solution is further processed in a plant where the gold or copper is recovered. For accounting purposes, costs are added to ore on leach pads based on current mining and leaching costs, including applicable depreciation, depletion and amortization relating to mining operations. Costs are removed from ore on leach pads as ounces or pounds are recovered based on the average cost per recoverable ounce of gold or pound of copper on the leach pad.
Estimates of recoverable gold or copper on the leach pads are calculated from the quantities of ore placed on the leach pads (measured tons added to the leach pads), the grade of ore placed on the leach pads (based on assay data) and a recovery percentage (based on ore type).
Although the quantities of recoverable gold or copper placed on the leach pads are reconciled by comparing the grades of ore placed on pads to the quantities of gold or copper actually recovered (metallurgical balancing), the nature of the leaching process inherently limits the ability to precisely monitor inventory levels. As a result, the metallurgical balancing process is regularly monitored and estimates are refined based on actual results over time. Historically, our operating results have not been materially impacted by variations between the estimated and actual recoverable quantities of gold or copper on our leach pads. At December 31, 2010, the weighted average cost per recoverable ounce of gold and recoverable pound of copper on leach pads was $547 per ounce and $1.10 per pound, respectively (2009: $383 per ounce of gold and $1.01 per pound of copper). Variations between actual and estimated quantities resulting from changes in assumptions and estimates that do not result in write-downs to net realizable value are accounted for on a prospective basis.
The ultimate recovery of gold or copper from a leach pad will not be known until the leaching process is concluded. Based on current mine plans, we expect to place the last ton of ore on our current leach pads at dates for gold ranging from 2011 to 2027 and for copper ranging from 2011 to 2027. Including the estimated time required for residual leaching, rinsing and reclamation activities, we expect that our leaching operations will terminate within a period of up to six years following the date that the last ton of ore is placed on the leach pad.
The current portion of ore inventory on leach pads is determined based on estimates of the quantities of gold or copper at each balance sheet date that we expect to recover during the next 12 months.
128
Barrick Financial Report 2010 | Notes to Consolidated Financial Statements
Ore in Stockpiles
At December 31 | | 2010 | | 2009 | | Year(1) | |
Gold | | | | | | | |
Goldstrike | | | | | | | |
Ore that requires roasting | | $ | 499 | | $ | 452 | | 2025 | |
Ore that requires autoclaving | | 42 | | 46 | | 2024 | |
Kalgoorlie | | 89 | | 80 | | 2021 | |
Porgera | | 140 | | 117 | | 2024 | |
Cowal | | 93 | | 88 | | 2019 | |
Veladero | | 21 | | 26 | | 2024 | |
Cortez | | 365 | | 98 | | 2027 | |
Turquoise Ridge | | 14 | | 15 | | 2036 | |
Other | | 177 | | 130 | | | |
Copper | | | | | | | |
Zaldívar | | 110 | | 77 | | 2026 | |
| | $ | 1,550 | | $ | 1,129 | | | |
(1) Year in which we expect to complete full processing of the ore in stockpiles.
Ore on Leachpads
At December 31 | | 2010 | | 2009 | | Year(1) | |
Gold | | | | | | | |
Veladero | | $ | 87 | | $ | 75 | | 2011 | |
Cortez | | 16 | | 25 | | 2011 | |
Ruby Hill | | 10 | | 24 | | 2011 | |
Bald Mountain | | 15 | | 24 | | 2011 | |
Lagunas Norte | | 17 | | 22 | | 2011 | |
Round Mountain | | 25 | | 18 | | 2011 | |
Pierina | | 53 | | 14 | | 2011 | |
Marigold | | 19 | | 13 | | 2011 | |
Copper | | | | | | | |
Zaldívar | | 156 | | 172 | | 2011 | |
| | $ | 398 | | $ | 387 | | | |
(1) Year in which we expect to complete full processing of the ore on leachpads.
Purchase Commitments
At December 31, 2010, we had purchase obligations for supplies and consumables of approximately $1,449 million.
14 · Accounts Receivable and Other Current Assets
At December 31 | | 2010 | | 2009 | |
Accounts receivable | | | | | |
Amounts due from concentrate sales | | $ | 22 | | $ | 9 | |
Amounts due from copper cathode sales | | 159 | | 109 | |
Other receivables | | 165 | | 133 | |
| | $ | 346 | | $ | 251 | |
Other current assets | | | | | |
Derivative assets (note 20e) | | $ | 615 | | $ | 214 | |
Goods and services taxes recoverable(1) | | 211 | | 201 | |
Deferred share-based compensation (note 28b) | | 13 | | 7 | |
Prepaid expenses | | 95 | | 92 | |
Other | | 13 | | 10 | |
| | $ | 947 | | $ | 524 | |
(1) 2010 includes $59 million and $132 million in VAT and fuel tax receivables in Africa and South America, respectively (2009: $50 million and $111 million, respectively).
129
Notes to Consolidated Financial Statements
15 · Property, Plant and Equipment
| | Assets | | | | | | Exploration | | | | | |
| | subject to | | Accumulated | | Capital | | properties | | Construction | | | |
| | amortization(1),(2) | | amortization | | Projects(6) | | & VBPP | | in progress(3) | | Total | |
At January 1, 2008 | | $ | 14,073 | | $ | (7,598 | ) | $ | 1,089 | | $ | 474 | | $ | 397 | | $ | 8,435 | |
Additions | | 584 | | (155 | ) | 756 | | — | | 626 | | 1,811 | |
Acquisitions | | 1,609 | | — | | — | | 409 | | — | | 2,018 | |
Capitalized interest(5) | | 57 | | — | | 102 | | 8 | | — | | 167 | |
Amortization | | — | | (912 | ) | — | | — | | — | | (912 | ) |
Impairments | | (14 | ) | — | | — | | — | | — | | (14 | ) |
Transfers between categories(4) | | 481 | | — | | (31 | ) | (178 | ) | (272 | ) | — | |
At January 1, 2009 | | 16,790 | | (8,665 | ) | 1,916 | | 713 | | 751 | | 11,505 | |
Additions | | 445 | | 21 | | 1,207 | | 3 | | 608 | | 2,284 | |
Acquisitions | | 276 | | — | | — | | — | | — | | 276 | |
Capitalized interest(5) | | 71 | | — | | 132 | | 8 | | — | | 211 | |
Amortization | | — | | (1,033 | ) | — | | — | | — | | (1,033 | ) |
Impairments | | (56 | ) | — | | (122 | ) | — | | — | | (178 | ) |
Currency translation adjustment | | 60 | | — | | — | | — | | — | | 60 | |
Transfers between categories(4) | | 1,130 | | — | | (616 | ) | (92 | ) | (422 | ) | — | |
At January 1, 2010 | | 18,716 | | (9,677 | ) | 2,517 | | 632 | | 937 | | 13,125 | |
Additions | | 533 | | 43 | | 1,957 | | (1 | ) | 1,032 | | 3,564 | |
Acquisitions | | 252 | | — | | 1,732 | | 116 | | — | | 2,100 | |
Capitalized interest(5) | | 14 | | — | | 241 | | 10 | | — | | 265 | |
Amortization | | — | | (1,331 | ) | — | | — | | — | | (1,331 | ) |
Currency translation adjustment | | 28 | | — | | — | | — | | — | | 28 | |
Transfers between categories(4) | | 1,263 | | — | | 5 | | (64 | ) | (1,204 | ) | — | |
At December 31, 2010 | | $ | 20,806 | | $ | (10,965 | ) | $ | 6,452 | | $ | 693 | | $ | 765 | | $ | 17,751 | |
(1) �� Represents capitalized reserve acquisition and development costs and buildings, plant and equipment.
(2) Includes assets under capital leases, leach pads and tailings dams.
(3) Includes construction in process for tangible assets at operating mines, as well as deposits on long lead capital items. Once an asset is available for use, it is transferred to assets subject to amortization and amortized over its estimated useful life.
(4) Includes construction in process that is transferred to buildings, plant and equipment as the asset is available for use and value beyond proven and probable reserves (“VBPP”) that is transferred to capitalized reserve acquisition and development costs, once mineralized material is converted into proven and probable reserves. In 2009, Buzwagi transitioned from a development project to an operating mine and its property, plant, and equipment balance was transferred from exploration properties, capital projects & VBPP to assets subject to amortization and construction in progress.
(5) Capitalized interest for assets subject to amortization primarily reflects capitalized interest at Cortez Hills.
(6) Includes construction in process for tangible assets at capital projects.
a) Accounting Policy for Property, Plant and Equipment
Capitalized Reserve Acquisition Costs
We capitalize the cost of acquisition of land and mineral rights. On acquiring a mineral or petroleum and natural gas property, we estimate the fair value of proven and probable reserves, and we record these amounts as assets at the date of acquisition. When production begins, capitalized reserve acquisition costs are amortized using the units-of-production (“UOP”) method, whereby the numerator is the number of ounces of gold/pounds of copper/barrels of oil equivalent (boe) produced and the denominator is the estimated recoverable ounces of gold/pounds of copper/boe contained in proven and probable reserves.
Value Beyond Proven and Probable Reserves (“VBPP”)
On acquisition of mineral property, we prepare an estimate of the fair value of the resources and exploration potential of that property and record this amount as an asset (VBPP) as at the date of acquisition. As part of our annual business cycle, we prepare estimates of proven and probable gold and copper mineral reserves for each mineral property. The change in reserves, net of production is used to determine the amount to be converted from VBPP to proven and probable reserves subject to amortization. For 2010 the effect on amortization expense of transfers from VBPP to proven and probable reserves is an increase of $3 million (2009: $3 million increase; 2008: $5 million increase).
130
Barrick Financial Report 2010 | Notes to Consolidated Financial Statements
| | VBPP | |
At January 1, 2008 | | $ | 313 | |
VBPP conversion to reserves | | (178 | ) |
Acquisitions(1) | | 381 | |
At January 1, 2009 | | 516 | |
VBPP conversion to reserves | | (93 | ) |
At January 1, 2010 | | $ | 423 | |
VBPP conversion to reserves | | (64 | ) |
At December 31, 2010 | | $ | 359 | |
(1) Represents VBPP acquired on acquisition of the additional 40% interest in Cortez.
Capitalized Development Costs
Capitalized development costs include the costs of removing overburden and waste materials at our open pit mining operations prior to the commencement of production; costs incurred to access reserves at our underground mining operations; exploration expenditures incurred that meet the definition of an asset (refer to note 7 for capitalization criteria for drilling and related costs), and qualifying development costs incurred at our petroleum and natural gas properties.
The costs of removing overburden and waste materials to access the ore body at an open pit mine prior to the production phase are referred to as “pre-stripping costs”. Pre-stripping costs are capitalized during the development of an open pit mine. Where a mine operates several open pits that utilize common processing facilities, we capitalize the pre-stripping costs associated with each pit. The production phase of an open pit mine commences when saleable materials, beyond a de minimus amount, are produced. Stripping costs incurred during the production phase of a mine are variable production costs that are included as a component of inventory to be recognized as a component of cost of sales in the same period as the revenue from the sale of inventory. Capitalized pre-stripping costs are amortized using the UOP method, whereby the denominator is the estimated recoverable ounces of gold/pounds of copper in proven and probable reserves in the associated open pit.
At our underground mines, we incur development costs to build new shafts, drifts and ramps that will enable us to physically access ore underground. The time over which we will continue to incur these costs depends on the mine life, which could in some cases be greater than 25 years. These underground development costs are capitalized as incurred. Costs incurred and capitalized to enable access to specific ore blocks or areas of the mine, and which only provide an economic benefit over the period of mining that ore block or area, are amortized using the UOP method, whereby the denominator is estimated recoverable ounces of gold/pounds of copper contained in proven and probable reserves within that ore block or area. If capitalized underground development costs provide an economic benefit over the entire mine life, the costs are amortized using the UOP method, whereby the denominator is the estimated recoverable ounces of gold/pounds of copper contained in total accessible proven and probable reserves.
For our petroleum and natural gas properties, we follow the successful efforts method of accounting, whereby exploration expenditures which are either general in nature or related to an unsuccessful drilling program are expensed. Only costs which relate directly to the discovery and development of specific commercial oil and gas reserves are capitalized as development costs and amortized using the UOP method, whereby the denominator is the estimated recoverable amount of boe in proven developed reserves.
Buildings, Plant and Equipment
We record buildings, plant and equipment at cost, which includes all expenditures incurred to prepare an asset for its intended use. Cost includes the purchase price; brokers’ commissions; and installation costs including architectural, design and engineering fees, legal fees, survey costs, site preparation costs, freight charges, transportation insurance costs, duties, testing and preparation charges. In addition, if the cost of an asset acquired other than through a business combination is different from its tax basis on acquisition, the cost is adjusted to reflect the related future income tax consequences.
We capitalize costs that extend the productive capacity or useful economic life of an asset. Costs incurred that do not extend the productive capacity or useful economic life of an asset are considered repairs and maintenance and expensed as incurred. We amortize the capitalized cost of assets less any estimated residual value, using the straight-line method over the estimated useful economic life of the asset based on their expected use in our business. The longest estimated useful economic life for buildings and equipment at ore processing facilities is 25 years and for mining equipment is 15 years. Depreciation of oil and gas plants and related facilities is calculated using the UOP method.
In the normal course of our business, we have entered into certain leasing arrangements whose conditions meet the criteria for the leases to be classified as capital leases. For capital leases, we record an asset and an obligation at an amount equal to the present value at the beginning of the lease term of minimum lease payments over the lease term. In the case of our capital leasing arrangements, there is transfer of ownership of the leased assets to us at the end of the lease term and therefore we amortize these assets on a basis consistent with our other owned assets. As at December 31, 2010, the carrying value of our capital leases is $72 million.
131
Notes to Consolidated Financial Statements
Exploration Properties and Development Projects
The amounts capitalized to exploration and development projects comprise the cost of mineral interests acquired either as individual asset purchases or as part of a business combination. The amount capitalized to development projects with proven and probable reserves also includes the capitalization cost associated with developing and constructing the mine. The value of such assets is primarily driven by the nature and amount of mineralized material contained in such properties. Exploration and development stage mineral interests represent interests in properties that contain proven and probable reserves or are believed to potentially contain mineralized material consisting of (i) other mineralized material such as measured, indicated and inferred material; (ii) other mine exploration potential such as inferred material not immediately adjacent to existing reserves and mineralization but located within the immediate mine area; (iii) other mine-related exploration potential that is not part of measured, indicated or inferred material greenfield exploration potential; and (iv) any acquired right to explore and develop a potential mineral deposit.
Amounts capitalized to capital projects include costs associated with the construction of tangible assets, such as processing plants, permanent housing facilities and other tangible infrastructure associated with the project.
Exploration Properties, Capital Projects and VBPP
| | Carrying amount | | Carrying amount | |
| | at December 31, | | at December 31, | |
| | 2010 | | 2009 | |
Exploration projects and other land positions | | | | | |
Papua New Guinea land positions | | $ | 194 | | $ | 187 | |
Tanzanian exploration properties(1) | | 82 | | — | |
REN joint venture | | 36 | | — | |
Other | | 22 | | 22 | |
Value beyond proven and probable reserves at producing mines | | 359 | | 423 | |
Capital projects(2) | | | | | |
Pascua-Lama | | 2,164 | | 1,196 | |
Pueblo Viejo | | 2,502 | | 1,321 | |
Cerro Casale(3) | | 1,786 | | — | |
| | $ | 7,145 | | $ | 3,149 | |
(1) Represents amounts allocated to exploration properties as a result of the Tusker acquisition. See note 3b for further details.
(2) The carrying amounts for the Donlin Creek, Reko Diq, and Kabanga projects are reflected in the carrying amounts of the equity investments through which they are owned. Refer to note 12.
(3) The carrying amount for the Cerro Casale investment has been transferred to property, plant and equipment in 2010 as a result of our obtaining control of the entity due to the acquisition of an additional 25% interest. Refer to note 3f.
Capitalized Interest
Interest cost is considered an element of the historical cost of an asset when a period of time is necessary to prepare it for its intended use. We capitalize interest costs to exploration properties and development projects prior to when production begins while exploration, development or construction activities are in progress. We also capitalize interest costs on the cost of certain equity method investments, wherein the only significant assets are exploration properties or capital projects, and while exploration, development or construction activities are in progress. For 2010, we capitalized $289 million of interest costs (2009: $269 million).
Gold and Copper Mineral Reserves
At the end of each fiscal year, as part of our annual business cycle, we prepare estimates of proven and probable gold and copper mineral reserves for each mineral property. We prospectively revise calculations of amortization expense for property, plant and equipment amortized using the UOP method, whereby the denominator is estimated recoverable ounces of gold/pounds of copper. The effect of changes in reserve estimates on amortization expense for 2010 was $nil (2009: $70 million decrease; 2008: $57 million decrease).
b) Amortization and Accretion
| | 2010 | | 2009 | | 2008 | |
Amortization | | $ | 1,149 | | $ | 1,016 | | $ | 912 | |
Accretion (note 22) | | 47 | | 57 | | 45 | |
| | $ | 1,196 | | $ | 1,073 | | $ | 957 | |
c) Impairment Evaluations
Producing Mines, Development Projects and Petroleum & Natural Gas Properties
We review and test the carrying amounts of assets when events or changes in circumstances suggest that the carrying amount may not be recoverable. We group assets at the lowest level for which identifiable cash flows are largely independent of the cash flows of other assets and liabilities. For operating mines, capital projects and petroleum and natural gas properties, the individual mine/project/property is a single reporting unit for impairment testing purposes. A potential impairment is identified if the sum of the reporting unit’s undiscounted cash flows is less than its carrying amount. When a potential long-lived asset impairment is identified, the amount of impairment is calculated by comparing its fair value to its carrying amount.
132
Barrick Financial Report 2010 | Notes to Consolidated Financial Statements
Long-lived assets subject to potential impairment at mine sites/capital projects/petroleum and natural gas properties include buildings, plant and equipment, capitalized reserve acquisition and development costs and VBPP. For impairment assessment purposes, the estimated fair value of buildings, plant and equipment is based on a combination of current depreciated replacement cost and current market value. The estimated fair value of capitalized reserve acquisition, development costs and VBPP is determined using an income approach which measures the present value of the related cash flows expected to be derived from the asset.
Exploration Properties
After acquisition, various factors can affect the recoverability of the capitalized cost of land and mineral rights, particularly the results of exploration drilling. The length of time between the acquisition of land and mineral rights and when we undertake exploration work varies based on the prioritization of our exploration projects and the size of our exploration budget. If we determine that a potential impairment condition may exist, we compare the sum of the undiscounted cash flows expected to be generated from the project to its carrying amount. If the sum of undiscounted cash flows is less than the carrying amount, an impairment charge is recognized if the carrying amount of the individual long-lived assets within the group exceeds their fair value. For projects that do not have reliable cash flow projections, a market approach is applied.
In 2010, we did not record any impairment charge related to our exploration properties. In 2008, we completed a bankable feasibility study (“BFS”) for our Sedibelo platinum project in South Africa meeting the conditions for a 10% interest in the property. We also held the right to increase our interest to 65% in return for a decision to develop Sedibelo and payment of approximately $106 million in fourth quarter 2009. In third quarter 2009, after conducting a thorough review of development alternatives to maximize the project’s potential, we decided not to proceed with this payment to increase our ownership interest in Sedibelo. As a consequence of this decision, we recorded an impairment charge of $158 million in third quarter 2009, reducing the carrying amount of our investment in the project and related assets to their estimated fair values.
d) Capital Commitments
In addition to entering into various operational commitments in the normal course of business, we had commitments of approximately $1,254 million at December 31, 2010 for construction activities at our capital projects.
e) Insurance
We purchase insurance coverage for certain insurable losses, subject to varying deductibles, at our mineral properties and corporate locations including losses such as property damage and business interruption. We record losses relating to insurable events as they occur. Proceeds receivable from insurance coverage are recorded at such time as receipt is probable and the amount receivable is fixed or determinable.
Insurance Proceeds | | 2010 | | 2009 | | 2008 | |
Cost of sales | | $ | 2 | | $ | 18 | | $ | 30 | |
Other income | | 6 | | 26 | | 2 | |
| | $ | 8 | | $ | 44 | | $ | 32 | |
133
Notes to Consolidated Financial Statements
16 · Intangible Assets
| | 2010 | | 2009 | |
| | Gross carrying | | Accumulated | | Net carrying | | Gross carrying | | Accumulated | | Net carrying | |
For the years ended December 31 | | amount | | amortization | | amount | | amount | | amortization | | amount | |
Water rights(1) | | $ | 116 | | $ | — | | $ | 116 | | $ | 40 | | $ | — | | $ | 40 | |
Technology(2) | | 17 | | — | | 17 | | 17 | | — | | 17 | |
Supply contracts(3) | | 23 | | 16 | | 7 | | 24 | | 15 | | 9 | |
| | $ | 156 | | $ | 16 | | $ | 140 | | $ | 81 | | $ | 15 | | $ | 66 | |
Aggregate period amortization expense | | | | $ | 1 | | | | | | $ | — | | | |
For the years ended December 31 | | | | 2011 | | 2012 | | 2013 | | 2014 | | 2015 | |
Estimated aggregate amortization expense | | | | $ | — | | $ | 2 | | $ | 2 | | $ | 2 | | $ | 2 | |
| | | | | | | | | | | | | | | | | | |
(1) Water rights in South America ($116 million) are subject to annual impairment testing and will be amortized when used in the future. In 2010, we recorded a $75 million increase as a result of gaining control of Cerro Casale. Refer to note 3f. In 2009, we increased our investment in water rights for our Sedibelo project by $26 million. We subsequently recorded an impairment charge for water rights related to Sedibelo ($34 million) in third quarter 2009 (note 15c).
(2) The amount will be amortized using the UOP method over the estimated proven and probable reserves of the Pueblo Viejo mine, with no assumed residual value.
(3) Relates to a supply agreement with Michelin North America Inc. to secure a supply of tires and will be amortized upon the commencement of the supply of tires in the future.
Accounting Policy for Intangible Assets
Intangible assets acquired as part of an acquisition of a business are recognized separately from goodwill if the asset is separable or arises from contractual or legal rights. Intangible assets are also recognized when acquired individually or with a group of other assets.
Intangible assets are initially recorded at their estimated fair value. Intangible assets with a finite life are amortized over their useful economic lives on a straight-line or UOP basis, as appropriate. Intangible assets having indefinite lives and intangible assets that are not yet ready for use are not amortized and are reviewed annually for impairment. We also review and test the carrying amounts of all intangible assets when events or changes in circumstances suggest that their carrying amount may not be recoverable.
In second quarter 2010, after restructuring a tire supply agreement, we recorded an impairment charge of $7 million. In third quarter 2009, after making a decision not to continue developing the Sedibleo project, we recorded an impairment charge of $34 million related to water rights at the project.
134
Barrick Financial Report 2010 | Notes to Consolidated Financial Statements
17 · Goodwill
| | Gold | | Copper | | Other | | | |
| | North | | | | South | | | | South | | Barrick | | | |
| | America | | Australia | | America | | Africa | | America | | Energy | | Total | |
At January 1, 2008 | | $ | 2,381 | | $ | 1,815 | | $ | 441 | | $ | 373 | | $ | 743 | | $ | — | | $ | 5,753 | |
Additions(1) | | 23 | | — | | — | | — | | — | | 96 | | 119 | |
Other(2) | | — | | — | | — | | — | | — | | (8 | ) | (8 | ) |
Impairments(3) | | (8 | ) | (272 | ) | — | | (216 | ) | — | | (88 | ) | (584 | ) |
At December 31, 2008 | | 2,396 | | 1,543 | | 441 | | 157 | | 743 | | — | | 5,280 | |
Other(4) | | (20 | ) | — | | — | | — | | — | | — | | (20 | ) |
Impairments(5) | | — | | (63 | ) | — | | — | | — | | — | | (63 | ) |
At December 31, 2009 | | 2,376 | | 1,480 | | 441 | | 157 | | 743 | | — | | 5,197 | |
Additions(6) | | — | | — | | — | | 22 | | — | | 64 | | 86 | |
Other(2) | | — | | — | | — | | — | | — | | 4 | | 4 | |
At December 31, 2010 | | $ | 2,376 | | $ | 1,480 | | $ | 441 | | $ | 179 | | $ | 743 | | $ | 68 | | $ | 5,287 | |
(1) Represents goodwill acquired as a result of the acquisitions of an additional 40% interest in Cortez ($20 million), an additional 40% interest in Storm ($3 million) and Barrick Energy ($96 million).
(2) Represents the impact of foreign exchange rate changes on the translation of Barrick Energy from C$ to US$.
(3) Impairment charges recorded in 2008 related to Kanowna ($272 million), North Mara ($216 million), Barrick Energy ($88 million), and Marigold ($8 million).
(4) Represents a reduction of goodwill as a result of the acquisition of an additional 50% interest in the Hemlo mine (note 3h).
(5) Impairment charge recorded in 2009 related to Plutonic ($63 million).
(6) Represents goodwill acquired as a result of the acquisition of Tusker ($22 million) (note 3b) and Bountiful, Puskwa and Dolomite ($64 million) (note 3a).
Accounting Policy for Goodwill and Goodwill Impairment
Under the purchase method, the costs of business acquisitions are allocated to the assets acquired and liabilities assumed based on the estimated fair value at the date of acquisition. The excess of purchase cost over the net fair value of identified tangible and intangible assets and liabilities acquired represents goodwill that is allocated to reporting units. We believe that goodwill arises principally because of the following factors: 1) The going concern value implicit in our ability to sustain and/or grow our business by increasing reserves and resources through new discoveries; 2) The ability to capture unique synergies that can be realized from managing a portfolio of both acquired and existing mines and mineral properties in our regional business units; and 3) the requirement to record a deferred tax liability for the difference between the assigned values and the tax bases of assets acquired and liabilities assumed in a business combination at amounts that do not reflect fair value.
Each individual mineral property that is an operating mine is a reporting unit for goodwill impairment testing purposes. On an annual basis, as at October 1, and at any other time if events or changes in circumstances indicate that the fair value of a reporting unit has been reduced below its carrying amount, we evaluate the carrying amount of goodwill for potential impairment.
There is no active market for our reporting units. Consequently, when assessing a reporting unit for potential goodwill impairment, we use an income approach (being the net present value of expected future cash flows or net asset value (“NAV”) of the relevant reporting unit) to determine the fair value we could receive for the reporting unit in an arm’s length transaction at the measurement date. Expected future cash flows are based on a probability-weighted approach applied to potential outcomes. Estimates of expected future cash flows reflect estimates of projected future revenues, cash costs of production and capital expenditures contained in our long-term life of mine (“LOM”) plans, which are updated for each reporting unit in the fourth quarter of each fiscal year.
135
Notes to Consolidated Financial Statements
Our LOM plans are based on detailed research, analysis and modeling to optimize the internal rate of return generated from each reporting unit. As such, these plans consider the optimal level of investment, overall production levels and sequence of extraction taking into account all relevant characteristics of the ore body, including waste to ore ratios, ore grades, haul distances, chemical and metallurgical properties impacting process recoveries and capacities of available extraction, haulage and processing equipment. Therefore, the LOM plan is the appropriate basis for forecasting production output in each future year and the related production costs and capital expenditures.
Projected future revenues reflect the forecasted future production levels at each of our reporting units as detailed in our LOM plans. Included in these forecasts is the production of mineral resources that do not currently qualify for inclusion in proven and probable ore reserves where there is a high degree of confidence in its economic extraction. This is consistent with the methodology we use to measure value beyond proven and probable reserves when allocating the purchase price of a business combination to acquired mining assets.
Projected future revenues also reflect our estimated long-term metals prices, which are determined based on current prices, an analysis of the expected total production costs of the producers, forward pricing curves of the particular metal and forecasts of expected long-term metals prices prepared by analysts. These estimates often differ from current price levels, but our methodology is consistent with how a market participant would assess future long-term metals prices. In 2010, we have used estimated 2011, 2012 and long-term gold prices of $1,250, $1,250 and $1,150 per ounce, respectively (2009: short-term $1,050, long-term $950), and estimated 2011, 2012 and long-term copper prices of $3.25, $3.25 and $2.75 per pound, respectively (2009: short-term $2.50, long-term $2.25).
Our estimates of future cash costs of production and capital expenditures are based on the LOM plans for each reporting unit. Costs incurred in currencies other than the US dollar are translated to US dollars using expected long-term exchange rates based on the relevant forward pricing curve. Oil prices are a significant component, both directly and indirectly, of our expected cash costs of production. We have used an estimated average oil price of $75 per barrel (2009: $75), which is based on the spot price, forward pricing curve, and long-term oil price forecasts prepared by analysts.
The discount rate applied to present value the net future cash flows is based upon our real weighted average cost of capital with an appropriate adjustment for the remaining life of a mine and risks associated with the relevant cash flows based on the geographic location of the reporting unit. These risk adjustments were based on observed historical country risk premiums and the average credit default swap spreads for the period. In 2010, we used the following real discount rates for our gold mines with goodwill: United States 2.31% — 3.87% (2009: 3.03% — 4.61% ); Australia 3.05% — 3.83% (2009: 3.53% — 4.45%); Argentina 10.25% (2009: 12.52%); Tanzania 7.12% — 8.67% (2009: 8.79% — 10.37%); Papua New Guinea 8.67% (2009: 8.46%); and Peru 3.76% — 4.53% (2009: 4.87% — 5.78%).The decrease in discount rates compared to the prior year primarily reflects lower risk free borrowing rates. Discount rates for Papua New Guinea increased due to higher country risk premiums. For our copper mine, we used the following real discount rate in 2010: Chile 8.94% (2009: 8.82%). The increase in discount rates compared to the prior year primarily reflects a higher country risk premium.
For our gold reporting units, we apply a market multiple to the NAV computed using the present value of future cash flows approach in order to assess their estimated fair value. Gold companies typically trade at a market capitalization that is based on a multiple of their underlying NAV. Consequently, a market participant would generally apply a NAV multiple when estimating the fair value of an operating gold mine.
136
Barrick Financial Report 2010 | Notes to Consolidated Financial Statements
When selecting NAV multiples to arrive at fair value, we considered trading prices of comparable gold mining companies on October 1, 2010. The selected ranges of multiples for all operating gold mines were also based on mine life. The range of selected multiples in respect of operating gold mines with lives of five years or less were based on the lower end of the observed multiples. Mines with lives greater than five years were generally based on median and/or average observation. Mines with lives of twenty years or greater were based on a 20% increase on the median and/or average observations. In 2010, we have used the following multiples in our assessment of the fair value of our gold reporting units: North America 1.0 – 1.9 (2009: 1.2 – 2.2); Australia 1.0 – 1.6 (2009: 1.3 – 1.8); South America 1.0 – 1.5 (2009: 1.1 – 1.6); and Africa 1.0 – 1.7 (2009: 1.2 – 2.0).
In 2010 there were no goodwill impairment charges (2009: $63 million Plutonic; 2008: Kanowna $272 million; North Mara $216 million; Osborne, included in discontinued operations, $64 million; Henty, included in discontinued operations, $30 million; Marigold $8 million; and Barrick Energy $88 million). In second quarter 2009, we acquired the remaining 50% interest in our Hemlo mine, which resulted in a $20 million reduction of goodwill.
18 · Other Assets
At December 31 | | 2010 | | 2009 | |
Non-current ore in stockpiles (note 13) | | $ | 1,106 | | $ | 796 | |
Derivative assets (note 20e) | | 511 | | 290 | |
Goods and services taxes recoverable(1) | | 138 | | 124 | |
Debt issue costs | | 54 | | 42 | |
Unamortized share-based compensation (note 28b) | | 70 | | 67 | |
Notes receivable | | 90 | | 94 | |
Deposits receivable | | — | | 11 | |
Other | | 101 | | 107 | |
| | $ | 2,070 | | $ | 1,531 | |
(1) Includes $75 million and $63 in VAT and fuel tax receivables in South America and Africa, respectively (2009: $94 million and $30 million, respectively).
Debt Issue Costs
In 2010, a total of $9 million of debt issue costs arose from the non-recourse project financing for Pueblo Viejo.
Amortization of debt issue costs is calculated using the interest method over the term of each debt obligation, and classified as a component of interest cost (see note 20b).
In 2009, a total of $16 million of debt issue costs arose on debenture issuances of $1.25 billion and $750 million.
19 · Other Current Liabilities
At December 31 | | 2010 | | 2009 | |
Asset retirement obligations (note 22) | | $ | 88 | | $ | 85 | |
Derivative liabilities (note 20e) | | 173 | | 180 | |
Post-retirement benefits (note 29) | | 10 | | 16 | |
Income taxes payable (note 9) | | 535 | | 94 | |
Restricted stock units (note 28b) | | 64 | | 33 | |
Other | | 94 | | 67 | |
| | $ | 964 | | $ | 475 | |
20 · Financial Instruments
Financial instruments include cash; evidence of ownership in an entity; or a contract that imposes an obligation on one party and conveys a right to a second entity to deliver/receive cash or another financial instrument. Information on certain types of financial instruments is included elsewhere in these financial statements as follows: accounts receivable — note 14; investments — note 12; restricted share units — note 28b.
a) Cash and Equivalents
Cash and equivalents include cash, term deposits, treasury bills and money markets with original maturities of less than 90 days.
At December 31 | | 2010 | | 2009 | |
Cash deposits | | $ | 1,345 | | $ | 509 | |
Term deposits | | 1,236 | | 298 | |
Treasury bills | | — | | 125 | |
Money market investments | | 1,387 | | 1,632 | |
| | $ | 3,968 | | $ | 2,564 | |
137
Notes to Consolidated Financial Statements
b) Long-Term Debt(1)
| | 2010 | | 2009 | | 2008 | |
| | | | | | Repay- | | Amorti- | | | | | | Repay- | | Amorti- | | | | | | Repay- | | Amorti- | | | |
| | | | | | ments/ | | zation | | | | | | ments/ | | zation | | | | | | ments/ | | zation | | | |
| | At | | | | Redemp- | | and | | At | | | | Redemp- | | and | | At | | | | Redemp- | | and | | At | |
| | Dec. 31 | | Proceeds | | tions(7) | | Other(2) | | Dec. 31 | | Proceeds | | tions | | Other(2) | | Dec. 31 | | Proceeds | | tions | | Other(2) | | Jan. 1 | |
Fixed rate notes | | $ | 3,217 | | $ | — | | $ | — | | $ | 3 | | $ | 3,214 | | $ | 1,964 | | $ | — | | $ | — | | $ | 1,250 | | $ | 1,250 | | $ | — | | $ | — | | $ | — | |
5.80%/4.875% notes(3) | | 752 | | — | | — | | 4 | | 748 | | — | | — | | 1 | | 747 | | — | | — | | 2 | | 745 | |
Copper-linked notes | | — | | — | | — | | — | | — | | — | | 190 | | — | | 190 | | — | | 325 | | — | | 515 | |
US dollar notes(8) | | 996 | | — | | — | | — | | 996 | | 190 | | — | | 1 | | 805 | | 325 | | — | | — | | 480 | |
Convertible senior debentures | | — | | — | | 281 | | (4 | ) | 285 | | — | | — | | (4 | ) | 289 | | — | | — | | (4 | ) | 293 | |
Project financing | | 754 | | 754 | | 62 | | — | | 62 | | — | | 53 | | — | | 115 | | — | | 99 | | — | | 214 | |
Capital leases | | 72 | | — | | 24 | | 34 | | 62 | | — | | 25 | | 17 | | 70 | | — | | 21 | | 6 | | 85 | |
Other debt obligations(4) | | 901 | | — | | 63 | | (4 | ) | 968 | | — | | 16 | | 7 | | 977 | | 152 | | 150 | | 52 | | 923 | |
First credit facility(5) | | — | | — | | — | | — | | — | | — | | — | | — | | — | | 990 | | 990 | | — | | — | |
| | 6,692 | | 754 | | 430 | | 33 | | 6,335 | | 2,154 | | 284 | | 22 | | 4,443 | | 2,717 | | 1,585 | | 56 | | 3,255 | |
Less: current portion(6) | | (14 | ) | — | | — | | — | | (54 | ) | — | | — | | — | | (93 | ) | — | | — | | — | | (102 | ) |
| | $ | 6,678 | | $ | 754 | | $ | 430 | | $ | 33 | | $ | 6,281 | | $ | 2,154 | | $ | 284 | | $ | 22 | | $ | 4,350 | | $ | 2,717 | | $ | 1,585 | | $ | 56 | | $ | 3,153 | |
Short-term debt | | | | | | | | | | | | | | | | | | | | | | | | | | | |
Demand financing facility | | — | | — | | — | | — | | — | | — | | 113 | | — | | 113 | | — | | 18 | | — | | 131 | |
| | $ | — | | $ | — | | $ | — | | $ | — | | $ | — | | $ | — | | $ | 113 | | $ | — | | $ | 113 | | $ | — | | $ | 18 | | $ | — | | $ | 131 | |
(1) | The agreements that govern our long-term debt each contain various provisions which are not summarized herein. In certain cases, these provisions allow Barrick to, at its option, redeem indebtedness prior to maturity at specified prices and also may permit redemption of debt by Barrick upon the occurrence of certain specified changes in tax legislation. |
(2) | Amortization of debt premium/discount. |
(3) | During third quarter 2004, we issued $400 million of debentures at a $3 million discount that mature on November 15, 2034 and $350 million of debentures at a $2 million discount that mature on November 15, 2014. |
(4) | The obligations have an aggregate amount of $901 million, of which $100 million is subject to floating interest rates and $801 million is subject to fixed interest rates ranging from 4.75% to 8.05%. The obligations mature at various times between 2012 and 2035. |
(5) | We have a credit and guarantee agreement with a group of banks (the “Lenders”), which requires the Lenders to make available to us a credit facility of up to $1.5 billion or the equivalent amount in Canadian currency. The credit facility, which is unsecured, has an interest rate of LIBOR plus 0.25% to 0.35% on drawn down amounts, and a commitment rate of 0.07% to 0.08% on undrawn amounts. $50 million matures in 2012 and the remaining $1.45 billion matures in 2013. |
(6) | The current portion of long-term debt consists of capital leases ($14 million). |
(7) | On October 20, 2010 we redeemed all of our entire outstanding Placer Dome 2.75% Convertible Senior Debentures due 2023. |
(8) | $400 million of US dollar notes with a coupon of 5.75% mature in 2016 and $600 million of US dollar notes with a coupon of 6.35% mature in 2036. |
Redemption of Convertible Senior Debentures
On October 20, 2010 (the “Redemption Date”) we redeemed our entire outstanding Placer Dome 2.75% Convertible Senior Debentures due 2023 (the “Debentures”). The registered holders of the Debentures were to receive a redemption price of 100.825% of the principal amount outstanding, plus accrued and unpaid interest to the Redemption Date, for a total of $1,008.63 per $1,000.00 principal amount of Debentures if the conversion option was not exercised.
Effective September 1, 2010 to October 19, 2010, the conversion rate per each $1,000 principal amount of Securities was 40.9378 common shares. Substantially all the holders of these debentures exercised their right to convert these Securities into common shares. No gain or loss was recognized in the income statement on conversion.
138
Barrick Financial Report 2010 | Notes to Consolidated Financial Statements
Pueblo Viejo Project Financing Agreement
In April 2010, Barrick and Goldcorp finalized terms for $1.035 billion (100% basis) in non-recourse project financing for Pueblo Viejo. The lending syndicate is comprised of international financial institutions including export development agencies and commercial banks. The amount is divided into three tranches of $400 million, $375 million and $260 million with tenors of 15, 15 and 12 years, respectively. The $400 million tranche bears a coupon of LIBOR+3.25% pre-completion and scales gradually to LIBOR+5.10% (inclusive of political risk insurance premium) for years 13—15. The $375 million tranche bears a fixed coupon of 4.02% for the entire 15 years. The $260 million tranche bears a coupon of LIBOR+3.25% pre-completion and scales gradually to LIBOR+4.85% (inclusive of political risk insurance premium) for years 11—12. Barrick and Goldcorp each provided a guarantee for their proportionate share which will terminate upon Pueblo Viejo meeting certain operating completion tests and are subject to an exclusion for certain political risk events. In June 2010 we received $782 million (100% basis), less financing fees of $28 million on this financing agreement by fully drawing on the $400 million and $260 million tranches and a portion of the $375 million tranche.
Fixed Rate Notes
On October 16, 2009, we issued two tranches of debentures totaling $1.25 billion through our wholly-owned indirect subsidiary Barrick (PD) Australia Finance Pty Ltd. (“BPDAF”) consisting of $850 million of 30-year notes with a coupon rate of 5.95%, and $400 million of 10-year notes with a coupon rate of 4.95% (collectively the “Notes”). BPDAF used the proceeds to provide loans to us for settling the Gold Hedges and some of the Floating Contracts. In exchange, we provide sufficient funds to BPDAF to meet the principal and interest obligations on the notes. We also provided an unconditional and irrevocable guarantee of these payments, which will rank equally with our other unsecured and unsubordinated obligations.
On March 19, 2009, we issued an aggregate of $750 million of 10-year notes with a coupon rate of 6.95% for general corporate purposes. The notes are unsecured, unsubordinated obligations and will rank equally with our other unsecured, unsubordinated obligations.
In September, 2008, we issued an aggregate of $1,250 million of notes through our wholly-owned indirect subsidiaries Barrick North America Finance LLC and Barrick Gold Financeco LLC (collectively the “LLCs”) consisting of $500 million of 5-year notes with a coupon rate of 6.125%, $500 million of 10-year notes with a coupon rate of 6.8%, and $250 million of 30-year notes with a coupon rate of 7.5% (collectively the “Notes”). The LLCs used the proceeds to provide loans to us. We provide sufficient funds to the LLCs to meet the principal and interest obligations on the notes. We also provided an unconditional and irrevocable guarantee of these payments, which will rank equally with our other unsecured and unsubordinated obligations.
We provide an unconditional and irrevocable guarantee on debentures totaling $1.25 billion through our wholly-owned indirect subsidiary Barrick (PD) Australia Finance Pty Ltd. and $1.25 billion of notes through our wholly-owned indirect subsidiaries Barrick North America Finance LLC and Barrick Gold Financeco LLC. These payments will rank equally with our other unsecured and unsubordinated obligations.
Project Financing
One of our wholly-owned subsidiaries, Minera Argentina Gold S.A. in Argentina, had a limited recourse amortizing loan of $62 million outstanding at December 31, 2009, the majority of which had a variable interest rate. During the year this loan was fully repaid.
139
Notes to Consolidated Financial Statements
| | For the years ended December 31 | |
| | 2010 | | 2009 | | 2008 | |
| | Interest | | Effective | | Interest | | Effective | | Interest | | Effective | |
Interest | | cost | | rate(1) | | cost | | rate(1) | | cost | | rate(1) | |
Fixed rate notes | | $ | 211 | | 6.49 | % | $ | 142 | | 6.40 | % | $ | 26 | | 7.00 | % |
5.80%/4.875% notes | | 41 | | 5.48 | % | 44 | | 5.80 | % | 42 | | 5.70 | % |
US dollar notes | | 62 | | 6.22 | % | 62 | | 6.20 | % | 62 | | 6.20 | % |
Convertible senior debentures | | 2 | | 0.80 | % | 3 | | 0.80 | % | 4 | | 1.50 | % |
Project financing | | 16 | | 3.65 | % | 8 | | 8.20 | % | 19 | | 11.00 | % |
Capital leases | | 3 | | 4.30 | % | 2 | | 5.60 | % | 4 | | 5.00 | % |
Other debt obligations | | 47 | | 4.94 | % | 49 | | 5.10 | % | 50 | | 5.30 | % |
Deposit on silver sale agreement (note 23) | | 21 | | 8.59 | % | 6 | | 8.59 | % | — | | — | |
First credit facility | | — | | — | | — | | — | | 17 | | 3.30 | % |
Demand financing facility | | — | | — | | 5 | | 8.70 | % | 11 | | 8.90 | % |
Other interest | | 7 | | | | 5 | | | | 8 | | | |
| | 410 | | | | 326 | | | | 243 | | | |
Less: interest capitalized | | (289 | ) | | | (269 | ) | | | (222 | ) | | |
| | $ | 121 | | | | $ | 57 | | | | $ | 21 | | | |
Cash interest paid | | $ | 400 | | | | $ | 311 | | | | $ | 213 | | | |
Amortization of debt issue costs | | 4 | | | | 6 | | | | 7 | | | |
Amortization of premium | | (6 | ) | | | (6 | ) | | | (7 | ) | | |
Losses on interest rate hedges | | 2 | | | | 3 | | | | 1 | | | |
Increase in interest accruals | | 10 | | | | 12 | | | | 29 | | | |
Interest cost | | $ | 410 | | | | $ | 326 | | | | $ | 243 | | | |
(1) The effective rate includes the stated interest rate under the debt agreement, amortization of debt issue costs and debt discount/premium and the impact of interest rate contracts designated in a hedging relationship with long-term debt.
| | | | | | | | | | | | 2016 and | |
Scheduled Debt Repayments | | 2011 | | 2012 | | 2013 | | 2014 | | 2015 | | thereafter | |
Fixed rate notes | | $ | — | | $ | — | | $ | 500 | | $ | — | | $ | — | | $ | 2,750 | |
5.80%/4.875% notes | | — | | — | | — | | 350 | | — | | 400 | |
Project financing | | — | | — | | 38 | | 76 | | 76 | | 592 | |
US dollar notes | | — | | — | | — | | — | | 1,000 | | — | |
Other debt obligations | | — | | 120 | | 65 | | — | | 100 | | 566 | |
| | $ | — | | $ | 120 | | $ | 603 | | $ | 426 | | $ | 1,176 | | $ | 4,308 | |
Minimum annual payments under capital leases | | $ | 14 | | $ | 17 | | $ | 16 | | $ | 10 | | $ | 8 | | $ | 7 | |
140
Barrick Financial Report 2010 | Notes to Consolidated Financial Statements
c) Use of Derivative Instruments (“Derivatives”) in Risk Management
In the normal course of business, our assets, liabilities and forecasted transactions, as reported in US dollars, are impacted by various market risks including, but not limited to:
Item | | Impacted by |
| | |
· Sales | | · Prices of gold, copper, oil and natural gas |
· Cost of sales | | |
· Consumption of diesel fuel, propane, natural gas and electricity | | · Prices of diesel fuel, propane, natural gas and electricity |
· Non-US dollar expenditures | | · Currency exchange rates — US dollar versus A$, ARS, C$, CLP, JPY, PGK, TZS and ZAR |
· By-product credits | | · Prices of silver and copper |
· Corporate and regional administration, exploration and business development costs | | · Currency exchange rates — US dollar versus A$, ARS, C$, CLP, JPY, PGK, TZS and ZAR |
· Capital expenditures | | |
· Non-US dollar capital expenditures | | · Currency exchange rates — US dollar versus A$, ARS, C$, CLP, EUR and PGK |
· Consumption of steel | | · Price of steel |
· Interest earned on cash and equivalents | | · US dollar interest rates |
· Interest paid on fixed-rate borrowings | | · US dollar interest rates |
The timeframe and manner in which we manage risks varies for each item based upon our assessment of the risk and available alternatives for mitigating risk. For these particular risks, we believe that derivatives are an appropriate way of managing the risk.
The primary objective of our risk management program is to mitigate variability associated with changing market values related to the hedged item. Many of the derivatives we use meet the hedge effectiveness criteria and are designated in a hedge accounting relationship. Some of the derivative instruments are effective in achieving our risk management objectives, but they do not meet the strict hedge effectiveness criteria, and they are classified as “economic hedges”. The change in fair value of these economic hedges is recorded in current period earnings, classified with the income statement line item that is consistent with the derivative instruments’ intended risk objective.
d) Other Use of Derivative Instruments
We also enter into derivative instruments with the objective of realizing trading gains to increase our reported net income.
During the year, we wrote $100 million net USD pay-fixed swaptions giving the buyer the right, but not the obligation, to enter into an interest rate swap at a specific date in the future, at a particular fixed rate, for a specified term. Changes in the fair value of the swaptions and the premiums earned were recognized in current period earnings through interest expense. For the year, we recognized a gain on premiums of $2 million and a loss on position value of $1 million in current period earnings. There were $200 million USD pay-fixed swaptions outstanding at December 31, 2010.
We enter into purchased and written contracts with the primary objective of increasing the realized price on our gold and copper sales. During 2010, we wrote gold put and call options with an average outstanding notional volume of 0.3 million and 0.3 million ounces, respectively, on a net basis. We also held other net purchased gold long positions during the year with an average outstanding notional of 0.1 million ounces. During the year, we wrote copper call options averaging 5 million pounds and purchased other net long copper positions averaging 7 million pounds.
As a result of these activities, we recorded realized gains in revenue of $26 million on gold contracts and realized gains of $7 million on copper contracts in 2010. There are no outstanding gold or copper positions at December 31, 2010.
141
Notes to Consolidated Financial Statements
e) Summary of Derivatives at December 31, 2010
| | | | | | | | | | Accounting | | | |
| | | | | | | | | | classification by | | | |
| | Notional amount by term to maturity | | notional amount | | | |
| | Within | | 2 to 3 | | 4 to 5 | | | | Cash flow | | Fair value | | Non- | | Fair value | |
| | 1 year | | years | | years | | Total | | hedge | | hedge | | hedge | | (USD) | |
US dollar interest rate contracts | | | | | | | | | | | | | | | | | |
Total receive — fixed swap positions | | $ | — | | $ | 100 | | $ | 100 | | $ | 200 | | $ | — | | $ | 200 | | $ | — | | $ | 6 | |
Total pay — fixed swap positions | | — | | — | | (100 | ) | (100 | ) | — | | — | | (100 | ) | (3 | ) |
Total pay — fixed swaption positions | | — | | — | | (200 | ) | (200 | ) | — | | — | | (200 | ) | (2 | ) |
Currency contracts | | | | | | | | | | | | | | | | | |
A$:US$ contracts (A$ millions) | | 1,638 | | 2,064 | | 515 | | 4,217 | | 4,217 | | — | | — | | 804 | |
C$:US$ contracts (C$ millions) | | 353 | | 19 | | — | | 372 | | 372 | | — | | — | | 12 | |
CLP:US$ contracts (CLP millions)(1) | | 172,595 | | 71,800 | | — | | 244,395 | | 98,295 | | — | | 146,100 | | 37 | |
EUR:US$ contracts (EUR millions) | | 10 | | 10 | | — | | 20 | | 20 | | — | | — | | (1 | ) |
PGK:US$ contracts (PGK millions) | | 54 | | — | | — | | 54 | | — | | — | | 54 | | 1 | |
Commodity contracts | | | | | | | | | | | | | | | | | |
Copper collar sell contracts (millions of pounds) | | 278 | | 8 | | — | | 286 | | 185 | | — | | 101 | | (128 | ) |
Copper net call spread contracts (millions of pounds) | | 132 | | — | | — | | 132 | | — | | — | | 132 | | 23 | |
Copper net collar buy contracts (millions of pounds) | | 79 | | — | | — | | 79 | | — | | — | | 79 | | 56 | |
Silver collar sell contracts (millions of ozs) | | — | | — | | 15 | | 15 | | 15 | | — | | — | | (15 | ) |
Diesel contracts (thousands of barrels)(2) | | 2,316 | | 2,341 | | 50 | | 4,707 | | 4,707 | | — | | — | | 55 | |
Propane contracts (millions of gallons) | | 13 | | 6 | | — | | 19 | | 19 | | — | | — | | 3 | |
Electricity contracts (thousands of megawatt hours) | | 53 | | 35 | | — | | 88 | | — | | — | | 88 | | — | |
| | | | | | | | | | | | | | | | | | | | | | | | | |
(1) Non-hedge contracts economically hedge pre-production capital expenditures at our Pascua-Lama project.
(2) Diesel commodity contracts represent a combination of WTI, ULSD and ULSD/WTI Crack spread swaps, WTB, MOPS and JET hedge contracts. These derivatives hedge physical supply contracts based on the price of ULSD, WTB, MOPS and JET respectively, plus a spread. WTI represents West Texas Intermediate, WTB represents Waterborne, MOPS represents Mean of Platts Singapore, JET represents Jet Fuel, ULSD represents Ultra Low Sulfur Diesel US Gulf Coast.
Fair Values of Derivative Instruments
| | Asset Derivatives | | Liability Derivatives | |
| | At Dec. 31, 2010 | | At Dec. 31, 2009 | | At Dec. 31, 2010 | | At Dec. 31, 2009 | |
| | Balance sheet | | Fair | | Balance sheet | | Fair | | Balance sheet | | Fair | | Balance sheet | | Fair | |
| | classification | | value | | classification | | value | | classification | | value | | classification | | value | |
Derivatives designated as hedging instruments | | | | | | | | | | | | | | | | | | | | | |
US dollar interest rate contracts | | Other assets | | $ | 6 | | Other assets | | $ | — | | Other liabilities | | $ | — | | Other liabilities | | $ | — | |
Currency contracts | | Other assets | | 831 | | Other assets | | 374 | | Other liabilities | | 1 | | Other liabilities | | 9 | |
Commodity contracts | | Other assets | | 112 | | Other assets | | 53 | | Other liabilities | | 192 | | Other liabilities | | 131 | |
Total derivatives classified as hedging instruments | | | | $ | 949 | | | | $ | 427 | | | | $ | 193 | | | | $ | 140 | |
Derivatives not designated as hedging instruments | | | | | | | | | | | | | | | | | |
US dollar interest rate contracts | | Other assets | | $ | — | | Other assets | | $ | 1 | | Other liabilities | | $ | 5 | | Other liabilities | | $ | 7 | |
Currency contracts | | Other assets | | 30 | | Other assets | | 15 | | Other liabilities | | 7 | | Other liabilities | | 9 | |
Commodity contracts | | Other assets | | 147 | | Other assets | | 61 | | Other liabilities | | 73 | | Other liabilities | | 43 | |
Total derivatives not designated as hedging instruments | | | | $ | 177 | | | | $ | 77 | | | | $ | 85 | | | | $ | 59 | |
Total derivatives | | | | $ | 1,126 | | | | $ | 504 | | | | $ | 278 | | | | $ | 199 | |
142
Barrick Financial Report 2010 | Notes to Consolidated Financial Statements
US Dollar Interest Rate Contracts
Non-hedge Contracts
We have a $300 million US dollar receive-fixed interest rate swap outstanding that is used to economically hedge US dollar interest rate risk on our outstanding cash balance.
Currency Contracts
Cash Flow Hedges
During the year, currency contracts totaling A$1,449 million, C$370 million, EUR 13 million, PGK 42 million, and CLP 145,885 million have been designated against forecasted non-US dollar denominated expenditures, some of which are hedges that matured within the year. The outstanding contracts hedge the variability of the US dollar amount of those expenditures caused by changes in currency exchange rates over the next four years.
Hedged items that relate to operating and/or sustaining capital expense are identified as the first stated quantity of dollars of forecasted expenditures in a future month. For A$110 million, C$295 million, and CLP 30,780 million of collar contracts, we have concluded that the hedges are 100% effective because the critical terms (including notional amount and maturity date) of the hedged items and the currency contracts are the same. For all remaining currency hedges, prospective and retrospective hedge effectiveness is assessed using the hypothetical derivative method. The prospective test is based on regression analysis of the month-on-month change in fair value of both the actual derivative and a hypothetical derivative caused by actual historic changes in forward exchange rates over the last three years. The retrospective test involves comparing the effect of historic changes in exchange rates each period on the fair value of both the actual and hypothetical derivative, and ineffectiveness is measured using a dollar offset approach. The effective portion of changes in fair value of the currency contracts is recorded in OCI until the forecasted expenditure impacts earnings.
Hedged items that relate to pre-production expenditures at our development projects are identified as the stated quantity of dollars of the forecasted expenditures associated with a specific transaction in a pre-defined time period. For AUD 55 million, EUR 20 million and CLP 54,900 million, hedge effectiveness is assessed using the dual spot method, where changes in fair value attributable to changes in spot prices are calculated on a discounted basis for the actual derivative and an undiscounted basis for the hypothetical derivative. The effectiveness testing excludes time value of the hedging instrument. Prospective and retrospective hedge effectiveness uses a dollar offset method.
Non-hedge Contracts
We concluded that CLP 146,100 million of collar contracts do not meet the effectiveness criteria of the dual spot method. These contracts represent an economic hedge of pre-production capital expenditures at our Pascua-Lama and Cerro Casale projects. Although not qualifying as an accounting hedge, the contracts protect us against variability of the CLP to the US dollar on pre-production expenditures at our Pascua-Lama and Cerro Casale projects. Changes in the fair value of the non-hedge CLP contracts are recorded in current period project expense. In 2010, we recorded an unrealized gain of $24 million on the outstanding collar contracts. Non-hedge currency contracts are used to mitigate the variability of the US dollar amount of non-US dollar denominated exposures that do not meet the strict hedge effectiveness criteria. Changes in the fair value of non-hedge currency contracts are recorded in current period cost of sales, corporate administration, other income, other expense or income tax expense according to the intention of the hedging instrument.
Commodity Contracts
Diesel/Propane/Electricity/Natural Gas
Cash Flow Hedges
During the year, we entered into 480 thousand barrels of WTI/ ULSD crack spread swaps, 1,222 thousand barrels of MOPS forwards, 228 thousand barrels of WTB forwards, 228 thousand barrels of JET forwards, and 19 million gallons of propane designated against forecasted fuel purchases for expected consumption at our mines. The designated contracts act as a hedge against variability in market prices on the cost of future fuel purchases over the next four years. Hedged items are identified as the first stated quantity of forecasted consumption purchased in a future month. Prospective and retrospective hedge effectiveness is assessed using the hypothetical derivative method. The prospective test is based on regression analysis of the month-on-month change in fair value of both the actual derivative and a hypothetical derivative caused by actual historic changes in commodity prices over the last three years. The retrospective test involves comparing the effect of historic changes in commodity prices each period on the fair value of both the actual and hypothetical derivative, and ineffectiveness is measured using a dollar offset approach. The effective portion of changes in fair value of the commodity contracts is recorded in OCI until the forecasted transaction impacts earnings.
143
Notes to Consolidated Financial Statements
In 2009, we entered into a diesel fuel supply contract. Under the terms of the contract, fuel purchased for consumption at our Nevada based mines is priced based on the ULSD index. We have continued to hedge our exposure to diesel using our existing WTI forward contracts. Retrospective hedge effectiveness testing shows a strong correlation between ULSD and WTI and thus we expect that these hedges will continue to be effective. The prospective and retrospective testing is assessed using the hypothetical derivative method.
Non-hedge Contracts
Non-hedge electricity contracts of 88 thousand megawatt hours are used to mitigate the risk of price changes on electricity consumption at Barrick Energy. Although not qualifying as an accounting hedge, the contracts protect the Company to a significant extent from the effects of changes in electricity prices. Changes in the fair value of non-hedge electricity contracts are recorded in current period cost of sales.
Copper
Cash Flow Hedges
Copper collar contracts totaling 185 million pounds have been designated as hedges against copper cathode sales at our Zaldívar mine. The contracts contain purchased put and sold call options with weighted average strike prices of $3.00/lb and $4.35/lb, respectively.
For collars designated against copper cathode production, the hedged items are identified as the first stated quantity of pounds of forecasted sales in a future month. Prospective hedge effectiveness is assessed on these hedges using a dollar offset method. The dollar offset assessment involves comparing the effect of theoretical shifts in forward copper prices on the fair value of both the actual hedging derivative and a hypothetical hedging derivative. The retrospective assessment involves comparing the effect of historic changes in copper prices each period on the fair value of both the actual and hypothetical derivative using a dollar offset approach. The effective portion of changes in fair value of the copper contracts is recorded in OCI until the forecasted copper sale impacts earnings.
Non-hedge Contracts
Copper sell collar contracts totaling 22 million pounds were entered into during the year containing purchased puts and sold calls with an average strike price of $3.25/lb and $4.77/lb, respectively. The options mature over a period of two years, with 14 million pounds maturing in 2011 and the remaining 8 million pounds maturing in 2012. During 2010, we also de-designated collar sell contracts for 79 million pounds and crystallized $12 million of losses in OCI. These hedges were originally designated against future copper production at our Zaldívar mine. The exposure is still expected to occur and therefore amounts crystallized in OCI will be recorded in copper revenue when the sales occur. We continue to hold these collars as non-hedge contracts. The contracts contain purchased put and sold call options with an average strike of $3.00/lb and $4.02/lb, respectively.
During 2010, we purchased 79 million pounds of collar buy contracts containing sold put and purchased call options with an average strike of $3.00/lb and $3.99/lb, respectively, for a net premium of $11 million. Premiums paid have been recorded as a reduction of current period revenue. The options mature evenly throughout 2011.
During 2010, we purchased 132 million pounds of call options at an average strike of $4.26/lb and sold 132 million pounds of call options at $4.72/lb for a net premium of $13 million. Premiums paid have been recorded as a reduction of current period revenue. The options mature evenly throughout 2011. These contracts are not designated as cash flow hedges. Changes in the fair value of these copper options are recorded in current period revenue.
Silver
Cash Flow Hedges
During the year we designated silver collar contracts totaling 15 million ounces as hedges against silver bullion sales from our silver producing mines. The contracts contain purchased put and sold call options with weighted average strike prices of $20/oz and $55/oz respectively. For collars designated against silver bullion sales, the hedged items are identified as the first stated quantity of ounces of forecasted sales in a future month. Prospective hedge effectiveness is assessed using a regression method. The regression method involves comparing week-by-week changes in the fair value of both the actual hedging derivative and a hypothetical derivative caused by actual historical changes in commodity prices over the last fifty-two weeks. The retrospective assessment involves comparing the effect of historic changes in silver prices each period on the fair value of both the actual and hypothetical derivative using a regression approach. The effective portion of changes in fair value of the silver contracts is recorded in OCI until the forecasted silver sale impacts earnings.
144
Barrick Financial Report 2010 | Notes to Consolidated Financial Statements
Non-hedge Gains (Losses)
For the years ended December 31 | | 2010 | | 2009 | | 2008 | | Income statement classification | |
Risk management activities | | | | | | | | | |
Commodity contracts | | | | | | | | | |
Copper | | $ | 33 | | $ | (53 | ) | $ | 73 | | Revenue/cost of sales | |
Fuel | | — | | 1 | | (30 | ) | Cost of sales | |
Steel | | — | | — | | (3 | ) | Project development expense | |
Currency contracts | | 30 | | (4 | ) | (8 | ) | Cost of sales/corporate administration/ other income/expense/ | |
Interest rate contracts | | (2 | ) | (7 | ) | (4 | ) | Interest income/expense | |
| | 61 | | (63 | ) | 28 | | | |
Other use of derivative instruments | | | | | | | | | |
Commodity contracts | | | | | | | | | |
Gold | | 26 | | 56 | | 19 | | Revenue | |
Copper | | 7 | | (2 | ) | — | | Revenue | |
Interest rate swaptions | | — | | 3 | | — | | Interest income/expense | |
| | 33 | | 57 | | 19 | | | |
Other gains (losses) | | | | | | | | | |
Embedded derivatives(1) | | 13 | | 5 | | (3 | ) | Revenue | |
Hedge ineffectiveness | | 11 | | (3 | ) | (6 | ) | Cost of sales/revenue/other income | |
Ineffective portion of fair value hedge | | 3 | | — | | — | | Other income/expense | |
| | $ | 27 | | $ | 2 | | $ | (9 | ) | | |
| | $ | 121 | | $ | (4 | ) | $ | 38 | | | |
(1) Includes embedded derivatives on gold concentrate sales and copper cathode sales.
Derivative Assets and Liabilities
| | 2010 | | 2009 | |
At January 1 | | $ | 305 | | $ | (43 | ) |
Derivatives cash (inflow) outflow | | | | | |
Operating activities | | (168 | ) | (328 | ) |
Financing activities | | (12 | ) | 10 | |
Change in fair value of: | | | | | |
Non-hedge derivatives | | 103 | | (39 | ) |
Cash flow hedges | | | | | |
Effective portion | | 601 | | 708 | |
Ineffective portion | | 11 | | (3 | ) |
Fair value hedges | | 5 | | — | |
Ineffective portion of fair value hedge | | 3 | | — | |
At December 31 | | $ | 848 | | $ | 305 | |
Classification: | | | | | |
Other current assets | | $ | 615 | | $ | 214 | |
Other long-term assets | | 511 | | 290 | |
Other current liabilities | | (173 | ) | (180 | ) |
Other long-term obligations | | (105 | ) | (19 | ) |
| | $ | 848 | | $ | 305 | |
145
Notes to Consolidated Financial Statements
Cash Flow Hedge Gains (Losses) in OCI
| | Commodity | | | | | | | | Interest rate | | | |
| | price hedges | | Currency hedges | | hedges | | | |
| | | | | | | | Operating | | Administration/ | | Capital | | Long-term | | | |
| | Silver(1) | | Copper | | Fuel | | costs | | other costs | | expenditures | | debt | | Total | |
At January 1, 2008 | | $ | 15 | | $ | 14 | | $ | 79 | | $ | 238 | | $ | 27 | | $ | (1 | ) | $ | (17 | ) | $ | 355 | |
Effective portion of change in fair value of hedging instruments | | — | | 582 | | (215 | ) | (610 | ) | (46 | ) | 5 | | (17 | ) | (301 | ) |
Transfers to earnings: | | | | | | | | | | | | | | | | | |
On recording hedged items in earnings | | (2 | ) | (112 | ) | (33 | ) | (106 | ) | (11 | ) | (4 | ) | 1 | | (267 | ) |
At December 31, 2008 | | 13 | | 484 | | (169 | ) | (478 | ) | (30 | ) | — | | (33 | ) | (213 | ) |
Effective portion of change in fair value of hedging instruments | | — | | (273 | ) | 68 | | 820 | | 42 | | 48 | | — | | 705 | |
Transfers to earnings: | | | | | | | | | | | | | | | | | |
On recording hedged items in earnings | | (10 | ) | (283 | ) | 95 | | (22 | ) | 7 | | (3 | ) | 3 | | (213 | ) |
Hedge ineffectiveness due to changes in original forecasted transaction | | — | | — | | 2 | | (5 | ) | — | | — | | — | | (3 | ) |
At December 31, 2009 | | 3 | | (72 | ) | (4 | ) | 315 | | 19 | | 45 | | (30 | ) | 276 | |
Effective portion of change in fair value of hedging instruments | | (15 | ) | (60 | ) | 29 | | 549 | | 56 | | 53 | | — | | 612 | |
Transfers to earnings: | | | | | | | | | | | | | | | | | |
On recording hedged items in earnings | | (2 | ) | 54 | | 26 | | (146 | ) | (33 | ) | (6 | ) | 3 | | (104 | ) |
At December 31, 2010 | | $ | (14 | ) | $ | (78 | ) | $ | 51 | | $ | 718 | | $ | 42 | | $ | 92 | | $ | (27 | ) | $ | 784 | |
| | Cost of | | Copper | | Cost of | | Cost of | | Administration/ | | | | Interest | | | |
Hedge gains/losses classified within | | sales | | sales | | sales | | sales | | Other expense | | Amortization | | expense | | | |
Portion of hedge gain (loss) expected to affect 2011 earnings(2) | | $ | 2 | | $ | (78 | ) | $ | 22 | | $ | 273 | | $ | 39 | | $ | — | | $ | (3 | ) | $ | 255 | |
| | | | | | | | | | | | | | | | | | | | | | | | | |
(1) Amounts prior to 2010 reflect amortization of crystallized gold positions.
(2) Based on the fair value of hedge contracts at December 31, 2010.
Cash Flow Hedge Gains (Losses) at December 31
| | | | | | | | | | Amount of gain (loss) | |
| | | | | | Amount of gain (loss) | | Location of gain (loss) | | recognized in income | |
| | Amount of gain | | | | transferred from | | recognized in income | | (ineffective portion and | |
| | (loss) recognized | | Location of gain (loss) | | OCI into income | | (ineffective portion and | | amount excluded from | |
Derivatives in cash flow | | in OCI | | transferred from OCI into | | (effective portion) | | amount excluded from | | effectiveness testing) | |
hedging relationships | | 2010 | | 2009 | | income (effective portion) | | 2010 | | 2009 | | effectiveness testing) | | 2010 | | 2009 | |
Interest rate contracts | | $ | — | | $ | — | | Interest income/expense | | $ | (3 | ) | $ | (3 | ) | Interest income/expense | | $ | — | | $ | — | |
Foreign exchange | | | | | | Cost of sales/corporate | | | | | | Cost of sales/corporate | | 14 | | 2 | |
contracts | | 658 | | 910 | | administration/amortization | | 185 | | 21 | | administration/amortization | | | | | |
Commodity contracts | | (46 | ) | (205 | ) | Revenue/cost of sales | | (78 | ) | 198 | | Revenue/cost of sales | | — | | (2 | ) |
Total | | $ | 612 | | $ | 705 | | | | $ | 104 | | $ | 216 | | | | $ | 14 | | $ | — | |
Fair Value Hedge Gains at December 31
| | | | Amount of gain | |
| | Location of gain | | recognized in income | |
| | recognized in income | | on derivative | |
Derivatives in fair value hedging relationships | | on derivative | | 2010 | | 2009 | |
Interest rate contracts | | Interest income/expense | | $ | 8 | | $ | — | |
| | | | | | | | | |
146
Barrick Financial Report 2010 | Notes to Consolidated Financial Statements
f) Credit Risk
Credit risk is the risk that the counterparty to a financial instrument will cause a financial loss to us by failing to discharge its obligations. Credit risk arises and is associated with our overall position in cash and cash equivalents, derivative assets and accounts receivables. To mitigate our exposure to credit risk we maintain policies to limit the concentration of credit risk, review counterparty creditworthiness on a monthly basis, and ensure liquidity of available funds.
Specifically, we invest our cash and cash equivalents in highly rated financial institutions primarily within the United States and other investment grade countries.(1)
We sell our gold and copper production into the world market and to private customers with strong credit ratings. Historically the level of customer defaults has not had a significant impact on our operating results or financial position.
The fair value of our derivative contracts is adjusted for credit risk based on observed credit default swap spreads. In cases where we have a legally enforceable master netting agreement with a counterparty, credit risk exposure represents the net amount of the positive and negative fair values by counterparty. For derivatives in a net asset position, credit risk is measured using credit default swap spreads for each particular counterparty, as appropriate. For derivatives in a net liability position, credit risk is measured using Barrick’s credit default swap spreads. We specifically mitigate credit risk on derivatives in a net asset position by:
· entering into derivatives with high credit-quality counterparties (investment grade);
· limiting the amount of exposure to each counterparty; and
· monitoring the financial condition of counterparties on a regular basis.
The company’s maximum exposure to credit risk is as follows:
At December 31 | | 2010 | | 2009 | |
Cash and equivalents | | $ | 3,968 | | $ | 2,564 | |
Accounts receivable | | 346 | | 251 | |
Net derivative assets by counterparty | | 901 | | 235 | |
| | $ | 5,215 | | $ | 3,050 | |
(1) Investment grade countries include Canada, Chile, Australia, and Peru. Investment grade countries are defined as being rated BBB- or higher by S&P.
g) Risks Relating to the Use of Derivatives
By using derivatives, in addition to credit risk, we are affected by market risk. Market risk is the risk that the fair value of a derivative might be adversely affected by a change in commodity prices, interest rates, or currency exchange rates, and that this in turn affects our financial condition. We manage market risk by establishing and monitoring parameters that limit the types and degree of market risk that may be undertaken.
21 · Fair Value Measurements
Fair value is the price that would be received to sell an asset or paid to transfer a liability in an orderly transaction between market participants at the measurement date. The fair value hierarchy establishes three levels to classify the inputs to valuation techniques used to measure fair value. Level 1 inputs are quoted prices (unadjusted) in active markets for identical assets or liabilities. Level 2 inputs are quoted prices in markets that are not active, quoted prices for similar assets or liabilities in active markets, inputs other than quoted prices that are observable for the asset or liability (for example, interest rate and yield curves observable at commonly quoted intervals, forward pricing curves used to value currency and commodity contracts and volatility measurements used to value option contracts), or inputs that are derived principally from or corroborated by observable market data or other means. Level 3 inputs are unobservable (supported by little or no market activity). The fair value hierarchy gives the highest priority to Level 1 inputs and the lowest priority to Level 3 inputs.
a) Assets and Liabilities Measured at Fair Value on a Recurring Basis
| | Quoted prices | | Significant | | | | | |
| | in active | | other | | Significant | | | |
| | markets for | | observable | | unobservable | | Aggregate | |
| | identical assets | | inputs | | inputs | | fair | |
| | (Level 1) | | (Level 2) | | (Level 3) | | value | |
Cash equivalents | | $ | 2,781 | | $ | — | | $ | — | | $ | 2,781 | |
Available-for-sale securities | | 171 | | — | | — | | 171 | |
Derivatives | | — | | 848 | | — | | 848 | |
Receivables from provisional copper and gold sales | | — | | 159 | | — | | 159 | |
| | $ | 2,952 | | $ | 1,007 | | $ | — | | $ | 3,959 | |
147
Notes to Consolidated Financial Statements
b) Fair Values of Financial Instruments
| | 2010 | | 2009 | |
| | | | Estimated | | | | Estimated | |
| | Carrying | | fair | | Carrying | | fair | |
At December 31 | | amount | | value | | amount | | value | |
Financial assets | | | | | | | | | |
Cash and equivalents(1) | | $ | 3,968 | | $ | 3,968 | | $ | 2,564 | | $ | 2,564 | |
Accounts receivable(1) | | 346 | | 346 | | 251 | | 251 | |
Available-for-sale securities(2) | | 171 | | 171 | | 61 | | 61 | |
Derivative assets | | 1,126 | | 1,126 | | 504 | | 504 | |
| | $ | 5,611 | | $ | 5,611 | | $ | 3,380 | | $ | 3,380 | |
Financial liabilities | | | | | | | | | |
Accounts payable(1) | | $ | 1,511 | | $ | 1,511 | | $ | 1,221 | | $ | 1,221 | |
Long-term debt(3) | | 6,692 | | 7,070 | | 6,335 | | 6,723 | |
Settlement obligation to close out gold sales contracts | | — | | — | | 647 | | 647 | |
Derivative liabilities | | 278 | | 278 | | 199 | | 199 | |
Restricted share units(4) | | 153 | | 153 | | 124 | | 124 | |
Deferred share units(4) | | 9 | | 9 | | 6 | | 6 | |
| | $ | 8,643 | | $ | 9,021 | | $ | 8,532 | | $ | 8,920 | |
(1) Fair value approximates the carrying amounts due to the short-term nature and historically negligible credit losses.
(2) Recorded at fair value. Quoted market prices are used to determine fair value.
(3) Long-term debt is generally recorded at cost except for obligations that are designated in a fair-value hedge relationship, which are recorded at fair value in periods when a hedge relationship exists. The fair value of long-term debt is primarily determined using quoted market prices. Balance includes current portion of long-term debt.
(4) Recorded at fair value based on our period-end closing market share price.
c) Valuation Techniques
Cash Equivalents
The fair value of our cash equivalents is classified within Level 1 of the fair value hierarchy because they are valued using quoted market prices in active markets. Our cash equivalents are comprised of U.S. Treasury bills and money market securities that are invested primarily in U.S. Treasury bills.
Available-for-Sale Securities
The fair value of available-for-sale securities is determined based on a market approach reflecting the closing price of each particular security at the balance sheet date. The closing price is a quoted market price obtained from the exchange that is the principal active market for the particular security, and therefore available-for-sale securities are classified within Level 1 of the fair value hierarchy.
Derivative Instruments
The fair value of derivative instruments is determined using either present value techniques or option pricing models that utilize a variety of inputs that are a combination of quoted prices and market-corroborated inputs. The fair values of all our derivative contracts include an adjustment for credit risk. For counterparties in a net asset position credit risk is based upon the observed credit default swap spread for each particular counterparty, as appropriate. For counterparties in a net liability position credit risk is based upon Barrick’s observed credit default swap spread. The fair value of US dollar interest rate and currency swap contracts is determined by discounting contracted cash flows using a discount rate derived from observed LIBOR and swap rate curves and CDS rates. In the case of currency contracts, we convert non-US dollar cash flows into US dollars using an exchange rate derived from currency swap curves and CDS rates. The fair value of commodity forward contracts is determined by discounting contractual cash flows using a discount rate derived from observed LIBOR and swap rate curves and CDS rates. Contractual cash flows are calculated using a forward pricing curve derived from observed forward prices for each commodity. Derivative instruments are classified within Level 2 of the fair value hierarchy.
Receivables from Provisional Copper and Gold Sales
The fair value of receivables rising from copper and gold sales contracts that contain provisional pricing mechanisms is determined using the appropriate quoted forward price from the exchange that is the principal active market for the particular metal. As such, these receivables are classified within Level 2 of the fair value hierarchy.
22 · Asset Retirement Obligations
Asset Retirement Obligations (AROs)
| | 2010 | | 2009 | |
At January 1 | | $ | 1,207 | | $ | 1,036 | |
AROs acquired during the year | | 9 | | 30 | |
AROs arising in the year | | 305 | | 119 | |
Impact of revisions to expected cash flows recorded in earnings | | 8 | | 10 | |
Settlements | | | | | |
Cash payments | | (44 | ) | (39 | ) |
Settlement gains | | (5 | ) | (6 | ) |
Accretion | | 47 | | 57 | |
At December 31 | | 1,527 | | 1,207 | |
Current portion (note 19) | | (88 | ) | (85 | ) |
| | $ | 1,439 | | $ | 1,122 | |
148
Barrick Financial Report 2010 | Notes to Consolidated Financial Statements
Each period we assess cost estimates and other assumptions used in the valuation of AROs at each of our mineral properties to reflect events, changes in circumstances and new information available. Changes in these cost estimates and assumptions have a corresponding impact on the fair value of the ARO. For closed mines, any change in the fair value of AROs results in a corresponding charge or credit within other expense, whereas at operating mines the charge is recorded as an adjustment to the carrying amount of the corresponding asset. In 2010, adjustments of $27 million were recorded to reflect changes in cost estimates for AROs at closed mines and Barrick Energy (2009: $10 million; 2008: $9 million).
At December 31 | | 2010 | | 2009 | |
Operating mines and development properties | | | | | |
ARO increase(1) | | $ | 301 | | $ | 119 | |
ARO decrease(2) | | (8 | ) | (1 | ) |
Closed mines | | | | | |
ARO increase(3) | | 14 | | 8 | |
Barrick Energy | | | | | |
ARO increase(1) | | 13 | | 2 | |
| | | | | | | |
(1) These adjustments were recorded with a corresponding adjustment to property, plant and equipment. 2010 balance includes revisions to mine closure plans at Porgera ($118 million) and Pierina ($90 million).
(2) Represents a decrease in AROs at a mine where the corresponding ARO asset had been fully amortized and was therefore recorded as a recovery in other income.
(3) For closed mines, any change in the fair value of AROs results in a corresponding charge or credit to other expense or other income, respectively.
AROs arise from the acquisition, development, construction and normal operation of mining property, plant and equipment, due to government controls and regulations that protect the environment on the closure and reclamation of mining properties. The major parts of the carrying amount of AROs relate to tailings and heap leach pad closure/rehabilitation; demolition of buildings/mine facilities; ongoing water treatment; and ongoing care and maintenance of closed mines. The fair values of AROs are measured by discounting the expected cash flows using a discount factor that reflects the credit-adjusted risk-free rate of interest. We prepare estimates of the timing and amount of expected cash flows when an ARO is incurred. We update expected cash flows to reflect changes in facts and circumstances. The principal factors that can cause expected cash flows to change are: the construction of new processing facilities; changes in the quantities of material in reserves and a corresponding change in the life-of-mine plan; changing ore characteristics that impact required environmental protection measures and related costs; changes in water quality that impact the extent of water treatment required; and changes in laws and regulations governing the protection of the environment. When expected cash flows increase, the revised cash flows are discounted using a current discount factor whereas when expected cash flows decrease the reduced cash flows are discounted using a historic discount factor, and then in both cases any change in the fair value of the ARO is recorded. We record the fair value of an ARO when it is incurred. At producing mines AROs incurred and changes in the fair value of AROs are recorded as an adjustment to the corresponding asset carrying amounts. At closed mines, any adjustment to the fair value of an ARO is charged directly to earnings. AROs are adjusted to reflect the passage of time (accretion) calculated by applying the discount factor implicit in the initial fair-value measurement to the beginning-of-period carrying amount of the AROs. For producing mines, development projects and closed mines, accretion is recorded in amortization and accretion. Upon settlement of an ARO, we record a gain or loss if the actual cost differs from the carrying amount of the ARO. Settlement gains/losses are recorded in other (income) expense. Other environmental remediation costs that are not AROs are expensed as incurred (see note 8a).
23 · Other Non-current Liabilities
At December 31 | | 2010 | | 2009 | |
Deposit on silver sale agreement | | $ | 312 | | $ | 196 | |
Settlement obligation to close out gold sales contracts | | — | | 647 | |
Pension benefits (note 29c) | | 103 | | 96 | |
Other post-retirement benefits (note 29e) | | 25 | | 26 | |
Derivative liabilities (note 20e) | | 105 | | 19 | |
Restricted share units (note 28b) | | 89 | | 91 | |
Provision for supply contract restructuring costs | | 31 | | — | |
Provision for offsite remediation | | 61 | | — | |
Other | | 142 | | 70 | |
| | $ | 868 | | $ | 1,145 | |
Silver Sale Agreement
On September 22, 2009, we entered into an agreement with Silver Wheaton Corp. to sell the equivalent of 25% of the life-of-mine silver production from the Pascua-Lama project and 100% of silver production from the Lagunas Norte, Pierina and Veladero mines until project completion at Pascua-Lama. In return, we were entitled to an upfront cash payment of $625 million payable over three years from the date of the agreement, as well as ongoing payments in cash of the lesser of $3.90 (subject to an annual inflation adjustment of 1% starting three years after project completion at Pascua-Lama) and the prevailing market price for each ounce of silver delivered under the agreement.
149
Notes to Consolidated Financial Statements
During 2010 we received cash payments of $137.5 million (2009: $213 million). Providing that construction continues to progress at Pascua-Lama, we are entitled to receive additional cash payments totaling $275 million in aggregate over the next two anniversary dates of the agreement. An imputed interest expense is being recorded on the liability at the rate implicit in the agreement. The liability plus imputed interest will be amortized based on the difference between the effective contract price for silver and the amount of the ongoing cash payment per ounce of silver delivered under the agreement.
Settlement Obligation to Close Out Gold Sales Contracts
In September 2009, we announced a plan to eliminate our “Gold Hedges” and a significant portion of our “Floating Contracts”. Our “Gold Hedges” were fixed price contracts which did not participate in gold price movements. Our “Floating Contracts” were essentially Gold Hedges that had been offset against future movements in the gold price but not yet settled. As at December 31, 2009, the obligation relating to the Floating Contracts had been reduced to $0.6 billion. During 2010 the $0.6 billion obligation relating to the Floating Contracts was repaid.
24 · Deferred Income Taxes
Recognition and Measurement
We record deferred income tax assets and liabilities where temporary differences exist between the carrying amounts of assets and liabilities in our balance sheet and their tax bases. The measurement and recognition of deferred income tax assets and liabilities takes into account: enacted rates that will apply when temporary differences reverse; interpretations of relevant tax legislation; tax planning strategies; estimates of the tax bases of assets and liabilities; and the deductibility of expenditures for income tax purposes. We recognize the effect of changes in our assessment of these estimates and factors when they occur. Changes in deferred income tax assets, liabilities and valuation allowances are allocated between net income and other comprehensive income based on the source of the change.
Current income taxes of $74 million and deferred income taxes of $48 million have been provided on the undistributed earnings of certain foreign subsidiaries. Deferred income taxes have not been provided on the undistributed earnings of all other foreign subsidiaries which are considered to be reinvested indefinitely outside Canada. The determination of the unrecorded deferred income tax liability is not considered practicable.
Sources of Deferred Income Tax Assets and Liabilities
At December 31 | | 2010 | | 2009 | |
Deferred tax assets | | | | | |
Tax loss carry forwards | | $ | 553 | | $ | 659 | |
Capital tax loss carry forwards | | 101 | | — | |
Alternative minimum tax (“AMT”) credits | | 318 | | 287 | |
Asset retirement obligations | | 494 | | 413 | |
Property, plant and equipment | | 177 | | 268 | |
Post-retirement benefit obligations | | 14 | | 16 | |
Accrued interest payable | | 63 | | 108 | |
Other | | 53 | | — | |
| | 1,773 | | 1,751 | |
Valuation allowances | | (425 | ) | (481 | ) |
| | 1,348 | | 1,270 | |
Deferred tax liabilities | | | | | |
Property, plant and equipment | | (1,725 | ) | (1,328 | ) |
Derivative instruments | | (168 | ) | (81 | ) |
Inventory | | (102 | ) | (70 | ) |
Other | | — | | (26 | ) |
| | $ | (647 | ) | $ | (235 | ) |
Classification: | | | | | |
Non-current assets | | $ | 467 | | $ | 949 | |
Non-current liabilities | | (1,114 | ) | (1,184 | ) |
| | $ | (647 | ) | $ | (235 | ) |
Expiry Dates of Tax Losses and AMT Credits
| | | | | | | | | | | | No | | | |
| | | | | | | | | | | | expiry | | | |
| | 2011 | | 2012 | | 2013 | | 2014 | | 2015+ | | date | | Total | |
Tax losses(1) | | | | | | | | | | | | | | | |
Canada | | $ | 7 | | $ | — | | $ | 2 | | $ | — | | $ | 1,290 | | $ | — | | $ | 1,299 | |
Barbados | | — | | — | | — | | — | | 7,280 | | — | | $ | 7,280 | |
Chile | | — | | — | | — | | — | | — | | 202 | | $ | 202 | |
Tanzania | | — | | — | | — | | — | | — | | 97 | | $ | 97 | |
Dominican Republic | | — | | — | | — | | — | | — | | 247 | | $ | 247 | |
Other | | — | | — | | — | | — | | 6 | | 100 | | $ | 106 | |
| | $ | 7 | | $ | — | | $ | 2 | | $ | — | | $ | 8,576 | | $ | 646 | | $ | 9,231 | |
AMT credits(2) | | | | | | | | | | | | $ | 318 | | $ | 318 | |
(1) Represents the gross amount of tax loss carry forwards translated at closing exchange rates at December 31, 2010.
(2) Represents the amounts deductible against future taxes payable in years when taxes payable exceed “minimum tax” as defined by United States tax legislation.
150
Barrick Financial Report 2010 | Notes to Consolidated Financial Statements
Net Deferred Tax Assets
| | 2010 | | 2009 | |
Gross deferred tax assets | | | | | |
Canada | | $ | 350 | | $ | 366 | |
Chile | | 20 | | 44 | |
Argentina | | 97 | | 119 | |
Australia | | 104 | | 109 | |
Tanzania | | 56 | | 122 | |
United States | | 136 | | 542 | |
Barbados | | 73 | | 69 | |
Other | | 56 | | 59 | |
| | 892 | | 1,430 | |
Valuation allowances | | | | | |
Canada | | (52 | ) | (45 | ) |
Chile | | (20 | ) | (22 | ) |
Argentina | | (97 | ) | (119 | ) |
Australia | | (104 | ) | (11 | ) |
Tanzania | | (30 | ) | (30 | ) |
United States | | (7 | ) | (136 | ) |
Barbados | | (73 | ) | (69 | ) |
Other | | (42 | ) | (49 | ) |
| | (425 | ) | (481 | ) |
Net | | $ | 467 | | $ | 949 | |
Valuation Allowances
We consider the need to record a valuation allowance against deferred tax assets, taking into account the effects of local tax law. A valuation allowance is not recorded when we conclude that sufficient positive evidence exists to demonstrate that it is more likely than not that a deferred tax asset will be realized.
The main factors considered are:
· Historic and expected future levels of taxable income;
· Tax plans that affect whether tax assets can be realized; and
· The nature, amount and expected timing of reversal of taxable temporary differences.
Levels of future taxable income are mainly affected by: market gold and silver prices; forecasted future costs and expenses to produce gold reserves; quantities of proven and probable gold reserves; market interest rates; and foreign currency exchange rates. If these factors or other circumstances change, we record an adjustment to valuation allowances to reflect our latest assessment of the amount of deferred tax assets that will more likely than not be realized.
A deferred income tax asset totaling $298 million has been recorded in Canada. This deferred tax asset primarily arose due to mark-to-market losses realized for acquired Placer Dome derivative instruments. Projections of various sources of income support the conclusion that the realizability of this deferred tax asset is more likely than not, and consequently no valuation allowance has been set up for this deferred tax asset.
Due to the impact of higher market gold prices in third quarter 2010 the remaining valuation allowance relating to AMT credits in the United States was released.
Source of Changes in Deferred Tax Balances
For the years ended December 31 | | 2010 | | 2009 | | 2008 | |
Temporary differences | | | | | | | |
Property, plant and equipment | | $ | (402 | ) | $ | (279 | ) | $ | (3 | ) |
Asset retirement obligations | | 81 | | 47 | | 24 | |
Tax loss carry forwards | | (106 | ) | 2 | | (72 | ) |
Capital tax loss carry forwards | | 101 | | — | | — | |
Derivatives | | (86 | ) | (171 | ) | 212 | |
Other | | (1 | ) | 8 | | (2 | ) |
| | (413 | ) | (393 | ) | 159 | |
Net currency translation gains/ (losses) on deferred tax balances | | 2 | | 40 | | (98 | ) |
Canadian tax rate changes | | — | | (59 | ) | — | |
Canadian functional currency election | | — | | 70 | | — | |
Release of other valuation allowances | | — | | — | | 175 | |
| | $ | (411 | ) | $ | (342 | ) | $ | 236 | |
Intraperiod allocation to: | | | | | | | |
Income (loss) from continuing operations before income taxes | | $ | (231 | ) | $ | (107 | ) | $ | 41 | |
Income (loss) from discontinued operations | | — | | (41 | ) | 4 | |
Tusker acquisition | | (22 | ) | — | | — | |
Acquisition of Hemlo | | — | | (56 | ) | — | |
Share issue costs | | — | | 40 | | — | |
Redemption of convertible senior debentures | | (12 | ) | — | | — | |
Cortez acquisition | | — | | — | | 11 | |
Barrick Energy Inc. acquisitions | | (37 | ) | — | | (22 | ) |
Kainantu acquisition | | — | | — | | (19 | ) |
Other acquisition | | — | | — | | 2 | |
OCI (note 26) | | (109 | ) | (178 | ) | 219 | |
Other | | (1 | ) | (8 | ) | (2 | ) |
| | $ | (412 | ) | $ | (350 | ) | $ | 234 | |
Unrecognized Tax Benefits
| | 2010 | | 2009 | |
At January 1 | | $ | 67 | | $ | 46 | |
Additions based on tax positions related to the current year | | — | | — | |
Additions for tax positions of prior years | | — | | 38 | |
Reductions for tax positions of prior years | | — | | — | |
Settlements | | (3 | ) | (17 | ) |
At December 31(1) | | $ | 64 | | $ | 67 | |
(1) If recognized, the total amount of $64 million would be recognized as a benefit to income taxes on the income statement, and therefore would impact the reported effective tax rate.
151
Notes to Consolidated Financial Statements
We anticipate the amount of unrecognized tax benefits to decrease within 12 months of the reporting date by approximately $2 million to $3 million, related primarily to the expected settlement of income tax and mining tax assessments.
We further anticipate that it is reasonably possible for the amount of unrecognized tax benefits to decrease within 12 months of the reporting date by approximately $37 million through a potential settlement with tax authorities that may result in a reduction of available tax pools.
Tax Years Still Under Examination
Canada | | 2006–2010 | |
United States | | 2010 | |
Peru | | 2007–2010 | |
Chile(1) | | 2007–2010 | |
Argentina | | 2004–2010 | |
Australia | | All years open | |
Papua New Guinea | | 2004–2010 | |
Tanzania | | All years open | |
(1) In addition, operating loss carry forwards from earlier periods are still open for examination.
Peruvian Tax Assessment
On September 30, 2004, the Tax Court of Peru issued a decision in our favor in the matter of our appeal of a 2002 income tax assessment for an amount of $32 million, excluding interest and penalties. The assessment mainly related to the validity of a revaluation of the Pierina mining concession, which affected its tax basis for the years 1999 and 2000. The full life-of-mine effect on current and deferred income tax liabilities totaling $141 million was fully recorded at December 31, 2002, as well as other related costs of about $21 million.
In January 2005, we received written confirmation that there would be no appeal of the September 30, 2004 Tax Court of Peru decision. In December 2004, we recorded a $141 million reduction in current and deferred income tax liabilities and a $21 million reduction in other accrued costs. The confirmation concluded the administrative and judicial appeals process with resolution in Barrick’s favor.
Notwithstanding the favorable Tax Court decision we received in 2004 on the 1999 to 2000 revaluation matter, in an audit concluded in 2005, SUNAT has reassessed us on the same issue for tax years 2001 to 2003. On October 19, 2007, SUNAT confirmed their reassessment. The tax assessment is for $53 million of tax, plus interest and penalties of $209 million updated as of December 31, 2010. We filed an appeal to the Tax Court of Peru within the statutory period. We believe that the audit reassessment has no merit, that we will prevail in court again, and accordingly no liability has been recorded for this reassessment.
25 · Capital Stock
a) Common Shares
Our authorized capital stock includes an unlimited number of common shares (issued 998,499,673 common shares); 9,764,929 First preferred shares Series A (issued nil); 9,047,619 Series B (issued nil); and 14,726,854 Second preferred shares Series A (issued nil).
Common Share Offering
On September 23, 2009, we issued 109 million common shares of Barrick at a price of $36.95 per share, for net proceeds of $3,885 million.
In 2010, we declared and paid dividends in US dollars totaling $0.44 per share ($436 million) (2009: $0.40 per share, $369 million; 2008: $0.40 per share, $349 million).
b) Exchangeable Shares
In connection with a 1998 acquisition, Barrick Gold Inc. (“BGI”) issued 11.1 million BGI exchangeable shares, which were each exchangeable for 0.53 of a Barrick common share at any time at the option of the holder, and had essentially the same voting, dividend (payable in Canadian dollars), and other rights as 0.53 of a Barrick common share. BGI is a subsidiary that holds our interest in the Hemlo and Eskay Creek Mines. We had the right to require the exchange of each outstanding BGI exchangeable share for 0.53 of a Barrick common share. In first quarter 2009, the remaining 0.5 million BGI exchangeable shares were redeemed for 0.3 million Barrick common shares.
152
Barrick Financial Report 2010 | Notes to Consolidated Financial Statements
26 · Other Comprehensive Income (Loss) (“OCI”)
| | 2010 | | 2009 | | 2008 | |
Accumulated OCI at beginning of period | | | | | | | |
Cash flow hedge gains, net of tax of $81, $89, $105 | | $ | 195 | | $ | (124 | ) | $ | 250 | |
Investments, net of tax of $3, $nil, $4 | | 24 | | (2 | ) | 37 | |
Currency translation adjustments, net of tax of $nil, $nil, $nil | | (141 | ) | (197 | ) | (143 | ) |
Pension plans and other post-retirement benefits, net of tax of $14, $19, $2 | | (23 | ) | (33 | ) | 7 | |
| | 55 | | (356 | ) | 151 | |
Other comprehensive income (loss) for the period: | | | | | | | |
Changes in fair value of cash flow hedges | | 612 | | 705 | | (301 | ) |
Changes in fair value of investments | | 69 | | 34 | | (52 | ) |
Currency translation adjustments(1) | | 22 | | 56 | | (54 | ) |
Pension plan and other post-retirement benefit adjustments (note 29): | | | | | | | |
Net actuarial gain (loss) | | (2 | ) | 15 | | (62 | ) |
Transition obligation (asset) | | — | | — | | 1 | |
Less: reclassification adjustments for (gains) losses recorded in earnings: | | | | | | | |
Transfers of cash flow hedge gains to earnings on recording hedged items in earnings | | (104 | ) | (216 | ) | (267 | ) |
Investments: | | | | | | | |
Other than temporary impairment charges | | — | | 1 | | 26 | |
Gains realized on sale | | (12 | ) | (6 | ) | (17 | ) |
Other comprehensive income (loss), before tax | | 585 | | 589 | | (726 | ) |
Income tax recovery (expense) related to OCI | | (109 | ) | (178 | ) | 219 | |
Other comprehensive income (loss), net of tax | | $ | 476 | | $ | 411 | | $ | (507 | ) |
Accumulated OCI at December 31 | | | | | | | |
Cash flow hedge gains, net of tax of $186, $81, $89 | | $ | 598 | | $ | 195 | | $ | (124 | ) |
Investment, net of tax of $7, $3, $nil | | 77 | | 24 | | (2 | ) |
Currency translation adjustments, net of tax of $nil, $nil, $nil | | (119 | ) | (141 | ) | (197 | ) |
Pension plans and other post-retirement benefits, net of tax of $14, $14, $19 | | (25 | ) | (23 | ) | (33 | ) |
| | $ | 531 | | $ | 55 | | $ | (356 | ) |
(1) Represents currency translation adjustments for Barrick Energy.
27 · Non-controlling Interests
| | Pueblo Viejo project | | African Barrick Gold(1) | | Cerro Casale(2) | | Other | | Total | |
At January 1, 2008 | | $ | 60 | | $ | 17 | | $ | — | | $ | 5 | | $ | 82 | |
Share of net earnings (loss) | | (26 | ) | 38 | | — | | — | | 12 | |
Cash contributed | | 120 | | (30 | ) | — | | — | | 90 | |
Other increase in non-controlling interest | | — | | — | | — | | (2 | ) | (2 | ) |
At December 31, 2008 | | 154 | | 25 | | — | | 3 | | 182 | |
Share of net earnings (loss) | | 1 | | 5 | | — | | — | | 6 | |
Cash contributed | | 307 | | (8 | ) | — | | — | | 299 | |
Other increase in non-controlling interest | | — | | — | | — | | (3 | ) | (3 | ) |
At December 31, 2009 | | 462 | | 22 | | — | | — | | 484 | |
Share of net earnings (loss) | | (3 | ) | 41 | | (15 | ) | — | | 23 | |
Cash contributed | | 101 | | — | | 13 | | — | | 114 | |
Other increase in non-controlling interest | | — | | 594 | | 454 | | — | | 1,048 | |
At December 31, 2010 | | $ | 560 | | $ | 657 | | $ | 452 | | $ | — | | $ | 1,669 | |
(1) Represents non-controlling interest in ABG. The balance at January 1, 2010 includes the non-controlling interest of 30% in our Tulawaka mine.
(2) Represents non-controlling interest in Cerro Casale. Refer to note 3f.
153
Notes to Consolidated Financial Statements
28 · Stock-based Compensation
a) Stock Options
Under Barrick’s stock option plan, certain officers and key employees of the Corporation may purchase common shares at an exercise price that is equal to the closing share price on the day before the grant of the option. The grant date is the date when the details of the award, including the number of options granted by individual and the exercise price, are approved. Stock options vest evenly over four years, beginning in the year after granting. Options granted in July 2004 and prior are exercisable over 10 years, whereas options granted since December 2004 are exercisable over seven years. At December 31, 2010, 6.7 million (2009: 6.9 million; 2008: 7.4 million) common shares, in addition to those currently outstanding, were available for granting options. Stock options when exercised result in an increase to the number of common shares issued by Barrick.
Compensation expense for stock options was $14 million in 2010 (2009: $20 million; 2008: $25 million), and is presented as a component of corporate administration and other expense, consistent with the classification of other elements of compensation expense for those employees who had stock options. In 2009, we recognized an additional $7 million of stock option expense as a result of accelerating the vesting conditions of certain plan participants on their departure from the Company. The recognition of compensation expense for stock options reduced earnings per share for 2010 by $0.01 per share (2009: $0.03 per share; 2008: $0.03 per share).
Total intrinsic value relating to options exercised in 2010 was $96 million (2009: $38 million; 2008: $61 million).
Employee Stock Option Activity (Number of Shares in Millions)
| | 2010 | | 2009 | | 2008 | |
| | | | Average | | | | Average | | | | Average | |
| | Shares | | price | | Shares | | price | | Shares | | price | |
C$ options | | | | | | | | | | | | | |
At January 1 | | 3.3 | | $ | 27 | | 4.8 | | $ | 27 | | 7.1 | | $ | 27 | |
Exercised | | (1.9 | ) | 27 | | (1.4 | ) | 26 | | (2.1 | ) | 28 | |
Forfeited | | — | | — | | — | | — | | — | | — | |
Cancelled/expired | | — | | — | | (0.1 | ) | 23 | | (0.2 | ) | 28 | |
At December 31 | | 1.4 | | $ | 26 | | 3.3 | | $ | 27 | | 4.8 | | $ | 27 | |
US$ options | | | | | | | | | | | | | |
At January 1 | | 9.1 | | $ | 33 | | 8.9 | | $ | 28 | | 7 | | $ | 28 | |
Granted | | 0.9 | | 55 | | 1.6 | | 41 | | 2.8 | | 34 | |
Exercised | | (2.9 | ) | 28 | | (1.3 | ) | 24 | | (0.8 | ) | 24 | |
Forfeited | | (0.1 | ) | 38 | | (0.1 | ) | 35 | | (0.1 | ) | 31 | |
Cancelled/expired | | — | | — | | — | | — | | — | | — | |
At December 31 | | 7.0 | | $ | 38 | | 9.1 | | $ | 33 | | 8.9 | | $ | 28 | |
154
Barrick Financial Report 2010 | Notes to Consolidated Financial Statements
Stock Options Outstanding (Number of Shares in Millions)
| | Outstanding | | Exercisable | |
| | | | | | | | Intrinsic | | | | | | Intrinsic | |
| | | | Average | | Average | | value(1) | | | | Average | | value(1) | |
Range of exercise prices | | Shares | | price | | life (years) | | ($ millions) | | Shares | | price | | ($ millions) | |
C$ options | | | | | | | | | | | | | | | |
$ 22 – $ 27 | | 0.8 | | $ | 24 | | 2 | | $ | 24 | | 0.8 | | $ | 24 | | $ | 24 | |
$ 28 – $ 31 | | 0.6 | | 29 | | 3 | | 15 | | 0.6 | | 29 | | 15 | |
| | 1.4 | | $ | 26 | | 2 | | $ | 39 | | 1.4 | | $ | 26 | | $ | 39 | |
US$ options | | | | | | | | | | | | | | | |
$ 9 – $ 19 | | 0.1 | | $ | 13 | | 2 | | $ | 3 | | 0.1 | | $ | 13 | | $ | 3 | |
$ 20 – $ 27 | | 1.9 | | 26 | | 3 | | 53 | | 1.4 | | 25 | | 40 | |
$ 28 – $ 41 | | 1.4 | | 37 | | 5 | | 32 | | 1.3 | | 37 | | 22 | |
$ 42 – $ 55 | | 3.6 | | 46 | | 6 | | 21 | | 0.8 | | 43 | | 9 | |
| | 7.0 | | $ | 38 | | 5 | | $ | 109 | | 3.6 | | $ | 33 | | $ | 74 | |
(1) Based on the closing market share price on December 31, 2010 of C$53.12 and US$53.18.
Option Information
For the years ended December 31 | | | | | | | |
(per share and per option amounts in dollars) | | 2010 | | 2009 | | 2008 | |
Valuation assumptions | | Lattice | (1),(2) | Lattice | (1),(2) | Lattice | (1),(2) |
Expected term (years) | | 5.0–5.1 | | 5.0–5.1 | | 4.5–5.2 | |
Expected volatility(2) | | 33%–60% | | 35%–60% | | 30%–70% | |
Weighted average expected volatility(2) | | 36% | | 51% | | 43% | |
Expected dividend yield | | 1%–1.13% | | 1%–1.1% | | 0.7%–1.5% | |
Risk-free interest rate(2) | | 0.19%–2.88% | | 0.16%–3.44% | | 0.25%–5.1% | |
| | | | | | | |
Options granted (in millions) | | 0.9 | | 1.6 | | 2.8 | |
Weighted average fair value per option | | $ | 16 | | $ | 13 | | $ | 12 | |
| | | | | | | | | | |
(1) Different assumptions were used for the multiple stock option grants during the year.
(2) The volatility and risk-free interest rate assumption varied over the expected term of these stock option grants.
The expected volatility assumptions have been developed taking into consideration both historical and implied volatility of our US dollar share price. The risk-free rate for periods within the contractual life of the option is based on the US Treasury yield curve in effect at the time of the grant.
We use the straight-line method for attributing stock option expense over the vesting period. Stock option expense incorporates an expected forfeiture rate. The expected forfeiture rate is estimated based on historical forfeiture rates and expectations of future forfeiture rates. We make adjustments if the actual forfeiture rate differs from the expected rate.
The expected term assumption is derived from the option valuation model and is in part based on historical data regarding the exercise behavior of option holders based on multiple share-price paths. The Lattice model also takes into consideration employee turnover and voluntary exercise patterns of option holders.
As at December 31, 2010, there was $37 million (2009: $58 million; 2008: $42 million) of total unrecognized compensation cost relating to unvested stock options. We expect to recognize this cost over a weighted average period of 2 years (2009: 2 years; 2008: 2 years).
b) Restricted Share Units (RSUs) and Deferred Share Units (DSUs)
Under our RSU plan, selected employees are granted RSUs where each RSU has a value equal to one Barrick common share. RSUs vest at the end of a two-and-a-half or three-year period and are settled in cash on the third anniversary of the grant date. Additional RSUs are credited to reflect dividends paid on Barrick common shares over the vesting period.
A liability for RSUs is recorded at fair value on the grant date, with a corresponding amount recorded as a deferred compensation asset that is amortized on a straight-line basis over the vesting period. Changes in the fair value of the RSU liability
155
Notes to Consolidated Financial Statements
are recorded each period, with a corresponding adjustment to the deferred compensation asset.
Compensation expense for RSUs incorporates an expected forfeiture rate. The expected forfeiture rate is estimated based on historical forfeiture rates and expectations of future forfeiture rates. We make adjustments if the actual forfeiture rate differs from the expected rate. At December 31, 2010, the weighted average remaining contractual life of RSUs was 1.22 years.
Compensation expense for RSUs was $48 million in 2010 (2009: $40 million; 2008: $33 million) and is presented as a component of corporate administration and other expense, consistent with the classification of other elements of compensation expense for those employees who had RSUs. As at December 31, 2010 there was $83 million of total unamortized compensation cost relating to unvested RSUs (2009: $74 million; 2008: $84 million).
Under our DSU plan, Directors must receive a specified portion of their basic annual retainer in the form of DSUs, with the option to elect to receive 100% of such retainer in DSUs. Each DSU has the same value as one Barrick common share. DSUs must be retained until the Director leaves the Board, at which time the cash value of the DSUs will be paid out. Additional DSUs are credited to reflect dividends paid on Barrick common shares. DSUs are recorded at fair value on the grant date and are adjusted for changes in fair value. The fair value of amounts granted each period together with changes in fair value are expensed.
DSU and RSU Activity
| | | | Fair | | | | Fair | |
| | DSUs | | value | | RSUs | | value | |
| | (thousands) | | ($ millions) | | (thousands) | | ($ millions) | |
At January 1, 2008 | | 100 | | $ | 4 | | 2,383 | | $ | 100 | |
Settled for cash | | (4 | ) | (0.1 | ) | (348 | ) | (10.3 | ) |
Forfeited | | — | | — | | (262 | ) | (10.6 | ) |
Granted | | 34 | | 1.2 | | 1,493 | | 42 | |
Credits for dividends | | — | | — | | 20 | | 0.7 | |
Change in value | | — | | (0.5 | ) | — | | (1.7 | ) |
At December 31, 2008 | | 130 | | $ | 5 | | 3,286 | | $ | 120 | |
Settled for cash | | — | | — | | (897 | ) | (35.7 | ) |
Forfeited | | — | | — | | (279 | ) | (11.1 | ) |
Granted | | 37 | | 1.2 | | 1,013 | | 42.1 | |
Credits for dividends | | — | | — | | 27 | | 1 | |
Change in value | | — | | 0.7 | | — | | 7.4 | |
At December 31, 2009 | | 167 | | $ | 7 | | 3,150 | | $ | 124 | |
Settled for cash | | (20 | ) | (0.6 | ) | (824 | ) | (42.8 | ) |
Forfeited | | — | | — | | (326 | ) | (17.0 | ) |
Granted | | 33 | | 1.5 | | 918 | | 49.3 | |
Credits for dividends | | — | | — | | 30 | | 1.3 | |
Change in value | | — | | 1.9 | | — | | 37.9 | |
At December 31, 2010 | | 180 | | $ | 9 | | 2,948 | | $ | 153 | |
c) Performance Restricted Share Units (PRSUs)
In 2008, Barrick launched a PRSU plan. Under this plan, selected employees are granted PRSUs, where each PRSU has a value equal to one Barrick common share. PRSUs vest at the end of a three-year period and are settled in cash on the third anniversary of the grant date. Additional PRSUs are credited to reflect dividends paid on Barrick common shares over the vesting period. Vesting, and therefore, the liability is based on the achievement of performance goals and the target settlement will range from 0% to 200% of the value. At December 31, 2010, 335 thousand units were outstanding (2009: 250 thousand units).
d) Employee Share Purchase Plan (ESPP)
In 2008, Barrick launched an Employee Share Purchase Plan. This plan enables Barrick employees to purchase Company shares through payroll deduction. Each year, employees may contribute 1%—6% of their combined base salary and annual bonus, and Barrick will match 50% of the contribution, up to a maximum of $5,000 per year. During 2010, Barrick contributed $0.6 million to this plan (2009: $0.8 million).
e) ABG Stock Options
African Barrick Gold has a stock option plan for its directors and selected employees. The exercise price of the granted options is determined by the ABG Remuneration Committee before the grant of an option provided that this price cannot be less than the average of the middle-market quotation of ABG’s shares (as derived from the London Stock Exchange Daily Official List) for the three dealing days immediately preceding the date of grant. All options outstanding at the end of the year expire in 2017. None of the ABG options granted were exercisable at December 31, 2010. Stock option expense of $1 million (2009: $nil; 2008: $nil) is included as a component of other expense.
156
29 · Post-retirement Benefits
a) Defined Contribution Pension Plans
Certain employees take part in defined contribution employee benefit plans. We also have a retirement plan for certain officers of the Company, under which we contribute 15% of the officer’s annual salary and bonus. Our share of contributions to these plans, which is expensed in the year it is earned by the employee, was $56 million in 2010, $50 million in 2009 and $47 million in 2008.
b) Defined Benefit Pension Plans
We have qualified defined benefit pension plans that cover certain of our United States and Canadian employees and provide benefits based on employees’ years of service. Our policy is to fund the amounts necessary on an actuarial basis to provide enough assets to meet the benefits payable to plan members. Independent trustees administer assets of the plans, which are invested mainly in fixed income and equity securities. In 2009, two of our qualified defined benefit plans in Canada were wound up. No curtailment gain or loss resulted and the obligations of the plans were settled in 2009. In 2007, one of our qualified defined benefit plans in Canada was wound up. No curtailment gain or loss resulted and the obligations of the plans were settled in 2009.
As well as the qualified plans, we have non-qualified defined benefit pension plans covering certain employees and former directors of the Company. An irrevocable trust (“rabbi trust”) was set up to fund these plans. The fair value of assets held in this trust was $nil in 2010 (2009: $6 million).
Actuarial gains and losses arise when the actual return on plan assets differs from the expected return on plan assets for a period, or when the expected and actuarial accrued benefit obligations differ at the end of the year. We amortize actuarial gains and losses over the average remaining life expectancy of plan participants, in excess of a 10% corridor.
Pension Expense (Credit)
For the years ended December 31 | | 2010 | | 2009 | | 2008 | |
Expected return on plan assets | | $ | (14 | ) | $ | (14 | ) | $ | (19 | ) |
Service cost | | — | | — | | — | |
Interest cost | | 17 | | 19 | | 21 | |
Actuarial losses | | 2 | | 2 | | 1 | |
| | $ | 5 | | $ | 7 | | $ | 3 | |
c) Pension Plan Information
Fair Value of Plan Assets
For the years ended December 31 | | 2010 | | 2009 | | 2008 | |
Balance at January 1 | | $ | 215 | | $ | 237 | | $ | 293 | |
Increase for plans assumed on acquisitions(1) | | — | | 8 | | 9 | |
Actual return on plan assets | | 25 | | 36 | | (41 | ) |
Company contributions | | 12 | | 9 | | 12 | |
Settlements | | — | | (24 | ) | — | |
Benefits paid | | (25 | ) | (52 | ) | (33 | ) |
Foreign currency adjustments | | — | | 1 | | (3 | ) |
Balance at December 31 | | $ | 227 | | $ | 215 | | $ | 237 | |
(1) In 2009, represents plan acquired on acquisition of additional 50% in Hemlo.
In 2008, represents plan acquired on acquisition of additiona l 40% in Cortez.
| | 2010 | | 2010 | |
At December 31 | | Target(1) | | Actual | | Actual | |
Composition of plan assets(2) | | | | | | | |
Equity securities | | 54 | % | 54 | % | $ | 122 | |
Fixed income securities | | 46 | % | 46 | % | 105 | |
| | 100 | % | 100 | % | $ | 227 | |
(1) Based on the weighted average target for all defined benefit plans
(2) Holdings in Equity and Fixed income securities consist of Level 1 and Level 2 assets within the fair value hierarchy.
Projected Benefit Obligation (PBO)
For the years ended December 31 | | 2010 | | 2009 | |
Balance at January 1 | | $ | 321 | | $ | 357 | |
Increase for plans assumed on acquisitions | | — | | 6 | |
Amendments | | 1 | | — | |
Service cost | | — | | — | |
Interest cost | | 17 | | 19 | |
Actuarial losses | | 20 | | 6 | |
Benefits paid | | (25 | ) | (52 | ) |
Foreign currency adjustments | | 2 | | 8 | |
Settlements | | — | | (23 | ) |
Balance at December 31 | | $ | 336 | | $ | 321 | |
Funded status(1) | | $ | (109 | ) | $ | (106 | ) |
ABO(2) | | $ | 335 | | $ | 321 | |
(1) Represents the fair value of plan assets less projected benefit obligations.
(2) Represents the accumulated benefit obligation (“ABO”) for all plans. The ABO for plans where the PBO exceeds the fair value of plan assets was $326 million (2009: $314 million). Based on actuarial reports at December 31, 2010, our funding requirements for 2011 are $nil.
157
Notes to Consolidated Financial Statements
Pension Plan Assets/Liabilities
For the years ended December 31 | | 2010 | | 2009 | |
Non-current assets | | $ | 2 | | $ | 3 | |
Current liabilities | | (8 | ) | (13 | ) |
Non-current liabilities | | (103 | ) | (96 | ) |
Other comprehensive loss | | 43 | | 34 | |
| | $ | (66 | ) | $ | (72 | ) |
The projected benefit obligation and fair value of plan assets for pension plans with a projected benefit obligation in excess of plan assets at December 31, 2010 and 2009 were as follows:
For the years ended December 31 | | 2010 | | 2009 | |
Projected benefit obligation, end of year | | $ | 328 | | $ | 314 | |
Fair value of plan assets, end of year | | $ | 217 | | $ | 206 | |
The projected benefit obligation and fair value of plan assets for pension plans with an accumulated benefit obligation in excess of plan assets at December 31, 2010 and 2009 were as follows:
For the years ended December 31 | | 2010 | | 2009 | |
Projected benefit obligation, end of year | | $ | 328 | | $ | 314 | |
Accumulated benefit obligation, end of year | | $ | 326 | | $ | 314 | |
Fair value of plan assets, end of year | | $ | 217 | | $ | 206 | |
Expected Future Benefit Payments
For the years ending December 31 | | | |
2011 | | $ | 24 | |
2012 | | 23 | |
2013 | | 31 | |
2014 | | 23 | |
2015 | | 23 | |
2016 – 2020 | | $ | 114 | |
d) Actuarial Assumptions
For the years ended December 31 | | 2010 | | 2009 | | 2008 | |
Discount rate(1) | | | | | | | |
Benefit obligation | | 4.95%–5.77% | | 5.55–6.87% | | 4.50–6.25% | |
Pension cost | | 4.82%–6.87% | | 6.00–6.25% | | 4.50–6.25% | |
Return on plan assets(1) | | 4.50%–7.00% | | 4.50–7.00% | | 3.75–7.00% | |
Wage increases | | 5.00% | | 5.00% | | 3.50–5.00% | |
(1) Effect of a one-percent change: Discount rate: $32 million increase in ABO and $1.5 million decrease in pension cost; Return on plan assets: $2 million decrease in pension cost.
Pension plan assets, which consist primarily of fixed-income and equity securities, are valued using current market quotations. Plan obligations and the annual pension expense are determined on an actuarial basis and are affected by numerous assumptions and estimates including the market value of plan assets, estimates of the expected return on plan assets, discount rates, future wage increases and other assumptions. The discount rate, assumed rate of return on plan assets and wage increases are the assumptions that generally have the most significant impact on our pension cost and obligation.
The discount rate used to calculate the benefit obligation and pension cost is the rate at which the pension obligation could be effectively settled. This rate was developed by matching the cash flows underlying the pension obligation with a spot rate curve based on the actual returns available on high-grade (Moody’s Aa) US corporate bonds. Bonds included in this analysis were restricted to those with a minimum outstanding balance of $50 million. Only non-callable bonds, or bonds with a make-whole provision, were included. Finally, outlying bonds (highest and lowest 10%) were discarded as being non-representative and likely to be subject to a change in investment grade. The procedure was applied separately for pension and post-retirement plan purposes, and produced the same rate in each case.
The assumed rate of return on assets for pension cost purposes is the weighted average of expected long-term asset return assumptions. In estimating the long-term rate of return for plan assets, historical markets are studied and long-term historical returns on equities and fixed-income investments reflect the widely accepted capital market principle that assets with higher volatility generate a greater return over the long run. Current market factors such as inflation and interest rates are evaluated before long-term capital market assumptions are finalized.
Wage increases reflect the best estimate of merit increases to be provided, consistent with assumed inflation rates.
158
Barrick Financial Report 2010 | Notes to Consolidated Financial Statements
e) Other Post-retirement Benefits
We provide post-retirement medical, dental, and life insurance benefits to certain employees. We use the corridor approach in the accounting for post-retirement benefits. Actuarial gains and losses resulting from variances between actual results and economic estimates or actuarial assumptions are deferred and amortized over the average remaining life expectancy of participants when the net gains or losses exceed 10% of the accumulated post-retirement benefit obligation.
Other Post-retirement Benefits Expense
For the years ended December 31 | | 2010 | | 2009 | | 2008 | |
Interest cost | | $ | 1 | | $ | 2 | | $ | 2 | |
| | | | | | | | | | |
Fair Value of Plan Assets
For the years ended December 31 | | 2010 | | 2009 | | 2008 | |
Balance at January 1 | | $ | — | | $ | — | | $ | — | |
Contributions | | 2 | | 1 | | 2 | |
Benefits paid | | (2 | ) | (1 | ) | (2 | ) |
Balance at December 31 | | $ | — | | $ | — | | $ | — | |
Accumulated Post-retirement Benefit Obligation (APBO)
For the years ended December 31 | | 2010 | | 2009 | | 2008 | |
Balance at January 1 | | $ | 29 | | $ | 32 | | $ | 30 | |
Interest cost | | 1 | | 2 | | 2 | |
Actuarial (gains) losses | | (1 | ) | (3 | ) | 2 | |
Benefits paid | | (2 | ) | (2 | ) | (2 | ) |
Balance at December 31 | | $ | 27 | | $ | 29 | | $ | 32 | |
Funded status | | (27 | ) | (29 | ) | (32 | ) |
Unrecognized net transition obligation | | n/a | | n/a | | n/a | |
Unrecognized actuarial losses | | n/a | | n/a | | n/a | |
Net benefit liability recorded | | n/a | | n/a | | n/a | |
Other Post-retirement Liabilities
For the years ended December 31 | | 2010 | | 2009 | |
Current liability | | $ | 2 | | $ | 3 | |
Non-current liability | | 25 | | 26 | |
| | $ | 27 | | $ | 29 | |
Amounts recognized in accumulated other comprehensive income consist of:(1)
For the years ended December 31 | | 2010 | | 2009 | |
Net actuarial loss (gain) | | $ | (4 | ) | $ | (4 | ) |
Transition obligation (asset) | | — | | 1 | |
| | $ | (4 | ) | $ | (3 | ) |
(1) The estimated amounts that will be amortized into net periodic benefit cost in 2011.
We have assumed a health care cost trend of 8% in 2011, decreasing ratably to 4.75% in 2019 and thereafter. The assumed health care cost trend had a minimal effect on the amounts reported. A one percentage point change in the assumed health care cost trend rate at December 31, 2010 would have had no significant effect on the post-retirement obligation and would have had no significant effect on the benefit expense for 2010.
Expected Future Benefit Payments
For the years ending December 31 | | | |
2011 | | $ | 2 | |
2012 | | 2 | |
2013 | | 3 | |
2014 | | 3 | |
2015 | | 2 | |
2016 – 2020 | | $ | 5 | |
159
Notes to Consolidated Financial Statements
30 · Litigation and Claims
Certain conditions may exist as of the date the financial statements are issued, which may result in a loss to the Company but which will only be resolved when one or more future events occur or fail to occur. In assessing loss contingencies related to legal proceedings that are pending against us or unasserted claims that may result in such proceedings, the Company and its legal counsel evaluate the perceived merits of any legal proceedings or unasserted claims as well as the perceived merits of the amount of relief sought or expected to be sought.
If the assessment of a contingency suggests that a loss is probable, and the amount can be reliably estimated, then a loss is recorded. When a contingent loss is not probable but is reasonably possible, or is probable but the amount of loss cannot be reliably estimated, then details of the contingent loss are disclosed. Loss contingencies considered remote are generally not disclosed unless they involve guarantees, in which case we disclose the nature of the guarantee. Legal fees incurred in connection with pending legal proceedings are expensed as incurred.
Cortez Hills Complaint
On November 12, 2008, the United States Bureau of Land Management issued a Record of Decision approving the Cortez Hills Expansion Project. On November 20, 2008, the TeMoak Shoshone Tribe, the East Fork Band Council of the TeMoak Shoshone Tribe and the Timbisha Shoshone Tribe, the Western Shoshone Defense Project, and Great Basin Resource Watch filed a lawsuit against the United States seeking to enjoin the majority of the activities comprising the Project on grounds that it violated the Western Shoshone rights under the Religious Freedom Restoration Act (“RFRA”), that it violated the Federal Land Policy and Management Act’s (“FLPMA”) prohibition on “unnecessary and undue degradation,” and that the Project’s Environment Impact Statement (“EIS”) did not meet the requirements of the National Environmental Policy Act (“NEPA”). The Plaintiffs subsequently dismissed their RFRA claim, with prejudice, conceding that it was without merit, in light of a decision in another case.
On November 24, 2008, the Plaintiffs filed a Motion for a Temporary Restraining Order and a Preliminary Injunction barring work on the Project until after a trial on the merits. In January 2009, the Court denied the Plaintiffs’ Motion for a Preliminary Injunction, concluding that the Plaintiffs had failed to demonstrate a likelihood of success on the merits and that the Plaintiffs had otherwise failed to satisfy the necessary elements for a preliminary injunction. The Plaintiffs appealed that decision to the United States Court of Appeals for the Ninth Circuit. In December 2009, the Ninth Circuit issued an opinion in which it held that the Plaintiffs had failed to show that they were likely to succeed on the merits of their FLPMA claims, and thus were not entitled to an injunction based on those claims. The Ninth Circuit, however, held that Plaintiffs were likely to succeed on two of their NEPA claims and ordered that a supplemental EIS be prepared by Barrick that specifically provided more information on (i) the effectiveness of proposed mitigation measures for seeps and springs that might be affected by groundwater pumping, and (ii) the air quality impact of the shipment of refractory ore to Goldstrike for processing and that additional air quality modeling for fine particulate matter using updated EPA procedures should be performed and included in the supplemental EIS. The Ninth Circuit decision directed the District Court to enter an injunction consistent with the decision. In April 2010, the District Court granted Barrick’s motion seeking a tailored preliminary injunction, which allows mining operations to continue while the supplemental EIS is being completed.
In August 2010, the District Court issued an order granting summary judgment for Cortez except, generally for those issues covered by the supplemental EIS, on which it reserved ruling until the completion of that document. The final supplemental EIS was published on January 14, 2011. BLM’s record of decision on the final supplemental EIS is expected sometime after February 14, 2011.
Marinduque Complaint
Placer Dome Inc. was named the sole defendant in a Complaint filed in October 2005, by the Provincial Government of Marinduque, an island province of the Philippines (“Province”), with the District Court in Clark County, Nevada. The Complaint asserted that Placer Dome Inc. was responsible for alleged environmental degradation with consequent economic damages and impacts to the environment in the vicinity of the Marcopper mine that was owned and operated by Marcopper Mining Corporation (“Marcopper”). Placer Dome Inc. indirectly owned a minority shareholding of 39.9% in Marcopper until the divestiture of its shareholding in 1997. The Province sought “to recover damages for injuries to the natural, ecological and wildlife resources within its territory”. In addition, the Province sought compensation for the costs of restoring the environment, an order directing Placer Dome Inc. to undertake and complete “the remediation, environmental cleanup, and balancing of the ecology of the affected areas,” and payment of the costs of environmental monitoring. The Complaint addressed the discharge of mine tailings into Calancan Bay, the
160
Barrick Financial Report 2010 | Notes to Consolidated Financial Statements
1993 Maguila-guila dam breach, the 1996 Boac river tailings spill, and alleged past and continuing damage from acid rock drainage.
The action was removed to the U.S. District Court for the District of Nevada on motion of Placer Dome Inc. After the amalgamation of Placer Dome Inc. and the Company, the Court granted the Province’s motion to join the Company as an additional named Defendant. In June 2007, the Court issued an order granting the Company’s motion to dismiss on grounds of forum non conveniens (improper choice of forum). In September 2009, the U.S. Court of Appeals for the Ninth Circuit reversed the decision of the District Court on the ground that the U.S. District Court lacked subject matter jurisdiction over the case and removal from the Nevada state court was improper.
In April 2010, the Company filed a motion to dismiss the claims in the Nevada state court on the grounds of forum non conveniens and on October 12, 2010, the court issued an order granting the Company’s motion to dismiss the action. On February 11, 2011, the Court issued its written reasons for the dismissal order and the Province now has 30 days in which to determine whether or not to appeal the order.
No amounts have been accrued for any potential loss under this complaint.
Calancan Bay (Philippines) Complaint
In July 2004, a complaint was filed against Marcopper and Placer Dome Inc. in the Regional Trial Court of Boac, on the Philippine island of Marinduque, on behalf of a putative class of fishermen who reside in the communities around Calancan Bay, in northern Marinduque. The complaint alleges injuries to health and economic damages to the local fisheries resulting from the disposal of mine tailings from the Marcopper mine. The total amount of damages claimed is approximately US$1 billion.
In October 2006, the court granted the plaintiffs’ application for indigent status, allowing the case to proceed without payment of filing fees. In March 2008, an attempt was made to serve Placer Dome Inc. by serving the summons and complaint on Placer Dome Technical Services (Philippines) Inc. (“PDTS”). PDTS has returned the summons and complaint stating that PDTS is not an agent of Placer Dome Inc. for any purpose and is not authorized to accept service or to take any other action on behalf of Placer Dome Inc. In April 2008, Placer Dome Inc. made a special appearance by counsel to move to dismiss the complaint for lack of personal jurisdiction and on other grounds. The plaintiffs have opposed the motion to dismiss. The motion has been briefed and is currently pending.
In October 2008, the plaintiffs filed a motion challenging Placer Dome Inc.’s legal capacity to participate in the proceedings in light of its alleged “acquisition” by the Company. Placer Dome Inc. opposed this motion. The motion has been briefed and is currently pending.
The Company intends to defend the action vigorously. No amounts have been accrued for any potential loss under this complaint.
Perilla Complaint
In August 2009, Barrick Gold Inc. was purportedly served in Ontario with a complaint filed in November 2008 in the Regional Trial Court of Boac, on the Philippine island of Marinduque, on behalf of two named individuals and purportedly on behalf of the approximately 200,000 residents of Marinduque. In December 2009, the complaint was also purportedly served in Ontario in the name of Placer Dome Inc. The complaint alleges injury to the economy and the ecology of Marinduque as a result of the discharge of mine tailings from the Marcopper mine into the Calancan Bay, the Boac River, and the Mogpog River. The plaintiffs are claiming for abatement of a public nuisance allegedly caused by the tailings discharge and for nominal damages for an alleged violation of their constitutional right to a balanced and healthful ecology. Barrick Gold Inc. has moved to dismiss the complaint on a variety of grounds, which motion is now pending a decision of the Court following the failure of plaintiffs’ counsel to appear at the hearing in February 2010 or to timely file any comment or opposition to the motion. Motions to dismiss the complaint on a variety of grounds have also been filed in the name of Placer Dome Inc. In May 2010, the plaintiffs filed a motion for an order to admit an amended complaint in which they are seeking additional remedies including temporary and permanent environmental protection orders. In June 2010, Barrick Gold Inc. and Placer Dome Inc. filed a motion to have the Court resolve their unresolved motions to dismiss before considering the plaintiffs’ motion to admit the amended complaint. An opposition to the plaintiffs’ motion to admit was also filed by Barrick Gold Inc. and Placer Dome Inc. on the same basis. This motion is now fully briefed and awaiting determination by the Court. It is not known when these motions or the outstanding motions to dismiss will be decided by the Court. The Company intends to defend the action vigorously. No amounts have been accrued for any potential loss under this complaint.
Pakistani Constitutional Litigation
In November 2006, a Constitutional Petition was filed in the High Court of Balochistan by three Pakistani citizens against: Barrick, the governments of Balochistan and Pakistan, the Balochistan Development Authority (“BDA”), Tethyan Copper Company (“TCC”), Antofagasta Plc (“Antofagasta”), Muslim Lakhani and BHP (Pakistan) Pvt Limited (“BHP”).
161
Notes to Consolidated Financial Statements
The Petition alleged, among other things, that the entry by the BDA into the 1993 Joint Venture Agreement (“JVA”) with BHP to facilitate the exploration of the Reko Diq area and the grant of related exploration licenses were illegal and that the subsequent transfer of the interests of BHP in the JVA and the licenses to TCC was also illegal and should therefore be set aside. Barrick currently indirectly holds 50% of the shares of TCC, with Antofagasta indirectly holding the other 50%.
In June 2007, the High Court of Balochistan dismissed the Petition against Barrick and the other respondents in its entirety. In August 2007, the petitioners filed a Civil Petition for Leave to Appeal in the Supreme Court of Pakistan. In late 2010, the Supreme Court of Pakistan began hearing this matter, together with several other related petitions filed against TCC or its related parties. The related petitions primarily relate to whether it is in the public interest for TCC to receive a mining lease. On February 3, 2011, the Supreme Court issued an interim order providing, among other things, that the Government of Balochistan may not take any decision in respect of the grant or otherwise of a mining lease to TCC until matters before the Supreme Court are decided. As of February 16, 2011, no decision has been reached by the Supreme Court. Barrick and TCC continue to defend these actions vigorously. No amounts have been accrued for any potential loss under these complaints.
Pueblo Viejo
In April, 2010, Pueblo Viejo Dominicana Corporation (“PVDC”) received a copy of an action filed in the Dominican Republic by Fundacion Amigo de Maimon Inc., Fundacion Miguel L. de Pena Garcia Inc., and a number of individuals. The action alleges a variety of matters couched as violations of fundamental rights, including taking of private property, violations of mining and environmental and other laws, slavery, human trafficking, and bribery of government officials. The complaint does not describe the relief sought, but the action is styled as an “Amparo” remedy, which typically includes some form of injunctive relief. PVDC intends to vigorously defend the action.
Argentine Glacier Legislation
On September 30, 2010, the National Law on Minimum Requirements for the Protection of Glaciers was enacted in Argentina, and came into force in early November 2010. The federal law bans new mining exploration and exploitation activities on glaciers and in the “peri-glacial” environment, and subjects ongoing mining activities to an environmental audit. If such audit identifies significant impacts on glaciers and peri-glacial environment, the relevant authority is empowered to take action, which according to the legislation could include the suspension or relocation of the activity. In the case of the Veladero mine and the Pascua-Lama project, the competent authority is the Province of San Juan. The Province of San Juan had previously adopted glacier protection legislation, with which Veladero and Pascua-Lama comply.
In November 2010, in response to legal actions brought against the National State by local unions and San Juan based mining and construction chambers, as well as by Barrick’s subsidiaries, Barrick Exploraciones Argentina S.A. and Minera Argentina Gold S.A., which own the Veladero mine and the Argentine portion of the Pascua-Lama project, respectively, the Federal Court in the Province of San Juan, granted injunctions, based on the unconstitutionality of the federal law, suspending its application in the Province and, in particular to Veladero and Pascua-Lama. In December 2010, the Province of San Juan became a party to the actions, joining the challenge to the constitutionality of the new federal legislation. As a result of the intervention of the Province, the actions have been removed to the National Supreme Court of Justice of Argentina to determine the constitutionality of the legislation.
162
Barrick Financial Report 2010 | Mineral Reserves and Mineral Resources
Mineral Reserves and Mineral Resources
The tables on the next seven pages set forth Barrick’s interest in the total proven and probable gold and copper reserves and in the total measured and indicated gold, copper and nickel resources and certain related information at each property. For further details of proven and probable mineral reserves and measured, indicated and inferred mineral resources by category, metal and property, see pages 166 to 170.
The Company has carefully prepared and verified the mineral reserve and mineral resource figures and believes that its method of estimating mineral reserves has been verified by mining experience. These figures are estimates, however, and no assurance can be given that the indicated quantities of metal will be produced. Metal price fluctuations may render mineral reserves containing relatively lower grades of mineralization uneconomic. Moreover, short-term operating factors relating to the mineral reserves, such as the need for orderly development of ore bodies or the processing of new or different ore grades, could affect the Company’s profitability in any particular accounting period.
Definitions
A mineral resource is a concentration or occurrence of diamonds, natural solid inorganic material, or natural solid fossilized organic material including base and precious metals, coal, and industrial minerals in or on the Earth’s crust in such form and quantity and of such a grade or quality that it has reasonable prospects for economic extraction. The location, quantity, grade, geological characteristics and continuity of a mineral resource are known, estimated or interpreted from specific geological evidence and knowledge. Mineral resources are sub-divided, in order of increasing geological confidence, into inferred, indicated and measured categories.
An inferred mineral resource is that part of a mineral resource for which quantity and grade or quality can be estimated on the basis of geological evidence and limited sampling and reasonably assumed, but not verified, geological and grade continuity. The estimate is based on limited information and sampling gathered through appropriate techniques from locations such as outcrops, trenches, pits, workings and drill holes.
An indicated mineral resource is that part of a mineral resource for which quantity, grade or quality, densities, shape and physical characteristics, can be estimated with a level of confidence sufficient to allow the appropriate application of technical and economic parameters, to support mine planning and evaluation of the economic viability of the deposit. The estimate is based on detailed and reliable exploration and testing information gathered through appropriate techniques from locations such as outcrops, trenches, pits, workings and drill holes that are spaced closely enough for geological and grade continuity to be reasonably assumed.
A measured mineral resource is that part of a mineral resource for which quantity, grade or quality, densities, shape and physical characteristics are so well established that they can be estimated with confidence sufficient to allow the appropriate application of technical and economic parameters, to support production planning and evaluation of the economic viability of the deposit. The estimate is based on detailed and reliable exploration, sampling and testing information gathered through appropriate techniques from locations such as outcrops, trenches, pits, workings and drill holes that are spaced closely enough to confirm both geological and grade continuity.
Mineral resources, which are not mineral reserves, do not have demonstrated economic viability.
A mineral reserve is the economically mineable part of a measured or indicated mineral resource demonstrated by at least a preliminary feasibility study. This study must include adequate information on mining, processing, metallurgical, economic and other relevant factors that demonstrate, at the time of reporting, that economic extraction can be justified.
A mineral reserve includes diluting materials and allowances for losses that may occur when the material is mined. Mineral reserves are sub-divided in order of increasing confidence into probable mineral reserves and proven mineral reserves. A probable mineral reserve is the economically mineable part of an indicated and, in some circumstances, a measured mineral resource demonstrated by at least a preliminary feasibility study. This study must include adequate information on mining, processing, metallurgical, economic and other relevant factors that demonstrate, at the time of reporting, that economic extraction can be justified.
A proven mineral reserve is the economically mineable part of a measured mineral resource demonstrated by at least a preliminary feasibility study. This study must include adequate information on mining, processing, metallurgical, economic and other relevant factors that demonstrate, at the time of reporting, that economic extraction is justified.
163
Mineral Reserves and Mineral Resources
Summary Gold Mineral Reserves and Mineral Resources(1),(2)
| | 2010 | | 2009 | |
For the years ended December 31 | | Tons | | Grade | | Ounces | | Tons | | Grade | | Ounces | |
Based on attributable ounces | | (000s) | | (oz/ton) | | (000s) | | (000s) | | (oz/ton) | | (000s) | |
North America | | | | | | | | | | | | | | | |
Goldstrike Open Pit | | (proven and probable) | | 95,865 | | 0.101 | | 9,656 | | 82,902 | | 0.112 | | 9,296 | |
| | (mineral resource) | | 4,694 | | 0.037 | | 173 | | 16,687 | | 0.052 | | 870 | |
Goldstrike Underground | | (proven and probable) | | 10,872 | | 0.272 | | 2,958 | | 8,998 | | 0.318 | | 2,860 | |
| | (mineral resource) | | 6,771 | | 0.298 | | 2,020 | | 4,436 | | 0.334 | | 1,483 | |
Goldstrike Property Total | | (proven and probable) | | 106,737 | | 0.118 | | 12,614 | | 91,900 | | 0.132 | | 12,156 | |
| | (mineral resource) | | 11,465 | | 0.191 | | 2,193 | | 21,123 | | 0.111 | | 2,353 | |
Pueblo Viejo (60.00%) | | (proven and probable) | | 168,417 | | 0.084 | | 14,195 | | 166,638 | | 0.085 | | 14,244 | |
| | (mineral resource) | | 96,807 | | 0.059 | | 5,675 | | 70,834 | | 0.061 | | 4,287 | |
Cortez | | (proven and probable) | | 317,081 | | 0.046 | | 14,494 | | 243,669 | | 0.058 | | 14,100 | |
| | (mineral resource) | | 60,463 | | 0.071 | | 4,320 | | 46,622 | | 0.074 | | 3,467 | |
Bald Mountain | | (proven and probable) | | 246,711 | | 0.019 | | 4,748 | | 227,346 | | 0.020 | | 4,489 | |
| | (mineral resource) | | 151,944 | | 0.011 | | 1,680 | | 99,338 | | 0.012 | | 1,178 | |
Turquoise Ridge (75.00%) | | (proven and probable) | | 9,254 | | 0.456 | | 4,224 | | 8,030 | | 0.507 | | 4,072 | |
| | (mineral resource) | | 64,219 | | 0.131 | | 8,415 | | 1,730 | | 0.431 | | 745 | |
Round Mountain (50.00%) | | (proven and probable) | | 73,017 | | 0.018 | | 1,319 | | 78,807 | | 0.019 | | 1,466 | |
| | (mineral resource) | | 50,865 | | 0.022 | | 1,107 | | 43,912 | | 0.021 | | 939 | |
South Arturo (60.00%) | | (proven and probable) | | 27,358 | | 0.051 | | 1,391 | | 26,314 | | 0.051 | | 1,350 | |
| | (mineral resource) | | 16,041 | | 0.043 | | 692 | | 3,377 | | 0.048 | | 162 | |
Ruby Hill | | (proven and probable) | | 17,182 | | 0.065 | | 1,122 | | 13,933 | | 0.050 | | 702 | |
| | (mineral resource) | | 61,530 | | 0.023 | | 1,390 | | 8,960 | | 0.057 | | 514 | |
Hemlo | | (proven and probable) | | 18,388 | | 0.074 | | 1,362 | | 17,500 | | 0.076 | | 1,325 | |
| | (mineral resource) | | 4,184 | | 0.071 | | 299 | | 2,545 | | 0.070 | | 179 | |
Marigold Mine (33.33%) | | (proven and probable) | | 47,843 | | 0.016 | | 775 | | 49,997 | | 0.016 | | 807 | |
| | (mineral resource) | | 26,842 | | 0.014 | | 387 | | 14,064 | | 0.016 | | 218 | |
Golden Sunlight | | (proven and probable) | | 9,649 | | 0.056 | | 539 | | 8,239 | | 0.062 | | 508 | |
| | (mineral resource) | | 1,231 | | 0.047 | | 58 | | 282 | | 0.067 | | 19 | |
Donlin Creek (50.00%) | | (proven and probable) | | — | | — | | — | | — | | — | | — | |
| | (mineral resource) | | 322,485 | | 0.060 | | 19,357 | | 270,022 | | 0.068 | | 18,449 | |
South America | | | | | | | | | | | | | | | |
Cerro Casale (75.00%)(3) | | (proven and probable) | | 1,002,722 | | 0.017 | | 17,377 | | 668,481 | | 0.017 | | 11,585 | |
| | (mineral resource) | | 199,842 | | 0.012 | | 2,376 | | 119,855 | | 0.011 | | 1,365 | |
Pascua-Lama | | (proven and probable) | | 423,931 | | 0.042 | | 17,845 | | 423,858 | | 0.042 | | 17,839 | |
| | (mineral resource) | | 231,590 | | 0.027 | | 6,260 | | 153,371 | | 0.031 | | 4,821 | |
Veladero | | (proven and probable) | | 483,181 | | 0.023 | | 11,291 | | 503,787 | | 0.024 | | 12,008 | |
| | (mineral resource) | | 51,130 | | 0.012 | | 600 | | 65,253 | | 0.014 | | 884 | |
Lagunas Norte | | (proven and probable) | | 210,104 | | 0.031 | | 6,618 | | 234,423 | | 0.032 | | 7,501 | |
| | (mineral resource) | | 40,529 | | 0.019 | | 756 | | 39,419 | | 0.017 | | 678 | |
Pierina | | (proven and probable) | | 59,947 | | 0.013 | | 791 | | 43,595 | | 0.015 | | 648 | |
| | (mineral resource) | | 18,288 | | 0.015 | | 273 | | 6,366 | | 0.017 | | 108 | |
(1) Resources which are not reserves do not have demonstrated economic viability.
(2) See accompanying footnote #1.
(3) See accompanying footnote #2.
164
Barrick Financial Report 2010 | Mineral Reserves and Mineral Resources |
Summary Gold Mineral Reserves and Mineral Resources(1),(2)
| | 2010 | | 2009 | |
For the years ended December 31 | | Tons | | Grade | | Ounces | | Tons | | Grade | | Ounces | |
Based on attributable ounces | | (000s) | | (oz/ton) | | (000s) | | (000s) | | (oz/ton) | | (000s) | |
Australia Pacific | | | | | | | | | | | | | | | |
Porgera (95.00%) | | (proven and probable) | | 83,611 | | 0.089 | | 7,432 | | 77,534 | | 0.099 | | 7,683 | |
| | (mineral resource) | | 19,535 | | 0.074 | | 1,449 | | 23,960 | | 0.067 | | 1,602 | |
Kalgoorlie (50.00%) | | (proven and probable) | | 70,860 | | 0.053 | | 3,780 | | 75,080 | | 0.056 | | 4,205 | |
| | (mineral resource) | | 46,907 | | 0.025 | | 1,152 | | 6,479 | | 0.056 | | 362 | |
Cowal | | (proven and probable) | | 71,050 | | 0.035 | | 2,478 | | 76,928 | | 0.035 | | 2,697 | |
| | (mineral resource) | | 47,349 | | 0.032 | | 1,503 | | 25,705 | | 0.034 | | 881 | |
Plutonic | | (proven and probable) | | 2,078 | | 0.202 | | 420 | | 4,225 | | 0.182 | | 771 | |
| | (mineral resource) | | 3,130 | | 0.262 | | 820 | | 10,257 | | 0.195 | | 1,995 | |
Kanowna Belle | | (proven and probable) | | 6,813 | | 0.159 | | 1,086 | | 7,337 | | 0.168 | | 1,233 | |
| | (mineral resource) | | 7,201 | | 0.125 | | 901 | | 5,649 | | 0.141 | | 798 | |
Darlot | | (proven and probable) | | 3,241 | | 0.124 | | 403 | | 3,305 | | 0.134 | | 444 | |
| | (mineral resource) | | 1,676 | | 0.153 | | 256 | | 2,856 | | 0.126 | | 359 | |
Granny Smith | | (proven and probable) | | 4,018 | | 0.154 | | 617 | | 3,024 | | 0.169 | | 510 | |
| | (mineral resource) | | 3,419 | | 0.175 | | 599 | | 1,505 | | 0.150 | | 226 | |
Lawlers | | (proven and probable) | | 2,124 | | 0.166 | | 352 | | 3,108 | | 0.156 | | 486 | |
| | (mineral resource) | | 1,118 | | 0.249 | | 278 | | 1,883 | | 0.204 | | 384 | |
Osborne | | (proven and probable) | | — | | — | | — | | 813 | | 0.023 | | 19 | |
| | (mineral resource) | | — | | — | | — | | 4,379 | | 0.026 | | 115 | |
Reko Diq (37.50%) | | (proven and probable) | | — | | — | | — | | — | | — | | — | |
| | (mineral resource) | | 1,232,986 | | 0.008 | | 9,506 | | 1,232,986 | | 0.008 | | 9,506 | |
Africa(3) | | | | | | | | | | | | | | | |
Bulyanhulu (73.90%) | | (proven and probable) | | 23,903 | | 0.341 | | 8,147 | | 27,630 | | 0.374 | | 10,320 | |
| | (mineral resource) | | 9,011 | | 0.236 | | 2,128 | | 11,350 | | 0.316 | | 3,585 | |
North Mara (73.90%) | | (proven and probable) | | 22,502 | | 0.093 | | 2,096 | | 31,905 | | 0.092 | | 2,949 | |
| | (mineral resource) | | 15,183 | | 0.089 | | 1,355 | | 8,810 | | 0.098 | | 861 | |
Buzwagi (73.90%) | | (proven and probable) | | 45,277 | | 0.047 | | 2,137 | | 72,611 | | 0.047 | | 3,401 | |
| | (mineral resource) | | 14,727 | | 0.028 | | 417 | | 20,573 | | 0.034 | | 692 | |
Tulawaka (51.73%) | | (proven and probable) | | 261 | | 0.188 | | 49 | | 406 | | 0.229 | | 93 | |
| | (mineral resource) | | 422 | | 0.159 | | 67 | | 192 | | 0.167 | | 32 | |
Other | | (proven and probable) | | 210 | | 0.400 | | 84 | | 325 | | 0.431 | | 140 | |
| | (mineral resource) | | 163 | | 0.307 | | 50 | | 65 | | 0.369 | | 24 | |
Total | | (proven and probable) | | 3,557,470 | | 0.039 | | 139,786 | | 3,190,748 | | 0.044 | | 139,751 | |
| | (mineral resource) | | 2,812,282 | | 0.027 | | 76,319 | | 2,323,722 | | 0.027 | | 61,788 | |
(1) Resources which are not reserves do not have demonstrated economic viability.
(2) See accompanying footnote #1.
(3) See accompanying footnote #3.
165
Mineral Reserves and Mineral Resources
Gold Mineral Reserves(1)
| | Proven | | Probable | | Total | |
| | | | | | Contained | | | | | | Contained | | | | | | Contained | |
As at December 31, 2010 | | Tons | | Grade | | ounces | | Tons | | Grade | | ounces | | Tons | | Grade | | ounces | |
Based on attributable ounces | | (000s) | | (oz/ton) | | (000s) | | (000s) | | (oz/ton) | | (000s) | | (000s) | | (oz/ton) | | (000s) | |
North America | | | | | | | | | | | | | | | | | | | |
Goldstrike Open Pit | | 60,555 | | 0.097 | | 5,874 | | 35,310 | | 0.107 | | 3,782 | | 95,865 | | 0.101 | | 9,656 | |
Goldstrike Underground | | 4,543 | | 0.346 | | 1,571 | | 6,329 | | 0.219 | | 1,387 | | 10,872 | | 0.272 | | 2,958 | |
Goldstrike Property Total | | 65,098 | | 0.114 | | 7,445 | | 41,639 | | 0.124 | | 5,169 | | 106,737 | | 0.118 | | 12,614 | |
Pueblo Viejo (60.00%) | | 8,864 | | 0.097 | | 857 | | 159,553 | | 0.084 | | 13,338 | | 168,417 | | 0.084 | | 14,195 | |
Cortez | | 38,350 | | 0.081 | | 3,104 | | 278,731 | | 0.041 | | 11,390 | | 317,081 | | 0.046 | | 14,494 | |
Bald Mountain | | 76,886 | | 0.021 | | 1,604 | | 169,825 | | 0.019 | | 3,144 | | 246,711 | | 0.019 | | 4,748 | |
Turquoise Ridge (75.00%) | | 4,182 | | 0.458 | | 1,914 | | 5,072 | | 0.455 | | 2,310 | | 9,254 | | 0.456 | | 4,224 | |
Round Mountain (50.00%) | | 26,909 | | 0.021 | | 563 | | 46,108 | | 0.016 | | 756 | | 73,017 | | 0.018 | | 1,319 | |
South Arturo (60.00%) | | — | | — | | — | | 27,358 | | 0.051 | | 1,391 | | 27,358 | | 0.051 | | 1,391 | |
Ruby Hill | | 1,273 | | 0.082 | | 104 | | 15,909 | | 0.064 | | 1,018 | | 17,182 | | 0.065 | | 1,122 | |
Hemlo | | 5,397 | | 0.107 | | 580 | | 12,991 | | 0.060 | | 782 | | 18,388 | | 0.074 | | 1,362 | |
Marigold Mine (33.33%) | | 9,348 | | 0.019 | | 175 | | 38,495 | | 0.016 | | 600 | | 47,843 | | 0.016 | | 775 | |
Golden Sunlight | | 2,355 | | 0.065 | | 154 | | 7,294 | | 0.053 | | 385 | | 9,649 | | 0.056 | | 539 | |
South America | | | | | | | | | | | | | | | | | | | |
Cerro Casale (75.00%)(2) | | 191,429 | | 0.019 | | 3,575 | | 811,293 | | 0.017 | | 13,802 | | 1,002,722 | | 0.017 | | 17,377 | |
Pascua-Lama | | 43,395 | | 0.050 | | 2,160 | | 380,536 | | 0.041 | | 15,685 | | 423,931 | | 0.042 | | 17,845 | |
Veladero | | 27,785 | | 0.031 | | 875 | | 455,396 | | 0.023 | | 10,416 | | 483,181 | | 0.023 | | 11,291 | |
Lagunas Norte | | 16,498 | | 0.038 | | 635 | | 193,606 | | 0.031 | | 5,983 | | 210,104 | | 0.031 | | 6,618 | |
Pierina | | 37,163 | | 0.014 | | 533 | | 22,784 | | 0.011 | | 258 | | 59,947 | | 0.013 | | 791 | |
Australia Pacific | | | | | | | | | | | | | | | | | | | |
Porgera (95.00%) | | 46,963 | | 0.086 | | 4,047 | | 36,648 | | 0.092 | | 3,385 | | 83,611 | | 0.089 | | 7,432 | |
Kalgoorlie (50.00%) | | 30,173 | | 0.046 | | 1,387 | | 40,687 | | 0.059 | | 2,393 | | 70,860 | | 0.053 | | 3,780 | |
Cowal | | 13,851 | | 0.024 | | 339 | | 57,199 | | 0.037 | | 2,139 | | 71,050 | | 0.035 | | 2,478 | |
Plutonic | | 110 | | 0.227 | | 25 | | 1,968 | | 0.201 | | 395 | | 2,078 | | 0.202 | | 420 | |
Kanowna Belle | | 3,630 | | 0.176 | | 640 | | 3,183 | | 0.140 | | 446 | | 6,813 | | 0.159 | | 1,086 | |
Darlot | | 1,860 | | 0.112 | | 209 | | 1,381 | | 0.140 | | 194 | | 3,241 | | 0.124 | | 403 | |
Granny Smith | | 805 | | 0.160 | | 129 | | 3,213 | | 0.152 | | 488 | | 4,018 | | 0.154 | | 617 | |
Lawlers | | 387 | | 0.163 | | 63 | | 1,737 | | 0.166 | | 289 | | 2,124 | | 0.166 | | 352 | |
Henty | | — | | — | | — | | — | | — | | — | | — | | — | | — | |
Africa(3) | | | | | | | | | | | | | | | | | | | |
Bulyanhulu (73.90%) | | 976 | | 0.322 | | 314 | | 22,927 | | 0.342 | | 7,833 | | 23,903 | | 0.341 | | 8,147 | |
North Mara (73.90%) | | 6,949 | | 0.076 | | 531 | | 15,553 | | 0.101 | | 1,565 | | 22,502 | | 0.093 | | 2,096 | |
Buzwagi (73.90%) | | 3,425 | | 0.033 | | 112 | | 41,852 | | 0.048 | | 2,025 | | 45,277 | | 0.047 | | 2,137 | |
Tulawaka (51.73%) | | 163 | | 0.123 | | 20 | | 98 | | 0.296 | | 29 | | 261 | | 0.188 | | 49 | |
Other | | 147 | | 0.395 | | 58 | | 63 | | 0.413 | | 26 | | 210 | | 0.400 | | 84 | |
Total | | 664,371 | | 0.048 | | 32,152 | | 2,893,099 | | 0.037 | | 107,634 | | 3,557,470 | | 0.039 | | 139,786 | |
Copper Mineral Reserves(1)
| | Proven | | Probable | | Total | |
| | | | | | Contained | | | | | | Contained | | | | | | Contained | |
As at December 31, 2010 | | Tons | | Grade | | lbs | | Tons | | Grade | | lbs | | Tons | | Grade | | lbs | |
Based on attributable pounds | | (000s) | | (%) | | (millions) | | (000s) | | (%) | | (millions) | | (000s) | | (%) | | (millions) | |
Zaldívar | | 403,813 | | 0.544 | | 4,394 | | 209,024 | | 0.507 | | 2,120 | | 612,837 | | 0.531 | | 6,514 | |
Total | | 403,813 | | 0.544 | | 4,394 | | 209,024 | | 0.507 | | 2,120 | | 612,837 | | 0.531 | | 6,514 | |
(1) See accompanying footnote #1.
(2) See accompanying footnote #2.
(3) See accompanying footnote #3.
166
Barrick Financial Report 2010 | Mineral Reserves and Mineral Resources
Gold Mineral Resources(1),(2)
| | Measured (M) | | Indicated (I) | | (M) + (I) | | Inferred | |
| | | | | | Contained | | | | | | Contained | | Contained | | | | | | Contained | |
As at December 31, 2010 | | Tons | | Grade | | ounces | | Tons | | Grade | | ounces | | ounces | | Tons | | Grade | | ounces | |
Based on attributable ounces | | (000s) | | (oz/ton) | | (000s) | | (000s) | | (oz/ton) | | (000s) | | (000s) | | (000s) | | (oz/ton) | | (000s) | |
North America | | | | | | | | | | | | | | | | | | | | | |
Goldstrike Open Pit | | 793 | | 0.037 | | 29 | | 3,901 | | 0.037 | | 144 | | 173 | | 1,344 | | 0.065 | | 87 | |
Goldstrike Underground | | 1,613 | | 0.347 | | 560 | | 5,158 | | 0.283 | | 1,460 | | 2,020 | | 3,047 | | 0.298 | | 908 | |
Goldstrike Property Total | | 2,406 | | 0.245 | | 589 | | 9,059 | | 0.177 | | 1,604 | | 2,193 | | 4,391 | | 0.227 | | 995 | |
Pueblo Viejo (60.00%) | | 2,692 | | 0.059 | | 160 | | 94,115 | | 0.059 | | 5,515 | | 5,675 | | 5,191 | | 0.064 | | 332 | |
Cortez | | 3,844 | | 0.055 | | 210 | | 56,619 | | 0.073 | | 4,110 | | 4,320 | | 50,337 | | 0.103 | | 5,174 | |
Bald Mountain | | 43,133 | | 0.012 | | 514 | | 108,811 | | 0.011 | | 1,166 | | 1,680 | | 60,636 | | 0.011 | | 686 | |
Turquoise Ridge (75.00%) | | 2,847 | | 0.234 | | 666 | | 61,372 | | 0.126 | | 7,749 | | 8,415 | | 32,570 | | 0.160 | | 5,200 | |
Round Mountain (50.00%) | | 12,990 | | 0.028 | | 366 | | 37,875 | | 0.020 | | 741 | | 1,107 | | 24,870 | | 0.018 | | 441 | |
South Arturo (60.00%) | | — | | — | | — | | 16,041 | | 0.043 | | 692 | | 692 | | 6,974 | | 0.018 | | 126 | |
Ruby Hill | | 705 | | 0.026 | | 18 | | 60,825 | | 0.023 | | 1,372 | | 1,390 | | 12,885 | | 0.024 | | 307 | |
Hemlo | | 1,601 | | 0.117 | | 187 | | 2,583 | | 0.043 | | 112 | | 299 | | 1,362 | | 0.156 | | 212 | |
Marigold Mine (33.33%) | | 1,351 | | 0.016 | | 22 | | 25,491 | | 0.014 | | 365 | | 387 | | 15,546 | | 0.014 | | 217 | |
Golden Sunlight | | 306 | | 0.056 | | 17 | | 925 | | 0.044 | | 41 | | 58 | | 2,494 | | 0.035 | | 87 | |
Donlin Creek (50.00%) | | 4,692 | | 0.067 | | 316 | | 317,793 | | 0.060 | | 19,041 | | 19,357 | | 43,499 | | 0.069 | | 2,995 | |
| | | | | | | | | | | | | | | | | | | | | |
South America | | | | | | | | | | | | | | | | | | | | | |
Cerro Casale (75.00%)(3) | | 14,643 | | 0.011 | | 164 | | 185,199 | | 0.012 | | 2,212 | | 2,376 | | 384,355 | | 0.011 | | 4,350 | |
Pascua-Lama | | 19,956 | | 0.033 | | 666 | | 211,634 | | 0.026 | | 5,594 | | 6,260 | | 32,290 | | 0.036 | | 1,178 | |
Veladero | | 4,053 | | 0.010 | | 42 | | 47,077 | | 0.012 | | 558 | | 600 | | 75,183 | | 0.008 | | 581 | |
Lagunas Norte | | 1,185 | | 0.020 | | 24 | | 39,344 | | 0.019 | | 732 | | 756 | | 7,951 | | 0.015 | | 117 | |
Pierina | | 10,333 | | 0.017 | | 172 | | 7,955 | | 0.013 | | 101 | | 273 | | 19,934 | | 0.003 | | 58 | |
| | | | | | | | | | | | | | | | | | | | | |
Australia Pacific | | | | | | | | | | | | | | | | | | | | | |
Porgera (95.00%) | | 6,119 | | 0.057 | | 351 | | 13,416 | | 0.082 | | 1,098 | | 1,449 | | 13,840 | | 0.090 | | 1,243 | |
Kalgoorlie (50.00%) | | 1,934 | | 0.064 | | 124 | | 44,973 | | 0.023 | | 1,028 | | 1,152 | | 1,109 | | 0.146 | | 162 | |
Cowal | | — | | — | | — | | 47,349 | | 0.032 | | 1,503 | | 1,503 | | 12,686 | | 0.031 | | 395 | |
Plutonic | | 564 | | 0.121 | | 68 | | 2,566 | | 0.293 | | 752 | | 820 | | 4,049 | | 0.307 | | 1,242 | |
Kanowna Belle | | 4,022 | | 0.115 | | 462 | | 3,179 | | 0.138 | | 439 | | 901 | | 4,133 | | 0.101 | | 419 | |
Darlot | | 290 | | 0.152 | | 44 | | 1,386 | | 0.153 | | 212 | | 256 | | 555 | | 0.162 | | 90 | |
Granny Smith | | 830 | | 0.161 | | 134 | | 2,589 | | 0.180 | | 465 | | 599 | | 4,855 | | 0.239 | | 1,162 | |
Lawlers | | — | | — | | — | | 1,118 | | 0.249 | | 278 | | 278 | | 687 | | 0.319 | | 219 | |
Reko Diq (37.50%) | | 718,521 | | 0.009 | | 6,466 | | 514,465 | | 0.006 | | 3,040 | | 9,506 | | 1,192,569 | | 0.005 | | 6,399 | |
| | | | | | | | | | | | | | | | | | | | | |
Africa(4) | | | | | | | | | | | | | | | | | | | | | |
Bulyanhulu (73.90%) | | — | | — | | — | | 9,011 | | 0.236 | | 2,128 | | 2,128 | | 7,180 | | 0.344 | | 2,472 | |
North Mara (73.90%) | | 2,055 | | 0.071 | | 146 | | 13,128 | | 0.092 | | 1,209 | | 1,355 | | 1,515 | | 0.055 | | 84 | |
Buzwagi (73.90%) | | 61 | | 0.033 | | 2 | | 14,666 | | 0.028 | | 415 | | 417 | | 5,119 | | 0.035 | | 181 | |
Tulawaka (51.73%) | | — | | — | | — | | 422 | | 0.159 | | 67 | | 67 | | 76 | | 0.145 | | 11 | |
Other | | — | | — | | — | | 163 | | 0.307 | | 50 | | 50 | | 192 | | 0.349 | | 67 | |
Total | | 861,133 | | 0.014 | | 11,930 | | 1,951,149 | | 0.033 | | 64,389 | | 76,319 | | 2,029,033 | | 0.018 | | 37,202 | |
Copper Mineral Resources(1),(2)
| | Measured (M) | | Indicated (I) | | (M) + (I) | | Inferred | |
| | | | | | Contained | | | | | | Contained | | Contained | | | | | | Contained | |
As at December 31, 2010 | | Tons | | Grade | | lbs | | Tons | | Grade | | lbs | | lbs | | Tons | | Grade | | lbs | |
Based on attributable pounds | | (000s) | | (%) | | (millions) | | (000s) | | (%) | | (millions) | | (millions) | | (000s) | | (%) | | (millions) | |
Zaldívar | | 80,445 | | 0.433 | | 697 | | 66,148 | | 0.443 | | 586 | | 1,283 | | 69,308 | | 0.545 | | 756 | |
Reko Diq (37.50%) | | 718,521 | | 0.536 | | 7,697 | | 514,465 | | 0.392 | | 4,034 | | 11,731 | | 1,192,569 | | 0.352 | | 8,393 | |
Total | | 798,966 | | 0.525 | | 8,394 | | 580,613 | | 0.398 | | 4,620 | | 13,014 | | 1,261,877 | | 0.363 | | 9,149 | |
(1) Resources which are not reserves do not have demonstrated economic viability.
(2) See accompanying footnote #1.
(3) See accompanying footnote #2.
(4) See accompanying footnote #3.
167
Mineral Reserves and Mineral Resources
Contained Silver Within Reported Gold Reserves(1)
| | In proven | | In probable | | | |
| | gold reserves | | gold reserves | | Total | |
| | | | | | Contained | | | | | | Contained | | | | | | Contained | | Process | |
For the year ended December 31, 2010 | | Tons | | Grade | | ounces | | Tons | | Grade | | ounces | | Tons | | Grade | | ounces | | recovery | |
Based on attributable ounces | | (000s) | | (oz/ton) | | (000s) | | (000s) | | (oz/ton) | | (000s) | | (000s) | | (oz/ton) | | (000s) | | % | |
| | | | | | | | | | | | | | | | | | | | | |
North America | | | | | | | | | | | | | | | | | | | | | |
Pueblo Viejo (60.00%) | | 8,864 | | 0.64 | | 5,664 | | 159,553 | | 0.52 | | 82,714 | | 168,417 | | 0.52 | | 88,378 | | 86.9 | % |
| | | | | | | | | | | | | | | | | | | | | |
South America | | | | | | | | | | | | | | | | | | | | | |
Cerro Casale (75.00%)(2) | | 191,429 | | 0.05 | | 10,482 | | 811,293 | | 0.04 | | 33,564 | | 1,002,722 | | 0.04 | | 44,046 | | | |
Pascua-Lama | | 43,395 | | 1.72 | | 74,563 | | 380,536 | | 1.57 | | 596,932 | | 423,931 | | 1.58 | | 671,495 | | 81.6 | % |
Lagunas Norte | | 16,498 | | 0.13 | | 2,149 | | 193,606 | | 0.11 | | 21,034 | | 210,104 | | 0.11 | | 23,183 | | 21.2 | % |
Veladero | | 27,785 | | 0.39 | | 10,814 | | 455,396 | | 0.44 | | 199,857 | | 483,181 | | 0.44 | | 210,671 | | 6.4 | % |
Pierina | | 37,163 | | 0.37 | | 13,678 | | 22,784 | | 0.37 | | 8,369 | | 59,947 | | 0.37 | | 22,047 | | 36.8 | % |
| | | | | | | | | | | | | | | | | | | | | |
Africa(3) | | | | | | | | | | | | | | | | | | | | | |
Bulyanhulu (73.90%) | | 976 | | 0.23 | | 220 | | 22,927 | | 0.27 | | 6,292 | | 23,903 | | 0.27 | | 6,512 | | 75.0 | % |
| | | | | | | | | | | | | | | | | | | | | |
Total | | 326,110 | | 0.36 | | 117,570 | | 2,046,095 | | 0.46 | | 948,762 | | 2,372,205 | | 0.45 | | 1,066,332 | | 61.5 | % |
(1) Silver is accounted for as a by-product credit against reported or projected gold production costs.
(2) See accompanying footnote #2.
(3) See accompanying footnote #3.
Contained Copper Within Reported Gold Reserves(1)
| | In proven | | In probable | | | | | | | | | |
| | gold reserves | | gold reserves | | Total | |
| | | | | | Contained | | | | | | Contained | | | | | | Contained | | Process | |
For the year ended December 31, 2010 | | Tons | | Grade | | lbs | | Tons | | Grade | | lbs | | Tons | | Grade | | lbs | | recovery | |
Based on attributable pounds | | (000s) | | (%) | | (millions) | | (000s) | | (%) | | (millions) | | (000s) | | (%) | | (millions) | | % | |
North America | | | | | | | | | | | | | | | | | | | | | |
Pueblo Viejo (60.00%) | | 8,864 | | 0.120 | | 21.3 | | 159,553 | | 0.093 | | 297.9 | | 168,417 | | 0.095 | | 319.2 | | 79.5 | % |
| | | | | | | | | | | | | | | | | | | | | |
South America | | | | | | | | | | | | | | | | | | | | | |
Cerro Casale (75.00%)(2) | | 191,429 | | 0.189 | | 722.0 | | 811,293 | | 0.223 | | 3,614.4 | | 1,002,722 | | 0.216 | | 4,336.4 | | 81.2 | % |
Pascua-Lama | | 43,395 | | 0.096 | | 83.2 | | 380,536 | | 0.075 | | 574.4 | | 423,931 | | 0.078 | | 657.6 | | 62.9 | % |
| | | | | | | | | | | | | | | | | | | | | |
Africa(3) | | | | | | | | | | | | | | | | | | | | | |
Bulyanhulu (73.90%) | | 976 | | 0.415 | | 8.1 | | 22,927 | | 0.673 | | 308.5 | | 23,903 | | 0.662 | | 316.6 | | 95.0 | % |
Buzwagi (73.90%) | | 3,425 | | 0.006 | | 0.4 | | 41,852 | | 0.125 | | 104.3 | | 45,277 | | 0.116 | | 104.7 | | 76.5 | % |
| | | | | | | | | | | | | | | | | | | | | |
Total | | 248,089 | | 0.168 | | 835.0 | | 1,416,161 | | 0.173 | | 4,899.5 | | 1,664,250 | | 0.172 | | 5,734.5 | | 79.6 | % |
(1) Copper is accounted for as a by-product credit against reported or projected gold production costs.
(2) See accompanying footnote #2.
(3) See accompanying footnote #3.
168
Barrick Financial Report 2010 | Mineral Reserves and Mineral Resources
Contained Silver Within Reported Gold Resources(1)
| | Measured (M) | | Indicated (I) | | (M) + (I) | | Inferred | |
| | | | | | Contained | | | | | | Contained | | Contained | | | | | | Contained | |
For the year ended December 31, 2010 | | Tons | | Grade | | ounces | | Tons | | Grade | | ounces | | ounces | | Tons | | Grade | | ounces | |
Based on attributable ounces | | (000s) | | (oz/ton) | | (000s) | | (000s) | | (oz/ton) | | (000s) | | (000s) | | (000s) | | (oz/ton) | | (000s) | |
| | | | | | | | | | | | | | | | | | | | | |
North America | | | | | | | | | | | | | | | | | | | | | |
Pueblo Viejo (60.00%) | | 2,692 | | 0.39 | | 1,058 | | 94,115 | | 0.34 | | 32,217 | | 33,275 | | 5,191 | | 0.53 | | 2,746 | |
| | | | | | | | | | | | | | | | | | | | | |
South America | | | | | | | | | | | | | | | | | | | | | |
Cerro Casale (75.00%)(2) | | 14,643 | | 0.04 | | 637 | | 185,199 | | 0.03 | | 5,848 | | 6,485 | | 384,355 | | 0.03 | | 11,636 | |
Pascua-Lama | | 19,956 | | 0.74 | | 14,865 | | 211,634 | | 0.71 | | 150,720 | | 165,585 | | 32,290 | | 0.45 | | 14,676 | |
Lagunas Norte | | 1,185 | | 0.08 | | 96 | | 39,344 | | 0.07 | | 2,751 | | 2,847 | | 7,951 | | 0.06 | | 473 | |
Veladero | | 4,053 | | 0.19 | | 750 | | 47,077 | | 0.33 | | 15,703 | | 16,453 | | 75,183 | | 0.31 | | 23,663 | |
Pierina | | 10,333 | | 0.34 | | 3,515 | | 7,955 | | 0.35 | | 2,824 | | 6,339 | | 19,934 | | 0.32 | | 6,320 | |
| | | | | | | | | | | | | | | | | | | | | |
Africa(3) | | | | | | | | | | | | | | | | | | | | | |
Bulyanhulu (73.90%) | | — | | — | | — | | 9,011 | | 0.21 | | 1,906 | | 1,906 | | 7,180 | | 0.30 | | 2,133 | |
| | | | | | | | | | | | | | | | | | | | | |
Total | | 52,862 | | 0.40 | | 20,921 | | 594,335 | | 0.36 | | 211,969 | | 232,890 | | 532,084 | | 0.12 | | 61,647 | |
(1) Resources which are not reserves do not have demonstrated economic viability.
(2) See accompanying footnote #2.
(3) See accompanying footnote #3.
Contained Copper Within Reported Gold Resources(1)
| | In measured (M) | | In indicated (I) | | | | | | | | | |
| | gold resources | | gold resources | | (M) + (I) | | Inferred | |
| | | | | | Contained | | | | | | Contained | | Contained | | | | | | Contained | |
For the year ended December 31, 2010 | | Tons | | Grade | | lbs | | Tons | | Grade | | lbs | | lbs | | Tons | | Grade | | lbs | |
Based on attributable pounds | | (000s) | | (%) | | (millions) | | (000s) | | (%) | | (millions) | | (millions) | | (000s) | | (%) | | (millions) | |
| | | | | | | | | | | | | | | | | | | | | |
North America | | | | | | | | | | | | | | | | | | | | | |
Pueblo Viejo (60.00%) | | 2,692 | | 0.10 | | 5.4 | | 94,115 | | 0.082 | | 154.2 | | 159.6 | | 5,191 | | 0.098 | | 10.2 | |
| | | | | | | | | | | | | | | | | | | | | |
South America | | | | | | | | | | | | | | | | | | | | | |
Cerro Casale (75.00%)(2) | | 14,643 | | 0.152 | | 44.6 | | 185,199 | | 0.181 | | 670.6 | | 715.2 | | 384,355 | | 0.197 | | 1,514.4 | |
Pascua-Lama | | 19,956 | | 0.067 | | 26.9 | | 211,634 | | 0.056 | | 237.8 | | 264.7 | | 32,290 | | 0.046 | | 30.0 | |
| | | | | | | | | | | | | | | | | | | | | |
Africa(3) | | | | | | | | | | | | | | | | | | | | | |
Buzwagi (73.90%) | | 61 | | 0.08 | | 0.1 | | 14,666 | | 0.082 | | 24.1 | | 24.2 | | 5,119 | | 0.079 | | 8.1 | |
| | | | | | | | | | | | | | | | | | | | | |
Total | | 37,352 | | 0.103 | | 77.0 | | 505,614 | | 0.107 | | 1,086.7 | | 1,163.7 | | 426,955 | | 0.183 | | 1,562.7 | |
(1) Resources which are not reserves do not have demonstrated economic viability.
(2) See accompanying footnote #2.
(3) See accompanying footnote #3.
Nickel Mineral Resources(1)
| | Measured (M) | | Indicated (I) | | (M) + (I) | | Inferred | |
| | | | | | Contained | | | | | | Contained | | Contained | | | | | | Contained | |
For the year ended December 31, 2010 | | Tons | | Grade | | lbs | | Tons | | Grade | | lbs | | lbs | | Tons | | Grade | | lbs | |
Based on attributable pounds | | (000s) | | (%) | | (millions) | | (000s) | | (%) | | (millions) | | (millions) | | (000s) | | (%) | | (millions) | |
| | | | | | | | | | | | | | | | | | | | | |
Africa | | | | | | | | | | | | | | | | | | | | | |
Kabanga (50.00%) | | 7,606 | | 2.490 | | 378.8 | | 12,897 | | 2.720 | | 701.6 | | 1,080.4 | | 11,464 | | 2.600 | | 596.1 | |
(1) Resources which are not reserves do not have demonstrated economic viability.
169
Mineral Reserves and Mineral Resources
Mineral Reserves and Resources Notes
1. Mineral reserves (“reserves”) and mineral resources (“resources”) have been calculated as at December 31, 2010 in accordance with National Instrument 43-101 as required by Canadian securities regulatory authorities. For United States reporting purposes, Industry Guide 7, (under the Securities and Exchange Act of 1934), as interpreted by Staff of the SEC, applies different standards in order to classify mineralization as a reserve. Accordingly, for U.S. reporting purposes, Cerro Casale is classified as mineralized material. In addition, while the terms “measured”, “indicated” and “inferred” mineral resources are required pursuant to National Instrument 43-101, the U.S. Securities and Exchange Commission does not recognize such terms. Canadian standards differ significantly from the requirements of the U.S. Securities and Exchange Commission, and mineral resource information contained herein is not comparable to similar information regarding mineral reserves disclosed in accordance with the requirements of the U.S. Securities and Exchange Commission. U.S. investors should understand that “inferred” mineral resources have a great amount of uncertainty as to their existence and great uncertainty as to their economic and legal feasibility. In addition, U.S. investors are cautioned not to assume that any part or all of Barrick’s mineral resources constitute or will be converted into reserves. Calculations have been prepared by employees of Barrick, its joint venture partners or its joint venture operating companies, as applicable, under the supervision of Rick Sims, Senior Director, Resources and Reserves of Barrick, Chris Woodall, Senior Director, Mining of Barrick and John Lindsay, Senior Director Metallurgy, of Barrick. Except as noted below, reserves have been calculated using an assumed long-term average gold price of $US 1,000 ($Aus. 1,180) per ounce, a silver price of $US 16.00 per ounce, a copper price of $US 2.00 per pound and exchange rates of $1.05 $Can/$US and $0.85 $US/$Aus. Reserves at Round Mountain have been calculated using an assumed long-term average gold price of $US 900. Reserve calculations incorporate current and/or expected mine plans and cost levels at each property. Varying cut-off grades have been used depending on the mine and type of ore contained in the reserves. Barrick’s normal data verification procedures have been employed in connection with the calculations. Resources as at December 31, 2010 have been estimated using varying cut-off grades, depending on both the type of mine or project, its maturity and ore types at each property. For a breakdown of reserves and resources by category and for a more detailed description of the key assumptions, parameters and methods used in calculating Barrick’s reserves and resources, see Barrick’s most recent Annual Information Form/Form 40-F on file with Canadian provincial securities regulatory authorities and the U.S. Securities and Exchange Commission.
2. 2009 reserves and resources for the Cerro Casale project reflect Barrick’s then 50% interest. In March 2010, Barrick acquired an additional 25% of Cerro Casale. 2010 reserves and resources reflect Barrick’s 75% interest.
3. In March 2010, Barrick created African Barrick Gold plc to hold its African gold mines, gold projects and gold exploration properties. As of April 2010, Barrick owns approximately 73.9% of African Barrick Gold plc.
170
Barrick Financial Report 2010 | Corporate Governance and Committees of the Board
Corporate Governance and Committees of the Board
Corporate Governance
Over the past several years, there has been an increased focus on corporate governance in both the United States and Canada. Among other regulatory initiatives, the New York Stock Exchange added corporate governance standards to its listing rules. Although, as a regulatory matter, the vast majority of the NYSE corporate governance standards are not directly applicable to Barrick as a Canadian company, Barrick has implemented a number of structures and procedures to comply with the NYSE standards. There are no significant differences between Barrick’s corporate governance practices and the NYSE standards applicable to U.S. companies.
The Board of Directors has approved a set of Corporate Governance Guidelines to promote the effective functioning of the Board of Directors and its Committees and to set forth a common set of expectations as to how the Board should manage its affairs and perform its responsibilities. Barrick has also adopted a Code of Business Conduct and Ethics that is applicable to all directors, officers and employees of Barrick. In conjunction with the adoption of the Code, Barrick established a toll-free compliance hotline to allow for anonymous reporting of any suspected Code violations, including concerns regarding accounting, internal accounting controls or other auditing matters. A copy of the Corporate Governance Guidelines, the Code of Business Conduct and Ethics and the mandates of the Board of Directors and each of the Committees of the Board, including the Audit Committee, the Compensation Committee and the Corporate Governance and Nominating Committee, is posted on Barrick’s website at www.barrick.com and is available in print from the Company to any shareholder upon request.
Committees of the Board
Audit Committee
(S.J. Shapiro, D.J. Carty, P.A. Crossgrove, R.M. Franklin)
Reviews the Company’s financial statements and management’s discussion and analysis of financial and operating results, and assists the Board in its oversight of the integrity of Barrick’s financial reporting process and the quality, transparency, and integrity of Barrick’s financial statements and other relevant public disclosures, the Company’s compliance with legal and regulatory requirements relating to financial reporting, the external auditors’ qualifications and independence, and the performance of the internal and external auditors.
Compensation Committee
(D.J. Carty, M.A. Cohen, J.B. Harvey, S.J. Shapiro)
Assists the Board in monitoring, reviewing and approving Barrick’s compensation policies and practices, and administering Barrick’s share compensation plans. The Committee is responsible for reviewing and recommending director and senior management compensation and for succession planning with respect to senior executives.
Corporate Governance and Nominating Committee
(M.A. Cohen, R.M. Franklin, J.B. Harvey)
Assists the Board in establishing Barrick’s corporate governance policies and practices. The Committee also identifies individuals qualified to become members of the Board and reviews the composition and functioning of the Board and its Committees.
Environmental, Health and Safety Committee
(P.A. Crossgrove, C.W.D. Birchall, J.B. Harvey, A.W. Regent)
Reviews environmental, health and safety, and corporate social responsibility policies and programs, oversees the Company’s environmental, health and safety, and corporate social responsibility performance, and monitors current and future regulatory issues.
Finance Committee
(C.W.D. Birchall, H.L. Beck, A. Munk, N. Rothschild)
Reviews the Company’s financial structure and investment and financial risk management programs.
171
Shareholder Information
Shareholder Information
Barrick shares are traded on two stock exchanges:
New York
Toronto
Ticker Symbol
ABX
Number of Registered Shareholders at December 31, 2010
18,547
Index Listings
S&P/TSX Composite Index
S&P/TSX 60 Index
S&P Global 1200 Index
Philadelphia Gold/Silver Index
NYSE Arca Gold Miners Index
Dow Jones Sustainability Index (DJSI) — World
Dow Jones Sustainability Index (DJSI) — North America
NASDAQ Global Sustainability Index
2010 Dividend per Share
US$0.44
Common Shares
(millions) | | | |
Outstanding at December 31, 2010 | | 998 | |
| | | |
Weighted average 2010 | | | |
Basic | | 987 | |
Fully diluted | | 997 | |
The Company’s shares were split on a two-for-one basis in 1987, 1989 and 1993.
Volume of Shares Traded
(millions) | | 2010 | | 2009 | |
NYSE | | 810 | | 1,203 | |
TSX | | 870 | | 1,078 | |
Closing Price of Shares
December 31, 2010 | | | |
NYSE | | US$53.18 | |
TSX | | C$53.12 | |
Share Trading Information
New York Stock Exchange
| | Share Volume | | | | | | | | | |
| | (millions) | | High | | Low | |
Quarter | | 2010 | | 2009 | | 2010 | | 2009 | | 2010 | | 2009 | |
First | | 227 | | 361 | | US$42.63 | | US$40.90 | | US$33.65 | | US$25.54 | |
Second | | 228 | | 246 | | 47.25 | | 38.96 | | 38.15 | | 27.09 | |
Third | | 180 | | 258 | | 47.55 | | 41.98 | | 39.68 | | 30.67 | |
Fourth | | 175 | | 338 | | 55.65 | | 48.02 | | 44.87 | | 34.50 | |
| | 810 | | 1,203 | | | | | | | | | |
Toronto Stock Exchange
| | Share Volume | | | | | | | | | |
| | (millions) | | High | | Low | |
Quarter | | 2010 | | 2009 | | 2010 | | 2009 | | 2010 | | 2009 | |
First | | 233 | | 331 | | C$44.00 | | C$49.87 | | C$36.01 | | C$32.69 | |
Second | | 255 | | 251 | | 48.89 | | 43.24 | | 38.86 | | 33.01 | |
Third | | 198 | | 237 | | 50.65 | | 43.97 | | 41.07 | | 35.50 | |
Fourth | | 184 | | 259 | | 55.99 | | 50.53 | | 46.06 | | 37.04 | |
| | 870 | | 1,078 | | | | | | | | | |
172
Barrick Financial Report 2010 | Shareholder Information
Dividend Policy
The Board of Directors reviews the dividend policy quarterly based on the cash requirements of the Company’s operating assets, exploration and development activities, as well as potential acquisitions, combined with the current and projected financial position of the Company.
Dividend Payments
In 2010, the Company paid a cash dividend of $0.44 per share — $0.20 on June 15, $0.12 on September 15 and $0.12 on December 15. A cash dividend of $0.40 per share was paid in 2009 — $0.20 on June 15 and $0.20 on December 15.
Form 40-F
The Company’s Annual Report on Form 40-F is filed with the United States Securities and Exchange Commission. This report is available on Barrick’s website www.barrick.com and will be made available to shareholders, without charge, upon written request to the Secretary of the Company at the Corporate Office.
Other Language Reports
French and Spanish versions of this annual report are available from Investor Relations at the Corporate Office and on Barrick’s website www.barrick.com.
Shareholder Contacts
Shareholders are welcome to contact the Investor Relations Department for general information on the Company:
Deni Nicoski
Vice President, Investor Relations
Telephone: 416-307-7410
Email: dnicoski@barrick.com
Susan Muir
Senior Director, Investor Relations
Telephone: 416-307-5107
Email: s.muir@barrick.com
Amy Schwalm
Senior Director, Investor Relations
Telephone: 416-307-7422
Email: aschwalm@barrick.com
For information on such matters as share transfers, dividend cheques and change of address, inquiries should be directed to the Company’s Transfer Agents.
Transfer Agents and Registrars
CIBC Mellon Trust Company*
P.O. Box 7010
Adelaide Street Postal Station
Toronto, Ontario M5C 2W9
Telephone: 416-643-5500
Toll-free within the United States and Canada: 1-800-387-0825
Fax: 416-643-5501
Email: inquiries@cibcmellon.com
Website: www.cibcmellon.com
BNY Mellon Shareowner Services, L.L.C.
480 Washington Boulevard — 27th Floor
Jersey City, NJ 07310
Telephone: 1-800-589-9836
Fax: 201-680-4665
Email: shrrelations@mellon.com
Website: www.melloninvestor.com
*Effective November 2010, shareholder records are maintained by Canadian Stock Transfer (“CST”) as administrative agent for CIBC Mellon Trust Company.
Auditors
PricewaterhouseCoopers LLP
Toronto, Canada
Annual Meeting
The Annual Meeting of Shareholders will be held on Wednesday, April 27, 2011 at 10:00 a.m. (Toronto time) in the Metro Toronto Convention Centre, John Bassett Theatre, 255 Front Street West, Toronto, Ontario.
173
Board of Directors and Senior Officers
Board of Directors and Senior Officers
Board of Directors
Howard L. Beck, Q.C.
Toronto, Ontario
Corporate Director
C. William D. Birchall
Toronto, Ontario
Vice Chairman,
Barrick Gold Corporation
Donald J. Carty, O.C.
Dallas, Texas
Chairman,
Porter Airlines Inc. and
Virgin America Airlines
Gustavo A. Cisneros
Santo Domingo,
Dominican Republic
Chairman,
Cisneros Group of Companies
Marshall A. Cohen, O.C.
Toronto, Ontario
Counsel,
Cassels, Brock & Blackwell LLP
Peter A. Crossgrove, O.C.
Toronto, Ontario
Corporate Director
Robert M. Franklin
Toronto, Ontario
President, Signalta Capital
Corporation
J. Brett Harvey
Canonsburg, Pennsylvania
Chairman, President and
Chief Executive Officer,
CONSOL Energy Inc.
The Right Honourable
Brian Mulroney, P.C.
Montreal, Quebec
Chairman, Barrick International
Advisory Board
Senior Partner, Ogilvy Renault
Anthony Munk
Toronto, Ontario
Managing Director,
Onex Corporation
Peter Munk, C.C.
Toronto, Ontario
Founder and Chairman,
Barrick Gold Corporation
Aaron W. Regent
Toronto, Ontario
President and
Chief Executive Officer,
Barrick Gold Corporation
The Honourable
Nathaniel P. Rothschild
Klosters, Switzerland
Founder and Co-Chairman,
Vallar PLC
Co-Chairman,
EN+ Group Limited
Steven J. Shapiro
Houston, Texas
Corporate Director
Senior Officers
Peter Munk
Chairman
C. William D. Birchall
Vice Chairman
Aaron W. Regent
President and
Chief Executive Officer
Kelvin P.M. Dushnisky
Executive Vice President,
Corporate and Legal Affairs
Peter J. Kinver
Executive Vice President
and Chief Operating Officer
Jamie C. Sokalsky
Executive Vice President
and Chief Financial Officer
Rob Krcmarov
Senior Vice President,
Global Exploration
Donald D. Ritz
Senior Vice President,
Safety and Leadership
Sybil Veenman
Senior Vice President and
General Counsel
International Advisory Board
The International Advisory Board was established to provide advice to Barrick’s Board of Directors and management on geo-political and other strategic issues affecting the Company.
Chairman
The Right Honourable
Brian Mulroney
Former Prime Minister
of Canada
Members
Gustavo A. Cisneros
Dominican Republic
Secretary William S. Cohen
United States
Vernon E. Jordan, Jr.
United States
Andrónico Luksic
Chile
Angus A. MacNaughton
United States
Karl Otto Pöhl
Germany
Lord Charles Powell of Bayswater
KCMG
United Kingdom
The Honourable
Nathaniel P. Rothschild
Switzerland
The Honorable
Andrew Young
United States
174
Cautionary Statement on Forward-Looking Information
Certain information contained in this Annual Report 2010, including any information as to our strategy, projects, plans or future financial or operating performance and other statements that express management’s expectations or estimates of future performance, constitute “forward-looking statements”. All statements, other than statements of historical fact, are forward-looking statements. The words “believe”, “expect”, “will”, “anticipate”, “contemplate”, “target”, “plan”, “continue”, “budget”, “may”, “intend”, “estimate” and similar expressions identify forward-looking statements. Forward-looking statements are necessarily based upon a number of estimates and assumptions that, while considered reasonable by management, are inherently subject to significant business, economic and competitive uncertainties and contingencies. The Company cautions the reader that such forward-looking statements involve known and unknown risks, uncertainties and other factors that may cause the actual financial results, performance or achievements of Barrick to be materially different from the Company’s estimated future results, performance or achievements expressed or implied by those forward-looking statements and the forward-looking statements are not guarantees of future performance. These risks, uncertainties and other factors include, but are not limited to: the impact of global liquidity and credit availability on the timing of cash flows and the values of assets and liabilities based on projected future cash flows; changes in the worldwide price of gold, copper or certain other commodities (such as silver, fuel and electricity); fluctuations in currency markets; changes in U.S. dollar interest rates; risks arising from holding derivative instruments; ability to successfully complete announced transactions and integrate acquired assets; legislative, political or economic developments in the jurisdictions in which the Company carries on business; operating or technical difficulties in connection with mining or development activities; employee relations; availability and costs associated with mining inputs and labor; the speculative nature of exploration and development, including the risks of obtaining necessary licenses and permits and diminishing quantities or grades of reserves; changes in costs and estimates associated with our projects; adverse changes in our credit rating, level of indebtedness and liquidity, contests over title to properties, particularly title to undeveloped properties; the risks involved in the exploration, development and mining business. Certain of these factors are discussed in greater detail in the Company’s most recent Form 40-F/Annual Information Form on file with the U.S. Securities and Exchange Commission and Canadian provincial securities regulatory authorities.
The Company disclaims any intention or obligation to update or revise any forward-looking statements whether as a result of new information, future events or otherwise, except as required by applicable law.
