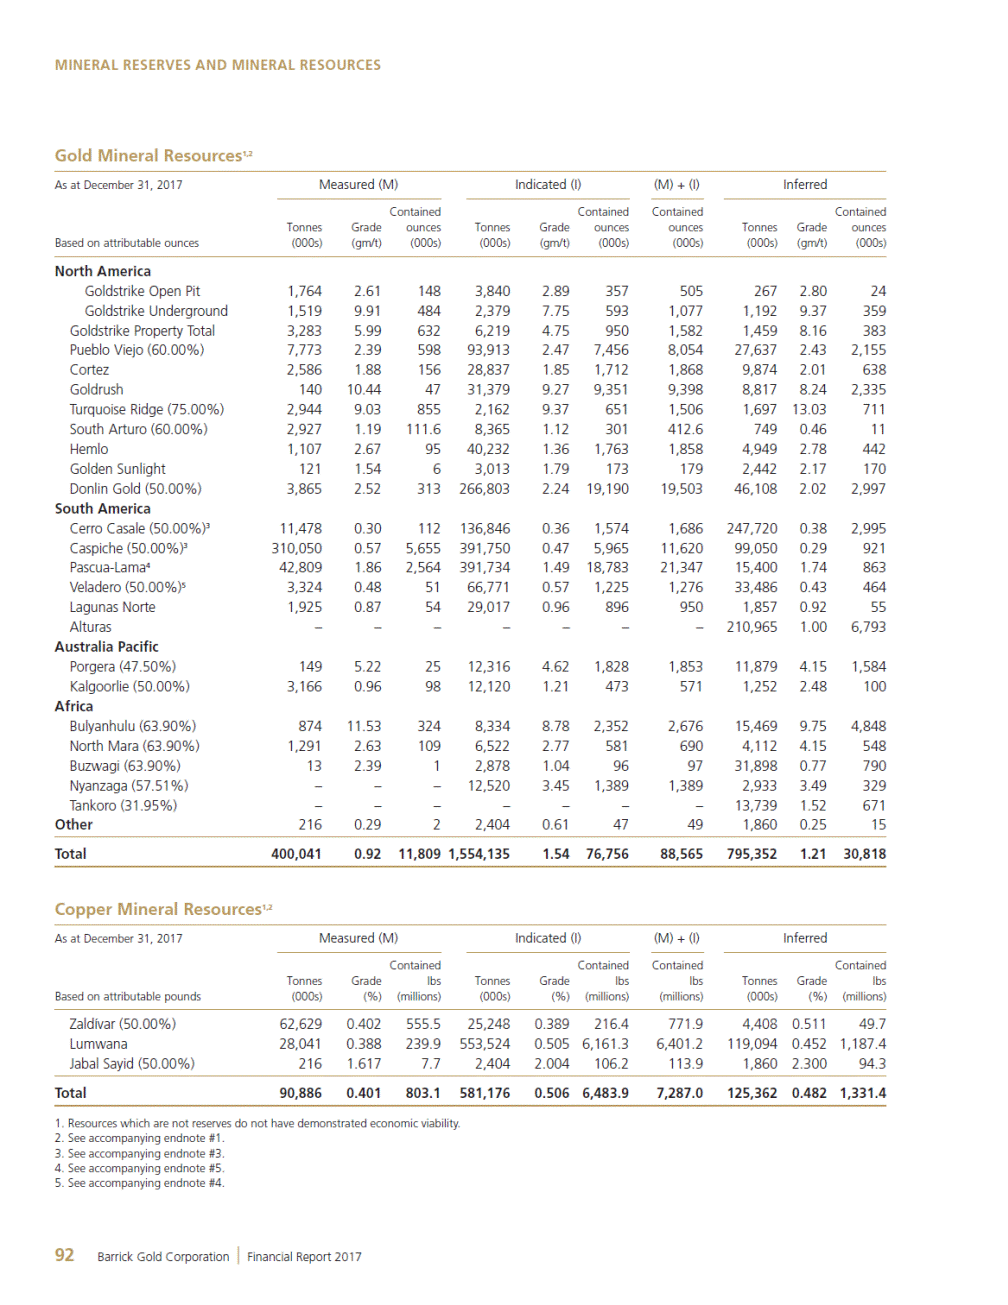
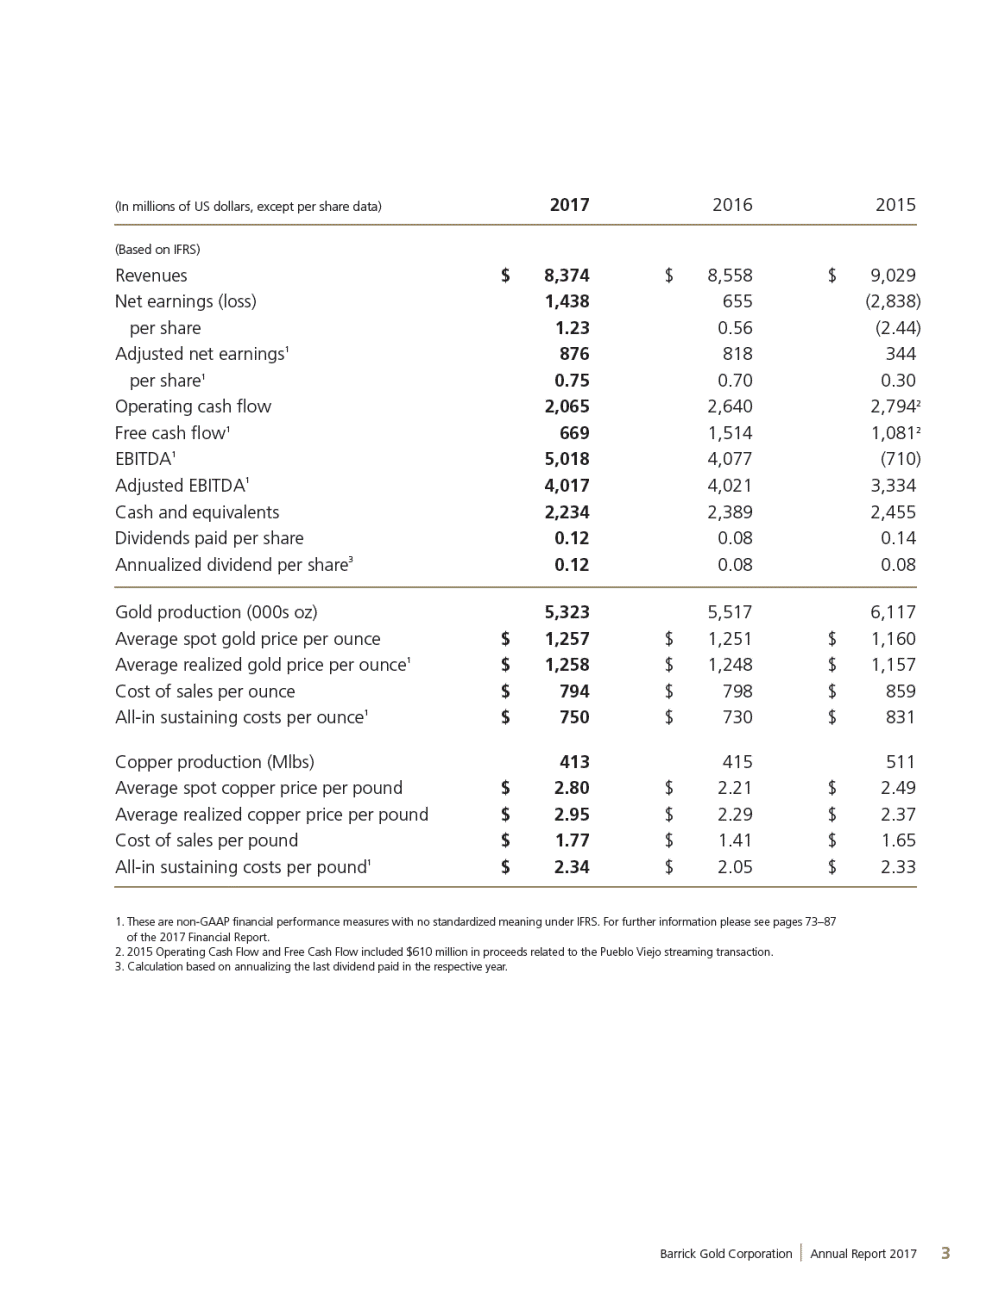
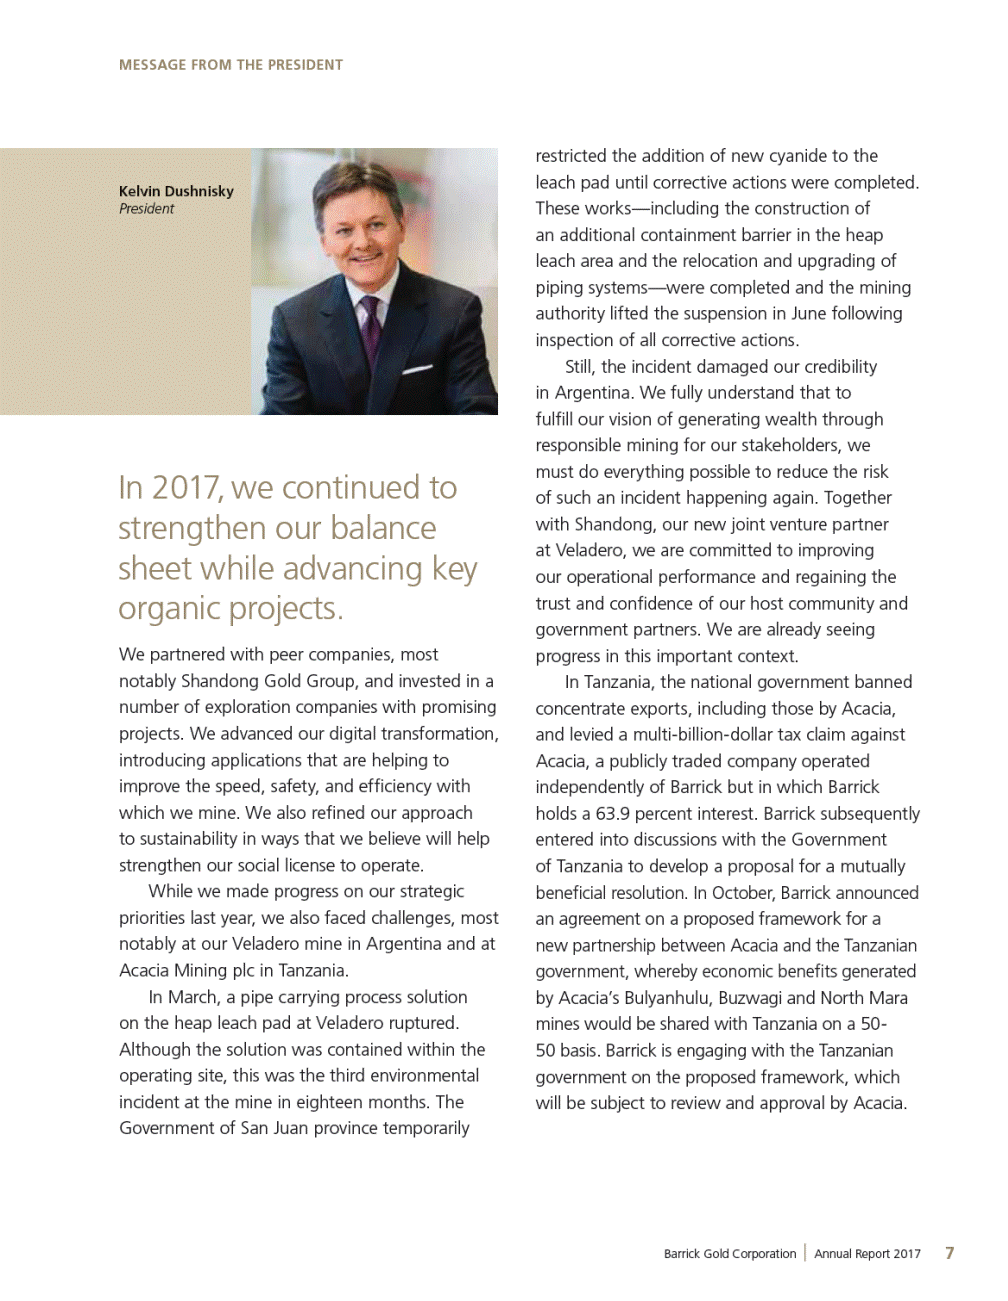
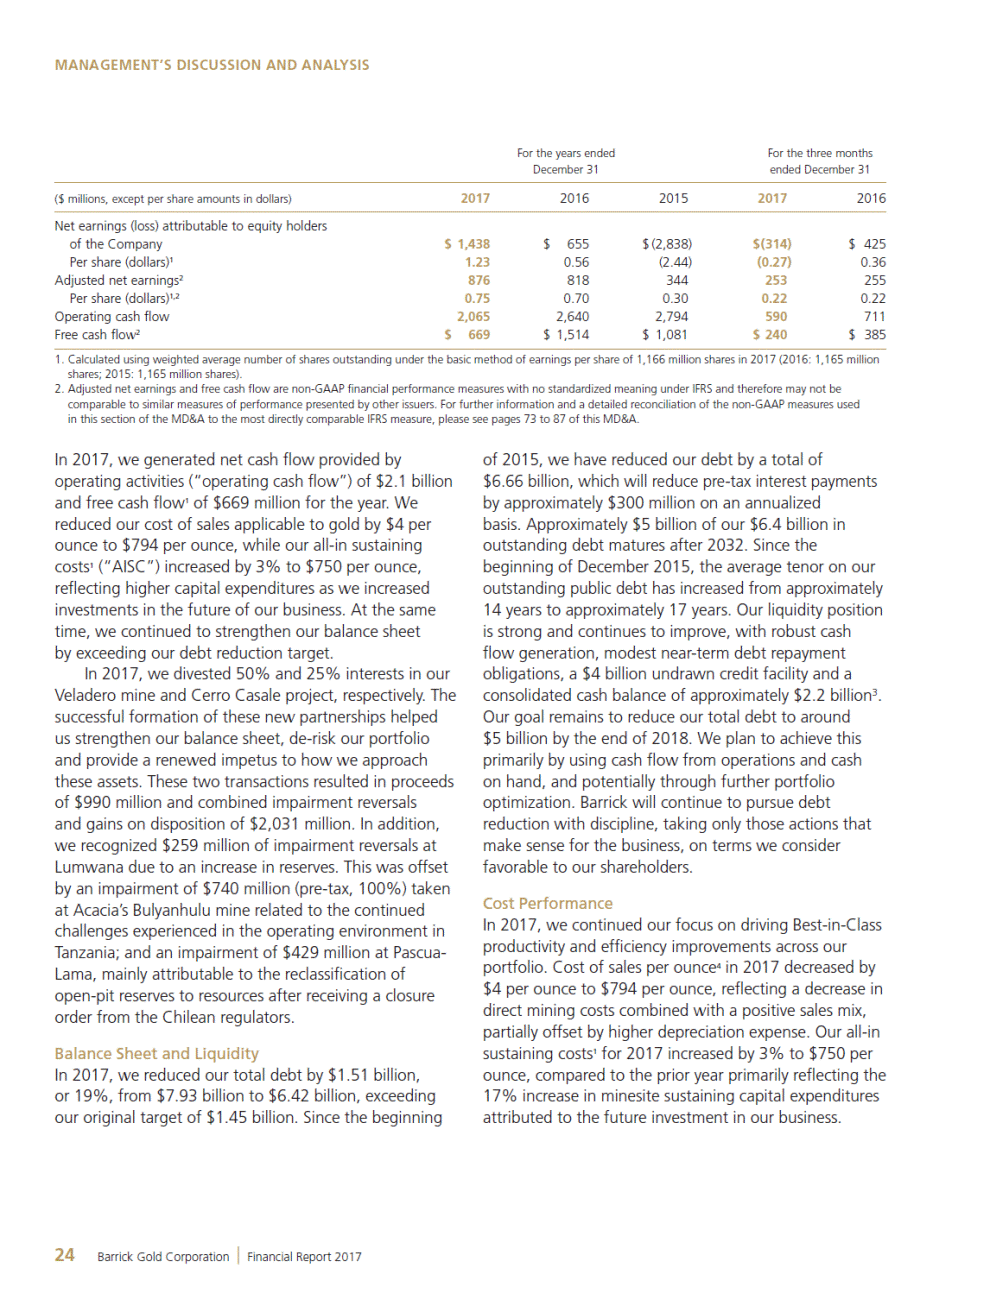
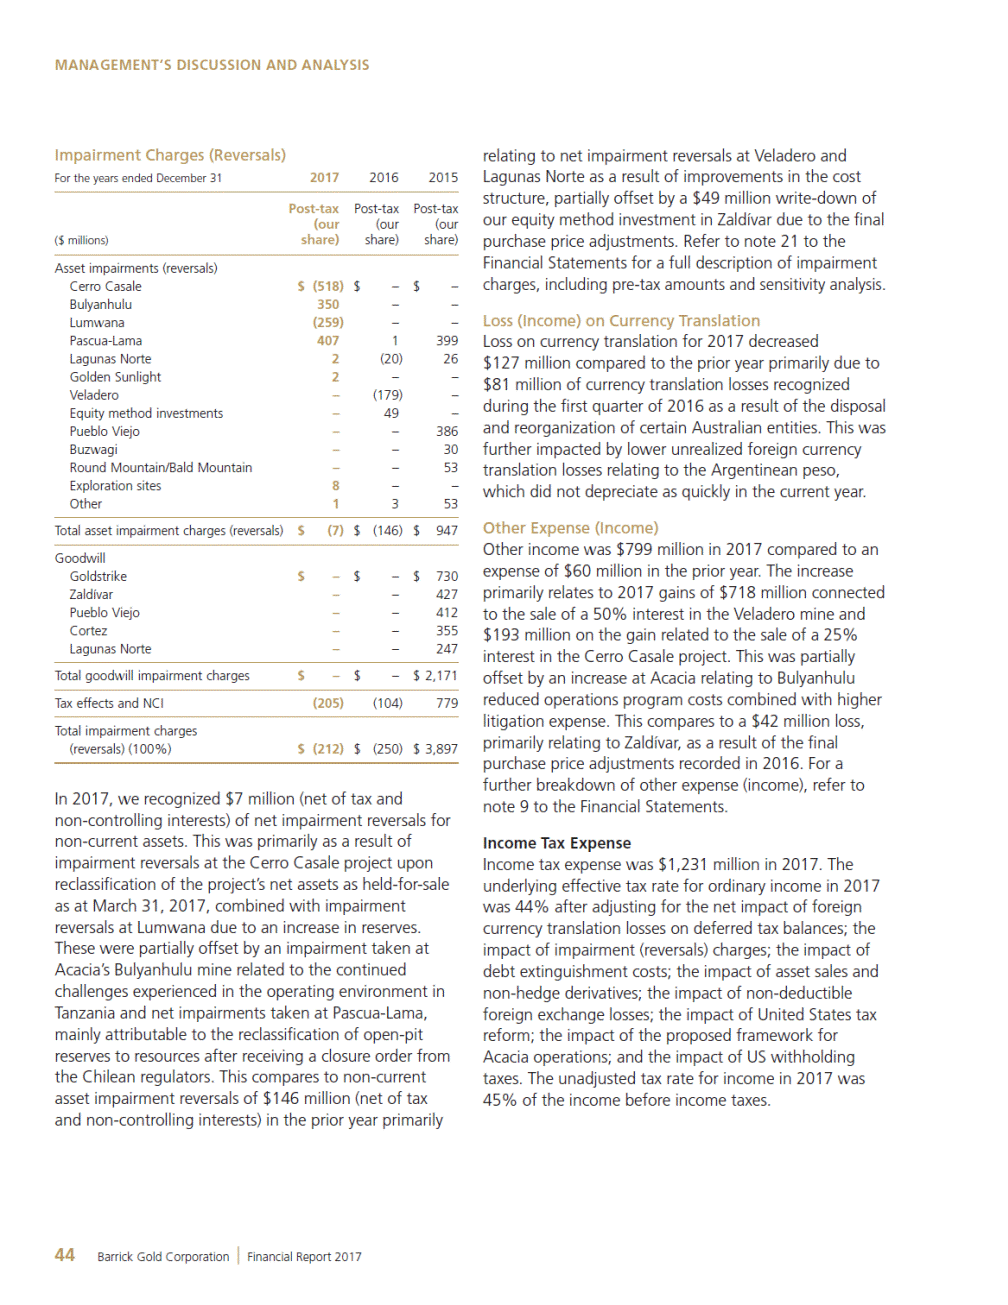
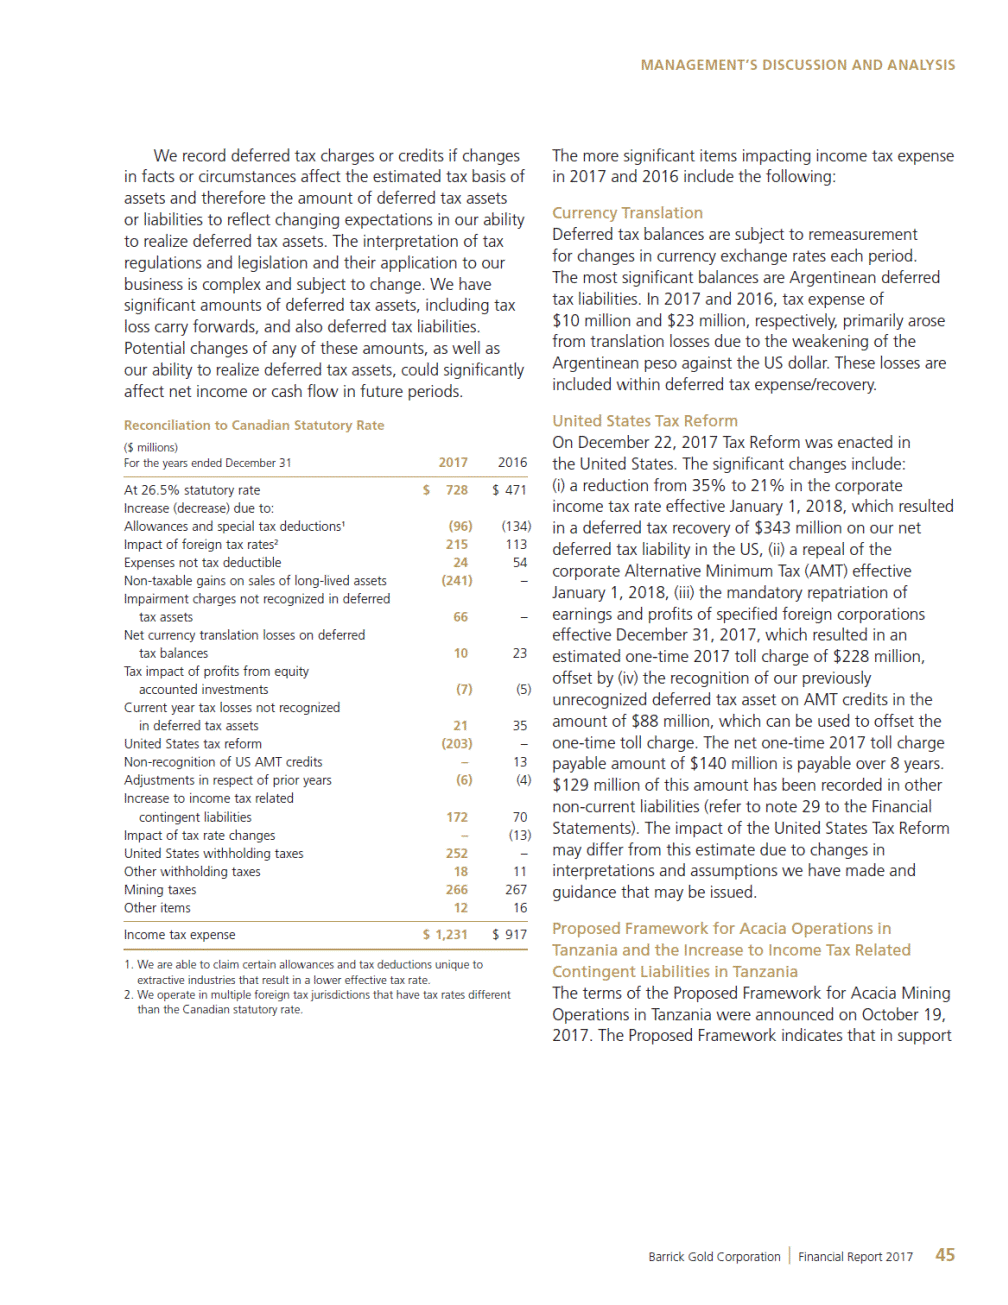
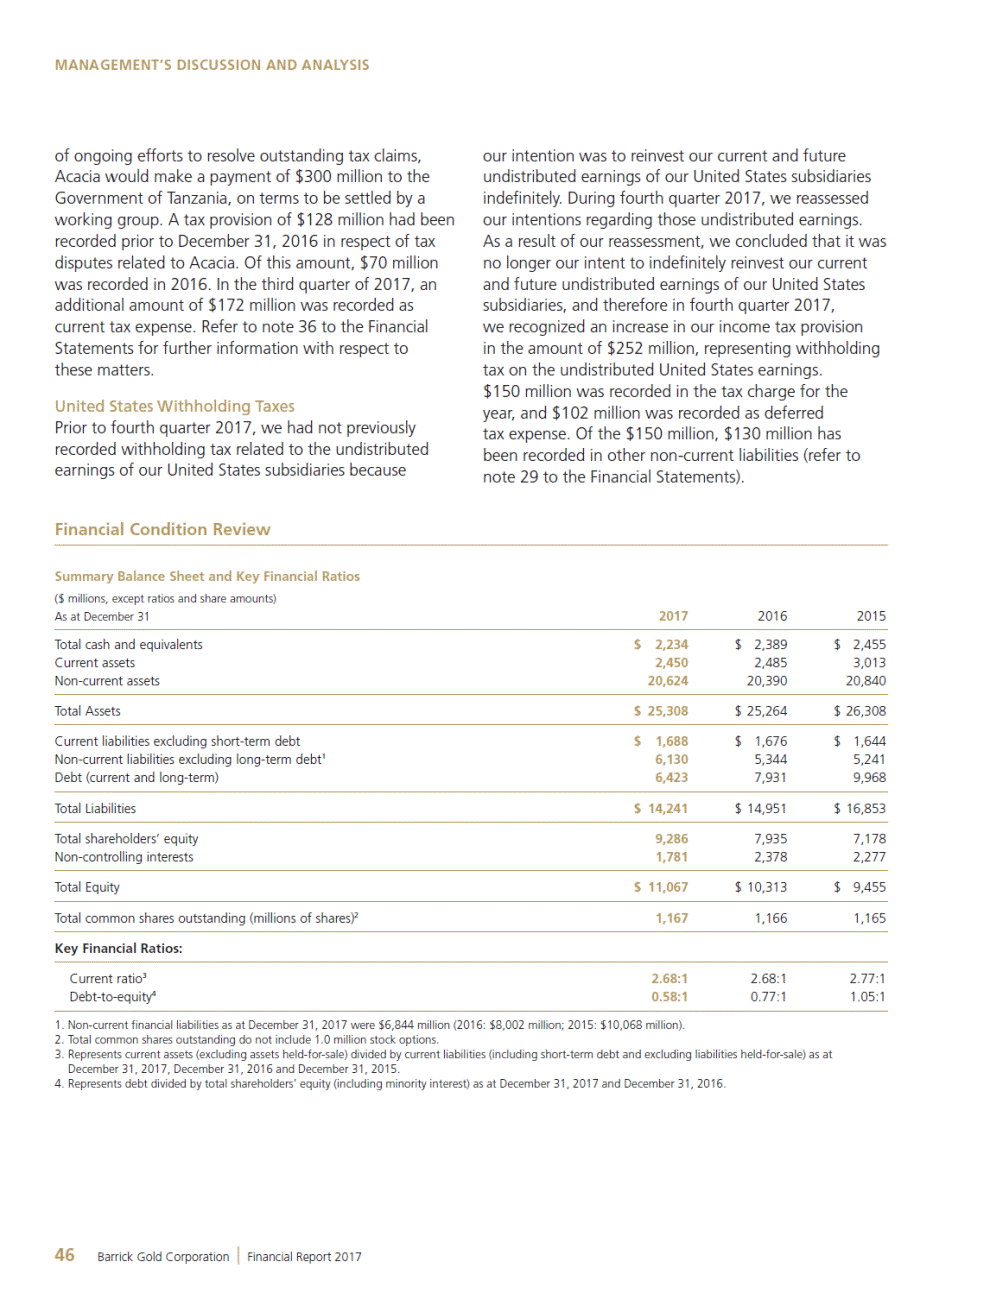
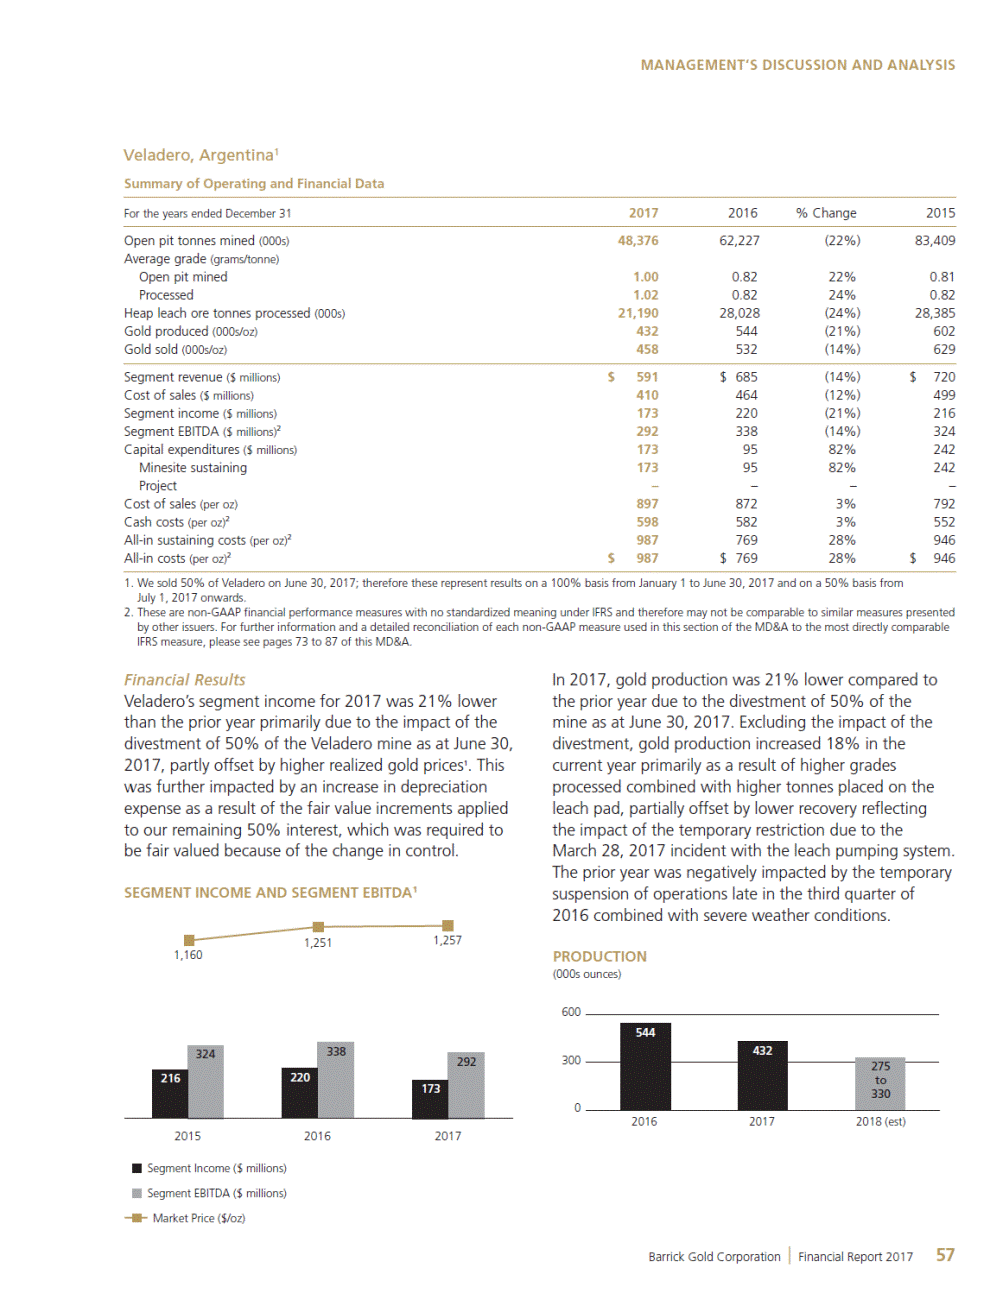
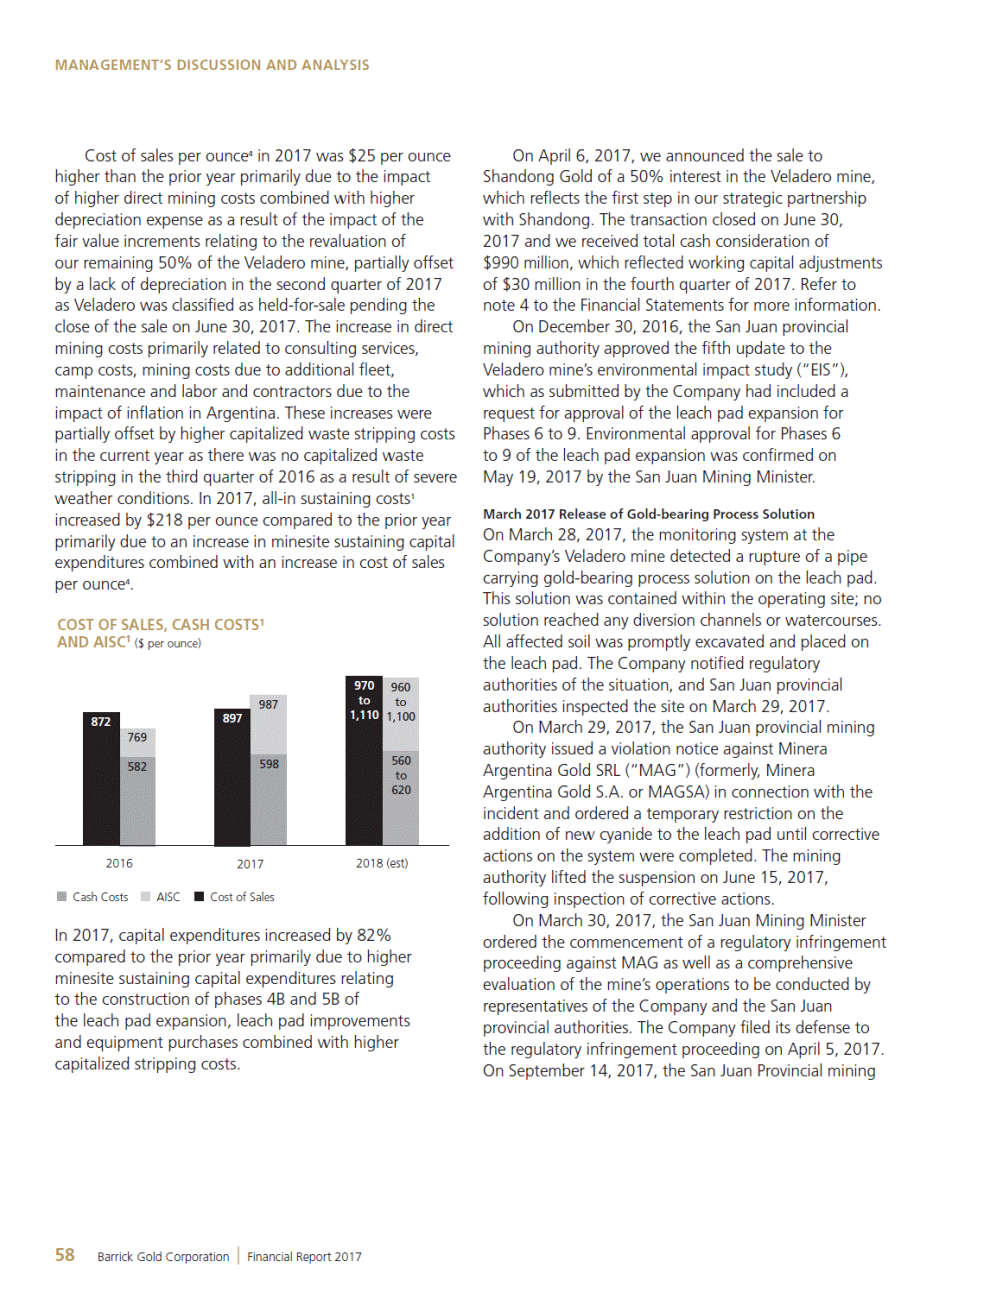
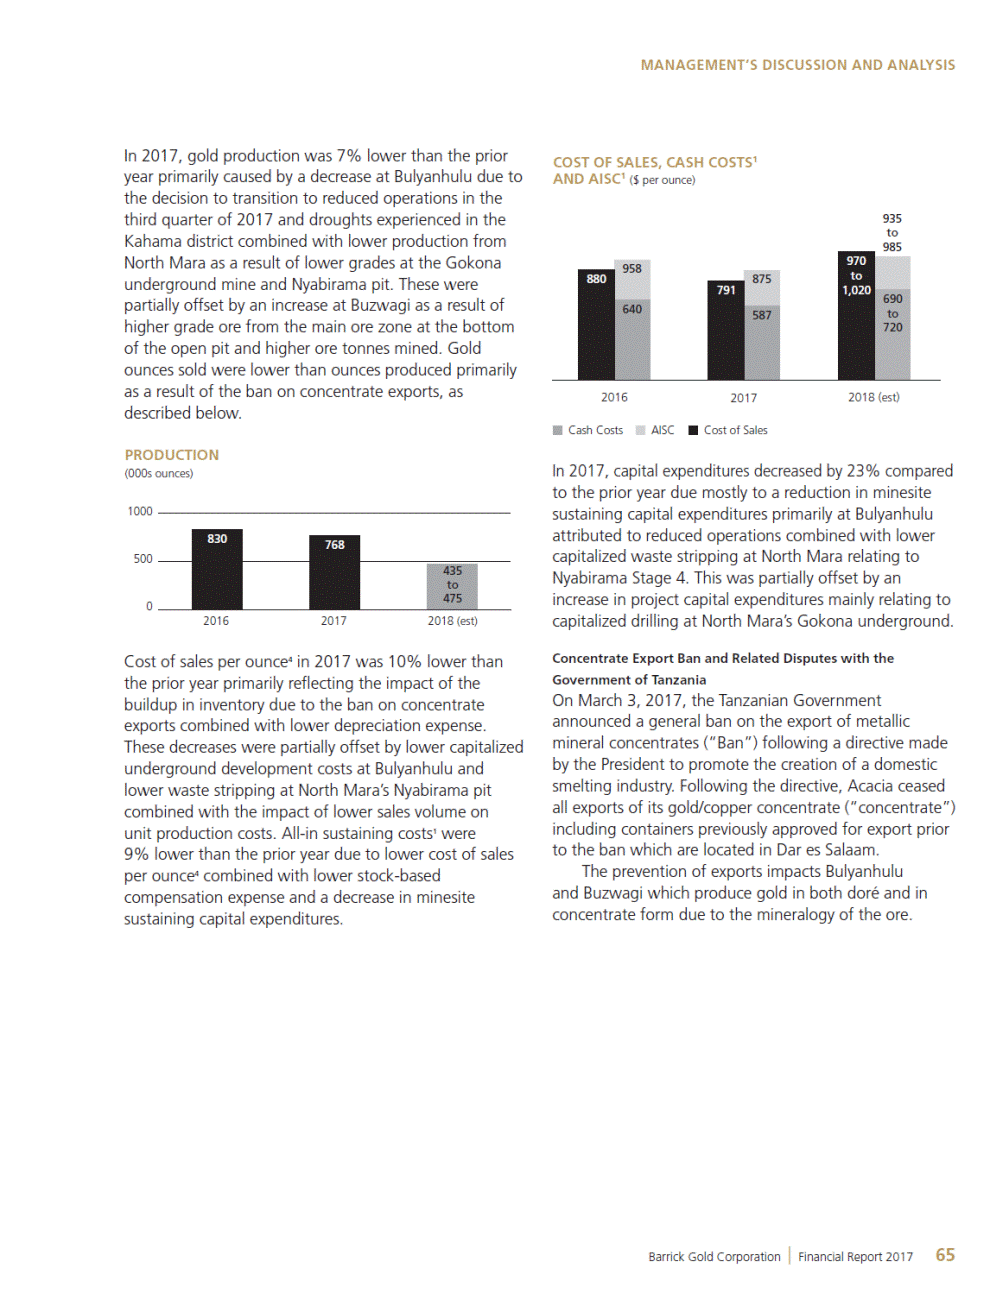
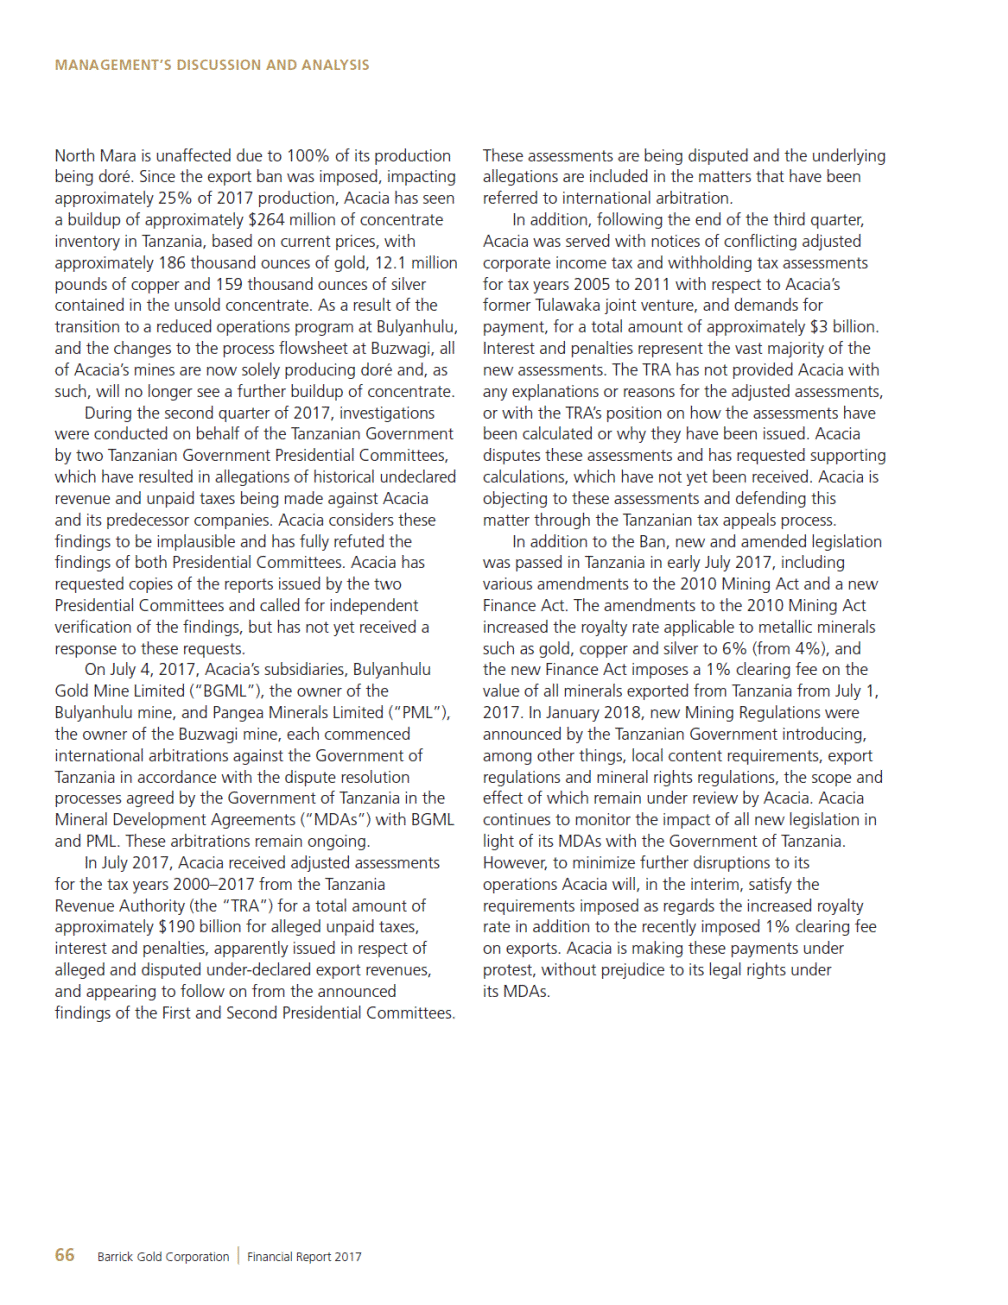
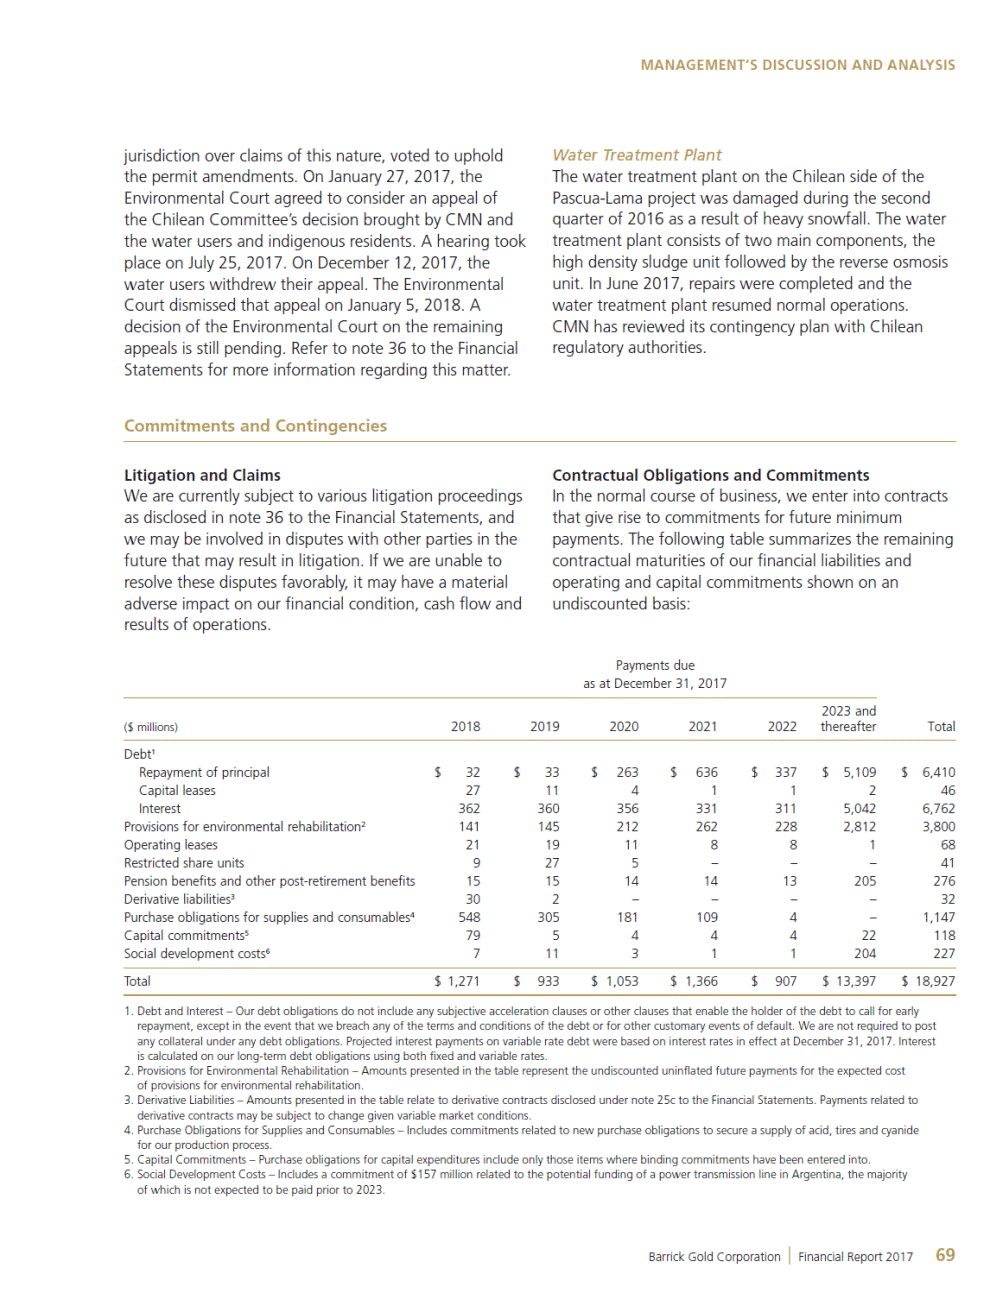
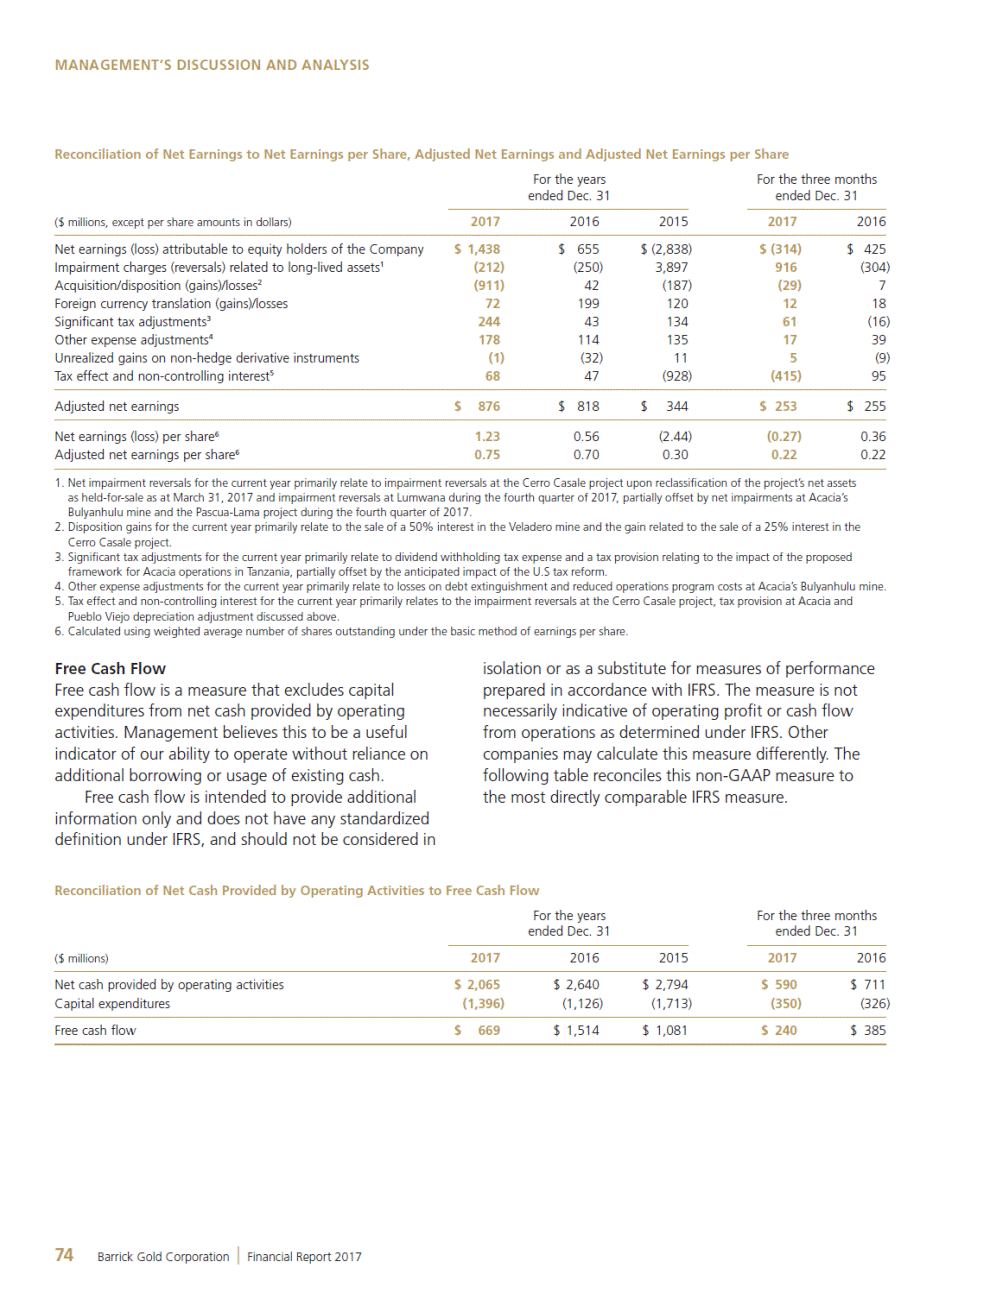
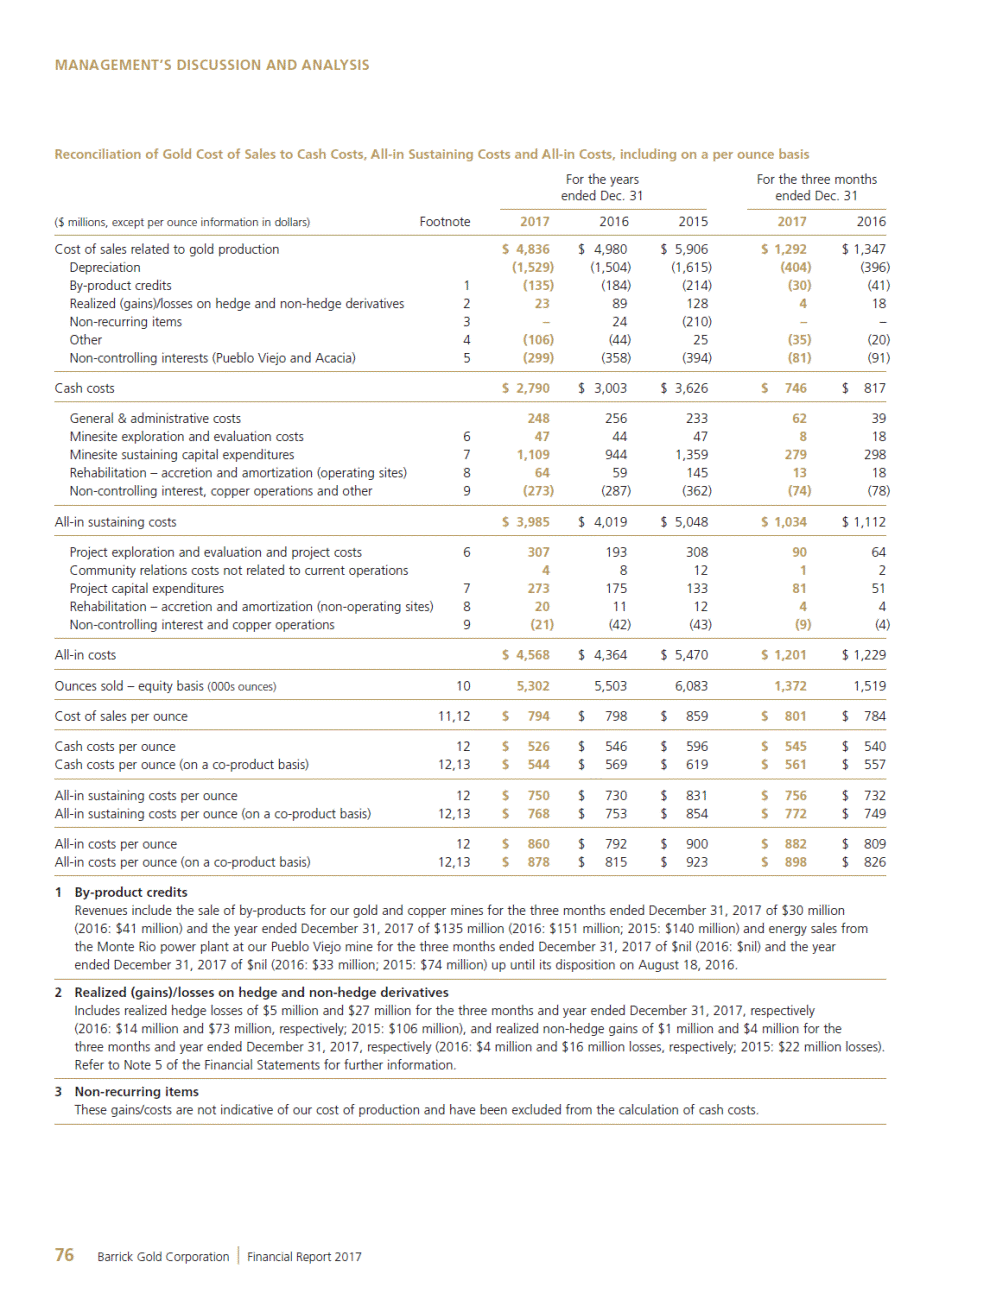
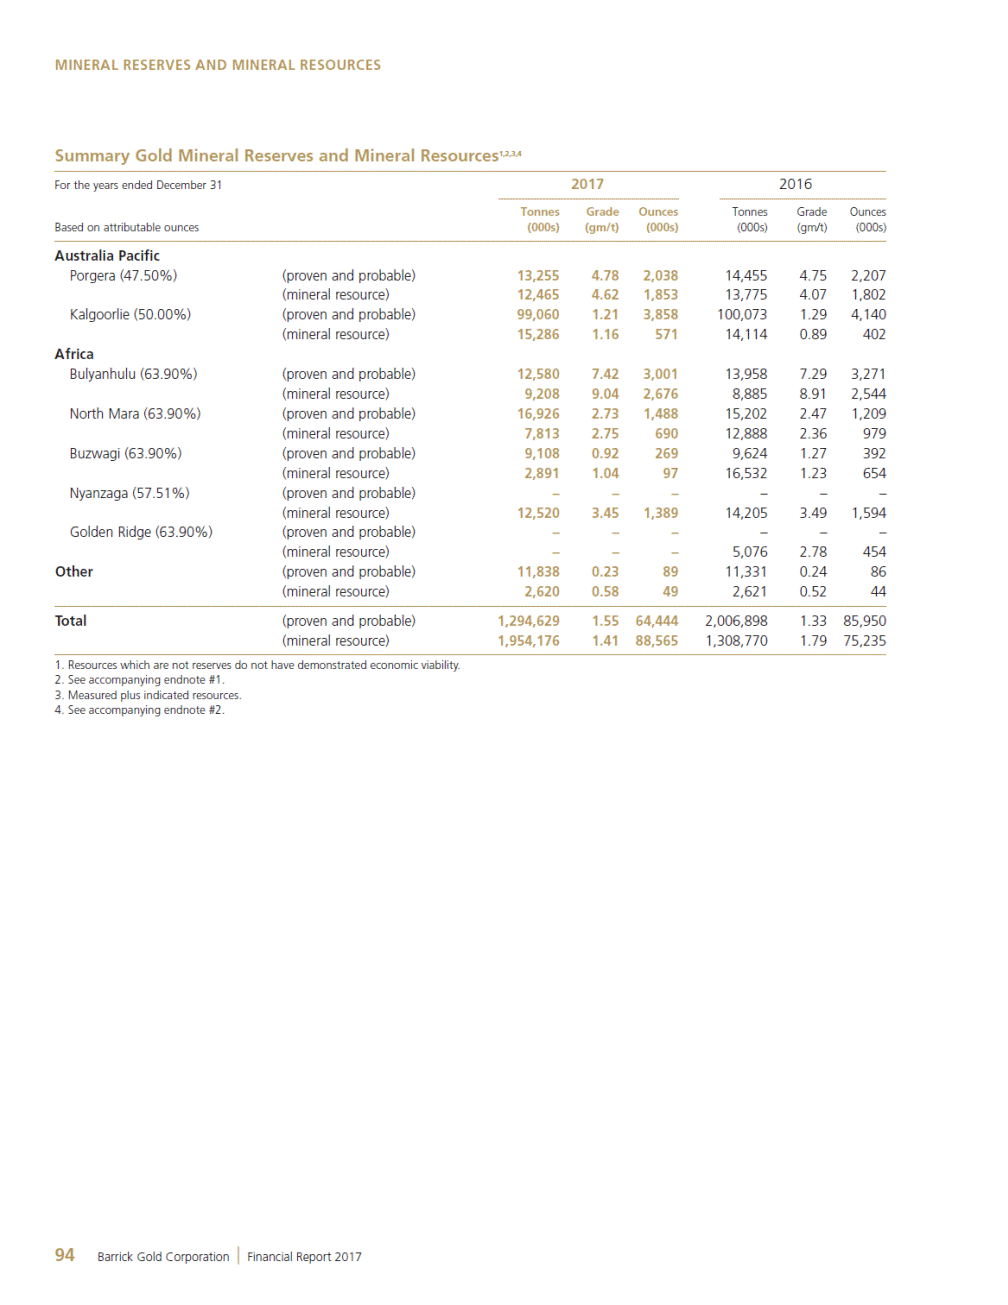
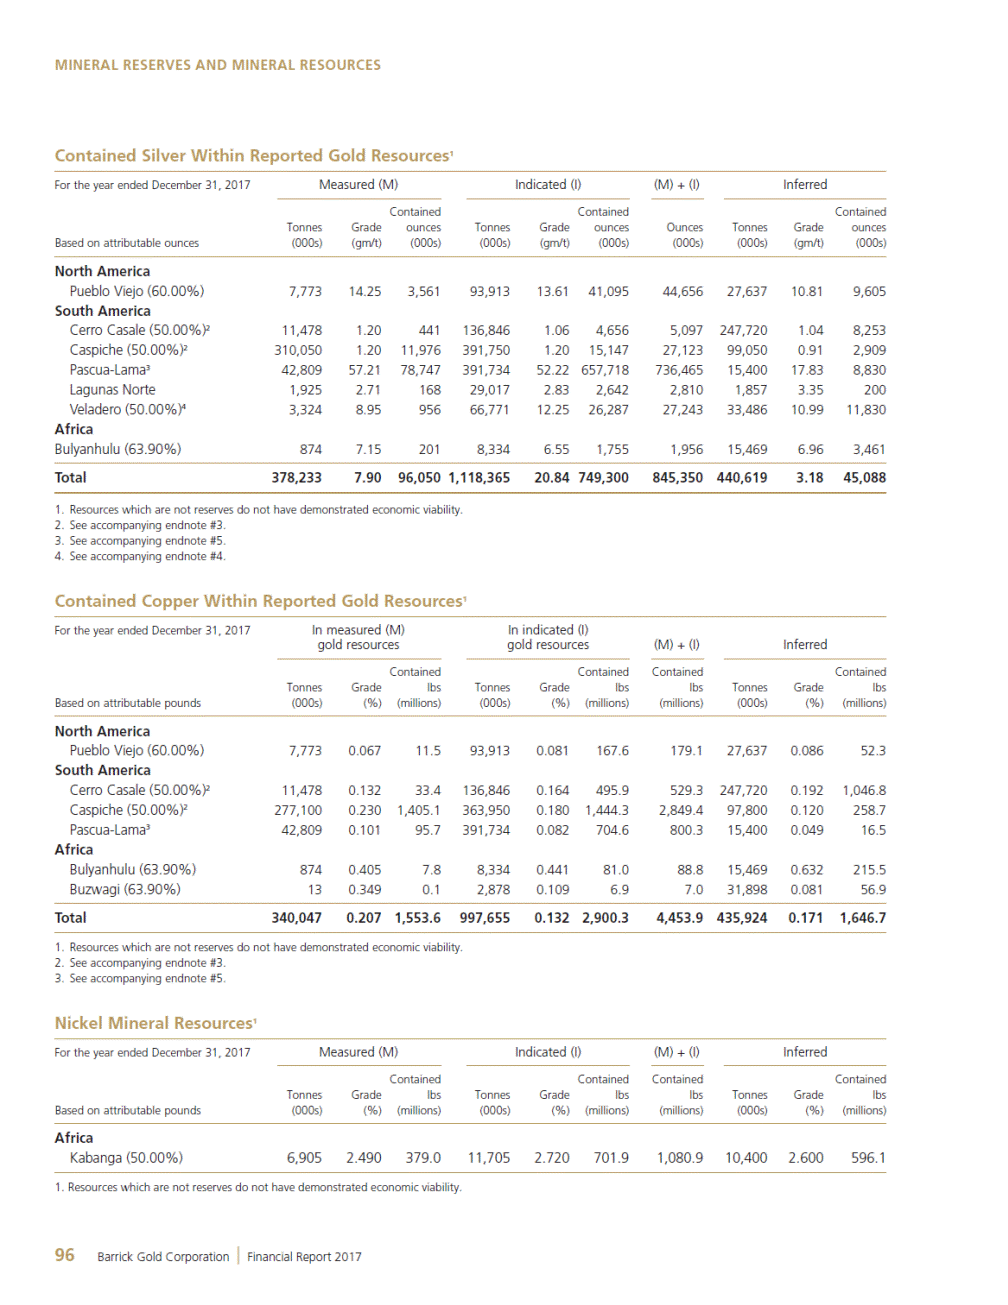
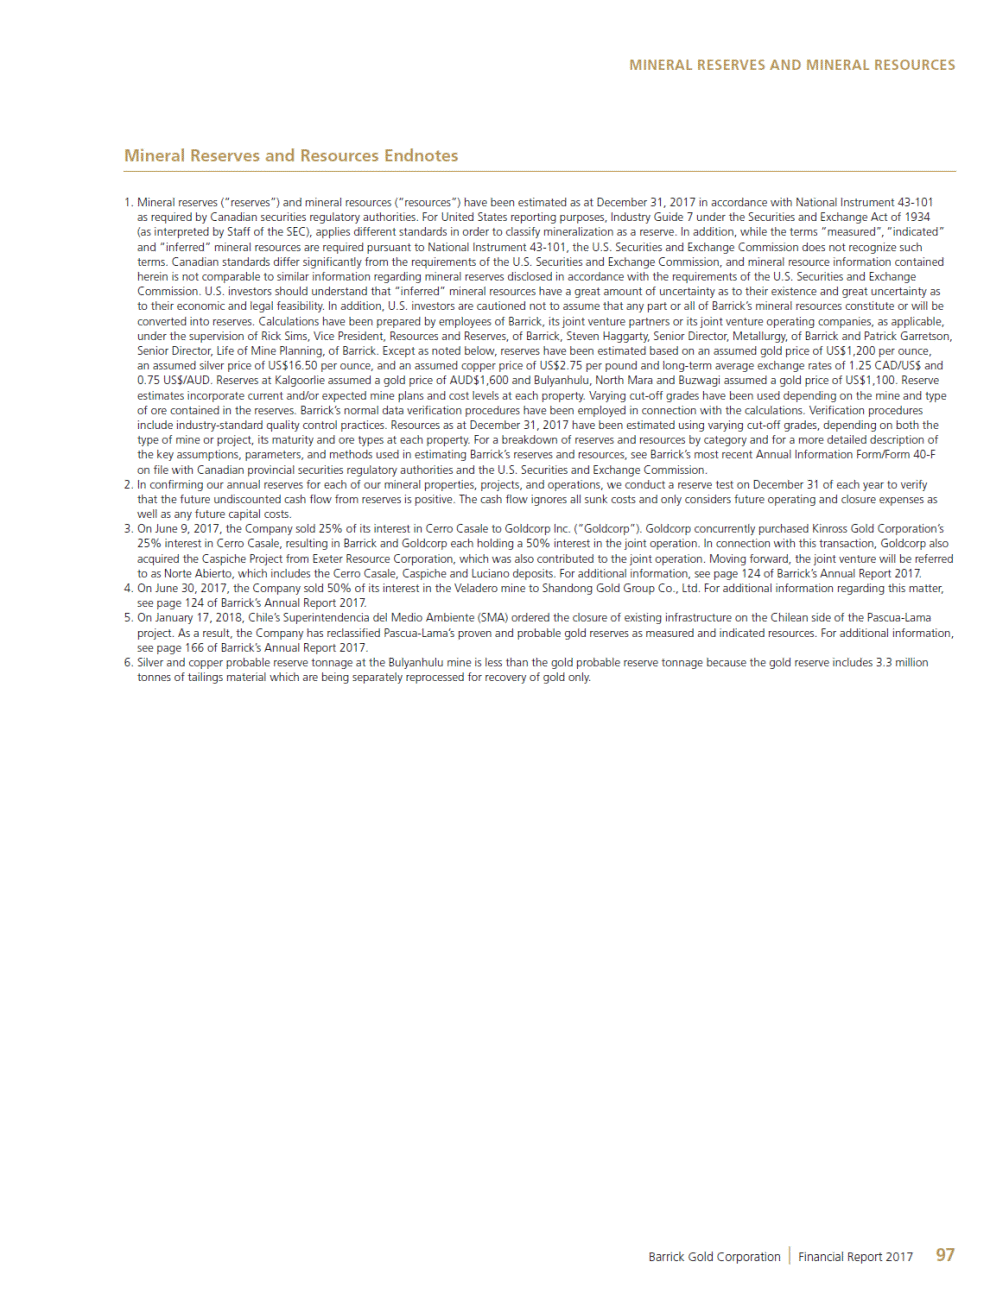
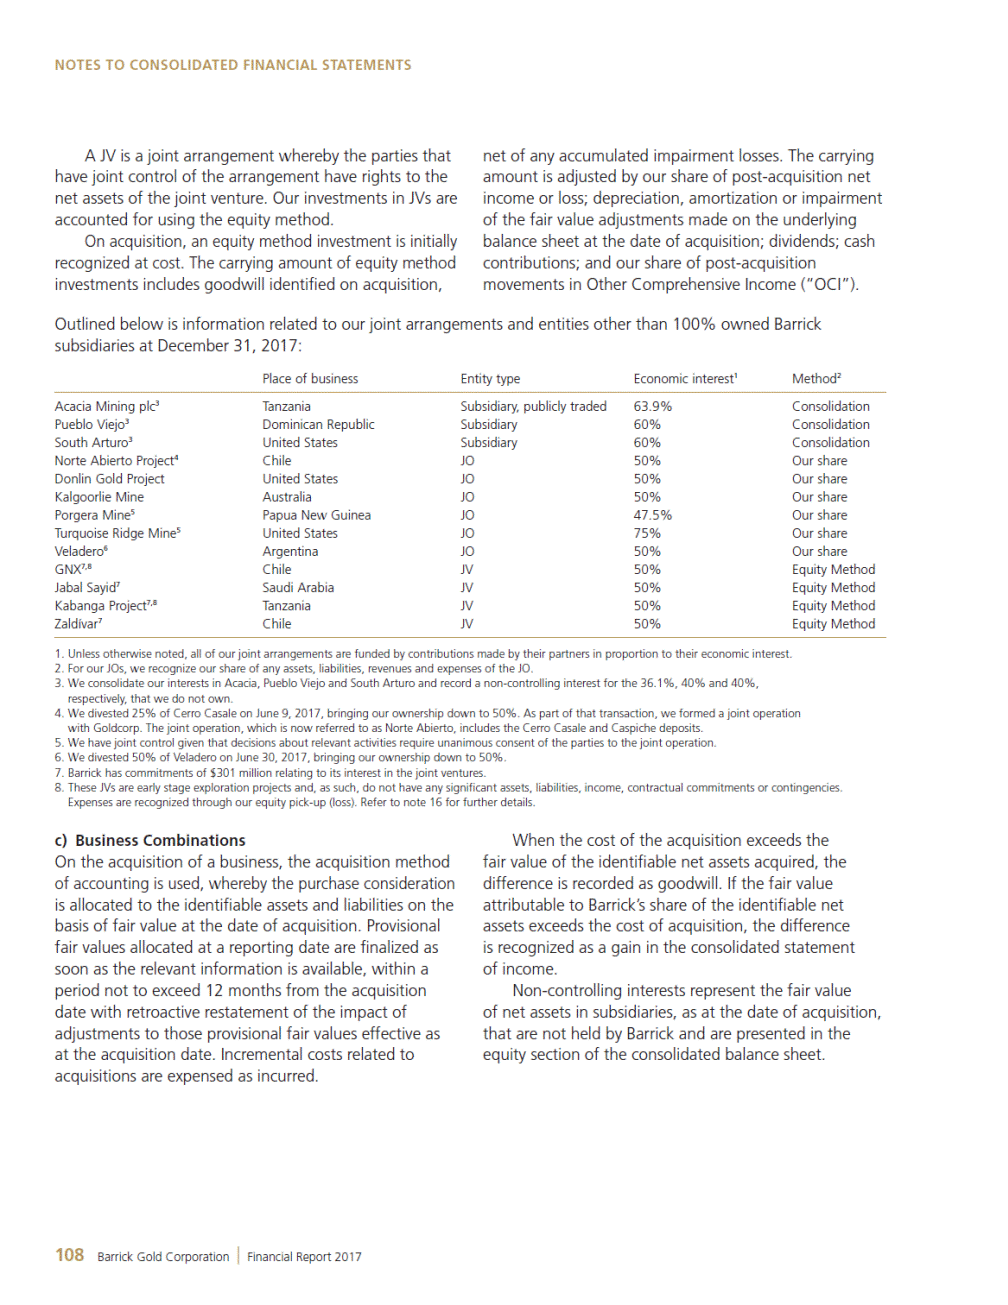
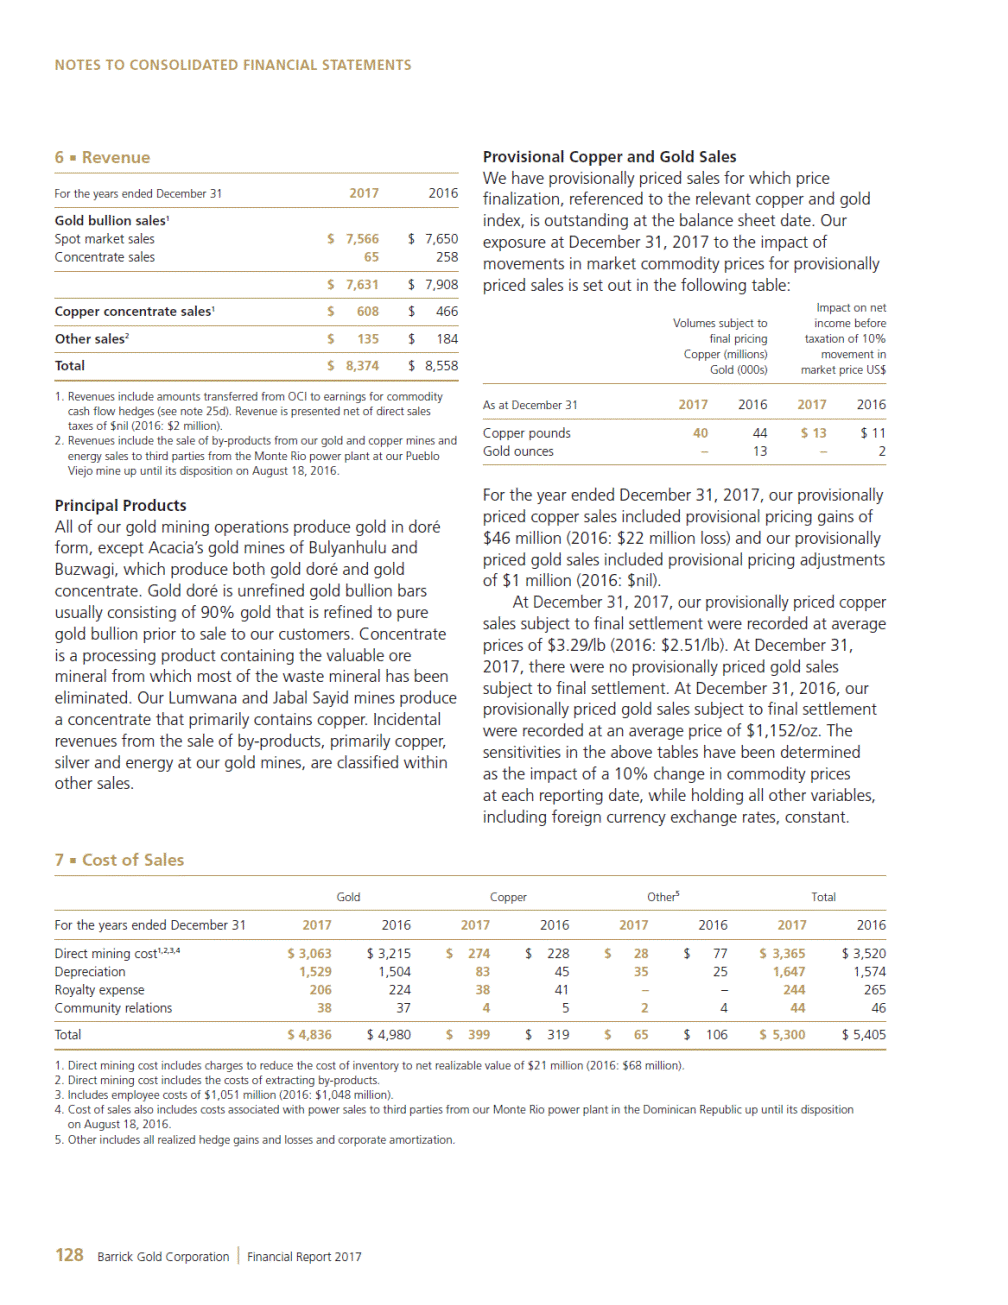
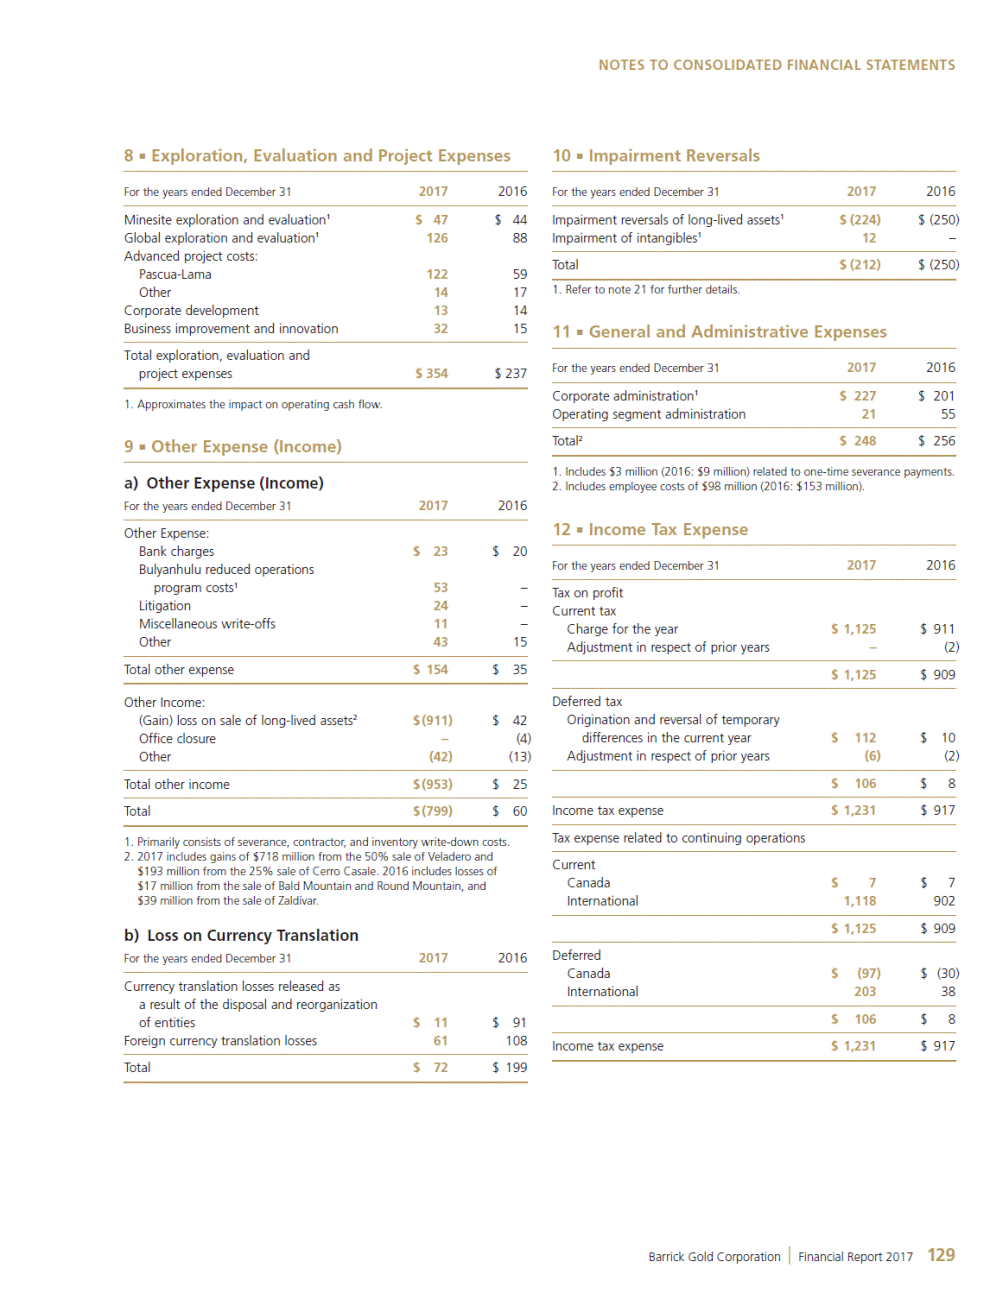
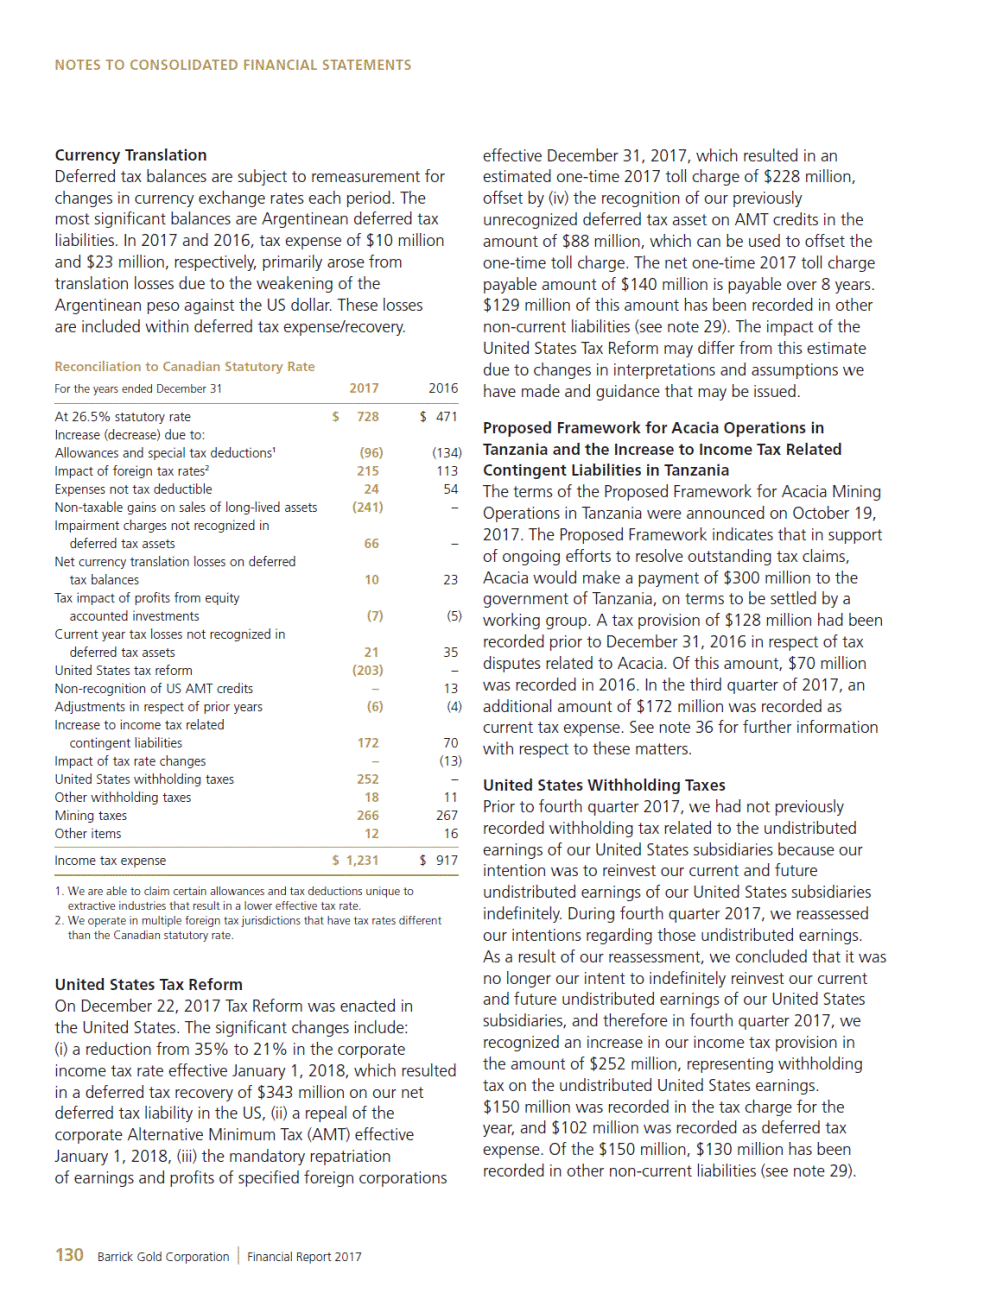
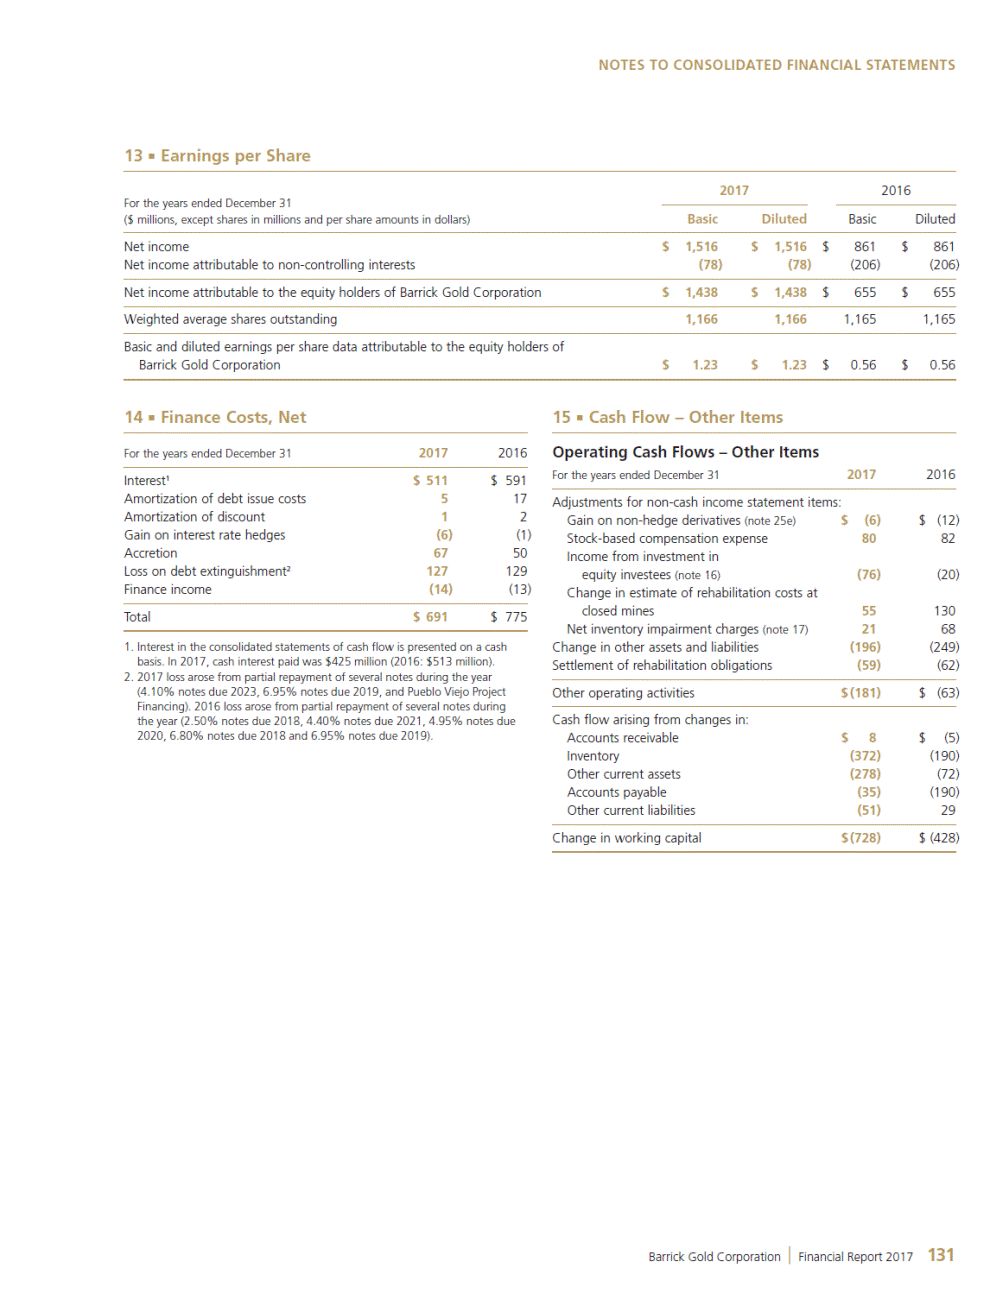
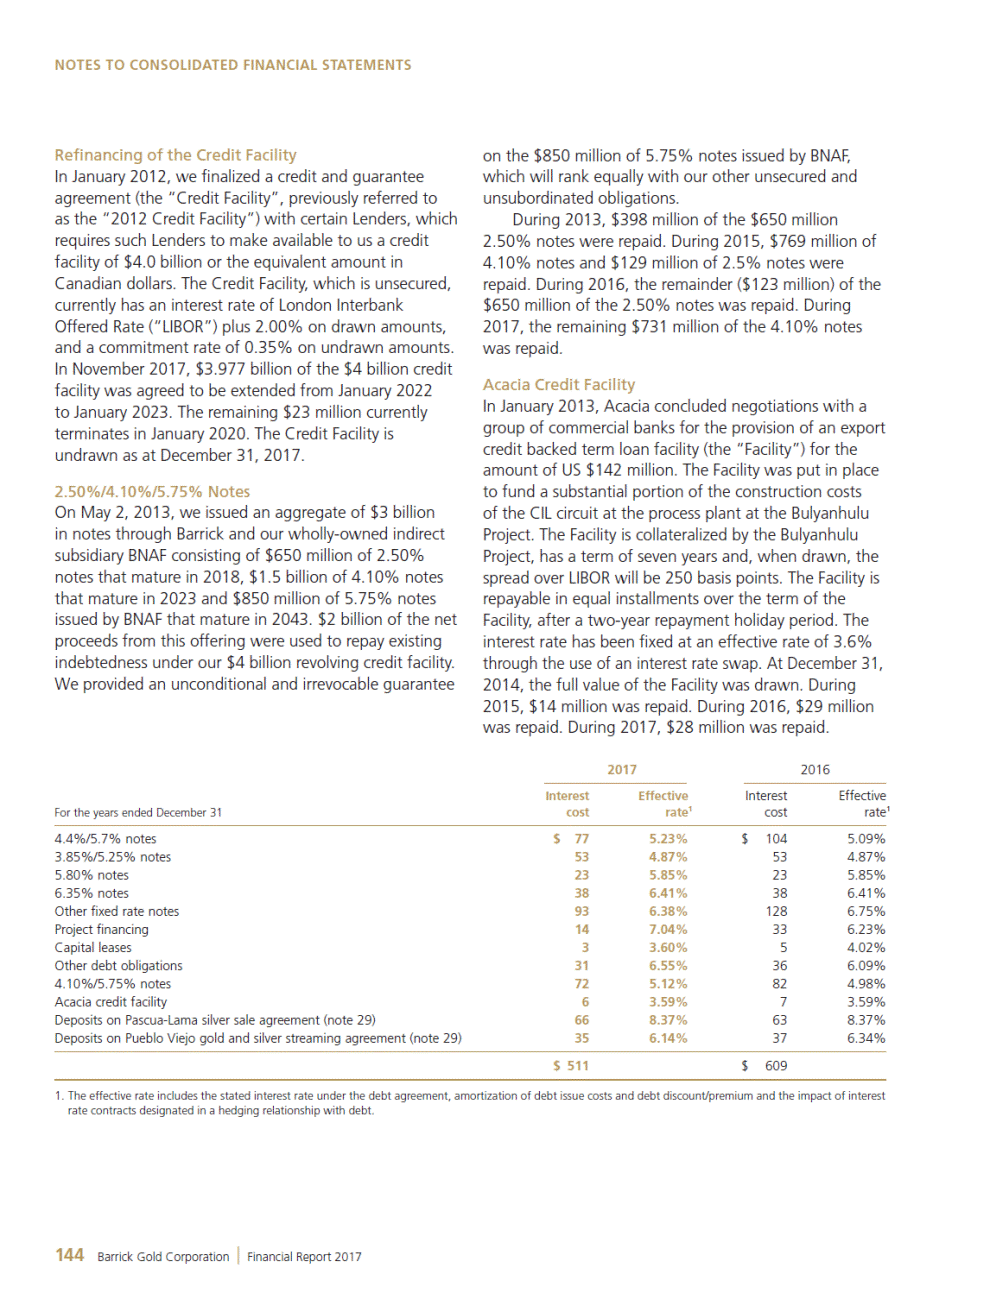
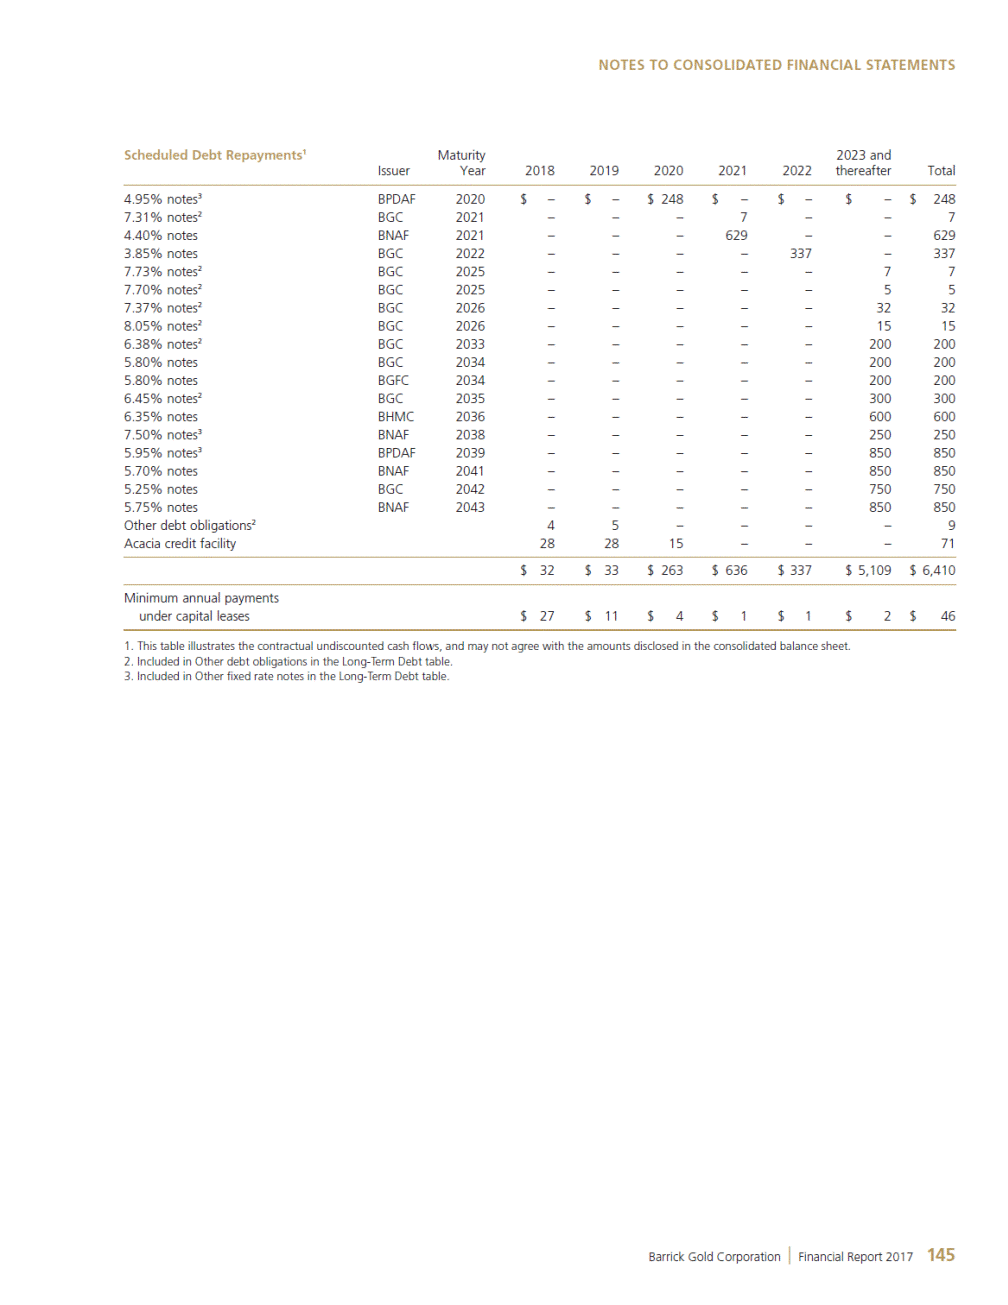
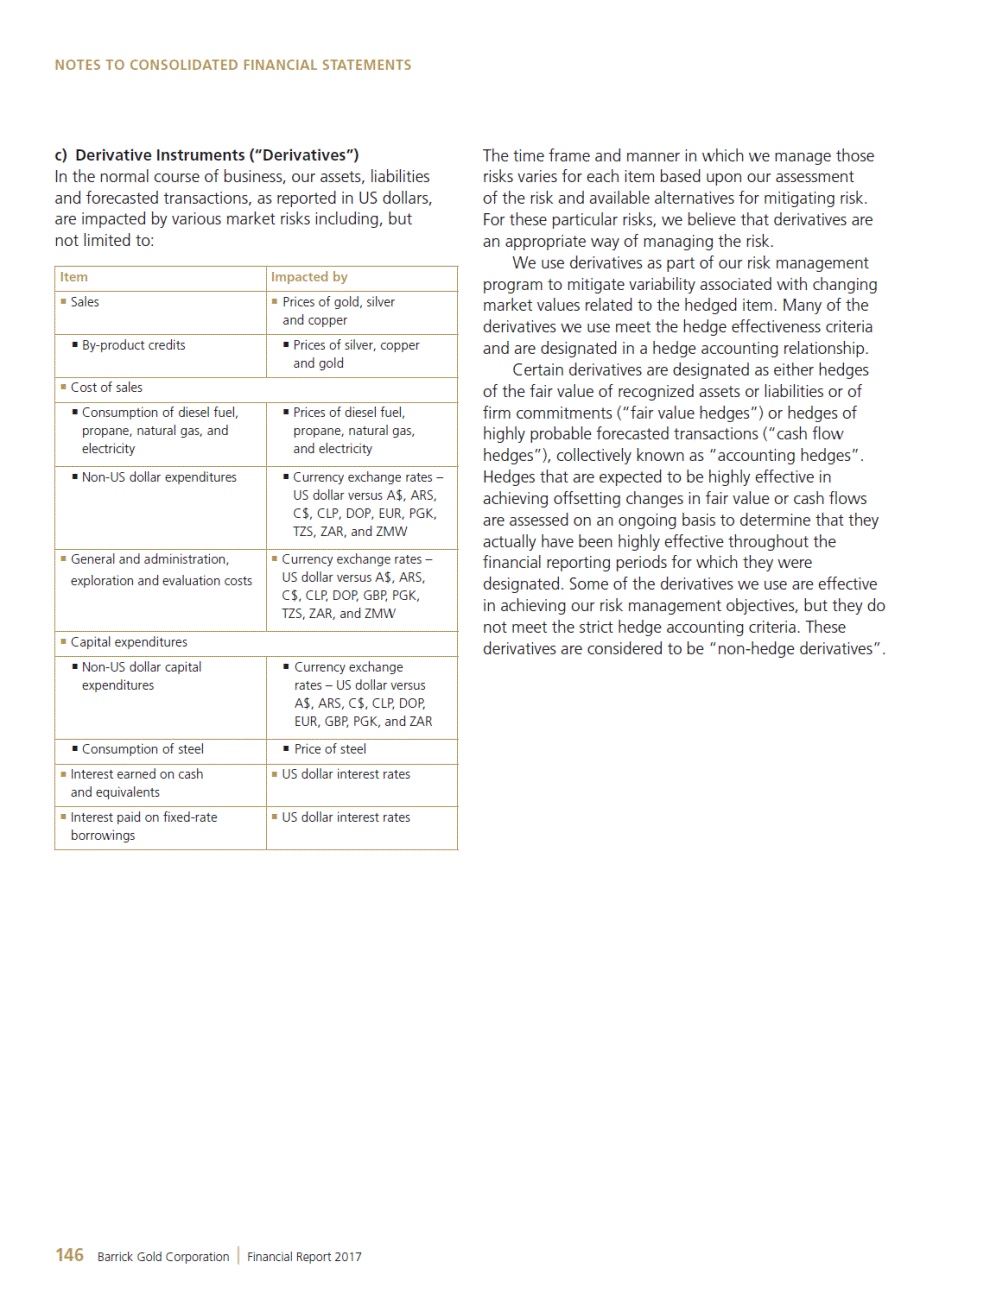
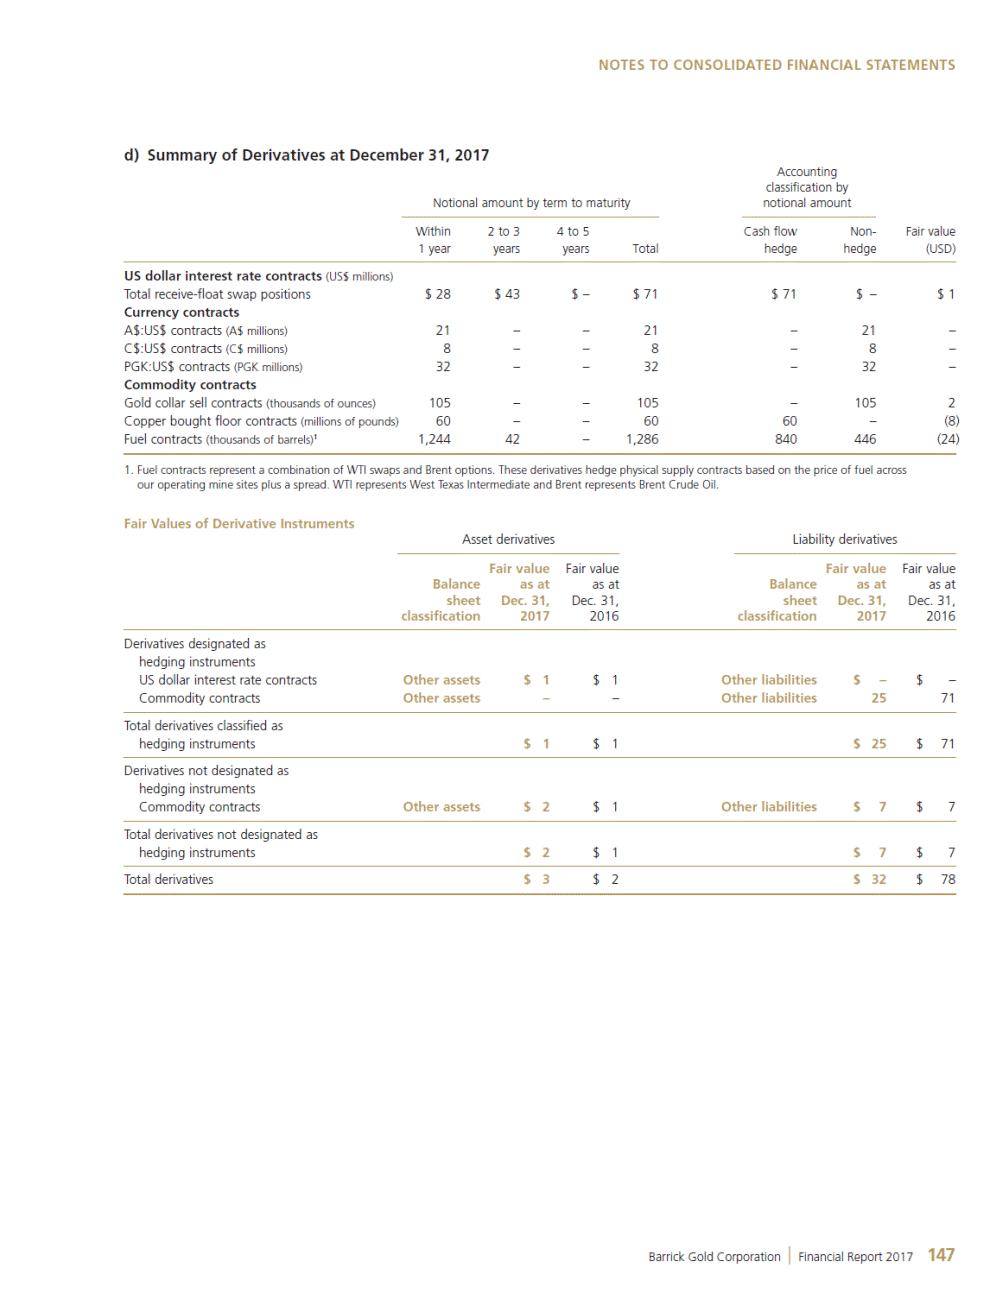
MINERAL RESERVES AND MINERAL RESOURCES Gold Mineral Resources1,2 Measured (M) Indicated (I) (M) + (I) Inferred As at December 31, 2017 Contained ounces (000s) Contained ounces (000s) Contained ounces (000s) Contained ounces (000s) Tonnes (000s) Grade (gm/t) Tonnes (000s) Grade (gm/t) Tonnes (000s) Grade (gm/t) Based on attributable ounces North America Goldstrike Open Pit Goldstrike Underground Goldstrike Property Total Pueblo Viejo (60.00%) Cortez Goldrush Turquoise Ridge (75.00%) South Arturo (60.00%) Hemlo Golden Sunlight Donlin Gold (50.00%) South America Cerro Casale (50.00%)3 Caspiche (50.00%)3 Pascua-Lama4 Veladero (50.00%)5 Lagunas Norte Alturas Australia Pacific Porgera (47.50%) Kalgoorlie (50.00%) Africa Bulyanhulu (63.90%) North Mara (63.90%) Buzwagi (63.90%) Nyanzaga (57.51%) Tankoro (31.95%) Other 1,764 1,519 3,283 7,773 2,586 140 2,944 2,927 1,107 121 3,865 2.61 9.91 5.99 2.39 1.88 10.44 9.03 1.19 2.67 1.54 2.52 148 484 632 598 156 47 855 111.6 95 6 313 3,840 2,379 6,219 93,913 28,837 31,379 2,162 8,365 40,232 3,013 266,803 2.89 7.75 4.75 2.47 1.85 9.27 9.37 1.12 1.36 1.79 2.24 357 593 950 7,456 1,712 9,351 651 301 1,763 173 19,190 505 1,077 1,582 8,054 1,868 9,398 1,506 412.6 1,858 179 19,503 267 1,192 1,459 27,637 9,874 8,817 1,697 749 4,949 2,442 46,108 2.80 9.37 8.16 2.43 2.01 8.24 13.03 0.46 2.78 2.17 2.02 24 359 383 2,155 638 2,335 711 11 442 170 2,997 11,478 310,050 42,809 3,324 1,925 – 0.30 0.57 1.86 0.48 0.87 – 112 5,655 2,564 51 54 – 136,846 391,750 391,734 66,771 29,017 – 0.36 0.47 1.49 0.57 0.96 – 1,574 5,965 18,783 1,225 896 – 1,686 11,620 21,347 1,276 950 – 247,720 99,050 15,400 33,486 1,857 210,965 0.38 0.29 1.74 0.43 0.92 1.00 2,995 921 863 464 55 6,793 149 3,166 5.22 0.96 25 98 12,316 12,120 4.62 1.21 1,828 473 1,853 571 11,879 1,252 4.15 2.48 1,584 100 874 1,291 13 – – 216 11.53 2.63 2.39 – – 0.29 324 109 1 – – 2 8,334 6,522 2,878 12,520 – 2,404 8.78 2.77 1.04 3.45 – 0.61 2,352 581 96 1,389 – 47 2,676 690 97 1,389 – 49 15,469 4,112 31,898 2,933 13,739 1,860 9.75 4.15 0.77 3.49 1.52 0.25 4,848 548 790 329 671 15 Total 400,041 0.92 11,809 1,554,135 1.54 76,756 88,565 795,352 1.21 30,818 Copper Mineral Resources1,2 Measured (M) Indicated (I) (M) + (I) Inferred As at December 31, 2017 Contained lbs (millions) Contained lbs (millions) Contained lbs (millions) Contained lbs (millions) Tonnes (000s) Grade (%) Tonnes (000s) Grade (%) Tonnes (000s) Grade (%) Based on attributable pounds Zaldívar (50.00%) Lumwana Jabal Sayid (50.00%) 62,629 28,041 216 0.402 0.388 1.617 555.5 239.9 7.7 25,248 553,524 2,404 0.389 0.505 2.004 216.4 6,161.3 106.2 771.9 6,401.2 113.9 4,408 119,094 1,860 0.511 0.452 2.300 49.7 1,187.4 94.3 Total 90,886 0.401 803.1 581,176 0.506 6,483.9 7,287.0 125,362 0.482 1,331.4 1. Resources which are not reserves do not have demonstrated economic viability. 2. See accompanying endnote #1. 3. See accompanying endnote #3. 4. See accompanying endnote #5. 5. See accompanying endnote #4. 92 Barrick Gold Corporation | Financial Report 2017