EXHIBIT 99.1

| | |
THIRD QUARTER REPORT 2011 OCTOBER 27, 2011 Based on IFRS and expressed in US dollars | | For a full explanation of results, the Financial Statements and Management Discussion & Analysis, please see the Company’s website,www.barrick.com. |
Barrick Reports Q3 2011 Financial and Operating Results
Financial and Operating Results
| | • | | Reported net earnings for Q3 rose 45% to a record $1.37 billion ($1.37 per share) from $942 million ($0.96 per share) in the prior year period. Q3 adjusted net earnings increased 52% to $1.39 billion ($1.39 per share)1 from $912 million ($0.93 per share) in Q3 2010, reflecting higher gold and copper prices along with higher copper sales volumes, resulting in an annualized return on equity of approximately 25%1. | |
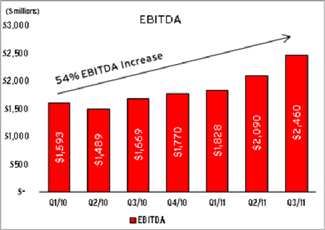
| | • | | Q3 EBITDA increased 47% to $2.46 billion1 from $1.67 billion in the same prior year period. Q3 operating cash flow rose 35% to a record $1.89 billion from $1.40 billion and adjusted operating cash flow increased 33% to $1.92 billion1 from $1.44 billion in Q3 2010. | |
| | • | | Q3 gold production was 1.93 million ounces at total cash costs of $453 per ounce and net cash costs of $328 per ounce1. The Company is on track to meet its full year operating guidance, with production expected to be 7.6-7.8 million ounces at total cash costs of $460-$475 per ounce, within original guidance ranges. Net cash costs for 2011 are anticipated to be $330-$350 per ounce2, reflecting a lower copper price assumption than previously assumed. Copper production is expected to be 450-460 million pounds at total cash costs of $1.60-$1.70 per pound in 2011. | |
| | • | | Gold cash margins expanded significantly in the third quarter, highlighting Barrick’s leverage to higher gold prices. Gold cash margins increased 55% to $1,290 per ounce1 from $834 per ounce in Q3 2010 and net cash margins rose 51% to $1,415 per ounce1 from $939 per ounce in the same prior year period. | |
Increasing Gold and Copper Reserves and Resources through Exploration and Selective Acquisitions
| | • | | During the quarter, Barrick announced two significant gold discoveries on the Cortez property in Nevada, Red Hill and Goldrush. Recent drilling continues to expand the mineralization at these two discoveries. In addition, infill drilling between the two deposits is successfully finding new mineralization, advancing the possibility that they will merge into a single deposit. A total of 264,000 feet of drilling is planned in 2011 and the program is approximately 80% complete. | |
| | • | | At Lumwana in Zambia, drilling activity has been ramped up with 11 drill rigs active and an additional four rigs being mobilized. Areas of focus include resource definition drilling at the Chimiwungo deposit to convert inferred resources into indicated resources as well as extensional drilling to expand the mineralization. Drilling at Chimiwungo East commenced in September and results received from initial drill holes are in line with expectations. In addition, Barrick is advancing an expansion study that could potentially double processing rates. | |
Investing in and Developing High Return Projects
| | • | | The development of the Pueblo Viejo3 and Pascua-Lama mines advanced during the third quarter with first production on track to commence in mid-2012 and mid-2013, respectively. | |
| | • | | Pueblo Viejo and Pascua-Lama are anticipated to contribute 1.4-1.5 million ounces of average annual gold production over the first full five years of operation at total cash costs significantly lower than Barrick’s overall current cash cost profile4. | |
Continually Improving Corporate Social Responsibility (CSR) Practices to Maintain License to Operate
| | • | | During the quarter, Barrick was ranked as a global leader in CSR for the fourth consecutive year by the Dow Jones Sustainability Index. Barrick is included on both the Dow Jones Sustainability World Index and North American Index for 2011. | |
Returning Capital to Shareholders
| | • | | Consistent with Barrick’s practice of paying a progressive dividend, the Board of Directors has authorized a quarterly dividend of 15 cents per share, which represents a 25% increase from the previous dividend. The Company’s strong earnings and operating cash flows, combined with its positive outlook on the gold price, enables it to continue to make high return investments in its project pipeline and also increase its dividend. Over the last five years, Barrick has had a consistent track record of returning capital to shareholders, increasing its dividend by more than 170%5 on a quarterly basis. | |
1 Adjusted net earnings, adjusted operating cash flow, EBITDA, return on equity, total cash costs, net cash costs, cash margins and net cash margins per ounce/pound are non-GAAP financial measures. See pages 55-62 of Barrick’s Third Quarter 2011 Report.
2 Assumes a market copper price of $3.25/lb for Q4 2011, which will result in a realized price of about $3.40/lb, including the impact of the copper collars.
3 Barrick has a 60% interest in the Pueblo Viejo mine.
4 Based on the estimated combined average annual production in the first full five years of operation.
5 Calculated based on converting the 2006 semi-annual dividend of 11 cents per share to a quarterly equivalent.
| | | | |
| BARRICK THIRD QUARTER 2011 | | | | PRESS RELEASE |
FINANCIAL AND OPERATING RESULTS
Q3 production was 1.93 million ounces of gold at total cash costs of $453 per ounce and net cash costs of $328 per ounce. The Company is on track to achieve its original full year operating guidance and has narrowed expected gold production and cash cost ranges to 7.6-7.8 million ounces at total cash costs of $460-$475 per ounce. Net cash costs for 2011 are expected to be $330-$350 per ounce, reflecting a lower copper price assumption than previously assumed. In 2012, total cash costs are expected to be approximately 10% higher, primarily due to inflationary cost pressures, as well as a change in the production mix. Gold production in 2012 is anticipated to be comparable to 2011.
Q3 gold cash margins increased 55% to $1,290 per ounce from $834 per ounce in Q3 2010 and net cash margins rose 51% to $1,415 per ounce from $939 per ounce in the same prior year period. This margin expansion demonstrates the Company’s exceptional leverage to higher gold prices.
Third quarter copper cash margins of $1.63 per pound included a full quarter of production from the recently acquired Lumwana mine in Zambia. The Company’s Q3 average realized copper price was negatively impacted by about $58 million in provisional pricing adjustments due to the significant decrease in market copper prices at the end of September. The sales price for copper is determined based on market copper prices at a future date set by the customer, generally one to six months after the initial date of sale. The prices on these sales are marked-to-market at the balance sheet date based on the forward copper price for the relevant quotational period. All mark-to-market adjustments are recorded in copper sales revenues. As a result, the Company’s Q3 average realized copper price of $3.54 was below the average market copper price of $4.07 per pound. As at quarter-end, there were approximately 82 million pounds of copper sales that were provisionally priced at the closing market copper price of $3.27 per pound, which are expected to settle by year end. Future changes in market copper prices will continue to affect the final realized prices.
Q3 adjusted net earnings rose 52% to a record $1.39 billion ($1.39 per share) compared to adjusted net earnings of $912 million ($0.93 per share) in the prior year period, reflecting higher gold and copper realized prices and higher copper sales volumes. Q3 adjusted net earnings translate to an annualized return on equity of approximately 25%. Q3 reported net earnings were $1.37 billion ($1.37 per share) before net adjustments of approximately $20 million. Q3 EBITDA increased 47% to $2.46 billion from $1.67 billion in the same prior year period. Q3 operating cash flow rose 35% to a record $1.89 billion from $1.40 billion in the prior year period and adjusted operating cash flow increased 33% to $1.92 billion from $1.44 billion in Q3 2010.
“Today, the Company reported another strong quarter of operational and financial results,” said Aaron Regent, Barrick’s President and CEO. “We remain on track to achieve our original full year operating targets including one of the lowest cash cost profiles amongst the senior gold producers. We are making good progress constructing our high return Pueblo Viejo and Pascua-Lama mines and are pleased with further positive exploration results at Goldrush and Red Hill, our new gold discoveries in Nevada.”
The North America region continued to perform well in Q3, producing 0.84 million ounces at total cash costs of $415 per ounce. The Cortez property performed on plan with production of 0.35 million ounces at total cash costs of $230 per ounce in Q3. The Cortez Hills open pit continues to be in a higher waste stripping phase, which is expected to result in lower production in Q4 before it returns to a higher grade area in Q1 2012.
The Goldstrike operation produced 0.26 million ounces at total cash costs of $516 per ounce in Q3 as it transitioned to a higher stripping phase in the second half of 2011 as previously disclosed. Full year 2011 production guidance for the North America region is expected to be 3.30-3.40 million ounces, within the previous guidance range, at the previous total cash cost guidance of $425-$450 per ounce.
| | | | |
| BARRICK THIRD QUARTER 2011 | | 2 | | PRESS RELEASE |
The South American business unit performed ahead of plan with production of 0.48 million ounces at total cash costs of $358 per ounce in Q3. Lagunas Norte production of 0.22 million ounces at total cash costs of $260 per ounce was ahead of plan, primarily due to changes in mine sequencing, which resulted in higher production in Q3, which had previously been anticipated in Q4. Veladero contributed 0.22 million ounces at total cash costs of $380 per ounce in Q3. In 2011, the South America region is expected to produce 1.85-1.90 million ounces at total cash costs of $360-$380 per ounce, within the previous production and cost guidance ranges.
The Australia Pacific business unit produced 0.47 million ounces at total cash costs of $609 per ounce in Q3. The Porgera mine, which produced 0.13 million ounces at total cash costs of $545 per ounce, was impacted by lower underground production, primarily due to equipment availability issues and unplanned maintenance. The Australia Pacific region is expected to produce about 1.90 million ounces in 2011, within the previous guidance range, at the previous total cash cost guidance of $610-$635 per ounce.
Attributable production from African Barrick Gold plc in Q3 was 0.14 million ounces at total cash costs of $687 per ounce. Barrick’s share of 2011 production is expected to be 0.515-0.560 million ounces at total cash costs of $675-$700 per ounce.
Q3 copper production of 140 million pounds at total cash costs of $1.91 per pound included the first full quarter of production from the newly acquired Lumwana mine in Zambia, which produced 75 million pounds at total cash costs of $2.13 per pound. Lumwana is expected to produce about 155 million pounds of copper at total cash costs of $1.95-$2.10 per pound from June 1 until year end. Production and cash cost guidance for 2011 reflects the impact of plant availability issues, lower grades primarily related to dilution, the mill shut down for maintenance in Q4 previously scheduled for Q1 2012, and higher costs related to labor and power. Areas of focus at Lumwana include mill de-bottlenecking, pit re-optimization, changes to mine sequencing, dilution control, equipment availability and leveraging Barrick’s supply chain agreements. An infill drill program at the producing Malundwe deposit is underway to
improve dilution control and more accurately model ore body characteristics. The Zaldívar copper mine in Chile produced 65 million pounds at total cash costs of $1.67 per pound in Q3 and is expected to produce approximately 300 million pounds of copper at $1.40-$1.50 per pound in 2011. Zaldívar’s Q3 performance was impacted by unplanned primary crusher maintenance which affected throughput. In 2011, the Company’s total copper production is expected to be 450-460 million pounds, which is slightly lower than the previous guidance of 455-475 million pounds. Total copper cash costs in 2011 are expected to be $1.60-$1.70 per pound, within the previous guidance range of $1.55-$1.70 per pound. In 2012, copper total cash costs are anticipated to be higher due to inflationary cost pressures and the impact of a full year of production from Lumwana.
Utilizing option collar strategies, the Company put in place floor protection on substantially all of the remaining expected copper production for 2011 at an average floor price of approximately $3.45 per pound, with upside participation to an average of approximately $4.85 per pound6. The Company also put in place floor protection on just under half of the expected copper production for 2012 at an average floor price of $3.75 per pound and has sold call options on approximately 40% of the expected 2012 production at an average price of approximately $5.50 per pound7. The remaining copper production is subject to market prices.
Approximately 60% of Barrick’s consolidated production costs are denominated in US dollars. The Company’s largest single currency exposure is the Australian dollar/US dollar exchange rate. Barrick is hedged on substantially all of the expected remaining Australian expenditures in 2011 and the expected 2012 Australian expenditures at effective average rates of $0.76 and $0.82, respectively, and also has substantial coverage for the following two years at rates at or below $0.80.
6 The realized price on remaining 2011 production is expected to be reduced by $0.06/lb as a result of the net premium paid on these positions.
7 The realized price on 2012 production is expected to be reduced by $0.12/lb asa result of the net premium paid on these positions.
| | | | |
| BARRICK THIRD QUARTER 2011 | | 3 | | PRESS RELEASE |
The Company has also mitigated the impact of higher oil prices through the use of financial contracts and production from Barrick Energy such that a $10 change in WTI crude oil prices is only expected to impact 2011, 2012 and 2013 total cash costs by about $1 per ounce. The Barrick Energy contribution, along with the financial contracts, provides hedge protection for approximately 80% of expected remaining 2011 fuel consumption and approximately 90% of expected 2012 and 2013 fuel consumption. Financial contracts also provide substantial hedge coverage in 2014 and production from Barrick Energy is expected to continue to provide long term natural offsets to changes in energy prices.
INCREASING GOLD AND COPPER RESERVES AND RESOURCES THROUGH EXPLORATION8 AND SELECTIVE ACQUISITIONS
Barrick’s 2011 exploration guidance is $370-$390 million and is weighted towards resource additions and reserve conversion at and around mine sites, while also providing for earlier stage exploration to support longer term growth for the Company. Major exploration programs are underway in all regions, with the focus on Nevada and the Lumwana property.
In Nevada, recent drilling continues to expand the mineralization at Red Hill and Goldrush. The Company’s confidence in the potential and continuity of the mineralization has increased. In addition, infill drilling between both deposits is successfully finding new mineralization and there is the possibility that the two deposits will merge into a single deposit. Step out holes north of Red Hill have intersected mineralization a further 2,000 feet beyond the currently outlined resource as well as extended mineralization at least 1,000 feet to the southwest. Highlights of major step-out drilling include 120 feet at 0.17 ounces per ton (opt), 60 feet at 0.20 opt, 80 feet at 0.16 opt, and 30 feet at 0.25 opt. Step-out drilling south of Goldrush is now underway to test the southern extension of the
8 Barrick’s exploration programs are designed and conducted under the supervision of Robert Krcmarov, Senior Vice President, Global Exploration of Barrick. For information on the geology, exploration activities generally, and drilling and analysis procedures on Barrick’s material properties, see Barrick’s most recent Annual Information Form/Form 40-F on file with Canadian provincial securities regulatory authorities and the U.S. Securities and Exchange Commission.
mineralized zone. A total of 264,000 feet of drilling is planned at Red Hill and Goldrush in 2011 and the program is approximately 80% complete.
At the 75%-owned Turquoise Ridge operation in Nevada, work is advancing on the potential to develop a large scale open pit in order to mine the lower grade halo around the high grade underground ore, which could significantly increase annual production. A prefeasibility study is expected to be completed by the end of 2012. Nine drill rigs are currently active on the property. The focus of open pit drilling is on upgrading resources and mineral inventory. Surface drilling has intersected significant new mineralization, particularly in the south area of the planned pit where the cover is shallower, which could positively impact economics. Underground drilling is also yielding strong results, intersecting higher grades than expected in some areas and zones are open up-dip and to the northwest.
At Lumwana, drilling activity has been ramped up with 11 drill rigs active and an additional four rigs being mobilized. Areas of focus include resource definition drilling at Chimiwungo to convert inferred resources into indicated resources as well as extensional drilling to expand the mineralization. Drilling across the in-pit portion of Chimiwungo East commenced in September and results received from initial drill holes indicate the thickness of the shoot is increasing, in line with expectations. Barrick is advancing an expansion study that could potentially double processing rates. An induced polarization survey is underway in the Chimiwungo South/Mutoma area and a drill program is planned to commence in Q4 2011 to test the potential for shallow mineralization in this area.
INVESTING IN AND DEVELOPING HIGH RETURN PROJECTS IN CONSTRUCTION
Barrick has targeted growth in production to approximately 9 million ounces of gold within the next five years9. Total cash costs are expected to benefit from its large, low cost projects, primarily Pueblo Viejo and Pascua-Lama, as these mines
9 The target of 9 Moz of annual production within five years reflects a current assessment of the expected production and timeline to complete and commission Barrick’s projects currently in construction (Pueblo Viejo and Pascua-Lama) and the Company’s current assessment of existing mine site opportunities, some of which are sensitive to metal price and various capital and input cost assumptions.
| | | | |
| BARRICK THIRD QUARTER 2011 | | 4 | | PRESS RELEASE |
come on stream. Once at full capacity, these two mines are expected to contribute 1.4-1.5 million ounces of average annual production over the first full five years of operation at low cash costs.
At the Pueblo Viejo project in the Dominican Republic, first production is anticipated in mid-2012. Barrick’s share of annual gold production in the first full five years of operation is expected to average 625,000-675,000 ounces at total cash costs of $275-$300 per ounce10.
Total mine construction capital is estimated at $3.6-$3.8 billion10 (100%), or $2.2-$2.3 billion (Barrick’s 60% share) of which 80% has been committed at the end of the third quarter. Overall construction at the Pueblo Viejo project is now more than 75% complete. Remediation of the starter tailings dam progressed during Q3 with the Company in receipt of all necessary approvals to allow construction of the dam to its full height. At the end of the third quarter, brick lining of all four autoclaves was completed. Nearly all of the concrete has been poured, about 95% of the steel has been erected and more than 7.6 million tonnes of ore have been stockpiled. Work continues toward achieving key milestones, including the connection of power to the site.
As part of a longer-term, optimized power solution for Pueblo Viejo, the Company is advancing a plan to construct a dual fuel power plant at an estimated incremental cost of approximately $300 million (100% basis) or $180 million (Barrick’s share). The power plant would commence operations utilizing heavy fuel oil, but have the ability to subsequently transition to lower cost liquid natural gas. The new plant is expected to provide lower cost, long term power to the project.
Pascua-Lama is a high quality, world class resource, expected to achieve first production in mid-2013. Average annual gold production is expected to be 800,000-850,000 ounces in its first full five years of operation at negative total cash costs of $225-$275 per ounce11, assuming a silver price of $25 per ounce. Average annual silver
10 Based on gold and oil price assumptions of$1,300/oz and $90/bbl, respectively.
11 Based on gold, silver and oil price assumptions of $1,300/oz, $25/oz, and $90/bbl, respectively and assuming a Chilean peso f/x rate of 475:1.
production for the first full five years is expected to be about 35 million ounces. For every $1 per ounce increase in the silver price, total cash costs are expected to decrease by approximately $35 per ounce over this period. Total mine construction capital is estimated at $4.7-$5.0 billion11, with approximately 50% of the capital committed at the end of the third quarter. In Chile, earthworks are about 80% complete. In Argentina, good progress was made on earthworks, which are approximately 60% complete at the end of Q3. Civil concrete works continue for the structures at the stockpile, grinding and pebble crusher areas, and have started in the Merrill Crowe process plant area. Concrete and steel works continued on the processing facilities in the third quarter.
At the Barriales camp in Chile, the former exploration camp has been demolished and construction is nearing completion on various facilities. The Los Amarillos camp in Argentina, which is targeted to house about 5,500 beds, currently houses 2,680 beds, with a targeted capacity of 3,500 beds to be completed by year end.
The Jabal Sayid copper project in Saudi Arabia is expected to enter production in the second half of 2012 at a total capital cost of approximately $400 million. Initial production is expected from Lode 2 and total average annual copper production is expected to be 100-130 million pounds over the first full five years of operation. Good potential exists for material extensions to known deposits and new discoveries from an ongoing evaluation of the entire Jabal Sayid site. Current exploration is focused on testing Lode 4 at depth, where mineralization has been intersected in several previous drill holes, including an intercept of 111 meters at 2.67% copper. Several geophysical surveys are also in progress.
At the end of the third quarter, construction is over 60% complete with more than 70% of the capital committed. Bulk earthworks are about 85% complete, underground services are more than 50% complete and concrete poured is 90% complete.
| | | | |
| BARRICK THIRD QUARTER 2011 | | 5 | | PRESS RELEASE |
PROJECTS IN FEASIBILITY
At the Cerro Casale project in Chile, the Environmental Impact Assessment was submitted in the third quarter. The permitting process is anticipated to be approximately 18 months, at which time Barrick will consider a construction decision and commence detailed engineering. Exploration programs will continue in parallel with completing basic engineering and permitting. Discussions with the government and meetings with local communities and indigenous groups are continuing in conjunction with these activities.
Barrick’s 75% share of average annual production is anticipated to be 750,000-825,000 ounces of gold and 190-210 million pounds of copper in the first full five years of operation at total cash costs of $125-$175 per ounce12. Estimated total mine construction capital is approximately $6 billion (100% basis)12.
At the 50%-owned Donlin Gold project in Alaska, feasibility study revisions, which include updated costs and the utilization of natural gas, are being finalized for submission to the Board of Donlin Gold LLC in Q4 2011. Mine construction capital is expected to be approximately $6 billion (100% basis) with an additional $1 billion (100% basis) for the construction of a natural gas pipeline, which is anticipated to lower long term power costs and offer a better environmental and operational solution for power connection to the site. Permitting is expected to commence in the first half of 2012.
At the Reko Diq copper-gold project, in which Barrick holds a 37.5% interest, the Supreme Court of Pakistan affirmed the jurisdiction of the provincial Government of Baluchistan (GoB) to grant the mining license in the third quarter. In September 2011, the GoB informed Tethyan Copper Company (TCC), the project company, that it considered the mining lease application to be incomplete and unsatisfactory. TCC has recently responded to the government’s comments on the application and will take appropriate steps to
| 12 | Based on gold, copper and oil price assumptions of $1,300/oz, $3.25/lb and $90/bbl, respectively and assuming a Chilean peso f/x rate of 475:1. |
protect its interest in the property, including through international arbitration if necessary.
At the 50%-owned Kabanga nickel project in Tanzania, the draft feasibility study is being reviewed by the partners. The Environmental Impact Assessment is expected to be submitted in Q4 2011. Preliminary engineering will continue for the remainder of 2011, as well as initiating negotiations to develop a Mineral Development Agreement with the Tanzanian government, prior to making a construction decision in the second half of 2012.
RETURNING CAPITAL TO SHAREHOLDERS
At September 30, 2011, Barrick had a cash balance of $3 billion13 and $1 billion available for drawdown under its credit facilities, as well as the gold industry’s highest credit rating. The Company generated approximately $4.3 billion in adjusted operating cash flow in the first nine months of 2011. Barrick’s strong earnings and operating cash flows, combined with its positive outlook on the gold price, enables it to continue to make high return investments in its project pipeline and also increase the dividend. The Board of Directors has authorized a quarterly dividend of 15 cents per share, which represents a 25% increase from the previous dividend. Over the last five years, Barrick has had a consistent track record of returning capital to shareholders, increasing its dividend by more than 170% on a quarterly basis14. The quarterly dividend is payable on December 15, 2011 to shareholders on record as of the close of business on November 30, 2011.
* * * *
Barrick’s vision is to be the world’s best gold company by finding, acquiring, developing and producing quality reserves in a safe, profitable and socially responsible manner. Barrick’s shares are traded on the Toronto and New York stock exchanges.
| 13 | Includes $525 million cash held at ABG, which may not be readily deployed outside ABG. It also includes $6 million held at Pueblo Viejo as a result of the first and second draw on the project financing. These funds are to be used to fund the further construction of the project and are not readily deployable by Barrick for other purposes. |
| 14 | The declaration and payment of dividends remains at the discretion of the Board of Directors and will depend on the Company’s financial results, cash requirements, future prospects and other factors deemed relevant by the Board. |
| | | | |
| BARRICK THIRD QUARTER 2011 | | 6 | | PRESS RELEASE |
Key Statistics
| | | | | | | | | | | | | | | | |
Barrick Gold Corporation (in United States dollars) | | Three months ended September 30, | | | Nine months ended September 30, | |
(Unaudited) | | 2011 | | | 2010 | | | 2011 | | | 2010 | |
| | | | |
Operating Results | | | | | | | | | | | | | | | | |
Gold production (thousands of ounces)1 | | | 1,928 | | | | 2,060 | | | | 5,862 | | | | 6,065 | |
Gold sold (thousands of ounces) | | | 1,908 | | | | 1,949 | | | | 5,685 | | | | 5,911 | |
Per ounce data | | | | | | | | | | | | | | | | |
Average spot gold price | | $ | 1,702 | | | $ | 1,227 | | | $ | 1,534 | | | $ | 1,178 | |
Average realized gold price2 | | | 1,743 | | | | 1,237 | | | | 1,550 | | | | 1,184 | |
Net cash costs2 | | | 328 | | | | 298 | | | | 325 | | | | 297 | |
Total cash costs2 | | | 453 | | | | 403 | | | | 445 | | | | 399 | |
Depreciation3 | | | 153 | | | | 141 | | | | 149 | | | | 138 | |
Other4 | | | 16 | | | | 7 | | | | 16 | | | | 6 | |
Total production costs | | | 622 | | | | 551 | | | | 610 | | | | 543 | |
Copper credits | | | 125 | | | | 105 | | | | 120 | | | | 102 | |
Copper production (millions of pounds) | | | 140 | | | | 84 | | | | 308 | | | | 286 | |
Copper sold (millions of pounds) | | | 146 | | | | 90 | | | | 309 | | | | 288 | |
Per pound data | | | | | | | | | | | | | | | | |
Average spot copper price | | $ | 4.07 | | | $ | 3.29 | | | $ | 4.20 | | | $ | 3.25 | |
Average realized copper price2 | | | 3.54 | | | | 3.43 | | | | 3.87 | | | | 3.20 | |
Total cash costs2 | | | 1.91 | | | | 1.12 | | | | 1.65 | | | | 1.10 | |
Depreciation3 | | | 0.29 | | | | 0.25 | | | | 0.27 | | | | 0.22 | |
Total production costs | | | 2.20 | | | | 1.37 | | | | 1.92 | | | | 1.32 | |
| | | | |
Financial Results(millions) | | | | | | | | | | | | | | | | |
Revenues | | $ | 4,007 | | | $ | 2,788 | | | $ | 10,523 | | | $ | 7,990 | |
Net earnings5 | | | 1,365 | | | | 942 | | | | 3,525 | | | | 2,621 | |
Adjusted net earnings2 | | | 1,385 | | | | 912 | | | | 3,506 | | | | 2,499 | |
EBITDA2 | | | 2,460 | | | | 1,669 | | | | 6,378 | | | | 4,751 | |
Operating cash flow | | | 1,889 | | | | 1,397 | | | | 4,014 | | | | 3,635 | |
Adjusted operating cash flow2 | | | 1,918 | | | | 1,441 | | | | 4,295 | | | | 3,719 | |
Per Share Data (dollars) | | | | | | | | | | | | | | | | |
Net earnings (basic) | | | 1.37 | | | | 0.96 | | | | 3.53 | | | | 2.66 | |
Adjusted net earnings (basic)2 | | | 1.39 | | | | 0.93 | | | | 3.51 | | | | 2.54 | |
Net earnings (diluted) | | | 1.36 | | | | 0.94 | | | | 3.52 | | | | 2.63 | |
Weighted average basic common shares (millions) | | | 1,000 | | | | 986 | | | | 999 | | | | 985 | |
Weighted average diluted common shares (millions)6 | | | 1,001 | | | | 998 | | | | 1,001 | | | | 997 | |
Return on equity2 | | | 25% | | | | 21% | | | | 22% | | | | 20% | |
| | | | | | | | | As at
September 30, | | | As at
December 31, | |
| | | | | | | | | 2011 | | | 2010 | |
Financial Position(millions) | | | | | | | | | | | | | | | | |
Cash and equivalents | | | | | | | | | | $ | 2,965 | | | $ | 3,968 | |
Non-cash working capital | | | | | | | | | | | 1,991 | | | | 1,696 | |
Adjusted debt2 | | | | | | | | | | | 13,049 | | | | 6,392 | |
Net debt2 | | | | | | | | | | | 10,086 | | | | 2,427 | |
Average shareholders’ equity | | | | | | | | | | | 20,924 | | | | 17,352 | |
1 Production includes our equity share of gold production at Highland Gold. 2 Realized price, net cash costs, total cash costs, adjusted net earnings, EBITDA, adjusted operating cash flow, adjusted debt, net debt and return on equity are non-GAAP financial performance measures with no standard definition under IFRS. See pages 55-62 of the Company’s MD&A. 3 Represents equity amortization expense divided by equity ounces of gold sold or pounds of copper sold. 4 Represents the impact of Barrick Energy and realized gains and losses on non-hedge commodity contracts at the Company’s producing mines divided by equity ounces of gold sold or pounds of copper sold. 5 Net earnings represents net income attributable to the equity holders of the Company. 6 Fully diluted includes dilutive effect of stock options and convertible debt. | |
| | | | |
| BARRICK THIRD QUARTER 2011 | | 7 | | SUMMARY INFORMATION |
Production and Cost Summary
| | | | | | | | | | | | | | | | | | | | | | | | | | | | | | | | |
| | | Gold Production (attributable ounces) (000’s) | | | Total Cash Costs($/oz) | |
| | | Three months ended
September 30, | | | Nine months ended
September 30, | | | Three months ended
September 30, | | | Nine months ended
September 30, | |
| (Unaudited) | | 2011 | | | 2010 | | | 2011 | | | 2010 | | | 2011 | | | 2010 | | | 2011 | | | 2010 | |
| | | | | | | | | | | | | |
North America | | | 836 | | | | 929 | | | | 2,621 | | | | 2,413 | | | $ | 415 | | | $ | 394 | | | $ | 405 | | | $ | 426 | |
South America | | | 475 | | | | 518 | | | | 1,426 | | | | 1,743 | | | | 358 | | | | 213 | | | | 358 | | | | 196 | |
Australia Pacific | | | 472 | | | | 483 | | | | 1,394 | | | | 1,454 | | | | 609 | | | | 587 | | | | 601 | | | | 567 | |
African Barrick Gold3 | | | 135 | | | | 122 | | | | 391 | | | | 431 | | | | 687 | | | | 618 | | | | 666 | | | | 552 | |
Other | | | 10 | | | | 8 | | | | 30 | | | | 24 | | | | 475 | | | | 494 | | | | 475 | | | | 494 | |
| |
Total | | | 1,928 | | | | 2,060 | | | | 5,862 | | | | 6,065 | | | $ | 453 | | | $ | 403 | | | $ | 445 | | | $ | 399 | |
| |
| | |
| | | Copper Production (attributable pounds) (Millions) | | | Total Cash Costs($/lb) | |
| | | Three months ended September 30, | | | Nine months ended September 30, | | | Three months ended
September 30, | | | Nine months ended
September 30, | |
| | | | | | | | | | | | | | | | |
(Unaudited) | | | 2011 | | | | 2010 | | | | 2011 | | | | 2010 | | | | 2011 | | | | 2010 | | | | 2011 | | | | 2010 | |
| | | | | | | | | | | | | |
South America | | | 65 | | | | 78 | | | | 209 | | | | 236 | | | | 1.67 | | | $ | 1.12 | | | $ | 1.44 | | | $ | 1.08 | |
Australia Pacific | | | 75 | | | | 6 | | | | 99 | | | | 50 | | | | 2.13 | | | | 1.11 | | | | 2.08 | | | | 1.19 | |
| | | | | | | | | | | | | | | | | | | | | | | | | | | | | | | | | |
Total | | | 140 | | | | 84 | | | | 308 | | | | 286 | | | $ | 1.91 | | | $ | 1.12 | | | $ | 1.65 | | | $ | 1.10 | |
| | | | | | | | | | | | | | | | | | | | | | | | | | | | | | | | | |
| | | | | | | | | | | | | | | | | | |
| | | Total Gold Production Costs ($/oz) | |
| | | Three months ended
September 30, | | | | | Nine months ended
September 30, | |
| | | | | | | | | | |
| | | | | | | | | | |
(Unaudited) | | | 2011 | | | | 2010 | | | | | | 2011 | | | | 2010 | |
Direct mining costs at market foreign exchange rates | | $ | 500 | | | $ | 398 | | | | | $ | 493 | | | $ | 396 | |
Gains realized on currency hedge and commodity hedge/economic hedge contracts | | | (58 | ) | | | (11 | ) | | | | | (53 | ) | | | (10 | ) |
Adjustments to direct mining costs2 | | | (16 | ) | | | (7 | ) | | | | | (16 | ) | | | (6 | ) |
By-product credits | | | (18 | ) | | | (11 | ) | | | | | (18 | ) | | | (14 | ) |
Copper credits | | | (125 | ) | | | (105 | ) | | | | | (120 | ) | | | (102 | ) |
| | | | | | | | | | | | | | | | | | | |
Cash operating costs, net basis | | | 283 | | | | 264 | | | | | | 286 | | | | 264 | |
Royalties | | | 45 | | | | 34 | | | | | | 39 | | | | 33 | |
| | | | | | | | | | | | | | | | | | | |
Net cash costs1 | | | 328 | | | | 298 | | | | | | 325 | | | | 297 | |
Copper credits | | | 125 | | | | 105 | | | | | | 120 | | | | 102 | |
| | | | | | | | | | | | | | | | | | | |
Total cash costs1 | | | 453 | | | | 403 | | | | | | 445 | | | | 399 | |
Depreciation | | | 153 | | | | 141 | | | | | | 149 | | | | 138 | |
Adjustments to direct mining costs2 | | | 16 | | | | 7 | | | | | | 16 | | | | 6 | |
| | | | | | | | | | | | | | | | | | | |
Total production costs | | $ | 622 | | | $ | 551 | | | | | $ | 610 | | | $ | 543 | |
| | | | | | | | | | | | | | | | | | | |
| | | | | | | | | | | | | | | | | | |
| | | Total Copper Production Costs ($/lb) | |
| |
| Three months ended
September 30, |
| | | |
| Nine months ended
September 30, |
|
| | | | | | | | | | |
| | | | | | | | | | |
(Unaudited) | | | 2011 | | | | 2010 | | | | | | 2011 | | | | 2010 | |
Cash operating costs | | $ | 1.83 | | | $ | 1.11 | | | | | $ | 1.60 | | | $ | 1.08 | |
Royalties | | | 0.08 | | | | 0.01 | | | | | | 0.05 | | | | 0.02 | |
| | | | | | | | | | | | | | | | | | | |
Total cash costs1 | | | 1.91 | | | | 1.12 | | | | | | 1.65 | | | | 1.10 | |
Depreciation | | | 0.29 | | | | 0.25 | | | | | | 0.27 | | | | 0.22 | |
| | | | | | | | | | | | | | | | | | | |
Total production costs | | $ | 2.20 | | | $ | 1.37 | | | | | $ | 1.92 | | | $ | 1.32 | |
| | | | | | | | | | | | | | | | | | | |
| 1 | Total cash costs and net cash costs are non-GAAP financial performance measures with no standard meaning under IFRS. See page 57 of the Company’s MD&A. |
| 2 | Represents realized gains and losses on non-hedge currency and commodity contracts and the impact of Barrick Energy’s net contribution |
| 3 | Figures relating to African Barrick Gold are presented on a 100% basis up to March 31, 2010 and a 73.9% basis thereafter, which reflects our equity share of production. |
| | | | |
| BARRICK THIRD QUARTER 2011 | | 8 | | SUMMARY INFORMATION |
MANAGEMENT’S DISCUSSION ANDANALYSIS (“MD&A”)
This portion of the Quarterly Report provides management’s discussion and analysis (“MD&A”) of the financial condition and results of operations to enable a reader to assess material changes in financial condition and results of operations as at and for the three and nine month periods ended September 30, 2011, in comparison to the corresponding prior-year periods. The MD&A is intended to help the reader understand Barrick Gold Corporation (“Barrick”, “we”, “our” or the “Company”), our operations, financial performance and present and future business environment. This MD&A, which has been prepared as of October 26, 2011, is intended to supplement and complement the unaudited interim consolidated financial statements and notes thereto, prepared in accordance with International Financial Reporting Standards (“IFRS”), for the three and nine month periods ended September 30, 2011 (collectively, the “Financial Statements”), which are included in this Quarterly Report on pages 63 to 110. You are encouraged to review the Financial Statements in conjunction with your review of this MD&A. This MD&A should be read in conjunction with both the annual audited consolidated financial statements for the three years ended December 31, 2010, prepared in accordance
with United States Generally Accepted Accounting Principles (“US GAAP”), the related annual MD&A included in the 2010 Annual Report, and the most recent Form 40-F/Annual Information Form on file with the US Securities and Exchange Commission (“SEC”) and Canadian provincial securities regulatory authorities. Certain notes to the Financial Statements are specifically referred to in this MD&A and such notes are incorporated by reference herein. All dollar amounts in this MD&A are in millions of US dollars, unless otherwise specified.
For the purposes of preparing our MD&A, we consider the materiality of information. Information is considered material if: (i) such information results in, or would reasonably be expected to result in, a significant change in the market price or value of our shares; or (ii) there is a substantial likelihood that a reasonable investor would consider it important in making an investment decision; or (iii) it would significantly alter the total mix of information available to investors. We evaluate materiality with reference to all relevant circumstances, including potential market sensitivity.
CAUTIONARY STATEMENT ON FORWARD-LOOKING INFORMATION
Certain information contained or incorporated by reference in this MD&A, including any information as to our strategy, project plans or future financial or operating performance, constitutes “forward-looking statements”. All statements, other than statements of historical fact, are forward-looking statements. The words “believe”, “expect”, “anticipate”, “contemplate”, “target”, “plan”, “intend”, “continue”, “budget”, “estimate”, “may”, “will”, “schedule” and similar expressions identify forward-looking statements. Forward-looking statements are necessarily based upon a number of estimates and assumptions that, while considered reasonable by the Company, are inherently subject to significant business, economic and competitive uncertainties and contingencies. Known and unknown factors could cause actual results to differ materially from those projected in the forward-looking statements. Such factors include, but are not limited to: fluctuations in the market and forward price of gold and copper or certain other commodities (such as silver, diesel fuel and electricity); the impact of global liquidity and credit availability on the timing of cash flows and the values of assets and liabilities based on projected future cash flows; fluctuations in the currency markets (such as Canadian and Australian dollars, Chilean and Argentinean peso, British pound, Peruvian sol, Zambian Kwacha and Papua New Guinean kina versus US dollar);
changes in US dollar interest rates that could impact the mark-to-market value of outstanding derivative instruments and ongoing payments/receipts under interest rate swaps and variable rate debt obligations; risks arising from holding derivative instruments (such as credit risk, market liquidity risk and mark-to-market risk); changes in national and local government legislation, taxation, controls, regulations and political or economic developments in Canada, the United States, Dominican Republic, Australia, Papua New Guinea, Chile, Peru, Argentina, Tanzania, Zambia, Saudi Arabia, United Kingdom, Pakistan or Barbados or other countries in which we do or may carry on business in the future; business opportunities that may be presented to, or pursued by, the Company; our ability to successfully integrate acquisitions; operating or technical difficulties in connection with mining or development activities; employee relations; availability and increased costs associated with mining inputs and the construction of capital projects; litigation; the speculative nature of exploration and development, including the risks of obtaining necessary licenses and permits; diminishing quantities or reserve grades; adverse changes in our credit rating; contests over title to properties, particularly title to undeveloped properties; and the organization of our previously held African gold operations and properties under a separate listed
| | | | |
| BARRICK THIRD QUARTER 2011 | | 9 | | MANAGEMENT’S DISCUSSION AND ANALYSIS |
company. In addition, there are risks and hazards associated with the business of exploration, development and mining, including environmental hazards, industrial accidents, unusual or unexpected formations, pressures, cave-ins, flooding and gold bullion or copper cathode losses (and the risk of inadequate insurance, or inability to obtain insurance, to cover these risks). Many of these uncertainties and contingencies can affect our actual results and could cause actual results to differ materially from those expressed or implied in any forward-looking statements made by, or on behalf of, us. Readers are cautioned that forward-looking statements are not
guarantees of future performance. All of the forward-looking statements made in this MD&A are qualified by these cautionary statements. Specific reference is made to the most recent Form 40-F/Annual Information Form on file with the SEC and Canadian provincial securities regulatory authorities for a discussion of some of the factors underlying forward-looking statements. We disclaim any intention or obligation to update or revise any forward-looking statements whether as a result of new information, future events or otherwise, except to the extent required by applicable law.
| | | | |
| INDEX | | | | |
| |
| | | page | |
Financial and Operating Highlights | | | | |
2011 Third Quarter Results | | | 11 | |
Business Developments, Outlook and Market Review | | | 13 | |
| |
Financial and Operating Results | | | | |
Summary of Operating Results | | | 21 | |
Key Operating Performance Metrics | | | 22 | |
Summary Cash Flow Performance | | | 25 | |
Review of Operating Segment Results | | | 27 | |
| |
Financial Condition Review | | | | |
Balance Sheet Review | | | 35 | |
Liquidity and Cash Flow | | | 37 | |
Financial Instruments | | | 39 | |
Contractual Obligations and Commitments | | | 41 | |
| |
Review of Quarterly Results | | | 42 | |
| |
International Financial Reporting Standards (IFRS) | | | 43 | |
| |
IFRS Critical Accounting Policies and Accounting Estimates | | | 51 | |
| |
Non -GAAP Financial Performance Measures | | | 55 | |
| | | | |
| BARRICK THIRD QUARTER 2011 | | 10 | | MANAGEMENT’S DISCUSSION AND ANALYSIS |
FINANCIAL AND OPERATING HIGHLIGHTS
Summary of Financial and Operating Data
| | | | | | | | | | | | | | | | |
| | | For the three months ended
September 30 | | | For the nine months ended
September 30 | |
| ($ millions, except where indicated) | | 2011 | | | 2010 | | | 2011 | | | 2010 | |
Financial Data | | | | | | | | | | | | | | | | |
Revenue | | | $ 4,007 | | | | $ 2,788 | | | | $ 10,523 | | | | $ 7,990 | |
Net earnings1 | | | 1,365 | | | | 942 | | | | 3,525 | | | | 2,621 | |
Per share (“EPS”)2 | | | 1.37 | | | | 0.96 | | | | 3.53 | | | | 2.66 | |
Adjusted net earnings3 | | | 1,385 | | | | 912 | | | | 3,506 | | | | 2,499 | |
Per share (“adjusted EPS”)2,3 | | | 1.39 | | | | 0.93 | | | | 3.51 | | | | 2.54 | |
EBITDA3 | | | 2,460 | | | | 1,669 | | | | 6,378 | | | | 4,751 | |
Capital expenditures | | | 1,514 | | | | 907 | | | | 3,653 | | | | 2,467 | |
Operating cash flow | | | 1,889 | | | | 1,397 | | | | 4,014 | | | | 3,635 | |
Adjusted operating cash flow3 | | | 1,918 | | | | 1,441 | | | | 4,295 | | | | 3,719 | |
Cash and equivalents | | | | | | | | | | | 2,965 | | | | 4,281 | |
Adjusted debt3 | | | | | | | | | | | 13,049 | | | | 7,272 | |
Net debt3 | | | | | | | | | | | $ 10,086 | | | | $ 3,116 | |
Return on equity3 | | | 25% | | | | 21% | | | | 22% | | | | 20% | |
| | | | | | | | | | | | | | | | |
Operating Data | | | | | | | | | | | | | | | | |
| | | | |
Gold | | | | | | | | | | | | | | | | |
Gold produced (000s ounces)4 | | | 1,928 | | | | 2,060 | | | | 5,862 | | | | 6,065 | |
Gold sold (000s ounces) | | | 1,908 | | | | 1,949 | | | | 5,685 | | | | 5,911 | |
Realized price ( $ per ounce)3 | | | $ 1,743 | | | | $ 1,237 | | | | $ 1,550 | | | | $ 1,184 | |
Net cash costs ($ per ounce)3 | | | $ 328 | | | | $ 298 | | | | $ 325 | | | | $ 297 | |
Total cash costs ($ per ounce)3 | | | $ 453 | | | | $ 403 | | | | $ 445 | | | | $ 399 | |
| | | | |
Copper | | | | | | | | | | | | | | | | |
Copper produced (millions of pounds) | | | 140 | | | | 84 | | | | 308 | | | | 286 | |
Copper sold (millions of pounds) | | | 146 | | | | 90 | | | | 309 | | | | 288 | |
Realized price ( $ per pound)3 | | | $ 3.54 | | | | $ 3.43 | | | | $ 3.87 | | | | $ 3.20 | |
Total cash costs ($ per pound)3 | | | $ 1.91 | | | | $ 1.12 | | | | $ 1.65 | | | | $ 1.10 | |
| 1 | Net earnings represent net income attributable to the equity holders of the Company. |
| 2 | Calculated using weighted average number of shares outstanding under the basic method. |
| 3 | Adjusted net earnings, adjusted operating cash flow , adjusted EPS, EBITDA, adjusted debt, net debt, return on equity, realized price, net cash costs and total cash costs are non-GAAP financial performance measures with no standardized definition under IFRS. For further information and a detailed reconciliation, please see pages 55 - 62 of this MD&A. |
| 4 | Production includes our equity share of gold production at Highland Gold. |
THIRD QUARTER FINANCIAL AND OPERATING HIGHLIGHTS
| • | | Net earnings and adjusted net earnings for the quarter were $1,365 million and $1,385 million, respectively, which represent significant increases from the net earnings of $942 million and adjusted net earnings of $912 million recorded in the same prior year period. The increases in net earnings and adjusted net earnings were largely driven by higher market gold and copper prices along with higher copper sales volumes, which were partially offset by lower gold sales volumes, higher cost of sales applicable to gold and copper and higher income tax expense. Net earnings for the current quarter were also impacted negatively by provisional pricing adjustments, which reduced copper revenues by $58 million due to a significant drop in copper market price at the end of September 2011. |
| • | | EPS and adjusted EPS for the third quarter 2011 were $1.37 and $1.39, up significantly compared to EPS of $0.96 and adjusted EPS of $0.93 for the third quarter 2010. The increases were due to the increase in both net earnings and adjusted net earnings. |
| | | | |
| BARRICK THIRD QUARTER 2011 | | 11 | | MANAGEMENT’S DISCUSSION AND ANALYSIS |
| • | | EBITDA for the third quarter 2011 was $2,460, million up significantly compared to EBITDA of $1,669 million for the third quarter 2010. The increase in EBITDA reflects the same factors affecting net earnings, except for income tax expense. |
| • | | Operating cash flow was $1,889 million, up $492 million or 35% compared to the third quarter 2010. The increase in operating cash flow was primarily driven by higher net earnings levels, partially offset by higher income taxes paid. |
| • | | Significant adjusting items in the third quarter include: $49 million in gains from the sale of assets; partially offset by $14 million in asset impairment charges, a $28 million tax charge in Peru related to a Peruvian Tax Court decision, as well as $32 million in inventory purchase accounting adjustments attributable to the Equinox acquisition. |
| • | | Gold production and sales volumes for third quarter 2011 were 1.93 million ounces and 1.91 million ounces, respectively. In third quarter 2010, gold production and sales volumes were 2.1 million and 1.9 million ounces, respectively. The decrease in production volume compared to the prior year period is primarily due to lower production in North America, South America and Australia Pacific, partially offset by slightly higher production by ABG. |
| • | | Total cash costs for gold were $453 per ounce, up $50 per ounce or 12% compared to the third quarter 2010. The increase reflects higher total cash costs across all regions as a result of increasing direct mining costs, including higher labor, energy, maintenance and consumables costs. Net cash costs were $328 per ounce in third quarter 2011, an increase of $30 per ounce or 10% compared to the same prior year period. The increase in total cash costs were partially mitigated by higher copper credits. |
| • | | Copper production and total cash costs for the third quarter 2011 were 140 million pounds and $1.91 per pound respectively, compared to production of 84 million pounds and total cash costs of $1.12 per pound for third quarter 2010. Copper production increased for the third quarter 2011 primarily due to production at Lumwana, acquired as part of the Equinox transaction, partially offset by lower production from Zaldivar. Total cash costs per pound increased in 2011 due to the inclusion of Lumwana production in the sales mix as well as lower production from Zaldivar at higher cash costs. |
FIRST NINE MONTHS 2011 vs. FIRST NINE MONTHS 2010
| • | | Net earnings and adjusted net earnings for the nine month period of 2011 were $3,525 million and $3,506 million, respectively, which represent significant increases from the net earnings of $2,621 million and adjusted net earnings of $2,499 million recorded in the nine month period of 2010. The increase in net earnings and adjusted net earnings was largely driven by higher market gold and copper prices as well as higher copper sales volumes, partially offset by lower gold sales volumes, higher cost of sales applicable to gold and copper and higher income tax expense. |
| • | | EPS and adjusted EPS for the nine month period of 2011 were $3.53 and $3.51, up significantly compared to EPS of $2.66 and adjusted EPS of $2.54 for the nine month period of 2010. The increases were due to the increase in both net earnings and adjusted net earnings. |
| • | | EBITDA for the nine month period of 2011 was $6,378 million, compared to EBITDA of $4,751 million for the nine month period of 2010. The increase in EBITDA reflects the same factors affecting net earnings, except for income tax expense. |
| • | | Operating cash flow was $4,014 million, up $379 million or 10% compared to the nine month period ended September 30, 2010. Adjusted operating cash flow was $4,295 million, up $576 million or 15% compared to the nine month period ended September 30, 2010. The increase in operating cash flow and adjusted operating cash flow were primarily due to higher net earnings levels, partially offset by higher income tax payments, including tax payments totaling about $480 million made in 2011 related to the final 2010 income tax liability. |
| • | | Significant adjusting items in the nine month period include: $182 million in gains from sale of assets; partially offset by $115 million in acquisition related costs including inventory purchase accounting adjustments attributable to the Equinox acquisition, $18 million in asset impairment charges, a $28 million tax charge in Peru related to a Peruvian Tax Court decision, and a $23 million charge for the recognition of a liability for contingent consideration related to the acquisition of an additional 40% of the Cortez property in 2008. |
| • | | Gold production and sales volumes for the nine month period of 2011 were 5.86 million ounces and 5.69 million ounces, respectively. In the nine month period of 2010, gold production and sales volumes were 6.07 million and 5.91 million ounces, respectively. The slight decrease in production volume compared to the prior year period is primarily due to lower production in South America, which was partially offset by higher production in North America. |
| • | | Total cash costs for gold were $445 per ounce, up $46 per ounce or 12% compared to the nine month period of 2010. The increase reflects higher total cash costs in South America, Australia Pacific and ABG; partially offset by lower total cash costs in North America. Net cash costs were $325 per ounce in the nine month period of 2011, an increase of $28 per ounce or 9% compared to the same prior year period. The increase in total cash costs was partially mitigated by higher copper credits. |
| | | | |
| BARRICK THIRD QUARTER 2011 | | 12 | | MANAGEMENT’S DISCUSSION AND ANALYSIS |
| • | | Copper production and total cash costs for the nine month period of 2011 were 308 million pounds and $1.65 per pound respectively, compared to production of 286 million pounds and total cash costs of $1.10 per pound for the nine month period of 2010. Copper production increased for the nine month period of 2011 primarily due to production from Lumwana, acquired as part of the Equinox transaction, partially offset by decreased production from Zaldívar and the impact of the Osborne divestiture in third quarter 2010. Total cash costs per pound increased in 2011 due to the inclusion of Lumwana production in the sales mix as well as lower production from Zaldívar mine at higher total cash costs. |
Business Developments
Adoption of IFRS
We adopted IFRS effective January 1, 2011. The financial results discussed in this MD&A were prepared in accordance with IFRS, including the relevant prior year comparative amounts. Under IFRS, certain costs such as production phase waste stripping costs and exploration and evaluation costs can be capitalized where there is probable future economic benefit. As a result, the conversion to IFRS resulted in a decrease in operating costs, an increase in net assets and an increase in operating cash flow and capital expenditures compared to equivalent results if presented in accordance with US GAAP. For a discussion of our significant accounting policies, refer to note 2 of the Consolidated Financial Statements.
Economic, Fiscal, Legislative and Regulatory Developments
The current global economic situation has impacted Barrick in a number of ways. The response from many governments to the ongoing economic crisis has led to continuing low interest rates and a reflationary environment that has been generally supportive of higher commodity prices. Gold and copper market prices, (refer to Market Review section of this MD&A for more details) have been key drivers of higher income and operating cash flows for Barrick. In the third quarter, the market prices for these metals were extremely volatile. In particular, copper prices declined significantly at the end of the third quarter, closing at $3.23 per pound, which was down from a quarterly high of $4.46 per pound.
The fiscal pressures currently experienced by many governments have resulted in a search for new sources of revenues, and the mining industry, which is generating significant profits and cash flow in this high metal price environment, is facing the possibility of higher income taxes and royalties. The proposed Australian Mineral Resources Rent Tax (“MRRT”) is one example. While the MRRT has been greatly revised to its current form, and is no longer expected to apply to our gold operations, we continue to monitor developments related to this proposal. In addition, in order to finance reconstruction stemming from the devastating 2010 earthquake, the Chilean government enacted a temporary first tier
income tax increase from 17% to 20% in 2011 and 18.5% in 2012 as well as a new elective mining royalty. In January 2011, we adopted the new royalty. The impact on the Company of the temporary income tax rate increase and the elective mining royalty on 2011 income tax expense is expected to be about $20 million and $15 million, respectively.
The Peruvian government enacted new tax legislation, effective October 1, 2011, which will apply specifically to mining operations. The tax rates will apply differently depending on whether or not a mining company has a stabilization agreement in effect. The impact to the Company from the new tax legislation is expected to be an increase in income tax expense of $12 million in fourth quarter 2011. On an annualized basis, we expect income tax expense to increase by about $20 million per year over the next couple of years.
In September 2011, Zambia elected a new leader, Michael Sata of the Patriotic Front party. President Sata is currently in the process of forming his government. Part of Mr. Sata’s campaign platform was to ensure the state receives more economic benefits from its mining sector. We have not received any official notice of changes to the taxation regime and continue to monitor the situation and engage in discussions with the new administration.
On October 26, 2011, the Argentinean government announced they will require companies to repatriate their export revenues. We are currently assessing the potential impact of this announcement on our Argentinean operations and projects.
On the legislative front, Argentina passed a federal glacier protection law in October 2010 that restricts mining in areas on or near the nation’s glaciers. Our activities do not take place on glaciers, and are undertaken pursuant to existing environmental approvals issued on the basis of comprehensive environmental impact studies that fully considered potential impacts on water resources, glaciers and other sensitive environmental areas around Veladero and Pascua-Lama. We have a comprehensive range of measures in place to protect such areas and resources. Further, we believe that the new federal law is unconstitutional, as it seeks to
| | | | |
| BARRICK THIRD QUARTER 2011 | | 13 | | MANAGEMENT’S DISCUSSION AND ANALYSIS |
legislate matters that are within the constitutional domain of the provinces. The Province of San Juan, where our operations are located, previously enacted glacier protection legislation with which we comply. We believe we are legally entitled to continue our current activities on the basis of existing approvals. In this regard, the Federal Court in San Juan has granted injunctions, based on the unconstitutionality of the federal law, suspending its application in the Province and in particular to Veladero and Pascua-Lama pending consideration of the constitutionality of the law by the Supreme Court of Argentina. It is possible that others may attempt to bring legal challenges seeking to restrict our activities based on the new federal law. We will vigorously oppose any such challenges.
The Australian government recently announced details of its proposed carbon tax scheme, which will commence on July 1, 2012. We have completed a preliminary assessment and expect the impact of complying with the legislation, to be an increase in our total cash costs of about $3 per ounce on a consolidated basis and about $12 per ounce for the regional business unit on an annualized basis.
Acquisitions and Divestitures
Acquisition of Equinox Minerals Limited
In April 2011, we announced an offer to acquire all of the issued and outstanding common shares of Equinox Minerals Limited (“Equinox”) for an all-cash offer of C$8.15 per share. This strategic, all-cash transaction, was accomplished without issuing equity or diluting our shareholders exposure to gold and has added two attractive assets to our portfolio, which improve our leverage to copper. By June 1, 2011, we had acquired 83% of the shares, thus obtaining control. We began consolidating operating results, including cash flows, from this date onwards. By July 19, 2011, we had acquired 100% of the issued and outstanding common shares for total cash consideration of $7.482 billion. Equinox’s primary asset is the Lumwana copper mine, a high-quality, long-life property in the highly prospective Zambian Copperbelt region. Equinox’s other significant asset is the Jabal Sayid copper project in Saudi Arabia, which is currently in development and is expected to enter production in 2012. This acquisition was funded through our existing cash balances and $6.5 billion in new debt, as described below. Following the Equinox acquisition, operating guidance was updated to include production from Lumwana, as well as capital expenditures expected at both Lumwana and Jabal Sayid in 2011. The contribution of Equinox operations has been consolidated into Barrick’s results from June 1, 2011 onwards.
In April 2011, we secured a new $2 billion revolving credit facility with an interest rate of LIBOR plus 1.25%. In June 2011, we drew $1 billion on this credit facility. In May 2011, we drew $1.5 billion on our previously existing revolving credit facility, which has an interest rate of LIBOR plus 0.30%. In June 2011, we issued an aggregate of $4.0 billion in debt securities comprised of: $700 million of 1.75% notes due 2014; $1.1 billion of 2.90% notes due 2016; $1.35 billion of 4.40% notes due 2021; and $850 million of 5.70% notes due 2041. Guidance for interest expense in 2011 has been updated for these debt issuances.
The acquisition of Equinox for cash consideration of $7.482 billion has substantially changed the our liquidity position, with an increase in net debt from $2.1 billion at March 31, 2011 to $10.1 billion, and a net debt to equity ratio of 0.45:1 at September 30, 2011.
Barrick Energy Acquisition
In 2011, our oil and gas subsidiary, Barrick Energy, completed two acquisitions. In June 2011, Barrick Energy acquired all of the outstanding shares of Venturion Natural Resources Limited (“Venturion”), for approximately $185 million. In July 2011, Barrick Energy acquired all of the outstanding shares of Culane Energy Corp (“Culane”), for approximately $68 million. These acquisitions were made to acquire additional producing assets, proven and probable reserves as well as facilities to allow us to grow and expand our energy business. Barrick Energy provides a natural economic hedge against our fuel price exposure.
Sale of assets
In August 2011, we completed the sale of our interest in the Fenn-Gib project to Lake Shore Gold Corp for share considerations and, in September 2011, we completed the sale of our 70% interest in the Pinson Mine to Atna Resources Ltd, for cash and share considerations. We recorded gains of approximately $62 million from the sales of these two properties in third quarter 2011.
Growth Projects
Lumwana exploration
Our recently acquired Lumwana copper mine has excellent potential for both brownfield and greenfield resource growth. We have an extensive 18 month exploration program and drilling activity has been ramped up with 11 drill rigs active and an additional four rigs being mobilized. Areas of focus include resource definition drilling at Chimiwungo to convert inferred resources into indicated resources as well as extensional drilling to expand the mineralization. In addition, we are advancing an expansion study that could potentially double processing rates.
| | | | |
| BARRICK THIRD QUARTER 2011 | | 14 | | MANAGEMENT’S DISCUSSION AND ANALYSIS |
Gold discoveries in Nevada
In September 2011, we reported two significant gold discoveries, known as Red Hill and Goldrush, on our 100%-owned Cortez property in Nevada. Since then, our confidence in the potential and continuity of the mineralization has increased. In addition, in-fill drilling between both deposits is successfully finding new mineralization and there is the possibility that the two deposits will merge into a single deposit. These two discoveries highlight opportunities that we have created through our exploration program and demonstrate our long-term commitment to exploration.
Turquoise Ridge expansion
At the 75%-owned Turquoise Ridge operation in Nevada, work is advancing on the potential to develop a large scale open pit in order to mine the lower grade halo around the high grade underground ore, which could significantly increase annual production. A prefeasibility study is expected to be completed by the end of 2012. Nine drill rigs are currently active on the property. The focus of open pit drilling is on upgrading resources and mineral inventory and surface drilling has intersected significant new mineralization, particularly in the south area of the planned pit where the cover is shallower, which could positively impact economics. Underground drilling is also yielding strong results, intersecting higher grades than expected in some areas and zones are open up-dip and to the northwest.
Donlin Gold update
Feasibility study revisions that include updated costs and the utilization of natural gas are expected to be completed in fourth quarter 2011. Early indications suggest total mine construction capital will be about $6 billion (100% basis), with an additional $1 billion (100% basis) for the construction of a natural gas pipeline.
Cerro Casale permitting
In third quarter 2011, we submitted the Environmental Impact Assessment. The permitting process is expected to take about 18 months, at which time we will consider a construction decision and commence detailed engineering. Estimated pre-production capital is about $6.0 billion (100% basis), as announced in our second quarter 2011 report.
Reko Diq mining lease
In September 2011, the Government of Baluchistan (“GoB”) informed Tethyan Copper Company (“TCC”), the project company, that it considered the mining lease application to be incomplete and unsatisfactory. TCC has recently responded to the government’s comments on the application and will take appropriate steps to protect its interest in the property, including through international arbitration if necessary.
| | | | |
| BARRICK THIRD QUARTER 2011 | | 15 | | MANAGEMENT’S DISCUSSION AND ANALYSIS |
Full year 2011 Outlook1
| | | | |
| ($ millions, except per ounce/pound data ) | | 2011 E | |
Gold production and costs | | | | |
Production (millions of ounces) | | | 7.6 - 7.8 | |
Cost of sales | | | 5,100 - 5,300 | |
Gold unit production costs | | | | |
Total cash costs ($ per ounce)2 | | | 460 - 475 | |
Net cash costs ($ per ounce)3,4 | | | 330 - 350 | |
Depreciation ($ per ounce)5 | | | 150 - 155 | |
Copper production and costs | | | | |
Production (millions of pounds)6 | | | 450 - 460 | |
Cost of sales7 | | | 910 - 980 | |
Copper unit production costs | | | | |
Total cash costs ($ per pound)8 | | | 1.60 - 1.70 | |
Depreciation on ($ per pound)9 | | | 0.40 - 0.45 | |
Other depreciation10 | | | 40 - 45 | |
Exploration on and evaluation on expense11 | | | 360 - 370 | |
Exploration on | | | 230 - 240 | |
Evaluation on12 | | | ~130 | |
Corporate administration | | | 160 - 170 | |
Other expense13 | | | 375 - 390 | |
Other income | | | 25 - 30 | |
Finance income14 | | | 10 - 15 | |
Finance costs15 | | | 200 - 210 | |
Capital expenditures16 | | | | |
Minesite sustaining | | | 1,050 -1,100 | |
Open pit and underground mine | | | | |
development | | | 950 - 1,000 | |
Minesite expansion | | | 675 - 725 | |
Capital projects | | | 2,600 - 2,700 | |
Effective income tax rate | | | ~33 | % |
| 1 | Our latest 2011 E is consistent with our previously announced guidance except as noted below. |
| 2 | Narrowed full year guidance range from $450 - $480 per ounce previously. |
| 3 | We have increased our guidance from $290 - $320 per ounce principally due to lower copper credits expected as a result of decreased copper market prices. |
| 4 | Assumes a market copper price of $3.25 per pound for fourth quarter 2011, which will result in a realized price of about $3.40 per pound, including the impact of our copper collars. |
| 5 | Narrowed full year guidance range from $150 - $160 per ounce previously. |
| 6 | We have updated our full year guidance range from 455 - 475 million pounds previously. |
| 7 | We have updated our guidance from $940 - $1,040 million reflecting our latest cost estimates. |
| 8 | Narrowed full year guidance range from $1.55 - $1.70 per pound previously. |
| 9 | Narrowed full year guidance range from $0.35 - $0.50 per pound previously. |
| 10 | Narrowed full year guidance range from $35 - $45 million previously. |
| 11 | Narrowed full year guidance range from $350 - $370 million previously. Total exploration expenditures in 2011 are expected to be about $370 - $390 million including $230 - $240 million in exploration expense and $140 - $150 million in capitalized exploration costs. Capitalized exploration costs are included in the guidance for open pit and underground mine development and minesite expansion. |
| 12 | Narrowed full year guidance range from $120 - $130 million previously. |
| 13 | We have increased our guidance from $340 - $360 million primarily due to increase in Regional Business Unit (“RBU”) costs as well as other costs to support recent acquisitions. |
| 14 | We have lowered our guidance range from $15 - $20 million principally due to higher cash used in investing activities with corresponding lower average cash balances and interest income. |
15 Narrowed full year guidance from $200 - $220 million previously.
| 16 | Our capital expenditures guidance, which represents our equity share, has been adjusted to reflect additional expenditures expected in the balance of 2011. Incremental expenditures relate to minesite expansion activities as well as construction activities at Pascua-Lama. We now expect our full year total capital expenditures to be in the range of $5.3 - $5.5 billion. |
In the third quarter, we narrowed certain of our guidance ranges from the ranges previously published, reflecting the lower expected variability of results in the remainder of the year.
We expect full year gold production to be in the range of 7.6 to 7.8 million ounces and our full year gold total cash costs to be in the range of $460 to $475 per ounce, which is within our original guidance of 7.6 to 8.0 million ounces at $450 to $480 per ounce. Our gold total cash costs are projected to increase in the final quarter of the year as a result of changes in our production mix, with higher cost mine sites contributing a greater share of total company production. We continue to expect our gold cost of sales to be within the range of $5.1 billion to $5.3 billion for the year, in line with our original guidance. We expect our net cash costs per ounce to increase from $290 to $320 per ounce to $330 to $350 per ounce primarily due to lower copper margins as a result of lower market copper prices in the fourth quarter. In 2012, gold production is expected to be comparable to current year’s production levels and total cash costs are expected to be about 10% higher primarily due to inflationary cost pressures, as well as a change in the production mix.
We have updated our full year copper production to be in the range of 450 to 460 million pounds, which is slightly lower than our most recent guidance range of 455 to 475 million pounds issued in the second quarter, primarily due to lower expected production from Lumwana. We have also narrowed our full year total cash costs to be in the range of $1.60 to $1.70 per pound, which is within our most recent guidance range of $1.55 to $1.70 per pound, issued in the second quarter. We have also updated our copper cost of sales to be in the range of $910 to $980 million, reflecting lower production and latest cost estimates. In 2012, copper total cash costs are anticipated to be higher due to inflationary cost pressures and the impact of a full year of production from Lumwana.
We continue to target increasing our gold production to approximately 9 million ounces1 in the next five years. Total cash costs are expected to benefit from our large, low cost projects, primarily Pueblo V iejo and Pascua-Lama, as these mines come on stream. Once at full capacity, these two mines are expected to contribute 1.4-
| 1 | The target of 9 Moz of annual production within five years reflects a current assessment of the expected production and timeline to complete and commission Barrick’s projects currently in construction (Pueblo Viejo and Pascua-Lama) and the Company’s current assessment of existing mine site opportunities, some of which are sensitive to metal price and various capital and input cost assumptions. |
| | | | |
| BARRICK THIRD QUARTER 2011 | | 16 | | MANAGEMENT’S DISCUSSION AND ANALYSIS |
1.5 million ounces of average annual production over the first full five years of operation with costs significantly lower than our overall current total cash costs profile.
Market Review
Gold and Copper Prices
The market prices of gold and copper are the primary drivers of our profitability and our ability to generate free cash flow for our shareholders. During the third quarter, the gold price experienced price volatility greater than any similar period over the last thirty years, with the price ranging from $1,479 to an all-time high of $1,921 per ounce due to continuing economic and political uncertainties. The price of gold closed at $1,620 per ounce, while the average quarterly market price of $1,702 was a new quarterly record and represented a $475 per ounce increase from the $1,227 per ounce average market price in the same prior year period.
Due to concerns about the global economy, accommodative monetary policies put in place by the world’s most prominent central banks, geopolitical issues, and European sovereign debt concerns, gold has continued to attract investor interest through its role as a safe haven investment, store of value and alternative to fiat currency. In addition, the limited choice in alternative safe haven investments and the strength of physical demand are significant drivers of the overall gold market. We expect that a continuation of these trends should be supportive of higher gold prices.
Gold prices also continue to be influenced by long-term trends in global gold mine production and the impact of central bank gold activities. When the International Monetary Fund (“IMF”) completed its previously announced and approved sale of gold in late 2010, no other significant seller of gold emerged from the official sector. In the second year of the current Central Bank Gold Agreement, which ended in September 2011, the signatory members sold only 1 ton of gold, or less than 1% percent of the maximum agreed amount, while the central banks of Mexico, Russia, South Korea and Thailand, among others, have been adding to gold reserves.
Copper prices also experienced significant volatility in the third quarter of 2011, trading in a range of $3.16 per pound to $4.46 per pound. The average price for the third quarter was $4.07 per pound and the closing price was $3.23 per pound. Copper’s strength lies mainly in strong physical demand from emerging markets, especially China, and investor interest in base metals with strong forward-looking supply/demand fundamentals. Concerns about global economic growth,
specifically in relation to lackluster job growth and government austerity measures, caused copper prices to decline significantly towards the end of the third quarter. Copper prices should continue to be positively influenced by demand from Asia, the limited availability of scrap and production levels of mines and smelters in the future. In the near term, expectations of a physical deficit of refined copper in 2011 should be price supportive.
Utilizing option collar strategies, we have put in place floor protection on substantially all of the remaining expected copper production for 2011 at an average floor price of approximately $3.45 per pound, with upside participation to an average of approximately $4.85 per pound. Our realized price on remaining 2011 production is expected to be reduced by $0.06 per pound as a result of the net premium paid on these positions. We have also put in place floor protection on just under half of the expected copper production for 2012 at an average floor price of $3.75 per pound and have sold call options on approximately 40% of our expected 2012 production at an average price of approximately $5.50 per pound. Our realized price on all 2012 production is expected to be reduced by $0.12 per pound as a result of the net premium paid for these positions. Our remaining copper production is subject to market prices.
Silver
Silver prices do not significantly impact our current operating earnings, cash flows or gold total cash costs. Silver prices, however, will have a significant impact on the overall economics for our Pascua-Lama project, which is currently in the construction phase. In the first five full years of production, Pascua-Lama is expected to produce an average of 35 million ounces of silver annually. Each $10 increase in silver price is expected to contribute approximately $260 million to $300 million2 in revenue and pre-tax earnings in each of the first full five years of operation.
In the third quarter, silver prices traded in a wide range from $26.07 per ounce to $44.25 per ounce, averaged an all-time quarterly high of $38.87 per ounce and closed the quarter at $29.93 per ounce. Silver has managed to reach long-term highs due mainly to very strong investment demand, which is driven by factors similar to those influencing investment demand for gold. The physical silver market is currently in surplus and, while continuing global economic growth is expected to improve currently weak industrial demand, investment
| 2 | Includes the impact of the Silver Wheaton transaction, which sold 25% of life of mine silver production at a price that does not fluctuate with market silver prices. Excludes the impact of our silver option collar strategy. |
| | | | |
| BARRICK THIRD QUARTER 2011 | | 17 | | MANAGEMENT’S DISCUSSION AND ANALYSIS |
demand is expected to continue to be the primary driver of prices in the near term.
We have put in place silver price protection on a total of 45 million ounces of expected silver production over the period from 2013 to 2018, utilizing silver option collars with an average floor price of $23 per ounce and an average ceiling price of $57 per ounce. We paid a net premium of $19 million to enter into these positions.
In 2009, we entered into a transaction with Silver Wheaton Corp. (“Silver Wheaton”) whereby we sold 25% of the life-of-mine Pascua-Lama silver production from the earlier of January 1, 2014 or completion of project construction, and 100% of silver production from the Lagunas Norte, Pierina and Veladero mines until that time. Silver Wheaton will make upfront payments totaling $625 million ($488 million received as at September 30, 2011). Silver Wheaton will also make ongoing payments of $3.90 per ounce in cash (subject to a 1% annual inflation adjustment starting three years after completing construction at Pascua-Lama) for each ounce of silver delivered under the agreement. The effective selling price of silver under the agreement is about $13.72 per ounce.
Currency Exchange Rates
The results of our mining operations outside of the United States are affected by US dollar exchange rates. The largest single exposure we have is to the Australian dollar/US dollar exchange rate. We also have exposure to the Canadian dollar through a combination of Canadian mine operating costs and corporate administration costs and exposure to the Chilean peso as a result of the construction of our Pascua-Lama project and mine operating costs. In addition, we have exposure to the Papua New Guinea kina, Peruvian sol, Zambian kwacha and Argentinean peso through mine operating and capital costs.
In third quarter 2011, the US dollar strengthened against our currency exposures toward the end of the quarter, on lower commodity prices and global economic concerns. At the same time, Australia, Canada and Chile each continue to emerge from the global economic crisis better than many other OECD countries. As a result, the Australian dollar, Canadian dollar and Chilean peso still trade at historically strong levels against the currencies of larger developed economies, including the US dollar, Euro, and Japanese yen. In the quarter, the Australian dollar traded in a range of $0.97 to $1.11 against the US dollar, while the US dollar against the Canadian dollar and Chilean peso yielded ranges of $0.94 to $1.05 and CLP 455 to CLP 529, respectively.
In the third quarter, we recorded gains in earnings of approximately $102 million for our Australian, Canadian and Chilean peso hedges, primarily impacting our gold and copper production and corporate administration costs. We are largely hedged for our Australian dollar, Canadian dollar and Chilean peso operating and administrative expenditures for the remainder of 2011 and, consequently, further fluctuations of the US dollar against these currencies should not have a significant impact on our guidance for cash costs or corporate administrative costs. We also have Chilean peso contracts in place to hedge a portion of our capital expenditures at the Pascua-Lama and Cerro Casale projects. For the remainder of the year, we expect to record hedge gains in net earnings of approximately $72 million on our Australian dollar, Canadian dollar and Chilean peso hedge positions assuming average market exchange rates of $0.97, $1.05 and CLP 521, respectively.
| | | | |
| BARRICK THIRD QUARTER 2011 | | 18 | | MANAGEMENT’S DISCUSSION AND ANALYSIS |
AUD Currency Contracts
| | | | | | | | | | |
| | | Contracts (AUD millions) | | Effective average
hedge rate (AUDUSD) | | | % of Expected
AUD Exposure1 | |
20112 | | 416 | | | 0.76 | | | | 92% | |
2012 | | 1,657 | | | 0.82 | | | | 93% | |
2013 | | 967 | | | 0.74 | | | | 53% | |
2014 | | 673 | | | 0.80 | | | | 41% | |
2015 | | 487 | | | 0.92 | | | | 36% | |
2016 | | 287 | | | 0.90 | | | | 37% | |
|
| CAD Currency Contracts | |
| | | Contracts3 (CAD millions) | | Effective average
hedge
rate (USDCAD) | | | % of Expected
CAD Exposure1 | |
20112 | | 88 | | | 1.03 | | | | 77% | |
2012 | | 224 | | | 0.98 | | | | 46% | |
2013 | | 52 | | | 1.00 | | | | 9% | |
|
| CLP Currency Contracts | |
| | | Contracts (CLP millions)4 | | Effective average
hedge
rate (USDCLP) | | | % of Expected
CLP Exposure5 | |
20112 | | 43,170 | | | 508 | | | | 43% | |
2012 | | 157,682 | | | 509 | | | | 42% | |
2013 | | 174,950 | | | 506 | | | | 62% | |
2014 | | 247,200 | | | 502 | | | | 91% | |
| 1 | Includes all forecasted operating, sustainable and eligible project capital expenditures. |
| 2 | Amounts presented represent contracts for the remaining period of 2011. |
| 3 | Includes $256 million CAD con tracts with an average cap and floor of $0.98 and $1.07, respectively. |
| 4 | Includes CLP 558,795 million collar contracts that are an economic hedge of capital expenditures, primarily at our Pascua-Lama and Cerro Casale projects, and certain operating expenditures with a cap and floor of CLP 506 and CLP 584, respectively. |
| 5 | Includes all forecasted operating, sustainable and forecasted project capital expenditures. |
Fuel
Geopolitical tensions in certain oil-producing nations, emerging market demand, concerns over global economic growth and the release of oil by the member countries of the International Energy Agency, combined to create a volatile environment for the price of oil in the third quarter.
The price of West Texas Intermediate (“WTI”) crude oil traded in a wide range of $76 to $101 per barrel in the third quarter, closed at $79 per barrel and averaged $90 per barrel in the quarter, compared to an average of $76 in the same prior year period.
On average, we consume approximately 4.5 million barrels of diesel fuel annually across all our mines. Diesel fuel is refined from crude oil and is therefore subject to similar volatility that affects crude oil prices.
Volatility in fuel prices has a significant direct and indirect impact on our production costs. In order to mitigate this volatility, we employ a strategy of combining the use of financial contracts and our production from Barrick Energy to effectively hedge our exposure to high oil prices. We currently have financial contracts in place totaling 5.3 million barrels, of which 0.6 million are set to mature in 2011 representing approximately 53% of our total estimated direct consumption for the remainder of the year. In the following 3 years, we have contracts for 4.7 million barrels representing approximately 38% of our total estimated direct consumption.
In the third quarter, we recorded a hedge gain of $13 million on our fuel hedge positions (Q3 2010: $8 million loss) and expect to record hedge gains of approximately $12 million for the remainder of 2011 based on an assumed average market WTI crude oil price of $79 per barrel.
For the remainder of 2011, we expect Barrick Energy to produce about 1.1 million boe. The net contribution from the production of Barrick Energy is expected to provide a natural economic offset equivalent to about 0.5 million boe. This Barrick Energy contribution, along with our financial fuel hedges, provides hedge protection for approximately 80% of our estimated remaining fuel consumption for 2011.
Financial Fuel Hedge Summary
| | | | | | | | | | | | |
| | | Barrels1
(thousands) | | | Average Price | | | % of Expected
Exposure | |
20112 | | | 572 | | | $ | 93 | | | | 53% | |
2012 | | | 1,833 | | | | 100 | | | | 42% | |
2013 | | | 1,820 | | | | 86 | | | | 40% | |
2014 | | | 1,020 | | | | 96 | | | | 27% | |
| | | | 5,245 | | | | 93 | | | | 39% | |
| 1 | Refers to contracts for a combination of WTI, ULSD, WTB, MOPS, Brent and JET. Products other than WTI have market prices in excess of WTI due to refining and location premiums. As a result, our average price on hedged barrels for 2011 - 2014 is $86 per barrel on a WTI-equivalent basis. |
| 2 | Amounts presented represent contracts for the remaining period of 2011. |
US Dollar Interest Rates
Beginning in 2008, in response to the contraction of global credit markets and in an effort to spur economic activity and avoid potential deflation, the US Federal Reserve reduced its benchmark rate to between 0% and 0.25%. The benchmark was kept at this level through the third quarter of 2011. During the third quarter, the Federal Open Market Committee of the US Federal Reserve released a statement on monetary policy that noted that economic conditions are likely to warrant
| | | | |
| BARRICK THIRD QUARTER 2011 | | 19 | | MANAGEMENT’S DISCUSSION AND ANALYSIS |
exceptionally low levels for the benchmark rate at least through mid-2013. In addition, we expect the US Federal Reserve to continue to use monetary policy initiatives in an effort to keep long-term interest rates low and increase employment. We expect such initiatives to be followed by incremental increases to short-term rates once economic conditions and credit markets normalize.
At present, our interest rate exposure mainly relates to interest receipts on our cash balances ($3.0 billion at September 30, 2011); the mark-to-market value of derivative instruments; the fair value and ongoing payments under US dollar interest-rate swaps; and to the
interest payments on our variable-rate debt ($3.6 billion at September 30, 2011). Currently, the amount of interest expense recorded in our consolidated statement of income is not materially impacted by changes in interest rates, because the majority of debt was issued at fixed interest rates. The relative amounts of variable-rate financial assets and liabilities may change in the future, depending on the amount of operating cash flow we generate, as well as the level of capital expenditures and our ability to borrow on favorable terms using fixed rate debt instruments.
| | | | |
BARRICK THIRD QUARTER 2011 | | 20 | | MANAGEMENT’S DISCUSSION AND ANALYSIS |
FINANCIAL AND OPERATING RESULTS
Summary of Operating Results
| | | | | | | | | | | | | | | | |
| For the nine months ended September 30 | | For the three months ended September 30 | | | For the nine months ended September 30 | |
| ($ millions, except per share data in dollars) | | 2011 | | | 2010 | | | 2011 | | | 2010 | |
Revenues | | | $ 4,007 | | | | $ 2,788 | | | | $ 10,523 | | | | $ 7,990 | |
Net earnings | | | 1,365 | | | | 942 | | | | 3,525 | | | | 2,621 | |
Per share1 | | | 1.37 | | | | 0.96 | | | | 3.53 | | | | 2.66 | |
Adjusted net earnings2 | | | 1,385 | | | | 912 | | | | 3,506 | | | | 2,499 | |
Per share1 | | | 1.39 | | | | 0.93 | | | | 3.51 | | | | 2.54 | |
EBITDA | | | $ 2,460 | | | | $ 1,669 | | | | $ 6,378 | | | | $ 4,751 | |
| 1 | Calculated using weighted average number of shares outstanding under the basic method. |
Net earnings for the three and nine month periods ended September 30, 2011 were $1,365 million and $3,525 million, respectively, compared to net earnings of $942 million and $2,621 million for the same prior year periods. Adjusted net earnings for the three and nine month periods ended September 30, 2011 were $1,385 million and $3,506 million, respectively, compared to adjusted net earnings of $912 million and $2,499 million for the same prior year periods. The increases in net earnings and adjusted net earnings for the three and nine month periods ended September 30, 2011 were primarily driven by higher realized gold and copper prices, partially offset by higher income tax expense and higher cost of sales applicable to gold and copper. Net earnings for the three month period ended September 30, 2011 were also impacted negatively by provisional pricing adjustments, which resulted in a decrease in copper revenues of $58 million due to a significant drop in the market copper price at the end of September 2011.
Significant adjusting items in the third quarter include: $49 million in gains from sale of assets, partially offset by $14 million in asset impairment charges, a $28 million tax charge in Peru related to a Peruvian Tax Court decision, as well as $32 million in inventory purchase accounting adjustments attributable to the Equinox acquisition. Significant adjusting items for the nine month periods ended September 30, 2011 include the above items along with $133 million in gains from sale of assets. These were partially offset by $83 million in acquisition related costs attributable to the Equinox transaction, including inventory purchase accounting adjustments, and a $23 million charge for the recognition of a liability for contingent consideration related to the acquisition of 40% interest in Cortez property in 2008 that was previously held by Kennecott Explorations (Australia) Ltd, a subsidiary of Rio Tinto plc.
EBITDA was $2,460 million and $6,378 million in the three and nine month periods ended September 30, 2011, respectively, compared to EBITDA of $1,669 million and
$4,751 million in the same prior year periods. The increases in EBITDA primarily reflect the increases in pre-tax earnings.
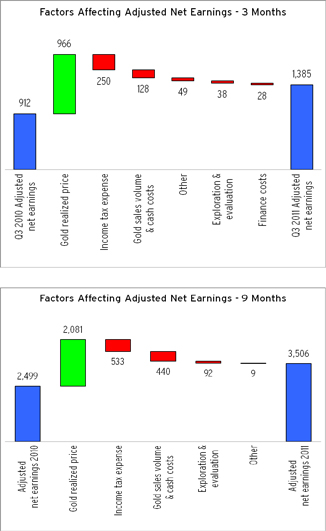
EPS, adjusted EPS and EBITDA for the three month periods ended September 30, 2011 were $1.37, $1.39 and $2,460 million, up 43%, 49% and 47%, respectively, compared to the same prior year period. The increase in EPS, adjusted EPS and EBITDA is primarily due to an
| | | | |
| BARRICK THIRD QUARTER 2011 | | 21 | | MANAGEMENT’S DISCUSSION AND ANALYSIS |
increase in earnings. The following tables illustrate continued trends of growth in EPS, adjusted EPS and EBITDA .
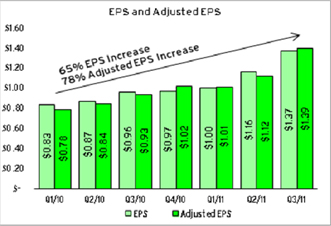
| | | | | | | | | | | | | | | | | | | | | | | | | | | | | | | | |
| Key Operating Performance Metrics | | | | | | | | | | | | |
| | | For the three months ended September 30 | | | For the nine months ended September 30 | |
| | | Gold | | | Copper | | | Gold | | | Copper | |
| ($ millions, except per ounce/pound data in dollars) | | 2011 | | | 2010 | | | 2011 | | | 2010 | | | 2011 | | | 2010 | | | 2011 | | | 2010 | |
Production (000s oz/millions of lbs)1 | | | 1,928 | | | | 2,060 | | | | 140 | | | | 84 | | | | 5,862 | | | | 6,065 | | | | 308 | | | | 286 | |
Revenues | | | | | | | | | | | | | | | | | | | | | | | | | | | | | | | | |
000s oz/millions lbs | | | 1,908 | | | | 1,949 | | | | 146 | | | | 90 | | | | 5,685 | | | | 5,911 | | | | 309 | | | | 288 | |
$ millions2 | | | $ 3,397 | | | | $ 2,467 | | | | $ 523 | | | | $ 270 | | | | $ 9,063 | | | | $ 7,103 | | | | $ 1,210 | | | | $ 733 | |
Market price3 | | | 1,702 | | | | 1,227 | | | | 4.07 | | | | 3.29 | | | | 1,534 | | | | 1,178 | | | | 4.20 | | | | 3.25 | |
Realized price3 | | | 1,743 | | | | 1,237 | | | | 3.54 | | | | 3.43 | | | | 1,550 | | | | 1,184 | | | | 3.87 | | | | 3.20 | |
Cost of sales ($ millions) | | | 1,295 | | | | 1,161 | | | | 388 | | | | 115 | | | | 3,792 | | | | 3,456 | | | | 683 | | | | 318 | |
Total cash costs3 | | | 453 | | | | 403 | | | | $ 1.91 | | | | $ 1.12 | | | | 445 | | | | 399 | | | | $ 1.65 | | | | $ 1.10 | |
Net cash costs3 | | | $ 328 | | | | $ 298 | | | | | | | | | | | | $ 325 | | | | $ 297 | | | | | | | | | |
| 1 | Reflects our equity share of production. |
| 2 | Represents sales on a 100% consolidated basis. |
| 3 | Per ounce/pound weighted average. |
| | | | |
| BARRICK THIRD QUARTER 2011 | | 22 | | MANAGEMENT’S DISCUSSION AND ANALYSIS |
Revenues
In third quarter 2011, gold and copper revenues totaled $3,397 million and $523 million, respectively, up 38% and 94%, respectively, compared to the third quarter 2010, primarily due to higher realized gold and copper prices and higher copper sales volumes, partially offset by lower gold sales volumes. For the nine month period ending September 30, 2011, gold and copper revenues totaled $9,063 million and $1,210 million, respectively, up 28% and 65%, respectively, compared to the same prior period in 2010, due to higher realized gold and copper prices and higher copper sales volumes, partially offset by lower gold sales volumes. The increase in copper sales volumes for the three and nine month periods ended September 30, 2011 was primarily due to production from Lumwana, which was acquired as part of the Equinox transaction in June 1, 2011, partially offset by lower sales from Zaldívar and the divestiture of Osborne in third quarter 2010.
Realized gold prices for the three and nine month periods ended September 30, 2011 were $1,743 per ounce and $1,550 per ounce, respectively, up $506 and $366 per ounce, respectively, compared to same prior year periods. The increase in realized prices reflect the increase in market gold prices, which averaged $1,702 per ounce and $1,534 per ounce, respectively, for the three and nine month periods ended September 30, 2011, compared to market prices gold prices of $1,227 and $1,178 for the same prior year periods. Realized copper prices for the three and nine month periods ended September 30, 2011 were $3.54 per pound and $3.87 per pound, respectively, up 3% and 21%, respectively, compared to the same prior year periods due to higher market prices for copper.
The sales price for copper production is determined provisionally at the date of sale with the final price determined based on market copper prices at a future date set by the customer, generally between one to six months after the initial date of sale. This contractual feature has the character of a commodity derivative. As a result, the invoice prices on these sales are marked-to-market at the balance sheet date based on the forward copper price for the relevant quotational period. All mark-to-market adjustments are recorded in copper sales revenues each reporting period. In the three month period ending September 30, 2011, copper revenues were negatively impacted by provisional pricing adjustments of $58 million due to the significant drop in copper market prices at the end of September 2011. As a result, our realized copper price for third quarter 2011 of $3.54 was below the average market copper price of $4.07 per pound. As at September 30, 2011, there were 82.4 million pounds of copper sales that
were provisionally priced at the closing market copper price of $3.27 per pound, which are expected to be settled by the end of the year. Future changes in market copper prices will continue to affect the final realized prices.
A 10% increase/decrease in copper prices, holding all other variables constant, could increase/decrease revenue by approximately $27 million and net earnings by $19 million based on the volumes of provisionally priced copper sales outstanding as at September 30, 2011.
Realized copper price reconciliation
| | | | |
For the three months ended September 30, 2011 | | | | |
Realized copper price before provisional price adjustments | | | 3.94 | |
Impact of provisional price adjustments | | | 0.40 | |
Realized copper price (per pound) | | | 3.54 | |
Cost of sales
Cost of sales applicable to gold for the three and nine month periods ended September 30, 2011 were $1,295 million and $3,792 million, including depreciation expense of $284 million and $840 million, respectively. This compares to cost of sales of $1,161 million and $3,456 million for the same prior year periods, including depreciation expense of $279 million and $842 million, respectively. The increase over the same prior year periods reflects higher direct mining costs, including higher labor, energy, maintenance and consumables costs; which were partially offset by an increase in capitalized production phase stripping costs.
Cost of sales applicable to copper for the three and nine month periods ended September 30, 2011 were $388 million and $683 million, including depreciation expense of $64 million and $109 million, respectively, for the three and nine month periods. This compares to cost of sales of $115 million and $318 million for the same prior year periods, including depreciation expense of $23 million and $64 million, respectively. The increase reflects the impact of including production from Lumwana, beginning on June 1, 2011, and higher direct mining costs at Zaldívar, primarily due to higher power and sulfuric acid prices; partially offset by lower copper sales volumes at Zaldívar and the divestiture of Osborne at the end of third quarter 2010.
| | | | |
| BARRICK THIRD QUARTER 2011 | | 23 | | MANAGEMENT’S DISCUSSION AND ANALYSIS |
Total cash costs and net cash costs
Gold total cash costs for the three and nine month periods ended September 30, 2011 were $453 per ounce and $445 per ounce, respectively, both up 12% from same prior year periods. The increase reflects the same factors impacting cost of sales applicable to gold, as well as the impact of lower production levels in South America, our lowest cost RBU, which resulted in higher consolidated unit production costs.
Copper total cash costs for the three and nine month periods ended September 30, 2011 were $1.91 per pound and $1.65 per pound, respectively, up 71% and 50%, respectively, from same prior year periods. The increase reflects the same factors impacting cost of sales applicable to copper, as well as the impact of lower average head grades on production levels, which resulted in higher unit production costs.
Gold net cash costs for the three and nine month periods ended September 30, 2011 were $328 per ounce and $325 per ounce, respectively, up 10% and 9%, respectively, over same prior year periods. The increase reflects higher gold total cash costs per ounce, partially offset by higher copper credits due to higher realized copper prices and higher copper sales volumes.
Cash margins
Net cash margins per ounce for the three and nine month periods ended September 30, 2011 were $1,415 per ounce and $1,225 per ounce, respectively, an increase of 51% and 38%, respectively, over the same prior year periods. Total and net cash margins per ounce illustrate the trends in profitability and the impact of fluctuations in realized prices and net cash costs on our ability to generate earnings and operating cash flow.
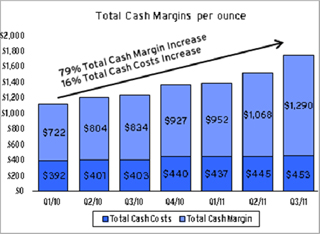
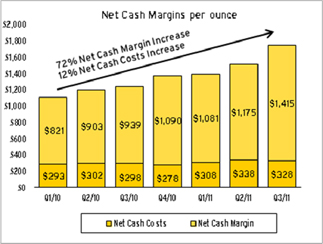
Other operating expenses
Other expense for the three and nine month periods ended September 30, 2011 was $135 million and $391 million, respectively, compared to $96 million and $330 million, respectively, for the same prior year periods. The increase in other expense for the third quarter primarily relates to higher Regional Business Unit (“RBU”) costs as well as higher rehabilitation costs at some of our closed mines. The increase in other expense for the nine month period ended September 30, 2011 was primarily due to a $39 million charge for the recognition of a liability for contingent consideration related to the acquisition of the additional 40% of the Cortez property in 2008 and acquisition related costs for the Equinox transaction, partially offset by lower currency translation losses.
Exploration and evaluation
| | | | | | | | | | | | | | | | |
| | | For the three months ended September 30 | | | For the nine months ended September 30 | |
| | | 2011 | | | 2010 | | | 2011 | | | 2010 | |
Exploration: | | | | | | | | | | | | | | | | |
Minesite programs | | $ | 15 | | | $ | 16 | | | $ | 56 | | | $ | 37 | |
Global programs | | | 46 | | | | 26 | | | | 103 | | | | 70 | |
Evaluation costs | | | 33 | | | | 14 | | | | 89 | | | | 49 | |
Exploration and | | | | | | | | | | | | | | | | |
Evaluation expense | | | 94 | | | | 56 | | | | 248 | | | | 156 | |
Exploration and evaluation (“E&E”) expenditures for the three and nine month periods ended September 30, 2011 were $94 million and $248 million, respectively. This compares to E&E expenditures for the same prior year periods of $56 million and $156 million, respectively.
For the nine month period ended September 30, 2011, minsite exploration expenditures increased primarily due to increased exploration activities at Granny Smith as
| | | | |
| BARRICK THIRD QUARTER 2011 | | 24 | | MANAGEMENT’S DISCUSSION AND ANALYSIS |
well as ABG. Exploration expenditures for the global programs increased for three and nine month periods ended September 30, 2011 primarily due to increased expenditures at Cortez and Lumwana. The evaluation expenditures increase relates to mine expansion studies at Cortez, Bald Mountain, Granny Smith, Cowal and at the Pueblo Viejo project. We expect E&E expenditures of about $190 million, including amounts both expensed and capitalized, in the fourth quarter of the year primarily due to an extensive drilling program at Lumwana.
Interest Expense
| | | | | | | | | | | | | | | | |
| | | For the three months
ended September 30 | | | For the nine months
ended September 30 | |
| | | | |
| (in $ millions) | | 2011 | | | 2010 | | | 2011 | | | 2010 | |
Interest costs | | | | | | | | | | | | | | | | |
Incurred | | | $ 151 | | | | $ 100 | | | | $ 384 | | | | $ 313 | |
Capitalized | | | (99 | ) | | | (76 | ) | | | (276 | ) | | | (196 | ) |
Interest expensed | | | $ 52 | | | | $ 24 | | | | $ 108 | | | | $ 117 | |
Finance costs incurred for the three and nine month periods ended September 30, 2011 were $68 million and $148 million, respectively, compared to $40 million and $153 million for the same prior year periods. Interest costs incurred for the three and nine month periods ended September 30, 2011 were $151 million and $384 million, respectively, up 51% and 23% from $100 million and $313 million, respectively, from same prior year periods. The increase in interest costs incurred primarily relates to the Pueblo Viejo project financing for which drawdowns began at the end of second quarter 2010, as well as interest incurred on debt issued to finance the Equinox acquisition in the second quarter 2011. Interest capitalized beginning in the first quarter 2011 increased significantly over the comparable prior periods primarily due to increased construction activity at our Pueblo Viejo and Pascua-Lama projects.
Income Tax
Income tax expense was $654 million in third quarter 2011. The underlying effective tax rate for income in third quarter 2011 was 31%. Income tax expense was $1,698 million for the nine months ended September 30, 2011. The underlying effective tax rate for the nine months was 33%.
We record deferred tax charges or credits if changes in facts or circumstances affect the estimated tax basis of assets, and therefore the amount of deferred tax assets or liabilities, to reflect changing expectations in our ability to realize deferred tax assets. The interpretation of tax regulations and legislation and their application to our business is complex and subject to change. We have significant amounts of deferred tax assets, including tax
loss carry forwards, and deferred tax liabilities. Our ability to realize deferred tax assets, could significantly affect net income or cash flow in future periods.
As disclosed in Note 23 to the December 31, 2010 financial statements, we filed an appeal with the Tax Court of Peru (“Tax Court”) in respect of a reassessment related to the 2001 to 2003 taxation years. The reassessment mainly related to the validity of a revaluation of the Pierina mining concession. As disclosed in the December 31, 2010 note, we have not previously recorded a provision for this matter.
The Tax Court decision was rendered on July 22, 2011. The Tax Court ruled in our favor on substantially all material issues. However, based on the Tax Court decision, the timing of certain deductions would differ from the position taken on filing. As a result, we would incur interest and penalties in some years and earn refund interest income in other years. We have recorded tax expense of $28 million in third quarter 2011 in respect of this matter. The Tax Court decision is open to appeal by either us or the Peruvian tax authorities.
Summary Cash Flow Performance
| | | | | | | | | | | | | | | | |
| | | For the three months ended September 30 | | | For the nine months ended September 30 | |
($ millions, except per share
data in dollars) | | 2011 | | | 2010 | | | 2011 | | | 2010 | |
| Operating cash flow | | $ | 1,889 | | | $ | 1,397 | | | $ | 4,014 | | | $ | 3,635 | |
| Adjusted operating cash flow | | $ | 1,918 | | | $ | 1,441 | | | $ | 4,295 | | | $ | 3,719 | |
Operating cash flow for the three and nine month periods ended September 30, 2011 month period ended September 30, 2011 were $1,889 million and $4,014 million, respectively, up 35% and 10%, respectively, compared to same prior year periods. The increase in operating cash flow was primarily due to an increase in net earnings due to rising gold and copper prices, partially offset by higher income tax payments.
A $100/ounce increase/decrease in gold prices holding all other variables constant, could increase/decrease operating cash flow by about $500 million on an annualized basis.
| | | | |
| BARRICK THIRD QUARTER 2011 | | 25 | | MANAGEMENT’S DISCUSSION AND ANALYSIS |
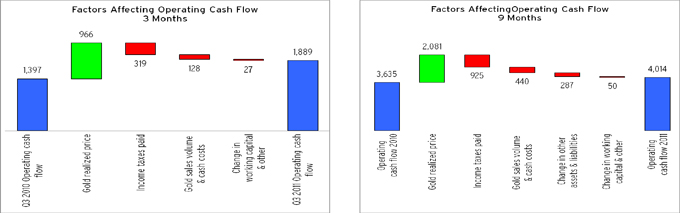
Mining Overview1
| | | | | | | | | | | | | | | | | | | | | | | | |
| | | For the three months ended September 30 | | | For the nine months ended September 30 | |
| | | 2011 | | | 2010 | | | % Change | | | 2011 | | | 2010 | | | % Change | |
Gold | | | | | | | | | | | | | | | | | | | | | | | | |
Ore tons mined (000s) | | | 42,653 | | | | 41,018 | | | | 4% | | | | 111,174 | | | | 117,210 | | | | (5%) | |
Waste tons mined (000s) | | | 136,259 | | | | 133,339 | | | | 2% | | | | 437,123 | | | | 418,765 | | | | 4% | |
Total tons mined (000s) | | | 178,912 | | | | 174,357 | | | | 3% | | | | 548,297 | | | | 535,975 | | | | 2% | |
Ore tons processed (000s) | | | 44,078 | | | | 37,763 | | | | 17% | | | | 121,062 | | | | 111,282 | | | | 9% | |
Average grade (ozs/ton) | | | 0.052 | | | | 0.068 | | | | (24%) | | | | 0.056 | | | | 0.065 | | | | (14%) | |
Recovery rate | | | 84.1% | | | | 80.2% | | | | 5% | | | | 86.5% | | | | 83.9% | | | | 3% | |
Gold produced (000s/oz) | | | 1,928 | | | | 2,060 | | | | (6%) | | | | 5,862 | | | | 6,065 | | | | (3%) | |
Copper | | | | | | | | | | | | | | | | | | | | | | | | |
Ore tons mined (000s) | | | 13,922 | | | | 13,594 | | | | 2% | | | | 35,419 | | | | 39,048 | | | | (9%) | |
Waste tons mined (000s) | | | 30,278 | | | | 4,539 | | | | 567% | | | | 55,416 | | | | 17,332 | | | | 220% | |
Total tons mined (000s) | | | 44,200 | | | | 18,133 | | | | 144% | | | | 90,835 | | | | 56,380 | | | | 61% | |
Ore tons processed (000s) | | | 19,224 | | | | 12,577 | | | | 53% | | | | 41,861 | | | | 38,488 | | | | 9% | |
Average grade ( percent) | | | 0.562 | | | | 0.585 | | | | (4%) | | | | 0.547 | | | | 0.631 | | | | (13%) | |
Copper produced (millions of lbs) | | | 140 | | | | 84 | | | | 67% | | | | 308 | | | | 286 | | | | 8% | |
| 1 | The amounts presented in this table include the results of discontinued operations. |
Production - Gold
Gold production for the three month period ended September 30, 2011 decreased by 6% over the same prior year period, primarily due to lower production in North America, South America and Australia Pacific, partially offset by higher production at ABG. For the nine month period ended September 30, 2011, gold production decreased by 3% over the same prior year period due to lower production in South America, Australia and ABG, partially offset by higher production in North America.
Total tons mined for the three and nine month periods ended September 30, 2011 were, respectively, 3% and 2% higher than the same prior year periods. Ore tons processed for the three and nine month periods ended September 30, 2011 were, respectively, 17% and 9%
higher than the same prior year periods. The increases were primarily due to an increase in tons processed at Bald Mountain, Golden Sunlight, Cortez, and Marigold, partially offset by fewer tons processed at Ruby Hill. Higher tons were processed at Bald Mountain due to an ongoing mine expansion. At Golden Sunlight, higher tons were processed as it recommenced production in 2011 after an extended development phase, which began in 2009. At Cortez, higher tons were processed in 2011 due to a drawdown of stockpiled ore. At Marigold, higher tons were processed in 2011 as mining in 2010 was impacted by a wall failure. At Ruby Hill, fewer ore tons were processed as it has entered a waste stripping phase in the third quarter of 2011.
| | | | |
| BARRICK THIRD QUARTER 2011 | | 26 | | MANAGEMENT’S DISCUSSION AND ANALYSIS |
Production - Copper
Copper production for the three and nine month periods ended September 30, 2011 increased by 67% and 8%, respectively, over the same prior year periods. The increases were primarily due to production from Lumwana, which we acquired as part of the Equinox transaction on June 1, 2011, partially offset by lower production at Zaldivar and the impact of the divestiture of Osborne in third quarter 2010.
Total tons mined for the three and nine month periods ended September 30, 2011 were 144% and 61% higher than the same prior year periods. Ore tons processed for the three and nine month periods ended September 30, 2011 were, respectively, 53% and 9% higher than the same prior year periods. The increase is primarily due to ore tons processed at the Lumwana subsequent to our acquisition on June 1, 2011, partially offset by fewer tons processed at Zaldivar and the impact of the divestiture of Osborne in third quarter 2010.
Review of Operating Segments Results
We report our results of operations using a geographical business unit approach, with producing mines concentrated in three RBUs: North America, South America and Australia Pacific. We also hold a 73.9% equity interest in ABG, which includes our previously held African gold mines and exploration properties. In addition, we have a Capital Projects segment that focuses on managing major capital projects. This structure reflects how we manage our business and how we classify our operations for business planning and measuring performance. In second quarter 2011, we completed the acquisition of Equinox which is comprised of the Lumwana copper mine and the Jabal Sayid development project. The Lumwana mine is in the process of being integrated into our Australia Pacific RBU and the results of the Jabal Sayid development project is included with our Capital Projects segment.
North America
Summary of Financial and Operating Data
| | | | | | | | | | | | | | | | | | | | | | | | |
| | | For the three months ended September 30 | | | For the nine months ended September 30 | |
| | | 2011 | | | 2010 | | | % Change | | | 2011 | | | 2010 | | | % Change | |
Total tons mined (000s) | | | 97,332 | | | | 97,867 | | | | (1%) | | | | 309,994 | | | | 305,395 | | | | 2% | |
Ore tons processed (000s) | | | 17,388 | | | | 12,397 | | | | 40% | | | | 45,045 | | | | 33,804 | | | | 33% | |
Average grade (ozs/ton) | | | 0.054 | | | | 0.092 | | | | (41%) | | | | 0.066 | | | | 0.085 | | | | (22%) | |
Gold produced (000s/oz) | | | 836 | | | | 929 | | | | (10%) | | | | 2,621 | | | | 2,413 | | | | 9% | |
Cost of sales ($ millions) | | | $ 488 | | | | $ 493 | | | | (1%) | | | | $ 1,440 | | | | $ 1,386 | | | | 4% | |
Total cash costs (per oz) | | | $ 415 | | | | $ 394 | | | | 5% | | | | $ 405 | | | | $ 426 | | | | (5%) | |
Segment income ($ millions)1 | | | $ 978 | | | | $ 585 | | | | 67% | | | | $ 2,405 | | | | $ 1,312 | | | | 83% | |
Segment EBITDA ($ millions) | | | $ 1,098 | | | | $ 722 | | | | 52% | | | | $ 2,781 | | | | $ 1,690 | | | | 65% | |
Capital expenditures (millions)2 | | | $ 265 | | | | $ 155 | | | | 71% | | | | $ 647 | | | | $ 396 | | | | 63% | |
| 1 | Segment income excludes income taxes. |
| 2 | Amounts presented represent expenditures for minesite expansion, minesite sustaining as well as open pit and underground mine development on a cash basis excluding capitalized interest. |
Segment EBITDA and segment income increased by $376 million and $393 million, respectively, for the three month period ended September 30, 2011 and by $1,091 million and $1,093 million, respectively, for the nine month period ended September 30, 2011, compared to the same prior year periods. The increases were primarily as a result of higher realized gold prices and sales volumes.
Gold production for the three and nine month periods ended September 30, 2011 was lower by 10% and higher by 9%, respectively, from the same prior year periods. Gold production was lower for the three month period ended September 30, 2011, primarily due to lower production at Goldstrike, mainly due to a waste stripping campaign that resulted in a decrease in tons processed and lower average head grades due to the processing of
lower grade stockpiles. The decrease in production at Goldstrike was partially offset by higher production at Bald Mountain, Cortez, Ruby Hill and Golden Sunlight. Gold production was higher for the nine month period ended September 30, 2011, primarily due to higher production at Bald Mountain, Cortez, Ruby Hill and Golden Sunlight which recommenced producing gold in 2011 after an extended redevelopment phase, which began in 2009. Production at Bald Mountain increased by 117% and 49%, respectively, for the three and nine month periods ended September 30, 2011, over the same prior year periods, mainly due to higher tons mined and processed as a result of a mine expansion. Production at Cortez decreased by 4% for the three month period, and increased by 22% for the nine month period, ended September 30, 2011 over the same prior year periods. For
| | | | |
| BARRICK THIRD QUARTER 2011 | | 27 | | MANAGEMENT’S DISCUSSION AND ANALYSIS |
the nine month period ended September 30, 2011, the increase in production reflects higher volumes processed, partially offset by lower average head grades due to the impact of production at the Cortez Hills open pit operations, which commenced in February 2010. At Ruby Hill, production for the three and nine month periods ended September 30, 2011, increased due to mine sequencing.
Cost of sales for the three and nine month periods ended September 30, 2010 were lower by 1% and higher by 4%, respectively, compared to the same prior year periods. Cost of sales were higher for the nine month period ended September 30, 2011, primarily due to higher direct mining costs, particularly for labor and energy. The increase in direct mining costs was partially offset by an increase in capitalized production phase stripping costs at Goldstrike, Cortez, Bald Mountain and Turquoise Ridge.
Total cash costs were up 5% and down 5%, to $415 per ounce and $405 per ounce, respectively, for the three and nine month periods ended September 30, 2011, compared to the same prior periods. Total cash costs were higher for the three month period ended September 30, 2011 due to lower production levels, particularly at Goldstrike. Total cash costs were lower for the nine month period ended September 30, 2011 due to the impact of higher production levels, particularly at Cortez, which more than offset the increase in direct mining costs.
We have narrowed our full year production for the region to be in the range of 3.30 to 3.40 million ounces, which is within our original guidance range of 3.30 to 3.46 million ounces. We continue to expect our total cash costs to be in the range of $425 to $450 per ounce for the region.
South America
Summary of Financial and Operating Data
| | | | | | | | | | | | | | | | | | | | | | | | |
| | | For the three months ended September 30 | | | For the nine months ended September 30 | |
| Gold | | 2011 | | | 2010 | | | % Change | | | 2011 | | | 2010 | | | % Change | |
Total tons mined (000s) | | | 41,064 | | | | 37,334 | | | | 10% | | | | 122,965 | | | | 111,520 | | | | 10% | |
Ore tons processed (000s) | | | 18,446 | | | | 17,259 | | | | 7% | | | | 51,708 | | | | 51,570 | | | | - | |
Average grade (ozs/ton) | | | 0.035 | | | | 0.043 | | | | (19%) | | | | 0.034 | | | | 0.042 | | | | (19%) | |
Gold produced (000s/oz) | | | 475 | | | | 518 | | | | (8%) | | | | 1,426 | | | | 1,743 | | | | (18%) | |
Cost of sales ($ millions) | | | $ 219 | | | | $152 | | | | 44% | | | | $ 649 | | | | $ 541 | | | | 20% | |
Total cash costs (per oz) | | | $ 358 | | | | $213 | | | | 68% | | | | $ 358 | | | | $ 196 | | | | 83% | |
Segment income ( $ millions)1 | | | $ 491 | | | | $385 | | | | 28% | | | | $ 1,285 | | | | $ 1,352 | | | | (5%) | |
Segment EBITDA ($ millions) | | | $ 547 | | | | $432 | | | | 27% | | | | $ 1,445 | | | | $ 1,530 | | | | (6%) | |
Capital expenditures (millions)2 | | | $ 80 | | | | $89 | | | | (10%) | | | | $ 204 | | | | $ 207 | | | | (1%) | |
Copper | | | | | | | | | | | | | | | | | | | | | | | | |
Copper produced (millions of lbs) | | | 65 | | | | 78 | | | | (17%) | | | | 209 | | | | 236 | | | | (11%) | |
Cost of sales ($ millions) | | | $ 138 | | | | $ 115 | | | | 20% | | | | $ 360 | | | | $ 318 | | | | 13% | |
Total cash costs (per lb) | | | $ 1.67 | | | | $ 1.12 | | | | 49% | | | | $ 1.44 | | | | $ 1.08 | | | | 33% | |
Segment income ( $ millions)1 | | | $ 124 | | | | $ 147 | | | | (16%) | | | | $ 499 | | | | $ 403 | | | | 24% | |
Segment EBITDA ($ millions) | | | $ 143 | | | | $ 170 | | | | (16%) | | | | $ 555 | | | | $ 467 | | | | 19% | |
Capita l expenditures (millions)2 | | | $ 14 | | | | $ 4 | | | | 250% | | | | $ 32 | | | | $ 18 | | | | 78% | |
1 Segment income excludes income taxes.
2 Amounts presented represent expenditures for minesite expansion, minesite sustaining as well as open pit and underground mine development on a cash basis excluding capitalized interest.
Gold
Segment EBITDA and segment income for the gold segment increased by $115 million and $106 million, respectively, in the three month period ended September 30, 2011, primarily as a result of higher realized gold prices, partially offset by higher total cash costs. Segment EBITDA and segment income decreased by $85 million and $67 million, respectively, in the nine month
period ended September 30, 2011, largely due to higher total cash costs and lower sales volumes, which was partially offset by higher realized gold prices.
Gold production for the three and nine month periods ended September 30, 2010 was lower by 8% and 18%, respectively, from the same prior year periods. Gold
| | | | |
| BARRICK THIRD QUARTER 2011 | | 28 | | MANAGEMENT’S DISCUSSION AND ANALYSIS |
production was lower for the three month period ended September 30, 2011, primarily due to lower production at Veladero, due to mining of higher grade areas in the prior year and cold weather causing temporary irrigation difficulties in the current period. The decrease in production at Veladero was partially offset by higher production at Lagunas Norte, as a result of mining higher grade ore with better recovery and improvements in the process plant flow, compared to prior quarter. For the nine month period ended September 30, 2011, the decrease in production reflects lower production at Lagunas Norte and Veladero, due to mine sequencing.
Cost of sales applicable to gold for the three and nine month periods ended September 30, 2011 were higher by 44% and 20%, respectively, from the same prior year periods. The increases were primarily due to higher direct mining costs, largely due to inflationary pressures in Argentina and lower capitalized production phase stripping costs at Veladero.
Total cash costs were $358 per ounce for both the three and nine month periods ended September 30, 2011, up 68% and 83%, respectively, compared to the same prior periods, reflecting higher direct mining costs. For the nine month period ended September 30, 2011, the increase also reflects the impact of lower production levels, particularly from the lower cost Lagunas Norte mine.
We have narrowed our full year production for the region to be in the range of 1.85 to 1.90 million ounces, which is within our original guidance range of 1.80 to 1.94 million ounces. We have also narrowed our total cash cost guidance range to $360 to $380 per ounce, which is within our original guidance range of $350 to $380 per ounce.
Copper
Segment EBITDA and segment income for the copper segment decreased by $27 million and $23 million, respectively, for the three month period ended September 30, 2011, and increased by $88 million and $96 million, respectively, for the nine month period ended September 30, 2011, compared to the same prior year periods. The decreases for the three month period ended September 30, 2011 reflect lower sales volume. The increases for the nine month period ended September 30, 2011 were primarily as a result of higher realized copper prices, partially offset by lower sales volumes and higher total cash costs.
Copper production for the three and nine month periods ended September 30, 2011 was lower by 17% and 11%, respectively, from the same prior year periods primarily due to lower tons processed and average lower grades.
Cost of sales applicable to copper for the three and nine month periods ended September 30, 2011 were higher by 20% and 13%, respectively, from the same prior year periods. The increases were primarily due to higher input prices for fuel, power and sulfuric acid, partially offset by lower depreciation expense as a result of reduced sales volumes. Total cash costs were up 49% and 33%, to $1.67 and $1.44 per pound, respectively, for the three and nine month periods ended September 30, 2011, compared to the same prior year periods, reflecting higher direct production costs and lower production levels.
We continue to expect full year copper production to be around 300 million pounds at total copper cash costs in the range of $1.40 to $1.50 per pound.
| | | | |
| BARRICK THIRD QUARTER 2011 | | 29 | | MANAGEMENT’S DISCUSSION AND ANALYSIS |
Australia Pacific
Summary of Financial and Operating Data
| | | | | | | | | | | | | | | | | | | | | | | | |
| | | For the three months ended September 30 | | | For the nine months ended September 30 | |
| Gold | | 2011 | | | 2010 | | | % Change | | | 2011 | | | 2010 | | | % Change | |
Total tons mined (000s) | | | 30,866 | | | | 30,515 | | | | 1% | | | | 87,229 | | | | 91,754 | | | | (5%) | |
Ore tons processed (000s) | | | 6,560 | | | | 6,565 | | | | - | | | | 19,682 | | | | 20,746 | | | | (5%) | |
Average grade (ozs/ton) | | | 0.083 | | | | 0.084 | | | | (1%) | | | | 0.082 | | | | 0.080 | | | | 3% | |
Gold produced (000s/oz) | | | 472 | | | | 483 | | | | (2%) | | | | 1,394 | | | | 1,454 | | | | (4%) | |
Cost of sales ($ millions) | | | $ 400 | | | | $ 370 | | | | 8% | | | | $ 1,155 | | | | $ 1,090 | | | | 6% | |
Total cash costs (per oz) | | | $ 609 | | | | $ 587 | | | | 4% | | | | $ 601 | | | | $ 567 | | | | 6% | |
Segment income ($ millions)1 | | | $ 401 | | | | $ 208 | | | | 93% | | | | $ 982 | | | | $ 562 | | | | 75% | |
Segment EBITDA ($ millions) | | | $ 481 | | | | $ 275 | | | | 75% | | | | $ 1,198 | | | | $ 765 | | | | 57% | |
Capital expenditures (millions)2 | | | $ 143 | | | | $ 120 | | | | 19% | | | | $ 352 | | | | $ 282 | | | | 25% | |
Copper | | | | | | | | | | | | | | | | | | | | | | | | |
Copper produced (millions of lbs) | | | 75 | | | | 6 | | | | 1,150% | | | | 99 | | | | 50 | | | | 98% | |
Cost of sales ($ millions) | | | $ 250 | | | | - | | | | - | | | | 323 | | | | - | | | | - | |
Total cash costs (per lb) | | | $ 2.13 | | | | $ 1.11 | | | | 92% | | | | $ 2.08 | | | | $ 1.19 | | | | 75% | |
Segment income ($ millions)1 | | | $ 2 | | | | - | | | | - | | | | $ 25 | | | | - | | | | - | |
Segment EBITDA ($ millions) | | | $ 47 | | | | - | | | | - | | | | $ 79 | | | | - | | | | - | |
Capital expenditures (millions)2 | | | $ 83 | | | | - | | | | - | | | | $ 92 | | | | - | | | | - | |
| 1 | Segment income excludes income taxes. |
| 2 | Amounts presented represent expenditures for minesite expansion, minesite sustaining as well as open pit and underground mine development on a cash basis excluding capitalized interest. |
Gold
Segment EBITDA and segment income for the gold segment increased by $206 million and $193 million, respectively, in the three month period ended September 30, 2011 and $433 and $420 million, respectively, in the nine month period ended September 30, 2011, compared to the same prior year periods. The increases were primarily as a result of higher realized gold prices, partially offset by lower sales volumes and higher total cash costs.
Gold production for the three and nine month periods ended September 30, 2011 was lower by 2% and 4%, respectively, from the same prior year periods. These decreases were primarily due to lower production at Cowal, Kanowna, Plutonic, Kalgoorlie and the impact of the divestiture of Osborne in the third quarter of 2010, partially offset by higher production at Yilgarn South and Porgera.
Production at Cowal decreased by 21% and 12% for the three and nine month periods ended September 30, 2011, respectively, compared to the same prior periods, due to the planned mining of lower grade zones of the pit. Production at Kanowna decreased by 9% and 7% for the three and nine month periods ended September 30, 2011, respectively, compared to the same prior periods, due to
lower average head grades resulting from dilution and lower tons processed due to lower mill utilization. Production at Plutonic decreased by 19% and 12% for the three and nine month periods ended September 30, 2011, respectively, compared to the same prior periods, primarily due to lower average head grades. Production at Yilgarn South increased by 8%, both for the three and nine month periods ended September 30, 2011 , compared to the same prior periods, due to better average head grades at Lawlers and higher tons mined and processed at Granny Smith, primarily as a result of the mine expansion.
Cost of sales applicable to gold for the three and nine month periods ended September 30, 2011 were higher by 8% and 6%, respectively, from the same prior year periods. The increases were primarily due to higher costs as a result of a mine expansion at Granny Smith, higher direct mining costs, particularly for labor, energy and diesel, and a decrease in capitalized production phase stripping costs at Porgera and Kalgoorlie.
Total cash costs were up 4% and 6%, to $609 per ounce and $601 per ounce, respectively, for the three and nine month periods ended September 30, 2011, over the same prior periods, reflecting higher direct mining costs and lower production levels.
| | | | |
| BARRICK THIRD QUARTER 2011 | | 30 | | MANAGEMENT’S DISCUSSION AND ANALYSIS |
We have narrowed our full year production for the region to about 1.90 million ounces, which is within our original guidance of 1.85 to 2.0 million ounces as the Porgera mine is being impacted by lower underground production primarily due to equipment availability issues and unplanned maintenance. We continue to expect total cash costs to be in the range of $610 to $635 per ounce for the region.
Copper
The copper segment in Australia Pacific RBU currently consists of the Lumwana copper mine that was acquired as part of the Equinox transaction. In 2010, copper production came from the Osborne mine that was sold in September 2010. The segment’s EBITDA and income was $47 million and $2 million, for the three month period ended September 30, 2011, and $79 million and $25 million, for the nine month periods ended September 30, 2011. Segment EBITDA was negatively affected by provisional pricing adjustments of $41 million in third quarter 2011 and $44 million in inventory purchase accounting adjustments related to the ore that was acquired as part of the acquisition. Segment income was affected by depreciation of fair value increments related to the bump in asset values arising from the preliminary allocation of the purchase price.
Copper production from Lumwana for the three and nine month periods ended September 30, 2011 was 75 million and 99 million pounds, respectively. Cash costs for 2011 have been impacted by plant availability; lower grades, primarily due to dilution; and higher costs related to higher labor and power rates. Areas of focus include mill-de-bottlenecking, pit re-optimization, changes to mine sequencing, dilution control, and higher equipment and plant availability and leveraging Barrick’s supply chain agreements. An infill drill program at the producing Malundwe deposit is underway to improve dilution control and more accurately model ore body characteristics.
Cost of sales applicable to copper for the three and nine month periods ended September 30, 2011 were $250 million and $323 million, respectively. Cost of sales for the nine month period ended September 30, 2011 includes costs related to remaining copper sales from the Osborne operations in the first quarter 2011. Total cash costs for three and nine month period ended September 30, 2011 were $2.13 per pound and $2.08 per pound, respectively.
We have narrowed our production from Lumwana for the period June to December to be about 155 million pounds, which is at the low end of our original guidance range of 155 to 175 million pounds, as the mill will be shut down for maintenance activities originally scheduled for 2012 in the fourth quarter 2011 and lower grade, primarily due to dilution. We have also increased our total cash costs to be in the range of $1.95 to $2.10 per pound, higher than our original guidance of $1.75 to $1.95 per pound, as a result of higher maintenance costs, including the aforementioned mill shut down.
At Lumwana, drilling activity has been ramped up with 11 drill rigs active and an additional four rigs being mobilized. Areas of focus include resource definition drilling at Chimiwungo to convert inferred resources into indicated resources as well as extensional drilling to expand the mineralization. Drilling across the in-pit portion of Chimiwungo East commenced in September and results received from initial drill holes indicate the thickness of the shoot is increasing, in line with expectations. Barrick is advancing an expansion study that could potentially double processing rates. An induced polarization survey is underway in the Chimiwungo South/Mutoma area and a drill program is planned to commence in fourth quarter to test the potential for shallow mineralization in this area.
| | | | |
| BARRICK THIRD QUARTER 2011 | | 31 | | MANAGEMENT’S DISCUSSION AND ANALYSIS |
African Barrick Gold
Summary Financial and Operating Data
| | | | | | | | | | | | | | | | | | | | | | | | |
| | | For the three months ended September 30 | | | For the nine months ended September 30 | |
100% basis | | | 2011 | | | | 2010 | | | | % Change | | | | 2011 | | | | 2010 | | | | % Change | |
Total tons mined (000s) | | | 13,058 | | | | 11,690 | | | | 12% | | | | 38,036 | | | | 33,313 | | | | 14% | |
Ore tons processed (000s) | | | 2,279 | | | | 2,087 | | | | 9% | | | | 6,262 | | | | 6,265 | | | | - | |
Average grade (ozs/ton) | | | 0.092 | | | | 0.092 | | | | - | | | | 0.097 | | | | 0.098 | | | | (1%) | |
Gold produced (000s/oz) | | | 182 | | | | 165 | | | | 10% | | | | 528 | | | | 521 | | | | 1% | |
Cost of sales ($ millions) | | | $ 184 | | | | $ 143 | | | | 29% | | | | $ 530 | | | | $ 422 | | | | 26% | |
Total cash costs (per oz) | | | $ 687 | | | | $ 618 | | | | 11% | | | | $ 666 | | | | $ 552 | | | | 21% | |
Segment income ($ millions)2 | | | $ 139 | | | | $ 62 | | | | 124% | | | | $ 316 | | | | $ 203 | | | | 56% | |
Segment EBITDA ($ millions) | | | $ 175 | | | | $ 88 | | | | 99% | | | | $ 418 | | | | $ 288 | | | | 45% | |
Capital expenditures (millions)3 | | | $ 85 | | | | $ 61 | | | | 39% | | | | $ 202 | | | | $ 148 | | | | 36% | |
| | | | | | | | | | | | | | | | | | | | | | | | |
| | |
| For the three months ended September 30
|
| | | For the nine months ended September 30 | |
73.9% basis1 | | | 2011 | | | | 2010 | | | | % Change | | | | 2011 | | | | 2010 | | | | % Change | |
Total tons mined (000s) | | | 9,650 | | | | 8,639 | | | | 12% | | | | 28,109 | | | | 27,305 | | | | 3% | |
Ore tons processed (000s) | | | 1,684 | | | | 1,542 | | | | 9% | | | | 4,627 | | | | 5,162 | | | | (10%) | |
Average grade (ozs/ton) | | | 0.092 | | | | 0.092 | | | | - | | | | 0.097 | | | | 0.098 | | | | (1%) | |
Gold produced (000s/oz) | | | 135 | | | | 122 | | | | 11% | | | | 391 | | | | 431 | | | | (9%) | |
Cost of sales ($ millions) | | | $ 136 | | | | $ 106 | | | | 28% | | | | $ 392 | | | | $ 350 | | | | 12% | |
Total cash costs (per oz) | | | $ 687 | | | | $ 618 | | | | 11% | | | | $ 666 | | | | $ 552 | | | | 21% | |
Segment income ( $ millions)2 | | | $ 103 | | | | $ 46 | | | | 124% | | | | $ 234 | | | | $ 167 | | | | 40% | |
Segment EBITDA ($ millions) | | | $ 130 | | | | $ 65 | | | | 100% | | | | $ 309 | | | | $ 238 | | | | 30% | |
Capita l expenditures (millions)3 | | | $ 63 | | | | $ 45 | | | | 40% | | | | $ 150 | | | | $ 119 | | | | 26% | |
| 1 | These amounts represent our equity share of results. The dilution of our ownership interest in ABG to approximately 73.9% impacts our operating statistics from second quarter 2010 onwards. |
| 2 | Segment income excludes income taxes. |
| 3 | Amounts presented represent expenditures for minesite expansion, minesite sustaining as well as open pit and underground mine development on a cash basis excluding capitalized interest. |
Segment EBITDA and segment income, on a 100% basis, increased by $87 million and $77 million, respectively, in the three month period ended September 30, 2011, and $130 million and $113 million, respectively, in the nine month period ended September 30, 2011, compared to the same prior year periods. The increases were primarily as a result of higher realized gold prices, partially offset by lower sales volume and higher total cash costs.
Gold production, on a 100% basis, for the three and nine month periods ended September 30, 2011, was up 10% and 1%, respectively, over the same prior year periods. These increases were primarily due to higher production at Buzwagi and Tulawaka, partially offset by lower production at North Mara. Production at Buzwagi increased by 44% and 12% for the three and nine month periods ended September 30, 2011, respectively, over the same prior year periods, reflecting the mining of higher grade ore and higher mill recovery. Production at Tulawaka increased by 29% and 42% for the three and nine month periods ended September 30, 2011, respectively, over the same prior year periods, mainly
due to the mining of higher grade ore. The decrease at North Mara was due to mine sequencing with increased waste stripping in the Gokona and Nyabirama pits, which resulted in the processing of lower grade stockpiles compared to 2010.
Cost of sales, on a 100% basis, for the three and nine month periods ended September 30, 2011, was up 29% and 26%, respectively, from the same prior year periods, primarily due to increase in direct mining costs, which is largely due to inflationary pressures and increased activity. Total cash costs for the three and nine month periods ended September 30, 2011 were up 11% and 21%, respectively, over the same prior year periods as the increase in cost of sales was partially offset by increased production.
We continue to expect full year equity gold production, reflecting our 73.9% ownership of ABG, to be in the range of 0.515 to 0.560 million ounces, but now at total cash costs of $675 to $700 per ounce, reflecting a range of cost pressures across our operations which have exceeded our expectations at the start of the year.
| | | | |
| BARRICK THIRD QUARTER 2011 | | 32 | | MANAGEMENT’S DISCUSSION AND ANALYSIS |
Capital Projects
Summary Financial Data
| | | | | | | | | | | | | | | | | | | | | | | | |
| | | For the three months ended September 30 | | | For the nine months ended September 30 | |
| | | | 2011 | | | | 2010 | | | | % Change | | | | 2011 | | | | 2010 | | | | % Change | |
E&E expense1 | | | $ 18 | | | | $ 6 | | | | 200% | | | | $ 33 | | | | $ 14 | | | | 136% | |
E&E expenses incurred by equity investees2 | | | 3 | | | | 13 | | | | (77%) | | | | 9 | | | | 44 | | | | (80%) | |
Total E&E expenses | | | 21 | | | | 19 | | | | 11% | | | | 42 | | | | 58 | | | | (28%) | |
Capital expenditures3 | | | | | | | | | | | | | | | | | | | | | | | | |
Pascua-Lama | | | 301 | | | | 124 | | | | 143% | | | | 799 | | | | 425 | | | | 88% | |
Pueblo Viejo | | | 113 | | | | 157 | | | | (28%) | | | | 399 | | | | 429 | | | | (7%) | |
Cerro Casale | | | 21 | | | | 15 | | | | 40% | | | | 62 | | | | 25 | | | | 148% | |
Jabal Sayid | | | 47 | | | | - | | | | - | | | | 66 | | | | - | | | | - | |
Cortez Hills | | | - | | | | - | | | | - | | | | - | | | | 24 | | | | (100%) | |
Subtotal | | | 482 | | | | 296 | | | | 63% | | | | 1,326 | | | | 903 | | | | 47% | |
Capital commitments4 | | | | | | | | | | | | | | | $ 1,494 | | | | $ 1,115 | | | | | |
| 1 | Amounts presented represent our share of E&E expense. |
| 2 | Amounts presented represent our share of E&E expense from projects for which we use the equity accounting method, including Reko Diq, Kabanga, Donlin Creek and Cerro Casale (until March 31, 2010). |
| 3 | Amounts presented represent our share of capital expenditures on a cash basis. |
| 4 | Capital commitments represent purchase obligations as at September 30, 2011 where binding commitments have been entered into for long lead capital items related to construction activities at our projects. |
For the three and nine month periods ended September 30, 2011, we spent $21 million and $42 million in E&E expenses, respectively, and incurred $482 million (our share) and $1,326 million (our share) in capital expenditures, respectively. This compares to E&E expenses of $19 million and $58 million, respectively, and capital expenditures of $296 million and $903 million, respectively, for the same prior year periods. The increase in E&E expenses primarily relates to increased E&E expenses at our capital projects, partially offset by decreased E&E expenditures incurred by our equity investees. The increase in capital expenditures primarily relates to increased construction activities at our Pascua-Lama and Jabal Sayid projects.
Investing in and developing high return projects in Construction
At the Pueblo Viejo project in the Dominican Republic, first production is anticipated in mid-2012. Barrick’s share of annual gold production in the first full five years of operation is expected to average 625,000-675,000 ounces at total cash costs of $275-$ 300 per ounce3.
Total mine construction capital is estimated at $3.6-$3.8 billion3 (100%), or $2.2-$2.3 billion (Barrick’s 60% share) of which 80% has been committed at the end of the third quarter. Overall construction at the Pueblo Viejo project is now more than 75% complete. Remediation of the starter tailings dam progressed during Q3 with the
| 3 | Based on gold and oil price assumptions of $1,300/oz and $90/bbl, respectively. |
Company in receipt of all necessary approvals to allow construction of the dam to its full height. At the end of the third quarter, brick lining of all four autoclaves was completed. Nearly all of the concrete has been poured, about 95% of the steel has been erected and more than 7.6 million tonnes of ore have been stockpiled. Work continues toward achieving key milestones including the connection of power to the site.
As part of a longer-term, optimized power solution for Pueblo Viejo, the Company is advancing a plan to construct a dual fuel power plant at an estimated incremental cost of approximately $300 million (100% basis) or $180 million (Barrick’s share). The power plant would commence operations utilizing heavy fuel oil, but have the ability to subsequently transition to lower cost liquid natural gas. The new plant is expected to provide lower cost, long term power to the project.
Pascua-Lama is a high quality, world class resource, expected to achieve first production in mid-2013. Average annual gold production is expected to be 800,000-850,000 ounces in its first full five years of operation at negative total cash costs of $225-$ 275 per ounce4 assuming a silver price of $25 per ounce. Average annual silver production for the first full five years is expected to be about 35 million ounces. For every $1 per ounce increase in the silver price, total cash
| 4 | Based on gold, silver and oil price assumptions of $1,300/oz, $25/oz, and $90/bbl respectively and assuming a Chilean peso f/x rate of 475:1. |
| | | | |
| BARRICK THIRD QUARTER 2011 | | 33 | | MANAGEMENT’S DISCUSSION AND ANALYSIS |
costs are expected to decrease by approximately $35 per ounce over this period. Total mine construction capital is estimated at $4.7-$5.0 billion4 with approximately 50% of the capital committed at the end of the third quarter. In Chile, earthworks are about 80% complete. In Argentina, good progress was made on earthworks which are approximately 60% complete at the end of Q3. Civil concrete works continue for the structures at the stockpile, grinding and pebble crusher areas, and have started in the Merrill Crowe process plant area. Concrete and steel works continued on the processing facilities in the third quarter.
At the Barriales camp in Chile, the former exploration camp has been demolished and construction is nearing completion on various facilities. The Los A marillos camp in Argentina, which is targeted to house about 5,500 beds, currently houses 2,680 beds, with a targeted capacity of 3,500 beds to be completed by year end.
The Jabal Sayid copper project in Saudi Arabia is expected to enter production in the second half of 2012 at a total capital cost of approximately $400 million. Initial production is expected from Lode 2 and total average annual copper production is expected to be 100-130 million pounds over the first full five years of operation. Good potential exists for material extensions to known deposits and new discoveries from an ongoing evaluation of the entire Jabal Sayid site. Current exploration is focused on testing Lode 4 at depth, where mineralization has been intersected in several previous drill holes, including an intercept of 111 meters at 2.67% copper. Several geophysical surveys are also in progress.
At the end of the third quarter construction is over 60% complete with more than 70% of the capital committed. Bulk earthworks are about 85% complete, underground services are more than 50% complete and concrete poured is 90% complete.
Projects in Feasibility
At the Cerro Casale project in Chile the Environmental Impact Assessment was submitted in the third quarter. The permitting process is anticipated to be approximately 18 months, at which time Barrick will consider a construction decision and commence detailed engineering. Exploration programs will continue in parallel with completing basic engineering and permitting. Discussions with the government and meetings with local communities and indigenous groups are continuing in conjunction with these activities.
Barrick’s 75% share of average annual production is anticipated to be 750,000-825,000 ounces of gold and 190-210 million pounds of copper in the first full five years of operation at total cash costs of $125-$ 175 per
ounce5. Estimated total mine construction capital is approximately $6 billion (100% basis)5.
At the 50%-owned Donlin Gold project in Alaska, feasibility study revisions, which include updated costs and the utilization of natural gas, are being finalized for submission to the Board of Donlin Gold LLC in Q4 2011. Mine construction capital is expected to be approximately $6 billion (100% basis) with an additional $1 billion (100% basis) for the construction of a natural gas pipeline, which is anticipated to lower long term power costs and offer a better environmental and operational solution for power connection to the site. Permitting is expected to commence in the first half of 2012.
At the Reko Diq copper-gold project, in which Barrick holds a 37.5% interest, the Supreme Court of Pakistan affirmed the jurisdiction of the provincial GoB to grant the mining license in the third quarter. In September 2011, the GoB informed TCC, that it considered the mining lease application to be incomplete and unsatisfactory. TCC has recently responded to the government’s comments on the application and will take appropriate steps to protect its interest in the property, including through international arbitration if necessary.
At the 50%-owned Kabanga nickel project in Tanzania, the draft feasibility study is being reviewed by the partners. The Environmental Impact Assessment is expected to be submitted in the fourth quarter 2011. Preliminary engineering will continue for the remainder of 2011, as well as initiating negotiations to develop a Mineral Development Agreement with the Tanzanian government, prior to making a construction decision in the second half of 2012.
| 5 | Based on gold, copper and oil price assumptions of $1,300/oz, $3.25/lb and $90/bbl respectively and assuming a Chilean peso f/x rate of 475:1. |
| | | | |
| BARRICK THIRD QUARTER 2011 | | 34 | | MANAGEMENT’S DISCUSSION AND ANALYSIS |
FINANCIAL CONDITION REVIEW
| | | | | | | | |
| Summary Balance Sheet and Key Financial Ratios | |
($ millions, except ratios and share amounts) | |
| | | | As at September 30, 2011 | | | | As at December 31, 2010 | |
Total cash and equivalents | | | $ 2,965 | | | | $ 3,968 | |
Non-cash working capital | | | 1,991 | | | | 1,696 | |
Non-current assets | | | 40,263 | | | | 27,566 | |
Other assets | | | 1,608 | | | | 1,407 | |
Total Assets | | | 46,827 | | | | 34,637 | |
Non-current liabilities excluding adjusted debt | | | 6,421 | | | | 4,537 | |
Adjusted debt1 | | | 13,049 | | | | 6,392 | |
Other liabilities | | | 2,893 | | | | 2,491 | |
Total Liabilities | | | 22,363 | | | | 13,420 | |
Total shareholders’ equity | | | 22,375 | | | | 19,472 | |
Non-controlling interests | | | 2,089 | | | | 1,745 | |
Total Equity | | | $ 24,464 | | | | $ 21,217 | |
Net debt1 | | | $ 10,086 | | | | $ 2,427 | |
Total common shares outstanding (millions of shares)2 | | | 1,000 | | | | 999 | |
Key Financial Ratios: | | | | | | | | |
Current ratio3 | | | 2.27:1 | | | | 2.84:1 | |
Adjusted debt-to-equity4 | | | 0.58:1 | | | | 0.33:1 | |
Net debt-to-equity5 | | | 0.45:1 | | | | 0.12:1 | |
Net debt-to-total capitalization6 | | | 0.32:1 | | | | 0.10:1 | |
Return on equity7 | | | 22% | | | | 20% | |
| 1 | Adjusted debt and net debt are non-GAAP financial performance measures with no standardized definition under IFRS. For further information and a detailed reconciliation, please see page 61 of this MD&A. |
| 2 | Total common shares outstanding do not include 7.1 million of stock options. The increase from December 31, 2010 is due to exercise of stock options. |
| 3 | Represents current assets divided by current liabilities as at September 30, 2011 and December 31, 2010. |
| 4 | Represents adjusted debt divided by total shareholders’ equity as at September 30, 2011 and December 31, 2010. |
| 5 | Represents net debt divided by total shareholders’ equity as at September 30, 2011 and December 31, 2010. |
| 6 | Represents net debt divided by capital stock and long term debt as at September 30, 2011 and December 31, 2010. |
| 7 | Represents annualized adjusted net earnings divided by average shareholders’ equity as at September 30, 2011 and December 31, 2010. |
Balance Sheet Review
Total assets were $46.8 billion at September 30, 2011, an increase of $12.2 billion, or 35%, compared to December 31, 2010. The increase primarily reflects an increase in property, plant and equipment and goodwill, partially offset by a decrease in cash and equivalents largely due to our acquisition of Equinox. Our asset base is primarily comprised of non-current assets such as property, plant and equipment and goodwill, reflecting the capital intensive nature of the mining business and our history of growing through acquisitions. Other significant assets include production inventories and cash and equivalents.
We typically do not carry a material accounts receivable balance, since only sales of concentrate and copper cathode have a settlement period.
Total liabilities increased by $8.9 billion, or 67% compared to December 31, 2010, largely due to the issuance of $6.5 billion of new debt in connection with the acquisition of Equinox; as well as accounts payable and other liabilities assumed that relate to the Equinox operations.
| | | | |
| BARRICK THIRD QUARTER 2011 | | 35 | | MANAGEMENT’S DISCUSSION AND ANALYSIS |
Sources and uses of net debt
| | | | | | | | | | | | | | | | |
| | | For the three months ended September 30 | | | For the nine months ended September 30 | |
| (in $ millions) | | 2011 | | | 2010 | | | 2011 | | | 2010 | |
| Operating Activities | | | | | | | | | | | | | | | | |
| Operating inflows | | | $ 1,889 | | | | $ 1,397 | | | | $ 4,014 | | | | $ 3,635 | |
| Investing activities | | | | | | | | | | | | | | | | |
| Capital expenditures - minesite sustaining | | | (315) | | | | (244) | | | | (673) | | | | (573) | |
| Capital expenditures - open pit and underground mine development | | | (260) | | | | (148) | | | | (664) | | | | (421) | |
| Capital expenditures - minesite expansion1 | | | (161) | | | | (82) | | | | (332) | | | | (148) | |
| Capital expenditures - projects1 | | | (778) | | | | (433) | | | | (1,984) | | | | (1,325) | |
| Acquisitions | | | (337) | | | | (61) | | | | (7,677) | | | | (813) | |
| Other investing activities | | | (47) | | | | (1) | | | | (25) | | | | (27) | |
Total investing outflows | | | (1,898) | | | | (969) | | | | (11,355) | | | | (3,307) | |
| Financing activities (excluding debt) | | | | | | | | | | | | | | | | |
| Proceeds from public issuance of common shares by a subsidiary | | | - | | | | - | | | | - | | | | 884 | |
| Dividends | | | (119) | | | | (118) | �� | | | (359) | | | | (315) | |
| Funding from non-controlling interests | | | 119 | | | | 28 | | | | 298 | | | | 12 | |
| Repayments of debt related to the acquisitions | | | - | | | | - | | | | (347) | | | | - | |
| Deposit on silver sales agreement | | | 138 | | | | 137 | | | | 138 | | | | 137 | |
| Other financing activities | | | 8 | | | | 14 | | | | (26) | | | | 27 | |
| Total financing (outflows) inflows | | | 146 | | | | 61 | | | | (296) | | | | 745 | |
| Other movements | | | (66) | | | | 6 | | | | (86) | | | | (22) | |
| Adjustment for Pueblo Viejo financing (partner’s share), net of cash | | | 4 | | | | 85 | | | | 64 | | | | 188 | |
| Net (decrease) increase in net debt | | | (75) | | | | (580) | | | | 7,659 | | | | (1,239) | |
| Net debt at beginning of period | | | 10,161 | | | | 3,696 | | | | 2,427 | | | | 4,355 | |
| Net debt at end of period | | | $ 10,086 | | | | $ 3,116 | | | | $ 10,086 | | | | $ 3,116 | |
| 1 | The amounts include capitalized interest of $216 million for the 3 months ended September 30, 2011 (2010:$30 million) and $377 million for the 9 months ended September 30, 2011 (2010:$134 million ). |
Net debt at September 30, 2011 was $10.1 billion and our net debt-to-equity and net debt-to-total capitalization ratios were 0.45:1 and 0.32:1 respectively. This compares to net debt at December 30, 2010 of $2.4 billion, with net debt-to-equity and net debt-to-total capitalization ratios of 0.12:1 and 0.10:1, respectively. The increase in net debt, net debt-to-equity and net debt-to-total capitalization ratios are largely due to the additional debt issued in connection with our acquisition of Equinox. The majority of our outstanding long-term debt matures at various dates beyond 2013, with approximately $2.3 billion maturing in the period 2011 to 2013. Counterparties to debt and derivative instruments do not have unilateral discretionary rights to accelerate repayment at earlier dates, and therefore we are largely protected from short-term liquidity fluctuations.
| | |
| Shareholder’s Equity |
Outstanding Share Data |
As at October 14, 2011 | | Number of shares |
Common shares | | 999,795,445 |
Stock options | | 7,126,500 |
Dividend Policy
Our Board of Directors has authorized a quarterly dividend of 15 cents per share, which represents a 25% increase from the previous dividend. The amount and timing of any dividends is within the discretion of our Board of Directors. The Board of Directors reviews the dividend policy quarterly based on our current and projected liquidity profile, and capital requirements for capital projects and potential acquisitions.
Comprehensive Income
Comprehensive income consists of net income or loss, together with certain other economic gains and losses, which, collectively, are described as “other comprehensive income” or” OCI”, and excluded from the income statement.
For the nine months ended September 30, 2011, OCI decreased by $316 million on an after-tax basis, consisting primarily of gains of $182 million on hedge contracts designated for future period, resulting from changes in currency exchange rates, copper prices, and fuel prices; offset by reclassification adjustments totaling $349 million for gains on hedge contracts designated for 2011 that were transferred to earnings in 2011 in conjunction with the recognition in expense of the related hedge exposure; $77 million of losses recorded as a result of changes in the fair value of investments held during the year; reclassification adjustments totaling $56 million for gains on investment that were
| | | | |
| BARRICK THIRD QUARTER 2011 | | 36 | | MANAGEMENT’S DISCUSSION AND ANALYSIS |
sold in the period; $61 million in losses for currency translation adjustments on Barrick Energy and Australia Pacific Copper segment; and a $45 million gain due to tax recoveries on the overall decrease in OCI.
Included in accumulated other comprehensive income at September 30, 2011 were unrealized pre-tax gains on currency, commodity and interest rate hedge contracts totaling $661 million. The balance primarily relates to currency hedge contracts that are designated against operating costs and capital expenditures, primarily over the next three years, and are expected to help protect against the impact of the movement in the Australian and Canadian dollar exchange rates against the US dollar. These hedge gains/losses are expected to be recorded in earnings at the same time as the corresponding hedged operating costs/depreciation are also recorded in earnings.
Liquidity and Cash Flow
Total cash and cash equivalents at September 30, 2011 were $3.0 billion6. Our cash position consisted of a mix of term deposits, treasury bills and money market investments. The decrease in cash and cash equivalents at September 30, 2011 from the beginning of 2011 is largely due to the use of approximately $2 billion in cash for the acquisition of Equinox. To fund the remaining cost of acquiring Equinox, we issued $4.0 billion of debt securities and we drew down $2.5 billion in aggregate under our credit facilities. We have $1.0 billion under our credit facilities that remains available for drawdown as a source of financing.
One of our primary ongoing sources of liquidity is operating cash flow. In the first nine months of 2011, we generated $4.0 billion in operating cash flows, which was is net of tax payments of about $1.5 billion, of which about $0.5 billion related to final 2010 income tax payments. Excluding the payment of final 2010 taxes, we generated operating cash flow of about $4.5 billion in the first nine months at realized gold and copper prices of $1,550 per ounce and $3.87 per pound, respectively, which compares to $3.6 billion in the first nine months of 2010 when gold and copper realized prices were $1,184 per ounce and $3.20 per pound respectively. The most significant driver of the change in operating cash flow is market gold and copper prices. Future changes in those market prices, either favorable or unfavorable will
| 6 | Includes $525 million cash held at ABG, which may not be readily deployed outside ABG. It also includes $6 million held at Pueblo Viejo as a result of the first and second draw on the project financing. These funds are to be used to fund the further construction of the project and are not readily deployable by Barrick for other purposes. |
continue to have a material impact on our cash flow and liquidity.
Non-cash Working Capital
| | | | | | | | |
| (in $ millions) | |
| As at
September 30,
2011 |
| |
| As at
December 31, 2010 |
|
| Inventories1 | | | $ 3,359 | | | | $ 2,838 | |
| Other current assets | | | 481 | | | | 616 | |
| Accounts receivable | | | 444 | | | | 370 | |
| VAT and fuel tax receivables2 | | | 402 | | | | 349 | |
| Accounts payable and other current liabilities | | | (2,695) | | | | (2,477) | |
| Non-cash working capital | | | $ 1,991 | | | | $ 1,696 | |
| 1 | Includes long-term stockpiles of $1,110 million (2010:$1,040 million). |
| 2 | Includes long-term VAT and fuel tax receivables of $227 million (2010:$138 million). |
The principal historic uses of operating cash flow are capital expenditures, construction activities, acquisitions, dividend payments and repayments of our outstanding debt. The majority of our outstanding debt matures at various dates beyond 2013, with approximately $194 million maturing in 2012 and $2,091 million maturing in 2013.
We have revised our capital spending guidance for 2011 to $5.3 billion to $5.5 billion, of which about half relates to the construction of Pueblo Viejo, Pascua-Lama and Jabal Sayid. We expect to complete construction at Pueblo Viejo in mid-2012 and Jabal Sayid in the second half of 2012, with Pascua-Lama in construction throughout 2012. We are also planning to secure project financing of about $1.25 billion in 2012 to fund a portion of the construction cost of Pascua-Lama. Our capital expenditure levels beyond 2012 will be significantly impacted by the timing and expenditure levels relating to other major new mine projects and mine expansions, which are subject to permitting approvals and final construction decisions. A material adverse decline in the market price of gold and/or copper could impact the timing of final construction decisions on these other major new mine projects that are not yet in construction.
Investments in capital projects and acquisitions are subject to an internal capital allocation review prior to proceeding with new expenditures. This review entails an assessment of our overall liquidity, the overall level of investment required, and the prioritization of investments. The assessment also takes into account expected levels of future operating cash flow and the cost and availability of new financing. Future changes in market gold prices and/or copper prices could impact the timing and amount of cash available for future investment in capital projects and/or other uses of capital.
| | | | |
| BARRICK THIRD QUARTER 2011 | | 37 | | MANAGEMENT’S DISCUSSION AND ANALYSIS |
Alternatives for sourcing our future capital or other liquidity needs include our remaining $1.0 billion of availability under our credit facilities, future operating cash flow, project financings and further debt or equity
financings. These alternatives are continually evaluated to determine the optimal mix of capital resources for our capital needs.
Capital Expenditures1
| | | | | | | | | | | | | | | | |
| | | | For the three months ended September 30 | | | | For the nine months ended September 30 | |
($ millions) | | | 2011 | | | | 2010 | | | | 2011 | | | | 2010 | |
Capital expenditures - projects | | | | | | | | | | | | | | | | |
Pascua-Lama | | | $ 301 | | | | $ 124 | | | | $ 799 | | | | $ 425 | |
Pueblo Viejo | | | 113 | | | | 157 | | | | 399 | | | | 429 | |
Cerro Casale | | | 21 | | | | 15 | | | | 62 | | | | 25 | |
Jabal Sayid | | | 47 | | | | - | | | | 66 | | | | - | |
Cortez Hills | | | - | | | | - | | | | - | | | | 24 | |
Subtotal | | | $ 482 | | | | $ 296 | | | | $ 1,326 | | | | $ 903 | |
| | | | |
Capital expenditures attributable to non-controlling interests2 | | | 83 | | | | 109 | | | | 286 | | | | 291 | |
| | | | |
Total consolidated project capital expenditures | | | $ 565 | | | | $ 405 | | | | $ 1,612 | | | | $ 1,194 | |
| | | | |
Capital expenditures - minesite expansion | | | | | | | | | | | | | | | | |
Gold | | | | | | | | | | | | | | | | |
North America | | | $ 84 | | | | 73 | | | | 205 | | | | $ 132 | |
South America | | | 28 | | | | 7 | | | | 67 | | | | $ 13 | |
Copper | | | | | | | | | | | | | | | | |
Australia Pacific | | | 46 | | | | - | | | | 55 | | | | - | |
| | | | |
Total capital expenditures - minesite expansion | | | $ 158 | | | | $ 80 | | | | $ 327 | | | | $ 145 | |
| | | | |
Capital expenditures - minesite sustaining | | | | | | | | | | | | | | | | |
Gold | | | | | | | | | | | | | | | | |
North America | | | $ 76 | | | | $ 55 | | | | $ 150 | | | | $ 132 | |
South America | | | 33 | | | | 48 | | | | 94 | | | | 123 | |
Australia Pacific | | | 84 | | | | 79 | | | | 161 | | | | 146 | |
African Barrick Gold | | | 38 | | | | 15 | | | | 95 | | | | 66 | |
Copper | | | | | | | | | | | | | | | | |
South America | | | 12 | | | | 4 | | | | 29 | | | | 18 | |
Australia Pacific | | | 9 | | | | - | | | | 9 | | | | - | |
Other3 | | | 63 | | | | 43 | | | | 135 | | | | 88 | |
| | | | |
Total capital expenditures - minesite sustaining | | | $ 315 | | | | $ 244 | | | | $ 673 | | | | $ 573 | |
| | | | |
Capital expenditures - open pit and underground mine development | | | | | | | | | | | | | | | | |
Gold | | | | | | | | | | | | | | | | |
North America | | | $ 105 | | | | $ 27 | | | | $ 292 | | | | $ 132 | |
South America | | | 19 | | | | 34 | | | | 43 | | | | 71 | |
Australia Pacific | | | 59 | | | | 41 | | | | 191 | | | | 136 | |
African Barrick Gold | | | 47 | | | | 46 | | | | 107 | | | | 82 | |
Copper | | | | | | | | | | | | | | | | |
South America | | | 2 | | | | - | | | | 3 | | | | - | |
Australia Pacific | | | 28 | | | | | | | | 28 | | | | | |
| | | | |
Total capital expenditures - open pit and underground mine development | | | $ 260 | | | | $ 148 | | | | $ 664 | | | | $ 421 | |
Capitalized interest | | | 216 | | | | 30 | | | | 377 | | | | 134 | |
Total | | | $ 1,514 | | | | $ 907 | | | | $ 3,653 | | | | $ 2,467 | |
| 1 | These amounts are presented on a cash basis consistent with the amounts presented on the consolidated statement of cash flows. |
| 2 | Amount reflects our partners’ shares of expenditures at the Pueblo Viejo and Cerro Casale projects on a cash basis. |
| 3 | These amounts include $58 million of capital expenditures at Barrick Energy for the 3 months ended September 30, 2011 (2010:$17 million) and $118 million for the 9 months ended September 30, 2011 (2010:$48 million). |
| | | | |
| BARRICK THIRD QUARTER 2011 | | 38 | | MANAGEMENT’S DISCUSSION AND ANALYSIS |
Capital expenditures for the three and nine month periods ended September 30, 2011 increased by $607 million and $1,186 million, respectively, over the same prior year periods. The increases are primarily due to an increase in project capital expenditures, primarily due to increased construction activities at Pascua-Lama, and an increase in minesite expansion and open pit and underground development expenditures at our RBUs and at ABG. In North America, the increase in capital expenditures is primarily due to expansionary activities at Bald Mountain, and open pit and underground development activities at Cortez and Goldstrike. In South America, the increase in capital expenditures reflects expansion activities at Lagunas Norte, partially offset by a decrease in sustaining and open pit and underground development activities at Veladero and Pierina. In Australia Pacific, the increase in capital expenditures was primarily attributable to open pit and underground development activities at Porgera, Kalgoorlie and Granny Smith. In ABG, the increase in capital expenditures was primarily attributable to open pit and underground development activities and minesite sustaining activities at Bulyanhulu, Buzwagi and North Mara. The increase in capital expenditures for copper reflects expansion activities undertaken at Lumwana.
Financial Instruments
We use a mixture of cash, long-term debt and shareholders’ equity to maintain an efficient capital structure and ensure adequate liquidity exists to meet the cash needs of our business. We use interest rate contracts to mitigate interest rate risk that is implicit in our cash balances and outstanding long-term debt. In the normal course of business, we are inherently exposed to currency and commodity price risk. We use currency and commodity hedging instruments to mitigate these inherent business risks. We also hold certain derivative instruments that do not qualify for hedge accounting treatment. These non-hedge derivatives are described in note 18 to our Financial Statements. For a discussion of certain risks and assumptions that relate to the use of derivatives, including market risk, market liquidity risk and credit risk, refer to note 18 to our Financial Statements. For a discussion of the methods used to value financial instruments, as well as any significant assumptions, refer also to note 18 to our Financial Statements.
Counterparty Risk
Our financial position is also dependent, in part, on our exposure to the risk of counterparty defaults related to the net fair value of our derivative contracts. Counterparty risk is the risk that a third party might fail to fulfill its performance obligations under the terms of a financial instrument. Counterparty risk can be assessed both in terms of credit risk and liquidity risk. For cash and equivalents and accounts receivable, credit risk represents the carrying amount on the balance sheet, net of any overdraft positions.
For derivatives, when the fair value is positive, this creates credit risk. When the fair value of a derivative is negative, we assume no credit risk. However, liquidity risk exists to the extent a counterparty is no longer able to perform in accordance with the terms of the contract due to insolvency. In cases where we have a legally enforceable master netting agreement with a counterparty, credit risk exposure represents the net amount of the positive and negative fair values for similar types of derivatives. For a net negative amount, we regard credit risk as being zero. For a net positive amount, this is a reasonable basis to measure credit risk when there is a legally enforceable master netting agreement. We mitigate credit and liquidity risk by:
| • | | Entering into derivatives with high credit-quality counterparties; |
| • | | Limiting the amount of exposure to each counterparty; and |
| • | | Monitoring the financial condition of counterparties. |
As of September 30, 2011, we had 25 counterparties to our derivative positions. We proactively manage our exposure to individual counterparties in order to mitigate both credit and liquidity risks. For those counterparties in a net asset position (total balance attributable to the counterparties is $773 million), four hold greater than 10% of our mark-to-market asset position, with the largest counterparty holding $140 million. On an ongoing basis, we monitor our exposures and ensure that none of the counterparties with which we hold outstanding contracts has declared insolvency.
| | | | |
| BARRICK THIRD QUARTER 2011 | | 39 | | MANAGEMENT’S DISCUSSION AND ANALYSIS |
Summary of Financial Instruments
| | | | | | | | | | | | |
As at September 30, 2011 | | | | | | | | | | | | |
| Financial Instrument | | Principal/Notional Amount | | | | | | | Associated Risks |
| | | | | | | | | | • | | Interest rate |
Cash and equivalents | | | | | $ 2,965 | | | million | | • | | Credit |
Accounts receivable | | | | | $ 444 | | | million | | • | | Credit |
Available-for-sale securities | | | | | $ 183 | | | million | | • | | Market |
Accounts payable | | | | | $ 1,890 | | | million | | • | | Interest rate |
Debt | | | | | $ 13,425 | | | million | | • | | Interest rate |
Restricted share units | | | | | $ 41 | | | million | | • | | Market |
Deferred share units | | | | | $ 10 | | | million | | • | | Market |
| | CAD | | | $ 684 | | | million | | • | | Credit |
| | CLP | | | 623,002 | | | million | | • | | Market/liquidity |
| | AUD | | | $ 4,888 | | | million | | | | |
| | EUR | | | 35 | | | million | | | | |
Derivative instruments - currency contracts | | PGK | | | 162 | | | million | | | | |
Derivative instruments - silver contracts | | | | | 45 | | | million oz | | • | | Market/liquidity |
Derivative instruments - copper contracts | | | | | 475 | | | million lbs | | • | | Credit |
| | Diesel | | | 4.2 | | | million bbls | | • | | Market/liquidity |
| | | Propane | | | 8 | | | million gallons | | • | | Credit |
| | | | | | | | | | • | | Credit |
Derivative instruments - interest rate contracts | | Receive fixed interest rate swaps | | | $ 200 | | | million | | • | | Market/liquidity |
| | | | | | | | | | • | | Market/liquidity |
Non-hedge derivatives | | | | | various | | | | | • | | Credit |
Commitments and Contingencies
Capital Expenditures Not Yet Committed
We expect to incur capital expenditures during the next five years for both projects and producing mines. The projects are at various stages of development, from preliminary exploration or scoping study stage through to the construction execution stage. The ultimate decision to incur capital expenditures at each potential
site is subject to positive results which allow the project to advance past decision hurdles. Three projects were at an advanced stage as at September 30, 2011, namely Pueblo Viejo, Pascua-Lama and Jabal Sayid (refer to pages 33-34 for further details).
| | | | |
| BARRICK THIRD QUARTER 2011 | | 40 | | MANAGEMENT’S DISCUSSION AND ANALYSIS |
Contractual Obligations and Commitments
| | | | | | | | | | | | | | | | | | | | | | | | | | | | |
| | | As at September 30 | |
| ($ millions) | | 20111 | | | 2012 | | | 2013 | | | 2014 | | | 2015 | | | 2016 and
thereafter | | | Total | |
Long-term debt2 | | | | | | | | | | | | | | | | | | | | | | | | | | | | |
Repayment of principal | | | $ - | | | | $ 167 | | | | $ 2,060 | | | | $ 1,140 | | | | $ 190 | | | | $ 9,731 | | | | $ 13,288 | |
Capital leases | | | 17 | | | | 27 | | | | 31 | | | | 27 | | | | 20 | | | | 15 | | | | 137 | |
Interest | | | 184 | | | | 564 | | | | 543 | | | | 483 | | | | 459 | | | | 5,451 | | | | 7,684 | |
Provisions for Environmental Rehabilitation3 | | | 50 | | | | 131 | | | | 100 | | | | 57 | | | | 90 | | | | 1,632 | | | | 2,060 | |
Operating leases | | | 9 | | | | 22 | | | | 19 | | | | 13 | | | | 13 | | | | 71 | | | | 147 | |
Restricted share units | | | 1 | | | | 27 | | | | 13 | | | | - | | | | - | | | | - | | | | 41 | |
Pension benefits and other post-retirement benefits | | | 26 | | | | 26 | | | | 34 | | | | 26 | | | | 25 | | | | 119 | | | | 256 | |
Derivative liabilities4 | | | 24 | | | | 49 | | | | 27 | | | | 50 | | | | 29 | | | | 18 | | | | 197 | |
Purchase obligations for supplies and consumables5 | | | 759 | | | | 280 | | | | 178 | | | | 125 | | | | 92 | | | | 329 | | | | 1,763 | |
Capital commitments6 | | | 1,307 | | | | 447 | | | | 13 | | | | 1 | | | | 1 | | | | 7 | | | | 1,776 | |
Social development costs | | | 1 | | | | 8 | | | | 9 | | | | 6 | | | | 6 | | | | 69 | | | | 99 | |
Total | | | $ 2,378 | | | | $ 1,748 | | | | $ 3,027 | | | | $ 1,928 | | | | $ 925 | | | | $ 17,442 | | | | $ 27,448 | |
| 1 | Represents the obligations and commitments for the remainder of the year. |
| 2 | Long-term debt and interest - Our debt obligations do not include any subjective acceleration clauses or other clauses that enable the holder of the debt to call for early repayment, except in the event that we breach any of the terms and conditions of the debt or for other customary events of default. The debt and interest amounts include 100% of the Pueblo Viejo financing, even though we have only guaranteed our 60% share. We are not required to post any collateral under any debt obligations. The terms of our debt obligations would not be affected by deterioration in our credit rating. Projected interest payments on variable rate debt were based on interest rates in effect at September 30, 2011. Interest is calculated on our long-term debt obligations using both fixed and variable rates. |
| 3 | Provisions for Environmental Rehabilitation (“PER”) - Amounts presented in the table represent the undiscounted future payments for the expected cost of provisions for environmental rehabilitation. |
| 4 | Derivative liabilities - Amounts presented in the table relate to derivative contracts disclosed under note 18 to the Financial Statements. Payments related to derivative contracts cannot be reasonably estimated given variable market conditions. |
| 5 | Purchase obligations for supplies and consumables - Includes commitments related to purchase obligations to secure a supply of acid, tires and cyanide for our production process. |
| 6 | Capital commitments - Purchase obligations for capital expenditures include only those items where binding commitments have been entered into. Commitments at September 30, 2011 mainly relate to construction capital at Pueblo Viejo and Pascua-Lama. |
Litigation and Claims
We are currently subject to various litigation as disclosed in note 23 to the Financial Statements, and we may be involved in disputes with other parties in the future that may result in litigation. If we are unable to resolve these
disputes favorably, it may have a material adverse impact on our financial condition, cash flow and results of operations.
| | | | |
| BARRICK THIRD QUARTER 2011 | | 41 | | MANAGEMENT’S DISCUSSION AND ANALYSIS |
REVIEW OF QUARTERLY REPORTS
| | | | | | | | | | | | | | | | | | | | | | | | | | | | | | | | | | |
| | | |
| | | IFRS | | | | | US GAAP | |
| | | 2011 | | | | | | 2010 | | | | | | | | | | | 2009 | |
| ($ millions, except where indicated) | | Q3 | | | Q2 | | | Q1 | | | Q4 | | | Q3 | | | Q2 | | | Q1 | | | | | Q4 | |
Revenues | | $ | 4,007 | | | $ | 3,426 | | | $ | 3,090 | | | $ | 3,011 | | | $ | 2,788 | | | $ | 2,621 | | | $ | 2,581 | | | | | | $ 2,452 | |
Realized price - gold1 | | | 1,743 | | | | 1,513 | | | | 1,389 | | | | 1,368 | | | | 1,237 | | | | 1,205 | | | | 1,114 | | | | | | 1,119 | |
Realized price - copper1 | | | 3.54 | | | | 4.07 | | | | 4.25 | | | | 3.99 | | | | 3.43 | | | | 2.93 | | | | 3.29 | | | | | | 3.44 | |
Cost of sales | | | 1,730 | | | | 1,496 | | | | 1,357 | | | | 1,331 | | | | 1,301 | | | | 1,262 | | | | 1,268 | | | | | | 1,013 | |
Net earnings2 | | | 1,365 | | | | 1,159 | | | | 1,001 | | | | 961 | | | | 942 | | | | 859 | | | | 820 | | | | | | 215 | |
Per share (dollars)2,3 | | | 1.37 | | | | 1.16 | | | | 1.00 | | | | 0.97 | | | | 0.96 | | | | 0.87 | | | | 0.83 | | | | | | 0.22 | |
Adjusted net earnings | | | 1,385 | | | | 1,117 | | | | 1,004 | | | | 1,018 | | | | 912 | | | | 824 | | | | 763 | | | | | | 604 | |
Per share (dollars)2,3 | | | 1.39 | | | | 1.12 | | | | 1.01 | | | | 1.02 | | | | 0.93 | | | | 0.84 | | | | 0.78 | | | | | | 0.61 | |
EBITDA | | | 2,460 | | | | 2,090 | | | | 1,828 | | | | 1,770 | | | | 1,669 | | | | 1,489 | | | | 1,593 | | | | | | 794 | |
Operating cash flow | | | 1,889 | | | | 690 | | | | 1,435 | | | | 918 | | | | 1,397 | | | | 1,108 | | | | 1,130 | | | | | | (4,300 | ) |
Adjusted operating cash flow | | $ | 1,918 | | | | $ 938 | | | $ | 1,439 | | | $ | 1,493 | | | $ | 1,441 | | | $ | 1,127 | | | $ | 1,151 | | | | | | $ 921 | |
| 1 | Per ounce/pound weighted average. Realized price is a non-GAAP financial performance measure with no standardized definition under IFRS. For further information and a detailed reconciliation , please see page 60 of this MD&A. |
| 2 | Sum of all the quarters may not add up to the yearly total due to rounding. |
| 3 | Calculated using weighted average number of shares outstanding under the basic method of earnings per share. |
Our financial results for the last eight quarters reflect a trend of increasing spot gold and copper prices that have translated into increasing revenues, net earnings, EBITDA and adjusted operating cash flow. The operating
cash outflow in the fourth quarter 2009 reflects cash outflows related to our gold sales contracts, which we decided to eliminate in third quarter 2009.
| | | | |
| BARRICK THIRD QUARTER 2011 | | 42 | | MANAGEMENT’S DISCUSSION AND ANALYSIS |
INTERNATIONAL FINANCIAL REPORTING STANDARDS
We have adopted IFRS effective January 1, 2011. Our transition date is January 1, 2010 (the “transition date”) and the Company has prepared its opening IFRS balance sheet as at that date. Our IFRS accounting policies are described in note 2 of the Financial Statements.
Elected exemptions from full retrospective application
In preparing the accompanied Financial Statements in accordance with IFRS 1 First-time Adoption of International Financial Reporting Standards (“IFRS 1”), the Company has applied certain of the optional exemptions from full retrospective application of IFRS. The optional exemptions applied are described below.
(i) Business combinations
We have applied the business combinations exemption in IFRS 1 to not apply International Financial Reporting Standard 3 Business Combinations (“IFRS 3”) retrospectively to past business combinations. Accordingly, the Company has not restated business combinations that took place prior to the transition date.
(ii) Fair value or revaluation as deemed cost
We have elected to measure certain items of Property, Plant and Equipment (“PP&E”) at fair value as at January 1, 2010 or revaluation amounts previously determined under US GAAP and use those amounts as deemed cost as at January 1, 2010. We have made this election at the following properties: Pascua-Lama, Goldstrike, Plutonic, Marigold, Pierina, Sedibelo, Osborne. We have also elected to adopt this election for certain assets at
Barrick Energy, which were adjusted by $166 million to their fair value of $342 million on the transition date to IFRS, due to a decline in oil prices.
(iii) Asset related to Provision for Environmental Rehabilitation
We have elected to take a simplified approach to calculate and record the asset related to the environmental rehabilitation provision on our opening IFRS consolidated balance sheet. The environmental rehabilitation provision calculated on the transition date in accordance with International Accounting Standard 37 Provisions, Contingent Liabilities and Contingent Assets (“IAS 37”) was discounted back to the date when the provision first arose on the mineral property, at which date the corresponding asset was set up and then depreciated to its carrying amount as at the transition date.
(iv) Employee benefits
We have elected to recognize all cumulative actuarial gains and losses as at January 1, 2010 in opening retained earnings for the company’s employee benefit plans.
(v) Cumulative translation differences
We have elected to set the previously accumulated cumulative translation account, which was included in accumulated other comprehensive income (“AOCI”), to zero as at January 1, 2010 and absorbed the balance into retained earnings.
| | | | |
| BARRICK THIRD QUARTER 2011 | | 43 | | MANAGEMENT’S DISCUSSION AND ANALYSIS |
Reconciliation of Consolidated Balance Sheets as Reported Under US GAAP and IFRS
| | | | | | | | | | | | | | | | | | | | | | | | | | | | | | |
| | | | | | | | | January 1, 2010 | | | December 31, 2010 | |
| | | Ref | | | | | | US GAAP1 | | | Adj | | | IFRS | | | US GAAP1 | | | Adj | | | IFRS | |
Assets | | | | | | | | | | | | | | | | | | | | | | | | | | | | | | |
Current assets | | | | | | | | | | | | | | | | | | | | | | | | | | | | | | |
Cash and equivalents | | | | | | | | | $ 2,564 | | | | $ - | | | | $ 2,564 | | | | $ 3,968 | | | | $ - | | | | $ 3,968 | |
Accounts receivable | | | | | | | | | 251 | | | | 8 | | | | 259 | | | | 346 | | | | 24 | | | | 370 | |
Inventories | | A | | | | | | | 1,540 | | | | (52) | | | | 1,488 | | | | 1,852 | | | | (54) | | | | 1,798 | |
Other current assets | | | | | | | | | 524 | | | | (6) | | | | 518 | | | | 947 | | | | (12) | | | | 935 | |
Total current assets (excluding assets classified as held for sale) | | | | | | | | | 4,879 | | | | (50 | ) | | | 4,829 | | | | 7,113 | | | | (42 | ) | | | 7,071 | |
Assets classified as held for sale | | | | | | | | | 59 | | | | 41 | | | | 100 | | | | - | | | | - | | | | - | |
Total current assets | | | | | | | | | 4,938 | | | | (9) | | | | 4,929 | | | | 7,113 | | | | (42) | | | | 7,071 | |
Non current assets | | | | | | | | | | | | | | | | | | | | | | | | | | | | | | |
Equity in investees | | B | | | | | | | 1,136 | | | | (12) | | | | 1,124 | | | | 291 | | | | 105 | | | | 396 | |
Other investments | | E | | | | | | | 92 | | | | (30) | | | | 62 | | | | 203 | | | | (32) | | | | 171 | |
Property , plant and equipment | | C | | | | | | | 13,125 | | | | 253 | | | | 13,378 | | | | 17,751 | | | | 139 | | | | 17,890 | |
Goodwill | | C | | | | | | | 5,197 | | | | - | | | | 5,197 | | | | 5,287 | | | | 809 | | | | 6,096 | |
Intangible assets | | C | | | | | | | 66 | | | | 209 | | | | 275 | | | | 140 | | | | 335 | | | | 475 | |
Deferred income tax assets | | D | | | | | | | 949 | | | | (348) | | | | 601 | | | | 467 | | | | 158 | | | | 625 | |
Other assets | | A, E | | | | | | | 1,531 | | | | (173) | | | | 1,358 | | | | 2,070 | | | | (157) | | | | 1,913 | |
Assets of discontinued operations | | | | | | | | | 41 | | | | (41) | | | | - | | | | - | | | | - | | | | - | |
Total assets | | | | | | | | | $ 27,075 | | | | ($ 151) | | | | $ 26,924 | | | | $ 33,322 | | | | $ 1,315 | | | | $ 34,637 | |
| | | | | | | | | |
| | | | | | | | | | | | | | | | | | | | | | | | | | | | | | | |
Liabilities and Equity | | | | | | | | | | | | | | | | | | | | | | | | | | | | | | |
Current liabilities | | | | | | | | | | | | | | | | | | | | | | | | | | | | | | |
Accounts payable | | | | | | | | | $ 1,221 | | | | - | | | | $ 1,221 | | | | $ 1,511 | | | | - | | | | $ 1,511 | |
Debt | | | | | | | | | 54 | | | | - | | | | 54 | | | | 14 | | | | - | | | | 14 | |
Current income tax liabilities | | | | | | | | | 93 | | | | 11 | | | | 104 | | | | 535 | | | | 15 | | | | 550 | |
Other current liabilities | | | | | | | | | 382 | | | | (16) | | | | 366 | | | | 429 | | | | (13) | | | | 416 | |
Total current liabilities (excluding liabilities classified as held for sale) | | | | | | | | | 1,750 | | | | (5) | | | | 1,745 | | | | 2,489 | | | | 2 | | | | 2,491 | |
Liabilities classified as held for sale | | | | | | | | | 23 | | | | 26 | | | | 49 | | | | - | | | | - | | | | - | |
Total current liabilities | | | | | | | | | 1,773 | | | | 21 | | | | 1,794 | | | | 2,489 | | | | 2 | | | | 2,491 | |
Non-current liabilities | | | | | | | | | | | | | | | | | | | | | | | | | | | | | | |
Debt | | F | | | | | | | 6,281 | | | | (157) | | | | 6,124 | | | | 6,678 | | | | (54) | | | | 6,624 | |
Provisions | | G | | | | | | | 1,122 | | | | 286 | | | | 1,408 | | | | 1,439 | | | | 329 | | | | 1,768 | |
Deferred income tax liabilities | | D | | | | | | | 1,184 | | | | (224) | | | | 960 | | | | 1,114 | | | | 857 | | | | 1,971 | |
Other liabilities | | | | | | | | | 1,145 | | | | (261) | | | | 884 | | | | 868 | | | | (302) | | | | 566 | |
| | | | | | | | | |
Liabilities of discontinued operations | | | | | | | | | 23 | | | | (23) | | | | - | | | | - | | | | - | | | | - | |
Total liabilities | | | | | | | | | 11,528 | | | | (358) | | | | 11,170 | | | | 12,588 | | | | 832 | | | | 13,420 | |
Equity | | | | | | | | | | | | | | | | | | | | | | | | | | | | | | |
Capital stock | | | | | | | | | 17,390 | | | | 2 | | | | 17,392 | | | | 17,790 | | | | 30 | | | | 17,820 | |
Additional paid-in capital | | | | | | | | | - | | | | - | | | | - | | | | 288 | | | | (12) | | | | 276 | |
| | | | | | | | | |
Convertible borrowings - equity component | | | | | | | | | - | | | | 143 | | | | 143 | | | | - | | | | 38 | | | | 38 | |
Retained earnings (deficit) | | H | | | | | | | (2,382) | | | | (153) | | | | (2,535) | | | | 456 | | | | 155 | | | | 611 | |
| | | | | | | | | |
Accumulated other comprehensive income | | I | | | | | | | 55 | | | | 177 | | | | 232 | | | | 531 | | | | 196 | | | | 727 | |
| | | | | | | | | |
| Total equity attributable to Barrick Gold Corporation shareholders | | | | | | | | | 15,063 | | | | 169 | | | | 15,232 | | | | 19,065 | | | | 407 | | | | 19,472 | |
Non-controlling interests | | J | | | | | | | 484 | | | | 38 | | | | 522 | | | | 1,669 | | | | 76 | | | | 1,745 | |
Total equity | | | | | | | | | 15,547 | | | | 207 | | | | 15,754 | | | | 20,734 | | | | 483 | | | | 21,217 | |
Total liabilities and equity | | | | | | | | | $ 27,075 | | | | ($ 151) | | | | $ 26,924 | | | | $ 33,322 | | | | $ 1,315 | | | | $ 34,637 | |
| 1 | Certain US GAAP figures have been reclassified to conform to our IFRS financial statement presentation. |
| | | | |
| BARRICK THIRD QUARTER 2011 | | 44 | | MANAGEMENT’S DISCUSSION AND ANALYSIS |
Consolidated Statements of Comprehensive Income
| | | | | | | | | | | | | | | | | | | | | | | | | | | | | | | | |
| | | | | | | | | For the three months ended September 30, 2010 | | | | | For the nine months ended September 30, 2010 | |
| | | Ref | | | | | | US GAAP1 | | | Adj | | | IFRS | | | | | US GAAP1 | | | Adj | | | IFRS | |
Sales | | K | | | | | | | $ 2,775 | | | | $ 13 | | | | $ 2,788 | | | | | | $ 7,978 | | | | $ 12 | | | | $ 7,990 | |
Costs and expenses | | | | | | | | | | | | | | | | | | | | | | | | | | | | | | | | |
Cost of sales | | L | | | | | | | 1,365 | | | | (64) | | | | 1,301 | | | | | | 4,002 | | | | (171) | | | | 3,831 | |
Corporate administration | | | | | | | | | 36 | | | | 1 | | | | 37 | | | | | | 113 | | | | 2 | | | | 115 | |
Exploration and evaluation | | M | | | | | | | 85 | | | | (29) | | | | 56 | | | | | | 213 | | | | (57) | | | | 156 | |
Other expense | | | | | | | | | 70 | | | | 26 | | | | 96 | | | | | | 333 | | | | (3) | | | | 330 | |
Impairment charges (reversals) | | N | | | | | | | - | | | | (29) | | | | (29) | | | | | | 7 | | | | (60) | | | | (53) | |
| | | | | | | | | 1,556 | | | | (95) | | | | 1,461 | | | | | | 4,668 | | | | (289) | | | | 4,379 | |
Other income | | O | | | | | | | 45 | | | | (10) | | | | 35 | | | | | | 85 | | | | 7 | | | | 92 | |
Loss from equity investees | | | | | | | | | (10) | | | | 7 | | | | (3) | | | | | | (39) | | | | 12 | | | | (27) | |
| Gain (loss) on non-hedge derivatives | | P | | | | | | | - | | | | (4) | | | | (4) | | | | | | - | | | | 84 | | | | 84 | |
Income before finance items and income taxes | | | | | | | | | 1,254 | | | | 101 | | | | 1,355 | | | | | | 3,356 | | | | 404 | | | | 3,760 | |
| | | | | | | | | | |
Finance items | | | | | | | | | | | | | | | | | | | | | | | | | | | | | | | | |
Finance income | | | | | | | | | 5 | | | | - | | | | 5 | | | | | | 11 | | | | - | | | | 11 | |
Finance costs | | | | | | | | | (59) | | | | 19 | | | | (40) | | | | | | (158) | | | | 5 | | | | (153) | |
Income before income taxes | | | | | | | | �� | 1,200 | | | | 120 | | | | 1,320 | | | | | | 3,209 | | | | 409 | | | | 3,618 | |
Income tax expense | | Q | | | | | | | (368) | | | | (8) | | | | (376) | | | | | | (898) | | | | (154) | | | | (1,052) | |
| Income from continuing operations | | | | | | | | | 832 | | | | 112 | | | | 944 | | | | | | 2,311 | | | | 255 | | | | 2,566 | |
| Income from discontinued operations | | | | | | | | | 10 | | | | 1 | | | | 11 | | | | | | 81 | | | | 1 | | | | 82 | |
Net income | | | | | | | | | 842 | | | | 113 | | | | 955 | | | | | | 2,392 | | | | 256 | | | | 2,648 | |
| | | | | | | | | | |
| Unrealized gains (losses) on available-for-sale (AFS) financial securities, net of tax | | | | | | | | | 28 | | | | - | | | | 28 | | | | | | 27 | | | | - | | | | 27 | |
| | | | | | | | | | |
| Realized (gains) losses and impairments (recoveries) on AFS financial securities, net of tax | | | | | | | | | (7) | | | | - | | | | (7) | | | | | | (8) | | | | - | | | | (8) | |
| | | | | | | | | | |
| Unrealized gains (losses) on derivatives designated as cash flow hedges, net of tax | | | | | | | | | 400 | | | | 35 | | | | 435 | | | | | | 303 | | | | (9) | | | | 294 | |
| | | | | | | | | | |
| Realized (gains) losses on derivatives designated as cash flow hedges, net of tax | | | | | | | | | (15) | | | | - | | | | (15) | | | | | | (51) | | | | (1) | | | | (52) | |
Currency translation adjustments, net of tax | | | | | | | | | 19 | | | | (5) | | | | 14 | | | | | | 5 | | | | (4) | | | | 1 | |
Other comprehensive income | | | | | | | | | 425 | | | | 30 | | | | 455 | | | | | | 276 | | | | (14) | | | | 262 | |
Total comprehensive income | | | | | | | | | $ 1,267 | | | | $ 143 | | | | $ 1,410 | | | | | | $ 2,668 | | | | $ 242 | | | | $ 2,910 | |
| | | | | | |
Attributable to: | | | | | | | | | | | | | | | | | | | | | | | | | | | | | | | | |
| Equity holders of Barrick Gold Corporation | | | | | | | | | 1,272 | | | | 125 | | | | $ 1,397 | | | | | | 2,654 | | | | 229 | | | | $ 2,883 | |
Non-controlling interests | | | | | | | | | ($ 5) | | | | $ 18 | | | | $ 13 | | | | | | $ 14 | | | | $ 13 | | | | $ 27 | |
| 1 | Certain US GAAP figures have been reclassified to conform to our IFRS financial statement presentation. |
| | | | |
| BARRICK THIRD QUARTER 2011 | | 45 | | MANAGEMENT’S DISCUSSION AND ANALYSIS |
Consolidated Statements of Cash Flow
Under IFRS, as a result of capitalized production phase stripping costs and capitalized E&E costs, operating cash inflows for the nine months ended September 30, 2010 increased by $289 million to $3,635 million and investing cash outflows increased by $289 million to $3,307 million, compared to the equivalent US GAAP amounts for the same periods.
References
Consolidated Balance Sheets
| | | | | | | | |
| | | Increase (decrease) as at | |
| Description | | Jan.1, 2010 | | | Dec.31, 2010 | |
| Capitalized production phase stripping1 | | | ($ 142) | | | | ($ 116) | |
Other2 | | | 3 | | | | (4) | |
| | | | (139) | | | | (120) | |
| Short-term inventories | | | (52) | | | | (54) | |
Long-term inventories | | | (87) | | | | (66) | |
| | | | ($ 139) | | | | ($ 120) | |
| 1. | The most significant IFRS impact on inventory was the change in the accounting treatment of production phase stripping costs for open pit mines, which we capitalize to PP&E when management assesses that it is probable that the stripping costs will result in future economic benefits. Under US GAAP, these costs were treated as production costs. Capitalized production phase stripping costs also resulted in an increase in depreciation. Refer to note C below for more information on capitalized production phase stripping costs. |
| 2. | Includes asset retirement cost adjustments. Refer to note C. |
B) Equity in Investees
| | | | | | | | |
| | | Increase (decrease) as at | |
| Description | | Jan.1, 2010 | | | Dec.31, 2010 | |
| Highland Gold impairment reversal1 | | | $ 55 | | | | $ 139 | |
| Elimination of interest capitalization on equity investees2 | | | (125) | | | | (46) | |
| Capitalized E&E3 | | | 22 | | | | 12 | |
| Accumulated hedge losses relating to capital expenditures reclassified4 | | | 36 | | | | - | |
| | | | ($ 12) | | | | $ 105 | |
| 1. | Under IFRS, past impairments of equity investments must be reversed in the future if there is a recovery in the fair value of the investment. In 2008, we recorded an impairment of $140 million on our investment in Highland Gold. The fair value of the investment has increased since the write down; therefore, partial reversals were recorded under IFRS at the transition date and in subsequent quarters. |
| 2. | Under IFRS, our investment in equity investees are not qualifying assets that are eligible for interest capitalization . On transition and in subsequent quarters, this resulted in the reversal of previously capitalized interest on our equity investees where the primary activities are the development of mining projects, which principally impacted the carrying amount of our investment in Cerro Casale. |
| 3. | Under US GAAP, E&E costs can only be capitalized when Barrick has declared US 2P reserves in accordance with Industry Guide 7 issued by the US SEC. Under IFRS, we capitalize E&E costs when management assesses that it is probable that the expenditures will result in future economic benefits. This resulted in the capitalization of previously expensed E&E costs for the Cerro Casale project. |
| 4. | IFRS requires that hedge gains or losses on capital expenditures be recorded against the related asset. Accordingly, hedge losses on our capital expenditures incurred for equity method investments were reclassified from AOCI to Equity in Investees. |
| | | | |
| BARRICK THIRD QUARTER 2011 | | 46 | | MANAGEMENT’S DISCUSSION AND ANALYSIS |
C) Property, Plant and Equipment
| | | | | | | | |
| | | Increase (decrease) as at | |
| Description | | Jan.1, 2010 | | | Dec. 31, 2010 | |
| Land, Building and Equipment: | | | | | |
Deemed cost election for oil & gas properties1 | | | ($166 | ) | | | ($166 | ) |
| Accumulated hedge gains reclassified from AOCI2 | | | (56 | ) | | | (62 | ) |
| | | (222 | ) | | | (228 | ) |
| Mining Interest - Depreciable: | | | | | |
| Capitalized production phase stripping3 | | | 550 | | | | 736 | |
Asset retirement cost adjustments4 | | | (41 | ) | | | (19 | ) |
| | | 509 | | | | 717 | |
| Mining Interest - Non-Depreciable: | | | | | |
Capitalized E&E5 | | | 188 | | | | 292 | |
| Acquired exploration properties reclassified to intangible assets6 | | | (209 | ) | | | (335 | ) |
Cerro Casale acquisition7 | | | - | | | | (313 | ) |
| | | (21 | ) | | | (356 | ) |
Other adjustments | | | (13 | ) | | | 6 | |
| | | | $ 253 | | | | $ 139 | |
| 1. | As permitted in IFRS 1, we took a deemed cost election for Barrick Energy, which resulted in an adjustment to the carrying amount of certain assets with an offset to retained earnings. For more information on IFRS 1 elections, refer to note 3A of the Financial Statements. |
| 2. | IFRS requires that hedge gains or losses on capital expenditures be recorded with the related asset. Accordingly, hedge gains on our capital expenditures at capital projects and certain operating mines were reclassified from AOCI to the related asset. |
| 3. | Under IFRS, production phase stripping costs that generate a future economic benefit are capitalized as open pit mine development costs within PP&E. On transition and in subsequent quarters, this resulted in a net increase in PP&E. |
| 4. | As permitted in IFRS 1, we elected to take a simplified approach to calculate and record the asset related to the rehabilitation provision on our opening IFRS consolidated balance sheet. For more information on IFRS 1 elections available to first-time adopters, refer to note 3A of the Financial Statements. Subsequent to January 1, 2010, asset retirement costs increased or decreased based on movements in foreign exchange and discount rates. |
| 5. | Under US GAAP, E&E costs can only be capitalized when Barrick has declared US 2P reserves in accordance with Industry Guide 7 issued by the US SEC. IFRS allows capitalization of E&E costs when management assesses that it is probable that the expenditures will result in future economic benefits. At January 1, 2010, the difference resulted from additional E&E costs capitalized under IFRS for the Pueblo Viejo, Buzwagi, Veladero and Lagunas Norte properties. Capitalized costs are net of accumulated depreciation. |
| 6. | Under IFRS, on acquisition of a mineral property in the exploration stage, we prepare an estimate of the fair value attributable to the exploration potential including mineral resources, if any, of that property. This fair value is recorded as an intangible asset (acquired exploration potential) as at the date of acquisition. This change resulted in the reclassification of PP&E related to acquired exploration potential primarily for our Kainantu property, to Intangibles Assets. |
| 7. | Under IFRS, Cerro Casale met the definition of a business when we acquired an additional 25% ownership, obtaining control, in first quarter 2010. Under US GAAP, Cerro Casale was accounted for as an acquisition of an asset. This accounting difference resulted in the recognition of goodwill of $809 million. |
Adjustments to PP&E by Segment:
| | | | | | | | |
| | | Increase (decrease) as at | |
| Description | | Jan.1, 2010 | | | Dec.31, 2010 | |
Gold | | | | | | | | |
North America | | | $ 248 | | | | $ 272 | |
South America | | | 196 | | | | 235 | |
Australia Pacific | | | (154 | ) | | | (74 | ) |
African Barrick Gold | | | 21 | | | | 4 | |
Copper | | | 6 | | | | 14 | |
Capital Projects | | | 95 | | | | (161 | ) |
Barrick Energy | | | (159 | ) | | | (151 | ) |
| | | | $ 253 | | | | $ 139 | |
| D) | Deferred Income Tax Assets and Liabilities |
| | | | | | | | |
| | | Increase (decrease) as at | |
| Description | | Jan.1, 2010 | | | Dec. 31, 2010 | |
Deferred income tax assets1 | | | ($348) | | | | $158 | |
Deferred income tax liabilities1 | | | ($224) | | | | $857 | |
| 1. | Deferred tax asset and liability balances changed primarily due to the tax effects of the IFRS adjustments. In addition, for December 31, 2010, the IFRS deferred tax liability includes $523 million related to the finalization of the Cerro Casale purchase price allocation which is adjusted retroactively under IFRS. The US GAAP deferred tax amount did not include amounts related to the Cerro Casale purchase price allocation. |
| | | | | | | | |
| Sources of Deferred Income Tax Assets and Liabilities | | | | |
At December 31, 2010 | | | US GAAP | | | | IFRS | |
Deferred tax assets | | | | | | | | |
Tax loss carry forwards | | | $ 553 | | | | $ 337 | |
Capital tax loss carry forwards | | | 101 | | | | - | |
| Alternative minimum tax (“AMT”) credits | | | 318 | | | | 318 | |
PER | | | 494 | | | | 469 | |
Property , plant and equipment | | | 177 | | | | - | |
| Post-retirement benefit obligations | | | 14 | | | | 25 | |
Accrued interest payable | | | 63 | | | | 63 | |
Other | | | 53 | | | | - | |
| | | 1,773 | | | | 1,212 | |
Valuation allowances | | | (425) | | | | - | |
| | | 1,348 | | | | 1,212 | |
| | |
Deferred tax liabilities | | | | | | | | |
Property, plant and equipment | | | (1,725) | | | | (2,177) | |
Derivative instruments | | | (168) | | | | (160) | |
Inventory | | | (102) | | | | (212) | |
Other | | | - | | | | (9) | |
| | | | ($ 647) | | | | ($1,346) | |
| | |
Classification: | | | | | | | | |
Non-current assets | | | $ 467 | | | | $ 625 | |
Non-current liabilities | | | (1,114) | | | | (1,971) | |
| | | | ($ 647) | | | | ($1,346) | |
| | | | |
| BARRICK THIRD QUARTER 2011 | | 47 | | MANAGEMENT’S DISCUSSION AND ANALYSIS |
| | | | | | | | |
| | | Increase (decrease) as at | |
| Description | | Jan.1, 2010 | | | Dec. 31, 2010 | |
| Capitalized production phase stripping costs related to long-term inventory1 | | | ($ 87) | | | | ($ 66) | |
| Debt issuance costs reclassified to debt2 | | | (45) | | | | (54) | |
| Reversal of the RSU long-term asset | | | (68) | | | | (70) | |
| Investment in Yokohama reclassified | | | 30 | | | | 32 | |
| Other adjustments | | | (3) | | | | 1 | |
| | | | ($ 173) | | | | ($ 157) | |
| | | | | | | | |
| | | Increase (decrease) as at | |
| Description | | Jan.1, 2010 | | | Dec. 31, 2010 | |
| Bifurcation of senior convertible debt1 | | | ($ 143) | | | | - | |
| Debt issue costs reclassified2 | | | (45) | | | | (54) | |
| Previously amortized debt premium reversed to retained earnings2 | | | 31 | | | | - | |
| | | | ($ 157) | | | | ($ 54) | |
| 1. | Under IFRS, compound financial instruments are required to be split into a debt and an equity component. On transition to IFRS, our senior convertible debentures were bifurcated into debt and equity components. We calculated the liability component by discounting the cash flows associated with the liability at a market rate for a similar debt instrument (without the conversion option). The equity component was measured as the residual amount. |
| 2. | IFRS requires debt issuance costs to be deducted from the carrying amount of the related financial liability. At January 1, 2010, this resulted in the reclassification of debt issuance costs from other assets to debt. This was partially offset by reversal of previously amortized debt premium from retained earnings. |
| | | | | | | | |
| | | Increase (decrease) as at | |
| Description | | Jan.1, 2010 | | | Dec. 31, 2010 | |
| PER adjustments1,2,3 | | | $ 72 | | | | $ 80 | |
| Reclassification of employee benefits and stock based compensation from other liabilities4 | | | 269 | | | | 302 | |
| Additional provision recognized under IFRS5 | | | 11 | | | | 11 | |
| Reversal of the RSU long-term asset6 | | | (68) | | | | (70) | |
| Other adjustments | | | 2 | | | | 6 | |
| | | | $ 286 | | | | $ 329 | |
| 1. | IFRS requires that provisions for PER be adjusted to fair value at each reporting period by applying the current foreign exchange and discount rates. The adjustments to PER are added (or deducted) from the cost of the related asset. At January 1, 2010, the effect of applying the current foreign exchange and discount rates was an increase in the PER balance. In subsequent quarters, the PER increased or decreased based on the movements in foreign exchange and discount rates. |
| 2. | IFRS requires that constructive obligations be recognized as provisions if it is probable that the obligation will result in an outflow of economic resources. At January 1, 2010, we recognized certain constructive obligations that were previously expensed as incurred under US GAAP. |
| 3. | IFRS requires that environmental obligations be measured using management’s best estimate of the expenditure required to settle the obligation. Under US GAAP, environmental obligations are recorded based on the cost of a third-party performing the work, irrespective of management’s intention to perform the work internally. At January 1, 2010, we eliminated contractor margins for those obligations where Barrick intends to perform the work. |
| 4. | Under IFRS, we reclassified employee benefits and stock-based compensation from other liabilities to provisions. |
| 5. | IFRS requires recognition of a contingent liability if it is probable that the obligation will result in an outflow of economic resources. At January 1, 2010, this resulted in the recognition of a contingent financial liability of $11 million relating to the additional 40% Cortez acquisition in 2008. |
| | | | |
| BARRICK THIRD QUARTER 2011 | | 48 | | MANAGEMENT’S DISCUSSION AND ANALYSIS |
| H) | Opening Retained Earnings1 |
| | | | |
US GAAP, as reported Jan 1, 2010 | | | ($ 2,382) | |
IFRS 1 Exemptions | | | | |
Reset of actuarial gains and losses relating to pension plans2 | | | (37) | |
Reset of cumulative translation account2 | | | (141) | |
Adjustment due to deemed cost election for oil & gas properties2 | | | (166) | |
| |
IFRS Policy choices | | | | |
Capitalized production phase stripping3 | | | 408 | |
Capitalized E&E3 | | | 160 | |
Highland Gold impairment reversal4 | | | 55 | |
Elimination of interest capitalization on equity investees4 | | | (125) | |
Increase in PERs and related asset5 | | | (101) | |
Bifurcation of senior convertible debt6 | | | (31) | |
Time value changes in fair value of options designated as hedging instrument7 | | | (33) | |
Tax effect of adjustments, net | | | (119) | |
Other adjustments | | | (23) | |
IFRS, as reported Jan 1, 2010 | | | ($ 2,535) | |
| 1. | Retained earnings changes for the quarters are due to the IFRS adjustments in the consolidated statement of income. |
| 2. | Refer to note 3A of the Financial Statements. |
| 7. | Under IFRS, Barrick is required to separate the intrinsic value and the time value of our purchased copper options and designate as the hedging instrument only the changes in the intrinsic value of the option. As a result, for hedge relationships where the critical terms of the purchased option match the hedged risk, the change in intrinsic value is deferred in equity while the change in time value is reclassified from AOCI to opening retained earnings. This change resulted in an amount recorded in retained earnings on transition and gains/losses attributable to time value changes in subsequent quarters were recognized on a separate line item `gains (losses) on non-hedge derivatives’ in the income statement. |
| I) | Accumulated Other Comprehensive Income |
| | | | | | | | |
| | | Increase (decrease) as at | |
| Description | | Jan.1, 2010 | | | Dec.31, 2010 | |
| Reset of actuarial gains and losses relating to pension plans1 | | | $ 37 | | | | $ 37 | |
| Reset of cumulative translation account1 | | | 141 | | | | 141 | |
| Time value changes in fair value of options designated as hedging instrument2 | | | 33 | | | | 72 | |
| Accumulated hedge losses relating to capital expenditures reclassified3 | | | 36 | | | | 36 | |
| Accumulated hedge gains reclassified4 | | | (56) | | | | (62) | |
| Tax effect of adjustments | | | (14) | | | | (20) | |
| Other adjustments | | | - | | | | (8) | |
| | | | $ 177 | | | | $ 196 | |
| 1. | Refer to note 3A of the Financial Statements. |
| J) | Non-Controlling Interests (NCI) |
| | | | | | | | |
| | | Increase (decrease) as at | |
| Description | | Jan.1, 2010 | | | Dec. 31, 2010 | |
| Capitalized E&E atributable to NCI related to Pueblo Viejo1 | | | $ 50 | | | | $ 50 | |
| Sale of 26.1% ownership of ABG2 | | | - | | | | 25 | |
| Other adjustments | | | (12) | | | | 1 | |
| | | | $ 38 | | | | $ 76 | |
| 2. | On February 17, 2010, our Board of Directors approved a plan to create ABG and to offer about 26.1% of its equity (including the overallotment option) in an initial public offering on the London Stock Exchange. ABG holds Barrick’s previously held African gold mines and most of Barrick’s previously held exploration properties. The carrying amounts of the net assets are different under IFRS as compared to US GAAP, which resulted in an adjustment to Additional Paid In Capital (“APIC”), and a corresponding adjustment to the NCI. For more information on this transaction, refer to note 4 of the Financial Statements. |
Consolidated Statements of Income
| | | | | | | | |
| | | Increase (decrease) for the period | |
| Description | | 3 months ended September 30
2010 | | | 9 months ended September 30 2010 | |
| Other metal sales reclassified from cost of sales1 | | | $ 25 | | | | $ 91 | |
| Gain on non-hedge derivatives2 | | | (11) | | | | (61) | |
| Revenue recognition3 | | | 7 | | | | - | |
| Others | | | (8) | | | | (18) | |
| | | | $ 13 | | | | $ 12 | |
| 1 | Recognition of incidental other metal sales previously recorded as a credit to costs of sales will be presented as part of revenues commencing January 1, 2010. |
| 2 | Under IFRS, all realized and unrealized non-hedge derivative gains or losses, hedge ineffectiveness and amounts not qualifying for hedge accounting are presented as a separate line on the consolidated income statement. Under US GAAP these amounts were presented in the respective income statement line item to which the gain or loss was most closely related. |
| 3 | Revenues increased on transition due to earlier recognition of revenue for our concentrate sales at Bulyanhulu mine. Under IFRS, revenue is recognized on transfer of risk and rewards as compared to recognition on transfer of title under US GAAP. |
| | | | |
| BARRICK THIRD QUARTER 2011 | | 49 | | MANAGEMENT’S DISCUSSION AND ANALYSIS |
| | | | | | | | |
| | | Increase (decrease)
for the period | |
| Description | | 3 months
ended
September 30
2010 | | | 9 months ended
September 30
2010 | |
| Capitalized production phase stripping1 | | | ($ 78) | | | | ($ 225) | |
| Reclassification to income tax2 | | | (34) | | | | (77) | |
| Depreciation expense3 | | | 16 | | | | 51 | |
| Other metal sales4 | | | 25 | | | | 91 | |
| Gain on non-hedge derivatives | | | 11 | | | | 8 | |
| Other adjustments | | | (4) | | | | (19) | |
| | | | ($ 64) | | | | ($ 171) | |
| 1. | Costs of sales were lower primarily due to capitalized production phase stripping costs. |
| 2. | Under IFRS, royalties and mining taxes that are payable to government bodies and are calculated based on net profit are classified as income taxes. We reclassified the following to income tax expense: Nevada Net Proceeds Tax and Cowal royalty. |
| 3. | Depreciation expense increased under IFRS due to higher book values resulting from capitalization of production phase stripping costs and E&E costs, and the impact of the calculation of the asset related to the environmental rehabilitation provisions under IFRS 1 for opening balance sheet as at January 1, 2010. |
| M) | Exploration and Evaluation |
Under IFRS, the criteria to determine costs that qualify for capitalization differs from US GAAP. We capitalized additional E&E costs at certain properties, mainly Cerro Casale, where management assessed under IFRS that it is probable that these expenditures will result in future economic benefits.
| N) | Impairment Charges (Reversals) |
| | | | | | | | |
| | | Increase (decrease) for the period | |
| Description | | 3 months ended
September 30 2010 | | | 9 months ended
September 30 2010 | |
| Highland Gold impairment reversal1 | | | ($29) | | | | ($ 64) | |
| Other | | | - | | | | 4 | |
| | | | ($ 29) | | | | ($ 60) | |
In the first quarter of 2010, Barrick acquired an additional 25% ownership interest in the Cerro Casale project and obtained control over the project. Due to the elimination of capitalized interest under IFRS, the assets had a lower book value which resulted in a higher gain on acquisition of $ 13 million (net of taxes), which was recorded as other income.
| P) | Gain (Loss) on Non-Hedge Derivatives |
| | | | | | | | |
| | | Increase (decrease) for the period | |
| Description | | 3 months ended
September 30
2010 | | | 9 months
ended September 30
2010 | |
| Gains on non-hedge derivative positions1 | | | $ 39 | | | | $ 64 | |
| Unrealized gains due to hedge ineffectiveness | | | 5 | | | | 8 | |
| Time value changes in fair value of options designated as hedging instrument1 | | | (48) | | | | 12 | |
| | | | ($ 4) | | | | $ 84 | |
| 1. | Under IFRS, all realized and unrealized non-hedge derivative gains or losses, hedge ineffectiveness and amounts not qualifying for hedge accounting are presented as a separate line on the consolidated income statement. Under US GAAP these amounts were presented in the respective income statement line item to which the gain or loss was most closely related. |
| | | | | | | | |
| | | Increase (decrease) for the period | |
| Description | | 3 months
ended
September 30
2010 | | | 9 months
ended
September 30
2010 | |
| Tax effect of changes in income | | | $ 2 | | | | $ 79 | |
| Reclassification from cost of sales1 | | | 32 | | | | 82 | |
| Other adjustments | | | (26) | | | | (7) | |
| | | | $ 8 | | | | $ 154 | |
Impact of conversion to IFRS Total Cash Costs per ounce on gold and per pound on copper
| | | | | | | | |
| For the three months ended September 30, 2010 | |
| | |
| | | Gold | | | Copper | |
| (Per ounce/pound information in dollars) | | 2010 | | | 2010 | |
Cash costs - US GAAP | | | $ 454 | | | | $ 1.12 | |
Capitalized production phase stripping costs1 | | | (37) | | | | - | |
Cost of sales reclassified to income tax expense2 | | | (17) | | | | - | |
Other adjustments | | | 3 | | | | - | |
Cash costs - IFRS | | | $ 403 | | | | $ 1.12 | |
|
| For the nine months ended September 30, 2010 | |
| | |
| | | Gold | | | Copper | |
| (Per ounce/pound information in dollars) | | 2010 | | | 2010 | |
Cash costs - US GAAP | | | $ 448 | | | | $ 1.10 | |
Capitalized production phase stripping costs1 | | | (37) | | | | - | |
Cost of sales reclassified to income tax expense2 | | | (13) | | | | - | |
Other adjustments | | | 1 | | | | - | |
Cash costs - IFRS | | | $ 399 | | | | $ 1.10 | |
| | | | |
| BARRICK THIRD QUARTER 2011 | | 50 | | MANAGEMENT’S DISCUSSION AND ANALYSIS |
IFRS CRITICAL ACCOUNTING POLICIES AND ACCOUNTING ESTIMATES
Management has discussed the development and selection of our critical accounting estimates with the Audit Committee of the Board of Directors, and the Audit Committee has reviewed the disclosure relating to such estimates in conjunction with its review of this MD&A . The accounting policies and methods we utilize determine how we report our financial condition and results of operations, and they may require management to make estimates or rely on assumptions about matters that are inherently uncertain. Our significant accounting policies are disclosed in note 2 of the Financial Statements. In this MD&A, we have provided a summary of changes in critical accounting estimates from those disclosed in the Financial Statements.
Future Accounting Policy Changes
Our interim financial statements have been prepared in accordance with International Accounting Standard 34 Interim Financial Reporting (“IAS 34”) as issued by the International Accounting Standards Board (“IASB”). The policies applied in the Financial Statements are based on International Financial Reporting Standards (“IFRS”) issued and outstanding as at October 26, 2011, the date the Board of Directors approved the Financial Statements for issue. Any subsequent changes to IFRS that are issued and effective as at December 31, 2011 could result in a restatement of the Financial Statements, including the transition adjustments recognized on conversion to IFRS.
Financial Instruments
IFRS 9 Financial Instruments
In November 2009, the IASB issued IFRS 9Financial Instruments as the first step in its project to replace IAS 39Financial Instruments: Recognitionand Measurement. IFRS 9 retains but simplifies the mixed measurement model and establishes two primary measurement categories for financial assets: amortized cost and fair value. The basis of classification depends on an entity’s business model and the contractual cash flow of the financial asset. Classification is made at the time the financial asset is initially recognized, namely when the entity becomes a party to the contractual provisions of the instrument.
IFRS 9 amends some of the requirements of IFRS 7Financial Instruments: Disclosuresincluding added disclosures about investments in equity instruments measured at fair value in OCI, and guidance on financial liabilities and de-recognition of financial instruments. In August 2011, the IASB issued an exposure draft that proposes to adjust the mandatory effective date of IFRS
9 from January 1, 2013 to January 1, 2015. We are currently assessing the impact of adopting IFRS 9 on our consolidated financial statements, including the impact of early adoption of the standard.
IFRS 10 Consolidated Financial Statements
In May 2011, the IASB issued IFRS 10Consolidated Financial Statementsto replace IAS 27Consolidated and Separate Financial Statementsand SIC 12Consolidation - Special Purpose Entities. The new consolidation standard changes the definition of control so that the same criteria apply to all entities, both operating and special purpose entities, to determine control. The revised definition focuses on the need to have both power and variable returns before control is present. IFRS 10 must be applied starting January 1, 2013 with early adoption permitted. We are currently assessing the impact of adopting IFRS 10 on our consolidated financial statements.
IFRS 11 Joint Arrangements
In May 2011, the IASB issued IFRS 11 Joint Arrangements to replace IAS 31, Interests in Joint Ventures. The new standard defines two types of arrangements: Joint Operations and Joint Ventures. Focus is on the rights and obligations of the parties involved to reflect the joint arrangement, thereby requiring parties to recognize the individual assets and liabilities to which they have rights or for which they are responsible, even if the joint arrangement operates in a separate legal entity. IFRS 11 must be applied starting January 1, 2013 with early adoption permitted. We are currently assessing the impact of adopting IFRS 11 on our consolidated financial statements.
IFRS 12 Disclosure of Interests in Other Entities
In May 2011, the IASB issued IFRS 12Disclosure of Interests in Other Entitiesto create a comprehensive disclosure standard to address the requirements for subsidiaries, joint arrangements and associates including the reporting entity’s involvement with other entities. It also includes the requirements for unconsolidated structured entities (i.e. special purpose entities). IFRS 12 must be applied starting January 1, 2013 with early adoption permitted. We are currently assessing the impact of adopting IFRS 12 on our consolidated financial statements.
IFRS 13 Fair Value Measurement
In May 2011, the IASB issued IFRS 13Fair Value Measurement as a single source of guidance for all fair value measurements required by IFRS to reduce the
| | | | |
| BARRICK THIRD QUARTER 2011 | | 51 | | MANAGEMENT’S DISCUSSION AND ANALYSIS |
complexity and improve consistency across its application. The standard provides a definition of fair value and guidance on how to measure fair value as well as a requirement for enhanced disclosures. Enhanced disclosures about fair value are required to enable financial statement users understand how the fair values were derived. IFRS 13 must be applied starting January 1, 2013 with early adoption permitted. We are currently assessing the impact of adopting IFRS 13 on our consolidated financial statements.
IFRIC 20 Stripping Costs in the Production Phase of a Surface Mine
In October 2011, the IASB issued IFRIC 20 Stripping Costs in the Production Phase of a Surface Mine. IFRIC 20 provides guidance on the accounting for the costs of stripping activity in the production phase of surface mining when two benefits accrue to the entity from the stripping activity: useable ore that can be used to produce inventory and improved access to further quantities of material that will be mined in future periods. IFRIC 20 must be applied starting January 1, 2013 with early adoption permitted. We are currently assessing the impact of adopting IFRIC 20 on our consolidated financial statements.
Internal Control over Financial Reporting and Disclosure Controls and Procedures
Management is responsible for establishing and maintaining adequate internal control over financial reporting and disclosure controls and procedures.
Internal control over financial reporting is a framework designed to provide reasonable assurance regarding the reliability of financial reporting and the preparation of financial statements in accordance with IFRS. The Company’s internal control over financial reporting framework includes those policies and procedures that (i) pertain to the maintenance of records that, in reasonable detail, accurately and fairly reflect the transactions and dispositions of the assets of the Company; (ii) provide reasonable assurance that transactions are recorded as necessary to permit preparation of financial statements in accordance with IFRS, and that receipts and expenditures of the Company are being made only in accordance with authorizations of management and directors of the Company; and (iii) provide reasonable assurance regarding prevention or timely detection of unauthorized acquisition, use or disposition of the Company’s assets that could have a material effect on the Company’s consolidated financial statements.
Disclosure controls and procedures form a broader framework designed to ensure that other financial
information disclosed publicly fairly presents in all material respects the financial condition, results of operations and cash flows of the company for the periods presented in this Report. The Company’s disclosure controls and procedures framework includes processes designed to ensure that material information relating to the Company, including its consolidated subsidiaries, is made known to management by others within those entities to allow timely decisions regarding required disclosure.
Together, the internal control over financial reporting and disclosure controls and procedures frameworks provide internal control over financial reporting and disclosure. Due to its inherent limitations, internal control over financial reporting and disclosure may not prevent or detect all misstatements. Further, the effectiveness of internal control is subject to the risk that controls may become inadequate because of changes in conditions, or that the degree of compliance with policies or procedures may change.
In connection with the reorganization of the Capital Projects group and related personnel moves at the Pascua-Lama project announced in the second quarter, and in preparation for its transition to the South America RBU , additional personnel from Barrick’s Corporate Office, the South America RBU and Pascua-Lama project locations have been reassigned into critical roles to strengthen the core project team. Additionally, along with personnel training and role clarification, work continues to enhance and standardize the project controls, finance and supply chain business processes and systems. Management is also continuing to assess and address the impact to the Company’s internal control environment relative to its integration of Equinox (as described on page 27 of this report) into the Australia Pacific business unit and Capital Projects segment. It is not expected that the Company’s conversion to IFRS will impact the effectiveness of the internal control over financial reporting and disclosure in the current year.
Management will continue to monitor the effectiveness of its internal control over financial reporting and disclosure and may make modifications from time to time as considered necessary or desirable.
Accounting Estimates
Life-of-mine (“LOM”) Estimates Used to Measure
Depreciation of Property, Plant and Equipment
We depreciate our assets over their useful life, or over the remaining life of the mine (if shorter). We use the units-of-production basis (“UOP”) to depreciate the mining interest component of PP&E whereby the
| | | | |
| BARRICK THIRD QUARTER 2011 | | 52 | | MANAGEMENT’S DISCUSSION AND ANALYSIS |
denominator is the expected mineral production based on our LOM plans. LOM plans are prepared based on estimates of ounces of gold/pounds of copper in proven and probable reserves and a portion of resources at the mine where there is high probability of economic extraction. At the end of each fiscal year, as part of our business cycle, we update our LOM plans and prepare estimates of proven and probable gold and copper mineral reserves as well as measured, indicated and inferred mineral resources for each mineral property. We prospectively revise calculations of depreciation based on these updated LOM plans. The table below illustrates the impact of historic changes in LOM estimates on depreciation for each of our operating segments.
Impact of Historic Changes in LOM Estimates on
Depreciation
| | | | | | | | | | | | |
| | | | | | Depreciation increase (decrease)1 Periods ended September 30,2011 | |
($ millions, except LOM is in millions
of contained oz/pounds) | | LOM increase
(decrease)1 | | | Three months | | | Nine Months | |
Gold | | | | | | | | | | | | |
North America | | | 7.1 | | | | ($ 16) | | | | ($ 48) | |
Australia Pacific | | | 1.7 | | | | ($ 9) | | | | ($ 25) | |
ABG | | | (3.9) | | | | $ 5 | | | | $ 14 | |
South America | | | 1.3 | | | | ($ 3) | | | | ($ 9) | |
Total Gold | | | 6.2 | | | | ($ 23) | | | | ($ 68) | |
| | | | | | | | | | | | |
Copper | | | | | | | | | | | | |
South America | | | 734 | | | | ($ 2) | | | | ($ 6) | |
| 1 | Each year we update our LOM estimates as at the end of the year as part of our normal business cycle. We then use those updated LOM estimates to calculate depreciation expense in the following fiscal year on assets which use the units- of- production method of depreciation. LOM changes presented were calculated as at the end of 2010 and are in millions of contained ounces/pounds. |
Provisions for Environmental Rehabilitations (“PERs”)
We have an obligation to reclaim our mining properties after the minerals have been mined from the site, and have estimated the costs necessary to comply with existing reclamation standards. We recognize the fair value of a liability for a PER such as site closure and reclamation costs, in the period in which it is incurred if a reasonable estimate of fair value can be made. PER can include facility decommissioning and dismantling; removal or treatment of waste materials; site and land rehabilitation, including compliance with and monitoring of environmental regulations; security and other site-related costs required to perform the rehabilitation work; and operation of equipment designed to reduce or eliminate environmental effects.
Provisions for the cost of each rehabilitation program are normally recognized at the time that an environmental disturbance occurs or a constructive obligation is determined. When the extent of disturbance increases over the life of an operation, the provision is increased accordingly.
We record a PER in our financial statements when it is incurred and capitalize this amount as an increase in the carrying amount of the related asset. At operating mines, the increase in a PER is recorded as an adjustment to the corresponding asset carrying amount and results in a prospective increase in depreciation expense. At closed mines, any adjustment to a PER is recognized as an expense in the consolidated statement of income.
PERs are measured at the expected value of the future cash flows, discounted to their present value using a current, US dollar real risk- free pre-tax discount rate. The expected future cash flows exclude the effect of inflation. The unwinding of the discount referred to as accretion expense, is included in finance costs and results in an increase in the amount of the provision. Provisions are updated each reporting period for the effect of a change in the discount rate and foreign exchange rate when applicable, and the change in estimate is added or deducted from the related asset and depreciated prospectively over the asset’s useful life.
During the three month period ended September 30, 2011, our PER balance increased by $186 million as a result of a decrease in the discount rate used to calculate PER. The offset was recorded as an increase in PP&E and did not have any impact on current period earnings.
Accounting for impairment of non-current assets
We review and test the carrying amounts of PP&E and intangible assets with definite lives when indicators of impairments are considered to exist. Impairment assessments on PP&E and intangible assets are conducted at the level of Cash Generating Units (“CGU”), which is the lowest level at which identifiable cash flows are largely independent of the cash flows of other assets. For operating mines, capital projects and petroleum and natural gas properties, the individual mine/project/property represents a CGU for impairment testing.
We conduct an annual test for impairment of goodwill in the fourth quarter of each fiscal year and at any other time of the year if an indicator of impairment is identified. We test goodwill at the operating segment level, since each CGU in a segment derives synergy benefits from the business combinations within that
| | | | |
| BARRICK THIRD QUARTER 2011 | | 53 | | MANAGMENT’S DISCUSSION AND ANALYSIS |
segment that give rise to goodwill and management does not internally monitor goodwill at a lower level. We record an impairment if the carrying amount of the operating segment exceeds its recoverable amount and, consequently, reduce the carrying value to its recoverable amount.
Circumstances that could trigger an impairment test on goodwill or long-lived assets include, but are not limited to: a significant adverse business, legal or regulatory development; the likelihood that a CGU or a significant portion of a CGU will be sold or otherwise disposed of; or a significant change to the operating plans of a CGU .
The most significant factors impacting the outcome of impairment tests are market gold and copper prices; discount rates; and market multiple assumptions used in the estimation of the fair value of CGUs or groups of CGUs. An adverse change in any one or a combination of these factors could lead to the recognition of impairment charges in future periods. We continue to monitor these factors on an ongoing basis to assess whether any impairment charge is required.
Due to the recent decline in market copper prices, management continues to re-evaluate expectations for the long term copper price. A continuation of the recent trend of lower market copper prices could lead to management lowering long-term copper price assumptions, which could have a negative impact on the recoverability of goodwill attributable to our copper business segments. In the fourth quarter of 2011, we will conduct our annual goodwill impairment test for all business segments. These tests are based on updated life of mine plans for all our operations, which we expect to finalize in the fourth quarter of 2011 as part of our normal planning cycle. The principal risk factors that could potentially lead to an impairment of goodwill in the copper business segments include a lower long term copper price assumption, any revisions to expected
copper production profiles over the life of mine, and any increases in operating and capital costs at our copper operations due to inflation and other factors.
Preliminary Purchase Price Allocations
We have prepared a preliminary allocation of the purchase cost of the Equinox business combination to the assets and liabilities acquired. This allocation is prepared based on the estimated fair value of the assets/liabilities using the best information available as at the balance sheet date. We expect to have updated LOM plans for both Lumwana and the Jabal Sayid project in the fourth quarter 2011. The final valuations of assets and liabilities acquired will be based on these plans. Depending on the estimated production levels, expected operating and capital expenditures and estimated long-term copper prices, there could be significant adjustments to the preliminary allocation.
In particular, the preliminary fair value estimates for depreciable mining interests, deferred income taxes and goodwill could be materially different from the final amounts and could have a corresponding impact on the calculations of depreciation and income tax expense for periods subsequent to the date of acquisition. Under IFRS, any such adjustments to finalize the purchase price allocation will result in a retrospective adjustment to the preliminary allocations from the acquisition date onwards. The measurement period for making adjustments to the preliminary allocation cannot exceed one year from the date of acquisition.
| | | | |
| BARRICK THIRD QUARTER 2011 | | 54 | | MANAGEMENT’S DISCUSSION AND ANALYSIS |
NON-GAAP FINANCIAL PERFORMANCE MEASURES7
Adjusted Net Earnings (Adjusted Net Earnings per Share) and Return on Equity
Adjusted net earnings is a non-GAAP financial measure which excludes the following from net earnings:
| • | | Significant tax adjustments not related to current period earnings; |
| • | | Impairment charges (reversals) related to intangibles, goodwill, property, plant and equipment, and investments; |
| • | | Gains/losses and other one-time costs relating to acquisitions/dispositions; |
| • | | Foreign currency translation gains/losses; |
| • | | Non-recurring restructuring costs; and |
| • | | Unrealized gains/losses on non-hedge derivative instruments |
Management uses this measure internally to evaluate the underlying operating performance of the Company as a whole for the reporting periods presented, and to assist with the planning and forecasting of future operating results. We believe that adjusted net earnings allows investors and analysts to better evaluate the results of the underlying business of the Company. While the adjustments to net earnings in this measure include items that are recurring, management believes that adjusted net earnings is a useful measure of the Company’s performance because non-recurring tax adjustments; impairment charges, gains/losses and other one-time costs relating to asset acquisitions/dispositions and business combinations; and non-recurring restructuring charges do not reflect the underlying operating performance of our core mining business and are not necessarily indicative of future operating results.
Furthermore, foreign currency translation gains/losses and unrealized gains/losses from non-hedge derivatives are not necessarily reflective of the underlying operating results for the reporting periods presented.
As noted, the Company uses this measure for its own internal purposes. Management’s internal budgets and forecasts and public guidance do not reflect potential impairment charges, potential gains/losses on the acquisition/disposition of assets, foreign currency translation gains/losses, or unrealized gains/losses on non-hedge derivatives. Consequently, the presentation of adjusted net earnings enables investors and analysts to better understand the underlying operating performance of our core mining business through the eyes of Management. Management periodically evaluates the components of adjusted net earnings based on an internal assessment of performance measures that are useful for evaluating the operating performance of our business segments and a review of the non-GAAP measures used by mining industry analysts and other mining companies.
We also present return on equity as a measure which is calculated by dividing adjusted net earnings by average shareholders’ equity. Management believes this to be a useful indicator of the Company’s performance.
Adjusted net earnings and return on equity are intended to provide additional information only and do not have any standardized definition under IFRS and should not be considered in isolation or as substitutes for measures of performance prepared in accordance with IFRS. The measures are not necessarily indicative of operating profit or cash flow from operations as determined under IFRS. Other companies may calculate these measures differently. The following table reconciles these non-GAAP measures to the most directly comparable IFRS measure.
| | | | |
7 The amounts presented in the non-GAAP financial performance measure tables include the results of discontinued operations. |
| BARRICK THIRD QUARTER 2011 | | 55 | | MANAGEMENT’S DISCUSSION AND ANALYSIS |
Reconciliation of Net Earnings to Adjusted Net Earnings and Return on Equity1
| | | | | | | | | | | | | | | | |
| ($ millions, except per share amounts in dollars) | | For the three months
ended September 30 | | | For the nine months
ended September 30 | |
| | | 2011 | | | 2010 | | | 2011 | | | 2010 | |
Net earnings attributable to equity holders of the Company | | | $ 1,365 | | | | $ 942 | | | | $ 3,525 | | | | $ 2,621 | |
Significant tax adjustments not related to current period earnings | | | 28 | | | | - | | | | 36 | | | | (78) | |
Impairment charges (reversals) related to intangibles, property , plant and equipment, and investments | | | 14 | | | | (26) | | | | 18 | | | | (48) | |
Acquisition/disposition adjustments2 | | | (49) | | | | (11) | | | | (159) | | | | (42) | |
Foreign currency translation (gains)/losses | | | 3 | | | | (7) | | | | (26) | | | | 37 | |
Restructuring costs | | | - | | | | - | | | | 2 | | | | 40 | |
Acquisition related costs3 | | | 32 | | | | - | | | | 115 | | | | - | |
Unrealized (gains)/losses on non-hedge derivative instruments | | | (8) | | | | 14 | | | | (5) | | | | (31) | |
Adjusted net earnings | | | $1,385 | | | | $912 | | | | $3,506 | | | | $2,499 | |
Net earnings per share4 | | | $1.37 | | | | $0.96 | | | | $3.53 | | | | $2.66 | |
Adjusted net earnings per share4 | | | $1.39 | | | | $0.93 | | | | $3.51 | | | | $2.54 | |
Average Shareholders’ Equity | | | $21,977 | | | | $17,486 | | | | $20,924 | | | | $16,685 | |
Return on equity5 | | | 25% | | | | 21% | | | | 22% | | | | 20% | |
| 1 | Amounts presented in this table are post-tax. |
| 2 | For the three month period ended September 30, 2011, includes gains on sale of assets. For the nine month period ended September 30, 2011 includes gain on sale assets of $182 million, partially offset by a $23 million charge for the recognition of a liability for contingent consideration related to the acquisition of the additional 40% interest in Cortez property. |
| 3 | Represents expensed transaction costs, fair value inventory purchase adjustments and realized foreign exchange losses relating to our economic hedge of the purchase price related to the Equinox acquisition. |
| 4 | Calculated using weighted average number of shares outstanding under the basic method of earnings per share. |
| 5 | Calculated as annualized adjusted net earnings divided by average shareholders’ equity. |
Adjusted Operating Cash Flow
Adjusted operating cash flow is a non-GAAP financial measure which excludes the effect of elimination of gold sales contracts, the impact of one-time costs and working capital adjustments relating to business combinations; and the impact of VAT recoverable relating to capital expenditures at our projects.
Management uses adjusted operating cash flow as a measure internally to evaluate the underlying operating cash flow performance of the Company as a whole for the reporting periods presented, and to assist with the planning and forecasting of future operating cash flow. The elimination of gold sales contracts, one-time costs and working capital adjustments relating to business combinations; and the impact of VAT recoverable relating to capital expenditures at our projects are activities that are not reflective of the underlying
capacity of our operations to generate operating cash flow and therefore this adjustment will result in a more meaningful operating cash flow measure for investors and analysts to evaluate our performance in the period and assess our future operating cash flow-generating capability.
Adjusted operating cash flow is intended to provide additional information only and does not have any standardized definition under IFRS and should not be considered in isolation or as a substitute for measures of performance prepared in accordance with IFRS. The measure is not necessarily indicative of operating profit or cash flow from operations as determined under IFRS. Other companies may calculate these measures differently. The following table reconciles this non-GAAP measure to the most directly comparable IFRS measures.
Reconciliation of Adjusted Operating Cash Flow
| | | | | | | | | | | | | | | | |
| ($ millions) | | For the three months
ended September 30 | | | For the nine months
ended September 30 | |
| | | 2011 | | | 2010 | | | 2011 | | | 2010 | |
Operating cash flow | | | $1,889 | | | | $1,397 | | | | $4,014 | | | | $3,635 | |
Acquisition costs expensed and related working capital movements | | | 16 | | | | - | | | | 204 | | | | - | |
VAT recoverable | | | 13 | | | | 44 | | | | 77 | | | | 84 | |
Adjusted operating cash flow | | | $1,918 | | | | $1,441 | | | | $4,295 | | | | $3,719 | |
| | | | |
| BARRICK THIRD QUARTER 2011 | | 56 | | MANAGEMENT’S DISCUSSION AND ANALYSIS |
Total Cash Costs per ounce and Net Cash Costs per ounce
Total cash costs per ounce/pound and net cash costs per ounce are non-GAAP financial measures. Both measures include all costs absorbed into inventory, as well as royalties, and by-product credits, and exclude inventory purchase accounting adjustments, unrealized gains/losses from non-hedge currency and commodity contracts, and depreciation and accretion. These measures also include the gross margin generated by our Barrick Energy business unit, which was acquired to mitigate our exposure to oil prices as a credit against gold production costs. The presentation of these statistics in this manner allows us to monitor and manage those factors that impact production costs on a monthly basis. These measures are calculated by dividing the aggregate of the applicable costs by gold ounces or copper pounds sold. These measures are calculated on a consistent basis for the periods presented.
We have also adjusted our gold total cash costs to remove the impact of ore purchase agreements that have economic characteristics similar to a toll milling arrangement. The cost of producing these ounces is not indicative of our normal production costs. Hence, we have removed such costs from total cash costs.
We calculate total cash costs and net cash costs based on our equity interest in production from our mines. We believe that using an equity interest presentation is a fairer, more accurate way to measure economic performance than using a consolidated basis. For mines where we hold less than a 100% share in the production, we exclude the economic share of gold production attributable to the non-controlling interest. Consequently, our production and total cash costs and
net cash costs statistics only reflect our equity share of production.
Net cash costs measures the gross margin from all non-gold sales, whether or not these non-gold metals are produced in conjunction with gold, as a credit against the cost of producing gold. A number of other gold producers present their costs net of the contribution from non-gold sales. We believe that including a measure of net cash costs per ounce on this basis provides investors and analysts with information with which to compare our performance to other gold producers, and to better assess the overall performance of our business. In addition, this measure provides information to enable investors and analysts to understand the importance of non-gold revenues to our cost structure.
Total cash cost and net cash cost statistics are intended to provide additional information only and do not have any standardized definition under IFRS and should not be considered in isolation or as a substitute for measures of performance prepared in accordance with IFRS. The measures are not necessarily indicative of operating profit or cash flow from operations as determined under IFRS. Other companies may calculate these measures differently. The following tables reconcile these non-GAAP measures to the most directly comparable IFRS measure.
| | | | |
| BARRICK THIRD QUARTER 2011 | | 57 | | MANAGEMENT’S DISCUSSION AND ANALYSIS |
Reconciliation of Cost of Sales to Total Cash Costs per ounce/pound
| | | | | | | | | | | | | | | | | | | | | | | | | | | | | | | | |
| | | Gold | | | Copper | | | Oil and Gas | | | Total | |
For the three months ended September 30 | | | 2011 | | | | 2010 | | | | 2011 | | | | 2010 | | | | 2011 | | | | 2010 | | | | 2011 | | | | 2010 | |
Cost of Sales | | | $ 1,295 | | | | $ 1,161 | | | | $ 388 | | | | $ 115 | | | | $ 47 | | | | $ 25 | | | | $ 1,730 | | | | $ 1,301 | |
Less: Depreciation | | | 284 | | | | 279 | | | | 64 | | | | 23 | | | | 28 | | | | 14 | | | | 376 | | | | 316 | |
| | | | $ 1,011 | | | | $ 882 | | | | $ 324 | | | | $ 92 | | | | $ 19 | | | | $ 11 | | | | $ 1,354 | | | | $ 985 | |
| | | | |
| | | Gold | | | Copper | | | Oil and Gas | | | Total | |
For the nine months ended September 30 | | | 2011 | | | | 2010 | | | | 2011 | | | | 2010 | | | | 2011 | | | | 2010 | | | | 2011 | | | | 2010 | |
Cost of Sales | | | $ 3,792 | | | | $ 3,456 | | | | $ 683 | | | | $ 318 | | | | $ 108 | | | | $ 57 | | | | $ 4,583 | | | | $ 3,831 | |
Less: Depreciation | | | 840 | | | | 842 | | | | 109 | | | | 64 | | | | 68 | | | | 30 | | | | 1,017 | | | | 936 | |
| | | | $ 2,952 | | | | $ 2,614 | | | | $ 574 | | | | $ 254 | | | | $ 40 | | | | $ 27 | | | | $ 3,566 | | | | $ 2,895 | |
| | | | | | | | | | | | | | | | | | | | | | | | | | | | | | | | | | |
| | | For the three months ended September 30 | | | For the nine months ended September 30 | |
| | | Gold | | | Copper | | | Gold | | | | | Copper | |
| ($ millions, except per ounce/pound information in dollars) | | 2011 | | | 2010 | | | 2011 | | | 2010 | | | 2011 | | | 2010 | | | | | 2011 | | | 2010 | |
Cost of sales | | | $ 1,011 | | | | $ 882 | | | | $ 324 | | | | $ 92 | | | | $ 2,952 | | | | $ 2,614 | | | | | | $ 574 | | | | $ 254 | |
Cost of sales applicable to discontinued operations | | | - | | | | 2 | | | | - | | | | 11 | | | | | | | | 8 | | | | | | - | | | | 68 | |
Cost of sales applicable to non-controlling interests1 | | | (43) | | | | (30) | | | | - | | | | - | | | | (126) | | | | (60) | | | | | | - | | | | - | |
Cost of sales applicable to ore purchase arrangement | | | (38) | | | | (30) | | | | - | | | | - | | | | (100) | | | | (81) | | | | | | - | | | | - | |
Other metal sales | | | (35) | | | | (25) | | | | - | | | | (2) | | | | (104) | | | | (89) | | | | | | (3) | | | | (5) | |
Inventory purchase accounting adjustments | | | - | | | | - | | | | (44) | | | | - | | | | - | | | | - | | | | | | (63) | | | | - | |
Unrealized non-hedge gains/losses on fuel hedges | | | (3) | | | | - | | | | - | | | | - | | | | (6) | | | | - | | | | | | - | | | | - | |
Impact of Barrick Energy | | | (28) | | | | (14) | | | | - | | | | - | | | | (86) | | | | (36) | | | | | | - | | | | - | |
Total cash costs | | | $ 864 | | | | $ 785 | | | | $ 280 | | | | $ 101 | | | | $ 2,530 | | | | $ 2,356 | | | | | | $ 508 | | | | $ 317 | |
| Ounces/pounds sold - consolidated basis (000s ounces/millions pounds) | | | 1,963 | | | | 1,997 | | | | 146 | | | | 90 | | | | 5,845 | | | | 6,013 | | | | | | 309 | | | | 288 | |
| Ounces/pounds sold- non-controlling interest (000s ounces)1 | | | (55) | | | | (48) | | | | - | | | | - | | | | (160) | | | | (102) | | | | | | - | | | | - | |
| Ounces/pounds sold - equity basis (000s ounces/millions pounds) | | | 1,908 | | | | 1,949 | | | | 146 | | | | 90 | | | | 5,685 | | | | 5,911 | | | | | | 309 | | | | 288 | |
Total cash costs per ounce/per pound2 | | | $ 453 | | | | $ 403 | | | | $ 1.91 | | | | $ 1.12 | | | | $ 445 | | | | $ 399 | | | | | | $ 1.65 | | | | $ 1.10 | |
1 Relates to interest in ABG held by outside shareholders.
2 Total cash costs per ounce/pound may not calculate based on amounts presented in this table due to rounding.
| | | | |
| BARRICK THIRD QUARTER 2011 | | 58 | | MANAGEMENT’S DISCUSSION AND ANALYSIS |
Net Cash Costs per ounce
| | | | | | | | | | | | | | | | | | | | | | | | |
| | |
| ($ millions, except per ounce/pound data in dollars) | | For the three months ended September 30 | | | For the nine months ended September 30 | |
| | | | | 2011 | | | | | 2010 | | | | | 2011 | | | | | 2010 | |
Ounces gold sold - equity basis (000s) | | | | | 1,908 | | | | | | 1,949 | | | | | | 5,685 | | | | | | 5,911 | |
Total cash costs per ounce - equity basis | | | | | $ 453 | | | | | | $ 403 | | | | | | $ 445 | | | | | | $ 399 | |
Revenues from copper sales | | | | | 523 | | | | | | 270 | | | | | | 1,210 | | | | | | 733 | |
Revenues from copper sales of discontinued operations | | | | | - | | | | | | 30 | | | | | | - | | | | | | 170 | |
Inventory purchase accounting adjustments | | | | | 44 | | | | | | - | | | | | | 63 | | | | | | - | |
Realized non-hedge gold/copper derivative (losses) gains | | | | | (5 | ) | | | | | 9 | | | | | | (16 | ) | | | | | 19 | |
Net revenues from copper excluding realized non-hedge gains/losses from copper contracts | | | | | $ 562 | | | | | | $ 309 | | | | | | $ 1,257 | | | | | | $ 922 | |
Copper cost of sales per consolidated statement of income | | | | | 324 | | | | | | 92 | | | | | | 574 | | | | | | 254 | |
Copper cost of sales from discontinued operations | | | | | - | | | | | | 11 | | | | | | - | | | | | | 68 | |
Copper credits | | | | | 238 | | | | | | 206 | | | | | | 683 | | | | | | 600 | |
Copper credits per ounce1 | | | | | 125 | | | | | | 105 | | | | | | 120 | | | | | | 102 | |
Net cash costs per ounce | | | | | $ 328 | | | | | | $ 298 | | | | | | $ 325 | | | | | | $ 297 | |
| 1 | Copper credits per ounce for three and nine month periods ended September 30, 2011 and September 30, 2010 may not calculate based on amounts presented in this table due to rounding. |
EBITDA
EBITDA is a non-GAAP financial measure, which excludes the following from net earnings:
Management believes that EBITDA is a valuable indicator of the Company’s ability to generate liquidity by producing operating cash flow to: fund working capital needs, service debt obligations, and fund capital expenditures. Management uses EBITDA for this purpose. EBITDA is also frequently used by investors and analysts for valuation purposes whereby EBITDA is multiplied by a factor or “EBITDA multiple” that is based on observed or inferred relationship between EBITDA
and market values to determine the approximate total enterprise value of a company.
EBITDA is intended to provide additional information to investors and analysts, does not have any standardized definition under IFRS and should not be considered in isolation or as a substitute for measures of performance prepared in accordance with IFRS. EBITDA excludes the impact of cash costs of financing activities and taxes, and the effects of changes in operating working capital balances, and therefore is not necessarily indicative of operating profit or cash flow from operations as determined under IFRS. Other companies may calculate EBITDA differently.
The following table provides a reconciliation of EBITDA to net earnings.
| | | | |
| BARRICK THIRD QUARTER 2011 | | 59 | | MANAGEMENT’S DISCUSSION AND ANALYSIS |
Reconciliation of Net Earnings to EBITDA
| | | | | | | | | | | | | | | | |
| ($ millions, except per share amounts in dollars) | | For the three months ended September 30 | | | For the nine months ended September 30 | |
| | | 2011 | | | 2010 | | | 2011 | | | 2010 | |
Net earnings | | | $ 1,365 | | | | $ 942 | | | | $ 3,525 | | | | $ 2,621 | |
Income tax expense | | | 654 | | | | 376 | | | | 1,698 | | | | 1,052 | |
Finance costs | | | 68 | | | | 40 | | | | 148 | | | | 153 | |
Finance income | | | (3 | ) | | | (5 | ) | | | (10 | ) | | | (11) | |
Depreciation | | | 376 | | | | 316 | | | | 1,017 | | | | 936 | |
EBITDA | | | $ 2,460 | | | | $ 1,669 | | | | $ 6,378 | | | | $ 4,751 | |
Reported as: | | | | | | | | | | | | | | | | |
Gold | | | | | | | | | | | | | | | | |
North America | | | $ 1,098 | | | | $722 | | | | $ 2,781 | | | | $ 1,690 | |
South America | | | 547 | | | | 432 | | | | 1,445 | | | | 1,530 | |
Australia Pacific | | | 481 | | | | 275 | | | | 1,198 | | | | 765 | |
African Barrick Gold | | | 175 | | | | 88 | | | | 418 | | | | 288 | |
Copper | | | | | | | | | | | | | | | | |
South America | | | 143 | | | | 170 | | | | 555 | | | | 467 | |
Australia Pacific | | | 47 | | | | - | | | | 79 | | | | - | |
Capital Projects | | | (30 | ) | | | (4 | ) | | | (52 | ) | | | (8 | ) |
Barrick Energy | | | 21 | | | | 15 | | | | 71 | | | | 31 | |
Other | | | (22 | ) | | | (29 | ) | | | (117 | ) | | | (12 | ) |
EBITDA | | | $ 2,460 | | | | $ 1,669 | | | | $ 6,378 | | | | $ 4,751 | |
Realized Prices
Realized price is a non-GAAP financial measure which excludes from sales:
| • | | Unrealized gains and losses on non-hedge derivative contracts; |
| • | | Sales attributable to ore purchase arrangement; and |
This measure is intended to enable management to better understand the price realized in each reporting period for gold and copper sales because unrealized mark-to-market value of non-hedge gold and copper derivatives are subject to change each period due to changes in market factors such as market and forward gold and copper prices so that prices ultimately realized may differ from those recorded. The exclusion of such unrealized mark-to-market gains and losses from the presentation of this performance measure enables investors to understand performance based on the realized proceeds of selling gold and copper production.
The gains and losses on non-hedge derivatives and receivable balances relate to instruments/balances that mature in future periods, at which time the gains and losses will become realized. The amounts of these gains
and losses reflect fair values based on market valuation assumptions at the end of each period and do not necessarily represent the amounts that will become realized on maturity. We also exclude export duties that are paid upon sale and netted against revenues. We believe this provides investors and analysts with a more accurate measure with which to compare to market gold prices and to assess our gold sales performance. For those reasons, management believes that this measure provides a more accurate reflection of our past performance and is a better indicator of its expected performance in future periods.
The realized price measure is intended to provide additional information, and does not have any standardized definition under IFRS and should not be considered in isolation or as a substitute for measures of performance prepared in accordance with IFRS. The measure is not necessarily indicative of sales as determined under IFRS. Other companies may calculate this measure differently. The following table reconciles realized prices to the most directly comparable IFRS measure.
| | | | |
| BARRICK THIRD QUARTER 2011 | | 60 | | MANAGEMENT’S DISCUSSION AND ANALYSIS |
Reconciliation of Sales to Realized Price per ounce/per pound1
| | | | | | | | | | | | | | | | | | | | | | | | | | | | | | | | |
| | | For the three months ended September 30 | | | For the nine months ended September 30 | |
| | | Gold | | | Copper | | | Gold | | | Copper | |
| ($ millions, except per ounce/pound information in dollars) | | 2011 | | | 2010 | | | 2011 | | | 2010 | | | 2011 | | | 2010 | | | 2011 | | | 2010 | |
Sales | | | $ 3,397 | | | | $ 2,467 | | | | $ 523 | | | | $ 270 | | | | $ 9,063 | | | | $ 7,103 | | | | $ 1,210 | | | | $ 733 | |
Sales attributable to discontinued operations | | | - | | | | 6 | | | | - | | | | 30 | | | | - | | | | 30 | | | | - | | | | 170 | |
Sales applicable to non-controlling interests | | | (95) | | | | (61) | | | | - | | | | - | | | | (249) | | | | (126) | | | | - | | | | - | |
Sales attributable to ore purchase agreement | | | (41) | | | | (31) | | | | - | | | | - | | | | (108) | | | | (83) | | | | - | | | | - | |
Realized non-hedge gold/copper derivative (losses) gains | | | 46 | | | | 10 | | | | (5) | | | | 9 | | | | 54 | | | | 25 | | | | (16) | | | | 19 | |
Export duties | | | 18 | | | | 20 | | | | - | | | | | | | | 50 | | | | 49 | | | | - | | | | - | |
Revenues - as adjusted | | | $ 3,325 | | | | $ 2,411 | | | | $ 518 | | | | $ 309 | | | | $ 8,810 | | | | $ 6,998 | | | | $ 1,194 | | | | $ 922 | |
Ounces/pounds sold (000s ounces/millions pounds) | | | 1,908 | | | | 1,949 | | | | 146 | | | | 90 | | | | 5,685 | | | | 5,911 | | | | 309 | | | | 288 | |
Realized gold/copper price per ounce/pound1 | | | $ 1,743 | | | | $ 1,237 | | | | $ 3.54 | | | | $ 3.43 | | | | $ 1,550 | | | | $ 1,184 | | | | $ 3.87 | | | | $ 3.20 | |
| 1 | Realized price per ounce/pound may not calculate based on amounts presented in this table due to rounding. |
Net Cash Margin
Management uses a non-GAAP financial measure, net cash margin, which represents realized price per ounce less net cash costs per ounce. This measure is used by management to analyze profitability trends and to assess the cash-generating capability from the sale of gold on a consolidated basis in each reporting period, expressed on a unit basis. We believe that it illustrates the performance of our business on a consolidated basis and enables investors to better understand our performance in comparison to other gold producers who present results on a similar basis and is an important indicator of expected performance in future periods.
Net cash margin is intended to provide additional information, does not have any standardized definition under IFRS and should not be considered in isolation or as a substitute for measures of performance prepared in accordance with IFRS. This measure is not necessarily indicative of operating profit or cash flow from operations as determined under IFRS. Other companies may calculate cash margin differently. The following table derives this non-GAAP measure from previously defined non-GAAP measures of realized gold price per ounce, total cash costs per ounce, and copper credit per ounce, as determined in the net cash cost reconciliation. Net cash margin could also be derived from realized price per ounce and net cash costs per ounce.
Reconciliation of net cash margin per ounce
| | | | | | | | | | | | | | | | | | | | | | | | | | | | | | | | |
| | | For the three months ended September 30 | | | For the nine months ended September 30 | |
| | | Gold | | | Copper | | | Gold | | | Copper | |
| | | 2011 | | | 2010 | | | 2011 | | | 2010 | | | 2011 | | | 2010 | | | 2011 | | | 2010 | |
Realized gold/copper price per ounce/pound | | | $ 1,743 | | | | $ 1,237 | | | | $ 3.54 | | | | $ 3.43 | | | | $ 1,550 | | | | $ 1,184 | | | | $ 3.87 | | | | $ 3.20 | |
Total cash costs per ounce/per pound | | | 453 | | | | 403 | | | | 1.91 | | | | 1.12 | | | | 445 | | | | 399 | | | | 1.65 | | | | 1.10 | |
Total cash margin per ounce/per pound | | | $ 1,290 | | | | $ 834 | | | | $ 1.63 | | | | $ 2.31 | | | | $ 1,105 | | | | $ 785 | | | | $ 2.22 | | | | $ 2.10 | |
Copper credit per ounce1 | | | 125 | | | | 105 | | | | | | | | | | | | 120 | | | | 102 | | | | | | | | | |
Net cash margin per ounce | | | $ 1,415 | | | | $ 939 | | | | | | | | | | | | $ 1,225 | | | | $ 887 | | | | | | | | | |
| 1 | Copper credit per ounce is calculated as the margin from copper sales divided by gold ounces sold. Refer to the calculation in the net cash costs reconciliation on page 59. |
Adjusted Debt and Net Debt
Management uses non-GAAP financial measures “adjusted debt” and “net debt” since they are more indicative of how we manage our debt levels internally than the IFRS measure. We believe these measures provide a meaningful measure for investors and analysts to evaluate our overall debt capacity, liquidity and capital structure. Adjusted debt and net debt are intended to provide additional information, do not have any standardized definition under IFRS and should not be
considered in isolation or as a substitute for measures of performance prepared in accordance with IFRS.
| | | | |
| BARRICK THIRD QUARTER 2011 | | 61 | | MANAGEMENT’S DISCUSSION AND ANALYSIS |
We have adjusted our long-term debt to exclude fair value on other adjustments and our partner’s share of project financing to arrive at adjusted debt. We have excluded the impact of fair value and other adjustments in order to reflect the actual settlement obligation in relation to the debt instrument. We have excluded our partners’ shares
of project financing, where Barrick has provided a guarantee only for its proportionate share of the debt. We then deduct our cash and equivalents (net of our partner’s share of cash held at Pueblo Viejo) to arrive at net debt.
Adjusted Debt and Net Debt Summary
| | | | | | | | |
| | |
| (in $ millions) | | As at September 30, 2011 | | | As at December 31, 2010 | |
Debt per financial statements | | | $ 13,383 | | | | $ 6,638 | |
Fair value and other adjustments1 | | | 42 | | | | 67 | |
Pueblo Viejo financing - partner’s share2 | | | (376) | | | | (313) | |
Adjusted debt | | | $ 13,049 | | | | $ 6,392 | |
Cash and equivalents | | | (2,965) | | | | (3,968) | |
Cash and equivalents - partner’s share at Pueblo Viejo2 | | | 2 | | | | 3 | |
Net debt | | | $ 10,086 | | | | $ 2,427 | |
| 1 | Other adjustments primarily relate to issue costs which have been netted against the debts. |
| 2 | We consolidate 100% of Pueblo Viejo in our financial statements; however we have guaranteed only our 60% share of the $940 million financing received to this point. Therefore, we have removed our partner’s share of both the financing and cash and equivalents to ensure comparability. |
| | | | |
| BARRICK THIRD QUARTER 2011 | | 62 | | MANAGEMENT’S DISCUSSION AND ANALYSIS |
Consolidated Statements of Income
| | | | | | | | | | | | | | | | |
Barrick Gold Corporation (in millions of United States dollars, except per share data) (Unaudited) | | Three months ended
September 30, | | | Nine months ended
September 30, | |
| | | 2011 | | | 2010 | | | 2011 | | | 2010 | |
| | | | |
Revenue (notes 5 and 6) | | $ | 4,007 | | | $ | 2,788 | | | $ | 10,523 | | | $ | 7,990 | |
Costs and expenses | | | | | | | | | | | | | | | | |
Cost of sales (notes 5 and 7) | | | 1,730 | | | | 1,301 | | | | 4,583 | | | | 3,831 | |
Corporate administration | | | 43 | | | | 37 | | | | 123 | | | | 115 | |
Exploration and evaluation (note 8) | | | 94 | | | | 56 | | | | 248 | | | | 156 | |
Other expense (note 10A) | | | 135 | | | | 96 | | | | 391 | | | | 330 | |
Impairment charges (reversals) (note 10B) | | | 19 | | | | (29 | ) | | | 23 | | | | (53) | |
| | | 2,021 | | | | 1,461 | | | | 5,368 | | | | 4,379 | |
Other income (note 10C) | | | 76 | | | | 35 | | | | 238 | | | | 92 | |
Income (loss) from equity investees (note 14) | | | 8 | | | | (3 | ) | | | 13 | | | | (27) | |
Gain (loss) on non-hedge derivatives (note 18E) | | | 32 | | | | (4 | ) | | | 8 | | | | 84 | |
Income before finance items and income taxes | | | 2,102 | | | | 1,355 | | | | 5,414 | | | | 3,760 | |
Finance items (note 11) | | | | | | | | | | | | | | | | |
Finance income | | | 3 | | | | 5 | | | | 10 | | | | 11 | |
Finance costs | | | (68 | ) | | | (40 | ) | | | (148 | ) | | | (153) | |
Income before income taxes | | | 2,037 | | | | 1,320 | | | | 5,276 | | | | 3,618 | |
Income tax expense (note 12) | | | (654 | ) | | | (376 | ) | | | (1,698 | ) | | | (1,052) | |
Income from continuing operations | | | 1,383 | | | | 944 | | | | 3,578 | | | | 2,566 | |
Income from discontinued operations (note 4G) | | | - | | | | 11 | | | | - | | | | 82 | |
Net income | | $ | 1,383 | | | $ | 955 | | | $ | 3,578 | | | $ | 2,648 | |
Attributable to: | | | | | | | | | | | | | | | | |
Equity holders of Barrick Gold Corporation | | $ | 1,365 | | | $ | 942 | | | $ | 3,525 | | | $ | 2,621 | |
Non-controlling interests (note 22) | | $ | 18 | | | $ | 13 | | | $ | 53 | | | $ | 27 | |
|
Earnings per share data attributable to the equity holders of Barrick Gold Corporation (note 9) | |
Income from continuing operations | | | | | | | | | | | | | | | | |
Basic | | $ | 1.37 | | | $ | 0.94 | | | $ | 3.53 | | | $ | 2.58 | |
Diluted | | $ | 1.36 | | | $ | 0.93 | | | $ | 3.52 | | | $ | 2.55 | |
Income from discontinued operations | | | | | | | | | | | | | | | | |
Basic | | $ | - | | | $ | 0.02 | | | $ | - | | | $ | 0.08 | |
Diluted | | $ | - | | | $ | 0.01 | | | $ | - | | | $ | 0.08 | |
Net income | | | | | | | | | | | | | | | | |
Basic | | $ | 1.37 | | | $ | 0.96 | | | $ | 3.53 | | | $ | 2.66 | |
Diluted | | $ | 1.36 | | | $ | 0.94 | | | $ | 3.52 | | | $ | 2.63 | |
The accompanying notes are an integral part of these consolidated financial statements.
| | | | |
| BARRICK THIRD QUARTER 2011 | | 63 | | FINANCIAL STATEMENTS (UNAUDITED) |
Consolidated Statements of Comprehensive Income
| | | | | | | | | | | | | | | | |
Barrick Gold Corporation (in millions of United States dollars) (Unaudited) | | Three months ended September 30, | | | Nine months ended September 30, | |
| | | 2011 | | | 2010 | | | 2011 | | | 2010 | |
Net income | | $ | 1,383 | | | $ | 955 | | | $ | 3,578 | | | $ | 2,648 | |
| | | | |
Other comprehensive income, net of taxes | | | | | | | | | | | | | | | | |
Unrealized gains (losses) on available-for-sale (“AFS”) financial securities, net of tax $10, $3, $7, $1 | | | (75 | ) | | | 28 | | | | (70 | ) | | | 27 | |
Realized (gains) losses and impairments on AFS financial securities, net of tax $1, $1, $6, $nil | | | (6 | ) | | | (7 | ) | | | (50 | ) | | | (8 | ) |
Unrealized gains (losses) on derivatives designated as cash flow hedges, net of tax $4, $118, $17, $76 | | | (162 | ) | | | 435 | | | | 165 | | | | 294 | |
Realized gains on derivatives designated as cash flow hedges, net of tax $3, $4, $49, $13 | | | (124 | ) | | | (15 | ) | | | (300 | ) | | | (52 | ) |
Currency translation adjustments, net of tax $nil, $nil, $nil, $nil | | | (94 | ) | | | 14 | | | | (61 | ) | | | 1 | |
Total other comprehensive income (loss) | | | (461 | ) | | | 455 | | | | (316 | ) | | | 262 | |
Total comprehensive income | | $ | 922 | | | $ | 1,410 | | | $ | 3,262 | | | $ | 2,910 | |
Attributable to: | | | | | | | | | | | | | | | | |
| | | | |
Equity holders of Barrick Gold Corporation | | $ | 904 | | | $ | 1,397 | | | $ | 3,209 | | | $ | 2,883 | |
| | | | |
Non-controlling interests | | $ | 18 | | | $ | 13 | | | $ | 53 | | | $ | 27 | |
The accompanying notes are an integral part of these consolidated financial statements.
| | | | |
| BARRICK THIRD QUARTER 2011 | | 64 | | FINANCIAL STATEMENTS (UNAUDITED) |
Consolidated Statements of Cash Flow
| | | | | | | | | | | | | | | | |
Barrick Gold Corporation (in millions of United States dollars) (Unaudited) | | Three months ended
September 30, | | | Nine months ended
September 30, | |
| | | 2011 | | | 2010 | | | 2011 | | | 2010 | |
OPERATING ACTIVITIES | | | | | | | | | | | | | | | | |
Net income | | $ | 1,383 | | | $ | 955 | | | $ | 3,578 | | | $ | 2,648 | |
Adjusted for the following items: | | | | | | | | | | | | | | | | |
Depreciation | | | 376 | | | | 316 | | | | 1,017 | | | | 936 | |
Accretion | | | 16 | | | | 5 | | | | 40 | | | | 17 | |
Impairment charges (reversals) (note 10B) | | | 19 | | | | (29 | ) | | | 23 | | | | (53 | ) |
Income tax expense (note 12) | | | 654 | | | | 376 | | | | 1,698 | | | | 1,052 | |
Increase in inventory | | | (199 | ) | | | (110 | ) | | | (455 | ) | | | (242 | ) |
Gain on sale/acquisition of long-lived assets/investments | | | (69 | ) | | | (16 | ) | | | (225 | ) | | | (66 | ) |
Other (note 13A) | | | 234 | | | | 148 | | | | (62 | ) | | | 120 | |
Operating cash flows before interest and income taxes | | | 2,414 | | | | 1,645 | | | | 5,614 | | | | 4,412 | |
Net interest paid | | | (55 | ) | | | (97 | ) | | | (106 | ) | | | (208 | ) |
Income taxes paid | | | (470 | ) | | | (151 | ) | | | (1,494 | ) | | | (569 | ) |
Net cash provided by operating activities | | | 1,889 | | | | 1,397 | | | | 4,014 | | | | 3,635 | |
INVESTING ACTIVITIES | | | | | | | | | | | | | | | | |
Property, plant and equipment | | | | | | | | | | | | | | | | |
Capital expenditures (note 5) | | | (1,514 | ) | | | (907 | ) | | | (3,653 | ) | | | (2,467 | ) |
Sales proceeds | | | 15 | | | | 27 | | | | 48 | | | | 35 | |
Acquisitions (note 4) | | | (337 | ) | | | (61 | ) | | | (7,677 | ) | | | (813 | ) |
Investments | | | | | | | | | | | | | | | | |
Purchases | | | (63 | ) | | | (26 | ) | | | (72 | ) | | | (28 | ) |
Sales | | | 9 | | | | 10 | | | | 80 | | | | 10 | |
Other investing activities (note 13B) | | | (8 | ) | | | (12 | ) | | | (81 | ) | | | (44 | ) |
Net cash used in investing activities | | | (1,898 | ) | | | (969 | ) | | | (11,355 | ) | | | (3,307 | ) |
FINANCING ACTIVITIES | | | | | | | | | | | | | | | | |
Proceeds on exercise of stock options | | | 10 | | | | 18 | | | | 41 | | | | 49 | |
Proceeds from public issuance of common shares by a subsidiary (note 4E) | | | - | | | | - | | | | - | | | | 884 | |
Long-term debt | | | | | | | | | | | | | | | | |
Proceeds | | | - | | | | - | | | | 6,659 | | | | 782 | |
Repayments | | | (16 | ) | | | (72 | ) | | | (365 | ) | | | (147 | ) |
Dividends | | | (119 | ) | | | (118 | ) | | | (359 | ) | | | (315 | ) |
Funding from non-controlling interests | | | 119 | | | | 28 | | | | 298 | | | | 12 | |
Deposit on silver sale agreement | | | 138 | | | | 137 | | | | 138 | | | | 137 | |
Other financing activities (note 13C) | | | (2 | ) | | | (4 | ) | | | (67 | ) | | | (22 | ) |
Net cash provided by (used in) financing activities | | | 130 | | | | (11 | ) | | | 6,345 | | | | 1,380 | |
Effect of exchange rate changes on cash and equivalents | | | (19 | ) | | | 13 | | | | (7 | ) | | | 9 | |
Net increase (decrease) in cash and equivalents | | | 102 | | | | 430 | | | | (1,003 | ) | | | 1,717 | |
Cash and equivalents at beginning of period (note 18A) | | | 2,863 | | | | 3,851 | | | | 3,968 | | | | 2,564 | |
Cash and equivalents at end of period (note 18A) | | $ | 2,965 | | | $ | 4,281 | | | $ | 2,965 | | | $ | 4,281 | |
The accompanying notes are an integral part of these consolidated financial statements.
| | | | |
| BARRICK THIRD QUARTER 2011 | | 65 | | FINANCIAL STATEMENTS (UNAUDITED) |
Consolidated Balance Sheets
| | | | | | | | | | | | |
Barrick Gold Corporation (in millions of United States dollars) (Unaudited) | | As at September 30, | | | As at December 31, | | | As at January 1, | |
| | | 2011 | | | 2010 | | | 2010 | |
ASSETS | | | | | | | | | | | | |
Current assets | | | | | | | | | | | | |
Cash and equivalents (note 18A) | | $ | 2,965 | | | $ | 3,968 | | | $ | 2,564 | |
Accounts receivable | | | 444 | | | | 370 | | | | 259 | |
Inventories (note 15) | | | 2,249 | | | | 1,798 | | | | 1,488 | |
Other current assets | | | 906 | | | | 935 | | | | 518 | |
Total current assets (excluding assets classified as held for sale) | | | 6,564 | | | | 7,071 | | | | 4,829 | |
Assets classified as held for sale | | | - | | | | - | | | | 100 | |
Total current assets | | | 6,564 | | | | 7,071 | | | | 4,929 | |
| | | |
Non-current assets | | | | | | | | | | | | |
Equity in investees (note 14) | | | 440 | | | | 396 | | | | 1,124 | |
Other investments | | | 188 | | | | 171 | | | | 62 | |
Property, plant and equipment (note 16) | | | 27,007 | | | | 17,890 | | | | 13,378 | |
Goodwill (note 17) | | | 9,557 | | | | 6,096 | | | | 5,197 | |
Intangible assets | | | 500 | | | | 475 | | | | 275 | |
Deferred income tax assets | | | 537 | | | | 625 | | | | 601 | |
Other assets | | | 2,034 | | | | 1,913 | | | | 1,358 | |
Total assets | | $ | 46,827 | | | $ | 34,637 | | | $ | 26,924 | |
LIABILITIES AND EQUITY | | | | | | | | | | | | |
Current liabilities | | | | | | | | | | | | |
Accounts payable | | | 1,890 | | | | 1,511 | | | | 1,221 | |
Debt | | | 198 | | | | 14 | | | | 54 | |
Current income tax liabilities | | | 451 | | | | 550 | | | | 104 | |
Other current liabilities | | | 354 | | | | 416 | | | | 366 | |
Total current liabilities (excluding liabilities classified as held for sale) | | | 2,893 | | | | 2,491 | | | | 1,745 | |
Liabilities classified as held for sale | | | - | | | | - | | | | 49 | |
Total current liabilities | | | 2,893 | | | | 2,491 | | | | 1,794 | |
| | | |
Non-current liabilities | | | | | | | | | | | | |
Debt (note 18B) | | | 13,185 | | | | 6,624 | | | | 6,124 | |
Provisions (note 20) | | | 2,137 | | | | 1,768 | | | | 1,408 | |
Deferred income tax liabilities | | | 3,396 | | | | 1,971 | | | | 960 | |
Other liabilities (note 19) | | | 752 | | | | 566 | | | | 884 | |
Total liabilities | | | 22,363 | | | | 13,420 | | | | 11,170 | |
Equity | | | | | | | | | | | | |
Capital stock (note 21) | | | 17,873 | | | | 17,820 | | | | 17,392 | |
Retained earnings (deficit) | | | 3,777 | | | | 611 | | | | (2,535) | |
Accumulated other comprehensive income | | | 411 | | | | 727 | | | | 232 | |
Other | | | 314 | | | | 314 | | | | 143 | |
Total equity attributable to Barrick Gold Corporation shareholders | | | 22,375 | | | | 19,472 | | | | 15,232 | |
Non-controlling interests (note 22) | | | 2,089 | | | | 1,745 | | | | 522 | |
Total equity | | | 24,464 | | | | 21,217 | | | | 15,754 | |
Contingencies and commitments (note 16 and 23) | | | | | | | | | | | | |
Total liabilities and equity | | $ | 46,827 | | | $ | 34,637 | | | $ | 26,924 | |
The accompanying notes are an integral part of these consolidated financial statements.
| | | | |
| BARRICK THIRD QUARTER 2011 | | 66 | | FINANCIAL STATEMENTS (UNAUDITED) |
Consolidated Statements of Changes in Equity
| | | | | | | | | | | | | | | | | | | | | | | | | | | | |
| Barrick Gold Corporation | | Attributable to equity holders of the company | | | | | | | |
(in millions of United States dollars)
(Unaudited) | | Capital stock | | | Retained
earnings
(deficit) | | | Accumulated
other
comprehensive
income (loss) | | | Other1 | | | Total equity
attributable to shareholders | | | Non-controlling
interests | | | Total equity | |
At January 1, 2011 | | $ | 17,820 | | | $ | 611 | | | $ | 727 | | | $ | 314 | | | $ | 19,472 | | | $ | 1,745 | | | $ | 21,217 | |
Net income | | | - | | | | 3,525 | | | | - | | | | - | | | | 3,525 | | | | 53 | | | | 3,578 | |
Total other comprehensive income (loss) | | | - | | | | - | | | | (316 | ) | | | - | | | | (316 | ) | | | - | | | | (316) | |
Total comprehensive income | | | - | | | | 3,525 | | | | (316 | ) | | | - | | | | 3,209 | | | | 53 | | | | 3,262 | |
Transactions with owners | | | | | | | | | | | | | | | | | | | | | | | | | | | | |
Dividends | | | - | | | | (359 | ) | | | - | | | | - | | | | (359 | ) | | | - | | | | (359) | |
Issued on exercise of stock options | | | 41 | | | | - | | | | - | | | | - | | | | 41 | | | | - | | | | 41 | |
Recognition of stock option expense | | | 12 | | | | - | | | | - | | | | - | | | | 12 | | | | - | | | | 12 | |
Funding from non-controlling interests | | | - | | | | - | | | | - | | | | - | | | | - | | | | 298 | | | | 298 | |
Other decrease in non-controlling interests | | | - | | | | - | | | | - | | | | - | | | | - | | | | (7 | ) | | | (7) | |
Total transactions with owners | | | 53 | | | | (359 | ) | | | - | | | | - | | | | (306 | ) | | | 291 | | | | (15) | |
At September 30, 2011 | | $ | 17,873 | | | $ | 3,777 | | | $ | 411 | | | $ | 314 | | | $ | 22,375 | | | $ | 2,089 | | | $ | 24,464 | |
| | | | | | | | | | | | | | | | | | | | | | | | | | | | |
At January 1, 2010 | | $ | 17,392 | | | $ | (2,535 | ) | | $ | 232 | | | $ | 143 | | | $ | 15,232 | | | $ | 522 | | | $ | 15,754 | |
Net income | | | - | | | | 2,621 | | | | - | | | | - | | | | 2,621 | | | | 27 | | | | 2,648 | |
Total other comprehensive income | | | - | | | | - | | | | 262 | | | | - | | | | 262 | | | | - | | | | 262 | |
Total comprehensive income | | | - | | | | 2,621 | | | | 262 | | | | - | | | | 2,883 | | | | 27 | | | | 2,910 | |
Transactions with owners | | | | | | | | | | | | | | | | | | | | | | | | | | | | |
Dividends | | | - | | | | (315 | ) | | | - | | | | - | | | | (315 | ) | | | - | | | | (315) | |
Issued on exercise of stock options | | | 49 | | | | - | | | | - | | | | - | | | | 49 | | | | - | | | | 49 | |
Recognition of stock option expense | | | 12 | | | | - | | | | - | | | | - | | | | 12 | | | | - | | | | 12 | |
Recognized on initial public offering of African Barrick Gold (note 4E) | | | - | | | | - | | | | - | | | | 276 | | | | 276 | | | | - | | | | 276 | |
Funding from non-controlling interests | | | - | | | | - | | | | - | | | | - | | | | - | | | | 12 | | | | 12 | |
Other increase in non-controlling interests | | | - | | | | - | | | | - | | | | - | | | | - | | | | 1,061 | | | | 1,061 | |
Total transactions with owners | | | 61 | | | | (315 | ) | | | - | | | | 276 | | | | 22 | | | | 1,073 | | | | 1,095 | |
At September 30, 2010 | | $ | 17,453 | | | $ | (229 | ) | | $ | 494 | | | $ | 419 | | | $ | 18,137 | | | $ | 1,622 | | | $ | 19,759 | |
1 Includes additional paid-in capital as at September 30, 2011: $276 million (December 31, 2010: $276 million; September 30, 2010: $276 million; January 1, 2010: $ nil) and convertible borrowings - equity component as at September 30, 2011: $38 million (December 31, 2010: $38 million; September 30, 2010: $143 million; January 1, 2010: $143 million).
The accompanying notes are an integral part of these consolidated financial statements.
| | | | |
| BARRICK THIRD QUARTER 2011 | | 67 | | FINANCIAL STATEMENTS (UNAUDITED) |
NOTES TO CONSOLIDATED
FINANCIAL STATEMENTS
Barrick Gold Corporation.Tabular dollar amounts in millions of United States dollars, unless otherwise shown. References to C$, A$, ZAR, CLP, PGK, TZS, JPY, ARS, GBP, EUR and ZMK are to Canadian dollars, Australian dollars, South African rand, Chilean pesos, Papua New Guinea kina, Tanzanian schillings, Japanese yen, Argentinean pesos, British Pound Sterling, Euros and Zambian Kwacha, respectively.
1 > CORPORATE INFORMATION
Barrick Gold Corporation (“Barrick” or the “Company”) is a corporation governed by the Business Corporation Act (Ontario). We are principally engaged in the production and sale of gold and copper, as well as related activities such as exploration and mine development. We also hold interests in oil and gas properties located in Canada. Our producing mines are concentrated in three regional business units (“RBU”): North America, South America, and Australia Pacific. We also hold a 73.9% equity interest in African Barrick Gold plc (“ABG”), a company listed on the London Stock Exchange that owns gold mines and exploration properties in Africa. We sell our gold production into the world market and we sell our copper production into the world market and to private customers.
Seasonality does not have a significant impact on the Company’s operations.
2 > SIGNIFICANT ACCOUNTING POLICIES
| A) | Statement of Compliance |
These interim financial statements have been prepared in accordance with International Accounting Standard 34 Interim Financial Reporting (“IAS 34”) as issued by the International Accounting Standards Board (“IASB”). The policies applied in these interim financial statements are based on International Financial Reporting Standards (“IFRS”) issued and outstanding as at October 26, 2011, the date the Board of Directors approved these interim financial statements for issue. Any subsequent changes to IFRS that are issued and effective as at December 31, 2011 could result in a restatement of these interim financial statements, including the transition adjustments recognized on conversion to IFRS.
Prior to the adoption of IFRS, our primary financial statements were prepared in accordance with United States generally accepted accounting principles (“US GAAP”). Disclosure of our elected transition exemptions
and reconciliation and explanation of accounting policy differences compared to US GAAP have been provided in Note 3 to these financial statements.
These interim financial statements should be read in conjunction with the Company’s 2010 annual financial statements, which were prepared in accordance with US GAAP, and in consideration of the IFRS disclosures included in Note 3 to these interim financial statements.
Subsidiaries
These financial statements include the accounts of Barrick and its consolidated subsidiaries. All intercompany balances, transactions, income and expenses, and profits or losses have been eliminated on consolidation. We consolidate subsidiaries where we have the ability to exercise control. Control is achieved when we have the power to govern the financial and operating policies of the entity. Control is normally achieved through ownership, directly or indirectly, of more than 50 percent of the voting power. Control can also be achieved through power over more than half of the voting rights by virtue of an agreement with other investors or through the exercise of de facto control. For non wholly-owned subsidiaries, the net assets attributable to outside equity shareholders are presented as “non-controlling interests” in the equity section of the consolidated balance sheet. Profit for the period that is attributable to non-controlling interests is calculated based on the ownership of the minority shareholders in the subsidiary.
Joint Ventures
A joint venture is a contractual arrangement whereby two or more parties undertake an economic activity that is subject to joint control. Joint control is the contractually agreed sharing of control such that significant operating and financial decisions require the unanimous consent of the parties sharing control. Our joint ventures consist of jointly controlled assets (“JCAs”) and jointly controlled entities (“JCEs”).
A JCA is a joint venture in which the venturers have control over the assets contributed to or acquired for the purposes of the joint venture. JCAs do not involve the establishment of a corporation, partnership or other entity. The participants in a JCA derive benefit from the joint activity through a share of production, rather than by receiving a share of the net operating results. Our proportionate
| | | | |
| BARRICK THIRD QUARTER 2011 | | 68 | | NOTES TO FINANCIAL STATEMENTS (UNAUDITED) |
interest in the assets, liabilities, revenues, expenses, and cash flows of JCAs are incorporated into the consolidated financial statements under the appropriate headings.
A JCE is a joint venture that involves the establishment of a corporation, partnership or other entity in which each venturer has a long term interest. We account for our interests in JCEs using the equity method of accounting.
On acquisition, an equity method investment is initially recognized at cost. The carrying amount of equity method investments includes goodwill identified on acquisition, net of any accumulated impairment losses. The carrying amount is adjusted by our share of post acquisition net income or loss, depreciation, amortization or impairment of the fair value adjustments made at the date of acquisition, and our share of post acquisition movements in Other Comprehensive Income (“OCI”).
Associates
An associate is an entity, over which the investor has significant influence but not control and that is neither a subsidiary nor an interest in a joint venture. Significant influence is presumed to exist where the Company has between 20 percent and 50 percent of the voting rights, but can also arise where the Company has less than 20 percent if we have the power to be actively involved and influential in policy decisions affecting the entity. Our share of the net assets and net income or loss are accounted for in the consolidated financial statements using the equity method of accounting.
Consolidation Method at September 30, 2011
Outlined below are the accounting methods used for entities other than 100% owned Barrick subsidiaries:
| | | | | | |
| | | Entity type at September 30, 2011 | | Economic Interest at September 30, 20111 | | Method |
North America | | | | | | |
Marigold Mine | | JCA | | 33% | | Proportional |
Round Mountain Mine | | JCA | | 50% | | Proportional |
Turquoise Ridge Mine | | JCA | | 75% | | Proportional |
Australia | | | | | | |
Kalgoorlie Mine | | JCA | | 50% | | Proportional |
Porgera Mine | | JCA | | 95% | | Proportional |
ABG2 | | Subsidiary | | 73.9% | | Consolidation |
Capital Projects | | | | | | |
Pueblo Viejo Project3 | | Subsidiary | | 60% | | Consolidation |
Cerro Casale Project3 | | Subsidiary | | 75% | | Consolidation |
Donlin Gold Project | | JCE | | 50% | | Equity Method |
Reko Diq Project4 | | JCE | | 37.5% | | Equity Method |
Kabanga Project | | JCE | | 50% | | Equity Method |
Highland Gold | | Associate | | 20% | | Equity Method |
| 1 | Unless otherwise noted, all of our joint ventures are funded by contributions made by their partners in proportion to their economic interest. |
| 2 | In 2010, we completed an initial public offering (“IPO”) for a non-controlling interest in our African gold mining operations. As a result of this transaction, our economic interest in the North Mara, Bulyanhulu and Buzwagi gold mines was reduced from 100% to 73.9% and our economic interest in the Tulawaka gold mine was reduced from 70% to 51.7%. |
| 3 | We consolidate our interests in Pueblo Viejo, Cerro Casale and ABG and record a non-controlling interest for the 40%, 25% and 26.1%, respectively, that we do not own. |
| 4 | We hold a 50% interest in Atacama Copper, which has a 75% interest in the Reko Diq project. |
On the acquisition of a business, the acquisition method of accounting is used, whereby the purchase consideration is allocated to the identifiable assets and liabilities on the basis of fair value at the date of acquisition. Provisional fair values allocated at a reporting date are finalized within twelve months of the acquisition date with retroactive
restatement to the acquisition date as required. Incremental costs related to the acquisition are expensed as incurred.
When purchase consideration is contingent on future events, the initial cost of the acquisition recorded includes an estimate of the fair value of the contingent amounts
| | | | |
| BARRICK THIRD QUARTER 2011 | | 69 | | NOTES TO FINANCIAL STATEMENTS (UNAUDITED) |
expected to be payable in the future. When the fair value of contingent consideration as at the date of acquisition is finalized before the end of the twelve month measurement period, the adjustment is allocated to the identifiable assets and liabilities acquired. Subsequent changes to the estimated fair value of contingent consideration are recorded in the consolidated statement of income.
When the cost of the acquisition exceeds the fair values of the identifiable net assets acquired, the difference is recorded as goodwill. If the fair value attributable to Barrick’s share of the identifiable net assets exceeds the cost of acquisition, the difference is recognized as a gain in the consolidated statement of income.
Non-controlling interests represent the fair value of net assets in subsidiaries, as at the date of acquisition, that are not held by Barrick and are presented in the equity section of the consolidated balance sheet.
When control of a subsidiary is acquired in stages, its carrying value prior to the change in control is compared with the fair value of the identifiable net assets at the date of the change of control. If fair value is greater than/less than carrying value, a gain/loss is recorded in the consolidated statement of income.
| D) | Discontinued Operations |
A discontinued operation is a component of the Company that can be clearly distinguished from the rest of the Company, both operationally and for financial reporting purposes, and is expected to be recovered primarily through sale rather than continuing use. The assets and liabilities are presented as held for sale in the consolidated balance sheet when the relevant criteria are met. Results of operations and any gain or loss from disposal are excluded from earnings before finance items and tax and are reported separately as Income from discontinued operations.
| E) | Foreign Currency Translation |
The functional currency for the Company, for each subsidiary of the Company, and for joint ventures and associates, is the currency of the primary economic environment in which it operates. The functional currency of our gold and copper operations is the US dollar. We translate non-US dollar balances for these operations into US dollars as follows:
| • | | Property, plant and equipment (“PP&E”), intangible assets and equity method investments using historical rates; |
| • | | Available-for-sale securities using the closing exchange rate as at the balance sheet date with translation gains and losses recorded in OCI; |
| • | | Environmental rehabilitation provisions using the closing exchange rate as at the balance sheet date; |
| • | | Deferred tax assets and liabilities using the closing exchange rate as at the balance sheet date with translation gains and losses recorded in income tax expense; |
| • | | Other assets and liabilities using the closing exchange rate as at the balance sheet date with translation gains and losses recorded in other income/expense; and |
| • | | Income and expenses using the average exchange rate for the period, except for expenses that relate to non-monetary assets and liabilities measured at historical rates, which are translated using the same historical rate as the associated non-monetary assets and liabilities. |
The functional currency of our oil and gas operations is the Canadian dollar. We translate non-US dollar balances related to these operations into US dollars as follows:
| • | | Assets and liabilities using the closing exchange rate as at the balance sheet date with translation gains and losses recorded in OCI; and |
| • | | Income and expense using the average exchange rate for the period with translation gains and losses recorded in OCI. |
We record revenue when evidence exists that all of the following criteria are met:
| • | | The significant risks and rewards of ownership of the product have been transferred to the buyer; |
| • | | Neither continuing managerial involvement to the degree usually associated with ownership, nor effective control over the goods sold, has been retained; |
| • | | The amount of revenue can be reliably measured; |
| • | | It is probable that the economic benefits associated with the sale will flow to us; and |
| • | | The costs incurred or to be incurred in respect of the sale can be reliably measured. |
These conditions are generally satisfied when title passes to the customer.
| G) | Exploration and Evaluation |
Exploration expenditures are the costs incurred in the initial search for mineral deposits with economic potential or in the process of obtaining more information about existing mineral deposits. Exploration expenditures typically include costs associated with prospecting, sampling, mapping, diamond drilling and other work involved in searching for ore.
| | | | |
| BARRICK THIRD QUARTER 2011 | | 70 | | NOTES TO FINANCIAL STATEMENTS (UNAUDITED) |
Evaluation expenditures are the costs incurred to establish the technical and commercial viability of developing mineral deposits identified through exploration activities or by acquisition. Evaluation expenditures include the cost of (i) establishing the volume and grade of deposits through drilling of core samples, trenching and sampling activities in an ore body that is classified as either a mineral resource or a proven and probable reserve; (ii) determining the optimal methods of extraction and metallurgical and treatment processes; (iii) studies related to surveying, transportation and infrastructure requirements; (iv) permitting activities; and (v) economic evaluations to determine whether development of the mineralized material is commercially justified, including scoping, prefeasibility and final feasibility studies.
Exploration and evaluation expenditures are capitalized if management determines that probable future economic benefits will be generated as a result of the expenditures.
Cash flows attributable to capitalized exploration and evaluation expenditures are classified as investing activities in the consolidated statement of cash flow.
For our petroleum and natural gas properties, we follow the successful efforts method of accounting, whereby exploration expenditures that are either general in nature or related to an unsuccessful drilling program are recorded as exploration expense in the consolidated statement of income. Only costs that relate directly to the discovery and development of specific commercial oil and gas reserves are capitalized as development costs.
Earnings per share is computed by dividing net income available to common shareholders by the weighted average number of common shares outstanding for the period. Diluted earnings per share reflect the potential dilution that could occur if additional common shares are assumed to be issued under securities that entitle their holders to obtain common shares in the future. For stock options, the number of additional shares for inclusion in diluted earnings per share calculations is determined using the treasury stock method. Under this method, stock options, whose exercise price is less than the average market price of our common shares, are assumed to be exercised and the proceeds are used to repurchase common shares at the average market price for the period. The incremental number of common shares issued under stock options and repurchased from proceeds is included in the calculation of diluted earnings per share. For convertible debentures, the number of additional shares for inclusion in diluted earnings per share calculations is determined using the as
if converted method. The incremental number of common shares issued is included in the number of weighted average shares outstanding and interest on the convertible debentures is excluded from the calculation of income.
Current tax for each taxable entity is based on the local taxable income at the local statutory tax rate enacted or substantively enacted at the balance sheet date and includes adjustments to tax payable or recoverable in respect of previous periods.
Deferred tax is recognized using the balance sheet method in respect of all temporary differences between the tax bases of assets and liabilities, and their carrying amounts for financial reporting purposes, except as indicated below:
Deferred income tax liabilities are recognized for all taxable temporary differences, except:
| • | | Where the deferred income tax liability arises from the initial recognition of goodwill, or the initial recognition of an asset or liability in an acquisition that is not a business combination and, at the time of the acquisition, affects neither the accounting profit nor taxable profit or loss; and |
| • | | In respect of taxable temporary differences associated with investments in subsidiaries, associates and interests in joint ventures, where the timing of the reversal of the temporary differences can be controlled and it is probable that the temporary differences will not reverse in the foreseeable future. |
Deferred income tax assets are recognized for all deductible temporary differences, carry-forward of unused tax assets and unused tax losses, to the extent that it is probable that taxable profit will be available against which the deductible temporary differences and the carry-forward of unused tax assets and unused tax losses can be utilized, except:
| • | | Where the deferred income tax asset relating to the deductible temporary difference arises from the initial recognition of an asset or liability in an acquisition that is not a business combination and, at the time of the acquisition, affects neither the accounting profit nor taxable profit or loss; and |
| • | | In respect of deductible temporary differences associated with investments in subsidiaries, associates and interests in joint ventures, deferred tax assets are recognized only to the extent that it is probable that the temporary differences will reverse in the foreseeable future and taxable profit will be available against which the temporary differences can be utilized. |
| | | | |
| BARRICK THIRD QUARTER 2011 | | 71 | | NOTES TO FINANCIAL STATEMENTS (UNAUDITED) |
The carrying amount of deferred income tax assets is reviewed at each balance sheet date and reduced to the extent that it is no longer probable that sufficient taxable profit will be available to allow all or part of the deferred income tax asset to be utilized. To the extent that an asset not previously recognized fulfills the criteria for recognition, a deferred income tax asset is recorded.
Deferred tax is measured on an undiscounted basis at the tax rates that are expected to apply in the periods in which the asset is realized or the liability is settled, based on tax rates and tax laws enacted or substantively enacted at the balance sheet date.
Current and deferred tax relating to items recognized directly in equity are recognized in equity and not in the income statement.
Royalties and Special Mining Taxes
Income tax expense includes the cost of royalty and special mining taxes payable to governments that are calculated based on a percentage of taxable profit whereby taxable profit represents net income adjusted for certain items defined in the applicable legislation.
Interim Reporting
As Barrick operates in different jurisdictions, our policy is that a global budgeted average annual effective income tax rate is determined and applied to the interim period global pre-tax income.
The income tax expense is recognized in each interim period based on the best estimate of the weighted average annual income tax rate expected for the full financial year. Amounts accrued for income tax expense in one interim period may have to be adjusted in a subsequent interim period of that financial year if the estimate of the annual income tax rate changes.
In addition to the application of the budgeted income tax rate, income tax expense in each interim period includes, in addition to other items, the impact of currency translation gains and losses, changes in the recognition of deferred tax assets, legislative changes and tax rate changes.
Investments in publically quoted securities are categorized as available-for-sale. Available-for-sale investments are recorded at fair value with unrealized gains and losses recorded in OCI. Realized gains and losses are recorded in earnings when investments mature or are sold and are calculated using the carrying amount of securities sold.
If the fair value of an investment declines below the carrying amount, we undertake an assessment of whether the impairment is significant or prolonged. We consider all relevant facts and circumstances in this assessment, particularly: the length of time and extent to which fair value has been less than the carrying amount; the financial condition and near-term prospects of the investee, including any specific events that have impacted its fair value; both positive and negative evidence that the carrying amount is recoverable within a reasonable period of time; and our ability and intent to hold the investment for a reasonable period of time sufficient for an expected recovery of the fair value up to or beyond the carrying amount.
When a decline in the fair value of an available-for-sale investment has been recognized in OCI and there is objective evidence that the asset is impaired, any cumulative loss that had been recognized in OCI is reclassified as an impairment loss in the consolidated statement of income. The reclassification adjustment is calculated as the difference between the acquisition cost (net of any principal repayment and amortization) and current fair value, less any impairment loss on that financial asset previously recognized. Impairment losses on equity investments classified as available-for-sale are not subject to reversal.
Material extracted from our mines is classified as either ore or waste. Ore represents material that, at the time of extraction, we expect to process into a saleable form and sell at a profit. Raw materials are comprised of both ore in stockpiles and ore on leach pads as processing is required to extract benefit from the ore. Ore is accumulated in stockpiles that are subsequently processed into gold/copper in a saleable form. The recovery of gold and copper from certain oxide ores is achieved through the heap leaching process. Work in process represents gold/copper in the processing circuit that has not completed the production process, and is not yet in a saleable form. Finished goods inventory represents gold/copper in saleable form that has not yet been sold. Mine operating supplies represent commodity consumables and other raw materials used in the production process, as well as spare parts and other maintenance supplies that are not classified as capital items.
Inventories are valued at the lower of cost and net realizable value. Cost is determined on a weighted average basis and includes all costs incurred, based on a normal production capacity, in bringing each product to its present location and condition. Cost of inventories includes, direct
| | | | |
| BARRICK THIRD QUARTER 2011 | | 72 | | NOTES TO FINANCIAL STATEMENTS (UNAUDITED) |
labor, materials and contractor expenses, including non-capitalized stripping costs; depreciation on PP&E including capitalized stripping costs; and an allocation of mine site overhead costs. As ore is removed for processing, costs are removed based on the average cost per ounce/pound in the stockpile.
We record provisions to reduce inventory to net realizable value to reflect changes in economic factors that impact inventory value and to reflect present intentions for the use of slow moving and obsolete supplies inventory. Net realizable value is determined with reference to relevant market prices less applicable variable selling expenses. Provisions recorded also reflect an estimate of the remaining costs of completion to bring the inventory into its saleable form. Provisions are also recorded to reduce mine operating supplies to net realizable value, which is generally calculated by reference to its salvage or scrap value, when it is determined that the supplies are obsolete. Provisions are reversed to reflect subsequent recoveries in net realizable value where the inventory is still on hand.
| L) | Property, Plant and Equipment |
Land, Buildings, Plant and Equipment
At acquisition, we record land, buildings, plant and equipment at cost, including all expenditures incurred to prepare an asset for its intended use. These expenditures consist of: the purchase price; brokers’ commissions; and installation costs including architectural, design and engineering fees, legal fees, survey costs, site preparation costs, freight charges, transportation insurance costs, duties, testing and preparation charges.
We capitalize costs that meet the asset recognition criteria. Costs incurred that do not extend the productive capacity or useful economic life of an asset are considered repairs and maintenance expense, accounted for as a cost of the inventory produced in the period.
Depreciation commences when buildings, plant and equipment are considered available for use. Once buildings, plant and equipment are considered available for use they are measured as cost less accumulated depreciation and applicable impairment losses. Land is not depreciated and is measured at cost less impairment losses.
Depreciation on equipment utilized in the development of assets, including open pit and underground mine development, is depreciated and recapitalized as development costs attributable to the related asset.
| | |
| Annual Depreciation Rates of Major Asset Categories |
| | |
Land | | Not depreciated |
Plant and equipment | | 5 - 25 years |
Underground mobile equipment | | 5 - 7 years |
Light vehicles and other mobile equipment | | 2 - 3 years |
Furniture, computer and office equipment | | 2 - 3 years |
Oil and gas plants and related facilities | | 3 - 15 years |
Leasing Arrangements
We enter into leasing arrangements and arrangements that are in substance leasing arrangements. The determination of whether an arrangement is, or contains, a lease is based on the substance of the arrangement at inception date, including whether the fulfillment of the arrangement is dependent on the use of a specific asset or assets or whether the arrangement conveys a right to use the asset.
Leasing arrangements that transfer substantially all the risks and rewards of ownership of the asset to Barrick are classified as finance leases. Finance leases are recorded as an asset with a corresponding liability at an amount equal to the lower of the fair value of the leased property and the present value of the minimum lease payment. Each lease payment is allocated between the liability and finance costs using the effective interest method, whereby a constant rate of interest expense is recognized on the balance of the liability outstanding. The interest element of the lease is charged to the consolidated statement of income as a finance cost.
PP&E assets acquired under finance leases are depreciated, once the asset becomes available for use, over the shorter of the useful life of the asset and the lease term.
All other leases are classified as operating leases. Operating lease payments are recognized as an operating cost in the consolidated statement of income on a straight-line basis over the lease term.
Mining Interests
Mining interests consist of: fair value attributable to mineral reserves and resources acquired in a business combination or asset acquisition; underground mine development costs; open pit mine development costs; capitalized exploration and evaluation cost; and capitalized interest.
| | | | |
| BARRICK THIRD QUARTER 2011 | | 73 | | NOTES TO FINANCIAL STATEMENTS (UNAUDITED) |
Acquired Mining Properties
On acquisition of a mining property we prepare an estimate of the fair value attributable to the proven and probable mineral reserves, mineral resources and exploration potential attributable to the property. The estimated fair value attributable to the mineral reserves and the portion of mineral resources considered to be probable of economic extraction at the time of the business combination is depreciated on a units of production (“UOP”) basis whereby the denominator is the proven and probable reserves and the portion of resources expected to be extracted economically. The estimated fair value attributable to mineral resources that are not considered to be probable of economic extraction at the time of the business combination is not subject to depreciation, until the resources become probable of economic extraction in the future. Exploration potential is recorded as an intangible asset.
Acquired Petroleum and Natural Gas Properties
On acquiring petroleum and natural gas property, we estimate the fair value of reserves and resources and we record this amount as an asset at the date of acquisition, which is subject to depreciation when the asset is available for its intended use.
Underground Mine Development Costs
At our underground mines, we incur development costs to build new shafts, drifts and ramps that will enable us to physically access ore underground. The time over which we will continue to incur these costs depends on the mine life. These underground development costs are capitalized as incurred.
Capitalized underground development costs incurred to enable access to specific ore blocks or areas of the underground mine, and which only provide an economic benefit over the period of mining that ore block or area, are depreciated on a UOP basis, whereby the denominator is estimated ounces/pounds of gold/copper in proven and probable reserves and a portion of resources within that ore block or area where it is considered probable that those resources will be extracted economically.
If capitalized underground development costs provide an economic benefit over the entire mine life, the costs are depreciated on a UOP basis, whereby the denominator is the estimated ounces of gold/pounds of copper in total accessible proven and probable reserves and a portion of resources where it is considered probable that those resources will be extracted economically.
Open Pit Mining Costs
In open pit mining operations, it is necessary to remove overburden and other waste materials to access ore from which minerals can be extracted economically. The process of mining overburden and waste materials is referred to as stripping. Stripping costs incurred in order to provide initial access to the ore body (referred to as pre-production stripping) are capitalized as open pit mine development costs.
Stripping costs incurred during the production stage of a pit are accounted for as costs of the inventory produced during the period that the stripping costs were incurred, unless these costs provide a future economic benefit. Production phase stripping costs generate a future economic benefit when the related stripping activity: (i) provides access to ore to be mined in the future; (ii) increases the fair value of the mine (or pit) as access to future mineral reserves becomes less costly; (iii) increases the productive capacity or extends the productive life of the mine (or pit). For production phase stripping costs that generate a future economic benefit, the current period stripping costs are capitalized as open pit mine development costs.
Capitalized open pit mine development costs are depreciated on a UOP basis whereby the denominator is the estimated ounces/pounds of gold/copper in the associated open pit in proven and probable reserves and the portion of resources considered probable of being extracted economically. Capitalized open pit mine development costs are depreciated once the mine has entered production and the future economic benefit is being derived.
Capitalized Interest
We capitalize interest costs for qualifying assets. Qualifying assets are assets that require a significant amount of time to prepare for their intended use, including projects that are in the exploration, development or construction stages. Qualifying assets also include significant expansion projects at our operating mines. Capitalized interest costs are considered an element of the historical cost of the qualifying asset. Capitalization ceases when the asset is substantially complete or if construction is interrupted for an extended period. Where the funds used to finance a qualifying asset form part of general borrowings, the amount capitalized is calculated using a weighted average of rates applicable to the relevant borrowings during the period. Where funds borrowed are directly attributable to a qualifying asset, the amount capitalized represents the borrowing costs specific to those borrowings. Where surplus funds available out of money borrowed specifically to finance a project are temporarily
| | | | |
| BARRICK THIRD QUARTER 2011 | | 74 | | NOTES TO FINANCIAL STATEMENTS (UNAUDITED) |
invested, the total capitalized interest is reduced by income generated from short-term investments of such funds.
Construction-in-Progress
Assets under construction at both projects and operating mines are capitalized as construction-in-progress. The cost of construction-in-progress comprises its purchase price and any costs directly attributable to bringing it into working condition for its intended use. Construction-inprogress amounts related to development projects are included in the carrying amount of the development project. Construction-in-progress amounts incurred at operating mines are presented as a separate asset within PP&E. Construction-in-progress also contains deposits on long lead items. Construction-in-progress is not depreciated. Once the asset is complete and available for use, depreciation is commenced.
Insurance
We record losses relating to insurable events as they occur. Proceeds receivable from insurance coverage are recorded at such time as receipt is virtually certain and the amount receivable is fixed or determinable. For business interruption the amount is only recognized when it is virtually certain as supported by receipt of notification of a minimum or proposed settlement amount from the insurance adjuster.
Under the acquisition method of accounting for business combinations, where the fair value of consideration paid exceeds the fair value of the identifiable net assets acquired, the difference is recorded as goodwill. Goodwill is not amortized; rather it is tested annually for impairment or at any time during the year that an indicator of impairment is identified. Goodwill is allocated to the group of cash generating units (“CGU”) that comprise an operating segment, since each CGU in a segment is expected to derive benefits from a business combination that results in the recognition of goodwill.
Intangible assets acquired by way of an asset acquisition or business combination are recognized if the asset is separable or arises from contractual or legal rights and the fair value can be measured reliably on initial recognition.
On acquisition of a mineral property in the exploration stage, we prepare an estimate of the fair value attributable to the exploration potential, including mineral resources, if any, of that property. The fair value of the exploration potential is recorded as an intangible asset (acquired exploration potential) as at the date of acquisition. When an
exploration stage property moves into development, the acquired exploration potential attributable to that property is transferred to mining interests within PP&E.
| O) | Impairment of Non-current Assets |
We review and test the carrying amounts of PP&E and intangible assets with definite lives when an indicator of impairment is considered to exist. Impairment assessments on PP&E and intangible assets are conducted at the level of CGUs, which is the lowest level for which identifiable cash flows are largely independent of the cash flows of other assets. For operating mines, capital projects and petroleum and natural gas properties, the individual mine/project/property represents a CGU for impairment testing.
Goodwill is tested for impairment annually in the fourth quarter or at any time during the year if an indicator of impairment is identified. We test goodwill at the operating segment level, since each CGU in a segment derives synergy benefits from the business combinations within that segment that give rise to goodwill and management does not internally monitor goodwill at a lower level.
The recoverable amount of a CGU or an operating segment is the higher of Value in Use and Fair Value Less Costs to Sell. An impairment loss is recognized for any excess of carrying amount of a CGU or operating segment over its recoverable amount. Any impairment is recognized as an expense in the consolidated statement of income in the reporting period in which the impairment occurs. Where it is not appropriate to allocate the loss to a separate asset, an impairment loss related to a CGU is allocated to the carrying amount of the assets of the CGU on a pro rata basis based on the carrying amount of its non-monetary assets. An impairment loss related to an operating segment is applied in the following order: (a) first, to reduce the carrying amount of goodwill allocated to the operating segment, (b) then, to the other assets of the operating segment.
Impairment Reversal
Impairment losses for PP&E and intangible assets are reversed if the conditions that gave rise to the impairment are no longer present and it has been determined that the asset is no longer impaired as a result. This reversal is recognized in the consolidated statement of income and is limited to the carrying value that would have been determined, net of any depreciation where applicable, had no impairment charge been recognized in prior years. When an impairment reversal is undertaken, the recoverable amount is assessed by reference to the higher
| | | | |
| BARRICK THIRD QUARTER 2011 | | 75 | | NOTES TO FINANCIAL STATEMENTS (UNAUDITED) |
of Value in Use and Fair Value Less Costs to Sell. Goodwill impairment losses are not reversible.
Debt is recognized initially at fair value, net of financing costs incurred, and subsequently measured at amortized cost. Any difference between the amounts originally received and the redemption value of the debt is recognized in the consolidated statement of income over the period to maturity using the effective interest method.
Convertible debentures are accounted for as a compound financial instrument, with the equity component and the liability component bifurcated as at the date of issuance. The equity component is recognized in equity and is not subsequently re-measured. The liability component is measured at amortized cost. Interest expense on the liability component is calculated by applying the prevailing market interest rate for similar debt obligations without the equity conversion feature. The difference between this amount and interest paid is added to the carrying amount of the liability component.
| R) | Derivative Instruments and Hedge Accounting |
Derivative Instruments
Derivative instruments are recorded at fair value on the consolidated balance sheet. Derivative instruments are classified as either hedges of the fair value of recognized assets or liabilities or of firm commitments (“fair value hedges”), hedges of highly probable forecast transactions (“cash flow hedges”) or non-hedge derivatives. Derivatives designated as either a fair value or cash flow hedge that are expected to be highly effective in achieving offsetting changes in fair value or cash flows are assessed on an ongoing basis to determine that they actually have been highly effective throughout the financial reporting periods for which they were designated. Derivative assets and derivative liabilities are shown separately in the balance sheet unless there is a legal right to offset and the intent to settle on a net basis.
Fair Value Hedges
Changes in the fair value of derivatives that are designated and qualify as fair value hedges are recorded in the consolidated statement of income, together with any changes in the fair value of the hedged asset or liability or firm commitment that is attributable to the hedged risk. The gain or loss relating to the ineffective portion is recognized in the consolidated statement of income.
Cash Flow Hedges
The effective portion of changes in the fair value of derivatives that are designated and qualify as cash flow hedges is recognized in equity. The gain or loss relating to the ineffective portion is recognized in the consolidated statement of income. Amounts accumulated in equity are transferred to the consolidated statement of income in the period when the forecasted transaction impacts earnings. When the forecasted transaction that is hedged results in the recognition of a non-financial asset or a non-financial liability, the gains and losses previously deferred in equity are transferred from equity and included in the measurement of the initial carrying amount of the asset or liability.
When a derivative designated as a cash flow hedge expires or is sold and the forecasted transaction is still expected to occur, any cumulative gain or loss relating to the derivative that is recorded in equity at that time remains in equity and is recognized in the consolidated statement of income when the forecasted transaction occurs. When a forecasted transaction is no longer expected to occur, the cumulative gain or loss that was recorded in equity is immediately transferred to the consolidated statement of income.
Non-Hedge Derivatives
Derivative instruments that do not qualify as either fair value or cash flow hedges are recorded at their fair value at the balance sheet date, with changes in fair value recognized in the consolidated statement of income.
Derivatives embedded in other financial instruments or other executory contracts are accounted for as separate derivatives when their risks and characteristics are not closely related to their host financial instrument or contract. In some cases, the embedded derivatives may be designated as hedges and will be accounted for as described above.
Fair value is the price that would be received to sell an asset or paid to transfer a liability in an orderly transaction between market participants at the measurement date. The fair value hierarchy establishes three levels to classify the inputs to valuation techniques used to measure fair value.
| U) | Environment Rehabilitation Provision |
Mining, extraction and processing activities normally give rise to obligations for environmental rehabilitation. Rehabilitation work can include facility decommissioning
| | | | |
| BARRICK THIRD QUARTER 2011 | | 76 | | NOTES TO FINANCIAL STATEMENTS (UNAUDITED) |
and dismantling; removal or treatment of waste materials; site and land rehabilitation, including compliance with and monitoring of environmental regulations; security and other site-related costs required to perform the rehabilitation work; and operation of equipment designed to reduce or eliminate environmental effects. The extent of work required and the associated costs are dependent on the requirements of relevant authorities and our environmental policies. Routine operating costs that may impact the ultimate closure and rehabilitation activities, such as waste material handling conducted as an integral part of a mining or production process, are not included in the provision. Costs arising from unforeseen circumstances, such as the contamination caused by unplanned discharges, are recognized as an expense and liability when the event occurs that gives rise to an obligation and reliable estimates of the required rehabilitation costs can be made.
Provisions for the cost of each rehabilitation program are normally recognized at the time that an environmental disturbance occurs or a constructive obligation is determined. When the extent of disturbance increases over the life of an operation, the provision is increased accordingly. The major parts of the carrying amount of provisions relate to tailings pond closure/rehabilitation; demolition of buildings/mine facilities; ongoing water treatment; and ongoing care and maintenance of closed mines. Costs included in the provision encompass all closure and rehabilitation activity expected to occur progressively over the life of the operation and at the time of closure in connection with disturbances as at the reporting date. Estimated costs included in the determination of the provision reflect the risks and probabilities of alternative estimates of cash flows required to settle the obligation at each particular operation. The expected rehabilitation costs are estimated based on the cost of external contractors performing the work or the cost of performing the work internally depending on management’s intention.
The timing of the actual rehabilitation expenditure is dependent upon a number of factors such as the life and nature of the asset, the operating license conditions and the environment in which the mine operates. Expenditures may occur before and after closure and can continue for an extended period of time depending on rehabilitation requirements. Rehabilitation provisions are measured at the expected value of future cash flows, discounted to their present value using a current, US dollar real risk-free pre-tax discount rate. The expected future cash flows exclude the effect of inflation. The unwinding of the discount, referred to as accretion expense, is included in finance
costs and results in an increase in the amount of the provision. Provisions are updated each reporting period for material changes to expected cash flows and for the effect of a change in the discount rate and exchange rate, when applicable, and the change in estimate is added or deducted from the related asset and depreciated prospectively over the asset’s useful life.
Significant judgments and estimates are involved in forming expectations of future activities and the amount and timing of the associated cash flows. Those expectations are formed based on existing environmental and regulatory requirements or, if more stringent, our environmental policies which give rise to a constructive obligation. When expected cash flows change, the revised cash flows are discounted using the current US dollar real risk-free pre-tax discount rate and an adjustment is made to the provision.
When provisions for closure and rehabilitation are initially recognized, the corresponding cost is capitalized as an asset, representing part of the cost of acquiring the future economic benefits of the operation. The capitalized cost of closure and rehabilitation activities is recognized in PP&E and depreciated over the expected economic life of the operation to which it relates.
Adjustments to the estimated amount and timing of future closure and rehabilitation cash flows are a normal occurrence in light of the significant judgments and estimates involved. The principal factors that can cause expected cash flows to change are: the construction of new processing facilities; changes in the quantities of material in reserves and resources with a corresponding change in the life-of-mine plan; changing ore characteristics that impact required environmental protection measures and related costs; changes in water quality that impact the extent of water treatment required; foreign exchange rates and changes in laws and regulations governing the protection of the environment.
Rehabilitation provisions are adjusted as a result of changes in estimates. Those adjustments are accounted for as a change in the corresponding value of the related assets including the related mineral property, except where a reduction in the provision is greater than the remaining net book value of the related assets, in which case the value is reduced to nil and the remaining adjustment is recognized in the consolidated statement of income. In the case of closed sites, changes to estimated costs are recognized immediately in the consolidated statement of income. The adjusted cost of the related asset is depreciated prospectively. Changes also result in an adjustment to future finance costs.
| | | | |
| BARRICK THIRD QUARTER 2011 | | 77 | | NOTES TO FINANCIAL STATEMENTS (UNAUDITED) |
| V) | Litigation and Other Provisions |
Provisions are recognized when a present obligation exists (legal or constructive), as a result of a past event, for which it is probable that an outflow of resources will be required to settle the obligation, and a reliable estimate can be made of the amount of the obligation. Provisions are discounted to net present value using an appropriate current market based pre-tax discount rate and the accretion expense is included in finance costs.
Certain conditions may exist as of the date the financial statements are issued, which may result in a loss to the Company but which will only be resolved when one or more future events occur or fail to occur. In assessing loss contingencies related to legal proceedings that are pending against us or unasserted claims that may result in such proceedings, the Company and its legal counsel evaluate the perceived merits of any legal proceedings or unasserted claims as well as the perceived merits of the amount of relief sought or expected to be sought.
If the assessment of a contingency suggests that a loss is probable, and the amount can be reliably estimated, then a loss is recorded. When a contingent loss is not probable but is reasonably possible, or is probable but the amount of loss cannot be reliably estimated, then details of the contingent loss are disclosed. Loss contingencies considered remote are generally not disclosed unless they involve guarantees, in which case we disclose the nature of the guarantee. Legal fees incurred in connection with pending legal proceedings are expensed as incurred.
| W) | Stock-Based Compensation |
Barrick offers both equity-settled (Employee Stock Option Plan (“ESOP”), Employee Share Purchase Plan (“ESPP”)) and cash-settled (Restricted Share Units (“RSU”), Deferred Share Units (“DSU”), Performance Restricted Share Units (“PRSU”)) awards to certain employees and officers of the Company.
Equity settled awards are measured at the initial grant date. The cost is recorded over the vesting period of the award to the same expense category of the award recipient’s payroll costs (i.e. cost of sales, RBU costs, corporate administration) and the corresponding entry is recorded against equity. Equity-settled awards are not remeasured subsequent to the initial grant date.
Cash-settled awards are measured at fair value initially at the grant date of the award and are required to be remeasured to fair value at each reporting date until settlement. The cost is then recorded over the vesting period of the award. This expense, and any changes in the fair value of the award, is recorded to the same expense
category of the award recipient’s payroll costs. The cost of a cash-settled award is recorded within liabilities until settled.
We use the accelerated method (also referred to as ‘graded’ vesting) for attributing stock option expense over the vesting period. Stock option expense incorporates an expected forfeiture rate. The expected forfeiture rate is estimated based on historical forfeiture rates and expectations of future forfeitures rates. We make adjustments if the actual forfeiture rate differs from the expected rate.
Employee Stock Option Plan
Under Barrick’s ESOP, certain officers and key employees of the Corporation may purchase common shares at an exercise price that is equal to the closing share price on the day before the grant of the option. The grant date is the date when the details of the award, including the number of options granted to the individual and the exercise price, are approved. Stock options vest over four years, beginning in the year after granting. The ESOP arrangement has graded vesting terms, and therefore, multiple vesting periods must be valued and accounted for separately over their respective vesting periods. The compensation expense of the instruments issued for each grant under the ESOP is calculated using the Lattice model. The compensation expense is adjusted by the estimated forfeiture rate which is estimated based on historical forfeiture rates and expectations of future forfeitures rates. We make adjustments if the actual forfeiture rate differs from the expected rate.
Restricted Share Units
Under our RSU plan, selected employees are granted RSUs where each RSU has a value equal to one Barrick common share. RSUs vest at the end of two and a half years and are settled in cash upon vesting. Additional RSUs are credited to reflect dividends paid on Barrick common shares over the vesting period.
A liability for RSUs is measured at fair value on the grant date and is subsequently adjusted for changes in fair value. The liability is recognized on a straight-line basis over the vesting period, with a corresponding charge to compensation expense as a component of corporate administration and other expenses. Compensation expenses for RSUs incorporate an estimate for expected forfeiture rates based on which the fair value is adjusted. Barrick calculates this adjustment on a quarterly basis.
| | | | |
| BARRICK THIRD QUARTER 2011 | | 78 | | NOTES TO FINANCIAL STATEMENTS (UNAUDITED) |
African Barrick Gold RSUs
Historically, Barrick maintained a cash-settled RSU plan for select employees who now work for ABG. This plan operates in the identical manner as the Barrick RSU plan. The existing legacy RSUs will continue to be administered and accounted for based on the movement of the fair value of Barrick common share for recording liabilities and compensation expense.
Deferred Share Units
Under our DSU plan, Directors must receive a specified portion of their basic annual retainer in the form of DSUs, with the option to elect to receive 100% of such retainer in DSUs. Each DSU has the same value as one Barrick common share. DSUs must be retained until the Director leaves the Board, at which time the cash value of the DSUs is paid out. Additional DSUs are credited to reflect dividends paid on Barrick common shares. The initial fair value of the liability is calculated as of the grant date and is recognized immediately. Subsequently, at each reporting date and on settlement the liability is re-measured, with any change in fair value recorded as Directors compensation expense in the period.
Performance Restricted Share Units
In 2008, Barrick launched a PRSU plan. Under this plan, selected employees are granted PRSUs, where each PRSU has a value equal to one Barrick common share. PRSUs vest at the end of a three-year period and are settled in cash on the third anniversary of the grant date. Additional PRSUs are credited to reflect dividends paid on Barrick common shares over the vesting period. The amount of PRSUs that vest is based on the achievement of performance goals and the target settlement ranges from 0% to 200% of the value.
The value of a PRSU reflects the value of a Barrick common share adjusted for its relative performance against certain competitors. Therefore, the fair value of the PRSUs is determined with reference to the closing stock price at each re-measurement date.
The initial fair value of the liability is calculated as of the grant date and is recognized within compensation expense using the straight-line method over the vesting period. Subsequently, at each reporting date and on settlement the liability is re-measured, with any changes in fair value recorded as compensation expense. The fair value is adjusted by the calculated forfeiture rate.
Employee Share Purchase Plan
In 2008, Barrick launched an ESPP. This plan enables Barrick employees to purchase Company shares through
payroll deduction. Each year, employees may contribute 1%-6% of their combined base salary and annual bonus, and Barrick will match 50% of the contribution, up to a maximum of $5,000 per year.
Both Barrick and the employee make the contributions on a bi-monthly basis with the funds being transferred to a custodian who purchases Barrick Common Shares in the open market. Shares purchased with employee contributions have no vesting requirement, however, shares purchased with Barrick’s contributions vest annually on December 1st. All dividend income is used to purchase additional Barrick shares.
Barrick records an expense, equal to its bi-monthly cash contribution. No forfeiture rate is applied to the amounts accrued. Where an employee leaves prior to December 1, any accrual for contributions by Barrick during the year related to that employee is reversed.
| X) | Post-Retirement Benefits |
Defined Contribution Pension Plans
Certain employees take part in defined contribution employee benefit plans whereby we contribute up to 6% of the employees’ annual salary and bonus. We also have a retirement plan for certain officers of Barrick under which we contribute 15% of the officer’s annual salary and bonus. The contributions are recognized as compensation expense as incurred. The Company has no further payment obligations once the contributions have been paid.
Defined Benefit Pension Plans
We have qualified defined benefit pension plans that cover certain of our United States and Canadian employees and provide benefits based on employees’ years of service. Our policy is to fund the amounts necessary on an actuarial basis to provide enough assets to meet the benefits payable to plan members. Independent trustees administer assets of the plans, which are invested mainly in fixed income and equity securities.
As well as the qualified plans, we have non-qualified defined benefit pension plans covering certain employees and former directors of Barrick. An irrevocable trust (“rabbi trust”) was set up to fund these plans.
Actuarial gains and losses arise when the actual return on plan assets differs from the expected return on plan assets for a period, or when the expected and actuarial accrued benefit obligations differ at the end of the year. We record actuarial gains and losses in equity.
| | | | |
| BARRICK THIRD QUARTER 2011 | | 79 | | NOTES TO FINANCIAL STATEMENTS (UNAUDITED) |
Our valuations are carried out using the project unit method and the expected rate of return on pension plan assets is determined as management’s best estimate of the long-term return on major asset classes. We record the difference between the fair value of the plan assets (if any) of post retirement plans and the present value of the plan obligations as an asset or liability on the consolidated balance sheets.
Pension Plan Assets and Liabilities
Pension plan assets, which consist primarily of fixed-income and equity securities, are valued using current market quotations. Plan obligations and the annual pension expense are determined on an actuarial basis and are affected by numerous assumptions and estimates including the market value of plan assets, estimates of the expected return on plan assets, discount rates, future wage increases and other assumptions.
The discount rate, assumed rate of return on plan assets and wage increases are the assumptions that generally have the most significant impact on our pension cost and obligation.
The assumed rate of return on assets for pension cost purposes is the weighted average of expected long-term asset return assumptions. In estimating the long-term rate of return for plan assets, historical markets are studied and long-term historical returns on equities and fixed-income investments reflect the widely accepted capital market principle that assets with higher volatility generate a greater return over the long run. Current market factors such as inflation and interest rates are evaluated before long-term capital market assumptions are finalized.
Wage increases reflect the best estimate of merit increases to be provided, consistent with assumed inflation rates.
Other Post-Retirement Benefits
We provide post-retirement medical, dental, and life insurance benefits to certain employees. Actuarial gains and losses resulting from variances between actual results and economic estimates or actuarial assumptions are recorded in OCI and amortized over the average remaining life expectancy of participants when the net gains or losses exceed 10% of the accumulated post-retirement benefit obligation.
| Y) | New Accounting Standards |
IFRS 9 Financial Instruments
In November 2009, the IASB issued IFRS 9 Financial Instruments as the first step in its project to replace IAS 39Financial Instruments: Recognition and Measurement. IFRS
9 retains but simplifies the mixed measurement model and establishes two primary measurement categories for financial assets: amortized cost and fair value. The basis of classification depends on an entity’s business model and the contractual cash flow of the financial asset. Classification is made at the time the financial asset is initially recognized, namely when the entity becomes a party to the contractual provisions of the instrument.
IFRS 9 amends some of the requirements of IFRS 7Financial Instruments: Disclosures including added disclosures about investments in equity instruments measured at fair value in OCI, and guidance on financial liabilities and de-recognition of financial instruments. In August 2011, the IASB issued an exposure draft that proposes to adjust the mandatory effective date of IFRS 9 from January 1, 2013 to January 1, 2015. We are currently assessing the impact of adopting IFRS 9 on our consolidated financial statements, including the impact of early adoption.
IFRS 10 Consolidated Financial Statements
In May 2011, the IASB issued IFRS 10Consolidated Financial Statements to replace IAS 27Consolidated and Separate Financial Statements and SIC 12Consolidation – Special Purpose Entities. The new consolidation standard changes the definition of control so that the same criteria apply to all entities, both operating and special purpose entities, to determine control. The revised definition focuses on the need to have both power and variable returns before control is present. IFRS 10 must be applied starting January 1, 2013 with early adoption permitted. We are currently assessing the impact of adopting IFRS 10 on our consolidated financial statements.
IFRS 11 Joint Arrangements
In May 2011, the IASB issued IFRS 11 Joint Arrangements to replace IAS 31, Interests in Joint Ventures. The new standard defines two types of arrangements: Joint Operations and Joint Ventures. Focus is on the rights and obligations of the parties involved to reflect the joint arrangement, thereby requiring parties to recognize the individual assets and liabilities to which they have rights or for which they are responsible, even if the joint arrangement operates in a separate legal entity. IFRS 11 must be applied starting January 1, 2013 with early adoption permitted. We are currently assessing the impact of adopting IFRS 11 on our consolidated financial statements.
IFRS 12 Disclosure of Interests in Other Entities
In May 2011, the IASB issued IFRS 12Disclosure of Interests in Other Entities to create a comprehensive disclosure
| | | | |
| BARRICK THIRD QUARTER 2011 | | 80 | | NOTES TO FINANCIAL STATEMENTS (UNAUDITED) |
standard to address the requirements for subsidiaries, joint arrangements and associates including the reporting entity’s involvement with other entities. It also includes the requirements for unconsolidated structured entities (i.e. special purpose entities). IFRS 12 must be applied starting January 1, 2013 with early adoption permitted. We are currently assessing the impact of adopting IFRS 12 on our consolidated financial statements.
IFRS 13 Fair Value Measurement
In May 2011, the IASB issued IFRS 13Fair Value Measurement as a single source of guidance for all fair value measurements required by IFRS to reduce the complexity and improve consistency across its application. The standard provides a definition of fair value and guidance on how to measure fair value as well as a requirement for enhanced disclosures. IFRS 13 must be applied starting January 1, 2013 with early adoption permitted. We are currently assessing the impact of adopting IFRS 13 on our consolidated financial statements.
IFRIC 20 Stripping Costs in the Production Phase of a Surface Mine
In October 2011, the IASB issued IFRIC 20 Stripping Costs in the Production Phase of a Surface Mine. IFRIC 20 provides guidance on the accounting for the costs of stripping activity in the production phase of surface mining when two benefits accrue to the entity from the stripping activity: useable ore that can be used to produce inventory and improved access to further quantities of material that will be mined in future periods. IFRIC 20 must be applied starting January 1, 2013 with early adoption permitted. We are currently assessing the impact of adopting IFRIC 20 on our consolidated financial statements.
| Z) | Significant Judgments in Applying Accounting Policies and Key Sources of Estimation Uncertainty |
Many of the amounts included in the consolidated balance sheet require management to make judgments and/or estimates. These judgments and estimates are continuously evaluated and are based on management’s experience and knowledge of the relevant facts and circumstances. Actual results may differ from the amounts included in the consolidated balance sheet. Areas of significant judgment and estimates affecting the amounts recognized in the consolidated balance sheet include:
| • | | Estimates of the quantities of proven and probable gold reserves and the portion of resources considered to be probable of economic extraction, which are used in: the calculation of depreciation expense; the capitalization of production phase stripping costs; and, forecasting the timing of the payments related to the environmental rehabilitation provision. |
| • | | Changes in forecast prices of commodities, exchange rates, production costs and recovery rates may change the economic status of reserves and resources and may, ultimately, result in the reserves and resources being revised; |
| • | | The future economic benefit of stripping costs capitalized during the production phase; |
| • | | The future economic benefit of exploration and evaluation costs; |
| • | | Estimates of ounces/pounds of gold/copper ore in stockpiles and on leach pads that are estimated based on the number of tons added and removed, the gold/copper contained therein and the metallurgical recovery rate; |
| • | | Review of goodwill, tangible and intangible assets carrying value, the determination of whether these assets are impaired and the measurement of impairment charges or reversals; |
| • | | The estimated fair values of cash generating units for impairment tests, including estimates of future costs to produce proven and probable reserves, future commodity prices, foreign exchange rates and discount rates; |
| • | | The estimated useful lives and residual values of tangible and long-lived assets and the measurement of depreciation expense; |
| • | | Recognition of a provision for environmental rehabilitation including the estimation of the rehabilitation costs and timing of expenditures that are impacted by changes in discount rates, foreign exchange rates, and in environmental and regulatory requirements; |
| • | | Whether to recognize a liability for loss contingencies and the amount of any such provision; |
| • | | Recognition of deferred income tax assets, amounts recorded for uncertain tax positions, the measurement of income tax expense and indirect taxes; |
| • | | The estimated fair value of derivative instruments for which a liquid active market does not exist; and |
| • | | Preliminary fair value adjustments recorded as a result of acquisitions. |
We estimate our ore reserves and mineral resources based on information compiled by qualified persons as defined in accordance with the Canadian Securities Administrators’ National Instrument 43-101 Standards of Disclosure for Mineral Projects requirements.
3 > Transition to IFRS
We have adopted IFRS effective January 1, 2011. Our transition date is January 1, 2010 (the “transition date”) and the Company has prepared its opening IFRS balance sheet as at that date. These consolidated financial statements have been prepared in accordance with the accounting policies described in Note 2.
| | | | |
| BARRICK THIRD QUARTER 2011 | | 81 | | NOTES TO FINANCIAL STATEMENTS (UNAUDITED) |
A) Elected exemptions from full retrospective application
In preparing these consolidated financial statements in accordance with IFRS 1First-time Adoption of International Financial Reporting Standards (“IFRS 1”), the company has applied certain of the optional exemptions from full retrospective application of IFRS. The optional exemptions applied are described below.
(i) Business combinations
We have elected the business combinations exemption in IFRS 1 to not apply IFRS 3 retrospectively to past business combinations. Accordingly, the company has not restated business combinations that took place prior to the transition date.
(ii) Fair value or revaluation as deemed cost
We have elected to measure certain items of PP&E at fair value as at January 1, 2010 or revaluation amounts previously determined under US GAAP and use those amounts as deemed cost as at January 1, 2010. We have made this election at the following properties: Pascua- Lama, Goldstrike, Plutonic, Marigold, Pierina, Sedibelo, Osborne. We have also elected to adopt this election for certain assets at Barrick Energy, which were adjusted by $166 million to their fair value of $342 million on the transition date to IFRS, due to a decline in oil prices.
(iii) Asset related to provisions for environmental rehabilitation
We have elected to take a simplified approach to calculate and record the asset related to the environmental rehabilitation provision on our opening IFRS consolidated balance sheet. The environmental rehabilitation provision calculated on the transition date in accordance with International Accounting Standard 37 Provisions, Contingent Liabilities and Contingent Assets (“IAS 37”) was discounted back to the date when the provision first arose on the mineral property, at which date the corresponding asset was set up and then depreciated to its carrying amount as at the transition date.
(iv) Employee benefits
We have elected to recognize all cumulative actuarial gains and losses as at January 1, 2010 in opening retained earnings for the company’s employee benefit plans.
(v) Cumulative translation differences
We have elected to set the previously accumulated cumulative translation account, which was included in accumulated other comprehensive income (“AOCI”), to zero as at January 1, 2010 and absorbed the balance into retained earnings.
B) Reconciliation of equity as reported under US GAAP to IFRS
The following is a reconciliation of the company’s total equity reported in accordance with US GAAP to its total equity under IFRS at the transition date January 1, 2010:
| | | | | | | | | | | | | | | | | | | | | | | | | | |
| (millions of US$) | | Ref | | Capital
stock | | | Retained
earnings
(deficit) | | | AOCI | | | Other | | | Non-controlling
interests | | | Total Equity | |
As reported under US GAAP | | | | | $17,390 | | | | $(2,382) | | | | $55 | | | $ | - | | | | $484 | | | | $15,547 | |
IFRS 1 Exemptions | | | | | | | | | | | | | | | | | | | | | | | | | | |
Deemed cost election for Barrick Energy | | Note 3A (ii) | | | - | | | | (166) | | | | - | | | | - | | | | - | | | | (166) | |
Reset of pension plan actuarial losses | | Note 3A (iv) | | | - | | | | (37) | | | | 37 | | | | - | | | | - | | | | - | |
Reset of cumulative translation losses | | Note 3A (v) | | | - | | | | (141) | | | | 141 | | | | - | | | | - | | | | - | |
IFRS Policy Impacts | | | | | | | | | | | | | | | | | | | | | | | | | | |
Capitalized production phase stripping costs | | (i) | | | - | | | | 408 | | | | - | | | | - | | | | - | | | | 408 | |
Capitalized exploration and evaluation costs | | (ii) | | | - | | | | 160 | | | | - | | | | - | | | | 50 | | | | 210 | |
Reversal of past impairments | | (iii) | | | - | | | | 55 | | | | - | | | | - | | | | - | | | | 55 | |
Changes in capitalized interest | | (iv) | | | - | | | | (125) | | | | - | | | | - | | | | - | | | | (125) | |
Changes in PER | | (v) | | | - | | | | (101) | | | | - | | | | - | | | | - | | | | (101) | |
Bifurcation of senior convertible debt | | (vi) | | | - | | | | (31) | | | | - | | | | 143 | | | | - | | | | 112 | |
Exclusion of time value changes in fair value of options designated as hedging instruments | | (vii) | | | - | | | | (33) | | | | 33 | | | | - | | | | - | | | | - | |
Reclassification of hedge gains to related asset | | (viii) | | | - | | | | - | | | | (20) | | | | - | | | | - | | | | (20) | |
Tax effect of IFRS changes | | | | | (6) | | | | (119) | | | | (14) | | | | - | | | | (12) | | | | (151) | |
Others, net | | | | | 8 | | | | (23) | | | | - | | | | - | | | | - | | | | (15) | |
As reported under IFRS | | | | | $17,392 | | | | $(2,535) | | | | $232 | | | | $143 | | | | $522 | | | | $15,754 | |
| | | | |
| BARRICK THIRD QUARTER 2011 | | 82 | | NOTES TO FINANCIAL STATEMENTS (UNAUDITED) |
The following is a reconciliation of the company’s total equity reported in accordance with US GAAP to its total equity under IFRS at September 30, 2010:
| | | | | | | | | | | | | | |
| (millions of US$) | | Ref | | Capital
stock | | Retained
earnings
(deficit) | | AOCI | | Other | | Non- controlling
interests | | Total Equity |
| As reported under US GAAP | | | | $17,449 | | $(319) | | $ 331 | | $ 288 | | $1,558 | | $19,307 |
IFRS 1 Exemptions | | | | | | | | | | | | | | |
Deemed cost election for Barrick Energy | | Note 3A (ii) | | - | | (166) | | - | | - | | - | | (166) |
Reset of pension plan actuarial losses | | Note 3A (iv) | | - | | (37) | | 37 | | - | | - | | - |
Reset of cumulative translation losses | | Note 3A (v) | | - | | (141) | | 141 | | - | | - | | - |
IFRS Policy Impacts | | | | | | | | | | | | | | |
Capitalized production phase stripping costs | | (i) | | - | | 579 | | - | | - | | - | | 579 |
Capitalized exploration and evaluation costs | | (ii) | | - | | 219 | | - | | - | | 50 | | 269 |
Reversal of past impairments | | (iii) | | - | | 119 | | - | | - | | - | | 119 |
Changes in capitalized interest | | (iv) | | - | | (129) | | - | | - | | - | | (129) |
Changes in PER | | (v) | | - | | (98) | | - | | - | | - | | (98) |
Bifurcation of senior convertible debt | | (vi) | | - | | (31) | | - | | 143 | | - | | 112 |
Exclusion of time value changes in fair value of options designated as hedging instruments | | (vii) | | - | | (22) | | 22 | | - | | - | | - |
Reclassification of hedge gains to related asset | | (viii) | | - | | - | | (21) | | - | | - | | (21) |
IPO of ABG | | (ix) | | - | | - | | - | | (12) | | 21 | | 9 |
Gain on acquisition of additional 25% interest in Cerro Casale | | (x) | | - | | 13 | | - | | - | | - | | 13 |
Tax effect of IFRS changes | | | | (6) | | (191) | | (14) | | - | | - | | (211) |
Others, net | | | | 10 | | (25) | | (2) | | - | | (7) | | (24) |
As reported under IFRS | | | | $17,453 | | $(229) | | $494 | | $419 | | $1,622 | | $19,759 |
The following is a reconciliation of the company’s total equity reported in accordance with US GAAP to its total equity under IFRS at December 31, 2010:
| | | | | | | | | | | | | | |
| (millions of US$) | | Ref | | Capital stock | | Retained earnings (deficit) | | AOCI | | Other | | Non- controlling interests | | Total Equity |
| As reported under US GAAP | | | | $17,790 | | $456 | | $531 | | $288 | | $1,669 | | $20,734 |
IFRS 1 Exemptions | | | | | | | | | | | | | | |
Deemed cost election for Barrick Energy | | Note 3A (ii) | | - | | (166) | | - | | - | | - | | (166) |
Reset of pension plan actuarial losses | | Note 3A (iv) | | - | | (37) | | 37 | | - | | - | | - |
Reset of cumulative translation losses | | Note 3A (v) | | - | | (141) | | 141 | | - | | - | | - |
IFRS Policy Impacts | | | | | | | | | | | | | | |
Capitalized production phase stripping costs | | (i) | | - | | 632 | | - | | - | | - | | 632 |
Capitalized exploration and evaluation costs | | (ii) | | - | | 270 | | - | | - | | 50 | | 320 |
Reversal of past impairments | | (iii) | | - | | 139 | | - | | - | | - | | 139 |
Changes in capitalized interest | | (iv) | | - | | (130) | | - | | - | | - | | (130) |
Changes in PER | | (v) | | - | | (100) | | - | | - | | - | | (100) |
Bifurcation of senior convertible debt | | (vi) | | - | | (31) | | - | | 38 | | - | | 7 |
Exclusion of time value changes in fair value of options designated as hedging instruments | | (vii) | | - | | (72) | | 72 | | - | | - | | - |
Reclassification of hedge gains to related asset | | (viii) | | - | | - | | (26) | | - | | - | | (26) |
IPO of ABG | | (ix) | | - | | - | | - | | (12) | | 25 | | 13 |
Gain on acquisition of additional 25% interest in Cerro Casale | | (x) | | - | | 13 | | - | | - | | - | | 13 |
Tax effect of IFRS changes | | | | 20 | | (202) | | (20) | | - | | 1 | | (201) |
Others, net | | | | 10 | | (20) | | (8) | | - | | - | | (18) |
As reported under IFRS | | | | $17,820 | | $611 | | $727 | | $314 | | $1,745 | | $21,217 |
| | | | |
| BARRICK THIRD QUARTER 2011 | | 83 | | NOTES TO FINANCIAL STATEMENTS (UNAUDITED) |
| | C) | Reconciliation of net income attributable to equity holders of Barrick Gold Corporation as reported under US GAAP to IFRS |
The following is a reconciliation of the company’s net income reported in accordance with US GAAP to its net income under IFRS for the three and nine months ended September 30, 2010:
| | | | | | |
| (millions of US$) | | Ref | | Three months ended
September 30, 2010 | | Nine months ended
September 30, 2010 |
Net Income - As reported under US GAAP | | | | $837 | | $2,378 |
IFRS Policy Impacts | | | | | | |
Capitalized production phase stripping costs | | (i) | | 65 | | 171 |
Capitalized exploration and evaluation costs | | (ii) | | 30 | | 59 |
Reversal of past impairments | | (iii) | | 29 | | 64 |
Changes in capitalized interest | | (iv) | | 6 | | (4) |
Changes in PER | | (v) | | 3 | | 3 |
Exclusion of time value changes in fair value of options designated as hedging instruments | | (vii) | | (48) | | 11 |
Gain on acquisition of additional 25% interest in Cerro Casale | | (x) | | - | | 13 |
Tax effect of IFRS changes | | | | 24 | | (72) |
Non-controlling interest share of income | | | | (8) | | (13) |
Others, net | | | | 4 | | 11 |
Net Income - As reported under IFRS | | | | $942 | | $2,621 |
| | D) | Reconciliation of OCI as reported under US GAAP to IFRS The following is a reconciliation of the company’s OCI reported in accordance with US GAAP to its OCI under IFRS for the three and nine months ended September 30, 2010: |
| | | | | | |
| (millions of US$) | | Ref | | Three months ended
September 30, 2010 | | Nine months ended
September 30, 2010 |
OCI - As reported under US GAAP | | | | $425 | | $276 |
IFRS Policy Impacts | | | | | | |
| Exclusion of gains/(losses) on time value changes in fair value of options designated as hedging instruments, net of tax | | (vii) | | 35 | | (9) |
Realized capital hedges gains/(losses) transferred to PP&E, net of tax | | (vii) | | - | | (1) |
Currency translation adjustments on deemed cost election for Barrick Energy, net of tax | | | | (5) | | (4) |
OCI - As reported under IFRS | | | | $455 | | $262 |
| | E) | Reconciliation of net cash provided by operating activities and net used in investing activities as reported under US GAAP to IFRS |
The following is a reconciliation showing material adjustments to the company’s consolidated statement of cash flow as reported under US GAAP to its consolidated cash flow statement under IFRS for the nine months ended September 30, 2010 and the year ended December 31, 2010:
| | | | | | |
| Operating Activities | | | | | | |
| (millions of US$) | | Ref | | Nine months ended
Sept. 30, 2010 | | Year ended
Dec. 31, 2010 |
Net cash provided by operating activities - As reported under US GAAP | | | | $3,346 | | $4,127 |
IFRS Policy Impacts | | | | | | |
Capitalized development costs1 | | (i), (ii) | | 289 | | 426 |
Net cash provided by operating activities - As reported under IFRS | | | | $3,635 | | $4,553 |
| | | | |
| BARRICK THIRD QUARTER 2011 | | 84 | | NOTES TO FINANCIAL STATEMENTS (UNAUDITED) |
| | | | | | |
| Investing Activities | | | | | | |
| (millions of US$) | | Ref | | Nine months ended
Sept. 30, 2010 | | Year ended
Dec. 31, 2010 |
Net cash used in investing activities - As reported under US GAAP | | | | ($3,018) | | ($4,172) |
IFRS Policy Impacts | | | | | | |
Capitalized development costs1 | | (i), (ii) | | (289) | | (426) |
Net cash used in investing activities - As reported under IFRS | | | | ($3,307) | | ($4,598) |
| 1 | The net cash provided by operating activities and the net cash used in investing activities increased due to the increased capitalization of development costs including production phase stripping costs and exploration and evaluation costs under IFRS compared to US GAAP. The change in net cash provided by financing activities was the same under US GAAP and IFRS. |
References
| (i) | Under IFRS, production phase stripping costs for open pit mines are capitalized to PP&E if the stripping activities provide a probable future economic benefit. Under US GAAP, these costs are treated as current production costs. Capitalized stripping costs also resulted in an increase in depreciation expense. |
| (ii) | Under IFRS, exploration and evaluation expenditures are capitalized if management determines that probable future economic benefits will be generated as a result of the expenditures. We capitalized additional exploration and evaluation costs at certain properties, mainly Cerro Casale, where management assessed under IFRS that it was probable that these expenditures would result in future economic benefits. |
| (iii) | Under IFRS, past impairments of equity investments can be reversed if there is a recovery in the realizable value of the investment. In 2008, we recorded an impairment of $140 million on our investment in Highland Gold. In our opening IFRS balance sheet and throughout 2010, we have recorded reversals of this impairment charge as the fair value of our investment increased due to a recovery in the quoted share price. |
| (iv) | Investments accounted for using the equity method of accounting are not qualifying assets under IFRS for the purpose of capitalizing interest. On transition and in subsequent quarters, this resulted in the reversal of previously capitalized interest primarily related to Cerro Casale. This was partially offset by higher capitalization of interest due to capitalization of production phase stripping and exploration and evaluation costs. |
| (v) | Under IFRS, Provisions for Environmental Rehabilitation (PER) are updated each reporting period for changes in discount rates and exchange rates. |
| (vi) | IFRS requires bifurcation of convertible debt instruments, with the debt and equity portions to be recognized separately. This change also resulted in reversal of previously amortized debt premium from retained earnings. |
| (vii) | Under IFRS, all realized and unrealized non-hedge derivative gains or losses, gains or losses related to hedge ineffectiveness and changes in fair value of option derivatives designated as accounting hedges due to changes in time value, which are excluded from the hedge effectiveness assessment, are presented as a separate line on the consolidated statement of income. Under US GAAP these amounts were presented in the respective income statement line item most closely related to the risk exposure expected to be offset by the derivative, and changes in fair value due to changes in time value were recognized in equity. |
| (viii) | The capitalization of production phase stripping costs resulted in the reclassification of the related currency hedge gains realized on such expenditures from retained earnings to PP&E. |
| (ix) | The difference in the carrying amount of ABG under IFRS compared to its carrying amount under US GAAP resulted in an adjustment to paid-in capital in the equity section of the balance sheet, with a corresponding adjustment in the non-controlling interest. |
| (x) | In the first quarter of 2010, Barrick acquired an additional 25% ownership interest in the Cerro Casale project. Due to the elimination of capitalized interest on investments accounted for using the equity method of accounting, the carrying amount was lower under IFRS, which resulted in a higher gain on acquisition. |
| | | | |
| BARRICK THIRD QUARTER 2011 | | 85 | | NOTES TO FINANCIAL STATEMENTS (UNAUDITED) |
4 > ACQUISITIONS AND DIVESTITURES
| | | | | | | | | | | | | | | | |
| | | For the three
months ended
September 30 | | | For the nine
months ended
September 30 | |
| | | 2011 | | | 2010 | | | 2011 | | | 2010 | |
Cash paid on acquisition1 | | | | | | | | | | | | | | | | |
Equinox | | $
|
269 |
| | $ | - | | | $ | 7,482 | | | $ | - | |
Cerro Casale | | | - | | | | - | | | | - | | | | 454 | |
Barrick Energy acquisitions | | | 68 | | | | 25 | | | | 253 | | | | 264 | |
Tusker | | | - | | | | - | | | | - | | | | 74 | |
REN | | | - | | | | 36 | | | | - | | | | 36 | |
Other | | | - | | | | - | | | | 25 | | | | - | |
| | | | 337 | | | | 61 | | | | 7,760 | | | | 828 | |
Less: cash acquired | | | - | | | | - | | | | (83 | ) | | | (15 | ) |
| | | $ | 337 | | | $ | 61 | | | $ | 7,677 | | | $ | 813 | |
Cash proceeds on divesture1 | | | | | | | | | | | | | | | | |
Sedibelo | | $ | - | | | $ | - | | | $ | 44 | | | $ | - | |
IPO of African gold mining operations2 | | | - | | | | - | | | | - | | | | 884 | |
Osborne | | | - | | | | 17 | | | | - | | | | 17 | |
Pinson | | | 15 | | | | - | | | | 15 | | | | - | |
| | | $ | 15 | | | $ | 17 | | | $ | 59 | | | $ | 901 | |
| 1 | All amounts represent gross cash paid on acquisition or received on divestiture. |
| 2 | There was no change in control as a result of the IPO of ABG, and consequently the net proceeds received were recorded as a financing cash inflow on the consolidated statement of cash flows. |
| | A) | Acquisition of Equinox Minerals Limited |
On June 1, 2011, we acquired 83% of the recorded voting shares of Equinox Minerals Limited (“Equinox”), thus obtaining control. Throughout June we obtained a further 13% of the voting shares and obtained the final 4% on July 19, 2011. Cash consideration paid in second quarter 2011 was $7,213 million, with a further $269 million paid in third quarter 2011, for total cash consideration of $7,482 million. We have determined that this transaction represents a business combination with Barrick identified as the acquirer. We began consolidating the operating results, cash flows and net assets of Equinox from June 1, 2011.
Equinox was a publicly traded mining company that owns the Lumwana copper mine in Zambia and the Jabal Sayid copper project in Saudi Arabia. The operations of Equinox are being integrated into Barrick’s Australia Pacific business unit and the Capital Projects group.
The tables below present the purchase cost and our preliminary allocation of the purchase price to the assets and liabilities acquired. This allocation is preliminary as we have not had sufficient time to complete the valuation process. In third quarter 2011, we have made minor adjustments to some of the estimated fair values and there will be further adjustments to the estimated fair values as the valuation work is finalized.
| | | | |
| Purchase Cost | | | |
| | | | | |
Cash paid to Equinox shareholders in June 2011 | | | $ 6,957 | |
Cash paid to Equinox shareholders in July 2011 | | | 269 | |
| |
Cost of Equinox shares previously acquired | | | 131 | |
Payouts to Equinox employees on change of control | | | 125 | |
Total Acquisition Cost | | | $ 7,482 | |
Cash acquired with Equinox | | | (83) | |
Net Cash Consideration | | | $ 7,399 | |
The purchase cost was funded from our existing cash balances and from proceeds from the issuance of long-term debt of $6.5 billion.
Summary of Preliminary Purchase Price Allocation
| | | | |
| | | Preliminary
Fair Value at
Acquisition | |
Assets | |
Current assets | | | $ 411 | |
Property plant and equipment | | | 5,659 | |
Other assets | | | 66 | |
Goodwill | | | 3,427 | |
Total assets | | | $ 9,563 | |
| |
Liabilities | | | | |
Current Liabilities | | | $ 291 | |
Deferred income tax liabilities | | | 1,339 | |
Provisions | | | 43 | |
Debt | | | 408 | |
Total liabilities | | | $ 2,081 | |
Net assets | | | $ 7,482 | |
In accordance with the acquisition method of accounting, the acquisition cost has been allocated on a preliminary basis to the underlying assets acquired and liabilities assumed based primarily upon their estimated fair values at the date of acquisition. We used an income approach (being the net present value of expected future cash flows) to determine the preliminary fair values of mining interests. Estimates of expected future cash flows for the final valuations are based on estimates of projected future revenues, expected conversions of resources to reserves, expected future production costs and capital expenditures based on a finalized life of mine plan. The excess of acquisition cost over the net identifiable assets acquired represents goodwill.
| | | | |
| BARRICK THIRD QUARTER 2011 | | 86 | | NOTES TO FINANCIAL STATEMENTS (UNAUDITED) |
Goodwill arose on this acquisition principally because of the following factors: 1) the scarcity of large, long-life copper deposits; 2) the ability to capture financing, tax and operational synergies by managing these properties within Barrick; 3) the potential to expand production through operational improvements and increases to reserves through exploration at the Lumwana property, which is located in one of the most prospective copper regions in the world; and 4) the requirement to record a deferred tax liability for the difference between the assigned values and the tax bases of assets acquired and liabilities assumed at amounts that do not reflect fair value. The goodwill is not deductible for income tax purposes.
Since it has been consolidated from June 1, 2011, Equinox contributed revenue of $353 million and segment income of $25 million. Revenues and net income of the combined entity would have been approximately $10.9 billion and approximately $3.5 billion, respectively, for the nine months ended September 30, 2011 had the acquisition and related debt issuances occurred on January 1, 2011.
Acquisition related costs of approximately $85 million have been expensed, with approximately $39 million presented in other expense and $45 million in realized foreign exchange losses relating to our economic hedge of the purchase price presented in gain (loss) on non-hedge derivatives.
| | B) | Barrick Energy Acquisitions |
In 2011, our oil and gas subsidiary, Barrick Energy has completed two acquisitions. On June 30, 2011, Barrick Energy, acquired all of the outstanding shares of Venturion Natural Resources Limited (“Venturion”), a privately held corporation, for approximately $185 million. On July 28, 2011, Barrick Energy acquired all of the outstanding shares of Culane Energy Corporation (“Culane”) for approximately $68 million. These acquisitions were made to acquire additional producing assets, proved and probable reserves, as well as facilities to allow us to grow and expand our energy business. We have determined that these transactions represent business combinations, with Barrick Energy identified as the acquirer. The tables below present the combined purchase cost and the preliminary purchase price allocation for these transactions. The purchase price allocation will be finalized in fourth quarter 2011 upon the determination of the final fair values. We have recorded goodwill on these transactions as a result of the potential to increase current reserves through enhanced oil recoveries and the requirement to record a deferred tax liability for the difference between the carrying values and the tax bases of assets acquired and liabilities assumed. The goodwill is not deductible for tax purposes. Barrick Energy began consolidating the operating results, cash flows, and net assets of Venturion and Culane from June 30, 2011 and July 28, 2011, respectively.
| | | | |
| Total Costs to Allocate | | | |
Purchase cost | | | $ 253 | |
| |
Preliminary Allocation of Fair Values to Venturion and
Culane’s Net Assets | | | |
Current assets | | | $ 11 | |
Property, plant & equipment | | | 298 | |
Goodwill | | | 39 | |
Total assets | | | 348 | |
Current liabilities | | | 3 | |
Asset retirement obligation | | | 13 | |
Bank debt | | | 44 | |
Deferred income tax liabilities | | | 35 | |
Total liabilities | | | 95 | |
Net assets acquired | | | $ 253 | |
In 2010, Barrick Energy completed three acquisitions. On May 17, 2010, Barrick Energy acquired all of the outstanding shares of Bountiful Resources (“Bountiful”), a privately held corporation, for approximately $109 million and on June 25, 2010, Barrick Energy acquired the Puskwa property from Galleon Energy Inc. (“Puskwa”) for approximately $130 million. On September 17, 2010, Barrick Energy acquired the assets of Dolomite Resources (“Dolomite”) for approximately $25 million. These acquisitions were made to acquire additional producing assets, proved and probable reserves as well as facilities to allow us to grow and expand our energy business. We have determined that these transactions represent business combinations, with Barrick Energy identified as the acquirer. The tables below present the combined purchase cost and the final purchase price allocation for these 2010 transactions. We have recorded goodwill on these transactions as a result of the potential to increase current reserves through enhanced oil recoveries and the requirement to record a deferred tax liability for the difference between the carrying values and the tax bases of assets acquired and liabilities assumed. The goodwill is not deductible for tax purposes. Barrick Energy began consolidating the operating results, cash flows, and net assets of Bountiful, Puskwa, and Dolomite, from May 17, 2010, June 25, 2010, and September 17, 2010, respectively.
| | | | |
| BARRICK THIRD QUARTER 2011 | | 87 | | NOTES TO FINANCIAL STATEMENTS (UNAUDITED) |
| | | | |
| Total Costs to Allocate | | | |
Purchase cost | | $ | 264 | |
| | | | |
Final Allocation of Fair Values to Bountiful, Puskwa and
Dolomite’s Net Assets | |
Current assets | | | $ 8 | |
Property, plant & equipment | | | 252 | |
Goodwill | | | 64 | |
Total assets | | | 324 | |
Current liabilities | | | 2 | |
Asset retirement obligation | | | 8 | |
Bank debt | | | 13 | |
Deferred income tax liabilities | | | 37 | |
Total liabilities | | | 60 | |
Net assets acquired | | $ | 264 | |
| | C) | Acquisition of Tusker Gold Limited |
On April 27, 2010, ABG acquired 100% of the issued and outstanding shares of Tusker Gold Limited (“Tusker”) for aggregate net consideration of approximately $74 million. As a result of this acquisition, ABG has increased its interest in the Nyanzaga joint venture from 51% to 100%. We have determined that this transaction represents a business combination, with ABG identified as the acquirer. The purchase price allocation was finalized in second quarter 2011 and there were no adjustments to the preliminary allocations. The goodwill is attributable to a deferred tax liability generated due to the difference between the fair value of the exploration and evaluation assets and the book value of these assets. The tables below present the purchase cost and our final purchase price allocation. ABG began consolidating the operating results, cash flows and net assets of Tusker from April 30, 2010.
| | | | |
| Total Costs to Allocate | | | |
| | | | | |
Purchase cost | | $ | 74 | |
Less: cash acquired | | | (8) | |
Cash consideration paid | | $ | 66 | |
| | | | |
| Allocation of Fair Values to Tusker’s Net Assets | | | |
Property, plant & equipment | | $ | 80 | |
Goodwill | | | 22 | |
Total assets | | | 102 | |
Current liabilities | | | 10 | |
Other non-current liabilities | | | 4 | |
Deferred income tax liabilities | | | 22 | |
Total liabilities | | | 36 | |
Net assets acquired | | $ | 66 | |
| | D) | Disposition of 10% Interest in Sedibelo |
On March 23, 2011, we disposed of our 10% interest in the Sedibelo platinum project (“Sedibelo”) with a carrying amount of nil, to the Bakgatla-Ba-Kgafela Tribe (“BBK”), owner of the remaining 90% interest in Sedibelo; and transferred certain long lead items and associated liabilities with carrying amounts of nil and $23 million respectively, to Newshelf 1101 (Proprietary) Limited for consideration of $44 million. We also settled various outstanding matters between Barrick and the BBK regarding Sedibelo and their respective interests. We recorded a pre-tax gain of $67 million upon the closing of this transaction.
| | E) | IPO of African Gold Mining Operations |
On March 24, 2010, the IPO for ABG closed and its approximately 404 million ordinary shares were admitted to the Official List of the UK Listing Authority and to trading on the London Stock Exchange’s main market for listed securities. ABG sold approximately 101 million ordinary shares in the offering, or about 25% of its equity and Barrick retained an interest in approximately 303 million ordinary shares, or about 75% of the equity of ABG. In April 2010, the over-allotment option was partially exercised resulting in a 1.1% dilution of our interest in ABG to 73.9%.
The net proceeds from the IPO and the exercise of the over-allotment option were approximately $834 million and $50 million respectively. As Barrick has retained a controlling financial interest in ABG, we continue to consolidate ABG and accounted for the disposition of ABG shares as an equity transaction. Accordingly, the difference between the proceeds received and the carrying amount has been recorded as additional paid-in capital in equity, and we have set up a non-controlling interest to reflect the change in our ownership interest in ABG.
| | F) | Acquisition of Additional 25% Interest in Cerro Casale |
On March 31, 2010, we completed the acquisition of the additional 25% interest in Cerro Casale from Kinross Gold Corporation (“Kinross”) for cash consideration of $454 million and the elimination of a $20 million contingent obligation, which was payable by Kinross to Barrick on a construction decision. The acquisition of the additional 25% interest has been accounted for as a business combination.
Our interest in the project is now 75% and, as a result of obtaining control, we have re-measured our previously held 50% ownership interest to fair value and recorded a corresponding post-tax gain of $42 million in other income (see note 10C).
| | | | |
| BARRICK THIRD QUARTER 2011 | | 88 | | NOTES TO FINANCIAL STATEMENTS (UNAUDITED) |
We used an income approach (being the net present value of expected future cash flows) to determine the fair values of the depreciable and non-depreciable mining interest. Estimates of expected future cash flows reflect estimates of projected future revenues, conversion of resources to reserves, production costs and capital expenditures contained in our life of mine plan.
The discount rate used to present value the net future cash flows is based on our real weighted average cost of capital, with an appropriate adjustment for geographical risks associated with the relevant cash flows.
We recorded goodwill on this acquisition principally because of the following factors: 1) The going concern value implicit in our ability to sustain and grow this project by increasing reserves and resources through new discoveries; 2) The ability to capture unique synergies that can be realized from managing this project within our South America regional business unit; and 3) the requirement to record a deferred tax liability for the difference between the assigned values and the tax bases of assets acquired and liabilities assumed at amounts that do not reflect fair value. The goodwill is not deductible for income tax purposes.
Beginning in second quarter 2010, we consolidate 100% of the operating results, cash flows, assets and liabilities of Cerro Casale, with an offsetting non-controlling interest of 25% measured at fair value as at March 31, 2010.
The tables below present the purchase cost, the final purchase price allocation and the remeasurement gain recorded in other income (note 10C).
| | | | |
| Purchase Cost | | | |
| | | | | |
Cash | | | $ 454 | |
Less: cash acquired | | | (7) | |
| | | | | |
Cash consideration paid | | | 447 | |
Carrying amount of equity method investment | | | 839 | |
Remeasurement gain | | | 42 | |
| | | | | |
Net assets | | | $ 1,328 | |
| | | | | |
| | | | |
| Summary of Purchase Price Allocation | | | |
| | | | | |
| | | Fair Value at
Acquisition | |
| | | | | |
Current assets | | | $ 1 | |
VAT receivables | | | 12 | |
Depreciable mining interest | | | 1,155 | |
Non-depreciable mining interest | | | 263 | |
Water rights | | | 75 | |
Goodwill | | | 809 | |
| | | | | |
Total assets | | | 2,315 | |
| | | | | |
Current liabilities | | | 10 | |
Deferred income tax liabilities | | | 523 | |
| | | | | |
Total liabilities | | | 533 | |
| | | | | |
Non-controlling interest | | | 454 | |
| | | | | |
Net assets | | | $ 1,328 | |
| | | | | |
| | G) | Discontinued Operations |
| | | | | | | | | | | | | | | | |
| | | | | | | | | | | | | | | | | |
| Results of Discontinued Operations | |
| | | | | | | | | | | | | | | | | |
| |
| For the three months
ended September 30 |
| |
| For the nine months
ended September 30 |
|
| | | | | | | | | | | | | | | | | |
| | | 2011 | | | | 2010 | | | | 2011 | | | | 2010 | |
| | | | | | | | | | | | | | | | | |
Gold sales | | | | | | | | | | | | | | | | |
Osborne | | | $ - | | | | $ 6 | | | | $ - | | | | $ 30 | |
Copper sales | | | | | | | | | | | | | | | | |
Osborne | | | - | | | | 30 | | | | - | | | | 170 | |
| | | | | | | | | | | | | | | | | |
| | | $ - | | | | $ 36 | | | | $ - | | | | $ 200 | |
| | | | | | | | | | | | | | | | | |
Other metal sales | | | | | | | | | | | | | | | | |
Osborne | | | $ - | | | | $ - | | | | $ - | | | | $ 2 | |
| | | | | | | | | | | | | | | | | |
| | | | | | | $ 36 | | | | | | | | $ 202 | |
| | | | | | | | | | | | | | | | | |
Income before tax | | | | | | | | | | | | | | | | |
Osborne | | | $ - | | | | $ 16 | | | | $ - | | | | $ 117 | |
| | | | | | | | | | | | | | | | | |
| | | $ - | | | | $ 16 | | | | $ - | | | | $ 117 | |
| | | | | | | | | | | | | | | | | |
Osborne
On September 30, 2010, we divested our Osborne copper mine for $17 million cash, as well as a royalty receivable from any future production, capped at approximately $14 million. Ivanhoe has agreed to assume all site environmental obligations. A loss of approximately $7 million, primarily due to the settlement of severance obligations, was recorded and recognized in discontinued operations. The results of operations and the assets and liabilities of Osborne have been presented as discontinued operations in the consolidated statement of income, the consolidated statement of cash flow and the consolidated balance sheet.
| | | | |
| BARRICK THIRD QUARTER 2011 | | 89 | | NOTES TO FINANCIAL STATEMENTS (UNAUDITED) |
5 > SEGMENT INFORMATION
Operating segments are components of Barrick whose separate financial information is available that is evaluated regularly by Barrick’s Chief Executive Officer who is our Chief Operating Decision Maker (“CODM”). Our format for segment reporting is based on product segments, including all project development activities up to and including the commissioning of new mines with a further break down by geographical segments. The product segments are determined based on our management and internal reporting structure. Our geographical segments are determined by the location of our assets and operations. In second quarter 2011, we completed the acquisition of Equinox (note 4A) which is comprised of an operating copper mine and a development project. The operations of Equinox have been integrated into our Australia Pacific business unit. However, the copper mine and development project are evaluated separately from the existing Australia Pacific gold segment by the CODM. As such, we revised our segment disclosure to present the operating copper mine results as Australia Pacific copper and the development project results within Capital Projects in our segment information.
| | | | | | | | | | | | | | | | | | | | | | | | |
| Income Statement Information | | | | | | | | | | | | | | | | | | |
| For the three months ended September 30, 2011 | | Revenues | | | Cost of Sales | | | Exploration &
Evaluation | | | RBU Costs | | | Other Expenses
(Income)1 | | | Segment Income
(Loss)2 | |
Gold | | | | | | | | | | | | | | | | | | | | | | | | |
North America | | | $ 1,516 | | | | $ 488 | | | | $ 30 | | | | $ 13 | | | | $ 7 | | | | $ 978 | |
South America | | | 738 | | | | 219 | | | | 6 | | | | 11 | | | | 11 | | | | 491 | |
Australia Pacific | | | 828 | | | | 400 | | | | 26 | | | | 3 | | | | (2) | | | | 401 | |
ABG | | | 355 | | | | 184 | | | | 7 | | | | 12 | | | | 13 | | | | 139 | |
| | | | | | |
Copper | | | | | | | | | | | | | | | | | | | | | | | | |
South America | | | 272 | | | | 138 | | | | - | | | | - | | | | 10 | | | | 124 | |
Australia Pacific | | | 251 | | | | 250 | | | | 5 | | | | 6 | | | | (12) | | | | 2 | |
Capital Projects3 | | | - | | | | - | | | | 14 | | | | 1 | | | | 18 | | | | (33) | |
Barrick Energy | | | 47 | | | | 47 | | | | - | | | | 4 | | | | 3 | | | | (7) | |
| | | | $ 4,007 | | | | $ 1,726 | | | | $ 88 | | | | $ 50 | | | | $ 48 | | | | $ 2,095 | |
| | | | | | |
| | | | | | | | | | | | | | | | | | | | | | | | |
| Income Statement Information | | | | | | | | | | | | | | | | | | |
| For the three months ended September 30, 2010 | | Revenues | | | Cost of Sales | | | Exploration &
Evaluation | | | RBU Costs | | | Other Expenses
(Income)1 | | | Segment Income
(Loss)2 | |
Gold | | | | | | | | | | | | | | | | | | | | | | | | |
North America | | | $ 1,119 | | | | $ 493 | | | | $ 22 | | | | $ 8 | | | | $ 11 | | | | $ 585 | |
South America | | | 560 | | | | 152 | | | | 4 | | | | 9 | | | | 10 | | | | 385 | |
Australia Pacific | | | 591 | | | | 370 | | | | 11 | | | | 11 | | | | (9) | | | | 208 | |
ABG | | | 221 | | | | 143 | | | | 6 | | | | 10 | | | | - | | | | 62 | |
| | | | | | |
Copper | | | | | | | | | | | | | | | | | | | | | | | | |
South America | | | 271 | | | | 115 | | | | - | | | | - | | | | 9 | | | | 147 | |
Australia Pacific | | | - | | | | - | | | | - | | | | - | | | | - | | | | - | |
Capital Projects3 | | | - | | | | - | | | | 9 | | | | - | | | | (5) | | | | (4) | |
Barrick Energy | | | 26 | | | | 25 | | | | - | | | | 2 | | | | (2) | | | | 1 | |
| | | | $ 2,788 | | | | $ 1,298 | | | | $ 52 | | | | $ 40 | | | | $ 14 | | | | $ 1,384 | |
| | | | |
| BARRICK THIRD QUARTER 2011 | | 90 | | NOTES TO FINANCIAL STATEMENTS (UNAUDITED) |
| | | | | | | | | | | | | | | | | | | | | | | | |
| Income Statement Information | |
| For the nine months ended September 30, 2011 | | Revenues | | | Cost of Sales | | | Exploration &
Evaluation | | | RBU Costs | | | Other Expenses
(Income)1 | | | Segment Income
(Loss)2 | |
Gold | | | | | | | | | | | | | | | | | | | | | | | | |
North America | | | $ 4,030 | | | | $ 1,440 | | | | $ 74 | | | | $ 31 | | | | $ 80 | | | | $ 2,405 | |
South America | | | 1,985 | | | | 649 | | | | 19 | | | | 29 | | | | 3 | | | | 1,285 | |
Australia Pacific | | | 2,236 | | | | 1,155 | | | | 66 | | | | 27 | | | | 6 | | | | 982 | |
ABG | | | 933 | | | | 530 | | | | 23 | | | | 33 | | | | 31 | | | | 316 | |
| | | | | | |
Copper | | | | | | | | | | | | | | | | | | | | | | | | |
South America | | | 859 | | | | 360 | | | | - | | | | - | | | | - | | | | 499 | |
Australia Pacific | | | 353 | | | | 323 | | | | 7 | | | | 10 | | | | (12) | | | | 25 | |
Capital Projects3 | | | - | | | | - | | | | 35 | | | | 1 | | | | 20 | | | | (56) | |
Barrick Energy | | | 127 | | | | 108 | | | | - | | | | 9 | | | | 8 | | | | 2 | |
| | | | $ 10,523 | | | | $ 4,565 | | | | $ 224 | | | | $ 140 | | | | $ 136 | | | | $ 5,458 | |
| | | | | | | | | | | | | | | | | | | | | | | | |
| Income Statement Information | |
| For the nine months ended September 30, 2010 | | Revenues | | | Cost of Sales | | | Exploration &
Evaluation | | | RBU Costs | | | Other Expenses
(Income)1 | | | Segment Income
(Loss)2 | |
Gold | | | | | | | | | | | | | | | | | | | | | | | | |
North America | | | $ 2,825 | | | | $ 1,386 | | | | $ 57 | | | | $ 25 | | | | $ 45 | | | | $ 1,312 | |
South America | | | 1,957 | | | | 541 | | | | 12 | | | | 28 | | | | 24 | | | | 1,352 | |
Australia Pacific | | | 1,733 | | | | 1,090 | | | | 34 | | | | 34 | | | | 13 | | | | 562 | |
ABG | | | 676 | | | | 422 | | | | 9 | | | | 25 | | | | 17 | | | | 203 | |
| | | | | | |
Copper | | | | | | | | | | | | | | | | | | | | | | | | |
South America | | | 736 | | | | 318 | | | | - | | | | - | | | | 15 | | | | 403 | |
Australia Pacific | | | - | | | | - | | | | - | | | | - | | | | - | | | | - | |
Capital Projects3 | | | - | | | | - | | | | 44 | | | | 1 | | | | (36) | | | | (9) | |
Barrick Energy | | | 63 | | | | 57 | | | | - | | | | 5 | | | | - | | | | 1 | |
| | | | $ 7,990 | | | | $ 3,814 | | | | $ 156 | | | | $ 118 | | | | $ 78 | | | | $ 3,824 | |
| 1 | Other expenses include accretion expense. For the three months ended September 30, 2011, accretion expense was $16 million (2010: $ 5 million) and for the nine months ended September 30, 2011, accretion expense was $40 million (2010: $17 million). See note 11 for further details. |
| 2 | We manage the performance of our regional business units using a measure of income before interest and taxes, consequently interest income, interest expense and income taxes are not allocated to our regional business units. |
| 3 | Segment income (loss) for the Capital Projects segment includes exploration and evaluation expense and losses from equity investees that hold capital projects. See notes 8 and 14 for further details. For the nine months ended September 30, 2010, Capital Projects other expenses (income) includes a $69 million pre-tax gain on the acquisition of the 25% interest in Cerro Casale (note 4F). |
| | | | | | | | | | | | | | | | |
| Reconciliation of Segment Income to Income from Continuing Operations Before Income Taxes and Other Items | |
| | | For the three months ended September 30 | | | For the nine months ended September 30 | |
| | | | 2011 | | | | 2010 | | | | 2011 | | | | 2010 | |
Segment income | | | $ 2,095 | | | | $ 1,384 | | | | $ 5,458 | | | | $ 3,824 | |
Cost of sales - depreciation of corporate assets | | | (4) | | | | (3) | | | | (18) | | | | (17) | |
Exploration and evaluation not attributable to segments | | | (9) | | | | (10) | | | | (33) | | | | (32) | |
Corporate administration | | | (43) | | | | (37) | | | | (123) | | | | (115) | |
Other income (expense) not attributable to segments | | | 23 | | | | (12) | | | | 83 | | | | (59) | |
Impairment (charges) reversals | | | (19) | | | | 29 | | | | (23) | | | | 53 | |
Finance income | | | 3 | | | | 5 | | | | 10 | | | | 11 | |
Finance costs (excludes accretion) | | | (52) | | | | (35) | | | | (108) | | | | (136) | |
Gain (loss) on non-hedge derivatives | | | 32 | | | | (4) | | | | 8 | | | | 84 | |
Gain from equity investees not attributable to segments | | | 11 | | | | 3 | | | | 22 | | | | 5 | |
Income before income taxes | | | $ 2,037 | | | | $ 1,320 | | | | $ 5,276 | | | | $ 3,618 | |
| | | | |
| BARRICK THIRD QUARTER 2011 | | 91 | | NOTES TO FINANCIAL STATEMENTS (UNAUDITED) |
| | | | | | | | | | | | | | | | |
| Asset Information | |
| Segment capital expenditures1 | | For the three months
ended September 30 | | | For the nine months
ended September 30 | |
| | | | 2011 | | | | 2010 | | | | 2011 | 2 | | | 2010 | |
Gold | | | | | | | | | | | | | | | | |
North America | | | $ 290 | | | | $ 163 | | | | $ 788 | | | | $ 454 | |
South America | | | 85 | | | | 88 | | | | 208 | | | | 206 | |
Australia Pacific | | | 150 | | | | 101 | | | | 357 | | | | 258 | |
ABG | | | 84 | | | | 48 | | | | 209 | | | | 135 | |
Copper | | | | | | | | | | | | | | | | |
South America | | | 14 | | | | 9 | | | | 31 | | | | 19 | |
Australia Pacific | | | 76 | | | | - | | | | 97 | | | | - | |
Capital Projects | | | 797 | | | | 507 | | | | 2,041 | | | | 1,500 | |
Barrick Energy | | | 52 | | | | 21 | | | | 114 | | | | 51 | |
Segment total | | | 1,548 | | | | 937 | | | | 3,845 | | | | 2,623 | |
| Other items not allocated to segments | | | 7 | | | | 26 | | | | 19 | | | | 40 | |
Enterprise total | | | $ 1,555 | | | | $ 963 | | | | $ 3,864 | | | | $ 2,663 | |
| 1 | Segment capital expenditures are presented for internal management reporting purposes on an accrual basis. Capital expenditures in the Consolidated Statement of Cash Flow are presented on a cash basis. For the three months ended September 30, 2011, cash expenditures were $1,514 million (2010: $907 million) and the increase in accrued expenditures was $41 million (2010: $ 56 million increase). For the nine months ended September 30, 2011, cash expenditures were $3,653 million (2010: $ 2,467 million) and the increase in accrued expenditures was $211 million (2010: $ 196 million increase). |
| 2 | Total assets at September 30, 2011 were $46,827, an increase of $12,190 since December 31, 2010. The increase is primarily due to the addition of assets, including goodwill, as a result of the acquisition of Equinox on June 1, 2011. |
| | | | | | | | | | | | | | | | |
| 6 > REVENUE | |
| | | For the three months
ended September 30 | | | For the nine months
ended September 30 | |
| | | | 2011 | | | | 2010 | | | | 2011 | | | | 2010 | |
Gold bullion sales1 | | | | | �� | | | | | | | | | | | |
Spot market sales | | | $ 3,274 | | | | $ 2,413 | | | | $ 8,717 | | | | $ 6,961 | |
Concentrate sales | | | 123 | | | | 54 | | | | 346 | | | | 142 | |
| | | | 3,397 | | | | 2,467 | | | | 9,063 | | | | 7,103 | |
Copper sales1 | | | | | | | | | | | | | | | | |
Copper cathode sales | | | 272 | | | | 270 | | | | 852 | | | | 730 | |
Concentrate sales | | | 251 | | | | - | | | | 358 | | | | 3 | |
| | | | 523 | | | | 270 | | | | 1,210 | | | | 733 | |
Oil and gas sales | | | 47 | | | | 26 | | | | 127 | | | | 63 | |
Other metal sales | | | 40 | | | | 25 | | | | 123 | | | | 91 | |
| | | | $ 4,007 | | | | $ 2,788 | | | | $ 10,523 | | | | $ 7,990 | |
| 1 | Revenues include amounts transferred from OCI to earnings for commodity cash flow hedges (see note 18D). |
Revenue
Principal Products
All of our gold mining operations produce gold in doré form, except Bulyanhulu and Buzwagi which produce both gold doré and gold concentrate. Gold doré is unrefined gold bullion bars usually consisting of 90% gold that is refined to pure gold bullion prior to sale to our customers. Concentrate is a processing product containing the valuable ore mineral from which most of the waste mineral has been eliminated. At our Osborne mine we produced a concentrate that contained both gold and copper; and our Lumwana mine produces a concentrate that primarily contains copper. At our Zaldívar mine we produce copper cathode, which consists of 99.9% copper.
Gold Bullion Sales
Gold bullion is sold primarily in the London spot market. The sales price is fixed at the delivery date based on the gold spot price. Generally, we record revenue from gold bullion sales at the time of physical delivery, which is also the date that title to the gold passes.
Concentrate Sales
Under the terms of concentrate sales contracts with independent smelting companies, gold and copper sales prices are provisionally set on a specified future date after shipment based on market prices. We record revenues under these contracts at the time of shipment, which is also when the risk and rewards of ownership pass to the smelting companies, using forward market gold and copper prices on the expected date that final sales prices will be fixed. Variations between the price recorded at the shipment date and the actual final price set under the smelting contracts are caused by changes in market gold and copper prices, and result in an embedded derivative in accounts receivable. The embedded derivative is recorded at fair value each period until final settlement occurs, with changes in fair value classified as provisional price adjustments and included in revenue in the consolidated statement of income.
Copper Cathode Sales
Under the terms of copper cathode sales contracts, copper sales prices are provisionally set on a specified future date based upon market commodity prices plus certain price adjustments. Revenue is recognized at the time of shipment, which is also when the risks and rewards of ownership pass to the customer. Revenue is provisionally measured using forward market prices on the expected date that final selling prices will be fixed. Variations occur between the price recorded on the date of revenue recognition and the actual final price under the terms of
| | | | |
| BARRICK THIRD QUARTER 2011 | | 92 | | NOTES TO FINANCIAL STATEMENTS (UNAUDITED) |
the contracts due to changes in market copper prices, which result in the existence of an embedded derivative in accounts receivable. This embedded derivative is recorded at fair value each period until final settlement occurs, with changes in fair value classified as provisional price adjustments and included in revenue in the consolidated statement of income.
Provisional Copper and Gold Sales
We have provisionally priced sales for which price finalization, referenced to the relevant copper and gold index, is outstanding at the balance sheet date. Our exposure at September 30, 2011 to the impact of movements in market commodity prices for provisionally priced sales is set out in the following table:
| | | | | | | | | | | | | | | | |
| | | Volumes subject to
final pricing | | | Impact on net
income
before taxation of
10% movement in
market price US$M | |
As at September 30 | | | 2011 | | | | 2010 | | | | 2011 | | | | 2010 | |
Copper pounds (millions) | | | 82 | | | | 27 | | | | $ 27 | | | | $ 9 | |
Gold ounces (000’s) | | | 57 | | | | 14 | | | | 10 | | | | 2 | |
For the three months ended September 30, 2011, our provisionally priced copper and gold sales included provisional pricing adjustments of $58 million (2010: $18 million) and $11 million (2010: $nil) respectively. For the nine months ended September 30, 2011, our provisionally priced copper and gold sales included provisional pricing adjustments of $65 million (2010: $11 million) and $15 million (2010: $2 million) respectively.
At September 30, 2011, our provisionally priced copper and gold sales subject to final settlement were recorded at average prices of $3.27/lb (2010: $3.65/lb) and $1,776/oz (2010: $1,271/oz) respectively. The sensitivities in the above tables have been determined as the impact of a 10 percent change in commodity prices at each reporting date, while holding all other variables, including foreign currency exchange rates, constant.
Oil and Gas Sales
Revenue from the sale of crude oil, natural gas and natural gas liquids is recorded at the time it enters the pipeline system, which is also when risks and rewards of ownership are transferred. At the time of delivery of oil and gas, revenues are determined based upon contracts by reference to monthly market commodity prices plus certain price adjustments. Price adjustments include product quality and transportation adjustments and market differentials.
| | | | | | | | |
| | | | | | | |
For the three months ended September 30 | | | 2011 | | | | 2010 | |
Direct mining cost1, 2 | | | $ 1,255 | | | | $ 918 | |
Depreciation | | | 376 | | | | 316 | |
Royalty expense | | | 99 | | | | 67 | |
| | | | | | | | | |
| | | $ 1,730 | | | | $ 1,301 | |
| | | | | | | | | |
| | | | | | | | |
| | | | | | | | | |
For the nine months ended September 30 | | | 2011 | | | | 2010 | |
| | | | | | | | | |
Direct mining cost1,2 | | $ | 3,319 | | | $ | 2,696 | |
Depreciation | | | 1,017 | | | | 936 | |
Royalty expense | | | 247 | | | | 199 | |
| | | | | | | | | |
| | $ | 4,583 | | | $ | 3,831 | |
| | | | | | | | | |
| 1 | Direct mining cost includes charges (reversals) to reduce the cost of inventory to net realizable value as follows: $(1) million for the three months ended September 30, 2011 (2010: $nil) and $nil for the nine months ending September 30, 2011 (2010: $2 million). |
| 2 | Direct mining cost includes the costs of extracting co-products. |
Cost of Sales
Cost of sales consists of direct mining costs (which include personnel costs, general and administrative costs, energy costs (principally diesel fuel and electricity), maintenance and repair costs, operating supplies, external services, third party smelting, refining and transport fees), and depreciation related to sales and royalty expenses for the period. Cost of sales is based on the weighted average cost of contained or recoverable ounces sold and royalty expense for the period. All costs are net of any impairment to reduce inventory to its net realizable value.
| | | | | | | | | | | | | | | | |
| 8 > EXPLORATION & EVALUATION | |
| | |
| For the three months
ended September 30 |
| |
| For the nine months
ended September 30 |
|
| | | | 2011 | | | | 2010 | | | | 2011 | | | | 2010 | |
Exploration: | | | | | | | | | | | | | | | | |
Minesite programs | | | $ 15 | | | | $ 16 | | | | $ 56 | | | | $ 37 | |
Global programs | | | 46 | | | | 26 | | | | 103 | | | | 70 | |
| | | 61 | | | | 42 | | | | 159 | | | | 107 | |
Evaluation costs | | | 33 | | | | 14 | | | | 89 | | | | 49 | |
| Exploration and evaluation expense | | | $ 94 | | | | $ 56 | | | | $ 248 | | | | $ 156 | |
| | | | | | | | | | | | | | | | | |
| | | | |
| BARRICK THIRD QUARTER 2011 | | 93 | | NOTES TO FINANCIAL STATEMENTS (UNAUDITED) |
9 > EARNINGS PER SHARE
| | | | | | | | | | | | | | | | | | | | | | | | | | | | | | | | |
| | | For the three months ended September 30 | | | For the nine months ended September 30 | |
| | | 2011 | | | 2010 | | | 2011 | | | 2010 | |
| | | Basic | | | Diluted | | | Basic | | | Diluted | | | Basic | | | Diluted | | | Basic | | | Diluted | |
Income from continuing operations | | | $ 1,383 | | | | $ 1,383 | | | | $ 944 | | | | $ 944 | | | | $ 3,578 | | | | $ 3,578 | | | | $ 2,566 | | | | $ 2,566 | |
| | | | | | | | |
Net income attributable to non-controlling interests | | | (18) | | | | (18) | | | | (13) | | | | (13) | | | | (53) | | | | (53) | | | | (27) | | | | (27) | |
Plus: interest on convertible debentures | | | - | | | | - | | | | - | | | | - | | | | - | | | | - | | | | - | | | | 1 | |
| Net income from continuing operations after assumed conversions | | | 1,365 | | | | 1,365 | | | | 931 | | | | 931 | | | | 3,525 | | | | 3,525 | | | | 2,539 | | | | 2,540 | |
Income from discontinued operations | | | - | | | | - | | | | 11 | | | | 11 | | | | - | | | | - | | | | 82 | | | | 82 | |
| | | | | | | | |
Net income attributable to equity holders of Barrick Gold | | | | | | | | | | | | | | | | | | | | | | | | | | | | | | | | |
Corporation after assumed conversions | | | $ 1,365 | | | | $ 1,365 | | | | $ 942 | | | | $ 942 | | | | $ 3,525 | | | | $ 3,525 | | | | $ 2,621 | | | | $ 2,622 | |
Weighted average shares outstanding | | | 999 | | | | 999 | | | | 986 | | | | 986 | | | | 999 | | | | 999 | | | | 985 | | | | 985 | |
Effect of dilutive securities | | | | | | | | | | | | | | | | | | | | | | | | | | | | | | | | |
Stock options | | | - | | | | 2 | | | | - | | | | 3 | | | | - | | | | 2 | | | | - | | | | 3 | |
Convertible debentures | | | - | | | | - | | | | - | | | | 9 | | | | - | | | | - | | | | - | | | | 9 | |
| | | | 999 | | | | 1,001 | | | | 986 | | | | 998 | | | | 999 | | | | 1,001 | | | | 985 | | | | 997 | |
| Earnings per share data attributable to the equity holders of Barrick | | | | | | | | | | | | | | | | | | | | | | | | | | | | | | | | |
Gold Corporation | | | | | | | | | | | | | | | | | | | | | | | | | | | | | | | | |
Income from continuing operations | | | $ 1.37 | | | | $ 1.36 | | | | $ 0.94 | | | | $ 0.93 | | | | $ 3.53 | | | | $ 3.52 | | | | $ 2.58 | | | | $ 2.55 | |
Income from discontinued operations | | | $ - | | | | $ - | | | | $0.02 | | | | $0.01 | | | | $ - | | | | $ - | | | | $0.08 | | | | $0.08 | |
Net income | | | $1.37 | | | | $1.36 | | | | $0.96 | | | | $0.94 | | | | $3.53 | | | | $3.52 | | | | $2.66 | | | | $2.63 | |
10 > OTHER CHARGES
A Other Expense
| | | | | | | | | | | | | | | | |
| | | For the three
months ended
September 30 | | | For the nine
months ended
September 30 | |
| | | | 2011 | | | | 2010 | | | | 2011 | | | | 2010 | |
Regional business unit costs1 | | | $ 50 | | | | $ 40 | | | | $ 140 | | | | $ 118 | |
Severance costs | | | - | | | | - | | | | - | | | | 10 | |
Currency translation losses2 | | | 4 | | | | 6 | | | | 3 | | | | 36 | |
Community relations3 | | | 16 | | | | 12 | | | | 34 | | | | 22 | |
| World Gold Council fees | | | 2 | | | | 3 | | | | 7 | | | | 11 | |
| Changes in estimate of rehabilitation costs at closed mines | | | 26 | | | | 11 | | | | 36 | | | | 33 | |
| Pension and other post-retirement benefit expense | | | 1 | | | | - | | | | 1 | | | | 2 | |
| Contingent purchase consideration4 | | | - | | | | - | | | | 39 | | | | - | |
Equinox acquisition costs | | | 2 | | | | - | | | | 39 | | | | - | |
Other items | | | 34 | | | | 24 | | | | 92 | | | | 98 | |
| | | | $ 135 | | | | $ 96 | | | | $ 391 | | | | $ 330 | |
| 1 | Relates to costs incurred at regional business unit offices. |
| 2 | Amounts attributable to currency translation losses on working capital. |
| 3 | Amounts mainly related to community programs and other related expenses. |
| 4 | Amount relates to the re-measurement of a liability for contingent consideration for the acquisition of the additional 40% of the Cortez property in 2008. |
B Impairment Charges and Reversals
| | | | | | | | | | | | | | | | |
| | | For the three
months ended
September 30 | | | For the nine
months ended
September 30 | |
| | | | 2011 | | | | 2010 | | | | 2011 | | | | 2010 | |
| Impairment of long-lived assets | | | $ 19 | | | | $ - | | | | $ 23 | | | | $ - | |
| Impairment (reversal) of investments1 | | | - | | | | (29) | | | | - | | | | (53) | |
| | | | $ 19 | | | | $(29) | | | | $ 23 | | | | $(53) | |
| 1 | Reflects an impairment reversal on our investment in Highland Gold. Refer to Note 3. |
C Other Income
| | | | | | | | | | | | | | | | |
| | | For the three months
ended September 30 | | | For the nine months
ended September 30 | |
| | | | 2011 | | | | 2010 | | | | 2011 | | | | 2010 | |
| Gain on sale of assets and investments1 | | | $ 69 | | | | $ 16 | | | | $ 225 | | | | $ 24 | |
| Gain on acquisition of assets2 | | | - | | | | - | | | | - | | | | 42 | |
Other | | | 7 | | | | 19 | | | | 13 | | | | 26 | |
| | | | $ 76 | | | | $ 35 | | | | $ 238 | | | | $ 92 | |
| 1 | Includes the sale of our interest in the Fenn-Gib project ($35 million) and the sale of our 70% interest in the Pinson mine ($27 million) in third quarter 2011. |
| 2 | Relates to the acquisition of an additional 25% interest in Cerro Casale (note 4F). |
| | | | |
| BARRICK THIRD QUARTER 2011 | | 94 | | NOTES TO FINANCIAL STATEMENTS (UNAUDITED) |
11> FINANCE INCOME AND FINANCE COSTS
Finance Income
| | | | | | | | | | | | | | | | |
| | | For the three
months ended
September 30 | | | For the nine
months ended
September 30 | |
| | | | 2011 | | | | 2010 | | | | 2011 | | | | 2010 | |
Interest income | | | $ 3 | | | | $ 5 | | | | $ 10 | | | | $ 10 | |
Other | | | - | | | | - | | | | - | | | | 1 | |
Total | | | $ 3 | | | | $ 5 | | | | $ 10 | | | | $ 11 | |
Finance Costs | | | | | | | | | | | | |
| | |
| For the three
months ended
September 30 |
| |
| For the nine
months ended
September 30 |
|
| | | | 2011 | | | | 2010 | | | | 2011 | | | | 2010 | |
Interest | | | $ 148 | | | | $ 99 | | | | $ 376 | | | | $ 306 | |
| Amortization of debt issue costs | | | 4 | | | | 1 | | | | 8 | | | | 7 | |
| Gain on interest rate hedges | | | (1 | ) | | | - | | | | - | | | | - | |
Interest capitalized1 | | | (99 | ) | | | (76 | ) | | | (276 | ) | | | (196 | ) |
Finance charges2 | | | - | | | | 11 | | | | - | | | | 19 | |
Accretion | | | 16 | | | | 5 | | | | 40 | | | | 17 | |
Total | | | $ 68 | | | | $ 40 | | | | $ 148 | | | | $ 153 | |
| 1 | Interest has been capitalized at the rate of interest applicable to the specific borrowings financing the assets under construction or, where financed through general borrowings, at a capitalization rate representing the average interest rate on such borrowings. For the three months ended September 30, 2011, the general capitalization rate was 1.2% (2010:1.5%) and for nine months ended September 30, 2011 the general capitalization rate was 4.0% (2010:4.8%). |
| 2 | Represents accrued financing charges on the remaining settlement obligation to close out gold sales contracts. |
12 > INCOME TAX EXPENSE
| | | | | | | | | | | | | | | | |
| | | For the three months
ended September 30 | | | For the nine months
ended September 30 | |
| | | | 2011 | | | | 2010 | | | | 2011 | | | | 2010 | |
Current | | | $ 561 | | | | $ 379 | | | | $ 1,464 | | | | $ 923 | |
Deferred | | | 93 | | | | (3 | ) | | | 234 | | | | 129 | |
| | | | $ 654 | | | | $ 376 | | | | $ 1,698 | | | | $ 1,052 | |
| Actual effective tax rate | | | 32 | % | | | 28 | % | | | 32 | % | | | 29 | % |
| Impact of net currency translation gains on deferred tax balances | | | - | | | | 1 | % | | | 1 | % | | | - | |
| Impact of Peruvian Tax Court decision | | | (1 | %) | | | - | | | | - | | | | - | |
| Impact of legislative amendments on Australia | | | - | | | | - | | | | - | | | | 2 | % |
| Estimated effective tax rate on ordinary income | | | 31 | % | | | 29 | % | | | 33 | % | | | 31 | % |
Currency Translation
Deferred tax balances are subject to remeasurement for changes in currency exchange rates each period. The most significant balances are Papua New Guinea and Argentinean net deferred tax liabilities. These translation gains/losses are included within deferred income tax expense/recovery.
Peruvian Tax Court Decision
As disclosed in Note 23 to the December 31, 2010 financial statements, we filed an appeal with the Tax Court of Peru (“Tax Court”) in respect of a reassessment related to the 2001 to 2003 taxation years. The reassessment mainly related to the validity of a revaluation of the Pierina mining concession. As disclosed in the December 31, 2010 note, we have not previously recorded a provision for this matter.
The Tax Court decision was rendered on July 22, 2011. The Tax Court ruled in our favor on substantially all material issues. However, based on the Tax Court decision, the timing of certain deductions would differ from the position taken on filing. As a result, we would incur interest and penalties in some years and earn refund interest income in other years. We have recorded tax expense of $28 million in third quarter 2011 in respect of this matter. The Tax Court decision is open to appeal by either us or the Peruvian tax authorities.
Dividend Withholding Tax
In second quarter 2011, we recorded a $12 million dollar dividend withholding tax expense in respect of funds available from a foreign subsidiary.
Australian Functional Currency Election
In first quarter 2011, we filed an election in Australia to prepare certain of our Australian tax returns using US dollar functional currency effective January 1, 2011. This election resulted in a one-time benefit of $4 million. Going forward, all material Australian tax returns will now be filed using a US dollar functional currency.
Impact of Legislative Amendments in Australia
In Australia, we elected to enter into the consolidated tax regime in 2004 (in 2002 for the former Placer Dome Inc. subsidiaries). At the time the elections were made, there were certain accrued gains that were required to be included in taxable income upon subsequent realization. In second quarter 2010, clarifying legislative amendments to the Australian consolidation tax rules were enacted. These amendments enable us to reduce the inclusion of certain of these accrued gains, resulting in a permanent decrease in taxable income. The impact of the amendment was a
| | | | |
| BARRICK THIRD QUARTER 2011 | | 95 | | NOTES TO FINANCIAL STATEMENTS (UNAUDITED) |
current tax recovery of $78 million recorded in second quarter 2010.
Decrease to Tax Related Contingent Liabilities
In second quarter 2010, we made payments of $1 million and in first quarter 2010, we made payments of $2 million in settlement of US income tax related contingent liabilities.
We expect the amount of income tax related contingent liabilities to further decrease within 12 months of the reporting date by approximately $2 to $3 million related primarily to the expected settlement of income tax and mining tax assessments.
We further anticipate that it is reasonably possible for the amount of tax related contingent liabilities to decrease within 12 months of the reporting date by approximately $37 million through a potential settlement with tax authorities that may result in a reduction of available tax pools.
13 > CASH FLOW – OTHER ITEMS
| | | | | | | | | | | | | | | | |
| A Operating Cash Flows – Other Items | | For the three months ended
September 30 | | | For the nine months ended
September 30 | |
| | | | 2011 | | | | 2010 | | | | 2011 | | | | 2010 | |
Adjustments for non-cash income statement items: | | | | | | | | | | | | | | | | |
Currency translation losses (note 10A) | | | $ 4 | | | | $ 6 | | | | $ 3 | | | | $ 36 | |
Amortization of debt issue costs | | | 4 | | | | 1 | | | | 8 | | | | 7 | |
Stock option expense | | | 2 | | | | 5 | | | | 12 | | | | 12 | |
(Gain) loss on non-hedge derivatives | | | (32) | | | | 4 | | | | (8) | | | | (84) | |
(Gain) loss from equity investees (note 14) | | | (8) | | | | 3 | | | | (13) | | | | 27 | |
Change in estimate of rehabilitation costs at closed mines | | | 26 | | | | 11 | | | | 36 | | | | 33 | |
Inventory impairment charges (reversals) (note 15) | | | (1) | | | | - | | | | - | | | | 2 | |
Cash flow arising from changes in: | | | | | | | | | | | | | | | | |
Derivative assets and liabilities | | | 81 | | | | (26) | | | | (45) | | | | (19) | |
Value added tax recoverable | | | (72) | | | | (64) | | | | (153) | | | | (140) | |
Other current liabilities | | | 11 | | | | 44 | | | | (34) | | | | 23 | |
Prepaid assets | | | 15 | | | | 18 | | | | (51) | | | | (13) | |
Accounts payable and accrued liabilities | | | 197 | | | | 181 | | | | 162 | | | | 204 | |
Other assets and liabilities | | | 19 | | | | (15) | | | | 51 | | | | 149 | |
Income from discontinued operations | | | - | | | | (11) | | | | - | | | | (82) | |
Operating cash flows of discontinued operations | | | - | | | | - | | | | - | | | | (4) | |
Settlement of rehabilitation obligations | | | (12) | | | | (9) | | | | (30) | | | | (31) | |
Other net operating activities | | | $ 234 | | | | $ 148 | | | | $ (62) | | | | $ 120 | |
| | | |
| B Investing Cash Flows – Other Items | | For the three months ended
September 30 | | | For the nine months ended
September 30 | |
| | | 2011 | | | 2010 | | | 2011 | | | 2010 | |
Funding for equity investees (note 14) | | | $ (8) | | | | $ (12) | | | | $ (31) | | | | $ (44) | |
Investing cash flows of discontinued operations | | | - | | | | - | | | | - | | | | - | |
Other | | | - | | | | - | | | | (50) | | | | - | |
Other net investing activities | | | $ (8) | | | | $ (12) | | | | $ (81) | | | | $ (44) | |
| | | | | | | | | | | | | | | | |
| | | |
| C Financing Cash Flows – Other Items | | For the three months ended
September 30 | | | For the nine months ended
September 30 | |
| | | 2011 | | | 2010 | | | 2011 | | | 2010 | |
Financing fees on long-term debt | | | $ - | | | | (35) | | | | $ (59) | | | | $ (35) | |
Financing cash flows of discontinued operations | | | - | | | | - | | | | - | | | | - | |
Derivative settlements | | | (2) | | | | 31 | | | | (8) | | | | 13 | |
Other net financing activities | | | $ (2) | | | | $ (4) | | | | $ (67) | | | | $ (22) | |
| | | | |
| BARRICK THIRD QUARTER 2011 | | 96 | | NOTES TO FINANCIAL STATEMENTS (UNAUDITED) |
| | | | | | | | | | | | | | | | | | | | | | | | |
| 14 > EQUITY IN INVESTEES | | | | | | | | | | | | | | | | | | |
| | | | | | | | | | | | | | | | | | | | | | | | | |
| Equity Method Investment Continuity | | | | | | | | | | | | | | | | | | |
| | | | | | | | | | | | | | | | | | | | | | | | | |
| | | Highland | | | | Atacama | 1 | | | Cerro Casale | | | | Donlin Gold | | | | Kabanga | | | | Total | |
| | | | | | | | | | | | | | | | | | | | | | | | | |
At January 1, 2010 | | | $ 96 | | | | $ 131 | | | | $ 828 | | | | $ 67 | | | | $ 2 | | | | $ 1,124 | |
Equity pick-up (loss) from equity investees | | | 12 | | | | (19) | | | | (1) | | | | (10) | | | | (6) | | | | (24) | |
Funding | | | - | | | | 12 | | | | 12 | | | | 22 | | | | 5 | | | | 51 | |
Impairment (charges) reversals | | | 84 | | | | - | | | | - | | | | - | | | | - | | | | 84 | |
Derecognition on acquisition of controlling interest2 | | | - | | | | - | | | | (839) | | | | - | | | | - | | | | (839) | |
| | | | | | | | | | | | | | | | | | | | | | | | | |
At December 31, 2010 | | | $ 192 | | | | $ 124 | | | | $ - | | | | $ 79 | | | | $ 1 | | | | $ 396 | |
Equity pick-up (loss) from equity investees | | | 22 | | | | (8) | | | | - | | | | (1) | | | | - | | | | 13 | |
Funding | | | - | | | | 6 | | | | - | | | | 17 | | | | 8 | | | | 31 | |
| | | | | | | | | | | | | | | | | | | | | | | | | |
At September 30, 2011 | | | $ 214 | | | | $ 122 | | | | $ - | | | | $ 95 | | | | $ 9 | | | | $ 440 | |
| | | | | | | | | | | | | | | | | | | | | | | | | |
Publicly traded | | | Yes | | | | No | | | | No | | | | No | | | | No | | | | | |
| | | | | | | | | | | | | | | | | | | | | | | | | |
| 1 | Represents our investment in Reko Diq. |
| 2 | The carrying amount of the Cerro Casale investment has been derecognized as a result of our obtaining control over the entity due to the acquisition of an additional 25% interest and is now consolidated. See note 4F for further details. |
| | | | | | | | | | | | | | | | | | | | | | | | |
| 15 > INVENTORIES | | | | | | | | | | | | | | | | | | |
| | | | | | | | | | | | | | | | | | | | | | | | | |
| | | | | | | Gold | | | | | | | | | | | | Copper | | | | | |
| | | | | | | | | | | | | | | | | | | | | | | | | |
| | |
| At September 30,
2011 |
| |
| At December 31,
2010 |
| |
| At January 1,
2010 |
| |
| At September 30,
2011 |
| |
| At December 31,
2010 |
| |
| At January 1,
2010 |
|
Raw materials | | | | | | | | | | | | | | | | | | | | | | | | |
Ore in stockpiles | | | $ 1,292 | | | | $ 1,364 | | | | $ 932 | | | | $ 192 | | | | $ 112 | | | | $ 79 | |
Ore on leach pads | | | 272 | | | | 223 | | | | 138 | | | | 232 | | | | 157 | | | | 130 | |
Mine operating supplies | | | 723 | | | | 558 | | | | 485 | | | | 100 | | | | 25 | | | | 19 | |
Work in process | | | 352 | | | | 255 | | | | 283 | | | | 6 | | | | 48 | | | | 47 | |
Finished products | | | | | | | | | | | | | | | | | | | | | | | | |
Gold doré | | | 101 | | | | 88 | | | | 74 | | | | - | | | | - | | | | - | |
Copper cathode | | | - | | | | - | | | | - | | | | 10 | | | | 8 | | | | 5 | |
Copper concentrate | | | - | | | | - | | | | - | | | | 72 | | | | - | | | | - | |
Gold concentrate | | | 7 | | | | - | | | | 5 | | | | - | | | | - | | | | - | |
| | | | | | | | | | | | | | | | | | | | | | | | | |
| | | 2,747 | | | | 2,488 | | | | 1,917 | | | | 612 | | | | 350 | | | | 280 | |
Non-current ore in stockpiles1 | | | (950) | | | | (884) | | | | (589) | | | | (160) | | | | (156) | | | | (120) | |
| | | | | | | | | | | | | | | | | | | | | | | | | |
| | | $ 1,797 | | | | $ 1,604 | | | | $ 1,328 | | | | $ 452 | | | | $ 194 | | | | $ 160 | |
| | | | | | | | | | | | | | | | | | | | | | | | | |
| 1 | Ore that we do not expect to process in the next 12 months is classified within other assets. |
| | | | | | | | | | | | | | | | |
| | | | | | | | | | | | | | | | | |
| |
| For the three months ended
September 30 |
| |
| For the nine months ended
September 30 |
|
| | | | | | | | | | | | | | | | | |
| | | 2011 | | | | 2010 | | | | 2011 | | | | 2010 | |
| | | | | | | | | | | | | | | | | |
Inventory impairment charges | | | $ - | | | | $ - | | | | $ 1 | | | | $ 2 | |
Inventory impairment charges reversed | | | (1) | | | | - | | | | (1) | | | | - | |
| | | | | | | | | | | | | | | | | |
| | | | |
| BARRICK THIRD QUARTER 2011 | | 97 | | NOTES TO FINANCIAL STATEMENTS (UNAUDITED) |
Purchase Commitments
At September 30, 2011, we had purchase obligations for supplies and consumables of approximately $1,763 million.
16 > PROPERTY, PLANT, AND EQUIPMENT
| | | | | | | | | | | | |
| | | As at
September 30,
2011 | | | As at
December 31,
2010 | | | As at
January 1,
2010 | |
Depreciable assets | | | $ 15,194 | | | | $ 10,328 | | | | $ 9,492 | |
| | | |
Non-depreciable assets | | | | | | | | | | | | |
Capital projects | | | | | | | | | | | | |
Pascua-Lama | | | 3,249 | | | | 2,156 | | | | 1,185 | |
Pueblo Viejo2 | | | 3,368 | | | | 2,590 | | | | 1,425 | |
Cerro Casale1,2 | | | 1,682 | | | | 1,544 | | | | - | |
Jabal Sayid | | | 1,611 | | | | - | | | | - | |
Construction-in-progress | | | 1,564 | | | | 913 | | | | 853 | |
| Acquired mineral resources | | | 339 | | | | 359 | | | | 423 | |
| | | | $ 27,007 | | | | $ 17,890 | | | | $ 13,378 | |
| 1 | The carrying amount of the Cerro Casale investment has been transferred to PP&E as a result of our obtaining control over the entity due to the acquisition of an additional 25% interest. See note 4F for further details. |
| 2 | Amounts are presented on a 100% basis and include our partner’s non-controlling interest. |
Capital Commitments
In addition to entering into various operational commitments in the normal course of business, we had commitments of approximately $1,494 million at September 30, 2011.
17 > GOODWILL
| | | | | | | | | | | | |
| | | As at
September 30,
2011 | | | As at
December 31,
2010 | | | As at
January 1,
2010 | |
Gold | | | | | | | | | | | | |
North America | | | $ 2,376 | | | | $ 2,376 | | | | $ 2,376 | |
Australia Pacific | | | 1,480 | | | | 1,480 | | | | 1,480 | |
South America | | | 441 | | | | 441 | | | | 441 | |
ABG | | | 179 | | | | 179 | | | | 157 | |
Gold carrying amount | | | 4,476 | | | | 4,476 | | | | 4,454 | |
Copper | | | | | | | | | | | | |
Australia Pacific (note 4A) | | | 3,427 | | | | - | | | | - | |
South America | | | 743 | | | | 743 | | | | 743 | |
Copper carrying amount | | | 4,170 | | | | 743 | | | | 743 | |
Capital Projects | | | 809 | | | | 809 | | | | - | |
Barrick Energy | | | 102 | | | | 68 | | | | - | |
Total carrying amount | | | $ 9,557 | | | | $ 6,096 | | | | $ 5,197 | |
We do not have any goodwill that is deductible for income tax purposes.
18 > FINANCIAL INSTRUMENTS
Financial instruments include cash; evidence of ownership in an entity; or a contract that imposes an obligation on one party and conveys a right to a second entity to deliver/receive cash or another financial instrument.
A Cash and Equivalents
Cash and equivalents include cash, term deposits, treasury bills and money markets with original maturities of less than 90 days.
B Debt
Equinox Acquisition Financing
In April 2011, we entered into a credit and guarantee agreement (the “second credit facility”) with a group of banks (the “Lenders”), which required the Lenders to make available to us a credit facility of up to $2 billion or the equivalent amount in Canadian dollars. The second credit facility, which is unsecured, has an interest rate of LIBOR plus 1.25% on drawn down amounts, and a commitment rate of 0.15% on undrawn amounts. The second credit facility matures in 2016.
In June 2011, we drew $1 billion on the second credit facility to finance a portion of the acquisition of Equinox, including the payment of related fees and expenses. At September 30, 2011, the undrawn amount on the second credit facility was $1 billion.
In June 2011, Barrick, and our wholly-owned subsidiary Barrick North America Finance LLC (“BNAF”), issued an aggregate of $4.0 billion in debt securities comprised of: $700 million of 1.75% notes due 2014 and $1.1 billion of 2.90% notes due 2016 issued by Barrick (collectively, the “Barrick Notes”) as well as $1.35 billion of 4.40% notes due 2021 and $850 million of 5.70% notes due 2041 issued by BNAF (collectively, the “BNAF Notes”). Barrick provides an unconditional and irrevocable guarantee of the BNAF Notes. The Barrick Notes and the guarantee in respect of the BNAF Notes will rank equally with Barrick’s other unsecured and unsubordinated obligations.
The net proceeds from this offering were used in June 2011 to finance a portion of the acquisition of Equinox, including the payment of related fees and expenses.
First Credit Facility
We also have a credit and guarantee agreement (the “first credit facility”) with a group of banks (the “Lenders”), which requires the Lenders to make available to us a credit facility of up to $1.5 billion or the equivalent amount in Canadian dollars. The first credit facility, which is unsecured, has an interest rate of LIBOR plus 0.25% to
| | | | |
| BARRICK THIRD QUARTER 2011 | | 98 | | NOTES TO FINANCIAL STATEMENTS (UNAUDITED) |
0.35% on drawn down amounts, and a commitment rate of 0.07% to 0.08% on undrawn amounts. $50 million matures in 2012 and the remaining $1.45 billion matures in 2013.
In May 2011, we drew $1.5 billion on the first credit facility to finance a portion of the acquisition of Equinox Minerals Limited, including the payment of related fees and expenses.
Pueblo Viejo Project Financing Agreement
In April 2010, Barrick and Goldcorp finalized terms for $1.035 billion (100% basis) in non-recourse project financing for Pueblo Viejo. The amount is divided into three tranches of $400 million, $375 million and $260 million with tenors of 15, 15 and 12 years, respectively. The $400 million tranche bears a coupon of LIBOR+3.25% pre-completion and scales gradually to LIBOR+5.10% (inclusive of political risk insurance premium) for years 13-15. The $375 million tranche bears a fixed coupon of 4.02% for the entire 15 years. The $260 million tranche bears a coupon of LIBOR+3.25% pre-completion and scales gradually to LIBOR+4.85% (inclusive of political risk insurance premium) for years 11-12.
In March 2011, we received $159 million (100% basis) less financing fees of $15 million on this financing agreement. At September 30, 2011, the undrawn amount on this financing agreement was $95 million.
Fixed Rate Notes
We provide an unconditional and irrevocable guarantee on debentures totaling $1.25 billion through our wholly-owned indirect subsidiary Barrick (PD) Australia Finance Pty Ltd. and $1.25 billion of notes through our wholly-owned indirect subsidiaries Barrick North America Finance LLC and Barrick Gold Financeco LLC. These guarantees will rank equally with our other unsecured and unsubordinated obligations.
| | | | | | | | | | | | | | | | | | | | | | | | |
| SCHEDULED DEBT REPAYMENTS | | | | | | | | | | | | | | | | | | |
| | | | | | | | | | | | | | | | | | | | | | | | | |
| | | 2011 | | | | 2012 | | | | 2013 | | | | 2014 | | | | 2015 | | |
| 2016 and
thereafter |
|
| | | | | | | | | | | | | | | | | | | | | | | | | |
Fixed rate notes | | | $ - | | | | $ - | | | | $ 500 | | | | $ - | | | | $ - | | | | $ 2,750 | |
1.75%/2.9%/4.4%/5.7% notes | | | - | | | | - | | | | - | | | | 700 | | | | - | | | | 3,300 | |
5.75%/6.35% notes | | | - | | | | - | | | | - | | | | - | | | | - | | | | 1,000 | |
5.80%/4.875% notes | | | - | | | | - | | | | - | | | | 350 | | | | - | | | | 400 | |
Project financing | | | - | | | | - | | | | 45 | | | | 90 | | | | 90 | | | | 716 | |
First credit facility | | | - | | | | 50 | | | | 1,450 | | | | - | | | | - | | | | - | |
Second credit facility | | | - | | | | - | | | | - | | | | - | | | | - | | | | 1,000 | |
Other debt obligations | | | - | | | | 117 | | | | 65 | | | | - | | | | 100 | | | | 565 | |
| | | | | | | | | | | | | | | | | | | | | | | | | |
| | | $ - | | | | $ 167 | | | | $ 2,060 | | | | $ 1,140 | | | | $ 190 | | | | $ 9,731 | |
| | | | | | | | | | | | | | | | | | | | | | | | | |
Minimum annual payments under capital leases | | | $ 17 | | | | $ 27 | | | | $ 31 | | | | $ 27 | | | | $ 20 | | | | $ 15 | |
| | | | | | | | | | | | | | | | | | | | | | | | | |
| | | | |
| BARRICK THIRD QUARTER 2011 | | 99 | | NOTES TO FINANCIAL STATEMENTS (UNAUDITED) |
| C | Derivative Instruments (“Derivatives”) |
In the normal course of business, our assets, liabilities and forecasted transactions, as reported in US dollars, are impacted by various market risks including, but not limited to:
| | |
Item | | Impacted by |
• Revenues | | • Prices of gold, silver, copper, oil and natural gas |
• Cost of sales | | |
¡ Consumption of diesel fuel, propane, natural gas, and electricity | | • Prices of diesel fuel, propane, natural gas, and electricity |
¡ Non-US dollar expenditures | | • Currency exchange rates – US dollar versus A$, ARS, C$, CLP, JPY, PGK, TZS, GBP, ZAR and ZMK |
• Corporate and regional administration, exploration and business development costs | | • Currency exchange rates – US dollar versus A$, ARS, C$, CLP, JPY, PGK, TZS, ZAR and ZMK |
• Capital expenditures | | |
¡ Non-US dollar capital expenditures | | • Currency exchange rates – US dollar versus A$, ARS, C$, CLP, EUR, PGK and ZMK |
¡ Consumption of steel | | • Price of steel |
• Interest earned on cash and equivalents | | • US dollar interest rates |
• Interest paid on fixed–rate debt | | • US dollar interest rates |
The time frame and manner in which we manage those risks varies for each item based upon our assessment of the risk and available alternatives for mitigating risk. For these particular risks, we believe that derivatives are an appropriate way of managing the risk.
The primary objective of our risk management program is to mitigate variability associated with changing market values related to the hedged item. Many of the derivatives we use meet the hedge effectiveness criteria and are designated in a hedge accounting relationship.
Certain derivatives are designated as either hedges of the fair value of recognized assets or liabilities or of firm commitments (“fair value hedges”) or hedges of highly probable forecasted transactions (“cash flow hedges”), (collectively “accounting hedges”). Hedges that are expected to be highly effective in achieving offsetting changes in fair value or cash flows are assessed on an ongoing basis to determine that they actually have been highly effective throughout the financial reporting periods for which they were designated. Some of the derivative instruments we use are effective in achieving our risk management objectives, but they do not meet the strict hedge effectiveness criteria. These derivatives are considered to be “non-hedge derivatives”. We also enter into derivative instruments with the objective of realizing trading gains to increase our reported net income. These derivatives are also considered to be “non-hedge derivatives”.
| | | | |
| BARRICK THIRD QUARTER 2011 | | 100 | | NOTES TO FINANCIAL STATEMENTS (UNAUDITED) |
D Summary of Derivatives at September 30, 2011
| | | | | | | | | | | | | | | | | | | | | | | | | | | | | | | | |
| | | Notional Amount by Term to Maturity | | | | | | Accounting Classification by
Notional Amount | | | Fair
value
(USD) | |
| | | Within 1 year | | | 2 to 3 years | | | 4+ years | | | Total | | | Cash flow
hedge | | | Fair
value
hedge | | | Non-
Hedge | | | | |
US dollar interest rate contracts | | | | | | | | | | | | | | | | | | | | | | | | | | | | | | | | |
Total receive - fixed swap positions | | | $ - | | | | $ 200 | | | | $ - | | | | $ 200 | | | | $ - | | | | $ 200 | | | | $ - | | | | $ 9 | |
Currency contracts | | | | | | | | | | | | | | | | | | | | | | | | | | | | | | | | |
A$:US$ contracts (A$ millions) | | | 2,086 | | | | 1,795 | | | | 1,007 | | | | 4,888 | | | | 4,488 | | | | - | | | | 400 | | | | 452 | |
C$:US$ contracts (C$ millions) | | | 543 | | | | 141 | | | | - | | | | 684 | | | | 364 | | | | - | | | | 320 | | | | (13) | |
CLP:US$ contracts (CLP millions)1 | | | 162,644 | | | | 396,058 | | | | 64,300 | | | | 623,002 | | | | 211,462 | | | | - | | | | 411,540 | | | | (46) | |
EUR:US$ contracts (EUR millions) | | | 35 | | | | - | | | | - | | | | 35 | | | | 35 | | | | - | | | | - | | | | (2) | |
PGK:US$ contracts (PGK millions) | | | 162 | | | | - | | | | - | | | | 162 | | | | - | | | | - | | | | 162 | | | | 1 | |
| | | | | | | | |
Commodity contracts | | | | | | | | | | | | | | | | | | | | | | | | | | | | | | | | |
| Copper collar sell contracts (millions of pounds) | | | 350 | | | | 62 | | | | - | | | | 412 | | | | 377 | | | | - | | | | 35 | | | | 239 | |
| Copper bought floor contracts (millions of pounds) | | | 26 | | | | 14 | | | | - | | | | 40 | | | | 40 | | | | - | | | | - | | | | 31 | |
| Copper net call spread contract (millions of pounds) | | | 3 | | | | - | | | | - | | | | 3 | | | | - | | | | - | | | | 3 | | | | - | |
| Copper net collar buy contracts (millions of pounds) | | | 20 | | | | - | | | | - | | | | 20 | | | | - | | | | - | | | | 20 | | | | (2) | |
| Silver collar sell contracts (millions of ozs) | | | - | | | | 12 | | | | 33 | | | | 45 | | | | 45 | | | | - | | | | - | | | | 76 | |
| Diesel contracts (thousands of barrels)2 | | | 842 | | | | 3,063 | | | | 340 | | | | 4,245 | | | | 3,925 | | | | - | | | | 320 | | | | (5) | |
| Propane contracts (millions of gallons) | | | 7 | | | | 1 | | | | - | | | | 8 | | | | 8 | | | | - | | | | - | | | | 4 | |
| Natural Gas contracts (thousands of GJ) | | | 122 | | | | - | | | | - | | | | 122 | | | | 122 | | | | - | | | | - | | | | - | |
| Electricity contracts (thousands of megawatt hours) | | | 38 | | | | 26 | | | | - | | | | 64 | | | | - | | | | - | | | | 64 | | | | 1 | |
| 1 | Non-hedge contracts economically hedge pre-production capital expenditures at our Pascua Lama and Cerro Casale projects. |
| 2 | Diesel commodity contracts represent a combination of WTI, ULSD and ULSD/WTI Crack spread swaps, WTB, MOPS, Brent and JET hedge contracts. These derivatives hedge physical supply contracts based on the price of ULSD, WTB, MOPS and JET respectively, plus a spread. WTI represents West Texas Intermediate, WTB represents Waterborne, MOPS represents Mean of Platts Singapore, JET represents Jet Fuel, Brent represents Brent crude, ULSD represents Ultra Low Sulfur Diesel US Gulf Coast. |
| | | | |
| BARRICK THIRD QUARTER 2011 | | 101 | | NOTES TO FINANCIAL STATEMENTS (UNAUDITED) |
Fair Values of Derivative Instruments
| | | | | | | | | | | | | | | | | | | | | | | | | | | | | | | | |
| | | Asset Derivatives | | | | | | Liability Derivatives | |
| | | | | | | | |
| | | Consolidated
Balance Sheet
Classification | | | Fair Value at
September 30,
2011 | | | Fair Value at
December 31,
2010 | | | Fair Value at
January 1,
2010 | | | Consolidated
Balance Sheet
Classification | | | Fair Value at
September 30,
2011 | | | Fair Value at
December 31,
2010 | | | Fair Value at
January 1,
2010 | |
| Derivatives designated as accounting hedges | | | | | | | | | | | | | | | | | | | | | | | | | | | | | | | | |
US dollar interest rate contracts | | | Other assets | | | | $ 9 | | | | $ 6 | | | | $ - | | | | Other liabilities | | | | $ - | | | | $ - | | | | $ - | |
Currency contracts | | | Other assets | | | | 533 | | | | 831 | | | | 374 | | | | Other liabilities | | | | 100 | | | | 1 | | | | 9 | |
Commodity contracts | | | Other assets | | | | 383 | | | | 112 | | | | 53 | | | | Other liabilities | | | | 53 | | | | 192 | | | | 131 | |
| Total derivatives designated as accounting hedges | | | | | | | $ 925 | | | | $ 949 | | | | $ 427 | | | | | | | | $ 153 | | | | $ 193 | | | | $ 140 | |
| | | | | | | | |
| Non-hedge derivatives | | | | | | | | | | | | | | | | | | | | | | | | | | | | | | | | |
US dollar interest rate contracts | | | Other assets | | | | $ - | | | | $ - | | | | $ 1 | | | | Other liabilities | | | | $ - | | | | $ 5 | | | | $ 7 | |
Currency contracts | | | Other assets | | | | 1 | | | | 30 | | | | 15 | | | | Other liabilities | | | | 42 | | | | 7 | | | | 9 | |
Commodity contracts | | | Other assets | | | | 16 | | | | 147 | | | | 61 | | | | Other liabilities | | | | 2 | | | | 73 | | | | 43 | |
| Total non-hedge derivatives | | | | | | | $17 | | | | $ 177 | | | | $ 77 | | | | | | | | $ 44 | | | | $ 85 | | | | $ 59 | |
| Total derivatives | | | | | | | $ 942 | | | | $ 1,126 | | | | $ 504 | | | | | | | | $ 197 | | | | $ 278 | | | | $ 199 | |
US Dollar Interest Rate Contracts
Fair Value Hedges
We have a $200 million receive fixed swap position outstanding that is used to hedge changes in the fair value of a portion of our long-term fixed-rate debt. The effective portion of changes in the fair value of the swap contracts are recorded in interest expense. Gains and losses from hedge ineffectiveness are recognized in current earnings, classified in the consolidated statement of income as gains (losses) on non-hedge derivatives.
Currency Contracts
Cash Flow Hedges
During the quarter, currency contracts totaling AUD 1,380 million, CAD 232 million and CLP 36 billion have been designated against forecasted non-US dollar denominated expenditures. In total, we have AUD $4,488 million, CAD $364 million CLP 211 billion and EUR 35 million designated as cash flow hedges of our anticipated operating, administrative, sustaining capital and project capital spend. The outstanding contracts hedge the variability of the US dollar amount of those expenditures caused by changes in currency exchange rates over the next five years. The effective portion of changes in fair value of the currency contracts is recorded in OCI until the forecasted expenditure impacts earnings. Gains and losses from hedge ineffectiveness are recognized in current earnings, classified in the consolidated statement of income as gains (losses) on non-hedge derivatives.
Non-hedge Derivatives
We concluded that CLP 412 billion of derivative contracts do not meet the strict hedge effectiveness criteria. These contracts represent an economic hedge of pre-production capital expenditures at our Pascua Lama and Cerro Casale projects. Although not qualifying as an accounting hedge, the contracts protect us against the variability of the CLP to the US dollar on pre-production expenditures at our projects. The remaining non-hedge currency contracts are used to mitigate the variability of the US dollar amount of non-US dollar denominated exposures that do not meet the strict hedge effectiveness criteria. Changes in the fair value of the non-hedge currency contracts are recorded in the consolidated statement of income as gains (losses) on non-hedge derivatives.
During the quarter, we wrote a combination of Australian dollar put and call options with an outstanding notional amount of AUD $400 million at September 30, 2011. We also wrote Canadian dollar option contracts with an outstanding notional amount of CAD $300 million at September 30, 2011. As a result of these activities, we earned $6 million in premium income, recognized in the consolidated statement of income as gains on non-hedge derivatives.
Commodity Contracts Diesel/Propane/Electricity/Natural Gas
Cash Flow Hedges
In total, we have fuel contracts totaling 3,385 thousand barrels of diesel, 540 thousand barrels of Brent crude, and
| | | | |
| BARRICK THIRD QUARTER 2011 | | 102 | | NOTES TO FINANCIAL STATEMENTS (UNAUDITED) |
8 million gallons of propane designated as cash flow hedges of our anticipated usage of fuels in our operations. The designated contracts act as a hedge against the variability in market prices. The effective portion of changes in the fair value of the commodity contracts is recorded in OCI until the forecasted transaction impacts earnings. Gains and losses from hedge ineffectiveness are recognized in current earnings, classified in the consolidated statement of income as gains (losses) on non-hedge derivatives.
We also have 122 thousand GJ of AECO sales contracts designated against future forecasted sales of natural gas at Barrick Energy for the remainder of 2011.
Non-hedge Derivatives
As a result of de-designating all existing WTI contracts on January 1, 2011 due to a change in our diesel fuel supply contract, we currently have $29 million of crystallized gains remaining in OCI as at September 30, 2011, remaining from the original total of $35 million. The exposure is still expected to occur and therefore amounts crystallized in OCI will be recorded in cost of sales when the originally designated exposures occur over the next 27 months. During the quarter, we entered in to 420 thousand barrels of WTI swaps to economically hedge our exposure to forecasted fuel purchases for expected consumption at our mines.
Non-hedge electricity contracts of 64 thousand megawatt hours are used to mitigate the risk of price changes on electricity consumption at Barrick Energy. Although not qualifying as an accounting hedge, the contracts protect Barrick to a significant extent from the effects of changes in electricity prices. Changes in the unrealized and realized fair value of non-hedge electricity contracts are recognized in the consolidated statement of income as gains (losses) on non-hedge derivatives.
During the quarter, we wrote WTI put options for a net notional of 500 thousand barrels. As a result of this activity, we recorded $1 million in realized and unrealized losses in the consolidated statement of income as gains (losses) on non-hedge derivatives.
Metals Contracts
Cash Flow Hedges
During the quarter we purchased 71 million pounds of copper collar contracts to designate as hedges against copper concentrate sales at our Lumwana mine in 2011. These contracts contain purchased put and sold call options with weighted average strike prices of $3.69/lb and $4.92/lb respectively. We paid premiums of $4 million to purchase these contracts. We also purchased 18 million
pounds of copper collar contracts to designate as hedges against copper cathode sales at our Zaldivar mine in 2011. These contracts contain purchased put and sold call options with weighted average strike prices of $3.54/lb and $4.67/lb respectively. We paid premiums of $1 million to purchase these contracts.
Silver collar contracts totaling 45 million ounces have been designated as hedges against silver bullion sales from our silver producing mines. The contracts contain purchased put and sold call options with weighted average strike prices of $23/oz and $57/oz respectively.
Our copper and silver collar contracts have been designated as accounting hedges and the effective portion of changes in fair value of these contracts is recorded in OCI until the forecasted sale impacts earnings. Any changes in the fair value of collar contracts due to changes in time value are excluded from hedge effectiveness assessment and are consequently recognized in the consolidated statement of income. Provided the spot copper and silver prices remain within the collar band, any unrealized gain (loss) on the collar will be attributable to time value.
During the quarter we recorded unrealized gains on our copper collars and silver collars of $51 million and $73 million respectively due to changes in time value. This was included in current period earnings as gains (losses) on non-hedge derivative activities. Gains and losses from hedge ineffectiveness and the excluded time value of options are recognized in the consolidated statement of income as gains (losses) on non-hedge derivatives.
Non-hedge Derivatives
We have sold call options outstanding to economically increase the cap on 46 million pounds of our remaining 2011 copper production to $4.88/lb. The options mature evenly throughout 2011. Changes in the unrealized and realized fair value of these copper positions are recognized in the consolidated statement of income as gains (losses) on non-hedge derivatives.
We enter into purchased and written contracts with the primary objective of increasing the realized price on our gold sales. During the quarter, we held net purchased gold long positions with an average outstanding notional of 0.1 million ounces. As a result of these activities, we recorded realized gains of $46 million on gold contracts in the consolidated statement of income as gains (losses) on non-hedge derivatives. There are no outstanding gold positions at September 30, 2011.
| | | | |
| BARRICK THIRD QUARTER 2011 | | 103 | | NOTES TO FINANCIAL STATEMENTS (UNAUDITED) |
Cash Flow Hedge Gains (Losses) in OCI
| | | | | | | | | | | | | | | | | | | | | | | | | | | | | | | | | | | | |
| | | Commodity price hedges | | | | | Currency hedges | | | | | Interest
rate
hedges | | | | |
| | | Gold/Silver | | | Copper | | | Fuel | | | | | Operating
costs | | | Administration/other
costs | | | Capital
expenditures | | | | | Long-
term
debt | | | Total | |
At January 1, 2010 | | | $ 3 | | | | $ (33) | | | | $ (4) | | | | | | $ 309 | | | | $ 19 | | | | $ 25 | | | | | | $ (30) | | | | $ 289 | |
| Effective portion of change in fair value of hedging instruments | | | - | | | | (41) | | | | 29 | | | | | | 552 | | | | 56 | | | | 53 | | | | | | - | | | | 649 | |
Transfers to earnings: | | | - | | | | - | | | | - | | | | | | - | | | | - | | | | - | | | | | | - | | | | | |
| On recording hedged items in earnings/PP&E1 | | | (2) | | | | 54 | | | | 26 | | | | | | (145) | | | | (33) | | | | (13) | | | | | | 3 | | | | (110) | |
At December 31, 2010 | | | $ 1 | | | | $ (20) | | | | $ 51 | | | | | | $ 716 | | | | $ 42 | | | | $ 65 | | | | | | $ (27) | | | | $ 828 | |
| Effective portion of change in fair value of hedging instruments | | | 25 | | | | 196 | | | | 18 | | | | | | (43) | | | | (5) | | | | (2) | | | | | | (7) | | | | 182 | |
Transfers to earnings: | | | - | | | | - | | | | - | | | | | | - | | | | - | | | | - | | | | | | - | | | | | |
| On recording hedged items in earnings/PP&E1 | | | (2) | | | | 7 | | | | (35) | | | | | | (258) | | | | (19) | | | | (44) | | | | | | 2 | | | | (349) | |
| At September 30, 2011 | | | $ 24 | | | | $ 183 | | | | $ 34 | | | | | | $ 415 | | | | $ 18 | | | | $ 19 | | | | | | $ (32) | | | | $ 661 | |
| 1 | Realized gains (losses) on qualifying currency hedges of capital expenditures are transferred from OCI to PP&E on settlement. |
Cash Flow Hedge Gains (Losses) at September 30
| | | | | | | | | | | | | | | | | | | | | | | | | | | | |
Derivatives in cash flow hedging relationships | | Amount of gain
(loss) recognized in
OCI | | | Location of gain (loss)
transferred from OCI into income (effective portion) | | Amount of gain
(loss) transferred
from OCI into
income (effective
portion) | | | Location of gain (loss)
recognized in income (ineffective
portion and amount excluded
from effectiveness testing)1 | | Amount of gain (loss) recognized in income
(ineffective position and amount excluded from
effectiveness testing) | |
| | | 2011 | | | 2010 | | | | | 2011 | | | 2010 | | | | | 2011 | | | 2010 | |
Interest rate contracts | | | $ (7) | | | | $ - | | | Finance income/finance costs | | | $ (2) | | | | $ (2) | | | Gain (loss) on non-hedge derivatives | | | $ - | | | | $ 1 | |
| | | | | | | | |
| Foreign exchange contracts | | | (50) | | | | 392 | | | Cost of sales/corporate administration | | | 321 | | | | 122 | | | Gain (loss) on non-hedge derivatives | | | (17) | | | | - | |
| Commodity contracts | | | 239 | | | | (22) | | | Revenue/cost of sales | | | 30 | | | | (55) | | | Gain (loss) on non-hedge derivatives | | | 177 | | | | 20 | |
Total | | | $ 182 | | | | $ 370 | | | | | | $ 349 | | | | $ 65 | | | | | | $ 160 | | | | $ 21 | |
| 1 | Amounts in the table above represent unrealized and realized gains (losses) recognized in current earnings |
| | | | |
| BARRICK THIRD QUARTER 2011 | | 104 | | NOTES TO FINANCIAL STATEMENTS (UNAUDITED) |
E Gains (Losses) on Non-hedge
Derivatives
| | | | | | | | | | | | | | | | |
| | | For the three
months ended
September 30 | | | For the nine
months ended
September 30 | |
| | | 2011 | | | 2010 | | | 2011 | | | 2010 | |
| Gains (losses) on non-hedge derivatives | | | | | | | | | | | | | | | | |
Commodity contracts | | | | | | | | | | | | | | | | |
Gold | | | $ 46 | | | | $ 10 | | | | $ 53 | | | | $ 25 | |
Copper | | | (7) | | | | 1 | | | | (82) | | | | 34 | |
Fuel | | | (70) | | | | - | | | | (41) | | | | - | |
Currency contracts | | | (58) | | | | 36 | | | | (89) | | | | 16 | |
Interest rate contracts | | | - | | | | (8) | | | | 7 | | | | (11) | |
| | | | (89) | | | | 39 | | | | (152) | | | | 64 | |
| | | | | | | | | | | | | | | | |
| | | | |
| Gains (losses) attributable to silver collar hedges1 | | | 73 | | | | - | | | | 47 | | | | - | |
| Gains (losses) attributable to copper option collar hedges1 | | | 51 | | | | (51) | | | | 124 | | | | 16 | |
| Gains (losses) attributable to currency option collar hedges1 | | | (3) | | | | 3 | | | | (17) | | | | (4) | |
| Hedge ineffectiveness | | | - | | | | 5 | | | | 6 | | | | 8 | |
| | | | 121 | | | | (43) | | | | 160 | | | | 20 | |
| | | | $ 32 | | | | $ (4) | | | | $ 8 | | | | $ 84 | |
| 1 | Represents unrealized gains (losses) attributable to changes in the time value of the collars, which are excluded from the hedge effectiveness assessment. |
| F) | Fair Values of Financial Instruments |
With the exception of long-term debt, all financial assets and financial liabilities are recorded at fair value or carried at an amount that approximates fair value due to the short-term nature and historically negligible credit losses. The fair value of long-term debt at September 30, 2011 is $14,154 million (December 31, 2010: $7,070 million and January 1, 2010: $6,723 million).
19 > OTHER NON-CURRENT LIABILITIES
| | | | | | | | | | | | |
| | | As at September
30, 2011 | | | As at
December
31, 2010 | | | As at
January 1,
2010 | |
| Deposit on silver sale agreement | | | $ 440 | | | | $ 312 | | | | $ 196 | |
| Settlement obligation to close out gold sales contracts | | | - | | | | - | | | | 647 | |
Derivative liabilities | | | 146 | | | | 105 | | | | 19 | |
| Supply contract restructuring costs | | | 28 | | | | 31 | | | | - | |
Offsite remediation | | | 64 | | | | 66 | | | | - | |
Other | | | 74 | | | | 52 | | | | 22 | |
| | | | $ 752 | | | | $ 566 | | | | $ 884 | |
20 > PROVISIONS
| | | | | | | | | | | | |
| | | As at September
30, 2011 | | | As at
December
31, 2010 | | | As at
January 1,
2010 | |
| Environmental rehabilitation | | | $ 1,848 | | | | $ 1,532 | | | | $ 1,191 | |
| Pension benefits | | | 120 | | | | 125 | | | | 119 | |
| Other post retirement benefits | | | 22 | | | | 25 | | | | 26 | |
| RSUs | | | 46 | | | | 30 | | | | 24 | |
| Contingent purchase consideration | | | 50 | | | | 11 | | | | 11 | |
Other | | | 51 | | | | 45 | | | | 37 | |
| | | | $ 2,137 | | | | $ 1,768 | | | | $ 1,408 | |
21 > CAPITAL STOCK A Common Shares
Our authorized capital stock includes an unlimited number of common shares (issued 999,795,445 common shares); 9,764,929 First preferred shares Series A (issued nil); 9,047,619 Series B (issued nil); and 14,726,854 Second preferred shares Series A (issued nil).
Dividends are declared after a quarter end in the announcement of the results for the quarter. Dividends declared are paid in the same quarter.
22 > NON-CONTROLLING INTERESTS
| | | | | | | | | | | | | | | | |
| | | Pueblo
Viejo | | | ABG1 | | | Cerro
Casale2 | | | Total | |
At January 1, 2010 | | | $ 500 | | | | $ 22 | | | | $ - | | | | $ 522 | |
| Share of net earnings (loss) | | | (3) | | | | 52 | | | | - | | | | 49 | |
Cash contributed | | | 101 | | | | - | | | | 13 | | | | 114 | |
| Other increase in non-controlling interest | | | - | | | | 606 | | | | 454 | | | | 1,060 | |
At December 31, 2010 | | | $ 598 | | | | $ 680 | | | | $ 467 | | | | $ 1,745 | |
| Share of net earnings (loss) | | | (11) | | | | 64 | | | | - | | | | 53 | |
Cash contributed | | | 269 | | | | - | | | | 29 | | | | 298 | |
| Other increase (decrease) in non-controlling interest | | | - | | | | (7) | | | | - | | | | (7) | |
At September 30, 2011 | | | $ 856 | | | | $ 737 | | | | $ 496 | | | | $ 2,089 | |
| 1 | Represents non-controlling interest in ABG. The balance at January 1, 2010 includes the non-controlling interest of 30% of our Tulawaka mine. Refer to note 4E. |
| 2 | Represents non-controlling interest in Cerro Casale. Refer to note 4F. |
| | | | |
| BARRICK THIRD QUARTER 2011 | | 105 | | NOTES TO FINANCIAL STATEMENTS (UNAUDITED) |
23 > LITIGATIONS AND CLAIMS
Certain conditions may exist as of the date the financial statements are issued, which may result in a loss to the Company but which will only be resolved when one or more future events occur or fail to occur. In assessing loss contingencies related to legal proceedings that are pending against us or unasserted claims that may result in such proceedings, the Company and its legal counsel evaluate the perceived merits of any legal proceedings or unasserted claims as well as the perceived merits of the amount of relief sought or expected to be sought.
Cortez Hills Complaint
On November 12, 2008, the United States Bureau of Land Management (the “BLM”) issued a Record of Decision approving the Cortez Hills Expansion Project. On November 20, 2008, the TeMoak Shoshone Tribe, the East Fork Band Council of the TeMoak Shoshone Tribe and the Timbisha Shoshone Tribe, the Western Shoshone Defense Project, and Great Basin Resource Watch filed a lawsuit against the United States seeking to enjoin the majority of the activities comprising the Project on grounds that it violated the Western Shoshone rights under the Religious Freedom Restoration Act (“RFRA”), that it violated the Federal Land Policy and Management Act’s (“FLPMA”) prohibition on “unnecessary and undue degradation,” and that the Project’s Environment Impact Statement (“EIS”) did not meet the requirements of the National Environmental Policy Act (“NEPA”). The Plaintiffs subsequently dismissed their RFRA claim, with prejudice, conceding that it was without merit, in light of a decision in another case.
On November 24, 2008, the Plaintiffs filed a Motion for a Temporary Restraining Order and a Preliminary Injunction barring work on the Project until after a trial on the merits. In January 2009, the Court denied the Plaintiffs’ Motion for a Preliminary Injunction, concluding that the Plaintiffs had failed to demonstrate a likelihood of success on the merits and that the Plaintiffs had otherwise failed to satisfy the necessary elements for a preliminary injunction. The Plaintiffs appealed that decision to the United States Court of Appeals for the Ninth Circuit. In December 2009, the Ninth Circuit issued an opinion in which it held that the Plaintiffs had failed to show that they were likely to succeed on the merits of their FLPMA claims, and thus were not entitled to an injunction based on those claims. The Ninth Circuit, however, held that Plaintiffs were likely to succeed on two of their NEPA claims and ordered that a supplemental EIS be prepared by Barrick that specifically provided more information on (i) the effectiveness of proposed mitigation measures for seeps and springs that might be affected by groundwater pumping, and (ii) the air
quality impact of the shipment of refractory ore to Goldstrike for processing and that additional air quality modeling for fine particulate matter using updated EPA procedures should be performed and included in the supplemental EIS. The Ninth Circuit decision directed the District Court to enter an injunction consistent with the decision. In April 2010, the District Court granted Barrick’s motion seeking a tailored preliminary injunction, which allows mining operations to continue while the supplemental EIS is being completed.
In August 2010, the District Court issued an order granting summary judgment for Cortez except, generally for those issues covered by the supplemental EIS, on which it reserved ruling until the completion of that document. The final supplemental EIS was published on January 14, 2011. On March 15, 2011, the BLM issued its record of decision that approved the supplemental EIS, which had the effect of terminating the tailored injunction, thereby enabling the Cortez mine to revert to its original operating scope. The Plaintiffs and Barrick have filed their respective motions for summary judgment on all remaining issues. Oral arguments were held on October 6, 2011. The Court has the matter under advisement.
Marinduque Complaint
Placer Dome Inc. was named the sole defendant in a Complaint filed in October 2005, by the Provincial Government of Marinduque, an island province of the Philippines (“Province”), with the District Court in Clark County, Nevada. The Complaint asserted that Placer Dome Inc. was responsible for alleged environmental degradation with consequent economic damages and impacts to the environment in the vicinity of the Marcopper mine that was owned and operated by Marcopper Mining Corporation (“Marcopper”). Placer Dome Inc. indirectly owned a minority shareholding of 39.9% in Marcopper until the divestiture of its shareholding in 1997. The Province sought “to recover damages for injuries to the natural, ecological and wildlife resources within its territory”. In addition, the Province sought compensation for the costs of restoring the environment, an order directing Placer Dome Inc. to undertake and complete “the remediation, environmental cleanup, and balancing of the ecology of the affected areas,” and payment of the costs of environmental monitoring. The Complaint addressed the discharge of mine tailings into Calancan Bay, the 1993 Maguila-guila dam breach, the 1996 Boac river tailings spill, and alleged past and continuing damage from acid rock drainage.
The action was removed to the U.S. District Court for the District of Nevada on motion of Placer Dome Inc. After the amalgamation of Placer Dome Inc. and the Company, the
| | | | |
| BARRICK THIRD QUARTER 2011 | | 106 | | NOTES TO FINANCIAL STATEMENTS (UNAUDITED) |
Court granted the Province’s motion to join the Company as an additional named Defendant. In June 2007, the Court issued an order granting the Company’s motion to dismiss on grounds offorum non conveniens(improper choice of forum). In September 2009, the U.S. Court of Appeals for the Ninth Circuit reversed the decision of the District Court on the ground that the U.S. District Court lacked subject matter jurisdiction over the case and removal from the Nevada state court was improper.
In April 2010, the Company filed a motion to dismiss the claims in the Nevada state court on the grounds offorum non conveniens and on October 12, 2010, the court issued an order granting the Company’s motion to dismiss the action. On February 11, 2011, the Court issued its written reasons for the dismissal order. On March 11, 2011, the Province filed a motion to reconsider the Court’s order, which the Company opposed on March 28, 2011. The Court denied the motion to reconsider on May 25, 2011. The Province has appealed the Court’s dismissal order to the Nevada Supreme Court. The appeal has not yet been fully briefed. The Company intends to continue to defend the action vigorously. No amounts have been accrued for any potential loss under this complaint.
Calancan Bay (Philippines) Complaint
In July 2004, a complaint was filed against Marcopper and Placer Dome Inc. in the Regional Trial Court of Boac, on the Philippine island of Marinduque, on behalf of a putative class of fishermen who reside in the communities around Calancan Bay, in northern Marinduque. The complaint alleges injuries to health and economic damages to the local fisheries resulting from the disposal of mine tailings from the Marcopper mine. The total amount of damages claimed is approximately US$1 billion.
In October 2006, the court granted the plaintiffs’ application for indigent status, allowing the case to proceed without payment of filing fees. In March 2008, an attempt was made to serve Placer Dome Inc. by serving the summons and complaint on Placer Dome Technical Services (Philippines) Inc. (“PDTS”). PDTS has returned the summons and complaint stating that PDTS is not an agent of Placer Dome Inc. for any purpose and is not authorized to accept service or to take any other action on behalf of Placer Dome Inc. In April 2008, Placer Dome Inc. made a special appearance by counsel to move to dismiss the complaint for lack of personal jurisdiction and on other grounds. The plaintiffs have opposed the motion to dismiss. The motion has been briefed and is currently pending.
In October 2008, the plaintiffs filed a motion challenging Placer Dome Inc.’s legal capacity to participate in the proceedings in light of its alleged “acquisition” by the Company. Placer Dome Inc. opposed this motion. The motion has been briefed and is currently pending. A “clarification hearing” has been scheduled for February 7, 2012
The Company intends to defend the action vigorously. No amounts have been accrued for any potential loss under this complaint.
Perilla Complaint
In August 2009, Barrick Gold Inc. was purportedly served in Ontario with a complaint filed in November 2008 in the Regional Trial Court of Boac, on the Philippine island of Marinduque, on behalf of two named individuals and purportedly on behalf of the approximately 200,000 residents of Marinduque. In December 2009, the complaint was also purportedly served in Ontario in the name of Placer Dome Inc. The complaint alleges injury to the economy and the ecology of Marinduque as a result of the discharge of mine tailings from the Marcopper mine into the Calancan Bay, the Boac River, and the Mogpog River. The plaintiffs are claiming for abatement of a public nuisance allegedly caused by the tailings discharge and for nominal damages for an alleged violation of their constitutional right to a balanced and healthful ecology. Barrick Gold Inc. has moved to dismiss the complaint on a variety of grounds, which motion is now pending a decision of the Court following the failure of plaintiffs’ counsel to appear at the hearing in February 2010 or to timely file any comment or opposition to the motion. Motions to dismiss the complaint on a variety of grounds have also been filed in the name of Placer Dome Inc. In May 2010, the plaintiffs filed a motion for an order to admit an amended complaint in which they are seeking additional remedies including temporary and permanent environmental protection orders. In June 2010, Barrick Gold Inc. and Placer Dome Inc. filed a motion to have the Court resolve their unresolved motions to dismiss before considering the plaintiffs’ motion to admit the amended complaint. An opposition to the plaintiffs’ motion to admit was also filed by Barrick Gold Inc. and Placer Dome Inc. on the same basis. This motion is now fully briefed and awaiting determination by the Court. It is not known when these motions or the outstanding motions to dismiss will be decided by the Court. The Company intends to defend the action vigorously. No amounts have been accrued for any potential loss under this complaint.
| | | | |
| BARRICK THIRD QUARTER 2011 | | 107 | | NOTES TO FINANCIAL STATEMENTS (UNAUDITED) |
Writ of Kalikasan
On February 25, 2011 a Petition for the Issuance of a Writ of Kalikasan with Prayer for Temporary Environmental Protection Order was filed in the Supreme Court of the Republic of the Philippines in Eliza M. Hernandez, Mamerto M. Lanete and Godofredo L. Manoy versus Placer Dome Inc. and Barrick Gold Corporation, SC G.R. No. 195482 (the “Petition”). On March 8, 2011, the Supreme Court issued an En Banc Resolution and Writ of Kalikasan and directed service of summons on Placer Dome Inc. and the Company, ordered Placer Dome Inc. and the Company to make a verified return of the Writ with ten (10) days of service and referred the case to the Court of Appeal for hearing. The Petition alleges that Placer Dome Inc. violated the petitioners’ constitutional right to a balanced and healthful ecology as a result of, amongst other things, the discharge of tailings into Calancan Bay, the 1993 Maguila-Guila dam break, the 1996 Boac river tailings spill and failure of Marcopper to properly decommission the Marcopper mine. The petitioners have pleaded that the Company is liable for the alleged actions and omissions of Placer Dome Inc. which was a minority indirect shareholder of Marcopper at all relevant times and is seeking orders requiring the Company to environmentally remediate the areas in and around the mine site that are alleged to have sustained environmental impacts. The petitioners purported to serve the Company on March 25, 2011.
On March 31, 2011, the Company filed an Urgent Motion For Ruling on Jurisdiction with the Supreme Court challenging the constitutionality of the Rules of Procedure in Environmental Cases (the “Environmental Rules”) pursuant to which the Petition was filed, as well as the jurisdiction of the Court over the Company. As required by the Environmental Rules, by special appearance and without submitting to the jurisdiction of the Court, on April 4, 2011, the Company filed its ReturnAd Cautelamto the Writ seeking the dismissal of the Petition with prejudice. On April 12, 2011, the Supreme Court issued a Resolution requiring the petitioners to submit a Comment on the Company’s Urgent Motion for Ruling on Jurisdiction within ten days of receiving notice of the Resolution. On or around April 27, 2011, the petitioners purported to make discovery requests of the Company and Placer Dome Inc. (collectively, the “Discovery Requests”). On May 4, 2011, the Court of Appeals issued a Resolution: (i) directing the petitioners to submit a Comment on the Company’s Urgent Motion for Ruling on Jurisdiction; and (ii) putting the petitioners’ Discovery Requests in abeyance pending resolution of the Company’s Urgent Motion for Ruling on Jurisdiction. On May 16, 2011, the Company, appearing specially and without submitting to the Supreme Court’s jurisdiction, filed with the Supreme Court a Clarificatory Manifestation seeking
clarification as to whether the Court of Appeals or the Supreme Court has jurisdiction over the matter. On June 2, 2011, the petitioners served an Opposition to the Company’s Urgent Motion for Ruling on Jurisdiction.
On June 6, 2011, a mail package addressed to Placer Dome Inc. from the Philippines Office of the Solicitor General purported to serve summons and other materials on Placer Dome Inc. On or about June 6, 2011, the Company, appearing specially and without submitting to the Supreme Court’s jurisdiction, filed a Manifestation drawing to the Court’s attention the fact that each of the Court of Appeals and the Supreme Court had issued (inconsistent) Resolutions indicating that they would each resolve the Company’s Urgent Motion for Ruling on Jurisdiction. The Company requested that all further proceedings in the case, both before the Supreme Court and the Court of Appeals, be suspended pending issuance of the clarification sought in the Company’s Clarifactory Manifestation. By Manifestation dated June 10, 2011, Placer Dome Inc., by special appearance and without submitting itself to the Supreme Court’s jurisdiction: (i) adopted the Company’s Urgent Motion for Ruling on Jurisdiction and reserved the right to file a supplement thereto; and (ii) joined the Company in seeking clarification as to which court has jurisdiction over this matter. By Manifestation dated June 16, 2011, Placer Dome Inc., by special appearance and without submitting itself to the Supreme Court’s jurisdiction: (i) adopted as its own the Company’s Return Ad Cautelam; and (ii) reserved the right to supplement this Return after the Supreme Court has clarified which court has jurisdiction.
The Supreme Court issued a Resolution dated June 21, 2011 in which it referred the records of the case to the Court of Appeals for appropriate action on the various pending motions. In June 2011, the Petitioners filed their Opposition to the Urgent Motion for Ruling on Jurisdiction. On July 1, 2011 Placer Dome Inc., by special appearance and without submitting themselves to the court’s jurisdiction, filed a Supplement to the pending Urgent Motion for Ruling on Jurisdiction. On July 8, 2011, the Company and Placer Dome Inc., by special appearance and without submitting themselves to the jurisdiction of the Court of Appeals, filed a Manifestation: (i) indicating their understanding that the Supreme Court Resolution dated June 21, 2011 resolves the issues raised in the Clarificatory Manifestation and effectively rules that the Supreme Court has lost or relinquished subject matter jurisdiction over the case effective June 21, 2011 and has transferred jurisdiction to the Court of Appeals; (ii) manifesting their intention to file a Second Supplement to the Urgent Motion for Ruling on Jurisdiction. On July 12, 2011, the Company and Placer
| | | | |
| BARRICK THIRD QUARTER 2011 | | 108 | | NOTES TO FINANCIAL STATEMENTS (UNAUDITED) |
Dome Inc. filed, under special and limited appearance and without submitting themselves to the Court of Appeal’s jurisdiction, a Second Supplement to their Urgent Motion for Ruling on Jurisdiction. On July 14, 2011, the Company and Placer Dome Inc., by special appearance and without submitting themselves to the jurisdiction of the Court, filed a Manifestation submitting that they are entitled to be heard on the Petitioners’ Urgent Motion dated April 12, 2011 (regarding service related issues) and Manifestation with Reiterated Motion dated May 11, 2011 (also regarding service related issues), neither of which had been served on the Company and Placer Dome Inc. On September 8, 2011, in response to learning that the Supreme Court had granted the Petitioners’ Urgent Motion dated April 12, 2011 and Manifestation with Reiterated Motion dated May 11, 2011 in its Resolution dated May 31, 2011, without the Company or Placer Dome Inc. being aware of such motions or having an opportunity to respond to them, the Company and Placer Dome Inc., by special appearance and without submitting themselves to the jurisdiction of the Court, filed a Manifestation submitting that the Supreme Court’s May 31, 2011 Resolution is functus officio and moot and, in any event, is void and legally ineffective. On or about August 8, 2011, the Petitioners filed a Comment (to the Supplement and Second Supplement to the Urgent Motion for Ruling on Jurisdiction). On September 1, 2011, the Company and Placer Dome Inc. Inc., by special appearance and without submitting themselves to the jurisdiction of the Court, filed a Consolidated Reply to the Petitioners’ June, 2011 Opposition and August 8, 2011 Comment. The Urgent Motion for Ruling on Jurisdiction is now fully briefed. No decision has as yet been issued with respect to either the Urgent Motion for Ruling on Jurisdiction or the Manifestations dated July 14, 2011 and September 8, 2011.
Pakistani Constitutional Litigation
In November 2006, a Constitutional Petition was filed in the High Court of Balochistan by three Pakistani citizens against: Barrick, the governments of Balochistan and Pakistan, the Balochistan Development Authority (“BDA”), Tethyan Copper Company (“TCC”), Antofagasta Plc (“Antofagasta”), Muslim Lakhani and BHP (Pakistan) Pvt Limited (“BHP”).
The Petition alleged, among other things, that the entry by the BDA into the 1993 Joint Venture Agreement (“JVA”) with BHP to facilitate the exploration of the Reko Diq area and the grant of related exploration licenses were illegal and that the subsequent transfer of the interests of BHP in the JVA and the licenses to TCC was also illegal and should therefore be set aside. Barrick currently indirectly holds 50% of the shares of TCC, with Antofagasta indirectly holding the other 50%.
In June 2007, the High Court of Balochistan dismissed the Petition against Barrick and the other respondents in its entirety. In August 2007, the petitioners filed a Civil Petition for Leave to Appeal in the Supreme Court of Pakistan. In late 2010, the Supreme Court of Pakistan began hearing this matter, together with several other related petitions filed against TCC or its related parties. The related petitions primarily relate to whether it is in the public interest for TCC to receive a mining lease. On February 3, 2011, the Supreme Court issued an interim order providing, among other things, that the Government of Balochistan (“GOB”) may not take any decision in respect of the grant or otherwise of a mining lease to TCC until matters before the Supreme Court are decided. On May 25, 2011, the Supreme Court rescinded its interim order and ruled, among other things, that the GOB shall proceed to expeditiously decide TCC’s application for the grant of a mining lease transparently and fairly in accordance with laws and applicable rules. The Supreme Court also ruled that the petitions before the Court shall remain pending at this time.
On September 21, 2011, the GOB delivered a notice to TCC advising that it considered TCC’s application for a mining lease, which had been filed on February 15, 2011, to be incomplete and unsatisfactory and giving TCC 30 days in which to respond. On October 19, 2011, TCC delivered a response to the GOB’s notice. In addition, TCC delivered a notice of dispute in order to preserve its rights with respect to international arbitration.
Barrick and TCC continue to defend these actions vigorously. No amounts have been accrued for any potential loss under these complaints.
Pueblo Viejo
In April, 2010, Pueblo Viejo Dominicana Corporation (“PVDC”) received a copy of an action filed in the Dominican Republic by Fundacion Amigo de Maimon Inc., Fundacion Miguel L. de Pena Garcia Inc., and a number of individuals. The action alleges a variety of matters couched as violations of fundamental rights, including taking of private property, violations of mining and environmental and other laws, slavery, human trafficking, and bribery of government officials. The complaint does not describe the relief sought, but the action is styled as an “Amparo” remedy, which typically includes some form of injunctive relief. PVDC intends to vigorously defend the action.
Argentine Glacier Legislation
On September 30, 2010, theNational Law on Minimum Requirements for the Protection of Glaciers was enacted in Argentina, and came into force in early November 2010.
| | | | |
| BARRICK THIRD QUARTER 2011 | | 109 | | NOTES TO FINANCIAL STATEMENTS (UNAUDITED) |
The federal law bans new mining exploration and exploitation activities on glaciers and in the “peri-glacial” environment, and subjects ongoing mining activities to an environmental audit. If such audit identifies significant impacts on glaciers and peri-glacial environment, the relevant authority is empowered to take action, which according to the legislation could include the suspension or relocation of the activity. In the case of the Veladero mine and the Pascua-Lama project, the competent authority is the Province of San Juan. The Province of San Juan had previously adopted glacier protection legislation, with which Veladero and Pascua-Lama comply. In November 2010, in response to legal actions brought against the National State by local unions and San Juan based mining and construction chambers, as well as by Barrick’s subsidiaries, Barrick Exploraciones Argentina S.A. and Minera Argentina Gold S.A., which own the Veladero mine and the Argentine portion of the Pascua-Lama project, respectively, the Federal Court in the Province of San Juan, granted injunctions, based on the unconstitutionality of the federal law, suspending its application in the Province and, in particular to Veladero and Pascua-Lama. In December 2010, the Province of San Juan became a party to the actions, joining the challenge to the constitutionality of the new federal legislation. As a result of the intervention of the Province, the actions were removed to the National Supreme Court of Justice of Argentina to determine the constitutionality of the legislation.
The National Supreme Court of Justice of Argentina issued a decision determining that this case falls within its jurisdiction. The National State has filed a remedy for revocation of the decision of the Federal Court in the Province of San Juan to grant injunctions suspending the application of the federal law in the Province of San Juan. BEASA and MAGSA answered this remedy on June 29th, 2011.
| | | | |
| BARRICK THIRD QUARTER 2011 | | 110 | | NOTES TO FINANCIAL STATEMENTS (UNAUDITED) |
| | |
CORPORATE OFFICE | | TRANSFER AGENTS AND REGISTRARS |
Barrick Gold Corporation | | CIBC Mellon Trust Company* |
Brookfield Place, TD Canada Trust Tower | | P.O. Box 7010, Adelaide Street Postal Station |
Suite 3700 | | Toronto, Canada M5C 2W9 |
161 Bay Street, P.O. Box 212 | | or |
Toronto, Canada M5J 2S1 | | American Stock Transfer & Trust Company, LLC |
Tel: (416) 861-9911 Fax: (416) 861-0727 | | 6201 - 15thAvenue |
Toll-free throughout North America: 1-800-720-7415 | | Brooklyn, NY 11219 |
Email:investor@barrick.com | | |
Website:www.barrick.com | | Tel: 1-800-387-0825 |
| | Toll-free throughout North America |
SHARES LISTED | | Fax: (416) 643-5501 |
ABX – The New York Stock Exchange | | Email:inquiries@canstockta.com |
The Toronto Stock Exchange | | Website:www.canstockta.com |
| |
INVESTOR CONTACT | | *Effective November 2010, shareholder records are |
Deni Nicoski | | maintained by Canadian Stock Transfer (“CST”) as |
Vice President, Investor Relations | | administrative agent for CIBC Mellon Trust Company. |
Tel: (416) 307-7410 Email:dnicoski@barrick.com | | MEDIA CONTACT |
| | Andy Lloyd |
| | Senior Manager, Communications |
| | Tel: (416) 307-7414 |
| | Email:alloyd@barrick.com |
CAUTIONARY STATEMENT ON FORWARD-LOOKING INFORMATION
Certain information contained in this Third Quarter Report 2011, including any information as to our strategy, projects, plans or future financial or operating performance and other statements that express management’s expectations or estimates of future performance, constitute “forward-looking statements”. All statements, other than statements of historical fact, are forward-looking statements. The words “believe”, “expect”, “will”, “anticipate”, “contemplate”, “target”, “plan”, “continue”, “budget”, “may”, “intend”, “estimate” and similar expressions identify forward-looking statements. Forward-looking statements are necessarily based upon a number of estimates and assumptions that, while considered reasonable by management, are inherently subject to significant business, economic and competitive uncertainties and contingencies. The Company cautions the reader that such forward-looking statements involve known and unknown risks, uncertainties and other factors that may cause the actual financial results, performance or achievements of Barrick to be materially different from the Company’s estimated future results, performance or achievements expressed or implied by those forward-looking statements and the forward-looking statements are not guarantees of future performance. These risks, uncertainties and other factors include, but are not limited to: the impact of global liquidity and credit availability on the timing of cash flows and the values of assets and liabilities based on projected future cash flows; changes in the worldwide price of gold, copper or certain other commodities (such as silver, fuel and electricity); fluctuations in currency markets; changes in U.S. dollar interest rates; risks arising from holding derivative instruments; the ability of the Company to complete or successfully integrate an announced acquisition proposal; legislative, political or economic developments in the jurisdictions in which the Company carries on business, including Zambia and Saudi Arabia; operating or technical difficulties in connection with mining or development activities; employee relations; availability and costs associated with mining inputs and labor; the speculative nature of exploration and development, including the risks of obtaining necessary licenses and permits and diminishing quantities or grades of reserves; changes in costs and estimates associated with our projects; adverse changes in our credit rating, level of indebtedness and liquidity, contests over title to properties, particularly title to undeveloped properties; the organization of our previously held African gold operations under a separate listed entity; the risks involved in the exploration, development and mining business. Certain of these factors are discussed in greater detail in the Company’s most recent Form 40-F/Annual Information Form on file with the U.S. Securities and Exchange Commission and Canadian provincial securities regulatory authorities.
The Company disclaims any intention or obligation to update or revise any forward-looking statements whether as a result of new information, future events or otherwise, except as required by applicable law.