
| | |
FOURTH QUARTER AND YEAR-END REPORT 2011 FEBRUARY 16, 2012 Based on IFRS and expressed in US dollars | | For a full explanation of results, the Financial Statements and Management Discussion & Analysis, 2012 outlook, mine statistics and mineral reserves and resources, please see the Company’s website,www.barrick.com. |
Barrick Reports Q4 2011 Financial and Operating Results
Financial and Operating Results
| | • | | Reported net earnings for Q4 were $959 million ($0.96 per share) compared to $961 million ($0.97 per share) in the prior year period. Adjusted net earnings rose 15% to $1.17 billion ($1.17 per share)1 from $1.02 billion ($1.02 per share) in the prior year period, primarily reflecting higher realized gold prices and higher copper sales volumes. Q4 operating cash flow increased 41% to $1.22 billion and adjusted operating cash flow was $1.30 billion1. Gold cash margins increased 25% to $1,159 per ounce1 in Q4 from $928 per ounce in the prior year period and net cash margins rose 18% to $1,282 per ounce1 from $1,090 per ounce in the prior year period. | |
| | • | | Full year adjusted net earnings increased 33% from $3.5 2 billion in the prior year to $4.67 billion ($4.67 per share), demonstrating the Company’s strong gold price leverage, and translating to a higher return on equity of 22%1 from 20% in 2010. Adjusted operating cash flow rose 8% to $5 .68 billion from $5 .24 billion in the prior year. Reported net earnings and operating cash flow in 2011 increased 25% and 16% to $4.48 billion ($4.49 per share) and $5.32 billion, respectively, compared to the prior year, and were Company records. | |
| | • | | Q4 gold production of 1.81 million ounces at total cash costs of $505 per ounce1 or net cash costs of $382 per ounce1 included a strong performance from the North America region. Full year gold production of 7.68 million ounces at total cash costs of $460 per ounce met original guidance while net cash costs of $339 per ounce were below original guidance. Copper production of 451 million pounds in 2011 also met guidance at total cash costs of $1.75 per pound1, which were slightly above guidance. | |
| | • | | 2012 gold production is anticipated to be 7.3-7.8 million ounces at total cash costs of $520-$560 per ounce or net cash costs of $400-$450 per ounce2, positioning Barrick as one of the lowest cost senior gold producers. Copper production for 2012 is expected to be 550-600 million pounds at total cash costs of $1.90-$2.20 per pound. | |
Investing in and Developing High Return Projects
| | • | | The world-class Pueblo Viejo and Pascua-Lama projects are on track to enter production in mid-2012 and mid-2013, respectively. These two mines are expected to contribute about 1.5 million ounces3 of low cost annual production and provide combined annual average EBITDA of about $2.5 billion4to Barrick in their first full five years. | |
Replacing Gold Reserves and Increasing Copper Reserves through Exploration and Selective Acquisitions
| | • | | Barrick replaced proven and probable gold reserves to an industry-leading 139.9 million ounces5 in 2011. Our focused exploration program is yielding excellent results, including the high grade Red Hill/Goldrush greenfield discovery in Nevada. Copper reserves nearly doubled from 6.5 billion pounds to 12.7 billion pounds5, measured and indicated copper resources rose 17% to 15 .3 billion pounds and inferred copper resources increased 117% to 19.9 billion pounds5 with the addition of Lumwana and Jabal Sayid. | |
Returning Capital to Shareholders
| | • | | Consistent with Barrick’s practice of paying a progressive dividend, the Company increased its quarterly dividend by 25% to $0.15 per share during 2011, representing more than a 170%6 increase in capital returned to shareholders in the last five years, or a 22% annual compound growth rate over this period. | |
| 1 | Adjusted net earnings, adjusted operating cash flow, EBITDA, return on equity, total cash costs per ounce, total cash costs per pound, net cash costs, total cash margins and net cash margins per ounce/pound are non- GAAP financial measures. See pages 72-79 of Barrick’s Year-End 2011 Report. |
| 2 | Based on an assumed realized copper price of $3.50 per pound for 2012. |
| 3 | ~1.5 million ounces of production is based on the estimated cumulative average annual production in the first full five years once both mines are at full capacity. |
| 4 | Based on a $1,600 per ounce gold price, a $ 30 per ounce silver price and a $100/bbl oil price and estimated average annual production in the first full five years once both mines are at full capacity. |
| 5 | Calculated in accordance with National Instrument 43-101 as required by Canadian securities regulatory authorities. For United States reporting purposes, Industry Guide 7 (under the Securities Exchange Act of 1934), as interpreted by the Staff of the SEC, applies different standards in order to classify mineralization as a reserve. Accordingly, for U.S. reporting purposes, approximately 2.1 5 million ounces of reserves at Pueblo Viejo (Barrick’s 60% interest) is classified as mineralized material. For a breakdown of reserves and resources by category and additional information relating to reserves and resources, see pages 161-166 of Barrick’s 2011 Year-End Report. |
| 6 | Calculated based on converting the 2006 semi-annual dividend of 11 cents per share to a quarterly dividend. |
| | |
| BARRICK FOURTH QUARTER AND YEAR-END 2011 | | PRESS RELEASE |
FINANCIAL AND OPERATING RESULTS
Q4 production was 1.81 million ounces of gold at total and net cash costs of $505 per ounce and $382 per ounce, respectively. Full year production of 7.68 million ounces at total cash costs of $460 per ounce met original guidance as Barrick’s high quality portfolio and effective cost management programs enabled the Company to deliver on its operating targets for the ninth successive year. Net cash costs of $339 per ounce for the year were below original guidance. The realized gold price for the quarter was $1,664 per ounce7, 22% higher than the same prior year period. Q4 cash margins increased 25% to $1,159 per ounce from $928 per ounce in the comparable prior year period and net cash margins rose 18% to $1,282 per ounce from $1,090 per ounce in the same prior year period.
Q4 adjusted net earnings rose 15% to $1.17 billion ($1.17 per share), compared to $1.02 billion ($1.02 per share) in the same prior year period, primarily reflecting higher realized gold prices and higher copper sales volumes. Reported Q4 net earnings of $0.96 billion ($0.96 per share) include the after-tax impact of $153 million in impairment charges, mainly related to redundant power assets and investment portfolio write-downs, as well as a one-time withholding tax charge of about $75 million on repatriation of funds out of the U.S.
Q4 operating cash flow was up 41% to $1.22 billion from the same prior year period. Adjusted operating cash flow of $1.30 billion in Q4 compares to $1.52 billion in the same prior year period and adjusts for the one-time withholding tax payment.
Full year adjusted net earnings rose 33% from the same prior year period to $4.67 billion ($4.67 per share) and translated to a 22% return on equity, up from 20% in 2010. Adjusted operating cash flow increased 8% to $5.68 billion from 2010. Full year reported net earnings and operating cash flow of $4.48 billion ($4.49 per share) and $5.32 billion, respectively, were Company records.
“2011 was an excellent year for Barrick,” said Aaron Regent, President and CEO. “We met our production and cost targets, enabling us to maximize the benefits of higher gold prices and
7 Realized price per ounce is a non-GAAP financial measure. See pages 72-79 of Barrick’s 2011 Year-End Report.
realize record earnings and cash flow. We advanced our world-class projects, Pueblo Viejo and Pascua-Lama, which are scheduled to begin contributing low cost ounces in 2012 and 2013. We replaced our reserves, and our growing high grade gold discovery in Nevada, Red Hill/Goldrush, clearly demonstrates the value that a focused and disciplined exploration program can create. We added two quality copper mines to our portfolio and significantly expanded the copper reserves and resources at Lumwana. Finally, we continue to strengthen and be recognized for our CSR practices which are a critical component of our success.”
PRODUCTION AND COSTS
The North America business unit performed above plan, producing 0.76 million ounces at total cash costs of $498 per ounce in Q4 on strong performances from Cortez and Goldstrike. The Cortez property contributed 0.28 million ounces at total cash costs of $331 per ounce for the quarter on higher tonnage from the open pit. With full year production of 1.42 million ounces at total cash costs of $245 per ounce, Cortez is one of the world’s largest and lowest cost gold mines, and the property also has excellent upside exploration potential. Production in 2012 is anticipated to be 1.20-1.25 million ounces at total cash costs of $300-$350 per ounce, reflecting a higher proportion of underground ounces and lower open pit grades as part of planned mine sequencing.
The Goldstrike operation also performed well, producing 0.25 million ounces at total cash costs of $570 per ounce in Q4, primarily due to more underground tons and higher open pit grades than anticipated. Production in 2012 is expected to be 1.25 -1.30 million ounces as the open pit moves back into a higher ore phase. Full year 2012 production for the North America business unit is forecast to be 3.425 -3.600 million ounces at total cash costs of $475-$525 per ounce.
The South America business unit performed on plan, with production of 0.45 million ounces at total cash costs of $357 per ounce in Q4. The Veladero mine contributed 0.23 million ounces at total cash costs of $355 per ounce in Q4 and 0.96 million
| | | | | | | | |
| BARRICK FOURTH QUARTER AND YEAR-END 2011 | | 2 | | | | PRESS RELEASE |
ounces at total cash costs of $353 per ounce for 2011. Lagunas Norte produced 0.18 million ounces in Q4 at total cash costs of $268 per ounce. Production from South America in 2012 is expected to be 1.550-1.700 million ounces at total cash costs of $430-$480 per ounce, primarily due to lower grades at Veladero and lower grades and recoveries at Lagunas Norte as anticipated in their mine plans.
The Australia Pacific business unit produced 0.49 million ounces at total cash costs of $677 per ounce in Q4. The Porgera mine, the region’s largest operation, produced 0.12 million ounces at total cash costs of $679 per ounce. Australia Pacific is expected to produce 1.800-1.950 million ounces in 2012 at total cash costs of $700-$750 per ounce, primarily reflecting higher power costs for Porgera.
Attributable production from African Barrick Gold plc (ABG) in Q4 was 0.12 million ounces at total cash costs of $779 per ounce. Barrick’s share of 2012 production is expected to be 0.500-0.535 million ounces at total cash costs of $790-$860 per ounce.
Q4 copper production of 143 million pounds at total cash costs of $1.99 per pound included 60 million pounds from the Lumwana mine at total cash costs of $2.47 per pound. Lumwana is expected to produce 230-260 million pounds of copper in 2012 at total cash costs of $2.40-$2.75 per pound. Cash costs in 2012 reflect mining of lower grade areas of the current Malundwe pit and as mining transitions to the initial lower grade benches of the Chimiwungo deposit, which starts to produce during the second half, as well as higher costs related to labor and royalties. The Chimiwungo deposit has three lodes, one of which is significantly thicker than Malundwe as shown by recent exploration drill results over the eastern shoot, consequently we expect more flexibility in managing the mined grade going forward. The Zaldívar mine in Chile produced 83 million pounds at total cash costs of $1.65 per pound in Q4 and is expected to produce approximately 285-300 million pounds of copper at total cash costs of $1.45-$1.75 per pound in 2012. The Company has put floor protection in place on approximately half
of total anticipated 2012 copper production at an average floor price of about $3.75 per pound8 and can fully participate in copper price upside.
Approximately 60% of Barrick’s consolidated production costs are denominated in US dollars. The Company’s largest single currency exposure is the Australian dollar/US dollar exchange rate. Barrick is fully hedged on its Australian operating expenditures in 2012 and is about 70% hedged on expected 2013 Australian operating expenditures at effective average rates of $0.81 and $0.74, respectively, and also has additional coverage for 2014-2016 at levels substantially below current rates.
The Company has also mitigated the impact of higher oil prices through the use of financial contracts and production from Barrick Energy such that a $10 change in WTI crude oil prices would impact 2012 total cash costs by less than $1 per ounce. The Barrick Energy contribution, along with the financial contracts, provides hedge protection for approximately 80% of expected 2012 fuel consumption. Production from Barrick Energy is expected to continue to provide long term natural offsets to changes in energy prices.
INCREASING GOLD AND COPPER RESERVES AND RESOURCES THROUGH EXPLORATION9 AND SELECTIVE ACQUISITIONS
Barrick replaced proven and probable gold reserves to an industry-leading 139.9 million ounces at the end of 2011, based on a $1,200 per ounce gold price, and also has measured and indicated gold resources of 80.4 million ounces and inferred gold resources of 40.2 million ounces5, based on a $1,400 per ounce gold price. With the addition of Lumwana and Jabal Sayid, copper reserves nearly doubled from 6.5 billion pounds to 12.7 billion pounds5, measured and indicated copper resources rose 17% to 15.3 billion pounds and inferred copper resources increased 117% to 19.9 billion pounds5 based on a $2.75 per pound copper price and a $3.25 per pound copper price, respectively. At Lumwana, reserves grew 9%
8The realized price on 2012 production is expected to be reduced by $0.13/lb as a result of the net premium paid on this position.
9Barrick’s exploration programs are designed and conducted under the supervision of Robert Krcmarov, Senior Vice President, Global Exploration of Barrick. For information on the geology, exploration activities generally, and drilling and analysis procedures on Barrick’s material properties, see Barrick’s most recent Annual Information Form/Form 40-F on file with Canadian provincial securities regulatory authorities and the U.S. Securities and Exchange Commission.
| | | | | | | | |
| BARRICK FOURTH QUARTER AND YEAR-END 2011 | | 3 | | | | PRESS RELEASE |
to 4.9 billion pounds and inferred resources nearly doubled from 5.5 billion pounds to 10.7 billion pounds5. In addition, 2.1 billion pounds were added in the measured and indicated category5, and the Chimiwungo deposit remains open to the east and south.
As a result of exploration success in 2011, the 2012 exploration budget is $450-$490 million, of which approximately 40% will be capitalized. The budget is weighted towards near-term resource additions and conversion at existing mines while still providing support for earlier stage exploration in operating districts and other emerging areas. North America is expected to be allocated about 45% of the total budget, the majority of which is targeted for Nevada. About 20% is expected to be spent in the Australia Pacific business unit and about 20% is targeted for copper in Zambia. Approximately 10% will be allocated to the South America business unit, with the remainder being African Barrick Gold.
In Nevada, recent drilling continues to grow the potential at Red Hill/Goldrush. At Red Hill, a resource of 1.27 million ounces was calculated in the indicated category and 3.30 million ounces in the inferred category5, and the resource remains open in multiple directions. Step-out holes have intersected mineralization a further 2,800 feet north beyond the initial 2010 resource as well as extended mineralization at least 1,000 feet to the southwest. Highlights of major step-out drilling include 90 feet at 0.15 ounces per ton (opt), 120 feet at 0.32 opt, 20 feet at 1.18 opt, and 110 feet at 0.12 opt. Infill drilling between the deposits has shown that Red Hill and Goldrush merge into a single deposit. A small portion of the Goldrush deposit had sufficient drill density to report an initial inferred resource of 2.45 million ounces5. The step-out drilling continues to suggest a high likelihood of major resource expansion. A total of 468,000 feet of drilling ($64 million) is planned at Red Hill/Goldrush in 2012 to test the full extent of the mineralized system and further expand and upgrade the resource base and a scoping study has commenced.
At Lumwana, activity has been ramped up with 17 drill rigs on the property focusing on resource
definition drilling at Chimiwungo to convert inferred resources into the indicated category and step-out drilling to the south and east to extend the mineralization. Drilling to date has confirmed the thickened eastern shoot of Chimiwungo and selected highlights include 44 meters grading 1.00% copper, 44 meters at 1.07%, 41 meters at 0.80%, 37 meters at 0.91% and 20 meters at 1.60%. In addition to these strong results within the resource area, drilling further to the east is intersecting shallower than expected mineralization. A prefeasibility study on an expansion that could potentially double processing rates at Lumwana is expected to be completed by year end 2012.
INVESTING IN AND DEVELOPING HIGH RETURN PROJECTS IN CONSTRUCTION
Barrick has targeted growth in production to approximately nine million ounces of gold by 201610, driven largely by Pueblo Viejo and Pascua-Lama. Total cash costs per ounce are expected to benefit from these two large, low cost projects as they come on stream in 2012 and 2013, respectively. These two high quality mines are expected to contribute about 1.5 million ounces11 of average annual production and have a significant positive impact on Barrick’s overall total cash costs.
At the Pueblo Viejo project in the Dominican Republic, first production continues to be expected in mid-2012 and overall construction is currently about 90% complete. At the end of Q4, approximately 85% of the expected total mine construction capital of $3.6-$3.8 billion12 (100% basis) or $2.2-$2.3 billion (Barrick’s 60% share) had been committed. About 13 million tonnes of ore, representing approximately 1.4 million contained gold ounces, has been stockpiled to date. Construction of the tailings facility progressed during Q4 with the receipt of approvals to recommence construction. The oxygen plant is expected to undergo pre-commissioning testing in Q1 2012, with the first two autoclaves undergoing
10 The target of 9 Moz of annual production by 2016 reflects a current assessment of the expected production and timeline to complete and commission Barrick’s projects currently in construction (Pueblo Viejo and Pascua-Lama) and the Company’s current assessment of existing mine site opportunities, some of which are sensitive to metal price and various capital and input cost assumptions.
11Based on the estimated cumulative average annual production in the first full five years once both are at full capacity.
12 Based on gold and oil price assumptions of $1,300/oz and $100/bbl, respectively
| | | | | | | | |
| BARRICK FOURTH QUARTER AND YEAR-END 2011 | | 4 | | | | PRESS RELEASE |
pre-commissioning in Q2 2012. Construction of the transmission line connecting the site to the national power grid was completed during Q4 2011, and the inter-connect to the grid has been achieved. As part of a longer-term, optimized power solution for Pueblo Viejo, the Company has started early works to construct a dual fuel power plant at an estimated incremental cost of approximately $300 million (100% basis). The power plant would commence operations utilizing heavy fuel oil, but have the ability to subsequently transition to lower cost liquid natural gas. The new plant is expected to provide lower cost, long term power to the project.
Pueblo Viejo is expected to contribute approximately 100,000-125,000 ounces to Barrick at total cash costs of $400-$500 per ounce13 in 2012 as it ramps up to full production in 2013. Barrick’s 60% share of annual gold production in the first full five years of operation is expected to average 625,000-675,000 ounces at total cash costs of $300-$350 per ounce12.
At the Pascua-Lama project, approximately 55% of the previously announced pre-production capital of $4.7-$5.0 billion14 has been committed and first production is expected in mid-2013. The project is being impacted by labor and commodity cost pressures as a result of inflation, competition for skilled labor, the impact of increased Argentinean customs restrictions on equipment procurement and lower than expected labor productivity.
In Chile, earthworks were about 95% complete at the end of Q4, and in Argentina, earthworks construction was approximately 65% complete at year end. Approximately 40% of the concrete has been poured at the processing facilities in Argentina and about 15% of the structural steel has been erected to date. Occupancy of the construction camps in Chile and Argentina continues to ramp up with 6,500 beds available by the end of 2011. The camps are expected to reach their full capacity of 10,000 beds in mid-2012. Average annual gold production from Pascua-Lama is expected to be 800,000-850,000 ounces in the first full five years
13 Based on 2012 gold and oil price assumptions of $1,700/oz and $100/bbl, respectively. The 2012 total cash cost estimate is dependent on the rate at which production ramps up after commercial levels of productionare achieved. A change in the efficiency of the ramp up could have a significant impact on this estimate.
14 Based on gold, silver and oil price assumptions of $1,300/oz, $25/oz, and $100/bbl, respectively and assuming a Chilean peso f/x rate of 475:1.
of operation at negative total cash costs of $225-$275 per ounce14based on a silver price of $25 per ounce. For every $1 per ounce increase in the silver price, total cash costs are expected to decrease by about $35 per ounce over this period.
Overall construction of the Jabal Sayid copper project in Saudi Arabia was about 75% complete at the end of Q4. Subject to receipt of final approvals, the operation is expected to enter production in the second half of 2012 at total construction capital of approximately $400 million, of which 85% had been committed at the end of Q4. Underground mine development for first ore production and concrete works was completed in Q4 and bulk earthworks were about 90% complete. Jabal Sayid is expected to produce 35-45 million pounds of copper in 2012 at total cash costs of $2.15-$2.50 per pound15. Average annual production from Lodes cash costs of $1.50-$1.70 per pound. Results from recent drilling beneath Lode 4 demonstrate that the width of mineralization towards the base of the current resource model had been underestimated by lack of drilling. In addition to the previous intercept of 111 meters grading 2.67% copper, recent drilling has intersected 119 meters at 1.2% copper. This area will be the focus of ongoing drilling and resource/reserve upgrades and additions in 2012.
PROJECTS IN FEASIBILITY
At the Cerro Casale project in Chile, basic engineering was completed on schedule in Q4. The EIA permitting process is anticipated to be completed by the end of 2012, after which Barrick will consider a construction decision, commencement of detailed engineering and sectoral permitting. Ongoing consultation with the government, local communities and indigenous groups is continuing in parallel with permitting.
Barrick’s 75% share of average annual production is anticipated to be 750,000-825,000 ounces of gold and 190-210 million pounds of copper in the first full five years of operation at
15 Based on 2012 copper and gold price assumptions of $3.50/lb and $1,700/oz, respectively. The 2012 total cash cost estimate is dependent on the rate at which production ramps up after commercial levels of production are achieved. A change in the efficiency of the ramp up could have a significant impact on this estimate.
| | | | | | | | |
| BARRICK FOURTH QUARTER AND YEAR-END 2011 | | 5 | | | | PRESS RELEASE |
total cash costs of $200-$250 per ounce16. Estimated total mine construction capital is approximately $6.0 billion (100% basis)16, 17.
At the 50%-owned Donlin Gold project in Alaska, the revised feasibility study, which includes updated costs and the utilization of natural gas, has been completed and acceptance of the study by the Board of Donlin Gold LLC is expected in the first half of 2012. Mine construction capital is expected to be approximately $6.7 billion (100% basis)18, which includes a natural gas pipeline that is anticipated to lower long term power costs and offer a better environmental and operational solution for power connection to the site. Permitting is expected to commence following approval by the Board of the revised feasibility study. Donlin Gold is anticipated to produce about 1.5 million ounces of gold annually (100% basis) in its first full five years of operation.
At the 75%-owned Turquoise Ridge mine in Nevada, work is advancing on the potential to develop a large scale open pit in order to mine the lower grade halo around the high grade underground ore, which could significantly increase annual production. Work in 2012 will focus on resource conversion, mine planning, environmental data collection, geotechnical and hydrologic evaluation, metallurgical and trade-off studies for processing as part of the prefeasibility study which is expected to be completed by the end of 2012. Twelve drill rigs are currently active on the property and the focus of open pit drilling is on upgrading resources. Additionally, surface drilling has intersected new mineralization, particularly in the shallower south area of the planned pit, which could positively impact economics. Underground drilling is also yielding strong results, intersecting higher grades than expected in some areas, and zones are open up-dip and to the northwest.
Scoping work has been completed on the Lagunas Norte deep sulfide potential and the project is undergoing metallurgical and geotechnical work as part of a prefeasibility study which is anticipated to be completed by year end 2012. A scoping study has
16 Based on gold, copper and oil price assumptions of $1,300/oz, $3.25/lb and $100/bbl, respectively and assuming a Chilean peso f/x rate of 475:1.
17 Based on Q2 2011 prices and does not include escalation for inflation.
18 Based on Q2 2011 prices and does not include escalation for inflation.
also been completed on the Zaldívar deep sulfides and a prefeasibility study is expected by year end 2012.
FINANCIAL STRENGTH
At December 31, 2011, Barrick remained in a strong financial position with the gold industry’s only ‘A’ credit rating, a quarter-end cash balance of $2.7 billion, and 2011 adjusted operating cash flow of $5.7 billion. The Company’s existing $2.0 billion revolving credit facility was replaced with a new five-year, $4.0 billion revolving credit facility in January, 2012, of which $ 3.0 billion remains available. Barrick’s financial strength positions the Company well to continue investing in its project pipeline, maintain a progressive dividend and pursue other value-enhancing opportunities. Consistent with Barrick’s practice of paying a progressive dividend, the Company increased its quarterly dividend by 25% to $0.15 per share during 2011, representing a 170% increase in capital returned to shareholders in the last five years, or a 22% annual compound growth rate over this period.
CORPORATE SOCIAL RESPONSIBILITY
Barrick continues to be recognized for its strong Corporate Social Responsibility culture and was awarded the Best Practice of CSR Award for 2011 by IR Magazine. In 2011, the Company was listed for the fourth consecutive year on the Dow Jones Sustainability World Index and is also the only Canadian mining company to be ranked as one of the world’s top 100 sustainable companies by NASDAQ.
BOARD APPOINTMENT
Barrick’s Board of Directors has appointed a new board member, John Thornton. Mr. Thornton is a Professor and Director of the Global Leadership Program and Chairman of the Advisory Board at the Tsinghua University School of Economics and Management in Beijing. He is also Chairman of the Board of Trustees of the Brookings Institution, a director of HSBC Holdings plc and a director and non-executive Chairman of HSBC North America Holdings Inc., as well as past President and board member of the Goldman Sachs Group.
| | | | | | | | |
| BARRICK FOURTH QUARTER AND YEAR-END 2011 | | 6 | | | | PRESS RELEASE |
OUTLOOK AND GUIDANCE
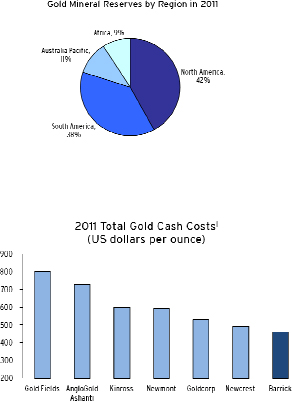
The Company expects 2012 gold production to be in the range of 7.3-7.8 million ounces on lower expected grades and production at Cortez and Veladero. Total cash costs of $ 520-$560 per ounce or net cash costs of $400-$450 per ounce for 2012 principally reflect a change in the production mix, smaller amounts of capitalized waste stripping and higher labor and other inflationary costs. Barrick continues to be well positioned in the lower third of the global gold cost curve based on the high quality of its reserves, its active input cost management, focus on best practices and supply chain initiatives.
Copper production is expected to increase to 550–600 million pounds in 2012. Total cash costs of $1.90-$2.20 per pound anticipated for 2012 reflect a full year of production from Lumwana, higher sulfuric acid costs in Chile, higher royalties in Zambia and the second half start up of Jabal Sayid.
Capital project expenditures for 2012 are expected to be in the range of $2.60-$2.75 billion19 primarily related to construction activities at Pueblo Viejo and Pascua-Lama. Open pit and underground mine development, which includes capitalized waste stripping, is anticipated to be $850-$925 million and mine site expansion capital is expected to be $850-$925 million, including expenditures on development projects at Lagunas Norte, Cortez, Turquoise Ridge, Pueblo Viejo, Goldstrike and Lumwana. Mine site sustaining capital expenditures are expected to be $1.20-$1.30 billion, reflecting a full year of expenditures at Lumwana and the inclusion of sustaining capital for Pueblo Viejo.
* * * *
Barrick’s vision is to be the world’s best gold company by finding, acquiring, developing and producing quality reserves in a safe, profitable and socially responsible manner. Barrick’s shares are traded on the Toronto and New York stock exchanges.
Outlook Assumptions and Economic Sensitivity Analysis
| | | | | | | | | | | | | | | | |
| | | 2012 Guidance Assumption | | | Hypothetical Change | | | Impact on Total Cash Costs | | | Impact on EBITDA (millions) | |
Gold revenue | | | $1,700/oz | 1 | | | $50/oz | | | | n/a | | | | $375 - $400 | |
Copper revenue2 | | | $3.50/lb | 1 | | | $0.25/lb | | | | n/a | | | | $72 | |
Gold total cash costs | | | | | | | | | | | | | | | | |
Gold price effe ct on royalties | | | $1,700/oz | | | | $50/oz | | | | $1.25/oz | | | | $10 | |
WTI crude oil price3 | | | $100/bbl | | | | $10/bbl | | | | $0.25/oz | | | | $2 | |
Australian dollar exchange rate3 | | | 1:1 | | | | 10% | | | | $0/oz | | | | $0 | |
Copper total cash costs | | | | | | | | | | | | | | | | |
WTI crude oil price3 | | | $100/bbl | | | | $10/bbl | | | | $0.02/lb | | | | $11 | |
Chilean peso exchange rate3 | | | 500:1 | | | | 10% | | | | $0/lb | | | | $0 | |
| 1 | Barrick has assumed a gold price of $1,700 per ounce and copper price of $3.50/lb, which are consistent with current market prices. This assumption does not represent a forecast of what we expect gold or copper prices to average in 2012. |
| 2 | Barrick has put in place floor protection on approximately half of its expected copper production for 2012 at an average floor price of $3.75 per pound and can fully participate in copper price upside. At prices above $3.75 per pound, the impact on EBITDA of a $0.25/lb change in the copper price is approximately $140 million. |
| 3 | Due to hedging activities we are largely protected against changes in these factors. |
| 19 | Represents Barrick’s share of expenditures and includes capitalized interest of about $350-375 million. |
| | | | | | | | |
| BARRICK FOURTH QUARTER AND YEAR-END 2011 | | 7 | | | | PRESS RELEASE |
Key Statistics
| | | | | | | | | | | | | | | | |
| Barrick Gold Corporation | | Three months ended | | | Twelve months ended | |
| (in United States dollars) | | December 31, | | | December 31, | |
| (Unaudited) | | 2011 | | | 2010 | | | 2011 | | | 2010 | |
| | | | |
Operating Results | | | | | | | | | | | | | | | | |
Gold production (thousands of ounces)1 | | | 1,814 | | | | 1,700 | | | | 7,676 | | | | 7,765 | |
Gold sold (thousands of ounces) | | | 1,865 | | | | 1,831 | | | | 7,550 | | | | 7,742 | |
Per ounce data | | | | | | | | | | | | | | | | |
Average spot gold price | | $ | 1,688 | | | $ | 1,367 | | | $ | 1,572 | | | $ | 1,225 | |
Average realized gold price2 | | | 1,664 | | | | 1,368 | | | | 1,578 | | | | 1,228 | |
Net cash costs2 | | | 382 | | | | 278 | | | | 339 | | | | 293 | |
Total cash costs2 | | | 505 | | | | 440 | | | | 460 | | | | 409 | |
Depreciation3 | | | 168 | | | | 127 | | | | 154 | | | | 136 | |
Other4 | | | 17 | | | | 11 | | | | 16 | | | | 7 | |
Total production costs | | | 690 | | | | 578 | | | | 630 | | | | 552 | |
Copper credits | | | 123 | | | | 162 | | | | 121 | | | | 116 | |
Copper production (millions of pounds) | | | 143 | | | | 82 | | | | 451 | | | | 368 | |
Copper sold (millions of pounds) | | | 135 | | | | 103 | | | | 444 | | | | 391 | |
Per pound data | | | | | | | | | | | | | | | | |
Average spot copper price | | $ | 3.40 | | | $ | 3.92 | | | $ | 4.00 | | | $ | 3.42 | |
Average realized copper price2 | | | 3.69 | | | | 3.99 | | | | 3.82 | | | | 3.41 | |
Total cash costs2 | | | 1.99 | | | | 1.08 | | | | 1.75 | | | | 1.10 | |
Depreciation3 | | | 0.48 | | | | 0.23 | | | | 0.38 | | | | 0.23 | |
Total production costs | | | 2.47 | | | | 1.31 | | | | 2.13 | | | | 1.33 | |
Financial Results (millions) | | | | | | | | | | | | | | | | |
Revenues | | $ | 3,789 | | | $ | 3,011 | | | $ | 14,312 | | | $ | 11,001 | |
Net earnings5 | | | 959 | | | | 961 | | | | 4,484 | | | | 3,582 | |
Adjusted net earnings2 | | | 1,166 | | | | 1,018 | | | | 4,666 | | | | 3,517 | |
EBITDA2 | | | 1,998 | | | | 1,770 | | | | 8,376 | | | | 6,521 | |
Operating cash flow | | | 1,224 | | | | 866 | | | | 5,315 | | | | 4,585 | |
Adjusted operating cash flow2 | | | 1,299 | | | | 1,522 | | | | 5,680 | | | | 5,241 | |
Per Share Data (dollars) | | | | | | | | | | | | | | | | |
Net earnings (basic) | | | 0.96 | | | | 0.97 | | | | 4.49 | | | | 3.63 | |
Adjusted net earnings (basic)2 | | | 1.17 | | | | 1.02 | | | | 4.67 | | | | 3.56 | |
Net earnings (diluted) | | | 0.96 | | | | 0.96 | | | | 4.48 | | | | 3.59 | |
Weighted average basic common shares (millions) | | | 1,000 | | | | 995 | | | | 999 | | | | 987 | |
Weighted average diluted common shares (millions)6 | | | 1,002 | | | | 1,000 | | | | 1,001 | | | | 997 | |
Return on equity2 | | | 20% | | | | 22% | | | | 22% | | | | 20% | |
| | | | | | | | | As at | | | As at | |
| | | | | | | | | December 31, | | | December 31, | |
| | | | | | | | | 2011 | | | 2010 | |
Financial Position (millions) | | | | | | | | | | | | | | | | |
Cash and equivalents | | | | | | | | | | $ | 2,745 | | | $ | 3,968 | |
Non-cash working capital | | | | | | | | | | | 2,335 | | | | 1,695 | |
Adjusted debt2 | | | | | | | | | | | 13,058 | | | | 6,392 | |
Net debt2 | | | | | | | | | | | 10,320 | | | | 2,427 | |
Average shareholders’ equity | | | | | | | | | | | 21,418 | | | | 17,352 | |
1 Production includes our equity share of gold production at Highland Gold. 2 Realized price, net cash costs, total cash costs, adjusted net earnings, EBITDA, adjusted operating cash flow, adjusted debt, net debt and return on equity are non-GAAP financial performance measures with no standard definition under IFRS. See pages 72 - 79 of the Company’s MD&A. 3 Represents equity amortization expense divided by equity ounces of gold sold or pounds of copper sold. 4 Represents the Barrick Energy gross margin divided by equity ounces of gold sold. 5 Net earnings represents net income attributable to the equity holders of the Company. 6 Fully diluted includes dilutive effect of stock options and convertible debt. | |
| | | | |
| BARRICK YEAR-END 2011 | | 8 | | SUMMARY INFORMATION |
Production and Cost Summary
| | | | | | | | | | | | | | | | | | | | | | | | | | | | | | | | |
| | | Gold Production (attributable ounces) (000’s) | | | Total Cash Costs ($/oz) | |
| | | | | | | | |
| | | Three months ended December 31, | | | Year ended
December 31, | | | Three months ended
December 31, | | | Year ended
December 31, | |
| | | | | | | | | | | | | | | | |
| (Unaudited) | | 2011 | | | 2010 | | | 2011 | | | 2010 | | | 2011 | | | 2010 | | | 2011 | | | 2010 | |
| | | | | | | | | | | | | |
North America | | | 761 | | | | 697 | | | | 3,382 | | | | 3,110 | | | $ | 498 | | | $ | 437 | | | $ | 426 | | | $ | 429 | |
South America | | | 446 | | | | 377 | | | | 1,872 | | | | 2,120 | | | | 357 | | | | 251 | | | | 358 | | | | 208 | |
Australia Pacific | | | 485 | | | | 485 | | | | 1,879 | | | | 1,939 | | | | 677 | | | | 602 | | | | 621 | | | | 576 | |
African Barrick Gold3 | | | 118 | | | | 133 | | | | 509 | | | | 564 | | | | 779 | | | | 622 | | | | 692 | | | | 570 | |
Other | | | 4 | | | | 8 | | | | 34 | | | | 32 | | | | 475 | | | | 494 | | | | 475 | | | | 494 | |
| |
Total | | | 1,814 | | | | 1,700 | | | | 7,676 | | | | 7,765 | | | $ | 505 | | | $ | 440 | | | $ | 460 | | | $ | 409 | |
| |
| | | | | | | | | | | | | | | | | | | | | | | | | | | | | | | | |
| | | Copper Production (attributable pounds) (Millions) | | | Total Cash Costs ($/lb) | |
| | | | | | | | |
| | | Three months ended
December 31, | | | Year ended
December 31, | | | Three months ended
December 31, | | | Year ended
December 31, | |
(Unaudited) | | | 2011 | | | | 2010 | | | | 2011 | | | | 2010 | | | | 2011 | | | | 2010 | | | | 2011 | | | | 2010 | |
| | | | | | | | | | | | | |
Total | | | 143 | | | | 82 | | | | 451 | | | | 368 | | | $ | 1.99 | | | $ | 1.08 | | | $ | 1.75 | | | $ | 1.10 | |
| |
| | | | | | | | | | | | | | | | |
| | | Total Gold Production Costs ($/oz) | |
| | | | |
| | | Three months ended December 31, | | | Year ended December 31, | |
| | | | | | | | |
(Unaudited) | | | 2011 | | | | 2010 | | | | 2011 | | | | 2010 | |
| | | | | |
Direct mining costs at market foreign exchange rates | | $ | 549 | | | $ | 464 | | | $ | 506 | | | $ | 412 | |
Gains realized on currency hedge and commodity hedge/economic hedge contracts | | | (53 | ) | | | (34 | ) | | | (53 | ) | | | (16 | ) |
Other2 | | | (17 | ) | | | (11 | ) | | | (16 | ) | | | (7 | ) |
By-product credits | | | (18 | ) | | | (20 | ) | | | (18 | ) | | | (15 | ) |
Copper credits | | | (123 | ) | | | (162 | ) | | | (121 | ) | | | (116 | ) |
| |
Cash operating costs, net basis | | | 338 | | | | 237 | | | | 298 | | | | 258 | |
Royalties | | | 44 | | | | 41 | | | | 41 | | | | 35 | |
| |
Net cash costs1 | | | 382 | | | | 278 | | | | 339 | | | | 293 | |
Copper credits | | | 123 | | | | 162 | | | | 121 | | | | 116 | |
| |
Total cash costs1 | | �� | 505 | | | | 440 | | | | 460 | | | | 409 | |
Depreciation | | | 168 | | | | 127 | | | | 154 | | | | 136 | |
Other2 | | | 17 | | | | 11 | | | | 16 | | | | 7 | |
| |
Total production costs | | $ | 690 | | | $ | 578 | | | $ | 630 | | | $ | 552 | |
| |
| | | | | | | | | | | | | | | | |
| | | Total Copper Production Costs ($/lb) | |
| | | | |
| |
| Three months ended
December 31, |
| |
| Year ended
December 31, |
|
| | | | | | | | |
(Unaudited) | | | 2011 | | | | 2010 | | | | 2011 | | | | 2010 | |
| | | | | |
Cash operating costs | | $ | 1.97 | | | $ | 1.06 | | | $ | 1.71 | | | $ | 1.08 | |
Royalties | | | 0.02 | | | | 0.02 | | | | 0.04 | | | | 0.02 | |
| |
Total cash costs1 | | | 1.99 | | | | 1.08 | | | | 1.75 | | | | 1.10 | |
Depreciation | | | 0.48 | | | | 0.23 | | | | 0.38 | | | | 0.23 | |
| |
Total production costs | | $ | 2.47 | | | $ | 1.31 | | | $ | 2.13 | | | $ | 1.33 | |
| |
| 1 | Total cash costs and net cash costs are non-GAAP financial performance measures with no standard meaning under IFRS. See page 74 of the Company’s MD&A. |
| 2 | Represents the Barrick Energy gross margin divided by equity ounces of gold sold. |
| 3 | Figures relating to African Barrick Gold are presented on a 100% basis up to March 31, 2010 and a 73.9% basis thereafter, which reflects our equity share of production. |
| | | | |
| BARRICK YEAR-END 2011 | | 9 | | SUMMARY INFORMATION |
MANAGEMENT’S DISCUSSION AND ANALYSIS (“MD&A”)
Management’s Discussion and Analysis (“MD&A”) is intended to help the reader understand Barrick Gold Corporation (“Barrick”, “we”, “our” or the “Company”), our operations, financial performance and present and future business environment. This MD&A, which has been prepared as of February 15, 2012, should be read in conjunction with our audited consolidated financial statements for the year ended December 31, 2011. Unless otherwise indicated, all amounts are presented in US dollars.
For the purposes of preparing our MD&A, we consider the materiality of information. Information is considered material if: (i) such information results in, or would reasonably be expected to result in, a significant change in the market price or value of our shares; or (ii)
there is a substantial likelihood that a reasonable investor would consider it important in making an investment decision; or (iii) it would significantly alter the total mix of information available to investors. We evaluate materiality with reference to all relevant circumstances, including potential market sensitivity.
Continuous disclosure materials, including our most recent Form 40-F/Annual Information Form, annual MD&A, audited consolidated financial statements, and Notice of Annual Meeting of Shareholders and Proxy Circular will be available on our website at www.barrick.com, on SEDAR at www.sedar.com and on EDGAR at www.sec.gov. For an explanation of terminology unique to the mining industry, readers should refer to the glossary on page 80.
CAUTIONARY STATEMENT ON FORWARD-LOOKING INFORMATION
Certain information contained or incorporated by reference in this MD&A, including any information as to our strategy, project plans or future financial or operating performance, constitutes “forward-looking statements”. All statements, other than statements of historical fact, are forward-looking statements. The words “believe”, “expect”, “anticipate”, “contemplate”, “target”, “plan”, “intend”, “continue”, “budget”, “estimate”, “may”, “will”, “schedule” and similar expressions identify forward-looking statements. Forward-looking statements are necessarily based upon a number of estimates and assumptions that, while considered reasonable by the Company, are inherently subject to significant business, economic and competitive uncertainties and contingencies. Known and unknown factors could cause actual results to differ materially from those projected in the forward-looking statements. Such factors include, but are not limited to: fluctuations in the market and forward price of gold and copper or certain other commodities (such as silver, diesel fuel and electricity); the impact of global liquidity and credit availability on the timing of cash flows and the values of assets and liabilities based on projected future cash flows; fluctuations in the currency markets (such as Canadian and Australian dollars, Chilean and Argentinean peso, British pound, Peruvian sol, Zambian kwacha and Papua New Guinean kina versus US dollar); changes in US dollar interest rates that could impact the mark-to-market value of outstanding derivative instruments and ongoing payments/receipts under interest rate swaps and variable rate debt obligations; risks arising from holding derivative instruments (such as credit risk, market liquidity risk and mark-to-market risk); changes in national and local government legislation, taxation, controls, regulations and political
or economic developments in Canada, the United States, Dominican Republic, Australia, Papua New Guinea, Chile, Peru, Argentina, Tanzania, Zambia, Saudi Arabia, United Kingdom, Pakistan or Barbados or other countries in which we do or may carry on business in the future; business opportunities that may be presented to, or pursued by, the Company; our ability to successfully integrate acquisitions; operating or technical difficulties in connection with mining or development activities; employee relations; availability and increased costs associated with mining inputs and the construction of capital projects; litigation; the speculative nature of exploration and development, including the risks of obtaining necessary licenses and permits; diminishing quantities or reserve grades; adverse changes in our credit rating; contests over title to properties, particularly title to undeveloped properties; and the organization of our previously held African gold operations and properties under a separate listed company. In addition, there are risks and hazards associated with the business of exploration, development and mining, including environmental hazards, industrial accidents, unusual or unexpected formations, pressures, cave-ins, flooding and gold bullion or copper cathode losses (and the risk of inadequate insurance, or inability to obtain insurance, to cover these risks). Many of these uncertainties and contingencies can affect our actual results and could cause actual results to differ materially from those expressed or implied in any forward-looking statements made by, or on behalf of, us. Readers are cautioned that forward-looking statements are not guarantees of future performance. All of the forward-looking statements made in this MD&A are qualified by these cautionary statements. Specific reference is made to
| | | | |
| BARRICK YEAR-END 2011 | | 10 | | MANAGEMENT’S DISCUSSION AND ANALYSIS |
the most recent Form 40-F/Annual Information Form on file with the SEC and Canadian provincial securities regulatory authorities for a discussion of some of the factors underlying forward-looking statements. We disclaim any intention or obligation to update or revise any forward-looking statements whether as a result of new information, future events or otherwise, except to the extent required by applicable law.
Changes in Presentation of Non-GAAP Financial Performance Measures
We use certain non-GAAP financial performance measures in our MD&A. For a detailed description of each of the non-GAAP measures used in this MD&A, please see the discussion under “Non-GAAP Financial Performance Measures” beginning on page 72 of our MD&A.
Adjusted Operating Cash Flow before Working Capital Changes
Starting in this MD&A, we are introducing “Adjusted operating cash flow before working capital” as a non-GAAP measure. We present adjusted operating cash flow before working capital changes as a measure which excludes working capital changes from adjusted operating cash flow. Management uses adjusted operating cash flow before working capital as a measure
internally to evaluate the Company’s ability to generate cash flows from its mining operations.
Adjusted Operating Cash Flow
We have adjusted our adjusted operating cash flow to remove the effect of one time withholding tax payments and acquisition costs and working capital adjustments related to acquisitions. These items are not reflective of the underlying capacity of our operations to generate operating cash flow and therefore this adjustment will result in a more meaningful operating cash flow measure for investors and analysts to evaluate our performance in the period and assess our future operating cash flow generating capability.
Adjusted Net Earnings
In 2011, we updated our adjusted net earnings measure to include the removal of the impact of changes in the discount rate on the measurement of the provision for environmental rehabilitation at our closed sites. This adjustment will result in a more meaningful measure of adjusted net earnings for investors and analysts to assess our current operating performance and to predict future operating results.
| | | | |
| BARRICK YEAR-END 2011 | | 11 | | MANAGEMENT’S DISCUSSION AND ANALYSIS |
| | | | |
| |
| INDEX | | | |
| |
| | | page | |
Financial and Operating Highlights | | | | |
2011 Fourth Quarter and Year-End Results | | | 13 | |
Business Overview | | | 16 | |
Outlook for 2012 | | | 22 | |
| |
Strategy, Key Risk Factors and Market Review | | | | |
Our Strategy | | | 26 | |
Capability to Execute our Strategy | | | 26 | |
Market Review | | | 30 | |
| |
Financial and Operating Results | | | | |
Summary of Financial Performance | | | 36 | |
Summary of Operating Performance | | | 37 | |
Mineral Reserves and Mineral Resources Update | | | 42 | |
Review of Operating Segments Performance | | | 42 | |
| |
Financial Condition Review | | | | |
Balance Sheet Review | | | 50 | |
Liquidity and Cash Flow | | | 52 | |
Financial Instruments | | | 54 | |
Commitments and Contingencies | | | 56 | |
| |
Review of Quarterly Results | | | 57 | |
| |
International Financial Reporting Standards (IFRS) | | | 58 | |
| |
IFRS Critical Accounting Policies and Estimates | | | 66 | |
| |
Non-GAAP Financial Performance Measures | | | 72 | |
| |
Glossary of Technical Terms | | | 80 | |
| | | | |
| BARRICK YEAR-END 2011 | | 12 | | MANAGEMENT’S DISCUSSION AND ANALYSIS |
FINANCIAL AND OPERATING HIGHLIGHTS1
2011 Fourth Quarter and Year-End Results
| | | | | | | | | | | | | | | | |
| | | For the three months ended December 31 | | | For the years ended December 31 | |
| ($ millions, except where indicated) | | 2011 | | | 2010 | | | 2011 | | | 2010 | |
Financial Data | | | | | | | | | | | | | | | | |
Revenue | | | $ 3,789 | | | | $3,011 | | | | $ 14,312 | | | | $ 11,001 | |
Net earnings2 | | | 959 | | | | 961 | | | | 4,484 | | | | 3,582 | |
Per share (“EPS”)3 | | | 0.96 | | | | 0.97 | | | | 4.49 | | | | 3.63 | |
Adjusted net earnings4 | | | 1,166 | | | | 1,018 | | | | 4,666 | | | | 3,517 | |
Per share (“adjusted EPS”)3,4 | | | 1.17 | | | | 1.02 | | | | 4.67 | | | | 3.56 | |
EBITDA4 | | | 1,998 | | | | 1,770 | | | | 8,376 | | | | 6,521 | |
Capital expenditures | | | 1,320 | | | | 1,311 | | | | 4,973 | | | | 3,778 | |
Operating cash flow | | | 1,224 | | | | 866 | | | | 5,315 | | | | 4,585 | |
Adjusted operating cash flow4 | | | 1,299 | | | | 1,522 | | | | 5,680 | | | | 5,241 | |
| Adjusted operating cash flow before working capital changes4 | | | 1,405 | | | | 2,044 | | | | 5,819 | | | | 5,242 | |
Free cash flow4 | | | 68 | | | | 327 | | | | 1,082 | | | | 1,870 | |
Cash and equivalents | | | | | | | | | | | 2,745 | | | | 3,968 | |
Adjusted debt4 | | | | | | | | | | | 13,058 | | | | 6,392 | |
Net debt4 | | | | | | | | | | | $ 10,320 | | | | $ 2,427 | |
Return on equity4 | | | 20% | | | | 22% | | | | 22% | | | | 20% | |
| | | | | | | | | | | | | | | | |
Operating Data | | | | | | | | | | | | | | | | |
| | | | |
Gold | | | | | | | | | | | | | | | | |
Gold produced (000s ounces)5 | | | 1,814 | | | | 1,700 | | | | 7,676 | | | | 7,765 | |
Gold sold (000s ounces) | | | 1,865 | | | | 1,831 | | | | 7,550 | | | | 7,742 | |
Realized price ($ per ounce)4 | | | $ 1,664 | | | | $ 1,368 | | | | $ 1,578 | | | | $ 1,228 | |
Net cash costs ($ per ounce)4 | | | $ 382 | | | | $ 278 | | | | $ 339 | | | | $ 293 | |
Total cash costs ($ per ounce)4 | | | $ 505 | | | | $ 440 | | | | $ 460 | | | | $ 409 | |
| | | | |
Copper | | | | | | | | | | | | | | | | |
Copper produced (millions of pounds) | | | 143 | | | | 82 | | | | 451 | | | | 368 | |
Copper sold (millions of pounds) | | | 135 | | | | 103 | | | | 444 | | | | 391 | |
Realized price ($ per pound)4 | | | $ 3.69 | | | | $ 3.99 | | | | $ 3.82 | | | | $ 3.41 | |
Total cash costs ($ per pound)4 | | | $ 1.99 | | | | $ 1.08 | | | | $ 1.75 | | | | $ 1.10 | |
| 1 | The amounts presented in this table include the results of discontinued operations. |
| 2 | Net earnings represent net income attributable to the equity holders of the Company. |
| 3 | Calculated using weighted average number of shares outstanding under the basic method. |
| 4 | Adjusted net earnings, adjusted EPS, EBITDA, adjusted operating cash flow, adjusted operating cash flow before working capital changes, free cash flow, adjusted debt, net debt, return on equity, realized price, net cash costs and total cash costs are non-GAAP financial performance measures with no standardized definition under IFRS. For further information and a detailed reconciliation, please see pages 72 – 79 of this MD&A. |
| 5 | Production includes our equity share of gold production at Highland Gold. |
FOURTH QUARTER FINANCIAL AND OPERATING HIGHLIGHTS
| • | | Net earnings for the fourth quarter were $959 million, which is in line with net earnings in the prior year period. This reflects the impact of impairment charges and investment write-downs totaling $187 million, one-time tax charges totaling $75 million, and higher gold and copper cost of sales, partially offset by higher gold and copper sales volumes and higher realized gold prices. |
| | | | |
| BARRICK YEAR-END 2011 | | 13 | | MANAGEMENT’S DISCUSSION AND ANALYSIS |
| • | | Adjusted net earnings for the fourth quarter were $1,166 million, up 15% over the prior year period. The increase primarily reflects higher realized gold prices and higher gold and copper sales volumes, partially offset by higher gold and copper cost of sales and higher income tax expense. |
| • | | EPS and adjusted EPS for the fourth quarter were $0.96 and $1.17, respectively, down 1% and up 15%, respectively, over the prior year period. The changes reflect the decrease in net earnings and increase in adjusted net earnings, respectively. |
| • | | EBITDA for the fourth quarter was $1,998 million, up 13% over the prior year period, reflecting the same factors affecting net earnings, except for income tax expense. |
| • | | Operating cash flow for the fourth quarter was $1,224 million, up 41% over the prior year period. The increase in operating cash flow primarily reflects payments related to the settlement of gold sales contracts of $656 million in 2010, partially offset by lower net earnings and a one-time withholding tax payment of $75 million in 2011. |
| • | | Adjusted operating cash flow for the fourth quarter was $1,299 million, down 15% from the prior year period. The decrease in adjusted operating cash flow reflects lower net earnings and higher income taxes paid. Adjusted operating cash flow before working capital adjustments was $1,405 million, down $639 million from the prior year period. |
| • | | Capital expenditures for the fourth quarter were $1,320 million, up 1% over the prior year period. The increases largely reflect higher project capital and minesite expansion expenditures. |
| • | | Gold production for the fourth quarter was 1.8 million ounces, up 7% over the prior year period. Gold production increased primarily due to increases in production in North America and South America, partially offset by decreased production in ABG. |
| • | | The realized gold price for the fourth quarter was $1,664 per ounce, up 22% over the prior year period, principally reflecting higher market gold prices. |
| • | | Gold total cash costs for the fourth quarter were $505 per ounce, up 15% over the prior year period. The increase reflects increased direct mining costs, including higher labor, energy, maintenance and consumable costs. |
| • | | Net cash costs for the fourth quarter were $382 per ounce, up 37% over the prior year period, primarily due to higher total cash costs and lower copper credits. |
| • | | Copper production for the fourth quarter was 143 million pounds, up 74% over the prior year period, primarily due to the inclusion of production from Lumwana, which was acquired as part of the acquisition of Equinox on June 1, 2011. |
| • | | Realized copper prices for the fourth quarter were $3.69 per pound, down 8% from the prior year period, primarily due to lower market copper prices. |
| • | | Copper total cash costs for the fourth quarter were $1.99 per pound, up 84% over the prior year period. The increase was primarily due to the inclusion of higher cost production from Lumwana in the mix, which was acquired as part of the acquisition of Equinox on June 1, 2011. Total cash costs were also higher due to higher direct production costs and lower production levels at Zaldívar. |
FULL YEAR FINANCIAL AND OPERATING HIGHLIGHTS
| • | | Net earnings for 2011 were $4,484 million, up 25% over the prior year. The increase reflects higher realized gold and copper prices and higher copper sales volumes, partially offset by higher gold and copper cost of sales, lower gold sales volumes, impairment charges and investment write-downs, as well as higher income tax expense. |
| • | | Adjusted net earnings for 2011 were $4,666 million, up 33% over the prior year. The increase primarily reflects higher realized gold and copper prices and higher copper sales volumes, partially offset by higher gold and copper cost of sales, lower gold sales volumes and higher income tax expense. |
| • | | EPS and adjusted EPS for 2011 were $4.49 and $4.67, respectively, up 24% and 31%, respectively, over the prior year. The increases for the year reflect the increases in both net earnings and adjusted net earnings. |
| • | | EBITDA for 2011 was $8,376 million, up 28% over the prior year. The increase in EBITDA reflects the same factors affecting net earnings, except for income tax expense. |
| • | | Operating cash flow for 2011 was $5,315 million, up 16% over the prior year. The increase in operating cash flow was primarily due to higher net earnings, partially offset by higher income tax payments, including tax payments totaling about $480 million made in 2011 related to the final 2010 income tax liability. |
| • | | Adjusted operating cash flow for 2011 was $5,680 million, up 8% over the prior year. Adjusted operating cash flow increased for the same reasons as operating cash flow. Adjusting items in 2011 include: one-time costs related to the Equinox acquisition of $204 million and withholding tax payments of $161 million. Adjusted operating cash flow before changes in working capital was $5,819 million, up 11% over the prior year. |
| | | | |
| BARRICK YEAR-END 2011 | | 14 | | MANAGEMENT’S DISCUSSION AND ANALYSIS |
| • | | Capital expenditures were $4,973 million, up 32% over the prior year. Capital expenditures attributable to Barrick for 2011 were $4,598 million, up 36% over the prior year. The increase reflects higher project capital expenditures and an increase in minesite expansion, minesite sustaining and open pit and underground development expenditures. |
| • | | Gold production for 2011 was 7.7 million ounces, down slightly from the prior year. Gold production decreased for the year primarily due to decreases in production in South America, Australia Pacific and ABG, partially offset by increased production in North America. |
| • | | Realized gold prices for 2011 were $1,578 per ounce, up 29% over the prior year, principally as a result of higher market gold prices. |
| • | | Gold total cash costs for 2011 were $460 per ounce, up 12% over the prior year. The increase reflects higher direct mining costs, particularly higher labor, energy, maintenance and consumable costs as well as the impact of lower production levels in South America, our lowest cost RBU, which resulted in higher consolidated unit production costs, partially offset by an increase in capitalized production phase stripping costs. |
| • | | Net cash costs for 2011 were $339 per ounce, up 16% over the prior year, primarily due to higher total cash costs,. |
| • | | Copper production for 2011 was 451 million pounds, up 23% over the prior year, primarily due to the inclusion of production from Lumwana which was acquired as a result of the acquisition of Equinox on June 1, 2011, partially offset by lower production in Zaldívar and the impact of the divestiture of Osborne in the third quarter of 2010. |
| • | | Realized copper prices for 2011 were $3.82 per pound, up 12% over the prior year, primarily reflecting higher average market copper prices. |
| • | | Copper total cash costs for 2011 were $1.75 per pound, up 59% over the prior year. The increase reflects higher direct production costs and lower production levels at Zaldívar and the impact of including higher cost production from Lumwana in the mix. |
| | | | |
| BARRICK YEAR-END 2011 | | 15 | | MANAGEMENT’S DISCUSSION AND ANALYSIS |
Business Overview
Barrick’s vision is to be the world’s best gold mining company by finding, acquiring, developing and producing gold in a safe, profitable and socially responsible manner. We sell our production in the world market through the following distribution channels: gold bullion is sold in the gold spot market; gold and copper concentrate is sold to independent smelting companies; and copper cathode is sold to various manufacturers and traders.
Barrick’s market capitalization, annual gold production and gold reserves are the largest in the industry. We also produce significant amounts of copper and have significant silver reserves contained within our gold reserves at our Pascua-Lama project. Our large mineral inventory provides significant optionality to metal prices, which supports mine life extension and expansion investment opportunities.
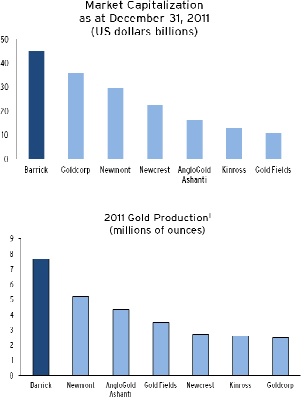
| 1 | Based on Fiscal 2011 results. |
We are targeting to increase our annual gold production to nine million ounces by 2016. The significant drivers of this production growth include our Pueblo Viejo and Pascua-Lama projects, as well as various expansionary opportunities at our existing operating mines. We are targeting to increase our annual copper production to about 1 billion pounds by 2017 as a result of the start-up of Jabal Sayid and expansion opportunities at Zaldívar and Lumwana. We produced about 3.4 million ounces of silver as a by-product in 2011. We are targeting to increase our annual silver production to about 50 million ounces by 2016.
Our targeted production levels do not include production from Cerro Casale, Donlin Gold through 2016/2017, the Turquoise Ridge expansion or Goldrush/Red Hills gold discoveries due to the extended permitting and construction timelines for these projects.
We manage our business through seven primary business units: four regional gold businesses, a global copper business, an oil & gas business and a Capital Projects business. This structure enables each business unit to customize corporate strategies to meet the unique conditions in which they operate. For gold, we manage our operations using a geographical business unit approach, with producing mines concentrated in three regional business units (“RBUs”): North America, South America and Australia Pacific, each of which is led by its own Regional President. We also hold a 73.9% equity interest in African Barrick Gold (“ABG”), which includes our previously held African gold mines and exploration properties. We established our global copper business unit in the fourth quarter of 2011 to manage our copper business in a manner that maximizes the value of the Company’s copper assets. Our oil & gas business, managed by Barrick Energy, provides an economic hedge against our exposure to oil prices and also provides support for energy-saving initiatives undertaken by our other business units. Our Capital Projects business, distinct from our other business units, focuses on managing feasibility studies and construction of our major capital projects, while our operating business units manage feasibility studies and construction of mine expansion projects at existing operating mines. Our business unit structure adds value by enabling the realization of operational efficiencies, allocating resources to individual mines/projects more effectively and understanding and better managing the local business environment, including labor, consumable costs and supply and government and community relations.
| | | | |
| BARRICK YEAR-END 2011 | | 16 | | MANAGEMENT’S DISCUSSION AND ANALYSIS |
The newly created copper business unit has been given the primary responsibility and accountability for managing our copper business, which includes the Zaldívar and Lumwana mines, and the Jabal Sayid, Reko Diq and Kabanga projects. The copper business unit’s long-term strategy is to maximize the value of these important assets by providing strategic oversight of copper production and marketing, the adoption of best
We have operating mines or projects in Canada, the United States, the Dominican Republic, Australia, Papua New Guinea, Peru, Chile, Argentina, Zambia, Saudi Arabia, Pakistan and Tanzania. The geographic split of gold production for the year ended December 31, 2011 was as follows:
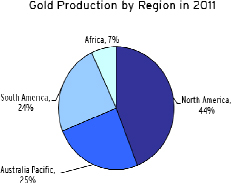
In addition, our gold reserves and resources are situated primarily in geopolitically secure countries, with approximately 66% of our gold reserves located in investment grade1 countries, including the United States, Chile, Australia, Peru, and Canada. This provides a lower overall risk profile.
| 1 | Based on the most recent public information as at date noted. |
| 1 | Defined as being rated BBB- or higher by S&P. |
practices in mining throughout the portfolio of mines/projects, as well advancing value creation opportunities within the copper business, such as the Lumwana and Zaldívar expansion opportunities.
| 1 | Based on Fiscal 2011 results. |
Increasing Gold and Copper Reserves through Exploration and Selective Acquisition
Acquisition of Equinox Minerals Limited
In April 2011, we announced an offer to acquire all of the issued and outstanding common shares of Equinox Minerals Limited (“Equinox”) for an all-cash offer of C$8.15 per share. This strategic, all-cash transaction, was accomplished without issuing equity or diluting our shareholder’s exposure to gold and has added two attractive copper assets to our portfolio. On June 1, 2011, we had acquired 83% of the shares, thus obtaining control. We began consolidating operating results, including cash flows, from this date onwards. On July 19, 2011, we acquired 100% of the issued and outstanding common shares for total cash consideration of $7.482 billion. Equinox’s primary asset is the Lumwana copper mine, a high-quality, long-life property in the highly prospective Zambian Copperbelt
| | | | |
| BARRICK YEAR-END 2011 | | 17 | | MANAGEMENT’S DISCUSSION AND ANALYSIS |
region. Equinox’s other significant asset is the Jabal Sayid copper project in Saudi Arabia, which is currently in construction and is expected to enter production in 2012. This acquisition was funded through our existing cash balances and $6.5 billion in new debt issued during 2011. The contribution of Equinox operations has been consolidated into Barrick’s results from June 1, 2011 onwards as part of our newly formed copper business unit.
Gold discoveries in Nevada
In Nevada, recent drilling continues to grow the potential at Red Hill/Goldrush. At Red Hill, a resource of 1.27 million ounces was calculated in the indicated category and 3.30 million ounces in the inferred category2, and the resource remains open in multiple directions. Step-out holes have intersected mineralization a further 2,800 feet north beyond the initial 2010 resource as well as extended mineralization at least 1,000 feet to the southwest. Highlights of major step-out drilling include 90 feet at 0.15 ounces per ton (opt), 120 feet at 0.32 opt, 20 feet at 1.18 opt, and 110 feet at 0.12 opt. Infill drilling between the deposits has shown that Red Hill and Goldrush merge into a single deposit. A small portion of the Goldrush deposit had sufficient drill density to report an initial inferred resource of 2.45 million ounces2. The step-out drilling continues to suggest a high likelihood of major resource expansion. A total of 468,000 feet of drilling ($64 million) is planned at Red Hill/Goldrush in 2012 to test the full extent of the mineralized system and further expand and upgrade the resource base and a scoping study has commenced.
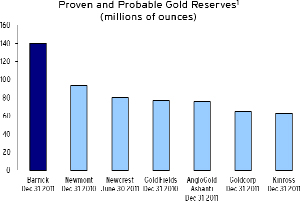
Gold and Copper Reserves and Resources Update3
Barrick replaced proven and probable gold reserves to an industry leading 139.9 million ounces at the end of 2011, based on a $1,200 per ounce gold price, and also has measured and indicated gold resources of 80.4 million ounces and inferred gold resources of 40.2 million ounces, based on a $1,400 per ounce gold price2. With the addition of Lumwana and Jabal Sayid, copper reserves nearly doubled from 6.5 billion pounds to 12.7 billion pounds, measured and indicated copper resources
| 2 | Calculated in accordance with National Instrument 43-101 as required by Canadian securities regulatory authorities. For United States reporting purposes, Industry Guide 7 (under the Securities Exchange Act of 1934), as interpreted by the Staff of the SEC, applies different standards in order to classify mineralization as a reserve. Accordingly, for U.S. reporting purposes, approximately 2.15 million ounces of reserves at Pueblo Viejo (Barrick’s 60% interest) is classified as mineralized material. For a breakdown of reserves and resources by category and additional information relating to reserves and resources, see pages 161 to 166 of Barrick’s 2011 Year-End Report. |
| 3 | For a breakdown of reserves and resources by category and additional information relating to reserves and resources, see pages 161 to 166 of this Financial Report |
rose 17% to 15.3 billion pounds and inferred copper resources increased 117% to 19.9 billion pounds based on a $2.75 per pound copper price and a $3.25 per pound copper price2, respectively.
New Financing and Capital Structure Developments
During 2011 we increased our outstanding debt by $6.5 billion to fund the cost of the Equinox acquisition. In May 2011, we entered into a new $2 billion revolving credit facility with an interest rate of LIBOR plus 1.25%. In June 2011, we drew $1 billion on this credit facility. In May 2011, we drew $1.5 billion on our previously existing revolving credit facility and in June 2011, we issued an aggregate of $4.0 billion in debt securities.
In January 2012, we entered into a credit facility of $4 billion, which matures in 2017 to replace our $2 billion facility that was scheduled to mature in 2016 and also to augment our overall credit capacity. Coincident with this agreement becoming effective, we terminated our $2 billion facility that was obtained in April 2011 and transferred the $1 billion drawn on the $2 billion facility to the new $4 billion facility.
Returning Capital to Shareholders
As a result of our positive outlook on the gold price, our strong financial position and robust operating cash flow, Barrick’s Board of Directors authorized an annual dividend increase from $0.48 per common share to$0.60 per common share4 in October, 2011. Over the last five years, Barrick has had a consistent track record of returning capital to shareholders, increasing its dividends by more than 170%5 on a quarterly basis.
Investing in and Developing High Return Projects
Projects in Construction
Pueblo Viejo
At the Pueblo Viejo project in the Dominican Republic, first production continues to be expected in mid-2012 and overall construction is currently about 90% complete. At the end of Q4, approximately 85% of the expected total mine construction capital of $3.6 -$3.8 billion6 (100% basis) or $2.2 -$2.3 billion (Barrick’s 60% share) had been committed. About 13 million tonnes of ore, representing approximately 1.4 million contained gold ounces, has been stockpiled to date. Construction
| 4 | The declaration and payment of dividends remains at the discretion of the Board of Directors and will depend on our financial results, cash requirements, future prospects and other factors deemed relevant by the Board. |
| 5 | Calculated based on converting the 2006 semi-annual dividend of 11 cents per share to a quarterly dividend. |
| 6 | Based on gold and oil price assumptions of $1,300/oz, and $100/bbl, respectively. |
| | | | |
| BARRICK YEAR-END 2011 | | 18 | | MANAGEMENT’S DISCUSSION AND ANALYSIS |
of the tailings facility progressed during Q4 with the receipt of approvals to re-commence construction. The oxygen plant is expected to undergo pre-commissioning testing in Q1 2012, with the first two autoclaves undergoing pre-commissioning in Q2 2012. Construction of the transmission line connecting the site to the national power grid was completed during Q4 2011, and the inter-connect to the grid has been achieved. As part of a longer-term, optimized power solution for Pueblo Viejo, the Company has started early works to construct a dual fuel power plant at an estimated incremental cost of approximately $300 million (100% basis). The power plant would commence operations utilizing heavy fuel oil, but have the ability to subsequently transition to lower cost liquid natural gas. The new plant is expected to provide lower-cost, long-term power to the project.
Pueblo Viejo is expected to contribute approximately 100,000-125,000 ounces to Barrick at total cash costs of $400-$500 per ounce7 in 2012 as it ramps up to full production in 2013. Barrick’s 60% share of annual gold production in the first full five years of operation is expected to average 625,000-675,000 ounces at total cash costs of $300-$350 per ounce8.
Jabal Sayid
Overall construction of the Jabal Sayid copper project in Saudi Arabia was about 75% complete at the end of Q4. Subject to receipt of final approvals, the operation is expected to enter production in the second half of 2012 at total construction capital of approximately $400 million, of which 85% had been committed at the end of Q4. Underground mine development for first ore production and concrete works was completed in Q4 and bulk earthworks were about 90% complete. Jabal Sayid is expected to produce 35-45 million pounds of copper in 2012 at total cash costs of $2.15 -$2.50 per pound9. Average annual production from Lodes 2 and 4 is expected to be 100-130 million pounds over the first full five years of operation at total cash costs of $1.50 -$1.70 per pound. Results from recent drilling beneath Lode 4 demonstrate that the width of mineralization towards the base of the current resource model had been
| 7 | Based on 2012 gold and oil price assumptions of $1,700/oz and $100/bbl, respectively. The 2012 total cash cost estimate is dependent on the rate at which production ramps up after commercial levels of production are achieved. A change in the efficiency of the ramp up could have a significant impact on this estimate. |
| 8 | Based on gold and oil price assumptions of $1,300/oz, and $100/bbl, respectively. |
| 9 | Based on 2012 copper and gold price assumptions of $3.50/lb and $1,700/oz, respectively. The 2012 total cash cost estimate is dependent on the rate at which production ramps up after commercial levels of production are achieved. A change in the efficiency of the ramp up could have a significant impact on this estimate. |
underestimated by lack of drilling. In addition to the previous intercept of 111 meters grading 2.67% copper, recent drilling has intersected 119 meters at 1.2% copper. This area will be the focus of ongoing drilling and resource/reserve upgrades and additions in 2012.
Pascua-Lama
At the Pascua-Lama project, approximately 55% of the previously announced pre-production capital of $4.7 -$5.0 billion10 has been committed and first production is expected in mid-2013. The project is being impacted by labor and commodity cost pressures as a result of inflation, competition for skilled labor, the impact of increased Argentinean customs restrictions on equipment procurement and lower than expected labor productivity.
In Chile, earthworks were about 95% complete at the end of Q4, and in Argentina, earthworks construction was approximately 65% complete at year end. Approximately 40% of the concrete has been poured at the processing facilities in Argentina and about 15% of the structural steel has been erected to date. Occupancy of the construction camps in Chile and Argentina continues to ramp up with 6,500 beds available by the end of 2011. The camps are expected to reach their full capacity of 10,000 beds in mid-2012. Average annual gold production from Pascua-Lama is expected to be 800,000–850,000 ounces in the first full five years of operation at negative total cash costs of $225-$275 per ounce10 based on a silver price of $25 per ounce. For every $1 per ounce increase in the silver price, total cash costs are expected to decrease by about $35 per ounce over this period.
Projects in Feasibility
Cerro Casale
At the Cerro Casale project in Chile, basic engineering was completed on schedule in Q4. The EIA permitting process is anticipated to be completed by the end of 2012, after which Barrick will consider a construction decision, commencement of detailed engineering and sectoral permitting. Ongoing consultation with the government, local communities and indigenous groups is continuing in parallel with permitting.
Barrick’s 75% share of average annual production is anticipated to be 750,000-825,000 ounces of gold and 190-210 million pounds of copper in the first full five years of operation at total cash costs of $200-$250 per
| 10 | Based on gold, silver and oil price assumptions of $1,300/oz, $25/oz, and $100/bbl, respectively, and assuming a Chilean peso f/x rate of 475:1. |
| | | | |
| BARRICK YEAR-END 2011 | | 19 | | MANAGEMENT’S DISCUSSION AND ANALYSIS |
ounce11. Estimated total mine construction capital is approximately $6.0 billion (100% basis)10,12 .
Donlin Gold
At the 50%-owned Donlin Gold project in Alaska, the revised feasibility study, which includes updated costs and the utilization of natural gas, has been completed and acceptance of the study by the Board of Donlin Gold LLC is expected in the first half of 2012. Mine construction capital is expected to be approximately $6.7 billion (100% basis)13, which includes a natural gas pipeline that is anticipated to lower long-term power costs and offer a better environmental and operational solution for power connection to the site. Permitting is expected to commence following approval by the Board of the revised feasibility study. Donlin Gold is anticipated to produce about 1.5 million ounces of gold annually (100% basis) in its first full five years of operation.
Lagunas Norte Sulfides Expansion
A scoping study was completed on the Lagunas Norte deep sulfide potential in 2011 and the project is undergoing metallurgical and geotechnical work as part of a prefeasibility study, which is anticipated to be completed by year end 2012. This expansion opportunity has the potential to benefit life of mine production starting as early as 2016.
Zaldívar Sulfides Expansion
A scoping study has also been completed on the Zaldívar deep sulfides and a prefeasibility study is expected by year end 2012. Although this project is in the early stages, this expansion opportunity has the potential to benefit life of mine production starting as early as 2017 and significantly extend the mine life.
Lumwana Expansion
At Lumwana, activity has been ramped up with 17 drill rigs on the property focusing on resource definition drilling at Chimiwungo to convert inferred resources into the indicated category and step-out drilling to the south and east to extend the mineralization. Drilling to date has confirmed the thickened eastern shoot of Chimiwungo and selected highlights include 44 meters grading 1.00% copper, 44 meters at 1.07%, 41 meters at 0.80%, 37 meters at 0.91% and 20 meters at 1.60%. In addition to these strong results within the resource area, drilling further to the east is intersecting shallower than expected mineralization. A prefeasibility study on an
| 11 | Based on gold, copper, and oil price assumption of $1,300/oz, $3.25/oz and $100/bbl, respectively and assuming a Chilean peso f/x rate of 475;1. |
| 12 | Based on Q2 2011 prices and does not include escalation for inflation. |
| 13 | Based on Q2 2011 prices and does not include escalation for inflation. |
expansion that could potentially double processing rates at Lumwana is expected to be completed by year end 2012.
Turquoise Ridge Expansion
At the 75%-owned Turquoise Ridge mine in Nevada, work is advancing on the potential to develop a large-scale open pit in order to mine the lower grade halo around the high-grade underground ore, which could significantly increase annual production. Work in 2012 will focus on resource conversion, mine planning, environmental data collection, geotechnical and hydrologic evaluation, metallurgical and trade-off studies for processing as part of the prefeasibility study, which is expected to be completed by the end of 2012. Twelve drill rigs are currently active on the property and the focus of open pit drilling is on upgrading resources. Additionally, surface drilling has intersected new mineralization, particularly in the shallower south area of the planned pit, which could positively impact economics. Underground drilling is also yielding strong results, intersecting higher grades than expected in some areas, and zones are open up-dip and to the northwest.
Hemlo Expansion
We have identified an opportunity at our Hemlo mine to expand the open pit and extend the mine life by up to 10 years. We are currently working on the feasibility study, which is expected to be completed in early 2012.
Adoption of IFRS
We adopted IFRS effective January 1, 2011. The financial results discussed in this MD&A were prepared in accordance with IFRS, including the relevant prior year comparative amounts. Under IFRS, certain costs such as production phase waste stripping costs and exploration and evaluation costs can be capitalized where there is probable future economic benefit. As a result, the conversion to IFRS resulted in a decrease in operating costs, an increase in net assets and an increase in operating cash flow and capital expenditures compared to equivalent results if presented in accordance with US GAAP. Certain figures within this MD&A are presented under US GAAP and have been labeled accordingly. For a discussion of our significant accounting policies, refer to note 2 of the Consolidated Financial Statements.
Economic, Fiscal and Legislative Developments
The current global economic situation has impacted Barrick in a number of ways. The response from many governments to the ongoing economic crisis has led to continuing low interest rates and a reflationary
| | | | |
| BARRICK YEAR-END 2011 | | 20 | | MANAGEMENT’S DISCUSSION AND ANALYSIS |
environment that has been generally supportive of higher commodity prices. The long-term fundamentals for gold remain strong and are supported by a number of factors including ongoing risks to the European financial system, central bank buying for reserve diversification purposes and strong investment and retail demand from consumers in developing countries. Gold and copper market prices in particular (refer to Market Review section of this MD&A for more details) have been key drivers of higher income and operating cash flows for Barrick. During the year, the market prices for these metals were extremely volatile. During 2011, gold prices achieved a series of successive all-time nominal highs. Copper prices also reached an all-time high during 2011, but declined significantly in the second half, closing at $3.43 per pound, which was down compared to the 2010 closing price of $4.42 per pound.
The fiscal pressures currently experienced by many governments have resulted in a search for new sources of revenues, and the mining industry, which is generating significant profits and cash flow in this high metal price environment, is facing the possibility of higher income taxes and royalties. The Australian Mineral Resources Rent Tax (“MRRT”), which if enacted will apply from July 1, 2012, is one example. While the MRRT currently does not apply to our gold operations, there has been a degree of political agitation to extend the legislation to include gold mining. We continue to monitor and consider any developments related to this legislation. In addition, in order to finance reconstruction stemming from the devastating 2010 earthquake, the Chilean government enacted a temporary first tier income tax increase from 17% to 20% in 2011 and 18.5% in 2012 as well as a new elective mining royalty. In January 2011 we adopted the new royalty. The impact on the Company of the temporary income tax rate increase and the elective mining royalty on 2011 income tax expense were about $18 million and $8 million, respectively.
The Peruvian government enacted new tax legislation, effective October 1, 2011, which will apply specifically to mining operations. The tax rates will apply differently depending on whether or not a mining company has a stabilization agreement in effect. The impact to the Company from the new tax legislation has resulted in an increase in income tax expense of $12 million in fourth quarter 2011. On an annualized basis, we expect income tax expense to increase by about $23 million per year over the next couple of years.
In September 2011, Zambia elected a new leader, Michael Sata of the Patriotic Front party. Part of Mr. Sata's campaign platform was to ensure the state receives
more economic benefits from its mining sector. The new Zambian Government has since announced a change in the mining tax regime to increase the royalty rate from 3% to 6%. The new rate, which has been enacted, will be effective from April 1, 2012.
On October 26, 2011, the Argentinean government announced by Decree 1722 the obligation for companies producing crude oil, natural gas, and mining to repatriate and convert into Argentinean pesos, on the Single and Free Foreign Exchange Market, all foreign currencies resulting from export transactions. The Bank Transaction Tax (“BTT”) resulting from the conversion of foreign currencies to pesos is 0.6% and is applicable to all currency transactions that would otherwise have been executed using offshore funds. We do not expect the BTT to have a significant impact on Veladero and Pascua Lama. Both Veladero and Pascua-Lama acquired stability rights in Argentina before Decree 1722/2011, which we believe should provide protection against changes to our stabilized foreign exchange regimes. The Argentinean Mining Investment Law N°24.196 grants tax and foreign exchange stability for a 30 year term to mining companies that file a feasibility study for a mining project.
The Australian government has enacted its carbon tax scheme with a commencement date of July 1, 2012. The carbon price will be set at AUD $23 per tonne of carbon until June 30, 2015 and will apply to the top 500 high-emitting companies. We have completed a preliminary assessment and expect the impact of complying with the legislation to be an increase in our total gold cash costs of approximately $3 per ounce on a consolidated basis and approximately $12 per ounce for the regional business unit on an annualized basis.
On November 15th, 2011 the Government of Balochistan rejected the mining lease application for our Reko Diq copper-gold project in Pakistan. We believe that we have a sound legal basis to support our entitlement to secure a mining lease and we are actively pursuing the enforcement of our legal rights through both the International Center for Settlement of Investment Disputes and the International Chamber of Commerce, as well as through an administrative appeal under the Balochistan Mineral Rules. The carrying value of our investment in Reko Diq is $121 million.
| | | | |
| BARRICK YEAR-END 2011 | | 21 | | MANAGEMENT’S DISCUSSION AND ANALYSIS |
Outlook for 2012
2012 Guidance Summary
| | | | | | | | |
| | | 2011 Actual | | | 2012 Guidance | |
Gold production and costs | | | | | | | | |
Production (millions of ounces)1 | | | 7.7 | | | | 7.3 -7.8 | |
Cost of sales2 | | | 5,127 | | | | 5,800 - 6,200 | |
Gold unit production costs | | | | | | | | |
Total cash costs ($ per ounce)3 | | | 460 | | | | 520 - 560 | |
Net cash costs ($ per ounce)4 | | | 339 | | | | 400 - 450 | |
Depreciation ($ per ounce)5 | | | 154 | | | | 185 - 195 | |
Copper production and costs | | | | | | | | |
Production (millions of pounds) | | | 451 | | | | 550 - 600 | |
Cost of sales6 | | | 949 | | | | 1,400 - 1,600 | |
Copper unit production costs | | | | | | | | |
Total cash costs ($ per pound) | | | 1.75 | | | | 1.90 - 2.20 | |
Depreciation ($ per pound) | | | 0.38 | | | | 0.50 - 0.60 | |
Other depreciation7 | | | 50 | | | | 65 - 75 | |
Exploration and evaluation expense | | | 352 | | | | 380 - 410 | |
Exploration8 | | | 217 | | | | 260 - 280 | |
Evaluation9 | | | 135 | | | | 120 - 130 | |
Corporate administration | | | 166 | | | | 165 - 175 | |
Other expense10 | | | 576 | | | | 425 - 450 | |
Other income11 | | | 248 | | | | 15 - 20 | |
Finance income | | | 13 | | | | 10 - 15 | |
Finance costs | | | 199 | | | | 200 - 225 | |
Capital expenditures: | | | | | | | | |
Minesite sustaining | | | 980 | | | | 1,200-1,300 | |
Open pit and underground mine development12 | | | 842 | | | | 850 - 925 | |
Minesite expansion12,13 | | | 529 | | | | 850 - 925 | |
Capital projects14 | | | 2,247 | | | | 2,600 - 2,750 | |
Total capital expenditures | | | 4,598 | | | | 5,500 - 5,900 | |
Effective income tax rate15 | | | 33 | % | | | 32 | % |
| 1 | Guidance for gold production reflects Barrick’s equity share of production from ABG (73.9%), Pueblo Viejo (60%). |
| 2 | Cost of sales applicable to gold includes depreciation expense and cost of sales applicable to the outside equity interests in ABG. Guidance for cost of sales reflects the full 100% consolidation of ABG gold sales. Cost of sales guidance does not include proceeds from by-product metal sales or the net contribution from Barrick Energy, whereas guidance for gold total cash costs and gold net cash costs do reflect these items. |
| 3 | Gold total cash costs includes expected proceeds of approximately $140 million (2011: $155 million) from the sale of by-product metals and the net contribution of approximately $156 million from Barrick Energy (2011: $117 million). Copper total cash costs includes expected proceeds of approximately $8 million from the sale of by-product metals (2011: $3 million). |
| 4 | Assuming a realized copper price of $3.50 per pound. |
| 5 | Includes depreciation expense related to Barrick Energy. |
| 6 | Cost of sales applicable to copper includes depreciation expense and excludes the amortization of the Lumwana inventory fair value adjustment at acquisition (2011: $34 million) |
| 7 | Represents depreciation for the Corporate and Regional Business Unit offices. |
| 8 | Total exploration expenditures in 2012 are expected to be between $450 - $490 million including $260 - $280 million (2011: $217 million) in exploration expense and $190 - $210 million (2011: $133 million) in capitalized exploration costs. The capitalized exploration costs are included in the guidance for open pit and underground mine development and minesite expansion capital expenditures, as appropriate. |
| 9 | Represents Barrick’s share of evaluation expenditures. Includes expected costs of $4 million for Kabanga and Donlin Gold (2011: $2 million) that will be classified under “income (loss) from equity investees”. |
| 10 | Other expense is expected to be lower in 2012 as 2011 costs include special items of approximately $149 million in other expense, primarily due to acquisition costs, and the effect of discount rate changes on environmental provisions at closed sites. |
| 11 | Other income is expected to be lower in 2012 as 2011 income includes approximately $224 million in other income due to the gain on sale of certain assets and investments. |
| 12 | Includes capitalized exploration costs. |
| 13 | Represents Barrick’s share of minesite expansion capital expenditures. Includes capitalized interest of about $115 to $120 million (2011: $39 million). |
| 14 | Represents Barrick’s share of project capital expenditures including capitalized interest of about $375 million in 2012 (2011: $343 million). |
| 15 | Excludes the impact of one time dividend withholding tax in 2011 of $87 million. |
2012 Guidance Analysis
Production
We prepare estimates of future production based on mine plans that reflect the expected method by which we will mine reserves at each site. Actual gold and copper production may vary from these estimates due to a number of operational factors, including whether the volume and/or grade of ore mined differs from estimates, which could occur because of changing mining rates, ore dilution, varying metallurgical and other ore characteristics, and/or short-term mining conditions that require different sequential development of ore bodies or mining in different areas of the mine. Certain non-operating factors may also cause actual production to vary from guidance, including litigation risk, the regulatory environment and the impact of global economic conditions. Mining rates are also impacted by various risks and hazards inherent at each operation, including natural phenomena, such as inclement weather conditions, floods and earthquakes, and unexpected civil disturbances, labor shortages or strikes.
We expect 2012 gold production to be about 7.3 to 7.8 million ounces. Our gold production mix is expected to change as a result of higher production in North America that is offset by lower production in South America. The production mix within North America is also expected to change due to the commencement of operations at Pueblo Viejo in the Dominican Republic in the second half of the year and an increase in ore tons mined and processed at Goldstrike as the mine completed a stripping phase towards the end of 2011. This is expected to be partially offset by lower
| | | | |
| BARRICK YEAR-END 2011 | | 22 | | MANAGEMENT’S DISCUSSION AND ANALYSIS |
production at Cortez due to a decline in open pit ore grade. South America production is expected to be lower than 2011 levels, primarily due to lower ore grades at Veladero and decreased production at Pierina. Production at Australia Pacific is expected to be consistent with 2011 levels and production at ABG is expected to be slightly higher than 2011, primarily due to higher ore grades at North Mara.
Copper production is expected to increase from 451 million pounds in 2011 to about 550 to 600 million pounds in 2012, as a result of a full year of production from Lumwana and the mid-year start up of Jabal Sayid. Production at Zaldívar is expected to remain at levels similar to 2011.
Revenues
Revenues include consolidated sales of gold, copper, oil and metal by-products. Revenues from oil and metal by-products are reflected in our guidance for gold total cash costs. Revenues from gold and copper reported in 2012 will reflect the sale of production at market gold and copper prices and the impact of copper floor price contracts. Barrick does not provide guidance on 2012 gold and copper prices.
Cost of Sales, Net Cash Costs and Total Cash Costs
We prepare estimates of cost of sales, net cash costs and total cash costs based on expected costs associated with mine plans that reflect the expected method by which we will mine reserves at each site. Cost of sales, net cash costs and total cash costs per ounce/pound are also affected by ore metallurgy that impacts gold and copper recovery rates, labor costs, the cost of mining supplies and services, foreign currency exchange rates and stripping costs incurred during the production phase of the mine. In the normal course of our operations, we attempt to manage each of these risks to mitigate, where possible, the effect they have on our operating results.
Cost of sales applicable to gold is expected to be in the range of $5.8 to $6.2 billion, compared to $5.1 billion in 2011. The increase is primarily due to the commencement of operations at Pueblo Viejo, higher total ore tons mined, lower waste tons mined that are eligible for capitalization and inflationary cost pressures on labor and other input costs.
Total cash costs are expected to be in the range of $520 to $560 per ounce, up from $460 per ounce in 2011. The increase in 2012 principally reflects a change in production mix from lower-cost ore sources to higher-cost ore sources, both between and within mine sites. Additionally, we expect to capitalize less waste stripping
costs as a result of Goldstrike and Cortez completing substantial stripping campaigns in 2011. Labor cost is increasing due to a combination of significant inflation in certain parts of South America, market adjustments for skilled labor in North America, Australia and Africa and planned hiring at some of our operations. Gas and electricity costs are also higher, principally due to significantly higher natural gas prices at Porgera as a result of the expiration of a long-term contract at the end of 2011. Other cost pressures include the changes in our effective currency hedge rates from 2011 to 2012 and higher royalties due to higher realized gold prices.
Cost of sales applicable to copper is expected to be in the range of $1,400 to $1,600 million, compared to $949 million in the prior year. Total cash costs are expected to be in the range of $1.90 to $2.20 per pound for copper, up from total cash costs of $1.75 per pound in 2011. The increase in cost of sales and total cash costs is primarily a result of the impact of a full year’s contribution from Lumwana, an increase to the Zambian government royalty rate, the start-up of Jabal Sayid and higher costs at Zaldívar, primarily due to an increase in market prices for sulfuric acid.
Net gold cash costs are expected to be in the range of $400 to $450 per ounce, assuming an average market copper price of $3.50 for 2012 and the impact of copper hedge contracts.
Exploration and Evaluation
Exploration and Evaluation (“E&E”) costs will be classified under both the “exploration and evaluation” line and the “loss from equity investees” line on our consolidated statements of income. The timing of the funding provided to equity investees for E&E expenditures and the recognition of the related income or expense as loss from equity investees in our consolidated statement of income may vary. The funding is initially recorded as an increase in the carrying amount of our investment. Our share of expenses is recognized when the expenditures are incurred by the equity investee.
We expect to expense approximately $380 to $410 million of E&E expenditures in 2012. Costs primarily reflect ongoing minesite reserve and resource development programs, principally at Red Hill and Goldrush, Goldstrike, Lumwana, Kanowna, and Veladero. E&E expenses also include our share of non-capitalizable project costs at Pueblo Viejo, Pascua-Lama and Cerro Casale and costs classified under income (loss) from equity investees.
| | | | |
| BARRICK YEAR-END 2011 | | 23 | | MANAGEMENT’S DISCUSSION AND ANALYSIS |
Finance Costs
Finance costs primarily represent interest expense on long-term debt. We expect higher finance costs in 2012, primarily due to higher gross interest costs on debt issued to finance the Equinox acquisition in mid-2011. Capitalized interest for 2012 is similar to 2011 as higher interest capitalized on Pascua Lama and Cerro Casale is offset by lower capitalized interest at Pueblo Viejo and Jabal Sayid once these mines commence production in 2012.
Capital Expenditures
Total capital expenditures for 2012 are expected to be in the range of $5.5 to $5.9 billion. The level of spend is higher in 2012, primarily due to construction activity at Pascua-Lama and Jabal Sayid and higher minesite expansion expenditures. We expect the level of spending on capital projects to decline in 2013 to about $1.7 billion following the completion of Pueblo Viejo and Jabal Sayid in 2012 and Pascua Lama in mid-2013.
Minesite Sustaining
Sustaining capital expenditures are expected to increase from 2011 expenditure levels of $980 million to about $1,200 to $1,300 million, mainly due a full year of expenditures at Lumwana, and the inclusion of sustaining capital expenditures at Pueblo Viejo.
Open pit and underground mine development
Open pit and underground mine development capital includes capitalized waste stripping, underground mine development and exploration drilling expenditures that meet our criteria for capitalization. In 2012, expenditures primarily relate to mine development activities at Goldstrike, Cortez, North Mara, Veladero, Porgera and Granny Smith. Expenditures are expected to increase slightly from 2011 levels, primarily due to higher expenditures in South America from increased mine development activities at Veladero, and in ABG due to higher strip ratios and higher costs at Buzwagi and North Mara. These increases are partly offset by lower expenditures expected in North America, where both Goldstrike and Cortez completed a period of high waste stripping in 2011 as anticipated in their life of mine plans.
Minesite Expansion
The expected increase in expansion capital relates to various projects at Pueblo Viejo, Goldstrike, Cortez and Turquoise Ridge in North America, Lagunas Norte in South America and Lumwana. At Pueblo Viejo, $240 million (100% basis) or $144 million (Barrick’s share) of 2012 expenditures relate to the construction of a dual fuel power plant at Pueblo Viejo at an estimated incremental total cost of approximately $300 million (100% basis) or $180 million (Barrick share). The increase also reflects capitalized exploration costs to advance the expansion project at Turquoise Ridge.
Capital Projects
The expected increase in our share of capital project capital expenditures from $2,247 million in 2011 to $2,600 to $2,750 million in 2012 is mainly due to the construction activity at Pascua-Lama, partly offset by lower capital project capital expenditures at Pueblo Viejo as this project commences operation in mid-2012.
Project Capital Expenditures
| | | | | | | | |
| ($ millions) | | 2011
Actual | | | 2012 Guidance | |
Pueblo Viejo (60% basis) | | | $ 521 | | | | $400 - $425 | |
Pascua-Lama | | | 1,191 | | | | $1,600 - $1,675 | |
Cerro Casale (75% basis) | | | 83 | | | | $50 - $75 | |
Jabal Sayid | | | 105 | | | | $125 - $150 | |
Other | | | 4 | | | | ~$50 | |
Capitalized interest | | | 343 | | | | ~$375 | |
| | | | $2,247 | | | | $2,600 - $2,750 | |
Income Taxes
Our underlying expected effective tax rate of 32% excludes the impact of currency translation gains/losses and changes in the recognition of deferred tax assets.
Based on our current outlook assumptions, cash tax payments in 2012 are expected to be consistent with 2011. Cash tax payments in 2012 are expected to be the highest in the second quarter due to the settlement of some 2011 liabilities and operating cash flow will be reduced accordingly.
| | | | |
| BARRICK YEAR-END 2011 | | 24 | | MANAGEMENT’S DISCUSSION AND ANALYSIS |
Outlook Assumptions and Economic Sensitivity Analysis
| | | | | | | | | | | | | | | | |
| | | 2012 Guidance
Assumption | | | Hypothetical
Change | | | Impact on
Total Cash Costs | | | Impact on EBITDA
(millions) | |
Gold revenue | | | $1,700/oz | 1 | | | $50/oz | | | | n/a | | | | $375 - $400 | |
Copper revenue2 | | | $3.50/lb | 1 | | | $0.25/lb | | | | n/a | | | | $72 | |
Gold total cash costs | | | | | | | | | | | | | | | | |
Gold price effect on royalties | | | $1,700/oz | | | | $50/oz | | | | $1.25/oz | | | | $10 | |
WTI crude oil price3 | | | $100/bbl | | | | $10/bbl | | | | $0.25/oz | | | | $2 | |
Australian dollar exchange rate3 | | | 1 : 1 | | | | 10% | | | | $0/oz | | | | $0 | |
Copper total cash costs | | | | | | | | | | | | | | | | |
WTI crude oil price | | | $100/bbl | | | | $10/bbl | | | | $0.01/lb | | | | $6 | |
Chilean peso exchange rate3 | | | 500 : 1 | | | | 10% | | | | $0/lb | | | | $0 | |
| 1 | We have assumed a gold price of $1,700 per ounce and copper price of $3.50/lb, which are consistent with current market prices. This assumption does not represent a forecast of what we expect gold or copper prices to average in 2012. |
| 2 | We have put in place floor protection on just under half of our expected copper production for 2012 at an average floor price of $3.75 per pound and can fully participate in copper price upside. At prices above $3.75 per pound, the impact on EBITDA of a $0.25/lb change in the copper price is approximately $140 million. |
| 3 | Due to hedging activities we are largely protected against changes in these factors. |
| | | | |
| BARRICK YEAR-END 2011 | | 25 | | MANAGEMENT’S DISCUSSION AND ANALYSIS |
STRATEGY, KEY RISK FACTORS AND MARKET REVIEW
Our Strategy
Our core objective is to maximize long-term value for our shareholders by following a balanced approach that emphasizes increasing net asset value, production, reserves, earnings and cash flow on a per share basis, while continuing our track record of paying a progressive dividend. In order to deliver on these objectives, our strategic focus in 2012 is on the following priorities:
| • | | Meet operational and financial targets to maximize benefits of rising metal prices; |
| • | | Increase gold and copper reserves through exploration and selective acquisitions; |
| • | | Maximize the value of existing mines and properties, leveraging technical skills and regional infrastructure; |
| • | | Invest in and develop high return projects; and |
| • | | Continually improve corporate social responsibility (“CSR”) practices to maintain license to operate. |
Capability to Execute our Strategy
The Our capability to execute on our strategy comes from the strength of our experienced management team, skilled workforce and organizational structure; a strong emphasis on exploration and a pipeline of projects that facilitates the long-term sustainability of our business; our strong financial position; and our commitment to maintaining our license to operate.
We understand that creating shareholder value is the reward for actively managing the risks that could impact our ability to execute our strategy. Consequently, we have established an enterprise risk management (“ERM”) process for identifying, evaluating and managing company-wide risks. Our ERM process ensures that risks are properly identified, assessed, reported and monitored at all levels of the organization. All risks and associated mitigation plans are reported through our business units and corporate functional leaders. These risks are reviewed, consolidated, ranked and prioritized by senior management. An analysis is performed to ensure there is proper assessment of risks that may interfere with achieving our strategic objectives.
The following is a summary of our key competitive strengths, as well as certain of risk factors impacting our ability to execute our strategy.
There are additional risks that either individually or collectively may affect our business and financial results in the future. For a more detailed description of the risks facing the Company, please refer to the most recently filed Annual Information Form.
Experienced Management Team, Skilled Workforce and Organizational Structure
We have an experienced board of directors and senior management team with a proven track record at Barrick and within the mining industry. Strong leadership and governance are critical to the successful implementation of our core business strategies.
Risk Factor: Our ability to attract and retain staff with critical mining skills affects our ability to deliver on our strategic objectives, move on opportunities and provide resources for our projects.
In order to continue to maintain a skilled workforce, we have a combination of strategies, including partnerships to develop local capabilities, technical and leadership training programs, succession planning, talent management systems, and implementation of a targeted compensation strategy. We continue to focus on training and development for key members of our senior mine management, technical professionals and frontline workers through our talent management processes, and enhanced distance learning programs in order to meet this challenge. We have also expanded our technical training and development programs beyond the traditional mining disciplines (mining, metallurgy, maintenance and geology) to include our critical support functions such as environment, health & safety and human resources. This program is now improving the technical and leadership skills of over 1,000 professionals. Leadership development for high potential employees has been, and will continue to be, an area of focus in the coming year.
Exploration
Barrick’s exploration strategy is aligned with our business objectives. It is a balanced approach that ensures we can meet both our short-term and long-term growth needs.
Risk Factor: We must continually replace reserves depleted by production to maintain production levels over the long-term.
| | | | |
| BARRICK YEAR-END 2011 | | 26 | | MANAGEMENT’S DISCUSSION AND ANALYSIS |
Our exploration strategy is three-fold:
| • | | Replacing and adding resources at existing operations and development projects, where we can monetize new discoveries in a more timely manner; |
| • | | Working closely with our corporate development group to identify acquisition opportunities with exploration upside, and |
| • | | Searching for the next flagship deposit that will sustain Barrick for decades. |
The exploration budget supports a strong pipeline of projects and is weighted towards near-term resource additions and conversion at our existing mines, where we believe there is excellent potential to make new discoveries and to expand reserves and resources. The budget also provides support for earlier-stage exploration in our operating districts, with a smaller percentage of the budget directed at emerging areas in order to generate quality projects for future years.
The 2012 total exploration budget guidance is $450 to $490 million, including expenditures that will meet the criteria for capitalization. This is a ~20% increase from 2011, and is a reflection of the exceptionally strong and robust exploration pipeline in each of our business units. The increase in budget is mainly the result of major exploration programs at Red Hill/Goldrush, Turquoise Ridge and Lumwana, following on from successful results of our 2011 programs at these sites. These are key projects with large drill programs that are expected to directly add and/or upgrade gold and copper reserves/resources over the next few years, and support the various planned scoping, prefeasibility, feasibility and expansion studies that are underway at these sites.
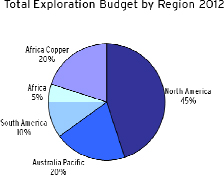
Barrick has been successful at consistently finding reserves and resources. With each one of our acquisitions, we have gone on to substantially add to reserves and resources. We have extensive land
positions on many of the world’s most prospective trends and, due in large part to our consistent funding and disciplined approach to exploration, we were successful at replacing reserves in 2011 and growing resources. Since 1990, we have spent approximately $2.5 billion on exploration, which has resulted in the discovery of approximately 148 million ounces of reserves, substantially more than the 118 million ounces that we have produced in the same time period. The per ounce cost of reserve additions of approximately $17 has added substantial value to the Company.
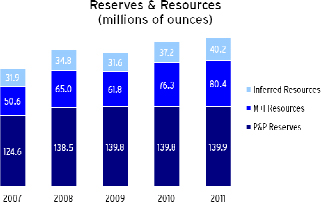
Investing in High Return Projects
Building new mines is key to our long-term goal of increasing profitability and creating long-term shareholder value.
Risk Factor: Our significant capital projects represent a key driver to our plans for future growth and the process to bring these projects into operation may be subject to unexpected delays that could increase the cost of development and the ultimate operating cost of the relevant project.
It may take years for a project to move from the exploration stage through feasibility, permitting and mine construction into production. This development timeframe has increased in recent years as many mines require the development of supporting infrastructure, which complicates the completion of feasibility studies and adds significantly to the capital costs of construction. The development of a new mine requires successful completion of a major permitting process including extensive discussions with government regulatory bodies and communities affected by the new mine. This significant increase in the timeline and cost of developing projects is reflected in our business strategy by ensuring that we have a deep inventory of projects and internal resources to effectively manage and support each phase of new mine development.
| | | | |
| BARRICK YEAR-END 2011 | | 27 | | MANAGEMENT’S DISCUSSION AND ANALYSIS |
Our Capital Projects group utilizes a formal system to govern advancement of our large projects through the development process, up to and including the commissioning of new mines, at which point responsibility for mine operations is handed over to the relevant operating business unit. This disciplined system of standards and procedures, which includes the involvement of multiple functional groups, enhances the study quality and consistency; and enables the development of mitigation plans where necessary, thereby improving the overall certainty of project delivery on schedule and on budget. Over the past eight years, we have built seven new projects on time and near budget, namely Tulawaka, Lagunas Norte, Veladero, Cowal, Ruby Hill, Buzwagi and Cortez Hills. This experience will support commissioning the three projects currently in construction (Pueblo Viejo, Jabal Sayid and Pascua-Lama), over the next two years.
Liquidity and Capital Structure
We actively manage our liquidity and capital structure by monitoring our balance sheet debt to capitalization and debt coverage ratios such as net debt to equity and net debt-to-total capitalization ratios. We utilize combinations of proceeds from operating cash flow and debt financings to fund investments in capital expenditures and acquisitions. We also put in place undrawn credit facilities that provide the flexibility to manage through periods of volatile commodity prices while ensuring funding is available for major capital projects. Operating cash flow is a key driver of our liquidity and is dependent on prices realized from gold and copper sales, production levels, production costs, exploration costs, payments for income taxes and interest and other factors. Our strong operating cash flow generation, primarily driven by rising gold and copper prices, has enabled us to fund significant investments during the past two years in capital projects and expansion projects at existing major mines while maintaining our strong financial position. We have the only A-rated balance sheet in the gold mining industry and our credit ratings have remained stable. We were able to obtain low-cost financing in order to partially finance the acquisition of Equinox. In January 2012, we secured a credit facility of $4 billion, which matures in 2017, to replace our $2 billion facility that was scheduled to mature in 2016 and also to augment our overall credit capacity. Coincident with this agreement becoming effective, we terminated our $2 billion facility that was obtained in April 2011 and transferred the $1 billion drawn on the $2 billion facility to the new $4 billion facility.
Risk Factor: Our revenues are primarily derived from the sale of gold and copper and the market prices of these metals can fluctuate widely due to macroeconomic factors that are beyond our control. Our operating results and financial condition also depend significantly on other commodity prices and foreign exchange rates, which are largely dependent on worldwide economic conditions outside of our control.
Our shareholders want full exposure to changes in the gold price, and consequently all of our future gold production is unhedged. Our corporate treasury function implements hedging strategies on an opportunistic basis to protect us from downside price risk on our copper production. We also actively hedge foreign exchange risk for key input commodities such as fuel. Please see pages 32 to 34 of this MD&A for a description of our exposures and mitigation strategies for these risks.
License to Operate
Our license to operate is a critical asset and contributes directly to the achievement of our strategic objectives and value creation for our shareholders.
Risk Factor: In order to maintain our license to operate, it is essential that we:
| | • | | Ensure every person goes home safe and healthy every day; |
| | • | | Actively review talent and develop people for the future; |
| | • | | Manage our reputation proactively; |
| | • | | Are a partner welcomed in the communities where we operate; |
| | • | | Protect the environment; |
| | • | | Maintain good relations with governments and other stakeholders; |
| | • | | Comply with all regulatory standards; and |
| | • | | Conduct our business in an ethical manner. |
In order to mitigate risks associated with our license to operate, Barrick places a strong focus on CSR and safety and environmental performance, a summary of which is provided below.
Corporate Social Responsibility
At Barrick, we approach CSR as an opportunity to create mutual benefit and value for our diverse stakeholders, including the communities where we operate, our shareholders and our employees. Doing so helps ensure we continue to be partners welcomed in these communities.
| | | | |
| BARRICK YEAR-END 2011 | | 28 | | MANAGEMENT’S DISCUSSION AND ANALYSIS |
In 2011, for the fourth straight year, Barrick was named to the Dow Jones Sustainability World Index, and for the fifth year, to the North American Index. The renewed listing on the index reinforces Barrick's position among the most sustainability-driven companies in the world. Our work in CSR is one of continuous improvement, and in 2012 we will maintain our focus on this key strategic objective.
We have completed the development of our Community Relations Management System (“CRMS”), which aims to ensure our community relations activities and initiatives are carried out in a systematic manner across the Company, consistent with international best practice. Securing and maintaining our social license to operate depends on our ability to listen actively and respond in a timely manner to issues of material importance to our key stakeholders. To this end, one of our top priorities in implementing the CRMS has been to ensure that all operations have an effective grievance mechanism process. By the end of 2012, all communities where we operate will have access to a simple and culturally sensitive process through which they can provide feedback and seek resolution to legitimate concerns.
Barrick was the first Canadian mining company to become a member of the Voluntary Principles on Security and Human Rights (“Voluntary Principles”). The Voluntary Principles were developed by a group comprised of national governments, non-governmental organizations and companies in the extractive and energy sector. They guide and dictate our engagement with host nation military and police representatives that provide external security and response assistance, ensuring that human rights principles are reinforced in contractual requirements, guidelines on the use of force, relevant training, and in other relevant areas. In geopolitically complex regions, Barrick’s security personnel receive mandatory human rights training and training in the requirements of the Voluntary Principles.
We are also in the process of developing our formal human rights compliance program. This program is designed to take into account best practices across all industries, including the extractive sector. It will be designed to cover all operations, employees, and third party service providers, on a global basis. Our active role in these programs ensure we are part of the evolving effort on improving the industry’s performance on human rights and security.
Safety and Environmental Performance
Responsible environmental management is central to our success as a leading gold mining company. Our
Environmental Management System has been fully implemented at twenty of our mines, with full implementation at the remaining six mines to be completed in 2012. By the end of 2011, Barrick had achieved International Cyanide Management Code certification at 22 of the 23 of our mines which use cyanide, and we expect to achieve full certification in 2012.
We recognize the risks that climate change poses to society and to our long-term success. To address these risks, our Climate Change Standard has been implemented in all our regions. The Standard focuses on energy efficiency and the greater use of renewable energy to reduce our carbon footprint and allow us to remain competitive in a carbon-constrained world. We are continuing our efforts to use more renewable energy. In 2011, we inaugurated the Punta Colorada wind farm in Chile, joining our solar farm in Nevada, and our wind turbine, located at the Veladero mine in Argentina, as alternative energy sources built and operated by Barrick.
Water is essential for all of our operations, as well as for the communities where we operate, and therefore water availability is a critical concern. We are focused on using water wisely and managing it as a community resource, respecting the rights of other water users. We have implemented our Water Conservation Standard at all of our operations. In 2011, approximately 30 percent of our water intake was brackish or saline rather than fresh water. We also recycle water through the processing systems at most of our operations, reusing it many times over. Nineteen of our mines are zero water discharge operations, with all water recycled and reused on site and we continue to look for more ways to reduce water consumption.
Managing land effectively is an essential component of our commitment to responsible mining. Effective land management involves exercising good land stewardship at our operations throughout their life cycle, providing erosion control, practicing concurrent reclamation, protecting land with high conservation value, mitigating impacts where avoiding them is not possible, and planning for mine closure during mine development. This approach reduces our impact on the land during the life of a mine and helps achieve a successful closure once mining has ceased.
At Barrick we believe that the safety, health and well-being of our workers and their families is of paramount importance. Our safety and health vision is: “Every person going home safe and healthy every day”.
| | | | |
| BARRICK YEAR-END 2011 | | 29 | | MANAGEMENT’S DISCUSSION AND ANALYSIS |
For us to succeed in fulfilling this vision, we:
| • | | Provide the expertise and resources needed to maintain safe and healthy working environments; |
| • | | Establish clearly defined safety and occupational health programs and measure safety and health performance, making improvements as warranted; |
| • | | Operate in accordance with recognized industry standards, while complying with applicable regulations; |
| • | | Investigate the causes of accidents and incidents and develop effective preventative and remedial action; |
| • | | Train employees to carry out their jobs safely and productively; |
| • | | Maintain a high degree of emergency preparedness; and |
| • | | Require that vendors and contractors comply with our applicable safety and health standards. |
Market Review
Gold and Copper
The market prices of gold and copper are the primary drivers of our profitability and our ability to generate free cash flow for our shareholders. The prices of gold and copper are subject to volatile price movements over short periods of time and are affected by numerous industry and macroeconomic factors that are beyond our control. Gold price volatility remained historically high in 2011, with the price ranging from $1,319 per ounce to an all-time nominal high of $1,921 per ounce. The average market price for the year of $1,572 per ounce was also a record and represented a 28% increase over 2010. Gold has continued to attract investor interest due to sovereign debt concerns and very accommodative monetary policies by some of the world’s most prominent central banks, resulting in gold performing its traditional role as a store of value and an alternative to fiat currency. The continuing uncertain macroeconomic environment and loose monetary policies, together with the limited choice of alternative safe haven investments, is supportive of continued strong investment demand. Throughout 2011, we have continued to see increased interest in holding gold as an investment. This was evidenced by the growth in Exchange Traded Funds (“ETFs”), which increased by 5 million ounces to a total of 77 million ounces, as well as the worldwide demand for physical gold in forms such as bars and coins. Physical demand for gold for jewelry and other uses also remains a significant driver of the overall gold market. A continuation of these trends is supportive of higher gold prices.
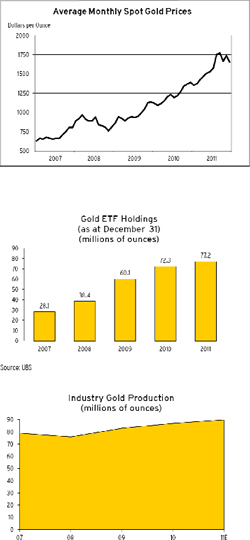
Source: Thomson Reuters GFMS
| | | | |
| BARRICK YEAR-END 2011 | | 30 | | MANAGEMENT’S DISCUSSION AND ANALYSIS |
Gold prices also continue to be influenced by long-term trends in global gold mine production and the impact of central bank gold activities. Gold production has increased in recent years with the extension of the lives of older mines due to the rising gold price. The time requirement to bring projects to the production stage and the increasing costs and risks of building a mine, including concerns of resource nationalism and lengthened permitting processes, are expected to slow the pace of new production in future years.
The International Monetary Fund (“IMF”) completed its previously announced and approved sale of gold in late 2010. No other significant seller of gold has emerged from the official sector since that time. In the second year of the Central Bank Gold Agreement (“CBGA”), which ended in September 2011, the signatory members sold 1 tonne of gold, or less than 1% of the maximum agreed amount. In addition, for the second consecutive year, global central banks were net buyers of gold in 2011, with the central banks of Mexico, Russia, Turkey, Thailand and South Korea, among others, adding to their gold reserves.
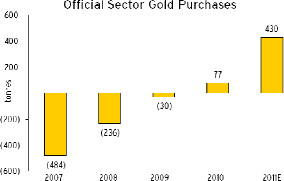
Source: World Gold Council and Thomson Reuters GFMS
The reserve gold holdings as a percentage of total reserves of emerging market countries, such as the BRIC countries (Brazil, Russia, India, and China), are significantly lower than other developed countries. The central banks of these developing economies hold a significant portion of their reserves in US dollar government assets and, as they identify a need to diversify their portfolio and reduce their exposure to the US dollar, we believe that gold will be one of the main beneficiaries. In conjunction with the very low amount of gold sold under the CBGA quota, which is expected to continue in the current year of the agreement, the net purchases of gold by global central
banks provide a strong indication that gold is viewed as a reserve asset and a de facto currency.
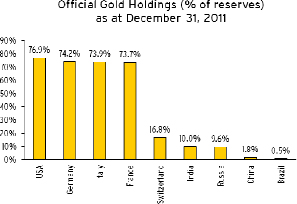
Source: World Gold Council
Copper prices experienced a volatile year, as London Metals Exchange (“LME”) copper prices traded in a wide range of $3.01 per pound to an all-time high of $4.62 per pound, averaged $4.00 per pound, and closed the year at $3.43 per pound. Copper’s rise to an all-time high occurred mainly as a result of strong demand from emerging markets, especially China, a physical deficit and continually increasing investor interest in base metals with strong forward-looking supply/demand fundamentals. Copper prices should continue to be positively influenced by demand from Asia, global economic growth, the limited availability of scrap metal and lower production levels of mines and smelters in the future.
We have put in place floor protection on approximately half of our expected copper production for 2012 at an average price of $3.75 per pound and have full participation to any upside in copper prices. Our realized price on all 2012 copper production is expected to be reduced by approximately $0.13 per pound as a result of the net premium paid on option hedging strategies. Our remaining copper production is subject to market prices.
| | | | |
| BARRICK YEAR-END 2011 | | 31 | | MANAGEMENT’S DISCUSSION AND ANALYSIS |
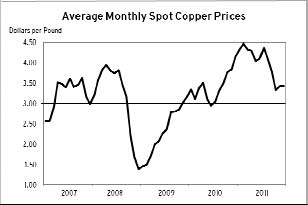
Silver
Silver traded in a wide range of $26.07 per ounce to $49.79 per ounce in 2011, averaged an all-time high of $35.12 per ounce and closed the year at $28.18 per ounce. Despite weak industrial demand, silver managed to rise during the year to a 31-year high due to similar factors influencing investment demand for gold. The physical silver market is currently in surplus and with the continuing global economic growth expected to improve industrial demand, while investor interest continues to be price supportive.
Silver prices do not significantly impact our current operating earnings, cash flows or gold total cash costs. Silver prices, however, will have a significant impact on the overall economics for our Pascua-Lama project, which is currently in the construction phase. In the first five full years of production, Pascua-Lama is expected to produce an average of 35 million ounces of silver per annum.
Utilizing option collar strategies, we have hedge protection on a total of 45 million ounces of expected silver production from 2013 to 2018, inclusive, with an average floor price of $23 per ounce and an average ceiling price of $57 per ounce.
In 2009, we entered into a transaction with Silver Wheaton Corp. (“Silver Wheaton”) whereby we sold 25% of the life of mine Pascua-Lama silver production from the later of January 1, 2014 or completion of project construction, and 100% of silver production from the Lagunas Norte, Pierina and Veladero mines until that time. Silver Wheaton will make up-front payments totaling $625 million ($488 million received as at December 31, 2011). Silver Wheaton will also make ongoing payments of $3.90 per ounce in cash (subject to a 1% annual inflation adjustment starting three years after completing construction at Pascua-Lama) for each ounce of silver delivered under the agreement.
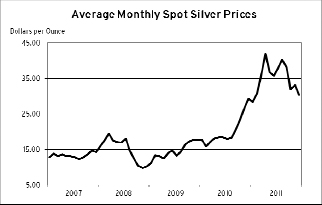
Currency Exchange Rates
The results of our mining operations outside of the United States are affected by US dollar exchange rates. The largest single exposure we have is to the Australian dollar/US dollar exchange rate. We also have exposure to the Canadian dollar through a combination of Canadian mine operating costs and corporate administration costs and exposure to the Chilean peso as a result of the construction of our Pascua-Lama project and Chilean mine operating costs. In addition, we have exposure to the Papua New Guinea kina, Peruvian sol, Zambian kwacha and Argentinean peso through mine operating and capital costs.
Fluctuations in the US dollar increase the volatility of our costs reported in US dollars, subject to protection that we have put in place through our currency hedging program. Australia, Canada and Chile each continue to emerge from the global economic crisis better than many other OECD countries. As a result, the Australian dollar, Canadian dollar and Chilean peso traded at historically strong levels during the year against the currencies of larger developed economies, including the US dollar and Euro. In 2011, the Australian dollar traded in a range of $0.94 to $1.11 against the US dollar, while the US dollar against the Canadian dollar and Chilean peso yielded ranges of $0.94 to $1.07 and CLP455 to CLP536, respectively.
About 60% of our consolidated production costs are denominated in US dollars and are not exposed to fluctuations in US dollar exchange rates. For the remaining portion, our currency hedge position allows for more accurate forecasting of our anticipated expenditures in US dollar terms and mitigates our exposure to volatility in the US dollar. Our currency hedge position has provided benefits to us in the form of hedge gains recorded within our operating costs when contract exchange rates are compared to prevailing market exchange rates as follows: 2011 - $344
| | | | |
| BARRICK YEAR-END 2011 | | 32 | | MANAGEMENT’S DISCUSSION AND ANALYSIS |
million; 2010 - $146 million; and 2009 - $27 million (US GAAP). As a result of the gains from our currency hedging program, total cash costs were reduced by $46 per ounce in 2011. Also for 2011, we recorded currency hedge gains in our corporate administration costs of $24 million (2010 - $33 million gain and 2009 - $7 million loss (US GAAP)) and capitalized additional currency hedge gains of $64 million (2010 - $13 million and 2009 - $3 million (US GAAP)).
Our average hedge rates vary depending on when the contracts were put in place. We have hedged approximately AUD $1.7 billion, CAD $500 million and CLP 300 billion in 2012 for expected Australian, Canadian and Chilean operating costs, including Canadian corporate administrative costs and sustaining and eligible project capital expenditures at average rates of $0.81, $1.01 and 516, respectively. As a result, for 2012, we are almost fully hedged for each of our expected Australian dollar, Canadian dollar and Chilean peso expenditures. Assuming market exchange rates at the December 31, 2011 levels of AUD $1.02 against the US dollar and $1.02 and CLP520 for the US dollar against the Canadian dollar and Chilean peso, respectively, we expect to record gains on our operating expenditures of approximately $300 million in 2012, primarily related to our Australian dollar hedges, or about $40 per ounce based on total forecasted 2012 production. Beyond 2012, we have hedge protection in place for about 40% of our Australian dollar operating exposures through 2016. Further information on our currency hedge positions is included in note 22 to the consolidated financial statements.
AUD Currency Contracts
| | | | | | | | | | | | | | | | |
| | | Contracts
(AUD millions) | | | Effective
Average Hedge
Rate (AUDUSD) | | | % of Total
Expected
AUD Exposure1
Hedged | | | % of Expected
Operating Cost
Exposure
Hedged | |
2012 | | | 1,657 | | | | 0.81 | | | | 93% | | | | 100% | |
2013 | | | 967 | | | | 0.74 | | | | 54% | | | | 69% | |
2014 | | | 673 | | | | 0.80 | | | | 43% | | | | 54% | |
2015 | | | 487 | | | | 0.92 | | | | 37% | | | | 41% | |
2016 | | | 287 | | | | 0.90 | | | | 27% | | | | 31% | |
| | | | | | | | | | | | | | | | |
| CAD Currency Contracts | |
| | | Contracts
(CAD millions)2 | | | Effective Average Hedge
Rate (USDCAD) | | | % of Total
Expected
CAD Exposure1
Hedged | | | % of Expected
Operating Cost
Exposure
Hedged | |
2012 | | | 463 | | | | 1.01 | | | | 93% | | | | 100% | |
2013 | | | 304 | | | | 1.02 | | | | 58% | | | | 100% | |
|
| CLP Currency Contracts | |
| | | Contracts
(CLP millions)3 | | | Effective Average Hedge
Rate (USDCLP) | | | % of Total
Expected
CLP Exposure1
Hedged | | | % of Expected
Operating Cost
Exposure
Hedged | |
2012 | | | 289,789 | | | | 516 | | | | 96% | | | | 100% | |
2013 | | | 223,325 | | | | 513 | | | | 69% | | | | 100% | |
2014 | | | 287,016 | | | | 509 | | | | 78% | | | | 100% | |
| 1 | Includes all forecasted operating, administrative sustainable and eligible project capital expenditures. |
| 2 | Includes $266 million CAD contracts with a cap and floor of $0.98 and $1.07, respectively. |
| 3 | Includes CLP 638,460 million collar contracts that are an economic hedge of operating and administrative and capital expenditures at various South American sites and at our Pascua-Lama project with a cap and floor of 505 and 581, respectively. |
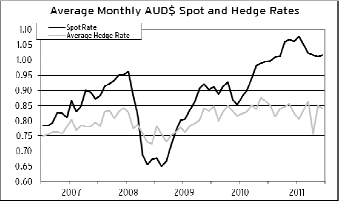
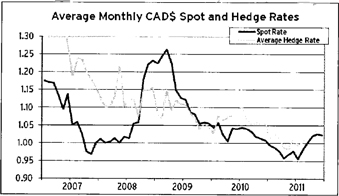
| | | | |
| BARRICK YEAR-END 2011 | | 33 | | MANAGEMENT’S DISCUSSION AND ANALYSIS |
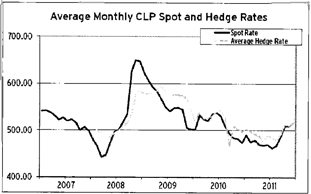
Fuel
For 2011, the price of West Texas Intermediate (“WTI”) crude oil traded between $75 and $115 per barrel, averaged $95 per barrel and closed the year at $99 per barrel. Geopolitical tensions in certain oil-producing nations, emerging market demand, concerns over global economic growth and the release of oil by the member countries of the International Energy Agency combined to create a volatile environment for the price of oil during the year.
On average we consume approximately 4.5 million barrels of diesel fuel annually across all our operating mines. Diesel fuel is refined from crude oil and is therefore subject to the same price volatility affecting crude oil prices. Therefore, volatility in crude prices has a significant direct and indirect impact on our production costs. To mitigate this volatility, we employ a strategy of combining the use of financial contracts and our production from Barrick Energy to effectively hedge our exposure to oil prices. We currently have financial contracts in place totaling 5.0 million barrels over the next three years. In 2011, we recorded hedge gains in earnings of approximately $48 million on our fuel hedge positions (2010: $26 million loss and 2009: $97 million (US GAAP) loss). Assuming market rates at the December 31, 2011 level of $99 per barrel, we expect to realize hedge gains of approximately $20 million in 2012 from our financial fuel contracts.
In 2012, we expect Barrick Energy to produce about 3.7 million boe. The net contribution from Barrick Energy’s production is expected to provide a natural offset equivalent to about 1.8 million barrels of fuel. The Barrick Energy contribution, along with our financial hedges, provide hedge protection for approximately 80% of our estimated fuel consumption for 2012.
Financial Fuel Hedge Summary
| | | | | | | | | | | | |
| | | Barrels1
(thousands) | | | Average Price | | | % of Expected
Exposure | |
2012 | | | 2,052 | | | $ | 105 | | | | 46% | |
2013 | | | 1,910 | | | | 87 | | | | 41% | |
2014 | | | 1,020 | | | | 96 | | | | 24% | |
| | | | 4,982 | | | $ | 96 | | | | 40% | |
| 1 | Refers to contracts for a combination of WTI, BRENT, ULSD, WTB, MOPS and JET. Products other than WTI and BRENT have market prices in excess of crude due to refining and location premiums. As a result, our average price on hedged barrels for 2012 – 2014 is $89 per barrel on a WTI-equivalent basis. |
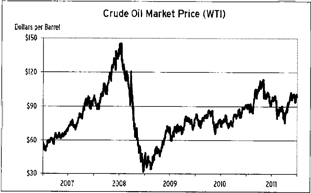
US Dollar Interest Rates
Beginning in 2008, in response to the contraction of global credit markets and in an effort to spur economic activity and avoid potential deflation, the US Federal Reserve reduced its benchmark rate to between 0% and 0.25%. The benchmark was kept at this level through 2011. We expect that short-term rates will remain at low levels into 2014, with the US Federal Reserve continuing to use monetary policy initiatives in an effort to keep long-term interest rates low and increase employment. We expect such initiatives to be followed by incremental increases to short-term rates once economic conditions and credit markets normalize.
At present, our interest rate exposure mainly relates to interest receipts on our cash balances ($2.7 billion at the end of the year); the mark-to-market value of derivative instruments; the fair value and ongoing payments under US dollar interest-rate swaps; and to the interest payments on our variable-rate debt ($3.6 billion at December 31, 2011). Currently, the amount of interest expense recorded in our consolidated statement of income is not materially impacted by changes in interest rates, because the majority of debt was issued at fixed interest rates. The relative amounts of variable-rate financial assets and liabilities may change in the future, depending on the amount of operating cash flow we generate, as well as the level of capital expenditures and our ability to borrow on favorable terms using fixed rate debt instruments.
| | | | |
| BARRICK YEAR-END 2011 | | 34 | | MANAGEMENT’S DISCUSSION AND ANALYSIS |
The upward-sloping US yield curve has a significant impact on the net amount of interest expense since our debt issuances were set at predominantly 5-year to 30-year interest rates, while our cash and equivalent balances are generating interest income at much lower rates in the 1 to 90 day range.
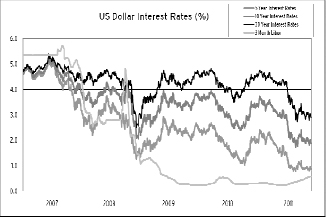
| | | | |
| BARRICK YEAR-END 2011 | | 35 | | MANAGEMENT’S DISCUSSION AND ANALYSIS |
FINANCIAL AND OPERATING RESULTS
Summary of Financial Performance1
($ millions, except per share data in dollars)
| | | | | | | | | | | | | | | | | | | | |
| | | IFRS | | | | | | | | | US GAAP | |
| For the years ended December 31 | | 2011 | | | 2010 | | | $ change | | | % change | | | 2009 | |
Revenues | | | $ 14,312 | | | | $ 11,001 | | | | $ 3,311 | | | | 30% | | | | $8,404 | |
Net earnings | | | 4,484 | | | | 3,582 | | | | 902 | | | | 25% | | | | (4,274) | |
Per share2 | | | 4.49 | | | | 3.63 | | | | 0.86 | | | | 24% | | | | (4.73) | |
Adjusted net earnings3 | | | 4,666 | | | | 3,517 | | | | 1,149 | | | | 33% | | | | 1,810 | |
Per share2,3 | | | 4.67 | | | | 3.56 | | | | 1.11 | | | | 31% | | | | 2.00 | |
EBITDA3 | | | 8,376 | | | | 6,521 | | | | 1,855 | | | | 28% | | | | (2,563) | |
Operating cash flow | | | 5,315 | | | | 4,585 | | | | 730 | | | | 16% | | | | (2,322) | |
Adjusted operating cash flow3 | | | 5,680 | | | | 5,241 | | | | 439 | | | | 8% | | | | 2,899 | |
Free cash flow3 | | | $ 1,082 | | | | $ 1,870 | | | | $ (788) | | | | (42%) | | | | $ 833 | |
| 1 | The amounts presented in this table include the results of discontinued operations. |
| 2 | Calculated using weighted average number of shares outstanding under the basic method. |
| 3 | Adjusted net earnings, adjusted EPS, EBITDA, adjusted operating cash flow and free cash flow are non-GAAP financial performance measures with no standard meaning under IFRS. For further information and a detailed reconciliation, please see pages 72 - 79 of this MD&A. |
In 2011, we recorded net earnings of $4,484 million compared to net earnings of $3,582 million in the prior year. Adjusted net earnings were $4,666 million, compared to $3,517 million in 2010. The increases in net earnings and adjusted net earnings were primarily driven by higher realized gold and copper prices, higher copper sales volumes; partially offset by lower gold sales volumes, higher income tax expense and higher cost of sales applicable to gold and copper.
The significant post-tax adjusting items in 2011 include: $97 million in acquisition-related costs, including inventory purchase accounting adjustments attributable to the Equinox acquisition; $165 million in impairment charges, which include write-downs on our available-for-sale investments ($85 million), asset impairment charges in our oil & gas business ($37 million) and on certain power-related assets at our Pueblo Viejo project ($47 million); $122 million in non-recurring tax expense; and a $23 million charge for the recognition of a liability for contingent consideration related to the acquisition of an additional 40% interest in the Cortez property in 2008 that was previously held by Kennecott Explorations (Australia) Ltd, a subsidiary of Rio Tinto plc. These charges were partially offset by $188 million in gains from the sale of assets and $66 million in unrealized gains on non-hedge derivative instruments.
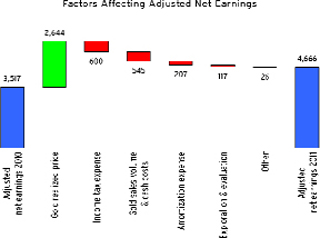
EBITDA was $8,376 million in 2011, compared to EBITDA of $6,521 million in the prior year. The significant increase in EBITDA primarily reflects the increase in pre-tax earnings. EPS and adjusted EPS for the year ended December 31, 2011 were $4.49 and $4.67, up 24% and 31%, respectively, compared to the same prior year period due to higher net earnings and adjusted net earnings.
| | | | | | | | |
| Summary of Cash Flow Performance | | | | | | |
| ($ millions) | | | | | | |
| For the years ended December 31 | | 2011 | | | 2010 | |
| Operating cash flow | | | $5,315 | | | | $4,585 | |
| Adjusted operating cash flow | | | $5,680 | | | | $5,241 | |
| Adjusted operating cash flow before working capital changes | | | $5,819 | | | | $5,242 | |
| | | | |
| BARRICK YEAR-END 2011 | | 36 | | MANAGEMENT’S DISCUSSION AND ANALYSIS |
Operating cash flow was $5,315 million in 2011 compared to $4,585 million in the prior year. 2010 operating cash flow reflects payments related to the settlement of gold sales contracts of $656 million. In 2011, significant items that impact operating cash flow include non-recurring payments related to the Equinox acquisition of $204 million, and non-recurring withholding tax payments of $161 million. Adjusted operating cash flow, which excludes the impact of these payments, totaled $5,680 million in 2011 compared to $5,241 million in the prior year. The increases in operating cash flow and adjusted operating cash flow were primarily due to higher net earnings levels, partially offset by higher income tax payments, including tax payments totaling about $480 million made in 2011 related to the final 2010 income tax liability, and the impact of working capital changes. Adjusted operating cash flow before changes in working capital was $5,819 million, up 11% from the prior year.
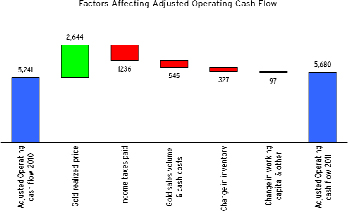
Summary of Operating Performance1
| | | | | | | | | | | | | | | | | | | | | | | | |
| ($ millions, except per ounce/pound data in dollars) | | Gold | | | Copper | |
| | | IFRS | | | US GAAP | | | IFRS | | | US GAAP | |
| For the years ended December 31 | | 2011 | | | 2010 | | | 2009 | | | 2011 | | | 2010 | | | 2009 | |
Production (000s oz/millions of lbs)2 | | | 7,676 | | | | 7,765 | | | | 7,397 | | | | 451 | | | | 368 | | | | 393 | |
Revenues | | | | | | | | | | | | | | | | | | | | | | | | |
000s oz/millions lbs | | | 7,550 | | | | 7,742 | | | | 7,279 | | | | 444 | | | | 391 | | | | 380 | |
$ millions3 | | | $ 12,263 | | | | $ 9,730 | | | | $ 7,191 | | | | $ 1,714 | | | | $ 1,300 | | | | $ 1,155 | |
Market price4 | | | 1,572 | | | | 1,225 | | | | 972 | | | | 4.00 | | | | 3.42 | | | | 2.34 | |
Realized price4,5 | | | 1,578 | | | | 1,228 | | | | 985 | | | | 3.82 | | | | 3.41 | | | | 3.16 | |
Cost of sales ($ millions) | | | 5,177 | | | | 4,618 | | | | 3,431 | | | | 983 | | | | 430 | | | | 444 | |
Total cash costs ($ millions)2,4,5 | | | 460 | | | | 409 | | | | 464 | | | | $ 1.75 | | | | $ 1.10 | | | | $ 1.17 | |
Net cash costs ($ millions)2,4,5 | | | $ 339 | | | | $ 293 | | | | $ 360 | | | | | | | | | | | | | |
| 1 | The amounts presented in this table include the results of discontinued operations. |
| 2 | Reflects our equity share of production. |
| 3 | Represents revenues on a 100% consolidated basis. |
| 4 | Per ounce/pound weighted average. |
| 5 | Realized price, total cash costs and net cash costs are non-GAAP financial performance measures with no standard meaning under IFRS. For further information and a detailed reconciliation, please see pages 72 - 79 of this MD&A. |
| | | | |
| BARRICK YEAR-END 2011 | | 37 | | MANAGEMENT’S DISCUSSION AND ANALYSIS |
Revenues
In 2011, gold and copper revenues totaled $12,263 million and $1,714 million, respectively, up 26% and 32% compared to the prior year, primarily due to higher realized gold and copper prices and higher copper sales volumes, partially offset by lower gold sales volumes. The increase in copper sales volumes for the year ended December 31, 2011 reflects production from Lumwana, which was acquired as part of the Equinox transaction on June 1, 2011, partially offset by lower production from Zaldívar and the divestiture of Osborne in third quarter 2010.
Realized gold prices of $1,578 per ounce in 2011 were up $350 per ounce, or 29%, compared to the prior year, reflecting the increase in market gold prices, which averaged $1,572 per ounce in 2011, compared to $1,225 per ounce in 2010. Realized copper prices were 12% higher than the prior year, primarily due to the 17% increase in market copper prices.
Cost of sales
Cost of sales applicable to gold was $5.2 billion in 2011, up 12%, compared to the prior year. This included depreciation expense of $1,152 in 2011 as compared to depreciation expense of $1,077 in 2010. The increase reflects higher direct mining costs, particularly higher labor, energy, maintenance and consumable costs, partially offset by an increase in capitalized production phase stripping costs.
Cost of sales applicable to copper was $983 million, including depreciation expense of $170 million in 2011, up 129% compared to the $430 million, including depreciation expense of $88 million, recorded in the prior year. The increase reflects the impact of including production from Lumwana beginning on June 1, 2011, and higher direct mining costs at Zaldívar, primarily due to higher power and sulfuric acid prices; partially offset by lower copper sales volumes at Zaldívar and the impact of the divestiture of Osborne at the end of third quarter 2010.
Total cash costs and net cash costs
Gold total cash costs were $460 per ounce in 2011, up 12% compared to the $409 per ounce recorded in the prior year. The increase reflects the same factors impacting cost of sales applicable to gold, as well as the impact of lower production levels in South America, our lowest-cost RBU, which resulted in higher consolidated unit production costs. For the year, total cash costs per ounce were at the low end of our 2011 guidance range of $460 to $475 per ounce, mainly as a result of changes in our production mix, with lower cost mine sites contributing a greater share of total company production in fourth quarter 2011.
Copper total cash costs were $1.75 per pound in 2011, up 59% compared to $1.10 per pound in 2010 and slightly higher than our most recent 2011 guidance range of $1.60 to $1.70 per pound. The increase reflects the higher unit production costs at Lumwana, as well as the higher costs at Zaldívar due to the impact of lower average grades on production levels.
Net cash costs were $339 per ounce in 2011, up 16% compared to the $293 per ounce recorded in the prior year. The increase reflects higher gold total cash costs per ounce, which was partially offset by higher copper credits due to higher realized copper prices and higher copper sales volumes.
Net cash margins
Net cash margins per ounce illustrate the trends in profitability and the impact of fluctuations in realized prices and net cash costs on our ability to generate earnings and operating cash flow.
Net cash margins per ounce increased 33% in 2011, largely due to the rise in gold prices partially offset by the increase in net cash costs.
| | | | |
| BARRICK YEAR-END 2011 | | 38 | | MANAGEMENT’S DISCUSSION AND ANALYSIS |
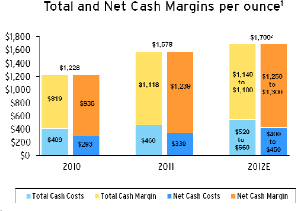
| 1 | Total cash costs, total cash margin, net cash costs and net cash margin are non-GAAP financial performance measures with no standard definition under IFRS. |
For further information and a detailed reconciliation, please see pages 72 – 79 of this MD&A.
| 2 | We have assumed a gold price of $1,700 per ounce, which is consistent with current market prices. This assumption does not represent a forecast of what we expect gold prices to be in 2012. |
Other operating expenses
Other expense was $576 million in 2011, up 27% compared to the $455 million recorded in the prior year. The increase is primarily due to higher RBU costs; higher corporate social responsibility costs; an increase in the provision for environmental rehabilitation due to changes in discount rates at some of our closed mines; a $39 million charge for the recognition of a liability for contingent consideration related to the acquisition of the additional 40% of the Cortez property in 2008; and acquisition-related costs for the Equinox transaction, partially offset by lower currency translation losses and lower severance and other restructuring costs.
Exploration and Evaluation
| | | | | | | | |
| (in $ millions) | | | | | | |
| For the years ended December 31 | | 2011 | | | 2010 | |
Exploration: | | | | | | | | |
Minesite programs | | | $ 72 | | | | $ 51 | |
Global programs | | | 145 | | | | 103 | |
Evaluation costs | | | 129 | | | | 75 | |
Exploration and evaluation expense | | | $ 346 | | | | $ 229 | |
Exploration and evaluation expense was $346 million in 2011, up 51% compared to $229 million in 2010. The increase is primarily due to increased minesite and global exploration and an increase in evaluation expenditures. Minesite exploration expenditures increased primarily due to increased exploration activities at Cowal and Granny Smith as well as at ABG. Exploration expenditures for the global programs increased due to increased expenditures at Cortez, Jabal Sayid and Lumwana. The evaluation expenditures
increase relates to mine expansion studies at Bald Mountain, Hemlo, Cowal, Pueblo Viejo and Porgera.
Interest Expense
| | | | | | | | |
| (in $ millions) | | | | | | |
| For the years ended December 31 | | 2011 | | | 2010 | |
Interest costs | | | | | | | | |
Incurred | | | $ 555 | | | | $ 425 | |
Capitalized | | | (408) | | | | (285) | |
Interest expensed | | | $ 147 | | | | $ 140 | |
Finance costs incurred in 2011 were $199 million, compared to $180 million in the prior year. Interest costs incurred were $555 million, up 31% compared to the $425 million in the prior year. The increase in interest costs incurred primarily relates to the Pueblo Viejo project financing, for which drawdowns began at the end of second quarter 2010, as well as interest incurred on debt issued and credit facilities drawn on to finance the Equinox acquisition in the second quarter of 2011. Interest capitalized increased in 2011 compared to the prior year primarily due to increased construction activity at our Pueblo Viejo and Pascua-Lama projects.
Impairment Charges
Impairment charges were $235 million, compared to impairment reversals of $73 million in 2010. The amount for 2011 included write-downs on our available-for-sale investments ($97 million); asset impairment charges on various properties in our oil & gas business ($49 million); and a write-down on certain power-related assets at our Pueblo Viejo project as a result of our decision to proceed with a new long-term power solution ($62 million) that is expected to provide lower long-term power costs. In 2010, the impairment reversal related to our equity investment in Highland Gold.
Income Tax
| | | | | | | | |
| (Percentages) | | | | | | |
| For the years ended December 31 | | 2011 | | | 2010 | |
Effective tax rate on ordinary income | | | 33% | | | | 31% | |
Impact of legislative amendment in Australia | | | - | | | | (1%) | |
Dividend withholding tax | | | 1% | | | | 1% | |
Actual effective tax rate | | | 34% | | | | 31% | |
Our effective tax rate on ordinary income increased from 31% to 34% in 2011 primarily due to the impact of changes in the mix of production and in the mix of taxable income in the various tax jurisdictions where we operate. The more significant items impacting income tax expense in 2011 and 2010 include the following:
| | | | |
| BARRICK YEAR-END 2011 | | 39 | | MANAGEMENT’S DISCUSSION AND ANALYSIS |
Currency Translation
Deferred tax balances are subject to remeasurement for changes in currency exchange rates each period. The most significant balances are Papua New Guinea deferred tax liabilities with a carrying amount of approximately $40 million, and Argentinean deferred tax liabilities with a carrying amount of approximately $257 million. In 2011 and 2010, the appreciation of the Papua New Guinea kina against the US dollar, and the weakening of the Argentinean peso against the US dollar resulted in net translation gains totaling $32 million and $19 million, respectively. These gains are included within deferred tax expense/recovery.
Dividend Withholding Tax
In 2011, we recorded an $87 million dollar dividend withholding current tax expense in respect of funds repatriated from foreign subsidiaries.
In 2010, we recorded a $74 million dollar dividend withholding current tax expense in respect of funds available to be repatriated from a foreign subsidiary.
Peruvian Tax Court Decision
On September 30, 2004, the Tax Court of Peru issued a decision in our favor in the matter of our appeal of a 2002 income tax assessment for an amount of $32 million, excluding interest and penalties. The assessment mainly related to the validity of a revaluation of the Pierina mining concession, which affected its tax basis for the years 1999 and 2000. The full life of mine effect on current and deferred income tax liabilities totalling $141 million was fully recorded at December 31, 2002, as well as other related costs of about $21 million.
In January 2005, we received written confirmation that there would be no appeal of the September 30, 2004 Tax Court of Peru decision. In December 2004, we recorded a $141 million reduction in current and deferred income tax liabilities and a $21 million reduction in other accrued costs. The confirmation concluded the administrative and judicial appeals process with resolution in Barrick’s favor.
Notwithstanding the favorable Tax Court decision we received in 2004 on the 1999 to 2000 revaluation matter, in an audit concluded in 2005, The Tax Administration in Peru (SUNAT) has reassessed us on the same issue for tax years 2001 to 2003. On October 19, 2007, SUNAT confirmed their reassessment. We filed an appeal to the Tax Court of Peru within the statutory period.
The Tax Court decision was rendered on August 15, 2011. The Tax Court ruled in our favor on substantially all material issues. However, based on the Tax Court decision, the timing of certain deductions would differ from the position taken on filing. As a result, we would incur interest and penalties in some years and earn refund interest income in other years. The Tax Administration (SUNAT) has since assessed us $100 million for this matter. However, we believe that the SUNAT amount is incorrect, and have appealed the assessment. After recomputing the liability, to reflect what we believe is the probable amount, we have recorded a current tax expense of $39 million in 2011 in respect of this matter.
On November 15, 2011 we appealed the Tax Court decision to the Judicial Court with respect to the timing of certain deductions for the Pierina mining concession. SUNAT also appealed the Tax Court decision to the Judicial Court.
Australian Functional Currency Election
In 2011, we filed an election in Australia to prepare certain of our Australian tax returns using US dollar functional currency effective January 1, 2011. This election resulted in a one-time deferred tax benefit of $4 million. Going forward, all material Australian tax returns will now be filed using a US dollar functional currency.
Impact of Legislative Amendments in Australia
In Australia, we elected to enter into the consolidated tax regime in 2004 (in 2002 for the former Placer Dome Inc. subsidiaries). At the time the elections were made, there were certain accrued gains that were required to be included in taxable income upon subsequent realization. In second quarter 2010, clarifying legislative amendments to the Australian consolidation tax rules were enacted. These amendments enable us to reduce the inclusion of certain of these accrued gains, resulting in a permanent decrease in taxable income. The impact of the amendment is a current tax recovery of $78 million recorded in 2010.
| | | | |
| BARRICK YEAR-END 2011 | | 40 | | MANAGEMENT’S DISCUSSION AND ANALYSIS |
Mining Overview1
| | | | | | | | | | | | | | | | |
| | | IFRS | | | US
GAAP | |
For the years ended
December 31 | | 2011 | | | 2010 | | | % Change | | | 2009 | |
Gold | | | | | | | | | | | | | | | | |
Ore tons mined (millions) | | | 151 | | | | 155 | | | | (3%) | | | | 174 | |
| Waste tons mined (millions) | | | 569 | | | | 539 | | | | 6% | | | | 555 | |
| Total tons mined (millions) | | | 720 | | | | 694 | | | | 4% | | | | 729 | |
| Ore tons processed (millions) | | | 162 | | | | 145 | | | | 12% | | | | 171 | |
Average grade (ozs/ton) | | | 0.056 | | | | 0.063 | | | | (11%) | | | | 0.052 | |
Recovery rate | | | 84.6% | | | | 85.0% | | | | - | | | | 83.2% | |
Gold produced (000s/oz) | | | 7,676 | | | | 7,765 | | | | (1%) | | | | 7,397 | |
Copper | | | | | | | | | | | | | | | | |
| Ore tons mined (millions) | | | 50 | | | | 48 | | | | 4% | | | | 50 | |
| Waste tons mined (millions) | | | 90 | | | | 24 | | | | 275% | | | | 30 | |
| Total tons mined (millions) | | | 140 | | | | 72 | | | | 94% | | | | 80 | |
| Ore tons processed (millions) | | | 63 | | | | 46 | | | | 37% | | | | 49 | |
| Average grade (percent) | | | 0.54 | | | | 0.60 | | | | (10%) | | | | 0.60 | |
| Copper produced (millions of lbs) | | | 451 | | | | 368 | | | | 23% | | | | 393 | |
| 1 | The amounts presented in this table include the results of discontinued operations. |
Production - Gold
Gold production in 2011 was slightly lower than the prior year, due to lower production in South America, Australia and ABG, partially offset by higher production in North America. Production of 7.676 million ounces was in line with our most recent guidance range of 7.6 to 7.8 million ounces, and within our original guidance range of 7.6 to 8.0 million ounces.
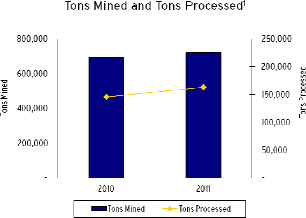
| 1 | All amounts presented are based on equity production. |
Tons Mined and Tons Processed - Gold
Total tons mined increased in 2011 by 4%, and tons processed increased by 12%, compared to the prior year. The increases were primarily due to increased mining activity at Bald Mountain, Lagunas Norte, Veladero, Yilgarn South and Kalgoorlie, partially offset by decreased mining activity at Goldstrike, Cortez, Golden Sunlight, Ruby Hill, Pierina, Porgera, Cowal and Buzwagi. The increase in ore tons processed was primarily due to increases at Bald Mountain, Golden Sunlight, Cortez, Veladero and Pierina. Higher tons were processed at Bald Mountain due to an ongoing mine expansion. At Golden Sunlight, higher tons were processed as it recommenced production in 2011 after an extended redevelopment phase. At Cortez, higher tons were processed in 2011 due to a drawdown of stockpiled ore.
Average Mill Head Grades - Gold
Average mill head grades decreased by approximately 11% in 2011 compared to the prior year, primarily due to lower ore grades from Cortez, Goldstrike, Cowal, North Mara and Veladero, partially offset by higher grades processed at Yilgarn South. In general, reserve grades have been trending downwards in recent years, partly as a result of rising gold prices which make it economic to process lower grade material.
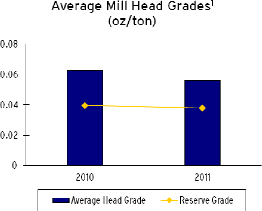
| 1 | All amounts presented based on equity production. Average mill head grades are expressed as the number of ounces of gold contained in a ton of ore processed. Reserve grade represents expected grade over the life of the mine and is calculated based on reserves reported at the end of the immediately preceding year. |
| | | | |
| BARRICK YEAR-END 2011 | | 41 | | MANAGEMENT’S DISCUSSION AND ANALYSIS |
Production - copper
Copper production in 2011 was 23% higher than the prior year, primarily due to production from Lumwana which was acquired as part of the Equinox transaction, partially offset by decreased production from Zaldívar and the impact of the Osborne divestiture in third quarter 2010. Production of 451 million pounds was in line with the lower end of our most recent guidance of approximately 450-460 million pounds.
Tons Mined and Tons Processed - Copper
Total tons mined increased in 2011 by 94%, and tons processed increased by 37%, compared to the prior year. The increases are primarily due to the acquisition of Lumwana on June 1, 2011, partially offset by a decrease in tons mined and processed at Zaldívar and the impact of the divestiture of Osborne in third quarter 2010.
Mineral Reserves and Mineral Resources Update14
At year-end 2011, we added 9 million ounces of proven and probable gold reserves. After depletion of 9 million ounces, proven and probable gold reserves was at 139.9 million ounces, still the largest in the industry, based on an assumed $1,20015 per ounce gold price. The increase primarily reflects reserve additions at Goldstrike, Cortez, Turquoise Ridge, Kalgoorlie, partially offset by a decrease in Porgera and Bulyanhulu. Contained silver within reported gold reserves is 1 billion ounces.
Measured and indicated gold mineral resources increased by 5% to 80.4 million ounces and inferred gold mineral resources increased 8% to 40.2 million ounces based on an assumed gold price of $1,400 per ounce.
Proven and probable copper reserves nearly doubled from 6.5 billion pounds to 12.7 billion pounds, measured and indicated copper resources rose 17% to 15.3 billion pounds and inferred copper resources increased 117% to 19.9 billion pounds based on a $2.75 per pound copper price and a $3.25 per pound copper price, respectively. The increases primarily reflect incremental reserves and resources due to the addition of Lumwana and Jabal Sayid, acquired as part of acquisition of Equinox on June 1, 2011.
Replacing gold and copper reserves depleted by production year over year is necessary in order to
| 14 | For a breakdown of reserves and resources by category and additional information relating to reserves and resources, see pages 161 to 166 of this Financial Report. |
| 15 | Reserves at Plutonic have been calculated using an assumed price of $1,250 per ounce. |
maintain production levels over the long-term. If depletion of reserves exceeds discoveries over the long-term, then we may not be able to sustain gold and copper production levels. Reserves can be replaced by expanding known ore bodies, acquiring mines or properties or discovering new deposits. Once a site with gold or copper mineralization is discovered, it takes many years from the initial phases of drilling until production is possible, during which time the economic feasibility of production may change. Substantial expenditures are required to establish proven and probable reserves and to permit and construct mining and processing facilities.
Review of Operating Segments Performance
Barrick’s business is organized into seven primary business units: four regional gold businesses, a global copper business, an oil and gas business, and a Capital Projects business. Barrick’s Chief Operating Decision Maker reviews the operating results, assesses performance and makes capital allocation decisions for each of these business operations at a business unit level. Therefore, these business units are operating segments for financial reporting purposes. In the fourth quarter 2011, Barrick established a global copper unit in order to maximize the value of the Company’s copper assets. This unit will be responsible for providing strategic direction and oversight of the copper business and ensuring that the Company realizes the business and operational synergies arising from the acquisition of Equinox. Our internal reporting structure has been revised to reflect this organizational change. Segment information for the years ended December 31, 2011 and 2010 has also been revised to reflect this organizational change. Segment performance is evaluated based on a number of measures including operating income before tax, production levels and unit production costs. Income tax, corporate administration, finance income and costs, impairment charges and reversals, investment write-downs and gains/losses on non-hedge derivatives are managed on a consolidated basis and are therefore not reflected in segment income.
| | | | |
| BARRICK YEAR-END 2011 | | 42 | | MANAGEMENT’S DISCUSSION AND ANALYSIS |
North America
Summary of Financial and Operating Data
| | | | | | | | | | | | | | | | |
| Summary of Financial and Operating Data | | | | | | | |
| | | IFRS | | | US GAAP | |
| For the years ended December 31 | | 2011 | | | 2010 | | | % Change | | | 2009 | |
| Total tons mined (millions) | | | 410 | | | | 396 | | | | 4% | | | | 397 | |
| Ore tons processed (millions) | | | 61 | | | | 44 | | | | 39% | | | | 64 | |
| Average grade (ozs/ton) | | | 0.065 | | | | 0.084 | | | | (23%) | | | | 0.053 | |
| Gold produced (000s/oz) | | | 3,382 | | | | 3,110 | | | | 9% | | | | 2,810 | |
| Cost of sales ($ millions) | | | $ 1,924 | | | | $ 1,812 | | | | 6% | | | | $ 1,421 | |
| Total cash costs (per oz) | | | $ 426 | | | | $ 429 | | | | (1%) | | | | $ 504 | |
| Segment income ($ millions)1 | | | $ 3,094 | | | | $ 1,837 | | | | 68% | | | | $ 897 | |
| Segment EBITDA ($ millions)2 | | | $ 3,585 | | | | $ 2,317 | | | | 55% | | | | $ 1,259 | |
| Capital expenditures ($ millions)3 | | | $ 854 | | | | $ 603 | | | | 42% | | | | $ 207 | |
| 1 | Segment income excludes income taxes. |
| 2 | EBITDA is a non-GAAP financial performance measure with no standardized meaning under IFRS. For further information and a detailed reconciliation, please see page 76 of this MD&A. |
| 3 | Amounts presented represent expenditures for minesite expansion, minesite sustaining as well as open pit and underground mine development on a cash basis excluding capitalized interest. |
Segment EBITDA and segment income for 2011 were $3,585 million and $3,094 million, an increase of 55% and 68%, respectively, over the prior year. The increases were primarily the result of higher realized gold prices and higher sales volume.
Gold production of 3.38 million ounces for 2011 was 9% higher than the prior year, and in line with the high end of our most recent regional guidance range of 3.30 to 3.40 million ounces. Higher production was mainly due to increased production at Cortez, Bald Mountain, Ruby Hill and Golden Sunlight, which recommenced producing gold in 2011 after an extended redevelopment phase. This increase was partially offset by lower production at Goldstrike.
Production at Cortez increased by 25% over 2010, mainly as a result of higher volumes processed; partially offset by lower head grades due to the impact of a full year production at the Cortez Hills open pit. Production at Bald Mountain increased by 58% mainly due to higher tons mined and processed as a result of an ongoing mine expansion. At Ruby Hill, production for year was up by 57% due to increase in refractory ore processed, which resulted in higher average head grades. At Goldstrike, production for the year was down by 12% primarily as a result of lower average head grades due to mine sequencing and lower throughput at the autoclave.
Cost of sales for 2011 increased by 6% over the prior year, primarily as a result of higher direct mining costs, particularly for labor and energy. The increase in direct mining costs was partially offset by an increase in capitalized production phase stripping costs at Goldstrike and Cortez. Total cash costs per ounce were $426, as compared to $429 in the prior year, and were in line with our most recent regional guidance range of $425 to $450 per ounce. Total cash costs were lower in 2011 due to the impact of higher production levels, particularly at Cortez, which was partially offset by the increase in direct mining costs.
In 2012, we expect gold production to be in the range of 3.425 to 3.60 million ounces. Production mix within North America is expected to change due to the commencement of operations at Pueblo Viejo in the Dominican Republic in the second half of the year and an increase in ore tons mined and processed at Goldstrike as the mine completed a substantial stripping phase towards the end of 2011. Production is also expected to be higher due to higher tons mined and processed at Bald Mountain due to the completion of a recent expansion in 2011, and higher ore grades at Golden Sunlight following the completion of an extended development period early in 2011. This is expected to be partially offset by lower production at Cortez due to a decline in open pit ore grade. Total cash costs are expected to be $475 to $525 per ounce, higher than 2011 levels of $426 per ounce primarily due to a change in production mix. Additionally, we expect to capitalize less operating costs for waste stripping as a result of Goldstrike and Cortez completing substantial stripping campaigns in 2011. Labor cost is increasing due to market adjustments for skilled labor and additional hiring at some sites. Gas and electricity costs are slightly higher at Cortez and royalties are increasing due to higher realized gold prices.
Beyond 2012, we have identified various opportunities to add production within North America, including the potential expansion of our current Turquoise Ridge underground operation into a large scale open pit to mine low-grade mineralization; the recent discoveries known as Red Hill/Goldrush in Nevada, together with possibilities for extension at the Cortez Hills Lower Zone and other satellite deposits; the use of thiosulphate technology at Goldstrike to extend the life of the autoclaves; and the expansion of the open pit mine life at Hemlo. We continue to progress evaluation of these opportunities to create value at our existing operations.
| | | | |
| BARRICK YEAR-END 2011 | | 43 | | MANAGEMENT’S DISCUSSION AND ANALYSIS |
South America
Summary of Financial and Operating Data
| | | | | | | | | | | | | | | | |
| | | IFRS | | | US
GAAP | |
For the years ended December 31 | | 2011 | | | 2010 | | | %
Change | | | 2009 | |
| Total tons mined (millions) | | | 162 | | | | 145 | | | | 12% | | | | 158 | |
| Ore tons processed (millions) | | | 69 | | | | 67 | | | | 3% | | | | 70 | |
| Average grade (ozs/ton) | | | 0.035 | | | | 0.039 | | | | (10%) | | | | 0.036 | |
| Gold produced (000s/oz) | | | 1,872 | | | | 2,120 | | | | (12%) | | | | 1,889 | |
| Cost of sales ($ millions) | | | $ 905 | | | | $ 702 | | | | 29% | | | | $499 | |
| Total cash costs (per oz) | | | $ 358 | | | | $ 208 | | | | 72% | | | | $265 | |
| Segment income ($ millions)1 | | | $ 1,887 | | | | $ 1,782 | | | | 6% | | | | $ 1,111 | |
| Segment EBITDA ($ millions)2 | | | $ 2,102 | | | | $ 1,996 | | | | 5% | | | | 1,245 | |
| Capital expenditures ($ millions)3 | | | $ 298 | | | | $ 293 | | | | 2% | | | | $ 171 | |
| 1 | Segment income excludes income taxes. |
| 2 | EBITDA is a non-GAAP financial performance measure with no standardized meaning under IFRS. For further information and a detailed reconciliation, please see page 76 of this MD&A. |
| 3 | Amounts presented represent expenditures for minesite expansion, minesite sustaining as well as open pit and underground mine development on a cash basis excluding capitalized interest. |
Segment EBITDA and segment income for 2011 were $2,102 million and $1,887 million, an increase of 5% and 6%, respectively, over the prior year. These increases were primarily as a result of higher realized gold prices, which were partially offset by lower sales volumes and higher total cash costs.
Gold production for 2011 was 12% lower than in the prior year, and was within our regional guidance range of 1.85 to 1.90 million ounces. The decrease in production reflects lower production levels across all of our mines.
In 2011, cost of sales increased by 29% over the prior year, primarily due to higher direct mining costs, largely due to inflationary pressures in Argentina, an increase in consumable costs, and lower capitalized production phase stripping costs at Veladero. Total cash costs of $358 per ounce were slightly lower than our most recent regional guidance range of $360 to $380 per ounce. The increase in total cash costs was mainly due to higher direct mining costs along with the impact of lower production levels, particularly from the lower-cost Lagunas Norte and Veladero mines.
In 2012, we expect gold production to be in the range of 1.55 to 1.70 million ounces. Production is expected to be lower than 2011, primarily due to lower Veladero and Pierina production and, to a lesser extent, Lagunas Norte. Mining activity at Veladero is expected to shift away from the higher grade areas of the Filo Federico pit to lower grade areas as anticipated in the life of mine
plan. Total gold cash costs are expected to be $430 to $480 per ounce compared to $358 per ounce in 2011. Total cash costs per ounce are expected to be higher in 2012 primarily due to the production mix impact of lower grades at Veladero and higher labor and contractor costs due to inflation in Argentina.
Beyond 2012, we have identified various opportunities to add production within South America, including extending mining at Lagunas Norte as a result of incremental sulphide mineralization, which has the potential to benefit life of mine production, and an optimized leach pad solution at Veladero, which would accelerate the processing of inventory. We continue to make progress in our evaluation of these opportunities to create value at our existing operations.
Australia Pacific
Summary of Financial and Operating Data1
| | | | | | | | | | | | | | | | |
| | | IFRS | | | US
GAAP | |
For the years ended
December 31 | | 2011 | | | 2010 | | | %
Change | | | 2009 | |
| Gold | | | | | | | | | | | | | | | | |
| Total tons mined (millions) | | | 112 | | | | 118 | | | | (5%) | | | | 133 | |
| Ore tons processed (millions) | | | 26 | | | | 27 | | | | (4%) | | | | 30 | |
| Average grade (ozs/ton) | | | 0.083 | | | | 0.082 | | | | 1% | | | | 0.075 | |
| Gold produced (000s/oz) | | | 1,879 | | | | 1,939 | | | | (3%) | | | | 1,950 | |
| Cost of sales ($ millions) | | | $ 1,611 | | | | $ 1,480 | | | | 9% | | | | $ 1,134 | |
| Total cash costs (per oz) | | | $ 621 | | | | $ 576 | | | | 8% | | | | $ 581 | |
| Segment income ($ millions)2 | | | $ 1,330 | | | | $ 831 | | | | 60% | | | | $ 315 | |
| Segment EBITDA ($ millions)3 | | | $ 1,648 | | | | $ 1,096 | | | | 50% | | | | $ 597 | |
| Capital expenditures ($ millions)4 | | | $ 463 | | | | $ 381 | | | | 22% | | | | $ 239 | |
| 1 | The amounts presented in this table include the results of discontinued operations. |
| 2 | Segment income includes income taxes related to Osborne only. |
| 3 | EBITDA is a non-GAAP financial performance measure with no standardized meaning under IFRS. For further information and a detailed reconciliation, please see page 76 of this MD&A. |
| 4 | Amounts presented represent expenditures for minesite expansion, minesite sustaining as well as open pit and underground mine development on a cash basis excluding capitalized interest. |
Segment EBITDA and segment income for 2011 were $1,648 million and $1,330 million, an increase of 50% and 60%, respectively, over the prior year. The increases were primarily as a result of higher realized gold prices, which was partially offset by lower sales volumes and higher total cash costs.
Gold production of 1.9 million ounces for 2011 was slightly lower than the prior year and was in line with our original and most recent guidance of 1.9 million ounces. Higher production at Yilgarn South was offset by lower production at Cowal, Kanowna, Plutonic and Porgera.
| | | | |
| BARRICK YEAR-END 2011 | | 44 | | MANAGEMENT’S DISCUSSION AND ANALYSIS |
Production at Yilgarn South increased by 18% over 2010 due to better average head grades at Lawlers, improved production rates at Darlot and higher tons mined and processed at Granny Smith, primarily as a result of the mine expansion. Production at Cowal decreased by 10%, due to mine sequencing, which resulted in the mining of lower grade zones of the pit. Production at Kanowna decreased by 10% from 2010 as a result of lower average head grades and lower tons processed due to mining and processing of harder ore which is more difficult to treat and results in lower recoveries. Production at Plutonic decreased by 15% from 2010 due to lower average head grades. Production at Porgera decreased by 4%, mainly due to lower average head grades as a higher portion of the mill feed was sourced from stockpiles.
In 2011, cost of sales increased by 9% over the prior year, reflecting higher direct mining costs, particularly for labor and energy, a decrease in capitalized production phase stripping costs at Porgera, Cowal and Kalgoorlie and higher costs as a result of a mine expansion at Granny Smith.
Total cash costs per ounce were up 8% to $621 over the prior year, due to the same factors that affected cost of sales, as well as the impact of slightly lower production levels. Total cash costs were within our original guidance range of $610 to $635 per ounce.
In 2012, we expect gold production to be in the range of 1.80 to 1.95 million ounces, which is consistent with 2011. Higher production is expected at Porgera due to improved underground production primarily due to equipment availability issues and unplanned maintenance in 2011. This is expected to be offset by lower production at Kalgoorlie due to fewer tons mined in lower grade areas. Total gold cash costs are expected to be $700 to $750 per ounce compared to $621 per ounce in 2011. Total cash costs per ounce are expected to be higher primarily due to the changes in our effective hedge rates from 2011 to 2012, higher gas and electricity costs and higher labor due to inflation and hiring at some sites. Gas and electricity costs are higher principally due to significantly higher natural gas prices at Porgera, where it is used to generate power, as a result of the expiration of a long-term contract at the end of 2011.
Beyond 2012, we have identified various opportunities to add gold production within Australia Pacific, including a potential expansion at Cowal that could extend the mine life by about 5 years and an expansion at Granny Smith below the current underground mine. We continue to
progress our evaluation of these opportunities to create value at our existing operations.
African Barrick Gold
Summary of Financial and Operating Data1
| | | | | | | | | | | | | | | | |
For the years ended December 31 | | IFRS | | | US
GAAP | |
| 100% basis | | 2011 | | | 2010 | | | % Change | | | 2009 | |
| Total tons mined (millions) | | | 50 | | | | 44 | | | | 14% | | | | 41 | |
| Ore tons processed (millions) | | | 8 | | | | 8 | | | | - | | | | 7 | |
| Average grade (ozs/ton) | | | 0.096 | | | | 0.094 | | | | 2% | | | | 0.114 | |
| Gold produced (000s/oz) | | | 689 | | | | 701 | | | | (2%) | | | | 716 | |
| Cost of sales ($ millions) | | | $708 | | | | $598 | | | | 18% | | | | $377 | |
| Total cash costs (per oz) | | | $692 | | | | $570 | | | | 21% | | | | $545 | |
| Segment income ($ millions)2 | | | $397 | | | | $315 | | | | 26% | | | | $143 | |
| Segment EBITDA ($ millions)3 | | | $538 | | | | $429 | | | | 25% | | | | $236 | |
| Capital expenditures ($ millions)4 | | | $284 | | | | $225 | | | | 26% | | | | $134 | |
| | | | | | | | | | | | | | | | |
For the years ended December 31 | | IFRS | | | US
GAAP | |
73.9% basis1 | | | 2011 | | | | 2010 | | | | % Change | | | | 2009 | |
Total tons mined (millions) | | | 37 | | | | 35 | | | | 6% | | | | 41 | |
| Ore tons processed (millions) | | | 6 | | | | 7 | | | | (14%) | | | | 7 | |
Average grade (ozs/ton) | | | 0.096 | | | | 0.094 | | | | 2% | | | | 0.114 | |
Gold produced (000s/oz) | | | 509 | | | | 564 | | | | (10%) | | | | 716 | |
Cost of sales ($ millions) | | | $523 | | | | $480 | | | | 9% | | | | $377 | |
Total cash costs (per oz) | | | $692 | | | | $570 | | | | 21% | | | | $545 | |
| Segment income ($ millions)2 | | | $293 | | | | $250 | | | | 17% | | | | $143 | |
| Segment EBITDA ($ millions)3 | | | $398 | | | | $342 | | | | 16% | | | | $236 | |
| Capital expenditures ($ millions)4 | | | $210 | | | | $176 | | | | 19% | | | | $134 | |
| 1 | These amounts represent our equity share of results. The dilution of our ownership interest in ABG to approximately 73.9% impacts our operating statistics from second quarter 2010 onwards. |
| 2 | Segment income excludes income taxes. |
| 3 | EBITDA is a non-GAAP financial performance measure with no standardized meaning under IFRS. For further information and a detailed reconciliation, please see page 76 of this MD&A. |
| 4 | Amounts presented represent expenditures for minesite expansion, minesite sustaining as well as open pit and underground mine development on a cash basis excluding capitalized interest. |
Segment EBITDA and segment income for 2011, on a 100% basis, were $538 million and $397 million, an increase of 25% and 26%, respectively, over the prior year. The increases were primarily as a result of higher realized gold prices, which was partially offset by lower sales volume and higher total cash costs.
Barrick’s equity interest in 2011 production was 0.509 million ounces, slightly lower than the most recent regional guidance of 0.515 to 0.560 million ounces. Lower than originally expected production in 2011 was
| | | | |
| BARRICK YEAR-END 2011 | | 45 | | MANAGEMENT’S DISCUSSION AND ANALYSIS |
mainly due to a decrease in production at North Mara, partially offset by higher production at Tulawaka. The decrease at North Mara was due to mine sequencing, which resulted in the processing of lower grade stockpiles as a result of its ongoing waste stripping program. The increase at Tulawaka was due to higher average head grades from underground operations.
In 2011, cost of sales, on a 100% basis, increased by 18% over 2010 primarily due to higher direct mining costs, which is largely due to inflationary pressures and increases in commodity inputs for key operating consumables. Compared to 2010, 2011 total cash costs per ounce were $692, up 21% and were within our regional guidance range of $675 to $700 per ounce. The increase in total cash costs was primarily due to higher costs across our operations.
In 2012, we expect equity gold production, reflecting our 73.9% ownership of ABG, to be in the range of 0.500 to 0.535 million ounces, which is consistent with 2011. North Mara production is expected to be higher due to higher ore grades mined and milled from slightly fewer tons processed. Buzwagi production is lower due to a shift to mining lower grade areas. Total gold cash costs are expected to be $790 to $860 per ounce compared to $692 per ounce in 2011. Total cash costs per ounce are expected to be higher due to the production mix impact of lower Buzwagi grades and an increase in labor, gas and electricity costs at several sites.
Beyond 2012, ABG has identified various opportunities to add production, including the Gokona/Nyabigena underground zones at North Mara; a process plant expansion and the Upper East Zone at Bulyanhulu; and at the Golden Ridge exploration property. ABG continues to make progress in its evaluation of these opportunities to create value at its existing operations and to develop acquired exploration properties.
Major Capital Projects
Summary of Financial and Operating Data
| | | | | | | | | | | | | | | | |
For the years ended December 31 | | IFRS | | | US GAAP | |
| | | 2011 | | | 2010 | | | % Change | | | 2009 | |
E&E expense1 | | | $ 53 | | | | $ 21 | | | | 152% | | | | 49 | |
| E&E expenses incurred by equity investees2 | | | 2 | | | | 11 | | | | (82%) | | | | 93 | |
| Total E&E expenses | | | 55 | | | | 32 | | | | 72% | | | | 142 | |
| Segment income (loss) | | | (165) | | | | (18) | | | | 817% | | | | (109) | |
Segment EBITDA | | | (155) | | | | (15) | | | | 933% | | | | (106) | |
Capital expenditures3 | | | | | | | | | | | | | | | | |
Pascua-Lama | | | 1,191 | | | | 724 | | | | 65% | | | | 202 | |
Pueblo Viejo | | | 521 | | | | 592 | | | | (12%) | | | | 433 | |
Cerro Casale | | | 83 | | | | 50 | | | | 66% | | | | - | |
Cortez Hills | | | - | | | | 19 | | | | (100%) | | | | - | |
Buzwagi | | | | | | | | | | | | | | | 52 | |
Equity investees | | | 39 | | | | 25 | | | | 56% | | | | | |
Subtotal | | | 1,834 | | | | 1,410 | | | | 30% | | | | 687 | |
| Capital commitments4 | | | $ 1,338 | | | | $ 1,018 | | | | 31% | | | | 1,018 | |
| 1 | Amounts presented represent our share of E&E expense. |
| 2 | Amounts presented represent our share of project development expense from projects for which we use the equity accounting method managed by Capital Projects, including Donlin Gold and Cerro Casale (until March 31, 2010). |
| 3 | Amounts presented represent our share of capital expenditures on a cash basis. |
| 4 | Capital commitments represent purchase obligations as at December 31 where binding commitments have been entered into for long lead capital items related to construction activities at our projects. |
We spent $53 million in E&E expenses (our share) in capital expenditures in 2011 as compared to prior year E&E expense of $21 million. The increase in E&E compared to 2010 primarily relates to increased E&E expenses at our capital projects, partially offset by decreased E&E expenditures incurred by our equity investees. The increase in capital expenditures primarily relates to increased construction activities at our Pascua-Lama project.
Investing in and Developing High Return Projects
Projects in construction
Barrick has targeted growth in production to approximately nine million ounces of gold by 201616., driven largely by Pueblo Viejo and Pascua-Lama. Total cash costs per ounce are expected to benefit from these two large, low-cost projects as they come on stream in 2012 and 2013, respectively. These two high quality
| 16 | The target of 9 M oz of annual production by 2016 reflects a current assessment of the expected production and timeline to complete and commission Barrick’s projects currently in construction (Pueblo Viejo and Pascua-Lama) and the Company’s current assessment of existing mine site opportunities, some of which are sensitive to metal price and various capital and input cost assumptions. |
| | | | |
| BARRICK YEAR-END 2011 | | 46 | | MANAGEMENT’S DISCUSSION AND ANALYSIS |
mines are expected to contribute 1.5 million ounces17 of average annual production and have a significant positive impact on Barrick’s overall total cash costs.
Pueblo Viejo
At the Pueblo Viejo project in the Dominican Republic, first production continues to be expected in mid-2012 and overall construction is currently about 90% complete. At the end of Q4, approximately 85% of the expected total mine construction capital of $3.6 -$3.8 billion18(100% basis) or $2.2 -$2.3 billion (Barrick’s 60% share) had been committed. About 13 million tonnes of ore, representing approximately 1.4 million contained gold ounces, has been stockpiled to date. Construction of the tailings facility progressed during Q4 with the receipt of approvals to re-commence construction. The oxygen plant is expected to undergo pre-commissioning testing in Q1 2012, with the first two autoclaves undergoing pre-commissioning in Q2 2012. Construction of the transmission line connecting the site to the national power grid was completed during Q4 2011, and the inter-connect to the grid has been achieved. As part of a longer-term, optimized power solution for Pueblo Viejo, the Company has started early works to construct a dual fuel power plant at an estimated incremental cost of approximately $300 million (100% basis). The power plant would commence operations utilizing heavy fuel oil, but have the ability to subsequently transition to lower cost liquid natural gas. The new plant is expected to provide lower cost, long-term power to the project.
Pueblo Viejo is expected to contribute approximately 100,000-125,000 ounces to Barrick at total cash costs of $400-$500 per ounce19 in 2012 as it ramps up to full production in 2013. Barrick’s 60% share of annual gold production in the first full five years of operation is expected to average 625,000-675,000 ounces at total cash costs of $300-$350 per ounce20.
Pascua-Lama
At the Pascua-Lama project, approximately 55% of the previously announced pre-production capital of $4.7 -$5.0 billion21 has been committed and first production is
| 17 | Based on the estimated cumulative average annual production in the first full five years once both are at full capacity. |
| 18 | Based on gold and oil price assumptions of $1,300/oz and $100/bbl, respectively. |
| 19 | Based on 2012 gold and oil price assumptions of $1,700/oz and $100/bbl, respectively. The 2012 total cash cost estimate is dependent on the rate at which production ramps up after commercial levels of production are achieved. |
A change in the efficiency of the ramp up could have a significant impact on this estimate.
| 20 | Based on gold and oil price assumptions of $1,300/oz and $100/bbl, respectively. |
| 21 | Based on gold, silver and oil price assumptions of $1,300/oz, $25/oz, and $100/bbl, respectively and assuming a Chilean peso f/x rate of 475:1. |
expected in mid-2013. The project is being impacted by labor and commodity cost pressures as a result of inflation, competition for skilled labor, the impact of increased Argentinean customs restrictions on equipment procurement and lower than expected labor productivity.
In Chile, earthworks were about 95% complete at the end of Q4, and in Argentina, earthworks construction was approximately 65% complete at year end. Approximately 40% of the concrete has been poured at the processing facilities in Argentina and about 15% of the structural steel has been erected to date. Occupancy of the construction camps in Chile and Argentina continues to ramp up with 6,500 beds available by the end of 2011. The camps are expected to reach their full capacity of 10,000 beds in mid-2012. Average annual gold production from Pascua-Lama is expected to be 800,000–850,000 ounces in the first full five years of operation at negative total cash costs of $225-$275 per ounce21 based on a silver price of $25 per ounce. For every $1 per ounce increase in the silver price, total cash costs are expected to decrease by about $35 per ounce over this period.
Projects in feasibility
Cerro Casale
At the Cerro Casale project in Chile, basic engineering was completed on schedule in Q4. The EIA permitting process is anticipated to be completed by the end of 2012, after which Barrick will consider a construction decision, commencement of detailed engineering and sectoral permitting. Ongoing consultation with the government, local communities and indigenous groups is continuing in parallel with permitting.
Barrick’s 75% share of average annual production is anticipated to be 750,000-825,000 ounces of gold and 190-210 million pounds of copper in the first full five years of operation at total cash costs of $200-$250 per ounce22. Estimated total mine construction capital is approximately $6.0 billion (100% basis)22,23.
Donlin Gold
At the 50%-owned Donlin Gold project in Alaska, the revised feasibility study, which includes updated costs and the utilization of natural gas, has been completed and acceptance of the study by the Board of Donlin Gold LLC is expected in the first half of 2012. Mine construction capital is expected to be approximately
| 22 | Based on gold, copper, and oil price assumption of $1,300/oz, $3.25/oz and $100/bbl, respectively and assuming a Chilean peso f/x rate of 475;1. |
| 23 | Based on Q2 2011 prices and does not include escalation for inflation. |
| | | | |
| BARRICK YEAR-END 2011 | | 47 | | MANAGEMENT’S DISCUSSION AND ANALYSIS |
$6.7 billion (100% basis)24, which includes a natural gas pipeline that is anticipated to lower long-term power costs and offer a better environmental and operational solution for power connection to the site. Permitting is expected to commence following approval by the Board of the revised feasibility study. Donlin Gold is anticipated to produce about 1.5 million ounces of gold annually (100% basis) in its first full five years of operation.
Copper
Summary of Financial and Operating Data
| | | | | | | | | | | | | | | | |
| | | IFRS | | | US
GAAP | |
| For the years ended December 31 | | 2011 | | | 2010 | | | % Change | | | 2009 | |
| Copper produced (millions of lbs) | | | 451 | | | | 368 | | | | 23% | | | | 393 | |
| Cost of sales ($ millions) | | | $ 983 | | | | $ 430 | | | | 129% | | | | $ 444 | |
| Total cash costs (per lb) | | | $ 1.75 | | | | $ 1.10 | | | | 59% | | | | $ 1.17 | |
| Segment income ($ millions)1 | | | $ 644 | | | | $ 607 | | | | 6% | | | | $ 570 | |
| Segment EBITDA ($ millions)2 | | | $ 817 | | | | $ 697 | | | | 17% | | | | $ 646 | |
| Capital expenditures ($ millions)3 | | | $ 333 | | | | $ 55 | | | | 505% | | | | $ 39 | |
| 1 | Segment income excludes income taxes. |
| 2 | EBITDA is a non-GAAP financial performance measure with no standardized meaning under IFRS. For further information and a detailed reconciliation, please see page 76 of this MD&A. |
| 3 | Amounts presented represent expenditures for minesite expansion, minesite sustaining as well as open pit and underground mine development on a cash basis excluding capitalized interest. |
Segment EBITDA and segment income for 2011 were $817 million and $644 million, an increase of 17% and 6%, respectively, over the prior year. Segment income for 2011 was $644 million, up $37 million as compared to the prior year. The increases were primarily as a result of higher realized copper prices and sales volumes, which were partially offset by higher total cash costs. Segment EBITDA was negatively affected by $31 million in inventory purchase accounting adjustments related to mineral inventory that was acquired as part of the Equinox acquisition. Segment income was also affected by depreciation of fair value increments arising from the allocation of the purchase price.
Copper production in 2011 was 451 million pounds, which was 23% higher than the prior year, and was in line with the low end of our regional guidance range of 450 to 460 million pounds. The increase in production level was mainly due to production from Lumwana, which was acquired as part of the Equinox transaction, partially offset by lower production in Zaldívar due to lower average head grades and the impact of the divestiture of Osborne in the third quarter of 2010.
| 24 | Based on Q2 2011 prices and does not include escalation for inflation. |
In 2011, cost of sales increased by 129% over the prior year, primarily due to the inclusion of Lumwana production and the impact of higher input prices for fuel, power and sulfuric acid costs at Zaldívar. Total cash costs per pound increased by 59% over the prior year, reflecting higher direct production costs and lower production levels at Zaldívar and the impact of higher cost production from Lumwana. Total cash costs were slightly above the high end of our recent guidance range of $1.60 to $1.70 per pound.
In 2012, we expect copper production in the range of about 550 to 600 million pounds, resulting from a full year of production from Lumwana and the mid-year start-up of Jabal Sayid. Production at Zaldívar is expected to remain at levels similar to 2011. Total cash costs for copper are expected to be in the range of $1.90 to $2.20 per pound, approximately $0.30 higher than 2011 and mainly the result of the impact of a full year’s contribution from Lumwana, an increase to the Zambian government royalty rate, start-up of Jabal Sayid at higher average cash costs per pound and an increase in market prices for sulfuric acid at Zaldívar.
Investing in and developing High Return Projects
Projects in construction
Jabal Sayid
Overall construction of the Jabal Sayid copper project in Saudi Arabia was about 75% complete at the end of Q4. Subject to receipt of final approvals, the operation is expected to enter production in the second half of 2012 at total construction capital of approximately $400 million, of which 85% had been committed at the end of Q4. Underground mine development for first ore production and concrete works was completed in Q4 and bulk earthworks were about 90% complete. Jabal Sayid is expected to produce 35-45 million pounds of copper in 2012 at total cash costs of $2.15 -$2.50 per pound25. Average annual production from Lodes 2 and 4 is expected to be 100-130 million pounds over the first full five years of operation at total cash costs of $1.50 -$1.70 per pound. Results from recent drilling beneath Lode 4 demonstrate that the width of mineralization towards the base of the current resource model had been underestimated by lack of drilling. In addition to the previous intercept of 111 meters grading 2.67% copper, recent drilling has intersected 119 meters at 1.2% copper. This area will be the focus of ongoing drilling and resource/reserve upgrades and additions in 2012.
| 25 | Based on 2012 copper and gold price assumptions of $3.50/lb and $1,700/oz, respectively. The 2012 total cash cost estimate is dependent on the rate at which production ramps up after commercial levels of production are achieved. A change in the efficiency of the ramp up could have a significant impact on this estimate. |
| | | | |
| BARRICK YEAR-END 2011 | | 48 | | MANAGEMENT’S DISCUSSION AND ANALYSIS |
Projects in Feasibility
Zaldívar Sulfides Expansion
A scoping study has also been completed on the Zaldívar deep sulfides and a prefeasibility study by year end 2012. Although this project is in the early stages, this expansion opportunity has the potential to benefit life of mine production starting as early as 2017 and significantly extend the mine life.
Lumwana Expansion
At Lumwana, activity has been ramped up with 17 drill rigs on the property focusing on resource definition drilling at Chimiwungo to convert inferred resources into the indicated category and step-out drilling to the south and east to extend the mineralization. Drilling to date has confirmed the thickened eastern shoot of Chimiwungo and selected highlights include 44 meters grading 1.00% copper, 44 meters at 1.07%, 41 meters at 0.80%, 37 meters at 0.91% and 20 meters at 1.60%. In addition to these strong results within the resource area, drilling further to the east is intersecting shallower than expected mineralization. A prefeasibility study on an expansion that could potentially double processing rates at Lumwana is expected to be completed by year end 2012.
Kabanga
At the 50%-owned Kabanga nickel project in Tanzania, preliminary engineering continues along with efforts to obtain an approved Environmental Impact Assessment and a Special Mining License and negotiate a Mineral Development Agreement with the Tanzanian government by the end of 2012, at which point the partners expect to make a construction decision.
| | | | |
| BARRICK YEAR-END 2011 | | 49 | | MANAGEMENT’S DISCUSSION AND ANALYSIS |
FINANCIAL CONDITION REVIEW
Summary Balance Sheet and Key Financial Ratios
| | | | | | | | |
($ millions, except ratios and share amounts) | |
| | | | As at December 31, 2011 | | | | As at December 31, 2010 | |
Total cash and equivalents | | | $ 2,745 | | | | $ 3,968 | |
Non-cash working capital | | | 2,335 | | | | 1,695 | |
Non-current assets | | | 42,339 | | | | 27,566 | |
Other assets | | | 1,465 | | | | 1,408 | |
Total Assets | | | 48,884 | | | | 34,637 | |
Non-current liabilities excluding adjusted debt | | | 7,361 | | | | 4,537 | |
Adjusted debt1 | | | 13,058 | | | | 6,392 | |
Other liabilities | | | 2,911 | | | | 2,491 | |
Total Liabilities | | | 23,330 | | | | 13,420 | |
Total shareholders’ equity | | | 23,363 | | | | 19,472 | |
Non-controlling interests | | | 2,191 | | | | 1,745 | |
Total Equity | | | $ 25,554 | | | | $ 21,217 | |
Dividends | | | $ 509 | | | | $ 436 | |
Net debt1 | | | $ 10,320 | | | | $ 2,427 | |
Total common shares outstanding (millions of shares)2 | | | 1,000 | | | | 999 | |
Key Financial Ratios: | | | | | | | | |
Current ratio3 | | | 2.25:1 | | | | 2.84:1 | |
Adjusted debt-to-equity4 | | | 0.56:1 | | | | 0.33:1 | |
Net debt-to-equity5 | | | 0.44:1 | | | | 0.12:1 | |
Net debt-to-total capitalization6 | | | 0.33:1 | | | | 0.10:1 | |
Return on equity7 | | | 22% | | | | 20% | |
| 1 | Adjusted debt and net debt are non-GAAP financial performance measures with no standardized meaning under IFRS. For further information and a detailed reconciliation, please see page 79 of this MD&A. |
| 2 | Total common shares outstanding do not include 6,845,296 stock options. The increase from December 31, 2010 is due to the exercise of stock options and the conversion of debentures. |
| 3 | Represents current assets divided by current liabilities as at December 31, 2011 and December 31, 2010. |
| 4 | Represents adjusted debt divided by total shareholders’ equity as at December 31, 2011 and December 31, 2010. |
| 5 | Represents net debt divided by total shareholders’ equity as at December 31, 2011 and December 31, 2010. |
| 6 | Represents net debt divided by capital stock and long-term debt at December 31, 2011 and December 31, 2010. |
| 7 | Represents adjusted net earnings divided by average shareholders’ equity as at December 31, 2011 and December 31, 2010. |
Balance Sheet Review
Total assets were $49 billion in 2011, an increase of $14.2 billion or 41% compared to 2010. The increase primarily reflects an increase in property, plant and equipment and goodwill, which were partially offset by a decrease in cash and equivalents. This reflects the impact of our acquisition of Equinox in the second quarter of 2011 as well as the significant capital expenditures primarily related to our projects in construction. Our asset base is primarily comprised of non-current assets such as property, plant and equipment and goodwill, reflecting the capital intensive nature of the mining business and our history of growing through acquisitions. Other significant assets
|
|
|
include production inventories and cash and equivalents. We typically do not carry a material accounts receivable balance, since only sales of concentrate and copper cathode have a settlement period. |
Total liabilities increased by $10 billion or 74% compared to 2010, largely due to the issuance of $6.5 billion of new debt in connection with the acquisition of Equinox.
| | | | |
| BARRICK YEAR-END 2011 | | 50 | | MANAGEMENT’S DISCUSSION AND ANALYSIS |
Sources and Uses of Net Debt
| | | | | | | | |
| | | For the years ended December 31 | |
| (in $ millions) | | 2011 | | | 2010 | |
Operating Activities | | | | | | | | |
Adjusted operating cash flow | | | $ 5,680 | | | | $5,241 | |
Settlement of gold sales contracts | | | - | | | | (656) | |
| Acquisition costs expensed and related working capital movements | | | (204) | | | | - | |
| Withholding tax payment | | | (161) | | | | | |
| Operating inflows | | | $ 5,315 | | | | $4,585 | |
Investing activities | | | | | | | | |
| Capital expenditures - minesite sustaining | | | (980) | | | | (865) | |
| Capital expenditures - open pit and underground mine development | | | (842) | | | | (595) | |
| Capital expenditures - minesite expansion1 | | | (533) | | | | (257) | |
| Capital expenditures - projects1 | | | (2,618) | | | | (2,061) | |
| Acquisitions | | | (7,677) | | | | (813) | |
| Other investing activities | | | (177) | | | | (39) | |
| Total investing outflows | | | (12,827) | | | | (4,630) | |
| Financing activities (excluding debt) | | | | | | | | |
| Proceeds from public issuance of common shares by a subsidiary | | | - | | | | 884 | |
| Dividends | | | (509) | | | | (436) | |
| Funding from non-controlling interests | | | 403 | | | | 114 | |
| Repayments of debt related to the acquisitions | | | (347) | | | | - | |
| Deposit on silver sales agreement | | | 138 | | | | 137 | |
| Other financing activities | | | (9) | | | | 102 | |
| Total financing (outflows) inflows | | | (324) | | | | 801 | |
| Other movements | | | (116) | | | | 30 | |
Conversion of convertible debt | | | | | | | 176 | |
Settlement (recognition) of obligation to close out gold sales contracts | | | - | | | | 656 | |
Adjustment for Pueblo Viejo financing (partner’s share), net of cash | | | 59 | | | | 310 | |
| Net (decrease) increase in net debt | | | 7,893 | | | | (1,928) | |
| Net debt at beginning of period2 | | | 2,427 | | | | 4,355 | |
| Net debt at end of period2 | | | $ 10,320 | | | | $ 2,427 | |
| 1 | The amounts include capitalized interest of $382 million (2010: $275 million). |
| 2 | Net debt is a non-GAAP financial performance measures with no standardized definition under IFRS. For further information and a detailed reconciliation, please see pages 79 of this MD&A. |
As at December 31, 2011 net debt was $10.3 billion, and our net debt-to-equity ratio and net debt-to-total capitalization ratios were 0.44:1 and 0.33:1, respectively. This compares to net debt as at December 30, 2010 of $2.4 billion, and net debt to equity and net debt-to-total capitalization ratios of 0.12:1 and 0.10:1, respectively. The
increase in net debt, net debt-to-equity and net debt-to-total capitalization ratios are largely due to the additional debt issued in connection with our acquisition of Equinox. The majority of our outstanding long-term debt matures at various dates beyond 2013. In January 2012, we entered into a new credit facility of $4 billion with an interest rate of LIBOR plus 1.00%, which matures in 2017. Coincident with this agreement becoming effective, we terminated our $2 billion facility that was secured in May 2011 and transferred the $1 billion drawn on the $2 billion facility to the new $4 billion facility. As a result, our total scheduled debt repayments in the next couple of years is $2,287 million. Counterparties to debt and derivative instruments do not have unilateral discretionary rights to accelerate repayment at earlier dates, and therefore we are largely protected from short-term liquidity fluctuations.
| | | | |
| Shareholders’ Equity | |
| Outstanding Share Data | |
As at January 27, 2012 | | | Number of shares | |
Common shares | | | 1,000,422,260 | |
Stock options | | | 6,845,296 | |
Dividend Policy
In 2011, we increased our annual dividend from $0.48 per common share to $0.60 per common share. This 25% increase in dividends reflects our ability to generate substantial cash flows from our operations in a high gold price environment. The amount and timing of any dividends is within the discretion of our Board of Directors. The Board of Directors reviews the dividend policy quarterly based on our current and projected liquidity profile, and capital requirements for capital projects and potential acquisitions.
Comprehensive Income
Comprehensive income consists of net income or loss, together with certain other economic gains and losses, which, collectively, are described as “other comprehensive income” or “OCI”, and excluded from the income statement.
In 2011, other comprehensive income was a loss of $156 million on an after-tax basis consisting primarily of gains of $411 million on hedge contracts designated for future periods, caused primarily by changes in currency exchange rates, copper prices, and fuel prices, offset by reclassification adjustments totaling $506 million for gains on hedge contracts designated for 2011 that were transferred to earnings in 2011 in conjunction with the recognition in expense of the related hedge exposure;
| | | | |
| BARRICK YEAR-END 2011 | | 51 | | MANAGEMENT’S DISCUSSION AND ANALYSIS |
$41 million loss transferred to earnings related to gains recorded on the sale of shares in various investments and losses for impaired investments; $100 million of losses recorded as a result of changes in the fair value of investments held during the year; $36 million in losses for currency translation adjustments on Barrick Energy; $35 million actuarial loss on pension liability and a $69 million gain due to tax recoveries on the overall decrease in OCI.
Included in accumulated other comprehensive income at December 31, 2011 were unrealized pre-tax gains on currency, commodity and interest rate hedge contracts totaling $733 million. The balance primarily relates to currency hedge contracts that are designated against operating costs and capital expenditures, primarily over the next three years and are expected to help protect against the impact of the strengthening in the Australian and Canadian dollar exchange rates against the US dollar. These hedge gains/losses are expected to be recorded in earnings at the same time as the corresponding hedged operating costs/depreciation are recorded in earnings.
Financial Position
We have maintained a strong financial position despite the market turbulence that has been experienced over the past four years. Our strong earnings and operating cash flow growth have enabled us to make high return investments in our project pipeline and also consistently increase our dividends. This is illustrated by our significant cash and working capital balances which remain strong after the use of approximately $2 billion in cash for the acquisition of Equinox in 2011. Our debt-to-equity and debt-to-total capitalization ratios as at December 31, 2011 have also increased reflecting the additional debt issued in connection with our acquisition of Equinox.
Our strong financial position enabled us to fund the acquisition of Equinox through a combination of our existing cash balances and new debt, which helped up maintain the only A-rated balance sheet in the gold mining industry as measured by S&P. Our credit ratings, as established by S&P and Moody’s, have remained stable throughout this period of financial uncertainty. Our ability to access unsecured debt markets and the related cost of debt financing is, in part, dependent upon maintaining an acceptable credit rating. Deterioration in our credit rating would not adversely affect existing debt securities, but could impact funding costs for any new debt financing.
Credit Rating from Major Rating Agencies
| | | | |
At January 28, 2012: | | | | |
Standard and Poor’s (“S&P”) | | | A- | |
Moody’s | | | Baa1 | |
The key factors impacting our financial position, and therefore our credit rating, include the following:
| • | | Our market capitalization and the strength of our balance sheet, including the amount of net debt and our net debt-to-equity ratio (refer to the balance sheet review section of this MD&A for a discussion of key factors impacting these measures in 2011); |
| • | | Our net cash flow, including cash generated by operating activities (refer to the liquidity and cash flow section of this MD&A for a discussion of key factors impacting these measures in 2011); |
| • | | Expected capital expenditure requirements (refer to the outlook section of this MD&A for a discussion of key factors impacting these measures in future periods); |
| • | | The quantity of our gold and copper reserves (refer to page 42 for more information); and |
| • | | Our geo-political risk profile. |
Liquidity and Cash Flow
Total cash and cash equivalents at the end of 2011 were $2.7 billion26. At year end, our cash position consisted of a mix of term deposits, treasury bills and money market investments. Our cash position is primarily denominated in US dollars. The decrease in cash and cash equivalents at December 31, 2011 compared to the end of the prior year is largely due to the use of approximately $2 billion for the acquisition of Equinox. To fund the remaining cost of the acquisition, we issued $4.0 billion of debt securities and we drew down $2.5 billion from our credit facilities. Upon completion of the renegotiation of one of our credit facilities in January 2012, we have a total of $5.5 billion under our credit facilities, with $3.0 billion available for drawdown as a source of financing.
One of our primary ongoing sources of liquidity is operating cash flow. In 2011, we generated $5.3 billion in operating cash flow, which was net of tax payments of about $2 billion, of which about $0.5 billion related to final 2010 income tax payments, compared to $4.6 billion of operating cash flow in 2010. Adjusted operating cash flow, which excludes the impact of payment of the settlement of gold sales contracts, transaction costs and working capital inputs related to
| 26 | Includes $584 million cash held at ABG, which may not be readily deployed outside ABG. |
| | | | |
| BARRICK YEAR-END 2011 | | 52 | | MANAGEMENT’S DISCUSSION AND ANALYSIS |
acquisition totaled $5.7 billion in 2011, an increase of 8% compared to 2010. The increase in adjusted operating cash flow was primarily due to growing cash margins with the rise in realized gold and copper prices and higher copper sales volumes, partially offset by higher income taxes paid and lower gold sales volumes. The most significant driver of the change in operating cash flow is market gold and copper prices. Future changes in those market prices, either favorable or unfavorable, will continue to have a material impact on our cash flow and liquidity.
The table below illustrates the sensitivity impact of changes in gold and copper prices on our 2011 production levels.
| | | | | | | | |
| | | | Change in price | | | | Impact on EBITDA | |
Gold | | | 100/oz | | | | $ 0.8 billion | |
Copper | | | $ 0.50/lb | | | | $ 0.2 billion | |
Working Capital
| | | | | | | | |
| (in $ millions) | | As at
December 31,
2011 | | | As at
December 31,
2010 | |
Inventories1 | | | $ 3,651 | | | | $ 2,838 | |
Other current assets | | | 507 | | | | 615 | |
Accounts receivable | | | 426 | | | | 370 | |
| VAT and fuel tax receivables2 | | | 466 | | | | 349 | |
| Accounts payable and other current liabilities | | | (2,715) | | | | (2,477) | |
| Non-cash working capital | | | $ 2,335 | | | | $ 1,695 | |
| 1 | Includes long-term stockpiles of $1,153 million (2010: $1,040 million). |
| 2 | Includes long-term VAT and fuel tax receivables of $272 million (2010: $138 million). |
Operating cash flow and adjusted operating cash flow were also impacted by a $640 million increase in non-cash working capital. The increase in non-cash working capital primarily relates to an increase in inventories, partially offset by an increase in accounts payable and other current liabilities. The increase in inventory related to an increase in ore in stockpiles of approximately $113 million, principally at Porgera and Goldstrike. These increases were partially offset by a decrease at Cortez as a result of the processing of ore stockpiles in the second half of the year.
The principal uses of operating cash flow are to fund our capital expenditures, including construction activities at our advanced projects; acquisitions; dividend payments; and repayments of our outstanding debt.
Assuming we are able to sustain our current level of cash generation, continue to pay dividends at current
rates totaling about $0.6 billion per year and incur minesite sustaining capital expenditures of about $2 billion per year, $3 billion per year of free cash flow would be available for investment in capital projects, minesite expansion opportunities and acquisitions. We expect to complete construction at Pueblo Viejo in mid-2012 and Jabal Sayid in the second half of 2012, with Pascua-Lama in construction throughout 2012. Therefore, we expect 2012 to be a peak year of capital expenditure and anticipate the amount of capital expenditures to begin declining in 2013 and beyond. However, capital expenditures will be significantly impacted by the timing and expenditure levels relating to other major new mine projects and mine expansions, which are subject to permitting approvals and final construction decisions. A material adverse decline in the market price of gold and/or copper could impact the timing of final construction decisions on these other major new mine projects that are not yet in construction.
We take a balanced approach to capital allocation and subject all investment decisions to a rigorous and disciplined internal capital allocation review. This review entails an assessment of our overall liquidity, the overall level of investment required, and the prioritization of investments based on the merits of each opportunity relative to the portfolio of investment choices we have. This review may result in good opportunities being held back in favor of higher return projects and should allow us to generate the best return on investment decisions when we are faced with a multitude of prospects. The assessment also takes into account expected levels of future operating cash flow and the cost and availability of new financing. Future changes in market gold prices and/or copper prices could impact the timing and amount of cash available for future investment in capital projects, acquisitions, dividends, debt repayments and/or other uses of capital.
Alternatives for sourcing our future capital or other liquidity needs include $3.0 billion of availability under our credit facilities, future operating cash flow, project financings and further debt or equity financings. These alternatives should provide us with the flexibility to fund any cash flow shortfall and are continually evaluated to determine the optimal mix of capital resources for our capital needs.
Cash used in investing activities amounted to $12,827 million in 2011, an increase of $8,197 million compared to 2010, primarily due to the $7,482 million acquisition of Equinox in the second quarter of 2011.
| | | | |
| BARRICK YEAR-END 2011 | | 53 | | MANAGEMENT’S DISCUSSION AND ANALYSIS |
Capital Expenditures1
| | | | | | | | |
For the years ended December 31 | | | | | | | | |
($ millions) | | | 2011 | | | | 2010 | |
Capital expenditures - gold projects | | | | | | | | |
Pascua-Lama | | | $ 1,191 | | | | $ 724 | |
Pueblo Viejo | | | 521 | | | | 592 | |
Cerro Casale | | | 83 | | | | 50 | |
Cortez Hills | | | - | | | | 19 | |
Subtotal2 | | | $ 1,795 | | | | $ 1,385 | |
Copper projects | | | | | | | | |
Jabal Sayid | | | $ 105 | | | | - | |
Subtotal | | | $ 1,900 | | | | $ 1,385 | |
| | |
Capital expenditures attributable to non-controlling interests3 | | | 375 | | | | 407 | |
| | |
Total consolidated project capital expenditures | | | $ 2,275 | | | | $ 1,792 | |
| | |
Capital expenditures - minesite expansion | | | | | | | | |
Gold | | | | | | | | |
North America | | | 255 | | | | $ 228 | |
South America | | | 96 | | | | 23 | |
| | |
African Barrick Gold | | | 50 | | | | - | |
Copper | | | 93 | | | | - | |
| | |
Total capital expenditures - minesite expansion | | | $ 494 | | | | $ 251 | |
| | |
Capital expenditures - minesite sustaining | | | | | | | | |
Gold | | | | | | | | |
North America | | | $ 254 | | | | $ 198 | |
South America | | | 140 | | | | 172 | |
Australia Pacific | | | 192 | | | | 190 | |
African Barrick Gold | | | 136 | | | | 96 | |
Copper | | | 69 | | | | 55 | |
Other4 | | | 189 | | | | 154 | |
| | |
Total capital expenditures - minesite sustaining | | | $ 980 | | | | $ 865 | |
| | |
| Capital expenditures - open pit and underground mine development | | | | | | | | |
Gold | | | | | | | | |
North America | | | $ 345 | | | | $ 177 | |
South America | | | 62 | | | | 98 | |
Australia Pacific | | | 271 | | | | 191 | |
African Barrick Gold | | | 98 | | | | 129 | |
Copper | | | 66 | | | | - | |
| | |
| Total capital expenditures - open pit and underground mine development | | | $ 842 | | | | $ 595 | |
Capitalized interest | | | 382 | | | | 275 | |
Total consolidated capital expenditures | | | $ 4,973 | | | | $ 3,778 | |
Capital expenditures attributable to non-controlling interests3 | | | 375 | | | | 407 | |
Total capital expenditures attributable to Barrick | | | 4,598 | | | | 3,371 | |
Total capital expenditures - copper | | | 385 | | | | 55 | |
| | |
Total capital expenditures - gold | | | 4,024 | | | | 3,162 | |
| | |
Capital expenditures - other | | | 189 | | | | 154 | |
Total capital expenditures attributable to Barrick | | | 4,598 | | | | 3,371 | |
| 1 | These amounts are presented on a cash basis consistent with the amounts presented on the consolidated statement of cash flows. |
| 2 | On an accrual basis, our share of project capital expenditures is $2,501 million including capitalized interest. |
| 3 | Amount reflects our partner’s share of expenditures at the Pueblo Viejo and Cerro Casale project on a cash basis. |
| 4 | These amounts include $162 million of capital expenditures at Barrick Energy (2010: $86 million). |
Our ability to access low-cost borrowing allowed us to generate financing cash inflow of $6,291 million in 2011. The significant financing activities in 2011 include financing inflows of $4 billion in debt securities and $2.5 billion in proceeds from the drawdown of our line of credit. These amounts were partially offset by dividend payments of $509 million and debt repayments of $380 million. This compares to financing inflows in 2010 of $1,434 million in 2011, which primarily includes $884 million in proceeds from public issuance of common shares by ABG in the first quarter 2010 and the drawdown of $782 million of Pueblo Viejo project financing in second quarter 2010 partially offset by debt repayments of $149 million and dividend payments of $436 million.
Financial Instruments
We use a mixture of cash, long-term debt and shareholders’ equity to maintain an efficient capital structure and ensure adequate liquidity exists to meet the cash needs of our business. We use interest rate contracts to mitigate interest rate risk that is implicit in our cash balances and outstanding long-term debt. In the normal course of business, we are inherently exposed to currency and commodity price risk. We use currency and commodity hedging instruments to mitigate these inherent business risks. We also hold certain derivative instruments that do not qualify for hedge accounting treatment. These non-hedge derivatives are described in note 22 to our consolidated financial statements. For a discussion of certain risks and assumptions that relate to the use of derivatives, including market risk, liquidity risk and credit risk, refer to notes 2 and 25 to our consolidated financial statements. For a discussion of the methods used to value financial instruments, as well as any significant assumptions, refer also to note 2 to our consolidated financial statements.
Counterparty Risk
Our financial position is also dependent, in part, on our exposure to the risk of counterparty defaults related to the net fair value of our derivative contracts. Counterparty risk is the risk that a third party might fail to fulfill its performance obligations under the terms of
| | | | |
| BARRICK YEAR-END 2011 | | 54 | | MANAGEMENT’S DISCUSSION AND ANALYSIS |
a financial instrument. Counterparty risk can be assessed both in terms of credit risk and liquidity risk. For cash and equivalents and accounts receivable, credit risk represents the carrying amount on the balance sheet, net of any overdraft positions.
For derivatives, when the fair value is positive, this creates credit risk. When the fair value of a derivative is negative, we assume no credit risk. However, liquidity risk exists to the extent a counterparty is no longer able to perform in accordance with the terms of the contract due to insolvency. In cases where we have a legally enforceable master netting agreement with a counterparty, credit risk exposure represents the net amount of the positive and negative fair values for similar types of derivatives. For a net negative amount, we regard credit risk as being zero. For a net positive amount, this is a reasonable basis to measure credit risk when there is a legally enforceable master netting agreement. We mitigate credit and liquidity risk by:
| • | | Entering into derivatives with high credit-quality counterparties; |
| • | | Limiting the amount of exposure to each counterparty; and |
| • | | Monitoring the financial condition of counterparties. |
As of December 31, 2011, we had 24 counterparties to our derivative positions. We proactively manage our exposure to individual counterparties in order to mitigate both credit and liquidity risks. For those counterparties with which we hold a net asset position (total balance attributable to the counterparties is $899 million), four hold greater than 10% of our mark-to-market asset position, with the largest counterparty holding 14%. We have two counterparties with which we are in a net liability position, for a total net liability of 1 million. On an ongoing basis, we monitor our exposures and ensure that none of the counterparties with which we hold outstanding contracts has declared insolvency.
Summary of Financial Instruments
| | | | | | | | | | | | |
As at December 31, 2011 | | | | | | | | | | | | |
| Financial Instrument | | Principal/Notional Amount | | | | | | | Associated Risks |
| | | | | | | | | | • | | Interest rate |
Cash and equivalents | | | | | $ 2,745 | | | million | | • | | Credit |
| | | | | | | | | | • | | Credit |
Accounts receivable | | | | | $ 426 | | | million | | • | | Market |
| | | | | | | | | | • | | Market |
Available-for-sale securities | | | | | $ 161 | | | million | | • | | Liquidity |
Accounts payable | | | | | $ 2,083 | | | million | | • | | Interest rate |
Debt | | | | | $ 13,434 | | | million | | • | | Interest rate |
Restricted share units | | | | | $ 48 | | | million | | • | | Market |
Deferred share units | | | | | $ 8 | | | million | | • | | Market |
Derivative instruments - currency contracts | | CAD | | | 1,239 | | | million | | • | | Credit |
| | CLP | | | 800,130 | | | million | | • | | Market/liquidity |
| | AUD | | | 4,471 | | | million | | | | |
| | EUR | | | 35 | | | million | | | | |
| | PGK | | | 40 | | | million | | | | |
| | | ZAR | | | 510 | | | million | | | | |
Derivative instruments - silver contracts | | | | | 45 | | | million oz | | • | | Market/liquidity |
Derivative instruments - copper contracts | | | | | 289 | | | million lbs | | • | | Credit |
| | Diesel | | | 5.0 | | | million bbls | | • | | Market/liquidity |
| | | Propane | | | 4 | | | million gallons | | • | | Credit |
Derivative instruments - interest rate contracts | | Receive fixed interest rate swaps | | | $ 200 | | | million | | • | | Market/liquidity |
Non-hedge derivatives | | | | | various | | | | | • | | Market/liquidity |
| | | | | | | | | | | • | | Credit |
| | | | |
| BARRICK YEAR-END 2011 | | 55 | | MANAGEMENT’S DISCUSSION AND ANALYSIS |
Commitments and Contingencies
Capital Expenditures Not Yet Committed
We expect to incur capital expenditures during the next five years for both projects and producing mines. The projects are at various stages of development, from preliminary exploration or scoping study stage through to the construction execution stage. The ultimate decision to incur capital expenditures at each potential
site is subject to positive results which allow the project to advance past decision hurdles. Three projects were at an advanced stage at December 31, 2011, namely Pueblo Viejo, Pascua-Lama and Jabal Sayid (refer to pages 46-48 for further details).
Contractual Obligations and Commitments
| | | | | | | | | | | | | | | | | | | | | | | | | | | | |
| | | Payments due As at December 31 | |
| ($ millions) | | 2012 | | | 2013 | | | 2014 | | | 2015 | | | 2016 | | | 2017 and
thereafter | | | Total | |
Debt1 | | | | | | | | | | | | | | | | | | | | | | | | | | | | |
Repayment of principal | | | $ 168 | | | | $ 2,061 | | | | $ 1,140 | | | | $ 190 | | | | $ 2,590 | | | | $ 7,142 | | | | $ 13,291 | |
Capital leases | | | 28 | | | | 30 | | | | 26 | | | | 24 | | | | 16 | | | | 19 | | | | 143 | |
Interest | | | 562 | | | | 544 | | | | 506 | | | | 480 | | | | 442 | | | | 5,096 | | | | 7,630 | |
Provisions for environmental rehabilitation2 | | | 151 | | | | 126 | | | | 72 | | | | 79 | | | | 111 | | | | 1,791 | | | | 2,330 | |
Operating leases | | | 25 | | | | 22 | | | | 15 | | | | 14 | | | | 11 | | | | 68 | | | | 155 | |
Restricted share units | | | 27 | | | | 19 | | | | 2 | | | | - | | | | - | | | | - | | | | 48 | |
Pension benefits and other post-retirement benefits | | | 37 | | | | 28 | | | | 28 | | | | 28 | | | | 28 | | | | 141 | | | | 290 | |
Derivative liabilities3 | | | 22 | | | | 10 | | | | 20 | | | | 9 | | | | 3 | | | | - | | | | 64 | |
Purchase obligations for supplies and consumables4 | | | 872 | | | | 215 | | | | 149 | | | | 114 | | | | 192 | | | | 206 | | | | 1,748 | |
Capital commitments5 | | | 1,740 | | | | 15 | | | | 1 | | | | 1 | | | | 7 | | | | - | | | | 1,764 | |
Social development costs | | | 16 | | | | 16 | | | | 6 | | | | 6 | | | | 6 | | | | 64 | | | | 114 | |
Total | | | $ 3,648 | | | | $ 3,086 | | | | $ 1,965 | | | | $ 945 | | | | $ 3,406 | | | | $ 14,527 | | | | $ 27,577 | |
| 1 | Debt and Interest - Our debt obligations do not include any subjective acceleration clauses or other clauses that enable the holder of the debt to call for early repayment, except in the event that we breach any of the terms and conditions of the debt or for other customary events of default. The debt and interest amounts include 100% of the Pueblo Viejo financing, even though we have only guaranteed our 60% share. We are not required to post any collateral under any debt obligations. The terms of our debt obligations would not be affected by deterioration in our credit rating. Projected interest payments on variable rate debt were based on interest rates in effect at December 31, 2011. Interest is calculated on our long-term debt obligations using both fixed and variable rates. |
| 2 | Provisions for Environmental Rehabilitation - Amounts presented in the table represent the undiscounted future payments for the expected cost of provisions for environmental rehabilitation. |
| 3 | Derivative Liabilities - Amounts presented in the table relate to derivative contracts disclosed under notes 22 to the consolidated financial statements. Payments related to derivative contracts cannot be reasonably estimated given variable market conditions. |
| 4 | Purchase Obligations for Supplies and Consumables - Includes commitments related to new purchase obligations to secure a supply of acid, tires and cyanide for our production process. |
| 5 | Capital Commitments - Purchase obligations for capital expenditures include only those items where binding commitments have been entered into. Commitments at the end of 2011 mainly relate to construction capital at Pueblo Viejo, Pascua-Lama and Jabal Sayid. |
Litigation and Claims
We are currently subject to various litigation as disclosed in note 33 to the consolidated financial statements, and we may be involved in disputes with other parties in the future that may result in litigation.
If we are unable to resolve these disputes favorably, it may have a material adverse impact on our financial condition, cash flow and results of operations.
| | | | |
| BARRICK YEAR-END 2011 | | 56 | | MANAGEMENT’S DISCUSSION AND ANALYSIS |
REVIEW OF QUARTERLY RESULTS
Quarterly Information1
| | | | | | | | | | | | | | | | | | | | | | | | | | | | | | | | |
| | | 2011 | | | 2010 | |
| ($ millions, except where indicated) | | Q4 | | | Q3 | | | Q2 | | | Q1 | | | Q4 | | | Q3 | | | Q2 | | | Q1 | |
Revenues | | $ | 3,789 | | | $ | 4,007 | | | $ | 3,426 | | | $ | 3,090 | | | $ | 3,011 | | | $ | 2,788 | | | $ | 2,621 | | | | $2,581 | |
Realized price - gold2 | | | 1,664 | | | | 1,743 | | | | 1,513 | | | | 1,389 | | | | 1,368 | | | | 1,237 | | | | 1,205 | | | | 1,114 | |
Realized price - copper2 | | | 3.69 | | | | 3.54 | | | | 4.07 | | | | 4.25 | | | | 3.99 | | | | 3.43 | | | | 2.93 | | | | 3.29 | |
Cost of sales | | | 1,733 | | | | 1,730 | | | | 1,496 | | | | 1,357 | | | | 1,331 | | | | 1,301 | | | | 1,262 | | | | 1,268 | |
Net earnings4 | | | 959 | | | | 1,365 | | | | 1,159 | | | | 1,001 | | | | 961 | | | | 942 | | | | 859 | | | | 820 | |
Per share (dollars)3,4 | | | 0.96 | | | | 1.37 | | | | 1.16 | | | | 1.00 | | | | 0.97 | | | | 0.96 | | | | 0.87 | | | | 0.83 | |
Adjusted net earnings5 | | | 1,166 | | | | 1,379 | | | | 1,117 | | | | 1,004 | | | | 1,018 | | | | 912 | | | | 824 | | | | 763 | |
Per share (dollars)3,4 | | | 1.17 | | | | 1.38 | | | | 1.12 | | | | 1.01 | | | | 1.02 | | | | 0.93 | | | | 0.84 | | | | 0.78 | |
EBITDA5 | | | 1,998 | | | | 2,460 | | | | 2,090 | | | | 1,828 | | | | 1,770 | | | | 1,669 | | | | 1,489 | | | | 1,593 | |
Operating cash flow | | | 1,224 | | | | 1,902 | | | | 750 | | | | 1,439 | | | | 866 | | | | 1,441 | | | | 1,127 | | | | 1,151 | |
Adjusted operating cash flow5 | | $ | 1,299 | | | | $2,004 | | | $ | 938 | | | $ | 1,439 | | | $ | 1,522 | | | $ | 1,441 | | | $ | 1,127 | | | | $1,151 | |
| 1 | The amounts presented in this table include the results of discontinued operations. |
| 2 | Per ounce/pound weighted average. Realized price is a non-GAAP financial performance measure with no standard meaning under IFRS. For further information and a detailed reconciliation, please see page 77 of this MD&A. |
| 3 | Calculated using weighted average number of shares outstanding under the basic method of earnings per share. |
| 4 | Sum of all the quarters may not add up to the yearly total due to rounding. |
| 5 | Adjusted net earnings, EBITDA and adjusted operating cash flow are non-GAAP financial performance measures with no standard meaning under IFRS. For further information and a detailed reconciliation, please see pages 72 - 79 of this MD&A. |
Our financial results for the last eight quarters reflect a trend of increasing spot gold and copper prices that have translated into increasing revenues, net earnings, EBITDA and adjusted operating cash flow partially offset by higher gold and copper production costs mainly caused by inflationary pressures. These financial results were driven by tremendous gold margins. Our results have shown significant margin expansion over the past several years as we continue to benefit from rising gold prices and held the line on our cash cost.
Fourth Quarter Results
In fourth quarter 2011, we reported net earnings and adjusted net earnings of $959 million and $1,166 million, respectively, compared to $961 million and $1,018 million, respectively, in fourth quarter 2010.
The decrease in both net earnings and adjusted net earnings were largely driven by higher market gold and copper prices along with higher gold and copper sales volumes, which were partially offset by higher cost of sales applicable to gold and copper and higher total cash costs for gold and copper.
In fourth quarter 2011, we sold 1.87 million ounces of gold and 135 million pounds of copper, compared to 1.83 million ounces of gold and 103 million pounds of copper in fourth quarter 2010. Revenues in fourth quarter 2011 were higher than the same prior year period reflecting higher market prices for both copper and gold and higher gold and copper sales volumes. In fourth
quarter 2011, cost of sales was $1,733 million, total cash costs of gold was $505 per ounce and total cash cost of $1.99 per pound for copper, an increase of $402 million, $65 per ounce, and $0.91 per pound respectively, from fourth quarter 2010. Cost of sales was higher, reflecting higher direct mining costs, including higher labor, energy, maintenance and consumable costs, the impact of including production from Lumwana, beginning on June 1, 2011, partially offset by an increase in capitalized production phase stripping costs for gold. Total gold cash costs were higher as a result of increasing direct mining costs, including higher labor, energy, maintenance and consumables costs. Total copper cash costs increased due to inclusion of Lumwana production in the sales mix. In fourth quarter 2011, net cash costs increased by $104 per ounce to $382 per ounce, compared to $278 per ounce in fourth quarter 2010, reflecting higher total gold cash costs.
Operating cash flow in fourth quarter 2011 was $1,224 million, a significant increase from fourth quarter 2010. Fourth quarter operating cash flow of 2010 reflected the cost of settling the gold sales contracts of $656 million.
Adjusted operating cash flow for the fourth quarter was $1,299 million, down 15% over the prior year period. The decrease in adjusted operating cash flow reflects lower net earnings and higher income taxes paid. Adjusted operating cash flow before working capital adjustments was $1,405 million, down $639 million from prior year period.
| | | | |
| BARRICK YEAR-END 2011 | | 57 | | MANAGEMENT’S DISCUSSION AND ANALYSIS |
INTERNATIONAL FINANCIAL REPORTING STANDARDS (IFRS)
We have adopted IFRS effective January 1, 2011. Our transition date is January 1, 2010 (the “transition date”) and the Company has prepared its opening IFRS balance sheet as at that date. Our IFRS accounting policies are described in note 2 of the Financial Statements.
Elected exemptions from full retrospective application
In preparing the accompanying Financial Statements in accordance with IFRS 1 First-time Adoption of International Financial Reporting Standards (“IFRS 1”), the Company has applied certain of the optional exemptions from full retrospective application of IFRS. The optional exemptions applied are described below.
(i) Business combinations
We have applied the business combinations exemption in IFRS 1 to not apply International Financial Reporting Standard 3Business Combinations (“IFRS 3”) retrospectively to past business combinations. Accordingly, the Company has not restated business combinations that took place prior to the transition date.
(ii) Fair value or revaluation as deemed cost
We have elected to measure certain items of Property, Plant and Equipment (“PP&E”) at fair value as at January 1, 2010 or revaluation amounts previously determined under US GAAP and use those amounts as deemed cost as at January 1, 2010. We have made this election at the following properties: Pascua-Lama, Goldstrike, Plutonic, Marigold, Pierina, Sedibelo and Osborne. We have also elected to adopt this election
for certain assets at Barrick Energy, which were adjusted by $166 million to their fair value of $342 million on the transition date to IFRS, due to a decline in oil prices.
(iii) Asset related to Provision for Environmental Rehabilitation
We have elected to take a simplified approach to calculate and record the asset related to the environmental rehabilitation provision on our opening IFRS consolidated balance sheet. The environmental rehabilitation provision calculated on the transition date in accordance with International Accounting Standard 37Provisions, Contingent Liabilities and Contingent Assets (“IAS 37”) was discounted back to the date when the provision first arose on the mineral property, at which date the corresponding asset was set up and then depreciated to its carrying amount as at the transition date.
(iv) Employee benefits
We have elected to recognize all cumulative actuarial gains and losses as at January 1, 2010 in opening retained earnings for the company’s employee benefit plans.
(v) Cumulative translation differences
We have elected to set the previously accumulated cumulative translation account, which was included in accumulated other comprehensive income (“AOCI”), to zero as at January 1, 2010 and absorbed the balance into retained earnings.
| | | | |
| BARRICK YEAR-END 2011 | | 58 | | MANAGEMENT’S DISCUSSION AND ANALYSIS |
Reconciliation of Consolidated Balance Sheets as Reported Under US GAAP and IFRS
| | | | | | | | | | | | | | | | | | | | | | | | | | | | | | |
| | | | | | | | | January 1, 2010 | | | December 31, 2010 | |
| | | Ref | | | | | | US GAAP1 | | | Adj | | | IFRS | | | US GAAP1 | | | Adj | | | IFRS | |
Assets | | | | | | | | | | | | | | | | | | | | | | | | | | | | | | |
Current assets | | | | | | | | | | | | | | | | | | | | | | | | | | | | | | |
Cash and equivalents | | | | | | | | | $ 2,564 | | | | $ - | | | | $ 2,564 | | | | $ 3,968 | | | | $ - | | | | $ 3,968 | |
Accounts receivable | | | | | | | | | 251 | | | | 8 | | | | 259 | | | | 346 | | | | 24 | | | | 370 | |
Inventories | | A | | | | | | | 1,540 | | | | (52) | | | | 1,488 | | | | 1,852 | | | | (54) | | | | 1,798 | |
Other current assets | | | | | | | | | 524 | | | | (6) | | | | 518 | | | | 947 | | | | (12) | | | | 935 | |
Total current assets (excluding assets classified as held for sale) | | | | | | | | | 4,879 | | | | (50 | ) | | | 4,829 | | | | 7,113 | | | | (42 | ) | | | 7,071 | |
Assets classified as held for sale | | | | | | | | | 59 | | | | 41 | | | | 100 | | | | - | | | | - | | | | - | |
Total current assets | | | | | | | | | 4,938 | | | | (9) | | | | 4,929 | | | | 7,113 | | | | (42) | | | | 7,071 | |
Non current assets | | | | | | | | | | | | | | | | | | | | | | | | | | | | | | |
Equity in investees | | B | | | | | | | 1,136 | | | | (12) | | | | 1,124 | | | | 291 | | | | 105 | | | | 396 | |
Other investments | | E | | | | | | | 92 | | | | (30) | | | | 62 | | | | 203 | | | | (32) | | | | 171 | |
Property, plant and equipment | | C | | | | | | | 13,125 | | | | 253 | | | | 13,378 | | | | 17,751 | | | | 139 | | | | 17,890 | |
Goodwill | | C | | | | | | | 5,197 | | | | - | | | | 5,197 | | | | 5,287 | | | | 809 | | | | 6,096 | |
Intangible assets | | C | | | | | | | 66 | | | | 209 | | | | 275 | | | | 140 | | | | 335 | | | | 475 | |
Deferred income tax assets | | D | | | | | | | 949 | | | | (348) | | | | 601 | | | | 467 | | | | 158 | | | | 625 | |
Other assets | | A, E | | | | | | | 1,531 | | | | (173) | | | | 1,358 | | | | 2,070 | | | | (157) | | | | 1,913 | |
Assets of discontinued operations | | | | | | | | | 41 | | | | (41) | | | | - | | | | - | | | | - | | | | - | |
Total assets | | | | | | | | | $ 27,075 | | | | $ (151) | | | | $ 26,924 | | | | $ 33,322 | | | | $ 1,315 | | | | $ 34,637 | |
| | | | | | | | | |
| | | | | | | | | | | | | | | | | | | | | | | | | | | | | | | |
Liabilities and Equity | | | | | | | | | | | | | | | | | | | | | | | | | | | | | | |
Current liabilities | | | | | | | | | | | | | | | | | | | | | | | | | | | | | | |
Accounts payable | | | | | | | | | $ 1,221 | | | | $ - | | | | $ 1,221 | | | | $ 1,511 | | | | $ - | | | | $ 1,511 | |
Debt | | | | | | | | | 54 | | | | - | | | | 54 | | | | 14 | | | | - | | | | 14 | |
Current income tax liabilities | | | | | | | | | 94 | | | | 10 | | | | 104 | | | | 535 | | | | 15 | | | | 550 | |
Other current liabilities | | | | | | | | | 383 | | | | (17) | | | | 366 | | | | 429 | | | | (13) | | | | 416 | |
Total current liabilities (excluding liabilities classified as held for sale) | | | | | | | | | 1,750 | | | | (5) | | | | 1,745 | | | | 2,489 | | | | 2 | | | | 2,491 | |
Liabilities classified as held for sale | | | | | | | | | 23 | | | | 26 | | | | 49 | | | | - | | | | - | | | | - | |
Total current liabilities | | | | | | | | | 1,773 | | | | 21 | | | | 1,794 | | | | 2,489 | | | | 2 | | | | 2,491 | |
Non-current liabilities | | | | | | | | | | | | | | | | | | | | | | | | | | | | | | |
Debt | | F | | | | | | | 6,281 | | | | (157) | | | | 6,124 | | | | 6,678 | | | | (54) | | | | 6,624 | |
Provisions | | G | | | | | | | 1,122 | | | | 286 | | | | 1,408 | | | | 1,439 | | | | 329 | | | | 1,768 | |
Deferred income tax liabilities | | D | | | | | | | 1,184 | | | | (224) | | | | 960 | | | | 1,114 | | | | 857 | | | | 1,971 | |
Other liabilities | | | | | | | | | 1,145 | | | | (261) | | | | 884 | | | | 868 | | | | (302) | | | | 566 | |
| | | | | | | | | |
Liabilities of discontinued operations | | | | | | | | | 23 | | | | (23) | | | | - | | | | - | | | | - | | | | - | |
Total liabilities | | | | | | | | | 11,528 | | | | (358) | | | | 11,170 | | | | 12,588 | | | | 832 | | | | 13,420 | |
Equity | | | | | | | | | | | | | | | | | | | | | | | | | | | | | | |
Capital stock | | | | | | | | | 17,390 | | | | 2 | | | | 17,392 | | | | 17,790 | | | | 30 | | | | 17,820 | |
Other | | | | | | | | | - | | | | 143 | | | | 143 | | | | 288 | | | | 26 | | | | 314 | |
Retained earnings (deficit) | | H | | | | | | | (2,382) | | | | (153) | | | | (2,535) | | | | 456 | | | | 153 | | | | 609 | |
| | | | | | | | | |
Accumulated other comprehensive income | | I | | | | | | | 55 | | | | 177 | | | | 232 | | | | 531 | | | | 198 | | | | 729 | |
| | | | | | | | | |
| Total equity attributable to Barrick Gold Corporation shareholders | | | | | | | | | 15,063 | | | | 169 | | | | 15,232 | | | | 19,065 | | | | 407 | | | | 19,472 | |
Non-controlling interests | | J | | | | | | | 484 | | | | 38 | | | | 522 | | | | 1,669 | | | | 76 | | | | 1,745 | |
Total equity | | | | | | | | | 15,547 | | | | 207 | | | | 15,754 | | | | 20,734 | | | | 483 | | | | 21,217 | |
Total liabilities and equity | | | | | | | | | $ 27,075 | | | | $ (151) | | | | $ 26,924 | | | | $ 33,322 | | | | $ 1,315 | | | | $ 34,637 | |
| 1 | Certain US GAAP figures have been reclassified to conform to our IFRS financial statement presentation. |
| | | | |
| BARRICK YEAR-END 2011 | | 59 | | MANAGEMENT’S DISCUSSION AND ANALYSIS |
Consolidated Statements of Comprehensive Income
| | | | | | | | | | | | | | | | | | | | |
| | | | | | | | | For the year ended December 31, 2010 | | | |
| | | Ref | | | | | | US GAAP1 | | | Adj | | | IFRS | | | |
Sales | | K | | | | | | | $ 10,924 | | | | $ 77 | | | | $ 11,001 | | | |
Costs and expenses | | | | | | | | | | | | | | | | | | | | |
Cost of sales | | L | | | | | | | 5,350 | | | | (188) | | | | 5,162 | | | |
Corporate administration | | | | | | | | | 154 | | | | 2 | | | | 156 | | | |
Exploration and evaluation | | M | | | | | | | 333 | | | | (104) | | | | 229 | | | |
Other expense | | | | | | | | | 463 | | | | (8) | | | | 455 | | | |
Impairment charges (reversals) | | N | | | | | | | 7 | | | | (80) | | | | (73) | | | |
| | | | | | | | | 6,307 | | | | (378) | | | | 5,929 | | | |
Other income | | | | | | | | | 124 | | | | (8) | | | | 116 | | | |
Loss from equity investees | | | | | | | | | (41) | | | | 17 | | | | (24) | | | |
| Gain (loss) on non-hedge derivatives | | O | | | | | | | - | | | | 69 | | | | 69 | | | |
Income before finance items and income taxes | | | | | | | | | 4,700 | | | | 533 | | | | 5,233 | | | |
| | | | | | | |
Finance items | | | | | | | | | | | | | | | | | | | | |
Finance income | | | | | | | | | 14 | | | | - | | | | 14 | | | |
Finance costs | | | | | | | | | (168) | | | | (12) | | | | (180) | | | |
Income before income taxes | | | | | | | | | 4,546 | | | | 521 | | | | 5,067 | | | |
Income tax expense | | P | | | | | | | (1,370) | | | | (191) | | | | (1,561) | | | |
| Income from continuing operations | | | | | | | | | 3,176 | | | | 330 | | | | 3,506 | | | |
| Income from discontinued operations | | | | | | | | | 121 | | | | 3 | | | | 124 | | | |
Net income | | | | | | | | | 3,297 | | | | 333 | | | | 3,630 | | | |
| | | | | | | |
| Unrealized gains (losses) on available-for-sale (AFS) financial securities, net of tax | | | | | | | | | 64 | | | | - | | | | 64 | | | |
| | | | | | | |
| Realized (gains) losses and impairments (recoveries) on AFS financial securities, net of tax | | | | | | | | | (11) | | | | - | | | | (11) | | | |
| | | | | | | |
| Unrealized gains (losses) on derivatives designated as cash flow hedges, net of tax | | | | | | | | | 485 | | | | 33 | | | | 518 | | | |
| | | | | | | |
| Realized (gains) losses on derivatives designated as cash flow hedges, net of tax | | | | | | | | | (82) | | | | (6) | | | | (88) | | | |
| | | | | | | |
| Actuarial gains (losses) on post employment benefit obligations, net of tax | | | | | | | | | (2) | | | | - | | | | (2) | | | |
Currency translation adjustments, net of tax | | | | | | | | | 22 | | | | (8) | | | | 14 | | | |
Other comprehensive income | | | | | | | | | 476 | | | | 19 | | | | 495 | | | |
Total comprehensive income | | | | | | | | | $ 3,773 | | | | $ 352 | | | | $ 4,125 | | | |
| | | | | | | | | | | | | | | | | | | | | |
Attributable to: | | | | | | | | | | | | | | | | | | | | |
| Equity holders of Barrick Gold Corporation | | | | | | | | | $ 3,750 | | | | 327 | | | | $ 4,077 | | | |
Non-controlling interests | | | | | | | | | $ 23 | | | | $ 25 | | | | $ 48 | | | |
| 1 | Certain US GAAP figures have been reclassified to conform to our IFRS financial statement presentation. |
| | | | |
| BARRICK YEAR-END 2011 | | 60 | | MANAGEMENT’S DISCUSSION AND ANALYSIS |
Consolidated Statements of Cash Flow
Under IFRS, as a result of capitalized production phase stripping costs and capitalized E&E costs, operating cash inflows for the year ended December 31, 2010 increased by $458 million to $4,585 million and investing cash outflows increased by $458 million to $4,630 million, compared to the equivalent US GAAP amounts for the same periods.
References
Consolidated Balance Sheets
| | | | | | | | |
| Description | | Jan.1, 2010 | | | Dec.31, 2010 | |
| Capitalized production phase stripping1 | | | $ (142) | | | | $ (116) | |
Other2 | | | 3 | | | | (4) | |
| | | | (139) | | | | (120) | |
| Short-term inventories | | | (52) | | | | (54) | |
Long-term inventories | | | (87) | | | | (66) | |
| | | | $ (139) | | | | $ (120) | |
| 1. | The most significant IFRS impact on inventory was the change in the accounting treatment of production phase stripping costs for open pit mines, which we capitalize to PP&E when management assesses that it is probable that the stripping costs will result in future economic benefits. Under US GAAP, these costs were treated as production costs. Capitalized production phase stripping costs also resulted in an increase in depreciation. Refer to note C below for more information on capitalized production phase stripping costs. |
| 2. | Includes asset retirement cost adjustments. Refer to note C. |
| | | | | | | | |
| Description | | Jan.1, 2010 | | | Dec.31, 2010 | |
| Highland Gold impairment reversal1 | | | $ 55 | | | | $ 139 | |
| Elimination of interest capitalization on equity investees2 | | | (125) | | | | (46) | |
| Capitalized E&E3 | | | 22 | | | | 12 | |
| Accumulated hedge losses relating to capital expenditures reclassified4 | | | 36 | | | | - | |
| | | | $ (12) | | | | $ 105 | |
| 1. | Under IFRS, past impairments of equity investments must be reversed in the future if there is a recovery in the fair value of the investment. In 2008, we recorded an impairment of $140 million on our investment in Highland Gold. The fair value of the investment has increased since the write down; therefore, partial reversals were recorded under IFRS at the transition date and in subsequent quarters. |
| 2. | Under IFRS, our investment in equity investees are not qualifying assets that are eligible for interest capitalization. On transition and in subsequent quarters, this resulted in the reversal of previously capitalized interest on our equity investees where the primary activities are the development of mining projects, which principally impacted the carrying amount of our investment in Cerro Casale. |
| 3. | Under US GAAP, E&E costs can only be capitalized when Barrick has declared US 2P reserves in accordance with Industry Guide 7 issued by the US SEC. Under IFRS, we capitalize E&E costs when management assesses that it is probable that the expenditures will result in future economic benefits. This resulted in the capitalization of previously expensed E&E costs for the Cerro Casale project. |
| 4. | IFRS requires that hedge gains or losses on capital expenditures be recorded against the related asset. Accordingly, hedge losses on our capital expenditures incurred for equity method investments were reclassified from AOCI to Equity in Investees. |
| C) | Property, Plant and Equipment |
| | | | | | | | |
| | | Increase (decrease) as at | |
| Description | | Jan.1, 2010 | | | Dec.31, 2010 | |
| Land, Building and Equipment: | | | | | |
| Deemed cost election for oil & gas properties1 | | | $ (166 | ) | | | $ (166 | ) |
| Accumulated hedge gains reclassified from AOCI2 | | | (56 | ) | | | (62 | ) |
| | | (222 | ) | | | (228 | ) |
| Mining Interest - Depreciable: | | | | | |
| Capitalized production phase stripping3 | | | 550 | | | | 736 | |
| Asset retirement cost adjustments4 | | | (41 | ) | | | (19 | ) |
| | | 509 | | | | 717 | |
| Mining Interest - Non-Depreciable: | | | | | |
Capitalized E&E5 | | | 188 | | | | 292 | |
| Acquired exploration properties reclassified to intangible assets6 | | | (209 | ) | | | (335 | ) |
Cerro Casale acquisition7 | | | - | | | | (313 | ) |
| | | (21 | ) | | | (356 | ) |
Other adjustments | | | (13 | ) | | | 6 | |
| | | | $ 253 | | | | $ 139 | |
| 1. | As permitted in IFRS 1, we took a deemed cost election for Barrick Energy, which resulted in an adjustment to the carrying amount of certain assets with an offset to retained earnings. For more information on IFRS 1 elections, refer to note 3A of the Financial Statements. |
| 2. | IFRS requires that hedge gains or losses on capital expenditures be recorded with the related asset. Accordingly, hedge gains on our capital expenditures at capital projects and certain operating mines were reclassified from AOCI to the related asset. |
| 3. | Under IFRS, production phase stripping costs that generate a future economic benefit are capitalized as open pit mine development costs within PP&E. On transition and in subsequent quarters, this resulted in a net increase in PP&E. |
| 4. | As permitted in IFRS 1, we elected to take a simplified approach to calculate and record the asset related to the rehabilitation provision on our opening IFRS consolidated balance sheet. For more information on IFRS 1 elections available to first-time adopters, refer to note 3A of the Financial Statements. Subsequent to January 1, 2010, asset retirement costs increased or decreased based on movements in foreign exchange and discount rates. |
| 5. | Under US GAAP, E&E costs can only be capitalized when Barrick has declared US 2P reserves in accordance with Industry Guide 7 issued by the US SEC. IFRS allows capitalization of E&E costs when management assesses that it is probable that the expenditures will result in future economic benefits. At January 1, 2010, the difference resulted from additional E&E costs capitalized under IFRS for the Pueblo Viejo, Buzwagi, Veladero and Lagunas Norte properties. Capitalized costs are net of accumulated depreciation. |
| 6. | Under IFRS, on acquisition of a mineral property in the exploration stage, we prepare an estimate of the fair value attributable to the exploration potential including mineral resources, if any, of that property. This fair value is recorded as an intangible asset (acquired exploration potential) as at the date of acquisition. This change resulted in the reclassification of PP&E related to acquired exploration potential primarily for our Kainantu property, to Intangibles Assets. |
| 7. | Under IFRS, Cerro Casale met the definition of a business when we acquired an additional 25% ownership, obtaining control, in first quarter 2010. Under US GAAP, Cerro Casale was accounted for as an acquisition of an asset. This accounting difference resulted in the recognition of goodwill of $809 million. |
| | | | |
| BARRICK YEAR-END 2011 | | 61 | | MANAGEMENT’S DISCUSSION AND ANALYSIS |
Adjustments to PP&E by Segment:
| | | | | | | | |
| | | Increase (decrease) as at | |
| Description | | Jan.1, 2010 | | | Dec.31, 2010 | |
Gold | | | | | | | | |
North America | | | $ 248 | | | | $ 272 | |
South America | | | 196 | | | | 235 | |
Australia Pacific | | | (154 | ) | | | (74 | ) |
African Barrick Gold | | | 21 | | | | 4 | |
Copper | | | 6 | | | | 14 | |
Capital Projects | | | 95 | | | | (161 | ) |
Barrick Energy | | | (159 | ) | | | (151 | ) |
| | | | $ 253 | | | | $ 139 | |
| D) | Deferred Income Tax Assets and Liabilities |
| | | | | | | | |
| | | Increase (decrease) as at | |
| Description | | Jan.1, 2010 | | | Dec.31, 2010 | |
Deferred income tax assets1 | | | $(348) | | | | $158 | |
Deferred income tax liabilities1 | | | $(224) | | | | $857 | |
| 1. | Deferred tax asset and liability balances changed primarily due to the tax effects of the IFRS adjustments. In addition, for December 31, 2010, the IFRS deferred tax liability includes $523 million related to the finalization of the Cerro Casale purchase price allocation which is adjusted retroactively under IFRS. The US GAAP deferred tax amount did not include amounts related to the Cerro Casale purchase price allocation. |
Sources of Deferred Income Tax Assets and Liabilities
| | | | | | | | |
At December 31, 2010 | | | US GAAP | | | | IFRS | |
Deferred tax assets | | | | | | | | |
Tax loss carry forwards | | | $ 553 | | | | $ 337 | |
Capital tax loss carry forwards | | | 101 | | | | - | |
| Alternative minimum tax (“AMT”) credits | | | 318 | | | | 318 | |
PER | | | 494 | | | | 469 | |
Property, plant and equipment | | | 177 | | | | - | |
| Post-retirement benefit obligations | | | 14 | | | | 25 | |
Accrued interest payable | | | 63 | | | | 63 | |
Other | | | 53 | | | | - | |
| | | 1,773 | | | | 1,212 | |
Valuation allowances | | | (425) | | | | - | |
| | | 1,348 | | | | 1,212 | |
| | |
Deferred tax liabilities | | | | | | | | |
Property, plant and equipment | | | (1,725) | | | | (2,177) | |
Derivative instruments | | | (168) | | | | (160) | |
Inventory | | | (102) | | | | (212) | |
Other | | | - | | | | (9) | |
| | | | $ (647) | | | | $ (1,346) | |
| | |
Classification: | | | | | | | | |
Non-current assets | | | $ 467 | | | | $ 625 | |
Non-current liabilities | | | (1,114) | | | | (1,971) | |
| | | | $ (647) | | | | $ (1,346) | |
| | | | | | | | |
| | | Increase (decrease) as at | |
| Description | | Jan.1, 2010 | | | Dec.31, 2010 | |
| Capitalized production phase stripping costs related to long-term inventory1 | | | $ (87) | | | | $ (66) | |
| Debt issuance costs reclassified to debt2 | | | (45) | | | | (54) | |
| Reversal of the RSU long-term asset | | | (68) | | | | (70) | |
| Investment in Yokohama reclassified | | | 30 | | | | 32 | |
Other adjustments | | | (3) | | | | 1 | |
| | | | $ (173) | | | | $ (157) | |
| | | | | | | | |
| | | Increase (decrease) as at | |
| Description | | Jan.1, 2010 | | | Dec.31, 2010 | |
| Bifurcation of senior convertible debt1 | | | $ (143) | | | | $- | |
| Debt issue costs reclassified2 | | | (45) | | | | (54) | |
| Previously amortized debt premium reversed to retained earnings2 | | | 31 | | | | - | |
| | | | $ (157) | | | | $ (54) | |
| 1. | Under IFRS, compound financial instruments are required to be split into a debt and an equity component. On transition to IFRS, our senior convertible debentures were bifurcated into debt and equity components. We calculated the liability component by discounting the cash flows associated with the liability at a market rate for a similar debt instrument (without the conversion option). The equity component was measured as the residual amount. |
| 2. | IFRS requires debt issuance costs to be deducted from the carrying amount of the related financial liability. At January 1, 2010, this resulted in the reclassification of debt issuance costs from other assets to debt. This was partially offset by reversal of previously amortized debt premium from retained earnings. |
| | | | |
| BARRICK YEAR-END 2011 | | 62 | | MANAGEMENT’S DISCUSSION AND ANALYSIS |
| | | | | | | | |
| | | Increase (decrease) as at | |
| Description | | Jan. 1, 2010 | | | Dec. 31, 2010 | |
PER adjustments1,2,3 | | | $ 72 | | | | $ 80 | |
| Reclassification of employee benefits and stock based compensation from other liabilities4 | | | 269 | | | | 302 | |
| Additional provision recognized under IFRS5 | | | 11 | | | | 11 | |
| Reversal of the RSU long-term asset6 | | | (68) | | | | (70) | |
Other adjustments | | | 2 | | | | 6 | |
| | | | $ 286 | | | | $ 329 | |
| 1. | IFRS requires that provisions for PER be adjusted to fair value at each reporting period by applying the current foreign exchange and discount rates. The adjustments to PER are added (or deducted) from the cost of the related asset. At January 1, 2010, the effect of applying the current foreign exchange and discount rates was an increase in the PER balance. In subsequent quarters, the PER increased or decreased based on the movements in foreign exchange and discount rates. |
| 2. | IFRS requires that constructive obligations be recognized as provisions if it is probable that the obligation will result in an outflow of economic resources. At January 1, 2010, we recognized certain constructive obligations that were previously expensed as incurred under US GAAP. |
| 3. | IFRS requires that environmental obligations be measured using management’s best estimate of the expenditure required to settle the obligation. Under US GAAP, environmental obligations are recorded based on the cost of a third- party performing the work, irrespective of management’s intention to perform the work internally. At January 1, 2010, we eliminated contractor margins for those obligations where Barrick intends to perform the work. |
| 4. | Under IFRS, we reclassified employee benefits and stock-based compensation from other liabilities to provisions. |
| 5. | IFRS requires recognition of a contingent liability if it is probable that the obligation will result in an outflow of economic resources. At January 1, 2010, this resulted in the recognition of a contingent financial liability of $11 million relating to the additional 40% Cortez acquisition in 2008. |
| H) | Opening Retained Earnings1 |
| | | | |
US GAAP, as reported Jan. 1, 2010 | | ($ | 2,382 | ) |
IFRS 1 Exemptions | | | | |
Reset of actuarial gains and losses relating to pension plans2 | | | (37 | ) |
Reset of cumulative translation account2 | | | (141 | ) |
Adjustment due to deemed cost election for oil & gas properties2 | | | (166 | ) |
| |
IFRS Policy choices | | | | |
Capitalized production phase stripping3 | | | 408 | |
Capitalized E&E3 | | | 160 | |
Highland Gold impairment reversal4 | | | 55 | |
Elimination of interest capitalization on equity investees4 | | | (125 | ) |
Increase in PERs and related asset5 | | | (101 | ) |
Bifurcation of senior convertible debt6 | | | (31 | ) |
Time value changes in fair value of options designated as hedging instrument7 | | | (33 | ) |
Tax effect of adjustments, net | | | (119 | ) |
Other adjustments | | | (23 | ) |
IFRS, as reported Jan. 1, 2010 | | ($ | 2,535 | ) |
| 1. | Retained earnings changes for the quarters are due to the IFRS adjustments in the consolidated statement of income. |
| 2. | Refer to note 3A of the Financial Statements. |
| 7. | Under IFRS, Barrick is required to separate the intrinsic value and the time value of our purchased copper options and designate as the hedging instrument only the changes in the intrinsic value of the option. As a result, for hedge relationships where the critical terms of the purchased option match the hedged risk, the change in intrinsic value is deferred in equity while the change in time value is reclassified from AOCI to opening retained earnings. This change resulted in an amount recorded in retained earnings on transition and gains/losses attributable to time value changes in subsequent quarters were recognized on a separate line item ‘gains (losses) on non-hedge derivatives’ in the income statement. |
| I) | Accumulated Other Comprehensive Income |
| | | | | | | | |
| | | Increase (decrease) as at | |
| Description | | Jan. 1, 2010 | | | Dec. 31, 2010 | |
| Reset of actuarial gains and losses relating to pension plans1 | | | $ 37 | | | | $ 37 | |
| Reset of cumulative translation account1 | | | 141 | | | | 141 | |
| Time value changes in fair value of options designated as hedging instrument2 | | | 33 | | | | 72 | |
| Accumulated hedge losses relating to capital expenditures reclassified3 | | | 36 | | | | 36 | |
| Accumulated hedge gains reclassified4 | | | (56) | | | | (62) | |
| Tax effect of adjustments | | | (14) | | | | (20) | |
| Other adjustments | | | - | | | | (6) | |
| | | | $ 177 | | | | $ 198 | |
| 1. | Refer to note 3A of the Financial Statements. |
| | | | |
| BARRICK YEAR-END 2011 | | 63 | | MANAGEMENT’S DISCUSSION AND ANALYSIS |
| J) | Non-Controlling Interests (NCI) |
| | | | | | | | |
| | | Increase (decrease) as at | |
| Description | | Jan. 1, 2010 | | | Dec. 31, 2010 | |
| Capitalized E&E attributable to NCI related to Pueblo Viejo1 | | | $ 50 | | | | $ 50 | |
| Sale of 26.1% ownership of ABG2 | | | - | | | | 25 | |
| Other adjustments | | | (12) | | | | 1 | |
| | | | $ 38 | | | | $ 76 | |
| 2. | On February 17, 2010, our Board of Directors approved a plan to create ABG and to offer about 26.1% of its equity (including the overallotment option) in an initial public offering on the London Stock Exchange. ABG holds Barrick’s previously held African gold mines and most of Barrick’s previously held exploration properties. The carrying amounts of the net assets are different under IFRS as compared to US GAAP, which resulted in an adjustment to Additional Paid In Capital (“APIC”), and a corresponding adjustment to the NCI. For more information on this transaction, refer to note 4 of the Financial Statements. |
Consolidated Statements of Comprehensive Income
| | | | |
| | | Increase (decrease)
for the period | |
| Description | | Year ended
December 31, 2010 | |
| Other metal sales reclassified from cost of sales1 | | | $ 131 | |
| Gain on non-hedge derivatives2 | | | (68) | |
| Revenue recognition3 | | | 14 | |
| Others | | | - | |
| | | | $ 77 | |
| 1 | Recognition of incidental other metal sales previously recorded as a credit to costs of sales will be presented as part of revenues commencing January 1, 2010. |
| 2 | Under IFRS, all realized and unrealized non-hedge derivative gains or losses, hedge ineffectiveness and amounts not qualifying for hedge accounting are presented as a separate line on the consolidated income statement. Under US GAAP these amounts were presented in the respective income statement line item to which the gain or loss was most closely related. |
| 3 | Revenues increased on transition due to earlier recognition of revenue for our concentrate sales at Bulyanhulu mine. Under IFRS, revenue is recognized on transfer of risk and rewards as compared to recognition on transfer of title under US GAAP. |
| | | | |
| | | Increase (decrease)
for the period | |
| Description | | Year ended
December 31, 2010 | |
| Capitalized production phase stripping1 | | | ($ 292) | |
| Reclassification to income tax2 | | | (101) | |
| Depreciation expense3 | | | 63 | |
| Other metal sales4 | | | 131 | |
| Gain on non-hedge derivatives | | | 21 | |
| Other adjustments | | | (10) | |
| | | | ($ 188) | |
| 1 | Cost of sales were lower primarily due to capitalized production phase stripping costs. |
| 2 | Under IFRS, royalties and mining taxes that are payable to government bodies and are calculated based on net profit are classified as income taxes. We reclassified the following to income tax expense: Nevada Net Proceeds Tax and Cowal royalty. |
| 3 | Depreciation expense increased under IFRS due to higher book values resulting from capitalization of production phase stripping costs and E&E costs, and the impact of the calculation of the asset related to the environmental rehabilitation provisions under IFRS 1 for opening balance sheet as at January 1, 2010. |
| M) | Exploration and Evaluation |
Under IFRS, the criteria to determine costs that qualify for capitalization differs from US GAAP. We capitalized additional E&E costs at certain properties, mainly Cerro Casale, where management assessed under IFRS that it is probable that these expenditures will result in future economic benefits.
| N) | Impairment Charges (Reversals) |
| | | | |
| | | Increase (decrease)
for the period | |
| Description | | Year ended
December 31, 2010 | |
| Highland Gold impairment reversal1 | | | ($ 84) | |
| Other | | | 4 | |
| | | | ($ 80) | |
| | | | |
| BARRICK YEAR-END 2011 | | 64 | | MANAGEMENT’S DISCUSSION AND ANALYSIS |
| O) | Gain (Loss) on Non-Hedge Derivatives |
| | | | |
| | | Increase (decrease)
for the period | |
| Description | | Year ended
December 31, 2010 | |
| Gains on non-hedge derivative positions1 | | | $ 94 | |
| Unrealized gains due to hedge ineffectiveness | | | 14 | |
| Time value changes in fair value of options designated as hedging instrument1 | | | (39) | |
| | | | $ 69 | |
| 1 | Under IFRS, all realized and unrealized non-hedge derivative gains or losses, hedge ineffectiveness and amounts not qualifying for hedge accounting are presented as a separate line on the consolidated income statement. Under US GAAP these amounts were presented in the respective income statement line item to which the gain or loss was most closely related. |
| | | | |
| | | Increase (decrease)
for the period | |
| Description | | Year ended
December 31, 2010 | |
| Tax effect of changes in income | | | ($ 98) | |
| Reclassification from cost of sales1 | | | (108) | |
| Other adjustments | | | 15 | |
| | | | ($ 191) | |
Impact of conversion to IFRS Total Cash Costs per ounce on gold and per pound on copper
| | | | | | | | |
| For the year ended December 31, 2010 | |
| | |
| | | Gold | | | Copper | |
| (Per ounce/pound information in dollars) | | 2010 | | | 2010 | |
| Cash costs - US GAAP | | | 457 | | | | 1.11 | |
Capitalized production phase stripping costs1 | | | (36) | | | | - | |
Cost of sales reclassified to income tax expense2 | | | (13) | | | | - | |
Other adjustments | | | 1 | | | | (0.01) | |
| Cash costs - IFRS | | | 409 | | | | 1.10 | |
| | | | |
| BARRICK YEAR-END 2011 | | 65 | | MANAGEMENT’S DISCUSSION AND ANALYSIS |
IFRS CRITICAL ACCOUNTING POLICIES AND ACCOUNTING ESTIMATES
Management has discussed the development and selection of our critical accounting estimates with the Audit Committee of the Board of Directors, and the Audit Committee has reviewed the disclosure relating to such estimates in conjunction with its review of this MD&A. The accounting policies and methods we utilize determine how we report our financial condition and results of operations, and they may require management to make estimates or rely on assumptions about matters that are inherently uncertain. Our significant accounting policies are disclosed in note 2 of the Financial Statements.
Future Accounting Policy Changes
These consolidated financial statements have been prepared in accordance with International Financial Reporting Standards (“IFRS”) as issued by the International Accounting Standards Board (“IASB”) under the historical cost convention, as modified by revaluation of certain financial assets, derivative contracts and post-retirement assets. The policies applied in these financial statements are based on IFRS’s in effect as at February 15, 2012, the date the Board of Directors approved these consolidated financial statements for issue.
Financial Instruments
IFRS 9 Financial Instruments
In November 2009, the IASB issued IFRS 9 Financial Instruments as the first step in its project to replace IAS 39Financial Instruments: Recognition and Measurement. IFRS 9 retains but simplifies the mixed measurement model and establishes two primary measurement categories for financial assets: amortized cost and fair value. The basis of classification depends on an entity’s business model and the contractual cash flow of the financial asset. Classification is made at the time the financial asset is initially recognized, namely when the entity becomes a party to the contractual provisions of the instrument.
IFRS 9 amends some of the requirements of IFRS 7Financial Instruments: Disclosures including added disclosures about investments in equity instruments measured at fair value in OCI, and guidance on financial liabilities and de-recognition of financial instruments. In December 2011, the IASB issued an amendment that adjusted the mandatory effective date of IFRS 9 from January 1, 2013 to January 1, 2015. We are currently assessing the impact of adopting IFRS 9 on our consolidated financial statements, including the impact of early adoption.
IFRS 10 Consolidated Financial Statements
In May 2011, the IASB issued IFRS 10Consolidated Financial Statements to replace IAS 27Consolidated and Separate Financial Statements and SIC 12Consolidation - Special Purpose Entities. The new consolidation standard changes the definition of control so that the same criteria apply to all entities, both operating and special purpose entities, to determine control. The revised definition focuses on the need to have both power and variable returns before control is present. IFRS 10 must be applied starting January 1, 2013 with early adoption permitted. We are currently assessing the impact of adopting IFRS 10 on our consolidated financial statements.
IFRS 11 Joint Arrangements
In May 2011, the IASB issued IFRS 11Joint Arrangements to replace IAS 31, Interests in Joint Ventures. The new standard defines two types of arrangements: Joint Operations and Joint Ventures. Focus is on the rights and obligations of the parties involved to reflect the joint arrangement, thereby requiring parties to recognize the individual assets and liabilities to which they have rights or for which they are responsible, even if the joint arrangement operates in a separate legal entity. IFRS 11 must be applied starting January 1, 2013 with early adoption permitted. We are currently assessing the impact of adopting IFRS 11 on our consolidated financial statements.
IFRS 12 Disclosure of Interests in Other Entities
In May 2011, the IASB issued IFRS 12Disclosure of Interests in Other Entities to create a comprehensive disclosure standard to address the requirements for subsidiaries, joint arrangements and associates including the reporting entity’s involvement with other entities. It also includes the requirements for unconsolidated structured entities (i.e. special purpose entities). IFRS 12 must be applied starting January 1, 2013 with early adoption permitted. We are currently assessing the impact of adopting IFRS 12 on our consolidated financial statements.
IFRS 13 Fair Value Measurement
In May 2011, the IASB issued IFRS 13Fair Value Measurement as a single source of guidance for all fair value measurements required by IFRS to reduce the complexity and improve consistency across its application. The standard provides a definition of fair value and guidance on how to measure fair value as well as a requirement for enhanced disclosures. Enhanced disclosures about fair value are required to enable financial statement users to understand how the fair
| | | | |
| BARRICK YEAR-END 2011 | | 66 | | MANAGEMENT’S DISCUSSION AND ANALYSIS |
values were derived. IFRS 13 must be applied starting January 1, 2013 with early adoption permitted. We are currently assessing the impact of adopting IFRS 13 on our consolidated financial statements.
IFRIC 20 Stripping Costs in the Production Phase of a Surface Mine
In October 2011, the IASB issued IFRIC 20 Stripping Costs in the Production Phase of a Surface Mine. IFRIC 20 provides guidance on the accounting for the costs of stripping activity in the production phase of surface mining when two benefits accrue to the entity from the stripping activity: useable ore that can be used to produce inventory and improved access to further quantities of material that will be mined in future periods. IFRIC 20 must be applied starting January 1, 2013 with early adoption permitted. We are currently assessing the impact of adopting IFRIC 20 on our consolidated financial statements.
Internal Control over Financial Reporting and Disclosure Controls and Procedures
Management is responsible for establishing and maintaining adequate internal control over financial reporting and disclosure controls and procedures. Internal control over financial reporting is a framework designed to provide reasonable assurance regarding the reliability of financial reporting and the preparation of financial statements in accordance with IFRS. The Company’s internal control over financial reporting framework includes those policies and procedures that (i) pertain to the maintenance of records that, in reasonable detail, accurately and fairly reflect the transactions and dispositions of the assets of the Company; (ii) provide reasonable assurance that transactions are recorded as necessary to permit preparation of financial statements in accordance with IFRS, and that receipts and expenditures of the Company are being made only in accordance with authorizations of management and directors of the Company; and (iii) provide reasonable assurance regarding prevention or timely detection of unauthorized acquisition, use or disposition of the Company’s assets that could have a material effect on the Company’s consolidated financial statements.
Disclosure controls and procedures form a broader framework designed to ensure that other financial information disclosed publicly fairly presents in all material respects the financial condition, results of operations and cash flows of the Company for the periods presented in this MD&A and Barrick’s Annual Report. The Company’s disclosure controls and procedures framework includes processes designed to ensure that material information relating to the
Company, including its consolidated subsidiaries, is made known to management by others within those entities to allow timely decisions regarding required disclosure.
Together, the internal control over financial reporting and disclosure controls and procedures frameworks provide internal control over financial reporting and disclosure. Due to its inherent limitations, internal control over financial reporting and disclosure may not prevent or detect all misstatements. Further, the effectiveness of internal control is subject to the risk that controls may become inadequate because of changes in conditions, or that the degree of compliance with policies or procedures may change. The changes related to our new Copper reporting segment described on page 16 will not significantly impact the design of internal control over financial reporting and disclosure. Management will continue to monitor the effectiveness of its internal control over financial reporting and disclosure and may make modifications from time to time as considered necessary or desirable.
The management of Barrick, at the direction of our chief executive and financial officers, have evaluated the effectiveness of the design and operation of the internal controls over financial reporting and disclosure controls and procedures as of the end of the period covered by this report and have concluded that they were effective at a reasonable assurance level.
Barrick’s annual management report on internal control over financial reporting and the integrated audit report of Barrick’s auditors for the year ended December 31, 2011 will be included in Barrick’s 2011 Annual Report and its 2011 Form 40-F/Annual Information Form on file with the US Securities and Exchange Commission (“SEC”) and Canadian provincial securities regulatory authorities.
Critical Accounting Estimates and Judgments
Certain accounting estimates have been identified as being “critical” to the presentation of our financial condition and results of operations because they require us to make subjective and/or complex judgments about matters that are inherently uncertain; or there is a reasonable likelihood that materially different amounts could be reported under different conditions or using different assumptions and estimates.
Accounting Estimates
Life of mine (“LOM”) Estimates Used to Measure
Depreciation of Property, Plant and Equipment
We depreciate our assets over their useful life, or over the remaining life of the mine (if shorter). We use the
| | | | |
| BARRICK YEAR-END 2011 | | 67 | | MANAGEMENT’S DISCUSSION AND ANALYSIS |
units-of-production basis (“UOP”) to depreciate the mining interest component of PP&E whereby the denominator is the expected mineral production based on our LOM plans. LOM plans are prepared based on estimates of ounces of gold/pounds of copper in proven and probable reserves and a portion of resources at the mine where there is a high probability of economic extraction. At the end of each fiscal year, as part of our business cycle, we update our LOM plans and prepare
estimates of proven and probable gold and copper mineral reserves as well as measured, indicated and inferred mineral resources for each mineral property. We prospectively revise calculations of depreciation based on these updated LOM plans. The table below illustrates the impact of historic changes in LOM estimates on depreciation for each of our operating segments.
Impact of Historic Changes in LOM Estimates on Depreciation
| | | | | | | | | | | | | | | | |
| For the years ended | | 2011 | | | 2010 | |
($ millions, except LOM in
millions of contained oz/pounds) | | LOM increase (decrease)1 | | | Depreciation increase
(decrease) | | | LOM increase
(decrease)1 | | | Depreciation increase
(decrease) | |
Gold | | | | | | | | | | | | | | | | |
North America | | | 7.1 | | | | $ (64) | | | | 5.7 | | | | $ (30) | |
Australia Pacific | �� | | 1.7 | | | | (39) | | | | 1.5 | | | | (11) | |
African Barrick Gold | | | (0.1) | | | | 5 | | | | (0.8) | | | | 5 | |
South America | | | 1.3 | | | | (13) | | | | 0.8 | | | | (6) | |
Total Gold | | | 10.0 | | | | $ (111) | | | | 7.2 | | | | $ (42) | |
Total Copper2 | | | 734 | | | | $ (8) | | | | 308 | | | | $2 | |
| 1 | Each year we update our LOM estimates as at the end of the year as part of our normal business cycle. We then use those updated LOM estimates to calculate depreciation expense in the following fiscal year on assets which use the units-of-production method of depreciation. LOM changes presented were calculated as at the end of 2010 and 2009 and are in millions of contained ounces/pounds. |
| 2 | The copper segment includes the reserve amounts of Zaldívar. Results of Lumwana are not included in the copper segment as it was acquired in second quarter of 2011. |
Provisions for Environmental Rehabilitations (“PERs”)
We have an obligation to reclaim our mining properties after the minerals have been mined from the site, and have estimated the costs necessary to comply with existing reclamation standards. We recognize the fair value of a liability for a PER such as site closure and reclamation costs, in the period in which it is incurred if a reasonable estimate of fair value can be made. PER can include facility decommissioning and dismantling; removal or treatment of waste materials; site and land rehabilitation, including compliance with and monitoring of environmental regulations; security and other site-related costs required to perform the rehabilitation work; and operation of equipment designed to reduce or eliminate environmental effects.
Provisions for the cost of each rehabilitation program are normally recognized at the time that an environmental disturbance occurs or a constructive obligation is determined. When the extent of disturbance increases over the life of an operation, the provision is increased accordingly. We record a PER in
our financial statements when it is incurred and capitalize this amount as an increase in the carrying amount of the related asset. At operating mines, the increase in a PER is recorded as an adjustment to the corresponding asset carrying amount and results in a prospective increase in depreciation expense. At closed mines, any adjustment to a PER is recognized as an expense in the consolidated statement of income.
PERs are measured at the expected value of the future cash flows, discounted to their present value using a current, US dollar real risk-free pre-tax discount rate. The expected future cash flows exclude the effect of inflation. The unwinding of the discount, referred to as accretion expense, is included in finance costs and results in an increase in the amount of the provision. Provisions are updated each reporting period for the effect of a change in the discount rate and foreign exchange rate when applicable, and the change in estimate is added or deducted from the related asset and depreciated prospectively over the asset’s useful life.
| | | | |
| BARRICK YEAR-END 2011 | | 68 | | MANAGEMENT’S DISCUSSION AND ANALYSIS |
In the future, changes in regulations or laws or enforcement could adversely affect our operations; and any instances of non-compliance with laws or regulations that result in fines or injunctions or delays in projects, or any unforeseen environmental contamination at, or related to, our mining properties, could result in us suffering significant costs. We mitigate these risks through environmental and health and safety programs under which we monitor compliance with laws and regulations and take steps to reduce the risk of environmental contamination occurring. We maintain insurance for some environmental risks; however, for some risks, coverage cannot be purchased at a reasonable cost. Our coverage may not provide full recovery for all possible causes of loss. The principal factors that can cause expected cash flows to change are: the construction of new processing facilities; changes in the quantities of material in reserves and a corresponding change in the life of mine plan; changing ore characteristics that ultimately impact the environment; changes in water quality that impact the extent of water treatment required; and changes in laws and regulations governing the protection of the environment. In general, as the end of the mine life nears, the reliability of expected cash flows increases, but earlier in the mine life, the estimation of a PER is inherently more subjective. Significant judgments and estimates are made when estimating the fair value of PERs. Expected cash flows relating to PERs could occur over periods of up to 40 years and the assessment of the extent of environmental remediation work is highly subjective. Considering all of these factors that go into the determination of a PER, the fair value of PERs can materially change over time.
The amount of PERs recorded reflects the expected cost, taking into account the probability of particular scenarios. The difference between the upper end of the range of these assumptions and the lower end of the range can be significant, and consequently changes in these assumptions could have a material effect on the fair value of PERs and future earnings in a period of change.
During year ended December 31, 2011, our PER balance increased by $538 million primarily due to a change in the discount rate used to calculate PER. The offset was recorded as an increase in PP&E for our operations and other expense at our closed sites.
PERs
| | | | | | | | |
(in $ millions) As at December 31 | | 2011 | | | 2010 | |
Operating mines | | $ | 1,608 | | | $ | 1,230 | |
Closed mines | | | 373 | | | | 302 | |
Development projects | | | 97 | | | | 42 | |
Other | | | 81 | | | | 47 | |
Total | | $ | 2,159 | | | $ | 1,621 | |
Accounting for impairment of non-current assets
Goodwill was tested for impairment in the fourth quarter. The recoverable amount of each operating segment has been determined using a FVLCS approach. For the year ended December 31, 2011, we did not record any impairment to goodwill (2010: nil).
FVLCS for each gold operating segment was determined by considering the net present value (“NPV”) of the future cash flows expected to be generated by the segment. Net future cash flows were derived from the most recent life of mine (“LOM”) plans, with mine lives ranging from 2 to 35 years, aggregated to the segment level. We have used an estimated long-term gold price of $1,600 per ounce (2010: $1,250 per ounce) to estimate future revenues. The net future cash flows were discounted using a segment real weighted average cost for a gold business of 5% (2010: 5%). Gold companies consistently trade at a market capitalization greater than the NPV of their expected cash flows. Market participants describe this as a “NAV multiple”, whereby the NAV represents the multiple applied to the NPV to arrive at the trading price. As a result, we applied a NAV multiple to the NPV of each gold operating segment based on the observable NAV multiples of comparable companies as at the test date. In 2011, the average NAV multiple was about 1.2 (2010: 1.4).
For our copper segment, the FVLCS was determined based on the NPV of future cash flows expected to be generated using the most recent LOM plans, with mine lives ranging from 11 to 31 years, aggregated to the segment level. We utilized a long-term risk-adjusted copper price of $3.44 per pound to estimate future revenues. The risk adjustment to the average long-term copper price was approximately 4.5%. The expected net future cash flow was additionally discounted using rates from 4.5% to 5.5% to reflect the time value of money and a residual risk factor for cash flow uncertainties not related to metal price. This results in an effective weighted average cost of capital for the copper segment of approximately 7%.
| | | | |
| BARRICK YEAR-END 2011 | | 69 | | MANAGEMENT’S DISCUSSION AND ANALYSIS |
For our oil and gas segment, the FVLCS was determined based on the NPV of future cash flows expected to be generated from our oil and gas properties, aggregated to the segment level. We have estimated future oil prices using the forward curve provided by an independent reserve evaluation firm, with prices starting at $97 per barrel (WTI) (2010: $88 per barrel). The net future cash flows were discounted using a real weighted average cost of capital for long life oil and gas assets of 8.5% (2010: 8.5%).
Non-current assets are tested for impairment when events or changes in circumstances suggest that the carrying amount may not be recoverable. The recoverable amount is calculated using the same FVLCS approach as described above for goodwill. However, the assessment is done at the CGU level, which is the lowest level for which identifiable cash flows are largely independent of the cash flows of other assets. For the year ended December 31, 2011, we recorded impairment charges of $138 million for non-current assets. The impairment included a $49 million charge at our Barrick Energy segment, primarily due to recovery issues at one of our properties. Impairment charges also included an $83 million write-down of certain power related assets at our Pueblo Viejo project as a result of a decision to proceed with an alternative long-term power solution.
Expected future cash flows used to determine the FVLCS used in the impairment testing of goodwill and non-current assets are inherently uncertain and could materially change over time. The cash flows are significantly affected by a number of factors including estimates of production levels, operating costs and capital expenditures reflected in our LOM plans; as well as economic factors beyond management’s control, such as gold, copper and oil prices; discount rates; and observable NAV multiples. Should management’s estimate of the future not reflect actual events, further impairments may be identified.
For purposes of testing for impairment of non-current assets of our gold, copper and oil and gas segments, a reasonably possible change in the key assumptions used to estimate the FVLCS could result in an impairment charge at one or more of our CGUs. The carrying value of the net assets of CGUs that are most sensitive to changes in the key assumptions are:
| | | | |
| As at December 31, 2011 | | Carrying Value | |
Lumwana | | | $ 3,538 | |
Jabal Sayid | | | 1,160 | |
Buzwagi | | | 634 | |
Barrick Energy CGUs | | | 231 | |
Pierina | | | $ 51 | |
Deferred Tax Assets and Liabilities
Measurement of Temporary Differences
We are periodically required to estimate the tax basis of assets and liabilities. Where applicable tax laws and regulations are either unclear or subject to varying interpretations, it is possible that changes in these estimates could occur that materially affect the amounts of deferred income tax assets and liabilities recorded in our consolidated financial statements. Changes in deferred tax assets and liabilities generally have a direct impact on earnings in the period of changes.
Recognition of Deferred Tax Assets
Each period, we evaluate the likelihood of whether some portion or all of each deferred tax asset will not be realized. This evaluation is based on historic and future expected levels of taxable income, the pattern and timing of reversals of taxable temporary timing differences that give rise to deferred tax liabilities, and tax planning activities. Levels of future taxable income are affected by, among other things, market gold prices, and production costs, quantities of proven and probable gold and copper reserves, interest rates and foreign currency exchange rates. If we determine that it is probable (a likelihood of more than 50%) that all or some portion of a deferred tax asset will not be realized, we do not recognize it in our financial statements. Changes in recognition of deferred tax assets are recorded as a component of income tax expense or recovery for each period. The most significant recent trend impacting expected levels of future taxable income and the amount of recognition of deferred tax assets, has been rising market gold prices. A decline in market gold prices could lead to derecognition of deferred tax assets and a corresponding increase in income tax expense.
In 2010, we recognized $129 million of previously nonrecognized deferred tax assets primarily because sources of income became available that enabled tax losses and US Alternative Minimum Tax (“AMT”) credits to be realized.
Deferred Tax Assets Not Recognized
| | | | | | | | |
| | | 2011 | | | 2010 | |
| | |
Australia | | | $ 122 | | | | $ 104 | |
Canada | | | 76 | | | | 52 | |
Argentina | | | 35 | | | | 61 | |
Barbados | | | 73 | | | | 73 | |
Tanzania | | | 31 | | | | 63 | |
Other | | | 23 | | | | 39 | |
| | | | $ 360 | | | | $ 392 | |
| | | | |
| BARRICK YEAR-END 2011 | | 70 | | MANAGEMENT’S DISCUSSION AND ANALYSIS |
Chile, Argentina, Tanzania and Other: the unrecognized deferred tax assets relate to the full amount of tax assets in subsidiaries that do not have any present sources of gold production or taxable income. In the event that these subsidiaries have sources of taxable income in the future, we may recognize some or all of the deferred tax assets.
Canada: most of the unrecognized deferred tax assets relate to tax pools which can only be utilized by income from specific sources.
Australia: most of the unrecognized deferred tax assets relate to capital losses that can only be utilized if capital gains are realized.
| | | | |
| BARRICK YEAR-END 2011 | | 71 | | MANAGEMENT’S DISCUSSION AND ANALYSIS |
NON-GAAP FINANCIAL PERFORMANCE MEASURES27
Adjusted Net Earnings (Adjusted Net Earnings per Share) and Return on Equity
Adjusted net earnings is a non-GAAP financial measure which excludes the following from net earnings:
| • | | Elimination of gold sales contracts; |
| • | | Significant tax adjustments not related to current period earnings; |
| • | | Impairment charges (reversals) related to intangibles, goodwill, property, plant and equipment, and investments; |
| • | | Gains/losses and other one-time costs relating to acquisitions/dispositions; |
| • | | Foreign currency translation gains/losses; |
| • | | Non-recurring restructuring costs; |
| • | | Unrealized gains/losses on non-hedge derivative instruments; and |
| • | | Change in the measurement of the PER as a result of changes in the discount rates for closed sites. |
Management uses this measure internally to evaluate the underlying operating performance of the Company as a whole for the reporting periods presented, and to assist with the planning and forecasting of future operating results. We believe that adjusted net earnings allows investors and analysts to better evaluate the results of the underlying business of the Company. While the adjustments to net earnings in this measure include items that are recurring, management believes that adjusted net earnings is a useful measure of the Company’s performance because non-recurring tax adjustments; impairment charges, gains/losses and other one-time costs relating to asset acquisitions/dispositions and business combinations; and non-recurring restructuring charges do not reflect the underlying operating performance of our core mining business and are not necessarily indicative of future operating results.
Furthermore, foreign currency translation gains/losses and unrealized gains/losses from non-hedge derivatives are not necessarily reflective of the underlying operating results for the reporting periods presented.
Starting in Q4 2011, we have also begun adjusting for changes in PER discount rates relating to our closed sites as they are not related to our day to day operations and not indicative of underlying results.
As noted, the Company uses this measure for its own internal purposes. Management’s internal budgets and forecasts and public guidance do not reflect potential impairment charges, potential gains/losses on the acquisition/disposition of assets, foreign currency translation gains/losses, or unrealized gains/losses on non-hedge derivatives. Consequently, the presentation of adjusted net earnings enables investors and analysts to better understand the underlying operating performance of our core mining business through the eyes of Management. Management periodically evaluates the components of adjusted net earnings based on an internal assessment of performance measures that are useful for evaluating the operating performance of our business segments and a review of the non-GAAP measures used by mining industry analysts and other mining companies.
We also present return on equity as a measure which is calculated by dividing adjusted net earnings by average shareholders’ equity. Management believes this to be a useful indicator of the Company’s performance.
Adjusted net earnings and return on equity are intended to provide additional information only and do not have any standardized definition under IFRS and should not be considered in isolation or as substitutes for measures of performance prepared in accordance with IFRS. The measures are not necessarily indicative of operating profit or cash flow from operations as determined under IFRS. Other companies may calculate these measures differently. The following table reconciles these non-GAAP measures to the most directly comparable IFRS measure.
| 27 | The amounts presented in the non-GAAP financial performance measure tables include the results of discontinued operations. |
| | | | |
| BARRICK YEAR-END 2011 | | 72 | | MANAGEMENT’S DISCUSSION AND ANALYSIS |
Reconciliation of Net Earnings to Adjusted Net Earnings and Return on Equity1
| | | | | | | | | | | | | | | | | | | | | | |
| ($ millions, except per share amounts in dollars) | | For the years
ended December 31 | | | | | For the three months
ended December 31 | |
| | | IFRS | | | US GAAP | | | | | | | | | |
| | | 2011 | | | 2010 | | | 2009 | | | | | 2011 | | | 2010 | |
Net earnings/(losses) attributable to equity holders of the Company | | | $ 4,484 | | | | $ 3,582 | | | | $ (4,274) | | | | | | $ 959 | | | | $ 961 | |
Elimination of gold sales contracts | | | - | | | | - | | | | 5,901 | | | | | | - | | | | - | |
Significant tax adjustments not related to current period earnings | | | 122 | | | | (4) | | | | 59 | | | | | | 86 | | | | 74 | |
Impairment charges (reversals) related to intangibles, property, plant and equipment, and investments | | | 165 | | | | (65) | | | | 259 | | | | | | 153 | | | | (17) | |
Acquisition/disposition adjustments2 | | | (165) | | | | (62) | | | | (85) | | | | | | (6) | | | | (20) | |
Foreign currency translation (gains)/losses | | | (5) | | | | 32 | | | | (95) | | | | | | 21 | | | | (5) | |
Restructuring costs | | | 2 | | | | 43 | | | | 15 | | | | | | - | | | | 3 | |
Acquisition related costs3 | | | 97 | | | | - | | | | - | | | | | | (18) | | | | - | |
Changes in PER discount rate for closed sites | | | 32 | | | | - | | | | - | | | | | | 32 | | | | - | |
Unrealized (gains)/losses on non-hedge derivative instruments | | | (66) | | | | (9) | | | | 30 | | | | | | (61) | | | | 22 | |
Adjusted net earnings | | | $ 4,666 | | | | $ 3,517 | | | | $ 1,810 | | | | | | $ 1,166 | | | | $ 1,018 | |
Net earnings/(losses) per share4 | | | $ 4.49 | | | | $ 3.63 | | | | $ (4.73) | | | | | | $0.96 | | | | $0.97 | |
Adjusted net earnings per share4 | | | $ 4.67 | | | | $ 3.56 | | | | $ 2.00 | | | | | | $ 1.17 | | | | $ 1.02 | |
Average Shareholders’ Equity | | | $21,418 | | | | $17,352 | | | | $15,170 | | | | | | $22,869 | | | | $18,805 | |
Return on equity5 | | | 22% | | | | 20% | | | | 12% | | | | | | 20% | | | | 22% | |
| 1 | Amounts presented in this table are post-tax. |
| 2 | For the three month period ended December 31, 2011, includes gains on sale of assets. For the year ended December 31, 2011 includes gain on sale assets of $188 million, partially offset by a $23 million charge for the recognition of a liability for contingent consideration related to the acquisition of the additional 40% interest in Cortez property. |
| 3 | Represents expensed transaction costs, fair value inventory purchase adjustments and realized foreign exchange losses relating to our economic hedge of the purchase price related to the Equinox acquisition. |
| 4 | Calculated using weighted average number of shares outstanding under the basic method of earnings per share. |
| 5 | Calculated as annualized adjusted net earnings divided by average shareholders’ equity. |
Adjusted Operating Cash Flow, Adjusted Operating Cash Flow before Working Capital Changes and Free Cash Flow
Adjusted operating cash flow is a non-GAAP financial measure which excludes the effect of elimination of gold sales contracts, the impact of one-time costs and working capital adjustments relating to business combinations.
Management uses adjusted operating cash flow as a measure internally to evaluate the underlying operating cash flow performance of the Company as a whole for the reporting periods presented, and to assist with the planning and forecasting of future operating cash flow. The elimination of gold sales contracts and one-time costs and working capital adjustments relating to business combinations are activities that are not reflective of the underlying capacity of our operations to generate operating cash flow and therefore this adjustment will result in a more meaningful operating cash flow measure for investors and analysts to evaluate our performance in the period and assess our future operating cash flow-generating capability.
We also present adjusted operating cash flow before working capital changes as a measure which excludes working capital changes from adjusted operating cash
flow. Management uses operating cash flow before working capital changes as a measure internally to evaluate the Company’s ability to generate cash flows from its mining operations, before the impact of working capital movements.
Free cash flow is a measure which excludes capital expenditures from adjusted operating cash flow. Management believes this to be a useful indicator of the Company’s ability to operate without reliance on additional borrowing or usage of existing cash.
Adjusted operating cash flow, adjusted operating cash flow before working capital changes and free cash flow are intended to provide additional information only and do not have any standardized definition under IFRS and should not be considered in isolation or as a substitute for measures of performance prepared in accordance with IFRS. The measures are not necessarily indicative of operating profit or cash flow from operations as determined under IFRS. Other companies may calculate these measures differently. The following table reconciles these non-GAAP measure to the most directly comparable IFRS measures.
| | | | |
| BARRICK YEAR-END 2011 | | 73 | | MANAGEMENT’S DISCUSSION AND ANALYSIS |
Reconciliation of Adjusted Operating Cash Flow
| | | | | | | | | | | | | | | | | | | | | | |
| ($ millions) | | For the years
ended December 31 | | | | | For the three months
ended December 31 | |
| | | IFRS | | | US GAAP | | | | | | | | | |
| | | 2011 | | | 2010 | | | 2009 | | | | | 2011 | | | 2010 | |
Operating cash flow | | | $ 5,315 | | | | $ 4,585 | | | | $ (2,322) | | | | | | $ 1,224 | | | | $ 866 | |
Elimination of gold sales contracts | | | - | | | | 656 | | | | 5,221 | | | | | | - | | | | 656 | |
Acquisition costs expensed and related working capital movements | | | 204 | | | | - | | | | - | | | | | | - | | | | - | |
Withholding tax payment | | | 161 | | | | - | | | | - | | | | | | 75 | | | | - | |
Adjusted operating cash flow | | | $ 5,680 | | | | $ 5,241 | | | | $ 2,899 | | | | | | $ 1,299 | | | | $ 1,522 | |
Changes in working capital | | | 139 | | | | 1 | | | | (412) | | | | | | 106 | | | | 522 | |
Adjusted operating cash flow before working capital changes | | | $ 5,819 | | | | $ 5,242 | | | | $ 2,487 | | | | | | $ 1,405 | | | | $ 2,044 | |
| | | | | | | |
Adjusted operating cash flow | | | $ 5,680 | | | | $ 5,241 | | | | $ 2,899 | | | | | | $ 1,299 | | | | $ 1,522 | |
Capital expenditures - Barrick’s share | | | (4,598) | | | | (3,371) | | | | (2,066) | | | | | | (1,231) | | | | (1,195) | |
Free cash flow | | | $ 1,082 | | | | $ 1,870 | | | | $ 833 | | | | | | $ 68 | | | | $ 327 | |
Total Cash Costs per ounce and Net Cash Costs per ounce
Total cash costs per ounce/pound and net cash costs per ounce are non-GAAP financial measures. Both measures include all costs absorbed into inventory, as well as royalties, and by-product credits, and exclude inventory purchase accounting adjustments, unrealized gains/losses from non-hedge currency and commodity contracts, and depreciation and accretion. These measures also include the gross margin generated by our Barrick Energy business unit, which was acquired to mitigate our exposure to oil prices as a credit against gold production costs. The presentation of these statistics in this manner allows us to monitor and manage those factors that impact production costs on a monthly basis. These measures are calculated by dividing the aggregate of the applicable costs by gold ounces or copper pounds sold. These measures are calculated on a consistent basis for the periods presented.
We have also adjusted our gold total cash costs to remove the impact of ore purchase agreements that have economic characteristics similar to a toll milling arrangement. The cost of producing these ounces is not indicative of our normal production costs. Hence, we have removed such costs from total cash costs.
We calculate total cash costs and net cash costs based on our equity interest in production from our mines. We believe that using an equity interest presentation is a fairer, more accurate way to measure economic performance than using a consolidated basis. For mines where we hold less than a 100% share in the production,
we exclude the economic share of gold production attributable to the non-controlling interest. Consequently, our production and total cash costs and net cash costs statistics only reflect our equity share of production.
Net cash costs measures the gross margin from all non-gold sales, whether or not these non-gold metals are produced in conjunction with gold, as a credit against the cost of producing gold. A number of other gold producers present their costs net of the contribution from non-gold sales. We believe that including a measure of net cash costs per ounce on this basis provides investors and analysts with information with which to compare our performance to other gold producers, and to better assess the overall performance of our business. In addition, this measure provides information to enable investors and analysts to understand the importance of non-gold revenues to our cost structure.
Total cash cost and net cash cost statistics are intended to provide additional information only and do not have any standardized definition under IFRS and should not be considered in isolation or as a substitute for measures of performance prepared in accordance with IFRS. The measures are not necessarily indicative of operating profit or cash flow from operations as determined under IFRS. Other companies may calculate these measures differently. The following tables reconcile these non-GAAP measures to the most directly comparable IFRS measure.
| | | | |
| BARRICK YEAR-END 2011 | | 74 | | MANAGEMENT’S DISCUSSION AND ANALYSIS |
Reconciliation of Cost of Sales to Total Cash Costs per ounce/pound
| | | | | | | | | | | | | | | | | | | | | | | | | | | | | | | | | | | | | | | | | | | | | | | | |
| | | Gold | | | Copper | | | Oil and Gas | | | Total | |
| | | IFRS | | | US
GAAP | | | IFRS | | | US
GAAP | | | IFRS | | | US
GAAP | | | IFRS | | | US
GAAP | |
| For the years ended December 31 | | 2011 | | | 2010 | | | 2009 | | | 2011 | | | 2010 | | | 2009 | | | 2011 | | | 2010 | | | 2009 | | | 2011 | | | 2010 | | | 2009 | |
Cost of sales | | | $ 5,177 | | | | $ 4,618 | | | | $ 4,281 | | | | $ 983 | | | | $ 430 | | | | $ 437 | | | | $ 156 | | | | $ 114 | | | | $ 69 | | | | $ 6,316 | | | | $ 5,162 | | | | $ 4,787 | |
Less: Depreciation | | | 1,152 | | | | 1,077 | | | | 874 | | | | 170 | | | | 88 | | | | 76 | | | | 97 | | | | 47 | | | | 30 | | | | 1,419 | | | | 1,212 | | | | 980 | |
| | | | $ 4,025 | | | | $ 3,541 | | | | $ 3,407 | | | | $ 813 | | | | $ 342 | | | | $ 361 | | | | $ 59 | | | | $ 67 | | | | $ 39 | | | | $ 4,897 | | | | $ 3,950 | | | | $ 3,807 | |
| | | | | | | | | | | | | | | | | | | | | | | | | | |
| ($ millions, except per ounce/pound information in dollars) | | Gold | | | | | Copper | |
| | | IFRS | | | US GAAP | | | | | IFRS | | | US GAAP | |
| For the years ended December 31 | | 2011 | | | 2010 | | | 2009 | | | | | 2011 | | | 2010 | | | 2009 | |
Cost of sales | | | $ 4,025 | | | | $ 3,541 | | | | $ 3,407 | | | | | | $ 813 | | | | $ 342 | | | | $ 361 | |
Cost of sales applicable to discontinued operations | | | - | | | | 10 | | | | 24 | | | | | | - | | | | 91 | | | | 83 | |
Cost of sales applicable to non-controlling interests1 | | | (171) | | | | (97) | | | | (12) | | | | | | - | | | | - | | | | - | |
Cost of sales applicable to ore purchase arrangement | | | (126) | | | | (104) | | | | (29) | | | | | | - | | | | - | | | | - | |
Other metal sales | | | (137) | | | | (120) | | | | - | | | | | | (3) | | | | (6) | | | | - | |
Inventory purchase accounting adjustments | | | - | | | | - | | | | - | | | | | | (34) | | | | - | | | | - | |
Realized non-hedge gains/losses on fuel hedges | | | (5) | | | | 3 | | | | 7 | | | | | | - | | | | - | | | | - | |
Impact of Barrick Energy | | | (118) | | | | (56) | | | | (20) | | | | | | - | | | | - | | | | - | |
Total cash costs | | | $ 3,468 | | | | $ 3,177 | | | | $ 3,377 | | | | | | $ 776 | | | | $ 427 | | | | $ 444 | |
Ounces/pounds sold - consolidated basis (000s ounces/millions pounds) | | | 7,758 | | | | 7,902 | | | | 7,307 | | | | | | 444 | | | | 391 | | | | 380 | |
Ounces/pounds sold- non-controlling interest (000s ounces)1 | | | (208) | | | | (160) | | | | (28) | | | | | | - | | | | - | | | | - | |
Ounces/pounds sold - equity basis (000s ounces/millions pounds) | | | 7,550 | | | | 7,742 | | | | 7,279 | | | | | | 444 | | | | 391 | | | | 380 | |
Total cash costs per ounce/per pound2 | | | $ 460 | | | | $ 409 | | | | $ 464 | | | | | | $ 1.75 | | | | $ 1.10 | | | | $ 1.17 | |
| 1 | Relates to interest in ABG held by outside shareholders. |
| 2 | Total cash costs per ounce/pound may not calculate based on amounts presented in this table due to rounding. |
| | | | |
| BARRICK YEAR-END 2011 | | 75 | | MANAGEMENT’S DISCUSSION AND ANALYSIS |
Net Cash Costs per ounce
| | | | | | | | | | | | | | | | | | | | |
| ($ millions, except per ounce/pound data in dollars) | | For the years ended December 31 | | | For the three months ended December 31 | |
| | | | | | | | |
| | | | | | | | |
| | | IFRS | | | US GAAP | | | | | | | |
| | | 2011 | | | 2010 | | | 2009 | | | 2011 | | | 2010 | |
Ounces gold sold – equity basis (000s) | | | 7,550 | | | | 7,742 | | | | 7,279 | | | | 1,865 | | | | 1,831 | |
Total cash costs per ounce – equity basis | | $ | 460 | | | | $ 409 | | | | $ 464 | | | | $ 505 | | | | $ 440 | |
Revenues from copper sales | | $ | 1,714 | | | | $ 1,056 | | | | $ 943 | | | | $ 504 | | | | $ 323 | |
Revenues from copper sales of discontinued operations | | | - | | | | 244 | | | | 212 | | | | - | | | | 74 | |
Unrealized non-hedge gold/copper derivate (gains) losses | | | - | | | | - | | | | 49 | | | | - | | | | - | |
Unrealized mark-to-market provisional price adjustments | | | - | | | | - | | | | (4 | ) | | | - | | | | - | |
Inventory purchase accounting adjustments | | | 34 | | | | - | | | | - | | | | (29 | ) | | | - | |
Realized non-hedge gold/copper derivative (losses) gains | | | (21 | ) | | | 30 | | | | - | | | | (5 | ) | | | 11 | |
| Net revenues from copper excluding realized non-hedge gains/losses from copper contracts | | $ | 1,727 | | | | $ 1,330 | | | | $ 1,200 | | | | $ 470 | | | | $ 408 | |
| Copper cost of sales per consolidated statement of income | | | 813 | | | | 342 | | | | 361 | | | | 239 | | | | 88 | |
| Copper cost of sales from discontinued operations | | | - | | | | 91 | | | | 83 | | | | - | | | | 23 | |
Copper credits | | | 914 | | | | 897 | | | | 756 | | | | 231 | | | | 297 | |
Copper credits per ounce1 | | | 121 | | | | 116 | | | | 104 | | | | 123 | | | | 162 | |
Net cash costs per ounce | | $ | 339 | | | | $ 293 | | | | $ 360 | | | | $ 382 | | | | $ 278 | |
| 1 | Copper credits per ounce for three month period and year ended December 31, 2011 and December 31, 2010 may not calculate based on amounts presented in this table due to rounding. |
EBITDA
EBITDA is a non-GAAP financial measure, which excludes the following from net earnings:
Management believes that EBITDA is a valuable indicator of the Company’s ability to generate liquidity by producing operating cash flow to: fund working capital needs, service debt obligations, and fund capital expenditures. Management uses EBITDA for this purpose. EBITDA is also frequently used by investors and analysts for valuation purposes whereby EBITDA is multiplied by a factor or “EBITDA multiple” that is based on observed or inferred relationship between EBITDA and market values to determine the approximate total enterprise value of a company.
EBITDA is intended to provide additional information to investors and analysts and does not have any standardized definition under IFRS and should not be considered in isolation or as a substitute for measures of performance prepared in accordance with IFRS. EBITDA excludes the impact of cash costs of financing activities and taxes, and the effects of changes in operating working capital balances, and therefore is not necessarily indicative of operating profit or cash flow from operations as determined under IFRS. Other companies may calculate EBITDA differently.
The following table provides a reconciliation of EBITDA to net earnings.
| | | | |
| BARRICK YEAR-END 2011 | | 76 | | MANAGEMENT’S DISCUSSION AND ANALYSIS |
Reconciliation of Net Earnings to EBITDA
| | | | | | | | | | | | | | | | | | | | | | |
| ($ millions, except per share amounts in dollars) | | For the years ended December 31 | | | For the three months ended December 31 | |
| | | IFRS | | | US GAAP | | | | | | | |
| | | 2011 | | | 2010 | | | | | 2009 | | | 2011 | | | 2010 | |
Net earnings | | | $ 4,484 | | | | $ 3,582 | | | | | | $ (4,274 | ) | | | $ 959 | | | | $ 961 | |
Income tax expense | | | 2,287 | | | | 1,561 | | | | | | 648 | | | | 589 | | | | 509 | |
Finance costs | | | 199 | | | | 180 | | | | | | 57 | | | | 51 | | | | 27 | |
Finance income | | | (13 | ) | | | (14 | ) | | | | | (10 | ) | | | (3) | | | | (3) | |
Depreciation | | | 1,419 | | | | 1,212 | | | | | | 1,016 | | | | 402 | | | | 276 | |
EBITDA | | | $ 8,376 | | | | $ 6,521 | | | | | | $ (2,563 | ) | | | $ 1,998 | | | | $ 1,770 | |
Reported as: | | | | | | | | | | | | | | | | | | | | | | |
Gold | | | | | | | | | | | | | | | | | | | | | | |
North America | | | $ 3,585 | | | | $ 2,317 | | | | | | $ 1,259 | | | | $ 804 | | | | $ 627 | |
South America | | | 2,102 | | | | 1,996 | | | | | | 1,245 | | | | 657 | | | | 466 | |
Australia Pacific | | | 1,648 | | | | 1,096 | | | | | | 597 | | | | 450 | | | | 331 | |
African Barrick Gold | | | 538 | | | | 429 | | | | | | 236 | | | | 120 | | | | 141 | |
Copper | | | 817 | | | | 697 | | | | | | 646 | | | | 183 | | | | 230 | |
Capital Projects | | | (155 | ) | | | (15 | ) | | | | | (106 | ) | | | (103 | ) | | | (7 | ) |
Barrick Energy | | | 49 | | | | 47 | | | | | | 9 | | | | (22 | ) | | | 16 | |
Other | | | (208 | ) | | | (46 | ) | | | | | (6,449 | ) | | | (91 | ) | | | (34 | ) |
EBITDA | | | $ 8,376 | | | | $ 6,521 | | | | | | $ (2,563 | ) | | | $ 1,998 | | | | $ 1,770 | |
Realized Prices
Realized price is a non-GAAP financial measure which excludes from sales:
| • | | Unrealized gains and losses on non-hedge derivative contracts; |
| • | | Unrealized mark-to-market gains and losses on provisional pricing from copper and gold sales contracts; |
| • | | Sales attributable to ore purchase arrangement; and |
This measure is intended to enable management to better understand the price realized in each reporting period for gold and copper sales because unrealized mark-to-market value of non-hedge gold and copper derivatives are subject to change each period due to changes in market factors such as market and forward gold and copper prices so that prices ultimately realized may differ from those recorded. The exclusion of such unrealized mark-to-market gains and losses from the presentation of this performance measure enables investors to understand performance based on the realized proceeds of selling gold and copper production.
The gains and losses on non-hedge derivatives and receivable balances relate to instruments/balances that mature in future periods, at which time the gains and
losses will become realized. The amounts of these gains and losses reflect fair values based on market valuation assumptions at the end of each period and do not necessarily represent the amounts that will become realized on maturity. We also exclude export duties that are paid upon sale and netted against revenues. We believe this provides investors and analysts with a more accurate measure with which to compare to market gold prices and to assess our gold sales performance. For those reasons, management believes that this measure provides a more accurate reflection of our past performance and is a better indicator of its expected performance in future periods.
The realized price measure is intended to provide additional information, and does not have any standardized definition under IFRS and should not be considered in isolation or as a substitute for measures of performance prepared in accordance with IFRS. The measure is not necessarily indicative of sales as determined under IFRS. Other companies may calculate this measure differently. The following table reconciles realized prices to the most directly comparable IFRS measure.
| | | | |
| BARRICK YEAR-END 2011 | | 77 | | MANAGEMENT’S DISCUSSION AND ANALYSIS |
Reconciliation of Sales to Realized Price per ounce/per pound1
| | | | | | | | | | | | | | | | | | | | | | | | | | |
| ($ millions, except per ounce/pound information in dollars) | | Gold | | | | | Copper | |
| | | IFRS | | | US GAAP | | | | | IFRS | | | US GAAP | |
| For the years ended December 31 | | 2011 | | | 2010 | | | 2009 | | | | | 2011 | | | 2010 | | | 2009 | |
Sales | | | $ 12,263 | | | | $ 9,687 | | | | $ 7,135 | | | | | | $ 1,714 | | | | $ 1,056 | | | | $ 943 | |
Sales attributable to discontinued operations | | | - | | | | 43 | | | | 56 | | | | | | - | | | | 244 | | | | 212 | |
Sales applicable to non-controlling interests | | | (329) | | | | (206) | | | | (27) | | | | | | - | | | | - | | | | - | |
Sales attributable to ore purchase agreement | | | (137) | | | | (111) | | | | (26) | | | | | | - | | | | - | | | | - | |
Unrealized non-hedge gold/copper derivates (gains) losses | | | - | | | | - | | | | - | | | | | | - | | | | - | | | | 49 | |
Unrealized mark- to-market provisional price adjustment | | | - | | | | (1) | | | | - | | | | | | - | | | | - | | | | (4) | |
Realized non-hedge gold/copper derivative (losses) gains | | | 43 | | | | 26 | | | | - | | | | | | (21) | | | | 30 | | | | - | |
Export duties | | | 73 | | | | 68 | | | | 30 | | | | | | - | | | | - | | | | - | |
Revenues - as adjusted | | | $ 11,913 | | | | $ 9,506 | | | | $ 7,168 | | | | | | $ 1,693 | | | | $ 1,330 | | | | $ 1,200 | |
Ounces/pounds sold (000s ounces/millions pounds) | | | 7,550 | | | | 7,742 | | | | 7,279 | | | | | | 444 | | | | 391 | | | | 380 | |
Realized gold/copper price per ounce/pound1 | | | $ 1,578 | | | | $ 1,228 | | | | $ 985 | | | | | | $ 3.82 | | | | $ 3.41 | | | | $ 3.16 | |
| 1 | Realized price per ounce/pound may not calculate based on amounts presented in this table due to rounding. |
Net Cash Margin
Management uses a non-GAAP financial measure, net cash margin, which represents realized price per ounce less net cash costs per ounce. This measure is used by management to analyze profitability trends and to assess the cash-generating capability from the sale of gold on a consolidated basis in each reporting period, expressed on a unit basis. We believe that it illustrates the performance of our business on a consolidated basis and enables investors to better understand our performance in comparison to other gold producers who present results on a similar basis and is an important indicator of expected performance in future periods.
Net cash margin is intended to provide additional information, does not have any standardized definition under IFRS and should not be considered in isolation or as a substitute for measures of performance prepared in accordance with IFRS. This measure is not necessarily indicative of operating profit or cash flow from operations as determined under IFRS. Other companies may calculate cash margin differently. The following table derives this non-GAAP measure from previously defined non-GAAP measures of realized gold price per ounce, total cash costs per ounce, and copper credit per ounce, as determined in the net cash cost reconciliation. Net cash margin could also be derived from realized price per ounce and net cash costs per ounce.
| | | | |
| BARRICK YEAR-END 2011 | | 78 | | MANAGEMENT’S DISCUSSION AND ANALYSIS |
Reconciliation of net cash margin per ounce
| | | | | | | | | | | | | | | | | | | | | | | | | | | | | | | | | | | | | | | | | | | | | | |
| (Per ounce data in dollars) | | For the years ended December 31 | | For the three months ended December 31 | |
| | | Gold | | | | | Copper | | | | | Gold | | | | | Copper | |
| | | IFRS | | | US
GAAP | | | | | IFRS | | | US
GAAP | | | | | | | | | | | | | | | | | |
| | | 2011 | | | 2010 | | | 2009 | | | | | 2011 | | | 2010 | | | 2009 | | | | | 2011 | | | 2010 | | | | | 2011 | | | 2010 | |
| Realized gold/copper price per ounce/pound | | | $ 1,578 | | | | $ 1,228 | | | | $ 985 | | | | | | $ 3.82 | | | | $ 3.41 | | | | $ 3.16 | | | | | | $ 1,664 | | | | $ 1,368 | | | | | | $ 3.69 | | | | $ 3.99 | |
Total cash costs per ounce/per pound | | | 460 | | | | 409 | | | | 464 | | | | | | 1.75 | | | | 1.10 | | | | 1.17 | | | | | | 505 | | | | 440 | | | | | | 1.99 | | | | 1.08 | |
| Total cash margin per ounce/per pound | | | $ 1,118 | | | | $ 819 | | | | $ 521 | | | | | | $ 2.07 | | | | $ 2.31 | | | | $ 1.99 | | | | | | $ 1,159 | | | | $ 928 | | | | | | $ 1.70 | | | | $ 2.91 | |
Copper credit per ounce1 | | | 121 | | | | 116 | | | | 104 | | | | | | | | | | | | | | | | | | | | 123 | | | | 162 | | | | | | | | | | | |
Net cash margin per ounce | | | $ 1,239 | | | | $ 935 | | | | $ 625 | | | | | | | | | | | | | | | | | | | | $ 1,282 | | | | $ 1,090 | | | | | | | | | | | |
| 1 | Copper credit per ounce is calculated as the margin from copper sales divided by gold ounces sold. Refer to the calculation in the net cash costs reconciliation on page 74. |
Adjusted Debt and Net Debt
Management uses non-GAAP financial measures “adjusted debt” and “net debt” since they are more indicative of how we manage our debt levels internally than the IFRS measure. We believe these measures provide a meaningful measure for investors and analysts to evaluate our overall debt capacity, liquidity and capital structure. Adjusted debt and net debt are intended to provide additional information, do not have any standardized definition under IFRS and should not be considered in isolation or as a substitute for measures of performance prepared in accordance with IFRS.
We have adjusted our long-term debt to exclude fair value and other adjustments and our partner’s share of project financing to arrive at adjusted debt. We have excluded the impact of fair value and other adjustments in order to reflect the actual settlement obligation in relation to the debt instrument. We have excluded our partners’ shares of project financing, where Barrick has provided a guarantee only for its proportionate share of the debt. We then deduct our cash and equivalents (net of our partner’s share of cash held at Pueblo Viejo) to arrive at net debt.
Adjusted Debt and Net Debt Summary
| | | | | | | | |
| (in $ millions) | | | | | | |
| As at December 31 | | 2011 | | | 2010 | |
Debt per financial statements | | | $ 13,369 | | | | $ 6,638 | |
Fair value and other adjustments1 | | | 65 | | | | 67 | |
Pueblo Viejo financing - partner’s share2 | | | (376) | | | | (313) | |
Adjusted debt | | | $ 13,058 | | | | $ 6,392 | |
Cash and equivalents | | | (2,745) | | | | (3,968) | |
Cash and equivalents - partner’s share at Pueblo Viejo2 | | | 7 | | | | 3 | |
Net debt | | | $ 10,320 | | | | $ 2,427 | |
| 1 | Other adjustment primarily related to issue costs which have been netted against the debts. |
| 2 | We consolidate 100% of Pueblo Viejo in our financial statements; however we have guaranteed only our 60% share of the $940 million financing received to this point. Therefore, we have removed our partner’s share of both the financing and cash and equivalents to ensure comparability. |
| | | | |
| BARRICK YEAR-END 2011 | | 79 | | MANAGEMENT’S DISCUSSION AND ANALYSIS |
GLOSSARY OF TECHNICAL TERMS
AUTOCLAVE: Oxidation process in which high temperatures and pressures are applied to convert refractory sulfide mineralization into amenable oxide ore.
BACKFILL: Primarily waste sand or rock used to support the roof or walls after removal of ore from a stope.
BY-PRODUCT: A secondary metal or mineral product recovered in the milling process such as silver.
CONCENTRATE: A very fine, powder-like product containing the valuable ore mineral from which most of the waste mineral has been eliminated.
CONTAINED OUNCES: Represents ounces in the ground before reduction of ounces not able to be recovered by the applicable metallurgical process.
DEVELOPMENT: Work carried out for the purpose of opening up a mineral deposit. In an underground mine this includes shaft sinking, crosscutting, drifting and raising. In an open pit mine, development includes the removal of overburden.
DILUTION: The effect of waste or low-grade ore which is unavoidably included in the mined ore, lowering the recovered grade.
DORÉ: Unrefined gold and silver bullion bars usually consisting of approximately 90 percent precious metals that will be further refined to almost pure metal.
DRILLING:
Core: drilling with a hollow bit with a diamond cutting rim to produce a cylindrical core that is used for geological study and assays. Used in mineral exploration.
In-fill: any method of drilling intervals between existing holes, used to provide greater geological detail and to help establish reserve estimates.
EXPLORATION: Prospecting, sampling, mapping, diamond-drilling and other work involved in searching for ore.
GRADE: The amount of metal in each ton of ore, expressed as troy ounces per ton or grams per tonne for precious metals and as a percentage for most other metals.
Cut-off grade: the minimum metal grade at which an ore body can be economically mined (used in the calculation of ore reserves).
Mill-head grade: metal content of mined ore going into a mill for processing.
Recovered grade: actual metal content of ore determined after processing.
Reserve grade: estimated metal content of an ore body, based on reserve calculations.
HEAP LEACHING: A process whereby gold/copper is extracted by “heaping” broken ore on sloping impermeable pads and continually applying to the heaps a weak cyanide solution which dissolves the contained gold/copper. The gold/copper-laden solution is then collected for gold/copper recovery.
HEAP LEACH PAD: A large impermeable foundation or pad used as a base for ore during heap leaching.
MILL: A processing facility where ore is finely ground and thereafter undergoes physical or chemical treatment to extract the valuable metals.
MINERAL RESERVE: See pages 161 to 166 – Summary Gold/ Copper Mineral Reserves and Mineral Resources.
MINERAL RESOURCE: See pages 161 to 166 – Summary Gold/Copper Mineral Reserves and Mineral Resources.
MINING CLAIM: That portion of applicable mineral lands that a party has staked or marked out in accordance with applicable mining laws to acquire the right to explore for and exploit the minerals under the surface.
MINING RATE: Tons of ore mined per day or even specified time period.
OPEN PIT: A mine where the minerals are mined entirely from the surface.
ORE: Rock, generally containing metallic or non–metallic minerals, which can be mined and processed at a profit.
ORE BODY: A sufficiently large amount of ore that can be mined economically.
OUNCES: Troy ounces of a fineness of 999.9 parts per 1,000 parts.
RECLAMATION: The process by which lands disturbed as a result of mining activity are modified to support beneficial land use. Reclamation activity may include the removal of buildings, equipment, machinery and other physical remnants of mining, closure of tailings storage facilities, leach pads and other mine features, and contouring, covering and re–vegetation of waste rock and other disturbed areas.
RECOVERY RATE: A term used in process metallurgy to indicate the proportion of valuable material physically recovered in the processing of ore. It is generally stated as a percentage of the material recovered compared to the total material originally present.
REFINING: The final stage of metal production in which impurities are removed from the molten metal.
STRIPPING: Removal of overburden or waste rock overlying an ore body in preparation for mining by open pit methods. Expressed as the total number of tons mined or to be mined for each ounce of gold or pound of copper.
TAILINGS: The material that remains after all economically and technically recoverable precious metals have been removed from the ore during processing.
| | | | |
| BARRICK YEAR-END 2011 | | 80 | | MANAGEMENT’S DISCUSSION AND ANALYSIS |
MANAGEMENT’S RESPONSIBILITY
Management’s Responsibility for Financial Statements
The accompanying consolidated financial statements have been prepared by and are the responsibility of the Board of Directors and Management of the company.
The consolidated financial statements have been prepared in accordance with International Financial Reporting Standards and reflect Management’s best estimates and judgments based on currently available information. The company has developed and maintains a system of internal controls in order to ensure, on a reasonable and cost effective basis, the reliability of its financial information.
The consolidated financial statements have been audited by PricewaterhouseCoopers LLP, Chartered Accountants. Their report outlines the scope of their examination and opinion on the consolidated financial statements.
|

|
|
Jamie C. Sokalsky |
Executive Vice President and Chief Financial Officer |
Toronto, Canada February 15, 2012 |
| | | | |
| BARRICK YEAR END 2011 | | 81 | | MANAGEMENT’S RESPONSIBILITY |
MANAGEMENT’S REPORT ON INTERNAL CONTROL OVER FINANCIAL REPORTING
Barrick’s management is responsible for establishing and maintaining adequate internal control over financial reporting.
Barrick’s management assessed the effectiveness of the company’s internal control over financial reporting as at December 31, 2011. Barrick’s Management used the Committee of Sponsoring Organizations of the Treadway Commission (COSO) framework to evaluate the effectiveness of Barrick’s internal control over financial reporting. Based on Barrick management’s assessment, Barrick’s internal control over financial reporting is effective as at December 31, 2011.
The effectiveness of the Company’s internal control over financial reporting as at December 31, 2011 has been audited by PricewaterhouseCoopers LLP, Chartered Accountants, as stated in their report which is located on pages 83 - 85 of Barrick’s 2011 Annual Financial Statements.
| | | | |
| BARRICK YEAR END 2011 | | 82 | | MANAGEMENT’S REPORT ON INTERNAL CONTROL OVER FINANCIAL REPORTING |
February 15, 2012
Independent Auditor’s Report
To the Shareholders of
Barrick Gold Corporation
We have completed an integrated audit of Barrick Gold Corporation’s 2011 consolidated financial statements and its internal control over financial reporting as at December 31, 2011 and an audit of its 2010 consolidated financial statements. Our opinions, based on our audits, are presented below.
Report on the consolidated financial statements
We have audited the accompanying consolidated financial statements of Barrick Gold Corporation, which comprise the consolidated balance sheets as at December 31, 2011, December 31, 2010 and January 1, 2010 and the consolidated statements of income, cash flow, changes in equity and comprehensive income for the years ended December 31, 2011 and December 31, 2010, and the related notes, which include a summary of significant accounting policies.
Management’s responsibility for the consolidated financial statements
Management is responsible for the preparation and fair presentation of these consolidated financial statements in accordance with International Financial Reporting Standards as issued by the International Accounting Standards Board and for such internal control as management determines is necessary to enable the preparation of consolidated financial statements that are free from material misstatement, whether due to fraud or error.
Auditor’s responsibility
Our responsibility is to express an opinion on these consolidated financial statements based on our audits. We conducted our audits in accordance with Canadian generally accepted auditing standards and the standards of the Public Company Accounting Oversight Board (United States). Those standards require that we plan and perform an audit to obtain reasonable assurance about whether the consolidated financial statements are free from material misstatement. Canadian generally accepted auditing standards require that we comply with ethical requirements.
An audit involves performing procedures to obtain audit evidence, on a test basis, about the amounts and disclosures in the consolidated financial statements. The procedures selected depend on the auditor’s judgment, including the assessment of the risks of material misstatement of the consolidated financial statements, whether due to fraud or error. In making those risk assessments, the auditor considers internal control relevant to the company’s preparation and fair presentation of the consolidated financial statements in order to design audit procedures that are appropriate in the circumstances. An audit also includes evaluating the appropriateness of accounting principles and policies used and the reasonableness of accounting estimates made by management, as well as evaluating the overall presentation of the consolidated financial statements.
| | | | |
| BARRICK YEAR END 2011 | | 83 | | INDEPENDENT AUDITOR’S REPORT |
We believe that the audit evidence we have obtained in our audits is sufficient and appropriate to provide a basis for our audit opinion on the consolidated financial statements.
Opinion
In our opinion, the consolidated financial statements present fairly, in all material respects, the financial position of Barrick Gold Corporation as at December 31, 2011, December 31, 2010 and January 1, 2010 and its financial performance and its cash flows for the years ended December 31, 2011 and December 31, 2010 in accordance with International Financial Reporting Standards as issued by the International Accounting Standards Board.
Report on internal control over financial reporting
We have also audited Barrick Gold Corporation’s internal control over financial reporting as at December 31, 2011, based on criteria established in Internal Control - Integrated Framework, issued by the Committee of Sponsoring Organizations of the Treadway Commission (COSO).
Management’s responsibility for internal control over financial reporting
Management is responsible for maintaining effective internal control over financial reporting and for its assessment of the effectiveness of internal control over financial reporting included in Management’s Report on Internal Control Over Financial Reporting.
Auditor’s responsibility
Our responsibility is to express an opinion on the company’s internal control over financial reporting based on our audit. We conducted our audit of internal control over financial reporting in accordance with the standards of the Public Company Accounting Oversight Board (United States). Those standards require that we plan and perform the audit to obtain reasonable assurance about whether effective internal control over financial reporting was maintained in all material respects.
An audit of internal control over financial reporting includes obtaining an understanding of internal control over financial reporting, assessing the risk that a material weakness exists, testing and evaluating the design and operating effectiveness of internal control, based on the assessed risk, and performing such other procedures as we consider necessary in the circumstances.
We believe that our audit provides a reasonable basis for our audit opinion on the company’s internal control over financial reporting.
Definition of internal control over financial reporting
A company’s internal control over financial reporting is a process designed to provide reasonable assurance regarding the reliability of financial reporting and the preparation of financial statements for external purposes in accordance with generally accepted accounting principles. A company’s internal control over financial reporting includes those policies and procedures that: (i) pertain to the maintenance of records that, in reasonable detail, accurately and fairly reflect the transactions and dispositions of the assets of the company; (ii) provide reasonable assurance that transactions are recorded as necessary to permit preparation of financial statements in accordance with generally accepted accounting principles, and that receipts and expenditures of the company are being made only in accordance with authorizations of management and directors of the company; and (iii) provide reasonable assurance regarding prevention
| | | | |
| BARRICK YEAR END 2011 | | 84 | | INDEPENDENT AUDITOR’S REPORT |
or timely detection of unauthorized acquisition, use, or disposition of the company’s assets that could have a material effect on the financial statements.
Inherent limitations
Because of its inherent limitations, internal control over financial reporting may not prevent or detect misstatements. Also, projections of any evaluation of effectiveness to future periods are subject to the risk that controls may become inadequate because of changes in conditions or that the degree of compliance with the policies or procedures may deteriorate.
Opinion
In our opinion, Barrick Gold Corporation maintained, in all material respects, effective internal control over financial reporting as at December 31, 2011, based on criteria established in Internal Control - Integrated Framework issued by COSO.
(Signed) “PricewaterhouseCoopers LLP”
Chartered Accountants, Licensed Public Accountants
Toronto, Canada
| | | | |
| BARRICK YEAR END 2011 | | 85 | | INDEPENDENT AUDITOR’S REPORT |
Consolidated Statements of Income
| | | | | | | | |
| Barrick Gold Corporation | | | | | | |
| For the years ended December 31 (in millions of United States dollars, except per share data) | | | | | | |
| | | 2011 | | | 2010 | |
| | |
Revenue (notes 5 and 6) | | $ | 14,312 | | | $ | 11,001 | |
Costs and expenses | | | | | | | | |
Cost of sales (notes 5 and 7) | | | 6,316 | | | | 5,162 | |
Corporate administration | | | 166 | | | | 156 | |
Exploration and evaluation (notes 5 and 8) | | | 346 | | | | 229 | |
Other expense (note 9a) | | | 576 | | | | 455 | |
Impairment charges (reversals) (note 9b) | | | 235 | | | | (73) | |
| | | 7,639 | | | | 5,929 | |
Other income (note 9c) | | | 248 | | | | 116 | |
Income (loss) from equity investees (note 14a) | | | 8 | | | | (24) | |
Gain on non-hedge derivatives (note 22e) | | | 81 | | | | 69 | |
Income before finance items and income taxes | | | 7,010 | | | | 5,233 | |
Finance items (note 12) | | | | | | | | |
Finance income | | | 13 | | | | 14 | |
Finance costs | | | (199 | ) | | | (180) | |
Income before income taxes | | | 6,824 | | | | 5,067 | |
Income tax expense (note 10) | | | (2,287 | ) | | | (1,561) | |
Income from continuing operations | | | 4,537 | | | | 3,506 | |
Income from discontinued operations (note 4g) | | | - | | | | 124 | |
Net income | | $ | 4,537 | | | $ | 3,630 | |
Attributable to: | | | | | | | | |
Equity holders of Barrick Gold Corporation | | $ | 4,484 | | | $ | 3,582 | |
Non-controlling interests (note 29) | | $ | 53 | | | $ | 48 | |
| | | 4,537 | | | | 3,630 | |
|
Earnings per share data attributable to the equity holders of Barrick Gold Corporation (note 11) | |
Income from continuing operations | | | | | | | | |
Basic | | $ | 4.49 | | | $ | 3.50 | |
Diluted | | $ | 4.48 | | | $ | 3.47 | |
Income from discontinued operations | | | | | | | | |
Basic | | $ | - | | | $ | 0.13 | |
Diluted | | $ | - | | | $ | 0.12 | |
Net income | | | | | | | | |
Basic | | $ | 4.49 | | | $ | 3.63 | |
Diluted | | $ | 4.48 | | | $ | 3.59 | |
The accompanying notes are an integral part of these consolidated financial statements.
| | | | |
| BARRICK YEAR-END 2011 | | 86 | | FINANCIAL STATEMENTS |
Consolidated Statements of Comprehensive Income
| | | | | | | | |
| Barrick Gold Corporation | | | | | | |
| For the years ended December 31 (in millions of United States dollars, except per share data) | | | | | | |
| | | 2011 | | | 2010 | |
Net income | | $ | 4,537 | | | $ | 3,630 | |
| | |
Other comprehensive income, net of taxes | | | | | | | | |
Unrealized gains (losses) on available-for-sale (“AFS”) financial securities, net of tax $9, $5 | | | (91 | ) | | | 64 | |
Realized (gains) losses and impairments on AFS financial securities, net of tax $5, $1 | | | 36 | | | | (11 | ) |
Unrealized gains on derivative investments designated as cash flow hedges, net of tax $41, $131 | | | 370 | | | | 518 | |
Realized (gains) on derivative investments designated as cash flow hedges, net of tax $93, $22 | | | (413 | ) | | | (88 | ) |
Actuarial (losses) on post employment benefit obligations, net of tax $13, $nil | �� | | (22 | ) | | | (2 | ) |
Currency translation adjustments gain (loss), net of tax $nil, $nil | | | (36 | ) | | | 14 | |
Total other comprehensive income (loss) | | | (156 | ) | | | 495 | |
Total comprehensive income | | $ | 4,381 | | | $ | 4,125 | |
Attributable to: | | | | | | | | |
| | |
Equity holders of Barrick Gold Corporation | | $ | 4,328 | | | $ | 4,077 | |
| | |
Non-controlling interests | | $ | 53 | | | $ | 48 | |
The accompanying notes are an integral part of these consolidated financial statements.
| | | | |
| BARRICK YEAR-END 2011 | | 87 | | FINANCIAL STATEMENTS |
Consolidated Statements of Cash Flow
| | | | | | | | |
| Barrick Gold Corporation | | | | | | |
| For the years ended December 31 (in millions of United States dollars) | | | | | | |
| | | 2011 | | | 2010 | |
OPERATING ACTIVITIES | | | | | | | | |
Net income | | $ | 4,537 | | | $ | 3,630 | |
Adjustments for the following items: | | | | | | | | |
Depreciation | | | 1,419 | | | | 1,212 | |
Accretion | | | 52 | | | | 21 | |
Impairment charges (reversals) (note 9b) | | | 235 | | | | (73 | ) |
Income tax expense (note 10) | | | 2,287 | | | | 1,561 | |
Increase in inventory | | | (708 | ) | | | (381 | ) |
Gain on sale/acquisition of long-lived assets/investments | | | (229 | ) | | | (79 | ) |
Other operating activities (note 13a) | | | (173 | ) | | | (421 | ) |
Operating cash flows before interest and income taxes | | | 7,420 | | | | 5,470 | |
Gross interest paid | | | (137 | ) | | | (153 | ) |
Income taxes paid | | | (1,968 | ) | | | (732 | ) |
Net cash provided by operating activities | | | 5,315 | | | | 4,585 | |
INVESTING ACTIVITIES | | | | | | | | |
Property, plant and equipment | | | | | | | | |
Capital expenditures (note 5) | | | (4,973 | ) | | | (3,778 | ) |
Sales proceeds | | | 48 | | | | 61 | |
Acquisitions (note 4) | | | (7,677 | ) | | | (813 | ) |
Investments | | | | | | | | |
Purchases | | | (72 | ) | | | (61 | ) |
Sales | | | 80 | | | | 15 | |
Other investing activities (note 13b) | | | (233 | ) | | | (54 | ) |
Net cash used in investing activities | | | (12,827 | ) | | | (4,630 | ) |
FINANCING ACTIVITIES | | | | | | | | |
Proceeds on exercise of stock options | | | 57 | | | | 127 | |
Proceeds from public issuance of common shares by a subsidiary (note 4e) | | | - | | | | 884 | |
Long-term debt | | | | | | | | |
Proceeds | | | 6,648 | | | | 782 | |
Repayments | | | (380 | ) | | | (149 | ) |
Dividends | | | (509 | ) | | | (436 | ) |
Funding from non-controlling interests | | | 403 | | | | 114 | |
Deposit on silver sale agreement (note 26) | | | 138 | | | | 137 | |
Other financing activities (note 13c) | | | (66 | ) | | | (25 | ) |
Net cash provided by financing activities | | | 6,291 | | | | 1,434 | |
Effect of exchange rate changes on cash and equivalents | | | (2 | ) | | | 15 | |
Net increase (decrease) in cash and equivalents | | | (1,223 | ) | | | 1,404 | |
Cash and equivalents at beginning of year (note 22a) | | | 3,968 | | | | 2,564 | |
Cash and equivalents at the end of year (note 22a) | | $ | 2,745 | | | $ | 3,968 | |
The accompanying notes are an integral part of these consolidated financial statements.
| | | | |
| BARRICK YEAR-END 2011 | | 88 | | FINANCIAL STATEMENTS |
Consolidated Balance Sheets
| | | | | | | | | | | | |
Barrick Gold Corporation (in millions of United States dollars) | | As at December 31 | | | As at December 31 | | | As at January 1 | |
| | | 2011 | | | 2010 | | | 2010 | |
ASSETS | | | | | | | | | | | | |
Current assets | | | | | | | | | | | | |
Cash and equivalents (note 22a) | | $ | 2,745 | | | $ | 3,968 | | | $ | 2,564 | |
Accounts receivable (note 16) | | | 426 | | | | 370 | | | | 259 | |
Inventories (note 15) | | | 2,498 | | | | 1,798 | | | | 1,488 | |
Other current assets (note 16) | | | 876 | | | | 935 | | | | 518 | |
Total current assets (excluding assets classified as held for sale) | | | 6,545 | | | | 7,071 | | | | 4,829 | |
Assets classified as held for sale | | | - | | | | - | | | | 100 | |
Total current assets | | | 6,545 | | | | 7,071 | | | | 4,929 | |
| | | |
Non-current assets | | | | | | | | | | | | |
Equity in investees (note 14a) | | | 440 | | | | 396 | | | | 1,124 | |
Other investments (note 14b) | | | 161 | | | | 171 | | | | 62 | |
Property, plant and equipment (note 17) | | | 28,979 | | | | 17,890 | | | | 13,378 | |
Goodwill (note 18a) | | | 9,626 | | | | 6,096 | | | | 5,197 | |
Intangible assets (note 18b) | | | 569 | | | | 475 | | | | 275 | |
Deferred income tax assets (note 27) | | | 409 | | | | 625 | | | | 601 | |
Non-current portion of inventory (note 15) | | | 1,153 | | | | 1,040 | | | | 709 | |
Other assets (note 19) | | | 1,002 | | | | 873 | | | | 649 | |
Total assets | | $ | 48,884 | | | $ | 34,637 | | | $ | 26,924 | |
LIABILITIES AND EQUITY | | | | | | | | | | | | |
Current liabilities | | | | | | | | | | | | |
Accounts payable (note 20) | | | 2,083 | | | | 1,511 | | | | 1,221 | |
Debt (note 22b) | | | 196 | | | | 14 | | | | 54 | |
Current income tax liabilities | | | 306 | | | | 550 | | | | 104 | |
Other current liabilities (note 21) | | | 326 | | | | 416 | | | | 366 | |
Total current liabilities (excluding liabilities classified as held for sale) | | | 2,911 | | | | 2,491 | | | | 1,745 | |
Liabilities classified as held for sale | | | - | | | | - | | | | 49 | |
Total current liabilities | | | 2,911 | | | | 2,491 | | | | 1,794 | |
| | | |
Non-current liabilities | | | | | | | | | | | | |
Debt (note 22b) | | | 13,173 | | | | 6,624 | | | | 6,124 | |
Provisions (note 24) | | | 2,326 | | | | 1,768 | | | | 1,408 | |
Deferred income tax liabilities (note 27) | | | 4,231 | | | | 1,971 | | | | 960 | |
Other liabilities (note 26) | | | 689 | | | | 566 | | | | 884 | |
Total liabilities | | | 23,330 | | | | 13,420 | | | | 11,170 | |
Equity | | | | | | | | | | | | |
Capital stock (note 28) | | | 17,892 | | | | 17,820 | | | | 17,392 | |
Retained earnings (deficit) | | | 4,562 | | | | 609 | | | | (2,535 | ) |
Accumulated other comprehensive income | | | 595 | | | | 729 | | | | 232 | |
Other | | | 314 | | | | 314 | | | | 143 | |
| Total equity attributable to Barrick Gold Corporation shareholders | | | 23,363 | | | | 19,472 | | | | 15,232 | |
Non-controlling interests (note 29) | | | 2,191 | | | | 1,745 | | | | 522 | |
Total equity | | | 25,554 | | | | 21,217 | | | | 15,754 | |
Contingencies and commitments (notes 17 and 33) | | | | | | | | | | | | |
Total liabilities and equity | | $ | 48,884 | | | $ | 34,637 | | | $ | 26,924 | |
The accompanying notes are an integral part of these consolidated financial statements.
| | | | | | |
Signed on behalf of the Board, | | | | | | |

| | 
| | | | |
Aaron Regent, Director | | Steven J. Shapiro, Director | | | | |
| | | | |
| BARRICK YEAR-END 2011 | | 89 | | FINANCIAL STATEMENTS |
Consolidated Statements of Changes in Equity
| | | | | | | | | | | | | | | | | | | | | | | | | | | | | | | | |
Barrick Gold Corporation | | Attributable to equity holders of the company | | | | | | | |
| (in millions of United States dollars) | | Common Shares
(in thousands) | | | Capital
stock | | | Retained
earnings
(deficit) | | | Accumulated
other
comprehensive
income (loss) | | | Other1 | | | Total equity
attributable to
shareholders | | | Non-controlling
interests | | | Total equity | |
At January 1, 2011 | | | 998,500 | | | $ | 17,820 | | | $ | 609 | | | $ | 729 | | | $ | 314 | | | $ | 19,472 | | | $ | 1,745 | | | $ | 21,217 | |
Net income | | | - | | | | - | | | | 4,484 | | | | - | | | | - | | | | 4,484 | | | | 53 | | | | 4,537 | |
Total other comprehensive income (loss) | |
| -
|
| | | - | | | | (22 | ) | | | (134 | ) | | | - | | | | (156 | ) | | | - | | | | (156 | ) |
Total comprehensive income | | | 998,500 | | | $ | - | | | $ | 4,462 | | | $ | (134 | ) | | $ | - | | | $ | 4,328 | | | $ | 53 | | | $ | 4,381 | |
Transactions with owners | | | | | | | | | | | | | | | | | | | | | | | | | | | | | | | | |
Dividends | | | - | | | | - | | | | (509 | ) | | | - | | | | - | | | | (509 | ) | | | - | | | | (509 | ) |
Issued on exercise of stock options | | | 1,923 | | | | 57 | | | | - | | | | - | | | | - | | | | 57 | | | | - | | | | 57 | |
Recognition of stock option expense | | | - | | | | 15 | | | | - | | | | - | | | | - | | | | 15 | | | | - | | | | 15 | |
Funding from non-controlling interests | | | - | | | | - | | | | - | | | | - | | | | - | | | | - | | | | 403 | | | | 403 | |
Other decrease in non-controlling interests | | | - | | | | - | | | | - | | | | - | | | | - | | | | - | | | | (10 | ) | | | (10 | ) |
Total transactions with owners | | | 1,923 | | | $ | 72 | | | $ | (509 | ) | | $ | - | | | $ | - | | | $ | (437 | ) | | $ | 393 | | | $ | (44 | ) |
At December 31, 2011 | | | 1,000,423 | | | $ | 17,892 | | | $ | 4,562 | | | $ | 595 | | | $ | 314 | | | $ | 23,363 | | | $ | 2,191 | | | $ | 25,554 | |
| | | | | | | | | | | | | | | | | | | | | | | | | | | | | | | | |
At January 1, 2010 | | | 984,328 | | | $ | 17,392 | | | $ | (2,535 | ) | | $ | 232 | | | $ | 143 | | | $ | 15,232 | | | $ | 522 | | | $ | 15,754 | |
Net income | | | - | | | | - | | | | 3,582 | | | | - | | | | - | | | | 3,582 | | | | 48 | | | | 3,630 | |
Total other comprehensive income (loss) | | | - | | | | - | | | | (2 | ) | | | 497 | | | | - | | | | 495 | | | | - | | | | 495 | |
Total comprehensive income | | | 984,328 | | | $ | - | | | $ | 3,580 | | | $ | 497 | | | $ | - | | | $ | 4,077 | | | $ | 48 | | | $ | 4,125 | |
Transactions with owners | | | | | | | | | | | | | | | | | | | | | | | - | | | | | | | | | |
Dividends | | | - | | | | - | | | | (436 | ) | | | - | | | | - | | | | (436 | ) | | | - | | | | (436 | ) |
Issued on conversion of debentures | | | 9,381 | | | | 294 | | | | - | | | | - | | | | - | | | | 294 | | | | - | | | | 294 | |
Issued on exercise of stock options | | | 4,791 | | | | 127 | | | | - | | | | - | | | | - | | | | 127 | | | | - | | | | 127 | |
Recognition of stock option expense | | | - | | | | 7 | | | | - | | | | - | | | | - | | | | 7 | | | | - | | | | 7 | |
Recognized on initial public offering of African Barrick | | | | | | | | | | | | | | | | | | | | | | | | | | | | | | | | |
Gold (note 4e) | | | - | | | | - | | | | - | | | | - | | | | 171 | | | | 171 | | | | - | | | | 171 | |
Funding from non-controlling interests | | | - | | | | - | | | | - | | | | - | | | | - | | | | - | | | | 114 | | | | 114 | |
Other increase in non-controlling interests | | | - | | | | - | | | | - | | | | - | | | | - | | | | - | | | | 1,061 | | | | 1,061 | |
Total transactions with owners | | | 14,172 | | | $ | 428 | | | $ | (436 | ) | | $ | - | | | $ | 171 | | | $ | 163 | | | $ | 1,175 | | | $ | 1,338 | |
At December 31, 2010 | | | 998,500 | | | $ | 17,820 | | | $ | 609 | | | $ | 729 | | | $ | 314 | | | $ | 19,472 | | | $ | 1,745 | | | $ | 21,217 | |
| 1 | Includes additional paid-in capital as at December 31, 2011: $276 million (December 31, 2010: $276 million; January 1, 2010: $ nil) and convertible borrowings - equity component as at December 31, 2011: $38 million (December 31, 2010: $38 million; January 1, 2010: $143 million). |
The accompanying notes are an integral part of these consolidated financial statements.
| | | | |
| BARRICK YEAR-END 2011 | | 90 | | FINANCIAL STATEMENTS |
NOTES TO CONSOLIDATED
FINANCIAL STATEMENTS
Barrick Gold Corporation.Tabular dollar amounts in millions of United States dollars, unless otherwise shown. References to C$, A$, ZAR, CLP, PGK, TZS, JPY, ARS, GBP, EUR and ZMK are to Canadian dollars, Australian dollars, South African rand, Chilean pesos, Papua New Guinea kina, Tanzanian schillings, Japanese yen, Argentinean pesos, British Pound Sterling, Euros and Zambian Kwacha, respectively.
1 > CORPORATE INFORMATION
Barrick Gold Corporation (“Barrick” or the “Company”) is a corporation governed by the Business Corporation Act (Ontario). The Company’s head and registered office is located at Brookfield Place, TD Canada Trust Tower, 161 Bay Street, Suite 3700, Toronto, Ontario, M5J 2S1. We are principally engaged in the production and sale of gold and copper, as well as related activities such as exploration and mine development. We also hold interests in oil and gas properties located in Canada. Our producing gold mines are concentrated in three regional business units (“RBU”): North America, South America, and Australia Pacific. We also hold a 73.9% equity interest in African Barrick Gold plc (“ABG”), a company listed on the London Stock Exchange that owns gold mines and exploration properties in Africa. Our Copper business unit contains producing copper mines located in Chile and Zambia and a mine under construction located in Saudi Arabia. We sell our gold and copper production into the world market.
2 > SIGNIFICANT ACCOUNTING POLICIES
| A) | Statement of Compliance |
These consolidated financial statements have been prepared in accordance with International Financial Reporting Standards (“IFRS”) as issued by the International Accounting Standards Board (“IASB”) under the historical cost convention, as modified by revaluation of derivative contracts and certain financial assets. The policies applied in these financial statements are based on IFRSs in effect as at February 15, 2012, the date the Board of Directors approved these consolidated financial statements for issue.
Prior to the adoption of IFRS, our primary financial statements were prepared in accordance with United States generally accepted accounting principles (“US GAAP”). Disclosure of our elected transition exemptions and reconciliation and explanation of accounting policy differences compared to US GAAP have been provided in Note 3 to these consolidated financial statements.
Subsidiaries
These consolidated financial statements include the accounts of Barrick and its subsidiaries. All intercompany balances, transactions, income and expenses, and profits or losses have been eliminated on consolidation. We consolidate subsidiaries where we have the ability to exercise control. Control is achieved when we have the power to govern the financial and operating policies of the entity. Control is normally achieved through ownership, directly or indirectly, of more than 50 percent of the voting power. Control can also be achieved through power over more than half of the voting rights by virtue of an agreement with other investors or through the exercise of de facto control. For non wholly-owned subsidiaries, the net assets attributable to outside equity shareholders are presented as “non-controlling interests” in the equity section of the consolidated balance sheet. Profit for the period that is attributable to non-controlling interests is calculated based on the ownership of the minority shareholders in the subsidiary.
Joint Ventures
A joint venture is a contractual arrangement whereby two or more parties undertake an economic activity that is subject to joint control. Joint control is the contractually agreed sharing of control such that significant operating and financial decisions require the unanimous consent of the parties sharing control. Our joint ventures consist of jointly controlled assets (“JCAs”) and jointly controlled entities (“JCEs”).
A JCA is a joint venture in which the venturers have control over the assets contributed to or acquired for the purposes of the joint venture. JCAs do not involve the establishment of a corporation, partnership or other entity. The participants in a JCA derive benefit from the joint activity through a share of production, rather than by receiving a share of the net operating results. Our proportionate interest in the assets, liabilities, revenues, expenses, and cash flows of JCAs are incorporated into the consolidated financial statements under the appropriate headings.
A JCE is a joint venture that involves the establishment of a corporation, partnership or other entity in which each venturer has a long-term interest. We account for our interests in JCEs using the equity method of accounting.
| | | | |
| BARRICK YEAR END 2011 | | 91 | | NOTES TO FINANCIAL STATEMENTS |
On acquisition, an equity method investment is initially recognized at cost. The carrying amount of equity method investments includes goodwill identified on acquisition, net of any accumulated impairment losses. The carrying amount is adjusted by our share of post- acquisition net income or loss, depreciation, amortization or impairment of the fair value adjustments made at the date of acquisition, dividends and our share of post-acquisition movements in Other Comprehensive Income (“OCI”).
Associates
An associate is an entity over which the investor has significant influence but not control and that is neither a subsidiary nor an interest in a joint venture. Significant influence is presumed to exist where the Company has between 20 percent and 50 percent of the voting rights, but can also arise where the Company has less than 20 percent if we have the power to be actively involved and influential in policy decisions affecting the entity. Our share of the net assets and net income or loss are accounted for in the consolidated financial statements using the equity method of accounting.
Consolidation Method at December 31, 2011
Outlined below are the accounting methods used for entities other than 100% owned Barrick subsidiaries:
| | | | | | |
| | | Entity type at December 31, 2011 | | Economic interest at December 31, 20111 | | Method |
Marigold Mine | | JCA | | 33% | | Proportional |
Round Mountain Mine | | JCA | | 50% | | Proportional |
Turquoise Ridge Mine | | JCA | | 75% | | Proportional |
Kalgoorlie Mine | | JCA | | 50% | | Proportional |
Porgera Mine | | JCA | | 95% | | Proportional |
African Barrick Gold plc2,3 | | Subsidiary, publicly traded | | 73.9% | | Consolidation |
Pueblo Viejo Project3 | | Subsidiary | | 60% | | Consolidation |
Cerro Casale Project3 | | Subsidiary | | 75% | | Consolidation |
Donlin Gold Project5 | | JCE | | 50% | | Equity Method |
Reko Diq Project4,5 | | JCE | | 37.5% | | Equity Method |
Kabanga Project5 | | JCE | | 50% | | Equity Method |
Highland Gold Plc | | Associate, publicly traded | | 20.4% | | Equity Method |
| 1 | Unless otherwise noted, all of our joint ventures are funded by contributions made by their partners in proportion to their economic interest. |
| 2 | In 2010, we completed an initial public offering (“IPO”) for a non-controlling interest in our African gold mining operations. As a result of this transaction, our economic interest in the North Mara, Bulyanhulu and Buzwagi gold mines was reduced from 100% to 73.9% and our economic interest in the Tulawaka gold mine was reduced from 70% to 51.7%. |
| 3 | We consolidate our interests in Pueblo Viejo, Cerro Casale and ABG and record a non-controlling interest for the 40%, 25% and 26.1%, respectively, that we do not own. |
| 4 | We hold a 50% interest in Atacama Copper, which has a 75% interest in the Reko Diq project. |
| 5 | Our jointly controlled entities are all early stage exploration projects and, as such, do not have any significant assets, liabilities, income, contractual commitments or contingencies. Expenses are recognized through our equity pick-up (loss). Refer to note 14 for further details. |
On the acquisition of a business, the acquisition method of accounting is used, whereby the purchase consideration is allocated to the identifiable assets and liabilities on the basis of fair value at the date of acquisition. Provisional fair values allocated at a reporting date are finalized as soon as the relevant information is available, within a period not to exceed twelve months from the acquisition date with retroactive restatement of the impact of adjustments to those provisional fair values effective as at the acquisition date. Incremental costs related to acquisitions are expensed as incurred.
When purchase consideration is contingent on future events, the initial cost of the acquisition recorded includes
an estimate of the fair value of the contingent amounts expected to be payable in the future. When the fair value of contingent consideration as at the date of acquisition is finalized before the end of the twelve month measurement period, the adjustment is allocated to the identifiable assets and liabilities acquired. Subsequent changes to the estimated fair value of contingent consideration are recorded in the consolidated statement of income.
When the cost of the acquisition exceeds the fair values of the identifiable net assets acquired, the difference is recorded as goodwill. If the fair value attributable to Barrick’s share of the identifiable net assets exceeds the cost of acquisition, the difference is recognized as a gain in the consolidated statement of income.
| | | | |
| BARRICK YEAR END 2011 | | 92 | | NOTES TO FINANCIAL STATEMENTS |
Non-controlling interests represent the fair value of net assets in subsidiaries, as at the date of acquisition, that are not held by Barrick and are presented in the equity section of the consolidated balance sheet.
When control of a subsidiary is acquired in stages, its carrying value prior to the change in control is compared with the fair value of the identifiable net assets at the date of the change of control. If fair value is greater than/less than carrying value, a gain/loss is recorded in the consolidated statement of income.
| D) | Discontinued Operations |
A discontinued operation is a component of the Company that can be clearly distinguished from the rest of the Company, both operationally and for financial reporting purposes, and is expected to be recovered primarily through sale rather than continuing use. The assets and liabilities are presented as held for sale in the consolidated balance sheet when the sale is highly probable, the asset or disposal group is available for immediate sale in its present condition and management is committed to the sale, which should be expected to qualify for recognition as a completed sale within one year from the date of classification. Results of operations and any gain or loss from disposal are excluded from earnings before finance items and tax and are reported separately as Income from discontinued operations.
| E) | Foreign Currency Translation |
The functional currency of the Company, for each subsidiary of the Company, and for joint ventures and associates, is the currency of the primary economic environment in which it operates. The functional currency of our gold and copper operations is the US dollar. We translate non-US dollar balances for these operations into US dollars as follows:
| • | | Property, plant and equipment (“PP&E”), intangible assets and equity method investments using historical rates; |
| • | | Available-for-sale securities using the closing exchange rate as at the balance sheet date with translation gains and losses recorded in OCI; |
| • | | Deferred tax assets and liabilities using the closing exchange rate as at the balance sheet date with translation gains and losses recorded in income tax expense; |
| • | | Other assets and liabilities using the closing exchange rate as at the balance sheet date with translation gains and losses recorded in other income/expense; and |
| • | | Income and expenses using the average exchange rate for the period, except for expenses that relate to non-monetary assets and liabilities measured at historical |
| | | rates, which are translated using the same historical rate as the associated non-monetary assets and liabilities. |
The functional currency of our Canadian oil and gas operations is the Canadian dollar. We translate non-US dollar balances related to these operations into US dollars as follows:
| • | | Assets and liabilities using the closing exchange rate as at the balance sheet date with translation gains and losses recorded in OCI; and |
| • | | Income and expense using the average exchange rate for the period with translation gains and losses recorded in OCI. |
We record revenue when evidence exists that all of the following criteria are met:
| • | | The significant risks and rewards of ownership of the product have been transferred to the buyer; |
| • | | Neither continuing managerial involvement to the degree usually associated with ownership, nor effective control over the goods sold, has been retained; |
| • | | The amount of revenue can be reliably measured; |
| • | | It is probable that the economic benefits associated with the sale will flow to us; and |
| • | | The costs incurred or to be incurred in respect of the sale can be reliably measured. |
These conditions are generally satisfied when title passes to the customer.
Gold Bullion Sales
Gold bullion is sold primarily in the London spot market. The sales price is fixed at the delivery date based on the gold spot price. Generally, we record revenue from gold bullion sales at the time of physical delivery, which is also the date that title to the gold passes.
Concentrate Sales
Under the terms of concentrate sales contracts with independent smelting companies, gold and copper sales prices are provisionally set on a specified future date after shipment based on market prices. We record revenues under these contracts at the time of shipment, which is also when the risk and rewards of ownership pass to the smelting companies, using forward market gold and copper prices on the expected date that final sales prices will be fixed. Variations between the price recorded at the shipment date and the actual final price set under the smelting contracts are caused by changes in market gold and copper prices, and result in an embedded derivative in accounts receivable. The embedded derivative is recorded at fair value each period until final settlement occurs, with changes in fair value classified as provisional price
| | | | |
| BARRICK YEAR END 2011 | | 93 | | NOTES TO FINANCIAL STATEMENTS |
adjustments and included in revenue in the consolidated statement of income.
Copper Cathode Sales
Under the terms of copper cathode sales contracts, copper sales prices are provisionally set on a specified future date based upon market commodity prices plus certain price adjustments. Revenue is recognized at the time of shipment, which is also when the risks and rewards of ownership pass to the customer. Revenue is provisionally measured using forward market prices on the expected date that final selling prices will be fixed. Variations occur between the price recorded on the date of revenue recognition and the actual final price under the terms of the contracts due to changes in market copper prices, which result in the existence of an embedded derivative in accounts receivable. This embedded derivative is recorded at fair value each period until final settlement occurs, with changes in fair value classified as provisional price adjustments and included in revenue in the consolidated statement of income.
Oil and Gas Sales
Revenue from the sale of crude oil, natural gas and natural gas liquids is recorded at the time it enters the pipeline system, which is also when risks and rewards of ownership are transferred. At the time of delivery of oil and gas, revenues are determined based upon contracts by reference to monthly market commodity prices plus certain price adjustments. Price adjustments include product quality and transportation adjustments and market differentials.
| G) | Exploration and Evaluation |
Exploration expenditures are the costs incurred in the initial search for mineral deposits with economic potential or in the process of obtaining more information about existing mineral deposits. Exploration expenditures typically include costs associated with prospecting, sampling, mapping, diamond drilling and other work involved in searching for ore.
Evaluation expenditures are the costs incurred to establish the technical and commercial viability of developing mineral deposits identified through exploration activities or by acquisition. Evaluation expenditures include the cost of (i) establishing the volume and grade of deposits through drilling of core samples, trenching and sampling activities in an ore body that is classified as either a mineral resource or a proven and probable reserve; (ii) determining the optimal methods of extraction and metallurgical and treatment processes; (iii) studies related to surveying, transportation and infrastructure requirements; (iv)
permitting activities; and (v) economic evaluations to determine whether development of the mineralized material is commercially justified, including scoping, prefeasibility and final feasibility studies.
Exploration and evaluation expenditures are capitalized if management determines that probable future economic benefits will be generated as a result of the expenditures. Cash flows attributable to capitalized exploration and evaluation expenditures are classified as investing activities in the consolidated statement of cash flow.
For our oil and gas properties, we follow the successful efforts method of accounting, whereby exploration expenditures that are either general in nature or related to an unsuccessful drilling program are recorded as exploration expense in the consolidated statement of income. Only costs that relate directly to the discovery and development of specific commercial oil and gas reserves are capitalized as development costs.
Earnings per share is computed by dividing net income available to common shareholders by the weighted average number of common shares outstanding for the period. Diluted earnings per share reflect the potential dilution that could occur if additional common shares are assumed to be issued under securities that entitle their holders to obtain common shares in the future. For stock options, the number of additional shares for inclusion in diluted earnings per share calculations is determined using the treasury stock method. Under this method, stock options, whose exercise price is less than the average market price of our common shares, are assumed to be exercised and the proceeds are used to repurchase common shares at the average market price for the period. The incremental number of common shares issued under stock options and repurchased from proceeds is included in the calculation of diluted earnings per share. For convertible debentures, the number of additional shares for inclusion in diluted earnings per share calculations is determined using the as if converted method. The incremental number of common shares issued is included in the number of weighted average shares outstanding and interest on the convertible debentures is excluded from the calculation of income.
Current tax for each taxable entity is based on the local taxable income at the local statutory tax rate enacted or substantively enacted at the balance sheet date and includes adjustments to tax payable or recoverable in respect of previous periods.
| | | | |
| BARRICK YEAR END 2011 | | 94 | | NOTES TO FINANCIAL STATEMENTS |
Deferred tax is recognized using the balance sheet method in respect of all temporary differences between the tax bases of assets and liabilities, and their carrying amounts for financial reporting purposes, except as indicated below.
Deferred income tax liabilities are recognized for all taxable temporary differences, except:
| • | | Where the deferred income tax liability arises from the initial recognition of goodwill, or the initial recognition of an asset or liability in an acquisition that is not a business combination and, at the time of the acquisition, affects neither the accounting profit nor taxable profit or loss; and |
| • | | In respect of taxable temporary differences associated with investments in subsidiaries, associates and interests in joint ventures, where the timing of the reversal of the temporary differences can be controlled and it is probable that the temporary differences will not reverse in the foreseeable future. |
Deferred income tax assets are recognized for all deductible temporary differences, carry-forward of unused tax assets and unused tax losses, to the extent that it is probable that taxable profit will be available against which the deductible temporary differences and the carry-forward of unused tax assets and unused tax losses can be utilized, except:
| • | | Where the deferred income tax asset relating to the deductible temporary difference arises from the initial recognition of an asset or liability in an acquisition that is not a business combination and, at the time of the acquisition, affects neither the accounting profit nor taxable profit or loss; and |
| • | | In respect of deductible temporary differences associated with investments in subsidiaries, associates and interests in joint ventures, deferred tax assets are recognized only to the extent that it is probable that the temporary differences will reverse in the foreseeable future and taxable profit will be available against which the temporary differences can be utilized. |
The carrying amount of deferred income tax assets is reviewed at each balance sheet date and reduced to the extent that it is no longer probable that sufficient taxable profit will be available to allow all or part of the deferred income tax asset to be utilized. To the extent that an asset not previously recognized fulfills the criteria for recognition, a deferred income tax asset is recorded.
Deferred tax is measured on an undiscounted basis at the tax rates that are expected to apply in the periods in which the asset is realized or the liability is settled, based on tax
rates and tax laws enacted or substantively enacted at the balance sheet date.
Current and deferred tax relating to items recognized directly in equity are recognized in equity and not in the income statement.
Royalties and Special Mining Taxes
Income tax expense includes the cost of royalty and special mining taxes payable to governments that are calculated based on a percentage of taxable profit whereby taxable profit represents net income adjusted for certain items defined in the applicable legislation.
Investments in publically quoted equity securities that are neither subsidiaries nor associates are categorized as available-for-sale. Available-for-sale equity investments are recorded at fair value with unrealized gains and losses recorded in OCI. Realized gains and losses are recorded in earnings when investments are sold and are calculated using the average carrying amount of securities sold.
If the fair value of an investment declines below the carrying amount, we undertake qualitative and quantitative assessments of whether the impairment is either significant or prolonged. We consider all relevant facts and circumstances in this assessment, particularly the length of time and extent to which fair value has been less than the carrying amount.
If an unrealized loss on an available-for-sale investment has been recognized in OCI and it is deemed to be either significant or prolonged, any cumulative loss that had been recognized in OCI is reclassified as an impairment loss in the consolidated statement of income. The reclassification adjustment is calculated as the difference between the acquisition cost (net of any principal repayment and amortization) and current fair value, less any impairment loss on that financial asset previously recognized. If the value of a previously impaired available for sale equity investment subsequently recovers, additional unrealized gains are recorded in OCI and the previously recorded impairment losses are not subject to reversal through the consolidated statement of income.
Material extracted from our mines is classified as either ore or waste. Ore represents material that, at the time of extraction, we expect to process into a saleable form and sell at a profit. Raw materials are comprised of both ore in stockpiles and ore on leach pads as processing is required to extract benefit from the ore. Ore is accumulated in
| | | | |
| BARRICK YEAR END 2011 | | 95 | | NOTES TO FINANCIAL STATEMENTS |
stockpiles that are subsequently processed into gold/copper in a saleable form. The recovery of gold and copper from certain oxide ores is achieved through the heap leaching process. Work in process represents gold/copper in the processing circuit that has not completed the production process, and is not yet in a saleable form. Finished goods inventory represents gold/copper in saleable form that has not yet been sold. Mine operating supplies represent commodity consumables and other raw materials used in the production process, as well as spare parts and other maintenance supplies that are not classified as capital items.
Inventories are valued at the lower of cost and net realizable value. Cost is determined on a weighted average basis and includes all costs incurred, based on a normal production capacity, in bringing each product to its present location and condition. Cost of inventories comprises direct labor, materials and contractor expenses, including non-capitalized stripping costs; depreciation on PP&E including capitalized stripping costs; and an allocation of mine site overhead costs. As ore is removed for processing, costs are removed based on the average cost per ounce/pound in the stockpile.
We record provisions to reduce inventory to net realizable value to reflect changes in economic factors that impact inventory value and to reflect present intentions for the use of slow moving and obsolete supplies inventory. Net realizable value is determined with reference to relevant market prices less applicable variable selling expenses. Provisions recorded also reflect an estimate of the remaining costs of completion to bring the inventory into its saleable form. Provisions are also recorded to reduce mine operating supplies to net realizable value, which is generally calculated by reference to its salvage or scrap value, when it is determined that the supplies are obsolete. Provisions are reversed to reflect subsequent recoveries in net realizable value where the inventory is still on hand.
We assess each mine construction project to determine when a mine moves into production stage. The criteria used to assess the start date are determined based on the unique nature of each mine construction project, such as the complexity of a plant or its location. We consider various relevant criteria to assess when the mine is substantially complete and ready for its intended use and moved into the production stage. Some of the criteria considered would include, but are not limited to, the following: (1) the level of capital expenditures compared to construction cost estimates; (2) the completion of a reasonable period of testing of mine plant and equipment;
(3) the ability to produce minerals in saleable form (within specifications); and (4) the ability to sustain ongoing production of minerals.
When a mine construction project moves into the production stage, the capitalization of certain mine construction costs ceases and costs are either capitalized to inventory or expensed, except for capitalizable costs related to property, plant and equipment additions or improvements, open pit stripping activities that provide a future benefit, underground mine development or E&E expenditures that meet the criteria for capitalization.
Pre-production stripping costs are capitalized until an “other than de minimis” level of mineral is produced, after which time such costs are either capitalized to inventory or expensed as incurred. We consider various relevant criteria to assess when an “other than de minimis” level of mineral is produced. Some of the criteria considered would include, but are not limited to, the following: (1) the amount of minerals mined versus total ounces in LOM ore; (2) the amount of ore tons mined versus total LOM expected ore tons mined; (3) the current stripping ratio versus the LOM strip ratio; and (4) the ore grade versus the LOM grade.
| M) | Property, Plant and Equipment |
Buildings, Plant and Equipment
At acquisition, we record buildings, plant and equipment at cost, including all expenditures incurred to prepare an asset for its intended use. These expenditures consist of: the purchase price; brokers’ commissions; and installation costs including architectural, design and engineering fees, legal fees, survey costs, site preparation costs, freight charges, transportation insurance costs, duties, testing and preparation charges.
We capitalize costs that meet the asset recognition criteria. Costs incurred that do not extend the productive capacity or useful economic life of an asset are considered repairs and maintenance expense and are accounted for as a cost of the inventory produced in the period.
Depreciation commences when buildings, plant and equipment are considered available for use. Once buildings, plant and equipment are considered available for use they are measured as cost less accumulated depreciation and applicable impairment losses.
Depreciation on equipment utilized in the development of assets, including open pit and underground mine development, is depreciated and recapitalized as development costs attributable to the related asset.
| | | | |
| BARRICK YEAR END 2011 | | 96 | | NOTES TO FINANCIAL STATEMENTS |
Annual Depreciation Rates of Major Asset Categories
| | |
Buildings, plant and equipment | | 5 - 25 years |
Underground mobile equipment | | 5 - 7 years |
Light vehicles and other mobile equipment | | 2 - 3 years |
Furniture, computer and office equipment | | 2 - 3 years |
Leasing Arrangements
We enter into leasing arrangements and arrangements that are in substance leasing arrangements. The determination of whether an arrangement is, or contains, a lease is based on the substance of the arrangement at inception date, including whether the fulfillment of the arrangement is dependent on the use of a specific asset or assets or whether the arrangement conveys a right to use the asset.
Leasing arrangements that transfer substantially all the risks and rewards of ownership of the asset to Barrick are classified as finance leases. Finance leases are recorded as an asset with a corresponding liability at an amount equal to the lower of the fair value of the leased property and the present value of the minimum lease payment. Each lease payment is allocated between the liability and finance costs using the effective interest method, whereby a constant rate of interest expense is recognized on the balance of the liability outstanding. The interest element of the lease is charged to the consolidated statement of income as a finance cost.
PP&E assets acquired under finance leases are depreciated, once the asset becomes available for use, over the shorter of the useful life of the asset and the lease term.
All other leases are classified as operating leases. Operating lease payments are recognized as an operating cost in the consolidated statement of income on a straight-line basis over the lease term.
Mineral Properties
Mineral properties consist of: the fair value attributable to mineral reserves and resources acquired in a business combination or asset acquisition; underground mine development costs; open pit mine development costs; capitalized exploration and evaluation costs; and capitalized interest.
i) Acquired Mining Properties
On acquisition of a mining property we prepare an estimate of the fair value attributable to the proven and probable mineral reserves, mineral resources and exploration potential attributable to the property. The estimated fair value attributable to the mineral reserves and the portion of mineral resources considered to be probable of
economic extraction at the time of the acquisition is depreciated on a units of production (“UOP”) basis whereby the denominator is the proven and probable reserves and the portion of resources expected to be extracted economically. The estimated fair value attributable to mineral resources that are not considered to be probable of economic extraction at the time of the acquisition is not subject to depreciation, until the resources become probable of economic extraction in the future. The estimated fair value attributable to exploration licenses is recorded as an intangible asset and is not subject to depreciation until the property enters production.
ii) Underground Mine Development Costs
At our underground mines, we incur development costs to build new shafts, drifts and ramps that will enable us to physically access ore underground. The time over which we will continue to incur these costs depends on the mine life. These underground development costs are capitalized as incurred.
Capitalized underground development costs incurred to enable access to specific ore blocks or areas of the underground mine, and which only provide an economic benefit over the period of mining that ore block or area, are depreciated on a UOP basis, whereby the denominator is estimated ounces/pounds of gold/copper in proven and probable reserves and a portion of resources within that ore block or area where it is considered probable that those resources will be extracted economically.
If capitalized underground development costs provide an economic benefit over the entire mine life, the costs are depreciated on a UOP basis, whereby the denominator is the estimated ounces of gold/pounds of copper in total accessible proven and probable reserves and a portion of resources where it is considered probable that those resources will be extracted economically.
iii) Open Pit Mining Costs
In open pit mining operations, it is necessary to remove overburden and other waste materials to access ore from which minerals can be extracted economically. The process of mining overburden and waste materials is referred to as stripping. Stripping costs incurred in order to provide initial access to the ore body (referred to as pre-production stripping) are capitalized as open pit mine development costs.
Stripping costs incurred during the production stage of a pit are accounted for as costs of the inventory produced during the period that the stripping costs were incurred, unless these costs are expected to provide a future
| | | | |
| BARRICK YEAR END 2011 | | 97 | | NOTES TO FINANCIAL STATEMENTS |
economic benefit. Production phase stripping costs generate a future economic benefit when the related stripping activity: (i) provides access to ore to be mined in the future; (ii) increases the fair value of the mine (or pit) as access to future mineral reserves becomes less costly; and (iii) increases the productive capacity or extends the productive life of the mine (or pit). For production phase stripping costs that are expected to generate a future economic benefit, the current period stripping costs are capitalized as open pit mine development costs.
Capitalized open pit mine development costs are depreciated on a UOP basis whereby the denominator is the estimated ounces/pounds of gold/copper in the associated open pit in proven and probable reserves and the portion of resources considered probable of being extracted economically. Capitalized open pit mine development costs are depreciated once the open pit has entered production and the future economic benefit is being derived.
iv) Oil and Gas Properties
On acquiring an oil and gas property, we estimate the fair value of reserves and resources and we record this amount as an asset at the date of acquisition, which is subject to depreciation, on a UOP basis over proved reserves, when the asset is available for its intended use.
Construction-in-Progress
Assets under construction at operating mines are capitalized as construction-in-progress. The cost of construction-in-progress comprises its purchase price and any costs directly attributable to bringing it into working condition for its intended use. Construction-in-progress amounts related to development projects are included in the carrying amount of the development project. Construction-in-progress amounts incurred at operating mines are presented as a separate asset within PP&E. Construction-in-progress also includes deposits on long lead items. Construction-in-progress is not depreciated. Once the asset is complete and available for use, depreciation is commenced.
Capitalized Interest
We capitalize interest costs for qualifying assets. Qualifying assets are assets that require a significant amount of time to prepare for their intended use, including projects that are in the exploration and evaluation, development or construction stages. Qualifying assets also include significant expansion projects at our operating mines. Capitalized interest costs are considered an element of the historical cost of the qualifying asset. Capitalization ceases when the asset is substantially
complete or if construction is interrupted for an extended period. Where the funds used to finance a qualifying asset form part of general borrowings, the amount capitalized is calculated using a weighted average of rates applicable to the relevant borrowings during the period. Where funds borrowed are directly attributable to a qualifying asset, the amount capitalized represents the borrowing costs specific to those borrowings. Where surplus funds available out of money borrowed specifically to finance a project are temporarily invested, the total capitalized interest is reduced by income generated from short-term investments of such funds.
Insurance
We record losses relating to insurable events as they occur. Proceeds receivable from insurance coverage are recorded at such time as receipt is virtually certain and the amount receivable is fixed or determinable. For business interruption the amount is only recognized when it is virtually certain as supported by receipt of notification of a minimum or proposed settlement amount from the insurance adjuster.
Under the acquisition method of accounting, the costs of business combinations are allocated to the assets acquired and liabilities assumed based on the estimated fair value at the date of acquisition. The excess of the fair value of consideration paid over the fair value of the identifiable net assets acquired is recorded as goodwill. Goodwill is not amortized; instead it is tested annually for impairment at the beginning of the fourth quarter for gold operating segments and the end of the fourth quarter for the copper operating segment. In addition, at each reporting period we assess whether there is an indication that goodwill is impaired and, if there is such an indication, we would test for goodwill impairment at that time. Goodwill is allocated to the group of cash generating units (“CGU”) that comprise an operating segment since each CGU in a segment is expected to derive benefits from a business combination that results in the recognition of goodwill. This consideration is based on the following: i) We manage our business using a business unit structure, and each business unit is an operating segment for reporting purposes. ii) Each business unit is responsible for the management of the operations in the unit. The Chief Operating Decision Maker (“CODM”) assesses the performance and makes capital allocation decisions for each business unit on this basis. iii) Each CGU in a segment is expected to benefit from the synergies arising as a result of business combinations, including: shared resources and infrastructure; administration and overhead; and access to
| | | | |
| BARRICK YEAR END 2011 | | 98 | | NOTES TO FINANCIAL STATEMENTS |
low-cost financing. iv) The CODM monitors goodwill at this level.
The recoverable amount of an operating segment is the higher of Value in Use (“VIU”) and Fair Value Less Costs to Sell (“FVLCS”). A goodwill impairment is recognized for any excess of the carrying amount of the segment over its recoverable amount. Any goodwill impairment is recognized in the consolidated statement of income in the reporting period in which it occurs. Goodwill impairment charges are not reversible.
Intangible assets acquired by way of an asset acquisition or business combination are recognized if the asset is separable or arises from contractual or legal rights and the fair value can be measured reliably on initial recognition.
On acquisition of a mineral property in the exploration stage, we prepare an estimate of the fair value attributable to the exploration licenses acquired, including the fair value attributable to mineral resources, if any, of that property. The fair value of the exploration license is recorded as an intangible asset (acquired exploration potential) as at the date of acquisition. When an exploration stage property moves into development, the acquired exploration potential attributable to that property is transferred to mining interests within PP&E.
| P) | Impairment of Non-Current Assets |
We review and test the carrying amounts of PP&E and intangible assets with definite lives when an indicator of impairment is considered to exist. Impairment assessments on PP&E and intangible assets are conducted at the level of CGUs, which is the lowest level for which identifiable cash flows are largely independent of the cash flows of other assets. For operating mines, projects and oil and gas properties, the individual mine/project/property represents a CGU for impairment testing.
The recoverable amount of a CGU is the higher of VIU and FVLCS. An impairment loss is recognized for any excess of the carrying amount of a CGU over its recoverable amount. Any impairment is recognized as an expense in the consolidated statement of income in the reporting period in which the impairment occurs. Where it is not appropriate to allocate the loss to a separate asset, an impairment loss related to a CGU is allocated to the carrying amount of the assets of the CGU on a pro rata basis based on the carrying amount of its non-monetary assets.
Impairment Reversal
Impairment losses for PP&E and intangible assets are reversed if the conditions that gave rise to the impairment are no longer present and it has been determined that the asset is no longer impaired as a result. This reversal is recognized in the consolidated statement of income and is limited to the carrying value that would have been determined, net of any depreciation where applicable, had no impairment charge been recognized in prior years. When an impairment reversal is undertaken, the recoverable amount is assessed by reference to the higher of VIU and FVLCS.
Debt is recognized initially at fair value, net of financing costs incurred, and subsequently measured at amortized cost. Any difference between the amounts originally received and the redemption value of the debt is recognized in the consolidated statement of income over the period to maturity using the effective interest method.
| R) | Derivative Instruments and Hedge Accounting |
Derivative Instruments
Derivative instruments are recorded at fair value on the consolidated balance sheet, classified based on contractual maturity. Derivative instruments are classified as either hedges of the fair value of recognized assets or liabilities or of firm commitments (“fair value hedges”), hedges of highly probable forecast transactions (“cash flow hedges”) or non-hedge derivatives. Derivatives designated as either a fair value or cash flow hedge that are expected to be highly effective in achieving offsetting changes in fair value or cash flows are assessed on an ongoing basis to determine that they actually have been highly effective throughout the financial reporting periods for which they were designated. Derivative assets and derivative liabilities are shown separately in the balance sheet unless there is a legal right to offset and the intent to settle on a net basis.
Fair Value Hedges
Changes in the fair value of derivatives that are designated and qualify as fair value hedges are recorded in the consolidated statement of income, together with any changes in the fair value of the hedged asset or liability or firm commitment that is attributable to the hedged risk. The gain or loss relating to the ineffective portion is recognized in the consolidated statement of income.
Cash Flow Hedges
The effective portion of changes in the fair value of derivatives that are designated and qualify as cash flow hedges is recognized in equity. The gain or loss relating to the ineffective portion is recognized in the consolidated
| | | | |
| BARRICK YEAR END 2011 | | 99 | | NOTES TO FINANCIAL STATEMENTS |
statement of income. Amounts accumulated in equity are transferred to the consolidated statement of income in the period when the forecasted transaction impacts earnings. When the forecasted transaction that is hedged results in the recognition of a non-financial asset or a non-financial liability, the gains and losses previously deferred in equity are transferred from equity and included in the measurement of the initial carrying amount of the asset or liability.
When a derivative designated as a cash flow hedge expires or is sold and the forecasted transaction is still expected to occur, any cumulative gain or loss relating to the derivative that is recorded in equity at that time remains in equity and is recognized in the consolidated statement of income when the forecasted transaction occurs. When a forecasted transaction is no longer expected to occur, the cumulative gain or loss that was recorded in equity is immediately transferred to the consolidated statement of income.
Non-Hedge Derivatives
Derivative instruments that do not qualify as either fair value or cash flow hedges are recorded at their fair value at the balance sheet date, with changes in fair value recognized in the consolidated statement of income.
Derivatives embedded in other financial instruments or other executory contracts are accounted for as separate derivatives when their risks and characteristics are not closely related to their host financial instrument or contract. In some cases, the embedded derivatives may be designated as hedges and are accounted for as described above.
Fair value is the price that would be received to sell an asset or paid to transfer a liability in an orderly transaction between market participants at the measurement date. The fair value hierarchy establishes three levels to classify the inputs to valuation techniques used to measure fair value.
| U) | Environment Rehabilitation Provision |
Mining, extraction and processing activities normally give rise to obligations for environmental rehabilitation. Rehabilitation work can include facility decommissioning and dismantling; removal or treatment of waste materials; site and land rehabilitation, including compliance with and monitoring of environmental regulations; security and other site-related costs required to perform the rehabilitation work; and operation of equipment designed
to reduce or eliminate environmental effects. The extent of work required and the associated costs are dependent on the requirements of relevant authorities and our environmental policies. Routine operating costs that may impact the ultimate closure and rehabilitation activities, such as waste material handling conducted as an integral part of a mining or production process, are not included in the provision. Costs arising from unforeseen circumstances, such as the contamination caused by unplanned discharges, are recognized as an expense and liability when the event occurs that gives rise to an obligation and reliable estimates of the required rehabilitation costs can be made.
Provisions for the cost of each rehabilitation program are normally recognized at the time that an environmental disturbance occurs or a constructive obligation is determined. When the extent of disturbance increases over the life of an operation, the provision is increased accordingly. The major parts of the carrying amount of provisions relate to tailings pond closure/rehabilitation; demolition of buildings/mine facilities; ongoing water treatment; and ongoing care and maintenance of closed mines. Costs included in the provision encompass all closure and rehabilitation activity expected to occur progressively over the life of the operation and at the time of closure in connection with disturbances as at the reporting date. Estimated costs included in the determination of the provision reflect the risks and probabilities of alternative estimates of cash flows required to settle the obligation at each particular operation. The expected rehabilitation costs are estimated based on the cost of external contractors performing the work or the cost of performing the work internally depending on management’s intention.
The timing of the actual rehabilitation expenditure is dependent upon a number of factors such as the life and nature of the asset, the operating license conditions and the environment in which the mine operates. Expenditures may occur before and after closure and can continue for an extended period of time depending on rehabilitation requirements. Rehabilitation provisions are measured at the expected value of future cash flows, discounted to their present value using a current US dollar real risk-free pre-tax discount rate. The expected future cash flows exclude the effect of inflation. The unwinding of the discount, referred to as accretion expense, is included in finance costs and results in an increase in the amount of the provision. Provisions are updated each reporting period for changes to expected cash flows and for the effect of changes in the discount rate, and the change in estimate is added or deducted from the related asset and depreciated
| | | | |
| BARRICK YEAR END 2011 | | 100 | | NOTES TO FINANCIAL STATEMENTS |
over the expected economic life of the operation to which it relates.
Significant judgments and estimates are involved in forming expectations of future activities and the amount and timing of the associated cash flows. Those expectations are formed based on existing environmental and regulatory requirements or, if more stringent, our environmental policies which give rise to a constructive obligation.
When provisions for closure and rehabilitation are initially recognized, the corresponding cost is capitalized as an asset, representing part of the cost of acquiring the future economic benefits of the operation. The capitalized cost of closure and rehabilitation activities is recognized in PP&E and depreciated over the expected economic life of the operation to which it relates.
Adjustments to the estimated amount and timing of future closure and rehabilitation cash flows are a normal occurrence in light of the significant judgments and estimates involved. The principal factors that can cause expected cash flows to change are: the construction of new processing facilities; changes in the quantities of material in reserves and resources with a corresponding change in the life of mine plan; changing ore characteristics that impact required environmental protection measures and related costs; changes in water quality that impact the extent of water treatment required; foreign exchange rates and changes in laws and regulations governing the protection of the environment.
Rehabilitation provisions are adjusted as a result of changes in estimates and assumptions. Those adjustments are accounted for as a change in the corresponding value of the related assets including the related mineral property, except where a reduction in the provision is greater than the remaining net book value of the related assets, in which case the value is reduced to nil and the remaining adjustment is recognized in the consolidated statement of income. In the case of closed sites, changes in estimates and assumptions are recognized immediately in the consolidated statement of income. For an operating mine, the adjusted carrying amount of the related asset is depreciated prospectively. Adjustments also result in changes to future finance costs.
| V) | Litigation and Other Provisions |
Provisions are recognized when a present obligation exists (legal or constructive), as a result of a past event, for which it is probable that an outflow of resources will be required to settle the obligation, and a reliable estimate can be made of the amount of the obligation. Provisions are discounted
to their present value using a current US dollar risk-free pre-tax discount rate and the accretion expense is included in finance costs.
Certain conditions may exist as of the date the financial statements are issued, which may result in a loss to the Company, but which will only be resolved when one or more future events occur or fail to occur. In assessing loss contingencies related to legal proceedings that are pending against us or unasserted claims that may result in such proceedings, the Company and its legal counsel evaluate the perceived merits of any legal proceedings or unasserted claims as well as the perceived merits of the amount of relief sought or expected to be sought.
If the assessment of a contingency suggests that a loss is probable, and the amount can be reliably estimated, then a loss is recorded. When a contingent loss is not probable but is reasonably possible, or is probable but the amount of loss cannot be reliably estimated, then details of the contingent loss are disclosed. Loss contingencies considered remote are generally not disclosed unless they involve guarantees, in which case we disclose the nature of the guarantee. Legal fees incurred in connection with pending legal proceedings are expensed as incurred. Contingent gains are only recognized when the inflow of economic benefits are virtually certain.
| W) | Stock-Based Compensation |
Barrick offers equity-settled (Employee Stock Option Plan (“ESOP”), Employee Share Purchase Plan (“ESPP”)) and cash-settled (Restricted Share Units (“RSU”), Deferred Share Units (“DSU”), Performance Restricted Share Units (“PRSU”)) awards to certain employees and officers of the Company.
Equity-settled awards are measured at fair value using the Lattice model with market related inputs as of the date of the grant. The cost is recorded over the vesting period of the award to the same expense category of the award recipient’s payroll costs (i.e. cost of sales, RBU costs, corporate administration) and the corresponding entry is recorded in equity. Equity-settled awards are not remeasured subsequent to the initial grant date.
Cash-settled awards are measured at fair value initially using the market value of the underlying shares at the date of the grant of the award and are required to be remeasured to fair value at each reporting date until settlement. The cost is then recorded over the vesting period of the award. This expense, and any changes in the fair value of the award, is recorded to the same expense category of the award recipient’s payroll costs. The cost of
| | | | |
| BARRICK YEAR END 2011 | | 101 | | NOTES TO FINANCIAL STATEMENTS |
a cash-settled award is recorded within liabilities until settled.
We use the accelerated method (also referred to as ‘graded’ vesting) for attributing stock option expense over the vesting period. Stock option expense incorporates an expected forfeiture rate. The expected forfeiture rate is estimated based on historical forfeiture rates and expectations of future forfeitures rates. We make adjustments if the actual forfeiture rate differs from the expected rate.
Employee Stock Option Plan
Under Barrick’s ESOP, certain officers and key employees of the Corporation may purchase common shares at an exercise price that is equal to the closing share price on the day before the grant of the option. The grant date is the date when the details of the award, including the number of options granted to the individual and the exercise price, are approved. Stock options vest over four years, beginning in the year after granting. The ESOP arrangement has graded vesting terms, and therefore, multiple vesting periods must be valued and accounted for separately over their respective vesting periods. The compensation expense of the instruments issued for each grant under the ESOP is calculated using the Lattice model. The compensation expense is adjusted by the estimated forfeiture rate which is estimated based on historical forfeiture rates and expectations of future forfeiture rates. We make adjustments if the actual forfeiture rate differs from the expected rate.
Restricted Share Units
Under our RSU plan, selected employees are granted RSUs where each RSU has a value equal to one Barrick common share. RSUs vest at the end of two and a half years and are settled in cash upon vesting. Additional RSUs are credited to reflect dividends paid on Barrick common shares over the vesting period.
A liability for RSUs is measured at fair value on the grant date and is subsequently adjusted for changes in fair value. The liability is recognized on a straight-line basis over the vesting period, with a corresponding charge to compensation expense as a component of corporate administration and other expenses. Compensation expenses for RSUs incorporate an estimate for expected forfeiture rates based on which the fair value is adjusted.
African Barrick Gold RSUs
Historically, Barrick maintained a cash-settled RSU plan for select employees who now work for ABG. This plan operates in the identical manner as the Barrick RSU plan.
The existing legacy RSUs will continue to be administered and accounted for based on the movement of the fair value of Barrick common shares for recording liabilities and compensation expense.
Deferred Share Units
Under our DSU plan, Directors must receive a specified portion of their basic annual retainer in the form of DSUs, with the option to elect to receive 100% of such retainer in DSUs. Each DSU has the same value as one Barrick common share. DSUs must be retained until the Director leaves the Board, at which time the cash value of the DSUs is paid out. Additional DSUs are credited to reflect dividends paid on Barrick common shares. The initial fair value of the liability is calculated as of the grant date and is recognized immediately. Subsequently, at each reporting date and on settlement the liability is re-measured, with any change in fair value recorded as Directors compensation expense in the period.
Performance Restricted Share Units
In 2008, Barrick launched a PRSU plan. Under this plan, selected employees are granted PRSUs, where each PRSU has a value equal to one Barrick common share. PRSUs vest at the end of a three-year period and are settled in cash on the third anniversary of the grant date. Additional PRSUs are credited to reflect dividends paid on Barrick common shares over the vesting period. The amount of PRSUs that vest is based on the achievement of performance goals and the target settlement ranges from 0% to 200% of the original grant, in units.
The value of a PRSU reflects the value of a Barrick common share adjusted for its relative performance against certain competitors. Therefore, the fair value of the PRSUs is determined with reference to the closing stock price at each remeasurement date.
The initial fair value of the liability is calculated as of the grant date and is recognized within compensation expense using the straight-line method over the vesting period. Subsequently, at each reporting date and on settlement, the liability is remeasured, with any changes in fair value recorded as compensation expense. The fair value is adjusted for the revised estimated forfeiture rate.
Employee Share Purchase Plan
In 2008, Barrick launched an ESPP. This plan enables Barrick employees to purchase Company shares through payroll deduction. Each year, employees may contribute 1%-6% of their combined base salary and annual bonus, and Barrick will match 50% of the contribution, up to a maximum of $5,000 per year.
| | | | |
| BARRICK YEAR END 2011 | | 102 | | NOTES TO FINANCIAL STATEMENTS |
Both Barrick and the employee make the contributions on a bi-monthly basis with the funds being transferred to a custodian who purchases Barrick Common Shares in the open market. Shares purchased with employee contributions have no vesting requirement; however, shares purchased with Barrick’s contributions vest annually on December 1. All dividend income is used to purchase additional Barrick shares.
Barrick records an expense equal to its bi-monthly cash contribution. No forfeiture rate is applied to the amounts accrued. Where an employee leaves prior to December 1, any accrual for contributions by Barrick during the year related to that employee is reversed.
| X) | Post-Retirement Benefits |
Defined Contribution Pension Plans
Certain employees take part in defined contribution employee benefit plans whereby we contribute up to 6% of the employees’ annual salary and bonus. We also have a retirement plan for certain officers of Barrick under which we contribute 15% of the officer’s annual salary and bonus. The contributions are recognized as compensation expense as incurred. The Company has no further payment obligations once the contributions have been paid.
Defined Benefit Pension Plans
We have qualified defined benefit pension plans that cover certain of our United States and Canadian employees and provide benefits based on employees’ years of service. Our policy is to fund the amounts necessary on an actuarial basis to provide enough assets to meet the benefits payable to plan members. Independent trustees administer assets of the plans, which are invested mainly in fixed income and equity securities.
As well as the qualified plans, we have non-qualified defined benefit pension plans covering certain employees and former directors of Barrick.
Actuarial gains and losses arise when the actual return on plan assets differs from the expected return on plan assets for a period, or when the expected and actuarial accrued benefit obligations differ at the end of the year. We record actuarial gains and losses in other comprehensive income and retained earnings.
Our valuations are carried out using the projected unit credit method and the expected rate of return on pension plan assets is determined as management’s best estimate of the long-term return on major asset classes. We record the difference between the fair value of the plan assets (if any) of post-retirement plans and the present value of the
plan obligations as an asset or liability on the consolidated balance sheets.
Pension Plan Assets and Liabilities
Pension plan assets, which consist primarily of fixed-income and equity securities, are valued using current market quotations. Plan obligations and the annual pension expense are determined on an actuarial basis and are affected by numerous assumptions and estimates including the market value of plan assets, estimates of the expected return on plan assets, discount rates, future wage increases and other assumptions.
The discount rate, assumed rate of return on plan assets and wage increases are the assumptions that generally have the most significant impact on our pension cost and obligation.
The assumed rate of return on assets for pension cost purposes is the weighted average of expected long-term asset return assumptions. In estimating the long-term rate of return for plan assets, historical markets are studied and long-term historical returns on equities and fixed-income investments reflect the widely accepted capital market principle that assets with higher volatility generate a greater return over the long run. Current market factors such as inflation and interest rates are evaluated before long-term capital market assumptions are finalized.
Wage increases reflect the best estimate of merit increases to be provided, consistent with assumed inflation rates.
Other Post-Retirement Benefits
We provide post-retirement medical, dental, and life insurance benefits to certain employees. Actuarial gains and losses resulting from variances between actual results and economic estimates or actuarial assumptions are recorded in OCI.
| Y) | New Accounting Standards |
IFRS 9 Financial Instruments
In November 2009, the IASB issued IFRS 9Financial Instruments as the first step in its project to replace IAS 39Financial Instruments: Recognition and Measurement. IFRS 9 retains but simplifies the mixed measurement model and establishes two primary measurement categories for financial assets: amortized cost and fair value. The basis of classification depends on an entity’s business model and the contractual cash flow of the financial asset. Classification is made at the time the financial asset is initially recognized, namely when the entity becomes a party to the contractual provisions of the instrument.
| | | | |
| BARRICK YEAR END 2011 | | 103 | | NOTES TO FINANCIAL STATEMENTS |
IFRS 9 amends some of the requirements of IFRS 7Financial Instruments: Disclosures, including added disclosures about investments in equity instruments measured at fair value in OCI, and guidance on financial liabilities and derecognition of financial instruments. In December 2011, the IASB issued an amendment that adjusted the mandatory effective date of IFRS 9 from January 1, 2013 to January 1, 2015. We are currently assessing the impact of adopting IFRS 9 on our consolidated financial statements, including the impact of early adoption.
IFRS 10 Consolidated Financial Statements
In May 2011, the IASB issued IFRS 10Consolidated Financial Statements to replace IAS 27Consolidated and Separate Financial Statements and SIC 12Consolidation – Special Purpose Entities. The new consolidation standard changes the definition of control so that the same criteria apply to all entities, both operating and special purpose entities, to determine control. The revised definition focuses on the need to have both power and variable returns before control is present. IFRS 10 must be applied starting January 1, 2013 with early adoption permitted. We are currently assessing the impact of adopting IFRS 10 on our consolidated financial statements.
IFRS 11 Joint Arrangements
In May 2011, the IASB issued IFRS 11Joint Arrangements to replace IAS 31,Interests in Joint Ventures. The new standard defines two types of arrangements: Joint Operations and Joint Ventures. Focus is on the rights and obligations of the parties involved to reflect the joint arrangement, thereby requiring parties to recognize the individual assets and liabilities to which they have rights or for which they are responsible, even if the joint arrangement operates in a separate legal entity. IFRS 11 must be applied starting January 1, 2013 with early adoption permitted. We are currently assessing the impact of adopting IFRS 11 on our consolidated financial statements.
IFRS 12 Disclosure of Interests in Other Entities
In May 2011, the IASB issued IFRS 12Disclosure of Interests in Other Entities to create a comprehensive disclosure standard to address the requirements for subsidiaries, joint arrangements and associates including the reporting entity’s involvement with other entities. It also includes the requirements for unconsolidated structured entities (i.e. special purpose entities). IFRS 12 must be applied starting January 1, 2013 with early adoption permitted. We are currently assessing the impact of adopting IFRS 12 on our consolidated financial statements.
IFRS 13 Fair Value Measurement
In May 2011, the IASB issued IFRS 13Fair Value Measurement as a single source of guidance for all fair value measurements required by IFRS to reduce the complexity and improve consistency across its application. The standard provides a definition of fair value and guidance on how to measure fair value as well as a requirement for enhanced disclosures. IFRS 13 must be applied starting January 1, 2013 with early adoption permitted. We are currently assessing the impact of adopting IFRS 13 on our consolidated financial statements.
IFRIC 20 Stripping Costs in the Production Phase of a Surface Mine
In October 2011, the IASB issued IFRIC 20Stripping Costs in the Production Phase of a Surface Mine. IFRIC 20 provides guidance on the accounting for the costs of stripping activity in the production phase of surface mining when two benefits accrue to the entity from the stripping activity: useable ore that can be used to produce inventory and improved access to further quantities of material that will be mined in future periods. IFRIC 20 must be applied starting January 1, 2013 with early adoption permitted. We are currently assessing the impact of adopting IFRIC 20 on our consolidated financial statements.
| Z) | Significant Judgments in Applying Accounting Policies and Key Sources of Estimation Uncertainty |
Many of the amounts included in the consolidated balance sheet require management to make judgments and/or estimates. These judgments and estimates are continuously evaluated and are based on management’s experience and knowledge of the relevant facts and circumstances. Actual results may differ from the amounts included in the consolidated balance sheet. Information about such judgments and estimation is contained in the accounting policies and/or the Notes to the financial statements, and the key areas are summarized below.
Areas of significant judgment that have the most significant effect on the amounts recognized in the consolidated financial statements are:
| • | | Estimates of the quantities of proven and probable reserves and the portion of resources considered to be probable of economic extraction, which are used in: the calculation of depreciation expense; the capitalization of production phase stripping costs; and, forecasting the timing of the payments related to the environmental rehabilitation provision. We estimate our ore reserves and mineral resources based on information compiled by qualified persons as defined in accordance with the Canadian Securities Administrators’ National Instrument |
| | | | |
| BARRICK YEAR END 2011 | | 104 | | NOTES TO FINANCIAL STATEMENTS |
| | | 43-101 Standards of Disclosure for Mineral Projects requirements; |
| • | | Provisional and final fair value allocations recorded as a result of business combinations - note 2(c) and note 4; |
| • | | The future economic benefit of exploration and evaluation costs - note 2(g); |
| • | | The determination of when a mine enters production stage since capitalization of certain costs ceases upon entering production - note 2(l); |
| • | | The determination of operating segments, which has an impact on the level at which goodwill is tested for impairment - note 5; and |
| • | | The estimated useful lives of tangible and long-lived assets and the measurement of depreciation expense - note 2(m); |
Key sources of estimation uncertainty that have a significant risk of causing a material adjustment to the carrying amounts of assets and liabilities within the next financial year are:
| • | | The estimation of the tax basis of assets and liabilities and related deferred income tax assets and liabilities, amounts recorded for uncertain tax positions, the measurement of income tax expense and indirect taxes, and estimates of the repatriation of earnings, which would impact the recognition of withholding taxes and also have an effect on the disclosure of the outside basis on subsidiaries/associates (note 2(i), note 10 and note 27; |
| • | | Estimates of ounces/pounds of gold/copper ore in stockpiles and on leach pads that are estimated based on the number of tons added and removed, the gold/copper contained therein and the metallurgical recovery rate (note 2k and note 15); |
| • | | The estimated fair values of cash generating units for non-current asset impairment tests and groups of CGUs for goodwill impairment tests, including estimates of future production levels and operating and capital costs as included in our life of mine (“LOM”) plans, future commodity prices and discount rates - note 2(n), note 2(p) and note 18(a); |
| • | | The determination of the fair value of derivative instruments - note 2(r) and note 22(d); |
| • | | Recognition of a provision for environmental rehabilitation including the estimation of the rehabilitation costs, timing of expenditures, the impact of changes in discount rates, and changes in environmental and regulatory requirements - note 2(u); and |
| • | | Whether to recognize a liability for loss contingencies and the amount of any such provision (note 2v) and (note 33). |
Other Notes to the Financial Statements
| | | | |
| | | Note | |
Transition to IFRS | | | 3 | |
Acquisitions and divestitures | | | 4 | |
Segment information | | | 5 | |
Revenue | | | 6 | |
Cost of sales | | | 7 | |
Exploration and evaluation | | | 8 | |
Other charges | | | 9 | |
Income tax expense | | | 10 | |
Earnings (loss) per share | | | 11 | |
Finance Income and finance cost | | | 12 | |
Cash flow - other items | | | 13 | |
Investment in equity accounted joint ventures and associates | | | 14 | |
Inventories | | | 15 | |
Accounts receivable and other current assets | | | 16 | |
Property, plant and equipment | | | 17 | |
Goodwill and other intangible assets | | | 18 | |
Other assets | | | 19 | |
Accounts payable | | | 20 | |
Other current liabilities | | | 21 | |
Financial instruments | | | 22 | |
Fair value measurements | | | 23 | |
Provisions and environmental rehabilitation | | | 24 | |
Financial risk management | | | 25 | |
Other non-current liabilities | | | 26 | |
Deferred income taxes | | | 27 | |
Capital stock | | | 28 | |
Non-controlling interests | | | 29 | |
Remuneration of key management personnel | | | 30 | |
Stock-based compensation | | | 31 | |
Post-retirement benefits | | | 32 | |
Litigation and claims | | | 33 | |
| | | | |
| BARRICK YEAR END 2011 | | 105 | | NOTES TO FINANCIAL STATEMENTS |
3 > Transition to IFRS
We adopted IFRS effective January 1, 2011. Our transition date is January 1, 2010 (the “transition date”) and the Company has prepared its opening IFRS balance sheet as at that date. These consolidated financial statements have been prepared in accordance with the accounting policies described in note 2, except for the modifications described below.
| | A) | Elected exemptions from full retrospective application |
In preparing these consolidated financial statements in accordance with IFRS 1First-time Adoption of International Financial Reporting Standards(“IFRS 1”), the Company has applied certain of the optional exemptions from full retrospective application of IFRS. The optional exemptions applied are described below.
(i) Business combinations
We have elected the business combinations exemption in IFRS 1 to not apply IFRS 3 retrospectively to past business combinations. Accordingly, the Company has not restated business combinations that took place prior to the transition date.
(ii) Fair value or revaluation as deemed cost
We have elected to measure certain items of PP&E at fair value as at January 1, 2010 or revaluation amounts previously determined under US GAAP and use those amounts as deemed cost as at January 1, 2010. We have made this election at the following properties: Pascua-Lama, Goldstrike, Plutonic, Marigold, Pierina, Sedibelo and Osborne. We have also elected to adopt this election for certain assets at Barrick Energy, which were adjusted by $166 million to their fair value of $342 million on the transition date to IFRS, due to a decline in oil prices.
(iii) Asset related to provisions for environmental rehabilitation
We have elected to take a simplified approach to calculate and record the asset related to the environmental rehabilitation provision on our opening IFRS consolidated balance sheet. The environmental rehabilitation provision calculated on the transition date in accordance with International Accounting Standard 37Provisions, Contingent Liabilities and Contingent Assets (“IAS 37”) was discounted back to the date when the provision first arose on the mineral property, at which date the corresponding asset was set up and then depreciated to its carrying amount as at the transition date.
(iv) Employee benefits
We have elected to recognize all cumulative actuarial gains and losses as at January 1, 2010 in opening retained earnings for the company’s employee benefit plans.
(v) Cumulative translation differences
We have elected to set the previously accumulated cumulative translation account, which was included in accumulated other comprehensive income (“AOCI”), to zero as at January 1, 2010 and absorbed the balance into retained earnings.
| | | | |
| BARRICK YEAR END 2011 | | 106 | | NOTES TO FINANCIAL STATEMENTS |
| | B) | Reconciliation of equity as reported under US GAAP to IFRS |
The following is a reconciliation of the company’s total equity reported in accordance with US GAAP to its total equity under IFRS at the transition date January 1, 2010:
| | | | | | | | | | | | | | |
| (millions of US$) | | Ref | | Capital
stock | | Retained
earnings
(deficit) | | AOCI | | Other | | Non- controlling
interests | | Total Equity |
As reported under US GAAP | | | | $17,390 | | $(2,382) | | $ 55 | | $ - | | $484 | | $15,547 |
IFRS 1 Exemptions | | | | | | | | | | | | | | |
Deemed cost election for Barrick Energy | | Note 3A (ii) | | - | | (166) | | - | | - | | - | | (166) |
Reset of pension plan actuarial losses | | Note 3A (iv) | | - | | (37) | | 37 | | - | | - | | - |
Reset of cumulative translation losses | | Note 3A (v) | | - | | (141) | | 141 | | - | | - | | - |
IFRS Policy Impacts | | | | | | | | | | | | | | |
Capitalized production phase stripping costs | | (i) | | - | | 408 | | - | | - | | - | | 408 |
Capitalized exploration and evaluation costs | | (ii) | | - | | 160 | | - | | - | | 50 | | 210 |
Reversal of past impairments | | (iii) | | - | | 55 | | - | | - | | - | | 55 |
Changes in capitalized interest | | (iv) | | - | | (125) | | - | | - | | - | | (125) |
Changes in PER (note 3a iii) | | (v) | | - | | (101) | | - | | - | | - | | (101) |
Bifurcation of senior convertible debt | | (vi) | | - | | (31) | | - | | 143 | | - | | 112 |
Exclusion of time value changes in fair value of options designated as hedging instruments | | (vii) | | - | | (33) | | 33 | | - | | - | | - |
Reclassification of hedge gains to related asset | | (viii) | | - | | - | | (20) | | - | | - | | (20) |
Tax effect of IFRS changes | | | | (6) | | (119) | | (14) | | - | | (12) | | (151) |
Others, net | | | | 8 | | (23) | | - | | - | | - | | (15) |
As reported under IFRS | | | | $17,392 | | $(2,535) | | $232 | | $143 | | $522 | | $15,754 |
The following is a reconciliation of the company’s total equity reported in accordance with US GAAP to its total equity under IFRS at December 31, 2010:
| | | | | | | | | | | | | | |
| (millions of US$) | | Ref | | Capital
stock | | Retained
earnings
(deficit) | | AOCI | | Other | | Non- controlling
interests | | Total Equity |
As reported under US GAAP | | | | $17,790 | | $456 | | $531 | | $288 | | $1,669 | | $20,734 |
IFRS 1 Exemptions | | | | | | | | | | | | | | |
Deemed cost election for Barrick Energy | | Note 3A (ii) | | - | | (166) | | - | | - | | - | | (166) |
Reset of pension plan actuarial losses | | Note 3A (iv) | | - | | (37) | | 37 | | - | | - | | - |
Reset of cumulative translation losses | | Note 3A (v) | | - | | (141) | | 141 | | - | | - | | - |
IFRS Policy Impacts | | | | | | | | | | | | | | |
Capitalized production phase stripping costs | | (i) | | - | | 632 | | - | | - | | - | | 632 |
Capitalized exploration and evaluation costs | | (ii) | | - | | 270 | | - | | - | | 50 | | 320 |
Reversal of past impairments | | (iii) | | - | | 139 | | - | | - | | - | | 139 |
Changes in capitalized interest | | (iv) | | - | | (130) | | - | | - | | - | | (130) |
Changes in PER (note 3a iii) | | (v) | | - | | (100) | | - | | - | | - | | (100) |
Bifurcation of senior convertible debt | | (vi) | | - | | (31) | | - | | 38 | | - | | 7 |
Exclusion of time value changes in fair value of options designated as hedging instruments | | (vii) | | - | | (72) | | 72 | | - | | - | | - |
Reclassification of hedge gains to related asset | | (viii) | | - | | - | | (26) | | - | | - | | (26) |
IPO of ABG | | (ix) | | - | | - | | - | | (12) | | 25 | | 13 |
Gain on acquisition of additional 25% interest in Cerro Casale | | (x) | | - | | 13 | | - | | - | | - | | 13 |
Tax effect of IFRS changes | | | | 20 | | (202) | | (20) | | - | | 1 | | (201) |
Others, net | | | | 10 | | (22) | | (6) | | - | | - | | (18) |
As reported under IFRS | | | | $17,820 | | $609 | | $729 | | $314 | | $1,745 | | $21,217 |
| | | | |
| BARRICK YEAR END 2011 | | 107 | | NOTES TO FINANCIAL STATEMENTS |
| | C) | Reconciliation of net income attributable to equity holders of Barrick Gold Corporation as reported under US GAAP to IFRS |
The following is a reconciliation of the company’s net income reported in accordance with US GAAP to its net income under IFRS for the year ended December 31, 2010:
| | | | |
| (millions of US$) | | Ref | | Year ended
December 31, 2010 |
Net Income - As reported under US GAAP | | | | $3,274 |
IFRS Policy Impacts | | | | |
Capitalized production phase stripping costs | | (i) | | 224 |
Capitalized exploration and evaluation costs | | (ii) | | 110 |
Reversal of past impairments | | (iii) | | 84 |
Changes in capitalized interest | | (iv) | | (5) |
Changes in PER (note 3a iii) | | (v) | | 1 |
Exclusion of time value changes in fair value of options designated as hedging instruments | | (vii) | | (39) |
Gain on acquisition of additional 25% interest in Cerro Casale | | (x) | | 13 |
Tax effect of IFRS changes | | | | (83) |
Non-controlling interest share of income | | | | (25) |
Others, net | | | | 28 |
Net Income - As reported under IFRS | | | | $3,582 |
| | D) | Reconciliation of OCI as reported under US GAAP to IFRS |
The following is a reconciliation of the company’s OCI reported in accordance with US GAAP to its OCI under IFRS for the year ended December 31, 2010:
| | | | |
| (millions of US$) | | Ref | | Year ended
December 31, 2010 |
OCI - As reported under US GAAP | | | | $476 |
IFRS Policy Impacts | | | | |
Exclusion of gains/(losses) on time value changes in fair value of options designated as hedging instruments, net of tax | | (vii) | | 33 |
Realized capital hedges gains/(losses) transferred to PP&E, net of tax | | (vii) | | (6) |
Currency translation adjustments on deemed cost election for Barrick Energy, net of tax | | | | (8) |
OCI - As reported under IFRS | | | | $495 |
| | E) | Reconciliation of net cash provided by operating activities and net cash used in investing activities as reported under US GAAP to IFRS |
The following is a reconciliation showing material adjustments to the company’s consolidated statement of cash flow as reported under US GAAP to its consolidated cash flow statement under IFRS for the year ended December 31, 2010:
| | | | |
| Operating Activities | | | | |
| (millions of US$) | | Ref | | Year ended
Dec. 31, 2010 |
Net cash provided by operating activities - As reported under US GAAP | | | | $4,127 |
IFRS Policy Impacts | | | | |
Capitalized development costs1 | | (i), (ii) | | 458 |
Net cash provided by operating activities - As reported under IFRS | | | | $4,585 |
| | | | |
| BARRICK YEAR END 2011 | | 108 | | NOTES TO FINANCIAL STATEMENTS |
| | | | |
| Investing Activities | | | | |
| (millions of US$) | | Ref | | Year ended
Dec. 31, 2010 |
Net cash used in investing activities - As reported under US GAAP | | | | ($4,172) |
IFRS Policy Impacts | | | | |
Capitalized development costs1 | | (i), (ii) | | (458) |
Net cash used in investing activities - As reported under IFRS | | | | ($4,630) |
| 1 | The net cash provided by operating activities and the net cash used in investing activities increased due to the increased capitalization of development costs including production phase stripping costs and exploration and evaluation costs under IFRS compared to US GAAP. The change in net cash provided by financing activities was the same under US GAAP and IFRS. |
References
| (i) | Under IFRS, production phase stripping costs for open pit mines are capitalized to PP&E if the stripping activities provide a probable future economic benefit. Under US GAAP, these costs are treated as current production costs. Capitalized stripping costs also resulted in an increase in depreciation expense. |
| (ii) | Under IFRS, exploration and evaluation expenditures are capitalized if management determines that probable future economic benefits will be generated as a result of the expenditures. We capitalized additional exploration and evaluation costs at certain properties, mainly Cerro Casale, where management assessed under IFRS that it was probable that these expenditures would result in future economic benefits. |
| (iii) | Under IFRS, past impairments of equity investments can be reversed if there is a recovery in the realizable value of the investment. In 2008, we recorded an impairment of $139 million on our investment in Highland Gold. In our opening IFRS balance sheet and throughout 2010, we have recorded reversals of this impairment charge as the fair value of our investment increased due to a recovery in the quoted share price. |
| (iv) | Investments accounted for using the equity method of accounting are not qualifying assets under IFRS for the purpose of capitalizing interest. On transition and in subsequent quarters, this resulted in the reversal of previously capitalized interest primarily related to Cerro Casale. This was partially offset by higher capitalization of interest due to capitalization of production phase stripping and exploration and evaluation costs. |
| (v) | Under IFRS, Provisions for Environmental Rehabilitation (PER) are updated each reporting period for changes in discount rates and exchange rates. |
| (vi) | IFRS requires bifurcation of convertible debt instruments, with the debt and equity portions to be recognized separately. This change also resulted in reversal of previously amortized debt premium from retained earnings. |
| (vii) | Under IFRS, all realized and unrealized non-hedge derivative gains or losses, gains or losses related to hedge ineffectiveness and changes in fair value of option derivatives designated as accounting hedges due to changes in time value, which are excluded from the hedge effectiveness assessment, are presented as a separate line item on the consolidated statement of income. Under US GAAP these amounts were presented in the respective income statement line item most closely related to the risk exposure expected to be offset by the derivative, and changes in fair value due to changes in time value were recognized in equity. |
| (viii) | The capitalization of production phase stripping costs resulted in the reclassification of the related currency hedge gains realized on such expenditures from retained earnings to PP&E. |
| (ix) | The difference in the carrying amount of ABG under IFRS compared to its carrying amount under US GAAP resulted in an adjustment to paid-in capital in the equity section of the balance sheet, with a corresponding adjustment in the non-controlling interest. |
| (x) | In the first quarter of 2010, Barrick acquired an additional 25% ownership interest in the Cerro Casale project. Due to the elimination of capitalized interest on investments accounted for using the equity method of accounting, the carrying amount was lower under IFRS, which resulted in a higher gain on acquisition (see note 4f). |
| | | | |
| BARRICK YEAR END 2011 | | 109 | | NOTES TO FINANCIAL STATEMENTS |
4 > ACQUISITIONS AND DIVESTITURES
| | | | | | | | |
| For the years ended December 31 | | 2011 | | | 2010 | |
Cash paid on acquisition1 | | | | | | | | |
Equinox | | $ | 7,482 | | | $ | - | |
Cerro Casale | | | - | | | | 454 | |
Oil and Gas acquisitions | | | 278 | | | | 264 | |
Tusker Gold Limited | | | - | | | | 74 | |
REN | | | - | | | | 36 | |
| | | $ | 7,760 | | | $ | 828 | |
Less: cash acquired | | | (83 | ) | | | (15 | ) |
| | | $ | 7,677 | | | $ | 813 | |
Cash proceeds on divestiture1 | | | | | | | | |
Sedibelo | | $ | 44 | | | $ | - | |
IPO of African Barrick Gold Plc2 | | | - | | | | 884 | |
Osborne | | | - | | | | 17 | |
Pinson | | | 15 | | | | - | |
| | | $ | 59 | | | $ | 901 | |
| 1 | All amounts represent gross cash paid on acquisition or received on divestiture. |
| 2 | There was no change in control as a result of the IPO of ABG, and consequently the net proceeds received were recorded as a financing cash inflow on the consolidated statement of cash flows. |
| | A) | Acquisition of Equinox Minerals Limited |
On June 1, 2011, we acquired 83% of the recorded voting shares of Equinox Minerals Limited (“Equinox”), thus obtaining control. Throughout June we obtained a further 13% of the voting shares and obtained the final 4% on July 19, 2011. Cash consideration paid in second quarter 2011 was $7,213 million, with a further $269 million paid in third quarter 2011, for total cash consideration of $7,482 million. We have determined that this transaction represents a business combination with Barrick identified as the acquirer. We began consolidating the operating results, cash flows and net assets of Equinox from June 1, 2011.
Equinox was a publicly traded mining company that owns the Lumwana copper mine in Zambia and the Jabal Sayid copper project in Saudi Arabia. These operations form part of Barrick’s copper business unit which was established in the fourth quarter.
The tables below present the purchase cost and our final allocation of the purchase price to the assets and liabilities acquired. This allocation was finalized in fourth quarter 2011 to reflect the final determination of the fair values of the assets and liabilities acquired. The significant adjustments were to increase property plant and equipment by $819 million and deferred income taxes by $769 million, with a corresponding net increase to goodwill of $79 million. There were no significant adjustments made to the
consolidated statements of income after applying these adjustments retroactively to the acquisition date.
| | | | |
| Purchase Cost | | | |
| | | | | |
Cash paid to Equinox shareholders in June 2011 | | | $ 6,957 | |
Cash paid to Equinox shareholders in July 2011 | | | 269 | |
| |
Cost of Equinox shares previously acquired | | | 131 | |
Payouts to Equinox employees on change of control | | | 125 | |
Total Acquisition Cost | | | $ 7,482 | |
Cash acquired with Equinox | | | (83) | |
Net Cash Consideration | | | $ 7,399 | |
The purchase cost was funded from our existing cash balances and from proceeds from the issuance of long-term debt of $6.5 billion.
Summary of Final Purchase Price Allocation
| | | | |
| | | Fair Value at
Acquisition | |
Assets | | | | |
Current assets | | | $ 366 | |
Buildings, plant and equipment | | | 1,526 | |
Lumwana depreciable mining interest | | | 1,792 | |
Lumwana non-depreciable mining interest | | | 2,258 | |
Jabal Sayid non-depreciable mining interest | | | 902 | |
Intangible assets | | | 66 | |
Goodwill | | | 3,506 | |
Total assets | | | $ 10,416 | |
| |
Liabilities | | | | |
Current liabilities | | | $ 359 | |
Deferred income tax liabilities | | | 2,108 | |
Provisions | | | 59 | |
Debt | | | 408 | |
Total liabilities | | | $ 2,934 | |
Net assets | | | $ 7,482 | |
In accordance with the acquisition method of accounting, the acquisition cost has been allocated to the underlying assets acquired and liabilities assumed, based primarily upon their estimated fair values at the date of acquisition. We primarily used a static discounted cash flow model (being the net present value of expected future cash flows) to determine the fair value of the mining interests, and used a replacement cost approach in determining the fair value of buildings, plant and equipment. Expected future cash flows are based on estimates of projected future revenues, expected conversions of resources to reserves, expected future production costs and capital expenditures based on the life of mine plan as at the acquisition date. The excess of acquisition cost over the net identifiable assets acquired represents goodwill.
| | | | |
| BARRICK YEAR END 2011 | | 110 | | NOTES TO FINANCIAL STATEMENTS |
Goodwill arose on this acquisition principally because of the following factors: 1) the scarcity of large, long-life copper deposits; 2) the ability to capture financing, tax and operational synergies by managing these properties within a copper business unit in Barrick; 3) the potential to expand production through operational improvements and increases to reserves through exploration at the Lumwana property, which is located in one of the most prospective copper regions in the world; and 4) the recognition of a deferred tax liability for the difference between the assigned values and the tax bases of assets acquired and liabilities assumed at amounts that do not reflect fair value. The goodwill is not deductible for income tax purposes.
Since it has been consolidated from June 1, 2011, Equinox contributed revenue of $569 million and segment income of $46 million. Revenues and net income of the combined Equinox and Barrick entities would have been approximately $14.7 billion and approximately $4.4 billion, respectively, for the twelve months ended December 31, 2011 had the acquisition and related debt issuances occurred on January 1, 2011.
Acquisition related costs of approximately $85 million have been expensed, with approximately $39 million presented in other expense and $45 million in realized foreign exchange losses relating to our economic hedge of the purchase price presented in gain (loss) on non-hedge derivatives.
| | B) | Oil and Gas Acquisitions |
In 2011, our oil and gas subsidiary Barrick Energy completed three acquisitions. On January 14, 2011, Barrick Energy acquired a 50% interest in the Valhalla North property from Penn West (“Valhalla North”), for approximately $25 million. On June 30, 2011, Barrick Energy acquired all of the outstanding shares of Venturion Natural Resources Limited (“Venturion”), a privately held corporation, for approximately $185 million. On July 28, 2011, Barrick Energy acquired all of the outstanding shares of Culane Energy Corporation (“Culane”) for approximately $68 million. These acquisitions were made to acquire additional producing assets, proved and probable reserves, as well as facilities to allow us to grow and expand our energy business. We have determined that these transactions represent business combinations, with Barrick Energy identified as the acquirer. The tables below present the combined purchase cost and the final purchase price allocation for these transactions. We have recorded goodwill on these transactions as a result of the potential to increase current reserves through enhanced oil recoveries and the recognition of a deferred tax liability for the difference between the carrying values and the tax
bases of assets acquired and liabilities assumed. The goodwill is not deductible for tax purposes. Barrick Energy began consolidating the operating results, cash flows, and net assets of Valhalla North, Venturion and Culane from January 14, 2011, June 30, 2011 and July 28, 2011, respectively.
| | | | |
| Total Costs to Allocate | | | |
Purchase cost | | | $ 278 | |
| |
Final Allocation of Fair Values to Valhalla North, Venturion and Culane’s Net Assets | | | |
Current assets | | | $ 8 | |
Property, plant and equipment | | | 342 | |
Goodwill | | | 26 | |
Total assets | | | $ 376 | |
Current liabilities | | | $4 | |
Provisions | | | 13 | |
Bank debt | | | 44 | |
Deferred income tax liabilities | | | 37 | |
Total liabilities | | | $ 98 | |
Net assets acquired | | | $ 278 | |
In 2010, Barrick Energy completed three acquisitions. On May 17, 2010, Barrick Energy acquired all of the outstanding shares of Bountiful Resources (“Bountiful”), a privately held corporation, for approximately $109 million and on June 25, 2010, Barrick Energy acquired the Puskwa property from Galleon Energy Inc. (“Puskwa”) for approximately $130 million. On September 17, 2010, Barrick Energy acquired the assets of Dolomite Resources (“Dolomite”) for approximately $25 million. These acquisitions were made to acquire additional producing assets, proved and probable reserves as well as facilities to allow us to grow and expand our energy business. We have determined that these transactions represent business combinations, with Barrick Energy identified as the acquirer. The tables below present the combined purchase cost and the final purchase price allocation for these 2010 transactions. We have recorded goodwill on these transactions as a result of the potential to increase current reserves through enhanced oil recoveries and the recognition of a deferred tax liability for the difference between the carrying values and the tax bases of assets acquired and liabilities assumed. The goodwill is not deductible for tax purposes. Barrick Energy began consolidating the operating results, cash flows, and net assets of Bountiful, Puskwa, and Dolomite, from May 17, 2010, June 25, 2010, and September 17, 2010, respectively.
| | | | |
| BARRICK YEAR END 2011 | | 111 | | NOTES TO FINANCIAL STATEMENTS |
| | | | |
| Total Costs to Allocate | |
Purchase cost | | | $ 264 | |
|
Allocation of Fair Values to Bountiful, Puskwa, and
Dolomite’s Net Assets | |
Current assets | | | $ 8 | |
Property, plant and equipment | | | 252 | |
Goodwill | | | 64 | |
Total assets | | | $ 324 | |
Current liabilities | | | $ 2 | |
Provisions | | | 8 | |
Bank debt | | | 13 | |
Deferred income tax liabilities | | | 37 | |
Total liabilities | | | $ 60 | |
Net assets acquired | | | $ 264 | |
| | C) | Acquisition of Tusker Gold Limited |
On April 27, 2010, ABG acquired 100% of the issued and outstanding shares of Tusker Gold Limited (“Tusker”) for aggregate net consideration of approximately $74 million. As a result of this acquisition, ABG increased its interest in the Nyanzaga joint venture from 51% to 100%. We have determined that this transaction represents a business combination, with ABG identified as the acquirer. The purchase price allocation was finalized in second quarter 2011 and there were no adjustments to the preliminary allocations. The goodwill is attributable to a deferred tax liability generated due to the difference between the fair value of the exploration and evaluation assets and the book value of these assets. The goodwill is not deductible for income tax purposes. The tables below present the purchase cost and our final purchase price allocation. ABG began consolidating the operating results, cash flows and net assets of Tusker from April 30, 2010.
| | | | |
| Total Costs to Allocate | |
Purchase cost | | | $ 74 | |
Less: cash acquired | | | (8) | |
Cash consideration paid | | | $ 66 | |
|
| Allocation of Fair Values to Tusker’s Net Assets | |
Property, plant and equipment | | | $ 80 | |
Goodwill | | | 22 | |
Total assets | | | $ 102 | |
Current liabilities | | | $ 10 | |
Other non-current liabilities | | | 4 | |
Deferred income tax liabilities | | | 22 | |
Total liabilities | | | $ 36 | |
Net assets acquired | | | $ 66 | |
| | D) | Disposition of 10% Interest in Sedibelo |
On March 23, 2011, we disposed of our 10% interest in the Sedibelo platinum project (“Sedibelo”) with a carrying amount of nil, to the Bakgatla-Ba-Kgafela Tribe (“BBK”), owner of the remaining 90% interest in Sedibelo; and transferred certain long lead items and associated liabilities with carrying amounts of nil and $23 million, respectively, to Newshelf 1101 (Proprietary) Limited for consideration of $44 million. We also settled various outstanding matters between Barrick and the BBK regarding Sedibelo and their respective interests. We recorded a pre-tax gain of $66 million upon the closing of this transaction.
| | E) | IPO of African Gold Mining Operations |
On March 24, 2010, the IPO for ABG closed and its approximately 404 million ordinary shares were admitted to the Official List of the UK Listing Authority and to trading on the London Stock Exchange’s main market for listed securities. ABG sold approximately 101 million ordinary shares in the offering, or about 25% of its equity and Barrick retained an interest in approximately 303 million ordinary shares, or about 75% of the equity of ABG. In April 2010, the over-allotment option was partially exercised resulting in a 1.1% dilution of our interest in ABG to 73.9%.
The net proceeds from the IPO and the exercise of the over-allotment option were approximately $834 million and $50 million, respectively. As Barrick has retained a controlling financial interest in ABG, we continue to consolidate ABG and accounted for the disposition of ABG shares as an equity transaction. Accordingly, the difference between the proceeds received and the carrying amount has been recorded as additional paid-in capital in equity, and we have set up a non-controlling interest to reflect the change in our ownership interest in ABG.
| | F) | Acquisition of the Additional 25% Interest in Cerro Casale |
On March 31, 2010, we completed the acquisition of the additional 25% interest in Cerro Casale from Kinross Gold Corporation (“Kinross”) for cash consideration of $454 million and the elimination of a $20 million contingent obligation, which was payable by Kinross to Barrick on a construction decision. The acquisition of the additional 25% interest has been accounted for as a business combination.
Our interest in the project is now 75% and, as a result of obtaining control, we have re-measured our previously held 50% ownership interest to fair value and recorded a corresponding post-tax gain of $42 million in other income (see note 9C).
| | | | |
| BARRICK YEAR END 2011 | | 112 | | NOTES TO FINANCIAL STATEMENTS |
We primarily used an income approach (being the net present value of expected future cash flows) to determine the fair values of the depreciable and non-depreciable mining interest. Estimates of expected future cash flows reflect estimates of projected future revenues, conversion of resources to reserves, production costs and capital expenditures contained in our life-of-mine plan.
We recorded goodwill on this acquisition principally because of the following factors: 1) the going concern value implicit in our ability to sustain and grow this project by increasing reserves and resources through new discoveries; 2) the ability to capture unique synergies that can be realized from managing this project within our South America regional business unit; and 3) the recognition of a deferred tax liability for the difference between the assigned values and the tax bases of assets acquired and liabilities assumed at amounts that do not reflect fair value. The goodwill is not deductible for income tax purposes.
Beginning in second quarter 2010, we consolidated 100% of the operating results, cash flows, assets and liabilities of Cerro Casale, with an offsetting non-controlling interest of 25% measured at fair value as at March 31, 2010.
The tables below present the purchase cost, the final purchase price allocation and the remeasurement gain recorded in other income (note 9C).
| | | | |
| Purchase Cost | |
Cash | | | $ 454 | |
Less: cash acquired | | | (7) | |
Cash consideration paid | | | $ 447 | |
Carrying amount of equity method investment | | | 839 | |
Remeasurement gain | | | 42 | |
Net assets | | | $ 1,328 | |
| | | | |
| Summary of Purchase Price Allocation | |
| | |
| Fair Value at
Acquisition |
|
Current assets | | | $ 1 | |
VAT receivables | | | 12 | |
Depreciable mining interest | | | 1,155 | |
Non-depreciable mining interest | | | 263 | |
Water rights | | | 75 | |
Goodwill | | | 809 | |
Total assets | | | $ 2,315 | |
Current liabilities | | | $ 10 | |
Deferred income tax liabilities | | | 523 | |
Total liabilities | | | $ 533 | |
Non-controlling interest | | | 454 | |
Net assets | | | $ 1,328 | |
| | G) | Discontinued Operations |
| | | | | | | | |
| Results of Discontinued Operations | |
| For the years ended December 31 | | 2011 | | | 2010 | |
Gold sales | | | | | | | | |
Osborne | | | $ - | | | | $ 43 | |
Copper sales | | | | | | | | |
Osborne | | | - | | | | 244 | |
| | | | $ - | | �� | | $ 287 | |
Other metals sales | | | | | | | | |
Osborne | | | $ - | | | | $ 2 | |
| | | | $ - | | | | $ 2 | |
Income before tax | | | | | | | | |
Osborne | | | $ - | | | | $ 175 | |
| | | | $ - | | | | $ 175 | |
Net income | | | | | | | | |
Osborne | | | $ - | | | | $ 124 | |
| | | | $ - | | | | $ 124 | |
Osborne
On September 30, 2010, we divested our Osborne copper mine for $17 million cash, as well as a royalty receivable from any future production, capped at approximately $14 million. Ivanhoe has agreed to assume all site environmental obligations. A loss of approximately $7 million, primarily due to the settlement of severance obligations, was recorded and recognized in discontinued operations. The results of operations and the assets and liabilities of Osborne have been presented as discontinued operations in the consolidated statement of income, the consolidated statement of cash flow and the consolidated balance sheet.
| | | | |
| BARRICK YEAR END 2011 | | 113 | | NOTES TO FINANCIAL STATEMENTS |
5 > SEGMENT INFORMATION
Barrick’s business is organized into seven primary business units: four regional gold businesses, a global copper business, an oil and gas business, and a capital projects business. Barrick’s Chief Operating Decision Maker reviews the operating results, assesses performance and makes capital allocation decisions at a business unit level. Therefore, these business units are operating segments for financial reporting purposes. In fourth quarter 2011, Barrick established the global copper business unit in order to maximize the value of the Company’s copper and other non-gold mining assets following the acquisition of Equinox in June, 2011. This unit is responsible for providing strategic direction and oversight of the copper business and ensuring that the Company realizes the business and operational synergies arising from the acquisition. Segment information for the years ended December 31, 2011 and 2010 has been revised to reflect this organizational change.
Segment performance is evaluated based on a number of measures including operating income before tax, production levels and unit production costs. Income tax, corporate administration, finance income and costs, impairment charges and reversals, investment write-downs and gains/losses on non-hedge derivatives are managed on a consolidated basis and are therefore not reflected in segment income.
| | | | | | | | | | | | | | | | | | | | | | | | | | | | |
| Consolidated Statements of Income Information | |
| | | | | | | Cost of Sales | | | | | | | | | | | | | | | | | |
For the year ended December 31, 2011 | | | Revenue | | |
| Direct mining
& Royalties |
| | | Depreciation | | |
| Exploration &
Evaluation |
| |
| Operating
Segment
Administration |
| | | Other Expenses1 | | |
| Segment Income
(Loss |
)2 |
Gold | | | | | | | | | | | | | | | | | | | | | | | | | | | | |
North America | | | $ 5,263 | | | | $ 1,453 | | | | $ 471 | | | | $ 98 | | | | $ 45 | | | | $ 102 | | | | $ 3,094 | |
South America | | | 2,864 | | | | 698 | | | | 207 | | | | 26 | | | | 30 | | | | 16 | | | | 1,887 | |
Australia Pacific | | | 3,073 | | | | 1,304 | | | | 307 | | | | 90 | | | | 42 | | | | - | | | | 1,330 | |
ABG | | | 1,218 | | | | 570 | | | | 138 | | | | 30 | | | | 48 | | | | 35 | | | | 397 | |
| | | | | | | |
Copper | | | 1,717 | | | | 813 | | | | 170 | | | | 23 | | | | 22 | | | | 45 | | | | 644 | |
Capital Projects3 | | | - | | | | - | | | | 8 | | | | 44 | | | | 2 | | | | 111 | | | | (165) | |
Barrick Energy | | | 177 | | | | 59 | | | | 97 | | | | - | | | | 12 | | | | 58 | | | | (49) | |
| | | | $ 14,312 | | | | $ 4,897 | | | | $ 1,398 | | | | $ 311 | | | | $ 201 | | | | $ 367 | | | �� | $ 7,138 | |
| | | | | | | | | | | | | | | | | | | | | | | | | | | | |
| Consolidated Statements of Income Information | |
| | | | | | | Cost of Sales | | | | | | | | | | | | | | | | | |
For the year ended December 31, 2010 | | | Revenue | | |
| Direct mining
& Royalties |
| | | Depreciation | | |
| Exploration &
Evaluation |
| |
| Operating
Segment
Administration |
| |
| Other Expenses
(Income |
)1 | |
| Segment Income
(Loss |
)2 |
Gold | | | | | | | | | | | | | | | | | | | | | | | | | | | | |
North America | | | $ 3,827 | | | | $ 1,347 | | | | $ 465 | | | | $ 80 | | | | $ 39 | | | | $ 59 | | | | $ 1,837 | |
South America | | | 2,567 | | | | 491 | | | | 211 | | | | 17 | | | | 41 | | | | 25 | | | | 1,782 | |
Australia Pacific | | | 2,438 | | | | 1,218 | | | | 262 | | | | 54 | | | | 51 | | | | 22 | | | | 831 | |
ABG | | | 985 | | | | 485 | | | | 113 | | | | 15 | | | | 37 | | | | 20 | | | | 315 | |
| | | | | | | |
Copper | | | 1,061 | | | | 342 | | | | 88 | | | | - | | | | 5 | | | | 19 | | | | 607 | |
Capital Projects3 | | | - | | | | - | | | | 4 | | | | 54 | | | | 3 | | | | (43) | | | | (18) | |
Barrick Energy | | | 123 | | | | 67 | | | | 47 | | | | - | | | | 7 | | | | 3 | | | | (1) | |
| | | | $ 11,001 | | | | $ 3,950 | | | | $ 1,190 | | | | $ 220 | | | | $ 183 | | | | $ 105 | | | | $ 5,353 | |
| 1 | Other expenses include accretion expense. For the year ended December 31, 2011, accretion expense was $52 million (2010: $21 million). See note 17 for further details. |
| 2 | We manage the performance of our business units using a measure of income before interest and taxes; consequently, interest income, interest expense and income taxes are not allocated to our business units. |
| 3 | The Capital Projects segment relates to our interests in our significant gold projects under construction. |
| | | | |
| BARRICK YEAR END 2011 | | 114 | | NOTES TO FINANCIAL STATEMENTS |
| | | | | | | | |
| Reconciliation of Segment Income to Income (Loss) from Continuing Operations Before Income Taxes | |
| For the years ended December 31 | | 2011 | | | 2010 | |
Segment income | | | $ 7,138 | | | | $ 5,353 | |
Depreciation of corporate assets | | | (21) | | | | (22) | |
Exploration not attributable to segments | | | (9) | | | | (9) | |
Evaluation not attributable to segments | | | (40) | | | | (36) | |
Corporate administration | | | (166) | | | | (156) | |
Other expenses | | | 49 | | | | (76) | |
Impairment (charges) reversals | | | (96) | | | | 77 | |
Finance income | | | 13 | | | | 14 | |
Finance costs (excludes accretion) | | | (147) | | | | (159) | |
Gain on non-hedge derivatives | | | 81 | | | | 69 | |
Gain from equity investees not attributable to segments | | | 22 | | | | 12 | |
Income before income taxes | | | $ 6,824 | | | | $ 5,067 | |
| | | | | | | | | | | | | | | | | | | | |
| Geographic Information | | | | | | | | | | | | | | | |
| | | Non-current assets1 | | | | | | Sales2 | |
| | | As at
December 31 2011 | | | As at
December 31 2010 | | | As at
January 1 2010 | | | 2011 | | | 2010 | |
United States | | | $ 5,675 | | | | $ 4,966 | | | | $ 4,782 | | | | $ 4,914 | | | | $ 3,524 | |
Zambia | | | 5,153 | | | | - | | | | - | | | | 543 | | | | - | |
Chile | | | 5,111 | | | | 4,168 | | | | 2,189 | | | | 1,148 | | | | 1,062 | |
Dominican Republic | | | 3,638 | | | | 2,624 | | | | 1,450 | | | | - | | | | - | |
Argentina | | | 2,893 | | | | 1,954 | | | | 1,382 | | | | 1,397 | | | | 1,352 | |
Tanzania | | | 2,099 | | | | 1,864 | | | | 1,652 | | | | 1,218 | | | | 985 | |
Canada | | | 1,432 | | | | 1,014 | | | | 670 | | | | 525 | | | | 426 | |
Saudi Arabia | | | 1,611 | | | | - | | | | - | | | | - | | | | - | |
Australia | | | 1,485 | | | | 1,367 | | | | 1,293 | | | | 2,330 | | | | 1,828 | |
Papua New Guinea | | | 1,017 | | | | 924 | | | | 711 | | | | 769 | | | | 609 | |
Peru | | | 602 | | | | 439 | | | | 310 | | | | 1,468 | | | | 1,215 | |
Other | | | 94 | | | | 97 | | | | 139 | | | | - | | | | - | |
Unallocated assets1 | | | 11,529 | | | | 8,149 | | | | 7,417 | | | | - | | | | - | |
Total | | | $ 42,339 | | | | $ 27,566 | | | | $ 21,995 | | | | $ 14,312 | | | | $ 11,001 | |
| 1 | Unallocated assets include goodwill, deferred tax assets and other financial assets. |
| 2 | Presented based on the location in which the sale originated. |
| | | | |
| BARRICK YEAR END 2011 | | 115 | | NOTES TO FINANCIAL STATEMENTS |
| | | | | | | | | | | | | | | | | | | | |
| Asset Information1 | |
| | | Total Assets | | | | | | Segment Capital Expenditures2 | |
| | |
| As at
December 31
2011 |
| |
| As at
December 31
2010 |
| |
| As at
January 1
2010 |
| |
| For the year ended
December 31
2011 |
| |
| For the year ended
December 31
2010 |
|
Gold | | | | | | | | | | | | | | | | | | | | |
North America | | | $ 8,200 | | | | $ 7,472 | | | | $ 7,311 | | | | $ 1,056 | | | | $ 657 | |
South America | | | 2,925 | | | | 2,789 | | | | 1,803 | | | | 491 | | | | 294 | |
Australia Pacific | | | 3,982 | | | | 3,911 | | | | 3,624 | | | | 465 | | | | 385 | |
ABG | | | 2,258 | | | | 2,031 | | | | 1,798 | | | | 309 | | | | 194 | |
Copper | | | 12,398 | | | | 2,114 | | | | 2,126 | | | | 433 | | | | 63 | |
Capital Projects3 | | | 9,385 | | | | 6,465 | | | | 2,781 | | | | 2,563 | | | | 2,250 | |
Barrick Energy | | | 1,104 | | | | 726 | | | | 342 | | | | 163 | | | | 86 | |
Segment total | | | $ 40,252 | | | | $ 25,508 | | | | $ 19,785 | | | | $ 5,480 | | | | $ 3,929 | |
Cash and equivalents | | | 2,745 | | | | 3,968 | | | | 2,564 | | | | - | | | | - | |
Other current assets | | | 3,800 | | | | 3,103 | | | | 2,265 | | | | - | | | | - | |
Equity in investees | | | 308 | | | | 271 | | | | 991 | | | | - | | | | - | |
Other investments | | | 161 | | | | 171 | | | | 62 | | | | - | | | | - | |
Intangible assets | | | 569 | | | | 475 | | | | 275 | | | | - | | | | - | |
Deferred income tax assets | | | 409 | | | | 625 | | | | 601 | | | | - | | | | - | |
Assets of discontinued operations | | | - | | | | - | | | | 100 | | | | - | | | | - | |
Other items not allocated to segments | | | 640 | | | | 516 | | | | 281 | | | | 27 | | | | 67 | |
Total | | | $ 48,884 | | | | $ 34,637 | | | | $ 26,924 | | | | $ 5,507 | | | | $ 3,996 | |
| 1 | Liabilities are not managed on a segment basis and have therefore been excluded from segment disclosures. |
| 2 | Segment capital expenditures are presented for internal management reporting purposes on an accrual basis. Capital expenditures in the Consolidated Statements of Cash Flow are presented on a cash basis. In 2011, cash expenditures were $4,973 million (2010: $3,778 million) and the increase in accrued expenditures was $534 million (2010: $218 million increase). |
| 3 | The carrying amount of the long-lived assets in the Capital Projects segment is transferred to the relevant operating segment on commissioning of the mine. |
| | | | |
| BARRICK YEAR END 2011 | | 116 | | NOTES TO FINANCIAL STATEMENTS |
| | | | | | | | |
| 6 > REVENUE | | | | | | |
| For the years ended December 31 | | 2011 | | | 2010 | |
Gold bullion sales1 | | | | | | | | |
Spot market sales | | | $ 11,819 | | | | $ 9,349 | |
Concentrate sales | | | 444 | | | | 338 | |
| | | | $ 12,263 | | | | $ 9,687 | |
Copper sales1 | | | | | | | | |
Copper cathode sales | | | $ 1,141 | | | | $ 1,052 | |
Concentrate sales | | | 573 | | | | 4 | |
| | | | $ 1,714 | | | | $ 1,056 | |
Oil and gas sales | | | $ 177 | | | | $ 123 | |
Other metal sales2 | | | $ 158 | | | | $ 135 | |
Total | | | $ 14,312 | | | | $ 11,001 | |
| 1 | Revenues include amounts transferred from OCI to earnings for commodity cash flow hedges (see note 22d). |
| 2 | Revenues include the sale of by-products for our gold and copper mines. |
Principal Products
All of our gold mining operations produce gold in doré form, except Bulyanhulu and Buzwagi which produce both gold doré and gold concentrate. Gold doré is unrefined gold bullion bars usually consisting of 90% gold that is refined to pure gold bullion prior to sale to our customers. Concentrate is a processing product containing the valuable ore mineral from which most of the waste mineral has been eliminated. Our Lumwana mine produces a concentrate that primarily contains copper. At our Zaldívar mine we produce copper cathode, which consists of 99.9% copper.
Revenue
Revenue is presented net of direct sales taxes of $50 million (2010: $30 million). Incidental revenues from the sale of by-products, primarily copper and silver, are classified within other metal sales.
Provisional Copper and Gold Sales
We have provisionally priced sales for which price finalization, referenced to the relevant copper and gold index, is outstanding at the balance sheet date. Our exposure at December 31, 2011 to the impact of movements in market commodity prices for provisionally priced sales is set out in the following table:
| | | | | | | | | | | | | | | | |
| | | Volumes subject to
final pricing | | | Impact on net
income before taxation of
10% movement in
market price US$M | |
| As at December 31 | | 2011 | | | 2010 | | | 2011 | | | 2010 | |
Copper pounds (millions) | | | 63 | | | | 37 | | | | $ 22 | | | | $ 16 | |
Gold ounces (000’s) | | | 29 | | | | 31 | | | | 5 | | | | 4 | |
For the year ended December 31, 2011, our provisionally priced copper sales included provisional pricing losses of $63 million (2010: $32 million gain) and our provisionally priced gold sales included provisional pricing gains of $9 million (2010: $4 million gain).
At December 31, 2011, our provisionally priced copper and gold sales subject to final settlement were recorded at average prices of $3.45/lb (2010: $4.42/lb) and $1,653/oz (2010: $1,392/oz), respectively. The sensitivities in the above tables have been determined as the impact of a 10 percent change in commodity prices at each reporting date, while holding all other variables, including foreign currency exchange rates, constant.
| | | | | | | | |
| 7 > COST OF SALES | | | | | | |
| For the years ended December 31 | | 2011 | | | 2010 | |
Direct mining cost1, 2 | | $ | 4,562 | | | $ | 3,674 | |
Depreciation | | | 1,419 | | | | 1,212 | |
Royalty expense | | | 335 | | | | 276 | |
| | | $ | 6,316 | | | $ | 5,162 | |
| 1 | Direct mining cost includes charges to reduce the cost of inventory to net realizable value as follows: $nil for the year ended December 31, 2011 (2010: $3 million). |
| 2 | Direct mining cost includes the costs of extracting co-products. |
Cost of Sales
Cost of sales consists of direct mining costs (which include personnel costs, general and administrative costs, energy costs (principally diesel fuel and electricity), maintenance and repair costs, operating supplies, external services, third party smelting, refining and transport fees), and depreciation related to sales and royalty expenses for the period. Cost of sales is based on the weighted average cost of contained or recoverable ounces sold and royalty expense for the period. All costs include any impairment to reduce inventory to its net realizable value.
| | | | |
| BARRICK YEAR END 2011 | | 117 | | NOTES TO FINANCIAL STATEMENTS |
Royalties
Certain of our properties are subject to royalty arrangements based on mineral production at the properties. The primary type of royalty is a net smelter return (NSR) royalty. Under this type of royalty we pay the holder an amount calculated as the royalty percentage multiplied by the value of gold production at market gold prices less third-party smelting, refining and transportation costs. Other types of royalties include:
| Ø | Net profits interest (NPI) royalty, |
| Ø | Modified net smelter return (NSR) royalty, |
| Ø | Net smelter return sliding scale (NSRSS) royalty, |
| Ø | Gross proceeds sliding scale (GPSS) royalty, |
| Ø | Gross smelter return (GSR) royalty, |
| Ø | Land tenement (LT) royalty, and a |
Royalty expense is recorded on completion of the production process.
Royalties applicable to our oil and gas properties include:
| Ø | Net profits interest (NPI) royalty, |
| Ø | Overriding royalty (ORR), and a |
| | |
Producing mines and capital
projects | | Type of royalty |
North America | | |
Goldstrike | | 0%-5% NSR, 0%-6% NPI |
Williams | | 1.5% NSR, 0.75%-1% NV |
David Bell | | 3%-3.5% NSR |
Hemlo - Interlake property | | 50% NPI, 3% NSR |
Round Mountain | | 3.53%-6.35% NSRSS |
Bald Mountain | | 3.5%-7% NSRSS, 2.9%-4% NSR, 10% NPI |
Ruby Hill | | 3% modified NSR |
Cortez | | 1.5% GSR |
Cortez - Pipeline/South Pipeline deposit | | 0.4%-9% GSR |
Cortez - portion of Pipeline/South Pipeline deposit | | 5% NV |
South America | | |
Veladero | | 3.75% gross proceeds |
Lagunas Norte | | 2.51% NSR |
Australia Pacific | | |
Porgera | | 2% NSR, 0.25% other |
Queensland & Western Australia production1 | | 2.5%-2.7% of gold revenue |
Cowal | | 4% of net gold revenue |
African Barrick Gold | | |
Bulyanhulu | | 3% NSR |
Tulawaka | | 3% NSR |
North Mara - Nyabirama and Nyabigena pit | | 3% NSR, 1% LT |
North Mara - Gokona pit | | 3% NSR, 1.1% LT |
Buzwagi | | 3% NSR, 30% NPI2 |
Capital Projects | | |
Donlin Gold Project | | 1.5% NSR (first 5 years), 4.5% NSR (thereafter), 8.0% NPI3 |
Pascua-Lama Project - Chile gold production | | 1.5%-9.8% GPSS |
Pascua-Lama Project - Chile copper production | | 2% NSR |
Pascua-Lama Project - Argentina production | | 3% modified NSR |
Pueblo Viejo | | 3.2% NSR (for gold & silver), 28.75% NPI3 |
Cerro Casale | | 3% NSR (capped at $3 million cumulative) |
Copper | | |
Lumwana | | 3% GSR4 |
Reko Diq | | 2% NSR |
Kabanga | | 3% NSR |
Other | | |
Barrick Energy | | 0.22% NPI, 1.69% FH&ORR, 20.4% Crown Royalty |
| 1 | Includes the Kalgoorlie, Kanowna, Granny Smith, Plutonic, Darlot and Lawlers mines. |
| 2 | The NPI is calculated as a percentage of profits realized from the Buzwagi mine after all capital, exploration, and development costs and interest incurred in relation to the Buzwagi mine have been recouped and all operating costs relating to the Buzwagi mine have been paid. No amount is currently payable. |
| 3 | The NPI is calculated as a percentage of profits realized from the mine until all funds invested to date with interest at an agreed upon rate are recovered. No amount is currently payable. |
| 4 | The GSR will increase to 6% effective April 1, 2012. |
| | | | |
| BARRICK YEAR END 2011 | | 118 | | NOTES TO FINANCIAL STATEMENTS |
| | | | | | | | |
| 8 > EXPLORATION AND EVALUATION | | | | |
| For the years ended December 31 | | 2011 | | | 2010 | |
Exploration: | | | | | | | | |
Minesite exploration | | | $ 72 | | | | $ 51 | |
Global programs | | | 145 | | | | 103 | |
| | | $ 217 | | | | $ 154 | |
Evaluation costs | | | 129 | | | | 75 | |
Exploration and evaluation expense1 | | | $ 346 | | | | $ 229 | |
| 1 | Approximates the impact on Operating Cash Flow. |
| | | | | | | | |
| 9 > OTHER CHARGES | | | | |
| A Other Expense | | | | | | |
| For the years ended December 31 | | 2011 | | | 2010 | |
Operating segment administration1 | | | $ 201 | | | | $ 183 | |
Corporate social responsibility | | | 55 | | | | 25 | |
| Changes in estimate of rehabilitation costs at closed mines | | | 79 | | | | 41 | |
World Gold Council fees | | | 9 | | | | 16 | |
Currency translation losses2 | | | 22 | | | | 26 | |
| Pension and other post-retirement benefit expense (note 32) | | | 4 | | | | 6 | |
Severance and other restructuring costs | | | 6 | | | | 16 | |
Equinox acquisition costs | | | 39 | | | | - | |
Other expensed items | | | 161 | | | | 142 | |
Total | | | $ 576 | | | | $ 455 | |
| 1 | Relates to costs incurred at business unit offices. |
| 2 | Amounts attributable to currency translation losses on working capital balances. |
| | | | | | | | |
| B Impairment Charges and Reversals | | | | |
| For the years ended December 31 | | 2011 | | | 2010 | |
| Impairment of long-lived assets1 | | $ 138 | | | $ 11 | |
| Impairment (reversal) of investment in associates2 | | | - | | | | (84) | |
Impairment of available-for-sale investments | | | 97 | | | | - | |
Total | | | $ 235 | | | | $ (73 | ) |
| 1 | In 2011, an impairment charge of $83 million was recorded to reduce the carrying amount to the estimated fair value for certain power assets and tailings dam assets at Pueblo Viejo. In 2011, the carrying amount of certain properties at Barrick Energy were tested for impairment on update of reserves following completion of the annual long-range planning process. An impairment charge of $49 million was recorded to reduce the carrying amount to the estimated fair value for these properties. Refer to note 17. |
| 2 | 2010 amount reflects an impairment reversal on our investment in Highland Gold. Refer to note 3. |
| | | | | | | | |
| C Other Income | | | | |
| For the years ended December 31 | | 2011 | | | 2010 | |
| Gain on sale/acquisition of long-lived assets/investments1 | | | $ 229 | | | | $ 79 | |
Royalty income | | | 3 | | | | 7 | |
Other | | | 16 | | | | 30 | |
Total | | | $ 248 | | | | $ 116 | |
| 1 | 2011 amounts include the sale of our interest in Sedibelo ($66 million), Fronteer Gold ($46 million), Fenn Gibb ($34 million), Metminco ($32 million) and Pinson ($28 million). 2010 amounts include $42 million related to the acquisition of an additional 25% interest in Cerro Casale. See note 4f for further details. |
| | | | | | | | |
| 10 > INCOME TAX EXPENSE | | | | |
| For the years ended December 31 | | 2011 | | | 2010 | |
Tax on profit | | | | | | | | |
Current tax | | | | | | | | |
Charge for the year | | | $ 1,861 | | | | $ 1,317 | |
Adjustment in respect of prior years | | | 24 | | | | (8) | |
| | | $ 1,885 | | | | $ 1,309 | |
Discontinued operations | | | - | | | | (52) | |
Continuing operations | | | $ 1,885 | | | | $ 1,257 | |
Deferred tax | | | | | | | | |
Origination and reversal of temporary differences in the current year | | | $ 405 | | | | $ 336 | |
Adjustment in respect of prior years | | | (3) | | | | (32) | |
Continuing operations | | | $ 402 | | | | $ 304 | |
| | | | $ 2,287 | | | | $ 1,561 | |
Tax expense related to continuing operations | | | | | | | | |
Current | | | | | | | | |
Canada | | | $ 23 | | | | $ 15 | |
International | | | 1,736 | | | | 1,246 | |
| | | | $ 1,759 | | | | $ 1,261 | |
Deferred | | | | | | | | |
Canada | | | $ (15) | | | | $ (2) | |
International | | | 453 | | | | 325 | |
| | | | $438 | | | | $323 | |
| Income tax expense before elements below which relate to international jurisdictions | | | $ 2,197 | | | | $ 1,584 | |
| Net currency translation (gains) losses on deferred tax balances | | | (32) | | | | (19) | |
Dividend withholding tax | | | 87 | | | | 74 | |
Impact of Peruvian Tax Court decision | | | 39 | | | | - | |
Impact of legislative amendments in Australia | | | - | | | | (78) | |
| Impact of Australian functional currency election | | | (4) | | | | - | |
Total expense | | | $ 2,287 | | | | $ 1,561 | |
| | | | |
| BARRICK YEAR END 2011 | | 119 | | NOTES TO FINANCIAL STATEMENTS |
Currency Translation
Deferred tax balances are subject to remeasurement for changes in currency exchange rates each period. The most significant balances are Papua New Guinea deferred tax liabilities with a carrying amount of approximately $40 million, and Argentinean deferred tax liabilities with a carrying amount of approximately $257 million. In 2011 and 2010, the appreciation of the Papua New Guinea Kina against the US dollar, and the weakening of the Argentine peso against the US dollar resulted in net translation gains totaling $32 million and $19 million, respectively. These gains are included within deferred tax expense/recovery.
Dividend Withholding Tax
In 2011, we recorded an $87 million dollar dividend withholding current tax expense in respect of funds repatriated from foreign subsidiaries.
In 2010, we recorded a $74 million dollar dividend withholding current tax expense in respect of funds available to be repatriated from a foreign subsidiary.
Peruvian Tax Court Decision
On September 30, 2004, the Tax Court of Peru issued a decision in our favor in the matter of our appeal of a 2002 income tax assessment for an amount of $32 million, excluding interest and penalties. The assessment mainly related to the validity of a revaluation of the Pierina mining concession, which affected its tax basis for the years 1999 and 2000. The full life of mine effect on current and deferred income tax liabilities totaling $141 million was fully recorded at December 31, 2002, as well as other related costs of about $21 million.
In January 2005, we received written confirmation that there would be no appeal of the September 30, 2004 Tax Court of Peru decision. In December 2004, we recorded a $141 million reduction in current and deferred income tax liabilities and a $21 million reduction in other accrued costs. The confirmation concluded the administrative and judicial appeals process with resolution in Barrick’s favor.
Notwithstanding the favorable Tax Court decision we received in 2004 on the 1999 to 2000 revaluation matter, in an audit concluded in 2005, The Tax Administration in Peru (SUNAT) has reassessed us on the same issue for tax years 2001 to 2003. On October 19, 2007, SUNAT confirmed their reassessment. We filed an appeal to the Tax Court of Peru within the statutory period.
The Tax Court decision was rendered on August 15, 2011. The Tax Court ruled in our favor on substantially all material issues. However, based on the Tax Court decision, the timing of certain deductions would differ from the position taken on filing. As a result, we would incur interest and penalties in some years and earn refund interest income in other years. SUNAT has since assessed us $100 million for this matter. However, we believe that the SUNAT amount is incorrect, and have appealed the assessment. After recomputing the liability, to reflect what we believe is the probable amount, we have recorded a current tax expense of $39 million in 2011 in respect of this matter.
On November 15, 2011, we appealed the Tax Court decision to the Judicial Court with respect to the timing of certain deductions for the Pierina mining concession. SUNAT also appealed the Tax Court decision to the Judicial Court.
Australian Functional Currency Election
In 2011, we filed an election in Australia to prepare certain of our Australian tax returns using US dollar functional currency effective January 1, 2011. This election resulted in a one-time deferred tax benefit of $4 million. Going forward, all material Australian tax returns will now be filed using a US dollar functional currency.
Impact of Legislative Amendments in Australia
In Australia, we elected to enter into the consolidated tax regime in 2004 (in 2002 for the former Placer Dome Inc. subsidiaries). At the time the elections were made, there were certain accrued gains that were required to be included in taxable income upon subsequent realization. In second quarter 2010, clarifying legislative amendments to the Australian consolidation tax rules were enacted. These amendments enable us to reduce the inclusion of certain of these accrued gains, resulting in a permanent decrease in taxable income. The impact of the amendment is a current tax recovery of $78 million recorded in 2010.
| | | | |
| BARRICK YEAR END 2011 | | 120 | | NOTES TO FINANCIAL STATEMENTS |
| | | | | | | | |
| Reconciliation to Canadian Statutory Rate | |
For the years ended December 31 | | | 2011 | | | | 2010 | |
At 28% (2010: 31%) statutory rate | | | $ 1,911 | | | | $ 1,571 | |
Increase (decrease) due to: | | | | | | | | |
Allowances and special tax deductions1 | | | (243) | | | | (168) | |
Impact of foreign tax rates2 | | | 270 | | | | 86 | |
Expenses not tax deductible | | | 22 | | | | 43 | |
| Net currency translation (gains)/losses on deferred tax balances | | | (32) | | | | (19) | |
| Recognition of previously unrecognized deferred tax assets | | | - | | | | (129) | |
| Current year tax losses not recognized in deferred tax assets | | | 17 | | | | 16 | |
Adjustments in respect of prior years | | | 21 | | | | (40) | |
Impact of Peruvian Tax Court decision | | | 39 | | | | - | |
| Impact of Australian functional currency election | | | (4) | | | | - | |
Impact of legislative amendments in Australia | | | - | | | | (78) | |
Dividend withholding tax | | | 87 | | | | 74 | |
Other withholding taxes | | | 31 | | | | 21 | |
Mining taxes | | | 167 | | | | 108 | |
Other items | | | 1 | | | | 76 | |
Income tax expense | | | $ 2,287 | | | | $ 1,561 | |
| 1 | We are able to claim certain allowances and tax deductions unique to extractive industries that result in a lower effective tax rate. |
| 2 | We operate in multiple foreign tax jurisdictions that have tax rates different than the Canadian statutory rate. |
| | | | |
| BARRICK YEAR END 2011 | | 121 | | NOTES TO FINANCIAL STATEMENTS |
| | | | | | | | | | | | | | | | |
| 11 > EARNINGS PER SHARE | |
For the years ended December 31 ($ millions, except shares in millions and per | | | 2011 | | | | 2010 | |
share amounts in dollars) | | | Basic | | | | Diluted | | | | Basic | | | | Diluted | |
Income from continuing operations | | | $ 4,537 | | | | $ 4,537 | | | | $ 3,506 | | | | $ 3,506 | |
Net income attributable to non-controlling interests | | | (53) | | | | (53) | | | | (48) | | | | (48) | |
Net income from continuing operations after assumed conversions | | | $ 4,484 | | | | $ 4,484 | | | | $ 3,458 | | | | $ 3,458 | |
Income from discontinued operations | | | - | | | | - | | | | 124 | | | | 124 | |
Net income attributable to equity holders of Barrick Gold Corporation after assumed conversions | | | $ 4,484 | | | | $ 4,484 | | | | $ 3,582 | | | | $ 3,582 | |
Weighted average shares outstanding | | | 999 | | | | 999 | | | | 987 | | | | 987 | |
Effect of dilutive securities | | | | | | | | | | | | | | | | |
Stock options | | | - | | | | 2 | | | | - | | | | 2 | |
Convertible debentures | | | - | | | | - | | | | - | | | | 8 | |
| | | | 999 | | | | 1,001 | | | | 987 | | | | 997 | |
Earnings per share data attributable to the equity holders of Barrick Gold | | | | | | | | | | | | | | | | |
Corporation | | | | | | | | | | | | | | | | |
Income from continuing operations | | | $ 4.49 | | | | $ 4.48 | | | | $ 3.50 | | | | $ 3.47 | |
Income from discontinued operations | | | $ - | | | | $ - | | | | $ 0.13 | | | | $ 0.12 | |
Net income | | | $ 4.49 | | | | $ 4.48 | | | | $ 3.63 | | | | $ 3.59 | |
| | | | | | | | |
| 12 > FINANCE INCOME AND FINANCE COST | |
| A Finance Income | |
For the years ended December 31 | | | 2011 | | | | 2010 | |
Interest income | | | $ 13 | | | | $ 13 | |
Other | | | - | | | | 1 | |
Total | | | $ 13 | | | | $ 14 | |
| | |
| B Finance Costs | | | | | | |
For the years ended December 31 | | | 2011 | | | | 2010 | |
Interest | | | $ 541 | | | | $ 419 | |
Amortization of debt issue costs | | | 17 | | | | 4 | |
Amortization of premium (discount) | | | (3) | | | | 2 | |
Interest capitalized1 | | | (408) | | | | (285) | |
Finance charges2 | | | - | | | | 19 | |
Accretion | | | 52 | | | | 21 | |
Total | | | $ 199 | | | | $ 180 | �� |
| 1 | Interest has been capitalized at the rate of interest applicable to the specific borrowings financing the assets under construction or, where financed through general borrowings, at a capitalization rate representing the average interest rate on such borrowings. For the year ended December 31, 2011, the general capitalization rate was 5.43% (2010: 6.42%). |
| 2 | Represents accrued financing charges on the remaining settlement obligation to close out gold sales contracts. |
| | | | |
| BARRICK YEAR END 2011 | | 122 | | NOTES TO FINANCIAL STATEMENTS |
13 > CASH FLOW – OTHER ITEMS
| | | | | | | | |
| A Operating Cash Flows - Other Items | |
For the years ended December 31 | | | 2011 | | | | 2010 | |
Adjustments for non-cash income statement items: | | | | | | | | |
Currency translation losses (note 9a) | | | $ 22 | | | | $ 26 | |
Amortization of debt issue costs | | | 17 | | | | 4 | |
RSU expense | | | 30 | | | | 48 | |
Stock option expense | | | 15 | | | | 16 | |
Gain on non-hedge derivatives | | | (81) | | | | (69) | |
(Gain) loss from investment in associates and JCEs (note 14) | | | (8) | | | | 24 | |
Change in estimate of rehabilitation provisions at closed mines | | | 79 | | | | 41 | |
Inventory impairment charges (reversals) (note 15) | | | - | | | | 3 | |
Cash flow arising from changes in: | | | | | | | | |
Derivative assets and liabilities | | | (78) | | | | (42) | |
Other current assets | | | (32) | | | | (101) | |
Value added tax recoverable | | | (68) | | | | (81) | |
Accounts receivable | | | 49 | | | | (57) | |
Other current liabilities | | | (81) | | | | 68 | |
Prepaid assets | | | (35) | | | | 90 | |
Accounts payable and accrued liabilities | | | 66 | | | | 311 | |
Other assets and liabilities | | | (24) | | | | 130 | |
Income from discontinued operations | | | - | | | | (124) | |
Payment of settlement of gold sales contracts | | | - | | | | (656) | |
Operating cash flows of discontinued operations | | | - | | | | (8) | |
Settlement of rehabilitation obligations | | | (44) | | | | (44) | |
Other net operating activities | | | (173) | | | | (421) | |
Operating cash flow includes payments for: | | | | | | | | |
Cash interest paid (note 22) | | | $ 137 | | | | $ 153 | |
|
| B Investing Cash Flows – Other Items | |
For the years ended December 31 | | | 2011 | | | | 2010 | |
Funding of investments in associates and JCEs (note 14) | | | $ (36) | | | | $ (51) | |
Other | | | (197) | | | | (3) | |
Other net investing activities | | | $ (233) | | | | $ (54) | |
Investing cash flow includes payments for: | | | | | | | | |
Capitalized interest (note 22) | | | $ 382 | | | | $ 275 | |
|
| C Financing Cash Flows – Other Items | |
For the years ended December 31 | | | 2011 | | | | 2010 | |
Financing fees on long-term debt | | | $ (59) | | | | $ (37) | |
Derivative settlements | | | (7) | | | | 12 | |
Other net financing activities | | | $ (66) | | | | $ (25) | |
| | | | |
| BARRICK YEAR END 2011 | | 123 | | NOTES TO FINANCIAL STATEMENTS |
14 > INVESTMENTS
| | | | | | | | | | | | | | | | | | | | | | | | |
| A Equity Accounting Method Investment Continuity | |
| | | | Highland Gold2 | | | | Reko Diq3 | | | | Cerro Casale | | | | Donlin Gold | | | | Kabanga | | | | Total | |
At January 1, 2010 | | | $ 96 | | | | $ 131 | | | | $ 828 | | | | $ 67 | | | | $ 2 | | | | $ 1,124 | |
Equity pick-up (loss) from equity investees | | | 12 | | | | (19) | | | | (1) | | | | (10) | | | | (6) | | | | (24) | |
Funds invested (dividends received) | | | - | | | | 12 | | | | 12 | | | | 22 | | | | 5 | | | | 51 | |
Impairment (charges) reversals | | | 84 | | | | - | | | | - | | | | - | | | | - | | | | 84 | |
Derecognition on acquisition of controlling interest1 | | | - | | | | - | | | | (839) | | | | - | | | | - | | | | (839) | |
At December 31, 2010 | | | $ 192 | | | | $ 124 | | | | $ - | | | | $ 79 | | | | $ 1 | | | | $ 396 | |
Equity pick-up (loss) from equity investees | | | 22 | | | | (12) | | | | - | | | | (2) | | | | - | | | | 8 | |
Funds invested (dividends received) | | | (5) | | | | 9 | | | | - | | | | 22 | | | | 10 | | | | 36 | |
At December 31, 2011 | | | $ 209 | | | | $ 121 | | | | $ - | | | | $ 99 | | | | $ 11 | | | | $ 440 | |
Publicly traded | | | Yes | | | | No | | | | No | | | | No | | | | No | | | | No | |
| 1 | The carrying amount of the Cerro Casale investment has been derecognized as an equity method investee as a result of our obtaining control over the entity as a result of the acquisition of an additional 25% interest in Q1 2010. See note 4f for further details. |
| 2 | Based on the December 30, 2011 trading price of $1.88 GBP per share, the market value of our investment in Highland Gold is $193 million. We performed a qualitative and quantitative assessment on the decline in fair value and determined that the decline was not significant or prolonged. |
| 3 | Refer to note 33 for further details. |
In February 2012, we determined that our investment in Highland Gold Mining Limited (“Highland”) was non-core to our business operations and strategy. As a result, we intend to divest our shareholding in an orderly process which delivers proper value to Barrick and supports the interests and aims of Highland and its shareholders. Based on the trading price of Highland as at February 14, 2012, the market value of our investment in Highland is $169 million.
| | | | | | | | | | | | | | | | | | | | | | | | |
| B Other Investments | |
| | | As at December 31, 2011 | | | As at December 31, 2010 | | | As at January 1, 2010 | |
| | | Fair Value1 | | | Gains in OCI | | | Fair value | | | Gains in OCI | | | Fair value | | | Gains in OCI | |
Available-for-sale securities | | | $ 161 | | | | $ 25 | | | | $ 171 | | | | $ 85 | | | | $ 62 | | | | $ 27 | |
| 1 | Refer to note 23 for further information on the measurement of fair value. |
| | | | | | | | |
| Gains on Investments Recorded in Earnings | |
For the years ended December 31 | | | 2011 | | | | 2010 | |
Gains realized on sales1 | | | $ 55 | | | | $ 12 | |
Cash proceeds from sales | | | 80 | | | | 15 | |
| 1 | 2011 amounts include gains realized on sale of our investment in Fronteer Gold of $46 million. |
| | | | |
| BARRICK YEAR END 2011 | | 124 | | NOTES TO FINANCIAL STATEMENTS |
| | | | | | | | | | | | | | | | | | | | | | | | |
| 15 > INVENTORIES | |
| | | | | | | Gold | | | | | | | | | | | | Copper | | | | | |
| | |
| As at
December 31,
2011 |
| |
| As at
December 31,
2010 |
| |
| As at
January 1,
2010 |
| |
| As at
December 31,
2011 |
| |
| As at
December 31,
2010 |
| |
| As at
January 1,
2010 |
|
Raw materials | | | | | | | | | | | | | | | | | | | | | | | | |
Ore in stockpiles | | | $ 1,401 | | | | $ 1,364 | | | | $ 932 | | | | $ 189 | | | | $ 112 | | | | $ 79 | |
Ore on leach pads | | | 335 | | | | 223 | | | | 184 | | | | 247 | | | | 157 | | | | 130 | |
Mine operating supplies | | | 757 | | | | 558 | | | | 485 | | | | 128 | | | | 25 | | | | 19 | |
Work in process | | | 371 | | | | 255 | | | | 237 | | | | 6 | | | | 48 | | | | 47 | |
Finished products | | | | | | | | | | | | | | | | | | | | | | | | |
Gold doré | | | 111 | | | | 88 | | | | 74 | | | | - | | | | - | | | | - | |
Copper cathode | | | - | | | | - | | | | - | | | | 14 | | | | 8 | | | | 5 | |
Copper concentrate | | | - | | | | - | | | | - | | | | 89 | | | | - | | | | - | |
Gold concentrate | | | 3 | | | | - | | | | 5 | | | | - | | | | - | | | | - | |
| | | $ 2,978 | | | | $ 2,488 | | | | $ 1,917 | | | | $ 673 | | | | $ 350 | | | | $ 280 | |
Non-current ore in stockpiles1 | | | (980) | | | | (884) | | | | (589) | | | | (173) | | | | (156) | | | | (120) | |
| | | | $ 1,998 | | | | $ 1,604 | | | | $ 1,328 | | | | $ 500 | | | | $ 194 | | | | $ 160 | |
| 1 | Ore that we do not expect to process in the next 12 months is classified within other assets. |
| | | | | | | | |
| For the years ended December 31 | | 2011 | | | 2010 | |
Inventory impairment charges | | | $ 1 | | | | $ 3 | |
Inventory impairment charges reversed | | | (1) | | | | - | |
Ore on leach pads
The recovery of gold and copper from certain oxide ores is achieved through the heap leaching process. Our Pierina, Lagunas Norte, Veladero, Cortez, Bald Mountain, Round Mountain, Ruby Hill and Marigold mines all use a heap leaching process for gold and our Zaldívar mine uses a heap leaching process for copper. Under this method, ore is placed on leach pads where it is treated with a chemical solution, which dissolves the gold or copper contained in the ore. The resulting “pregnant” solution is further processed in a plant where the gold or copper is recovered. For accounting purposes, costs are added to ore on leach pads based on current mining and leaching costs, including applicable depreciation, depletion and amortization relating to mining operations. Costs are removed from ore on leach pads as ounces or pounds are recovered based on the average cost per recoverable ounce of gold or pound of copper on the leach pad.
Estimates of recoverable gold or copper on the leach pads are calculated from the quantities of ore placed on the leach pads (measured tons added to the leach pads), the grade of ore placed on the leach pads (based on assay data) and a recovery percentage (based on ore type).
Although the quantities of recoverable gold or copper placed on the leach pads are reconciled by comparing the grades of ore placed on pads to the quantities of gold or copper actually recovered (metallurgical balancing), the nature of the leaching process inherently limits the ability to precisely monitor inventory levels. As a result, the metallurgical balancing process is regularly monitored and estimates are refined based on actual results over time. Historically, our operating results have not been materially impacted by variations between the estimated and actual recoverable quantities of gold or copper on our leach pads. At December 31, 2011, the weighted average cost per recoverable ounce of gold and recoverable pound of copper on leach pads was $653 per ounce and $1.03 per pound, respectively (2010: $427 per ounce of gold and $0.69 per pound of copper). Variations between actual and estimated quantities resulting from changes in assumptions and estimates that do not result in write-downs to net realizable value are accounted for on a prospective basis.
The ultimate recovery of gold or copper from a leach pad will not be known until the leaching process is concluded. Based on current mine plans, we expect to place the last ton of ore on our current leach pads at dates for gold ranging from 2012 to 2030 and for copper ranging from 2012 to 2028. Including the estimated time required for
| | | | |
| BARRICK YEAR END 2011 | | 125 | | NOTES TO FINANCIAL STATEMENTS |
residual leaching, rinsing and reclamation activities, we expect that our leaching operations will terminate within a period of up to six years following the date that the last ton of ore is placed on the leach pad.
The current portion of ore inventory on leach pads is determined based on estimates of the quantities of gold or copper at each balance sheet date that we expect to recover during the next 12 months.
Ore in Stockpiles
| | | | | | | | | | | | | | | | |
| | | As at
December 31,
2011 | | | As at
December 31,
2010 | | | As at
January 1,
2010 | | | Year1 | |
Gold | | | | | | | | | | | | | | | | |
Goldstrike | | | $ 525 | | | | $ 507 | | | | $ 407 | | | | 2027 | |
Cortez | | | 192 | | | | 366 | | | | 97 | | | | 2024 | |
Porgera | | | 149 | | | | 111 | | | | 105 | | | | 2025 | |
Kalgoorlie | | | 99 | | | | 89 | | | | 79 | | | | 2022 | |
Cowal | | | 90 | | | | 81 | | | | 77 | | | | 2020 | |
North Mara | | | 75 | | | | 59 | | | | 56 | | | | 2020 | |
Buzwagi | | | 59 | | | | 41 | | | | 25 | | | | 2024 | |
Pueblo Viejo | | | 55 | | | | 6 | | | | - | | | | 2047 | |
Round Mountain | | | 47 | | | | 4 | | | | 5 | | | | 2019 | |
Veladero | | | 30 | | | | 20 | | | | 26 | | | | 2014 | |
Lagunas Norte | | | 22 | | | | 24 | | | | 8 | | | | 2012 | |
Turquoise Ridge | | | 15 | | | | 14 | | | | 15 | | | | 2039 | |
Other | | | 43 | | | | 42 | | | | 32 | | | | | |
Copper | | | | | | | | | | | | | | | | |
Zaldívar | | | 175 | | | | 112 | | | | 79 | | | | 2028 | |
Lumwana | | | 14 | | | | - | | | | - | | | | 2037 | |
| | | | $ 1,590 | | | | $ 1,476 | | | | $ 1,011 | | | | | |
| 1 | Year in which we expect to complete full processing of the ore in stockpiles. |
Ore on Leachpads
| | | | | | | | | | | | | | | | |
| | | As at
December 31,
2011 | | | As at
December 31,
2010 | | | As at
January 1,
2010 | | | Year1 | |
Gold | | | | | | | | | | | | | | | | |
Veladero | | | $ 128 | | | | $ 71 | | | | $ 46 | | | | 2012 | |
Cortez | | | 12 | | | | 16 | | | | 24 | | | | 2012 | |
Ruby Hill | | | 9 | | | | 10 | | | | 23 | | | | 2012 | |
Bald Mountain | | | 61 | | | | 12 | | | | 24 | | | | 2012 | |
Lagunas Norte | | | 15 | | | | 17 | | | | 23 | | | | 2012 | |
Round Mountain | | | 17 | | | | 26 | | | | 17 | | | | 2012 | |
Pierina | | | 71 | | | | 52 | | | | 14 | | | | 2012 | |
Marigold | | | 22 | | | | 19 | | | | 13 | | | | 2012 | |
Copper | | | | | | | | | | | | | | | | |
Zaldívar | | | 247 | | | | 157 | | | | 130 | | | | 2014 | |
| | | | $ 582 | | | | $ 380 | | | | $ 314 | | | | | |
| 1 | Year in which we expect to complete full processing of the ore on leachpads. |
Purchase Commitments
At December 31, 2011, we had purchase obligations for supplies and consumables of approximately $1,748 million (2010: $1,449 million).
16> ACCOUNTS RECEIVABLE AND OTHER CURRENT ASSETS
| | | | | | | | | | | | |
| | | As at
December 31,
2011 | | | As at
December 31,
2010 | | | As at
January 1,
2010 | |
Accounts receivable | | | | | | | | | | | | |
Amounts due from concentrate sales | | | $ 99 | | | | $ 46 | | | | $ 16 | |
Amounts due from copper cathode sales | | | 107 | | | | 159 | | | | 109 | |
Other receivables | | | 220 | | | | 165 | | | | 134 | |
| | | | $ 426 | | | | $ 370 | | | | $ 259 | |
| Other current assets | | | | | | | | | | | | |
Derivative assets (note 22f) | | | $ 507 | | | | $ 615 | | | | $ 214 | |
Goods and services taxes recoverable1 | | | 194 | | | | 211 | | | | 201 | |
Prepaid expenses | | | 123 | | | | 95 | | | | 92 | |
Other | | | 52 | | | | 14 | | | | 11 | |
| | | | $ 876 | | | | $ 935 | | | | $ 518 | |
| 1 | Includes $131 million and $22 million in VAT and fuel tax receivables in South America and Africa, respectively (2010: $132 million and $59 million, respectively). |
| | | | |
| BARRICK YEAR END 2011 | | 126 | | NOTES TO FINANCIAL STATEMENTS |
17 > PROPERTY, PLANT AND EQUIPMENT
| | | | | | | | | | | | | | | | | | | | |
| | | | | | Mining Properties1 | | | | | | | |
| | | Buildings, plant
and equipment | | | Assets subject
to depreciation3 | | | Assets not subject
to depreciation2 | | | Oil and gas
properties | | | Total | |
At January 1, 2010 | | | | | | | | | | | | | | | | | | | | |
Net of accumulated depreciation | | | $ 2,081 | | | | $ 7,070 | | | | $ 3,886 | | | | $ 341 | | | | $ 13,378 | |
Adjustment on currency translation | | | - | | | | - | | | | - | | | | 28 | | | | 28 | |
Additions | | | 202 | | | | 471 | | | | 3,152 | | | | 90 | | | | 3,915 | |
Capitalized interest | | | - | | | | - | | | | 284 | | | | - | | | | 284 | |
Disposals | | | (5) | | | | (2) | | | | (17) | | | | - | | | | (24) | |
Acquisitions | | | - | | | | - | | | | 1,535 | | | | 252 | | | | 1,787 | |
Depreciation | | | (392) | | | | (1,035) | | | | - | | | | (44) | | | | (1,471) | |
Impairments (charges) | | | - | | | | - | | | | - | | | | (7) | | | | (7) | |
Transfers between categories4 | | | 568 | | | | 695 | | | | (1,263) | | | | - | | | | - | |
At December 31, 2010 | | | $ 2,454 | | | | $ 7,199 | | | | $ 7,577 | | | | $ 660 | | | | $ 17,890 | |
At January 1, 2010 | | | | | | | | | | | | | | | | | | | | |
Cost | | | $ 6,058 | | | | $ 13,141 | | | | $ 3,886 | | | | $ 391 | | | | $ 23,476 | |
Accumulated depreciation | | | (3,977) | | | | (6,071) | | | | - | | | | (50) | | | | (10,098) | |
Net carrying amount - January 1, 2010 | | | $ 2,081 | | | | $ 7,070 | | | | $ 3,886 | | | | $ 341 | | | | $ 13,378 | |
| | | | | | | | | | | | | | | | | | | | | |
At December 31, 2010 | | | | | | | | | | | | | | | | | | | | |
Cost | | | $ 6,808 | | | | $ 14,278 | | | | $ 7,577 | | | | $ 754 | | | | $ 29,417 | |
Accumulated depreciation | | | (4,354) | | | | (7,079) | | | | - | | | | (94) | | | | (11,527) | |
Net carrying amount - December 31, 2010 | | | $ 2,454 | | | | $ 7,199 | | | | $ 7,577 | | | | $ 660 | | | | $ 17,890 | |
| | | | | | | | | | | | | | | | | |
| | | | | | Mining Properties1 | | | | | | | |
| | | Buildings, plant
and equipment | | | Assets subject
to depreciation3 | | | Assets not subject
to depreciation2 | | | Oil and gas
properties | | | Total | |
At December 31, 2010 | | | | | | | | | | | | | | | | | | | | |
Net of accumulated depreciation | | | $ 2,454 | | | | $ 7,199 | | | | $ 7,577 | | | | $ 660 | | | | $ 17,890 | |
Adjustment on currency translation | | | - | | | | - | | | | - | | | | (22) | | | | (22) | |
Additions | | | 180 | | | | 219 | | | | 4,874 | | | | 178 | | | | 5,451 | |
Capitalized interest | | | - | | | | - | | | | 396 | | | | - | | | | 396 | |
Disposals | | | (20) | | | | (4) | | | | - | | | | - | | | | (24) | |
Acquisitions | | | - | | | | 3,078 | | | | 3,400 | | | | 342 | | | | 6,820 | |
Depreciation | | | (389) | | | | (910) | | | | - | | | | (95) | | | | (1,394) | |
Impairments (charges) | | | - | | | | - | | | | (89) | | | | (49) | | | | (138) | |
Transfers between categories4 | | | 417 | | | | 1,468 | | | | (1,885) | | | | - | | | | - | |
At December 31, 2011 | | | $ 2,642 | | | | $ 11,050 | | | | $ 14,273 | | | | $ 1,014 | | | | $ 28,979 | |
At December 31, 2011 | | | | | | | | | | | | | | | | | | | | |
Cost | | | $ 7,352 | | | | $ 19,200 | | | | $ 14,273 | | | | $ 1,225 | | | | $ 42,050 | |
Accumulated depreciation | | | (4,710) | | | | (8,150) | | | | - | | | | (211) | | | | (13,071) | |
Net carrying amount - December 31, 2011 | | | $ 2,642 | | | | $ 11,050 | | | | $ 14,273 | | | | $ 1,014 | | | | $ 28,979 | |
| 1 | Includes capitalized reserve acquisition costs, capitalized development costs and exploration and evaluation costs. |
| 2 | Assets not subject to depreciation includes construction-in-progress, capital projects and acquired mineral resources and exploration potential. |
| 3 | Assets subject to depreciation include the following items for production stage properties: acquired mineral reserves and resources, capitalized mine development costs, capitalized stripping and capitalized exploration and evaluation costs. |
| 4 | The carrying amount of the long-lived assets in the Capital Projects segment is transferred to the relevant operating segment on commissioning of the mine. |
| | | | |
| BARRICK YEAR END 2011 | | 127 | | NOTES TO FINANCIAL STATEMENTS |
Assets Not Subject to Depreciation
| | | | | | | | | | | | |
| | | Carrying
amount at
December 31,
2011 | | | Carrying
amount at
December 31,
2010 | | | Carrying
amount at
January 1,
2010 | |
| Construction-in-progress3 | | | $ 1,314 | | | | $ 913 | | | | $ 853 | |
| Acquired mineral resources and exploration potential | | | 2,278 | | | | 359 | | | | 423 | |
| Projects | | | | | | | | | | | | |
Pascua-Lama | | | 3,749 | | | | 2,156 | | | | 1,185 | |
Pueblo Viejo2 | | | 3,554 | | | | 2,590 | | | | 1,425 | |
Cerro Casale1, 2 | | | 1,732 | | | | 1,544 | | | | - | |
Jabal Sayid | | | 1,605 | | | | - | | | | - | |
| Other | | | 41 | | | | 15 | | | | | |
| | | | $ 14,273 | | | | $ 7,577 | | | | $ 3,886 | |
| 1 | The carrying amount of the Cerro Casale investment has been transferred to PP&E as a result of our obtaining control over the entity due to the acquisition of an additional 25% interest. See note 4f for further details. |
| 2 | Amounts are presented on a 100% basis and include our partner’s non- controlling interest. |
| 3 | Represents assets under construction at our operating mine sites. |
| B | Depreciation and Accretion |
| | | | | | | | |
| | | 2011 | | | 2010 | |
Depreciation (note 5) | | | $ 1,419 | | | | $ 1,212 | |
Accretion (note 24) | | | 52 | | | | 21 | |
| | | | $ 1,471 | | | | $ 1,233 | |
Changes in Gold and Copper Mineral Reserves
At the end of each fiscal year, as part of our annual business cycle, we prepare estimates of proven and probable gold and copper mineral reserves for each mineral property. We prospectively revise calculations of amortization expense for property, plant and equipment amortized using the UOP method, whereby the denominator is estimated recoverable ounces of gold/pounds of copper. The effect of changes in reserve estimates on amortization expense for 2011 was a $119 million decrease (2010: $40 million decrease).
In addition to entering into various operational commitments in the normal course of business, we had commitments of approximately $1,338 million at December 31, 2011 (2010: $1,254 million) for construction activities at our capital projects.
| | | | |
| BARRICK YEAR END 2011 | | 128 | | NOTES TO FINANCIAL STATEMENTS |
18 > GOODWILL AND OTHER INTANGIBLE ASSETS
A Goodwill
We allocate goodwill to the group of CGUs that comprise an operating segment, since each CGU in a segment is expected to derive benefits from a business combination that results in the recognition of goodwill. At December 31, 2011, goodwill has been allocated to each operating segment as follows:
| | | | | | | | | | | | | | | | | | | | | | | | | | | | | | | | |
| | | Gold | | | | | | | | | | | | | |
| | | North
America | | | Australia | | | South
America | | | ABG | | | Capital
Projects | | | Copper4 | | | Barrick
Energy | | | Total | |
| Opening balance January 1, 2010 | | | $ 2,376 | | | | $ 1,480 | | | | $ 441 | | | | $ 157 | | | | $ - | | | | $ 743 | | | | $ - | | | | $ 5,197 | |
| Additions1 | | | $ - | | | | $ - | | | | $ - | | | | $22 | | | | $ - | | | | $ - | | | | $64 | | | | $86 | |
| Other3 | | | - | | | | - | | | | - | | | | - | | | | 809 | | | | - | | | | 4 | | | | 813 | |
| Closing balance December 31, 2010 | | | $ 2,376 | | | | $ 1,480 | | | | $ 441 | | | | $ 179 | | | | $ 809 | | | | $ 743 | | | | $ 68 | | | | $ 6,096 | |
| Additions2 | | | $ - | | | | $ - | | | | $ - | | | | $ - | | | | $ - | | | | $3,506 | | | | $26 | | | | $3,532 | |
| Other3 | | | - | | | | - | | | | - | | | | - | | | | - | | | | - | | | | (2) | | | | (2) | |
| Closing balance December 31, 2011 | | | $ 2,376 | | | | $ 1,480 | | | | $ 441 | | | | $ 179 | | | | $ 809 | | | | $ 4,249 | | | | $ 92 | | | | $ 9,626 | |
| Cost | | | $2,376 | | | | $1,480 | | | | $441 | | | | $179 | | | | $809 | | | | $4,249 | | | | $92 | | | | $9,626 | |
| Net carrying amount | | | $ 2,376 | | | | $ 1,480 | | | | $ 441 | | | | $ 179 | | | | $ 809 | | | | $ 4,249 | | | | $ 92 | | | | $ 9,626 | |
| 1 | Represents goodwill acquired as a result of the acquisition of Tusker ($22 million) (note 4c) and Bountiful, Puskwa and Dolomite ($64 million) (note 4b). |
| 2 | Represents goodwill acquired as a result of the acquisition of Equinox ($3,506 million) (note 4a) and Venturion and Culane ($26 million) (note 4b). |
| 3 | Represents remeasured goodwill as a result of the adoption of the consolidation method of accounting following acquisition of an additional 25% interest in Cerro Casale (note 4f) and the impact of foreign exchange rate changes on the translation of Barrick Energy from C $ to US $. |
| 4 | In fourth quarter 2011, we established a global copper business unit. As a result, all of our copper assets now form part of this operating segment. The comparatives have been restated to reflect this reorganization. |
B Intangible Assets
| | | | | | | | | | | | | | | | | | | | |
| | | Water
rights1 | | | Technology2 | | | Supply
contracts3 | | | Exploration
potential4 | | | Total | |
| Opening balance January 1, 2010 | | | $ 40 | | | | $ 17 | | | | $ 9 | | | | $ 209 | | | | $ 275 | |
| Additions | | | $76 | | | | $ - | | | | $6 | | | | $126 | | | | $208 | |
| Disposals | | | - | | | | - | | | | (7) | | | | - | | | | (7) | |
| Amortization | | | - | | | | - | | | | (1) | | | | - | | | | (1) | |
| Closing balance December 31, 2010 | | | $ 116 | | | | $ 17 | | | | $ 7 | | | | $ 335 | | | | $ 475 | |
| Additions | | | $ - | | | | $ - | | | | $16 | | | | $78 | | | | $94 | |
| Closing balance December 31, 2011 | | | $ 116 | | | | $ 17 | | | | $ 23 | | | | $ 413 | | | | $ 569 | |
| Cost | | | $116 | | | | $17 | | | | $39 | | | | $413 | | | | $585 | |
| Accumulated amortization and impairment losses | | | - | | | | - | | | | (16) | | | | - | | | | (16) | |
| Net carrying amount December 31, 2011 | | | $ 116 | | | | $ 17 | | | | $ 23 | | | | $ 413 | | | | $ 569 | |
| 1 | Water rights in South America ($116 million) are subject to annual impairment testing and will be amortized through cost of sales when used in the future. In 2010, we recorded a $75 million increase as a result of adoption of the consolidation method of accounting for Cerro Casale. Refer to note 4f. |
| 2 | The amount will be amortized through cost of sales using the UOP method over the estimated proven and probable reserves of the Pueblo Viejo mine, with no assumed residual value. |
| 3 | Relates to a supply agreement with Michelin North America Inc. to secure a supply of tires and will be amortized over the effective term of the contract through cost of sales. |
| 4 | Exploration potential consists of the estimated fair value attributable to exploration licenses acquired as a result of a business combination or asset acquisition. The carrying value of the licenses will be transferred to PP&E when the development of attributable mineral resources commences (note 2m(i)). |
| | | | |
| BARRICK YEAR END 2011 | | 129 | | NOTES TO FINANCIAL STATEMENTS |
C Impairment of Goodwill and Non-current Assets
Goodwill was tested for impairment in the fourth quarter. The recoverable amount of each operating segment has been determined using a FVLCS approach. For the year ended December 31, 2011, we did not record any impairment to goodwill (2010: nil).
FVLCS for each gold operating segment was determined by considering the net present value (“NPV”) of the future cash flows expected to be generated by the segment. Net future cash flows were derived from the most recent life of mine (“LOM”) plans, with mine lives ranging from 2 to 35 years, aggregated to the segment level. We have used an estimated long-term gold price of $1,600 per ounce (2010: $1,250 per ounce) to estimate future revenues. The net future cash flows were discounted using a segment real weighted average cost for a gold business of 5% (2010: 5%). Gold companies consistently trade at a market capitalization greater than the NPV of their expected cash flows. Market participants describe this as a “NAV multiple”, whereby the NAV represents the multiple applied to the NPV to arrive at the trading price. As a result, we applied a NAV multiple to the NPV of each gold operating segment based on the observable NAV multiples of comparable companies as at the test date. In 2011, the average NAV multiple was about 1.2 (2010: 1.4).
For our copper segment, the FVLCS was determined based on the NPV of future cash flows expected to be generated using the most recent LOM plans, with mine lives ranging from 11 to 31 years, aggregated to the segment level. We utilized a long-term risk-adjusted copper price of $3.44 per pound to estimate future revenues. The risk adjustment to the average long-term copper price was approximately 4.5%. The expected net future cash flow was additionally discounted using rates from 4.5% to 5.5% to reflect the time value of money and a residual risk factor for cash flow uncertainties not related to metal price. This results in an effective weighted average cost of capital for the copper segment of approximately 7%.
For our oil and gas segment, the FVLCS was determined based on the NPV of future cash flows expected to be generated from our oil and gas properties, aggregated to the segment level. We have estimated future oil prices using the forward curve provided by an independent reserve evaluation firm, with prices starting at $97 per barrel (WTI) (2010: $88 per barrel). The net future cash
flows were discounted using a real weighted average cost of capital for long life oil and gas assets of 8.5% (2010: 8.5%).
Non-current assets are tested for impairment when events or changes in circumstances suggest that the carrying amount may not be recoverable. The recoverable amount is calculated using the same FVLCS approach as described above for goodwill. However, the assessment is done at the CGU level, which is the lowest level for which identifiable cash flows are largely independent of the cash flows of other assets. For the year ended December 31, 2011, we recorded impairment charges of $138 million for non-current assets. The impairment included a $49 million charge at our Barrick Energy segment, primarily due to recovery issues at one of our properties. Impairment charges also included an $83 million write-down of certain power related assets at our Pueblo Viejo project as a result of a decision to proceed with an alternative long-term power solution.
Expected future cash flows used to determine the FVLCS used in the impairment testing of goodwill and non-current assets are inherently uncertain and could materially change over time. The cash flows are significantly affected by a number of factors including estimates of production levels, operating costs and capital expenditures reflected in our LOM plans; as well as economic factors beyond management’s control, such as gold, copper and oil prices; discount rates; and observable NAV multiples. Should management’s estimate of the future not reflect actual events, further impairments may be identified.
For purposes of testing for impairment of non-current assets of our gold, copper and oil and gas segments, a reasonably possible change in the key assumptions used to estimate the FVLCS could result in an impairment charge at one or more of our CGUs. The carrying value of the net assets of CGUs that are most sensitive to changes in the key assumptions are:
| | | | |
| As at December 31, 2011 | | Carrying Value | |
Lumwana | | | $ 3,538 | |
Jabal Sayid | | | 1,160 | |
Buzwagi | | | 634 | |
Barrick Energy CGUs | | | 231 | |
Pierina | | | 51 | |
| | | | |
| BARRICK YEAR END 2011 | | 130 | | NOTES TO FINANCIAL STATEMENTS |
| | | | | | | | | | | | |
| 19 > OTHER ASSETS | | | | | | | | | |
| | | | | | | | | | | | | |
| | |
| As at December 31,
2011 |
| |
| As at December 31,
2010 |
| |
| As at January 1,
2010 |
|
Derivative assets (note 22f) | | | $ 455 | | | | $ 511 | | | | $ 290 | |
Goods and services taxes recoverable1 | | | 272 | | | | 138 | | | | 121 | |
Notes receivable | | | 121 | | | | 90 | | | | 94 | |
Other | | | 154 | | | | 134 | | | | 144 | |
| | | | $ 1,002 | | | | $ 873 | | | | $ 649 | |
| 1 | Includes $209 million and $63 million in VAT and fuel tax receivables in South America and Africa, respectively (2010: $75 million and $63 million, respectively). |
| | | | | | | | | | | | |
| 20 > ACCOUNTS PAYABLE | | | | | | | | | |
| | | | | | | | | | | | | |
| | |
| As at December 31,
2011 |
| |
| As at December 31,
2010 |
| |
| As at January 1,
2010 |
|
Accounts payable | | | $ 963 | | | | $ 790 | | | | $ 612 | |
Accruals | | | 1,120 | | | | 721 | | | | 609 | |
| | | | $ 2,083 | | | | $ 1,511 | | | | $ 1,221 | |
| | | | | | | | | | | | |
| 21 > OTHER CURRENT LIABILITIES | | | | | | | | | |
| | | | | | | | | | | | | |
| | |
| As at December 31,
2011 |
| |
| As at December 31,
2010 |
| |
| As at January 1,
2010 |
|
Provision for environmental rehabilitation (note 24) | | | $ 79 | | | | $ 88 | | | | $ 85 | |
Derivative liabilities (note 22f) | | | 22 | | | | 173 | | | | 180 | |
Post-retirement benefits (note 32b) | | | 14 | | | | 10 | | | | 16 | |
Restricted stock units (note 31b) | | | 27 | | | | 51 | | | | 26 | |
Contingent purchase consideration1 | | | 50 | | | | - | | | | - | |
Other | | | 134 | | | | 94 | | | | 59 | |
| | | | $ 326 | | | | $ 416 | | | | $ 366 | |
| 1 | Represents the contingent purchase consideration arising on our acquisition of the additional 40% interest in our Cortez property in 2008. Consideration of $1,695 million was recognized on acquisition in 2008. |
22 > FINANCIAL INSTRUMENTS
Financial instruments include cash; evidence of ownership in an entity; or a contract that imposes an obligation on one party and conveys a right to a second entity to deliver/receive cash or another financial instrument. Information on certain types of financial instruments is included elsewhere in these consolidated financial statements as follows: accounts receivable – note 16; investments – note 14; restricted share units – note 31b.
A Cash and Equivalents
Cash and equivalents include cash, term deposits, treasury bills and money markets with original maturities of less than 90 days.
| | | | | | | | | | | | |
| | |
| As at December 31,
2011 |
| |
| As at December 31,
2010 |
| |
| As at January 1,
2010 |
|
Cash deposits | | | $ 1,009 | | | | $ 1,345 | | | | $ 509 | |
Term deposits | | | 278 | | | | 1,236 | | | | 298 | |
Treasury bills | | | - | | | | - | | | | 125 | |
Money market investments | | | 1,458 | | | | 1,387 | | | | 1,632 | |
| | | | $ 2,745 | | | | $ 3,968 | | | | $ 2,564 | |
| | | | |
| BARRICK YEAR END 2011 | | 131 | | NOTES TO FINANCIAL STATEMENTS |
| | | | | | | | | | | | | | | | | | | | | | | | | | | | | | | | | | | | |
| | | 2011 | | | 2010 | |
| | | At
December 31 | | | Proceeds | | | Repayments | | | Amortization
and Other2 | | | At
December 31 | | | Proceeds | | | Repayments | | | Amortization
and Other2 | | | At
January 1 | |
| 1.75%/2.9%/4.4%/5.7% notes3 | | | $ 3,972 | | | | $ 4,000 | | | | $ - | | | | $ (28) | | | | $ - | | | | $ - | | | | $ - | | | | $ - | | | | $ - | |
| 5.80%/4.875% notes4 | | | 750 | | | | - | | | | - | | | | - | | | | 750 | | | | - | | | | - | | | | 4 | | | | 746 | |
| 5.75%/6.35% notes5 | | | 988 | | | | - | | | | - | | | | - | | | | 988 | | | | - | | | | - | | | | 1 | | | | 987 | |
| Other fixed rate notes | | | 3,190 | | | | - | | | | - | | | | - | | | | 3,190 | | | | - | | | | - | | | | 6 | | | | 3,184 | |
| Convertible senior debentures6 | | | - | | | | - | | | | - | | | | - | | | | - | | | | - | | | | 176 | | | | 3 | | | | 173 | |
| Project financing | | | 873 | | | | 148 | | | | - | | | | (16) | | | | 741 | | | | 754 | | | | 62 | | | | (8) | | | | 57 | |
| Capital leases | | | 203 | | | | - | | | | 20 | | | | 151 | | | | 72 | | | | - | | | | 24 | | | | 34 | | | | 62 | |
| Other debt obligations7 | | | 899 | | | | - | | | | - | | | | 2 | | | | 897 | | | | - | | | | 63 | | | | (9 | ) | | | 969 | |
| First credit facility8 | | | 1,500 | | | | 1,500 | | | | - | | | | - | | | | - | | | | - | | | | - | | | | - | | | | - | |
| Second credit facility9 | | | 994 | | | | 1,000 | | | | - | | | | (6) | | | | - | | | | - | | | | - | | | | - | | | | - | |
| | | $ 13,369 | | | | $ 6,648 | | | | $ 20 | | | | $ 103 | | | | $ 6,638 | | | | $ 754 | | | | $ 325 | | | | $ 31 | | | | $ 6,178 | |
| Less: current portion10 | | | (196) | | | | - | | | | - | | | | - | | | | (14) | | | | - | | | | - | | | | - | | | | (54) | |
| | | | $ 13,173 | | | | $ 6,648 | | | | $ 20 | | | | $ 103 | | | | $ 6,624 | | | | $ 754 | | | | $ 325 | | | | $ 31 | | | | $ 6,124 | |
| 1 | The agreements that govern our long-term debt each contain various provisions which are not summarized herein. In certain cases, these provisions allow Barrick to, at its option, redeem indebtedness prior to maturity at specified prices and also may permit redemption of debt by Barrick upon the occurrence of certain specified changes in tax legislation. |
| 2 | Amortization of debt premium/discount and increases in capital leases. |
| 3 | In June 2011, we issued an aggregate of $4 billion of debentures to finance a portion of the acquisition of Equinox. They are comprised of: $700 million at a $1 million discount that matures on May 30, 2014, $1.1 billion at a $1 million discount that matures on May 30, 2016, $1.35 billion at a $1 million discount that matures on May 30, 2021, and $850 million at a $4 million discount that matures on May 30, 2041. |
| 4 | During third quarter 2004, we issued $400 million of debentures at a $3 million discount that mature on November 15, 2034 and $350 million of debentures at a $2 million discount that mature on November 15, 2014. |
| 5 | $400 million of US dollar notes with a coupon rate of 5.75% mature in 2016 and $600 million of US dollar notes with a coupon rate of 6.35% mature in 2036. |
| 6 | On October 20, 2010 we redeemed all of our entire outstanding Placer Dome 2.75% Convertible Senior Debentures due 2023. |
| 7 | The obligations have an aggregate amount of $899 million, of which $100 million is subject to floating interest rates and $799 million is subject to fixed interest rates ranging from 4.75% to 8.05%. The obligations mature at various times between 2012 and 2035. |
| 8 | We have a credit and guarantee agreement with a group of banks (the “Lenders”), which requires the Lenders to make available to us a credit facility of up to $1.5 billion or the equivalent amount in Canadian currency. The credit facility, which is unsecured, has an interest rate of LIBOR plus 0.25% to 0.35% on drawn down amounts, and a commitment rate of 0.07% to 0.08% on undrawn amounts. $50 million matures in 2012 and the remaining $1.45 billion matures in 2013. |
| 9 | We have a credit and guarantee agreement with a group of banks which requires the Lenders to make available to us a credit facility of up to $2 billion or the equivalent amount in Canadian currency. The credit facility, which is unsecured, has an interest rate of LIBOR plus 1.25% on drawn down amounts, and a commitment rate of 0.20% on undrawn amounts. |
In January 2012, the $2 billion facility was terminated and the $1 billion drawn was transferred to the new $4 billion facility.
| 10 | The current portion of long-term debt consists of capital leases ($78 million, 2010: $14 million), other debt obligations ($68 million, 2010: $nil) and the first credit facility ($50 million, 2010: $nil). |
Equinox Acquisition Financing
In May 2011, we entered into a credit and guarantee agreement (the “second credit facility”) with the Lenders, which required the Lenders to make available to us a credit facility of $2 billion or the equivalent amount in Canadian dollars. The second credit facility, which is unsecured, has an interest rate of LIBOR plus 1.25% on drawn down amounts, and a commitment rate of 0.20% on undrawn amounts. The second credit facility matures in 2016.
In June 2011, we drew $1 billion on the second credit facility to finance a portion of the acquisition of Equinox, including
the payment of related fees and expenses. At December 31, 2011, the undrawn amount on the second credit facility was $1 billion.
In June 2011, Barrick, and our wholly-owned subsidiary Barrick North America Finance LLC ("BNAF”), issued an aggregate of $4.0 billion in debt securities comprised of: $700 million of 1.75% notes due 2014 and $1.1 billion of 2.90% notes due 2016 issued by Barrick (collectively, the “Barrick Notes”) as well as $1.35 billion of 4.40% notes due 2021 and $850 million of 5.70% notes due 2041 issued by BNAF (collectively, the “BNAF Notes”). Barrick provides an
| | | | |
| BARRICK YEAR END 2011 | | 132 | | NOTES TO FINANCIAL STATEMENTS |
unconditional and irrevocable guarantee of the BNAF Notes. The Barrick Notes and the guarantee in respect of the BNAF Notes will rank equally with Barrick’s other unsecured and unsubordinated obligations.
The net proceeds from this offering were used in June 2011 to finance a portion of the acquisition of Equinox, including the payment of related fees and expenses.
First Credit Facility
We also have a credit and guarantee agreement (the “first credit facility”) with the Lenders, which requires the Lenders to make available to us a credit facility of up to $1.5 billion or the equivalent amount in Canadian dollars. The first credit facility, which is unsecured, has an interest rate of LIBOR plus 0.25% to 0.35% on drawn down amounts, and a commitment rate of 0.07% to 0.08% on undrawn amounts. $50 million matures in 2012 and the remaining $1.45 billion matures in 2013.
In May 2011, we drew $1.5 billion on the first credit facility to finance a portion of the acquisition of Equinox Minerals Limited, including the payment of related fees and expenses.
Pueblo Viejo Project Financing Agreement
In April 2010, Barrick and Goldcorp finalized terms for $1.035 billion (100% basis) in non-recourse project financing for Pueblo Viejo. The lending syndicate is comprised of international financial institutions including export development agencies and commercial banks. The amount is divided into three tranches of $400 million, $375 million and $260 million with tenors of 15, 15 and 12 years, respectively. The $400 million tranche bears a coupon of LIBOR+3.25% pre-completion and scales gradually to LIBOR+5.10% (inclusive of political risk insurance premium) for years 13-15. The $375 million tranche bears a fixed coupon of 4.02% for the entire 15 years. The $260 million tranche bears a coupon of LIBOR+3.25% pre-completion and scales gradually to LIBOR+4.85% (inclusive of political risk insurance premium) for years 11-12. Barrick and Goldcorp each provided a guarantee for their proportionate share which will terminate upon Pueblo Viejo meeting certain operating completion tests and are subject to an exclusion for certain political risk events. In June 2010 we received $782 million (100% basis), less financing fees of $28 million on this financing agreement by fully drawing on the $400 million and $260 million tranches and a portion of the $375 million tranche. In March 2011, we received $159 million (100% basis) less financing fees of $15 million on this financing agreement.
Redemption of Convertible Senior Debentures
On October 20, 2010 (the “Redemption Date”) we redeemed our entire outstanding Placer Dome 2.75% Convertible Senior Debentures due 2023 (the "Debentures"). The registered holders of the Debentures were to receive a redemption price of 100.825% of the principal amount outstanding, plus accrued and unpaid interest to the Redemption Date, for a total of $1,008.63 per $1,000.00 principal amount of Debentures if the conversion option was not exercised.
Effective September 1, 2010 to October 19, 2010, the conversion rate per each $1,000 principal amount of Securities was 40.9378 common shares. Substantially all the holders of these debentures exercised their right to convert these Securities into common shares. No gain or loss was recognized in the income statement on conversion.
Other Fixed Rate Notes
On October 16, 2009, we issued two tranches of debentures totaling $1.25 billion through our wholly-owned indirect subsidiary Barrick (PD) Australia Finance Pty Ltd. (“BPDAF”) consisting of $850 million of 30-year notes with a coupon rate of 5.95%, and $400 million of 10-year notes with a coupon rate of 4.95% (collectively the “Notes”). BPDAF used the proceeds to provide loans to us for settling the Gold Hedges and some of the Floating Contracts. In exchange, we provide sufficient funds to BPDAF to meet the principal and interest obligations on the notes. We also provided an unconditional and irrevocable guarantee of these payments, which will rank equally with our other unsecured and unsubordinated obligations.
On March 19, 2009, we issued an aggregate of $750 million of 10-year notes with a coupon rate of 6.95% for general corporate purposes. The notes are unsecured, unsubordinated obligations and will rank equally with our other unsecured, unsubordinated obligations.
In September, 2008, we issued an aggregate of $1.25 billion of notes through our wholly-owned indirect subsidiaries Barrick North America Finance LLC and Barrick Gold Financeco LLC (collectively the “LLCs”) consisting of $500 million of 5-year notes with a coupon rate of 6.125%, $500 million of 10-year notes with a coupon rate of 6.8%, and $250 million of 30-year notes with a coupon rate of 7.5% (collectively the “Notes”). The LLCs used the proceeds to provide loans to us. We provide sufficient funds to the LLCs to meet the principal and interest obligations on the notes. We also provided an unconditional and irrevocable guarantee of these payments, which will rank equally with our other unsecured and unsubordinated obligations.
| | | | |
| BARRICK YEAR END 2011 | | 133 | | NOTES TO FINANCIAL STATEMENTS |
Refinancing of Second Credit Facility
In January 2012, we finalized a credit and guarantee agreement with the Lenders, which required the Lenders to make available to us a credit facility of $4 billion or the equivalent amount of Canadian dollars. The credit facility, which is unsecured, has an interest rate of LIBOR plus 1.00% on drawn amounts, and a commitment rate of 0.15% on undrawn amounts. The $4 billion facility matures in 2017. Coincident with this agreement becoming effective, we terminated the $2 billion facility that was set to mature
in 2016 and transferred the $1 billion drawn on the $2 billion facility to the new $4 billion facility.
Debt Issue Costs
In 2011, a total of $34 million of debt issue costs arose from the Equinox acquisition financing. In 2010, a total of $9 million of debt issue costs arose from the non-recourse project financing for Pueblo Viejo.
Amortization of debt issue costs is calculated using the interest method over the term of each debt obligation and is classified as a component of interest cost.
Interest
| | | | | | | | | | | | | | | | | | |
| | | 2011 | | | | | 2010 | |
| For the years ended December 31 | | Interest cost | | | Effective rate1 | | | | | Interest cost | | | Effective rate1 | |
1.75%/2.9%/4.4%/5.7% notes | | | $ 88 | | | | 3.77% | | | | | | $ - | | | | 0.00% | |
5.80%/4.875% notes | | | 42 | | | | 5.63% | | | | | | 41 | | | | 5.48% | |
5.75%/6.35% notes | | | 62 | | | | 6.22% | | | | | | 62 | | | | 6.22% | |
Other fixed rate notes | | | 212 | | | | 6.27% | | | | | | 211 | | | | 6.49% | |
Convertible senior debentures | | | - | | | | - | | | | | | 2 | | | | 1.30% | |
Project financing | | | 36 | | | | 4.22% | | | | | | 16 | | | | 3.65% | |
Capital leases | | | 7 | | | | 5.03% | | | | | | 3 | | | | 4.30% | |
Other debt obligations | | | 48 | | | | 5.30% | | | | | | 47 | | | | 4.94% | |
First credit facility | | | 5 | | | | 0.56% | | | | | | - | | | | - | |
Second credit facility | | | 10 | | | | 1.62% | | | | | | - | | | | - | |
Deposit on silver sale agreement (note 26) | | | 33 | | | | 8.59% | | | | | | 19 | | | | 8.59% | |
Accretion | | | 52 | | | | | | | | | | 21 | | | | | |
Other interest | | | 12 | | | | | | | | | | 43 | | | | | |
| | | $ 607 | | | | | | | | | | $ 465 | | | | | |
Less: interest capitalized | | | (408) | | | | | | | | | | (285) | | | | | |
| | | | $ 199 | | | | | | | | | | $ 180 | | | | | |
Cash interest paid | | | $ 519 | | | | | | | | | | $ 428 | | | | | |
Amortization of debt issue costs | | | 17 | | | | | | | | | | 4 | | | | | |
Amortization of premium (discount) | | | (3) | | | | | | | | | | 2 | | | | | |
Increase in interest accruals | | | 22 | | | | | | | | | | 10 | | | | | |
Accretion | | | 52 | | | | | | | | | | 21 | | | | | |
Interest cost | | | $ 607 | | | | | | | | | | $ 465 | | | | | |
| 1 | The effective rate includes the stated interest rate under the debt agreement, amortization of debt issue costs and debt discount/premium and the impact of interest rate contracts designated in a hedging relationship with long-term debt. |
| | | | |
| BARRICK YEAR END 2011 | | 134 | | NOTES TO FINANCIAL STATEMENTS |
| | | | | | | | | | | | | | | | | | | | | | | | |
| Scheduled Debt Repayments | | | | | | | | | | | | | | | | | | |
| | | | 2012 | | | | 2013 | | | | 2014 | | | | 2015 | | | | 2016 | | |
| 2017 and
thereafter |
|
1.75%/2.9%/4.4%/5.7% notes | | | $ - | | | | $ - | | | | $ 700 | | | | $ - | | | | $ 1,100 | | | | $ 2,200 | |
5.80%/4.875% notes | | | - | | | | - | | | | 350 | | | | - | | | | - | | | | 400 | |
5.75%/6.35% notes | | | - | | | | - | | | | - | | | | - | | | | 400 | | | | 600 | |
Other fixed rate notes | | | - | | | | 500 | | | | - | | | | - | | | | - | | | | 2,750 | |
Project financing | | | - | | | | 45 | | | | 90 | | | | 90 | | | | 90 | | | | 626 | |
Other debt obligations | | | 118 | | | | 66 | | | | - | | | | 100 | | | | - | | | | 566 | |
First credit facility | | | 50 | | | | 1,450 | | | | - | | | | - | | | | | | | | - | |
Second credit facility1 | | | - | | | | - | | | | - | | | | - | | | | 1,000 | | | | - | |
| | | | $ 168 | | | | $ 2,061 | | | | $ 1,140 | | | | $ 190 | | | | $ 2,590 | | | | $ 7,142 | |
Minimum annual payments under capital leases | | | $ 28 | | | | $ 30 | | | | $ 26 | | | | $24 | | | | $ 16 | | | | $19 | |
| 1 | In January 2012 we finalized a credit and guarantee agreement with a group of banks which required the Lenders to make available to us a credit facility of up to $4 billion or the equivalent amount of Canadian dollars. Coincident with this agreement becoming effective, we terminated the $2 billion facility that was set to mature in 2016 and transferred the $1 billion drawn on the $2 billion facility to the new $4 billion facility. As a result, there are no scheduled repayments on this new facility prior to 2017 and have enough undrawn debt capacity to replace debt coming due in 2012 and 2013. |
| C | Derivative Instruments (“Derivatives”) |
In the normal course of business, our assets, liabilities and forecasted transactions, as reported in US dollars, are impacted by various market risks including, but not limited to:
| | |
Item | | Impacted by |
• Sales | | • Prices of gold, copper, oil and natural gas |
• Cost of sales | | |
¡ Consumption of diesel fuel, propane, natural gas, and electricity | | ¡ Prices of diesel fuel, propane, natural gas, and electricity |
¡ Non-US dollar expenditures | | ¡ Currency exchange rates – US dollar versus A$, ARS, C$, CLP, JPY, PGK, TZS, ZAR and ZMK |
¡ By-product credits | | ¡ Prices of silver and copper |
• Corporate and regional administration, exploration and evaluation costs | | • Currency exchange rates – US dollar versus A$, ARS, C$, CLP, JPY, PGK, TZS and ZAR |
• Capital expenditures | | |
¡ Non-US dollar capital expenditures | | ¡ Currency exchange rates – US dollar versus A$, ARS, C$, CLP, EUR and PGK |
¡ Consumption of steel | | ¡ Price of steel |
• Interest earned on cash and equivalents | | • US dollar interest rates |
• Interest paid on fixed-rate borrowings | | • US dollar interest rates |
The time frame and manner in which we manage those risks varies for each item based upon our assessment of the risk and available alternatives for mitigating risk. For these particular risks, we believe that derivatives are an appropriate way of managing the risk.
We use derivatives as part of our risk management program to mitigate variability associated with changing market values related to the hedged item. Many of the derivatives we use meet the hedge effectiveness criteria and are designated in a hedge accounting relationship.
Certain derivatives are designated as either hedges of the fair value of recognized assets or liabilities or of firm commitments (“fair value hedges”) or hedges of highly probable forecasted transactions (“cash flow hedges”), collectively known as “accounting hedges”. Hedges that are expected to be highly effective in achieving offsetting changes in fair value or cash flows are assessed on an ongoing basis to determine that they actually have been highly effective throughout the financial reporting periods for which they were designated. Some of the derivative instruments we use are effective in achieving our risk management objectives, but they do not meet the strict hedge effectiveness criteria. These derivatives are considered to be “non-hedge derivatives”. We also enter into derivative instruments with the objective of realizing trading gains to increase our reported net income. These derivatives are also considered to be “non-hedge derivatives”.
| | | | |
| BARRICK YEAR END 2011 | | 135 | | NOTES TO FINANCIAL STATEMENTS |
D Summary of Derivatives at December 31, 2011
| | | | | | | | | | | | | | | | | | | | | | | | | | | | | | | | |
| | | Notional Amount by Term to Maturity | | | Accounting Classification by Notional Amount | |
| | | Within 1 year | | | 2 to 3 years | | | 4 to 5
years | | | Total | | | Cash flow
hedge | | | Fair
value
hedge | | | Non-
Hedge | | | Fair
value
(USD) | |
US dollar interest rate contracts | | | | | | | | | | | | | | | | | | | | | | | | | | | | | | | | |
Total receive - fixed swap positions | | | $ - | | | | $ 200 | | | | $ - | | | | $ 200 | | | | $ - | | | | $ 200 | | | | $ - | | | | $ 7 | |
Currency contracts | | | | | | | | | | | | | | | | | | | | | | | | | | | | | | | | |
A$:US$ contracts (A$ millions) | | | 2,057 | | | | 1,640 | | | | 774 | | | | 4,471 | | | | 4,071 | | | | - | | | | 400 | | | | 610 | |
C$:US$ contracts (C$ millions) | | | 935 | | | | 304 | | | | - | | | | 1,239 | | | | 767 | | | | - | | | | 472 | | | | 2 | |
CLP:US$ contracts (CLP millions)1 | | | 289,789 | | | | 510,341 | | | | - | | | | 800,130 | | | | 161,670 | | | | - | | | | 638,460 | | | | (29) | |
EUR:US$ contracts (EUR millions) | | | 35 | | | | - | | | | - | | | | 35 | | | | 35 | | | | - | | | | - | | | | (3) | |
PGK:US$ contracts (PGK millions) | | | 40 | | | | - | | | | - | | | | 40 | | | | - | | | | - | | | | 40 | | | | - | |
ZAR:US$ contracts (ZAR millions) | | | 416 | | | | 94 | | | | - | | | | 510 | | | | - | | | | - | | | | 510 | | | | 1 | |
| | | | | | | | | |
Commodity contracts | | | | | | | | | | | | | | | | | | | | | | | | | | | | | | | | |
Copper collar sell contracts (millions of pounds) | | | 249 | | | | - | | | | - | | | | 249 | | | | 238 | | | | - | | | | 11 | | | | 129 | |
| Copper bought floor contracts (millions of pounds) | | | 40 | | | | - | | | | - | | | | 40 | | | | 40 | | | | - | | | | - | | | | 21 | |
| Copper bought call contracts (millions of pounds) | | | 238 | | | | - | | | | - | | | | 238 | | | | - | | | | - | | | | 238 | | | | 5 | |
| Silver collar sell contracts (millions of ounces) | | | - | | | | 15 | | | | 30 | | | | 45 | | | | 45 | | | | - | | | | - | | | | 115 | |
| Diesel contracts (thousands of barrels)2 | | | 1,939 | | | | 3,043 | | | | - | | | | 4,982 | | | | 3,552 | | | | - | | | | 1,430 | | | | 37 | |
| Propane contracts (millions of gallons) | | | 4 | | | | - | | | | - | | | | 4 | | | | 4 | | | | - | | | | - | | | | 2 | |
| Electricity contracts (thousands of megawatt hours) | | | 35 | | | | 22 | | | | - | | | | 57 | | | | - | | | | - | | | | 57 | | | | 1 | |
| 1 | Non-hedge contracts economically hedge pre-production capital expenditures at our Pascua-Lama project and operating/administration costs at various South American locations. |
| 2 | Diesel commodity contracts represent a combination of WTI, BRENT, ULSD and BRENT/WTI spread swaps, WTB, MOPS and JET hedge contracts. These derivatives hedge physical supply contracts based on the price of ULSD, WTB, MOPS and JET, respectively, plus a spread. WTI represents West Texas Intermediate, BRENT represents Brent Crude Oil, WTB represents Waterborne, MOPS represents Mean of Platts Singapore, JET represents Jet Fuel, ULSD represents Ultra Low Sulfur Diesel US Gulf Coast. |
| | | | |
| BARRICK YEAR END 2011 | | 136 | | NOTES TO FINANCIAL STATEMENTS |
Fair Values of Derivative Instruments
| | | | | | | | | | | | | | | | | | | | | | | | | | | | | | | | |
| | | Asset Derivatives | | | Liability Derivatives | |
| | | Balance Sheet
Classification | | | Fair Value as at
December 31,
2011 | | | Fair Value
as at
December 31,
2010 | | | Fair Value
as at
January 1,
2010 | | | Balance Sheet
Classification | | | Fair Value
as at
December 31,
2011 | | | Fair Value
as at
December 31,
2010 | | | Fair Value
as at
January 1,
2010 | |
| Derivatives designated as hedging instruments | | | | | | | | | | | | | | | | | | | | | | | | | | | | | | | | |
US dollar interest rate contracts | | | Other assets | | | | $ 7 | | | | $ 6 | | | | $ - | | | | Other liabilities | | | | $ - | | | | $ - | | | | $ - | |
Currency contracts | | | Other assets | | | | 629 | | | | 831 | | | | 374 | | | | Other liabilities | | | | 26 | | | | 1 | | | | 9 | |
Commodity contracts | | | Other assets | | | | 312 | | | | 112 | | | | 53 | | | | Other liabilities | | | | 6 | | | | 192 | | | | 131 | |
| Total derivatives classified as hedging instruments | | | | | | | $ 948 | | | | $ 949 | | | | $ 427 | | | | | | | | $ 32 | | | | $ 193 | | | | $ 140 | |
| Derivatives not designated as hedging instruments | | | | | | | | | | | | | | | | | | | | | | | | | | | | | | | | |
US dollar interest rate contracts | | | Other assets | | | | $ - | | | | $ - | | | | $ 1 | | | | Other liabilities | | | | $ - | | | | $ 5 | | | | $ 7 | |
Currency contracts | | | Other assets | | | | 4 | | | | 30 | | | | 15 | | | | Other liabilities | | | | 26 | | | | 7 | | | | 9 | |
Commodity contracts | | | Other assets | | | | 10 | | | | 147 | | | | 61 | | | | Other liabilities | | | | 6 | | | | 73 | | | | 43 | |
| Total derivatives not designated as hedging instruments | | | | | | | $ 14 | | | | $ 177 | | | | $ 77 | | | | | | | | $ 32 | | | | $ 85 | | | | $ 59 | |
Total derivatives | | | | | | | $ 962 | | | | $ 1,126 | | | | $ 504 | | | | | | | | $ 64 | | | | $ 278 | | | | $ 199 | |
US Dollar Interest Rate Contracts
Fair Value Hedges
We have a $200 million receive fixed swap position outstanding that is used to hedge changes in the fair value of a portion of our long-term fixed-rate debt. The effective portion of changes in the fair value of the swap contracts is recorded in interest expense. Gains and losses from hedge ineffectiveness are recognized in current earnings, classified in the consolidated statement of income as gains/(losses) on non-hedge derivatives.
Currency Contracts
Cash Flow Hedges
During the year, currency contracts totaling A$ 1,693 million, CAD$ 522 million, EUR 25 million, and CLP 162 billion have been designated against forecasted non-US dollar denominated expenditures, some of which are hedges which matured within the year. In total, we have AUD$ 4,071 million, CAD$ 767 million, EUR 35 million, and CLP 162 billion designated as cash flow hedges of our anticipated operating, administrative, sustaining capital and project capital spend. The outstanding contracts hedge the variability of the US dollar amount of those expenditures caused by changes in currency exchange rates over the next five years. The effective portion of changes in fair value of the currency contracts is recorded in OCI until the forecasted expenditure impacts earnings. Gains and losses from hedge ineffectiveness are recognized in current earnings classified in the consolidated statement of income as gains (losses) on non-hedge derivatives.
Non-hedge Derivatives
We concluded that CLP 638 billion of derivatives contracts do not meet the strict hedge effectiveness criteria. These contracts represent an economic hedge of operating and administrative expenses at various South America locations, and pre-production capital expenditures at our Pascua Lama and Cerro Casale projects. Also, ZAR 510 million represents an economic hedge of our anticipated operating and administrative spending at various locations in Africa. Although not qualifying as accounting hedges, the contracts protect us against the variability of CLP and ZAR to the US dollar. The remaining non-hedge currency contracts are used to mitigate the variability of the US dollar amount of non-US dollar denominated exposures that do not meet the strict hedge effectiveness criteria. Changes in the fair value of the non-hedge currency contracts are recorded in the consolidated statement of income as gains (losses) on non-hedge derivatives.
During the year, we wrote a combination of AUD put and call options with an outstanding notional amount of AUD $400 million at December 31, 2011. We also wrote CAD put option contracts with an outstanding notional amount of CAD $445 million at December 31, 2011. As a result of these activities we earned $30 million in premium income, recognized in the consolidated statement of income as gains on non-hedge derivatives.
| | | | |
| BARRICK YEAR END 2011 | | 137 | | NOTES TO FINANCIAL STATEMENTS |
Commodity Contracts
Diesel/Propane/Electricity/Natural Gas
Cash Flow Hedges
In total, we have fuel contracts totaling 2,793 thousand barrels of diesel, 759 thousand barrels of Brent crude, and 4 million gallons of propane designated as cash flow hedges of our anticipated usage of fuels in our operations. The designated contracts act as a hedge against the variability in market prices. The effective portion of changes in the fair value of the commodity contracts is recorded in OCI until the forecasted transaction impacts earnings. Gains and losses from hedge ineffectiveness are recognized in current earnings, classified in the consolidated statement of income as gains (losses) on non-hedge derivatives.
Non-hedge Derivatives
As a result of de-designating all existing WTI contracts on January 1, 2011 due to a change in our diesel fuel supply contract, we currently have $26 million of crystallized gains in OCI as at December 31, 2011, remaining from the original total of $35 million. The hedged item is still expected to occur and therefore amounts crystallized in OCI will be recorded in cost of sales when the originally designated exposures occur over the next 24 months. During the year, we entered into 1,340 thousand barrels of WTI, and 480 thousand barrels of Brent-WTI swaps to economically hedge our exposure to forecasted fuel purchases for expected consumption at our mines.
Non-hedge electricity contracts of 57 thousand megawatt hours are used to mitigate the risk of price changes on electricity consumption at Barrick Energy. Although not qualifying as an accounting hedge, the contracts protect Barrick to a significant extent from the effects of changes in electricity prices. Changes in the unrealized and realized fair value of non-hedge electricity contracts are recognized in the consolidated statement of income as gains (losses) on non-hedge derivatives.
During the year, we wrote two million barrels of WTI put options all of which have expired. As a result of this activity, we recorded $4 million in realized gains on premiums recognized in the consolidated statement of income as gains (losses) on non-hedge derivatives.
Metals Contracts
Cash Flow Hedges
During the year, we purchased 238 million pounds of copper collar contracts to designate as hedges against copper cathode sales at our Zaldivar mine in 2012. These contracts contain purchased put and sold call options with weighted average strike prices of $3.75/lb and $5.50/lb, respectively. In addition, we purchased 40 million pounds
of copper floors with a weighted average strike price of $3.74/lb. We paid premiums of $71 million to purchase these contracts. These contracts were designated as cash flow hedges, with the effective portion of the hedge recognized in AOCI and the ineffective portion, together with the changes in time value, recognized in non-hedge derivative gains (losses). These contracts mature evenly throughout 2012.
Silver collar contracts totaling 45 million ounces have been designated as hedges against silver bullion sales from our silver producing mines. These contracts contain purchased put and sold call options with weighted average strike prices of $23/oz and $57/oz, respectively.
Our copper and silver collar contracts have been designated as accounting hedges and the effective portion of changes in fair value of these contracts is recorded in OCI until the forecasted sale impacts earnings. Any changes in the fair value of collar contracts due to changes in time value are excluded from hedge effectiveness assessment and are consequently recognized in the consolidated statement of income. Provided that spot copper and silver prices remain within the collar band, any unrealized gain (loss) on the collar will be attributable to time value.
During the year, we recorded unrealized gains on our copper collars and silver collars of $94 million and $64 million, respectively, due to changes in time value. This was included in current period earnings as gains on non-hedge derivative activities. Gains and losses from hedge ineffectiveness and the excluded time value of options are recognized in the consolidated statement of income as gains on non-hedge derivatives.
Non-Hedge Derivatives
We have purchased call options outstanding to economically remove the cap of $5.50/lb on the entire 238 million pounds of copper collars. Premiums of $6 million were paid to purchase these contracts. These contracts mature evenly throughout 2012. Changes in the unrealized and realized fair value of these copper positions are recognized in the consolidated statement of income as gains (losses) on non-hedge derivatives.
We enter into purchased and written contracts with the primary objective of increasing the realized price on our gold sales. During the year, we held net purchased gold long forward positions with an average outstanding notional of 0.3 million ounces. We also wrote gold put and call options with an average outstanding notional of 0.1 million and 0.1 million ounces, respectively. As a result of
| | | | |
| BARRICK YEAR END 2011 | | 138 | | NOTES TO FINANCIAL STATEMENTS |
these activities, we recorded realized gains of $43 million in the consolidated statement of income as gains on non-
hedge derivatives. There are no outstanding gold positions at December 31, 2011.
Cash Flow Hedge Gains (Losses) in AOCI
| | | | | | | | | | | | | | | | | | | | | | | | | | | | | | | | | | | | |
| | | Commodity price hedges | | | | | Currency hedges | | | | | Interest rate hedges | | | | |
| | | Gold/Silver1 | | | Copper | | | Fuel | | | | | Operating
costs | | | Administration/other
costs | | | Capital
expenditures | | | | | Long-
term
debt | | | Total | |
At January 1, 2010 | | | $ 3 | | | | $ (33) | | | | $ (4) | | | | | | $ 309 | | | | $ 19 | | | | $ 25 | | | | | | $ (30) | | | | $ 289 | |
Effective portion of change in fair value of hedging instruments | | | - | | | | (41) | | | | 29 | | | | | | 552 | | | | 56 | | | | 53 | | | | | | - | | | | 649 | |
Transfers to earnings: | | | | | | | | | | | | | | | | | | | | | | | | | | | | | | | | | | | | |
On recording hedged items in earnings | | | (2) | | | | 54 | | | | 26 | | | | | | (145) | | | | (33 | ) | | | (13) | | | | | | 3 | | | | (110) | |
At December 31, 2010 | | | $ 1 | | | | $ (20) | | | | $ 51 | | | | | | $ 716 | | | | $ 42 | | | | $ 65 | | | | | | $ (27) | | | | $ 828 | |
| Effective portion of change in fair value of hedging instruments | | | 46 | | | | 128 | | | | 26 | | | | | | 200 | | | | 1 | | | | 17 | | | | | | (7) | | | | 411 | |
Transfers to earnings: | | | | | | | | | | | | | | | | | | | | | | | | | | | | | | | | | | | | |
| On recording hedged items in earnings/PP&E1 | | | (3 | ) | | | (22 | ) | | | (48) | | | | | | (344 | ) | | | (24 | ) | | | (64) | | | | | | 3 | | | | (502) | |
| Hedge ineffectiveness due to changes in original forecasted transaction | | | - | | | | (4 | ) | | | - | | | | | | - | | | | - | | | | - | | | | | | - | | | | (4) | |
At December 31, 2011 | | | $ 44 | | | | $ 82 | | | | $29 | | | | | | $ 572 | | | | $ 19 | | | | $ 18 | | | | | | $ (31) | | | | $ 733 | |
| | | | | | | | | | | |
| | | | | | | | | | | | | | | | | | | | | | | | | | | | | | | | | | | | | |
| Hedge gains/losses classified within | | Cost of
sales | | | Copper
sales | | | Cost of
sales | | | | | Cost of
sales | | | Administration/other
expense | | | Property,
plant, and
equipment | | | | | Interest
expense | | | | |
| Portion of hedge gain (loss) expected to affect 2012 earnings2 | | | $ - | | | | $ 82 | | | | $ 20 | | | | | | $ 278 | | | | $ 19 | | | | $ 7 | | | | | | $ (3) | | | | $ 403 | |
| 1 | Realized gains (losses) on qualifying currency hedges of capital expenditures are transferred from OCI to PP&E on settlement. |
| 2 | Based on the fair value of hedge contracts at December 31, 2011. |
Cash Flow Hedge Gains (Losses) at December 31
| | | | | | | | | | | | | | | | | | | | | | | | | | | | |
Derivatives in cash flow hedging relationships | | Amount of gain (loss) recognized in
OCI | | | Location of gain (loss)
transferred from OCI into
income/PP&E (effective
portion) | | Amount of gain
(loss) transferred
from OCI into
income (effective
portion) | | | Location of gain (loss)
recognized in income (ineffective
portion and amount excluded
from effectiveness testing) | | Amount of gain
(loss) recognized in income
(ineffective portion
and amount
excluded from
effectiveness testing) | |
| | | 2011 | | | 2010 | | | | | 2011 | | | 2010 | | | | | 2011 | | | 2010 | |
Interest rate | | | | | | | | | | Finance income/finance | | | | | | | | | | Gain (loss) on non-hedge | | | | | | | | |
contracts | | | $ (7) | | | | $ - | | | costs | | | $ (3) | | | | $ (3) | | | derivatives | | | $ - | | | | $ 3 | |
Foreign exchange | | | | | | | | | | Cost of sales/corporate | | | | | | | | | | Gain (loss) on non-hedge | | | | | | | | |
contracts | | | 218 | | | | 661 | | | administration | | | 432 | | | | 191 | | | derivatives | | | (2) | | | | - | |
Commodity | | | | | | | | | | | | | | | | | | | | Gain (loss) on non-hedge | | | | | | | | |
contracts | | | 200 | | | | (12) | | | Revenue/cost of sales | | | 73 | | | | (78) | | | derivatives | | | 168 | | | | (25) | |
Total | | | $ 411 | | | | $ 649 | | | | | | $ 502 | | | | $ 110 | | | | | | $ 166 | | | | $ (22) | |
Fair Value Hedge Gains at December 31
| | | | | | |
| Derivatives in fair value hedging relationships | | Location of gain (loss) recognized in income on derivative | | Amount of gain (loss) recognized in income
on derivative |
| | | | | 2011 | | 2010 |
Interest rate contracts | | Interest income/expense | | $ 2 | | $ 5 |
| | | | |
| BARRICK YEAR END 2011 | | 139 | | NOTES TO FINANCIAL STATEMENTS |
| | | | | | | | |
E Gains (Losses) on Non-hedge Derivatives | |
| For the years ended December 31 | | 2011 | | | 2010 | |
Gains (losses) on non-hedge derivatives | | | | | | | | |
Commodity contracts | | | | | | | | |
Gold | | | $ 43 | | | | $ 26 | |
Copper | | | (85) | | | | 41 | |
Fuel | | | (1) | | | | - | |
Currency contracts | | | (48) | | | | 29 | |
Interest rate contracts | | | 6 | | | | (2) | |
| | | | $ (85) | | | | $ 94 | |
| | |
Gains (losses) attributable to silver option collar hedges1 | | | $ 64 | | | | $ (15) | |
Gains (losses) attributable to copper option collar hedges1 | | | 94 | | | | (19) | |
Gains (losses) attributable to currency option collar hedges1 | | | (2) | | | | (4) | |
Hedge ineffectiveness | | | 10 | | | | 13 | |
| | | | $ 166 | | | | $ (25) | |
| | | | $ 81 | | | | $ 69 | |
| 1 | Represents unrealized gains (losses) attributable to changes in time value of the collars, which are excluded from the hedge effectiveness assessment. |
| | | | | | | | |
F Derivative Assets and Liabilities | | | | | | |
| | | 2011 | | | 2010 | |
At January 1 | | | $ 848 | | | | $ 305 | |
Derivatives cash (inflow) outflow | | | | | | | | |
Operating activities | | | (428) | | | | (168) | |
Financing activities | | | 7 | | | | (12) | |
Change in fair value of: | | | | | | | | |
Non-hedge derivatives | | | (85) | | | | 103 | |
Cash flow hedges: | | | | | | | | |
Effective portion | | | 411 | | | | 635 | |
Ineffective portion | | | - | | | | 14 | |
Fair value hedges | | | (21) | | | | 5 | |
Excluded from effectiveness changes | | | 166 | | | | (34) | |
At December 31 | | | $ 898 | | | | $ 848 | |
Classification: | | | | | | | | |
Other current assets | | | $ 507 | | | | $ 615 | |
Other long-term assets | | | 455 | | | | 511 | |
Other current liabilities | | | (22) | | | | (173) | |
Other long-term obligations | | | (42) | | | | (105) | |
| | | | $ 898 | | | | $ 848 | |
| | | | |
| BARRICK YEAR END 2011 | | 140 | | NOTES TO FINANCIAL STATEMENTS |
23 > FAIR VALUE MEASUREMENTS
Fair value is the price that would be received to sell an asset or paid to transfer a liability in an orderly transaction between market participants at the measurement date. The fair value hierarchy establishes three levels to classify the inputs to valuation techniques used to measure fair value. Level 1 inputs are quoted prices (unadjusted) in active markets for identical assets or liabilities. Level 2 inputs are quoted prices in markets that are not active, quoted prices for similar assets or liabilities in active markets, inputs other than quoted prices that are
observable for the asset or liability (for example, interest rate and yield curves observable at commonly quoted intervals, forward pricing curves used to value currency and commodity contracts and volatility measurements used to value option contracts), or inputs that are derived principally from or corroborated by observable market data or other means. Level 3 inputs are unobservable (supported by little or no market activity). The fair value hierarchy gives the highest priority to Level 1 inputs and the lowest priority to Level 3 inputs.
| | | | | | | | | | | | |
A Assets and Liabilities Measured at Fair Value on a Recurring Basis | |
| Fair Value Measurements at December 31, 2011 | |
| | | Quoted Prices in Active Markets for Identical Assets
(Level 1) | | Significant Other
Observable Inputs (Level 2) | | | Significant Unobservable Inputs (Level 3) | | Aggregate Fair Value | |
| | | | |
Cash and equivalents | | $ 2,745 | | | $ - | | | $ - | | | $ 2,745 | |
Available-for-sale securities | | 161 | | | - | | | - | | | 161 | |
Derivatives | | - | | | 898 | | | - | | | 898 | |
Receivables from provisional copper and gold sales | | - | | | 206 | | | - | | | 206 | |
| | | $ 2,906 | | | $ 1,104 | | | $ - | | | $ 4,010 | |
| | | | | | | | | | | | | | | | | | | | | | | | |
| B Fair Values of Financial Assets and Liabilities | |
| | | At December 31, 2011 | | | At December 31, 2010 | | | At January 1, 2010 | |
| | | Carrying amount | | | Estimated fair value | | | Carrying amount | | | Estimated fair value | | | Carrying amount | | | Estimated fair value | |
| | | | | | |
Financial assets | | | | | | | | | | | | | | | | | | | | | | | | |
Cash and equivalents1 | | | $ 2,745 | | | | $ 2,745 | | | | $3,968 | | | | $ 3,968 | | | | $ 2,564 | | | | $ 2,564 | |
Accounts receivable1 | | | 426 | | | | 426 | | | | 370 | | | | 370 | | | | 259 | | | | 259 | |
Other receivables | | | 743 | | | | 743 | | | | 623 | | | | 623 | | | | 472 | | | | 472 | |
Available-for-sale securities2 | | | 161 | | | | 161 | | | | 171 | | | | 171 | | | | 62 | | | | 62 | |
Derivative assets | | | 962 | | | | 962 | | | | 1,126 | | | | 1,126 | | | | 504 | | | | 504 | |
| | | | $ 5,037 | | | | $ 5,037 | | | | $6,258 | | | | $ 6,258 | | | | $ 3,861 | | | | $ 3,861 | |
Financial liabilities | | | | | | | | | | | | | | | | | | | | | | | | |
Accounts payable1 | | | $ 2,083 | | | | $ 2,083 | | | | $1,511 | | �� | | $ 1,511 | | | | $ 1,221 | | | | $ 1,221 | |
Long-term debt3 | | | 13,369 | | | | 14,374 | | | | 6,638 | | | | 7,070 | | | | 6,178 | | | | 6,723 | |
Derivative liabilities | | | 64 | | | | 64 | | | | 278 | | | | 278 | | | | 199 | | | | 199 | |
Other liabilities | | | 202 | | | | 202 | | | | 111 | | | | 111 | | | | 8 | | | | 8 | |
Settlement obligation to close out gold sales contracts | | | - | | | | - | | | | - | | | | - | | | | 647 | | | | 647 | |
Pension liabilities | | | 136 | | | | 136 | | | | 111 | | | | 111 | | | | 109 | | | | 109 | |
Stock-based payments4 | | | 57 | | | | 57 | | | | 80 | | | | 80 | | | | 56 | | | | 56 | |
| | | | $ 15,911 | | | | $16,916 | | | | $ 8,729 | | | | $ 9,161 | | | | $ 8,418 | | | | $ 8,963 | |
| 1 | Fair value approximates the carrying amounts due to the short-term nature and historically negligible credit losses. |
| 2 | Recorded at fair value. Quoted market prices are used to determine fair value. |
| 3 | Long-term debt is generally recorded at amortized cost except for obligations that are designated in a fair-value hedge relationship, in which case the carrying amount is adjusted for changes in fair value of the hedging instrument in periods when a hedge relationship exists. The fair value of long-term debt is primarily determined using quoted market prices. Balance includes current portion of long-term debt. |
| 4 | Recorded at fair value based on our period-end closing market share price. |
| | | | |
| BARRICK YEAR END 2011 | | 141 | | NOTES TO FINANCIAL STATEMENTS |
| C | Assets Measured at Fair Value on a Non-Recurring Basis |
| | | | | | | | | | | | | | | | |
| | |
| Quoted prices in active markets
for identical assets
(Level 1) |
| |
| Significant other observable
inputs
(Level 2) |
| |
| Significant unobservable
inputs
(Level 3) |
| | | Aggregate fair value | |
Property, plant and equipment1 | | | $ - | | | | $ - | | | | $ 430 | | | | $ 430 | |
| 1 | Property, plant and equipment with a carrying amount of $562 million were written down to their fair value of $430 million, resulting in an impairment of $132 million, which was included in earnings this period. |
Valuation Techniques
Cash Equivalents
The fair value of our cash equivalents is classified within Level 1 of the fair value hierarchy because they are valued using quoted market prices in active markets. Our cash equivalents are comprised of U.S. Treasury bills and money market securities that are invested primarily in U.S. Treasury bills.
Available-for-Sale Securities
The fair value of available-for-sale securities is determined based on a market approach reflecting the closing price of each particular security at the balance sheet date. The closing price is a quoted market price obtained from the exchange that is the principal active market for the particular security, and therefore available-for-sale securities are classified within Level 1 of the fair value hierarchy.
Derivative Instruments
The fair value of derivative instruments is determined using either present value techniques or option pricing models that utilize a variety of inputs that are a combination of quoted prices and market-corroborated inputs. The fair values of all our derivative contracts include an adjustment for credit risk. For counterparties in a net asset position, credit risk is based upon the observed credit default swap spread for each particular counterparty, as appropriate. For counterparties in a net liability position, credit risk is based upon Barrick’s observed credit default swap spread. The fair value of US dollar interest rate and currency swap contracts is determined by discounting contracted cash flows using a discount rate derived from observed LIBOR and swap rate curves and CDS rates. In the case of currency contracts, we convert non-US dollar cash flows into US dollars using an exchange rate derived from currency swap curves and CDS rates. The fair value of commodity forward contracts is determined by discounting contractual cash flows using a discount rate derived from observed LIBOR and swap rate curves and CDS rates. Contractual cash flows are calculated using a forward pricing curve derived from observed forward prices for each commodity. Derivative instruments are classified within Level 2 of the fair value hierarchy.
Receivables from Provisional Copper and Gold Sales
The fair value of receivables rising from copper and gold sales contracts that contain provisional pricing mechanisms is determined using the appropriate quoted forward price from the exchange that is the principal active market for the particular metal. As such, these receivables are classified within Level 2 of the fair value hierarchy.
Property, Plant and Equipment
The fair value of property, plant and equipment is determined primarily using an income approach based on unobservable cash flows and, as a result are classified within Level 3 of the fair value hierarchy. Refer to note 17.
24 > PROVISIONS AND ENVIRONMENTAL REHABILITATION
| | | | | | | | | | | | |
A Provisions | | | | | | | | | |
| | |
| As at
December 31,
2011 |
| |
| As at
December 31,
2010 |
| |
| As at
January 1,
2010 |
|
Environmental rehabilitation | | | $ 2,080 | | | | $ 1,533 | | | | $ 1,191 | |
Pension benefits | | | 124 | | | | 103 | | | | 96 | |
Other post-retirement benefits | | | 22 | | | | 25 | | | | 26 | |
RSUs | | | 22 | | | | 20 | | | | 23 | |
Other | | | 78 | | | | 87 | | | | 72 | |
| | | | $ 2,326 | | | | $ 1,768 | | | | $ 1,408 | |
| | | | |
| BARRICK YEAR END 2011 | | 142 | | NOTES TO FINANCIAL STATEMENTS |
| | | | | | | | |
| B Environmental Rehabilitation | |
| | | 2011 | | | 2010 | |
At January 1 | | | $ 1,621 | | | | $ 1,301 | |
PERs acquired (divested) during the year | | | 67 | | | | (25) | |
PERs arising in the year | | | 391 | | | | 332 | |
Impact of revisions to expected cash flows recorded in earnings | | | 75 | | | | 39 | |
Settlements | | | | | | | | |
Cash payments | | | (44) | | | | (44) | |
Settlement gains | | | (3) | | | | (3) | |
Accretion | | | 52 | | | | 21 | |
At December 31 | | | 2,159 | | | | 1,621 | |
Current portion (note 21) | | | (79) | | | | (88) | |
| | | | $ 2,080 | | | | $ 1,533 | |
The eventual settlement of all PERs is expected to take place between 2012 and 2052.
The PER has increased from the third quarter 2011 by $223 million primarily due to changes in discount rates and PER’s acquired in acquisitions.
| | | | | | | | |
| At December 31 | | 2011 | | | 2010 | |
| Operating mines and development properties | | | | | | | | |
PER increase1 | | | $ 434 | | | | $295 | |
Closed mines | | | | | | | | |
PER increase2 | | | 79 | | | | 41 | |
Barrick Energy | | | | | | | | |
PER increase1 | | | 33 | | | | 15 | |
| 1 | 2011 increase includes discount rate adjustments of $205 million, accretion of $89 million, an increase due to the acquisition of the Lumwana mine of $53 million, and accretion of $38 million. |
| 2 | For closed mines, any change in the fair value of PER results in a corresponding charge or credit to other expense or other income, respectively. |
25 > FINANCIAL RISK MANAGEMENT
Our financial instruments are comprised of financial liabilities and financial assets. Our principal financial liabilities, other than derivatives, comprise accounts payable and debt. The main purpose of these financial instruments is to manage short-term cash flow and raise funds for our capital expenditure program. Our principal financial assets, other than derivative instruments, are cash and equivalents and accounts receivable, which arise directly from our operations. In the normal course of business, we use derivative instruments to mitigate exposure to various financial risks.
We manage our exposure to key financial risks in accordance with our financial risk management policy. The
objective of the policy is to support the delivery of our financial targets while protecting future financial security. The main risks that could adversely affect our financial assets, liabilities or future cash flows are as follows:
| a) | Market risk, including commodity price risk, foreign currency and interest rate risk; |
| d) | Capital risk management. |
Management designs strategies for managing each of these risks, which are summarized below. Our senior management oversees the management of financial risks. Our senior management ensures that our financial risk-taking activities are governed by appropriate policies and procedures and that financial risks are identified, measured and managed in accordance with our policies and our risk appetite. All derivative activities for risk management purposes are carried out by functions that have the appropriate skills, experience and supervision.
a) Market Risk
Market risk is the risk that changes in market factors, such as commodity prices, foreign exchange rates or interest rates, will affect the value of our financial instruments. We manage market risk by either accepting it or mitigating it through the use of derivatives and other economic hedging strategies.
Commodity Price Risk
Gold and Copper
We sell our gold and copper production in the world market. The market prices of gold and copper are the primary drivers of our profitability and ability to generate free cash flow. All of our future gold production is un-hedged in order to provide our shareholders with full exposure to changes in the market gold price. Our corporate treasury function implements hedging strategies on an opportunistic basis to protect us from downside price risk on our copper production. We have put in place floor protection on approximately half of our expected copper production for 2012 at an average price of $3.75 per pound and have full participation to any upside in copper prices. Our remaining copper production is subject to market prices.
Silver
We expect to produce significant amounts of silver as Pascua-Lama enters production in 2013. We utilize option collar strategies, whereby we have hedge protection on a total of 45 million ounces of expected silver production from 2013 to 2018, inclusive, to provide downside price risk protection on a portion of this future silver production.
| | | | |
| BARRICK YEAR END 2011 | | 143 | | NOTES TO FINANCIAL STATEMENTS |
Currently, changes in the market silver price only have a significant impact on the fair value of these collars.
Fuel
On average we consume approximately 4.5 million barrels of diesel fuel annually across all our mines. Diesel fuel is refined from crude oil and is therefore subject to the same price volatility affecting crude oil prices. Therefore, volatility in crude oil prices has a significant direct and indirect impact on our production costs. To mitigate this volatility, we employ a strategy of combining the use of financial contracts and our production from Barrick Energy to effectively hedge our exposure to oil prices.
The table below summarizes the impact of changes in the market price on gold, copper, silver and oil. The impact is expressed in terms of the resulting change in our profit after tax for the year or, where applicable, the change in equity. The sensitivities are based on the assumption that the market price changes by ten per cent with all other variables held constant.
Impact of a 10% change from year-end price
| | | | | | | | | | | | | | | | |
| | | Effect on Earnings | | | Effect on Equity | |
| Products | | 2011 | | | 2010 | | | 2011 | | | 2010 | |
10% increase in gold price | | | $ 776 | | | | $ 650 | | | | $ 776 | | | | $ 650 | |
10% increase in copper price | | | 143 | | | | 101 | | | | 46 | | | | 53 | |
10% increase in silver price1 | | | (42) | | | | (21) | | | | (21) | | | | 1 | |
10% increase in oil price | | | 10 | | | | 8 | | | | (1) | | | | (2) | |
| | | | | | | | | | | | | | | | |
| | | Effect on Earnings | | | Effect on Equity | |
| Products | | 2011 | | | 2010 | | | 2011 | | | 2010 | |
10% decrease in gold price | | | $ (776) | | | | $ (650) | | | | $ (776) | | | | $ (650) | |
10% decrease in copper price | | | (130) | | | | (84) | | | | (47) | | | | (80) | |
10% decrease in silver price1 | | | 32 | | | | 20 | | | | 30 | | | | (1) | |
10% decrease in oil price | | | (10) | | | | (8) | | | | 1 | | | | 2 | |
| 1 | Represents unrealized gains (losses) attributable to changes in fair value of the silver collars. |
Foreign Currency Risk
The functional and reporting currency for our gold and copper segments and capital projects is the US dollar, while the functional currency of our oil and gas segment is the Canadian dollar. We report our results using the US dollar. The majority of our operating and capital expenditures are denominated and settled in US dollars. The largest single exposure we have is to the Australian dollar. We also have exposure to the Canadian dollar through a combination of Canadian mine operating costs and corporate
administration costs; and to the Papua New Guinea kina, Peruvian sol, Chilean peso, Argentinean peso and Zambian Kwacha through mine operating costs. Consequently, fluctuations in the US dollar exchange rate against these currencies increase the volatility of cost of sales, corporate administration costs and overall net earnings, when translated into US dollars. To mitigate these inherent risks and provide greater certainty over our costs, we have foreign currency hedges in place for substantially all of our Australian and Canadian dollar exposures as well as a significant portion of our Chilean peso exposures. Consequently, the residual risk of foreign exchange fluctuations on our net earnings and financial position is not significant.
Interest Rate Risk
Interest rate risk refers to the risk that the value of a financial instrument or cash flows associated with the instruments will fluctuate due to changes in market interest rates. Currently, our interest rate exposure mainly relates to interest receipts on our cash balances ($2.7 billion at the end of the year); the mark-to market value of derivative instruments; the fair value and ongoing payments under US dollar interest-rate swaps; and to the interest payments on our variable-rate debt ($3.6 billion at December 31, 2011).
The following table shows the approximate interest rate sensitivities of our financial assets and liabilities as at December 31:
| | | | | | | | | | | | | | | | |
| Impact of a 1% change in interest rate | |
| | | Effect on Net Earnings | | | Effect on Equity | |
| | | 2011 | | | 2010 | | | 2011 | | | 2010 | |
1% increase | | | 16 | | | | 30 | | | | 16 | | | | 30 | |
1% decrease | | | (16 | ) | | | (30 | ) | | | (16 | ) | | | (30 | ) |
b) Credit Risk
Credit risk is the risk that a third party might fail to fulfill its performance obligations under the terms of a financial instrument. Credit risk arises from cash and equivalents, trade and other receivables as well as derivative assets. For cash and equivalents and trade and other receivables, credit risk exposure equals the carrying amount on the balance sheet, net of any overdraft positions. To mitigate our inherent exposure to credit risk we maintain policies to limit the concentration of credit risk, review counterparty creditworthiness on a monthly basis, and ensure liquidity of available funds. We also invest our cash and equivalents in highly rated financial institutions, primarily within the United States and other investment grade countries1.
| | | | |
| BARRICK YEAR END 2011 | | 144 | | NOTES TO FINANCIAL STATEMENTS |
Furthermore, we sell our gold and copper production into the world market and to private customers with strong credit ratings. Historically customer defaults have not had a significant impact on our operating results or financial position.
For derivatives with a positive fair value, we are exposed to credit risk equal to the carrying value. When the fair value of a derivative is negative, we assume no credit risk. We mitigate credit risk on derivatives by:
| • | | Entering into derivatives with high credit-quality counterparties; |
| • | | Limiting the amount of net exposure with each counterparty; and |
| • | | Monitoring the financial condition of counterparties on a regular basis. |
The company’s maximum exposure to credit risk at the reporting date is the carrying value of each of the financial assets disclosed as follows:
| | | | | | | | |
| At December 31 | | 2011 | | | 2010 | |
Cash and equivalents | | | $ 2,745 | | | | $ 3,968 | |
Accounts receivable | | | 426 | | | | 370 | |
Net derivative assets by counterparty | | | 901 | | | | 899 | |
| | | | $ 4,072 | | | | $ 5,237 | |
| 1 | Investment grade countries include Canada, Chile, Australia, and Peru. Investment grade countries are defined as being rated BBB- or higher by S&P. |
c) Liquidity Risk
Liquidity risk is the risk of loss from not having access to sufficient funds to meet both expected and unexpected cash demands. We manage our exposure to liquidity risk through prudent management of our balance sheet, including maintaining sufficient cash balances and access to undrawn credit facilities. Details of the undrawn credit facility are included in Note 22 of the consolidated financial statements. We also ensure we have access to public debt markets by maintaining a strong credit rating.
The following table outlines the expected maturity of our significant financial assets and liabilities into relevant maturity groupings based on the remaining period from the balance sheet date to the contractual maturity date. As the amounts disclosed in the table are the contractual undiscounted cash flows, these balances may not agree with the amounts disclosed in the balance sheet.
| | | | |
| BARRICK YEAR END 2011 | | 145 | | NOTES TO FINANCIAL STATEMENTS |
| | | | | | | | | | | | | | | | | | | | |
| As at December 31, 2011 | | | | | | | | | | | | | | | |
| (in $ millions) | | Less than 1 year | | | 1 to 3 years | | | 3 to 5 years | | | Over 5 years | | | Total | |
Cash and equivalents | | | $ 2,745 | | | | $ - | | | | $ - | | | | $ - | | | | $ 2,745 | |
Accounts receivable | | | 426 | | | | - | | | | - | | | | - | | | | 426 | |
Other receivables | | | 213 | | | | 308 | | | | 98 | | | | 124 | | | | 743 | |
Derivative assets | | | 504 | | | | 369 | | | | 56 | | | | 33 | | | | 962 | |
Trade and other payables | | | 2,083 | | | | - | | | | - | | | | - | | | | 2,083 | |
Debt | | | 196 | | | | 3,257 | | | | 2,820 | | | | 7,161 | | | | 13,434 | |
Derivative liabilities | | | 22 | | | | 30 | | | | 12 | | | | - | | | | 64 | |
Other liabilities | | | 12 | | | | 140 | | | | 18 | | | | 32 | | | | 202 | |
Stock-based payments | | | 27 | | | | 21 | | | | - | | | | - | | | | 48 | |
Total | | | $ 6,228 | | | | $ 4,125 | | | | $ 3,004 | | | | $ 7,350 | | | | $ 20,707 | |
| | | | | | | | | | | | | | | | |
| As at December 31, 2010 | | | | | | | | | | | | | | | |
| (in $ millions) | | Less than 1 year | | | 1 to 3 years | | | 3 to 5 years | | | Over 5 years | | | Total | |
Cash and cash equivalents | | | $ 3,968 | | | | $ - | | | | $ - | | | | $ - | | | | $ 3,968 | |
Accounts receivable | | | 370 | | | | - | | | | - | | | | - | | | | 370 | |
Other receivables | | | 228 | | | | 218 | | | | 67 | | | | 110 | | | | 623 | |
Derivative assets | | | 560 | | | | 466 | | | | 80 | | | | 20 | | | | 1,126 | |
Trade and other payables | | | 1,511 | | | | - | | | | - | | | | - | | | | 1,511 | |
Debt | | | 14 | | | | 756 | | | | 1,620 | | | | 4,315 | | | | 6,705 | |
Derivative liabilities | | | 175 | | | | 49 | | | | 22 | | | | 32 | | | | 278 | |
Other liabilities | | | 35 | | | | 32 | | | | 16 | | | | 28 | | | | 111 | |
Stock-based payments | | | 53 | | | | 19 | | | | - | | | | - | | | | 72 | |
Total | | | $ 6,914 | | | | $ 1,540 | | | | $ 1,805 | | | | $ 4,505 | | | | $ 14,764 | |
d) Capital Risk Management
Our objective when managing capital is to provide value for shareholders by maintaining an optimal short-term and long-term capital structure in order to reduce the overall cost of capital while preserving our ability to continue as a going concern. Our capital management objectives are to safeguard our ability to support our operating requirements on an ongoing basis, continue the development and exploration of our mineral properties and support any expansionary plans. Our objectives are also to ensure that we maintain a strong balance sheet and optimize the use of debt and equity to support our business and provide financial flexibility in order to maximize shareholder value. We define capital as total debt less cash and equivalents and it is managed by management subject to approved policies and limits by the Board of Directors. We are not subject to any significant financial covenants or capital requirements with our lenders or other parties.
| | | | | | | | | | | | |
| 26 > OTHER NON-CURRENT LIABILITIES | |
| | | At December 31,
2011 | | | At December 31,
2010 | | | At January 1,
2010 | |
| Deposit on silver sale agreement | | | $ 453 | | | | $ 312 | | | | $ 196 | |
| | | |
| Settlement obligation to close out gold sales contracts | | | - | | | | - | | | | 647 | |
| | | |
| Derivative liabilities (note 22f) | | | 42 | | | | 105 | | | | 19 | |
| Provision for supply contract restructuring costs | | | 25 | | | | 31 | | | | - | |
| Provision for offsite remediation | | | 61 | | | | 66 | | | | - | |
| | | |
Other | | | 108 | | | | 52 | | | | 22 | |
| | | | $ 689 | | | | $ 566 | | | | $ 884 | |
Silver Sale Agreement
On September 22, 2009, we entered into an agreement with Silver Wheaton Corp. to sell the equivalent of 25% of the life of mine silver production from the Pascua-Lama project and 100% of silver production from the Lagunas Norte, Pierina and Veladero mines until project completion at Pascua-Lama. In return, we were entitled to an upfront cash payment of $625 million payable over three years
| | | | |
| BARRICK YEAR END 2011 | | 146 | | NOTES TO FINANCIAL STATEMENTS |
from the date of the agreement, as well as ongoing payments in cash of the lesser of $3.90 (subject to an annual inflation adjustment of 1% starting three years after project completion at Pascua-Lama) and the prevailing market price for each ounce of silver delivered under the agreement.
During 2011 we received cash payments of $137.5 million (2010: $137.5 million). Providing that construction continues to progress at Pascua-Lama, we are entitled to receive an additional cash payment totaling $137.5 million in aggregate on the next anniversary date of the agreement. An imputed interest expense is being recorded on the liability at the rate implicit in the agreement. The liability plus imputed interest will be amortized based on the difference between the effective contract price for silver and the amount of the ongoing cash payment per ounce of silver delivered under the agreement.
27 > DEFERRED INCOME TAXES
Recognition and Measurement
We record deferred income tax assets and liabilities where temporary differences exist between the carrying amounts of assets and liabilities in our balance sheet and their tax bases. The measurement and recognition of deferred income tax assets and liabilities takes into account: substantively enacted rates that will apply when temporary differences reverse; interpretations of relevant tax legislation; estimates of the tax bases of assets and liabilities; and the deductibility of expenditures for income tax purposes. In addition the measurement and recognition of deferred tax assets takes into account tax planning strategies. We recognize the effect of changes in our assessment of these estimates and factors when they occur. Changes in deferred income tax assets and liabilities are allocated between net income, other comprehensive income, and goodwill based on the source of the change.
Current income taxes of $15 million and deferred income taxes of $31 million have been provided on the undistributed earnings of certain foreign subsidiaries. Deferred income taxes have not been provided on the undistributed earnings of all other foreign subsidiaries for which we are able to control the timing of the remittance, and it is probable that there will be no remittance in the foreseeable future. These undistributed earnings amounted to $7,892 million as at December 31, 2011. The majority of the $87 million dividend withholding tax expensed in 2011 related to a one-time dividend.
| | | | | | | | |
| Sources of Deferred Income Tax | | | | | | |
| Assets and Liabilities | | | | | | |
| At December 31 | | 2011 | | | 2010 | |
Deferred tax assets | | | | | | | | |
Tax loss carry forwards | | | $ 624 | | | | $ 337 | |
Alternative minimum tax (“AMT”) credits | | | 165 | | | | 318 | |
Environmental rehabilitation | | | 683 | | | | 469 | |
Property, plant and equipment | | | 26 | | | | - | |
Post-retirement benefit obligations | | | 16 | | | | 25 | |
Derivative instruments | | | - | | | | - | |
Accrued interest payable | | | 45 | | | | 63 | |
Other | | | 41 | | | | - | |
| | | $ 1,600 | | | | $ 1,212 | |
Deferred tax liabilities | | | | | | | | |
Property, plant and equipment | | | (5,067) | | | | (2,177) | |
Derivative instruments | | | (138) | | | | (160) | |
Inventory | | | (217) | | | | (212) | |
Other | | | - | | | | (9) | |
| | | | $ (3,822) | | | | $ (1,346) | |
Classification: | | | | | | | | |
Non-current assets | | | $ 409 | | | | $ 625 | |
Non-current liabilities | | | (4,231) | | | | (1,971) | |
| | | | $ (3,822 | ) | | | $ (1,346) | |
The deferred tax asset of $409 million includes $300 million receivable in more than one year. The deferred tax liability of $4,231 million includes $4,207 million due in more than one year.
Expiry Dates of Tax Losses and AMT Credits
| | | | | | | | | | | | | | | | | | | | | | | | | | | | |
| | | 2012 | | | 2013 | | | 2014 | | | 2015 | | | 2016+ | | | No
expiry
date | | | Total | |
| Non-capital tax losses1 | | | | | | | | | | | | | | | | | | | | | | | | | | | | |
| Canada | | | $ - | | | | $ - | | | | $ 4 | | | | $ 5 | | | | $ 1,513 | | | | $ - | | | | $1,522 | |
| Dominican | | | | | | | | | | | | | | | | | | | | | | | | | | | | |
| Republic | | | - | | | | - | | | | - | | | | - | | | | - | | | | 333 | | | | 333 | |
| Barbados | | | - | | | | - | | | | - | | | | - | | | | 7,281 | | | | - | | | | 7,281 | |
| Chile | | | - | | | | - | | | | - | | | | - | | | | - | | | | 130 | | | | 130 | |
| Tanzania | | | - | | | | - | | | | - | | | | - | | | | - | | | | 115 | | | | 115 | |
| Zambia | | | - | | | | - | | | | - | | | | - | | | | 494 | | | | - | | | | 494 | |
| Other | | | - | | | | - | | | | - | | | | 2 | | | | - | | | | 24 | | | | 26 | |
| | | | $ - | | | | $ - | | | | $4 | | | | $7 | | | | $9,288 | | | | $602 | | | | $9,901 | |
| | | | | | | |
| AMT credits2 | | | | | | | | | | | | | | | | | | | | | | | $165 | | | | $165 | |
| 1 | Represents the gross amount of tax loss carry forwards translated at closing exchange rates at December 31, 2011. |
| 2 | Represents the amounts deductible against future taxes payable in years when taxes payable exceed “minimum tax” as defined by United States tax legislation. |
| | | | |
| BARRICK YEAR END 2011 | | 147 | | NOTES TO FINANCIAL STATEMENTS |
The non-capital tax losses include $7,568 million of losses which are not recognized in deferred tax assets. Of these, $4 million expire in 2014, $7 million expire in 2015, $7,317 in 2016 or later, and $240 million have no expiry date.
Recognition of Deferred Tax Assets
We recognize deferred tax assets taking into account the effects of local tax law. Deferred tax assets are fully recognized when we conclude that sufficient positive evidence exists to demonstrate that it is probable that a deferred tax asset will be realized. The main factors considered are:
| | • | | Historic and expected future levels of taxable income; |
| | • | | Tax plans that affect whether tax assets can be realized; and |
| | • | | The nature, amount and expected timing of reversal of taxable temporary differences. |
Levels of future income are mainly affected by: market gold, copper and silver prices; forecasted future costs and expenses to produce gold and copper reserves; quantities of proven and probable gold and copper reserves; market interest rates; and foreign currency exchange rates. If these factors or other circumstances change, we record an adjustment to the recognition of deferred assets to reflect our latest assessment of the amount of deferred tax assets that is probable will be realized.
A deferred income tax asset totaling $310 million has been recorded in Canada. This deferred tax asset primarily arose due to mark-to-market losses realized for acquired Placer Dome derivative instruments recognized on the acquisition in 2006. Projections of various sources of income support the conclusion that the realizability of this deferred tax asset is probable and consequently we have fully recognized this deferred tax asset.
| | | | | | | | |
| Deferred Tax Assets Not Recognized | | | | | | |
| | | 2011 | | | 2010 | |
| | |
Australia | | | $ 122 | | | | $ 104 | |
Canada | | | 76 | | | | 52 | |
Argentina | | | 35 | | | | 61 | |
Barbados | | | 73 | | | | 73 | |
Tanzania | | | 31 | | | | 63 | |
Other | | | 23 | | | | 39 | |
| | | | $ 360 | | | | $ 392 | |
Deferred Tax Assets Not Recognized relate to: non-capital loss carry forwards of $170 million (2010: $175 million), capital loss carry forwards with no expiry date of $120 million (2010: $102 million), and other deductible temporary differences with no expiry date of $70 million (2010: $115 million).
| | | | | | | | |
| Source of Changes in Deferred Tax Balances | |
| For the years ended December 31 | | 2011 | | | 2010 | |
Temporary differences | | | | | | | | |
Property, plant and equipment | | | $ (2,865) | | | | $ (877) | |
Environmental rehabilitation | | | 214 | | | | 34 | |
Tax loss carry forwards | | | 287 | | | | (169) | |
AMT credits | | | (152) | | | | 167 | |
Derivatives | | | 21 | | | | (78) | |
Other | | | (17) | | | | (83) | |
| | | (2,512) | | | | (1,006) | |
| Net currency translation gains/(losses) on deferred tax balances | | | 32 | | | | 19 | |
| Impact of Australian functional currency election | | | 4 | | | | - | |
| | | | $ (2,476) | | | | $ (987) | |
Intraperiod allocation to: | | | | | | | | |
| Income (loss) from continuing operations before income taxes | | | $ (402) | | | | $ (304) | |
Equinox acquisition | | | (2,108) | | | | - | |
Barrick Energy acquisitions | | | (37) | | | | (37) | |
Cerro Casale acquisition | | | - | | | | (523) | |
Tusker acquisition | | | - | | | | (22) | |
OCI | | | 69 | | | | (113) | |
Other | | | 2 | | | | 12 | |
| | | | $ (2,476) | | | | $ (987) | |
| | | | | | | |
| Income Tax Related Contingent Liabilities | | | | | | |
| | | 2011 | | | 2010 | |
At January 1 | | | $ 64 | | | | $ 67 | |
| Additions based on tax positions related to the current year | | | 1 | | | | - | |
Reductions for tax positions of prior years | | | (1) | | | | - | |
Settlements | | | - | | | | (3) | |
At December 311 | | | $ 64 | | | | $ 64 | |
| 1 | If reversed, the total amount of $64 million would be recognized as a benefit to income taxes on the income statement, and therefore would impact the reported effective tax rate. |
We anticipate the amount of income tax related contingent liabilities to decrease within 12 months of the reporting date by approximately $2 million to $3 million, related primarily to the expected settlement of income tax and mining tax assessments.
| | | | |
| BARRICK YEAR END 2011 | | 148 | | NOTES TO FINANCIAL STATEMENTS |
We further anticipate that it is reasonably possible for the amount of income tax related contingent liabilities to decrease within 12 months of the reporting date by approximately $37 million through a potential settlement with tax authorities that may result in a reduction of available tax pools.
| | | | |
| Tax Years Still Under Examination | | | |
Canada | | | 2006-2011 | |
United States | | | 2011 | |
Peru | �� | | 2007-2011 | |
Chile | | | 2008-2011 | |
Argentina | | | 2005-2011 | |
Australia | | | All years open | |
Papua New Guinea | | | 2004-2011 | |
Tanzania | | | All years open | |
Zambia | | | All years open | |
28 > CAPITAL STOCK
Common Shares
Our authorized capital stock includes an unlimited number of common shares (issued 1,000,422,260 common shares); 10,000,000 First preferred shares Series A (issued nil); 10,000,000 Series B (issued nil); and 15,000,000 Second preferred shares Series A (issued nil). Our common shares have no par value.
Dividends
In 2011, we declared and paid dividends in US dollars totaling $0.51 per share ($509 million) (2010: $0.44 per share, $436 million).
29 > NON-CONTROLLING INTERESTS
| | | | | | | | | | | | | | | | |
| | | Pueblo Viejo | | | ABG1 | | | Cerro Casale2 | | | Total | |
At January 1, 2010 | | | $ 500 | | | | $ 22 | | | | $ - | | | | $ 522 | |
Share of income (loss) | | | (3) | | | | 51 | | | | - | | | | 48 | |
Cash contributed | | | 101 | | | | - | | | | 13 | | | | 114 | |
Recognition of non-controlling interest | | | - | | | | 607 | | | | 454 | | | | 1,061 | |
At December 31, 2010 | | | $ 598 | | | | $ 680 | | | | $ 467 | | | | $ 1,745 | |
Share of income (loss) | | | (26) | | | | 82 | | | | (3) | | | | 53 | |
Cash contributed | | | 365 | | | | - | | | | 38 | | | | 403 | |
Decrease in non-controlling interest3 | | | - | | | | (10) | | | | - | | | | (10) | |
At December 31, 2011 | | | $ 937 | | | | $ 752 | | | | $ 502 | | | | $ 2,191 | |
| 1 | Represents non-controlling interest in ABG. The balance at January 1, 2010 includes the non-controlling interest of 30% in our Tulawaka mine. |
| 2 | Represents non-controlling interest in Cerro Casale. Refer to note 4f. |
| 3 | Represents dividends received from African Barrick Gold. |
30 > REMUNERATION OF KEY MANAGEMENT PERSONNEL
Key management personnel include the members of the Board of Directors and the Senior leadership team. Compensation for key management personnel (including Directors) was as follows:
| | | | | | | | |
| For the years ended December 31 | | 2011 | | | 2010 | |
Salaries and short-term employee benefits1 | | | $ 20 | | | | $ 18 | |
Post-employment benefits2 | | | 3 | | | | 3 | |
Share-based payments and other3 | | | 28 | | | | 22 | |
| | | | $ 51 | | | | $ 43 | |
| 1 | Includes annual salary as at December 31 and annual short-term incentives/other bonuses earned in the year. |
| 2 | Represents company contributions to retirement savings plans. |
| 3 | Represents year-end stock option, RSU, and PRSU grants and other compensation. |
31 > STOCK-BASED COMPENSATION
A Stock Options
Under Barrick’s stock option plan, certain officers and key employees of the Corporation may purchase common shares at an exercise price that is equal to the closing share price on the day before the grant of the option. The grant date is the date when the details of the award, including the number of options granted by individual and the exercise price, are approved. Stock options vest evenly over four years, beginning in the year after granting. Options granted in July 2004 and prior are exercisable over 10 years, whereas options granted since December 2004 are exercisable over seven years. At December 31, 2011, 6.9 million (2010: 8.4 million) common shares were available for granting options. Stock options when exercised result in an increase to the number of common shares issued by Barrick.
| | | | |
| BARRICK YEAR END 2011 | | 149 | | NOTES TO FINANCIAL STATEMENTS |
Compensation expense for stock options was $15 million in 2011 (2010: $16 million), and is presented as a component of corporate administration and other expense, consistent with the classification of other elements of compensation expense for those employees who had stock options. The recognition of compensation expense for stock options
reduced earnings per share for 2011 by $0.01 per share (2010: $0.01 per share).
Total intrinsic value relating to options exercised in 2011 was $40 million (2010: $96 million).
| | | | | | | | | | | | | | | | |
| Employee Stock Option Activity (Number of Shares in Millions) | | | | | | | | | | |
| | | 2011 | | | 2010 | |
| | | Shares | | | Average Price | | | Shares | | | Average Price | |
C$ options | | | | | | | | | | | | | | | | |
At January 1 | | | 1.4 | | | | $ 26 | | | | 3.3 | | | | $ 27 | |
Exercised | | | (0.2) | | | | 25 | | | | (1.9) | | | | 27 | |
Forfeited | | | - | | | | - | | | | - | | | | - | |
Cancelled/expired | | | (0.1) | | | | 23 | | | | - | | | | - | |
At December 31 | | | 1.1 | | | | $ 27 | | | | 1.4 | | | | $ 26 | |
US$ options | | | | | | | | | | | | | | | | |
At January 1 | | | 7.0 | | | | $ 38 | | | | 9.1 | | | | $ 33 | |
Granted | | | 0.5 | | | | 50 | | | | 0.9 | | | | 55 | |
Exercised | | | (1.6) | | | | 30 | | | | (2.9) | | | | 28 | |
Forfeited | | | - | | | | - | | | | (0.1) | | | | 38 | |
Cancelled/expired | | | (0.1) | | | | 34 | | | | - | | | | - | |
At December 31 | | | 5.8 | | | | $ 41 | | | | 7.0 | | | | $ 38 | |
Stock Options Outstanding (Number of Shares in Millions)
| | | | | | | | | | | | | | | | | | | | | | | | | | | | |
| | | | | | Outstanding | | | | | | | | | Exercisable | | | | |
Range of exercise prices | | Shares | | | Average price | | | Average life (years) | | | Intrinsic value1 ($ millions) | | | Shares | | | Average price | | | Intrinsic value1 ($ millions) | |
C$ options | | | | | | | | | | | | | | | | | | | | | | | | | | | | |
$ 22 - $ 27 | | | 0.6 | | | | $ 24 | | | | 1 | | | | $ 12 | | | | 0.6 | | | | $ 24 | | | | $ 12 | |
$ 28 - $ 31 | | | 0.5 | | | | 30 | | | | 2 | | | | 9 | | | | 0.5 | | | | 30 | | | | 9 | |
| | | | 1.1 | | | | $ 27 | | | | 1 | | | | $ 21 | | | | 1.1 | | | | $ 26 | | | | $ 21 | |
US$ options | | | | | | | | | | | | | | | | | | | | | | | | | | | | |
$ 9 - $ 19 | | | 0.1 | | | | $ 13 | | | | 1 | | | | $ 2 | | | | 0.1 | | | | $ 13 | | | | $ 2 | |
$ 20 - $ 27 | | | 0.9 | | | | 26 | | | | 4 | | | | 17 | | | | 0.7 | | | | 26 | | | | 14 | |
$ 28 - $ 41 | | | 1.4 | | | | 38 | | | | 3 | | | | 10 | | | | 1.1 | | | | 38 | | | | 8 | |
$ 42 - $ 55 | | | 3.4 | | | | 47 | | | | 5 | | | | (6) | | | | 1.5 | | | | 44 | | | | 1 | |
| | | | 5.8 | | | | $ 41 | | | | 4 | | | | $ 23 | | | | 3.4 | | | | $ 38 | | | | $ 25 | |
| 1 | Based on the closing market share price on December 31, 2011 of C$46.15 and US$45.25. |
| | | | |
| BARRICK YEAR END 2011 | | 150 | | NOTES TO FINANCIAL STATEMENTS |
| | | | | | | | | | | | |
| Option Information | |
For the years ended (per share and per option amounts in dollars) | | December 31, 2011 | | | December 31, 2010 | | | January 1, 2010 | |
| | | |
Valuation assumptions | | | Lattice1,2 | | | | Lattice1,2 | | | | Lattice1,2 | |
Expected term (years) | | | 5.3 | | | | 5.0 | | | | 5.0 | |
Expected volatility2 | | | 33%-38% | | | | 33%-60% | | | | 35%-60% | |
Expected dividend yield | | | 1.22% | | | | 1.13% | | | | 1.10% | |
Risk-free interest rate2 | | | 0.04%-2.04% | | | | 0.19%-2.88% | | | | 0.16%-3.44% | |
| | | | | | | | | | | | | |
Options granted (in millions) | | | 0.5 | | | | 0.9 | | | | 1.6 | |
Weighted average fair value per option | | | $14 | | | | $16 | | | | $13 | |
| 1 | Different assumptions were used for the multiple stock option grants during the year. |
| 2 | The volatility and risk-free interest rate assumptions varied over the expected term of these stock option grants. |
The expected volatility assumptions have been developed taking into consideration both historical and implied volatility of our US dollar share price. The risk-free rate for periods within the contractual life of the option is based on the US Treasury yield curve in effect at the time of the grant.
The expected term assumption is derived from the option valuation model and is in part based on historical data regarding the exercise behavior of option holders based on multiple share-price paths. The Lattice model also takes into consideration employee turnover and voluntary exercise patterns of option holders.
As at December 31, 2011, there was $25 million (2010: $29 million) of total unrecognized compensation cost relating to unvested stock options. We expect to recognize this cost over a weighted average period of 2 years (2010: 2 years).
B Restricted Share Units (RSUs) and Deferred Share Units (DSUs)
Under our RSU plan, selected employees are granted RSUs where each RSU has a value equal to one Barrick common share. RSUs vest at the end of a two-and-a-half year period and are settled in cash on the two-and-a-half year anniversary of the grant date. Additional RSUs are credited to reflect dividends paid on Barrick common shares over the vesting period.
Compensation expense for RSUs incorporates an expected forfeiture rate. The expected forfeiture rate is estimated based on historical forfeiture rates and expectations of future forfeiture rates. We make adjustments if the actual forfeiture rate differs from the expected rate. At December 31, 2011, the weighted average remaining contractual life of RSUs was 1.55 years.
Compensation expense for RSUs was $30 million in 2011 (2010: $48 million) and is presented as a component of corporate administration and other expense, consistent with the classification of other elements of compensation expense for those employees who had RSUs.
Under our DSU plan, Directors must receive a specified portion of their basic annual retainer in the form of DSUs, with the option to elect to receive 100% of such retainer in DSUs. Each DSU has the same value as one Barrick common share. DSUs must be retained until the Director leaves the Board, at which time the cash value of the DSUs will be paid out. Additional DSUs are credited to reflect dividends paid on Barrick common shares. DSUs are recorded at fair value on the grant date and are adjusted for changes in fair value. The fair value of amounts granted each period together with changes in fair value are expensed.
| | | | |
| BARRICK YEAR END 2011 | | 151 | | NOTES TO FINANCIAL STATEMENTS |
| | | | | | | | | | | | | | | | |
| DSU and RSU Activity | | | | | | | | | | |
| | | DSUs (thousands) | | | Fair value ($ millions) | | | RSUs (thousands) | | | Fair value ($ millions) | |
| | | | |
At January 1, 2010 | | | 167 | | | | $ 6.6 | | | | 3,150 | | | | $ 49.0 | |
Settled for cash | | | (20) | | | | (0.6) | | | | (824) | | | | (42.8) | |
Forfeited | | | - | | | | - | | | | (326) | | | | (17.0) | |
Granted | | | 33 | | | | 1.5 | | | | 918 | | | | 49.3 | |
Credits for dividends | | | - | | | | - | | | | 29 | | | | 1.3 | |
Change in value | | | - | | | | 1.9 | | | | - | | | | 30.9 | |
At December 31, 2010 | | | 180 | | | | $ 9.4 | | | | 2,947 | | | | $ 70.7 | |
Settled for cash | | | (29) | | | | (0.8) | | | | (1,242) | | | | (60.8) | |
Forfeited | | | - | | | | - | | | | (69) | | | | (2.3) | |
Granted | | | 36 | | | | 1.7 | | | | 1,153 | | | | 56.8 | |
Credits for dividends | | | - | | | | - | | | | 26 | | | | 1.2 | |
Change in value | | | - | | | | (1.9) | | | | - | | | | (16.4) | |
At December 31, 2011 | | | 187 | | | | $ 8.4 | | | | 2,815 | | | | $ 49.2 | |
C Performance Restricted Share Units (PRSUs)
In 2008, Barrick launched a PRSU plan. Under this plan, selected employees are granted PRSUs, where each PRSU has a value equal to one Barrick common share. PRSUs vest at the end of a three-year period and are settled in cash on the third anniversary of the grant date. Additional PRSUs are credited to reflect dividends paid on Barrick common shares over the vesting period. Vesting, and therefore the liability, is based on the achievement of performance goals and the target settlement will range from 0% to 200% of the value. At December 31, 2011, 201 thousand units were outstanding (2010: 335 thousand units).
D Employee Share Purchase Plan (ESPP)
In 2008, Barrick launched an Employee Share Purchase Plan. This plan enables Barrick employees to purchase Company shares through payroll deduction. Each year, employees may contribute 1%-6% of their combined base salary and annual bonus, and Barrick will match 50% of the contribution, up to a maximum of $5,000 per year. During 2011, Barrick contributed and expensed $0.8 million to this plan (2010: $0.6 million).
E ABG Stock Options
African Barrick Gold has a stock option plan for its directors and selected employees. The exercise price of the granted options is determined by the ABG Remuneration Committee before the grant of an option provided that this price cannot be less than the average of the middle-market quotation of ABG’s shares (as derived from the London Stock Exchange Daily Official List) for the three dealing days immediately preceding the date of grant. All options outstanding at the end of the year expire in 2017 and 2018. There were 0.3 million ABG options granted which were exercisable at December 31, 2011. Stock option expense of $1.4 million (2010: $0.6 million) is included as a component of other expense.
32 > POST-RETIREMENT BENEFITS
A Description of Plans
Defined Contribution Pension Plans
Certain employees take part in defined contribution employee benefit plans. We also have a retirement plan for certain officers of the Company, under which we contribute 15% of the officer’s annual salary and bonus. Our share of contributions to these plans, which is expensed in the year it is earned by the employee, was $58 million in 2011, and $56 million in 2010.
Defined Benefit Pension Plans
We have qualified defined benefit pension plans that cover certain of our United States and Canadian employees and provide benefits based on employees’ years of service. Through the acquisition of Placer Dome, we acquired pension plans in the United States, Canada and Australia. Our policy is to fund the amounts necessary on an actuarial basis to provide enough assets to meet the benefits payable to plan members. Independent trustees administer assets of the plans, which are invested mainly in fixed income and equity securities.
Actuarial gains and losses arise when the actual return on plan assets differs from the expected return on plan assets for a period, or when the expected and actuarial accrued benefit obligations differ at the end of the year. We record actuarial gains and losses in the Statement of Comprehensive Income.
Post-Retirement Healthcare Plans
We provide post-retirement medical, dental, and life insurance benefits to certain employees.
| | | | |
| BARRICK YEAR END 2011 | | 152 | | NOTES TO FINANCIAL STATEMENTS |
B Post Retirement Plan Information
Actuarial Assumptions
| | | | | | | | | | | | | | | | |
As at December 31 | | Pension Plans 2011 | | | Other Post- Retirement Benefits 2011 | | | Pension Plans 2010 | | | Other Post- Retirement Benefits 2010 | |
| | | | |
| | | | |
Discount rate | | | | | | | | | | | | | | | | |
Benefit obligation | | | 2.80 - 5.21% | | | | 3.80 - 4.10% | | | | 3.50 - 5.30% | | | | 4.60 - 4.90% | |
Pension cost | | | 4.60 - 4.90% | | | | 3.50 - 5.77% | | | | 4.25 - 5.95% | | | | 5.25 - 5.50% | |
Expected return on plan assets | | | 4.50 - 7.00% | | | | N/A | | | | 4.50 - 7.00% | | | | N/A | |
Wage increases | | | N/A | | | | 5.00% | | | | N/A | | | | 5.00% | |
Pension plan assets, which consist primarily of fixed-income and equity securities, are valued using current market quotations. Plan obligations and the annual pension expense are determined on an actuarial basis and are affected by numerous assumptions and estimates including the market value of plan assets, estimates of the expected return on plan assets, discount rates, future wage increases and other assumptions. The discount rate, assumed rate of return on plan assets and wage increases are the assumptions that generally have the most significant impact on our pension cost and obligation.
The discount rate for benefit obligation and pension cost purposes is the rate at which the pension obligation could be effectively settled. This rate was developed by matching the cash flows underlying the pension obligation with a spot rate curve based on the actual returns available on high-grade (Moody’s Aa) US corporate bonds. Bonds included in this analysis were restricted to those with a minimum outstanding balance of $50 million. Only non-callable bonds, or bonds with a make-whole provision, were included. Finally, outlying bonds (highest and lowest 10%) were discarded as being non-representative and likely to be subject to a change in investment grade. The resulting discount rate from this analysis was rounded to the nearest five basis points. The procedure was applied separately for
pension and post-retirement plan purposes, and produced the same rate in each case.
The assumed rate of return on assets for pension cost purposes is the weighted average of expected long-term asset return assumptions. In estimating the long-term rate of return for plan assets, historical markets are studied and long-term historical returns on equities and fixed-income investments reflect the widely accepted capital market principle that assets with higher volatility generate a greater return over the long run. Current market factors such as inflation and interest rates are evaluated before long-term capital market assumptions are finalized.
Wage increases reflect the best estimate of merit increases to be provided, consistent with assumed inflation rates.
We have assumed a health care cost trend of 8% in 2012 (2010: 8%), decreasing ratably to 4.75% in 2019 and thereafter (2010: 4.75%). The assumed health care cost trend had a minimal effect on the amounts reported. A one percentage point change in the assumed health care cost trend rate at December 31, 2011 would have had no significant effect on the post-retirement obligation and would have had no significant effect on the benefit expense for 2011.
Expense Recognized in the Income Statement
| | | | | | | | | | | | | | | | |
As at December 31 | | Pension Plans 2011 | | | Other Post- Retirement Benefits 2011 | | | Pension Plans 2010 | | | Other Post- Retirement Benefits 2010 | |
| | | | |
| | | | |
Expected return on plan assets | | | $ (15) | | | | $ - | | | | $ (14) | | | | $ - | |
Past service cost | | | 1 | | | | - | | | | - | | | | - | |
Interest cost | | | 16 | | | | 1 | | | | 17 | | | | 1 | |
Plan amendment | | | 1 | | | | - | | | | 2 | | | | - | |
Total expense | | | $ 3 | | | | $ 1 | | | | $ 5 | | | | $ 1 | |
| | | | |
| BARRICK YEAR END 2011 | | 153 | | NOTES TO FINANCIAL STATEMENTS |
Plan Assets/Liabilities
| | | | | | | | | | | | | | | | |
| As at December 31 | | Pension Plans
2011 | | | Other Post-
Retirement
Benefits 2011 | | | Pension Plans
2010 | | | Other Post-
Retirement
Benefits 2010 | |
Non-current assets | | | $ 2 | | | | $ - | | | | $ 2 | | | | $ - | |
Current liabilities1 | | | 12 | | | | 2 | | | | 8 | | | | 2 | |
Non-current liabilities | | | 124 | | | | 22 | | | | 103 | | | | 25 | |
Other comprehensive income (loss)2 | | | (38) | | | | 4 | | | | (2) | | | | - | |
| | | | $ 100 | | | | $ 28 | | | | $ 111 | | | | $ 27 | |
| Accumulated actuarial gains (losses) recognized in OCI (before taxes) | | | $ (40) | | | | $4 | | | | $ (2) | | | | $ - | |
| 1 | Expected recovery or settlement within 12 months from the reporting date. |
| 2 | Amounts represent actuarial (gains) losses. |
Defined Benefit Obligation
The movement in the defined benefit obligation over the year is as follows:
| | | | | | | | | | | | | | | | |
| As at December 31 | | Pension Plans
2011 | | | Other Post-
Retirement
Benefits 2011 | | | Pension Plans
2010 | | | Other Post-
Retirement
Benefits 2010 | |
Balance at January 1 | | | $ 336 | | | | $ 27 | | | | $ 321 | | | | $ 29 | |
Service cost | | | 1 | | | | - | | | | - | | | | - | |
Interest cost | | | 16 | | | | 1 | | | | 17 | | | | 1 | |
Actuarial (gains) losses | | | 29 | | | | (3) | | | | 20 | | | | (1) | |
Benefits paid | | | (21) | | | | (1) | | | | (25) | | | | (2) | |
Foreign currency adjustments | | | - | | | | - | | | | 2 | | | | - | |
Amendments | | | - | | | | - | | | | 1 | | | | - | |
Balance at December 31 | | | $ 361 | | | | $ 24 | | | | $ 336 | | | | $ 27 | |
Funded status1 | | | $ (134) | | | | $ (24) | | | | $ (109) | | | | $ (27) | |
| 1 | Represents the fair value of plan assets less projected benefit obligations. |
Expected contributions to the pension plans and post-employment benefit plans for the year ended December 31, 2012 are $16 million and $2 million respectively.
Fair Value of Plan Assets
The movement in the fair value of plan assets over the year is as follows:
| | | | | | | | | | | | | | | | |
| | | Pension Plans
2011 | | | Other Post-
Retirement
Benefits 2011 | | | Pension Plans 2010 | | | Other Post-
Retirement
Benefits 2010 | |
Balance at January 1 | | | $ 227 | | | | $ - | | | | $ 215 | | | | $ - | |
Expected return on plan assets | | | 16 | | | | - | | | | 25 | | | | - | |
Actuarial gains and losses | | | (3) | | | | - | | | | - | | | | - | |
Company contributions | | | 9 | | | | 1 | | | | 12 | | | | 2 | |
Benefits paid | | | (22) | | | | (1) | | | | (25) | | | | (2) | |
Balance at December 31 | | | $ 227 | | | | $ - | | | | $ 227 | | | | $ - | |
| | | | |
| BARRICK YEAR END 2011 | | 154 | | NOTES TO FINANCIAL STATEMENTS |
| | | | | | | | | | | | |
| | | As at December 31, 2011 | | | | |
| | | Target1 | | | Actual | | | Actual | |
Composition of plan assets2 | | | | | | | | | | | | |
Equity securities | | | 53% | | | | 52% | | | | $ 118 | |
Fixed income securities | | | 47% | | | | 48% | | | | 109 | |
| | | | 100% | | | | 100% | | | | $ 227 | |
| 1 | Based on the weighted average target for all defined benefit plans. |
| 2 | Holdings in equity and fixed income securities consist of Level 1 and Level 2 assets within the fair value hierarchy. |
Expected Future Benefit Payments
| | | | | | | | |
| | | Other Post-Retirement | |
| For the years ending December 31 | | Pension Plans | | | Benefits | |
2012 | | | $ 35 | | | | $ 2 | |
2013 | | | 26 | | | | 2 | |
2014 | | | 26 | | | | 2 | |
2015 | | | 26 | | | | 2 | |
2016 | | | 26 | | | | 2 | |
2017 – 2021 | | | $ 133 | | | | $ 8 | |
33 > LITIGATION AND CLAIMS
Certain conditions may exist as of the date the financial statements are issued, which may result in a loss to the Company but which will only be resolved when one or more future events occur or fail to occur. In assessing loss contingencies related to legal proceedings that are pending against us or unasserted claims that may result in such proceedings, the Company and its legal counsel evaluate the perceived merits of any legal proceedings or unasserted claims as well as the perceived merits of the amount of relief sought or expected to be sought.
Cortez Hills Complaint
On November 12, 2008, the United States Bureau of Land Management (the “BLM”) issued a Record of Decision approving the Cortez Hills Expansion Project. On November 20, 2008, the TeMoak Shoshone Tribe, the East Fork Band Council of the TeMoak Shoshone Tribe and the Timbisha Shoshone Tribe, the Western Shoshone Defense Project, and Great Basin Resource Watch filed a lawsuit against the United States seeking to enjoin the majority of the activities comprising the Project on the grounds that it violated the Western Shoshone rights under the Religious Freedom Restoration Act (“RFRA”), that it violated the Federal Land Policy and Management Act’s (“FLPMA”) prohibition on “unnecessary and undue degradation,” and that the Project’s Environment Impact Statement (“EIS”) did not meet the requirements of the National Environmental Policy Act (“NEPA”). The Plaintiffs subsequently dismissed their RFRA claim, with prejudice, conceding that it was without merit, in light of a decision in another case.
On November 24, 2008, the Plaintiffs filed a Motion for a Temporary Restraining Order and a Preliminary Injunction barring work on the Project until after a trial on the merits. In January 2009, the Court denied the Plaintiffs’ Motion for a Preliminary Injunction, concluding that the Plaintiffs had failed to demonstrate a likelihood of success on the merits and that the Plaintiffs had otherwise failed to satisfy the necessary elements for a preliminary injunction. The Plaintiffs appealed that decision to the United States Court of Appeals for the Ninth Circuit. In December 2009, the Ninth Circuit issued an opinion in which it held that the Plaintiffs had failed to show that they were likely to succeed on the merits of their FLPMA claims, and thus were not entitled to an injunction based on those claims. The Ninth Circuit, however, held that the Plaintiffs were likely to succeed on two of their NEPA claims and ordered that a supplemental EIS be prepared by Barrick that specifically provided more information on (i) the effectiveness of proposed mitigation measures for seeps and springs that might be affected by groundwater pumping, and (ii) the air quality impact of the shipment of refractory ore to Goldstrike for processing and that additional air quality modeling for fine particulate matter using updated EPA procedures should be performed and included in the supplemental EIS. The Ninth Circuit decision directed the District Court to enter an injunction consistent with the decision. In April 2010, the District Court granted Barrick’s motion seeking a tailored preliminary injunction, which allows mining operations to continue while the supplemental EIS is being completed.
| | | | |
| BARRICK YEAR END 2011 | | 155 | | NOTES TO FINANCIAL STATEMENTS |
In August 2010, the District Court issued an order granting summary judgment for Cortez except, generally for those issues covered by the supplemental EIS, on which it reserved ruling until the completion of that document. The final supplemental EIS was published on January 14, 2011. On March 15, 2011, the BLM issued its record of decision that approved the supplemental EIS, which had the effect of terminating the tailored injunction, thereby enabling the Cortez mine to revert to its original operating scope. All parties filed their motions for summary judgment on all remaining issues. On January 3, 2012, the Court issued a decision granting summary judgment in favor of Barrick and the BLM on all remaining issues.
Marinduque Complaint
Placer Dome Inc. was named the sole defendant in a Complaint filed in October 2005 by the Provincial Government of Marinduque, an island province of the Philippines (“Province”), with the District Court in Clark County, Nevada. The Complaint asserted that Placer Dome Inc. was responsible for alleged environmental degradation with consequent economic damages and impacts to the environment in the vicinity of the Marcopper mine that was owned and operated by Marcopper Mining Corporation (“Marcopper”). Placer Dome Inc. indirectly owned a minority shareholding of 39.9% in Marcopper until the divestiture of its shareholding in 1997. The Province sought “to recover damages for injuries to the natural, ecological and wildlife resources within its territory”. In addition, the Province sought compensation for the costs of restoring the environment, an order directing Placer Dome Inc. to undertake and complete “the remediation, environmental cleanup, and balancing of the ecology of the affected areas,” and payment of the costs of environmental monitoring. The Complaint addressed the discharge of mine tailings into Calancan Bay, the 1993 Maguila-guila dam breach, the 1996 Boac river tailings spill, and alleged past and continuing damage from acid rock drainage.
The action was removed to the U.S. District Court for the District of Nevada on motion of Placer Dome Inc. After the amalgamation of Placer Dome Inc. and the Company, the Court granted the Province’s motion to join the Company as an additional named Defendant. In June 2007, the Court issued an order granting the Company’s motion to dismiss on grounds of forum non conveniens (improper choice of forum). In September 2009, the U.S. Court of Appeals for the Ninth Circuit reversed the decision of the District Court on the grounds that the U.S. District Court lacked subject matter jurisdiction over the case and removal from the Nevada state court was improper.
In April 2010, the Company filed a motion to dismiss the claims in the Nevada state court on the grounds of forum non conveniens and on October 12, 2010, the court issued an order granting the Company’s motion to dismiss the action. On February 11, 2011, the Court issued its written reasons for the dismissal order. On March 11, 2011, the Province filed a motion to reconsider the Court’s order, which the Company opposed on March 28, 2011. The Court denied the motion to reconsider on May 25, 2011. The Province has appealed the Court’s dismissal order to the Nevada Supreme Court. The Company intends to continue to defend the action vigorously. No amounts have been accrued for any potential loss under this complaint.
Calancan Bay (Philippines) Complaint
In July 2004, a complaint was filed against Marcopper and Placer Dome Inc. in the Regional Trial Court of Boac, on the Philippine island of Marinduque, on behalf of a putative class of fishermen who reside in the communities around Calancan Bay, in northern Marinduque. The complaint alleges injuries to health and economic damages to the local fisheries resulting from the disposal of mine tailings from the Marcopper mine. The total amount of damages claimed is approximately US$1 billion.
In October 2006, the court granted the plaintiffs’ application for indigent status, allowing the case to proceed without payment of filing fees. In March 2008, an attempt was made to serve Placer Dome Inc. by serving the summons and complaint on Placer Dome Technical Services (Philippines) Inc. (“PDTS”). PDTS has returned the summons and complaint stating that PDTS is not an agent of Placer Dome Inc. for any purpose and is not authorized to accept service or to take any other action on behalf of Placer Dome Inc. In April 2008, Placer Dome Inc. made a special appearance by counsel to move to dismiss the complaint for lack of personal jurisdiction and on other grounds. The plaintiffs have opposed the motion to dismiss. The motion has been briefed and is currently pending.
In October 2008, the plaintiffs filed a motion challenging Placer Dome Inc.’s legal capacity to participate in the proceedings in light of its alleged “acquisition” by the Company. Placer Dome Inc. opposed this motion. The motion has been briefed and is currently pending. The Company intends to defend the action vigorously. No amounts have been accrued for any potential loss under this complaint.
| | | | |
| BARRICK YEAR END 2011 | | 156 | | NOTES TO FINANCIAL STATEMENTS |
Perilla Complaint
In August 2009, Barrick Gold Inc. was purportedly served in Ontario with a complaint filed in November 2008 in the Regional Trial Court of Boac, on the Philippine island of Marinduque, on behalf of two named individuals and purportedly on behalf of the approximately 200,000 residents of Marinduque. In December 2009, the complaint was also purportedly served in Ontario in the name of Placer Dome Inc. The complaint alleges injury to the economy and the ecology of Marinduque as a result of the discharge of mine tailings from the Marcopper mine into the Calancan Bay, the Boac River, and the Mogpog River. The plaintiffs are claiming for abatement of a public nuisance allegedly caused by the tailings discharge and for nominal damages for an alleged violation of their constitutional right to a balanced and healthful ecology. Barrick Gold Inc. has moved to dismiss the complaint on a variety of grounds, which motion is now pending a decision of the Court following the failure of plaintiffs’ counsel to appear at the hearing in February 2010 or to timely file any comment or opposition to the motion. Motions to dismiss the complaint on a variety of grounds have also been filed in the name of Placer Dome Inc. In May 2010, the plaintiffs filed a motion for an order to admit an amended complaint in which they are seeking additional remedies including temporary and permanent environmental protection orders. In June 2010, Barrick Gold Inc. and Placer Dome Inc. filed a motion to have the Court resolve their unresolved motions to dismiss before considering the plaintiffs’ motion to admit the amended complaint. An opposition to the plaintiffs’ motion to admit was also filed by Barrick Gold Inc. and Placer Dome Inc. on the same basis. This motion is now fully briefed and awaiting determination by the Court. It is not known when these motions or the outstanding motions to dismiss will be decided by the Court. The Company intends to defend the action vigorously. No amounts have been accrued for any potential loss under this complaint.
Writ of Kalikasan
On February 25, 2011 a Petition for the Issuance of a Writ of Kalikasan with Prayer for Temporary Environmental Protection Order was filed in the Supreme Court of the Republic of the Philippines in Eliza M. Hernandez, Mamerto M. Lanete and Godofredo L. Manoy versus Placer Dome Inc. and Barrick Gold Corporation, SC G.R. No. 195482 (the “Petition”). On March 8, 2011, the Supreme Court issued an En Banc Resolution and Writ of Kalikasan and directed service of summons on Placer Dome Inc. and the Company, ordered Placer Dome Inc. and the Company to make a verified return of the Writ with ten (10) days of service and referred the case to the Court of Appeal for hearing. The Petition alleges that Placer Dome Inc. violated the
petitioners’ constitutional right to a balanced and healthful ecology as a result of, amongst other things, the discharge of tailings into Calancan Bay, the 1993 Maguila-Guila dam break, the 1996 Boac river tailings spill and failure of Marcopper to properly decommission the Marcopper mine. The petitioners have pleaded that the Company is liable for the alleged actions and omissions of Placer Dome Inc. which was a minority indirect shareholder of Marcopper at all relevant times and is seeking orders requiring the Company to environmentally remediate the areas in and around the mine site that are alleged to have sustained environmental impacts. The petitioners purported to serve the Company on March 25, 2011.
On March 31, 2011, the Company filed an Urgent Motion For Ruling on Jurisdiction with the Supreme Court challenging the constitutionality of the Rules of Procedure in Environmental Cases (the “Environmental Rules”) pursuant to which the Petition was filed, as well as the jurisdiction of the Court over the Company. As required by the Environmental Rules, by special appearance and without submitting to the jurisdiction of the Court, on April 4, 2011, the Company filed its Return Ad Cautelam to the Writ seeking the dismissal of the Petition with prejudice. On April 12, 2011, the Supreme Court issued a Resolution requiring the petitioners to submit a Comment on the Company’s Urgent Motion for Ruling on Jurisdiction within ten days of receiving notice of the Resolution. On or around April 27, 2011, the petitioners purported to make discovery requests of the Company and Placer Dome Inc. (collectively, the “Discovery Requests”). On May 4, 2011, the Court of Appeals issued a Resolution: (i) directing the petitioners to submit a Comment on the Company’s Urgent Motion for Ruling on Jurisdiction; and (ii) putting the petitioners’ Discovery Requests in abeyance pending resolution of the Company’s Urgent Motion for Ruling on Jurisdiction. On May 16, 2011, the Company, appearing specially and without submitting to the Supreme Court’s jurisdiction, filed with the Supreme Court a Clarificatory Manifestation seeking clarification as to whether the Court of Appeals or the Supreme Court has jurisdiction over the matter. On June 2, 2011, the petitioners served an Opposition to the Company’s Urgent Motion for Ruling on Jurisdiction.
On June 6, 2011, a mail package addressed to Placer Dome Inc. from the Philippines Office of the Solicitor General purported to serve summons and other materials on Placer Dome Inc. On or about June 6, 2011, the Company, appearing specially and without submitting to the Supreme Court’s jurisdiction, filed a Manifestation drawing to the Court’s attention the fact that each of the Court of Appeals and the Supreme Court had issued (inconsistent)
| | | | |
| BARRICK YEAR END 2011 | | 157 | | NOTES TO FINANCIAL STATEMENTS |
Resolutions indicating that they would each resolve the Company’s Urgent Motion for Ruling on Jurisdiction. The Company requested that all further proceedings in the case, both before the Supreme Court and the Court of Appeals, be suspended pending issuance of the clarification sought in the Company’s Clarifactory Manifestation. By Manifestation dated June 10, 2011, Placer Dome Inc., by special appearance and without submitting itself to the Supreme Court’s jurisdiction: (i) adopted the Company’s Urgent Motion for Ruling on Jurisdiction and reserved the right to file a supplement thereto; and (ii) joined the Company in seeking clarification as to which court has jurisdiction over this matter. By Manifestation dated June 16, 2011, Placer Dome Inc., by special appearance and without submitting itself to the Supreme Court’s jurisdiction: (i) adopted as its own the Company’s Return Ad Cautelam; and (ii) reserved the right to supplement this Return after the Supreme Court has clarified which court has jurisdiction.
The Supreme Court issued a Resolution dated June 21, 2011 in which it referred the records of the case to the Court of Appeals for appropriate action on the various pending motions. In June 2011, the Petitioners filed their Opposition to the Urgent Motion for Ruling on Jurisdiction. On July 1, 2011, Placer Dome Inc., by special appearance and without submitting themselves to the court’s jurisdiction, filed a Supplement to the pending Urgent Motion for Ruling on Jurisdiction. On July 8, 2011, the Company and Placer Dome Inc., by special appearance and without submitting themselves to the jurisdiction of the Court of Appeals, filed a Manifestation: (i) indicating their understanding that the Supreme Court Resolution dated June 21, 2011 resolves the issues raised in the Clarificatory Manifestation and effectively rules that the Supreme Court has lost or relinquished subject matter jurisdiction over the case effective June 21, 2011 and has transferred jurisdiction to the Court of Appeals; (ii) manifesting their intention to file a Second Supplement to the Urgent Motion for Ruling on Jurisdiction. On July 12, 2011, the Company and Placer Dome Inc. filed, under special and limited appearance and without submitting themselves to the Court of Appeal’s jurisdiction, a Second Supplement to their Urgent Motion for Ruling on Jurisdiction. On July 14, 2011, the Company and Placer Dome Inc., by special appearance and without submitting themselves to the jurisdiction of the Court, filed a Manifestation submitting that they are entitled to be heard on the Petitioners’ Urgent Motion dated April 12, 2011 (regarding service related issues) and Manifestation with Reiterated Motion dated May 11, 2011 (also regarding service related issues), neither of which had been served on the Company and Placer Dome Inc. On September 8, 2011, in response to learning that the Supreme Court had granted
the Petitioners’ Urgent Motion dated April 12, 2011 and Manifestation with Reiterated Motion dated May 11, 2011 in its Resolution dated May 31, 2011, without the Company or Placer Dome Inc. being aware of such motions or having an opportunity to respond to them, the Company and Placer Dome Inc., by special appearance and without submitting themselves to the jurisdiction of the Court, filed a Manifestation submitting that the Supreme Court’s May 31, 2011 Resolution is functus officio and moot and, in any event, is void and legally ineffective. On or about August 8, 2011, the Petitioners filed a Comment (to the Supplement and Second Supplement to the Urgent Motion for Ruling on Jurisdiction). On September 1, 2011, the Company and Placer Dome Inc. Inc., by special appearance and without submitting themselves to the jurisdiction of the Court, filed a Consolidated Reply to the Petitioners’ June, 2011 Opposition and August 8, 2011 Comment. The Urgent Motion for Ruling on Jurisdiction is now fully briefed. No decision has as yet been issued with respect to either the Urgent Motion for Ruling on Jurisdiction or the Manifestations dated July 14, 2011 and September 8, 2011.
On November 23, 2011, the Company’s counsel received a Motion for Intervention, dated November 18, 2011, filed with the Supreme Court. In this Motion for Intervention, two local governments, or “baranguays” (Baranguay San Antonio and Baranguay Lobo), seek intervenor status in the proceedings with the intention of seeking a dismissal of the proceedings. No decision has been issued with respect to this motion. No amounts have been accrued for any potential loss under this matter.
Reko Diq Arbitration
On February 15, 2011, Tethyan Copper Company Pakistan (Private) Limited (“TCCP”) (the local operating subsidiary of Tethyan Copper Company (“TCC”)) submitted to the Government of the Province of Balochistan (the “GOB”) an application for a mining lease in respect of the Reko Diq project in Pakistan. Barrick currently indirectly holds 50% of the shares of TCC, with Antofagasta Plc (“Antofagasta”) indirectly holding the other 50%.
TCC believes that, under the Chagai Hills Joint Venture Agreement (the “CHEJVA”) between TCC and the GOB, as well as under the 2002 Balochistan Mineral Rules, TCCP was legally entitled to the mining lease subject only to “routine” government requirements. On September 21, 2011, the GOB delivered a notice to TCC advising that it considered TCCP’s application to be incomplete and unsatisfactory and giving TCC 30 days in which to respond. On October 19, 2011, TCCP delivered a response to the GOB’s notice. In addition, TCCP delivered a notice of dispute in accordance with the arbitration agreement
| | | | |
| BARRICK YEAR END 2011 | | 158 | | NOTES TO FINANCIAL STATEMENTS |
between TCC and the GOB. On November 15, 2011, the GOB notified TCCP of the rejection of TCCP’s application for the mining lease.
On November 28, 2011, TCCP filed an administrative appeal under the 2002 Balochistan Mineral Rules, calling on the GOB to perform its obligations. On the same day, TCC filed two requests for international arbitration: one against the Government of Pakistan with the International Centre for Settlement of Investment Disputes (“ICSID”) asserting breaches of the Bilateral Investment Treaty between Australia (where TCC is incorporated) and Pakistan, and another against the GOB with the International Chamber of Commerce (“ICC”), asserting breaches of the CHEJVA. Constitution of the ICC arbitration panel is in process. The GOB has filed jurisdictional objections in that proceeding. The ICSID has registered the arbitration request against Pakistan, but Pakistan has not yet taken any action in that proceeding.
Pakistani Constitutional Litigation
In November 2006, a Constitutional Petition was filed in the High Court of Balochistan by three Pakistani citizens against: Barrick, the Governments of Balochistan and Pakistan, the Balochistan Development Authority (“BDA”), TCCP, Antofagasta, Muslim Lakhani and BHP (Pakistan) Pvt Limited (“BHP”).
The Petition alleged, among other things, that the entry by the BDA into the 1993 Joint Venture Agreement (“JVA”) with BHP to facilitate the exploration of the Reko Diq area and the grant of related exploration licenses were illegal and that the subsequent transfer of the interests of BHP in the JVA and the licenses to TCC was also illegal and should therefore be set aside. In June 2007, the High Court of Balochistan dismissed the Petition against Barrick and the other respondents in its entirety. In August 2007, the petitioners filed a Civil Petition for Leave to Appeal in the Supreme Court of Pakistan. In late 2010, the Supreme Court of Pakistan began hearing this matter, together with several other related petitions filed against TCC or its related parties. The related petitions primarily related to whether it would be in the public interest for TCCP to receive a mining lease. On May 25, 2011, the Supreme Court ruled, among other things, that the GOB should proceed to expeditiously decide TCCP’s application for the grant of a mining lease, transparently and fairly in accordance with laws and applicable rules. The Supreme Court also ruled that the petitions before the Court would remain pending.
On November 15, 2011, the GOB notified TCCP of the rejection of TCCP’s application for the mining lease. As noted above, on November 28, 2011, TCC filed the requests for international arbitration with ICSID and the ICC. Subsequently, the Supreme Court has resumed hearing various petitions relating to TCC and the Reko Diq project, including applications seeking an order staying the ICSID and ICC arbitrations. On February 7, 2012, the Supreme Court issued an order directing the GOB and Pakistan to request to the ICC and ICSID to refrain from taking further steps in respect of the arbitration proceedings and to extend the deadline for nomination of an arbitrator, pending disposition of the constitutional petitions by the Supreme Court.
TCC continues to pursue its rights under international arbitration, and Barrick, and TCCP continue to vigorously defend the above actions. No amounts have been accrued for any potential loss under these complaints.
Pueblo Viejo
In April 2010, Pueblo Viejo Dominicana Corporation (“PVDC”) received a copy of an action filed in the Dominican Republic by Fundacion Amigo de Maimon Inc., Fundacion Miguel L. de Pena Garcia Inc., and a number of individuals. The action alleges a variety of matters couched as violations of fundamental rights, including taking of private property, violations of mining and environmental and other laws, slavery, human trafficking, and bribery of government officials. The complaint does not describe the relief sought, but the action is styled as an “Amparo” remedy, which typically includes some form of injunctive relief. PVDC intends to vigorously defend the action. No amounts have been accrued for any potential loss under this matter.
Argentine Glacier Legislation
On September 30, 2010, the National Law on Minimum Requirements for the Protection of Glaciers was enacted in Argentina, and came into force in early November 2010. The federal law bans new mining exploration and exploitation activities on glaciers and in the “peri-glacial” environment, and subjects ongoing mining activities to an environmental audit. If such audit identifies significant impacts on glaciers and peri-glacial environment, the relevant authority is empowered to take action, which according to the legislation could include the suspension or relocation of the activity. In the case of the Veladero mine and the Pascua-Lama project, the competent authority is the Province of San Juan. The Province of San Juan had previously adopted glacier protection legislation, with which Veladero and Pascua-Lama comply. In November 2010, in response to legal actions brought against the
| | | | |
| BARRICK YEAR END 2011 | | 159 | | NOTES TO FINANCIAL STATEMENTS |
National State by local unions and San Juan based mining and construction chambers, as well as by Barrick’s subsidiaries, Barrick Exploraciones Argentina S.A. and Minera Argentina Gold S.A., which own the Veladero mine and the Argentine portion of the Pascua-Lama project, respectively, the Federal Court in the Province of San Juan, granted injunctions, based on the unconstitutionality of the federal law, suspending its application in the Province and, in particular to Veladero and Pascua-Lama. In December 2010, the Province of San Juan became a party to the actions, joining the challenge to the constitutionality of the new federal legislation. As a result of the intervention of the Province, the actions were removed to the National Supreme Court of Justice of Argentina to determine the constitutionality of the legislation.
The National Supreme Court of Justice of Argentina issued a decision determining that this case falls within its jurisdiction. The National State has filed a remedy for revocation of the decision of the Federal Court in the Province of San Juan to grant injunctions suspending the application of the federal law in the Province of San Juan. BEASA and MAGSA answered this remedy on June 29, 2011. No amounts have been accrued for any potential loss under this matter.
| | | | |
| BARRICK YEAR END 2011 | | 160 | | NOTES TO FINANCIAL STATEMENTS |
SUMMARY GOLD MINERAL RESERVES AND MINERAL RESOURCES(1,2,3)
| | | | | | | | | | | | | | | | | | | | | | | | | | |
| For the year ended December 31, 2011 | | | | 2011 | | | 2010 | |
| Based on attributable ounces | | | | Tons
(000’s) | | | Grade
(oz/ton) | | | Ounces
(000’s) | | | Tons
(000’s) | | | Grade
(oz/ton) | | | Ounces
(000’s) | |
NORTH AMERICA | | | | | | | | | | | | | | | | | | | | | | | | | | |
Goldstrike Open Pit | | (proven and probable) | | | 97,325 | | | | 0.096 | | | | 9,342 | | | | 95,865 | | | | 0.101 | | | | 9,656 | |
| | | (mineral resource) | | | 4,612 | | | | 0.032 | | | | 147 | | | | 4,694 | | | | 0.037 | | | | 173 | |
Goldstrike Underground | | (proven and probable) | | | 11,895 | | | | 0.255 | | | | 3,035 | | | | 10,872 | | | | 0.272 | | | | 2,958 | |
| | | (mineral resource) | | | 6,077 | | | | 0.301 | | | | 1,828 | | | | 6,771 | | | | 0.298 | | | | 2,020 | |
Goldstrike Property Total | | (proven and probable) | | | 109,220 | | | | 0.113 | | | | 12,377 | | | | 106,737 | | | | 0.118 | | | | 12,614 | |
| | | (mineral resource) | | | 10,689 | | | | 0.185 | | | | 1,975 | | | | 11,465 | | | | 0.191 | | | | 2,193 | |
Pueblo Viejo (60.00%) | | (proven and probable) | | | 188,729 | | | | 0.080 | | | | 15,173 | | | | 168,417 | | | | 0.084 | | | | 14,195 | |
| | | (mineral resource) | | | 120,194 | | | | 0.055 | | | | 6,597 | | | | 96,807 | | | | 0.059 | | | | 5,675 | |
Cortez | | (proven and probable) | | | 306,879 | | | | 0.047 | | | | 14,488 | | | | 317,081 | | | | 0.046 | | | | 14,494 | |
| | | (mineral resource) | | | 54,391 | | | | 0.069 | | | | 3,757 | | | | 60,463 | | | | 0.071 | | | | 4,320 | |
Red Hill - Gold Rush | | (proven and probable) | | | - | | | | - | | | | - | | | | - | | | | - | | | | - | |
| | | (mineral resource) | | | 11,221 | | | | 0.113 | | | | 1,273 | | | | - | | | | - | | | | - | |
Bald Mountain | | (proven and probable) | | | 307,162 | | | | 0.017 | | | | 5,102 | | | | 246,711 | | | | 0.019 | | | | 4,748 | |
| | | (mineral resource) | | | 123,191 | | | | 0.013 | | | | 1,623 | | | | 151,944 | | | | 0.011 | | | | 1,680 | |
Turquoise Ridge (75.00%) | | (proven and probable) | | | 11,986 | | | | 0.442 | | | | 5,294 | | | | 9,254 | | | | 0.456 | | | | 4,224 | |
| | | (mineral resource) | | | 62,394 | | | | 0.122 | | | | 7,641 | | | | 64,219 | | | | 0.131 | | | | 8,415 | |
Round Mountain (50.00%) | | (proven and probable) | | | 82,688 | | | | 0.017 | | | | 1,411 | | | | 73,017 | | | | 0.018 | | | | 1,319 | |
| | | (mineral resource) | | | 83,420 | | | | 0.016 | | | | 1,338 | | | | 50,865 | | | | 0.022 | | | | 1,107 | |
South Arturo (60.00%) | | (proven and probable) | | | 28,237 | | | | 0.050 | | | | 1,398 | | | | 27,358 | | | | 0.051 | | | | 1,391 | |
| | | (mineral resource) | | | 21,482 | | | | 0.039 | | | | 828 | | | | 16,041 | | | | 0.043 | | | | 692 | |
Ruby Hill | | (proven and probable) | | | 16,778 | | | | 0.058 | | | | 978 | | | | 17,182 | | | | 0.065 | | | | 1,122 | |
| | | (mineral resource) | | | 107,626 | | | | 0.021 | | | | 2,245 | | | | 61,530 | | | | 0.023 | | | | 1,390 | |
Hemlo | | (proven and probable) | | | 16,620 | | | | 0.069 | | | | 1,139 | | | | 18,388 | | | | 0.074 | | | | 1,362 | |
| | | (mineral resource) | | | 4,735 | | | | 0.087 | | | | 410 | | | | 4,184 | | | | 0.071 | | | | 299 | |
Marigold Mine (33.33%) | | (proven and probable) | | | 77,285 | | | | 0.015 | | | | 1,194 | | | | 47,843 | | | | 0.016 | | | | 775 | |
| | | (mineral resource) | | | 10,977 | | | | 0.012 | | | | 135 | | | | 26,842 | | | | 0.014 | | | | 387 | |
Golden Sunlight | | (proven and probable) | | | 8,932 | | | | 0.055 | | | | 487 | | | | 9,649 | | | | 0.056 | | | | 539 | |
| | | (mineral resource) | | | 716 | | | | 0.041 | | | | 29 | | | | 1,231 | | | | 0.047 | | | | 58 | |
Donlin Gold (50.00%) | | (proven and probable) | | | - | | | | - | | | | - | | | | - | | | | - | | | | - | |
| | | (mineral resource) | | | 298,358 | | | | 0.065 | | | | 19,503 | | | | 322,485 | | | | 0.060 | | | | 19,357 | |
SOUTH AMERICA | | | | | | | | | | | | | | | | | | | | | | | | | | |
Cerro Casale (75.00%) | | (proven and probable) | | | 990,088 | | | | 0.018 | | | | 17,434 | | | | 1,002,722 | | | | 0.017 | | | | 17,377 | |
| | | (mineral resource) | | | 245,990 | | | | 0.010 | | | | 2,494 | | | | 199,842 | | | | 0.012 | | | | 2,376 | |
Pascua-Lama | | (proven and probable) | | | 424,117 | | | | 0.042 | | | | 17,861 | | | | 423,931 | | | | 0.042 | | | | 17,845 | |
| | | (mineral resource) | | | 269,930 | | | | 0.025 | | | | 6,734 | | | | 231,590 | | | | 0.027 | | | | 6,260 | |
Veladero | | (proven and probable) | | | 481,153 | | | | 0.022 | | | | 10,558 | | | | 483,181 | | | | 0.023 | | | | 11,291 | |
| | | (mineral resource) | | | 44,029 | | | | 0.011 | | | | 464 | | | | 51,130 | | | | 0.012 | | | | 600 | |
Lagunas Norte | | (proven and probable) | | | 214,418 | | | | 0.029 | | | | 6,151 | | | | 210,104 | | | | 0.031 | | | | 6,618 | |
| | | (mineral resource) | | | 35,164 | | | | 0.014 | | | | 505 | | | | 40,529 | | | | 0.019 | | | | 756 | |
Pierina | | (proven and probable) | | | 67,865 | | | | 0.011 | | | | 771 | | | | 59,947 | | | | 0.013 | | | | 791 | |
| | | (mineral resource) | | | 10,243 | | | | 0.013 | | | | 132 | | | | 18,288 | | | | 0.015 | | | | 273 | |
AUSTRALIA PACIFIC | | | | | | | | | | | | | | | | | | | | | 165.000 | | | | | |
Porgera (95.00%) | | (proven and probable) | | | 75,372 | | | | 0.084 | | | | 6,366 | | | | 83,611 | | | | 0.089 | | | | 7,432 | |
| | | (mineral resource) | | | 27,369 | | | | 0.071 | | | | 1,933 | | | | 19,535 | | | | 0.074 | | | | 1,449 | |
Kalgoorlie (50.00%) | | (proven and probable) | | | 108,843 | | | | 0.040 | | | | 4,394 | | | | 70,860 | | | | 0.053 | | | | 3,780 | |
| | | (mineral resource) | | | 23,211 | | | | 0.033 | | | | 766 | | | | 46,907 | | | | 0.025 | | | | 1,152 | |
Cowal | | (proven and probable) | | | 65,280 | | | | 0.034 | | | | 2,209 | | | | 71,050 | | | | 0.035 | | | | 2,478 | |
| | | (mineral resource) | | | 37,191 | | | | 0.032 | | | | 1,187 | | | | 47,349 | | | | 0.032 | | | | 1,503 | |
Plutonic | | (proven and probable) | | | 2,987 | | | | 0.135 | | | | 402 | | | | 2,078 | | | | 0.202 | | | | 420 | |
| | | (mineral resource) | | | 2,451 | | | | 0.275 | | | | 675 | | | | 3,130 | | | | 0.262 | | | | 820 | |
Kanowna Belle | | (proven and probable) | | | 5,861 | | | | 0.142 | | | | 832 | | | | 6,813 | | | | 0.159 | | | | 1,086 | |
| | | (mineral resource) | | | 6,326 | | | | 0.124 | | | | 786 | | | | 7,201 | | | | 0.125 | | | | 901 | |
Darlot | | (proven and probable) | | | 2,805 | | | | 0.127 | | | | 357 | | | | 3,241 | | | | 0.124 | | | | 403 | |
| | | (mineral resource) | | | 1,345 | | | | 0.192 | | | | 258 | | | | 1,676 | | | | 0.153 | | | | 256 | |
Granny Smith | | (proven and probable) | | | 4,034 | | | | 0.157 | | | | 635 | | | | 4,018 | | | | 0.154 | | | | 617 | |
| | | (mineral resource) | | | 2,507 | | | | 0.166 | | | | 417 | | | | 3,419 | | | | 0.175 | | | | 599 | |
Lawlers | | (proven and probable) | | | 1,669 | | | | 0.140 | | | | 234 | | | | 2,124 | | | | 0.166 | | | | 352 | |
| | | (mineral resource) | | | 977 | | | | 0.289 | | | | 282 | | | | 1,118 | | | | 0.249 | | | | 278 | |
Reko Diq (37.50%)(4) | | (proven and probable) | | | - | | | | - | | | | - | | | | - | | | | - | | | | - | |
| | | (mineral resource) | | | 1,232,986 | | | | 0.008 | | | | 9,506 | | | | 1,232,986 | | | | 0.008 | | | | 9,506 | |
AFRICA | | | | | | | | | | | | | | | | | | | | | | | | | | |
Bulyanhulu (73.90%) | | (proven and probable) | | | 22,963 | | | | 0.342 | | | | 7,857 | | | | 23,903 | | | | 0.341 | | | | 8,147 | |
| | | (mineral resource) | | | 14,472 | | | | 0.154 | | | | 2,230 | | | | 9,011 | | | | 0.236 | | | | 2,128 | |
North Mara (73.90%) | | (proven and probable) | | | 28,997 | | | | 0.089 | | | | 2,575 | | | | 22,502 | | | | 0.093 | | | | 2,096 | |
| | | (mineral resource) | | | 13,025 | | | | 0.082 | | | | 1,064 | | | | 15,183 | | | | 0.089 | | | | 1,355 | |
Buzwagi (73.90%) | | (proven and probable) | | | 50,036 | | | | 0.043 | | | | 2,154 | | | | 45,277 | | | | 0.047 | | | | 2,137 | |
| | | (mineral resource) | | | 28,910 | | | | 0.033 | | | | 947 | | | | 14,727 | | | | 0.028 | | | | 417 | |
Nyanzaga (73.90%) | | (proven and probable) | | | - | | | | - | | | | - | | | | - | | | | - | | | | - | |
| | | (mineral resource) | | | 60,186 | | | | 0.043 | | | | 2,572 | | | | - | | | | - | | | | | |
Tulawaka (51.73%) | | (proven and probable) | | | 135 | | | | 0.348 | | | | 47 | | | | 261 | | | | 0.188 | | | | 49 | |
| | | (mineral resource) | | | 500 | | | | 0.160 | | | | 80 | | | | 422 | | | | 0.159 | | | | 67 | |
OTHER | | (proven and probable) | | | 173 | | | | 0.306 | | | | 53 | | | | 210 | | | | 0.400 | | | | 84 | |
| | | (mineral resource) | | | 37 | | | | 0.351 | | | | 13 | | | | 163 | | | | 0.307 | | | | 50 | |
TOTAL | | (proven and probable) | | | 3,701,312 | | | | 0.038 | | | | 139,931 | | | | 3,557,470 | | | | 0.039 | | | | 139,786 | |
| | | (mineral resource) | | | 2,966,243 | | | | 0.027 | | | | 80,399 | | | | 2,812,282 | | | | 0.027 | | | | 76,319 | |
| (1) | Resources which are not reserves do not have demonstrated economic viability. |
| (2) | See accompanying footnote #1. |
| (3) | Measured plus indicated resources. |
| (4) | See accompanying footnote #2. |
161
GOLD MINERAL RESERVES(1)
| | | | | | | | | | | | | | | | | | | | | | | | | | | | | | | | | | | | | | | | |
| As at December 31, 2011 | | | | | PROVEN | | | | | | | | | | | PROBABLE | | | | | | | | | | | TOTAL | | | | |
| | | Tons | | | Grade | | | Contained ozs | | | | | Tons | | | Grade | | | Contained ozs | | | | | Tons | | | Grade | | | Contained ozs | |
| Based on attributable ounces | | (000’s) | | | (oz/ton) | | | (000’s) | | | | | (000’s) | | | (oz/ton) | | | (000’s) | | | | | (000’s) | | | (oz/ton) | | | (000’s) | |
NORTH AMERICA | | | | | | | | | | | | | | | | | | | | | | | | | | | | | | | | | | | | | | | | |
Goldstrike Open Pit | | | 58,885 | | | | 0.092 | | | | 5,427 | | | | | | 38,440 | | | | 0.102 | | | | 3,915 | | | | | | 97,325 | | | | 0.096 | | | | 9,342 | |
Goldstrike Underground | | | 4,071 | | | | 0.330 | | | | 1,344 | | | | | | 7,824 | | | | 0.216 | | | | 1,691 | | | | | | 11,895 | | | | 0.255 | | | | 3,035 | |
Goldstrike Property Total | | | 62,956 | | | | 0.108 | | | | 6,771 | | | | | | 46,264 | | | | 0.121 | | | | 5,606 | | | | | | 109,220 | | | | 0.113 | | | | 12,377 | |
Pueblo Viejo (60.00%) | | | 23,925 | | | | 0.098 | | | | 2,342 | | | | | | 164,804 | | | | 0.078 | | | | 12,831 | | | | | | 188,729 | | | | 0.080 | | | | 15,173 | |
Cortez | | | 30,714 | | | | 0.070 | | | | 2,153 | | | | | | 276,165 | | | | 0.045 | | | | 12,335 | | | | | | 306,879 | | | | 0.047 | | | | 14,488 | |
Bald Mountain | | | 86,914 | | | | 0.019 | | | | 1,614 | | | | | | 220,248 | | | | 0.016 | | | | 3,488 | | | | | | 307,162 | | | | 0.017 | | | | 5,102 | |
Turquoise Ridge (75.00%) | | | 5,000 | | | | 0.444 | | | | 2,222 | | | | | | 6,986 | | | | 0.440 | | | | 3,072 | | | | | | 11,986 | | | | 0.442 | | | | 5,294 | |
Round Mountain (50.00%) | | | 27,521 | | | | 0.020 | | | | 562 | | | | | | 55,167 | | | | 0.015 | | | | 849 | | | | | | 82,688 | | | | 0.017 | | | | 1,411 | |
South Arturo (60.00%) | | | - | | | | - | | | | - | | | | | | 28,237 | | | | 0.050 | | | | 1,398 | | | | | | 28,237 | | | | 0.050 | | | | 1,398 | |
Ruby Hill | | | 965 | | | | 0.060 | | | | 58 | | | | | | 15,813 | | | | 0.058 | | | | 920 | | | | | | 16,778 | | | | 0.058 | | | | 978 | |
Hemlo | | | 3,661 | | | | 0.102 | | | | 375 | | | | | | 12,959 | | | | 0.059 | | | | 764 | | | | | | 16,620 | | | | 0.069 | | | | 1,139 | |
Marigold Mine (33.33%) | | | 13,232 | | | | 0.017 | | | | 221 | | | | | | 64,053 | | | | 0.015 | | | | 973 | | | | | | 77,285 | | | | 0.015 | | | | 1,194 | |
Golden Sunlight | | | 2,689 | | | | 0.057 | | | | 153 | | | | | | 6,243 | | | | 0.053 | | | | 334 | | | | | | 8,932 | | | | 0.055 | | | | 487 | |
SOUTH AMERICA | | | | | | | | | | | | | | | | | | | | | | | | | | | | | | | | | | | | | | | | |
Cerro Casale (75.00%) | | | 189,900 | | | | 0.019 | | | | 3,586 | | | | | | 800,188 | | | | 0.017 | | | | 13,848 | | | | | | 990,088 | | | | 0.018 | | | | 17,434 | |
Pascua-Lama | | | 43,514 | | | | 0.050 | | | | 2,167 | | | | | | 380,603 | | | | 0.041 | | | | 15,694 | | | | | | 424,117 | | | | 0.042 | | | | 17,861 | |
Veladero | | | 36,931 | | | | 0.022 | | | | 828 | | | | | | 444,222 | | | | 0.022 | | | | 9,730 | | | | | | 481,153 | | | | 0.022 | | | | 10,558 | |
Lagunas Norte | | | 17,132 | | | | 0.036 | | | | 625 | | | | | | 197,286 | | | | 0.028 | | | | 5,526 | | | | | | 214,418 | | | | 0.029 | | | | 6,151 | |
Pierina | | | 6,813 | | | | 0.015 | | | | 103 | | | | | | 61,052 | | | | 0.011 | | | | 668 | | | | | | 67,865 | | | | 0.011 | | | | 771 | |
AUSTRALIA PACIFIC | | | | | | | | | | | | | | | | | | | | | | | | | | | | | | | | | | | | | | | | |
Porgera (95.00%) | | | 18,267 | | | | 0.117 | | | | 2,138 | | | | | | 57,105 | | | | 0.074 | | | | 4,228 | | | | | | 75,372 | | | | 0.084 | | | | 6,366 | |
Kalgoorlie (50.00%) | | | 67,193 | | | | 0.030 | | | | 2,047 | | | | | | 41,650 | | | | 0.056 | | | | 2,347 | | | | | | 108,843 | | | | 0.040 | | | | 4,394 | |
Cowal | | | 14,774 | | | | 0.024 | | | | 353 | | | | | | 50,506 | | | | 0.037 | | | | 1,856 | | | | | | 65,280 | | | | 0.034 | | | | 2,209 | |
Plutonic | | | 1,015 | | | | 0.025 | | | | 25 | | | | | | 1,972 | | | | 0.191 | | | | 377 | | | | | | 2,987 | | | | 0.135 | | | | 402 | |
Kanowna Belle | | | 3,403 | | | | 0.146 | | | | 497 | | | | | | 2,458 | | | | 0.136 | | | | 335 | | | | | | 5,861 | | | | 0.142 | | | | 832 | |
Darlot | | | 1,627 | | | | 0.126 | | | | 205 | | | | | | 1,178 | | | | 0.129 | | | | 152 | | | | | | 2,805 | | | | 0.127 | | | | 357 | |
Granny Smith | | | 1,060 | | | | 0.158 | | | | 168 | | | | | | 2,974 | | | | 0.157 | | | | 467 | | | | | | 4,034 | | | | 0.157 | | | | 635 | |
Lawlers | | | 859 | | | | 0.157 | | | | 135 | | | | | | 810 | | | | 0.122 | | | | 99 | | | | | | 1,669 | | | | 0.140 | | | | 234 | |
Henty | | | - | | | | - | | | | - | | | | | | - | | | | - | | | | - | | | | | | - | | | | - | | | | - | |
AFRICA | | | | | | | | | | | | | | | | | | | | | | | | | | | | | | | | | | | | | | | | |
Bulyanhulu (73.90%) | | | 1,002 | | | | 0.314 | | | | 315 | | | | | | 21,961 | | | | 0.343 | | | | 7,542 | | | | | | 22,963 | | | | 0.342 | | | | 7,857 | |
North Mara (73.90%) | | | 9,367 | | | | 0.081 | | | | 761 | | | | | | 19,630 | | | | 0.092 | | | | 1,814 | | | | | | 28,997 | | | | 0.089 | | | | 2,575 | |
Buzwagi (73.90%) | | | 4,039 | | | | 0.032 | | | | 129 | | | | | | 45,997 | | | | 0.044 | | | | 2,025 | | | | | | 50,036 | | | | 0.043 | | | | 2,154 | |
Tulawaka (51.73%) | | | 36 | | | | 0.111 | | | | 4 | | | | | | 99 | | | | 0.434 | | | | 43 | | | | | | 135 | | | | 0.348 | | | | 47 | |
OTHER | | | 131 | | | | 0.344 | | | | 45 | | | | | | 42 | | | | 0.190 | | | | 8 | | | | | | 173 | | | | 0.306 | | | | 53 | |
TOTAL | | | 674,640 | | | | 0.045 | | | | 30,602 | | | | | | 3,026,672 | | | | 0.036 | | | | 109,329 | | | | | | 3,701,312 | | | | 0.038 | | | | 139,931 | |
| | | | | | | | | | |
| COPPER MINERAL RESERVES(1) | | | | | | | | | | | | | | | | | | | | | | | | | | | | | | | | | | | | | |
| As at December 31, 2011 | | | | | PROVEN | | | | | | | | | | | PROBABLE | | | | | | | | | | | TOTAL | | | | |
| | | Tons | | | Grade | | | Contained lbs | | | | | Tons | | | Grade | | | Contained lbs | | | | | Tons | | | Grade | | | Contained lbs | |
| Based on attributable pounds | | (000’s) | | | (%) | | | (millions) | | | | | 165 | | | (%) | | | (millions) | | | | | (000’s) | | | (%) | | | (millions) | |
Zaldivar | | | 425,791 | | | | 0.528 | | | | 4,496 | | | | | | 211,304 | | | | 0.498 | | | | 2,106 | | | | | | 637,095 | | | | 0.518 | | | | 6,602 | |
Lumwana | | | 147,415 | | | | 0.587 | | | | 1,731 | | | | | | 322,535 | | | | 0.493 | | | | 3,178 | | | | | | 469,950 | | | | 0.522 | | | | 4,909 | |
Jabal Sayid | | | 16,500 | | | | 2.206 | | | | 728 | | | | | | 10,315 | | | | 2.201 | | | | 454 | | | | | | 26,815 | | | | 2.204 | | | | 1,182 | |
TOTAL | | | 589,706 | | | | 0.590 | | | | 6,955 | | | | | | 544,154 | | | | 0.527 | | | | 5,738 | | | | | | 1,133,860 | | | | 0.560 | | | | 12,693 | |
| (1) | See accompanying footnote #1. |
162
GOLD MINERAL RESOURCES (1,2)
| | | | | | | | | | | | | | | | | | | | | | | | | | | | | | | | | | | | | | | | | | | | | | |
| As at December 31, 2011 | | MEASURED (M) | | | | | | | | INDICATED (I) | | | | | (M) + (I) | | | | | INFERRED | |
| | | Tons | | | Grade | | | Contained ozs | | | | | Tons | | | Grade | | | Contained ozs | | | | | Contained ozs | | | | | Tons | | | Grade | | | Contained ozs | |
| Based on attributable ounces | | (000’s) | | | (oz/ton) | | | (000’s) | | | | | (000’s) | | | (oz/ton) | | | (000’s) | | | | | (000’s) | | | | | (000’s) | | | (oz/ton) | | | (000’s) | |
NORTH AMERICA | | | | | | | | | | | | | | | | | | | | | | | | | | | | | | | | | | | | | | | | | | | | | | |
Goldstrike Open Pit | | | 886 | | | | 0.032 | | | | 28 | | | | | | 3,726 | | | | 0.032 | | | | 119 | | | | | | 147 | | | | | | 564 | | | | 0.055 | | | | 31 | |
Goldstrike Underground | | | 985 | | | | 0.341 | | | | 336 | | | | | | 5,092 | | | | 0.293 | | | | 1,492 | | | | | | 1,828 | | | | | | 2,698 | | | | 0.298 | | | | 805 | |
Goldstrike Property Total | | | 1,871 | | | | 0.195 | | | | 364 | | | | | | 8,818 | | | | 0.183 | | | | 1,611 | | | | | | 1,975 | | | | | | 3,262 | | | | 0.256 | | | | 836 | |
Pueblo Viejo (60.00%) | | | 2,296 | | | | 0.062 | | | | 143 | | | | | | 117,898 | | | | 0.055 | | | | 6,454 | | | | | | 6,597 | | | | | | 14,970 | | | | 0.047 | | | | 701 | |
Cortez | | | 3,159 | | | | 0.038 | | | | 121 | | | | | | 51,232 | | | | 0.071 | | | | 3,636 | | | | | | 3,757 | | | | | | 21,881 | | | | 0.074 | | | | 1,615 | |
Red Hill - Gold Rush | | | - | | | | - | | | | - | | | | | | 11,221 | | | | 0.113 | | | | 1,273 | | | | | | 1,273 | | | | | | 41,290 | | | | 0.139 | | | | 5,748 | |
Bald Mountain | | | 34,428 | | | | 0.014 | | | | 480 | | | | | | 88,763 | | | | 0.013 | | | | 1,143 | | | | | | 1,623 | | | | | | 72,491 | | | | 0.011 | | | | 787 | |
Turquoise Ridge (75.00%) | | | 7,995 | | | | 0.128 | | | | 1,024 | | | | | | 54,399 | | | | 0.122 | | | | 6,617 | | | | | | 7,641 | | | | | | 25,494 | | | | 0.130 | | | | 3,303 | |
Round Mountain (50.00%) | | | 17,795 | | | | 0.022 | | | | 400 | | | | | | 65,625 | | | | 0.014 | | | | 938 | | | | | | 1,338 | | | | | | 38,847 | | | | 0.012 | | | | 464 | |
South Arturo (60.00%) | | | - | | | | - | | | | - | | | | | | 21,482 | | | | 0.039 | | | | 828 | | | | | | 828 | | | | | | 10,458 | | | | 0.023 | | | | 236 | |
Ruby Hill | | | 1,331 | | | | 0.024 | | | | 32 | | | | | | 106,295 | | | | 0.021 | | | | 2,213 | | | | | | 2,245 | | | | | | 5,779 | | | | 0.034 | | | | 196 | |
Hemlo | | | 2,000 | | | | 0.110 | | | | 220 | | | | | | 2,735 | | | | 0.069 | | | | 190 | | | | | | 410 | | | | | | 2,937 | | | | 0.127 | | | | 374 | |
Marigold Mine (33.33%) | | | 683 | | | | 0.012 | | | | 8 | | | | | | 10,294 | | | | 0.012 | | | | 127 | | | | | | 135 | | | | | | 3,674 | | | | 0.013 | | | | 48 | |
Golden Sunlight | | | 121 | | | | 0.041 | | | | 5 | | | | | | 595 | | | | 0.040 | | | | 24 | | | | | | 29 | | | | | | 1,605 | | | | 0.036 | | | | 57 | |
Donlin Gold (50.00%) | | | 4,261 | | | | 0.073 | | | | 313 | | | | | | 294,097 | | | | 0.065 | | | | 19,190 | | | | | | 19,503 | | | | | | 50,825 | | | | 0.059 | | | | 2,997 | |
SOUTH AMERICA | | | | | | | | | | | | | | | | | | | | | | | | | | | | | | | | | | | | | | | | | | | | | | |
Cerro Casale (75.00%) | | | 19,356 | | | | 0.008 | | | | 164 | | | | | | 226,634 | | | | 0.010 | | | | 2,330 | | | | | | 2,494 | | | | | | 413,013 | | | | 0.011 | | | | 4,513 | |
Pascua-Lama | | | 23,420 | | | | 0.031 | | | | 722 | | | | | | 246,510 | | | | 0.024 | | | | 6,012 | | | | | | 6,734 | | | | | | 35,590 | | | | 0.034 | | | | 1,215 | |
Veladero | | | 3,800 | | | | 0.009 | | | | 36 | | | | | | 40,229 | | | | 0.011 | | | | 428 | | | | | | 464 | | | | | | 74,600 | | | | 0.008 | | | | 573 | |
Lagunas Norte | | | 884 | | | | 0.014 | | | | 12 | | | | | | 34,280 | | | | 0.014 | | | | 493 | | | | | | 505 | | | | | | 7,920 | | | | 0.014 | | | | 109 | |
Pierina | | | 581 | | | | 0.012 | | | | 7 | | | | | | 9,662 | | | | 0.013 | | | | 125 | | | | | | 132 | | | | | | 9,474 | | | | 0.006 | | | | 61 | |
AUSTRALIA PACIFIC | | | | | | | | | | | | | | | | | | | | | | | | | | | | | | | | | | | | | | | | | | | | | | |
Porgera (95.00%) | | | 9,065 | | | | 0.080 | | | | 724 | | | | | | 18,304 | | | | 0.066 | | | | 1,209 | | | | | | 1,933 | | | | | | 22,671 | | | | 0.130 | | | | 2,936 | |
Kalgoorlie (50.00%) | | | 6,054 | | | | 0.035 | | | | 212 | | | | | | 17,157 | | | | 0.032 | | | | 554 | | | | | | 766 | | | | | | 348 | | | | 0.078 | | | | 27 | |
Cowal | | | - | | | | - | | | | - | | | | | | 37,191 | | | | 0.032 | | | | 1,187 | | | | | | 1,187 | | | | | | 12,418 | | | | 0.030 | | | | 374 | |
Plutonic | | | 240 | | | | 0.117 | | | | 28 | | | | | | 2,211 | | | | 0.293 | | | | 647 | | | | | | 675 | | | | | | 3,975 | | | | 0.298 | | | | 1,183 | |
Kanowna Belle | | | 2,776 | | | | 0.128 | | | | 354 | | | | | | 3,550 | | | | 0.122 | | | | 432 | | | | | | 786 | | | | | | 5,631 | | | | 0.104 | | | | 588 | |
Darlot | | | 766 | | | | 0.187 | | | | 143 | | | | | | 579 | | | | 0.199 | | | | 115 | | | | | | 258 | | | | | | 1,043 | | | | 0.215 | | | | 224 | |
Granny Smith | | | 403 | | | | 0.159 | | | | 64 | | | | | | 2,104 | | | | 0.168 | | | | 353 | | | | | | 417 | | | | | | 5,316 | | | | 0.237 | | | | 1,261 | |
Lawlers | | | - | | | | - | | | | - | | | | | | 977 | | | | 0.289 | | | | 282 | | | | | | 282 | | | | | | 472 | | | | 0.316 | | | | 149 | |
Reko Diq (37.50%)(3) | | | 718,521 | | | | 0.009 | | | | 6,466 | | | | | | 514,465 | | | | 0.006 | | | | 3,040 | | | | | | 9,506 | | | | | | 1,192,569 | | | | 0.005 | | | | 6,399 | |
AFRICA | | | | | | | | | | | | | | | | | | | | | | | | | | | | | | | | | | | | | | | | | | | | | | |
Bulyanhulu (73.90%) | | | - | | | | - | | | | - | | | | | | 14,472 | | | | 0.154 | | | | 2,230 | | | | | | 2,230 | | | | | | 6,776 | | | | 0.350 | | | | 2,372 | |
North Mara (73.90%) | | | 2,222 | | | | 0.061 | | | | 136 | | | | | | 10,803 | | | | 0.086 | | | | 928 | | | | | | 1,064 | | | | | | 1,269 | | | | 0.075 | | | | 95 | |
Buzwagi (73.90%) | | | 110 | | | | 0.036 | | | | 4 | | | | | | 28,800 | | | | 0.033 | | | | 943 | | | | | | 947 | | | | | | 8,390 | | | | 0.034 | | | | 283 | |
Nyanzaga (73.90%) | | | - | | | | - | | | | - | | | | | | 60,186 | | | | 0.043 | | | | 2,572 | | | | | | 2,572 | | | | | | 7,381 | | | | 0.060 | | | | 442 | |
Tulawaka (51.73%) | | | - | | | | - | | | | - | | | | | | 500 | | | | 0.160 | | | | 80 | | | | | | 80 | | | | | | 95 | | | | 0.168 | | | | 16 | |
OTHER | | | 34 | | | | 0.353 | | | | 12 | | | | | | 3 | | | | 0.333 | | | | 1 | | | | | | 13 | | | | | | 4 | | | | 0.250 | | | | 1 | |
| | | | | | | | | | | | | |
TOTAL | | | 864,172 | | | | 0.014 | | | | 12,194 | | | | | | 2,102,071 | | | | 0.032 | | | | 68,205 | | | | | | 80,399 | | | | | | 2,102,468 | | | | 0.019 | | | | 40,183 | |
| | | | | | | | | | | |
| COPPER MINERAL RESOURCES(1,2) | | | | | | | | 165 | | | | | | | | | | | | | | | | | | | | | | | |
| As at December 31, 2011 | | MEASURED (M) | | | | | | | | INDICATED (I) | | | | | (M) + (I) | | | | | INFERRED | |
| | | Tons | | | Grade | | | Contained lbs | | | | | Tons | | | Grade | | | Contained lbs | | | | | Contained lbs | | | | | Tons | | | Grade | | | Contained lbs | |
| Based on attributable pounds | | (000’s) | | | (%) | | | (millions) | | | | | (000’s) | | | (%) | | | (millions) | | | | | (millions) | | | | | (000’s) | | | (%) | | | (millions) | |
Zaldivar | | | 78,576 | | | | 0.433 | | | | 680 | | | | | | 59,006 | | | | 0.462 | | | | 545 | | | | | | 1,225 | | | | | | 40,439 | | | | 0.543 | | | | 439 | |
Lumwana | | | 4,698 | | | | 0.713 | | | | 67 | | | | | | 162,737 | | | | 0.619 | | | | 2,015 | | | | | | 2,082 | | | | | | 882,479 | | | | 0.604 | | | | 10,660 | |
Jabal Sayid | | | 1,984 | | | | 1.890 | | | | 75 | | | | | | 4,212 | | | | 2.077 | | | | 175 | | | | | | 250 | | | | | | 19,436 | | | | 0.962 | | | | 374 | |
Reko Diq (37.50%)(3) | | | 718,521 | | | | 0.536 | | | | 7,697 | | | | | | 514,465 | | | | 0.392 | | | | 4,034 | | | | | | 11,731 | | | | | | 1,192,569 | | | | 0.352 | | | | 8,393 | |
TOTAL | | | 803,779 | | | | 0.530 | | | | 8,519 | | | | | | 740,420 | | | | 0.457 | | | | 6,769 | | | | | | 15,288 | | | | | | 2,134,923 | | | | 0.465 | | | | 19,866 | |
| (1) | Resources which are not reserves do not have demonstrated economic viability. |
| (2) | See accompanying footnote #1. |
| (3) | See accompanying footnote #2. |
163
CONTAINED SILVER WITHIN REPORTED GOLD RESERVES(1)
| | | | | | | | | | | | | | | | | | | | | | | | | | | | | | | | | | | | | | | | | | | | |
| For the year ended Dec. 31, 2011 | | IN PROVEN GOLD RESERVES | | | | | IN PROBABLE GOLD RESERVES | | | | | TOTAL | |
| Based on attributable ounces | | Tons
(000s) | | | Grade
(oz/ton) | | | Contained ozs
(000s) | | | | | Tons
(000s) | | | Grade
(oz/ton) | | | Contained ozs
(000s) | | | | | Tons
(000s) | | | Grade
(oz/ton) | | | Contained ozs
(000s) | | | Process recovery
% | |
NORTH AMERICA | | | | | | | | | | | | | | | | | | | | | | | | | | | | | | | | | | | | | | | | | | | | |
Pueblo Viejo (60.00%) | | | 23,925 | | | | 0.76 | | | | 18,144 | | | | | | 164,804 | | | | 0.47 | | | | 77,956 | | | | | | 188,729 | | | | 0.51 | | | | 96,100 | | | | 87.1% | |
SOUTH AMERICA | | | | | | | | | | | | | | | | | | | | | | | | | | | | | | | | | | | | | | | | | | | | |
Cerro Casale (75.00%) | | | 189,900 | | | | 0.06 | | | | 10,565 | | | | | | 800,188 | | | | 0.04 | | | | 33,451 | | | | | | 990,088 | | | | 0.04 | | | | 44,016 | | | | 69.0% | |
Pascua-Lama | | | 43,514 | | | | 1.73 | | | | 75,454 | | | | | | 380,603 | | | | 1.58 | | | | 600,795 | | | | | | 424,117 | | | | 1.59 | | | | 676,249 | | | | 81.6% | |
Lagunas Norte | | | 17,132 | | | | 0.12 | | | | 2,021 | | | | | | 197,286 | | | | 0.11 | | | | 21,884 | | | | | | 214,418 | | | | 0.11 | | | | 23,905 | | | | 21.6% | |
Veladero | | | 26,689 | | | | 0.38 | | | | 10,259 | | | | | | 444,222 | | | | 0.42 | | | | 187,436 | | | | | | 470,911 | | | | 0.42 | | | | 197,695 | | | | 6.2% | |
Pierina | | | 6,813 | | | | 0.58 | | | | 3,945 | | | | | | 61,052 | | | | 0.32 | | | | 19,319 | | | | | | 67,865 | | | | 0.34 | | | | 23,264 | | | | 37.0% | |
AFRICA | | | | | | | | | | | | | | | | | | | | | | | | | | | | | | | | | | | | | | | | | | | | |
Bulyanhulu (73.90%) | | | 1,002 | | | | 0.21 | | | | 207 | | | | | | 21,961 | | | | 0.28 | | | | 6,079 | | | | | | 22,963 | | | | 0.27 | | | | 6,286 | | | | 75.0% | |
TOTAL | | | 308,975 | | | | 0.39 | | | | 120,595 | | | | | | 2,070,116 | | | | 0.46 | | | | 946,920 | | | | | | 2,379,091 | | | | 0.45 | | | | 1,067,515 | | | | 65.3% | |
|
(1) Silver is accounted for as a by-product credit against reported or projected gold production costs. | |
|
| CONTAINED COPPER WITHIN REPORTED GOLD RESERVES(1) | |
| For the year ended Dec. 31, 2011 | | IN PROVEN GOLD RESERVES | | | | | IN PROBABLE GOLD RESERVES | | | | | TOTAL | |
| Based on attributable pounds | | Tons
(000s) | | | Grade
(%) | | | Contained lbs
(millions) | | | | | Tons
(000s) | | | Grade
(%) | | | Contained lbs
(millions) | | | | | Tons
(000s) | | | Grade
(%) | | | Contained lbs
(millions) | | | Process recovery
% | |
NORTH AMERICA | | | | | | | | | | | | | | | | | | | | | | | | | | | | | | | | | | | | | | | | | | | | |
Pueblo Viejo (60.00%) | | | 23,925 | | | | 0.080 | | | | 38.3 | | | | | | 164,804 | | | | 0.096 | | | | 316.0 | | | | | | 188,729 | | | | 0.094 | | | | 354.3 | | | | 79.5% | |
SOUTH AMERICA | | | | | | | | | | | | | | | | | | | | | | | | | | | | | | | | | | | | | | | | | | | | |
Cerro Casale (75.00%) | | | 189,900 | | | | 0.190 | | | | 721.3 | | | | | | 800,188 | | | | 0.226 | | | | 3,613.3 | | | | | | 990,088 | | | | 0.219 | | | | 4,334.6 | | | | 87.4% | |
Pascua-Lama | | | 43,514 | | | | 0.096 | | | | 83.7 | | | | | | 380,603 | | | | 0.075 | | | | 574.4 | | | | | | 424,117 | | | | 0.078 | | | | 658.1 | | | | 63.0% | |
AFRICA | | | | | | | | | | | | | | | | | | | | | | | | | | | | | | | | | | | | | | | | | | | | |
Bulyanhulu (73.90%) | | | 1,002 | | | | 0.369 | | | | 7.4 | | | | | | 21,961 | | | | 0.683 | | | | 299.9 | | | | | | 22,963 | | | | 0.669 | | | | 307.3 | | | | 95.0% | |
Buzwagi (73.90%) | | | 4,039 | | | | 0.068 | | | | 5.5 | | | | | | 45,997 | | | | 0.118 | | | | 108.3 | | | | | | 50,036 | | | | 0.114 | | | | 113.8 | | | | 70.0% | |
TOTAL | | | 262,380 | | | | 0.163 | | | | 856.2 | | | | | | 1,413,553 | | | | 0.174 | | | | 4,911.9 | | | | | | 1,675,933 | | | | 0.172 | | | | 5,768.1 | | | | 84.2% | |
| (1) | Copper is accounted for as a by-product credit against reported or projected gold production costs. |
164
| | | | | | | | | | | | | | | | | | | | | | | | | | | | | | | | | | | | | | | | | | | | | | |
| CONTAINED SILVER WITHIN REPORTED GOLD RESOURCES(1) | |
| For the year ended Dec. 31, 2011 | | MEASURED (M) | | | | | | | | INDICATED (I) | | | | | (M) + (I) | | | | | INFERRED | |
| Based on attributable ounces | | Tons
(000’s) | | | Grade (oz/ton) | | | Contained ozs
(000’s) | | | | | Tons
(000’s) | | | Grade (oz/ton) | | | Contained ozs
(000’s) | | | | | Ounces
(000’s) | | | | | Tons
(000’s) | | | Grade (oz/ton) | | | Contained ozs
(000’s) | |
NORTH AMERICA | | | | | | | | | | | | | | | | | | | | | | | | | | | | | | | | | | | | | | | | | | | | | | |
Pueblo Viejo (60.00%) | | | 2,296 | | | | 0.37 | | | | 839 | | | | | | 117,898 | | | | 0.30 | | | | 35,723 | | | | | | 36,562 | | | | | | 14,970 | | | | 0.37 | | | | 5,572 | |
SOUTH AMERICA | | | | | | | | | | | | | | | | | | | | | | | | | | | | | | | | | | | | | | | | | | | | | | |
Cerro Casale (75.00%) | | | 19,356 | | | | 0.04 | | | | 720 | | | | | | 226,634 | | | | 0.03 | | | | 7,257 | | | | | | 7,977 | | | | | | 413,013 | | | | 0.03 | | | | 12,594 | |
Pascua-Lama | | | 23,420 | | | | 0.71 | | | | 16,708 | | | | | | 246,510 | | | | 0.68 | | | | 168,459 | | | | | | 185,167 | | | | | | 35,590 | | | | 0.45 | | | | 16,055 | |
Lagunas Norte | | | 884 | | | | 0.06 | | | | 50 | | | | | | 34,280 | | | | 0.05 | | | | 1,778 | | | | | | 1,828 | | | | | | 7,920 | | | | 0.05 | | | | 397 | |
Veladero | | | 3,800 | | | | 0.16 | | | | 614 | | | | | | 40,229 | | | | 0.35 | | | | 14,049 | | | | | | 14,663 | | | | | | 74,600 | | | | 0.33 | | | | 24,523 | |
Pierina | | | 581 | | | | 0.22 | | | | 128 | | | | | | 9,662 | | | | 0.19 | | | | 1,820 | | | | | | 1,948 | | | | | | 9,474 | | | | 0.31 | | | | 2,928 | |
AFRICA | | | | | | | | | | | | | | | | | | | | | | | | | | | | | | | | | | | | | | | | | | | | | | |
Bulyanhulu (73.90%) | | | - | | | | - | | | | - | | | | | | 14,472 | | | | 0.13 | | | | 1,829 | | | | | | 1,829 | | | | | | 6,529 | | | | 0.30 | | | | 1,949 | |
TOTAL | | | 50,337 | | | | 0.38 | | | | 19,059 | | | | | | 689,685 | | | | 0.33 | | | | 230,915 | | | | | | 249,974 | | | | | | 562,096 | | | | 0.11 | | | | 64,018 | |
|
(1) Resources which are not reserves do not have demonstrated economic viability. | |
|
| CONTAINED COPPER WITHIN REPORTED GOLD RESOURCES(1) | |
| For the year ended Dec. 31, 2011 | | IN MEASURED (M) GOLD RESOURCES | | | | | IN INDICATED (I) GOLD RESOURCES | | | | | (M) + (I) | | | | | INFERRED | |
| Based on attributable pounds | | Tons
(000’s) | | | Grade (%) | | | Contained lbs
(millions) | | | | | Tons
(000’s) | | | Grade (%) | | | Contained lbs
(millions) | | | | | Contained lbs
(millions) | | | | | Tons
(000’s) | | | Grade (%) | | | Contained lbs
(millions) | |
NORTH AMERICA | | | | | | | | | | | | | | | | | | | | | | | | | | | | | | | | | | | | | | | | | | | | | | |
Pueblo Viejo (60.00%) | | | 2,296 | | | | 0.12 | | | | 5.5 | | | | | | 117,898 | | | | 0.084 | | | | 198.3 | | | | | | 203.8 | | | | | | 14,970 | | | | 0.077 | | | | 23.0 | |
SOUTH AMERICA | | | | | | | | | | | | | | | | | | | | | | | | | | | | | | | | | | | | | | | | | | | | | | |
Cerro Casale (75.00%) | | | 19,356 | | | | 0.126 | | | | 48.7 | | | | | | 226,634 | | | | 0.161 | | | | 730.5 | | | | | | 779.2 | | | | | | 413,013 | | | | 0.191 | | | | 1,580.1 | |
Pascua-Lama | | | 23,420 | | | | 0.061 | | | | 28.7 | | | | | | 246,510 | | | | 0.053 | | | | 261.0 | | | | | | 289.7 | | | | | | 35,590 | | | | 0.047 | | | | 33.7 | |
AFRICA | | | | | | | | | | | | | | | | | | | | | | | | | | | | | | | | | | | | | | | | | | | | | | |
Buzwagi (73.90%) | | | 110 | | | | 0.09 | | | | 0.2 | | | | | | 28,800 | | | | 0.098 | | | | 56.7 | | | | | | 56.9 | | | | | | 8,390 | | | | 0.089 | | | | 14.9 | |
TOTAL | | | 45,182 | | | | 0.092 | | | | 83.1 | | | | | | 619,842 | | | | 0.101 | | | | 1,246.5 | | | | | | 1,329.6 | | | | | | 471,963 | | | | 0.175 | | | | 1,651.7 | |
|
(1) Resources which are not reserves do not have demonstrated economic viability. | |
|
| NICKEL MINERAL RESOURCES(1) | |
| For the year ended Dec. 31, 2011 | | MEASURED (M) | | | | | | | | INDICATED (I) | | | | | (M) + (I) | | | | | INFERRED | |
| Based on attributable pounds | | Tons
(000’s) | | | Grade (%) | | | Contained lbs
(millions) | | | | | Tons
(000’s) | | | Grade (%) | | | Contained lbs
(millions) | | | | | Contained lbs
(millions) | | | | | Tons
(000’s) | | | Grade (%) | | | Contained lbs
(millions) | |
AFRICA | | | | | | | | | | | | | | | | | | | | | | | | | | | | | | | | | | | | | | | | | | | | | | |
Kabanga (50.00%) | | | 7,606 | | | | 2.490 | | | | 378.8 | | | | | | 12,897 | | | | 2.720 | | | | 701.6 | | | | | | 1,080.4 | | | | | | 11,464 | | | | 2.600 | | | | 596.1 | |
| (1) | Resources which are not reserves do not have demonstrated economic viability. |
165
MINERAL RESERVES AND RESOURCES NOTES
1. Mineral reserves (“reserves”) and mineral resources (“resources”) have been calculated as at December 31, 2011 in accordance with National Instrument 43-101 as required by Canadian securities regulatory authorities. For United States reporting purposes, Industry Guide 7, (under the Securities and Exchange Act of 1934), as interpreted by Staff of the SEC, applies different standards in order to classify mineralization as a reserve. Accordingly, for U.S. reporting purposes, approximately 2.15 million ounces of reserves at Pueblo Viejo (Barrick’s 60% interest) is classified as mineralized material. In addition, while the terms “measured”, “indicated” and “inferred” mineral resources are required pursuant to National Instrument 43-101, the U.S. Securities and Exchange Commission does not recognize such terms. Canadian standards differ significantly from the requirements of the U.S. Securities and Exchange Commission, and mineral resource information contained herein is not comparable to similar information regarding mineral reserves disclosed in accordance with the requirements of the U.S. Securities and Exchange Commission. U.S. investors should understand that “inferred” mineral resources have a great amount of uncertainty as to their existence and great uncertainty as to their economic and legal feasibility. In addition, U.S. investors are cautioned not to assume that any part or all of Barrick’s mineral resources constitute or will be converted into reserves. Calculations have been prepared by employees of Barrick, its joint venture partners or its joint venture operating companies, as applicable, under the supervision of Rick Sims, Senior Director, Resources and Reserves of Barrick, Chris Woodall, Senior Director, Mining of Barrick and John Lindsay, Senior Director Metallurgy, of Barrick. Except as noted below, reserves have been calculated using an assumed long-term average gold price of $US 1,200 ($Aus.1,330) per ounce, a silver price of $US 22.00 per ounce, a copper price of $US 2.75 per pound and exchange rates of 1.0 $Can/$US and 0.90 $US/$Aus. Reserves at Plutonic have been calculated using an assumed long-term average gold price of $US 1,250. Reserve calculations incorporate current and/or expected mine plans and cost levels at each property. Varying cut-off grades have been used depending on the mine and type of ore contained in the reserves. Barrick’s normal data verification procedures have been employed in connection with the calculations. Resources as at December 31, 2011 have been estimated using varying cut-off grades, depending on both the type of mine or project, its maturity and ore types at each property. For a breakdown of reserves and resources by category and for a more detailed description of the key assumptions, parameters and methods used in calculating Barrick’s reserves and resources, see Barrick’s most recent Annual Information Form/Form 40-F on file with Canadian provincial securities regulatory authorities and the U.S. Securities and Exchange Commission.
2. In November 2011, the Government of the Province of Balochistan rejected the application for a mining lease in respect of the Reko Diq project. Tethyan Copper Company (“TCC”) has commenced international arbitration proceedings asserting, among other things, that its local operating subsidiary is legally entitled to the mining lease subject only to “routine” government requirements. For additional information regarding this matter, see pages 21 and 158 to 159 of Barrick’s Year-End Report 2011.
| | |
CORPORATE OFFICE | | TRANSFER AGENTS AND REGISTRARS |
Barrick Gold Corporation | | CIBC Mellon Trust Company* |
Brookfield Place, TD Canada Trust Tower | | P.O. Box 700, Postal Station B |
Suite 3700 | | Toronto, Canada M5C 2W9 |
161 Bay Street, P.O. Box 212 | | or |
Toronto, Canada M5J 2S1 | | American Stock Transfer & Trust Company, LLC |
Tel: (416) 861-9911 Fax: (416) 861-0727 | | 6201 - 15 Avenue |
Toll-free throughout North America: 1-800-720-7415 | | Brooklyn, NY 11219 |
Email:investor@barrick.com | | |
Website:www.barrick.com | | Tel: 1-800-387-0825 |
| | Toll-free throughout North America |
SHARES LISTED | | Fax: (416) 643-5501 |
ABX – The New York Stock Exchange | | Email: inquiries@canstockta.com |
The Toronto Stock Exchange | | Website:www.canstockta.com |
| |
| | *Effective November 2010, shareholder records are |
| | maintained by Canadian Stock Transfer (“CST”) as |
| | administrative agent for CIBC Mellon Trust Company. |
INVESTOR CONTACT | | MEDIA CONTACT |
Deni Nicoski | | Andy Lloyd |
Vice President, Investor Relations | | Senior Manager, Communications |
Tel: (416) 307-7410 Email:dnicoski@barrick.com | | Tel: (416) 307-7414 |
| | Email:alloyd@barrick.com |
CAUTIONARY STATEMENT ON FORWARD-LOOKING INFORMATION
Certain information contained in this Fourth Quarter and Year-End Report 2011, including any information as to our strategy, projects, plans or future financial or operating performance and other statements that express management’s expectations or estimates of future performance, constitute "forward-looking statements”. All statements, other than statements of historical fact, are forward-looking statements. The words “believe”, “expect”, “will”, “anticipate”, “contemplate”, “target”, “plan”, “continue”, “budget”, “may”, “intend”, “estimate” and similar expressions identify forward-looking statements. Forward-looking statements are necessarily based upon a number of estimates and assumptions that, while considered reasonable by management, are inherently subject to significant business, economic and competitive uncertainties and contingencies. The Company cautions the reader that such forward-looking statements involve known and unknown risks, uncertainties and other factors that may cause the actual financial results, performance or achievements of Barrick to be materially different from the Company’s estimated future results, performance or achievements expressed or implied by those forward-looking statements and the forward-looking statements are not guarantees of future performance. These risks, uncertainties and other factors include, but are not limited to: the impact of global liquidity and credit availability on the timing of cash flows and the values of assets and liabilities based on projected future cash flows; changes in the worldwide price of gold, copper or certain other commodities (such as silver, fuel and electricity); fluctuations in currency markets; changes in U.S. dollar interest rates; risks arising from holding derivative instruments; the ability of the Company to complete or successfully integrate an announced acquisition proposal; legislative, political or economic developments in the jurisdictions in which the Company carries on business, including Zambia and Saudi Arabia; operating or technical difficulties in connection with mining or development activities; employee relations; availability and costs associated with mining inputs and labor; the speculative nature of exploration and development, including the risks of obtaining necessary licenses and permits and diminishing quantities or grades of reserves; changes in costs and estimates associated with our projects; adverse changes in our credit rating, level of indebtedness and liquidity, contests over title to properties, particularly title to undeveloped properties; the organization of our previously held African gold operations under a separate listed entity; the risks involved in the exploration, development and mining business. Certain of these factors are discussed in greater detail in the Company’s most recent Form 40-F/Annual Information Form on file with the U.S. Securities and Exchange Commission and Canadian provincial securities regulatory authorities.
The Company disclaims any intention or obligation to update or revise any forward-looking statements whether as a result of new information, future events or otherwise, except as required by applicable law.