Exhibit 99.1

BARRICK GOLD CORPORATION
TECHNICAL REPORT ON THE
PORGERA JOINT VENTURE,
ENGA PROVINCE,
PAPUA NEW GUINEA
NI 43-101 Report
Qualified Persons:
David W. Rennie, P.Eng.
Stuart E. Collins, P.E.
Kathleen Ann Altman, Ph.D., P.E.
March 16, 2012
ROSCOE POSTLE ASSOCIATES INC.

Report Control Form
| | | | | | | | |
Document Title | | Technical Report on Porgera Joint Venture, Enga Province, Papua New Guinea |
| |
Client Name & Address | | Brookfield Place, TD Canada Trust Tower Suite 3700, 161 Bay Street, P.O. Box 212 Toronto, Ontario M5J 2S1 |
| | | | |
Document Reference | | Project #1669 | | Status &
Issue No. | | Final
Version | | Rev 0 |
| |
Issue Date | | March 16, 2012 |
| | |
Lead Author | | Dave W. Rennie Stuart E. Collins Kathleen Ann Altman | | (Signed)
(Signed) (Signed) |
| | |
Peer Reviewer | | Graham Clow | | (Signed) |
| | |
Project Manager Approval | | Dave Rennie | | (Signed) |
| | |
Project Director Approval | | Richard Lambert | | (Signed) |
| | |
Report Distribution | | Name | | No. of Copies |
| | |
| | Client | | |
| | |
| | RPA Filing | | 1 (project box) |
|
Roscoe Postle Associates Inc. 55 University Avenue, Suite 501 Toronto, Ontario M5J 2H7 Canada Tel: +1 416 947 0907 Fax: +1 416 947 0395 mining@rpacan.com |
| | |
| | www.rpacan.com |
|
TABLE OF CONTENTS
| | | | |
| | | PAGE | |
| |
1 SUMMARY | | | 1-1 | |
Executive Summary | | | 1-1 | |
Technical Summary | | | 1-8 | |
| |
2 INTRODUCTION | | | 2-1 | |
| |
3 RELIANCE ON OTHER EXPERTS | | | 3-1 | |
| |
4 PROPERTY DESCRIPTION AND LOCATION | | | 4-1 | |
| |
5 ACCESSIBILITY, CLIMATE, LOCAL RESOURCES, INFRASTRUCTURE AND PHYSIOGRAPHY | | | 5-1 | |
| |
6 HISTORY | | | 6-1 | |
| |
7 GEOLOGICAL SETTING AND MINERALIZATION | | | 7-1 | |
Regional Geology | | | 7-1 | |
Local Geology | | | 7-4 | |
Property Geology | | | 7-4 | |
Mineralization | | | 7-11 | |
| |
8 DEPOSIT TYPES | | | 8-1 | |
| |
9 EXPLORATION | | | 9-1 | |
| |
Exploration Potential | | | 9-6 | |
| |
10 DRILLING | | | 10-1 | |
| |
11 SAMPLE PREPARATION, ANALYSES AND SECURITY | | | 11-1 | |
| |
12 DATA VERIFICATION | | | 12-1 | |
| |
13 MINERAL PROCESSING AND METALLURGICAL TESTING | | | 13-1 | |
| |
14 MINERAL RESOURCE ESTIMATE | | | 14-1 | |
Summary | | | 14-1 | |
Introduction | | | 14-4 | |
Open Pit Models | | | 14-6 | |
Underground Models | | | 14-27 | |
| |
15 MINERAL RESERVE ESTIMATE | | | 15-1 | |
Summary | | | 15-1 | |
Model Reconciliation | | | 15-8 | |
| |
16 MINING METHODS | | | 16-1 | |
Open Pit Operation Description | | | 16-1 | |
Underground Mine Description | | | 16-17 | |
| |
17 RECOVERY METHODS | | | 17-1 | |
| |
18 PROJECT INFRASTRUCTURE | | | 18-1 | |
| | | | |
| |
Barrick Gold Corporation – Porgera Joint Venture, Project #1669 Technical Report NI 43-101 – March 16, 2012 | | | Rev. 0 Page i | |
| | |
| | www.rpacan.com |
|
| | | | |
19 MARKET STUDIES AND CONTRACTS | | | 19-1 | |
Markets | | | 19-1 | |
Contracts | | | 19-1 | |
| |
20 ENVIRONMENTAL STUDIES, PERMITTING, AND SOCIAL OR COMMUNITY IMPACT | | | 20-1 | |
Introduction | | | 20-1 | |
Environmental Studies | | | 20-2 | |
Project Permitting | | | 20-2 | |
Monitoring | | | 20-4 | |
Social or Community Requirements | | | 20-5 | |
Mine Reclamation and Closure | | | 20-7 | |
| |
21 CAPITAL AND OPERATING COSTS | | | 21-1 | |
Capital Costs | | | 21-1 | |
Operating Costs | | | 21-3 | |
| |
22 ECONOMIC ANALYSIS | | | 22-1 | |
| |
23 ADJACENT PROPERTIES | | | 23-1 | |
| |
24 OTHER RELEVANT DATA AND INFORMATION | | | 24-1 | |
| |
25 INTERPRETATION AND CONCLUSIONS | | | 25-1 | |
| |
26 RECOMMENDATIONS | | | 26-1 | |
| |
27 REFERENCES | | | 27-1 | |
| |
28 DATE AND SIGNATURE PAGE | | | 28-1 | |
| |
29 CERTIFICATE OF QUALIFIED PERSON | | | 29-1 | |
LIST OF TABLES
| | | | | | |
| | | | | PAGE | |
| | |
Table 1-1 | | Mineral Resources (100%) – December 31, 2011 | | | 1-2 | |
| | |
Table 1-2 | | Mineral Reserves (100%) – December 31, 2011 | | | 1-3 | |
| | |
Table 1-3 | | Summary of Open Pit and Underground Sustaining Capital Costs (2011 Mid-Year) | | | 1-21 | |
| | |
Table 1-4 | | Summary of Open Pit Operating Costs (2011 Mid-Year) | | | 1-22 | |
| | |
Table 6-1 | | Porgera JV Historical Ounce Production | | | 6-5 | |
| | |
Table 7-1 | | Mineralization Types at Porgera JV | | | 7-12 | |
| | |
Table 7-2 | | Mineralized Zones at Porgera JV | | | 7-13 | |
| | |
Table 9-1 | | Peruk Significant Drill Intercepts | | | 9-5 | |
| | |
Table 9-2 | | Central Zone Significant Drill Intercepts | | | 9-6 | |
| | |
Table 13-1 | | Lithology Types | | | 13-2 | |
| | |
Table 13-2 | | Gold and Sulphur Recovery Constants by Lithology | | | 13-3 | |
| | |
Table 13-3 | | CIP and ADSS Constants by Lithology | | | 13-5 | |
| | |
Table 13-4 | | Actual Versus Budgeted Gold Recovery | | | 13-6 | |
| | |
Table 13-5 | | Actual versus Budgeted Gold Recovery | | | 13-6 | |
| | | | |
| |
Barrick Gold Corporation – Porgera Joint Venture, Project #1669 Technical Report NI 43-101 – March 16, 2012 | | | Rev. 0 Page ii | |
| | |
| | www.rpacan.com |
|
| | | | | | |
Table 13-6 | | 2011 Mill Budget (2011 through 2039) | | | 13-7 | |
| | |
Table 14-1 | | Mineral Resource Estimate (100%) – December 31, 2011 | | | 14-1 | |
| | |
Table 14-2 | | Change in Mineral Resources | | | 14-3 | |
| | |
Table 14-3 | | Block Model Types | | | 14-5 | |
| | |
Table 14-4 | | Bulk Densities | | | 14-7 | |
| | |
Table 14-5 | | Gold Domains | | | 14-8 | |
| | |
Table 14-6 | | Sulphur Domains | | | 14-9 | |
| | |
Table 14-7 | | Gold Top Cuts | | | 14-11 | |
| | |
Table 14-8 | | Sulphur Top Cuts | | | 14-12 | |
| | |
Table 14-9 | | 2 m Non-Declustered Composite Grades—Gold | | | 14-13 | |
| | |
Table 14-10 | | 2 m Non-Declustered Composite Grades—Sulphur | | | 14-14 | |
| | |
Table 14-11 | | Block Model Geometry | | | 14-17 | |
| | |
Table 14-12 | | Comparison of Mean Composite and Block Grades | | | 14-21 | |
| | |
Table 14-13 | | Comparison of 2011 and 2010 Block Model Results (1.0 g/t Au Cut-Off) | | | 14-23 | |
| | |
Table 14-14 | | Resource Classification by Kriging Variance | | | 14-25 | |
| | |
Table 14-15 | | CNZ Raw Sample Statistics | | | 14-31 | |
| | |
Table 14-16 | | AHD Raw Sample Statistics | | | 14-32 | |
| | |
Table 14-17 | | EZ Raw Sample Statistics | | | 14-33 | |
| | |
Table 14-18 | | PX Raw Sample Statistics | | | 14-33 | |
| | |
Table 14-19 | | OZ Raw Sample Statistics | | | 14-34 | |
| | |
Table 14-20 | | EDX Sample Statistics | | | 14-34 | |
| | |
Table 14-21 | | Top Cuts-underground Models | | | 14-35 | |
| | |
Table 14-22 | | Capped Composite Statistics—Gold | | | 14-36 | |
| | |
Table 14-23 | | Capped Composite Statistics—Sulphur | | | 14-37 | |
| | |
Table 14-24 | | Block Model Geometries | | | 14-41 | |
| | |
Table 14-25 | | Comparison of Mean Composite and Block Gold Grades | | | 14-43 | |
| | |
Table 14-26 | | Comparison of EOY2011 and Previous Block Model Results (1.0 g/t Au Cut-Off) | | | 14-48 | |
| | |
Table 14-27 | | Indicated and Inferred Classification Search Distances | | | 14-49 | |
| | |
Table 15-1 | | Mineral Reserve Estimate (100%) – December 31, 2011 | | | 15-1 | |
| | |
Table 15-2 | | Whittle pit optimization parameters | | | 15-3 | |
| | |
Table 15-3 | | Mine Design Parameters | | | 15-4 | |
| | |
Table 15-4 | | Summary of Development Heading dimensions | | | 15-6 | |
| | |
Table 15-5 | | Summary of Underground Cut-off Grade Inputs | | | 15-8 | |
| | |
Table 15-6 | | Mined Ore Reconciliation Results – December 31, 2011 | | | 15-9 | |
| | |
Table 16-1 | | Summary of Open Pit Equipment Fleet (Estimated 2012) | | | 16-2 | |
| | |
Table 16-2 | | Summary of Open Pit and Underground Equipment Fleet Performance Assumptions | | | 16-3 | |
| | |
| | (Estimated 2012) | | | | |
| | |
Table 16-3 | | Summary of Open Pit Mine Design Parameters | | | 16-4 | |
| | |
Table 16-4 | | Summary of Underground Equipment Fleet (Estimated 2012) | | | 16-23 | |
| | |
Table 16-5 | | Life Of Mine Open and Underground Production Schedule | | | 16-24 | |
| | |
Table 20-1 | | Summary of Major Permits | | | 20-3 | |
| | |
Table 21-1 | | Summary of Open Pit and Underground Sustaining Capital Costs (2011 Mid-Year) | | | 21-2 | |
| | |
Table 21-2 | | Summary of Open Pit Operating Costs (2011 Mid-Year) | | | 21-4 | |
| | |
Table 21-3 | | Porgera 2011 Cost Per Ounce Gold Produced | | | 21-5 | |
| | |
Table 21-4 | | 2011 Cost per Milled Tonne | | | 21-6 | |
| | |
Table 21-5 | | Summary of Manpower as of March 2011 | | | 21-6 | |
| | | | |
| |
Barrick Gold Corporation – Porgera Joint Venture, Project #1669 Technical Report NI 43-101 – March 16, 2012 | | | Rev. 0 Page iii | |
| | |
| | www.rpacan.com |
|
LIST OF FIGURES
| | | | | | |
| | |
| | | | | PAGE | |
| | |
Figure 4-1 | | Porgera JV Location Map | | | 4-4 | |
| | |
Figure 5-1 | | Porgera Mine Regional Infrastructure | | | 5-3 | |
| | |
Figure 5-2 | | Porgera Mine Local Infrastructure | | | 5-4 | |
| | |
Figure 7-1 | | Regional Geology | | | 7-2 | |
| | |
Figure 7-2 | | Property Geology | | | 7-5 | |
| | |
Figure 7-3 | | Geological Cross Section | | | 7-7 | |
| | |
Figure 9-1 | | Proposed Holes for the Tawasikale Veins Drill Hole Program | | | 9-2 | |
| | |
Figure 9-2 | | P-Zone Target | | | 9-4 | |
| | |
Figure 11-1 | | Primary Sample Preparation and Assaying Workflow for Diamond Drill Core | | | 11-7 | |
| | |
Figure 11-2 | | Primary Sample Preparation and Assaying Workflow for Grade Control Samples | | | 11-8 | |
| | |
Figure 13-1 | | Comparison of Actual Versus Budgeted Gold Recovery | | | 13-5 | |
| | |
Figure 13-2 | | Comparison of Actual Versus Budgeted Ounces Recovered | | | 13-6 | |
| | |
Figure 14-1 | | Example Block and Composite Grade Distributions (All Zones) | | | 14-20 | |
| | |
Figure 14-2 | | Tonnage And Grade Curves – ID3 vs Kriging | | | 14-22 | |
| | |
Figure 14-3 | | Drift Diagram (X-Direction) | | | 14-24 | |
| | |
Figure 14-4 | | Location of Underground Resource Domains | | | 14-29 | |
| | |
Figure 14-5 | | Example Histogram Comparison of Blocks vs Composites | | | 14-45 | |
| | |
Figure 14-6 | | Example Histogram Comparison of EOY2011 vs Mid-Year 2011 | | | 14-46 | |
| | |
Figure 15-1 | | Open Pit Mine – Ultimate Pit (Stage 5E) | | | 15-5 | |
| | |
Figure 16-1 | | Ultimate Pit Section 11300N Viewed North | | | 16-5 | |
| | |
Figure 16-2 | | Ultimate Pit Section 22500E Viewed East | | | 16-6 | |
| | |
Figure 16-3 | | Open Pit Slope Sectors | | | 16-9 | |
| | |
Figure 16-4 | | Open Pit Mine – Stage 5A | | | 16-10 | |
| | |
Figure 16-5 | | Open Pit Mine – Stage 5B | | | 16-11 | |
| | |
Figure 16-6 | | Open Pit Mine – Stage 5C Intermediate | | | 16-12 | |
| | |
Figure 16-7 | | Open Pit Mine – Stage 5C | | | 16-13 | |
| | |
Figure 16-8 | | Open Pit Mine – Stage 5D Intermediate | | | 16-14 | |
| | |
Figure 16-9 | | Open Pit Mine – Stage 5D | | | 16-15 | |
| | |
Figure 16-10 | | Open Pit Mine – Stage 5E | | | 16-16 | |
| | |
Figure 16-11 | | Longitudinal Section of Underground Workings | | | 16-19 | |
| | |
Figure 16-12 | | Isometric View of Underground Workings and the Open Pit | | | 16-20 | |
| | |
Figure 17-1 | | Process Flow Sheet | | | 17-4 | |
| | | | |
| |
Barrick Gold Corporation – Porgera Joint Venture, Project #1669 Technical Report NI 43-101 – March 16, 2012 | | | Rev. 0 Page iv | |
| | |
| | www.rpacan.com |
|
1 SUMMARY
EXECUTIVE SUMMARY
Roscoe Postle Associates Inc. (RPA) was retained by Barrick Gold Corporation (Barrick) to prepare an Independent Technical report on the Porgera Mine (the Project) located in Papua New Guinea (PNG). The purpose of this report is to support public disclosure of Mineral Resource and Mineral Reserve estimates at the Project as of December 31, 2011. This Technical Report conforms to NI 43-101 Standards of Disclosure for Mineral Projects. RPA visited the property from August 28 to September 2, 2011.
The Project is located in Enga Province of the Western Highlands of PNG. The mine is approximately 130 km west-northwest of Mount Hagen, PNG and 600 km northwest of the national capital, Port Moresby, PNG. The property is located at elevations between 2,200 MASL and 2,700 MASL in rugged mountainous terrain, which is largely covered with rain forest.
The Project is owned by Porgera Joint Venture (Porgera JV) whereby Barrick is the operator and has a 95% interest through a wholly owned subsidiary, and Mineral Resources Enga Limited has a 5% interest. The Project is a producing open pit and underground gold mine which has a planned operating rate of approximately 5.2 million tonnes per annum from the open pit and stockpiles and 0.8 million tonnes per annum from the underground. The mine produces gold in doré form from process plants utilizing gravity as well as flotation followed by autoclaves and cyanide leaching. Annual gold production was approximately 526,000 (100% interest) ounces in 2011.
Table 1-1 summarizes the Porgera JV Mineral Resources exclusive of Mineral Reserves as of December 31, 2011; this represents 100% of the Resource estimate and not the 95% attributable to Barrick.
| | | | |
| |
Barrick Gold Corporation – Porgera Joint Venture, Project #1669 Technical Report NI 43-101 – March 16, 2012 | | | Rev. 0 Page 1-1 | |
| | |
| | www.rpacan.com |
|
TABLE 1-1 MINERAL RESOURCES (100%) – DECEMBER 31, 2011
Barrick Gold Corporation – Porgera JV
| | | | | | | | |
Category | | Description | | Tonnes
(000) | | Grade
(g/t Au) | | Contained
Gold
(000 oz) |
Measured | | | | | | | | |
| | Open Pit | | 8,190 | | 2.31 | | 609 |
| | Underground | | 463 | | 10.33 | | 154 |
Total Measured | | | | 8,650 | | 2.74 | | 763 |
Indicated | | | | | | | | |
| | Open Pit | | 15,800 | | 1.56 | | 793 |
| | Underground | | 1,630 | | 9.15 | | 480 |
Total Indicated | | | | 17,400 | | 2.27 | | 1,270 |
| | | | | | | | |
Total Measured & Indicated | | | | 26,100 | | 2.41 | | 2,030 |
| | | | | | | | |
Inferred | | | | | | | | |
| | Open Pit | | 13,500 | | 1.77 | | 771 |
| | Underground | | 8,100 | | 8.90 | | 2,320 |
Total Inferred | | | | 21,600 | | 4.45 | | 3,090 |
Notes:
| | 1. | CIM definitions were followed for Mineral Resources. |
| | 2. | Mineral Resources are estimated at a cut-off grade of 1.0 g/t Au for the open pit and 3.0 g/t Au for the underground mine. |
| | 3. | Mineral Resources are estimated using an average gold price of US$1,400 per ounce, and a US$/C$ exchange rate of 1:1. |
| | 4. | A minimum mining width of 5 m was used. |
| | 5. | Bulk density is determined based on lithology |
| | 6. | Measured and Indicated Mineral Resources are exclusive of Mineral Reserves. |
Table 1-2 summarizes the Porgera JV Mineral Reserve estimate as of December 31, 2011; this represents 100% of the Reserves and not the 95% attributable to Barrick. This includes open pit, underground and stockpile reserves.
| | | | |
| |
Barrick Gold Corporation – Porgera Joint Venture, Project #1669 Technical Report NI 43-101 – March 16, 2012 | | | Rev. 0 Page 1-2 | |
| | |
| | www.rpacan.com |
|
TABLE 1-2 MINERAL RESERVES (100%) – DECEMBER 31, 2011
Barrick Gold Corporation – Porgera JV
| | | | | | | | | | | | |
Category | | Tonnes
(000) | | | Grade
(g/t Au) | | | Contained
Gold
(000 oz) | |
Open Pit | | | | | | | | | | | | |
Proven | | | 13,944 | | | | 3.00 | | | | 1,343 | |
Probable | | | 31,105 | | | | 2.11 | | | | 2,115 | |
Subtotal | | | 45,049 | | | | 2.39 | | | | 3,458 | |
| | | |
Underground | | | | | | | | | | | | |
Proven | | | 3,500 | | | | 7.17 | | | | 807 | |
Probable | | | 3,624 | | | | 7.56 | | | | 880 | |
Subtotal | | | 7,124 | | | | 7.37 | | | | 1,687 | |
| | | |
Stockpiles | | | | | | | | | | | | |
Proven | | | | | | | | | | | | |
Probable | | | 19,802 | | | | 2.29 | | | | 1,455 | |
Subtotal | | | 19,802 | | | | 2.29 | | | | 1,455 | |
| | | |
Process Inventory | | | — | | | | — | | | | 102 | |
| | | |
Total Proven | | | 17,443 | | | | 3.83 | | | | 2,149 | |
Total Probable | | | 54,532 | | | | 2.60 | | | | 4,552 | |
| | | | | | | | | | | | |
Total Mineral Reserve | | | 71,975 | | | | 2.90 | | | | 6,701 | |
| | | | | | | | | | | | |
Notes:
| | 1. | CIM definitions were followed for Mineral Reserves. |
| | 2. | Open Pit Mineral Reserves are estimated at a breakeven cut-off grades range from 0.95 g/t Au to 1.29 g/t Au (nominal). |
| | 3. | Underground Mineral Reserves are estimated at a cut-off grade of 3.5 g/t Au. |
| | 4. | Open Pit Mineral Reserves are estimated using an average long-term gold price of US$575 per ounce, a US$:C$ exchange rate of 1:1, and a US$:AUS$ exchange rate of 0.9:1. |
| | 5. | A minimum mining open pit width of 25 m was used. |
| | 6. | Bulk densities range from 2.64 t/m3 to 2.79 t/m3, depending on lithology. |
| | 7. | Numbers may not add due to rounding. |
| | 8. | Mineral Reserves do not include Mineral Resources, i.e. Mineral Reserves are exclusive of Mineral Resources. |
Mineral Reserves have been based on only Measured and Indicated Resources. The Mineral Reserves are exclusive of Mineral Resources, i.e. Mineral Reserves are not included in the Mineral Resources.
CONCLUSIONS
Based on the site visit and review, RPA draws the following conclusions:
| | | | |
| |
Barrick Gold Corporation – Porgera Joint Venture, Project #1669 Technical Report NI 43-101 – March 16, 2012 | | | Rev. 0 Page 1-3 | |
| | |
| | www.rpacan.com |
|
GEOLOGY AND MINERAL RESOURCES
| | • | | Sampling methods and protocols are consistent with common industry standards and appropriate for the style of mineralization. |
| | • | | The data capture is conducted in an appropriate fashion, with a reasonable level of safe-guards and validation. |
| | • | | The database is maintained using secure protocols and industry-standard software. |
| | • | | The assaying is done using methods commonly used in the industry and appropriate for the grades, deposit type and style of mineralization. |
| | • | | A minimum level of independent assay quality assurance/quality control (QA/QC) checking is applied. Assay repeatability is observed to be poor for gold, and the use of metallics screen assays is being contemplated. |
| | • | | RPA noted some minor errors in the database. However, in RPA’s opinion the sample database is reasonably free from error and adequate for use in estimation of Mineral Resources and Mineral Reserves. |
| | • | | Mineral Resource estimates are carried out using methods that are, for the most part, conventional and commonly used within the industry, using software that is commercially available. Certain geostatistical and statistical analyses are conducted using in-house software. |
| | • | | There is a good understanding of the geology, mineralogy and deposit model. The geological interpretations of the mineralized zones and the wireframe models derived from those interpretations are reasonable. |
| | • | | Parameters for grade estimation are derived using reasonable and appropriate interpretations of the geology, statistics, and geostatistics. |
| | • | | There are a number of mineralized zones that have been intersected by drill holes but have not yet been fully defined. Most often, these zones are located in the background domains. The block models for these domains are poorly constrained, which results in excessive dilution in some cases, and unrealistic extrapolation of grades in others. These zones require further drilling, interpretation, and wireframe modeling to fully evaluate their potential and bring them into the Mineral Reserves. As an interim solution, Porgera JV mine staff have implemented an estimation strategy which employs search ellipsoids with highly restricted cross-strike radii (the “Statistically Controlled” method). |
| | • | | The implementation of the Statistically Controlled (SC) interpolation method has resulted in the addition of significant volumes of Mineral Resources to the inventory. In RPA’s opinion, this method is acceptable for use in estimation of Inferred Mineral Resources. It will require some time to assess the performance of this estimation method through tracking of the Inferred material through upgrade to Indicated and Measured. |
| | | | |
| |
Barrick Gold Corporation – Porgera Joint Venture, Project #1669 Technical Report NI 43-101 – March 16, 2012 | | | Rev. 0 Page 1-4 | |
| | |
| | www.rpacan.com |
|
| | • | | Other recent modifications to the estimation methodology include the application of a two drill hole minimum per block, and a conversion of the classification scheme to one based on distance from samples. These changes are being implemented to bring the process more in line with the guidelines imposed by Barrick’s Tuscon Resource Group. |
| | • | | On a 100% basis, the Measured and Indicated Mineral Resources total 26.1 million tonnes at a grade of 2.41 g/t Au, containing 2.03 million ounces of gold. |
| | • | | On a 100% basis, the Inferred Mineral Resources total 21.6 million tonnes at a grade of 4.45 g/t Au, containing 3.09 million ounces of gold. |
| | • | | Resource classification is reasonable and consistent with the requirements of NI 43-101. |
| | • | | Block model validation techniques are reasonably rigorous and do not indicate that there are any major issues with the grade interpolations. |
| | • | | The mine staff apply an appropriate level of rigour in demonstrating that the Mineral Resources have a reasonable prospect of economic extraction. |
| | • | | The cut-off grades applied are reasonable. |
| | • | | The resource estimate procedures are not very well documented, primarily due to the scheduling of a new set of block models for year end. Reports for some zones (e.g. PX and EDX) in the underground mine are up to six years old and require updates. |
| | • | | There are exploration targets in and around the Porgera JV Mine that could provide additional Mineral Reserves in the future. |
MINING AND MINERAL RESERVES
| | • | | RPA finds the Mineral Reserve estimates to be conservative, reasonable, acceptable, and compliant with NI 43-101. The Mineral Reserves are generated based upon the mine designs applied to the Mineral Resources. The design methodology uses both the cut-off grade estimation and economic assessment to design and validate the mineable reserves. Schedules are generated using industry-accepted methods and programs. |
| | • | | Open pit, underground, stockpile and inventory Proven and Probable Mineral Reserves total, on a 100% basis, 72.0 million tonnes at a grade of 2.90 g/t, containing 6.7 million ounces of gold. |
| | • | | The total closing stockpile at as of December 31, 2010 was 22.0 million tonnes at 2.35 g/t Au and 2.62% S for 1.66 million ounces. The total closing stockpile as of December 31, 2011 was 19.8 million tonnes at 2.29 g/t Au for 1.46 million ounces. |
| | | | |
| |
Barrick Gold Corporation – Porgera Joint Venture, Project #1669 Technical Report NI 43-101 – March 16, 2012 | | | Rev. 0 Page 1-5 | |
| | |
| | www.rpacan.com |
|
| | • | | As of December 31, 2011 the mine has produced approximately 17.4 million ounces of gold. Current mine life based on the Mineral Reserves only is approximately eight years. |
| | • | | The location of the Project creates many challenges for the mine planning and mine operations departments. Listed below are some the challenges that Porgera JV faces: |
| | • | | Dewatering of the surface and meteoric (ground) waters is a major challenge, which can impact the open pit slope stability; |
| | • | | Given the impacts of surface and ground waters and lithologies found in the open pit and underground, the ground control conditions can be difficult, which can result in highwall failures; |
| | • | | The Project is in a very remote area of Papua New Guinea that lays in high relief terrain, and experiences yearly precipitation of greater than two metres; |
| | • | | Maintaining the equipment with an experienced staff and sustaining an adequate supply of spare parts is continually being addressed by the Porgera JV management team. |
PROCESSING
| | • | | Although the equations used to estimate gold recovery appear to be accurate, they are very complex. RPA observed that communication as to how the estimates are developed was deficient between the process department and the technical services department. As a result the equations are not used in the cut-off-grade calculations or the Resource and Reserve models. |
| | • | | Historical metal recovery has been approximately 86%. |
ENVIRONMENTAL AND COMMUNITY CONSIDERATIONS
| | • | | The practice of segregating potential metal leaching material was initially used in the operation but was subsequently abandoned and was not in use at the time of the RPA site visit. |
| | • | | Illegal mining is one of the principal challenges affecting the operations. |
ECONOMIC ANALYSIS
| | • | | Recovered gold ounces are estimated to be 5.68 million for the period between 2012 and 2025. Mining will be active until 2020, after which time, stockpiles will be reclaimed to provide mill feed. |
| | • | | RPA notes that the economic analysis confirms that the material classified as Mineral Reserves is supported by a positive economic analysis |
| | • | | The Porgera JV has suffered from lack of expenditures to maintain the facilities. |
| | | | |
| |
Barrick Gold Corporation – Porgera Joint Venture, Project #1669 Technical Report NI 43-101 – March 16, 2012 | | | Rev. 0 Page 1-6 | |
| | |
| | www.rpacan.com |
|
RECOMMENDATIONS
RPA makes the following recommendations:
GEOLOGY AND MINERAL RESOURCES
| | • | | Porgera JV mine staff are planning to amend the assay QA/QC protocols to include screen metallics analysis in order to try and improve repeatability. RPA concurs with this approach and recommends that it continue. |
| | • | | Exploration work should continue in order to continue to add new Mineral Resources. |
| | • | | The SC method should only be used to estimate Inferred Mineral Resources. |
| | • | | Efforts to simplify the estimation methodologies should continue. However, RPA recommends changes should be implemented gradually and only with complete understanding of the effects of each change. |
| | • | | The present documentation for the resource estimates is fragmented and out-of-date. A single report document should be prepared which describes the methodologies and parameters used in the estimation process. |
MINING AND MINERAL RESERVES
| | • | | RPA recommends that a single resource model be used for both the open pit and underground mine planning. |
| | • | | Another open pit evaluation should be completed at higher gold prices, which should enable the mine to produce a larger open pit beyond the current pit limits. |
| | • | | A concerted effort to eliminate and/or severely reduce surface waters from entering the open pit should be undertaken. |
| | • | | Dilution and ore recovery from the underground stopes needs to be improved. |
| | • | | Longhole drilling accuracy should be reviewed and a quality control program instituted. Modifications to stope drilling and blasting patterns, which would have less impact on the hanging wall should be investigated. |
PROCESSING
| | • | | RPA recommends that the process department and the technical services department work together to simplify the equations used to estimate gold recovery so they can be used in the cut-off grade calculations and in the Resource and Reserve estimates. |
| | | | |
| |
Barrick Gold Corporation – Porgera Joint Venture, Project #1669 Technical Report NI 43-101 – March 16, 2012 | | | Rev. 0 Page 1-7 | |
| | |
| | www.rpacan.com |
|
ENVIRONMENTAL AND SOCIAL AND COMMUNITY CONSIDERATIONS
| | • | | RPA recommends that the practice of segregating potential metal leaching (PML) material and impounding it within competent waste that is not PML should be re-instituted unless on-going, detailed waste characterization including assaying, acid-base accounting, and humidity cell tests prove that there is no possibility of PML material causing environmental concerns in the future. |
| | • | | Porgera JV should continue to focus on plans and systems that ensure relocations are handled in a timely manner. |
ECONOMIC ANALYSIS
Under NI 43-101 rules, producing issuers may exclude the information required for Section 22—Economic Analysis, on properties currently in production, unless the technical report includes a material expansion of current production. RPA notes that Barrick is a producing issuer, the Porgera JV mine is currently in production, and an expansion of a material consequence is not being planned. RPA has performed an economic analysis of the Porgera JV mine using the estimates presented in this report and confirms that the outcome is a positive cash flow that supports the statement of Mineral Reserves.
TECHNICAL SUMMARY
PROPERTY DESCRIPTION AND LOCATION
The Porgera JV mine is located in Enga Province of the Western Highlands of PNG, at latitude 5°28’ south and longitude 143°05’ east. The mine is approximately 130 km west-northwest of Mount Hagen, PNG, and 600 km northwest of the national capital, Port Moresby, PNG. The property is located at elevations between 2,200 MASL and 2,700 MASL in rugged mountainous terrain, which is largely covered with rain forest.
LAND TENURE
The Porgera JV is an unincorporated joint venture whereby each party subscribes its portion of operating expenses and in return takes its appropriate portion of the gold production. The operation is managed by Barrick (Niugini) Ltd. (a wholly owned subsidiary of Barrick) on behalf of the joint venturers which are:
| | |
• Barrick (Niugini) Limited | | 95% |
• Mineral Resources Enga Limited | | 5% |
| | | | |
| |
Barrick Gold Corporation – Porgera Joint Venture, Project #1669 Technical Report NI 43-101 – March 16, 2012 | | | Rev. 0 Page 1-8 | |
| | |
| | www.rpacan.com |
|
Barrick increased its beneficial interest in the Porgera JV from 75% to 95% in 2007. Mineral Resources Enga Limited’s 5% is divided between the Enga Provincial government (2.5%) and local landowners (2.5%).
There is an area over which the Porgera JV has purchased the land rights from the locals who are the underlying land owners. The Porgera JV has paid compensation for the land and pays an ongoing lease payment but at the completion of operations the land will be returned to the underlying owners.
The Porgera JV operation is subject to a 2% royalty on revenue after the deduction of selling and refining costs.
EXISTING INFRASTRUCTURE
The major assets and facilities associated with the Porgera JV mine are:
| | • | | The open pit mine and associated waste dumps and haul roads. |
| | • | | The underground mine and mine development. |
| | • | | Open pit and underground mining equipment and support equipment. |
| | • | | Six million tonnes per year capacity concentrator with crushers, grinding circuit, flotation circuit, autoclaves, cyanide leaching, cyanide destruction, for the recovery of gold, and paste tailings backfill plant. |
| | • | | Two camps for employees. |
| | • | | A hard surface air strip located approximately 11 km from the mine. |
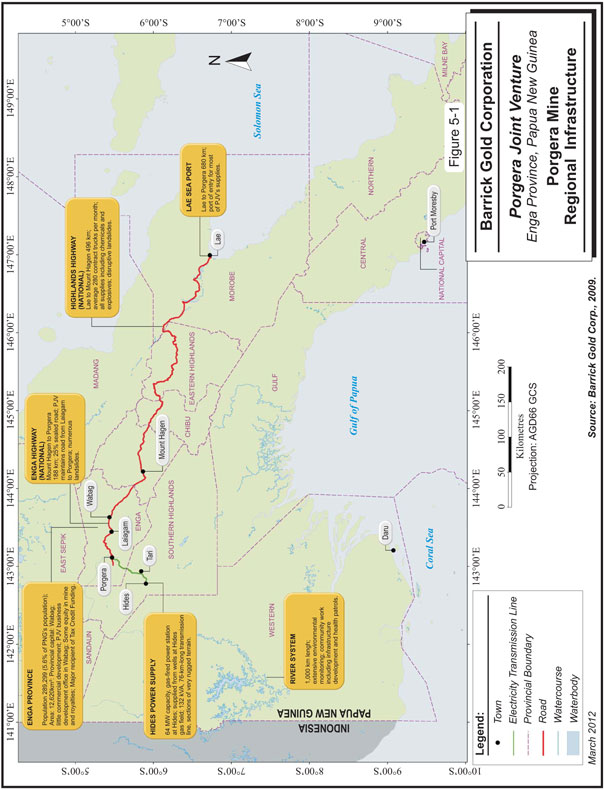
| | • | | Abundant water from a reservoir containing greater than 7,000,000 m3, located seven kilometres away at the Waile Creek Dam. |
| | • | | Four water treatment plants for potable water and five sewage treatment plants. |
| | • | | Power supplied from the 62 MW gas-fired Hides Power Station via a 73-km transmission line and 13 MW of diesel-powered backup power from a generator located at the mine site. |
| | | | |
| |
Barrick Gold Corporation – Porgera Joint Venture, Project #1669 Technical Report NI 43-101 – March 16, 2012 | | | Rev. 0 Page 1-9 | |
| | |
| | www.rpacan.com |
|
HISTORY
Alluvial gold showings were first officially reported in the area in 1938 by PNG Government officers and, in 1948, the first geological investigations traced the source to the Waruwari Hill area.
In 1964 and 1966 Bulolo Gold Dredging Ltd. (Bulolo) conducted mapping, channel sampling, and shallow diamond drilling programs followed, two years later, by Mount Isa Mines (MIM) which also carried out mapping, channel sampling, and diamond drilling. More drilling was done in the area in 1969 by Anaconda Australia Inc. which core drilled six holes at Waruwari and one at Rambari. A small-scale sluicing operation was set up in 1970 by MIM and Ada Explorations Pty. Ltd. to exploit the alluvial gold showings, and two adits were driven at Waruwari and one at Rambari.
In 1979, a three-way joint venture agreement was established between Placer PNG Pty. Ltd. (Place PNG), MIM, and New Guinea Goldfields Ltd. (NG Goldfields). A separate agreement was signed between the joint venture partners and the Independent State of Papua New Guinea (the State) that granted the State the right to acquire, at cost, up to 10% of the project if developed.
A preliminary technical and economic assessment conducted in 1981 based on a planned 15,000 tpd open pit mining operation was deemed uneconomic but later exploration success prompted a reevaluation. Another preliminary economic evaluation, conducted in 1984, returned positive results based on a mining rate of 4,000 tpd and development began in 1985 with the collaring of an exploration adit.
A Feasibility Study in 1989, based on a production rate of 8,000 tpd from combined underground and open pit operations, returned positive results. After regulatory approval was received, full construction began immediately and the State accepted its full 10% entitlement in the project. Through various acquisitions Placer Dome PNG, and later Barrick, was able to establish a 95% beneficial interest in the Porgera JV.
Commercial production was declared in 1990 and the open pit commenced operation in 1992 with a production rate of 8,000 tpd. In 1997, the underground mining operation was placed on care and maintenance but re-started in 2002 after exploration successfully identified additional resources.
| | | | |
| |
Barrick Gold Corporation – Porgera Joint Venture, Project #1669 Technical Report NI 43-101 – March 16, 2012 | | | Rev. 0 Page 1-10 | |
| | |
| | www.rpacan.com |
|
The Porgera JV mine has undergone numerous expansions over the life of the mine from the initial Stage 2 expansion in 1991 to the proposed Stage 5 expansions that are now planned. These expansions have resulted in the addition of major components to the processing circuits and pushbacks to the open pit mine. It should be noted again that Barrick increased its beneficial interest in the Porgera JV from 75% to 95% in 2007 following the acquisition of Placer in 2006.
GEOLOGY AND MINERALIZATION
The Porgera deposit is a world-class, largely refractory gold deposit that has already produced over 16.5 million ounces of gold. The high-grade core (Zone VII) is an epithermal-style deposit hosted within thermally metamorphosed sediments of the Cretaceous Chim Formation and the associated Porgera Diorite Intrusive Complex of Miocene age. The deposit is spatially associated with late Tertiary oxidized, hydrous, alkaline (shoshonitic) magmas of the Porgera Igneous Complex (PIC) located approximately 25 km south of the Lagaip fault zone in the northern portion of the Papuan Fold and Thrust Belt. The regional setting for Porgera is thought to be a back-arc region of a continental/island arc collision zone.
The tectonic units of Papua New Guinea result from collision and accretion of the Australian continental plate to the south with the Pacific oceanic plate to the north. The zone of interaction between the two plates forms the Central orogenic zone. The Papuan platform that hosts the Porgera JV mine is separated from the Central orogenic zone by the Lagaip fault zone, located some 25 km north of Porgera JV.
The Porgera intrusive complex is a calc-alkaline series of diorite plugs, stocks and dikes that form predominant relief within a seven kilometre wide basin rimmed to the south and east by limestone cliffs. The stocks and sills of the Porgera intrusive complex range from one metre wide dykes to bodies that are hundreds of metres in width. The stocks and dikes of the Porgera intrusive have experienced variable degrees of alteration.
| | | | |
| |
Barrick Gold Corporation – Porgera Joint Venture, Project #1669 Technical Report NI 43-101 – March 16, 2012 | | | Rev. 0 Page 1-11 | |
| | |
| | www.rpacan.com |
|
The Porgera JV mine area geology consists of a complex sequence of high level potassium-rich intrusives and variably altered sedimentary rocks which has characteristics of different deposit types. Despite its alkalic nature, Porgera shares many similarities with porphyry copper deposits. Rapid emplacement at shallow crustal levels distinguishes it from a typical gabbroic intrusion and the nature of the mineralization is more indicative of an epithermal gold deposit.
The primary sediments are pyritic, slightly calcareous, massive, incompetent bituminous shales and mudstones known as “brown mudstones”. These occur on the southwest and northwest margins of Waruwari (located in the southern part of the Porgera intrusive complex). The “black sediments” are the main variant on the “brown mudstones” and are the major host rock. Interpreted to be derived from the “brown mudstone”, the “black sediments” are more competent and less friable.
The major intrusive phases at Porgera are hornblende diorite, feldspar porphyry and hornblende diorite porphyry. These occur as stocks and sills and contacts generally dip steeper than 45°. Each of the intrusive rock types occur as more than one intrusive body, are inhomogeneous in texture and have chilled margins. By volume, hornblende diorite is the most prevalent rock type with two distinct bodies occurring. Feldspar porphyry forms small outcrops to the south of Waruwari and occur as small stocks to the northeast of Waruwari. The second most prevalent rock type by volume, it strikes north-northeast between two hornblende diorite bodies. Andesite and basalt are a fraction of the size of the three main intrusive bodies and occur mostly as dikes with accessory biotite and matrix plagioclase. Field observations have established the relationship between the intrusives. The hornblende diorite was emplaced first and followed by the feldspar porphyry and finally the hornblende diorite porphyry.
The principal structural features in the Porgera intrusive complex are the east trending faults, that control drainage in the area, and the Roamane Fault, which parallels and is subsidiary to the Lagaip Fault. The east trending Roamane Fault dips south at 70º to 80º and defines the northern extent of Waruwari and truncates the Yakatabari and Roamane intrusions. It appears to have moved many times creating a broad zone of deformation that has been invaded by numerous pulses of hydrothermal fluid which altered and mineralized the breccias that were formed by the movement
| | | | |
| |
Barrick Gold Corporation – Porgera Joint Venture, Project #1669 Technical Report NI 43-101 – March 16, 2012 | | | Rev. 0 Page 1-12 | |
| | |
| | www.rpacan.com |
|
Three distinct and highly variable types of breccias have been recognized within the Porgera intrusive complex, namely, sedimentary, tectonic, and hydrothermal. They are important hosts to mineralization and can display strong alteration and open space filling gangue mineralization.
Mineralization occurs within the Porgera intrusive complex and is closely associated with three dominate structural trends, the Roamane Fault, the Hanging Wall Shear Zone and the Footwall Splay Zone. Mineralization occurs around the margins and within the intrusive bodies. The Footwall Diorite (north of the Roamane Fault) and the Eastern Deeps are also mineralized and have contributed significant tonnages at moderate grade.
Gold is suggested to have been transported as a chloride complex in early magmatically derived hypersaline fluids and deposited as disseminate auriferous pyrite during cooling as a result of sulphidation and sericitization reactions with mafic igneous wall rocks.
Precious metal mineralization comprises four types, corresponding to four distinct mineralizing events. From oldest to most recent, these are:
| | • | | Auriferous pyrite, sphalerite and galena; |
| | • | | Coarse euhedral auriferous pyrite; |
| | • | | Fine-grained anhedral auriferous arsenical pyrite; |
| | • | | Gold and electrum associated with roscoelite. |
The fourth mineralization style is typified by very high grades and the presence of roscoelite is a useful visual indicator of these high grade zones. The distribution of mineralization is associated with structural activity and, to a lesser extent, alteration.
Gold mineralization occurs as fracture-fillings and as disseminations in and around faults, breccias and dilatant zones. Gold is usually present as submicroscopic grains within the pyrite, with a relatively minor component occurring as free grains. Important accessory minerals include quartz and roscoelite. Cross cutting relationships indicate the mineralization occurred in several pulses. Evidence suggests that some remobilization of gold may have occurred. Later fluids favoured the deposition of metallic gold suggesting earlier mineralization types may have been affected by later mineralizing events. Gold grade is closely related to fracture intensity and mineralization type.
| | | | |
| |
Barrick Gold Corporation – Porgera Joint Venture, Project #1669 Technical Report NI 43-101 – March 16, 2012 | | | Rev. 0 Page 1-13 | |
| | |
| | www.rpacan.com |
|
EXPLORATION
Since RPA’s last Mineral Resource and Reserve audit report in 2009, exploration diamond drilling has taken place in the following areas: Tupegai, Tawasikale Veins, Tawasikale Intrusion, P-Zone, Peruk, Central Zone East, and Alipis.
RPA conducted a cursory review of the exploration work at Porgera JV. The exploration staff are of the opinion that there are significant targets remaining within the mine area as well as underexplored sections of the concessions that warrant further work. In RPA’s opinion, this is a reasonable assessment that exploration work should continue.
MINERAL RESOURCES
The Mineral Resource estimate for Porgera JV is shown in Table 1-1. These represent the in situ Mineral Resource estimate excluding Mineral Reserves. In RPA’s opinion the Mineral Resources are reasonable, acceptable and compliant with NI 43-101.
The estimate was carried out using block models constrained by wireframe models of the geological domains and mined out volumes. Grade interpolations were done using a variety of methods which included Multiple Indicator Kriging (MIK), Ordinary Kriging (OK), and Inverse Distance weighting (ID). Data used in the interpolations comprised diamond drill and face samples. Grades were estimated for gold and sulphur, and the block models contain data for domain codes, bulk density, and classification.
The global Mineral Resources increased substantially in terms both of tonnage and grade from YE2010 to YE2011. The changes to the Mineral Resources were due to the following:
| | • | | increase due to addition of new resources in the O, North and East Zone (underground mine) |
| | • | | increase due to new pit shell with current gold price |
| | | | |
| |
Barrick Gold Corporation – Porgera Joint Venture, Project #1669 Technical Report NI 43-101 – March 16, 2012 | | | Rev. 0 Page 1-14 | |
| | |
| | www.rpacan.com |
|
| | • | | increase due to changes to the classification scheme |
| | • | | decrease due to update of cut-off grade |
OPEN PIT
The open pit block model encompasses the entire Porgera JV deposit, including material that will in all probability be mined from underground. The reported Mineral Resources are only those captured within a Lersch-Grossman open pit shell generated using Whittle to demonstrate the economic viability of mining by open pit. This pit shell was created using a gold price of $1,400/oz. Grades for gold and sulphur are interpolated MIK, OK and ID weighting. Kriging variance, which is used in the resource classification, is estimated into the model using OK. The interpolations are constrained by wireframe models of the principal estimation domains, as well as stoped volumes.
The cut-off grade used for the open pit resource estimate was 1.0 g/t Au, which is consistent with Barrick’s Reserve and Reporting Guidelines. This cut-off was derived using a gold price of $1,400/oz.
UNDERGROUND
The Mineral Resource estimates for the underground mine are generated from models created for six separate zones. These are the AHD, Central/North Zone (CNZ), East Zone (EZ), Project X (PX), Eastern Deeps (EDX), and O Zone (OZ). The models are constrained by 3D wireframes constructed using diamond drill and underground chip sampling results.
Grades for gold and sulphur are interpolated into the blocks using OK. The wireframe models are constructed using a nominal cut-off grade of 3 g/t Au and a three-metre minimum mining width. This cut-off was derived using a gold price of $1,400/oz. For some zones, a low-grade halo surrounding the 3 g/t wireframe is also constructed. These halos are based on a nominal 1.5 g/t Au cut-off.
MINERAL RESERVES
The Mineral Reserves for the Porgera JV mine are shown in Table 1-2. These Mineral Reserves are a combination of the open pit and underground operations and the stockpiles and inventory. Overall, RPA finds the Mineral Reserve estimates to be
| | | | |
| |
Barrick Gold Corporation – Porgera Joint Venture, Project #1669 Technical Report NI 43-101 – March 16, 2012 | | | Rev. 0 Page 1-15 | |
| | |
| | www.rpacan.com |
|
reasonable, acceptable, and compliant with NI 43-101. The Mineral Reserves are generated based upon the mine designs applied to the Mineral Resources. The design methodology uses both the cut-off grade estimation and economic assessment to design and validate the mineable reserves.
Block models, along with their associated wireframes, are constructed for both the open pit and underground mines. The open pit models are prepared by Senior Resource Geologists at Porgera JV mine with occasional assistance from external consultants. The models are constructed using Datamine software. Separate models are used for the open pit and underground mines.
Wireframes are also created for the mined volumes by the mine survey personnel. These models comprise stope and development void spaces in the underground mine as well as the volume depleted from the open pit.
Porgera JV maintains a system of both ore and low grade stockpiles, which have been growing since the 1990s.
The Probable Reserves located in 13 different stockpiles are estimated to be 54.5 million tons grading 2.60 g/t Au, containing 4.55 million ounces of gold, as of December 31, 2011. RPA agrees with the ore control rationale for creating the stockpiles, and the accounting methods used to track the stockpile quantities and grades. Consideration should be given to reclassifying these as Proven Reserves.
MINING METHODS
OPEN PIT
Barrick’s Porgera JV open pit is a large scale operation utilizing a traditional truck and shovel fleet. The open pit currently has five remaining phases, with the ultimate pit to measure approximately two kilometers east to west, 1.5 km north to south, and have an average depth of approximately 500 m. The waste rock dumps are located to the southeast and southwest of the open pit.
Ultimate pit limits were determined by generating Whittle® pit shells based on the net cash generated and the pit slopes recommended by Piteau Associates Engineering Ltd.
| | | | |
| |
Barrick Gold Corporation – Porgera Joint Venture, Project #1669 Technical Report NI 43-101 – March 16, 2012 | | | Rev. 0 Page 1-16 | |
| | |
| | www.rpacan.com |
|
Haul ramps were designed to be 35 m wide, including the safety berm for double lane traffic accommodating the 175 st class haul trucks, and have a maximum grade of 10%. Mining thickness is 10 m in waste and ore to help minimize dilution.
Barrick optimizes mining by using a multi-phased approach which maximizes stripping rates to keep an ore producing face always available. This multi-phase technique consists of a primary ore layback, a primary stripping layback, and a secondary stripping layback. Historically, this approach was put in place to maintain a consistent mill feed, and keep mine production in the range of 14 to 15 benches per layback per year. There are approximately 135 million tons per year mined.
The single, open pit operation is projected to mine approximately five million tonnes of ore per year at an average strip ratio of four waste tonnes to one ore tonne (4W:1O). The operation uses conventional open pit methods to mine the ore and waste; bench drilling, blasting, and loading with shovels and loaders into off-highway trucks. The primary loading units are supported by motor graders, track-dozers, small excavators, water trucks, and maintenance equipment.
The major risks associated with Porgera JV open pit are the following:
| | • | | Dewatering and slope stability, the Southwest Dyke Failure in particular; |
| | • | | Equipment availabilities; and |
| | • | | Safety and security issues due to artisanal miners who trespass on the Porgera JV mine site. |
UNDERGROUND
Porgera JV started in 1990 as an underground mining operation, which was completed in 1997. Underground mining was restarted in 2002, and it is currently planned to continue as long as the open pit is operating. It is RPA’s opinion that underground mining could continue after the planned completion of the open pit and during the milling of the stockpiles.
The underground mine is expected to produce approximately 1.2 million tonnes of ore per year and the goal is to increase this to 1.4 million tonnes per year. In 2011, the underground mine generated 935,000 tonnes grading 7.29 g/t Au.
| | | | |
| |
Barrick Gold Corporation – Porgera Joint Venture, Project #1669 Technical Report NI 43-101 – March 16, 2012 | | | Rev. 0 Page 1-17 | |
| | |
| | www.rpacan.com |
|
There are several underground deposits, but current production is coming from the North zone, and the recently accessed East zone. Underground exploration and development is underway and moving towards the AHD and Project X zones.
The average rock conditions are the key factor in the underground mine design and mining method selection. This has led to two mining methods both of which rely on cemented backfill for support. Where long hole stoping is used, the wall and back exposure is reduced by taking short long hole sections and filling before taking the next section. The underhand drift and fill stoping provides a backfill roof for subsequent lifts in the mining cycle.
Transverse long hole stoping is used where the mineralized zone has a significant width. Footwall drifts are driven parallel to the strike of the ore to provide access for stoping. Mining with transverse stopes requires a primary, secondary, and sometimes tertiary extraction to completely mine out the area. Longitudinal stopes are utilized in areas of the mine with adequate ground conditions to support a stope rib greater than 15 m in height, but do not have mineralized widths greater than 20 m. The stopes are accessed from a footwall drive and then driven parallel to the strike of ore. Each section is mined and filled before the next section is mined. If ground conditions are poor, the long hole stope section length can be reduced.
The underhand drift and fill method is utilized in areas of fair to poor ground conditions regardless of the width of the zone. The underhand drifts are nominally designed as 15 m wide by 15 m high. The minimum width is 15 m. The primary drift is driven with increased ground support to hold the ground open, then backfilled with a high strength cemented rock fill (CRF). Where the ore width exceeds the nominal drift width, subsequent drifts are developed (parallel or at oblique angles to the primary drift) and then backfilled. This process continues until the entire ore shape at a given elevation has been excavated and filled. Successive lifts are taken beneath the primary workings, utilizing the backfill as an engineered back.
MINERAL PROCESSING
The Porgera JV ore processing plant consists of crushing, grinding, flotation, pressure oxidation and leach/carbon-in-leach (CIL) operations. The crushing and grinding plant is
| | | | |
| |
Barrick Gold Corporation – Porgera Joint Venture, Project #1669 Technical Report NI 43-101 – March 16, 2012 | | | Rev. 0 Page 1-18 | |
| | |
| | www.rpacan.com |
|
at Tawisakale, which is physically separated from the concentrator at Anawe. Tawisakale is located immediately adjacent to the open pit and ground ore slurry is delivered by pipeline to the Anawe Concentrator.
ENVIRONMENTAL, PERMITTING AND SOCIAL CONSIDERATIONS
The Porgera JV site is located in an area that poses a number of unique challenges including:
| | • | | Challenging social factors including illegal miners |
For all of these reasons Porgera JV uses two operational practices that are uncommon for large mining operations. They are riverine tailings disposal and erodible dumps for disposal of mudstones. During initial permitting the PNG government and Porgera JV selected riverine tailings disposal as the method that poses the lowest risk to the environment.
Currently, Porgera JV is also developing and implementing an Environmental Management System (EMS) in preparation for certification by ISO 14001 and to meet Barrick corporate environmental standards.
PROJECT PERMITTING
The Porgera JV has approval to work the Porgera deposit within the agreed development plan under the terms of the Porgera Mining Development Contract (MDC) between the Government of PNG and the joint venture partners. The MDC specifies, in addition to other items, the annual rents that must be paid for the Special Mining Lease (SML). The MDC also specifies the classes of compensation that are payable to the landowners for the various land uses. The SML is issued by the Government of PNG. The SML, which expires in 2019, but is renewable, encompasses approximately 2,240 ha, including the mine and Project infrastructure areas. The Government of PNG has also awarded Leases for Mining Purposes (LMPs) for the waste dumps, campsites, and airstrip.
| | | | |
| |
Barrick Gold Corporation – Porgera Joint Venture, Project #1669 Technical Report NI 43-101 – March 16, 2012 | | | Rev. 0 Page 1-19 | |
| | |
| | www.rpacan.com |
|
WASTE ROCK STORAGE/DISPOSAL
Waste rock management is permitted under the waste discharge permit. It is generally split into three classifications:
| | • | | Competent waste, comprising Porgera intrusive complex rocks and altered sediment |
| | • | | Semi-competent waste, comprising black and calcareous sediment; |
| | • | | Erodible waste, comprising Chim Formation mudstones (Yakatabari and Western Mudstone) |
Waste is further divided into potential metal leaching (PML) material and non-PML material based on sulphur and zinc grades. PML material is generally competent or semi-competent, and was impounded within the stable dumps during earlier operations. RPA noted that this operating practice was subsequently abandoned and was not in use at the time of the site visit. RPA recommends that this practice should be re-instituted unless on-going, detailed waste characterization including assaying, acid-base accounting, and humidity cell tests prove that there is no possibility of PML material causing environmental concerns in the future.
SOCIAL OR COMMUNITY REQUIREMENTS
Community relations are a significant concern at Porgera JV due to the large influx of people, the local culture and customs, and the impact of the mine on the people of Papua New Guinea. The Porgera Environment Advisory Komiti (PEAK) was formed to provide advice, communication and review services to the mine.
Porgera JV has become a training centre for the mining industry in PNG. Porgera JV is committed to training programs and was developing a $24 million training program at the time of the site visit.
From time to time, civil disturbances and criminal activities such as trespass, illegal mining, sabotage, particularly with respect to power, theft and vandalism have occasionally caused disruptions to the operation and temporarily halted production at Porgera.
Illegal mining is one of the principal challenges affecting the operations at Porgera JV. RPA observed illegal miners in the open pit, at the waste dumps, and at the tailings discharge area. RPA recommends that continued pursuit of measures designed to mitigate the situations should be one of the highest priorities for Porgera JV.
| | | | |
| |
Barrick Gold Corporation – Porgera Joint Venture, Project #1669 Technical Report NI 43-101 – March 16, 2012 | | | Rev. 0 Page 1-20 | |
| | |
| | www.rpacan.com |
|
MINE RECLAMATION AND CLOSURE
SRK Consulting established the closure costs using the Barrick Reclamation Cost Estimator (BRCE) methodology and estimated the closure cost as $170 million.
CAPITAL AND OPERATING COST ESTIMATES
The sustaining capital costs for the Porgera JV for the period of 2012 to 2024 has been estimated to be $466 million (Table 1-3).
Operating costs for 2011 are estimated to be $841 per oz Au produced, or $81.78 per tonne milled (Table 1-4).
TABLE 1-3 SUMMARY OF OPEN PIT AND UNDERGROUND SUSTAINING
CAPITAL COSTS (2011 MID-YEAR)
Barrick Gold Corporation – Porgera JV
| | |
Capital Cost Category | | Totals for Years 2012 -2024
(US$ 000) |
Open Pit Mining | | 117,893 |
Underground Mining | | 71,511 |
Processing | | 53,230 |
G&A | | 176,423 |
Other | | 47,730 |
Total | | 466,788 |
| | | | |
| |
Barrick Gold Corporation – Porgera Joint Venture, Project #1669 Technical Report NI 43-101 – March 16, 2012 | | | Rev. 0 Page 1-21 | |
| | |
| | www.rpacan.com |
|
TABLE 1-4 SUMMARY OF OPEN PIT OPERATING COSTS
(2011 MID-YEAR)
Barrick Gold Corporation – Porgera JV
| | |
Department Description | | Actual Cost
(US$/tonne –milled) |
Open Pit Total | | 26.78 |
Underground Total | | 8.30 |
Mill Total | | 23.39 |
Maintenance Total | | 6.04 |
Sustainable Development Total | | 0.86 |
Exploration Total | | 0.01 |
Strategic Total | | 0.43 |
Accounting Total | | 0.18 |
Supply Total | | 1.20 |
Business Improvement Total | | 1.04 |
Security Total | | 2.46 |
Personnel Total | | 0.96 |
Occupational Health & Safety Total | | 0.46 |
Community Affairs Total | | 1.50 |
Admin General Services Total | | 5.63 |
Administration & Selling Total | | 1.91 |
Indirect Costs Total | | 0.62 |
Total | | 81.78 |
| | | | |
| |
Barrick Gold Corporation – Porgera Joint Venture, Project #1669 Technical Report NI 43-101 – March 16, 2012 | | | Rev. 0 Page 1-22 | |
| | |
| | www.rpacan.com |
|
2 INTRODUCTION
Roscoe Postle Associates Inc. (RPA) was retained by Barrick Gold Corporation (Barrick) to prepare an Independent Technical report on the Porgera mine (the Project) located in Papua New Guinea (PNG). The purpose of this report is to support public disclosure of Mineral Resource and Mineral Reserve estimates at the Project as of December 31, 2011. This Technical Report conforms to NI 43-101 Standards of Disclosure for Mineral Projects. RPA visited the property from August 28 to September 2, 2011.
The Project is located in Enga Province of the Western Highlands of PNG, at latitude 5°28’ south and longitude 143°05’ east. The mine is approximately 130 km west-northwest of Mount Hagen, PNG and 600 km northwest of the national capital, Port Moresby, PNG. The property is located at elevations between 2,200 MASL and 2,700 MASL in rugged mountainous terrain, which is largely covered with rain forest.
The Project is a producing open pit and underground gold mine which has a planned operating rate of approximately 5.2 million tonnes per annum (Mtpa) from the open pit and stockpiles and 0.8 Mtpa from the underground. The mine produces gold in doré form from process plants utilizing gravity as well as flotation followed by autoclaves and cyanide leaching. Annual gold production was approximately 526,000 (100% interest) ounces in 2011. The Project is owned by Porgera Joint Venture (Porgera JV) whereby Barrick is the operator and has a 95% interest through a wholly owned subsidiary, and Mineral Resources Enga Limited has a 5% interest.
PERSONNEL
Site visits were carried out from August 28 to September 2, 2011 by the following RPA employees:
| | • | | David Rennie, P. Eng, RPA Principal Geologist |
| | • | | Kathleen Altman, P. E., Ph.D., RPA Principal Metallurgist |
| | • | | Stuart Collins, P. E., RPA Principal Mining Engineer |
| | | | |
| |
Barrick Gold Corporation – Porgera Joint Venture, Project #1669 Technical Report NI 43-101 – March 16, 2012 | | | Rev. 0 Page 2-1 | |
| | |
| | www.rpacan.com |
|
SOURCES OF INFORMATION
During the visit, the auditors met with the following people:
| | • | | Simon Jackson, General Manager |
| | • | | Ettienne Du Plessis, Technical Services Manager |
| | • | | Bruce Robertson, Resource Geologist |
| | • | | Mike Beatty, Senior Long-term Open Pit Planning |
| | • | | Ridge Nyashanu, Process Manager |
| | • | | John Mark, Senior Metallurgist |
| | • | | Simon, Senior Metallurgist, Crushing & Grinding |
| | • | | Reynold Giwar, Plant Metallurgist, Crushing & Grinding |
| | • | | Charles Ross, Environmental Manager |
| | • | | Steve Mitzelberg, UG Production Foreman |
| | • | | Mark Mousek, UG Engineer |
Mr. Rennie is responsible for the overall preparation of the Report and has contributed to Sections 3 through 12, inclusive, and to Sections 14, 23, 24, and parts of Sections 1, 2, 25 and 26. Dr. Altman is responsible for Sections 13, 17, 18, 19, 20 and contributed to Sections 1, 2, 25, and 26. Mr. Collins is responsible for Sections 15, 16, 19, 21, 22 and contributed to Sections 1, 2, 25, and 26.
| | | | |
| |
Barrick Gold Corporation – Porgera Joint Venture, Project #1669 Technical Report NI 43-101 – March 16, 2012 | | | Rev. 0 Page 2-2 | |
| | |
| | www.rpacan.com |
|
LIST OF ABBREVIATIONS
Units of measurement used in this report conform to the Imperial system. All currency in this report is US dollars (US$) unless otherwise noted.
| | | | | | |
µm | | micron | | km2 | | square kilometre |
°C | | degree Celsius | | kPa | | kilopascal |
°F | | degree Fahrenheit | | kVA | | kilovolt-amperes |
µg | | microgram | | kW | | kilowatt |
A | | ampere | | kWh | | kilowatt-hour |
a | | annum | | L | | litre |
bbl | | barrels | | L/s | | litres per second |
Btu | | British thermal units | | m | | metre |
C$ | | Canadian dollars | | M | | mega (million) |
cal | | calorie | | m2 | | square metre |
cfm | | cubic feet per minute | | m3 | | cubic metre |
cm | | centimetre | | min | | minute |
cm2 | | square centimetre | | MASL | | metres above sea level |
d | | day | | mm | | millimetre |
dia. | | diameter | | mph | | miles per hour |
dmt | | dry metric tonne | | MVA | | megavolt-amperes |
dwt | | dead-weight ton | | MW | | megawatt |
ft | | foot | | MWh | | megawatt-hour |
ft/s | | foot per second | | m3/h | | cubic metres per hour |
ft2 | | square foot | | opt, oz/st | | ounce per short ton |
ft3 | | cubic foot | | oz | | Troy ounce (31.1035g) |
g | | gram | | ppm | | part per million |
G | | giga (billion) | | psia | | pound per square inch absolute |
Gal | | Imperial gallon | | psig | | pound per square inch gauge |
g/L | | gram per litre | | RL | | relative elevation |
g/t | | gram per tonne | | s | | second |
gpm | | Imperial gallons per minute | | st | | short ton |
gr/ft3 | | grain per cubic foot | | stpa | | short ton per year |
gr/m3 | | grain per cubic metre | | stpd | | short ton per day |
hr | | hour | | t | | metric tonne |
ha | | hectare | | tpa | | metric tonne per year |
hp | | horsepower | | tpd | | metric tonne per day |
in | | inch | | US$ | | United States dollar |
in2 | | square inch | | USg | | United States gallon |
J | | joule | | USgpm | | US gallon per minute |
k | | kilo (thousand) | | V | | volt |
kcal | | kilocalorie | | W | | watt |
kg | | kilogram | | wmt | | wet metric tonne |
km | | kilometre | | yd3 | | cubic yard |
km/h | | kilometre per hour | | yr | | year |
| | | | |
| |
Barrick Gold Corporation – Porgera Joint Venture, Project #1669 Technical Report NI 43-101 – March 16, 2012 | | | Rev. 0 Page 2-3 | |
| | |
| | www.rpacan.com |
|
3 RELIANCE ON OTHER EXPERTS
This report has been prepared by Roscoe Postle Associates Inc. (RPA) for Barrick Gold Corp. (Barrick). The information, conclusions, opinions, and estimates contained herein are based on:
| | • | | Information available to RPA at the time of preparation of this report, |
| | • | | Assumptions, conditions, and qualifications as set forth in this report, and |
| | • | | Data, reports, and other information supplied by Barrick and other third party sources. |
For the purpose of this report, RPA has relied on ownership information provided by Barrick. RPA has not researched property title or mineral rights for the Project and expresses no opinion as to the ownership status of the property.
RPA has relied on Barrick for guidance on applicable taxes, royalties, and other government levies or interests, applicable to revenue or income from the Project.
Except for the purposes legislated under provincial securities laws, any use of this report by any third party is at that party’s sole risk.
| | | | |
| |
Barrick Gold Corporation – Porgera Joint Venture, Project #1669 Technical Report NI 43-101 – March 16, 2012 | | | Rev. 0 Page 3-1 | |
| | |
| | www.rpacan.com |
|
4 PROPERTY DESCRIPTION AND LOCATION
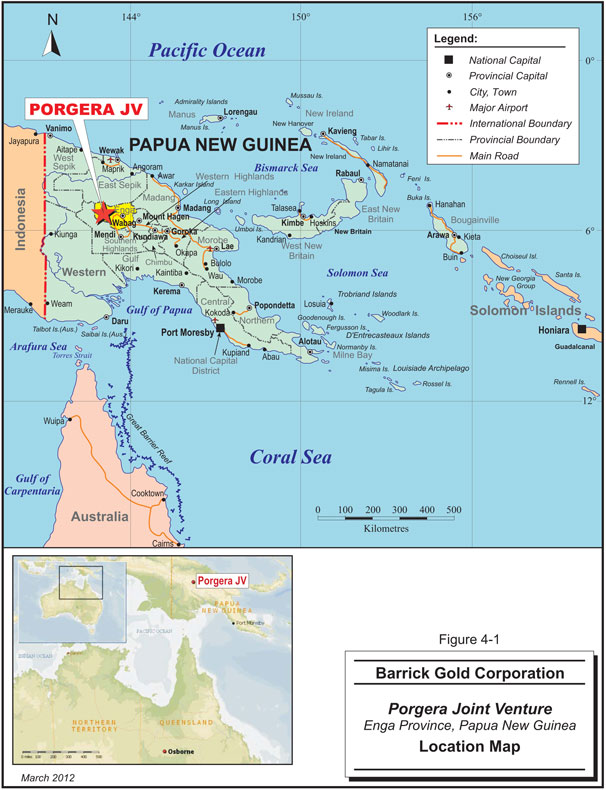
The Porgera Mine property is located in Enga Province of the Western Highlands of PNG, at latitude 5° 28’ south and longitude 143° 05’ east. The mine is approximately 130 km west-northwest of Mount Hagen, PNG and 600 km northwest of the national capital, Port Moresby, PNG. The property is located at elevations between 2,200 MASL and 2,700 MASL in rugged mountainous terrain, which is largely covered with rain forest (Figure 4-1).
LAND TENURE
The Porgera JV is an unincorporated joint venture whereby each party subscribes its portion of operating expenses and in return takes its appropriate portion of the gold production. The operation is managed by Barrick (Niugini) Ltd. (a wholly owned subsidiary of Barrick) on behalf of the joint venture partners which are:
| | • | | Barrick (Niugini) Limited 95% |
| | • | | Mineral Resources Enga Limited 5% |
Barrick increased its beneficial interest in the Porgerga JV from 75% to 95% in 2007. Mineral Resources Enga Limited’s 5% is divided between the Enga Provincial government (2.5%) and local landowners (2.5%).
The Porgera JV has approval to work the Porgera deposit within the agreed development plan under the terms of the Porgera Mining Development Contract (MDC) between the Government of PNG and the joint venture partner. The MDC specifies, inter alia, the annual rents that must be paid for the Special Mining Lease (SML) and the classes of compensation that are payable to the landowners for the various land uses. The SML is issued by the Government of PNG. The SML, which expires in 2019, but which is renewable, encompasses approximately 2,350 ha, including the mine and project infrastructure areas. The Government of PNG has also awarded Leases for Mining Purposes (LMPs) for the waste dumps, campsites, and airstrip.
| | | | |
| |
Barrick Gold Corporation – Porgera Joint Venture, Project #1669 Technical Report NI 43-101 – March 16, 2012 | | | Rev. 0 Page 4-1 | |
| | |
| | www.rpacan.com |
|
Any future open pit and waste dump expansions that extend the mine life beyond the expiry date of the Special Mining Lease (SML) will require an extension to the SML be approved by the PNG government. It has been postulated that the primary and only significant environmental impact from any potential, future open pit expansion should be the expansion of the existing waste dumps.
While initial overtures to the Government of PNG, related to the extension of the SML, have been received favourably there has been no formal application to extend the SML to include the operations and reclamation, which are now estimated to continue until after mine closure in 2020. Open pit and underground operations are expected to cease in 2020, with the mill continuing to process stockpiles through 2025. Agreements with the local populace concerning the Anawe North Waste Rock Facility (WRF) are deficient with respect to the required duty for this dump in any possible Stage 6 Plan. Negotiations, with the goal of reaching an agreement that is to the satisfaction of all stakeholders, are planned (Bassotti & Woodward, 2010). No Stage 6 expansion plan is being considered at this time. A substantial amount of exploration and development work needs to be completed before any further open pit and waste dump expansion is considered.
Any major change to the Approved Proposal for Development requires State approval under the MDC. The MDC defines a major change as either a material change in:
| | • | | The design, capacity, location or availability of the Works and Facilities including the mine water supply, infrastructure directly associated with the mining or processing of ore and the administration building, and Suyan and Alipis camps. |
| | • | | The design, capacity or availability of facilities located within the Mining Area, or in the mine plan or mine production if the material change would materially reduce the States royalties or revenue or have an adverse impact on the environment (Bassotti & Woodward, 2010). |
There is no expiration date for the MDC, but it is tied to the continuation of the SML. If the mine life is extended, it is required that current environmental permitting arrangements be renewed. Previous submissions regarding pushbacks have met with approval so precedents exist for positive outcomes.
There is an area over which the Porgera JV has purchased the land rights from the locals who are the underlying land owners. The Porgera JV has paid compensation for
| | | | |
| |
Barrick Gold Corporation – Porgera Joint Venture, Project #1669 Technical Report NI 43-101 – March 16, 2012 | | | Rev. 0 Page 4-2 | |
| | |
| | www.rpacan.com |
|
the land and pays an ongoing lease payment but, at the completion of operations, the land will be returned to the underlying owners. Land ownership is a major issue for the operation and the extension of the mine area would involve lengthy negotiations with both current and proposed land owners. Land in PNG is owned by individuals and not the State and, as such, “social license” is a very important part of the operation of the Porgera Mine (Bassotti & Woodward, 2010).
The Porgera JV operation is subject to a 2% royalty on revenue after the deduction of selling and refining costs.
| | | | |
| |
Barrick Gold Corporation – Porgera Joint Venture, Project #1669 Technical Report NI 43-101 – March 16, 2012 | | | Rev. 0 Page 4-3 | |
| | |
| | www.rpacan.com |
|
FIGURE 4-1 PORGERA JV LOCATION MAP
| | | | |
| |
Barrick Gold Corporation – Porgera Joint Venture, Project #1669 Technical Report NI 43-101 – March 16, 2012 | | | Rev. 0 Page 4-4 | |
| | |
| | www.rpacan.com |
|
5 ACCESSIBILITY, CLIMATE, LOCAL RESOURCES, INFRASTRUCTURE AND PHYSIOGRAPHY
ACCESSIBILITY
Access to Porgera JV is via the Enga Highway, a road distance of 211 km from Mount Hagen, PNG. There is a 470 km long road connection from Mt Hagen to the port of Lae, PNG. Almost all mine consumables and equipment are transported along this road on highway heavy-goods vehicles.
CLIMATE
The climate at the mine site is temperate year round, with daily temperatures ranging from 10ºC to 25ºC. The average annual rainfall is 3,650 mm spread throughout the year, although there are often drier periods from April through to October. There are high-intensity rainfall events of short duration, but there are no large rainfall events such as cyclones or monsoons. Climate, generally, does not impact on the Project’s operations.
LOCAL RESOURCES
The workforce consists of approximately 2,600 employees In addition, there are approximately 500 contractors. Of the total employee workforce, 94% are PNG citizens (64% local employees and 30% from other parts of PNG).The employees who are not local inhabitants commute to and from the mine by air, either by helicopter from Mt Hagen, PNG, landing directly at the minesite or by a DHC-6 (Twin Otter) light aircraft to the Kairik airstrip, located 11 km from the minesite. A joint venture between Airlines PNG and Heli Niugini operates this service under charter to the Porgera JV. This charter agreement also provides for feeder flights to and from Mt Hagen, PNG utilizing a DHC-8 (Dash 8) aircraft. Destinations are Port Moresby, Lae, Rabaul, Madang, and Wewak in PNG, and Cairns in Australia.
| | | | |
| |
Barrick Gold Corporation – Porgera Joint Venture, Project #1669 Technical Report NI 43-101 – March 16, 2012 | | | Rev. 0 Page 5-1 | |
| | |
| | www.rpacan.com |
|
LOCAL INFRASTRUCTURE
Local infrastructure and resources to support the mine have grown substantially since the mine started operations. Initially, the local population was estimated to be between 3,000 people and 5,000 people. Currently there are approximately 30,000 to 50,000 people. There is a hospital, schools, and other infrastructure that have improved the quality of life and reduced the mortality rates. The influx of people from outside the area has brought in “outsiders” and intermarriage between the various groups from PNG which has changed the dynamics of the local region. The influx of people provides a virtually unlimited supply of labor to work at the mine. Porgera JV provides a great deal of support in the local communities.
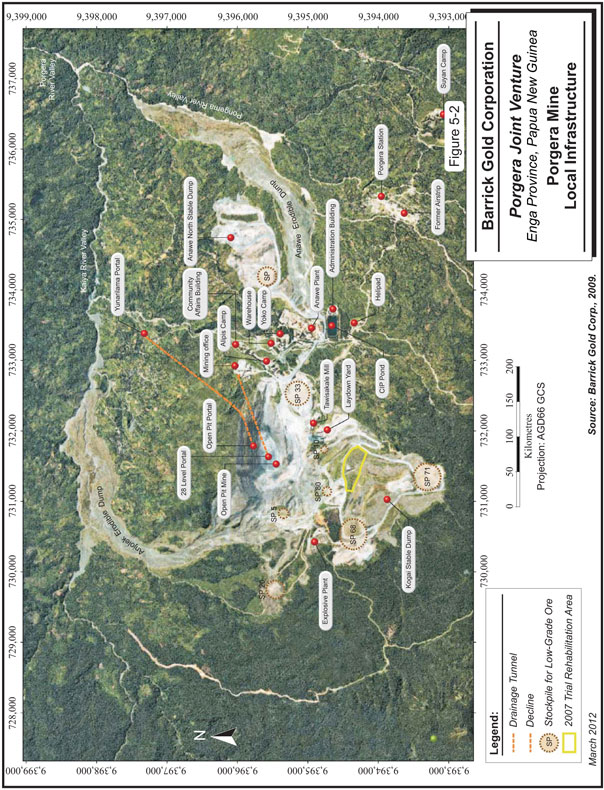
More detailed regional and local infrastructure plans are shown in Figures 5-1 and 5-2.
PHYSIOGRAPHY
The property is located at elevations between 2,200 MASL and 2,700 MASL in rugged mountainous terrain, which is largely covered with rain forest.
| | | | |
| |
Barrick Gold Corporation – Porgera Joint Venture, Project #1669 Technical Report NI 43-101 – March 16, 2012 | | | Rev. 0 Page 5-2 | |
| | |
| | www.rpacan.com |
|
FIGURE 5-1 PORGERA MINE REGIONAL INFRASTRUCTURE
| | | | |
| |
Barrick Gold Corporation – Porgera Joint Venture, Project #1669 Technical Report NI 43-101 – March 16, 2012 | | | Rev. 0 Page 5-3 | |
| | |
| | www.rpacan.com |
|
FIGURE 5-2 PORGERA MINE LOCAL INFRASTRUCTURE
| | | | |
| |
Barrick Gold Corporation – Porgera Joint Venture, Project #1669 Technical Report NI 43-101 – March 16, 2012 | | | Rev. 0 Page 5-4 | |
| | |
| | www.rpacan.com |
|
6 HISTORY
This section is derived from Bassotti & Woodward (2010) unless otherwise noted.
Alluvial gold was first officially reported in the area in 1938 by PNG Government officers and, in 1948, the first geological investigations traced the source to the Waruwari Hill area.
In 1964, J.J. Searson gained title to the area and solicited interest from various explorers. In 1964 and 1966 Bulolo Gold Dredging Ltd. (Bulolo) conducted mapping, channel sampling, and shallow diamond drilling programs.
Two years later, in 1968, Mount Isa Mines (MIM) carried out extensive geological mapping, trenching, and channel sampling programs.
The next year, in 1969, Anaconda Australia Inc. was active in the area with additional mapping, channel sampling, and drilling. Six holes were core drilled at Waruwari and one at Rambari but results indicated, for the prevailing gold price, sub-economic grades and tonnages.
In 1970, MIM and Ada Explorations Pty. Ltd. conducted extensive testing of the alluvial gold and established a small-scale sluicing operation. Also, two adits were driven at Waruwari and one north of Rambari.
Placer (PNG) Pty Ltd. (Placer PNG), which had amalgamated with Bulolo in 1966, entered into a joint venture agreement (JVA) with MIM and became the operator. In 1979, Placer PNG, MIM, and New Guinea Goldfields Ltd. (NG Goldfields) entered into a JVA that granted equal one-third interest to the three parties. An additional agreement, termed the Equity Agreement, was entered into with the Independent State of Papua New Guinea (the State). Under the terms of this agreement, the State had the right to acquire, at cost, up to ten percent interest in the project if it was developed.
| | | | |
| |
Barrick Gold Corporation – Porgera Joint Venture, Project #1669 Technical Report NI 43-101 – March 16, 2012 | | | Rev. 0 Page 6-1 | |
| | |
| | www.rpacan.com |
|
In 1981, a preliminary technical and economic evaluation was carried out by Fluor Mining and Metals Inc. on behalf of the joint venture partners and concluded, at the time, the project was uneconomic based on a 15,000 tpd production rate from an open pit. Subsequently, six zones of higher mineralization were discovered in the proposed mine area and another economic evaluation, based on the new information, was done in 1982. Subsequent to that evaluation, a seventh zone was discovered by surface exploration. Another preliminary economic evaluation was conducted in 1984 using a 4,000 tpd production rate and returned positive results.
Development on the mine began in 1985 with the collaring of an exploration adit. A full feasibility study was completed in 1989, based on an 8,000 tpd production rate from a combined open pit and underground operation. The joint venture partners’ application for an SML was approved in May, 1989, and full construction began immediately. The State accepted its full ten percent entitlement under the 1979 Equity Agreement and the three joint venturers were diluted to 30% interest each.
In 1990, commercial production was declared and MIM sold its 30% to Highland Gold Ltd (Highland). In 1993, Placer PNG, NG Goldfields, and Highland sold 15% (five percent each) interest in the property with the State purchasing ten percent and the remaining five percent going to Enga Province and the Porgera landowners.
In addition to the carried interest in the Porgera JV project, the State had been involved in the development of the Kutubu oil field and had direct equity involvement with the Lahir Gold Project. This lead to the formation and partial privatization of Orogen Minerals Ltd. (Orogen) to whom the State sold its 20% interest in the Project (Orogen, 2001).
Since startup the operation has expanded four times. The initial expansion in 1991, termed Stage 2, saw the addition of three autoclaves, an acid neutralization circuit, a 150 tpd lime plant, and a 310 tpd oxygen plant.
In 1992 the open pit commenced operation with an 8,000 tpd primary crusher, a semi-autogenous grinding (SAG) mill, ball mill, and additional capacity in the flotation concentrator that was part of Stage 3 expansion. The next expansion, Stage 4A in
| | | | |
| |
Barrick Gold Corporation – Porgera Joint Venture, Project #1669 Technical Report NI 43-101 – March 16, 2012 | | | Rev. 0 Page 6-2 | |
| | |
| | www.rpacan.com |
|
1993, added a ball mill and raised the grinding capacity of the operation to 10,500 tpd. A 75 tpd oxygen plant and a fourth autoclave was added and the mining rate for the underground operations was increased to 5,000 tpd.
Late in 1995, the Stage 4B expansion increased the mill capacity to 17,700 tpd with the addition of a SAG mill, a ball mill, flotation cells, a 340 tpd oxygen plant, an upgrade to the leach circuit, an expansion to the lime plant, and an increase in water storage capacity at Waile Creek Dame reservoir.
In 1997, the underground operation was placed on care and maintenance and an adit was collared. The adit was designed to serve dual purposes, exploration access and drainage for the open pit. It was successful in providing a means of identifying additional underground resources and a feasibility study recommended restarting underground operations. Underground operations re-commenced in 2002 and, as of 2009, produced 750,000 tpa of ore. Improvements were also made to the processing circuit with the expansion of the cleaner flotation circuit.
Also in 1997, Placer Dome Inc. (Placer Dome) acquired Highland for US$344 M and, along with its control of Placer PNG, increased its overall stake in the joint venture to 50%. Placer further increased its interest in the Project to 75% in 2003 with the acquisition of Aurion Gold Ltd. which was beneficial owner of the 25% controlled by NG Goldfields.
In 1998, additional oxygen plant capacity was installed that allowed for an increase in sulphur throughput. This was followed by other enhancements in 1999 that included the addition of a Knelson concentrator gravity separation circuit in the grinding section, an extension of the rougher/scavenger flotation circuit, and the addition of a cleaner circuit to the gravity circuit.
An Acacia reactor was installed in the gold room in 2001 to improve the gravity recovery of free gold. A contact secondary crusher was installed to improve mill capacity and bridge the gap between milling and oxidation capacity from 2004 to 2006.
| | | | |
| |
Barrick Gold Corporation – Porgera Joint Venture, Project #1669 Technical Report NI 43-101 – March 16, 2012 | | | Rev. 0 Page 6-3 | |
| | |
| | www.rpacan.com |
|
In 2002, Oil Search Ltd. (Oil Search) merged with Orogen and acquired the 20% interest that had formerly belonged to the State. In 2003, Oil Search sold its 20% interest to Durban Roodepoort Deep Ltd. (now named DRDGOLD Ltd.) for US$ 73.8 M.
In 2006, Barrick acquired 100% control of Placer Dome and took over operations at Porgera JV. In 2007, Barrick purchased an additional 20% interest in the Project, which resulted in an overall increase in their interest to 95%. In 2011, a twin decline and a paste backfill plant were completed.
Historical ounce production from the beginning of the mine life in 1990 to 2011 is shown in Table 6-1.
| | | | |
| |
Barrick Gold Corporation – Porgera Joint Venture, Project #1669 Technical Report NI 43-101 – March 16, 2012 | | | Rev. 0 Page 6-4 | |
| | |
| | www.rpacan.com |
|
TABLE 6-1 PORGERA JV HISTORICAL OUNCE PRODUCTION
Barrick Gold Corporation – Porgera JV
| | | | | | |
Year | | Recovery
(%) | | Gold Poured
(oz) | | Contained Ounces
Mined (oz) |
1990 | | 69.7 | | 265,645 | | 381,126 |
1991 | | 85.9 | | 1,216,101 | | 1,415,717 |
1992 | | 94.7 | | 1,485,077 | | 1,568,191 |
1993 | | 90.3 | | 1,156,669 | | 1,280,918 |
1994 | | 86.8 | | 1,032,767 | | 1,189,824 |
1995 | | 83.0 | | 848,868 | | 1,022,733 |
1996 | | 77.2 | | 854,822 | | 1,107,426 |
1997 | | 73.5 | | 712,693 | | 969,650 |
1998 | | 75.3 | | 726,806 | | 965,086 |
1999 | | 77.9 | | 754,754 | | 968,875 |
2000 | | 78.9 | | 910,434 | | 1,153,909 |
2001 | | 81.6 | | 760,622 | | 932,135 |
2002 | | 84.8 | | 641,811 | | 756,853 |
2003 | | 87.6 | | 851,920 | | 972,511 |
2004 | | 88.4 | | 1,019,700 | | 1,153,507 |
2005 | | 90.9 | | 847,130 | | 932,039 |
2006 | | 88.3 | | 523,358 | | 592,704 |
2007 | | 85.0 | | 533,913 | | 628,133 |
2008 | | 85.5 | | 637,572 | | 745,698 |
2009 | | 87.8 | | 572,595 | | 652,158 |
2010 | | 86.8 | | 524,572 | | 604,346 |
2011 | | 86.7 | | 519,944 | | 463,470 |
| | | | | | |
Totals | | | | 17,397,773 | | 20,457,009 |
| | | | |
| |
Barrick Gold Corporation – Porgera Joint Venture, Project #1669 Technical Report NI 43-101 – March 16, 2012 | | | Rev. 0 Page 6-5 | |
| | |
| | www.rpacan.com |
|
7 GEOLOGICAL SETTING AND MINERALIZATION
REGIONAL GEOLOGY
The tectonic units of Papua New Guinea result from collision and accretion of the Australian continental plate to the south with the Pacific oceanic plate to the north (Fleming et al., 1986). The zone of interaction between the two plates forms the Central orogenic zone. The Papuan platform that hosts the Project is separated from the Central orogenic zone by the Lagaip fault zone, located some 25 km north of Porgera JV.
The Late Jurassic to Cretaceous pelitic, terrigenous, shelf sediments of the Chim Formation were partially eroded during Paleocene emergence and unconformably overlain by Eocene to Miocene limestone (Figure 7-1). Limestone deposition ceased following commencement of Eocene uplift and tectonism due to continental collision and/or crustal thickening. On the Papuan platform, folding and southerly thrusting occurred. Later Miocene calc-alkaline igneous activity within the Central orogenic zone took place. Mineralized intrusive rocks occur within this zone and Porgera and OK Tedi intrusive systems may have been derived by the southward migration of tectonism (Fleming et al., 1986).
The Porgera intrusive complex is a calc-alkaline series of diorite plugs, stocks and dikes that form predominant relief within a seven kilometre wide basin rimmed to the south and east by limestone cliffs. Late Cretaceous shale and mudstone sediments of the Chim Formation outcrop within the basin and extend to the northwest along the margin of the Papuan platform. These sediments are interbedded with calcareous to dolomitic siltstone and calcareous to glauconitic arenites or sandstones and host characteristic syngenetic pyrite mineralization. Eocene limestone of the Mendi Group unconformably overlies the Chim Formation. No limestone outcrops in the vicinity of the Porgera intrusive complex and no skarn rocks have been observed (Fleming et al., 1986).
The stocks and sills of the Porgera intrusive complex range from one metre wide dikes to bodies that are hundreds of metres in width. No evidence of extrusion exists but textural observations and spatial relationship with the overlying limestone indicate intrusive emplacement close to surface (Fleming et al., 1986).
| | | | |
| |
Barrick Gold Corporation – Porgera Joint Venture, Project #1669 Technical Report NI 43-101 – March 16, 2012 | | | Rev. 0 Page 7-1 | |
| | |
| | www.rpacan.com |
FIGURE 7-1 REGIONAL GEOLOGY
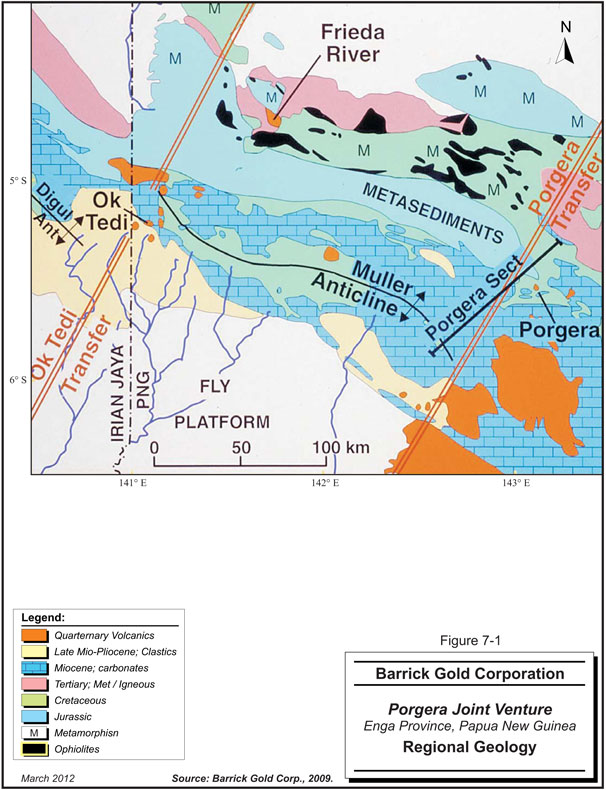
| | | | |
| |
Barrick Gold Corporation – Porgera Joint Venture, Project #1669 Technical Report NI 43-101 – March 16, 2012 | | | Rev. 0 Page 7-2 | |
| | |
| | www.rpacan.com |
|
LOCAL GEOLOGY
In the vicinity of the Porgera intrusive complex, sedimentary layering strikes to the northwest dipping steeply with several tight folds plunging to the southeast. Thrusts and steeply dipping faults intersect the shales. The overlying limestone is folded into broad open structures with low dip angles and has the appearance of having rafted over the shales. The limestone displays blocks of competent rock tens of kilometres in area (Fleming et al., 1986)
The principal structural features in the Porgera intrusive complex are the east trending faults, that control drainage in the area, and the Roamane Fault (RF), which parallels and is subsidiary to the Lagaip Fault (Fleming et al., 1986).
The intrusive complex is characterized by gabbroic and porphyritic rocks of alkalic basalt composition. The stocks and dikes of the Porgera intrusive have experienced variable degrees of alteration. Gold mineralization post dates alteration and occurs in three stages:
| | • | | Magnetite-sulphide-carbonate±quartz veins with minor gold |
| | • | | Base metal-sulphide-carbonate±quartz±gold veins |
| | • | | Quartz-roscoelite-pyrite-gold veins and breccias |
The third stage of mineralization is the most economically significant (Ronacher et al., 2004).
PROPERTY GEOLOGY
The Porgera area geology consists of a complex sequence of high level potassium-rich intrusives and variably altered sedimentary rocks (Figures 7-2 and 7-3). It has characteristics of different deposit types. Despite its alkalic nature, Porgera shares many similarities with porphyry copper deposits. Rapid emplacement at shallow crustal levels distinguishes it from a typical gabbroic intrusion and the nature of the mineralization is more indicative of an epithermal gold deposit (Richards and Kerrich, 1993).
| | | | |
| |
Barrick Gold Corporation – Porgera Joint Venture, Project #1669 Technical Report NI 43-101 – March 16, 2012 | | | Rev. 0 Page 7-3 | |
| | |
| | www.rpacan.com |
|
The primary sediments are pyritic, slightly calcareous, massive, incompetent bituminous shales and mudstones known as “brown mudstones”. These occur on the southwest and northwest margins of Waruwari (located in the southern part of the Porgera intrusive complex) (Handley and Bradshaw, 1986).
Several distinctive interbeds of calcareous, grey, massive, silt-size sediment occur on the flanks of Waruwari and dip eastward. These contain significant amounts of calcium carbonate. Thought to be products of hydrothermal alteration and remobilized sedimentary carbonate, these “calcareous sediments” are found adjacent to some intrusives (Handley, G.A. and Bradshaw, P.M.D., 1986).
The “black sediments” are the main variant on the “brown mudstones” and are the major host rock. These are dark grey to black, well-bedded, silt sized, shallow marine sediments. The bituminous material has been broken down by hydrothermal alteration to carbon. Interpreted to be derived from the “brown mudstone”, the “black sediments” are more competent and less friable (Fleming et al., 1986).
Altered sediments are easily recognizable as they are pale grey to cream-coloured and occur at the margins of the intrusives. They are sericite-dolomite altered “black” and “calcareous sediments”. At depth, the strongly altered sediments appear mottle, pale red, green or yellow (Fleming et al., 1986)
| | | | |
| |
Barrick Gold Corporation – Porgera Joint Venture, Project #1669 Technical Report NI 43-101 – March 16, 2012 | | | Rev. 0 Page 7-4 | |
| | |
| | www.rpacan.com |
FIGURE 7-2 PROPERTY GEOLOGY
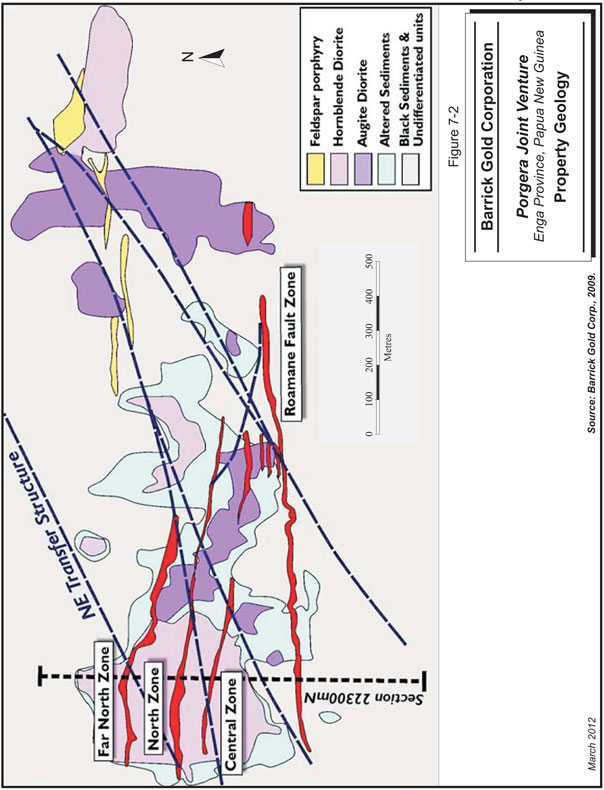
| | | | |
| |
Barrick Gold Corporation – Porgera Joint Venture, Project #1669 Technical Report NI 43-101 – March 16, 2012 | | | Rev. 0 Page 7-5 | |
| | |
| | www.rpacan.com |
|
The major intrusive phases at Porgera are hornblende diorite, feldspar porphyry and hornblende diorite porphyry. These occur as stocks and sills and contacts generally dip steeper that 45°. Each of the intrusive rock types occur as more than one intrusive body, are inhomogeneous in texture and have chilled margins. The presence of an intrusive body indicates a location of structural disturbance and larger intrusions occur in areas of structural dislocation (Fleming et al., 1986).
By volume, hornblende diorite is the most prevalent rock type with two distinct bodies occurring. Hornblende phenocrysts are up to ten millimetres and plagioclase is the dominant igneous mineral with augite, minor biotite and apatite. Equigranular, moderately coarse grained augite hornblende diorite occurs at the northern margin of Waruwari and at Rambari, north of the Romaine Fault. Olivine replacement is observed. The presence of olivine indicates a basic composition of magma that has been altered. Hornblende diorite occurs at depth in Waruwari. The matrix is predominantly feldspar, apatite and quartz with subordinate hornblende phenocrysts and no augite (Fleming et al., 1986).
Feldspar porphyry forms small outcrops to the south of Waruwari and occur as small stocks to the northeast of Waruwari. The second most prevalent rock type by volume, it strikes north-northeast between two hornblende diorite bodies. Strongly altered at Waruwari, the matrix composition is plagioclase with minor mafic granules and quartz and commonly contains numerous sedimentary and intrusive xenoliths up to 50 mm in size in varying stages of absorption. This intrusive phase is characterized by autobrecciation and wall-rock stoping. Relatively unaltered and unmineralized in other areas of the Porgera intrusive complex, it commonly forms dikes that persist for tens to hundreds of metres (Fleming et al., 1986).
Andesite and basalt are a fraction of the size of the three main intrusive bodies and occur mostly as dikes with accessory biotite and matrix plagioclase. Carbonate amygdales define the unit and the presence of olivine indicates basic composition (Fleming et al., 1986).
| | | | |
| |
Barrick Gold Corporation – Porgera Joint Venture, Project #1669 Technical Report NI 43-101 – March 16, 2012 | | | Rev. 0 Page 7-6 | |
| | |
| | www.rpacan.com |
FIGURE 7-3 GEOLOGICAL CROSS SECTION
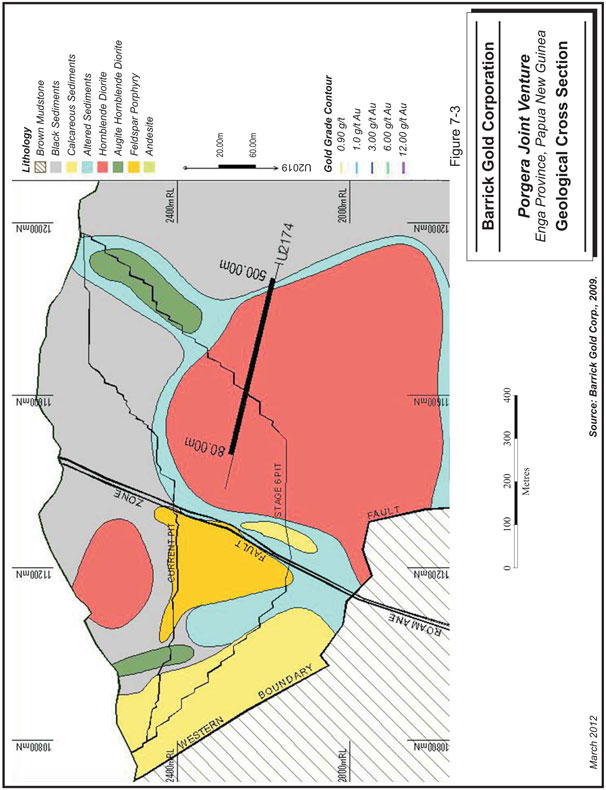
| | | | |
| |
Barrick Gold Corporation – Porgera Joint Venture, Project #1669 Technical Report NI 43-101 – March 16, 2012 | | | Rev. 0 Page 7-7 | |
| | |
| | www.rpacan.com |
|
Field observations have established the relationship between the intrusives. The hornblende diorite was emplaced first and followed by the feldspar porphyry and finally the hornblende diorite porphyry. Pervasive alteration has hampered efforts to age date the rocks. Analyses using K-Ar dating have put the age of the Porgera intrusive complex from 7.5 Ma to 14.4 Ma and confirm it as middle Miocene in origin. The large date range suggests that either several differentiation events have occurred or hydrothermal overprinting has affected the K/Ar ratios. The large disparity in ages, along with the observed field relationships, suggests that the igneous activity occurred in different phases and was not from one single differentiating magma chamber (Fleming et al., 1986).
Three distinct and highly variable types of breccias have been recognized within the Porgera intrusive complex. They are important hosts to mineralization and can display strong alteration and open space filling gangue mineralization.
Sedimentary breccia is a slump feature confined to one narrow horizon. It consists of angular to subangular fragments of Chim Formation shale or calcareous sediment cemented by rock flour and diagenetic calcite with pyrite in both fragments and matrix. Cretaceous in origin, it predates the other brecciation events and does not contain any higher grade mineralization (Fleming et al., 1986).
Tectonic breccias occur in fault zones and at intrusive contacts and generally host low grade gold mineralization. These are usually less than ten metres wide with angular to subrounded fragments in a rock flour matrix. Gold mineralization greater than 3 g/t Au is sometimes observed in contact breccias where fracturing during, and collapse after, intrusive emplacement occur. Associated with the intrusive igneous activity, tectonic breccia predates the hydrothermal breccia but postdates the sedimentary brecciation (Fleming et al., 1986).
Hydrothermal breccias usually occur where there are structural controls. There are three distinct types.
| | • | | Poorly mineralized pebble breccias that occur as steeply dipping sheets. Less than one metre wide, they consist of rounded to subrounded fragments of altered sedimentary and intrusive rocks. The matrix is dark, silica-rich and contains disseminated pyrite locally. |
| | | | |
| |
Barrick Gold Corporation – Porgera Joint Venture, Project #1669 Technical Report NI 43-101 – March 16, 2012 | | | Rev. 0 Page 7-8 | |
| | |
| | www.rpacan.com |
|
| | • | | Crackle breccias occur in strongly fractured rock at Waruwari. One occurrence is in the northeast corner of the deposit (at Yakatabari) and the other is at depth in the feldspar porphyry. These exhibit high fragment content with the matrix composed of crystalline carbonate-quartz and quartz containing finely disseminated pyrite. The fragments are autochthonous and carbonate quartz veins are common. |
| | • | | Disruptive breccia is monomictic or polymictic within a quartz, carbonate and sulphide matrix. Free gold may occur in the presence of chlorite. The fragments can be rotated, angular to round (due to milling) and are often autochthonous. This type of breccia hosts the highest grades and is usually found in the south end of the deposit. |
The crackle breccias appear to predate the disruptive breccias and are controlled by post-intrusive faulting. Disruptive breccias uniquely exhibit repeat brecciation and occur in sediments (Fleming et al., 1986).
The most intense fracturing in the Porgera intrusive complex occurs at Waruwari. Many trends have been identified but only a few faults display any significant displacement. The east trending RF dips south at 70º to 80º and defines the northern extent of Waruwari. It also truncates the Yakatabari and Roamane intrusions. It appears to have moved many times creating a broad zone of deformation that has been invaded by numerous pulses of hydrothermal fluid which altered and mineralized the breccias that were formed by the movement (Fleming et al., 1986).
The host shales and the altered margins of the intrusives are the most fractured. Major vein directions are north-northwest to northeast dipping to the west, and east dipping to the north. The eastern portion of the intrusive complex shows the strongest relationship between vein orientations and the more regional structural trends with sulphide quartz veins and quartz filled breccia zones running parallel to the RF (Fleming et al., 1986).
All intrusive rocks have undergone some hydrothermal alteration. The predominant alteration minerals are carbonate, sericite and chlorite. The most intense and pervasive alteration occurs within the feldspar porphyry and surrounding sediments at Waruwari.
Four phases of alteration have been identified and are summarized below (from Fleming et al., 1986).
| | | | |
| |
Barrick Gold Corporation – Porgera Joint Venture, Project #1669 Technical Report NI 43-101 – March 16, 2012 | | | Rev. 0 Page 7-9 | |
| | |
| | www.rpacan.com |
|
| | • | | Phase 1 is characterized by the presence of chlorite, calcite and minor dolomite, alteration of the intrusive rocks is pervasive, with carbonate cementing of the host sediments adjacent to the intrusives. Intrusive rocks display greenish hues due to chlorite pseudomorphs of mafic minerals. Chlorite and calcite occur as interstitial patches within matrices and carbonates are prominent within vugs. Plagioclase can be altered to sericite or patchy carbonate. |
| | • | | Phase 2 is structurally controlled and best developed in permeable zones. The loci of alteration is intrusive contacts, veins, faults and within the breccia. The relationship with Phase 1 alteration is complex, with overprinting, sharp and gradational contacts observed. Phase 2 alteration is stronger and affects most intrusive and adjacent sedimentary rocks. The alteration exhibits a bleaching of the dark mafic minerals. These have been replaced by carbonate and plagioclase has been replaced by sericite. Olivine alters to serpentine, but siderite, epidote, apatite and clay minerals also occur. Textural modifications are common, and sericite and carbonate flooding of porphyry matrices have been observed. The bleached appearance in the sediments is a product of the removal of organic bituminous material and the formation of sericite, montmorillonite clays, and dolomite replacement of calcite. |
| | • | | Phase 3 is characterized by silicification and regularly occurs in conjunction with Phase 2 alteration. Phase 3 alteration commonly occurs in strongly brecciated rock with igneous, or sedimentary and igneous, fragments that are intensely carbonatized and sericitized, with minor silicification. The matrix is dominated by silica, with chlorite developing as acicular or colloform aggregates in both fragments and matrix. Fine gold has been observed in these chlorite aggregates and specular hematite may occur. In sediments, Phase 3 alteration can result in hornfelsing. |
| | • | | Phase 4 alteration is confined to late fracture and fault zones and destroys all mineralogy and texture. It is characterized by argillic mineral assemblages and has not been recognized at depth. |
MINERALIZATION
Mineralization occurs within the Porgera intrusive complex and is closely associated with three dominate structural trends, the RF (Zone VII), the Hanging Wall Shear Zone (Zone VI) and the Footwall Splay Zone (Zone VIII). Mineralization occurs around the margins and within the intrusive bodies. The Footwall Diorite (north of Zone VII) and the Eastern Deeps have contributed significant tonnages at moderate grade (Agnew & Bassotti, 2008).
| | | | |
| |
Barrick Gold Corporation – Porgera Joint Venture, Project #1669 Technical Report NI 43-101 – March 16, 2012 | | | Rev. 0 Page 7-10 | |
| | |
| | www.rpacan.com |
|
Gold is suggested to have been transported as a chloride complex in early magmatically derived hypersaline fluids and deposited as disseminate auriferous pyrite during cooling as a result of sulphidation and sericitization reactions with mafic igneous wall rocks.
Precious metal mineralization comprises four types, corresponding to four distinct mineralizing events. From oldest to most recent, these are:
| | • | | Auriferous pyrite, sphalerite and galena; |
| | • | | Coarse euhedral auriferous pyrite; |
| | • | | Fine-grained anhedral auriferous arsenical pyrite; |
| | • | | Gold and electrum associated with roscoelite. |
The fourth mineralization style is typified by very high grades and the presence of roscoelite is a useful visual indicator of these high grade zones. The distribution of mineralization is associated with structural activity and, to a lesser extent, alteration. The deposit is a low-silica, high-sulphur system with most of the gold being refractory, likely in solid solution with pyrite grains. The relationship between higher gold grades and sulphide content, however, is not direct.
Gold mineralization occurs as fracture-fillings and as disseminations in and around faults, breccias and dilatant zones. Gold is usually present as submicroscopic grains within the pyrite, with a relatively minor component occurring as free grains. Important accessory minerals include quartz and roscoelite. Cross cutting relationships indicate the mineralization occurred in several pulses.
The four mineralization types that occur within the deposit are summarized in Table 7-1.
| | | | |
| |
Barrick Gold Corporation – Porgera Joint Venture, Project #1669 Technical Report NI 43-101 – March 16, 2012 | | | Rev. 0 Page 7-11 | |
| | |
| | www.rpacan.com |
|
TABLE 7-1 MINERALIZATION TYPES AT PORGERA JV
Barrick Gold Corporation – Porgera JV
| | | | | | | | | | | | |
Type | | Abundance | | Form | | Principal
Minerals | | Accessory
Minerals | | Median
Grade(g/t) | | Au(g/t)
:S(%) |
| A | | Very widespread | | Vein, veinlets, breccia | | Auriferous pyrite, sphalerite, galena | | Arsenical pyrite, freibergite, gold, electrum, pyrrhotite | | 3.0 (Au)
12.0 (Ag) | | 1:3 |
| | | | | | |
| B | | Widespread | | Disseminated, veinlet and stockwork | | Coarse, euhedral auriferous pyrite | | Sphalerite, galena | | 2.5 (Au)
5.0 (Ag) | | 1:2 |
| | | | | | |
| C | | Restricted | | Fine disseminated in crackle breccia | | Fine, anhedral auriferous pyrite | | Pyrite, marcasite | | 6.0 (Au)
4.0 (Ag) | | 4:1 |
| | | | | | |
| D | | Localized | | Veinlets and breccia matrix, vuggy | | Gold, electrum | | Pyrite, hematite, tellurides | | 10.0 (Au)
10.0 (Ag) | | 10:1 |
From Handley and Bradshaw, 1986
Evidence suggests that Type-D was the last mineralization event and that some remobilization of gold may have occurred. Later fluids favoured the deposition of metallic gold suggesting earlier mineralization types may have been affected by later mineralizing events. Gold grade is closely related to fracture intensity and mineralization type (Handley &Bradshaw, 1986).
Mineralization Types-A and -B are dominant volumetrically, with Type-C being subordinate and Type-D being relatively minor. The mineralization types form recognizable zones within the deposit as summarized in Table 7-2.
| | | | |
| |
Barrick Gold Corporation – Porgera Joint Venture, Project #1669 Technical Report NI 43-101 – March 16, 2012 | | | Rev. 0 Page 7-12 | |
| | |
| | www.rpacan.com |
|
TABLE 7-2 MINERALIZED ZONES AT PORGERA JV
Barrick Gold Corporation – Porgera JV
| | | | | | |
Zone | | Location | | Control | | Dominant Mineralization Type |
| I | | Outcrops at south end of Waruwari, plunges to north | | Pipe-like breccia | | Type-A massive sulfides in breccia matrix (silica poor) |
| | | |
| II | | Outcrops adjacent to Zone I, plunges NNE, dips east | | Brecciated contacts of andesite / basalt dykes | | Type-D |
| | | |
| III | | Mid-depth at Waruwari | | Brecciated feldspar porphyry contacts | | Type-B |
| | | |
| IV | | Parallel to strike (NNW), dips east | | Corridor zone between Yakatabari and Waruwari hornblende diorites, underlain by feldspar porphyry | | Type-A and Type-B |
| | | |
| V | | Broad zone underlying Waruwari at depth, strikes east | | Brecciation at feldspar porphyry contact and crackle brecciation within feldspar porphyry | | Type-C (subordinate but significant Type-B) |
| | | |
| VI | | Strikes east through Yakatabari diorite | | Associated with east striking faults and crackle brecciation | | Type-C |
| | | |
| VII | | South of RF, north end of Waruwari, strikes east, dips south | | RF controlled brecciation | | Type-D (significant Type-C to east, Type-A and Type-B in central area). Silica rich, sulfide poor |
| | | |
| VIII | | Strikes east, dip south | | Splay faults linking to RF, intersect NE trending “linking” faults | | |
From Handley & Bradshaw, 1986
The Porgera Zone VII deposit is an epithermal style mineralized body with a 930 m strike length and an average width of 20 m to 30 m and a maximum width of 100 m (Agnew & Bassotti, 2008).
The Footwall Splay Zone (Zone VIII) mineralized bodies are hosted within or associated with two east-west striking, south dipping faults named the Northern Footwall Splay faults (NFWS). These faults intersect the RF to the east and are cut by northeast trending “linking” faults. High grade mineralization occurs at the intersection of the NFWS splays and these “linking” faults. These deposits have been subdivided into North, Central, Eastern and Eastern Deeps mineralized bodies (Agnew & Bassotti, 2008).
| | | | |
| |
Barrick Gold Corporation – Porgera Joint Venture, Project #1669 Technical Report NI 43-101 – March 16, 2012 | | | Rev. 0 Page 7-13 | |
| | |
| | www.rpacan.com |
|
8 DEPOSIT TYPES
Porgera Mine is an epithermal vein-type gold-silver deposit but it shares many characteristics with porphyry copper deposits. Remnant heat from the intrusive rocks drove the boiling and upward migration of hydrothermal fluids and resulted in the emplacement of mineralization. The movement of these fluids was controlled by permeability of the rock mass, which developed in and around faults and tectonic zones of dilatancy. As such, the mineralization tends to occur in tabular bodies and breccia zones, the geometry of which is strongly influenced by the orientation of fault structures and subsidiary fractures. Deposition of ore minerals in epithermal systems is also dependent upon temperature and hydrostatic pressure. These conditions are generally closely related to elevation, with reduction of both temperature and pressure as the fluids migrate upwards.
| | | | |
| |
Barrick Gold Corporation – Porgera Joint Venture, Project #1669 Technical Report NI 43-101 – March 16, 2012 | | | Rev. 0 Page 8-1 | |
| | |
| | www.rpacan.com |
|
9 EXPLORATION
Since the last audit report in 2009, exploration work has taken place in the following areas: Tupegai, Tawasikale Veins, Tawasikale Intrusion, P-Zone, Peruk, Central Zone East, and Alipis. The most recent summary of exploration work was prepared in December 2010 (Bassotti & Woodward, 2010). At that time many of the programs for the targets described below were still underway or had yet to be carried out.
TUPEGAI
This program is designed to test the northern strike extension of the north-south trending, east dipping, Tupegai augite-hornblende-diorite (AHD). . Two ten metre drill hole intersections of 15 g/t Au and 9.6 g/t Au were encountered in two older holes. Targeting another AHD-style, sub-parallel, south-dipping lode complex characterized by Stage 2D (Type-D?) veining, as structural elements of the east-west trending RF zone, the drill program was completed in late 2010 and for a total depth of 2,647 m. The main mineralized intervals intersected were associated with reactivated Type-A vein structures and Stage 2D (Type-D?) vein breccia.
TAWASIKALE VEINS
The Tawasikale program targeted veins in the southern portion of the mine in the hanging wall of the RF. Drilling in this area was intended to follow up on high-grade intercepts and visible gold occurrences obtained in an earlier drill program. The drilling was also to test for extensions of a corridor of brecciation and altered sediments and intrusives. This breccia zone, termed the Damage Zone, strikes east-west, is near-vertical, and measures up to 123 m in width (see Figure 9-1).
| | | | |
| |
Barrick Gold Corporation – Porgera Joint Venture, Project #1669 Technical Report NI 43-101 – March 16, 2012 | | | Rev. 0 Page 9-1 | |
| | |
| | www.rpacan.com |
FIGURE 9-1 PROPOSED HOLES FOR THE TAWASIKALE VEINS DRILL HOLE PROGRAM
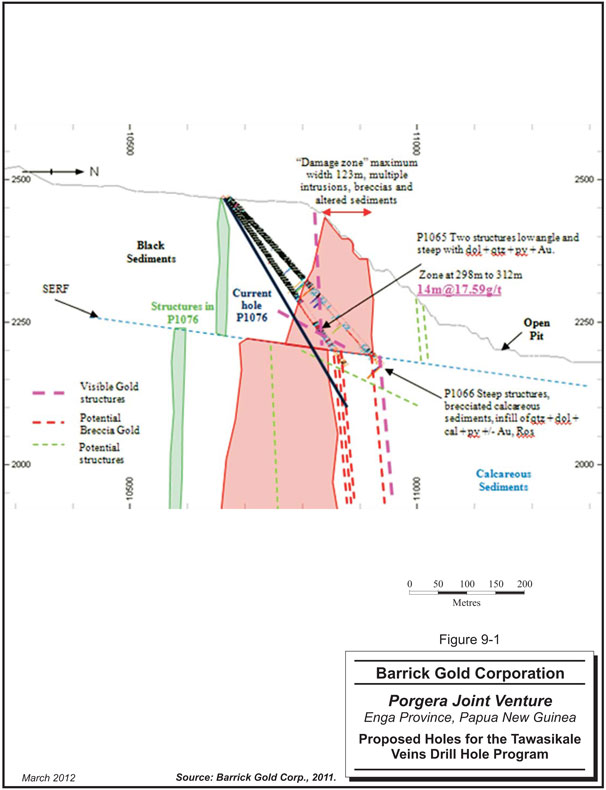
| | | | |
| |
Barrick Gold Corporation – Porgera Joint Venture, Project #1669 Technical Report NI 43-101 – March 16, 2012 | | | Rev. 0 Page 9-2 | |
| | |
| | www.rpacan.com |
|
TAWASIKALE INTRUSION
The Tawasikale Intrusion is a feldspar porphyry body also located in the southern portion of the mine along the hanging wall of the RF. Drilling on this target was designed for the following purposes:
| | • | | Test for mineralization associated with the intrusion. |
| | • | | Test the intrusion depth extent, thickness and alteration halo. |
| | • | | Test the repetitive low angle reverse south east dipping fault structures (SERF). |
| | • | | To test the intersection of the Western Boundary Fault (WBF) and the RF for potential mineralisation. |
P-ZONE
The P-Zone in located in the central portion of the mine, on the down dip extension of the East and Far North Zones (see Figure 9-2). Exploration work in this area is following up on an intercept of six metres grading 24.2 g/t Au obtained from hole U1984.
| | | | |
| |
Barrick Gold Corporation – Porgera Joint Venture, Project #1669 Technical Report NI 43-101 – March 16, 2012 | | | Rev. 0 Page 9-3 | |
| | |
| | www.rpacan.com |
FIGURE 9-2 P-ZONE TARGET
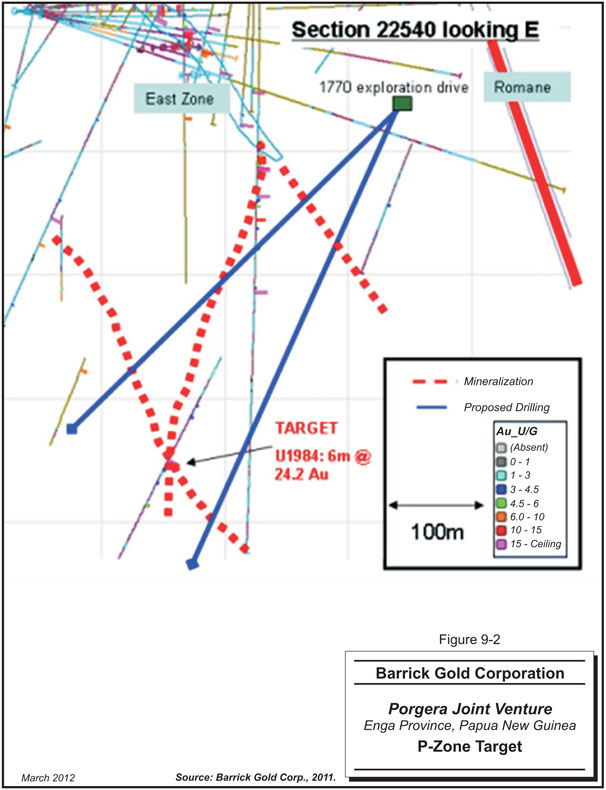
| | | | |
| |
Barrick Gold Corporation – Porgera Joint Venture, Project #1669 Technical Report NI 43-101 – March 16, 2012 | | | Rev. 0 Page 9-4 | |
| | |
| | www.rpacan.com |
|
PERUK
The Peruk target, located in the eastern part of the Porgera intrusive complex, consists of a steep south dipping west-northwest trending structure, hosting Type-D vein mineralization and transecting a hornblende to feldspar porphyritic intrusion (the Peruk porphyry). It is defined at surface by gold mineralization occurring in historical trenches. A previous hole, U3265, intersected 5.4 g/t Au over four metres (down hole width) within the feldspar porphyry. Five drill holes, collared underground, were planned to test targets down dip and along strike of drill hole U3265. Drilling was completed in January, 2011 with the resulting significant intersections shown in Table 9-1.
TABLE 9-1 PERUK SIGNIFICANT DRILL INTERCEPTS
Barrick Gold Corporation – Porgera JV
| | | | | | | | | | | | | | | | | | | | | | | | |
| HOLE ID | | Interval (m) | | | Intersection
(m) | | | Au (g/t) | | | S (%) | | | True Thickness
(m) | |
| | From | | | To | | | | | |
| U5960 | | | 375.0 | | | | 377.9 | | | | 2.9 | | | | 23.2 | | | | 4.84 | | | | 1.8 | |
| | | 465.0 | | | | 466.0 | | | | 1.0 | | | | 5.01 | | | | 1.33 | | | | 0.6 | |
| | | | | | |
| U5961 | | | 289.0 | | | | 289.7 | | | | 0.7 | | | | 4.72 | | | | | | | | 0.5 | |
| | | | | | |
| U5962 | | | 250.6 | | | | 252.4 | | | | 1.8 | | | | 6.18 | | | | 4354 | | | | 0.9 | |
| | | | | | |
| U5962W1 | | | 249.6 | | | | 251.1 | | | | 1.5 | | | | 4.12 | | | | 4.88 | | | | 0.6 | |
CENTRAL ZONE EAST
This program targeted the eastern extension of the east-west striking sub-vertical Central Zone mineralized structure, consisting of quartz-roscoelite veins and breccias hosted within augite diorite and altered sediments, which links the RF Zone and the North Zone. Drilling was done between September, 2010 and November, 2010 and comprised 12 holes. The first hole, drilled proximal to the Central Zone resource, intersected an east-west striking, sub-vertically dipping gold bearing quartz-roscoelite Type-D vein at approximately 180 m down hole. Additional holes, drilled to the east at a 40 m by 40 m spacing through the target zone, intersected mostly thin scattered zones of low to moderate grade gold mineralization. The AHD, which is a favourable host of gold mineralization in the Central Zone, shows less continuity to the east and, in its absence, mineralizing fluids appear to precipitate out into discontinuous fractures within sediments and along pre-existing carbonate-base metal Type-A vein type systems. This results in multiple poorly-defined zones of low- to moderate-grade gold mineralization. Significant intersections are summarized in Table 9-2.
| | | | |
| |
Barrick Gold Corporation – Porgera Joint Venture, Project #1669 Technical Report NI 43-101 – March 16, 2012 | | | Rev. 0 Page 9-5 | |
| | |
| | www.rpacan.com |
|
TABLE 9-2 CENTRAL ZONE SIGNIFICANT DRILL INTERCEPTS
Barrick Gold Corporation – Porgera JV
| | | | | | | | | | | | | | | | | | | | | | | | |
| HOLE ID | | Interval (m) | | | Intersection
(m) | | | Au
(g/t) | | | S
(%) | | | True Thickness
(m) | |
| | From | | | To | | | | | |
| U5997 | | | 154.0 | | | | 155.0 | | | | 1.0 | | | | 5.25 | | | | 0.78 | | | | 0.5 | |
| | | | | | |
| U5998 | | | 89.2 | | | | 89.7 | | | | 0.5 | | | | 10.80 | | | | 11.92 | | | | 0.4 | |
| | | | | | |
| U5998B | | | 173.0 | | | | 174.0 | | | | 1.0 | | | | 7.58 | | | | 0.47 | | | | 0.5 | |
| | | 179.0 | | | | 181.0 | | | | 2.0 | | | | 7.28 | | | | 2.48 | | | | 1.9 | |
| | | | | | |
| U5999 | | | 107.0 | | | | 111.0 | | | | 4.0 | | | | 9.75 | | | | 0.88 | | | | 1.4 | |
| | | 128.0 | | | | 128.7 | | | | 0.7 | | | | 8.93 | | | | 15.17 | | | | 0.7 | |
| | | | | | |
| U6001 | | | 72.0 | | | | 73.0 | | | | 1.0 | | | | 5.33 | | | | 1.50 | | | | 0.7 | |
| | | | | | |
| U6002 | | | 55.9 | | | | 56.4 | | | | 0.6 | | | | 6.83 | | | | 5.87 | | | | 0.5 | |
| | | | | | |
| U6005 | | | 116.3 | | | | 118.0 | | | | 1.7 | | | | 26.49 | | | | | | | | 1.5 | |
| | | | | | |
| U6006 | | | 68.0 | | | | 69.0 | | | | 1.0 | | | | 11.32 | | | | 1.14 | | | | 0.9 | |
ALIPIS
The Alipis programme is designed to investigate the possible intersection of the RF zone within surface geochemical anomalies in an area between the north-south trending Tupegai and Kogai dykes, and the poorly tested eastern extension of the known mineralized zones in an effort to identify mineralization outside of the current resource.
Four holes were planned but only three were drilled, of which, none reached the target depth. Little encouragement was gained from the lithologies intersected. The first two abandoned holes found no encouraging alteration, mineralization, or intrusions. The last hole did not intersect the favourably oriented east-west structure of the north-south Kogai dyke.
EXPLORATION POTENTIAL
RPA conducted a cursory review of the exploration work at Porgera JV. The exploration staff are of the opinion that there are significant targets remaining within the mine area as well as underexplored sections of the concessions that warrant further work. In RPA’s opinion, this is a reasonable assessment that exploration work should continue.
| | | | |
| |
Barrick Gold Corporation – Porgera Joint Venture, Project #1669 Technical Report NI 43-101 – March 16, 2012 | | | Rev. 0 Page 9-6 | |
| | |
| | www.rpacan.com |
|
10 DRILLING
Surface drilling is carried out on a nominal 40 m by 40 m spacing. Underground definition drilling is done on a nominal 20 m by 20 m spacing but, where warranted, is reduced to 10 m by 10m intervals. A relatively minor amount of reverse circulation (RC) drilling has been done in the pit. Underground core size is NQ2 (5.06 cm diameter) and the work is conducted by Barrick-operated labour and equipment. Surface holes are collared as PQ (8.51 cm diameter) down to approximately 60 m to 70 m below the collar, where the core size is reduced to HQ (6.35 cm diameter). At a depth of 250 m, the holes are further reduced to NQ (4.76 cm diameter). All surface drilling is conducted by Quest Exploration Drilling (PNG) Ltd.
Drill core is delivered to the site logging facility on a daily basis. Technicians photograph the core and measure recovery and RQD. RPA notes that recovery is not routinely measured, and that there is reportedly a large volume of RQD data that has not been entered into the database. In RPA’s opinion, core recovery is a key measure of the quality of the drilling, and should be done routinely for every hole.
Bulk density measurements are taken on a campaign basis, generally only when new areas of the mine are accessed. Once a suitable number of samples have been taken from a new rock unit, a bulk density value is assigned to it and measurements are suspended.
Geologists log the core and mark it for sampling. Drilling data are captured and managed in an acQuire database. Mine geologists log the holes and capture the data on Toughbook computers, which are linked directly to the Acquire system. Exploration geologists log on conventional lap-tops, which then have to be connected to the network to upload to acQuire. Script routines are run by the database operators to validate the logging information, ensuring that things such as the codes, from and to distances, and the hole depths are consistent.
Planned holes are entered into Acquire prior to drilling. When the holes have been drilled and surveyed, the as-built coordinates and orientations are entered into the database where they are compared with the plan. If there is significant deviation, then follow-up confirmation is carried out.
| | | | |
| |
Barrick Gold Corporation – Porgera Joint Venture, Project #1669 Technical Report NI 43-101 – March 16, 2012 | | | Rev. 0 Page 10-1 | |
| | |
| | www.rpacan.com |
|
Required information in the log includes:
| | • | | From/to depth of the interval being described |
| | • | | Description of the lithology |
| | • | | Structure, alteration, mineralization descriptions |
During the logging process the geologist identified and marked obvious geological boundaries and/or distinct changes in grade and/or style of mineralisation. Core is marked for sampling and turned over to the samplers.
Drill hole collars are surveyed by the mine survey staff. Down hole surveys are carried out using a Ranger single shot instrument. Data are collected starting at ten metres below the collar, continuing at 50 m intervals until the end of the hole is reached. The Ranger single shot camera is calibrated every month on surface to ensure accuracy. Historic survey data are collected using an Eastman Kodak single shot camera. Survey and header information is captured in the database, and the holes are plotted on sections for validation. The hole traces are checked by the drafting department and again by a Senior Geologist.
| | | | |
| |
Barrick Gold Corporation – Porgera Joint Venture, Project #1669 Technical Report NI 43-101 – March 16, 2012 | | | Rev. 0 Page 10-2 | |
| | |
| | www.rpacan.com |
|
11 SAMPLE PREPARATION, ANALYSES AND SECURITY
This section is derived from Bassotti & Woodward (2010) unless otherwise noted.
CORE SAMPLING
Core is marked by the logging geologist for sampling. The following sample intervals are then marked across the core:
| | • | | Approximately one metre in even style/grade of mineralization. |
| | • | | At contacts of intra-mineral and late mineral dykes cutting mineralization. |
| | • | | Less than one metre in high-grade zones with sheeted vein, stockwork, replacement and/or breccia styles of mineralization—guided by geological breaks. |
| | • | | Sample intervals should start from, and stop at, major geological contacts. |
| | • | | Minimum sample width is 0.3 m. |
| | • | | Samples should be no more than one metre in length in PQ-, and 1.5 m in HQ-size core. |
RPA notes that while the protocol is for samples to end at changes in lithology, it was reported during the site visit that underground diamond drill holes are still being sampled at a constant one-metre interval.
Drill samples are assigned numbers generated in acQuire according to Porgera JV site protocol. Sample numbers are written on the core at the start of each interval. A “Sample Advice Sheet” is printed from acQuire and checked with the pencil marks on the core. Quality assurance/quality control (QA/QC) samples, such as blanks, duplicates and certified reference materials (CRMs), are included in the sample stream and, while not appearing on the core itself, these control samples are listed on the Sample Advice Sheet. Numbers are clearly written on calico bags using black, permanent marker pen. Possible high gold and/or sulphide samples are noted and depths of sample intervals are recorded in acQuire.
| | | | |
| |
Barrick Gold Corporation – Porgera Joint Venture, Project #1669 Technical Report NI 43-101 – March 16, 2012 | | | Rev. 0 Page 11-1 | |
| | |
| | www.rpacan.com |
|
The sampler matches the sample number written on the bag against the one on the core and informs the logging geologist if any discrepancies are observed. Sampling does not proceed until sample numbers and intervals coincide on the bags, on the Sample Advice Sheet and on the core. Underground holes are sampled as whole-core and are not split. Core from exploration holes is split using a core saw. One half of the core is lifted from the box (leaving the half with the orientation line in the box) and placed inside the numbered calico bag. Faulted, clayey, or broken intervals that are not cut are sampled entirely as whole core, leaving no material in the box for that interval. This is only done when there are specific instructions from the logging geologist. Calico sample bags are tightly closed and lined up on the core shed floor in numerical order. The control standards and blanks are then added.
Sample number format is “drill hole number-consecutive sample number” starting at 0001. For example the 45th sample in drill hole U5876 will have the number “U58760045”.
All samples from Exploration, Resource Definition and underground grade control are submitted to the mine site laboratory. Batches can include up to a maximum of 45 samples (including QA/QC samples) and each dispatch must be accompanied by a Sample Dispatch Form. This form contains the following information:
| | • | | Unique dispatch identifying number |
| | • | | Project geologist contact information |
| | • | | Analysis and sample preparation required |
| | • | | Any additional instructions |
| | • | | Where to send the results (on-site data administrator) |
| | • | | What to do with pulps and coarse rejects. |
| | | | |
| |
Barrick Gold Corporation – Porgera Joint Venture, Project #1669 Technical Report NI 43-101 – March 16, 2012 | | | Rev. 0 Page 11-2 | |
| | |
| | www.rpacan.com |
|
OTHER SAMPLING
UNDERGROUND CHANNEL SAMPLING
Underground face samples are collected along a sample line that is perpendicular to the lode or vein structure with sample interval widths ranging from a minimum of 0.3 m to a maximum of two metres. Where the lithology changes the samples respect the lithological contacts. Focus is placed on sampling mineralized zones separately from waste sections (i.e. vein contacts, vein centres and waste on hanging and footwall sides). Samples across vein contacts pass at least fifteen centimetres into the adjacent wall rock.
Sampling is done along a corridor (horizontal in the case of a vertical vein) through the lower third of the face. Width of the corridor is set at approximately 50 cm. Sample intervals are marked by the mine geologist. The samples are chipped by the underground field assistant under the supervision of the mine geologist. Samples collected weigh approximately 2.5 kg to 3.0 kg.
BLAST HOLE SAMPLING
Rock chip samples are collected using a nine-inch pie tray (primary method) and scoops. The samples weight must be at least 25 kg per hole for an unbiased analysis of the ten metre hole. The sample collection process consists of the following steps:
| | • | | Place pie tray underneath dust skirt with the open end next to the collar position prior to drilling. |
| | • | | Pie tray must be no more than ten centimetres from the hole. |
| | • | | Pie tray must point away from the hole so that it can take a radial slice of the blast hole cuttings. |
| | • | | When drill depth has reached ten metres, pie tray is removed from under dust skirt so sub-drill is not included in the sample. |
| | • | | The sample is collected by the drill offsider. The sample bag is left with the top folded over (to protect from rain) next to the hole. |
| | • | | The hole collar / sample location is picked up by Survey. |
| | • | | The blast hole sample tag number is stapled to the inside of the bag by the geological sampler. |
| | | | |
| |
Barrick Gold Corporation – Porgera Joint Venture, Project #1669 Technical Report NI 43-101 – March 16, 2012 | | | Rev. 0 Page 11-3 | |
| | |
| | www.rpacan.com |
|
| | • | | The geologist and geological sampler will then map or log the blast hole lithology and alteration and then remove the bag from the blast pattern. |
| | • | | The geologist is to maintain an accurate mud map or logged map of the pattern for cross checking if survey files are corrupted or lost. |
| | • | | No sample bag is to be moved by authorised / unauthorised personnel unless it has a sample number stapled to it. |
| | • | | Only geology personnel can move bags unless permission has been granted by geology. |
The sample information is captured into a handheld Data Logger by the open pit geologist. The information is then transferred to the acQuire Data Capture Object and validated. The standard and blank controls are inserted into the sample run based on a regular ticket ID sequence. Field duplicates are collected (a second pie tray) at a percentage of approximately 5%.
SAMPLE PREPARATION AND ANALYSES
Assays for sulphur and gold are carried out on-site at the Porgera JV laboratory by Barrick employees. RPA inspected the laboratory facilities during the site visit and found it to be properly equipped, well organized, and competently managed. The Porgera JV laboratory is certified as a member of the National Institute of Standards and Industrial Technology (NISIT) which is part of the PNG National Laboratory accreditation scheme. It is also recognized by the National Association of Testing Authorities, Australia (NATA) and it participates in round robin third-party verification through NATA and GEOSTAT (independent suppliers of CRMs).
Diamond drill core and underground chip samples are delivered to the laboratory in calico bags. The samples are transferred onto a trolley and placed in the drying oven. Blast hole samples are transferred from the calico bag to an aluminum tray (50 cm by 40 cm) prior to being placed on a trolley and placed in the drying oven. The oven temperature is controlled between 110°C and 114°C.
After drying the diamond drill core and underground chip samples are crushed and split using a Rocklabs combination jaw crusher and rotating splitter. The split sample weight is approximately four kilograms. The remaining coarse reject from the drill core is transferred into labelled calico bags and further stored in larger plastic bags. The
| | | | |
| |
Barrick Gold Corporation – Porgera Joint Venture, Project #1669 Technical Report NI 43-101 – March 16, 2012 | | | Rev. 0 Page 11-4 | |
| | |
| | www.rpacan.com |
|
crushed sample size distribution must be to a minimum of 80% minus 2 mm or 90% minus 3.35 mm. All samples are pulverized using one of six LM5 pulverisers to 90% passing 106 µ.
A 300 g to 400 g pulp sub-sample is taken from the pulverized sample and put in a labelled brown pulp bag. Samples are sent to the fire assay (FA) section to be processed. Each batch of samples sent for FA is accompanied by a work sheet that includes a “batch” number and a “fusion” number. The pulverized reject from the diamond drill core is discarded. The pulverised reject from the blast hole samples is retained for one week before being discarded.
Samples are, generally, processed in batches of 50. A batch comprises 45 samples, which includes up to two external certified reference materials (CRMs), two pulp duplicates, two in-house reference standards, and one reagent blank.
Samples are weighed into a plastic bag until 50 g is achieved and the weight of the aliquot is transferred from the balance into the CCLAS database. For samples containing high concentrations of sulphur, a 25 g aliquot is used instead of 50 g. A 150 g fusion flux charge is then added to the plastic bag and the contents are thoroughly mixed. The sample and flux are then transferred to a 125 ml crucible. When a sufficient number of samples are prepared to make a batch, they are loaded into a furnace heated to 1050°C and allowed to fuse for 60 minutes. Once removed, the samples are simultaneously poured into fusion molds.
When cooled, the fused product is hammered to remove any slag from the lead button that contains the precious metals. Each of the lead buttons is transferred to a preheated cupel and the set of cupels is inserted into a cupellation furnace heated to 960°C. The cupellation process takes up to 60 minutes to complete. The resulting silver/gold prill is transferred to a test tube which is placed in a rack before being sent for digestion.
Each prill is digested by adding one milliliter of 50% nitric acid (HNO3) to the test tub and heating, on a hot plate, to 105°C for ten minutes. An additional two milliliters of concentrated hydrochloric acid (HCl) is added and test tubes are heated for an additional 15 minutes. The solution is allowed to cool after the digestion is complete and distilled
| | | | |
| |
Barrick Gold Corporation – Porgera Joint Venture, Project #1669 Technical Report NI 43-101 – March 16, 2012 | | | Rev. 0 Page 11-5 | |
| | |
| | www.rpacan.com |
|
water is added to the test tube to bring the volume of each sample up to ten milliliters. Each test tube is shaken and the rack of tubes is transferred to the Varian 240 Atomic Absorption Spectrometry (AAS) instrument for gold analysis. A Lab Fit CS-2000 Sulphur Analyzer is used to determine the sulphide sulphur content. Multi-element determinations for lead, zinc, silver, and copper are routinely performed using acid digestion and AAS techniques. Carbon analyses are performed using a titrimetric procedure.
Gold readings are transferred to the CCLAS system and, if CRMs analyses return values within acceptable limits, the results are published to the database for access by the Geology department.
Graphical representations of the sample preparation and assay workflows for drill hole and blast hole samples are shown in Figures 11-1 and 11-2, respectively.
RPA has reviewed the sample preparation, analyses, and security of the Porgera JV laboratory and found them to meet industry-standards. In RPA’s opinion, results generated from the Porgera JV laboratory are adequate and acceptable for use in the estimation of Mineral Resources. Security is a significant concern, however, throughout the mine. There is considerable evidence, for example, that drill core has been tampered with. Pieces have been noted to be missing from the boxes on delivery to the logging facility, before the sampling can be done. The mine geological staff are aware of this and have taken a number of steps to quantify the loss and try to prevent it. In practice, however, the problem has proven to be somewhat overwhelming, as was observed by RPA during the site visit. Many unauthorized people gain access to the mine despite fairly rigorous security protocols.
In RPA’s opinion, the loss of gold from samples is likely causing an understatement of the estimated Mineral Resources at Porgera JV. However, it is impossible to quantify what the magnitude of any discrepancy might be. Mine production reconciliations appear to confirm that the block models are predicting the grades reasonably well (see Section 15). Work conducted by the mine geology staff suggests that the result of losses of core could be resulting in mineralized zones being overlooked in the modeling process. So the actual understatement in this case may be just omission of resource material from the inventory altogether.
| | | | |
| |
Barrick Gold Corporation – Porgera Joint Venture, Project #1669 Technical Report NI 43-101 – March 16, 2012 | | | Rev. 0 Page 11-6 | |
| | |
| | www.rpacan.com |
FIGURE 11-1 PRIMARY SAMPLE PREPARATION AND ASSAYING WORKFLOW FOR DIAMOND DRILL CORE
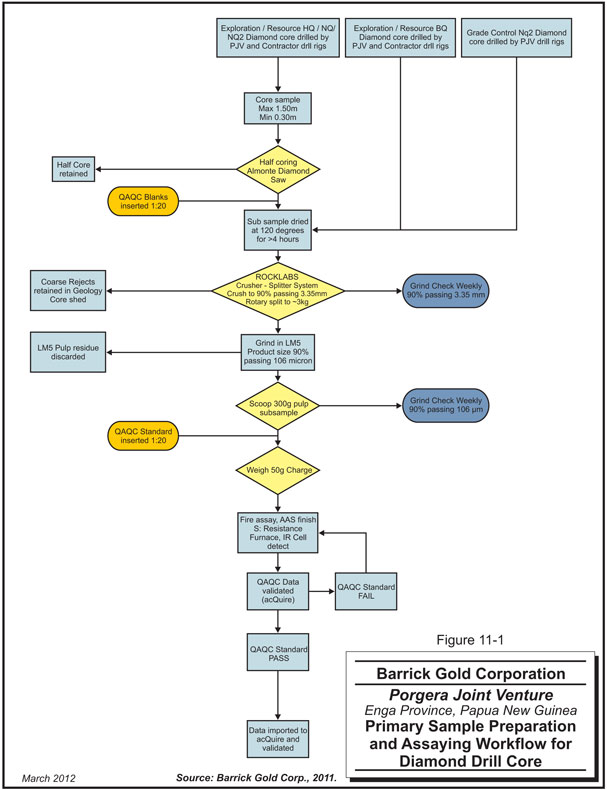
| | | | |
| |
Barrick Gold Corporation – Porgera Joint Venture, Project #1669 Technical Report NI 43-101 – March 16, 2012 | | | Rev. 0 Page 11-7 | |
| | |
| | www.rpacan.com |
FIGURE 11-2 PRIMARY SAMPLE PREPARATION AND ASSAYING WORKFLOW FOR GRADE CONTROL SAMPLES
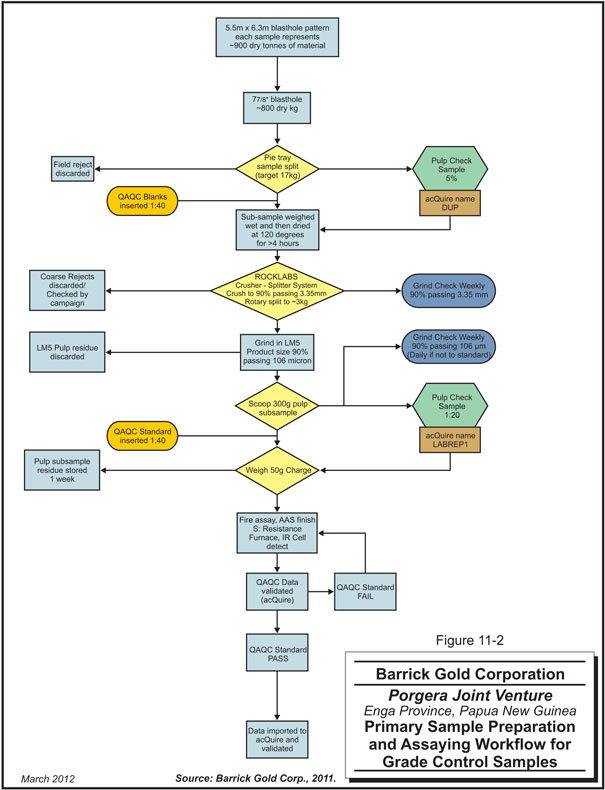
| | | | |
| |
Barrick Gold Corporation – Porgera Joint Venture, Project #1669 Technical Report NI 43-101 – March 16, 2012 | | | Rev. 0 Page 11-8 | |
| | |
| | www.rpacan.com |
|
12 DATA VERIFICATION
For drill core samples, QA/QC materials are placed in the sample stream at a rate of one in twenty. For open pit sampling, one blank and one standard are included with each batch. Reference materials consist of coarse blanks and commercially prepared standards. The blank material is locally-acquired river gravel. The standards are prepared by Rocklabs Inc. The QA/QC samples are entered into the acQuire system along with the regular samples.
The laboratory runs two standards, one blank and two duplicates with every batch of 50 assays. The results of these internal QA/QC analyses are reported to AcQuire and can be viewed by the geology staff. Assay results are posted to a Central Holding Database (CHD). AcQuire polls the CHD twice a day. Batches for which the QA/QC results are within specifications are eligible for download from the CHD. Failures in the QA/QC result in re-assay of the entire batch.
The AcQuire system has validation routines to produce reports of invalid drill hole data, such as overlapping intervals and incorrect hole lengths. The assay data is automatically imported from the laboratory and there are no “certificates” issued. Consequently, there is no way to validate the assay results.
RPA encountered a few errors in the database when attempting to import the drill holes into GEMS. Three drill collars had invalid data in the header table and could not be imported. As a result, three downhole survey records could not be imported because there were no corresponding header records. Several other collars had recorded hole lengths that were not consistent with downhole measurements in the assay, survey and litho tables. However, RPA notes that these errors were very easy to correct. Eight assay records were duplicated in the database and rejected on import. Three duplicate downhole survey records were found. A total of 1,344 duplicate litho records were encountered, as well.
RPA did a check of the assay database to look for invalid from-to intervals and obviously incorrect assay values. Several sulphur values were found that were greater than 100%,
| | | | |
| |
Barrick Gold Corporation – Porgera Joint Venture, Project #1669 Technical Report NI 43-101 – March 16, 2012 | | | Rev. 0 Page 12-1 | |
| | |
| | www.rpacan.com |
|
which is obviously incorrect. This was reported back to the geology staff, who in turn confirmed the errors. It is not known exactly how the erroneous assays came about, but it is suspected that they stem from keypunch errors at the laboratory. An additional validation routine will be added to check for errors of this type.
Routine field duplicates are not taken as part of the assay QA/QC protocol. Once per quarter, a suite of 250 pulps are sent to an outside commercial laboratory for checks. The results from these duplicates indicate that there is very poor repeatability for gold assays. RPA reviewed the paired duplicates results and concurs that the repeatability is quite poor, especially for pulps. In order to try to improve reproducibility the assay protocols are being amended to include metallics sieve analysis. In RPA’s opinion, this is reasonable and appropriate course of action.
In RPA’s opinion, the data management practices at Porgera JV meet or exceed standard industry practices. The database is resident on a central server that is managed by the site IT staff. The system is reasonably secure and is backed up daily. Assay QA/QC protocols are adequate for now, and will be improved by the addition of metallics assays. It is likely that there are some errors in the database but the number of assays is so large that relatively few errors will not have much of an impact on resource estimates.
| | | | |
| |
Barrick Gold Corporation – Porgera Joint Venture, Project #1669 Technical Report NI 43-101 – March 16, 2012 | | | Rev. 0 Page 12-2 | |
| | |
| | www.rpacan.com |
|
13 MINERAL PROCESSING AND METALLURGICAL TESTING
Metallurgical testing programs are completed as necessary to support new projects and project expansions. Typically, these test programs are completed by outside laboratories. For example, metallurgical testing was completed to support the Stage 6 Feasibility Study in 2007, which should be noted that this feasibility study has not been approved by Barrick, and another metallurgical study was conducted in 2010 to support the AHD feasibility study. Routine metallurgical tests are also conducted in the on-site metallurgical laboratory to check recovery and help define the source of recovery problems when they are experienced in the operating plants. Since the mine has been operating over 30 years, the metallurgical recovery models are based primarily on historical operating data. The ore must be differentiated between whether the source is the hanging wall or the footwall. The southwest hanging wall performs poorly in the processing plant. It has lower gravity recoverable gold, one percent to two percent lower flotation gold recovery, poorer carbon-in-leach (CIL) recovery, and higher oxygen demand.
RECOVERY
Due to the number of unit operations in the processing facilities, recovery must be estimated for all of the processes including:
| | • | | Leaching and carbon adsorption |
| | • | | Carbon elution and refinery |
Over the years, Porgera JV has developed a system of elaborate formulae to predict the gold recovery. Recovery is dependent upon the gold and sulphur head grades of the ore and the amount of material being processed. The ore is classified as one of 17 different lithologies including 12 from the footwall and five from the hanging wall. Data to support the recovery models is updated annually using operating data. The various lithologies are listed in Table 13-1.
| | | | |
| |
Barrick Gold Corporation – Porgera Joint Venture, Project #1669 Technical Report NI 43-101 – March 16, 2012 | | | Rev. 0 Page 13-1 | |
| | |
| | www.rpacan.com |
|
TABLE 13-1 LITHOLOGY TYPES
Barrick Gold Corporation—Porgera JV
| | | | | | |
Location | | Designation | | Lithology |
| Footwall | | 1 | | Black Seds |
| | 2 | | Calc Seds |
| | 3 | | Altered Seds |
| | 4 | | Diorite |
| | 5 | | Augite Horneblende Diorite |
| | 6 | | High Sulphur Breccia |
| | 7 | | Feldspar Porphyry |
| | 8 | | Andesite |
| | 9 | | Muds W |
| | 10 | | Muds Y |
| | 11 | | ROM Stockpile |
| | 12 | | Longterm Stockpile and Blue Ore |
| Hanging Wall | | 13 | | Black Seds |
| | 14 | | Calc Seds |
| | 15 | | Altered Seds |
| | 16 | | Diorite |
| | 17 | | Feldspar Porphyry |
The gravity gold recovery is estimated to be 22%. Of that 22%, it is estimated that 92% of the gold is recovered in the Acacia high intensity cyanide leaching reactor.
The gold recovery in the flotation concentrator is estimated using equations of the general format shown below.
Flotation Au Recovery
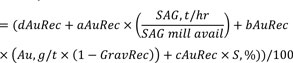
Where:
| | | | | | |
| | dAuRec = | | Gold recovery constant d | | |
| | aAuRec= | | Gold recovery constant a | | |
| | SAG, t/hr = | | Estimated average plant feed in t/hr |
| | SAG mill avail = | | Estimated SAG mill availability, % |
| | bAuRec = | | Gold recovery constant b | | |
| | Au, g/t = | | Gold head grade, g/t Au | | |
| | Grav Rec = | | Gravity recovery, 22% | | |
| | cAuRec = | | Gold recovery constant c | | |
| | S, % | | Sulphur head grade, %S | | |
The sulphur recovery is estimated using a similar equation but there is no relationship to the gold head grade.
| | | | |
| |
Barrick Gold Corporation – Porgera Joint Venture, Project #1669 Technical Report NI 43-101 – March 16, 2012 | | | Rev. 0 Page 13-2 | |
| | |
| | www.rpacan.com |
|

Where:
| | | | | | |
| | CSRec = | | Sulphur recovery constant c | | |
| | aSRec= | | Sulphur recovery constant a | | |
| | SAG, t/hr = | | Estimated average plant feed in t/hr |
| | SAG mill avail = | | Estimated SAG mill availability, % |
| | bSRec = | | Sulphur recovery constant b | | |
| | S, % | | Sulphur head grade, %S | | |
Table 13-2 shows the constants for the various Porgera JV lithology types using the designations shown in Table 13-1 (from 1 to 17). Constants a, b, and c used to estimate gold recovery and constants a and b used to estimate sulphur recovery are the same for all ore types, as shown in the table.
TABLE 13-2 GOLD AND SULPHUR RECOVERY CONSTANTS BY
LITHOLOGY
Barrick Gold Corporation—Porgera JV
| | | | | | | | | | | | | | | | | | | | | | | | |
| No. | | Gold Recovery Constants | | | Sulphur Recovery Constants |
| | | a | | | b | | | c | | | d | | a | | | b | | | c |
| 1 | | | | | | | | | | | | | | 88.05 | | | | | | | | | | 83.1 |
| 2 | | | | | | | | | | | | | | 96.55 | | | | | | | | | | 90.1 |
| 3 | | | | | | | | | | | | | | 100.55 | | | | | | | | | | 94.1 |
| 4 | | | | | | | | | | | | | | 103.55 | | | | | | | | | | 96.6 |
| 5 | | | | | | | | | | | | | | 103.55 | | | | | | | | | | 96.6 |
| 6 | | | | | | | | | | | | | | 101.55 | | | | | | | | | | 96.1 |
| 7 | | | | | | | | | | | | | | 101.55 | | | | | | | | | | 95.6 |
| 8 | | | | | | | | | | | | | | 101.55 | | | | | | | | | | 95.1 |
| 9 | | | -0.003 | | | | 2.102 | | | | -6.281 | | | 100.05 | | | 0.012 | | | | -4.754 | | | 90.1 |
| 10 | | | | | | | | | | | | | | 100.05 | | | | | | | | | | 90.1 |
| 11 | | | | | | | | | | | | | | 102.05 | | | | | | | | | | 94.1 |
| 12 | | | | | | | | | | | | | | 102.05 | | | | | | | | | | 92.1 |
| 13 | | | | | | | | | | | | | | 88.05 | | | | | | | | | | 83.1 |
| 14 | | | | | | | | | | | | | | 97.05 | | | | | | | | | | 90.1 |
| 15 | | | | | | | | | | | | | | 96.55 | | | | | | | | | | 94.1 |
| 16 | | | | | | | | | | | | | | 103.55 | | | | | | | | | | 96.6 |
| 17 | | | | | | | | | | | | | | 101.55 | | | | | | | | | | 95.6 |
The sulphur grade of the flotation concentrate is estimated to be 14% since this is the optimum for the operation of the autoclaves. The mass of concentrate produced is estimated using the estimated sulphur recovery determined by using the equations shown above and the final sulphur grade using the following equation.
| | | | |
| |
Barrick Gold Corporation – Porgera Joint Venture, Project #1669 Technical Report NI 43-101 – March 16, 2012 | | | Rev. 0 Page 13-3 | |
| | |
| | www.rpacan.com |
|

The gold grade of the concentrate is calculated by estimating the quantity of gold recovered from the gravity plus flotation circuit and dividing by the tonnage of flotation concentrate produced. For the purpose of estimating the overall recovery, it is assumed that the mass of material being processed in the pressure oxidation circuit and the leach/carbon-in-leach circuit is equal to the mass of concentrate produced. Finally, the oxidation and cyanide leaching recovery is estimated by calculating the “CIP Tails” and subtracting the amount of gold lost to tailings from the amount of gold feeding the circuits, i.e. the amount of gold recovered in the gravity and flotation circuits.
The CIP Tails are dependent upon two sets of constants: one set of constant for the oxidation/autoclave circuit (ADSS) and another set of constants for the cyanide leach (CIP) circuit. The general form of the equation is:

Where:
| | |
aCIP = | | CIP constant a |
bCIP= | | CIP constant b |
cCIP = | | CIP constant c |
aADSS = | | Oxidation recovery constant a |
bADSS = | | Oxidation recovery constant b |
cADSS = | | Oxidation recovery constant c |
S (t/hr) = | | Tonnes of sulphur fed to the oxidation circuit per operating hour based on the sulphur recovered in the flotation circuit |
The constants are the same for all ore types as shown in Table 13-3.
| | | | |
| |
Barrick Gold Corporation – Porgera Joint Venture, Project #1669 Technical Report NI 43-101 – March 16, 2012 | | | Rev. 0 Page 13-4 | |
| | |
| | www.rpacan.com |
|
TABLE 13-3 CIP AND ADSS CONSTANTS BY LITHOLOGY
Barrick Gold Corporation—Porgera JV
| | | | |
Constant | | Value | |
aCIP | | | 0.990 | |
bCIP | | | -0.012 | |
cCIP | | | 1.619 | |
aADSS | | | 0.295 | |
bADSS | | | -2.123 | |
cADSS | | | 3.943 | |
In order to assess the accuracy of the calculations, RPA compared the actual versus budgeted production data for 2009, 2010, and by month through November 2011. The results are shown graphically in Figure 13-1.
FIGURE 13-1 COMPARISON OF ACTUAL VERSUS BUDGETED GOLD RECOVERY
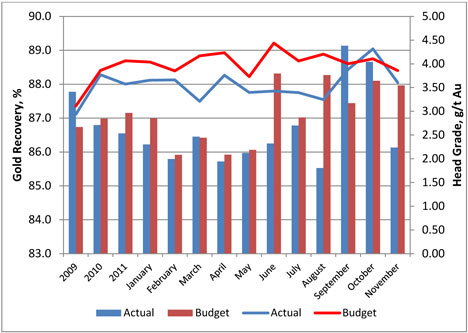
Since the recovery is dependent upon the gold feed grade to the plant, the actual and budgeted head grades are shown on the second axis of the figure. Overall recovery is only 0.1% lower than the budgeted overall recovery. The difference appears to be primarily due to the differences in head grade. A comparison of the numerical recoveries is provided in Table 13-4.
| | | | |
| |
Barrick Gold Corporation – Porgera Joint Venture, Project #1669 Technical Report NI 43-101 – March 16, 2012 | | | Rev. 0 Page 13-5 | |
| | |
| | www.rpacan.com |
|
TABLE 13-4 ACTUAL VERSUS BUDGETED GOLD RECOVERY
Barrick Gold Corporation—Porgera JV
| | | | | | | | | | | | | | | | |
Year | | Concentrator Recovery | | | Overall Recovery | |
| | Actual | | | Budget | | | Actual | | | Budget | |
2009 | | | 92.1 | | | | 90.2 | | | | 87.8 | | | | 86.7 | |
2010 | | | 92.2 | | | | 92.6 | | | | 86.8 | | | | 87.0 | |
2011 (Jan-Nov) | | | 91.8 | | | | 91.6 | | | | 86.5 | | | | 87.2 | |
Weighted Average | | | 92.0 | | | | 91.5 | | | | 86.9 | | | | 87.0 | |
Difference | | | 0.5 | % | | | | | | | -0.1 | % | | | | |
RPA also evaluated the ounces produced for the same time period. The results are summarized in Table 13-5 and Figure 13-2.
TABLE 13-5 ACTUAL VERSUS BUDGETED GOLD RECOVERY
Barrick Gold Corporation—Porgera JV
| | | | | | | | | | | | | | | | |
Year | | Au Ounces Recovered | | | Au Ounces Fed | |
| | Actual | | | Budget | | | Actual | | | Budget | |
2009 | | | 580,292 | | | | 619,434 | | | | 512,116 | | | | 557,064 | |
2010 | | | 546,953 | | | | 612,631 | | | | 630,181 | | | | 704,329 | |
2011 (Jan-Nov) | | | 496,858 | | | | 613,266 | | | | 573,721 | | | | 703,539 | |
Total | | | 2,120,962 | | | | 2,458,597 | | | | 2,289,739 | | | | 2,668,472 | |
Difference | | | -15.9 | % | | | | | | | -16.5 | % | | | | |
FIGURE 13-2 COMPARISON OF ACTUAL VERSUS BUDGETED OUNCES RECOVERED
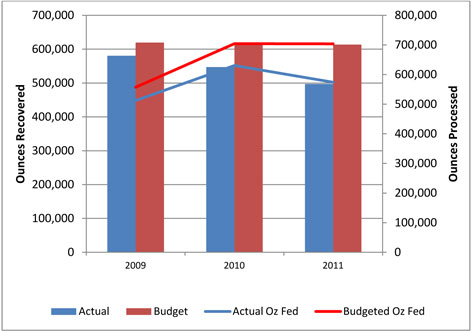
| | | | |
| |
Barrick Gold Corporation – Porgera Joint Venture, Project #1669 Technical Report NI 43-101 – March 16, 2012 | | | Rev. 0 Page 13-6 | |
| | |
| | www.rpacan.com |
|
Upon further evaluation, it was determined that the tonnage fed to the plant was 6.8% lower than budgeted and the average gold grade of the ore fed to the plant was 9.1% lower than the budgeted grade. Both of these differences contributed to the inability to meet the budgeted production targets.
CONCLUSIONS AND RECOMMENDATIONS
Although the equations used to estimate gold recovery appear to be accurate, they are very complex and RPA observed that communication about how the estimates are developed was deficient between the process department and the technical services department so the equations are not used in the cut-off-grade calculations or the Resource and Reserve models. Particularly since the life-of-mine (LOM) plan shows the number of material types to be greatly reduced and the majority of the material will come from the long term stockpiles, RPA recommends that an effort be made to simplify the equations and use them in the calculations and Resource and Reserve estimates that are completed by the Technical Services department. The 2011 Mill Budget estimates the quantities and material types that will be processed from 2011 through the end of the mine life. The data is summarized in Table 13-6.
TABLE 13-6 2011 MILL BUDGET (2011 THROUGH 2039)
Barrick Gold Corporation—Porgera JV
| | | | | | | | | | |
Location | | Lithology | | Tonnage | | | Percentage | |
| | Black Seds | | | 3,468,000 | | | | 4.7 | % |
| | Calc Seds | | | 7,800 | | | | 0.0 | % |
| | Altered Seds | | | 3,625,000 | | | | 4.9 | % |
| | Diorite | | | 3,019,000 | | | | 4.1 | % |
| | Augite Horneblende Diorite | | | 12,818,000 | | | | 17.3 | % |
Footwall | | High Sulphur Breccia | | | — | | | | — | |
| | Feldspar Porphyry | | | — | | | | — | |
| | Andesite | | | — | | | | — | |
| | Muds W | | | — | | | | — | |
| | Muds Y | | | — | | | | — | |
| | ROM Stockpile | | | — | | | | — | |
| | Longterm Stockpile and Blue Ore | | | 51,213,000 | | | | 69.1 | %% |
| | | | | | | | | | |
Hanging Wall | | Black Seds | | | — | | | | — | |
| | Calc Seds | | | — | | | | — | |
| | Altered Seds | | | — | | | | — | |
| | Diorite | | | — | | | | — | |
| | Feldspar Porphyry | | | — | | | | — | |
Total | | | | | 74,153,000 | | | | 100.0 | % |
| | | | |
| |
Barrick Gold Corporation – Porgera Joint Venture, Project #1669 Technical Report NI 43-101 – March 16, 2012 | | | Rev. 0 Page 13-7 | |
| | |
| | www.rpacan.com |
|
14 MINERAL RESOURCE ESTIMATE
SUMMARY
The Mineral Resources estimated for Porgera JV are shown in Table 14-1. These represent 100% of the in situ Mineral Resources estimated after exclusion of material included in the Mineral Reserves.
TABLE 14-1 MINERAL RESOURCE ESTIMATE (100%) – DECEMBER 31, 2011
Barrick Gold Corporation – Porgera JV
| | | | | | | | | | | | | | |
Category | | Description | | Tonnes
(000) | | | Grade
(g/t Au) | | | Contained
Gold
(000 oz) | |
Measured | | | | | | | | | | | | | | |
| | Open Pit | | | 8,190 | | | | 2.31 | | | | 609 | |
| | Underground | | | 463 | | | | 10.33 | | | | 154 | |
Total Measured | | | 8,650 | | | | 2.74 | | | | 763 | |
| | | | |
Indicated | | | | | | | | | | | | | | |
| | Open Pit | | | 15,800 | | | | 1.56 | | | | 793 | |
| | Underground | | | 1,630 | | | | 9.15 | | | | 480 | |
Total Indicated | | | | | 17,400 | | | | 2.27 | | | | 1,270 | |
| | | | | | | | | | | | | | |
Total Measured & Indicated | | | 26,100 | | | | 2.41 | | | | 2,030 | |
| | | | | | | | | | | | | | |
Inferred | | | | | | | | | | | | | | |
| | Open Pit | | | 13,500 | | | | 1.77 | | | | 771 | |
| | Underground | | | 8,100 | | | | 8.90 | | | | 2,320 | |
Total Inferred | | | 21,600 | | | | 4.45 | | | | 3,090 | |
Notes:
| | 1. | CIM definitions were followed for Mineral Resources. |
| | 2. | Mineral Resources are estimated at a cut-off grade of 1.0 g/t Au for the open pit and 3.0 g/t Au for the underground mine. |
| | 3. | Mineral Resources are estimated using an average gold price of US$1,400 per ounce, and a US$:C$ exchange rate of 1:1. |
| | 4. | A minimum mining width of 5 m was used. |
| | 5. | Bulk density is determined based on lithology. |
| | 6. | Measured and Indicated Mineral Resources are exclusive of Mineral Reserves. |
The estimate was carried out using block models constrained by wireframe models of the geological domains and mined out volumes. Grade interpolations were done using a variety of methods which included Multiple Indicator Kriging (MIK), Ordinary Kriging
| | | | |
| |
Barrick Gold Corporation – Porgera Joint Venture, Project #1669 Technical Report NI 43-101 – March 16, 2012 | | | Rev. 0 Page 14-1 | |
| | |
| | www.rpacan.com |
|
(OK), and Inverse Distance weighting (ID). Data used in the interpolations comprised diamond drill and face samples. Grades were estimated for gold and sulphur, and the block models were configured to store values for domain codes, bulk density, and classification.
In keeping with Barrick policy, Porgera JV typically updates the block models for the mid-year Mineral Resource estimate. The protocol is for the models to be current up to the beginning of June, and the monthly production is depleted from the model to calculate the total resources. Depletion for the second half of the year is applied to the model for the year-end estimates. For 2011, due to staff turnover, there was no mid-year update of the models. The Mineral Resources and Mineral Reserves estimates were reported by depletion from the June 2010 models. The block models were updated for year-end, and form the basis of the year-end estimates of Mineral Resources and Mineral Reserves.
This audit and report covers the year-end reported Mineral Resources and Mineral Reserves.
SUMMARY OF CHANGES TO THE RESOURCE ESTIMATES
Table 14-2 summarizes the changes to the Mineral Resource estimate (exclusive of Mineral Reserves) from end-of-year (EOY) 2010 to EOY2011.
| | | | |
| |
Barrick Gold Corporation – Porgera Joint Venture, Project #1669 Technical Report NI 43-101 – March 16, 2012 | | | Rev. 0 Page 14-2 | |
| | |
| | www.rpacan.com |
|
TABLE 14-2 CHANGE IN MINERAL RESOURCES
Barrick Gold Corporation – Porgera JV
| | | | | | | | | | | | | | | | | | | | | | | | | | | | | | | | | | | | |
| | | Open Pit | | | Underground | | | Total | |
| Measured | | Tonnes
(Mt) | | | Au
(g/t) | | | Au
(Koz) | | | Tonnes
(Mt) | | | Au (g/t) | | | Au
(Koz) | | | Tonnes
(Mt) | | | Au (g/t) | | | Au
(Koz) | |
2011 | | | 8.19 | | | | 2.31 | | | | 609 | | | | 0.463 | | | | 10.33 | | | | 154 | | | | 8.66 | | | | 2.74 | | | | 763 | |
2010 | | | 5.84 | | | | 1.97 | | | | 369 | | | | — | | | | — | | | | — | | | | 5.84 | | | | 1.97 | | | | 369 | |
Difference | | | 2.35 | | | | 0.34 | | | | 240 | | | | 0.463 | | | | 10.33 | | | | 154 | | | | 2.82 | | | | 0.77 | | | | 394 | |
% Difference | | | 40.2 | % | | | 17.3 | % | | | 65.0 | % | | | n/a | | | | n/a | | | | n/a | | | | 48.3 | % | | | 39.4 | % | | | 106.8 | % |
| | | | | | | | | |
| Indicated | | Tonnes
(Mt) | | | Au
(g/t) | | | Au
(Koz) | | | Tonnes
(Mt) | | | Au (g/t) | | | Au
(Koz) | | | Tonnes
(Mt) | | | Au (g/t) | | | Au
(Koz) | |
2011 | | | 15.8 | | | | 1.56 | | | | 793 | | | | 1.63 | | | | 9.15 | | | | 480 | | | | 17.4 | | | | 2.27 | | | | 1,270 | |
2010 | | | 10.3 | | | | 1.40 | | | | 465 | | | | 2.51 | | | | 8.57 | | | | 690 | | | | 12.8 | | | | 2.80 | | | | 1,160 | |
Difference | | | 5.5 | | | | 0.16 | | | | 328 | | | | -0.9 | | | | 0.58 | | | | -210 | | | | 4.6 | | | | -0.53 | | | | 110 | |
% Difference | | | 53.4 | % | | | 11.4 | % | | | 70.5 | % | | | -35.1 | % | | | 6.8 | % | | | -30.4 | % | | | 35.9 | % | | | -18.9 | % | | | 9.5 | % |
| | | | | | | | | |
| Inferred | | Tonnes
(Mt) | | | Au
(g/t) | | | Au
(Koz) | | | Tonnes
(Mt) | | | Au (g/t) | | | Au
(Koz) | | | Tonnes
(Mt) | | | Au (g/t) | | | Au
(Koz) | |
2011 | | | 13.5 | | | | 1.77 | | | | 771 | | | | 8.10 | | | | 8.90 | | | | 2,320 | | | | 21.6 | | | | 4.45 | | | | 3,090 | |
2010 | | | 10.5 | | | | 1.88 | | | | 634 | | | | 2.72 | | | | 7.71 | | | | 674 | | | | 10.5 | | | | 1.88 | | | | 643 | |
Difference | | | 3.00 | | | | -0.11 | | | | 137 | | | | 5.38 | | | | 1.19 | | | | 1,646 | | | | 11.1 | | | | 2.57 | | | | 2,447 | |
% Difference | | | 28.6 | % | | | -5.9 | % | | | 21.6 | % | | | 197.8 | % | | | 15.4 | % | | | 244.2 | % | | | 105.7 | % | | | 136.8 | % | | | 380.6 | % |
Notes:
| | 1. | Totals may not add due to rounding. |
The global Mineral Resources increased substantially in terms both of tonnage and grade from EOY2010 to EOY2011. There were many influences on the resource estimates that caused both increases and decreases. The changes to the Mineral Resources were due to the following:
| | • | | increase due to addition of new resources in the O, North and East Zone (underground mine). |
| | • | | increase due to new pit shell with current gold price. |
| | • | | decrease via depletion. |
| | • | | increase due to changes to the classification scheme. |
| | • | | decrease due to update of cut-off grade. |
| | | | |
| |
Barrick Gold Corporation – Porgera Joint Venture, Project #1669 Technical Report NI 43- 101 – March 16, 2012 | | | Rev. 0 Page 14-3 | |
| | |
| | www.rpacan.com |
|
The single largest change was due to resources added in the underground mine in the North and East Zones. These changes resulted from a change in the estimation parameters. This change involved the application of the statistically controlled method of interpolation (SC Method) which is described in more detail later in this section of the report. The resources that were added by making this change were in the Inferred category only and this is reflected in the significant change in Inferred resources in the underground mine (Table 14-2).
Additional Mineral Resources were also captured for the open pit by re-running the resource pit shell using up-to-date metal prices. This is reflected in Table 14-2 as an across-the-board increase in all categories.
Changes made to the classification methodology resulted in decreases to some zones and increases in others. These changes were only offsetting and resulted in a modest increase overall to the global resources. Measured Mineral Resources were added to the underground mine estimate, which is a significant increase from 2010, when there were no Measured resources. The Indicated category in the underground mine decreased, primarily due to changes in the classification methodology which resulted in upgrades to Measured in some cases and downgrades to Inferred in others.
INTRODUCTION
Block models, along with their associated wireframes, are constructed for both the open pit and underground mines. The open pit models are prepared by Mauro Bassotti and the underground models are the responsibility of Bruce Robertson. Both are Senior Resource Geologists for Porgera JV. From time to time Barrick has retained consultants to update parts of the models. The models are constructed using Datamine software, which is a commercially available package commonly used in the industry. Statistical and geostatistical analyses, declustering, and sundry support functions for derivation of the estimation parameters are carried out using a variety of commercial and in-house proprietary software.
Separate sets of models are used for the open pit and underground mines. At the end of the estimation process most of these models are combined into one single block model, which encompasses all of the Mineral Resources, both open pit and underground. The
| | | | |
| |
Barrick Gold Corporation – Porgera Joint Venture, Project #1669 Technical Report NI 43-101 – March 16, 2012 | | | Rev. 0 Page 14-4 | |
| | |
| | www.rpacan.com |
|
models all tend to occupy the same geographical area but have different characteristics depending on the variables that they store. For the gold and sulphur estimates in the principal mining areas, for example, the block models are double precision, in order to be configured to allow sub-blocking. The sub-blocking allows the model to better honour the boundaries of the wireframe models. For the background gold and sulphur values, located outside the principal resource domains, the block models are single precision.
Wireframes are also created for the mined volumes by the mine survey personnel. These models comprise stope and development void spaces in the underground mine as well as the volume depleted from the open pit.
A list of the general classes of the various block models and their purpose is provided in Table 14-3 below.
TABLE 14-3 BLOCK MODEL TYPES
Barrick Gold Corporation – Porgera JV
| | | | | | |
Area | | Model | | Type | | Purpose |
Open Pit | | Kriging variance | | OK, single precision | | Estimate kriging variance
for classification purposes. |
Open Pit | | Litho model | | NN | | Lithology codes stored for
application of bulk density. |
Open Pit | | Au background | | ID2, single prec. | | Estimate background gold
values. |
Open Pit | | S background | | ID2, single prec. | | Estimate background
sulphur values. |
Open Pit | | Voids model | | NN | | Blocks tagged for mined out
volumes. Tagged as
cemented backfill,
uncemented backfill, ore
development. |
Open Pit | | Dynamic Anisotropy Model | | NN, single prec. | | Used to apply individual
search anisotropy to each
block (sub-blocking used). |
Open Pit | | Gold grade | | MIK, double prec. | | Gold estimates (sub-
blocking used). |
U/G | | Gold grade | | OK, double precision | | Gold estimates (sub-
blocking used). |
Open Pit & U/G | | Sulphur grade | | OK, single precision | | Sulphur estimates. |
| | | | |
| |
Barrick Gold Corporation – Porgera Joint Venture, Project #1669 Technical Report NI 43-101 – March 16, 2012 | | | Rev. 0 Page 14-5 | |
| | |
| | www.rpacan.com |
|
OPEN PIT MODELS
The open pit block model encompasses the entire Porgera JV deposit, including material that will in all probability be mined from underground. The open pit resource is limited to material that falls within a Whittle pit shell configured expressly for delineation of Mineral Resources. The model comprises blocks measuring 10m by 5m by 10m, with grades for Au and S interpolated by MIK, OK and ID weighting. Kriging variance, which is used in the resource classification, is estimated into the model using OK. The interpolations are constrained by wireframe models of the principal estimation domains (24 for Au and 18 for S), as well as stoped volumes.
DATABASE
The database for the estimate consists of diamond drill and channel sampling data. In the most recent database supplied to RPA, there were records for 10,094 drill holes and channels. Of these, 331 were rejected on import to RPA’s database software (GEMS) due to missing or invalid information. The database contained 889,980 assay records (samples), of which seven were rejected on import due to invalid information.
The assay table contains data for Au and S. RPA notes that not all records contained a complete set of analyses. Of the 889,980 valid records in the assay table, 855,646 contained Au assays. The rest contained either -2000, -999, -0.01 or zero. The S assays consist of either total sulphur, which were done prior to 1999, and sulphide sulphur, which has been done since 1999. There were 317,710 total sulphur assays, and 512,640 sulphide sulphur assays.
Sample lengths ranged from a low of zero up to a high of 268 m. Seven samples were recorded as having equal from and to measurements (i.e. zero length), which are obvious errors. Apart from the zero-length intervals, were four samples with lengths of less than 10 cm. Twelve samples had lengths of greater than 10 m, and all of these sample records contained Au values. Five of these samples were recorded as being longer than 100 m. In RPA’s opinion, while there are clearly some spurious sample lengths, the relative number of obviously incorrect values is quite low considering the size of the database. This suggests that the data-entry QA/QC procedures are being observed reasonably well. Finding errors of this type is a very simple task, and RPA recommends that periodic inspections of the database be carried out to capture and correct or eliminate these errors.
| | | | |
| |
Barrick Gold Corporation – Porgera Joint Venture, Project #1669 Technical Report NI 43-101 – March 16, 2012 | | | Rev. 0 Page 14-6 | |
| | |
| | www.rpacan.com |
|
BULK DENSITY
Bulk density is applied according to rock type. The average bulk density for each rock type is shown in Table 14-4.
TABLE 14-4 BULK DENSITIES
Barrick Gold Corporation – Porgera JV
| | | | |
Lithology | | LITHJB
Code | | Bulk
Density |
Black Sediments | | 2 | | 2.64 |
Calcareous Sediments | | 3 | | 2.64 |
Altered Sediments | | 4 | | 2.75 |
Diorite | | 5 | | 2.74 |
Augite Hornblende Diorite | | 6 | | 2.79 |
Feldspar Porphyry | | 7 | | 2.66 |
Brown Mudstone | | 10 | | 2.64 |
Yak Brown Mudstone | | 11 | | 2.64 |
Footwall Diorite | | 12 | | 2.74 |
Roamane Diorite | | 13 | | 2.74 |
Bulk density measurements are carried out on anad hoc basis when new areas are developed in the mine. A campaign of density measurements is conducted within the new rock type until a reliable average density can be tabulated. The density determinations are performed by weighing a core specimen in air and again submerged in water. The density is the ratio of the dry weight to the difference between the dry and wet weights.
Density is applied to the blocks according to rock type codes. In some instances, where stoping of parts of blocks has occurred, the density is adjusted to account for the missing volume. The Datamine volumetrics routine calculates the tonnage based on the entire block volume, and the missing material is accounted for by pro-rating the density downwards.
| | | | |
| |
Barrick Gold Corporation – Porgera Joint Venture, Project #1669 Technical Report NI 43-101 – March 16, 2012 | | | Rev. 0 Page 14-7 | |
| | |
| | www.rpacan.com |
|
WIREFRAME MODELS
In all, 24 Au and 34 S domains were used in the estimation. The domains encompass regions within the deposit of like geological and/or mineralogical characteristics. Wireframe models are constructed by the mine staff for all of these domains. Often, no updates are required. New development or drilling in a particular domain will trigger an update to the wireframe model, which is then carried out by Porgera JV staff.
The Au and S domains are listed in Tables 14-5 and 14-6, respectively. Note that the wireframes are assigned priority numbers in case of overlaps. Where two or more domains overlap, the common volume is assigned to the domain with the higher priority.
TABLE 14-5 GOLD DOMAINS
Barrick Gold Corporation – Porgera JV
| | | | |
Name | | Code | | AuCode |
domau107 | | 1 | | 107 |
domau_tt116 | | 2 | | 116 |
domau158 | | 3 | | 158 |
domau160 | | 4 | | 160 |
domau161 | | 5 | | 161 |
domau164 | | 6 | | 164 |
domau165 | | 7 | | 165 |
domau166 | | 8 | | 166 |
domau167 | | 9 | | 167 |
domau169 | | 10 | | 169 |
domau123 | | 11 | | 123 |
domau108 | | 12 | | 108 |
domau110 | | 13 | | 110 |
domau171_1210 | | 14 | | 171 |
domau170 | | 15 | | 170 |
domau172 | | 16 | | 172 |
domau109 | | 17 | | 109 |
domau_ahd_2_op | | 21 | | 181 |
domau_ahd_3_op | | 22 | | 182 |
domau_ahd_4_op | | 23 | | 183 |
domau_ahd_1_op | | 24 | | 180 |
domau_tt129 | | 18 | | 129 |
domau_tt105 | | 19 | | 105 |
domau_tt102 | | 20 | | 102 |
| | | | |
| |
Barrick Gold Corporation – Porgera Joint Venture, Project #1669 Technical Report NI 43-101 – March 16, 2012 | | | Rev. 0 Page 14-8 | |
| | |
| | www.rpacan.com |
|
TABLE 14-6 SULPHUR DOMAINS
Barrick Gold Corporation – Porgera JV
| | | | |
Name | | Code | | Description |
| s7 | | 7 | | Roamane Fault |
| s12 | | 12 | | FW EW Rubble Zone |
| s8 | | 8 | | FW Diorite |
| s3 | | 3 | | HW Breccia Base |
| s9 | | 9 | | FW Splay |
| s15 | | 15 | | HW Breccia Top |
| s16 | | 16 | | HW Diorite |
| s29 | | 29 | | HW Roamane Zone West |
| s30 | | 30 | | HW NE EXT Zone #1 Top |
| s13 | | 13 | | HW NE EXT Zone #1 |
| s31 | | 31 | | NE HW Zone #2 Top |
| s4 | | 4 | | NE HW Zone #2 Base |
| s32 | | 32 | | NE HW Zone #3 Top |
| s5 | | 5 | | NE HW Zone #3 Base |
| s33 | | 33 | | NE HW Zone #4 Top |
| s6 | | 6 | | NE HW Zone #4 Base |
| s24 | | 24 | | HW Roamane Zone East |
| s28 | | 28 | | FW Roamane Zone Top |
| s26 | | 26 | | FW Roamane Zone #1 Base |
| s27 | | 27 | | FW Roamane Zone #2 Base |
| s11 | | 11 | | FW Augite Hornblende Diorite |
| s14 | | 14 | | Adit Diorite |
| s17 | | 17 | | HW Augite Hornblende Thrust |
| s34 | | 34 | | Wagima Intrusives |
| s19 | | 19 | | FW NW Zone #1 |
| s20 | | 20 | | FW NW Zone #2 |
| s21 | | 21 | | FW NW Zone #3 |
| s22 | | 22 | | FW NW Zone #4 |
| s10 | | 10 | | FW Waste |
| s25 | | 25 | | NE HW Zone #5 Top |
| s23 | | 23 | | NE HW Zone #5 Base |
| s2 | | 2 | | SE HW Waste Dom |
RPA inspected the wireframe models and found no concerns. In RPA’s opinion, they appear to represent reasonable interpretations of the mineralized zones.
COMPOSITES AND CAPPING
The samples are capped then composited to two-metre widths, using the wireframe models as boundary constraints. Compositing begins at the point where the drill hole
| | | | |
| |
Barrick Gold Corporation – Porgera Joint Venture, Project #1669 Technical Report NI 43-101 – March 16, 2012 | | | Rev. 0 Page 14-9 | |
| | |
| | www.rpacan.com |
|
enters a wireframe and progresses at two-metre increments to the exit point. The distance through a wireframed domain is seldom an exact multiple of two metres so the last composite in any domain is usually less than the proscribed length. Remnant composites less than one metre in length are discarded.
Composites are tagged with a code for the geology, as well as the gold and sulphur domains, and whether or not they reside within a stoped volume. The pit encompasses the portion of the deposit mined from underground in earlier years of production. These old stopes are accounted for in the block modeling to prevent overestimation of the tonnage. The treatment of composites from within these mined out areas is discussed in more detail below.
High grade samples are capped based on statistical analyses carried on each domain. Porgera JV staff generate means, cumulative frequency diagrams and coefficients of variation for each of the domained datasets at a range of top cuts. The caps are typically chosen at the value at which 10% of the metal content is removed, or in the case of the MIK domains, the median of the highest grade bin. Tables 14-7 and 14-8 list the top cuts applied to both Au and S, respectively.
Practice at Porgera JV used to be to cap the composites instead of the samples. For the EOY2011 models, the samples were capped prior to compositing in order to be consistent with Barrick standard practice. RPA concurs with this approach.
| | | | |
| |
Barrick Gold Corporation – Porgera Joint Venture, Project #1669 Technical Report NI 43-101 – March 16, 2012 | | | Rev. 0 Page 14-10 | |
| | |
| | www.rpacan.com |
|
TABLE 14-7 GOLD TOP CUTS
Barrick Gold Corporation - Porgera JV
| | | | | | |
AUCODE | | Estimation
Type | | Top Cut
(g/t Au) | | Comment |
| 102 | | id | | 30 | | |
| 105 | | ik | | 31 | | Top class median |
| 107 | | ik | | 249 | | Top class median |
| 108 | | ik | | 312 | | Top class median |
| 109 | | ik | | 100 | | Top class median |
| 110 | | ik | | 65 | | Top class median |
| 116 | | ik | | 43 | | Top class median |
| 123 | | ik | | 365 | | Top class median |
| 129 | | id | | 100 | | |
| 158 | | ok | | 30 | | |
| 160 | | ok | | 40 | | |
| 161 | | ik | | 64 | | Top class median |
| 164 | | ok | | 10 | | |
| 165 | | ok | | 700 | | |
| 166 | | ok | | 100 | | |
| 167 | | ok | | 20 | | |
| 169 | | ok | | 200 | | |
| 170 | | ik | | 176 | | Top class median |
| 171 | | ik | | 180 | | Top class median |
| 172 | | ok | | 90 | | |
| 180 | | ok | | 30 | | |
| 181 | | ok | | 50 | | |
| 182 | | ok | | 40 | | |
| 183 | | ok | | 30 | | |
| | | | |
| |
Barrick Gold Corporation – Porgera Joint Venture, Project #1669 Technical Report NI 43-101 – March 16, 2012 | | | Rev. 0 Page 14-11 | |
| | |
| | www.rpacan.com |
|
TABLE 14-8 SULPHUR TOP CUTS
Barrick Gold Corporation - Porgera JV
| | | | |
DOMAIN | | SCODE | | Top Cut (% S) |
s2 | | 2 | | 2 |
s3 | | 3 | | 15 |
s4 | | 4 | | 10 |
s5 | | 5 | | 15 |
s6 | | 6 | | 15 |
s7 | | 7 | | 12 |
s8 | | 8 | | 10 |
s9 | | 9 | | 12 |
s10 | | 10 | | 12 |
s11 | | 11 | | 12 |
s12 | | 12 | | 20 |
s13 | | 13 | | 15 |
s14 | | 14 | | 5 |
s15 | | 15 | | 17 |
s16 | | 16 | | 8 |
s17 | | 17 | | 3 |
s19 | | 19 | | 10 |
s20 | | 20 | | 8 |
s21 | | 21 | | 7 |
s22 | | 22 | | 3.5 |
s23 | | 23 | | 15 |
s24 | | 24 | | 5 |
s25 | | 25 | | 9 |
s26 | | 26 | | 10 |
s27 | | 27 | | 4.5 |
s28 | | 28 | | 10 |
s29 | | 29 | | 10 |
s30 | | 30 | | 9 |
s31 | | 31 | | 15 |
s32 | | 32 | | 15 |
s33 | | 33 | | 10 |
s34 | | 34 | | 9 |
s34 | | 34 | | 9 |
The composites are declustered by means of a 3D polygonal method, using in-house software developed for that purpose. The declustered data are then subjected to statistical and geostatistical analyses to define the estimation parameters. Uncapped, non-declustered composite statistics for gold and silver are provided in Tables 14-9 and 14-10. RPA checked and confirmed the mean grades for each of the domains.
| | | | |
| |
Barrick Gold Corporation – Porgera Joint Venture, Project #1669 Technical Report NI 43-101 – March 16, 2012 | | | Rev. 0 Page 14-12 | |
| | |
| | www.rpacan.com |
|
TABLE 14-9 2 M NON-DECLUSTERED COMPOSITE GRADES - GOLD
Barrick Gold Corporation—Porgera JV
| | | | | | | | |
AUCODE | | Number Au Comps | | Mean Au | | Max Au g/t | | Min Au g/t |
0 | | 17,369 | | 0.917 | | 428.50 | | 0.002 |
102 | | 15,309 | | 0.195 | | 150.35 | | 0.002 |
105 | | 212,237 | | 0.535 | | 350.00 | | 0.002 |
107 | | 11,522 | | 15.748 | | 11,100.00 | | 0.005 |
108 | | 43,257 | | 4.341 | | 2,419.00 | | 0.005 |
109 | | 54,968 | | 1.565 | | 3,500.00 | | 0.005 |
110 | | 23,635 | | 0.954 | | 900.00 | | 0.005 |
116 | | 1,098 | | 3.004 | | 1,600.00 | | 0.005 |
123 | | 51,169 | | 2.881 | | 4,376.00 | | 0.002 |
129 | | 52,310 | | 0.835 | | 1,665.00 | | 0.002 |
158 | | 227 | | 2.017 | | 82.00 | | 0.01 |
160 | | 2,407 | | 3.868 | | 220.00 | | 0.01 |
161 | | 2,468 | | 3.564 | | 220.00 | | 0.01 |
164 | | 172 | | 2.326 | | 64.14 | | 0.01 |
165 | | 1,701 | | 27.545 | | 3,904.10 | | 0.03 |
166 | | 2,350 | | 3.665 | | 239.00 | | 0.01 |
167 | | 1,980 | | 2.220 | | 75.00 | | 0.01 |
169 | | 16,135 | | 6.461 | | 8,400.00 | | 0.005 |
170 | | 46,785 | | 2.083 | | 685.00 | | 0.002 |
171 | | 38,824 | | 3.321 | | 1,520.05 | | 0.002 |
172 | | 5,163 | | 0.797 | | 839.00 | | 0.002 |
180 | | 1,808 | | 0.336 | | 53.88 | | 0.005 |
181 | | 1,524 | | 1.072 | | 112.67 | | 0.005 |
182 | | 4,700 | | 1.422 | | 155.82 | | 0.002 |
183 | | 11,547 | | 0.462 | | 86.00 | | 0.002 |
Total | | 620,665 | | 1.99 | | | | |
| | | | |
| |
Barrick Gold Corporation – Porgera Joint Venture, Project #1669 Technical Report NI 43-101 – March 16, 2012 | | | Rev. 0 Page 14-13 | |
| | |
| | www.rpacan.com |
|
|
TABLE 14-10 2 M NON-DECLUSTERED COMPOSITE GRADES—SULPHUR Barrick Gold Corporation—Porgera JV |
| | | | | | | | |
SCODE | | Number S Comps | | Mean S | | Max S % | | Min S % |
0 | | 12,137 | | 0.889 | | 22.70 | | 0.002 |
2 | | 10,662 | | 0.560 | | 15.40 | | 0.002 |
3 | | 815 | | 5.042 | | 24.70 | | 0.1 |
4 | | 8,566 | | 2.221 | | 35.50 | | 0.01 |
5 | | 11,025 | | 3.100 | | 46.89 | | 0.01 |
6 | | 8,336 | | 2.214 | | 25.00 | | 0.01 |
7 | | 11,442 | | 2.886 | | 44.00 | | 0.01 |
8 | | 113,832 | | 0.814 | | 40.60 | | 0.002 |
9 | | 30,382 | | 2.225 | | 34.70 | | 0.01 |
10 | | 36,143 | | 1.169 | | 33.00 | | 0.002 |
11 | | 53,793 | | 1.345 | | 279.50 | | 0.002 |
12 | | 1,318 | | 4.894 | | 24.30 | | 0.05 |
13 | | 1,812 | | 2.527 | | 27.00 | | 0.05 |
14 | | 12,404 | | 0.664 | | 16.60 | | 0.002 |
15 | | 1,278 | | 4.664 | | 24.84 | | 0.01 |
16 | | 5,783 | | 1.745 | | 26.60 | | 0.01 |
17 | | 780 | | 0.445 | | 4.40 | | 0.05 |
19 | | 100,086 | | 1.869 | | 918.79 | | 0.002 |
20 | | 25,755 | | 1.337 | | 19.60 | | 0.002 |
21 | | 6,263 | | 0.926 | | 17.20 | | 0.002 |
22 | | 1,822 | | 0.697 | | 14.86 | | 0.002 |
23 | | 41,294 | | 1.638 | | 39.60 | | 0.01 |
24 | | 3,786 | | 1.714 | | 12.80 | | 0.01 |
25 | | 8,319 | | 1.062 | | 115.59 | | 0.01 |
26 | | 32,572 | | 1.919 | | 33.30 | | 0.05 |
27 | | 1,218 | | 0.866 | | 11.32 | | 0.05 |
28 | | 9,614 | | 2.342 | | 21.20 | | 0.01 |
29 | | 11,830 | | 2.505 | | 27.20 | | 0.01 |
30 | | 462 | | 1.710 | | 13.00 | | 0.05 |
31 | | 5,930 | | 2.973 | | 36.00 | | 0.05 |
32 | | 8,644 | | 2.304 | | 27.30 | | 0.01 |
33 | | 2,771 | | 1.835 | | 24.10 | | 0.01 |
34 | | 2,511 | | 0.792 | | 15.45 | | 0.002 |
Total | | 540,405 | | 1.50 | | | | |
STOPE COMPOSITES
The voids model contains tags for mined out volumes. Different tags are applied depending on the type of void space. Early stopes, that which were filled with uncemented backfill, are discriminated from later ones with cemented backfill. This is to allow for different dilution parameters in the treatment of composites within the mined volumes, and for the design and reserve estimation processes. Similarly, a separate category is applied to development in ore.
| | | | |
| |
Barrick Gold Corporation – Porgera Joint Venture, Project #1669 Technical Report NI 43-101 – March 16, 2012 | | | Rev. 0 Page 14-14 | |
| | |
| | www.rpacan.com |
|
Production experience has shown that a better block model grade estimate is obtained when some of the samples from within stoped volumes are included in the database. For stopes mined prior to 1997, a procedure has been developed for treating composites within the voids. Composites located immediate inside of the mined volumes are termed “skin samples”. Generally only the skin samples are used in block modeling, and the samples in the interior of the stopes are ignored. An exception would be for narrow pillars between stopes. In this instance, the interior samples are included.
For grade interpolation purposes the skin samples are adjusted according to the following steps:
| | • | | If the grade of an adjacent sample outboard of a skin sample is higher than the grade of the skin sample then the grade of the skin sample is used. |
| | • | | If the grade of the outboard sample is greater than 12 g/t Au, then the skin sample is given the grade of that outboard sample. |
| | • | | Skin samples with grades greater than 12 g/t Au are capped at 12 g/t. |
GEOSTATISTICS AND SEARCH PARAMETERS
(Note that the term “variogram” may be used to refer to correlograms and semi-variograms in this report.)
Geostatistical analyses are carried out for both gold and sulphur in all domains. Omin-directional semi-variograms are generated to estimate nugget effects. Variogram maps and directional variograms are created in order to study anisotropy in grade continuity. This information is then used as a guide for development of search parameters for the OK and ID estimates and variograms models for the OK estimates. For the MIK domains, indicator variograms are generated for each class bin. The number of different variograms generated is quite large and they are too numerous to include in this report.
The geostatistics for gold are carried out using in-house software, and for sulphur using Sage. Variography is not routinely redone for every estimate. If there was no significant increase in the database for a particular domain, then the previous year’s variograms parameters are used.
| | | | |
| |
Barrick Gold Corporation – Porgera Joint Venture, Project #1669 Technical Report NI 43-101 – March 16, 2012 | | | Rev. 0 Page 14-15 | |
| | |
| | www.rpacan.com |
|
SEARCH PARAMETERS
Search parameters are developed in part from the geostatistical analyses described above. The orientation of the search ellipsoids are determined by the Dynamic Anisotropy Modeling (DAM) system. Strings are drawn along the approximate centreline of the zones in plan and section views for each estimation domain. The strings are modified by adding additional points to them in order to ensure consistent coverage throughout each zone. Strikes and dips are then generated for each of the polyline points and stored as data for grade interpolation. The strikes and dips are then interpolated into a block model using ID2 and stored as inputs to the grade estimations. When the block grades are interpolated, the system queries each block for the orientation of the search ellipsoid.
The grade interpolations are run using a series of progressively larger search ellipsoids and more liberal composite selection criteria. There were a total of 168 individual search parameter variants included in the summary file reviewed by RPA. Most domains have in the order of one to ten different search passes. However, domain 108 had 58 different search patterns, due to the fact that this domain comprises five separate sub-domains. The searches tended to vary most in ranges and not in sample selection criteria. All parameter files used an octant search with a minimum of four and maximum of 20 composites per block, with composites from a minimum of at least two drill holes.
The introduction of the two drill hole constraint is a new modification to the overall methodology. Also, the maximum composite per block limit of 20 is a significant change from the previous limit of 200. These changes were invoked to bring the Porgera JV estimation methodology more in line with Barrick’s preferred protocols. Barrick’s guidelines for resource estimation typically incorporate inverse distance interpolations using a small number of composites per block (typically no more than six).
BLOCK MODELS
There are several block models generated in the course of preparing the Mineral Resource and Reserve estimates. Most comprise arrays of 10 m by 5 m by 10 m blocks,
| | | | |
| |
Barrick Gold Corporation – Porgera Joint Venture, Project #1669 Technical Report NI 43-101 – March 16, 2012 | | | Rev. 0 Page 14-16 | |
| | |
| | www.rpacan.com |
|
although these models can vary in block size depending on their ultimate use. Some models are sub-blocked, while others are reblocked to a larger size for use in pit optimization. All, however, are oriented parallel to the property survey grid and encompass the same volume. The geometry of the generic framework for the block model array is provided in Table 14-11.
TABLE 14-11 BLOCK MODEL GEOMETRY
Barrick Gold Corporation—Porgera JV
| | | | | | |
Block Size: | | | X | | | 10 m |
| | | Y | | | 5 m |
| | | Z | | | 10 m |
| | |
Origin: | | | X | | | 21,200E |
| | | Y | | | 10,200N |
| | | Z | | | 1,600 m el |
| | |
Extents: | | | X | | | 2,660 m |
| | | Y | | | 2,260 m |
| | | Z | | | 1,200 m |
Block models are developed for grade interpolations for sulphur and gold using OK, ID3 and MIK. A model is also created to store individual search orientations for the DAM. Indicator kriging is used for domains with relatively high coefficients of variation. Inverse distance is used for background domains and those with relatively few data points. Each domain is estimated separately and is discriminated from neighbouring domains by means of the wireframe models. Sub-domains are defined for some zones to allow for variation in the estimation parameters within a domain.
The generalized process for constructing the block models is as follows:
| | 1) | Collect and validate the sample data. De-survey the samples (i.e. determine the XYZ coordinates of the samples). |
| | 2) | Update wireframe domain models including DAM, if applicable. |
| | 3) | Create and tag the 2 m composites. Tags include estimation domains for gold and sulphur and stope types. |
| | 4) | Adjust composites for skin samples. |
| | | | |
| |
Barrick Gold Corporation – Porgera Joint Venture, Project #1669 Technical Report NI 43-101 – March 16, 2012 | | | Rev. 0 Page 14-17 | |
| | |
| | www.rpacan.com |
|
| | 5) | Decluster composites and conduct statistics and geostatistics. Confirm top cuts. |
| | 6) | Develop and confirm estimation, kriging, and search parameters for gold, sulphur, and DAM. |
| | 7) | Create and tag a sub-blocked (termed “split” model at Porgera JV) model for gold. Note that tagging refers to the assignment of domain codes to the blocks. This is done using the wireframe models, and involves some degree of correction afterward to account for gaps and overlaps between wireframes. |
| | 8) | Create and tag a “regular” (un-split) model for gold. |
| | 9) | Create a split model for the DAM, and estimate strike and dip direction into the blocks using ID2. |
| | 10) | Regularize the gold model (i.e. re-block into a non-sub-blocked array). |
| | 11) | Estimate gold using ID3 (for validation of the MIK model) and regularize that model. |
| | 12) | Estimate kriging variance (KV) for gold using OK (for use in classification). |
| | 13) | Estimate gold using nearest neighbour (NN) for validation purposes. |
| | 14) | Create a split sulphur model and estimate. |
| | 15) | Regularize the sulphur model. |
| | 16) | Carry out the estimates for gold and silver in the background domains. These are domains on the periphery of the model that are generally poorly sampled. The purpose for estimating these domains is to track grades in strip material, and to maintain an inventory of mineralized zones not well enough defined to be included as Mineral Resources but that could be upgraded at a later date with additional sampling. |
| | 17) | Create the models for the development voids as well as the uncemented and cemented stope volumes. |
| | 18) | Regularize the combined KV, sulphur, and gold models tagged by AUCODE, then combine with the previous year’s model for comparative purposes. |
| | 19) | Assemble a model including all estimated components, as well as voids, and tag according to pit shells (i.e. proportion inside or outside of the pit). |
BLOCK MODEL VALIDATION
The model grade estimates are validated by the following methods:
| | • | | Inspection in cross section and level plan views, and comparison to composite grades. |
| | | | |
| |
Barrick Gold Corporation – Porgera Joint Venture, Project #1669 Technical Report NI 43-101 – March 16, 2012 | | | Rev. 0 Page 14-18 | |
| | |
| | www.rpacan.com |
|
| | • | | Comparison of the OK/MIK estimates to ID3 estimates. |
| | • | | Comparison of composite and block means and frequency distributions for each domain. |
| | • | | Comparison with previous year’s model. |
Porgera JV mine staff report that in section and plan views the block grades appear to agree quite well with the composite grades. RPA reviewed the cross sections and concurs with this assessment. It is noted, however, that in the background domain where there are no wireframe constraints, the grade interpolations do appear to be unrealistic. There are instances where high grades have been allowed to be smeared out over too broad of an area. In contrast, there are other instances where relatively good grade material has been unfairly diluted. This occurs primarily where there are no wireframe models to constrain the grade interpolation. Porgera JV mine staff are aware of this issue and are working to address it.
For each domain, the tonnage and grade for the kriged and ID3 estimates were compared at cut-off grades of zero and 1.0 g/t Au. The comparisons are carried out statistically as well as visually. Table 14-13 shows the global mean block grades for each estimation domain in both the kriged and ID3 models. RPA notes that with the exception of domains 102 and 105, the two estimation methodologies compare reasonably well. The 102 and 105 codes represent background domains, and as such, are poorly constrained, mostly unclassified, and do not generally contribute much to the Mineral Resource estimate. If these two domains are removed from the comparison, the overall results are within an acceptable standard.
Figure 14-2 shows the tonnage and grade curves for the ID3 block model against the kriged model. In RPA’s opinion, the ID3 model generally reports fewer tonnes at a higher grade than the MIK model across most cut-off grades. This suggests that the MIK model is smoothing grades more than the ID3. RPA further notes, however, that the differences in tonnage and grade tend to cancel one another out such that the metal content remains more or less constant.
| | | | |
| |
Barrick Gold Corporation – Porgera Joint Venture, Project #1669 Technical Report NI 43-101 – March 16, 2012 | | | Rev. 0 Page 14-19 | |
| | |
| | www.rpacan.com |
|
Statistical analyses are carried out on the composites and blocks to compare the two distributions. An example of this comparison is provided in Figure 14-1. A similar type of comparison is done for all domains as well as the entire database.
FIGURE 14-1 EXAMPLE BLOCK AND COMPOSITE GRADE
DISTRIBUTIONS (ALL ZONES)
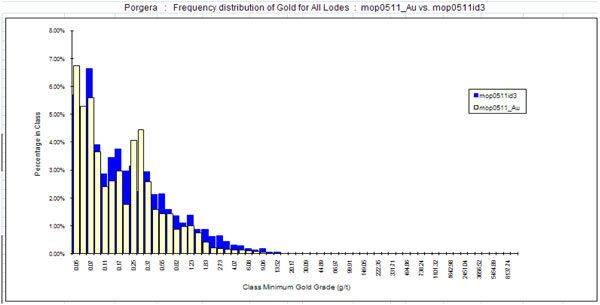
Table 14-12 shows the global weighted average gold grades for the composites and the blocks in each domain. In RPA’s opinion, there is not very good agreement between these mean grades. Overall, there appears to be a negative bias in the block grades versus the composites. At the time of writing of this report, Barrick personnel were aware of the issue and were experimenting with different search parameters to see if better agreement can be attained. They note (correctly) that there is a significant degree of smoothing of the block grade distributions relative to the composites and consider this to be a potential cause of the bias. In order to attempt to address this, more stringent limits on the maximum number of composite per block estimate will be applied and the impacts reviewed. In addition, a reduction in the size of the search ellipsoids is under consideration. In RPA’s opinion, these are strategies that should result in a reduction of the smoothing of grades in the block model which is viewed as a benefit. It is not clear, however, why the smoothing would have resulted in such a pronounced bias.
| | | | |
| |
Barrick Gold Corporation – Porgera Joint Venture, Project #1669 Technical Report NI 43-101 – March 16, 2012 | | | Rev. 0 Page 14-20 | |
| | |
| | www.rpacan.com |
|
RPA notes also that one of the effects of applying the IK approach is to restrict the highest grade samples from having too great an impact on the block model. This is generally done in lieu of capping, with the intent of constraining high grades by the use of more restrictive search parameters for the highest bins. In RPA’s opinion, therefore, it is reasonable to expect a reduction in the global block means if the influence of the highest grade samples is constrained.
TABLE 14-12 COMPARISON OF MEAN COMPOSITE AND BLOCK GRADES
Barrick Gold Corporation—Porgera JV
| | | | | | | | | | | | |
| | | Composites | | | Blocks | | | Difference | |
AUCODE | | (g/t Au) | | | (g/t Au) | | | (%) | |
0 | | | 1.297 | | | | 0.808 | | | | -37.7 | % |
102 | | | 0.197 | | | | 0.296 | | | | 50.3 | % |
105 | | | 0.503 | | | | 0.428 | | | | -14.9 | % |
107 | | | 6.372 | | | | 3.131 | | | | -50.9 | % |
108 | | | 2.786 | | | | 2.308 | | | | -17.2 | % |
109 | | | 1.570 | | | | 1.172 | | | | -25.4 | % |
110 | | | 0.885 | | | | 0.534 | | | | -39.7 | % |
116 | | | 1.988 | | | | 0.637 | | | | -68.0 | % |
123 | | | 2.676 | | | | 1.452 | | | | -45.7 | % |
129 | | | 0.850 | | | | 0.343 | | | | -59.6 | % |
158 | | | 1.999 | | | | 1.203 | | | | -39.8 | % |
160 | | | 3.778 | | | | 3.153 | | | | -16.5 | % |
161 | | | 3.336 | | | | 2.722 | | | | -18.4 | % |
164 | | | 1.229 | | | | 1.368 | | | | 11.3 | % |
165 | | | 5.761 | | | | 4.939 | | | | -14.3 | % |
166 | | | 3.294 | | | | 2.842 | | | | -13.7 | % |
167 | | | 2.183 | | | | 2.026 | | | | -7.2 | % |
169 | | | 4.458 | | | | 4.064 | | | | -8.8 | % |
170 | | | 2.010 | | | | 1.693 | | | | -15.8 | % |
171 | | | 3.029 | | | | 2.895 | | | | -4.4 | % |
172 | | | 0.700 | | | | 0.592 | | | | -15.4 | % |
180 | | | 0.333 | | | | 0.404 | | | | 21.3 | % |
181 | | | 0.993 | | | | 0.969 | | | | -2.4 | % |
182 | | | 1.210 | | | | 0.847 | | | | -30.0 | % |
183 | | | 0.443 | | | | 0.419 | | | | -5.4 | % |
All | | | 1.475 | | | | 0.519 | | | | -64.8 | % |
| | | | |
| |
Barrick Gold Corporation – Porgera Joint Venture, Project #1669 Technical Report NI 43-101 – March 16, 2012 | | | Rev. 0 Page 14-21 | |
| | |
| | www.rpacan.com |
|
FIGURE 14-2 TONNAGE AND GRADE CURVES—ID3 VS KRIGING
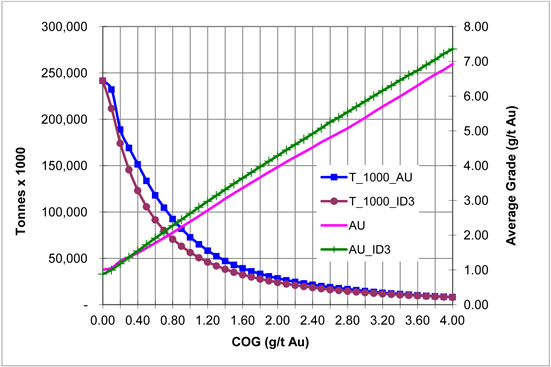
| | | | |
| |
Barrick Gold Corporation – Porgera Joint Venture, Project #1669 Technical Report NI 43-101 – March 16, 2012 | | | Rev. 0 Page 14-22 | |
| | |
| | www.rpacan.com |
|
| | | | | | | | | | | | | | | | | | | | | | | | | | | | | | | | | | | | | | | | | | | | | | | | |
| TABLE 14-13 COMPARISON OF 2011 AND 2010 BLOCK MODEL RESULTS (1.0 G/T AU CUT-OFF) | |
| Barrick Gold Corporation - Porgera JV | |
| | | 2011 | | | ID3 | | | Differences | |
Domain | | Tonnage
(000 t) | | | Grade
(g/t Au) | | | Ounce
(oz) | | | Tonnage
(000 t) | | | Grade
(g/tAu) | | | Ounce
(oz) | | | Tonnes
Diff.
(000 t) | | | Tonnes
Diff.
(%) | | | Grade
Diff.
(g/t Au) | | | Grade
Diff.
(%) | | | Ounce
Diff. (oz) | | | Ounce
Diff.
(%) | |
0 | | | 10,847 | | | | 3.77 | | | | 1,315,208 | | | | 12,509 | | | | 3.79 | | | | 1,524,395 | | | | -1,663 | | | | -13.29 | % | | | -0.02 | | | | -0.50 | % | | | -209,186 | | | | -13.72 | % |
102 | | | 7,939 | | | | 2.34 | | | | 597,411 | | | | 9,951 | | | | 2.53 | | | | 810,659 | | | | -2,012 | | | | -20.22 | % | | | -0.19 | | | | -7.63 | % | | | -213,248 | | | | -26.31 | % |
105 | | | 371,901 | | | | 1.73 | | | | 20,725,757 | | | | 427,456 | | | | 1.79 | | | | 24,663,620 | | | | -55,555 | | | | -13.00 | % | | | -0.06 | | | | -3.41 | % | | | -3,937,863 | | | | -15.97 | % |
107 | | | 9,394 | | | | 4.86 | | | | 1,469,270 | | | | 9,542 | | | | 5.24 | | | | 1,608,109 | | | | -149 | | | | -1.56 | % | | | -0.38 | | | | -7.19 | % | | | -138,840 | | | | -8.63 | % |
108 | | | 19,510 | | | | 3.66 | | | | 2,296,631 | | | | 19,448 | | | | 3.69 | | | | 2,304,163 | | | | 62 | | | | 0.32 | % | | | -0.02 | | | | -0.64 | % | | | -7,533 | | | | -0.33 | % |
109 | | | 82,614 | | | | 2.39 | | | | 6,348,941 | | | | 83,127 | | | | 2.40 | | | | 6,401,630 | | | | -513 | | | | -0.62 | % | | | 0.00 | | | | -0.21 | % | | | -52,689 | | | | -0.82 | % |
110 | | | 18,527 | | | | 2.42 | | | | 1,440,852 | | | | 18,092 | | | | 2.45 | | | | 1,423,497 | | | | 435 | | | | 2.40 | % | | | -0.03 | | | | -1.15 | % | | | 17,355 | | | | 1.22 | % |
116 | | | 1,736 | | | | 2.63 | | | | 146,685 | | | | 1,802 | | | | 2.78 | | | | 160,910 | | | | -66 | | | | -3.67 | % | | | -0.15 | | | | -5.37 | % | | | -14,225 | | | | -8.84 | % |
123 | | | 32,802 | | | | 3.58 | | | | 3,773,506 | | | | 33,036 | | | | 3.64 | | | | 3,868,392 | | | | -234 | | | | -0.71 | % | | | -0.06 | | | | -1.76 | % | | | -94,886 | | | | -2.45 | % |
129 | | | 34,281 | | | | 2.50 | | | | 2,755,128 | | | | 32,819 | | | | 2.51 | | | | 2,652,975 | | | | 1,463 | | | | 4.46 | % | | | -0.01 | | | | -0.58 | % | | | 102,153 | | | | 3.85 | % |
158 | | | 554 | | | | 1.80 | | | | 32,024 | | | | 554 | | | | 1.80 | | | | 32,014 | | | | 0 | | | | 0.00 | % | | | 0.00 | | | | 0.03 | % | | | 10 | | | | 0.03 | % |
160 | | | 6,099 | | | | 3.42 | | | | 670,449 | | | | 6,122 | | | | 3.42 | | | | 673,995 | | | | -24 | | | | -0.39 | % | | | 0.00 | | | | -0.14 | % | | | -3,546 | | | | -0.53 | % |
161 | | | 5,455 | | | | 3.32 | | | | 582,626 | | | | 5,384 | | | | 3.47 | | | | 600,179 | | | | 71 | | | | 1.33 | % | | | -0.15 | | | | -4.20 | % | | | -17,554 | | | | -2.92 | % |
164 | | | 397.06 | | | | 2.04 | | | | 26,029 | | | | 397.06 | | | | 2.04 | | | | 26,054 | | | | 0 | | | | 0.00 | % | | | 0.00 | | | | -0.09 | % | | | -24 | | | | -0.09 | % |
165 | | | 1,403 | | | | 3.54 | | | | 159,812 | | | | 1,403 | | | | 3.57 | | | | 161,084 | | | | 0 | | | | 0.00 | % | | | -0.03 | | | | -0.79 | % | | | -1,272 | | | | -0.79 | % |
166 | | | 5,160 | | | | 3.08 | | | | 511,713 | | | | 5,155 | | | | 3.09 | | | | 511,758 | | | | 5 | | | | 0.10 | % | | | 0.00 | | | | -0.11 | % | | | -46 | | | | -0.01 | % |
167 | | | 2,976 | | | | 2.31 | | | | 221,199 | | | | 2,974 | | | | 2.31 | | | | 221,153 | | | | 3 | | | | 0.09 | % | | | 0.00 | | | | -0.07 | % | | | 47 | | | | 0.02 | % |
169 | | | 15,193 | | | | 4.07 | | | | 1,988,586 | | | | 15,258 | | | | 4.07 | | | | 1,994,886 | | | | -65 | | | | -0.43 | % | | | 0.00 | | | | 0.11 | % | | | -6,300 | | | | -0.32 | % |
170 | | | 38,187 | | | | 2.36 | | | | 2,901,039 | | | | 38,317 | | | | 2.37 | | | | 2,917,374 | | | | -130 | | | | -0.34 | % | | | -0.01 | | | | -0.22 | % | | | -16,335 | | | | -0.56 | % |
171 | | | 29,881 | | | | 3.29 | | | | 3,158,047 | | | | 20,670 | | | | 3.64 | | | | 2,416,718 | | | | 9,211 | | | | 44.56 | % | | | -0.35 | | | | -9.61 | % | | | 741,328 | | | | 30.68 | % |
172 | | | 3,369 | | | | 1.46 | | | | 157,809 | | | | 3,392 | | | | 1.44 | | | | 157,098 | | | | -22 | | | | -0.66 | % | | | 0.02 | | | | 1.12 | % | | | 710 | | | | 0.45 | % |
180 | | | 904 | | | | 2.36 | | | | 68,470 | | | | 0 | | | | 0.00 | | | | 0 | | | | 904 | | | | n/a | | | | 2.36 | | | | n/a | | | | 68,470 | | | | n/a | |
181 | | | 2,274 | | | | 2.30 | | | | 168,484 | | | | 0 | | | | 0.00 | | | | 0 | | | | 2,274 | | | | n/a | | | | 2.30 | | | | n/a | | | | 168,484 | | | | n/a | |
182 | | | 6,253 | | | | 2.98 | | | | 599,072 | | | | 0 | | | | 0.00 | | | | 0 | | | | 6,253 | | | | n/a | | | | 2.98 | | | | n/a | | | | 599,072 | | | | n/a | |
183 | | | 17,038 | | | | 1.62 | | | | 889,814 | | | | 0 | | | | 0.00 | | | | 0 | | | | 17,038 | | | | n/a | | | | 1.62 | | | | n/a | | | | 889,814 | | | | n/a | |
Total | | | 724,693 | | | | 2.27 | | | | 53,004,560 | | | | 747,407 | | | | 2.29 | | | | 55,130,664 | | | | -22,714 | | | | -3.04 | % | | | -0.02 | | | | -0.84 | % | | | -2,126,104 | | | | -3.86 | % |
| | | | | | | | | | | | | | | | | | | | | | | | | | | | | | | | | | | | | | | | | | | | | | | | |
Notes:
1. Tonnage and grade totals are unclassified global block model results that include volumes mined since production started. They are not Mineral Resource estimates.
| | | | |
| |
Barrick Gold Corporation – Porgera Joint Venture, Project #1669 Technical Report NI 43-101 – March 16, 2012 | | | Rev. 0 Page 14-23 | |
| | |
| | www.rpacan.com |
|
The block model results for each zone are compared against the previous year’s model to check for significant differences. Table 14-13 shows the unclassified block model results for the 2011 model and 2010 at a cut-off of 1.0 g/t Au. Overall, there was a modest reduction in tonnes with a very minor change in grade, which resulted in a 3.9% reduction in overall ounces in the block model. The most significant negative differences occurred in the background domains (0, 102, and 105) owing to some modifications to the estimation parameters. The largest positive changes were in the 171 and AHD (180 to 183, inclusive) domains. The AHD domains were added to the open pit block model for the first time in 2011. The 171 domain was updated with a new wireframe, and the search and estimation parameters were modified to be consistent with the other domains in the model.
RPA reviewed the drift analysis diagrams and confirms that they do not show any significant biases. The drift diagrams show average grades for blocks pierced by at least one drill hole with the nearest composites. An example of one of these diagrams is provided in Figure 14-3.
FIGURE 14-3 DRIFT DIAGRAM (X-DIRECTION)
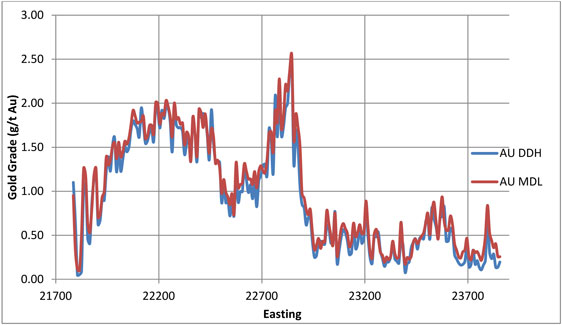
| | | | |
| |
Barrick Gold Corporation – Porgera Joint Venture, Project #1669 Technical Report NI 43-101 – March 16, 2012 | | | Rev. 0 Page 14-24 | |
| | |
| | www.rpacan.com |
|
CLASSIFICATION
In RPA’s opinion, the classification scheme is consistent with the nomenclature specified in the CIM Standards on Mineral Resources and Reserves Definitions and Guidelines and, as such, is compliant with NI 43-101 requirements.
The model is classified using kriging variance (KV), which is generated from a separate kriging interpolation run on the gold. The KV thresholds for assignment of the classification are delineated in Table 14-14.
|
| TABLE 14-14 RESOURCE CLASSIFICATION BY KRIGING VARIANCE |
| Barrick Gold Corporation – Porgera JV |
|
| | |
Resource Classification | | kv Ranges |
| Measured | | <0.19 |
| Indicated | | 0.19 - 0.65 |
| Inferred | | 0.65 –0.80 |
Blocks are interpolated for gold twice; once using the defined domain parameter set and again using a more liberal background set of parameters. All blocks estimated by the “primary” interpolation parameters with a KV of less than 0.80 are initially assigned an integer code of 3, denoting an Inferred classification. Blocks without a primary estimate for gold but which received a background estimate are assigned a code of five. All code three blocks with KV less than 0.19 are upgraded to an integer code of one for Measured, and all remaining blocks with KV less than 0.65 are assigned a two for Indicated. If a block has a primary gold estimate and the KV is greater than 0.8, but it was not assigned code five, it is coded as class four. In addition to the codes one, two, and three for Measured, Indicated and Inferred, respectively, this yields a body of material with class code of four, representing “Inventory”.
The Inventory class is maintained in order to track material for which the confidence level of the estimate is not high enough for inclusion as Mineral Resources, but for which there is some likelihood of the presence of gold mineralization. This is useful for longer term planning and development of exploration targets.
RPA notes that the KV thresholds have been modified from the last audit conducted in 2008 (for the mid-year 2008 model). The upper limit for Measured has been reduced
| | | | |
| |
Barrick Gold Corporation – Porgera Joint Venture, Project #1669 Technical Report NI 43-101 – March 16, 2012 | | | Rev. 0 Page 14-25 | |
| | |
| | www.rpacan.com |
|
from 0.31 to 0.19, which would very likely have resulted in a reduction of the volume of Measured resources. In 2008, the upper and lower limits for Indicated were 0.31 and 0.73, respectively. Application of the present standard would have resulted in the transfer of resources previously classified as Measured and a downgrade of other material to Inferred. For the Inferred Mineral Resources, the previously audited limits were 0.73 to 1.90. In RPA’s opinion, application of the present criterion for Inferred would likely have resulted in the inclusion of more material owing to the removal of the lower limit of 1.90. The net result of these changes would have been to make the reserves estimate more conservative owing to removal of material eligible for inclusion as Mineral Reserves (i.e. Measured and Indicated).
RPA notes that the present classification method is not consistent with the one preferred by the Barrick Resource Group in Tuscon (BRG). The Barrick approach is to classify blocks based on distance to the nearest composite, using criteria derived from the omni-directional semi-variograms. A typical example would be to classify as Measured all blocks within a distance corresponding to the range of the variogram at 80% of the sill. Indicated would be the range at 90% of the sill, and Inferred out to the limit of the search ellipsoids. Note that this is just an example of the process and would not necessarily be the criteria applied at Porgera JV.
Porgera JV mine staff are studying the practicality of switching over to the Barrick standard and what the effects of a switch would be. In RPA’s opinion, this is a worthwhile effort in that it could result in simplification of the classification process. However, the impact of such a change could be very significant, and should be implemented only after rigorous investigation as to the effects.
PIT SHELLS
The reported Mineral Resources are only those captured within a Whittle shell generated to demonstrate the economic viability of mining by open pit. This pit shell was created using a gold price of $1,400/oz. Blocks captured within this shell are deemed eligible for inclusion in the open pit mineral resources. This material is subjected to the reserve cut-off and mining constraints in order to derive the mineral reserves estimate. Any material left outside the resource pit shell is eligible for inclusion in the underground mineral resource estimate. Material inside the pit shell and is above cut-off, but not classified as mineral reserves is categorized as mineral resources outside of reserves.
| | | | |
| |
Barrick Gold Corporation – Porgera Joint Venture, Project #1669 Technical Report NI 43-101 – March 16, 2012 | | | Rev. 0 Page 14-26 | |
| | |
| | www.rpacan.com |
|
CUT-OFF GRADE
The cut-off grade used for the open pit resource estimate was 1.0 g/t Au, which is consistent with Barrick’s Reserve and Reporting Guidelines. This cut-off was derived using a gold price of $1,400/oz. In RPA’s the cut-off grade for the Porgera JV open pit mine is reasonable.
UNDERGROUND MODELS
The Mineral Resources estimates for the underground mine are generated from models created for six separate zones. These are the AHD, Central/North Zone (CNZ), East Zone (EZ), Project X (PX), Eastern Deeps (EDX), and O Zone (OZ). For the EOY2011 estimate, PX and EDX were not updated as no new information had been collected from these areas. The last estimate for PDX was carried out in 2006, and has been carried forward from that time. RPA did not review this estimate.
The models are constrained by 3D wireframes constructed using diamond drill and underground chip sampling results. There are a large number of these domains, and they are described under separate headings for each of the zones. The general locations of the zones are shown in Figure 14-4.
The models are configured as sub-blocked arrays with a parent block size of 5 m by 0.5 m by 5 m. Sub-blocks are generated with a relatively wide range of dimensions to allow the models to honour the wireframes more accurately. The sub-blocking routine resulted in extremely short dimensions in the Y direction (across strike), in the order of cm-scale.
Grades for gold and sulphur are interpolated into the blocks using OK. The grade interpolations are oriented using the DAM utility described earlier in this report.
| | | | |
| |
Barrick Gold Corporation – Porgera Joint Venture, Project #1669 Technical Report NI 43-101 – March 16, 2012 | | | Rev. 0 Page 14-27 | |
| | |
| | www.rpacan.com |
|
DATABASE
The database used for the underground models is essentially the same as for the open pit models. As such, the validation and management protocols are also the same.
BULK DENSITY
Bulk density values are assigned to each block depending on its principal rock type. Table 14-4 lists the various bulk density values used.
| | | | |
| |
Barrick Gold Corporation – Porgera Joint Venture, Project #1669 Technical Report NI 43-101 – March 16, 2012 | | | Rev. 0 Page 14-28 | |
| | |
| | www.rpacan.com |
FIGURE 14-4 LOCATION OF UNDERGROUND RESOURCE DOMAINS
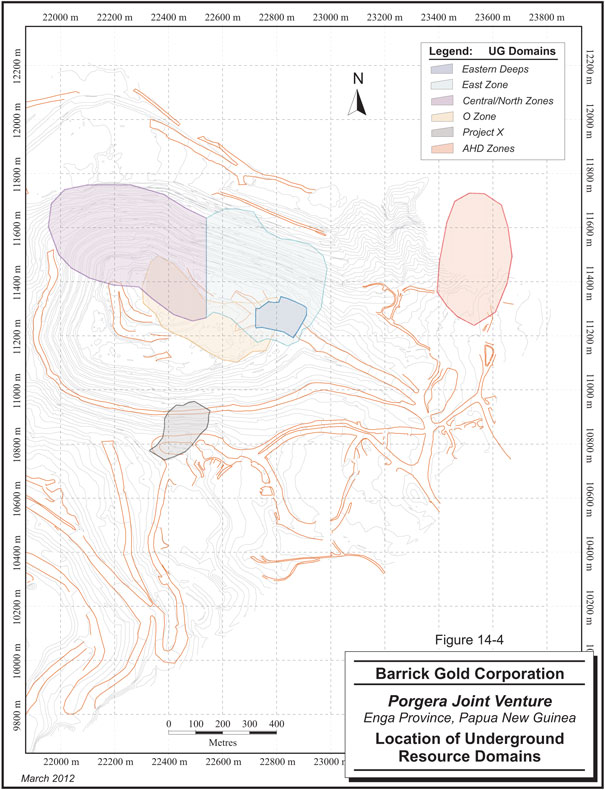
| | | | |
| |
Barrick Gold Corporation – Porgera Joint Venture, Project #1669 Technical Report NI 43-101 – March 16, 2012 | | | Rev. 0 Page 14-29 | |
| | |
| | www.rpacan.com |
|
WIREFRAME MODELS AND ESTIMATION DOMAINS
The wireframe models are constructed using a nominal cut-off grade of 3 g/t Au and a three-metre minimum width. For some zones, a low-grade halo surrounding the 3 g/t wireframe is also constructed. These halos are based on a nominal 1.5 g/t Au cut-off. Wireframes are also created to configure the DAM utility, in the same general fashion as is done for the open pit models.
The surveyors maintain a library of wireframes of the development and stoping. These are used to extract mined volumes from the model prior to reporting. Porgera JV mine staff report that the library of these voids models is disorganized and incomplete which results in excessive time spent to sort through them and select the correct ones. They are working to improve the level of organization of these files. RPA concurs with this course of action.
A 3D view of the mineralized domain wireframes is provided in Figure 14-5.
CNZ
The CNZ comprises several branching zones related to the Romane Fault, striking EW and dipping to the south with splays extending steeply upwards and downwards. Wireframes were constructed for several of these distinct structures. An envelope surrounding the entire CNZ area was also constructed to capture previously unmodeled mineralization in the walls of the main zone. There are many significant intercepts in the vicinity of the CNZ that have not been wireframed owing to time constraints. The envelope domain was added to allow the block model to extent to these other zones.
There are a total of 13 gold domains within the CNZ, numbered two to 14, inclusive. Table 14-15 shows the uncut sample statistics for these domains.
| | | | |
| |
Barrick Gold Corporation – Porgera Joint Venture, Project #1669 Technical Report NI 43-101 – March 16, 2012 | | | Rev. 0 Page 14-30 | |
| | |
| | www.rpacan.com |
|
| | | | | | | | | | | | |
| TABLE 14-15 CNZ RAW SAMPLE STATISTICS |
| Barrick Gold Corporation - Porgera JV |
|
| Gold |
Domain | | No. of assays | | Minimum | | Maximum | | Mean | | Std. Dev | | CV |
| 2 | | 28,149 | | 0.02 | | 685.00 | | 6.96 | | 16.96 | | 2.44 |
| 3 | | 1,311 | | 0.01 | | 260.00 | | 6.92 | | 18.00 | | 2.60 |
| 4 | | 2,251 | | 0.01 | | 60.00 | | 3.96 | | 6.22 | | 1.57 |
| 5 | | 755 | | 0.01 | | 145.00 | | 5.27 | | 14.92 | | 2.83 |
| 6 | | 94 | | 0.01 | | 66.00 | | 4.11 | | 8.94 | | 2.18 |
| 7 | | 211 | | 0.01 | | 14.00 | | 1.86 | | 2.99 | | 1.61 |
| 8 | | 927 | | 0.01 | | 43.00 | | 3.23 | | 5.23 | | 1.62 |
| 9 | | 516 | | 0.00 | | 115.00 | | 4.67 | | 13.63 | | 2.92 |
| 10 | | 48,098 | | 0.00 | | 3040.00 | | 10.01 | | 36.89 | | 3.68 |
| 11 | | 2,823 | | 0.01 | | 520.00 | | 7.48 | | 31.37 | | 4.19 |
| 12 | | 135,904 | | 0.00 | | 500.00 | | 1.97 | | 8.90 | | 4.51 |
| 13 | | 106,967 | | 0.00 | | 1437.05 | | 1.70 | | 11.55 | | 6.78 |
| 14 | | 1,027 | | 0.00 | | 121.32 | | 4.27 | | 11.16 | | 2.61 |
|
| Sulphur |
Domain | | No. of assays | | Minimum | | Maximum | | Mean | | Std. Dev | | CV |
| 2 | | 27,636 | | 0.00 | | 23.70 | | 1.45 | | 1.62 | | 1.12 |
| 3 | | 1,264 | | 0.00 | | 8.20 | | 0.82 | | 1.07 | | 1.31 |
| 4 | | 2,287 | | 0.00 | | 16.00 | | 0.84 | | 1.36 | | 1.63 |
| 5 | | 732 | | 0.05 | | 11.70 | | 1.01 | | 1.56 | | 1.54 |
| 6 | | 94 | | 0.05 | | 4.20 | | 0.96 | | 0.81 | | 0.84 |
| 7 | | 211 | | 0.00 | | 8.20 | | 0.81 | | 1.22 | | 1.50 |
| 8 | | 914 | | 0.01 | | 23.90 | | 2.16 | | 2.97 | | 1.37 |
| 9 | | 516 | | 0.00 | | 10.30 | | 1.60 | | 2.10 | | 1.32 |
| 10 | | 47,895 | | 0.00 | | 30.00 | | 1.07 | | 1.41 | | 1.32 |
| 11 | | 2,842 | | 0.00 | | 13.70 | | 1.02 | | 1.39 | | 1.36 |
| 12 | | 135,200 | | 0.00 | | 36.32 | | 1.30 | | 1.70 | | 1.31 |
| 13 | | 107,058 | | 0.00 | | 36.43 | | 1.12 | | 1.67 | | 1.49 |
| 14 | | 1,027 | | 0.00 | | 9.14 | | 1.45 | | 1.35 | | 0.93 |
AHD
There were six individual lenses, representing five gold domains, modeled for AHD. These domains are labeled 2, 3a, 3b, 4 and 6, plus a background domain (15). All are hard-boundary domains, meaning that composites from within a particular domain can only be used to estimate blocks in that domain.
Raw sample statistics for these domains are shown in Table 14-16.
| | | | |
| |
Barrick Gold Corporation – Porgera Joint Venture, Project #1669 Technical Report NI 43-101 – March 16, 2012 | | | Rev. 0 Page 14-31 | |
| | |
| | www.rpacan.com |
|
| | | | | | | | | | | | |
| TABLE 14-16 AHD RAW SAMPLE STATISTICS |
| Barrick Gold Corporation—Porgera JV |
|
| Gold |
Domain | | No. of assays | | Minimum | | Maximum | | Mean | | Std. Dev | | CV |
| 2 | | 513 | | 0.01 | | 222.93 | | 6.02 | | 18.16 | | 3.02 |
| 3A(31) | | 361 | | 0.01 | | 92.35 | | 6.74 | | 13.16 | | 1.95 |
| 3B(32) | | 151 | | 0.01 | | 139.50 | | 10.31 | | 21.24 | | 2.06 |
| 4 | | 867 | | 0.01 | | 269.31 | | 14.43 | | 29.01 | | 2.01 |
| 6B(6) | | 232 | | 0.02 | | 108.00 | | 7.95 | | 14.36 | | 1.81 |
| 15 | | 22,247 | | 0.01 | | 311.40 | | 0.48 | | 3.61 | | 7.57 |
|
| Sulphur |
Domain | | No. of assays | | Minimum | | Maximum | | Mean | | Std. Dev | | CV |
| 2 | | 491 | | 0.05 | | 7.63 | | 1.25 | | 1.15 | | 0.92 |
| 3A(31) | | 361 | | 0.05 | | 9.01 | | 0.89 | | 1.00 | | 1.13 |
| 3B(32) | | 151 | | 0.05 | | 4.00 | | 0.90 | | 0.80 | | 0.89 |
| 4 | | 865 | | 0.05 | | 8.38 | | 1.58 | | 1.42 | | 0.90 |
| 6B(6) | | 232 | | 0.05 | | 5.91 | | 1.45 | | 1.01 | | 0.69 |
| 15 | | 22,425 | | 0.01 | | 20.35 | | 0.69 | | 0.86 | | 1.25 |
EZ
The EZ is essentially the eastern strike extension of the CNZ and consists of five parallel lenses, each with their own wireframe model. There are five gold and sulphur domains numbered one through five, plus a low-grade envelope numbered ten.
RPA notes that the wireframes for both EZ and CNZ extend above the resource pit bottom. This necessitates a manual adjustment to the resource tonnage to prevent double counting of blocks. RPA recommends using the resource pit wireframe to “clip” the EZ and CNZ wireframes or to adjust domain codes in order to remove the need for a manual adjustment.
Raw sample statistics for these domains are shown in Table 14-17.
| | | | |
| |
Barrick Gold Corporation – Porgera Joint Venture, Project #1669 Technical Report NI 43-101 – March 16, 2012 | | | Rev. 0 Page 14-32 | |
| | |
| | www.rpacan.com |
|
TABLE 14-17 EZ RAW SAMPLE STATISTICS
Barrick Gold Corporation—Porgera JV
| | | | | | | | | | | | | | | | | | | | | | | | |
| Gold | |
Domain | | No. of assays | | | Minimum | | | Maximum | | | Mean | | | Std. Dev | | | CV | |
1 | | | 4,223 | | | | 0.00 | | | | 3075.25 | | | | 6.10 | | | | 50.45 | | | | 8.27 | |
2 | | | 4,442 | | | | 0.01 | | | | 365.00 | | | | 8.21 | | | | 27.01 | | | | 3.29 | |
3 | | | 1,078 | | | | 0.01 | | | | 495.00 | | | | 10.34 | | | | 34.24 | | | | 3.31 | |
4 | | | 13,201 | | | | 0.00 | | | | 2075.00 | | | | 8.78 | | | | 37.69 | | | | 4.29 | |
5 | | | 1,950 | | | | 0.00 | | | | 330.00 | | | | 5.67 | | | | 20.80 | | | | 3.67 | |
10 | | | 30,700 | | | | 0.00 | | | | 1560.00 | | | | 1.07 | | | | 8.17 | | | | 7.65 | |
|
| Sulphur | |
Domain | | No. of assays | | | Minimum | | | Maximum | | | Mean | | | Std. Dev | | | CV | |
1 | | | 4,175 | | | | 0.00 | | | | 32.80 | | | | 2.10 | | | | 2.01 | | | | 0.96 | |
2 | | | 4,286 | | | | 0.00 | | | | 13.90 | | | | 1.57 | | | | 1.62 | | | | 1.03 | |
3 | | | 1,054 | | | | 0.05 | | | | 17.10 | | | | 2.19 | | | | 1.92 | | | | 0.87 | |
4 | | | 12,890 | | | | 0.00 | | | | 20.12 | | | | 1.98 | | | | 1.59 | | | | 0.80 | |
5 | | | 1,783 | | | | 0.05 | | | | 16.60 | | | | 1.73 | | | | 1.82 | | | | 1.06 | |
10 | | | 36,450 | | | | 0.00 | | | | 1837.00 | | | | 1.67 | | | | 7.04 | | | | 4.23 | |
PX
Project X is a small cluster of irregularly-shaped mineralization located below the south wall of the pit (see Figure 14-4). There are three estimation domains, named one to three, inclusive.
Raw sample statistics for these domains are shown in Table 14-18.
TABLE 14-18 PX RAW SAMPLE STATISTICS
Barrick Gold Corporation—Porgera JV
| | | | | | | | | | | | | | | | | | | | | | | | | | | | |
| Gold | |
Domain | | No. of assays | | | Nulls | | | Minimum | | | Maximum | | | Average | | | Std. Dev | | | CV | |
1 | | | 1,584 | | | | 29 | | | | 0.01 | | | | 360.79 | | | | 4.12 | | | | 17.08 | | | | 4.14 | |
2 | | | 203 | | | | 20 | | | | 0.01 | | | | 450.00 | | | | 9.26 | | | | 38.70 | | | | 4.18 | |
3 | | | 1,303 | | | | 4 | | | | 0.01 | | | | 3135.00 | | | | 14.24 | | | | 53.69 | | | | 3.77 | |
|
| Sulphur | |
Domain | | No. of assays | | | Nulls | | | Minimum | | | Maximum | | | Average | | | Std. Dev | | | CV | |
1 | | | 1,584 | | | | 90 | | | | 0.05 | | | | 18.00 | | | | 1.96 | | | | 2.10 | | | | 1.07 | |
2 | | | 203 | | | | 22 | | | | 0.05 | | | | 13.30 | | | | 1.88 | | | | 2.10 | | | | 1.12 | |
3 | | | 1,303 | | | | 46 | | | | 0.05 | | | | 18.20 | | | | 1.50 | | | | 1.60 | | | | 1.07 | |
| | | | |
| |
Barrick Gold Corporation – Porgera Joint Venture, Project #1669 Technical Report NI 43-101 – March 16, 2012 | | | Rev. 0 Page 14-33 | |
| | |
| | www.rpacan.com |
|
OZ
The O Zone is a single shallower-dipping zone located in the footwall of the CNZ and EZ. It encompasses two domains, representing a footwall and hanging zone.
Raw sample statistics for these domains are shown in Table 14-19.
TABLE 14-19 OZ RAW SAMPLE STATISTICS
Barrick Gold Corporation—Porgera JV
| | | | | | | | | | | | | | | | | | | | | | | | |
| Gold | |
Domain | | No. of assays | | | Minimum | | | Maximum | | | Average | | | Std. Dev | | | CV | |
1 | | | 257 | | | | 0.01 | | | | 86.05 | | | | 5.19 | | | | 8.56 | | | | 1.65 | |
2 | | | 70 | | | | 0.01 | | | | 1560.00 | | | | 32.47 | | | | 207.63 | | | | 6.39 | |
|
| Sulphur | |
Domain | | No. of assays | | | Minimum | | | Maximum | | | Average | | | Std. Dev | | | CV | |
1 | | | 216 | | | | 0.10 | | | | 9.97 | | | | 1.64 | | | | 1.18 | | | | 0.72 | |
2 | | | 74 | | | | 0.10 | | | | 23.02 | | | | 1.94 | | | | 3.84 | | | | 1.98 | |
EDX
This zone comprises six intercalating and crossing lenses located just under the eastern end of the pit. Length-weighted sample statistics for this domain are shown in Table 14-20.
TABLE 14-20 EDX SAMPLE STATISTICS
Barrick Gold Corporation—Porgera JV
| | | | | | | | | | | | | | | | | | | | | | | | | | | | |
| Gold | |
Domain | | No. of assays | | | Minimum | | | Maximum | | | Average | | | Median | | | Std. Dev | | | CV | |
1 | | | 5706 | | | | 0.005 | | | | 8700 | | | | 11.65 | | | | 2.00 | | | | 103.9406 | | | | 8.924 | |
|
| Sulphur | |
Domain | | No. of assays | | | Minimum | | | Maximum | | | Average | | | Median | | | Std. Dev | | | CV | |
1 | | | 2398 | | | | 0.05 | | | | 33.3 | | | | 3.129 | | | | 2.50 | | | | 2.868 | | | | 0.917 | |
Notes: These statistics were generated by RPA using the database supplied from the mine site.
| | | | |
| |
Barrick Gold Corporation – Porgera Joint Venture, Project #1669 Technical Report NI 43-101 – March 16, 2012 | | | Rev. 0 Page 14-34 | |
| | |
| | www.rpacan.com |
|
COMPOSITES AND CAPPING
High grades are capped based on statistical analyses carried out on each domain. Porgera JV staff generate means, cumulative frequency diagrams and coefficients of variation for each of the domained datasets at a range of top cuts. The caps are typically chosen at the value at which 10% of the metal content is removed. Table 14-21 lists the top cuts applied to both Au and S for each domain.
TABLE 14-21 TOP CUTS-UNDERGROUND MODELS
Barrick Gold Corporation—Porgera JV
| | | | |
| CNZ | | | | |
AUDOM | | AU | | S |
2 | | 200 | | 20 |
3 | | 80 | | 8 |
4 | | 30 | | 10 |
5 | | 70 | | 8 |
6 | | 30 | | 3 |
7 | | 9 | | 3 |
8 | | 20 | | 20 |
9 | | 40 | | 9 |
10 | | 400 | | 20 |
11 | | 80 | | 7 |
12 | | 200 | | 18 |
13 | | 400 | | 20 |
14 | | 80 | | 8 |
| | | | |
| AHD | | | | |
AUDOM | | AU | | S |
| 2 | | 50 | | 3 |
| 3A(31) | | 60 | | 3 |
| 3B(32) | | 35 | | 3 |
| 4 | | 100 | | 6.5 |
| 6B(6) | | 70 | | 4 |
| 15 | | n/a | | n/a |
| | | | |
| PX | | | | |
AUDOM | | AU | | S |
| 1 | | 100 | | 12 |
| 2 | | 50 | | 8 |
| 3 | | 300 | | 11 |
| | | | |
| EZ | | | | |
AUDOM | | AU | | S |
| 1 | | 220 | | 13 |
| 2 | | 260 | | 10 |
| 3 | | 140 | | 10 |
| 4 | | 380 | | 9 |
| 5 | | 160 | | 10 |
| 10 | | 190 | | 17 |
| | | | |
| OZ | | | | |
AUDOM | | AU | | S |
| 1 | | 50 | | 3.5 |
| 2 | | 50 | | 3.5 |
The capped samples are composited to one-metre intervals, using the wireframe models as boundary constraints. The predominant sample length in the underground mine is one metre, so compositing has a limited impact. Small remnant composites which occur at the boundaries of domains used to be discarded if they were less than 0.5 m in length. Now, the remnant length is distributed equally among all composites within the domain.
Composites are tagged with domain codes, then subjected to statistical and geostatistical analyses. Tables 14-22 and 14-24 show the non-declustered composite statistics for gold and sulphur in all domains.
| | | | |
| |
Barrick Gold Corporation – Porgera Joint Venture, Project #1669 Technical Report NI 43-101 – March 16, 2012 | | | Rev. 0 Page 14-35 | |
| | |
| | www.rpacan.com |
|
TABLE 14-22 CAPPED COMPOSITE STATISTICS—GOLD
Barrick Gold Corporation—Porgera JV
| | | | | | | | | | | | | | | | | | | | | | | | | | | | |
Zone | | Domain | | | Number | | | Minimum | | | Maximum | | | Mean | | | Std. Dev | | | CV | |
CNZ | | | 2 | | | | 13,637 | | | | 0.02 | | | | 200.00 | | | | 5.24 | | | | 12.10 | | | | 2.31 | |
CNZ | | | 3 | | | | 906 | | | | 0.01 | | | | 80.00 | | | | 4.63 | | | | 11.38 | | | | 2.46 | |
CNZ | | | 4 | | | | 1,267 | | | | 0.01 | | | | 30.00 | | | | 2.50 | | | | 4.37 | | | | 1.75 | |
CNZ | | | 5 | | | | 522 | | | | 0.05 | | | | 70.00 | | | | 2.79 | | | | 7.86 | | | | 2.81 | |
CNZ | | | 6 | | | | 74 | | | | 0.01 | | | | 30.00 | | | | 3.84 | | | | 6.87 | | | | 1.79 | |
CNZ | | | 7 | | | | 145 | | | | 0.01 | | | | 9.00 | | | | 1.01 | | | | 1.85 | | | | 1.83 | |
CNZ | | | 8 | | | | 594 | | | | 0.01 | | | | 20.00 | | | | 2.72 | | | | 4.09 | | | | 1.51 | |
CNZ | | | 9 | | | | 335 | | | | 0.00 | | | | 40.00 | | | | 2.54 | | | | 6.18 | | | | 2.43 | |
CNZ | | | 10 | | | | 27,989 | | | | 0.00 | | | | 400.00 | | | | 8.86 | | | | 22.93 | | | | 2.59 | |
CNZ | | | 11 | | | | 1,789 | | | | 0.01 | | | | 80.00 | | | | 3.78 | | | | 10.31 | | | | 2.73 | |
CNZ | | | 12 | | | | 108,031 | | | | 0.00 | | | | 200.00 | | | | 1.27 | | | | 5.03 | | | | 3.96 | |
CNZ | | | 13 | | | | 89,010 | | | | 0.00 | | | | 400.00 | | | | 1.05 | | | | 6.45 | | | | 6.15 | |
CNZ | | | 14 | | | | 812 | | | | 0.00 | | | | 78.94 | | | | 3.52 | | | | 9.16 | | | | 2.60 | |
| | | | | | | |
AHD | | | 2 | | | | 381 | | | | 0.01 | | | | 50.00 | | | | 4.16 | | | | 7.46 | | | | 1.79 | |
AHD | | | 3A | (31) | | | 292 | | | | 0.01 | | | | 60.00 | | | | 5.61 | | | | 10.82 | | | | 1.93 | |
AHD | | | 3B | (32) | | | 99 | | | | 0.01 | | | | 35.00 | | | | 7.03 | | | | 9.37 | | | | 1.33 | |
AHD | | | 4 | | | | 669 | | | | 0.01 | | | | 100.00 | | | | 10.65 | | | | 18.65 | | | | 1.75 | |
AHD | | | 6B | (6) | | | 149 | | | | 0.02 | | | | 70.00 | | | | 6.99 | | | | 11.93 | | | | 1.71 | |
| | | 15 | | | | 22,956 | | | | 0.01 | | | | 25.00 | | | | 0.33 | | | | 1.24 | | | | 3.81 | |
| | | | | | | |
EZ | | | 1 | | | | 2,961 | | | | 0.00 | | | | 220.00 | | | | 3.84 | | | | 13.05 | | | | 3.40 | |
EZ | | | 2 | | | | 3,271 | | | | 0.01 | | | | 260.00 | | | | 5.07 | | | | 17.44 | | | | 3.44 | |
EZ | | | 3 | | | | 671 | | | | 0.01 | | | | 140.00 | | | | 5.91 | | | | 16.51 | | | | 2.79 | |
EZ | | | 4 | | | | 8,501 | | | | 0.00 | | | | 380.00 | | | | 6.40 | | | | 20.26 | | | | 3.16 | |
EZ | | | 5 | | | | 1,329 | | | | 0.00 | | | | 160.00 | | | | 3.69 | | | | 11.88 | | | | 3.22 | |
EZ | | | 10 | | | | 21,872 | | | | 0.00 | | | | 190.00 | | | | 0.70 | | | | 4.32 | | | | 6.22 | |
| | | | | | | |
PX | | | 1 | | | | 1,547 | | | | 0.01 | | | | 99.03 | | | | 3.83 | | | | 9.30 | | | | 2.43 | |
PX | | | 2 | | | | 165 | | | | 0.01 | | | | 50.00 | | | | 5.95 | | | | 12.15 | | | | 2.04 | |
PX | | | 3 | | | | 1,300 | | | | 0.01 | | | | 286.27 | | | | 7.53 | | | | 25.63 | | | | 3.40 | |
| | | | | | | |
OZ | | | 1 | | | | 193 | | | | 0.01 | | | | 50.00 | | | | 5.01 | | | | 6.47 | | | | 1.29 | |
OZ | | | 2 | | | | 57 | | | | 0.01 | | | | 50.00 | | | | 4.17 | | | | 9.66 | | | | 2.32 | |
| | | | |
| |
Barrick Gold Corporation – Porgera Joint Venture, Project #1669 Technical Report NI 43-101 – March 16, 2012 | | | Rev. 0 Page 14-36 | |
| | |
| | www.rpacan.com |
|
TABLE 14-23 CAPPED COMPOSITE STATISTICS—SULPHUR
Barrick Gold Corporation—Porgera JV
| | | | | | | | | | | | | | | | | | | | | | | | | | | | |
Zone | | Domain | | | Number | | | Minimum | | | Maximum | | | Mean | | | Std. Dev | | | CV | |
CNZ | | | 2 | | | | 13,399 | | | | 0.00 | | | | 20.00 | | | | 1.34 | | | | 1.53 | | | | 1.14 | |
CNZ | | | 3 | | | | 883 | | | | 0.00 | | | | 7.97 | | | | 0.72 | | | | 0.97 | | | | 1.34 | |
CNZ | | | 4 | | | | 1,290 | | | | 0.00 | | | | 10.00 | | | | 0.62 | | | | 1.07 | | | | 1.72 | |
CNZ | | | 5 | | | | 511 | | | | 0.05 | | | | 8.00 | | | | 0.77 | | | | 1.05 | | | | 1.36 | |
CNZ | | | 6 | | | | 74 | | | | 0.05 | | | | 2.84 | | | | 0.92 | | | | 0.76 | | | | 0.82 | |
CNZ | | | 7 | | | | 145 | | | | 0.00 | | | | 3.00 | | | | 0.52 | | | | 0.65 | | | | 1.25 | |
CNZ | | | 8 | | | | 583 | | | | 0.01 | | | | 20.00 | | | | 2.23 | | | | 3.26 | | | | 1.47 | |
CNZ | | | 9 | | | | 335 | | | | 0.00 | | | | 9.00 | | | | 1.13 | | | | 1.53 | | | | 1.36 | |
CNZ | | | 10 | | | | 27,836 | | | | 0.00 | | | | 20.00 | | | | 1.06 | | | | 1.44 | | | | 1.35 | |
CNZ | | | 11 | | | | 1,801 | | | | 0.00 | | | | 7.00 | | | | 0.75 | | | | 1.05 | | | | 1.40 | |
CNZ | | | 12 | | | | 107,517 | | | | 0.00 | | | | 18.00 | | | | 1.11 | | | | 1.49 | | | | 1.35 | |
CNZ | | | 13 | | | | 89,047 | | | | 0.00 | | | | 20.00 | | | | 0.93 | | | | 1.38 | | | | 1.48 | |
CNZ | | | 14 | | | | 812 | | | | 0.00 | | | | 8.00 | | | | 1.42 | | | | 1.28 | | | | 0.90 | |
| | | | | | | |
AHD | | | 2 | | | | 365 | | | | 0.05 | | | | 3.00 | | | | 1.08 | | | | 0.80 | | | | 0.75 | |
AHD | | | 3A | (31) | | | 292 | | | | 0.05 | | | | 3.00 | | | | 0.69 | | | | 0.69 | | | | 1.00 | |
AHD | | | 3B | (32) | | | 99 | | | | 0.05 | | | | 3.00 | | | | 0.90 | | | | 0.76 | | | | 0.85 | |
AHD | | | 4 | | | | 668 | | | | 0.05 | | | | 6.50 | | | | 1.41 | | | | 1.32 | | | | 0.93 | |
AHD | | | 6B | (6) | | | 149 | | | | 0.05 | | | | 4.00 | | | | 1.33 | | | | 0.90 | | | | 0.68 | |
| | | 15 | | | | 23,122 | | | | 0.01 | | | | 6.50 | | | | 0.61 | | | | 0.71 | | | | 1.16 | |
| | | | | | | |
EZ | | | 1 | | | | 2,928 | | | | 0.00 | | | | 13.00 | | | | 1.96 | | | | 1.94 | | | | 0.99 | |
EZ | | | 2 | | | | 3,124 | | | | 0.00 | | | | 10.00 | | | | 1.36 | | | | 1.47 | | | | 1.08 | |
EZ | | | 3 | | | | 657 | | | | 0.05 | | | | 10.00 | | | | 1.85 | | | | 1.61 | | | | 0.87 | |
EZ | | | 4 | | | | 8,220 | | | | 0.00 | | | | 9.00 | | | | 1.79 | | | | 1.47 | | | | 0.82 | |
EZ | | | 5 | | | | 1,182 | | | | 0.05 | | | | 10.00 | | | | 1.53 | | | | 1.58 | | | | 1.04 | |
EZ | | | 10 | | | | 27,578 | | | | 0.00 | | | | 17.00 | | | | 1.47 | | | | 1.65 | | | | 1.12 | |
| | | | | | | |
PX | | | 1 | | | | 1,486 | | | | 0.05 | | | | 12.00 | | | | 2.04 | | | | 2.05 | | | | 1.00 | |
PX | | | 2 | | | | 165 | | | | 0.14 | | | | 8.00 | | | | 1.81 | | | | 1.72 | | | | 0.95 | |
PX | | | 3 | | | | 1,259 | | | | 0.05 | | | | 11.00 | | | | 1.47 | | | | 1.39 | | | | 0.94 | |
| | | | | | | |
OZ | | | 1 | | | | 156 | | | | 0.11 | | | | 3.50 | | | | 1.58 | | | | 0.87 | | | | 0.55 | |
OZ | | | 2 | | | | 58 | | | | 0.10 | | | | 3.50 | | | | 1.19 | | | | 1.07 | | | | 0.90 | |
RPA notes that even after capping, the Coefficients of Variation (CV) for many of the gold domains are quite high. This indicates that the composite grade distributions are strongly skewed and that there is an increased risk of overestimation of grades in the block model interpolations.
| | | | |
| |
Barrick Gold Corporation – Porgera Joint Venture, Project #1669 Technical Report NI 43-101 – March 16, 2012 | | | Rev. 0 Page 14-37 | |
| | |
| | www.rpacan.com |
|
GEOSTATISTICS AND SEARCH PARAMETERS
Geostatistical analyses are carried out for both gold and sulphur in all domains. Omin-directional semi-variograms are generated to estimate nugget effects. Variogram maps and directional variograms are created in order to study anisotropy in grade continuity. This information is then used as a guide for development of search parameters for the OK and ID estimates and variograms models for the OK estimates.
The geostatistics for gold are carried out using in-house software, and for sulphur using Sage. Variography is not routinely redone for every estimate. If the database has not changed substantially between updates to the block models, then the variography is not redone.
RPA reviewed the variograms for all domains and notes that for many gold zones, the short-range portion of the variograms is quite steep, particularly for the CNZ and EZ. Often they were observed to achieve 80% of the sill co-variance within a range of two to five metres. This demonstrates that there is relatively poor gold grade correlation between samples, which will adversely affect the accuracy of local block grade estimates. This will tend to increase the degree of smoothing of block grades in the kriged interpolations and reduce the overall confidence level of individual block grade estimates. Classification of Mineral Resources could also be impacted, resulting in relatively more stringent constraints required for assignment of Measured and Indicated categories.
SEARCH PARAMETERS
Search parameters are developed in part from the geostatistical analyses discussed above. The orientation of the search ellipsoids are determined by the DAM utility. Strings are drawn along the approximate centre-line of the zones in plan and section views for each estimation domain. The strings are modified by adding additional points to them in order to ensure consistent coverage throughout each zone. Strikes and dips are then generated for each of the polyline points and stored as data for grade interpolation. The strikes and dips are then interpolated into a block model using ID2 and stored as inputs to the grade estimations. When the block grades are interpolated, the system queries each block for the orientation to assign to the search ellipsoid.
| | | | |
| |
Barrick Gold Corporation – Porgera Joint Venture, Project #1669 Technical Report NI 43-101 – March 16, 2012 | | | Rev. 0 Page 14-38 | |
| | |
| | www.rpacan.com |
|
The grade interpolations are run in a series of passes using a series of progressively larger search ellipsoids and more liberal composite selection criteria. The first pass is run using a search with radii equal to the variogram ranges at 80% to 90% of the sill. A fairly tight search radius of two metres is used perpendicular to the plane of the veins. For the second pass, the search is doubled in size and for the third pass the search is three times that for the first pass (3 1/2 times for the background domains). Composite selection constraints vary depending on the zone and the type of model (OK or ID).
CNZ
An ellipsoid search was used for both gold and sulphur. The first pass search ellipsoid measured 15 m by 15 m by 2 m, increasing by a factor of two and three for subsequent passes. For pass one and two, the limits on the number of composites were a minimum of two and maximum of five. For pass three, the minimum and maximum composite limits were one and three, respectively. Composites from at least two drill holes were required to create an estimate.
EZ
An ellipsoid search was also used for both gold and sulphur. The first pass search ellipsoid measured 15 m by 10 m by 2 m, increasing by a factor of two and three for subsequent passes. Minimum and maximum composites per estimate parameters were the same as for CNZ.
AHD
The first pass search ellipsoid measured 50 m by 50 m by 2 m, increasing by a factor of two and three for subsequent passes. For pass one and two, the limits on the number of composites were a minimum of two and maximum of five. For pass three, the minimum and maximum composite limits were one and three, respectively.
PX
An ellipsoid search with four passes was used for both gold and sulphur. For gold, the first pass search ellipsoids measured as follows:
Domain 1—50 m x 50 m x 21.7 m
Domain 2 – 40 m x 40 m x 17.4 m
Domain 3 – 50 m x 50 m x 25 m
| | | | |
| |
Barrick Gold Corporation – Porgera Joint Venture, Project #1669 Technical Report NI 43-101 – March 16, 2012 | | | Rev. 0 Page 14-39 | |
| | |
| | www.rpacan.com |
|
For sulphur, the first pass search radii were:
Domain 1 – 100 m x 50 m x 30 m
Domain 2 – 50 m x 50 m x 21.7 m
Domain 3 – 50 m x 50 m x 25 m
For pass one in all domains, the limits on the number of composites were set at a minimum of 12 and maximum of 24 with a maximum from any one drill hole of four. For passes two and three, the minimum per estimate was reduced to eight, and again to four for the last pass.
OZ
The first pass search was 20 m by 20 m by 2 m. An octant search was used with the same conditions as for CNZ. For pass one and two, the limits on the number of composites were a minimum of three and maximum of five. For the third pass the maximum number of composites was reduced to three. Composites from a minimum of two drill holes were required for a block estimate.
The parameter restricting the estimate to a minimum of two drill holes is a new constraint, being tested for the first time at Porgera JV. The effect of this constraint was to reduce number of blocks receiving estimates, and in so doing, reduce the global Mineral Resource estimate. In RPA’s opinion, the overall confidence level of the block estimates should also improve.
BLOCK MODELS
There are several block models generated in the course of preparing the Mineral Resource and Reserve estimates. They are sub-blocked models, with a fairly wide range of block dimensions. None of the models are rotated relative to the mine survey grid. The geometry of the block models are summarized in Table 14-24.
| | | | |
| |
Barrick Gold Corporation – Porgera Joint Venture, Project #1669 Technical Report NI 43-101 – March 16, 2012 | | | Rev. 0 Page 14-40 | |
| | |
| | www.rpacan.com |
|
TABLE 14-24 BLOCK MODEL GEOMETRIES
Barrick Gold Corporation—Porgera JV
| | | | | | | | | | | | | | | | | | |
Zone | | Origin | | Parent Block Size | | Extents |
| | X | | Y | | Z | | X | | Y | | Z | | Col | | Row | | Levels |
AHD | | 23350 | | 11120 | | 2420 | | 10 | | 1 | | 10 | | 36 | | 780 | | 80 |
CNZ | | 21900 | | 11140 | | 2440 | | 10 | | 1 | | 10 | | 64 | | 800 | | 94 |
EZ | | 22500 | | 11000 | | 2300 | | 10 | | 1 | | 10 | | 60 | | 900 | | 80 |
EDX | | n/a | | n/a | | n/a | | n/a | | n/a | | n/a | | n/a | | n/a | | n/a |
PX | | 22250 | | 10650 | | 2250 | | 6 | | 2 | | 4 | | 85 | | 200 | | 100 |
OZ | | 22200 | | 11000 | | 1800 | | 10 | | 1 | | 10 | | 80 | | 600 | | 30 |
The generalized process for constructing the block models is as follows:
| | 1) | Collect and validate the sample data. De-survey the samples (i.e. determine the XYZ coordinates of the samples). |
| | 2) | Update wireframe domain models including DAM, if applicable. |
| | 3) | Decluster samples and conduct statistics and geostatistics. Confirm top cuts. |
| | 4) | Decluster composites and conduct statistics and geostatistics. |
| | 5) | Develop and confirm estimation, kriging, and search parameters for gold, sulphur. |
| | 6) | Update digitized azimuth and dip strings for the Dynamic Anisotropy Modeling. Populate DAM block model with updated azimuth and dip values. |
| | 7) | Create and tag a sub-blocked (termed “split” model at Porgera JV) model for gold. Note that tagging refers to the assignment of domain codes to the blocks. |
| | 8) | Tag drill holes with lithology codes. |
| | 9) | Estimate litho codes into the block model for assignment of bulk density. |
| | 10) | Apply top cuts, create and tag the 1m composites. Tags include estimation domains for gold and sulphur. |
| | 11) | Create a split model for the DAM, and estimate strike and dip direction into the blocks using ID2. |
| | 12) | Estimate gold and sulphur in principal domains. |
| | 13) | Carry out the estimates for gold and silver in the background domains. |
| | 14) | Deplete the block model using wireframes for development and stopes. |
| | | | |
| |
Barrick Gold Corporation – Porgera Joint Venture, Project #1669 Technical Report NI 43-101 – March 16, 2012 | | | Rev. 0 Page 14-41 | |
| | |
| | www.rpacan.com |
|
| | 16) | Run Mineable Resource Optimizer (MRO) for confirmation of reasonable prospect of economic extraction. |
| | 17) | Send model to engineering for generation of stope shapes for reserves estimates. |
BLOCK MODEL VALIDATION
Validation techniques vary depending on the zone. More rigorous validation was carried out on the larger and more important zones, such as CNZ, AHD, and EZ. At present, most of the model grade estimates are validated by the following methods:
| | • | | Inspection in cross section and level plan views, and comparison to composite grades. |
| | • | | Comparison of composite and block means and frequency distributions for each domain. |
| | • | | Comparison with previous year’s model. |
In the PX model, which dates back to 2009, comparisons were generated between the kriged block estimates and a NN estimate. However, no comparisons were made, apparently, between the global composite and block grades nor between the 2009 model and any earlier ones (note: this may be because there was no earlier model). For the OZ model, the only validation technique applied appears to have been visual inspection.
COMMENTS ON VALIDATION RESULTS
Global weighted means for the blocks and composites were generated and compared for the CNZ, AHD and EZ. Table 14-25 shows the results of this comparison. In RPA’s opinion, there is generally good agreement between block and composite global averages. There appears to be a slight negative bias between the global block means and the composite means (ie the blocks average lower than the composites). This suggests that the block models are slightly conservative.
| | | | |
| |
Barrick Gold Corporation – Porgera Joint Venture, Project #1669 Technical Report NI 43-101 – March 16, 2012 | | | Rev. 0 Page 14-42 | |
| | |
| | www.rpacan.com |
|
TABLE 14-25 COMPARISON OF MEAN
COMPOSITE AND BLOCK GOLD GRADES
Barrick Gold Corporation—Porgera JV
| | | | | | | | | | | | | | |
Zone | | Domain | | Composites
(g/t Au) | | | Blocks
(g/t Au) | | | Pct Diff
(%) | |
CNZ | | All | | | 7.124 | | | | 6.233 | | | | -12.51 | % |
| | nz0511 | | | 8.901 | | | | 7.859 | | | | -11.71 | % |
| | cn608 | | | 3.801 | | | | 3.563 | | | | -6.26 | % |
| | south0511 | | | 3.762 | | | | 3.257 | | | | -13.42 | % |
| | cz0906 | | | 5.249 | | | | 4.79 | | | | -8.74 | % |
| | cn601 | | | 4.628 | | | | 3.329 | | | | -28.07 | % |
| | cn602 | | | 2.523 | | | | 2.709 | | | | 7.37 | % |
| | cn603 | | | 2.804 | | | | 2.663 | | | | -5.03 | % |
| | cn604 | | | 3.814 | | | | 3.689 | | | | -3.28 | % |
| | cn605 | | | 1.013 | | | | 1.037 | | | | 2.37 | % |
| | cn606 | | | 2.746 | | | | 2.566 | | | | -6.55 | % |
| | cn607 | | | 2.589 | | | | 2.421 | | | | -6.49 | % |
AHD | | All | | | 7.148 | | | | 6.951 | | | | -2.76 | % |
| | 2 | | | 3.991 | | | | 4.221 | | | | 5.76 | % |
| | 3a | | | 5.208 | | | | 4.548 | | | | -12.67 | % |
| | 3b | | | 6.516 | | | | 5.539 | | | | -14.99 | % |
| | 4 | | | 9.939 | | | | 9.414 | | | | -5.28 | % |
| | 6 | | | 6.220 | | | | 7.265 | | | | 16.80 | % |
EZ | | All | | | 5.514 | | | | 5.774 | | | | 4.72 | % |
| | 1 | | | 3.861 | | | | 3.783 | | | | -2.02 | % |
| | 2 | | | 5.089 | | | | 5.176 | | | | 1.71 | % |
| | 3 | | | 5.970 | | | | 6.727 | | | | 12.68 | % |
| | 4 | | | 6.492 | | | | 6.833 | | | | 5.25 | % |
| | 5 | | | 3.785 | | | | 4.203 | | | | 11.04 | % |
Means and cumulative metal contents are also calculated for the composites and blocks at cut-offs of 0.5 g/t Au, 1.0 g/t Au, 3.0 g/t Au, and 5.0 g/t Au. Histograms and cumulative frequency diagrams are generated to compare the grade distributions. An example of this comparison is provided in Figure 14-5. This diagram shows the block and composite histograms and cumulative frequency diagrams for the CNZ domain nz0511, and is a fairly typical example. Grade smoothing is demonstrated by a drawing-in of the ends of the histogram for the blocks relative to that for the composites. The block grade histogram appears more uniform and more closely resembles the classical “bell curve” than the composite distribution. This is an expected result, and is typical of many block models.
| | | | |
| |
Barrick Gold Corporation – Porgera Joint Venture, Project #1669 Technical Report NI 43-101 – March 16, 2012 | | | Rev. 0 Page 14-43 | |
| | |
| | www.rpacan.com |
|
The histogram comparison was done for all domains in CNZ, AHD, and EZ. RPA reviewed these diagrams and the statistical comparisons at the various cut-off grades. All the histograms demonstrate that there appears to have been some grade smoothing. The mean grades for the composites and blocks at the different cut-offs generally showed very good agreement except for the highest cut-off (5.0 g/t Au). The mean block grades for the 5.0 g/t Au cut-off were routinely lower than the composite means. In RPA’s opinion, this may indicate that there is some conservativeness in the block grade estimates.
| | | | |
| |
Barrick Gold Corporation – Porgera Joint Venture, Project #1669 Technical Report NI 43-101 – March 16, 2012 | | | Rev. 0 Page 14-44 | |
| | |
| | www.rpacan.com |
|
FIGURE 14-5 EXAMPLE HISTOGRAM COMPARISON OF BLOCKS VS
COMPOSITES
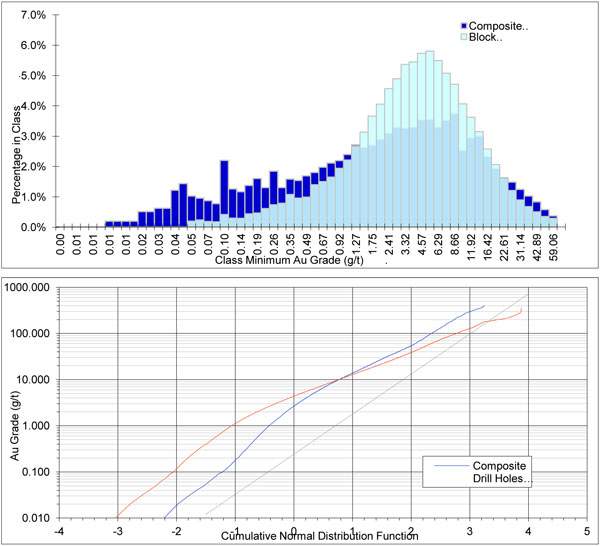
The EOY2011 block model results for CNZ, AHD, and EZ were compared with the results from the previous models. These comparisons are prepared in much the same way as what was done for the block/composite checks. The global weighted average mean grades are calculated for each domain at cut-offs of 0.0 g/t Au, 0.5 g/t Au, 1.0 g/t Au, 3.0 g/t Au and 5.0 g/t Au. Histograms and cumulative frequency diagrams for each model are overlayed on one another to provide a graphical means of comparison. An example of these diagrams is provided in Figure 14-6.
| | | | |
| |
Barrick Gold Corporation – Porgera Joint Venture, Project #1669 Technical Report NI 43-101 – March 16, 2012 | | | Rev. 0 Page 14-45 | |
| | |
| | www.rpacan.com |
|
FIGURE 14-6 EXAMPLE HISTOGRAM COMPARISON OF EOY2011 VS MID-
YEAR 2011
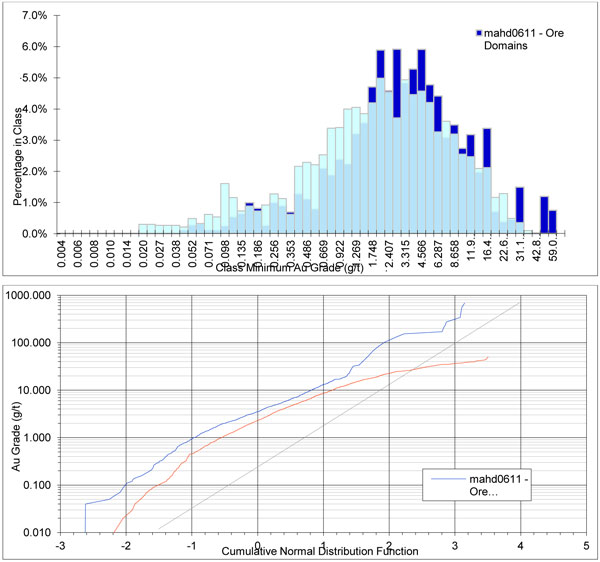
Figure 14-4 depicts a comparison between block models for AHD domain 2a. In this case, the EOY2011 model results are significantly lower in average grade than the previous model. Overall, RPA notes that similar differences were seen for all AHD domains. There has been a significant reduction in average grades at all cut-offs.
Table 14-26 shows a comparison, at a 1.0 g/t Au cut-off, between the EOY2011 and previous block models for the CNZ, AHD, and EZ domains. Note that these are unclassified block model results that are not Mineral Resources and may not reflect actual variations in the Mineral Resources.
| | | | |
| |
Barrick Gold Corporation – Porgera Joint Venture, Project #1669 Technical Report NI 43-101 – March 16, 2012 | | | Rev. 0 Page 14-46 | |
| | |
| | www.rpacan.com |
|
RPA notes that there were significant changes to several individual domains. These changes are generally due to modifications to the model based on new drilling information as well as changes to the estimation parameters. Overall, the CNZ and EZ did not change much in terms of tonnes, grade or total ounces. The AHD shows a significant increase in tonnes, but this is offset by a large drop in grade, resulting in a modest reduction in total ounces.
| | | | |
| |
Barrick Gold Corporation – Porgera Joint Venture, Project #1669 Technical Report NI 43-101 – March 16, 2012 | | | Rev. 0 Page 14-47 | |
| | |
| | www.rpacan.com |
|
TABLE 14-26 COMPARISON OF EOY2011 AND PREVIOUS BLOCK MODEL RESULTS (1.0 G/T AU CUT-OFF)
Barrick Gold Corporation - Porgera JV
| | | | | | | | | | | | | | | | | | | | | | | | | | | | | | | | | | | | | | | | | | | | | | | | | | |
| | | | | YE2011 | | | Previous Model | | | Differences | |
Zone | | Domain | | Tonnage
(t) | | | Grade
(g/t Au) | | | Ounce
(oz) | | | Tonnage
(t) | | | Grade
(g/t Au) | | | Ounce
(oz) | | | Tonnes
Diff
(t) | | | Tonnes
Diff
(%) | | | Grade
Diff
(g/t Au) | | | Grade
Diff
(%) | | | Ounce
Diff
(oz) | | | Ounce
Diff
(%) | |
CNZ | | nz0511 | | | 8,748,547 | | | | 9.09 | | | | 2,556,706 | | | | 9,488,141 | | | | 8.14 | | | | 2,483,056 | | | | -739,594 | | | | -7.8 | | | | 0.95 | | | | 11.7 | | | | 73,650 | | | | 3.0 | |
| | cn608 | | | 461,401 | | | | 5.47 | | | | 81,142 | | | | 540,398 | | | | 4.47 | | | | 77,661 | | | | -78,997 | | | | -14.6 | | | | 1.00 | | | | 22.4 | | | | 3,481 | | | | 4.5 | |
| | south0511 | | | 254,501 | | | | 6.50 | | | | 53,184 | | | | 481,828 | | | | 6.43 | | | | 99,606 | | | | -227,328 | | | | -47.2 | | | | 0.07 | | | | 1.1 | | | | -46,421 | | | | -46.6 | |
| | cz0906 | | | 4,170,926 | | | | 5.97 | | | | 800,549 | | | | 4,568,480 | | | | 5.39 | | | | 791,665 | | | | -397,553 | | | | -8.7 | | | | 0.58 | | | | 10.8 | | | | 8,884 | | | | 1.1 | |
| | cn601 | | | 189,365 | | | | 4.91 | | | | 29,892 | | | | 228,399 | | | | 3.93 | | | | 28,858 | | | | -39,034 | | | | -17.1 | | | | 0.98 | | | | 24.9 | | | | 1,034 | | | | 3.6 | |
| | cn602 | | | 358,434 | | | | 3.86 | | | | 44,481 | | | | 402,114 | | | | 3.48 | | | | 44,989 | | | | -43,680 | | | | -10.9 | | | | 0.38 | | | | 10.9 | | | | -508 | | | | -1.1 | |
| | cn603 | | | 100,890 | | | | 4.83 | | | | 15,667 | | | | 134,901 | | | | 3.99 | | | | 17,305 | | | | -34,011 | | | | -25.2 | | | | 0.84 | | | | 21.1 | | | | -1,638 | | | | -9.5 | |
| | cn604 | | | 69,440 | | | | 5.95 | | | | 13,283 | | | | 83,346 | | | | 4.35 | | | | 11,656 | | | | -13,906 | | | | -16.7 | | | | 1.60 | | | | 36.8 | | | | 1,627 | | | | 14.0 | |
| | cn605 | | | 24,951 | | | | 2.25 | | | | 1,805 | | | | 30,922 | | | | 1.62 | | | | 1,611 | | | | -5,971 | | | | -19.3 | | | | 0.63 | | | | 38.9 | | | | 194 | | | | 12.1 | |
| | cn606 | | | 104,543 | | | | 3.59 | | | | 12,066 | | | | 113,465 | | | | 3.33 | | | | 12,148 | | | | -8,922 | | | | -7.9 | | | | 0.26 | | | | 7.8 | | | | -81 | | | | -0.7 | |
| | All | | | 14,576,930 | | | | 7.73 | | | | 3,622,651 | | | | 16,180,060 | | | | 6.88 | | | | 3,578,900 | | | | -1,603,130 | | | | -9.9 | | | | 0.85 | | | | 12.4 | | | | 43,751 | | | | 1.2 | |
| | | | | | | | | | | | | |
AHD | | 2 | | | 669,581 | | | | 5.45 | | | | 117,322 | | | | 551,301 | | | | 6.27 | | | | 111,132 | | | | 118,280 | | | | 21.5 | | | | -0.82 | | | | -13.1 | | | | 6,191 | | | | 5.6 | |
| | 3a | | | 373,161 | | | | 6.16 | | | | 73,902 | | | | 352,572 | | | | 14.48 | | | | 164,133 | | | | 20,589 | | | | 5.8 | | | | -8.32 | | | | -57.5 | | | | -90,231 | | | | -55.0 | |
| | 3b | | | 218,645 | | | | 6.80 | | | | 47,800 | | | | 191,868 | | | | 17.99 | | | | 110,973 | | | | 26,776 | | | | 14.0 | | | | -11.19 | | | | -62.2 | | | | -63,172 | | | | -56.9 | |
| | 4 | | | 1,252,001 | | | | 11.38 | | | | 458,066 | | | | 1,006,202 | | | | 14.60 | | | | 472,301 | | | | 245,799 | | | | 24.4 | | | | -3.22 | | | | -22.1 | | | | -14,235 | | | | -3.0 | |
| | 6 | | | 835,306 | | | | 8.08 | | | | 216,989 | | | | 437,246 | | | | 14.70 | | | | 206,645 | | | | 398,060 | | | | 91.0 | | | | -6.62 | | | | -45.0 | | | | 10,345 | | | | 5.0 | |
| | All | | | 3,348,694 | | | | 8.49 | | | | 914,038 | | | | 2,539,189 | | | | 13.05 | | | | 1,065,336 | | | | 809,505 | | | | 31.9 | | | | -4.56 | | | | -34.9 | | | | -151,298 | | | | -14.2 | |
| | | | | | | | | | | | | |
EZ | | 1 | | | 748,296 | | | | 5.30 | | | | 127,506 | | | | 640,584 | | | | 5.79 | | | | 119,244 | | | | 107,713 | | | | 16.8 | | | | -0.49 | | | | -8.5 | | | | 8,262 | | | | 6.9 | |
| | 2 | | | 840,373 | | | | 7.99 | | | | 215,874 | | | | 4,285,651 | | | | 8.20 | | | | 1,129,826 | | | | -3,445,278 | | | | -80.4 | | | | -0.21 | | | | -2.6 | | | | -913,953 | | | | -80.9 | |
| | 3 | | | 335,597 | | | | 8.29 | | | | 89,444 | | | | 346,493 | | | | 8.86 | | | | 98,698 | | | | -10,897 | | | | -3.1 | | | | -0.57 | | | | -6.4 | | | | -9,254 | | | | -9.4 | |
| | 4 | | | 4,036,364 | | | | 8.22 | | | | 1,066,702 | | | | 935,089 | | | | 7.39 | | | | 222,166 | | | | 3,101,275 | | | | 331.7 | | | | 0.83 | | | | 11.2 | | | | 844,536 | | | | 380.1 | |
| | 5 | | | 532,147 | | | | 6.47 | | | | 110,692 | | | | 844,066 | | | | 5.27 | | | | 143,011 | | | | -311,919 | | | | -37.0 | | | | 1.20 | | | | 22.8 | | | | -32,318 | | | | -22.6 | |
| | All | | | 6,492,912 | | | | 7.71 | | | | 1,609,440 | | | | 7,051,948 | | | | 7.56 | | | | 1,714,004 | | | | -559,036 | | | | -7.9 | | | | 0.15 | | | | 2.0 | | | | -104,564 | | | | -6.1 | |
| | | | | | | | | | | | | | | | | | | | | | | | | | | | | | | | | | | | | | | | | | | | | | | | | | |
Notes:
| 1. | Tonnage and grade totals are unclassified global block model results at a cut-off grade that is well below that used for the underground mine. They are not Mineral Resource estimates. |
| | | | |
| |
Barrick Gold Corporation – Porgera Joint Venture, Project #1669 Technical Report NI 43-101 – March 16, 2012 | | | Rev. 0 Page 14-48 | |
| | |
| | www.rpacan.com |
|
CLASSIFICATION
Mineral Resources are classified as Measured, Indicated or Inferred, according to the confidence level of the estimate. This is consistent with the requirements of NI43-101. The principal criterion for assignment of the classification is distance from the nearest samples or development. The Measured category is assigned to blocks within 10 m of development. For Indicated and Inferred, the classification is assigned using search ellipsoids. The Inferred search is roughly double the size of the Indicated search. The ranges for these ellipsoids are determined with the help of geostatistics. Table 14-27 shows the sizes for the search ellipsoids used for classification.
TABLE 14-27 INDICATED AND INFERRED CLASSIFICATION
SEARCH DISTANCES
Barrick Gold Corporation—Porgera JV
| | | | |
Zone | | Indicated | | Inferred |
CNZ | | 15 x 15 x 2 | | 30 x 30 x 4 |
AHD | | 14 x 13 x 2 | | 35 x 35 x 4 |
EZ | | 15 x 10 x 2 | | 30 x 20 x 4 |
PX | | 50 x 50 x 22 | | 180 x 180 x 90 |
OZ | | 20 x 20 x 2 | | 40 x 40 x 4 |
In RPA’s opinion, the search radii used for PX is significantly larger than for the other zones, which implies that the resource classification is too aggressive for this zone. RPA recommends reviewing the classification parameters for PX and, if warranted, revising them so that they are more in line with the rest of the underground mine. In RPA’s opinion, this is not a critical issue with respect to the Mineral Reserves estimate because PX is not included in the Mineral Reserve estimate yet. However, the PX zone is a significant component of the Mineral Resources and this issue should be resolved for the next resource estimate.
MINEABLE RESOURCE OPTIMIZER
Following preliminary classification the block models are passed through the Mineable Resource Optimizer (MRO), which helps to define coherent bodies of mineralization that would meet a certain minimum criterion for development. The MRO agglomerates contiguous blocks of material that is above the cut-off grade. Masses of agglomerated
| | | | |
| |
Barrick Gold Corporation – Porgera Joint Venture, Project #1669 Technical Report NI 43-101 – March 16, 2012 | | | Rev. 0 Page 14-49 | |
| | |
| | www.rpacan.com |
|
blocks that are above the threshold for “mineability” (500 t) are included in the Mineral Resources. Small isolated clusters of blocks below that threshold are rejected. This optimization is analogous to the pit shell test applied to the open pit resources and serves to demonstrate “reasonable prospects for economic extraction” as proscribed by the CIM definition of Mineral Resources. In RPA’s opinion, the application of the MRO is a reasonable approach.
For the EOY2011 estimate, the MRO was not run for AHD or OZ due to issues with preparing the parameter files for the optimizer. In RPA’s opinion, this likely means that the tonnages reported for these two zones is higher than it should be. RPA recommends that the problems with the MRO be resolved for the next resource estimate.
CUT-OFF GRADE
The cut-off grade used for the underground mine resource estimate was 3.0 g/t Au, which is consistent with Barrick’s Reserve and Reporting Guidelines. This cut-off was derived using a gold price of $1,400/oz. In RPA’s opinion the cut-off grade for the Porgera JV open pit mine is reasonable.
| | | | |
| |
Barrick Gold Corporation – Porgera Joint Venture, Project #1669 Technical Report NI 43-101 – March 16, 2012 | | | Rev. 0 Page 14-50 | |
| | |
| | www.rpacan.com |
|
15 MINERAL RESERVE ESTIMATE
SUMMARY
The Mineral Reserves for Porgera JV Mine as of December 31, 2011 are summarized in Table 15-1. These represent 100% of the Mineral Reserves, and not the 95% attributable to Barrick.
TABLE 15-1 MINERAL RESERVE ESTIMATE (100%) – DECEMBER 31, 2011
Barrick Gold Corporation – Porgera JV
| | | | | | | | | | | | |
Category | | Tonnes
(000) | | | Grade
(g/t Au) | | | Contained
Gold
(000 oz) | |
Open Pit | | | | | | | | | | | | |
Proven | | | 13,944 | | | | 3.00 | | | | 1,343 | |
Probable | | | 31,105 | | | | 2.11 | | | | 2,115 | |
Subtotal | | | 45,049 | | | | 2.39 | | | | 3,458 | |
| | | |
Underground | | | | | | | | | | | | |
Proven | | | 3,500 | | | | 7.17 | | | | 807 | |
Probable | | | 3,624 | | | | 7.56 | | | | 880 | |
Subtotal | | | 7,124 | | | | 7.37 | | | | 1,687 | |
| | | |
Stockpiles | | | | | | | | | | | | |
Proven | | | — | | | | — | | | | — | |
Probable | | | 19,802 | | | | 2.29 | | | | 1,455 | |
Subtotal | | | 19,802 | | | | 2.29 | | | | 1,455 | |
| | | |
Process Inventory | | | — | | | | — | | | | 102 | |
| | | |
Total Proven | | | 17,443 | | | | 3.83 | | | | 2,149 | |
Total Probable | | | 54,532 | | | | 2.60 | | | | 4,552 | |
| | | | | | | | | | | | |
Total Mineral Reserve | | | 71,975 | | | | 2.90 | | | | 6,701 | |
| | | | | | | | | | | | |
Notes:
| | 1. | CIM definitions were followed for Mineral Reserves. |
| | 2. | Open Pit Mineral Reserves are estimated at a breakeven cut-off grades range from 0.95 g/t Au to 1.29 g/t Au (nominal). |
| | 3. | Underground Mineral Reserves are estimated at a cut-off grade of 3.5 g/t Au. |
| | 4. | Open Pit Mineral Reserves are estimated using an average long-term gold price of US$1,200 per ounce, a US$:C$ exchange rate of 1:1, and a US$:AUS$ exchange rate of 0.9:1. |
| | 5. | A minimum mining open pit width of 25 m was used. |
| | 6. | Bulk densities range from 2.64 t/m3 to 2.79 t/m3, depending on lithology. |
| | 7. | Numbers may not add due to rounding. |
| | 8. | Mineral Reserves do not include Mineral Resources, i.e. Mineral Reserves are exclusive of Mineral Resources. |
| | | | |
| |
Barrick Gold Corporation – Porgera Joint Venture, Project #1669 Technical Report NI 43-101 – March 16, 2012 | | | Rev. 0 Page 15-1 | |
| | |
| | www.rpacan.com |
|
Mineral Reserves have been based on only Measured and Indicated Resources. The Mineral Reserves are exclusive of Mineral Resources, i.e. Mineral Reserves are not included in the Mineral Resources.
Dilution in the reserves for the open pit is estimated to be zero. Dilution from the underground has been estimated to be 10% to 15%, but it can be higher.
Open pit mining recovery has been estimated to be 100%. Underground mining recovery for tonnage averages from 85% to 90%.
OPEN PIT
The open pit mine planning and design is based on a block model built by using MIK interpolation techniques from the exploration drill hole sample data. This model has been proven to be a fair representation of actual production, and it was used for pit optimization and mine design.
The design process consists of three major steps:
| | (1) | finding the block extraction sequence, which produces the best net present value (NPV) while satisfying the geotechnical slope constraints, |
| | (2) | designing the practically minable mine phases (pushbacks) that are based on the optimal block sequence, and |
| | (3) | performing a pit optimization for the mining schedule and cut-off grade. |
The analysis for the open pit reserves was done through the use of commercially-sold software called Whittle®. Whittle® performs the pit optimization, and provides the mine planning engineer approximate pit boundaries at given gold prices. The mine planning engineer then develops the best ultimate design and pit phases for the mine production schedule. The mine planning engineer at Porgera JV uses another commercial program called PolyPlan® to develop the mine production schedule. Table 15-2 summarizes the key open pit inputs for the Whittle® analysis.
| | | | |
| |
Barrick Gold Corporation – Porgera Joint Venture, Project #1669 Technical Report NI 43-101 – March 16, 2012 | | | Rev. 0 Page 15-2 | |
| | |
| | www.rpacan.com |
|
TABLE 15-2 WHITTLE PIT OPTIMIZATION PARAMETERS
Barrick Gold Corporation – Porgera JV
| | |
Block Dimensions | | 30 m x 30 m x 20 m |
Origin Coordinates | | 20690,10200,1600 |
Number of Columns, Rows, Levels | | 106, 75, 58 |
Mining Cost Adjustment Factor Formula (Varies by Cut-off Grade and Level) | | IF (Bench Level<40, ((40-Bench Level) * 0.06)+2.32,2.32) |
| |
Slope Templates (Inter-ramp angles, degrees) | | |
Ten Sectors (From Piteau) | | 24,34,38,44,44,47,49,46,48,26 degrees, respectively |
Reference Level for Cost Adjustment Factors | | 2420L |
Gold Price | | US$1,200/oz |
| |
Whittle Shell Selected | | $575 Pit (Shell 39) |
Based on the results of the Whittle® optimization and geotechnical studies, the mine engineering team designed the final pit with haul ramps and appropriate catch benches. Haul ramps were designed to be 35 m wide, including the safety berm for double lane traffic accommodating the 175 tonnes class haul trucks, and have a maximum grade of 10%. Mining thickness is 10 m in ore and waste, and the bench height is 30 m. Double and triple benching is utilized creating 20 m and 30 m faces between catch benches. Barrick optimizes mining by using a multi-phased approach which maximizes stripping rates to keep an ore producing face always available. This multi-phase technique consists of a primary ore layback, a primary stripping layback, and a secondary stripping layback. Historically, this approach was put in place to maintain a consistent mill feed, and keep mine production in the range of 3 to 12 benches per layback per year. Table 15-3 summarizes the mine design parameters.
It should be noted that the Whittle® optimization was constrained in areas around the primary crusher, the existing Project infrastructure and the new underground backfill plant.
The pit design is based on 10 m benches, also known as lifts. Slopes vary based on location. Figure 15-1 illustrates the ultimate pit outline.
| | | | |
| |
Barrick Gold Corporation – Porgera Joint Venture, Project #1669 Technical Report NI 43-101 – March 16, 2012 | | | Rev. 0 Page 15-3 | |
| | |
| | www.rpacan.com |
|
TABLE 15-3 MINE DESIGN PARAMETERS
Barrick Gold Corporation—Porgera JV
| | | | |
Haul Road Width | | | 35 m | |
Haul Road Grade | | | 10 | % |
Mining Bench Height—Waste | | | 10 m | |
Mining Bench Height—Ore | | | 10 m | |
Minimum Operating Width | | | 75 m | |
Design Operating Width | | | 150 m | |
Current Pit Bottom Elevation | | | 2,130 masl | |
Final Pit Bottom Elevation | | | 2,030 masl | |
Overall Pit Length | | | 1,583 m | |
Overall Pit Width | | | 1,030 m | |
| | | | |
| |
Barrick Gold Corporation – Porgera Joint Venture, Project #1669 Technical Report NI 43-101 – March 16, 2012 | | | Rev. 0 Page 15-4 | |
| | |
| | www.rpacan.com |
FIGURE 15-1 OPEN PIT MINE – ULTIMATE PIT (STAGE 5E)
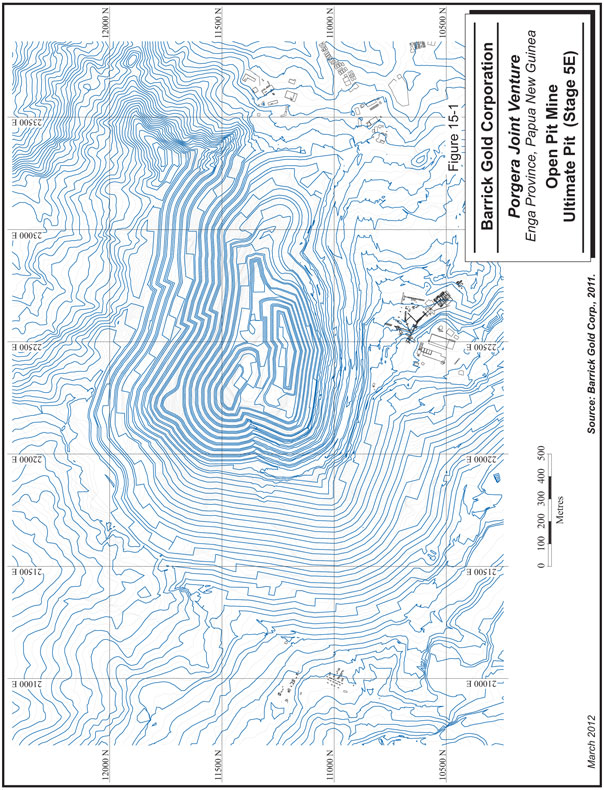
| | | | |
| |
Barrick Gold Corporation – Porgera Joint Venture, Project #1669 Technical Report NI 43-101 – March 16, 2012 | | | Rev. 0 Page 15-5 | |
| | |
| | www.rpacan.com |
|
UNDERGROUND MINE DESIGN
The Porgera JV underground development headings have been defined by the ground control conditions and equipment dimensions. A summary of the heading dimensions used at Porgera JV is listed in Table 15-4.
TABLE 15-4 SUMMARY OF DEVELOPMENT HEADING DIMENSIONS
Barrick Gold Corporation—Porgera JV
| | | | | | | | | | | | |
Development Type | | Standard Dimension | | | Profile | |
| | Width
(m) | | | Height
(m) | | |
Jumbo Development | |
Decline/Incline | | | 4.5 | | | | 5.0 | | | | Square | |
Level Development - Waste | | | 4.0 - 4.5 | | | | 4.0 - 5.0 | | | | Square | |
Level Development - Ore | | | 5.0 | | | | 5.0 | | | | Square | |
Vertical Development - Longhole | |
Stope Slot | | | 4.0 | | | | 4.0 | | | | Square | |
Fresh Air Raise | | | 4.0 | | | | 4.0 | | | | Square | |
Return Air Raise | | | 4.5 | | | | 4.5 | | | | Square | |
Vertical Development - Raise Bore | |
Ladderway | | | 1.5 | | | | | | | | Circular | |
Drainage | | | 1.0 | | | | | | | | Circular | |
Longhole Raise Reamer | | | 1.0 | | | | | | | | Circular | |
Pass (Haulage, Fill) | | | 1.5 | | | | | | | | Circular | |
The underground resource model block dimensions are 6 m by 1 m by 6 m, and the grade control block model cell dimensions are 3 m by 1 m by 2 m. It should be noted that Porgera JV’s grade control block model is a tool for the design of underground stopes and development headings. It can be stated that there is no single vein structure for the underground mineralization; mineralization occurs in a series of complex breccias and veins. Local variations of the grade occur due to the inherently high nugget effect, which occurs at the Porgera JV mine. Underground exploration drill spacing greater than 20 m by 20 m require additional drilling and sampling before an underground area is released for development and grade control.
The underground ore zones are first defined as ‘Project Areas’; with the primary Projects as the North Zone, East Zone, and AHD Zone. The Project Areas are then subdivided into Levels; such as the 1845 or 1920 with a corresponding centroid. Each ore body is finally assigned a number. An example of a typical numbering scheme for a Porgera JV
| | | | |
| |
Barrick Gold Corporation – Porgera Joint Venture, Project #1669 Technical Report NI 43-101 – March 16, 2012 | | | Rev. 0 Page 15-6 | |
| | |
| | www.rpacan.com |
|
underground stope would be NZ1845.2500.4, which represents the North Zone – 1845 Level – 2500 Centroid—#4 ore body. The North Zone is composed of the 1, 2, 4 and 6 ore bodies, the East Zone currently has defined the 2, 3, 4, 5, 6 ore bodies and the AHD Zone has defined ore bodies 2, 3, 4, 5, and 6.
Moisture content used in the underground mine design is approximately 2.1%. Underground mining recovery is reported to be 93%, which represents a good mining recovery. Planned dilution varies from 10% to 15%, but actual dilution is higher. All stopes are assigned a 10% hanging wall dilution due to the historical geomechanical properties experienced. Mintec’s Minesight software is used to design the development and stopes and Mine 24-D software is used for stope planning and scheduling.
A thorough geotechnical review is performed for every stope. A minimum dip of 45 degrees is required for all underground veins mining at Porgera JV. Minimum strike lengths for stope layout range from 25 m to 30 m. Stopes are laid out based on modeled grades that are color-coded in the block model. A series of five-meter slices are completed for each stope. Vein thicknesses vary for the three primary Project areas:
Resource classification is honoured during the stope design process; with Measured represented by 1, Indicated by 2 and Inferred represented by 3.
An underground cut-off grade of 3.5 g/t Au was used to define the stopes. Inputs to this cut-off grade are shown in the Table 15-5. The calculated cut-off grade is only 2.66 g/t Au, however, the higher cut-off was selected based on historical operating costs realized. RPA recommends that a lower cut-off grade be used because of the recent (2010 to 2012) gold prices.
| | | | |
| |
Barrick Gold Corporation – Porgera Joint Venture, Project #1669 Technical Report NI 43-101 – March 16, 2012 | | | Rev. 0 Page 15-7 | |
| | |
| | www.rpacan.com |
|
TABLE 15-5 SUMMARY OF UNDERGROUND CUT-OFF GRADE INPUTS
Barrick Gold Corporation—Porgera JV
| | | | | | | | |
DESCRIPTION | | VALUE | | | UNITS | |
Estimated Costs | | | | | | | | |
Mining Cost | | | $46.78 | | | | US$/tonne -milled | |
Process Cost | | | $12.75 | | | | US$/tonne -milled | |
G&A Cost | | | 17.61 | | | | US$/tonne -milled | |
| | | | | | | | |
Total Estimated Cost | | | $77.14 | | | | US$/tonne -milled | |
| | |
Metallurgical Recovery | | | 92 | % | | | Percent | |
Gold Price | | | $1,000 | | | | US$/oz | |
Royalty | | | 2 | % | | | Percent | |
Revenue Factor | | | $31.54 | | | | US$/gram | |
| | |
Calculated Reserve Cut-off Grade | | | 2.66 | | | | g/t Au | |
Historically at Porgera JV, most of the underground mining was performed in the North Zone, mining of the East Zone started in September 2011, and it is planned to mine the AHD Zone in the future. Future challenges to the underground design and mining will be the shallow-dipping ore bodies in the East and AHD Zones (less than 45 degrees), black sediments (poor rock mass ratings), and dilution.
MODEL RECONCILIATION
The model reconciliation for the past five years is summarized in Table 15-6. In summary, the declared ore ounces that are mined for the entire project, underground mining and open pit mining are 7% higher, 24% higher and 8% lower, respectively.
| | | | |
| |
Barrick Gold Corporation – Porgera Joint Venture, Project #1669 Technical Report NI 43-101 – March 16, 2012 | | | Rev. 0 Page 15-8 | |
| | |
| | www.rpacan.com |
|
TABLE 15-6 MINED ORE RECONCILIATION RESULTS – DECEMBER 31, 2011
Barrick Gold Corporation – Porgera JV
| | | | | | | | | | | | | | | | | | | | | | | | | | | | | | | | | | | | | | |
Porgera Mine Totals | |
| | | Overall Mine Declared Ore
Mined | | | Overall Mine Grade Control | | | Overall Mine Ore Reserve | |
| | | Tonnes
(000) | | | Gold
(000 oz) | | | Au Grade
(g/t) | | | Tonnes
(000 oz) | | | Gold
(000 oz) | | | Au
Grade
(g/t) | | | Tonnes
(000) | | | Gold
(000 oz) | | Au
Grade
(g/t) | |
2007 | | | 5,802 | | | | 691 | | | | 3.70 | | | | 5,312 | | | | 703 | | | | 4.12 | | | | 4,708 | | | | 586 | | | 3.87 | |
2008 | | | 6,201 | | | | 752 | | | | 3.77 | | | | 5,977 | | | | 788 | | | | 4.10 | | | | 6,922 | | | | 845 | | | 3.80 | |
2009 | | | 5,452 | | | | 636 | | | | 3.63 | | | | 5,063 | | | | 623 | | | | 3.83 | | | | 4,447 | | | | 502 | | | 3.51 | |
2010 | | | 3,152 | | | | 437 | | | | 4.31 | | | | 3,165 | | | | 489 | | | | 4.81 | | | | 3,250 | | | | 447 | | | 4.28 | |
2011 | | | 3,900 | | | | 489 | | | | 3.90 | | | | 3,221 | | | | 459 | | | | 4.44 | | | | 3,161 | | | | 418 | | | 4.11 | |
Five Year | | | 24,507 | | | | 3,005 | | | | 3.94 | | | | 22,738 | | | | 3,062 | | | | 4.33 | | | | 22,488 | | | | 2,799 | | | 4.00 | |
| | | | | | | | | | | | | | | | | | | | | | | | | | | | | | | | | | | | | | |
|
Underground Mining | |
| | | Underground Mine DOM | | | Underground Mine GC | | | Underground Mine OR | |
| | | Tonnes
(000) | | | Gold
(000 oz) | | | Au Grade
(g/t) | | | Tonnes
(000) | | | Gold
(000 oz) | | | Au
Grade
(g/t) | | | Tonnes
(000) | | | Gold
(000 oz) | | | Au
Grade
(g/t) | |
2007 | | | — | | | | — | | | | — | | | | — | | | | — | | | | — | | | | 682 | | | | 58 | | | 2.65 | |
2008 | | | 784 | | | | 221 | | | | 8.78 | | | | 786 | | | | 233 | | | | 9.24 | | | | 535 | | | | 164 | | | 9.56 | |
2009 | | | 689 | | | | 196 | | | | 8.83 | | | | 571 | | | | 176 | | | | 9.58 | | | | 350 | | | | 102 | | | 9.03 | |
2010 | | | 733 | | | | 213 | | | | 9.06 | | | | 665 | | | | 204 | | | | 9.56 | | | | 542 | | | | 169 | | | 9.68 | |
2011 | | | 935 | | | | 219 | | | | 7.29 | | | | 816 | | | | 220 | | | | 8.40 | | | | 697 | | | | 192 | | | 8.56 | |
Five Year | | | 3,141 | | | | 850 | | | | 8.69 | | | | 2,837 | | | | 834 | | | | 9.45 | | | | 2,123 | | | | 626 | | | 9.49 | |
| | | | | | | | | | | | | | | | | | | | | | | | | | | | | | | | | | | | | | |
|
Open Pit Mining | |
| | | Open Pit Mine DOM | | | Open Pit Mine GC | | | Open Pit Mine OR | |
| | | Tonnes
(000) | | | Gold
(000 oz) | | | Au Grade
(g/t) | | | Tonnes
(000) | | | Gold
(000 oz) | | | Au
Grade
(g/t) | | | Tonnes
(000) | | | Gold
(000 oz) | | | Au
Grade
(g/t) | |
2007 | | | — | | | | — | | | | — | | | | — | | | | — | | | | — | | | | 4,805 | | | | 528 | | | 3.42 | |
2008 | | | 5,417 | | | | 530 | | | | 3.05 | | | | 5,191 | | | | 554 | | | | 3.32 | | | | 6,387 | | | | 681 | | | 3.32 | |
2009 | | | 4,762 | | | | 440 | | | | 2.87 | | | | 4,492 | | | | 447 | | | | 3.10 | | | | 4,097 | | | | 400 | | | 3.04 | |
2010 | | | 2,419 | | | | 224 | | | | 2.88 | | | | 2,500 | | | | 285 | | | | 3.54 | | | | 2,709 | | | | 278 | | | 3.20 | |
2011 | | | 2,965 | | | | 270 | | | | 2.84 | | | | 2,405 | | | | 239 | | | | 3.09 | | | | 2,465 | | | | 226 | | | 2.85 | |
Five Year | | | 15,563 | | | | 1,465 | | | | 3.03 | | | | 14,589 | | | | 1,525 | | | | 3.36 | | | | 15,657 | | | | 1,586 | | | 3.26 | |
| | | | | | | | | | | | | | | | | | | | | | | | | | | | | | | | | | | | | | |
| | | | | | | | | | | | | | | | | | | | | | | | | | | | | | | | | | | | |
Porgera Mine Totals | |
| | | Declared Ore Mined vs Grade
Control | | | Grade Control vs Ore
Reserve | | | Declared Ore Mined vs
Ore Reserve | |
| | | Tonnes
(000) | | | Gold
(000 oz) | | | Au Grade
(g/t) | | | Tonnes
(000) | | | Gold
(000 oz) | | | Au
Grade
(g/t) | | | Tonnes
(000) | | | Gold
(000 oz) | | | Au
Grade
(g/t) | |
2007 | | | 9 | % | | | -2 | % | | | -10 | % | | | 13 | % | | | 20 | % | | | 6 | % | | | 23 | % | | | 18 | % | | | -4 | % |
2008 | | | 4 | % | | | -5 | % | | | -8 | % | | | -14 | % | | | -7 | % | | | 8 | % | | | -10 | % | | | -11 | % | | | -1 | % |
2009 | | | 8 | % | | | 2 | % | | | -5 | % | | | 14 | % | | | 24 | % | | | 9 | % | | | 23 | % | | | 27 | % | | | 3 | % |
2010 | | | 0 | % | | | -11 | % | | | -10 | % | | | -3 | % | | | 9 | % | | | 12 | % | | | -3 | % | | | -2 | % | | | 1 | % |
2011 | | | 21 | % | | | 7 | % | | | -12 | % | | | 2 | % | | | 10 | % | | | 8 | % | | | 23 | % | | | 17 | % | | | -5 | % |
Five Year | | | 8 | % | | | -2 | % | | | -9 | % | | | 1 | % | | | 9 | % | | | 8 | % | | | 9 | % | | | 7 | % | | | -1 | % |
| | | | | | | | | | | | | | | | | | | | | | | | | | | | | | | | | | | | |
| | | | |
| |
Barrick Gold Corporation – Porgera Joint Venture, Project #1669 Technical Report NI 43-101 – March 16, 2012 | | | Rev. 0 Page 15-9 | |
| | |
| | www.rpacan.com |
|
| | | | | | | | | | | | | | | | | | | | | | | | | | | | | | | | | | | | |
Underground Mining | |
| | | Declared Ore Mined vs Grade
Control | | | Grade Control vs Ore
Reserve | | | Declared Ore Mined vs
Ore Reserve | |
| | | Tonnes
(000) | | | Gold
(000 oz) | | | Au Grade
(g/t) | | | Tonnes
(000) | | | Gold
(000 oz) | | | Au
Grade
(g/t) | | | Tonnes
(000) | | | Gold
(000 oz) | | | Au
Grade
(g/t) | |
2007 | | | NA | | | | NA | | | | NA | | | | NA | | | | NA | | | | NA | | | | NA | | | | NA | | | | NA | |
2008 | | | 0 | % | | | -5 | % | | | -5 | % | | | 47 | % | | | 42 | % | | | -3 | % | | | 47 | % | | | 35 | % | | | -8 | % |
2009 | | | 21 | % | | | 11 | % | | | -8 | % | | | 63 | % | | | 73 | % | | | 6 | % | | | 97 | % | | | 93 | % | | | -2 | % |
2010 | | | 10 | % | | | 4 | % | | | -5 | % | | | 23 | % | | | 21 | % | | | -1 | % | | | 35 | % | | | 27 | % | | | -6 | % |
2011 | | | 15 | % | | | -1 | % | | | -13 | % | | | 17 | % | | | 15 | % | | | -2 | % | | | 34 | % | | | 14 | % | | | -15 | % |
Five Year | | | 11 | % | | | 2 | % | | | -8 | % | | | 34 | % | | | 33 | % | | | 0 | % | | | 48 | % | | | 36 | % | | | -8 | % |
| | | | | | | | | | | | | | | | | | | | | | | | | | | | | | | | | | | | |
|
Open Pit Mining | |
| | | Declared Ore Mined vs Grade
Control | | | Grade Control vs Ore
Reserve | | | Declared Ore Mined vs
Ore Reserve | |
| | | Tonnes
(000) | | | Gold
(000 oz) | | | Au Grade
(g/t) | | | Tonnes
(000) | | | Gold
(000 oz) | | | Au
Grade
(g/t) | | | Tonnes
(000) | | | Gold
(000 oz) | | | Au
Grade
(g/t) | |
2007 | | | | | | | | | | | | | | | | | | | | | | | | | | | | | | | | | | | | |
2008 | | | 4 | % | | | -4 | % | | | -8 | % | | | -19 | % | | | -19 | % | | | 0 | % | | | -15 | % | | | -22 | % | | | -8 | % |
2009 | | | 6 | % | | | -2 | % | | | -7 | % | | | 10 | % | | | 12 | % | | | 2 | % | | | 16 | % | | | 10 | % | | | -5 | % |
2010 | | | -3 | % | | | -21 | % | | | -19 | % | | | -8 | % | | | 2 | % | | | 11 | % | | | -11 | % | | | -20 | % | | | -10 | % |
2011 | | | 23 | % | | | 13 | % | | | -8 | % | | | -2 | % | | | 6 | % | | | 8 | % | | | 20 | % | | | 20 | % | | | -1 | % |
Five Year | | | 7 | % | | | -4 | % | | | -10 | % | | | -7 | % | | | -4 | % | | | 3 | % | | | -1 | % | | | -8 | % | | | -7 | % |
| | | | | | | | | | | | | | | | | | | | | | | | | | | | | | | | | | | | |
| | | | |
| |
Barrick Gold Corporation – Porgera Joint Venture, Project #1669 Technical Report NI 43-101 – March 16, 2012 | | | Rev. 0 Page15-10 | |
| | |
| | www.rpacan.com |
|
16 MINING METHODS
INTRODUCTION
Porgera JV is a mature operation that employs both open pit and underground mining methods. Placer Dome began mining as an underground operation in 1990. The current mine life is eight years, which extends to 2020, which also coincides with the expiration of the current mining. Processing of stockpiles is estimated to continue an additional five years to 2025.
Approximately 49% of the gold Mineral Reserve originates in the open pit, and the underground operations account for 29% of the gold. The remaining gold reserves lie in the stockpiles at 20% and process inventory at 2%.
In terms of gold production targets, mining is not a constraint. The operation has enough open pit and underground mining capacity to achieve its budgeted goals.
OPEN PIT OPERATION DESCRIPTION
The single, open pit operation is projected to mine approximately five million tonnes of ore per year at an average strip ratio of four waste tonnes to one ore tonne (4W:1O). The operation uses conventional open pit methods to mine the ore and waste; bench drilling, blasting, and loading with shovels and loaders into off-highway trucks. The primary loading units are supported by motor graders, track-dozers, small excavators, water trucks, and maintenance equipment.
The open pit loading and haulage fleet uses O&K RH 120 and RH 200 shovels (17 m3 26 m3, respectively) to load Caterpillar 777 and Caterpillar 789 off highway trucks (90 tonnes and 175 tonnes, respectively).
Atlas Copco DML blasthole drills drill 10 m benches. Blasthole patterns typically are 5.5 m by 6.0 m for the ore. Blasthole patterns in the waste will vary. Powder factors for blasting vary by pit location and lithology. Typical powder factors for the open pit are listed below:
| | | | |
| |
Barrick Gold Corporation – Porgera Joint Venture, Project #1669 Technical Report NI 43-101 – March 16, 2012 | | | Rev. 0 Page 16-1 | |
| | |
| | www.rpacan.com |
|
| | • | | Diorite Powder Factor is approximately 2.5 kg explosive per tonne; |
| | • | | Sediments Powder Factor is approximately 2.3 to 2.3 kg explosive per tonne; and |
| | • | | Brown Mudstone Powder Factor is approximately 0.1 kg explosive per tonne. |
Shovel dig plans are updated daily. The operations department utilizes a truck dispatch system. The open pit operations are run 24 hours per day, seven days per week.
Table 16-1 is a summary of the production and major support equipment used at the Porgera JV open pit. The amount of equipment is appropriate for the given production schedule, however, low equipment availabilities have been an issue at the Porgera JV Mine.
TABLE 16-1 SUMMARY OF OPEN PIT EQUIPMENT FLEET
(ESTIMATED 2012)
Barrick Gold Corporation – Porgera JV
| | | | |
Equipment Name | | Type of Unit | | 2012 Estimated Number of Units |
CAT 992 | | Front End Loader | | 2 |
RH40 | | Load | | Load |
RH200 | | 26-m3 Load | | 3 |
RH120 | | 17-m3 Load | | 1 |
CAT 777 | | 90-t Haul | | 8 |
CAT 789 | | 175-t Haul | | 33 |
Horizontal Drill | | Dewatering Hole Drill | | Drill |
AC L8 | | Drill | | 1 |
DML | | Blast Hole Drill | | 5 |
CAT 777 Water | | Water Truck Support | | 2 |
CAT 16G | | Motor Grader Support | | 3 |
CAT 824 | | Rubber Tired Dozer Support | | 3 |
CAT D10N | | Track Dozer Support | | 8 |
Roller | | Support | | 1 |
The following key operating indicators (assumptions) shown in Table 16-2 were employed in the LOM plan. RPA agrees with the availabilities and utilizations presented in Table 16-2 given the age of the equipment and the wet working conditions that can be encountered in the highlands of Papua New Guinea.
| | | | |
| |
Barrick Gold Corporation – Porgera Joint Venture, Project #1669 Technical Report NI 43-101 – March 16, 2012 | | | Rev. 0 Page 16-2 | |
| | |
| | www.rpacan.com |
|
TABLE 16-2 SUMMARY OF OPEN PIT AND UNDERGROUND EQUIPMENT
FLEET PERFORMANCE ASSUMPTIONS
(ESTIMATED 2012)
Barrick Gold Corporation – Porgera JV
| | | | | | |
Area | | Major | | Availability | | Utilization |
Open Pit | | RH200 | | 80% | | 90% |
Open Pit | | Cat789 | | 80% | | 77% |
Open Pit | | DML | | 78% | | 70% |
Underground | | R2900 | | 82% | | 80% |
Underground | | AD45 | | 77% | | 80% |
Underground | | Jumbo | | 74% | | 60% |
Process | | SAG’s | | 91% | | |
Process | | Autoclaves | | 90% | | |
Process | | O2 Plant | | 93% | | |
From: LOM2011_Tier2_v1.5_LOM.xls
MINE DESIGN
Mining parameters used for the design of the open pit are listed in Table 16-3. The major risks associated with the Porgera JV open pit are the following:
| | • | | Dewatering and slope stability, the Southwest Dyke Failure in particular; |
| | • | | Equipment availabilities; and |
| | • | | Safety and security issues due to artisanal miners who trespass on the Porgera JV mine site. |
| | | | |
| |
Barrick Gold Corporation – Porgera Joint Venture, Project #1669 Technical Report NI 43-101 – March 16, 2012 | | | Rev. 0 Page 16-3 | |
| | |
| | www.rpacan.com |
|
TABLE 16-3 SUMMARY OF OPEN PIT MINE DESIGN PARAMETERS
Barrick Gold Corporation – Porgera JV
| | | | |
Mine Design Parameter Description | | Parameter Value | | Units of Measure |
Bench Height/Lift Height | | 30 m / 10 m | | meters |
Break Even Cut-off Grade | | 1.16 | | Grams per tonne |
Mining Dilution | | 0% | | % |
Gold Price | | $1,200/oz or $38.58/g | | US$/oz or $/g |
Silver Price | | $22/oz or $0.707/g | | US$/oz or $/g |
Recoveries | | | | |
Red Ore | | 86.7% | | %, Historical Plant Performance |
Blue Ore | | 80.7% | | %, Historical Plant Performance |
Road Widths | | 35 m to 40 m | | meters |
Road Grades | | 10% | | %, typical |
Minimum Mining Widths | | Ranges from 50 m to 100 m | | meters |
| | | | | | |
Slope Sector Recommendations (Refer to Figure 16-2) | | Sector Rock Type | | Inter-ramp Angle | | Berm Width |
Sector I | | Western Mudstone | | 24° | | 29.0 m |
Sector II | | W-NW Black Sediments | | 34° | | 19.3 m |
Sector III | | North Black Sediments | | 38° | | 13.2 m |
Sector IV | | North Black Sediments | | 44° | | 12.3 m |
Sector V | | AHD/Altered Seds | | 44° | | 13.7 m |
Sector VI | | Diorite/Altered Seds | | 47° | | 12.0 m |
Sector VII | | Diorite/Altered Seds | | 49° | | 12.1 m |
Sector VIII | | North Diorite | | 46° | | 15.0 m |
Sector IX | | North Diorite | | 48° | | 13.0 m |
Sector X | | Yaktabari Mudstones | | 26° | | 23.1 m |
Two cross sectional views of the existing open pit and the ultimate pit are shown in Figures 16-1 and 16-2. It should be noted the color legend represents the gold grade estimated.
| | | | |
| |
Barrick Gold Corporation – Porgera Joint Venture, Project #1669 Technical Report NI 43-101 – March 16, 2012 | | | Rev. 0 Page 16-4 | |
| | |
| | www.rpacan.com |
FIGURE 16-1 ULTIMATE PIT SECTION 11300N VIEWED NORTH
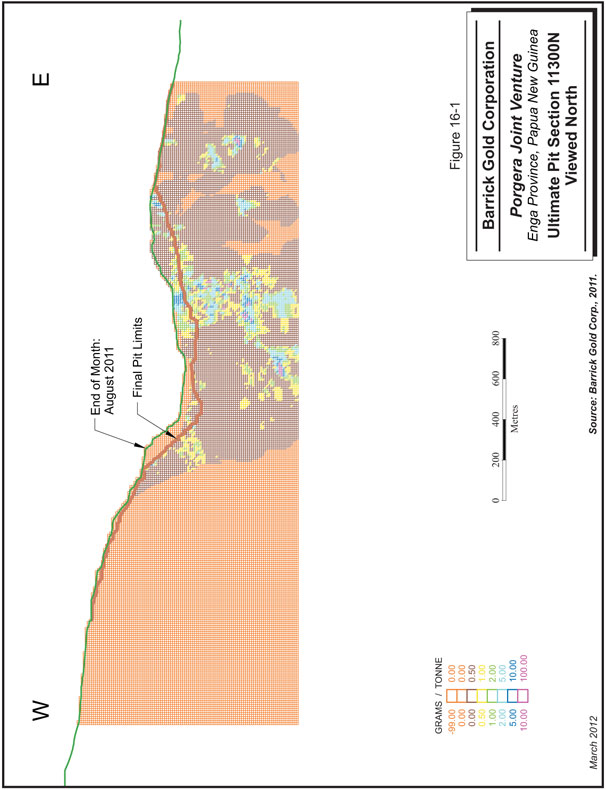
| | | | |
| |
Barrick Gold Corporation – Porgera Joint Venture, Project #1669 Technical Report NI 43-101 – March 16, 2012 | | | Rev. 0 Page 16-5 | |
| | |
| | www.rpacan.com |
FIGURE 16-2 ULTIMATE PIT SECTION 22500E VIEWED EAST
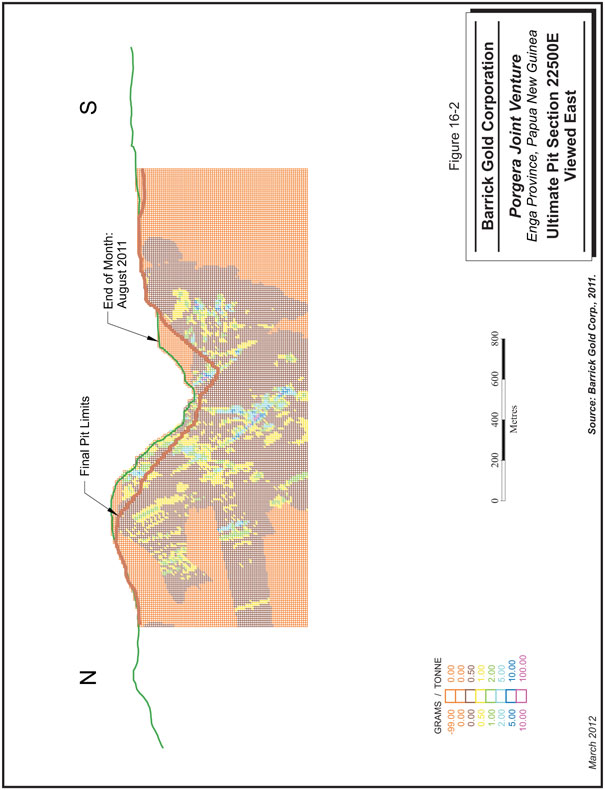
| | | | |
| |
Barrick Gold Corporation – Porgera Joint Venture, Project #1669 Technical Report NI 43-101 – March 16, 2012 | | | Rev. 0 Page 16-6 | |
| | |
| | www.rpacan.com |
|
OPEN PIT GEOTECHNICAL
The Porgera JV open pit operation slope stability was audited by Piteau Associates Engineering Ltd. in 2008, and the primary factors are shown in Table 16-3. The slope sectors are shown in Figure 16-3.
During the RPA site visit, there were a total of five areas that were experiencing significant high slope movement. The open pit areas of greatest concern to the Porgera JV mine engineering staff are listed below:
| | • | | Southeast Buttress Failure (Mudstones); |
| | • | | Stockpile 10 Movement (Mixed Sediments and Mudstones); |
| | • | | Southwest Dyke (Mudstones), which has impacted open pit mine production; |
| | • | | North Central (Mudstones); and |
| | • | | 5B Layback (Black Sediments). |
The open pit mine operation is regularly required to excavate material from the different areas of the pit to relieve the stresses to the highwalls and excavate material that has sloughed into the pit bottom.
All surface and ground water that reports to the open pit is channeled to raises located in the pit bottom, where the water is re-directed to an adit, and ultimately discharges the water at a nominal rate of 284 m3/hr from the 1920 Level pumping station. The Porgera Mine is located in one of the wettest areas on earth. The area receives approximately 3.65 m of precipitation per year. As previously noted, controlling the open pit slope stability and managing the surface water that reports to the open pit are the two major threats to the open pit.
MINING SCHEDULE
Five mining stages have been designed for the open pit. These stages are listed below:
Stage 5:Currently active with a 2014 completion;
Stage 5B:Currently active with a 2013 completion;
Stage 5C:Currently active with ore production start of 2012;
Stage 5D:Third quarter 2012 and mines Peruk Peak, which is located in the southwest corner of the ultimate pit; and
| | | | |
| |
Barrick Gold Corporation – Porgera Joint Venture, Project #1669 Technical Report NI 43-101 – March 16, 2012 | | | Rev. 0 Page 16-7 | |
| | |
| | www.rpacan.com |
|
Stage 5E:Final open pit mining stage.
The five logical mining stages are shown in Figures 16-4 (5A), 16-5 (5B), 16-6 (5C Intermediate), 16-7 (5C), 16-8 (5D Intermediate), 16-9 (5D), and 16-10 (5E). As evidenced in Figures 16-4 through 16-10, the Stage 5A is a current phase and Stage 5E is a future phase. The current LOM schedule is shown in Table 16-5.
| | | | |
| |
Barrick Gold Corporation – Porgera Joint Venture, Project #1669 Technical Report NI 43-101 – March 16, 2012 | | | Rev. 0 Page 16-8 | |
| | |
| | www.rpacan.com |
FIGURE 16-3 OPEN PIT SLOPE SECTORS
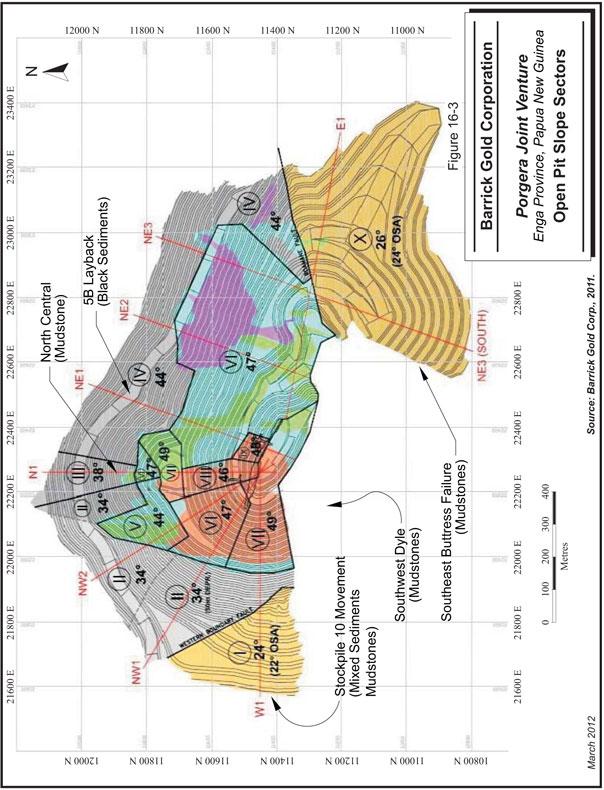
| | | | |
| |
Barrick Gold Corporation – Porgera Joint Venture, Project #1669 Technical Report NI 43-101 – March 16, 2012 | | | Rev. 0 Page 16-9 | |
| | |
| | www.rpacan.com |
FIGURE 16-4 OPEN PIT MINE – STAGE 5A
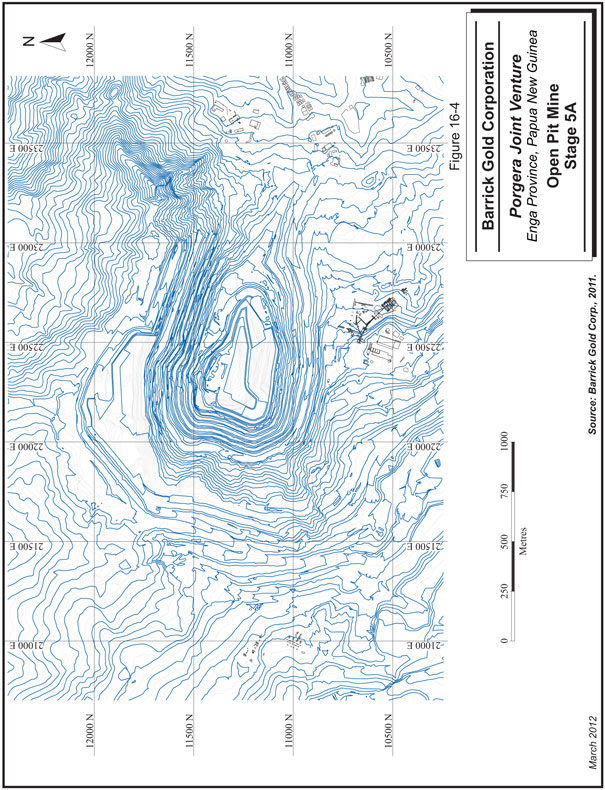
| | | | |
| |
Barrick Gold Corporation – Porgera Joint Venture, Project #1669 Technical Report NI 43-101 – March 16, 2012 | | | Rev. 0 Page 16-10 | |
| | |
| | www.rpacan.com |
FIGURE 16-5 OPEN PIT MINE – STAGE 5B
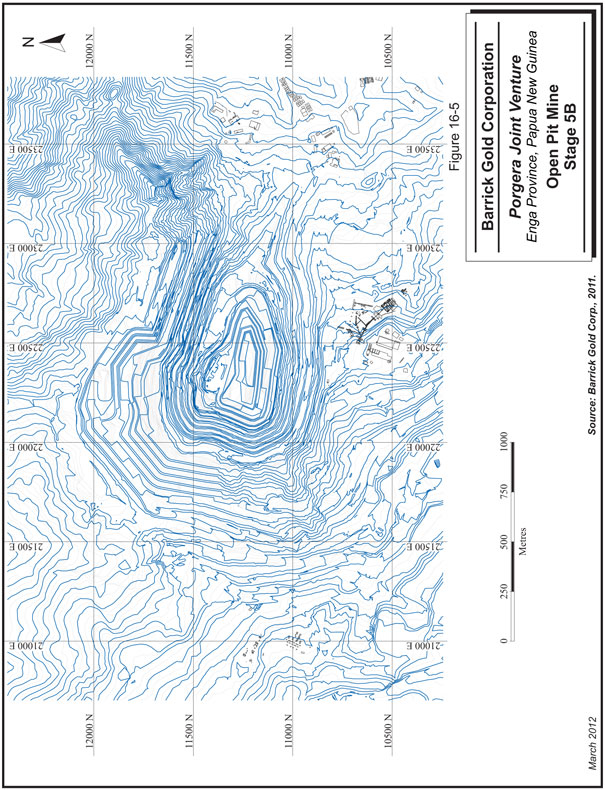
| | | | |
| |
Barrick Gold Corporation – Porgera Joint Venture, Project #1669 Technical Report NI 43-101 – March 16, 2012 | | | Rev. 0 Page 16-11 | |
| | |
| | www.rpacan.com |
FIGURE 16-6 OPEN PIT MINE – STAGE 5C INTERMEDIATE
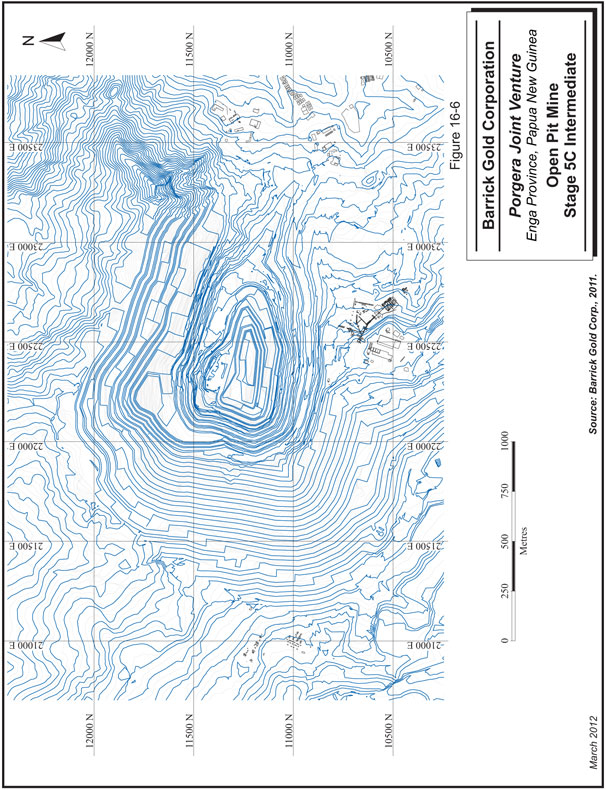
| | | | |
| |
Barrick Gold Corporation – Porgera Joint Venture, Project #1669 Technical Report NI 43-101 – March 16, 2012 | | | Rev. 0 Page 16-12 | |
| | |
| | www.rpacan.com |
FIGURE 16-7 OPEN PIT MINE – STAGE 5C
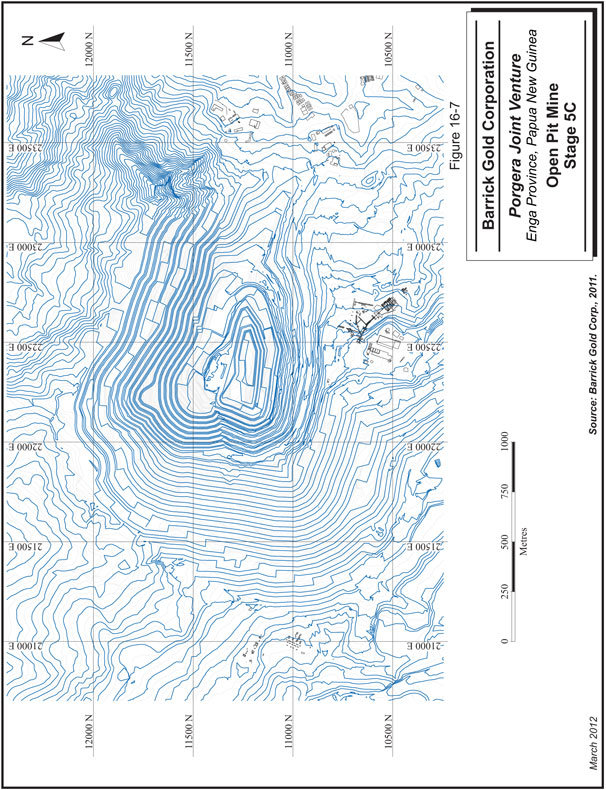
| | | | |
| |
Barrick Gold Corporation – Porgera Joint Venture, Project #1669 Technical Report NI 43-101 – March 16, 2012 | | | Rev. 0 Page 16-13 | |
| | |
| | www.rpacan.com |
FIGURE 16-8 OPEN PIT MINE – STAGE 5D INTERMEDIATE
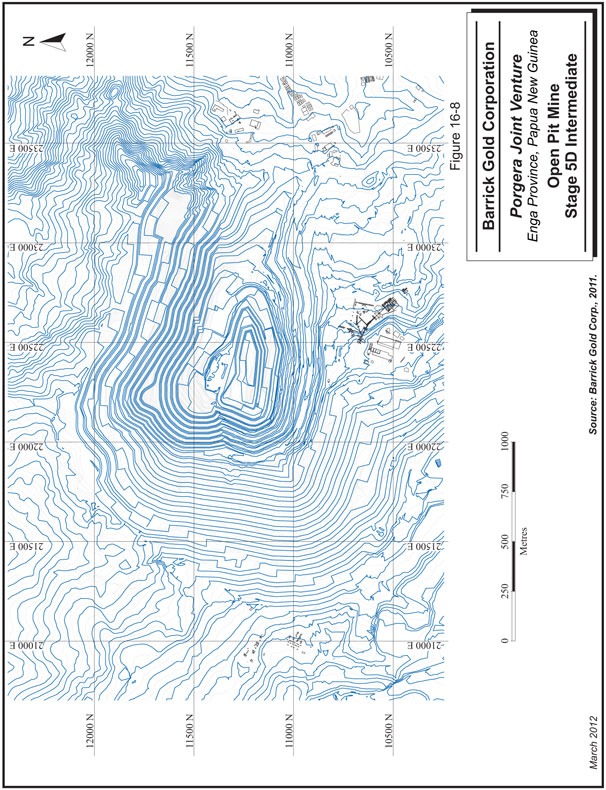
| | | | |
| |
Barrick Gold Corporation – Porgera Joint Venture, Project #1669 Technical Report NI 43-101 – March 16, 2012 | | | Rev. 0 Page 16-14 | |
| | |
| | www.rpacan.com |
FIGURE 16-9 OPEN PIT MINE – STAGE 5D
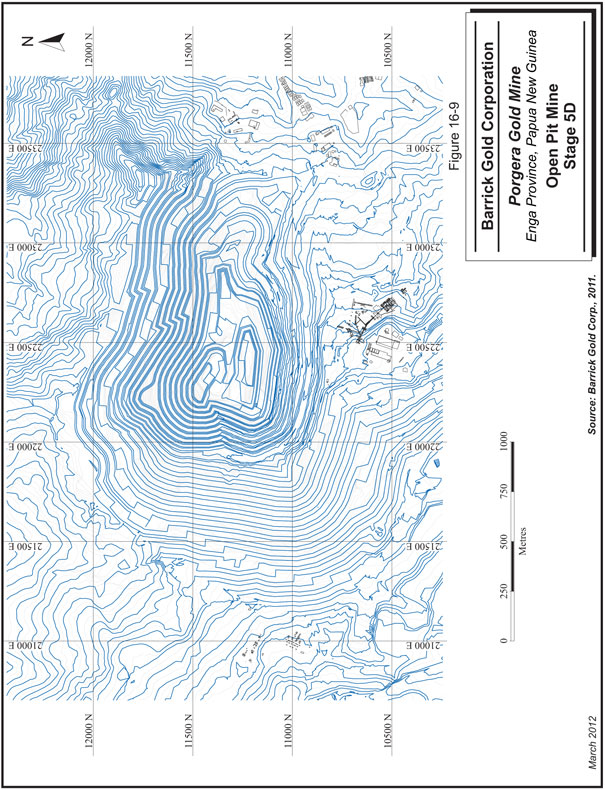
| | | | |
| |
Barrick Gold Corporation – Porgera Joint Venture, Project #1669 Technical Report NI 43-101 – March 16, 2012 | | | Rev. 0 Page 16-15 | |
| | |
| | www.rpacan.com |
FIGURE 16-10 OPEN PIT MINE – STAGE 5E
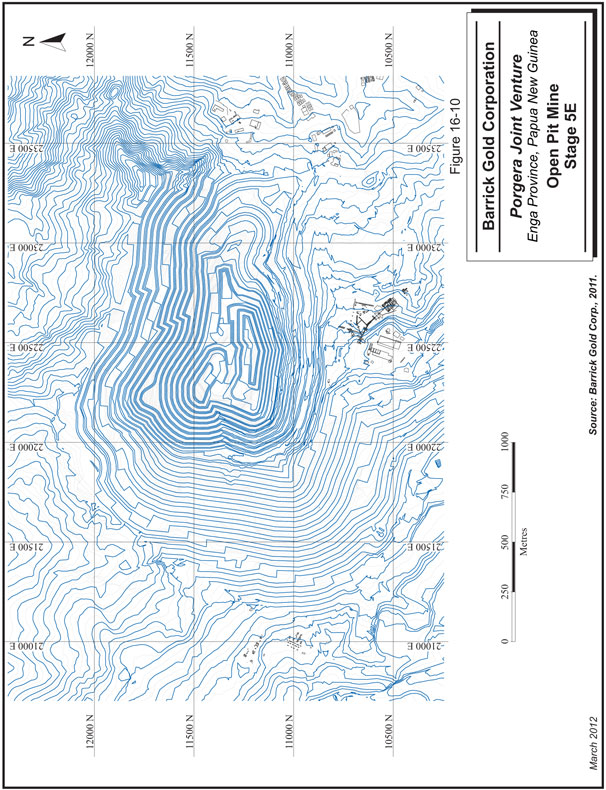
| | | | |
| |
Barrick Gold Corporation – Porgera Joint Venture, Project #1669 Technical Report NI 43-101 – March 16, 2012 | | | Rev. 0 Page 16-16 | |
| | |
| | www.rpacan.com |
|
OPEN PIT GRADE (ORE) CONTROL
The technical personnel who manage the grade control is managed well and fully staffed. Open pit ore is categorized into two major categories, Red Ore and Blue Ore. The primary distinction between the two ore categories is operating costs. Red Ore is generally the higher grade material, which is either fed directly into the primary crusher or sent to a high grade (short-term) stockpile. Blue Ore is of a lower gold grade, and is shipped directly to a stockpile for future blending. The Red Ore cut-off grade also incorporates a lower gold price, which will raise the cut-off grade.
There are currently 13 stockpiles composed of various grades and sulfur percentages on the Porgera JV mine site. Mine planning and the cut-off grade calculations define the following six categories for grade control:
| | 2. | Blue Ore (Directly to Stockpile); |
| | 3. | Low gold grade and low concentrate grade Red Ore (LG/LC); |
| | 4. | Low gold grade and high concentrate grade Red Ore (LG/HC); |
| | 5. | High gold grade and low concentrate grade Red Ore (HG/LC); and |
| | 6. | High gold grade and high concentrate grade Red Ore (HG/HC). |
Porgera JV’s goal is to maximize mill production by increasing the cut-off grade or by the replacement of low grade pit ore with higher grade stockpile ore. Concentrate grades are blended to meet the pressure oxidation (Autoclave) sulfur feed limit of approximately 2.5%.
UNDERGROUND MINE DESCRIPTION
Porgera JV started in 1990 as an underground mining operation, which was completed in 1997. The open pit operation began in 1993 and has been in continuous operation since. Underground mining was restarted in 2002, and it is expected to continue as long as the open pit is operating. It is RPA’s opinion that underground mining could continue after the planned completion of the open pit and during the milling of the stockpiles. The underground mine is expected to produce approximately 1.2 million tonnes of ore per year and the goal is to increase this to 1.4 million tonnes per year. In 2011, the underground mine generated 935,000 tonnes grading 7.29 g/t Au.
| | | | |
| |
Barrick Gold Corporation – Porgera Joint Venture, Project #1669 Technical Report NI 43-101 – March 16, 2012 | | | Rev. 0 Page 16-17 | |
| | |
| | www.rpacan.com |
|
There are several underground deposits, but current production is coming from the North zone, and the recently accessed East zone. Underground exploration and development is underway and moving towards the AHD and Project X zones.
Underground mining is highly mechanized with large scale underground equipment. Headings typically have dimensions of 5 m by 5 m and stopes are opened to 10 m wide (depending upon ground conditions). The mine is accessed from two primary decline systems. The first decline is collared at elevation 2210 RL near the mine offices and adjacent to the underground shop facilities (located on surface). This is the original mine access decline. There is also a new twin decline with the portals collared at elevation 2290 RL. The twin decline portals are located approximately one kilometer east of the original decline portal. Figure 16-11 is an overview of the underground workings, the extents of mining and the active areas. Figure 16-12 is an isometric view that shows the relative locations of the primary underground workings to the existing extents of the open pit.
| | | | |
| |
Barrick Gold Corporation – Porgera Joint Venture, Project #1669 Technical Report NI 43-101 – March 16, 2012 | | | Rev. 0 Page 16-18 | |
| | |
| | www.rpacan.com |
FIGURE 16-11 LONGITUDINAL SECTION OF UNDERGROUND WORKINGS
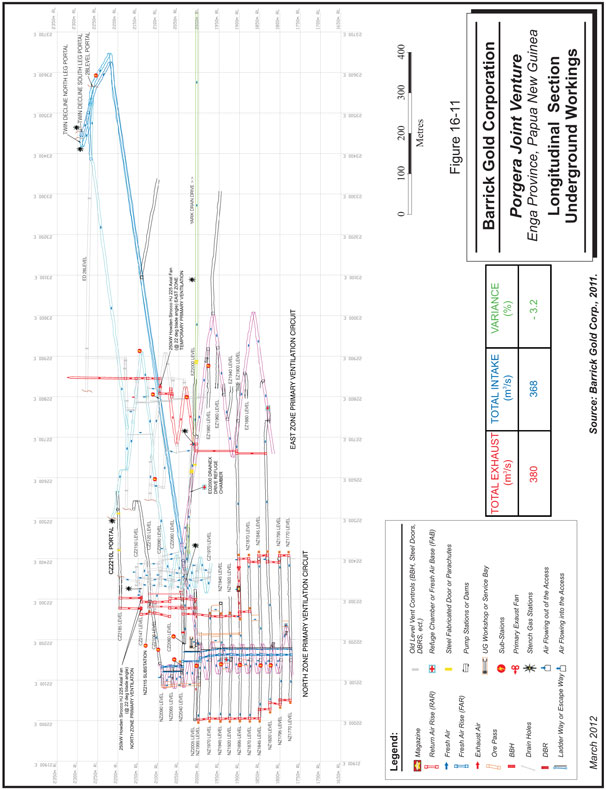
| | | | |
| |
Barrick Gold Corporation – Porgera Joint Venture, Project #1669 Technical Report NI 43-101 – March 16, 2012 | | | Rev. 0 Page 16-19 | |
| | |
| | www.rpacan.com |
FIGURE 16-12 ISOMETRIC VIEW OF UNDERGROUND WORKINGS AND THE OPEN PIT
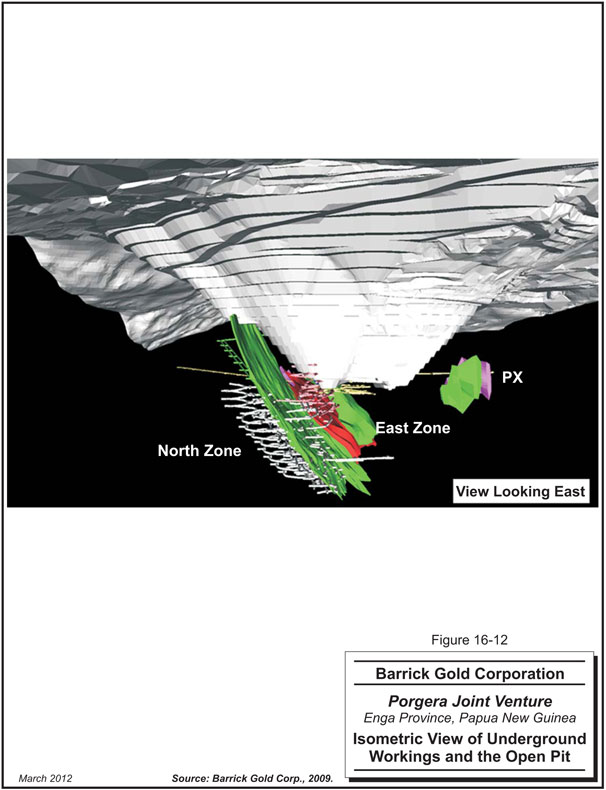
| | | | |
| |
Barrick Gold Corporation – Porgera Joint Venture, Project #1669 Technical Report NI 43-101 – March 16, 2012 | | | Rev. 0 Page 16-20 | |
| | |
| | www.rpacan.com |
|
STOPING METHOD
Mining is currently done with an Avoca or modified Avoca method. In the Avoca method, the ore is accessed from the both hangingwall and the footwall, and as the mining retreats across the stope in sections, backfill is placed from the entry at the opposite end of the stope. The fill is added to the stope from a level above and from the opposite end compared to the mucking. A free face is remaining, so there is no need to develop a new slot raise for each phase of the stoping. Porgera JV typically mines a 30 m long section in between fill cycles, but one of the benefits of the Avoca method is that shorter fill cycles can be taken to reduce the amount of open ground and to reduce the amount of remote mucking. Tires and scrap ventilation ducting are used to mark the fill face before blasting commences so that muckers will know when they are through the ore and into back fill.
In the modified Avoca mining method, there is only access from one end of the stope and the fill is placed from the level above but at the same end as the mucking. In this situation, the fill is tight to the face to be blasted and either some waste muck must be mucked from the bottom or a new slot raise must be opened for each successive cut. Blastholes are typically 25 m long. Down holes are 102 mm diameter and up holes are 89 mm diameter.
Waste is used for backfill to the maximum extent possible, with some of the fill being uncemented rock fill and the balance, cemented rock fill. This backfill is appropriate for use in the North zone. With the recent addition of the East zone to the production schedule, a new source of backfill is required. The East zone stopes are generally flatter in dip than the North zone and backfill flow dynamics require that paste fill be utilized instead of rock fill. A new paste fill plant was constructed in 2011 and its efficient operation will be important as mining shifts from the North Zone to the East Zone.
There were concerns raised within the engineering department regarding a lack of quality control on the longhole drilling. From review of the Cavity Monitoring System (CMS) surveys of the mined out stopes, it appears this concern is justified. In several cases, the drilling appears to have been shallower than the ore zone contours. In these cases, unblasted ore remained on the footwall and waste rock was mined from the hangingwall resulting in both reduced recovery and increased dilution. In RPA’s opinion, longhole drilling quality control should be enhanced.
| | | | |
| |
Barrick Gold Corporation – Porgera Joint Venture, Project #1669 Technical Report NI 43-101 – March 16, 2012 | | | Rev. 0 Page 16-21 | |
| | |
| | www.rpacan.com |
|
MINE DEVELOPMENT
All of the mine development is done with mechanized equipment. Development advance has not met plan in the past years, but there has not been a negative impact on production as the ore is coming primarily from the North zone which is effectively completely developed. Development rates in the East zone and other future mining zones will need to be maintained to ensure that sufficient work places are available in the future.
The new twin decline has significantly improved ore trucking and backfill haulage cycle times. The twin decline now permits for more efficient one-way traffic in and out of the mine.
GROUND SUPPORT
RPA witnessed good ground conditions in the mine areas that were. There was mechanical support in all areas. Rock bolts and mesh were commonly in use in the mine. From the CMS surveys, stope walls appear to be incurring some overbreak, and RPA is of the opinion that CMS surveys of all stopes should be maintained. Modifications to the drilling and blasting patterns should also be investigated with the goal of reducing the quantity of hangingwall dilution.
MINE VENTILATION
The underground mine ventilation system previously used the main ramp as the intake and then had raises located within the active open pit. The twin decline has recently been completed simplifying the primary ventilation circuit by providing new intake/exhaust routes. The use of raises in the open pit continues but to a lesser extent than in the past. This was problematic whenever open pit activity was in the vicinity of the ventilation raises because, after surface blasting, the raises were, on occasion, buried in muck which required they be cleared both at the top and by mucking from the bottom.
| | | | |
| |
Barrick Gold Corporation – Porgera Joint Venture, Project #1669 Technical Report NI 43-101 – March 16, 2012 | | | Rev. 0 Page 16-22 | |
| | |
| | www.rpacan.com |
|
UNDERGROUND MINING EQUIPMENT
Table 16-4 is a summary of the production and major support equipment used at the Porgera JV underground mine. The amount of equipment is appropriate for the given production schedule, however, as is the case with the open pit, low equipment availabilities have been an issue at the Porgera JV mine.
TABLE 16-4 SUMMARY OF UNDERGROUND EQUIPMENT FLEET
(ESTIMATED 2012)
Barrick Gold Corporation – Porgera JV
| | | | |
Equipment Name | | Type of Unit | | 2012 Estimated Number of Units |
Atlas Copco B322 | | Horizontal Drill | | 2 |
Atlas Copco B352 | | Horizontal Drill | | 1 |
Atlas Copco H127 | | Horizontal Drill | | 1 |
Atlas Copco M2D | | Horizontal Drill | | 2 |
| | |
Elphinstone R1700 | | LHD | | 2 |
Elphinstone R2900 | | LHD | | 5 |
| | |
Elphinstone AD45 | | Haul Truck | | 10 |
Elphinstone AD55 | | Haul Truck | | 2 |
| | |
Caterpillar IT28F | | Front-end Loader | | 2 |
Caterpillar IT28G | | Front-end Loader | | 3 |
| | |
Tamrock Solo 1006 | | Longhole Drill | | 1 |
Atlas Copco LC6 | | Longhole Drill | | 1 |
| | |
MacLean MEM818 | | Roofbolter | | 2 |
Tamrock H695 | | Cable Bolter | | 1 |
| | |
Caterpillar 140H | | Grader | | 1 |
Getman A64 | | Service Vehicle | | 5 |
| | |
Hagby Onram 1000 | | Diamond Drill | | 2 |
Longyear LM75 | | Diamond Drill | | 1 |
Longyear LMA90 | | Diamond Drill | | 4 |
| | | | |
| |
Barrick Gold Corporation – Porgera Joint Venture, Project #1669 Technical Report NI 43-101 – March 16, 2012 | | | Rev. 0 Page 16-23 | |
| | |
| | www.rpacan.com |
|
TABLE 16-5 Life Of Mine Open and Underground Production Schedule
Barrick Gold Corporation – Porgera JV
| | | | | | | | | | | | | | | | | | | | | | | | | | | | | | | | | | | | | | | | | | | | | | | | | | | | | | | | | | | | | | | | |
| | | Units | | | Total | | | 2012 | | | 2013 | | | 2014 | | | 2015 | | | 2016 | | | 2017 | | | 2018 | | | 2019 | | | 2020 | | | 2021 | | | 2022 | | | 2023 | | | 2024 | | | 2025 | |
TOTAL OPEN PIT | | | | | | | | | | | | | | | | | | | | | | | | | | | | | | | | | | | | | | | | | | | | | | | | | | | | | | | | | | | | | | | | |
Open Pit Ore | | | 000 t | | | | | | | | | | | | | | | | | | | | | | | | | | | | | | | | | | | | | | | | | | | | | | | | | | | | | | | | | | | | | |
Au Grade | | | g/t | | | | 45,049 | | | | 3,141 | | | | 2,567 | | | | 3,045 | | | | 3,973 | | | | 7,446 | | | | 6,794 | | | | 9,022 | | | | 4,374 | | | | 3,436 | | | | 4,391 | | | | | | | | | | | | | | | | | |
Contained Gold | | | 000 oz | | | | 2.39 | | | | 2.83 | | | | 3.39 | | | | 3.11 | | | | 1.98 | | | | 1.91 | | | | 2.19 | | | | 1.83 | | | | 2.89 | | | | 2.92 | | | | 3 | | | | | | | | | | | | | | | | | |
Waste (Including Mud Mining) | | | 000 t | | | | 3,458 | | | | 286 | | | | 280 | | | | 305 | | | | 253 | | | | 458 | | | | 479 | | | | 530 | | | | 407 | | | | 323 | | | | 423 | | | | | | | | | | | | | | | | | |
Total Open Pit | | | | | | | 215,846 | | | | 26,323 | | | | 29,267 | | | | 36,776 | | | | 34,017 | | | | 23,746 | | | | 24,041 | | | | 22,934 | | | | 21,099 | | | | 17,867 | | | | 6,097 | | | | | | | | | | | | | | | | | |
| | | | | | | | | | | | | | | | |
STOCKPILES | | | | | | | | | | | | | | | | | | | | | | | | | | | | | | | | | | | | | | | | | | | | | | | | | | | | | | | | | | | | | | | | |
Stockpile Reclaim (LGHC+LGLC+Blue) | | | 000 t | | | | | | | | | | | | | | | | | | | | | | | | | | | | | | | | | | | | | | | | | | | | | | | | | | | | | | | | | | | | | |
ROM Rehandle (ROM + 50% of Direct Feed) | | | 000 t | | | | 24,787 | | | | 3,424 | | | | 3,943 | | | | 2,209 | | | | 2,624 | | | | 3,629 | | | | 3,716 | | | | 3,880 | | | | 3,437 | | | | 2,199 | | | | 849 | | | | | | | | | | | | | | | | | |
Underground | | | 000 t | | | | 9,621 | | | | 933 | | | | 708 | | | | 830 | | | | 855 | | | | 857 | | | | 815 | | | | 711 | | | | 997 | | | | 1,738 | | | | 2,111 | | | | | | | | | | | | | | | | | |
Rehandle | | | 000 t | | | | 7,124 | | | | 693 | | | | 775 | | | | 836 | | | | 891 | | | | 892 | | | | 892 | | | | 891 | | | | 891 | | | | 833 | | | | 223 | | | | | | | | | | | | | | | | | |
Inpit Rehandle | | | 000 t | | | | 15,347 | | | | 1,841 | | | | 1,910 | | | | 2,299 | | | | 2,243 | | | | 1,872 | | | | 1,850 | | | | 1,917 | | | | 1,528 | | | | 1,278 | | | | 449 | | | | | | | | | | | | | | | | | |
Total Pit Movement | | | 000 t | | | | 317,774 | | | | 36,356 | | | | 39,169 | | | | 45,995 | | | | 44,604 | | | | 38,441 | | | | 38,107 | | | | 39,356 | | | | 32,327 | | | | 27,353 | | | | 12,422 | | | | | | | | | | | | | | | | | |
| | | | | | | | | | | | | | | | |
UNDERGROUND PRODUCTION | | | | | | | | | | | | | | | | | | | | | | | | | | | | | | | | | | | | | | | | | | | | | | | | | | | | | | | | | | | | | | | | |
Underground Ore | | | 000 t | | | | 7,124 | | | | 698 | | | | 775 | | | | 836 | | | | 891 | | | | 892 | | | | 892 | | | | 891 | | | | 891 | | | | 833 | | | | 223 | | | | | | | | | | | | | | | | | |
Au Grade | | | g/t | | | | 7.37 | | | | 8.06 | | | | 7.53 | | | | 7.73 | | | | 7.54 | | | | 6.96 | | | | 7.23 | | | | 6.91 | | | | 7.43 | | | | 7.46 | | | | 8.13 | | | | | | | | | | | | | | | | | |
Contained Gold | | | 000 oz | | | | 1,687 | | | | 181 | | | | 188 | | | | 208 | | | | 216 | | | | 199 | | | | 207 | | | | 198 | | | | 213 | | | | 200 | | | | 58 | | | | | | | | | | | | | | | | | |
| | | | | | | | | | | | | | | | |
MILL FEED (Crusher) | | | | | | | | | | | | | | | | | | | | | | | | | | | | | | | | | | | | | | | | | | | | | | | | | | | | | | | | | | | | | | | | |
Open Pit and ROM Ore | | | 000 t | | | | 17,180 | | | | 1,530 | | | | 1,263 | | | | 1,483 | | | | 1,526 | | | | 1,530 | | | | 1,455 | | | | 1,269 | | | | 1,781 | | | | 3,104 | | | | 3,769 | | | | | | | | | | | | | | | | | |
Au Grade | | | g/t | | | | 3.91 | | | | 4 | | | | 5 | | | | 5 | | | | 3 | | | | 3 | | | | 5 | | | | 4 | | | | 5 | | | | 3 | | | | 3 | | | | | | | | | | | | | | | | | |
Contained Gold | | | 000 oz | | | | 2,090 | | | | 195 | | | | 196 | | | | 208 | | | | 134 | | | | 160 | | | | 236 | | | | 173 | | | | 278 | | | | 308 | | | | 396 | | | | | | | | | | | | | | | | | |
Underground Ore | | | 000 t | | | | 7,124 | | | | 698 | | | | 775 | | | | 836 | | | | 891 | | | | 892 | | | | 892 | | | | 891 | | | | 891 | | | | 833 | | | | 223 | | | | | | | | | | | | | | | | | |
Au Grade | | | g/t | | | | 7.37 | | | | 8 | | | | 8 | | | | 8 | | | | 8 | | | | 7 | | | | 7 | | | | 7 | | | | 7 | | | | 7 | | | | 8 | | | | | | | | | | | | | | | | | |
Contained Gold | | | 000 oz | | | | 1,687 | | | | 181 | | | | 188 | | | | 208 | | | | 216 | | | | 199 | | | | 207 | | | | 198 | | | | 213 | | | | 200 | | | | 58 | | | | | | | | | | | | | | | | | |
Stockpile Reclaim Ore | | | 000 t | | | | 47,671 | | | | 2,706 | | | | 3,047 | | | | 2,805 | | | | 2,378 | | | | 2,722 | | | | 2,807 | | | | 2,975 | | | | 2,522 | | | | 1,279 | | | | 1,236 | | | | 5,381 | | | | 5,381 | | | | 5,381 | | | | 5,223 | |
Au Grade | | | g/t | | | | 1.84 | | | | 2.72 | | | | 2.66 | | | | 2.62 | | | | 2.7 | | | | 2.42 | | | | 2.33 | | | | 2.25 | | | | 1.98 | | | | 2.38 | | | | 1.57 | | | | 1.66 | | | | 1.66 | | | | 1.43 | | | | 1.12 | |
Contained Gold | | | 000 oz | | | | 2,731 | | | | 237 | | | | 260 | | | | 236 | | | | 206 | | | | 212 | | | | 210 | | | | 215 | | | | 161 | | | | 98 | | | | 63 | | | | 287 | | | | 286 | | | | 248 | | | | 189 | |
| | | | | | | | | | | | | | | | |
MILL PRODUCTION | | | | | | | | | | | | | | | | | | | | | | | | | | | | | | | | | | | | | | | | | | | | | | | | | | | | | | | | | | | | | | | | |
Total Feed | | | 000 t | | | | 71,975 | | | | 4,934.53 | | | | 5,084.51 | | | | 5,123.83 | | | | 4,795.80 | | | | 5,143.18 | | | | 5,154.02 | | | | 5,135.18 | | | | 5,193.85 | | | | 5,217.15 | | | | 5,227.83 | | | | 5,381.01 | | | | 5,380.79 | | | | 5,380.79 | | | | 5,222.94 | |
Au Grade | | | g/t | | | | 2.85 | | | | 3.87 | | | | 3.94 | | | | 3.96 | | | | 3.61 | | | | 3.46 | | | | 3.94 | | | | 3.55 | | | | 3.9 | | | | 3.61 | | | | 3.08 | | | | 1.66 | | | | 1.66 | | | | 1.43 | | | | 1.12 | |
Contained Gold | | | 000 oz | | | | 6,600 | | | | 614 | | | | 644 | | | | 652 | | | | 557 | | | | 572 | | | | 654 | | | | 587 | | | | 651 | | | | 605 | | | | 517 | | | | 287 | | | | 286 | | | | 248 | | | | 189 | |
Gold recovery | | | % | | | | 86.20 | % | | | 86.41 | % | | | 86.81 | % | | | 86.92 | % | | | 87.84 | % | | | 87.72 | % | | | 88.38 | % | | | 87.66 | % | | | 86.94 | % | | | 87.10 | % | | | 85.67 | % | | | 81.81 | % | | | 81.84 | % | | | 81.42 | % | | | 79.48 | % |
Gold produced | | | 000 oz | | | | 5,684 | | | | 530 | | | | 559 | | | | 567 | | | | 489 | | | | 502 | | | | 578 | | | | 514 | | | | 566 | | | | 527 | | | | 443 | | | | 235 | | | | 234 | | �� | | 202 | | | | 150 | |
| | | | |
| |
Barrick Gold Corporation – Porgera Joint Venture, Project #1669 Technical Report NI 43-101 – March 16, 2012 | | | Rev. 0 Page 16-24 | |
| | |
| | www.rpacan.com |
|
17 RECOVERY METHODS
The Porgera JV ore processing plant consists of crushing, grinding, flotation, pressure oxidation and leach/carbon-in-leach (CIL) operations. A simplified process flow sheet is shown in Figure 17-1. The crushing and grinding plant is at Tawisakale, which is physically separated from the concentrator at Anawe. Tawisakale is located immediately adjacent to the open pit and ground ore slurry is delivered by pipeline to the Anawe Concentrator.
Run-of-mine (ROM) ore is delivered by trucks to the dump pocket of a gyratory crusher. Primary crushed ore is conveyed to a coarse ore stockpile. A portion of the primary crusher product is diverted to the secondary crusher. The secondary crushed product is also delivered to the coarse ore stockpile. The additional crushing increases the throughput of the semi-autogenous grinding (SAG) mill circuit particularly when hard ore is fed to the plant. It is not always used.
The ore recovered from the coarse ore stockpile feeds two 8.53 m by 3.65 m SAG mills that are operated in parallel. The discharge from the SAG mills passes over vibrating screens. The oversize from the screens is directed to one of the two Omnicone crushers where it is crushed prior to recycling to the SAG mills. The screen underflow is directed to the ball milling circuit which is operated in closed circuit with cyclones. The underflow from the cyclones feeds three ball mills (mills one and two are 4.2 m diameter by 6.6 m long and ball mill 3 is 5.49 m diameter by 9.75 m long). A portion of the recirculating underflow is directed to Knelson concentrators for gravity recovery of free gold. The gravity concentrate is collected in a storage tank. It is periodically transferred to an Acacia high intensity cyanide reactor which is located in the gold room. The cyclone overflow proceeds by gravity flow to the flotation concentrator via two parallel pipelines that are each two kilometres long.
Flotation consists of rougher, cleaner, and scavenger flotation banks that produce a final concentrate that contains approximately 14% sulphur. The tailings from the flotation circuits are part of the final tailings. The flotation concentrate is combined with the tailings from the acacia reactor and reground to approximately 92% passing 38µ. The
| | | | |
| |
Barrick Gold Corporation – Porgera Joint Venture, Project #1669 Technical Report NI 43-101 – March 16, 2012 | | | Rev. 0 Page 17-1 | |
| | |
| | www.rpacan.com |
|
reground product flows to a concentrate thickener where the slurry density is increased from approximately 12% solids to approximately 50% solids. Six concentrate storage tanks provide storage for approximately six days of operation of the pressure oxidation plant. When needed, the flotation concentrate is pumped to a train of three carbonate reaction tanks where the new feed to the plant is mixed with recycled oxidized slurry. The acid from the recycled slurry destroys most of the carbonates which, in turn, reduces the generation of carbon dioxide in the autoclaves and thereby improves the utilization of oxygen. After carbonate destruction, the feed is directed to the four autoclaves. The autoclaves are 4 m diameter, 27 m long steel pressure vessels that are line with lead and acid-proof brick. The autoclaves are operated at 1,750 kPa and 197°C. The reaction occurs autogenously once started and water is added to the autoclave as required to control the reaction temperature. The process oxidizes the sulphides in the ore. The oxidized slurry and the vent gases discharge into a flash vessel that is equipped with a gas scrubber to control acidic emissions. The flash vessel lets down the pressure of the autoclave discharge slurry.
The autoclave discharge is treated in a wash circuit comprised of two stainless steel, 35 m diameter, high-rate thickeners. The wash circuit operates counter-currently, using overflow solution from the concentrate thickener as the wash water. The washed and thickened slurry is fed to the CIL circuit at a target slurry density of 29% solids.
The leach circuit consists of seven agitated tanks. Slaked lime is added to the first tank (conditioning tank) to adjust the pH to approximately 10.5. Sodium cyanide is added in the first CIL tank to a concentration of approximately 150 g/t. The circuit has been modified so the carbon flows by gravity from tank 0 to tank 6 along with the slurry. Following the CIL circuit, a series of nine carbon-in-pulp (CIP) tanks recover the remaining gold from the slurry. It is a traditional CIP circuit so the activated carbon is advanced counter current to the slurry flow. Each tank contains approximately six tonnes of carbon. Carbon is forwarded each day from CIL tank 6 and CIP tank 1. The gold recovery is generally between 90% and 92% in the leach circuit.
The carbon elution circuit includes two pressurized vessels that process approximately 10 t of carbon. The precious metals are eluted from the carbon using 15 bed volumes of eluant at 140ºC and 400 kPa. Barren carbon is regenerated in a rotary kiln and then
| | | | |
| |
Barrick Gold Corporation – Porgera Joint Venture, Project #1669 Technical Report NI 43-101 – March 16, 2012 | | | Rev. 0 Page 17-2 | |
| | |
| | www.rpacan.com |
|
acid washed in a three percent hydrochloric acid solution prior to being returned to the CIL/CIP circuit. Gold and silver are electro-won from the pregnant strip solution, which is combined with the solution from the Acacia reactor, in three banks of electro-winning cells. Each bank consists of three cells containing 18 stainless steel wool cathodes and 19 stainless steel mesh anodes. At regular intervals, the cathodes are removed and the gold “sludge” is washed off, pressure filtered, and retorted to remove any mercury. The mercury is condensed and collected as a by-product. The residue containing the gold and silver is mixed with a flux of borax, soda ash, nitre, and silica, and smelted in an induction furnace to produce doré bullion with an average concentration of approximately 80% gold.
The leach tailings are processed in a sulphur dioxide-air cyanide destruction plant that uses sodium metabisulfite to produce the sulphur dioxide. Effluent from the cyanide destruction circuit is mixed with the overflow from the wash thickener which is acidic. Further chemical treatment stabilizes any other potentially harmful constituents. Mixing the effluent from the cyanide destruction circuit with the acidic wash water has been shown to precipitate copper cyanide complexes which previously contributed to elevated levels of soluble copper that exceeded the discharge limit at one of the downstream sampling locations.
Lime is produced from limestone quarried adjacent to the mine. The limestone is calcined in two vertical kilns to convert it to lime. It is trucked to the mill site and stored in three lime silos. The lime is reacted with water in a lime slaker to make quick lime. It is then added to the plant at various locations.
Most of the water for the process plant is supplied by pipeline from the Waile Creek dam. The grinding circuit preferentially takes water from the nearby Kogai Creek.
Electrical power is delivered to site via a 73 km transmission line from the 72 MW Hides Power Station that uses gas turbines for power generation; this is supplemented by a 13 MW diesel power station at the mine site.
| | | | |
| |
Barrick Gold Corporation – Porgera Joint Venture, Project #1669 Technical Report NI 43-101 – March 16, 2012 | | | Rev. 0 Page 17-3 | |
| | |
| | www.rpacan.com |
FIGURE 17-1 PROCESS FLOW SHEET
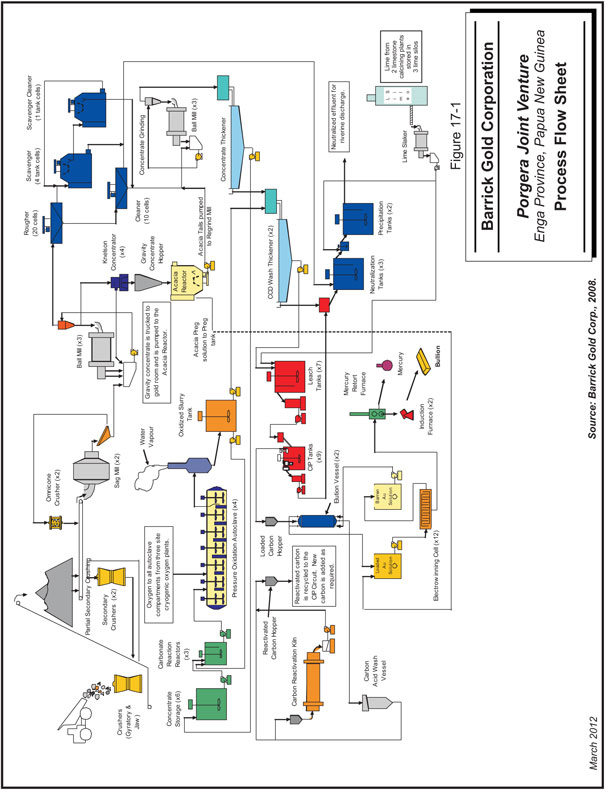
| | | | |
| |
Barrick Gold Corporation – Porgera Joint Venture, Project #1669 Technical Report NI 43-101 – March 16, 2012 | | | Rev. 0 Page 17-4 | |
| | |
| | www.rpacan.com |
|
18 PROJECT INFRASTRUCTURE
The major assets and facilities associated with the Porgera JV mine are:
| | • | | The open pit mine and associated waste dumps and haul roads |
| | • | | The underground mine and mine development |
| | • | | Open pit and underground mining equipment and support equipment |
| | • | | Six million tonnes per year capacity concentrator with crushers, SAG mills, flotation, autoclaves and cyanidation circuits for the recovery of gold |
| | • | | Two man-camps for employees |
| | • | | A hard surface air strip located approximately 7.5 km from the mine |
| | • | | Abundant water from a reservoir containing greater than 7,000,000 m3, located seven kilometres away at the Waile Creek Dam; |
| | • | | Four water treatment plants for potable water and five sewage treatment plants |
| | • | | Power supplied from the 62 MW gas-fired Hildes Power Station via a 73-km transmission line and 13 MW of diesel-powered backup power from a generator located at the mine site |
The mine area is populated with an estimated 30,000 people to 50,000 people living in housing types that range from thatch-roofed huts to conventional wooden houses.
WATER
The alternative supply of raw water, from the Kogai/Kulapi diversion, is taken from the Lower Kogai diversion as it passes the CIP pond. This water supplements the raw water stored in the head tank located near the helipad.
Potable water for the mine site is currently drawn from the Waile Creek delivery main to the raw water head tank and is processed in a treatment plant that is located alongside the raw water tank. The potable water is stored in a separate smaller head tank prior to reticulation through the mine site. If pumping from Waile Creek is minimized, then an alternative feed of raw water to this facility is required. It can be provided by gravity pipeline from Kulapi Creek or by pumping from the CIP pond.
POWER
The electrical power infrastructure at the Porgera JV site includes the following:
| | • | | 64 MW gas turbine electrical generation facility (eight units at 8 MW per unit) located at the Hides gas field in the Southern Highlands |
| | | | |
| |
Barrick Gold Corporation – Porgera Joint Venture, Project #1669 Technical Report NI 43-101 – March 16, 2012 | | | Rev. 0 Page 18-1 | |
| | |
| | www.rpacan.com |
|
| | • | | 73 km overhead power line connection to the gas turbine station |
| | • | | 13 MW six unit diesel generator set located adjacent to the processing plant |
| | • | | Connection to the Anawe (7 MW) power station |
The full Porgera JV mine site demand is currently 60 MW to 72MW. The Hides power station is capable of supplying 54 MW to 64MW, depending on the ambient air temperature at Hides. The shortfall in supply is provided by the Anawe power station, which generally runs at an average 7 MW, to augment the power supply as well as to provide voltage support compensation to the Hides power line.
| | | | |
| |
Barrick Gold Corporation – Porgera Joint Venture, Project #1669 Technical Report NI 43-101 – March 16, 2012 | | | Rev. 0 Page 18-2 | |
| | |
| | www.rpacan.com |
|
19 MARKET STUDIES AND CONTRACTS
MARKETS
Gold and silver are the principal commodities at Porger JV and are freely traded, at prices that are widely known, so that prospects for sale of any production are virtually assured. Prices are usually quoted in US dollars per troy ounce.
CONTRACTS
Porgera JV produces doré which is shipped from the site by air to the AGR Matthey Refinery in Perth, Western Australia.
| | | | |
| |
Barrick Gold Corporation – Porgera Joint Venture, Project #1669 Technical Report NI 43-101 – March 16, 2012 | | | Rev. 0 Page 19-1 | |
| | |
| | www.rpacan.com |
|
20 ENVIRONMENTAL STUDIES, PERMITTING, AND SOCIAL OR COMMUNITY IMPACT
INTRODUCTION
The Porgera JV site is located in an area that poses a number of unique challenges including:
| | • | | Challenging social factors including illegal miners. |
For all of these reasons Porgera JV uses two operational practices that are uncommon for large mining operations. They are riverine tailings disposal and erodible dumps for disposal of mudstones.
During initial permitting the PNG government and Porgera JV selected riverine tailings disposal as the method that poses the lowest risk to the environment. When Barrick acquired its interest in Porgera JV in 2006, a two-year, five million dollar study was conducted to re-evaluate the risks associated with tailings management. The same conclusion was reached: it is very difficult to ensure a stable foundation for a tailings storage facility, therefore, riverine tailings disposal is the preferred option. To improve tailings management, a cyanide destruction plant was commissioned in 2008 and in 2011 a paste backfill plant was installed in order to store a portion of the tailings underground as backfill. In November 2009 Porgera JV was certified under the International Cyanide Management Code.
Riverine tailings disposal is also used at other operations in PNG including Ok Tedi and Tolukuma. It was also used at the Bougainville Copper’s Panguna Mine prior to the time it was closed.
| | | | |
| |
Barrick Gold Corporation – Porgera Joint Venture, Project #1669 Technical Report NI 43-101 – March 16, 2012 | | | Rev. 0 Page 20-1 | |
| | |
| | www.rpacan.com |
|
Currently, Porgera JV is also developing and implementing an Environmental Management System (EMS) in preparation for certification by ISO 14001 and to meet Barrick corporate environmental standards.
ENVIRONMENTAL STUDIES
Environmental studies at Porgera JV are on-going. In 2005 a study of the erodible dumps was completed by Amec and Hydrobiology. Another review was conducted in 2011. The Porgera JV actively supports and collaborates with a wide range of research projects conducted by the Commonwealth Scientific and Industrial Research Organization (CSIRO) of Australia, universities, and non-government organizations (NGOs).
PROJECT PERMITTING
The Porgera JV operates under a Special Mining Licence (SML) issued by the Government of PNG. The original agreement process with the Government of PNG purportedly took approximately six years and ended with a Ministerial Directive. The operation still operates under the terms of that directive, which has been instrumental in curtailing unreasonable claims and actions from elements within the landowner groups.
The SML expires in 2019, but it is renewable, and the project life extends beyond this date. Major changes to the Approved Proposal for Development require State approval under the Mining Development Contract (MDC). The MDC defines a major change as either a material change in:
| | • | | The design, capacity, location or availability of the Works and Facilities including the mine water supply, infrastructure directly associated with the mining or processing of ore, and the administration building and Suyan and Alipis camps. |
| | • | | The design, capacity or availability of facilities located within the Mining Area, or in the mine plan or mine production if the material change would materially reduce the States royalties or revenue or have an adverse impact on the environment. |
| | | | |
| |
Barrick Gold Corporation – Porgera Joint Venture, Project #1669 Technical Report NI 43-101 – March 16, 2012 | | | Rev. 0 Page 20-2 | |
| | |
| | www.rpacan.com |
|
If current operations continue beyond 2019, it is believed that there may be no material changes to environmental impact and the State’s royalties and revenues would simply continue for a longer time period.
Agreements with the local populace are negotiated as needed to provide the space needed for expansion of waste storage facilities and to meet other operating requirements.
All environmental permits required to operate the Porgera JV are issued by the PNG Department of Environment and Conservation (DEC). The major permits are listed in Table 20-1.
TABLE 20-1 SUMMARY OF MAJOR PERMITS
Barrick Gold Corporation—Porgera JV
| | | | | | |
Name | | Permit Number | | Issue Date | | Expiration Data |
| | | |
Environment Plan | | | | November 29, 1988
Amended: November 16, 1994 | | |
| | | |
Power Development Plan | | | | May 10, 1990 | | |
| | | |
Environment Management Plan | | | | October 16, 1989
Amended: February 26, 2002 August 23, 2011 | | |
| | | |
Waste Discharge | | WD-L 3(121) | | November 29, 1988
Amended: January 3, 2007 July 22, 2010 | | December 31, 2053 |
| | | |
Water Extraction | | WE-L 3(91) | | November 29, 1988
Amended: January 3, 2007 July 22, 2010 | | December 31, 2053 |
| | | |
Water Investigation Mine Site to SG3 | | WI-L 3(8) | | September 28, 2006
Renewed: October 26, 2011 | | October 25, 2012 |
| | | |
Water Investigation SG3 downstream along rivers | | WI-L 3(9) | | September 28, 2006
Renewed: October 26, 2011 | | October 25, 2012 |
WASTE ROCK STORAGE/DISPOSAL
Waste rock management is permitted under the waste discharge permit [WE-L 3(121)]. It is generally split into three classifications:
| | • | | Competent waste, comprising Porgera intrusive complex rocks and altered sediment |
| | | | |
| |
Barrick Gold Corporation – Porgera Joint Venture, Project #1669 Technical Report NI 43-101 – March 16, 2012 | | | Rev. 0 Page 20-3 | |
| | |
| | www.rpacan.com |
|
| | • | | Semi-competent waste, comprising black and calcareous sediment; |
| | • | | Erodible waste, comprising Chim Formation mudstones (Yakatabari and Western Mudstone) |
Waste is further divided into potential metal leaching (PML) material and non-PML material based on sulphur and zinc grades. PML includes all potential acid forming material or any material with higher than 1,000 ppm Zn. PML material is generally competent or semi-competent, and was impounded within the stable dumps during earlier operations. RPA noted that this operating practice was subsequently abandoned and was not in use at the time of the site visit. RPA recommends that this practice should be re-instituted unless on-going, detailed waste characterization including assaying, acid-base accounting, and humidity cell tests prove that there is no possibility of PML material causing environmental concerns in the future.
MONITORING
Monitoring at Porgera JV includes collecting hydrology and sediment transport data, tailings monitoring, compliance monitoring, river monitoring, monitoring of Lake Murray, and biology monitoring. Monitoring of tailings discharge is designated under the waste discharge permit. The final tailings are discharged to the Porgera River, which in turn flows into the Lagaip River, the Strickland River, and the Fly River before entering the Gulf of Papua. River flows and natural sediment loads in this river system are relatively high compared to the inputs from the mine operation. The discharge limits for the permits were established based on the lowest drinking water standards taken from the World Health Organization (WHO), the US Environmental Protection Agency (EPA), and the Australian-New Zealand Ecosystem Protections. There is a comprehensive monitoring and testing program to ensure that the downstream effects of the discharge are maintained within the established limits and compliance with the permits is maintained.
Tailings samples are collected every two hours; the pH and weak acid dissociable (WAD) cyanide concentration are measured in the metallurgical laboratory. Environmental samples are also taken. Physical and chemical determinations such as pH, total suspended solids (TSS), and WAD cyanide are measured at the on-site
| | | | |
| |
Barrick Gold Corporation – Porgera Joint Venture, Project #1669 Technical Report NI 43-101 – March 16, 2012 | | | Rev. 0 Page 20-4 | |
| | |
| | www.rpacan.com |
|
environmental laboratory. Trace metal analyses are conducted by the Australian National Measurement Institute in Sydney. It was difficult to find a laboratory that is capable of making the determinations to the sub-parts per billion (PPB) level.
Reporting is done monthly, quarterly, and annually. Quarterly reports are submitted to the PNG DEC. The annual report is compiled by Porgera JV and specialist environmental consultants and peer reviewed by CSIRO prior to submission to the government.
SOCIAL OR COMMUNITY REQUIREMENTS
Community relations are a significant concern at Porgera JV due to the large influx of people, the local culture and customs, and the huge impact of the mine on the people of Papua New Guinea. The Porgera Environment Advisory Komiti (PEAK) was formed to provide advice, communication and review services to the mine. (Komiti is the Tok Pisin word for committee.) PEAK is an independent, skill based body comprised of members representing the PNG government, the company, and the Porgera Women’s Association. Additional members include individuals who have significant expertise or knowledge, from the Porgera communities, NGOs, and specialists from any organization with expertise relevant to sustainable development, and representing a balance of social, economic, and environmental backgrounds. The total membership does not exceed 16 members and the members of PEAK determine the frequency of the meetings. (www.peakpng.org.pg)
As with any large operation that has a finite life span, sustainable development is a major focus. Education and training are key components to any sustainable development program. Porgera JV has become a training centre for the mining industry in PNG. Employees are recruited by other mines and industries including the relatively new oil and gas industry. Porgera JV is committed to training programs and, in fact, was developing a $24 million training program at the time of the site visit.
Porgera JV also supports numerous other projects to support local people and communities including the Porgera Women’s Association which enables the independence of women, the annual Riverine Medical Patrol which checks on the health
| | | | |
| |
Barrick Gold Corporation – Porgera Joint Venture, Project #1669 Technical Report NI 43-101 – March 16, 2012 | | | Rev. 0 Page 20-5 | |
| | |
| | www.rpacan.com |
|
of remote villagers during their annual May patrol, and partnership with Conservation International which is an NGO involved in the Forest Stewards Initiative with the Hewa People of the Lagaip River.
From time to time, civil disturbances and criminal activities such as trespass; illegal mining; sabotage, particularly with respect to power; theft and vandalism have occasionally caused disruptions to operation, and temporarily halted production at Porgera.
Illegal mining is one of the principal challenges affecting the operations at Porgera JV. RPA observed illegal miners in the open pit, at the waste dumps, and at the tailings discharge area. Illegal mining, which involves trespass into the operating area of the mine, is both a security and safety issue at the Porgera mine. The illegal miners from time to time have clashed with mine security staff and law enforcement personnel who have attempted to move them away from the facilities. The presence of the illegal miners, given the nature of the mine’s operations, creates a safety issue for both the illegal miners and Porgera employees and can cause disruptions to mine operations. Following a comprehensive review of the Security function at Porgera JV conducted in 2010 and continued in 2011, numerous improvements have been made in order to strengthen alignment with international human rights standards. The law and order situation in Papua New Guinea and, in particular, around the Porgera Mine, presents a complex and challenging operating environment. Porgera JV has undertaken additional steps since 2010 to ensure that its personnel, including mine security staff, respond appropriately to civil disturbances and criminal activities in accordance with the standards Barrick has committed to uphold, including, without limitation, the Voluntary Principles on Security and Human Rights.
COMMUNITY PLANNING AND DEVELOPMENT
The Community Planning and Development section (CPD) program developed a five year plan which has key goals of building staff capacity to implement and manage the plan, improving engagement with key stakeholders, increasing income generation, developing the independence of local NGOs, and improving the quality of education in the Valley.
| | | | |
| |
Barrick Gold Corporation – Porgera Joint Venture, Project #1669 Technical Report NI 43-101 – March 16, 2012 | | | Rev. 0 Page 20-6 | |
| | |
| | www.rpacan.com |
|
A number of different strategies are planned to achieve these goals. To address staff capacity, a training needs analysis will be completed and a training program developed mainly using local staff. Improved engagement will be developed through the joint patrols, increased field work to monitor all programs such as literacy training, scouts and guides, and agricultural projects. Increasing income opportunities will be achieved by increasing access to micro credit, feasibility studies of potential business options, improved agricultural practices with monitoring and special training, and advice for existing and potential business people.
The independence of local NGOs will be delivered through implementing their strategic business plans and recruiting volunteer managers to mentor potential local managers. The improvement of education will begin with dialogue between community, schools (teachers, parents and students), government, Porgera JV, and NGOs. This dialogue is aimed at exploring options for improving education.
MINE RECLAMATION AND CLOSURE
The environmental permits specify that progressive landform rehabilitation shall be undertaken during operations including soil conservation and rehabilitation of disperse soil, stockpiles, quarry extractions sites, etc.; progressive re-vegetation shall be undertaken during operations on construction sites including access roads, stockpiles, quarry extraction sites, underground and process facility sites, etc.; and a detailed mine rehabilitation program shall be submitted five years prior to the official closure date.
Porgera JV constructs erosion control bunds and silt traps, re-vegetates areas using seedlings from local suppliers and their own nurseries. Studies of erosion rates and metal uptake rates in food crops have also been conducted (CSIRO, 2009).
SRK Consulting established the closure costs using the Barrick Reclamation Cost Estimator (BRCE) methodology and estimated the closure cost as $170 million (Barrick, 2011).
| | | | |
| |
Barrick Gold Corporation – Porgera Joint Venture, Project #1669 Technical Report NI 43-101 – March 16, 2012 | | | Rev. 0 Page 20-7 | |
| | |
| | www.rpacan.com |
|
21 CAPITAL AND OPERATING COSTS
CAPITAL COSTS
The Porgera JV mine has been in continuous operation since 1990; therefore, there are no pre-production capital costs associated with the Project. Table 21-1 is a summary of the sustaining capital costs for the Porgera JV mine. The mining department estimates that US$200 million in capital will be needed to continue its operations, processing has estimated that US$53 million will be needed, and the General and Administrative capital expenditures needed have been estimated at US$176 million. A capital cost total for the period of 2012 to 2024 has been estimated to be $466 million.
| | | | |
| |
Barrick Gold Corporation – Porgera Joint Venture, Project #1669 Technical Report NI 43-101 – March 16, 2012 | | | Rev. 0 Page 21-1 | |
| | |
| | www.rpacan.com |
|
TABLE 21-1 SUMMARY OF OPEN PIT AND UNDERGROUND SUSTAINING
CAPITAL COSTS (2011 MID-YEAR)
Barrick Gold Corporation – Porgera JV
| | | | |
Capital Cost Category | | Totals for Years 2012 -
2024
(US$ 000) | |
Open Pit Mining | | | 117,893 | |
Pre-Strip | | | — | |
Drills—Replacements | | | — | |
Drills—Rebuilds | | | 6,000 | |
Haulage Trucks—Replacements | | | 18,900 | |
Haulage Trucks—Rebuilds | | | 48,913 | |
Loading—Replacements | | | — | |
Loading—Rebuilds | | | 39,680 | |
Support Fleet Mobile Equipment | | | 4,400 | |
Fixed Equipment / Infrastructure / Mine Services | | | — | |
Light Vehicles | | | — | |
Other | | | — | |
Underground Mining | | | 71,511 | |
Deferred Dev. (distribution from operating costs) | | | 52,031 | |
Deferred Dev. (Contractor) | | | — | |
Drills—Replacements | | | 2,500 | |
Drills—Rebuilds | | | 6,050 | |
Haulage Trucks—Replacements | | | — | |
Haulage Trucks—Rebuilds | | | 3,599 | |
Loaders—Replacements | | | 1,000 | |
Loaders—Rebuilds | | | 4,796 | |
Support Fleet Mobile Equipment | | | 536 | |
Fixed Equipment / Infrastructure / Mine Services | | | — | |
Light Vehicles | | | — | |
Other | | | 1,000 | |
Processing | | | 53,230 | |
Leach Pad Expansion | | | — | |
Tailings Expansion | | | — | |
Processing Facilities—New | | | 4,980 | |
Processing Facilities—Replacement | | | 7,500 | |
Processing Facilities—Upgrades | | | 6,500 | |
Other Process Related Infrastructure | | | 32,350 | |
Port Facility | | | — | |
Light Vehicles | | | — | |
Other | | | 1,900 | |
G&A | | | 176,423 | |
Capitalized Costs (distribution from operating costs) | | | — | |
Environmental | | | 2,500 | |
Site Services—Power | | | 74,428 | |
Site Services—Other Non-core | | | 4,711 | |
Information Technology | | | 2,074 | |
Security | | | 5,000 | |
Land | | | 80,000 | |
Light Vehicles | | | 4,650 | |
Other | | | 3,060 | |
Other | | | 47,730 | |
Capitalized Drilling | | | 18,000 | |
Other | | | 29,730 | |
Grand Total | | | 466,788 | |
| | | | |
| |
Barrick Gold Corporation – Porgera Joint Venture, Project #1669 Technical Report NI 43-101 – March 16, 2012 | | | Rev. 0 Page 21-2 | |
| | |
| | www.rpacan.com |
|
OPERATING COSTS
Operating costs for the Project are summarized in Table 21-2.
| | | | |
| |
Barrick Gold Corporation – Porgera Joint Venture, Project #1669 Technical Report NI 43-101 – March 16, 2012 | | | Rev. 0 Page 21-3 | |
| | |
| | www.rpacan.com |
|
TABLE 21-2 SUMMARY OF OPEN PIT OPERATING COSTS (2011 MID-YEAR)
Barrick Gold Corporation – Porgera JV
| | | | | | | | |
Cost Category | | Units | | | Value | |
Open Pit Mining | | | | | | | | |
Drilling | | US$ | /t | (mined) | | | | |
Blasting | | US$ | /t | (mined) | | | | |
Loading | | US$ | /t | (mined) | | | 1.00 | |
Hauling | | US$ | /t | (mined) | | | 0.72 | |
Mine Overhead | | US$ | /t | (mined) | | | 0.22 | |
Ancillary Equipment | | US$ | /t | (mined) | | | 0.26 | |
Fuel, Oil and Gas | | US$ | /t | (mined) | | | 0.93 | |
Maintenance Overhead | | US$ | /t | (mined) | | | 0.27 | |
Inflation | | US$ | /t | (mined) | | | 0.16 | |
Mining Subtotal | | US$ | /t | (mined) | | | 3.57 | |
Processing | | US$ | /t | (milled) | | | | |
Primary Crusher | | US$ | /t | (milled) | | | 0.60 | |
Mill Administration | | US$ | /t | (milled) | | | 0.38 | |
Mill Training | | US$ | /t | (milled) | | | 0.05 | |
Grinding | | US$ | /t | (milled) | | | 5.38 | |
Concentrator | | US$ | /t | (milled) | | | 2.16 | |
Pressure Oxidation | | US$ | /t | (milled) | | | 3.33 | |
Oxygen Plant | | US$ | /t | (milled) | | | 2.66 | |
Refining | | US$ | /t | (milled) | | | 1.65 | |
Water Systems | | US$ | /t | (milled) | | | 0.44 | |
Lime Plant | | US$ | /t | (milled) | | | 1.42 | |
Lime Delivery | | US$ | /t | (milled) | | | 0.16 | |
Secondary Crusher | | US$ | /t | (milled) | | | 0.10 | |
Technical Services | | US$ | /t | (milled) | | | 0.27 | |
Maintenance Overhead | | US$ | /t | (milled) | | | 2.49 | |
Inflation | | US$ | /t | (milled) | | | 0.73 | |
Processing Subtotal | | US$ | /t | (milled) | | | 21.82 | |
General and Administration | | US$ | /t | (milled) | | | | |
Management (less selling) | | US$ | /t | (milled) | | | 1.43 | |
Commercial | | US$ | /t | (milled) | | | 2.46 | |
Sustaining Development | | US$ | /t | (milled) | | | 2.15 | |
Human Resources | | US$ | /t | (milled) | | | 3.57 | |
Asset Protection | | US$ | /t | (milled) | | | 1.99 | |
Occupational Health & Safety | | US$ | /t | (milled) | | | 0.28 | |
Selling Expenses | | US$ | /t | (milled) | | | 0.24 | |
Silver Credits | | US$ | /t | (milled) | | | -0.01 | |
Inflation | | US$ | /t | (milled) | | | 0.47 | |
G&A Subtotal | | US$ | /t | (milled) | | | 12.57 | |
From Porgera MY 2011 Cut-off Grade Report
| | | | |
| |
Barrick Gold Corporation – Porgera Joint Venture, Project #1669 Technical Report NI 43-101 – March 16, 2012 | | | Rev. 0 Page 21-4 | |
| | |
| | www.rpacan.com |
|
The 2011 end of year operating costs are summarized in Table 21-3 and Table 21-4. Table 21-3 represents the unit operating costs on a per ounce of gold basis, and Table 21-4 summarizes the unit costs on a per milled-tonne basis. In 2011, there were approximately 5.344 million tonnes milled compared to a budget of 5.897 Mt.
TABLE 21-3 PORGERA 2011 COST PER OUNCE GOLD PRODUCED
Barrick Gold Corporation – Porgera JV
| | | | | | | | | | | | | | | | |
Department Description | | Actual Cost
(US$/oz) | | | Budget Cost
(US$/oz) | | | Difference
(US$/oz) | | | YTD Var
(%). | |
Open Pit Total | | | 275 | | | | 173 | | | | 102 | | | | 58.8 | |
Underground Total | | | 85 | | | | 50 | | | | 35 | | | | 70.0 | |
Mill Total | | | 240 | | | | 154 | | | | 86 | | | | 55.8 | |
Maintenance Total | | | 62 | | | | 43 | | | | 20 | | | | 45.9 | |
Sustainable Development Total | | | 9 | | | | 6 | | | | 3 | | | | 49.3 | |
Exploration Total | | | 0 | | | | — | | | | 0 | | | | — | |
Strategic Total | | | 4 | | | | 7 | | | | (2 | ) | | | (34.5 | ) |
Accounting Total | | | 2 | | | | 4 | | | | (2 | ) | | | (47.7 | ) |
Supply Total | | | 12 | | | | 6 | | | | 6 | | | | 92.1 | |
Business Improvement Total | | | 11 | | | | 11 | | | | (0 | ) | | | (0.9 | ) |
Security Total | | | 25 | | | | 19 | | | | 6 | | | | 30.5 | |
Personnel Total | | | 10 | | | | 10 | | | | (0 | ) | | | (3.2 | ) |
Occupational Health & Safety Total | | | 5 | | | | 3 | | | | 2 | | | | 48.0 | |
Community Affairs Total | | | 15 | | | | 11 | | | | 4 | | | | 38.5 | |
Admin General Services Total | | | 58 | | | | 33 | | | | 25 | | | | 77.5 | |
Administration & Selling Total | | | 20 | | | | 13 | | | | 7 | | | | 52.9 | |
Indirect Costs Total | | | 6 | | | | — | | | | 6 | | | | — | |
Total | | | 841 | | | | 543 | | | | 297 | | | | 54.8 | |
| | | | |
| |
Barrick Gold Corporation – Porgera Joint Venture, Project #1669 Technical Report NI 43-101 – March 16, 2012 | | | Rev. 0 Page 21-5 | |
| | |
| | www.rpacan.com |
|
TABLE 21-4 2011 COST PER MILLED TONNE
Barrick Gold Corporation – Porgera JV
| | | | | | | | | | | | | | | | |
Department Description | | Actual Cost
(US$/t milled) | | | Budget Cost
(US$/t milled) | | | Difference
(US$/t milled) | | | YTD Var
(%.) | |
Open Pit Total | | | 26.78 | | | | 19.96 | | | | 6.82 | | | | 34.2 | |
Underground Total | | | 8.30 | | | | 5.78 | | | | 2.52 | | | | 43.6 | |
Mill Total | | | 23.39 | | | | 17.77 | | | | 5.62 | | | | 31.7 | |
Maintenance Total | | | 6.04 | | | | 4.90 | | | | 1.14 | | | | 23.3 | |
Sustainable Development Total | | | 0.86 | | | | 0.68 | | | | 0.18 | | | | 26.1 | |
Exploration Total | | | 0.01 | | | | — | | | | 0.01 | | | | — | |
Strategic Total | | | 0.43 | | | | 0.79 | | | | (0.35 | ) | | | (44.7 | ) |
Accounting Total | | | 0.18 | | | | 0.41 | | | | (0.23 | ) | | | (55.8 | ) |
Supply Total | | | 1.20 | | | | 0.74 | | | | 0.46 | | | | 62.3 | |
Business Improvement Total | | | 1.04 | | | | 1.24 | | | | (0.20 | ) | | | (16.3 | ) |
Security Total | | | 2.46 | | | | 2.23 | | | | 0.23 | | | | 10.3 | |
Personnel Total | | | 0.96 | | | | 1.17 | | | | (0.21 | ) | | | (18.3 | ) |
Occupational Health & Safety Total | | | 0.46 | | | | 0.37 | | | | 0.09 | | | | 25.0 | |
Community Affairs Total | | | 1.50 | | | | 1.28 | | | | 0.22 | | | | 17.0 | |
Admin General Services Total | | | 5.63 | | | | 3.75 | | | | 1.88 | | | | 50.0 | |
Administration & Selling Total | | | 1.91 | | | | 1.48 | | | | 0.43 | | | | 29.2 | |
Indirect Costs Total | | | 0.62 | | | | — | | | | 0.62 | | | | — | |
Total | | | 81.78 | | | | 62.56 | | | | 19.23 | | | | 30.7 | |
MANPOWER
Manpower for the Porgera JV project is summarized in Table 21-5. The budget manpower was estimated to be 2,735, but actual has been lower at 2,545.
TABLE 21-5 SUMMARY OF MANPOWER AS OF MARCH 2011
Barrick Gold Corporation – Porgera JV
| | | | | | | | |
Category | | Actual | | | Plan | |
Expatriates | | | 170 | | | | 210 | |
PNG National Staff | | | 1,094 | | | | 1,178 | |
PNG National Award | | | 1,281 | | | | 1,347 | |
Total | | | 2,545 | | | | 2,735 | |
| | | | |
| |
Barrick Gold Corporation – Porgera Joint Venture, Project #1669 Technical Report NI 43-101 – March 16, 2012 | | | Rev. 0 Page 21-6 | |
| | |
| | www.rpacan.com |
|
22 ECONOMIC ANALYSIS
Under NI 43-101 rules, producing issuers may exclude the information required for Section 22—Economic Analysis, on properties currently in production, unless the technical report includes a material expansion of current production. RPA notes that Barrick is a producing issuer, the Porgera JV mine is currently in production, and a material expansion is not being planned. RPA has performed an economic analysis of the Porgera JV mine using the estimates presented in this report and confirms that the outcome is a positive cash flow that supports the statement of Mineral Reserves.
| | | | |
| |
Barrick Gold Corporation – Porgera Joint Venture, Project #1669 Technical Report NI 43-101 – March 16, 2012 | | | Rev. 0 Page 22-1 | |
| | |
| | www.rpacan.com |
|
23 ADJACENT PROPERTIES
There are no significant prospects or producers adjacent to the Porgera JV mine property.
| | | | |
| |
Barrick Gold Corporation – Porgera Joint Venture, Project #1669 Technical Report NI 43-101 – March 16, 2012 | | | Rev. 0 Page 23-1 | |
| | |
| | www.rpacan.com |
|
24 OTHER RELEVANT DATA AND INFORMATION
No additional information or explanation is necessary to make this Technical Report understandable and not misleading.
| | | | |
| |
Barrick Gold Corporation – Porgera Joint Venture, Project #1669 Technical Report NI 43-101 – March 16, 2012 | | | Rev. 0 Page 24-1 | |
| | |
| | www.rpacan.com |
|
25 INTERPRETATION AND CONCLUSIONS
Based on the site visit and review, RPA draws the following conclusions:
GEOLOGY AND MINERAL RESOURCES
| | • | | Sampling methods and protocols are consistent with common industry standards and appropriate for the style of mineralization. |
| | • | | The data capture is conducted in an appropriate fashion, with a reasonable level of safe-guards and validation. |
| | • | | The database is maintained using secure protocols and industry-standard software. |
| | • | | The assaying is done using methods commonly used in the industry and appropriate for the grades, deposit type and style of mineralization. |
| | • | | A minimum level of independent assay QA/QC checking is applied. Assay repeatability is observed to be poor for gold, and the use of metallics screen assays is being contemplated. |
| | • | | RPA noted some minor errors in the database. However, in RPA’s opinion the sample database is reasonably free from error and adequate for use in estimation of Mineral Resources and Mineral Reserves. |
| | • | | Mineral Resource estimates are carried out using methods that are, for the most part, conventional and commonly used within the industry, using software that is commercially available. Certain geostatistical and statistical analyses are conducted using in-house software. |
| | • | | There is a good understanding of the geology, mineralogy and deposit model. The geological interpretations of the mineralized zones and the wireframe models derived from those interpretations are reasonable. |
| | • | | Parameters for grade estimation are derived using reasonable and appropriate interpretations of the geology, statistics, and geostatistics. |
| | • | | There are a number of mineralized zones that have been intersected by drill holes but have not yet been fully defined. Most often, these zones are located in the background domains. The block models for these domains are poorly constrained, which results in excessive dilution in some cases, and unrealistic extrapolation of grades in others. These zones require further drilling, interpretation, and wireframe modeling to fully evaluate their potential and bring them into the Mineral Reserves. As an interim solution, Porgera JV mine staff have implemented an estimation strategy which employs search ellipsoids with highly restricted cross-strike radii (the “Statistically Controlled” method). |
| | | | |
| |
Barrick Gold Corporation – Porgera Joint Venture, Project #1669 Technical Report NI 43-101 – March 16, 2012 | | | Rev. 0 Page 25-1 | |
| | |
| | www.rpacan.com |
|
| | • | | The implementation of the Statistically Controlled interpolation method has resulted in the addition of significant volumes of Mineral Resources to the inventory. In RPA’s opinion, this method is acceptable for use in estimation of Inferred Mineral Resources. It will require some time to assess the performance of this estimation method through tracking of the Inferred material through upgrade to Indicated and Measured. |
| | • | | Other recent modifications to the estimation methodology include the application of a two drill hole minimum per block, and a conversion of the classification scheme to one based on distance from samples. These changes are being implemented to bring the process more in line with the guidelines imposed by Barrick’s Tuscon Resource Group. |
| | • | | The Measured and Indicated Mineral Resources total 26.1 million tonnes at a grade of 2.41 g/t Au, containing 2.03 million ounces of gold. |
| | • | | The Inferred Mineral Resources total 21.6 million tonnes at a grade of 4.45 g/t Au, containing 3.09 million ounces of gold. |
| | • | | Resource classification is reasonable and consistent with the requirements of NI 43-101. |
| | • | | Block model validation techniques are reasonably rigorous and do not indicate that there are any major issues with the grade interpolations. |
| | • | | The mine staff apply an appropriate level of rigour in demonstrating that the Mineral Resources have a reasonable prospect of economic extraction. |
| | • | | The cut-off grades applied are reasonable. |
| | • | | The resource estimate procedures are not very well documented, primarily due to the scheduling of a new set of block models for year end. Reports for some zones (e.g. PX and EDX) in the underground mine are up to six years old and require updates. |
| | • | | There are exploration targets in and around the Porgera JV mine that could provide additional Mineral Reserves in the future. |
MINING AND MINERAL RESERVES
| | • | | RPA finds the Mineral Reserve estimates to be conservative, reasonable, acceptable, and compliant with NI 43-101. The Mineral Reserves are generated based upon the mine designs applied to the Mineral Resources. The design methodology uses both the cut-off grade estimation and economic assessment to design and validate the mineable reserves. Schedules are generated using industry-accepted methods and programs. |
| | • | | Open pit, underground, and stockpile Proven and Probable Mineral Reserves total 72.0 million tonnes at a grade of 2.90 g/t, containing 6.70 million ounces of gold. |
| | | | |
| |
Barrick Gold Corporation – Porgera Joint Venture, Project #1669 Technical Report NI 43-101 – March 16, 2012 | | | Rev. 0 Page 25-2 | |
| | |
| | www.rpacan.com |
|
| | • | | The total closing stockpile as of December 31, 2010 was 22.0 million tonnes at 2.35 g/t Au and 2.62% S for 1.66 million ounces. The total closing stockpile as of December 31, 2011 was 19.8 million tonnes at 2.29 g/t Au for 1.46 million ounces. |
| | • | | As of December 31, 2011 the mine has produced approximately 17.4 million ounces of gold. Current mine life based on the Mineral Reserves only is approximately eight years. |
| | • | | The location of the Project creates many challenges for the mine planning and mine operations departments. Listed below are some the challenges that Porgera JV faces: |
| | • | | Dewatering of the meteoric waters is a major challenge, which can impact the open pit slope stability; |
| | • | | Given the impacts of surface and ground waters and lithologies found in the open pit and underground, the ground control conditions can be difficult, which can result in highwall failures; |
| | • | | The Project is in a very remote area of Papua New Guinea that lays in high relief terrain, and experiences yearly precipitation of greater than two metres; |
| | • | | Maintaining the equipment with an experienced staff and sustaining an adequate of supply of spare parts is continually being addressed by the Porgera JV management team; |
PROCESS
| | • | | Although the equations used to estimate gold recovery appear to be accurate, they are very complex. RPA observed that communication as to how the estimates are developed was deficient between the process department and the technical services department. As a result the equations are not used in the cut-off-grade calculations or the Resource and Reserve models. Historical metal recovery has been approximately 86%. |
ENVIRONMENTAL AND COMMUNITY CONSIDERATIONS
| | • | | The practice of segregating potential metal leaching material was initially used in the operation but was subsequently abandoned and was not in use at the time of the RPA site visit. |
| | • | | Illegal mining is one of the principal challenges affecting the operations. |
ECONOMIC ANALYSIS
| | • | | Recovered gold ounces are estimated to be 5.68 million for the period between 2012 and 2025. Mining will be active until 2020, after which time, stockpiles will be reclaimed to provide mill feed. |
| | | | |
| |
Barrick Gold Corporation – Porgera Joint Venture, Project #1669 Technical Report NI 43-101 – March 16, 2012 | | | Rev. 0 Page 25-3 | |
| | |
| | www.rpacan.com |
|
| | • | | RPA notes that the economic analysis confirms that the material classified as Mineral Reserves is supported by a positive economic analysis. |
| | • | | The Porgera JV has suffered from lack of expenditures to maintain the facilities. |
| | | | |
| |
Barrick Gold Corporation – Porgera Joint Venture, Project #1669 Technical Report NI 43-101 – March 16, 2012 | | | Rev. 0 Page 25-4 | |
| | |
| | www.rpacan.com |
|
26 RECOMMENDATIONS
RPA makes the following recommendations:
GEOLOGY AND MINERAL RESOURCES
| | • | | Porgera JV mine staff are planning to amend the assay QA/QC protocols to include screen metallics analysis in order to try and improve repeatability. RPA concurs with this approach and recommends that it continue. |
| | • | | Exploration work should continue in order to continue to add new Mineral Resources. |
| | • | | The SC method should only be used to estimate Inferred Mineral Resources. |
| | • | | Efforts to simplify the estimation methodologies should continue. However, RPA recommends changes should be implemented gradually and only with complete understanding of the effects of each change. |
| | • | | The present documentation for the resource estimates is fragmented and out-of-date. A single report document should be prepared which describes the methodologies and parameters used in the estimation process. |
MINING AND MINERAL RESERVES
| | • | | RPA recommends that a single resource model be used for both the open pit and underground mine planning. |
| | • | | Another open pit evaluation should be completed at higher gold prices, which should enable the mine to produce a larger open pit beyond the current pit limits. |
| | • | | A concerted effort to eliminate and/or severely reduce surface waters from entering the open pit should be undertaken. |
| | • | | Dilution and ore recovery from the underground stopes needs to be improved. |
| | • | | Longhole drilling accuracy should be reviewed and a quality control program instituted. Modifications to stope drilling and blasting patterns, which would have less impact on the hanging wall should be investigated. |
PROCESS
| | • | | RPA recommends that the process department and the technical services department work together to simplify the equations used to estimate gold recovery so they can be used in the cut-off grade calculations and in the Resource and Reserve estimates. |
| | | | |
| |
Barrick Gold Corporation – Porgera Joint Venture, Project #1669 Technical Report NI 43-101 – March 16, 2012 | | | Rev. 0 Page 26-1 | |
| | |
| | www.rpacan.com |
|
ENVIRONMENTAL AND SOCIAL AND COMMUNITY CONSIDERATIONS
| | • | | RPA recommends that the practice of segregating PML material and impounding it within competent waste that is not PML should be re-instituted unless on-going, detailed waste characterization including assaying, acid-base accounting, and humidity cell tests prove that there is no possibility of PML material causing environmental concerns in the future. |
| | • | | Porgera JV should continue to focus on plans and systems that ensure relocations are handled in a timely manner. |
ECONOMIC ANALYSIS
| | • | | RPA notes that the economic analysis confirms that the material classified as Mineral Reserves is supported by a positive economic analysis. |
| | | | |
| |
Barrick Gold Corporation – Porgera Joint Venture, Project #1669 Technical Report NI 43-101 – March 16, 2012 | | | Rev. 0 Page 26-2 | |
| | |
| | www.rpacan.com |
|
27 REFERENCES
Agnew, P. and Bassotti, M.; November 2008, Porgera Resource Estimation Open Pit & Underground December 2008, internal report to Porgera Joint Venture, 89 pp.
Agnew, P. and Bassotti, M.; February 2010, Porgera Resource Estimation Open Pit & Underground December 2008, internal report to Porgera Joint Venture, 117 pp.
Barrick Gold Corporation (a), “Porgera JV”, Retrieved October 24, 2011 fromwww.barrick.com/GlobalOperations/AustraliaPacific/PorgeraJV
Barrick Gold Corporation (b), “Company”, Retrieved October 24, 2011 fromwww.barrick.com/Company/Profile
Barrick Gold Corporation (c), “Corporate Responsibility/ Key Issues”, Retrieved January 9, 2012, www.barrick.com/CorporateResponsibility/KeyTopics/PorgeraJV/IllegalMining
Barrick Porgera, December 2010, Report on the Mineral Resource and Ore Reserve Estimations for the Porgera Joint Venture as at 31st December 2010.
Barrick Porgera, 2010: 2010 MY Cut-Off Grade Estimation, internal report to Porgera Joint Venture, pp24.
Bassotti, M., 2010; East Zone Resource Estimation, June 2010, internal report to Porgera Joint Venture, 28 pp.
Bassotti, M., Robertson, B., du Plessis, E., Yowa, G., Beatty, M., January 2012: Comparative Analysis Between YE 2011 and MY 2010 Resource and Reserve, internal memo to Porgera Joint Venture, 14 pp.
Beatty, M., June 2011: 2011 OP Cut-Off Grade Report Porgera Mine, internal memo to Porgera JV, 21 pp.
Butcher, R. and Smith, G., March 2010: RBU Guidance For Life of Mine Planning, internal memo, 2 pp.
du Plessis, E., December 2011: 2011 End of Year Resources and Reserves Changes, internal memo to Porgera Joint Venture, 4 pp.
Fleming, A. W., Handley, G. A., Williams, K. L., Hills, A. L., and Corbett, G. J.; 1986, The Porgera Gold Deposit, Papua New Guinea, Economic Geology, Vol. 81, pp. 660 – 680.
Handley, G. A., and Bradshaw, P. M. D.; 1985, The Porgera Gold Deposit, Papua New Guinea, Proceedings of Gold ‘86 Symposium, Toronto, 9 pp.
Jooste, Johan, June 2011: 2011 UG Cut-Off Grade Report Porgera Mine, internal report to Porgera Joint Venture, 21 pp.
| | | | |
| |
Barrick Gold Corporation – Porgera Joint Venture, Project #1669 Technical Report NI 43-101 – March 16, 2012 | | | Rev. 0 Page 27-1 | |
| | |
| | www.rpacan.com |
|
Lewis, R.; 2009, Open Pit Resource Estimate April 2009—Notes, internal memo report to Porgera Joint Venture, 16 pp.
Lewis, R.; February 2010, Summary of LMRC Models, internal memo report to Porgera Joint Venture, 16 pp.
Lewis, R.; 2010, Open Pit Resource Estimate April 2010—Notes, internal memo report to Porgera Joint Venture, 4 pp.
Mullany, I., March 2011: ABX Tier Descriptions, internal memo, 4 pp.
Orogen Minerals Ltd., 2001, Regional Workshop on the Constraints, Challenges and Prospects for the Commodity-Based Development and Diversification in the Pacific Island Economies, 18-10 August 2001, Tanoa International Hotel, Nadi, Fiji. Retrieved fromhttp://www.unctad.org/infocomm/Diversification/nadi on November 7, 2011.
PEAK,www.peakpng.org.pg, Retrieved January 9, 2012
PJV Environment, Porgera Joint Venture 2011 Calendar
Porgera Joint Venture, June 2010, Environmental Monitoring 2009 Annual Report, January – December 2009
Richards, J.P. and Kerrich, R. 1993: The Porgera Gold Mine, Papua New Guinea; Magmatic Hydrothermal to Epithermal Evolution of an Alkalic-type Precious Metal Deposit, Economic Geology, August 1993; v.88; no.5; pp.1017-1052.
Robertson, B., Bassotti, M., and du Plessis, E., June 2011: Comparative Analysis Between YE 2010 and MY 2011 Resources and Reserves, internal memo to Porgera Joint Venture, 17 pp.
Ronacher, E., et al., 2004: Characteristics and Evolution of the Hydrothermal Fluid in the North Zone High Grade Area, Porgera Gold Deposit, Papua New Guinea, Economic Geology , August 2004; v.99; no. 5; pp. 843-867
Porgera Technical Staff, December 2, 2008; Summary of 2008 YE Mineral Resources and Mineral Reserves, internal memo to management, 9 pp.
Porgera Technical Staff, (Date unknown); AHD Feasibility Study, Draft For Peer Review, 163 pp.
Scott Wilson RPA, 2009: Report on Audit of Mineral Resources and Mineral Reserves for the Porgera Mine, Papua New Guinea. Prepared for Barrick Gold Corporation.
Sims, R., November 2011: End 2011 Reserve and Resource Reporting Template, internal memo to Barrick Operations and Projects Staff, 9 pp.
Taimre, T., 2009: AHD Resource Estimate November 2009, internal report, 26 pp.
| | | | |
| |
Barrick Gold Corporation – Porgera Joint Venture, Project #1669 Technical Report NI 43-101 – March 16, 2012 | | | Rev. 0 Page 27-2 | |
| | |
| | www.rpacan.com |
|
Taimre, T., 2009: Project X Resource Estimate November 2009, internal report, 26 pp.
Woodall, C., Lindsay, J., and Sims, R., October 2010: 2010 Year-End Resource and Reserve Reporting Guidelines, internal memo, 3 pp.
Woodall, C., Mullany, I., Lindsay, J., and Sims, R., March 2011: 2011 Mid-Year and Year-End Resource and Reserve Reporting Guidelines, internal memo, 3 pp.
| | | | |
| |
Barrick Gold Corporation – Porgera Joint Venture, Project #1669 Technical Report NI 43-101 – March 16, 2012 | | | Rev. 0 Page 27-3 | |
| | |
| | www.rpacan.com |
|
28 DATE AND SIGNATURE PAGE
This report titled Technical Report on the Porgera Joint Venture, Enga Province, Papua New Guinea and dated March 16, 2012 was prepared and signed by the following authors:
| | |
| | (Signed & Sealed) “David W. Rennie” |
Dated at Vancouver, BC March 16, 2012 | | Dave W. Rennie, P.Eng. Principal Geologist |
| |
| | (Signed & Sealed) “Stuart E. Collins” |
Dated at Lakewood, CO March 16, 2012 | | Stuart E. Collins, P.E. Principal Mining Engineer |
| |
| | (Signed & Sealed) “Kathleen Ann Altman” |
Dated at Lakewood, CO March 16, 2012 | | Kathleen Ann Altman, Ph.D., P.E. Principal Metallurgical Engineer |
| | | | |
| |
Barrick Gold Corporation – Porgera Joint Venture, Project #1669 Technical Report NI 43-101 – March 16, 2012 | | | Rev. 0 Page 28-1 | |
| | |
| | www.rpacan.com |
|
29 CERTIFICATE OF QUALIFIED PERSON
DAVID W. RENNIE
I, David W. Rennie, P.Eng., as an author of this report entitled “Technical Report on the Porgera Joint Venture, Enga Province, Papua New Guinea” prepared for Barrick Gold Corporation, and dated March 16, 2012, do hereby certify that:
| | 1. | I am a Principal Geologist with Roscoe Postle Associates Inc. My office address is Suite 388, 1130 West Pender Street, Vancouver, British Columbia, Canada V6E 4A4. |
| | 2. | I am a graduate of the University of British Columbia in 1979 with a Bachelor of Applied Science degree in Geological Engineering. |
| | 3. | I am registered as a Professional Engineer in the Province of British Columbia (Reg.# 13572). I have worked as a geological engineer for a total of 30 years since my graduation. My relevant experience for the purpose of the Technical Report is: |
| | • | | Review and report as a consultant on numerous exploration and mining projects around the world for due diligence and regulatory requirements. |
| | • | | Consultant Geologist to a number of major international mining companies providing expertise in conventional and geostatistical resource estimation for properties in North and South Americas, and Africa. |
| | • | | Chief Geologist and Chief Engineer at a gold-silver mine in southern B.C. |
| | • | | Exploration geologist in charge of exploration work and claim staking with two mining companies in British Columbia. |
| | 4. | I have read the definition of “qualified person” set out in National Instrument 43-101 (NI 43-101) and certify that by reason of my education, affiliation with a professional association (as defined in NI 43-101) and past relevant work experience, I fulfill the requirements to be a “qualified person” for the purposes of NI 43-101. |
| | 5. | I visited the Porgera Joint Venture from August 28 to September 2, 2011. |
| | 6. | I am responsible for overall preparation and for the preparation of Sections 3 through 12, 14, 23, and 24 and contributed to Sections 1, 2, 25 and 26 of the Technical Report. |
| | 7. | I am independent of the Issuer applying the test set out in Section 1.5 of NI 43-101. |
| | 8. | I participated in an audit and preparation of a Technical Report for the Porgera Mine in 2009. |
| | 9. | I have read NI 43-101, and the Technical Report has been prepared in compliance with NI 43-101 and Form 43-101F1. |
| | | | |
| |
Barrick Gold Corporation – Porgera Joint Venture, Project #1669 Technical Report NI 43-101 – March 16, 2012 | | | Rev. 0 Page 29-1 | |
| | |
| | www.rpacan.com |
|
| | 10. | At the effective date of the Technical Report, to the best of my knowledge, information, and belief, the Technical Report contains all scientific and technical information that is required to be disclosed to make the Technical Report not misleading. |
Dated this 16th day of March, 2012
(Signed & Sealed)“David W. Rennie”
David W. Rennie, P. Eng.
| | | | |
| |
Barrick Gold Corporation – Porgera Joint Venture, Project #1669 Technical Report NI 43-101 – March 16, 2012 | | | Rev. 0 Page 29-2 | |
| | |
| | www.rpacan.com |
|
STUART E. COLLINS
I, Stuart E. Collins, P.E., as an author of this report entitled “Technical Report on the Porgera Joint Venture, Enga Province, Papua New Guinea” prepared for Barrick Gold Corporation, and dated March 16, 2012, do hereby certify that:
| | 1. | I am Principal Mining Engineer with Roscoe Postle (USA) Ltd. of 143 Union Boulevard, Suite 505, Lakewood, Colorado, USA 80228. |
| | 2. | I am a graduate of South Dakota School of Mines and Technology, Rapid City, South Dakota, U.S.A., in 1985 with a B.S. degree in Mining Engineering. |
| | 3. | I am a Registered Professional Engineer in the state of Colorado (#29455). I have been a member of the Society for Mining, Metallurgy, and Exploration (SME) since 1975, and a Registered Member (#612514) since September 2006. I have worked as a mining engineer for a total of 25 years since my graduation. My relevant experience for the purpose of the Technical Report is: |
| | • | | Review and report as a consultant on numerous exploration, development and production mining projects around the world for due diligence and regulatory requirements; |
| | • | | Mine engineering, mine management, mine operations and mine financial analyses, involving copper, gold, silver, nickel, cobalt, uranium, coal and base metals located in the United States, Canada, Mexico, Turkey, Bolivia, Chile, Brazil, Costa Rica, Peru, Argentina and Colombia. |
| | • | | Engineering Manager for a number of mining-related companies; |
| | • | | Business Development for a small, privately-owned mining company in Colorado; |
| | • | | Operations supervisor at a large gold mine in Nevada, USA ; |
| | • | | Involvement with the development and operation of a small underground gold mine in Arizona, USA. |
| | 4. | I have read the definition of “qualified person” set out in National Instrument 43-101 (NI 43-101) and certify that by reason of my education, affiliation with a professional association (as defined in NI 43-101) and past relevant work experience, I fulfill the requirements to be a “qualified person” for the purposes of NI 43-101. |
| | 5. | I visited the Porgera Joint Venture from August 28 to September 2, 2012. |
| | 6. | I am responsible for preparation of Sections 15, 16, 19, 21, 22 and contributed to Sections 1, 2, 25, and 26 of the Technical Report. |
| | 7. | I am independent of the Issuer applying the test set out in Section 1.5 of NI 43-101. |
| | 8. | I have had no prior involvement with the property that is the subject of the Technical Report. |
| | 9. | I have read NI 43-101, and the Technical Report has been prepared in compliance with NI 43-101 and Form 43-101F1. |
| | | | |
| |
Barrick Gold Corporation – Porgera Joint Venture, Project #1669 Technical Report NI 43-101 – March 16, 2012 | | | Rev. 0 Page 29-3 | |
| | |
| | www.rpacan.com |
|
| | 10. | At the effective date of the Technical Report, to the best of my knowledge, information, and belief, the Technical Report contains all scientific and technical information that is required to be disclosed to make the Technical Report not misleading. |
Dated this 16th day of March, 2012
(Signed & Sealed)“Stuart E. Collins”
Stuart E. Collins, P.E.
| | | | |
| |
Barrick Gold Corporation – Porgera Joint Venture, Project #1669 Technical Report NI 43-101 – March 16, 2012 | | | Rev. 0 Page 29-4 | |
| | |
| | www.rpacan.com |
|
KATHLEEN ANN ALTMAN
I Kathleen Ann Altman, P.E., as an author of this report entitled “Technical Report on the Porgera Joint Venture, Enga Province, Papua New Guinea” prepared for Barrick Gold Corporation and dated March 16, 2012, do hereby certify that:
| | 1. | I am Principal Metallurgist with Roscoe Postle (USA) Ltd. of Suite 505, 143 Union Boulevard, Lakewood, Co., USA 80228. |
| | 2. | I am a graduate of the Colorado School of Mines in 1980 with a B.S in Metallurgical Engineering. I am a graduate of the University of Nevada, Reno Mackay School of Mines with an M.S. in Metallurgical Engineering in 1994 and a Ph.D. in Metallurgical Engineering in 1999. |
| | 3. | I am registered as a Professional Engineer in the State of Colorado (Reg.# 37556) and a Qualified Professional Member of the Mining and Metallurgical Society of America (Member # 01321QP). I have worked as a metallurgical engineer for a total of 30 years since my graduation. My relevant experience for the purpose of the Technical Report is: |
| | • | | I have worked for operating companies, including the Climax Molybdenum Company, Barrick Goldstrike, and FMC Gold in a series of positions of increasing responsibility. |
| | • | | I have worked as a consulting engineer on mining projects for approximately 15 years in roles such a process engineer, process manager, project engineer, area manager, study manager, and project manager. Projects have included scoping, prefeasibility and feasibility studies, basic engineering, detailed engineering and start-up and commissioning of new projects. |
| | • | | I was the Newmont Professor for Extractive Mineral Process Engineering in the Mining Engineering Department of the Mackay School of Earth Sciences and Engineering at the University of Nevada, Reno from 2005 to 2009. |
| | 4. | I have read the definition of “qualified person” set out in National Instrument 43-101 (NI 43-101) and certify that by reason of my education, affiliation with a professional association (as defined in NI 43-101) and past relevant work experience, I fulfill the requirements to be a “qualified person” for the purposes of NI 43-101. |
| | 5. | I visited the Porgera Joint Venture from August 28 to September 2, 2011. |
| | 6. | I am responsible for the preparation of Sections 13, 17, 18, 19 and 20 and contributed to Sections 1, 2, 16, 21, 25, and 26 of the Technical Report. |
| | 7. | I am independent of the Issuer applying the test set out in Section 1.5 of NI 43-101. |
| | 8. | I have had no prior involvement with the property that is the subject of the Technical Report. |
| | 9. | I have read NI 43-101, and the Technical Report has been prepared in compliance with NI 43-101 and Form 43-101F1. |
| | | | |
| |
Barrick Gold Corporation – Porgera Joint Venture, Project #1669 Technical Report NI 43-101 – March 16, 2012 | | | Rev. 0 Page 29-5 | |
| | |
| | www.rpacan.com |
|
| | 10. | At the effective date of the Technical Report, to the best of my knowledge, information, and belief, the Technical Report contains all scientific and technical information that is required to be disclosed to make the Technical Report not misleading. |
Dated this 16th day of March, 2012
(Signed & Sealed)“Kathleen Ann Altman”
Kathleen Ann Altman, P.E.
| | | | |
| |
Barrick Gold Corporation – Porgera Joint Venture, Project #1669 Technical Report NI 43-101 – March 16, 2012 | | | Rev. 0 Page 29-6 | |