EXHIBIT 99.1
TECHNICAL REPORT ON THE LUMWANA MINE, NORTH-WESTERN PROVINCE, REPUBLIC OF ZAMBIA
BARRICK GOLD CORPORATION
Report for NI 43-101
Qualified Persons:
David Londono
Benjamin Sanfurgo
March 27, 2014
Report Control Form
| | | | | | | | |
Document Title | | Technical Report on the Lumwana Mine, North-Western Province, Republic of Zambia |
| | | | | | | | |
Company Name & Address | | Barrick Gold Corporation Brookfield Place, TD Canada Trust Tower Suite 3700, 161 Bay Street, P.O. Box 212 Toronto, Ontario M5J 2S1 |
| | | | | | | | |
Document Reference | | | | Status & Issue No. | | Final Version | | |
| | | | | | | | |
Issue Date | | March 27, 2014 | | | | |
| | | | | | | | |
TABLE OF CONTENTS
| | | | |
| | | PAGE | |
| |
1 SUMMARY | | | 1-1 | |
Executive Summary | | | 1-1 | |
Technical Summary | | | 1-5 | |
| |
2 INTRODUCTION | | | 2-1 | |
| |
3 RELIANCE ON EXPERTS | | | 3-1 | |
| |
4 PROPERTY DESCRIPTION AND LOCATION | | | 4-1 | |
Ownership | | | 4-1 | |
Mineral Tenure | | | 4-2 | |
Development Agreement | | | 4-6 | |
Zambian Taxes | | | 4-8 | |
Royalty Payments | | | 4-9 | |
Surface Rights | | | 4-9 | |
Project Layout | | | 4-9 | |
Environmental Liabilities | | | 4-9 | |
| |
5 ACCESSIBILITY, CLIMATE, LOCAL RESOURCES, INFRASTRUCTURE AND PHYSIOGRAPHY | | | 5-1 | |
Accessibility | | | 5-1 | |
Climate | | | 5-1 | |
Local Resources | | | 5-4 | |
Infrastructure | | | 5-5 | |
Physiography | | | 5-5 | |
| |
6 HISTORY | | | 6-1 | |
Ownership | | | 6-1 | |
Exploration | | | 6-1 | |
Previous Resource Estimates | | | 6-4 | |
Past Production | | | 6-5 | |
| |
7 GEOLOGICAL SETTING AND MINERALIZATION | | | 7-1 | |
Regional Geology | | | 7-1 | |
Local Geology | | | 7-3 | |
Property Geology | | | 7-5 | |
Mineralization | | | 7-5 | |
| |
8 DEPOSIT TYPES | | | 8-1 | |
| |
9 EXPLORATION | | | 9-1 | |
| |
10 DRILLING | | | 10-1 | |
History | | | 10-1 | |
Sampling Methods | | | 10-8 | |
| | |
| Barrick Gold Corporation – Lumwana Mine, | | Page i |
| Technical Report NI 43 -101 – March 27, 2014 | |
| | | | |
| |
11 SAMPLE PREPARATION, ANALYSES AND SECURITY | | | 11-1 | |
Chain of custody | | | 11-1 | |
Sample Preparation | | | 11-2 | |
Analysis | | | 11-3 | |
QA/QC | | | 11-3 | |
| |
12 DATA VERIFICATION | | | 12-1 | |
| |
13 MINERAL PROCESSING AND METALLURGICAL TESTING | | | 13-1 | |
Introduction | | | 13-1 | |
Copper Recovery | | | 13-2 | |
| |
14 MINERAL RESOURCE ESTIMATE | | | 14-1 | |
Introduction | | | 14-1 | |
Assumptions | | | 14-2 | |
Geological Database | | | 14-2 | |
Geological Interpretation and Modelling | | | 14-4 | |
Bulk Density | | | 14-6 | |
Statistical Analysis | | | 14-6 | |
Grade Capping | | | 14-8 | |
Variography | | | 14-9 | |
Cut-off Grade | | | 14-11 | |
Grade Interpolation and Validation | | | 14-12 | |
Mineral Resource Classification | | | 14-15 | |
Mineral Resource Summary | | | 14-18 | |
Conclusions | | | 14-18 | |
| |
15 MINERAL RESERVE ESTIMATE | | | 15-1 | |
| |
16 MINING METHODS | | | 16-1 | |
Mining Operations | | | 16-1 | |
Life of Mine Plan | | | 16-3 | |
Mine Design | | | 16-3 | |
Geotechnical Considerations | | | 16-4 | |
Ore Control | | | 16-6 | |
Drilling and Blasting | | | 16-7 | |
Surface Water | | | 16-7 | |
Mining Dilution | | | 16-8 | |
Cut-off Grade | | | 16-9 | |
| |
17 RECOVERY METHODS | | | 17-1 | |
Crushing and Grinding | | | 17-1 | |
Froth Flotation | | | 17-1 | |
Concentrate Dewatering and Storage | | | 17-2 | |
Concentrate Thickener | | | 17-2 | |
Concentrate Filter | | | 17-2 | |
Tailings Thickener | | | 17-3 | |
Water | | | 17-3 | |
Potable Water | | | 17-3 | |
Process Control | | | 17-3 | |
Process Design Criteria | | | 17-4 | |
Water Management | | | 17-5 | |
| | |
| Barrick Gold Corporation – Lumwana Mine, | | Page ii |
| Technical Report NI 43 -101 – March 27, 2014 | |
| | | | |
| |
18 PROJECT INFRASTRUCTURE | | | 18-1 | |
Mine Waste (Overburden) Dumps | | | 18-1 | |
Tailings Storage Facility | | | 18-2 | |
| |
19 MARKET STUDIES AND CONTRACTS | | | 19-1 | |
Markets | | | 19-1 | |
Contracts | | | 19-2 | |
| |
20 ENVIRONMENTAL STUDIES, PERMITTING, AND SOCIAL OR COMMUNITY IMPACT | | | 20-1 | |
Environmental Studies | | | 20-1 | |
Project Permitting | | | 20-3 | |
Social and Community Requirements | | | 20-3 | |
| |
21 CAPITAL AND OPERATING COSTS | | | 21-1 | |
Capital Cost Estimates | | | 21-1 | |
Operating Cost Estimates | | | 21-1 | |
| |
22 ECONOMIC ANALYSIS | | | 22-1 | |
| |
23 ADJACENT PROPERTIES | | | 23-1 | |
| |
24 OTHER RELEVANT DATA AND INFORMATION | | �� | 24-1 | |
| |
25 INTERPRETATION AND CONCLUSIONS | | | 25-1 | |
Geology and Mineral Resources | | | 25-1 | |
Mining and Mineral Reserves | | | 25-1 | |
Mineral Processing and Metallurical Testing | | | 25-2 | |
| |
26 RECOMMENDATIONS | | | 26-1 | |
Mining and Mineral Reserves | | | 26-1 | |
Mineral Processing | | | 26-1 | |
Environmental Studies, Permitting, and Community Impact | | | 26-1 | |
| |
27 REFERENCES | | | 27-1 | |
| |
28 DATE AND SIGNATURE PAGE | | | 28-1 | |
| |
29 CERTIFICATE OF QUALIFIED PERSON | | | 29-1 | |
| | |
| Barrick Gold Corporation – Lumwana Mine, | | Page iii |
| Technical Report NI 43 -101 – March 27, 2014 | |
LIST OF TABLES
| | | | | | |
| | | | | PAGE | |
| | |
| Table 1-1 | | Mineral Resources – December 31, 2013 | | | 1-2 | |
| Table 1-2 | | Mineral Reserves – December 31, 2013 | | | 1-2 | |
| Table 1-3 | | Capital Cost Estimate | | | 1-15 | |
| Table 1-4 | | Operating Cost Estimate | | | 1-15 | |
| Table 6-1 | | Copper Mineral Resource and Reserve Estimates Prior to Barrick Ownership | | | 6-5 | |
| Table 6-2 | | Lumwana Production History | | | 6-6 | |
| Table 10-1 | | Historical Drilling Summary | | | 10-1 | |
| Table 10-2 | | Drilling Summary Prior to Barrick Ownership | | | 10-3 | |
| Table 10-3 | | Exploration Summary for the 2011/2012 Drilling Campaign | | | 10-4 | |
| Table 10-4 | | Exploration Summary for the 2013 Drilling Campaign | | | 10-7 | |
| Table 13-1 | | Project Studies | | | 13-1 | |
| Table 13-2 | | Metallurgical Test Samples | | | 13-2 | |
| Table 14-1 | | Summary of Copper Mineral Resources – December 31, 2013 | | | 14-1 | |
| Table 14-2 | | Lumwana Drill hole Statistics by Prospect | | | 14-3 | |
| Table 14-3 | | Chimiwungo and Malundwe Drill Hole Statistics by Company | | | 14-4 | |
| Table 14-4 | | Density Values | | | 14-6 | |
| Table 14-5 | | Chimiwungo Density Values | | | 14-6 | |
| Table 14-6 | | Chimiwungo Copper Statistics | | | 14-7 | |
| Table 14-7 | | Malundwe Copper Statistics | | | 14-7 | |
| Table 14-8 | | Copper Correlogram Parameters | | | 14-10 | |
| Table 14-9 | | Copper Kriging Parameters | | | 14-12 | |
| Table 14-10 | | Chimiwungo Pit Reserve Shell – Insitu Material by Cut-off Grade | | | 14-13 | |
| Table 14-11 | | Copper Mineral Resources – December 31, 2013 | | | 14-18 | |
| Table 15-1 | | Mineral Reserves – December 31, 2013 | | | 15-1 | |
| Table 15-2 | | Mineral Reserve Cut-off Grades | | | 15-2 | |
| Table 16-1 | | Cut-off Grade Parameters | | | 16-10 | |
| Table 16-2 | | Cut-off Grades | | | 16-11 | |
| Table 17-1 | | Lumwana Copper Process Design Criteria | | | 17-5 | |
| Table 21-1 | | Capital Cost Estimate | | | 21-1 | |
| Table 21-2 | | Operating Cost Estimate | | | 21-2 | |
| | |
| Barrick Gold Corporation – Lumwana Mine, | | Page iv |
| Technical Report NI 43 -101 – March 27, 2014 | |
LIST OF FIGURES
| | | | | | |
| | | | | PAGE | |
| | |
| Figure 4-1 | | Location Map | | | 4-1 | |
| Figure 4-2 | | Mining Lease Location | | | 4-3 | |
| Figure 4-3 | | Mining Licence Coordinates | | | 4-4 | |
| Figure 4-4 | | Project Surface Layout | | | 4-9 | |
| Figure 7-1 | | Regional Geology | | | 7-2 | |
| Figure 7-2 | | Local Geology | | | 7-4 | |
| Figure 7-3 | | Malundwe Mineralization – Cross Section (Looking North) | | | 7-7 | |
| Figure 7-4 | | Chimiwungo Mineralization – Cross Section (Looking West) | | | 7-8 | |
| Figure 7-5 | | Chimiwungo North Mineralization – Cross Section (Looking West) | | | 7-8 | |
| Figure 9-1 | | Lumwana Project Area Exploration Potential | | | 9-1 | |
| Figure 10-1 | | Chimiwungo Drill Hole Collar Locations Prior to Barrick Ownership | | | 10-4 | |
| Figure 10-2 | | Chimiwungo Drill Hole Collar Locations as at end of 2012 | | | 10-5 | |
| Figure 10-3 | | Lumwana Project Drill Hole Collar Locations | | | 10-8 | |
| Figure 14-1 | | Isometric View of Block Models (Copper Grade > 0.4%) | | | 14-5 | |
| Figure 14-2 | | Chimiwungo Copper Frequency Distribution | | | 14-8 | |
| Figure 14-3 | | Malundwe Copper Frequency Distribution | | | 14-9 | |
| Figure 14-4 | | Chimiwungo North Ore Correlogram | | | 14-10 | |
| Figure 14-5 | | Chimiwungo Main Ore Correlogram | | | 14-11 | |
| Figure 14-6 | | Chimiwungo South Ore Correlogram | | | 14-11 | |
| Figure 14-7 | | Chimiwungo Tonnage and Grade Comparison By Block Size | | | 14-13 | |
| Figure 14-8 | | Chimiwungo Swath Plot | | | 14-14 | |
| Figure 14-9 | | Malundwe Swath Plot | | | 14-15 | |
| Figure 14-10 | | 370.900 E Section – Chimiwungo Cu Estimation | | | 14-16 | |
| Figure 14-11 | | 370.900 E Section – Chimiwungo Cu Estimation | | | 14-16 | |
| Figure 14-12 | | 378.000 E Section – Chimiwungo Cu Estimation | | | 14-16 | |
| Figure 14-13 | | 378.000 E Section – Chimiwungo S Estimation | | | 14-17 | |
| Figure 14-14 | | 378.000 E Section – Chimiwungo Co Estimation | | | 14-17 | |
| Figure 14-15 | | 378.000 E Section – Chimiwungo Classification | | | 14-17 | |
| Figure 14-16 | | Chimiwungo Resource Classification Plan | | | 14-17 | |
| Figure 15-1 | | Chimiwungo Mine Design | | | 15-3 | |
| Figure 15-2 | | Malundwe Mine Design | | | 15-4 | |
| Figure 16-1 | | Lumwana Site Layout | | | 16-4 | |
| | |
| Barrick Gold Corporation – Lumwana Mine, | | Page v |
| Technical Report NI 43 -101 – March 27, 2014 | |
1 SUMMARY
EXECUTIVE SUMMARY
This Technical Report on the Lumwana Open Pit Copper Mine (Lumwana Mine), located in the North-Western Province of the Republic of Zambia has been prepared by Barrick Gold Corporation (Barrick). The purpose of this report is to support public disclosure of Mineral Resource and Mineral Reserve estimates at the Lumwana Mine as at December 31, 2013. This Technical Report conforms to NI 43-101 Standards of Disclosure for Mineral Projects. The report was generated by a combination of Lumwana site based and Barrick Corporate staff.
Barrick is a Canadian publicly traded mining company with a portfolio of operating mines and projects across five continents. The Lumwana Mine property is located within the North-Western Province of the Republic of Zambia, approximately 65 km from Solwezi, the provincial capital. It lies about 50 km south of the border between the Democratic Republic of Congo and Zambia.
The Project comprises of a 260,000 tonnes per day open pit mining operation and a 68,000 tonnes per day processing facility. The mine consists of two open pits, Malundwe and Chimiwungo, and is mined by conventional truck and shovel method. The current production plan shows that 537 million tonnes of ore grading 0.56% Cu will be mined between 2014 and 2038. The ore, which is predominantly sulphide, is treated through a conventional sulphide flotation plant, producing copper concentrate for smelting.
Table 1-1 summarizes the Lumwana Mineral Resources exclusive of Mineral Reserves as of December 31, 2013.
| | |
| Barrick Gold Corporation – Lumwana Mine, | | Page 1 -1 |
| Technical Report NI 43 -101 – March 27, 2014 | |
TABLE 1-1 MINERAL RESOURCES – DECEMBER 31, 2013
Barrick Gold Corporation – Lumwana Mine
| | | | | | | | | | | | |
Category | | Tonnage
(Mt) | | | Grade
(% Cu) | | | Contained Metal
(Mlbs Cu) | |
Measured | | | 67.5 | | | | 0.39 | | | | 581.4 | |
Indicated | | | 419.1 | | | | 0.52 | | | | 4,794.2 | |
| | | | | | | | | | | | |
Total Measured + Indicated | | | 486.6 | | | | 0.50 | | | | 5,375.6 | |
Total Inferred | | | 0.5 | | | | 0.57 | | | | 5.8 | |
Notes:
| 1. | CIM definitions were followed for Mineral Resources. |
| 2. | Fresh sulphide Mineral Resources are estimated at a cut-off grade of 0.16% Cu and transition sulphide Mineral Resources are estimated at a cut-off grade of 0.38% Cu. |
| 3. | Mineral Resources are estimated using a long-term copper price of US$3.50 per pound. |
| 4. | A minimum thickness of 2.0m was used in the wireframe model. |
| 5. | Mineral Resources are exclusive of Mineral Reserves. |
| 6. | Mineral Resources that are not Mineral Reserves do not have demonstrated economic viability. |
| 7. | Numbers may not add due to rounding. |
Proven and Probable Mineral Reserves for the Project are listed in Table 1-2.
TABLE 1-2 MINERAL RESERVES – DECEMBER 31, 2013
Barrick Gold Corporation – Lumwana Mine
| | | | | | | | | | | | |
Category | | Tonnes
(Mt) | | | Grade
(% Cu) | | | Contained Metal
(Mlbs Cu) | |
Proven | | | 233.05 | | | | 0.55 | | | | 2,847.28 | |
Probable | | | 303.83 | | | | 0.56 | | | | 3,755.87 | |
| | | | | | | | | | | | |
Sub-Total | | | 536.88 | | | | 0.56 | | | | 6,603.15 | |
Stockpiles (Proven) | | | 1.92 | | | | 0.39 | | | | 16.66 | |
| | | |
Total | | | 538.80 | | | | 0.56 | | | | 6,619.82 | |
Notes:
| 1. | CIM definitions were followed for Mineral Reserves. |
| 2. | Mineral Reserves are estimated at a cut-off grade of 0.20% Cu for fresh sulphides and 0.41% for transitional sulphides. |
| 3. | Mineral Reserves are estimated using an average long-term copper price of US$3.00 per pound and a US$/C$ exchange rate of 0.95. |
| 4. | Bulk density varies from 2.0 t/m3 to 2.80 t/m3 depending on degree of weathering and material type |
| 5. | 100% mining recovery and no dilution |
| 6. | Numbers may not add due to rounding. |
| | |
| Barrick Gold Corporation – Lumwana Mine, | | Page 1 -2 |
| Technical Report NI 43 -101 – March 27, 2014 | |
CONCLUSIONS
Based on the site experience of the authors and contributing staff, and subsequent review of gathered information, the following conclusions are offered:
GEOLOGY AND MINERAL RESOURCES
| • | | The sampling, sample preparation, analyses, and sample security are appropriate for the style of mineralization and Mineral Resource estimation. |
| • | | The end of year (EOY2013) Mineral Resource estimates are completed to industry standards using reasonable and appropriate parameters and are acceptable for use in Mineral Reserve estimation. The resource estimates conform to NI 43-101. |
| • | | Mineral Resources are reported exclusive of Mineral Reserves and are estimated effective December 31, 2013. |
| • | | Measured plus Indicated Mineral Resources total 486.6 Mt, grading 0.50% Cu, containing 5,375.6 million pounds Cu. |
| • | | Inferred Mineral Resources total 0.5 Mt, grading 0.57% Cu, containing 5.8 million pounds Cu. |
MINING AND MINERAL RESERVES
| • | | Proven and Probable Mineral Reserves total 538.80 million tonnes grading 0.56% Cu containing 6,619.82 million pounds Cu. |
| • | | The Mineral Reserve estimates have been prepared utilizing acceptable estimation methodologies and the Proven and Probable Reserves conform to CIM definitions and NI 43-101. |
| • | | Mining planning for the Lumwana open pit mine follows industry standards. |
| • | | Ore control procedures for the Lumwana open pit are well documented, and the ore control results have also been well documented. All records have been kept in good condition and are readily accessible. |
| • | | The methodology used by Lumwana for pit limit determination, cut-off grade optimization, production sequence and scheduling, and estimation of equipment/manpower requirements is in line with good industry practice. |
MINERAL PROCESSING AND METALLURICAL TESTING
| • | | The metallurgical test-work is adequate to support the Project and the recovery models are reasonable. |
| • | | The 2013 production data indicates that the estimated recovery compares favorably to the actual recovery and meets industry standards. |
| | |
| Barrick Gold Corporation – Lumwana Mine, | | Page 1 -3 |
| Technical Report NI 43 -101 – March 27, 2014 | |
RECOMMENDATIONS
GEOLOGY AND MINERAL RESOURCES
| • | | Develop personnel resources and skills on site necessary to generate resource models in-house, using Barrick’s Global Resource Group as Peer Reviewers. |
MINING AND MINERAL RESERVES
| • | | More hydrogeological data should be gathered and be aimed at any practicable methods useful for reducing the groundwater pressure in the rock units. |
MINERAL PROCESSING
| • | | Current studies to optimize recovery and concentrate grade should be continued. |
ENVIRONMENTAL STUDIES, PERMITTING, AND COMMUNITY IMPACT
| • | | Addendums to the approved EIS highlighting the changes in designs and locations and other relevant information have been prepared by the mine and submitted to ZEMA for review and approved on February 20, 2014. The conditions resulting from this need to be considered and any changes included in the Mine Plan and any effects on Reserves considered. |
ECONOMIC ANALYSIS
Under NI 43-101 rules, producing issuers may exclude the information required for this section on properties currently in production, unless the Technical Report includes a material expansion of current production. Barrick Lumwana is a producing issuer, the Lumwana Mine is currently in production, and a material expansion is not being planned. An economic analysis of the Lumwana Mine using the estimates presented in this report has been undertaken, and confirms that the outcome is a positive cash flow that supports the statement of Mineral Reserves.
| | |
| Barrick Gold Corporation – Lumwana Mine, | | Page 1 -4 |
| Technical Report NI 43 -101 – March 27, 2014 | |
TECHNICAL SUMMARY
PROPERTY DESCRIPTION AND LAND TENURE
The Lumwana Project is located in the North-Western Province of Zambia, approximately 65 km west from the provincial capital of Solwezi, 220 km west of Chingola, and 400 km northwest of the capital Lusaka.
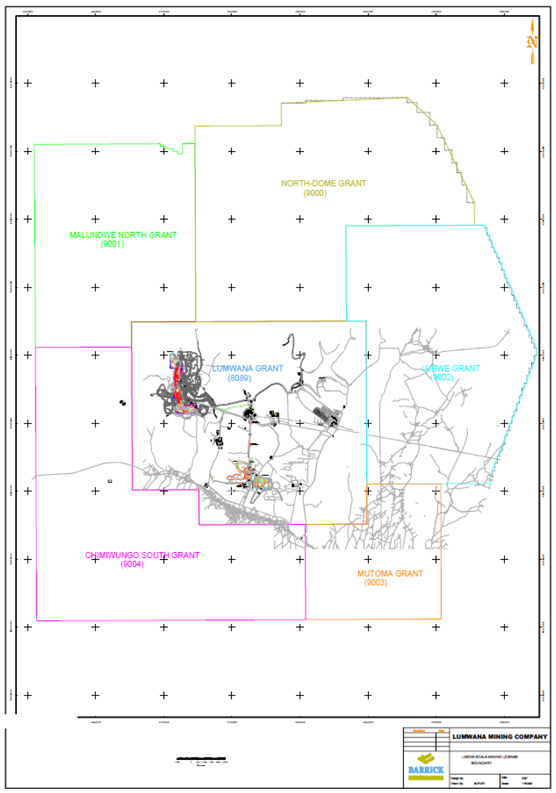
The Malundwe and Chimiwungo copper deposits together with numerous exploration prospects are contained within six large scale Mining Licences (8089-HQ-LML; 9000-HQ-LML; 9001-HQ-LML; 9002-HQ-LML; 9003-HQ-LML and 9004-HQ-LML) which are collectively referred to as Lumwana Project. Barrick has also secured the long-term land title to some 35,000 ha (350 km2) of township and mine operating areas in the six large scale Mining Licenses.
The Lumwana Development Agreement between the Government of the Republic of Zambia (GRZ) and Equinox Minerals Ltd. (Equinox) was signed on December 16, 2005, providing a 10-year stability period for the key fiscal and taxation provisions related to Lumwana, including a corporate tax rate of 25% and a mineral royalty of 0.6% of gross product. Incorporated in the Lumwana Development Agreement is a Copper Price Participation Agreement (PPA). The PPA is triggered upon the extinguishment of the Lumwana Project Debt Facility and only if the margin between the copper price and Lumwana operating costs is above an agreed threshold.
On April 1, 2008, the GRZ enacted a number of changes to the tax regime, particularly in relation to mining companies. The regime changes included an increase in the corporate tax from 25% to 30%, an increase in the mining royalty from 0.6% to 3%, and a number of other proposed additional imposts.
Following discussions and correspondence with GRZ, it was agreed with the Zambian Revenue Authority (ZRA) in January 2011 to pay mineral royalties assessed at 3%. Barrick continues to reserve its right to compensation for breach of the tax stability provisions under the Lumwana Development Agreement and, by agreeing to pay mineral royalties, protected itself from the ZRA assessing interest and penalties on the tax amount.
| | |
| Barrick Gold Corporation – Lumwana Mine, | | Page 1 -5 |
| Technical Report NI 43 -101 – March 27, 2014 | |
In December 2011, the GRZ increased the mineral royalty from 3% to 6% and re-introduced the taxation of hedging income as a separate source income. These changes took effect from April 1, 2012. Barrick continues to reserve its right to compensation for breach of the tax stability provisions under the Lumwana Development Agreement and, by agreeing to pay mineral royalties, protected itself from the ZRA assessing interest and penalties on the tax amount.
EXISTING INFRASTRUCTURE
Other than road access, there was very little established infrastructure in the project area prior to commissioning of the Lumwana Mine. High voltage electrical power at 330 kV is delivered to the site from the Zambia Electricity Supply Company (“ZESCO”) National Grid.
Lumwana is an operating mine and current site infrastructure includes roads, mine workings, processing plant, accommodation, offices, equipment repair facilities, fuel storage, water supply, a tailings storage facility, and a town-site for employees.
HISTORY
The Roan Selection Trust Limited (RST) acquired the Lumwana Project area in the late 1950s. American Metal Climax Inc. (AMAX) took over RST and formed a joint venture with Anglo American plc in 1970. In 1975, the Zambian copper industry was fully nationalized and Lumwana was transferred to Mindeco Limited, a precursor to Zambia Consolidated Copper Mines Limited (ZCCM).
From 1981 to 1990, Azienda General Italiana Petroli (AGIP) in joint venture with Compagnie Générale des Matières Nucléaires (COGEMA) conducted uranium exploration in the Mwombezhi Dome.
Phelps Dodge applied for the Mwombezhi Dome Prospecting Licence in late 1992 and Equinox entered into a joint venture with Phelps Dodge in August 1999. Equinox earned a 51% interest in Lumwana by funding a Bankable Feasibility Study in 2003 (2003 BFS), and on December 31, 2004, it acquired the remaining 49% interest from Phelps Dodge.
| | |
| Barrick Gold Corporation – Lumwana Mine, | | Page 1 -6 |
| Technical Report NI 43 -101 – March 27, 2014 | |
The 2003 BFS included an extensive two phase resource definition, metallurgical sampling, and geotechnical and hydrogeological drilling program. In October 2005, the BFS capital and operating cost estimates were updated. Additional metallurgical and geotechnical drilling, sampling, and test-work were also undertaken during this period. In December 2005, project development commenced with the construction of mine access roads and the first stage of the construction camp.
In 2006, the project development contract for Lumwana was awarded. Equinox completed an infill combined reverse circulation (RC) and diamond core drill program within the northern half of the 2003 BFS Chimiwungo pit. Project development works continued in 2006 with concentrator site and water dam earthworks and the expansion of the construction camp.
Pre-production mining began in April 2007, initially focusing upon the pre-stripping of oxidized materials from the Malundwe pit. The Project was commissioned in December 2008. Commercial copper production was achieved in April 2009 with 2009 production totalling 109,413 tonnes copper at a cash operating cost of $1.49/lb Cu. Including 2009, production to the end of 2013 totalled 572,237 tonnes copper at an operating cost of $2.02/lb Cu.
Barrick acquired Equinox in July 2011.
GEOLOGY AND MINERALIZATION
The Lumwana Project contains two major copper deposits, Malundwe and Chimiwungo, which are structurally controlled shear zone hosted deposits considered to be an end member of Central African Copperbelt class of deposits. These copper deposits are hosted within the Mwombezhi Dome, which is a northeast trending basement dome in the western arm of the Lufilian Arc thrust fold belt.
In Zambia, the Lufilian Arc contains variably deformed and metamorphosed Late Proterozoic metasediments and volcanics of the Katangan Lower and Upper Roan, Mwashia, Nguba, and the Kundelungu super groups, which unconformably overly the basement. The basement consists of older metamorphosed gneisses, schists, migmatites, amphibolites and granitoids. Subsequent to the deposition of the Katangan sequences, the basin was inverted, deformed, metamorphosed, and uplifted by generally north directed thrusting and folding to produce the late Neoproterozoic – Cambrian Lufilian Arc.
| | |
| Barrick Gold Corporation – Lumwana Mine, | | Page 1 -7 |
Technical Report NI 43-101 – March 27, 2014 | |
The copper mineralization at Malundwe and Chimiwungo is hosted almost entirely within high grade metamorphosed, intensely mylonitized, recrystallized muscovite–phlogopite–quartz–kyanite schists with disseminated sulphides (typically <5%) dominated by chalcopyrite and bornite which is locally referred to as Mineralized Ore Schist. The distribution of copper mineralization is controlled by visibly identifiable strata-bound geology, within which copper grades are consistent. Optimal grade continuity is aligned to an observed north–south stretching lineation.
The copper mineralization at Lumwana is almost entirely disseminated sulphides (typically <5%) dominated by chalcopyrite and bornite with a minor amount of the resource classified as oxide or transition.
The overall strike length of mineralization at Malundwe is approximately six kilometres north-south and up to 1.5 km wide (east-west), predominantly as a single Mineralized Ore Schist horizon. The mineralization outcrops in the east, has an overall gentle dip to the west, and plunges to the south.
The Chimiwungo deposit is partitioned into three bodies by two steep west-northwest trending dip-slip fault zones. The mineralized zones are referred to as Chimiwungo South, Chimiwungo Main (includes the recently discovered Chimiwungo East mineralized shoot), and Chimiwungo North. The mineralization at Chimiwungo currently extends up to 5.5 km north-south and 2.8 km in the east-west orientation and remains open to the east and south.
EXPLORATION STATUS
Equinox started exploration at Lumwana in 1999 and identified 28 copper targets within the Project area, including Chimiwungo North, South and East, and Kanga which have now been converted to Mineral Resources. Exploration targets include Mutoma, Odile, and Lubwe.
Following the discovery of the Chimiwungo East ore shoot in early 2010, a major drill program started at Chimiwungo. The program focused on defining the limits of the
| | |
| Barrick Gold Corporation – Lumwana Mine, | | Page 1 -8 |
| Technical Report NI 43 -101 – March 27, 2014 | |
Chimiwungo deposit and increasing the drill density in areas that are likely to be developed first. In the period from 2011 to 2013, a total of 1,290 holes for 385,116 m were completed, including sterilization drilling, and testing of oxide and transition mineralization.
The Kanga area is the southern, down plunge extension of the Malundwe deposit. In 2006, Equinox completed a ground induced polarization (IP) geophysical survey which identified a significant, two kilometre long north-south chargeable anomaly approximately 300 m south of the known Malundwe resource at that time. Drilling to test the IP chargeable anomaly at Kanga commenced in September 2006 and has subsequently confirmed the area to be the southern extension of the Malundwe deposit.
The Mutoma prospect lies within the Chimiwungo Thrust Sheet, 2.2 km east of the currently defined Chimiwungo deposit. Barrick will continue to test the interpretation that Mutoma represents the eastern expression of the Chimiwungo mineralization.
During 2009, extensive field work by Equinox occurred at the Odile Prospect. The prospect was identified by the coincidence of ground spectrometer uranium, copper soil geochemical, and IP geophysical chargeable anomalies. In November 2010, a diamond rig was moved to the prospect, where seven holes were drilled by Equinox.
The Lubwe deposit is located approximately 13 km north-northeast of Chimiwungo, within the Chimiwungo Thrust Sheet. Lubwe was discovered by RST in the 1960s and was further investigated by Phelps Dodge in the mid-1990s and then Equinox between 2004 and 2009.
MINERAL RESOURCES
The EOY2013 Mineral Resources were estimated by conventional 3D computer block modelling based on surface drilling and assaying. Geologic interpretation of the drilling data was carried out and wireframes were constructed for resource estimation based on major geological areas. Statistical analysis of assay data was carried out for each domain. Variography was completed to determine search parameters and ordinary kriging was employed for interpolation in the block model. The resource model was classified using a combination of estimation pass number, number of composites and drill holes used to assign the block grade, and the distance to nearest composite. The block model copper grades were visually validated using drill holes and composites in section and plan view as well as swath plots.
| | |
| Barrick Gold Corporation – Lumwana Mine, | | Page 1 -9 |
| Technical Report NI 43 -101 – March 27, 2014 | |
The Mineral Resources reported in Table 1-1 are exclusive of Mineral Reserves and could not be converted to Mineral Reserves due to operational constraints or economics (i.e., Measured and Indicated Mineral Resources), or an insufficient level of confidence (i.e., Inferred Mineral Resources).
In the authors’ opinion, the EOY2013 Mineral Resource estimates are competently completed to industry standards using reasonable and appropriate parameters and are acceptable for reserve work. The Resource estimates comply with NI 43-101.
The authors are not aware of any environmental, permitting, legal, title, taxation, socio-economic, marketing, political, or other relevant factors which could materially affect the open pit mineral resource estimates.
MINERAL RESERVES
The Mineral Reserves for the Lumwana Mine are shown in Table 1-2. These Mineral Reserves are a combination of the two open pits and the stockpiles.
The Mineral Reserve estimates are reasonable, acceptable, and compliant with NI 43-101. The Mineral Reserves are generated based upon the mine designs applied to the Mineral Resources. The design methodology uses both the cut-off grade estimation and economic assessment to design and validate the mineable reserves.
Lumwana maintains a system of ore, oxide, and low grade stockpiles, which have been growing since the late 2008. Oxide mineral inventory is not included in Reserves, due to low recovery through the existing circuit and no future plans for an oxide circuit.
MINING METHOD
There are two mining areas; Malundwe and Chimiwungo, which are 7 km apart in a direct line. Malundwe was the first pit to be mined, commencing in 2008. However Chimiwungo now contains 93% of the remaining reserves. The Chimiwungo mining area consists of three separate pits; South, Main and East. At the current copper prices and
| | |
| Barrick Gold Corporation – Lumwana Mine, | | Page 1 -10 |
| Technical Report NI 43 -101 – March 27, 2014 | |
cost structure, these pits do not join; however sensitivities run at higher copper prices and lower cost structure show they have potential to join under more favorable economic conditions.
Sulphide copper ore at Lumwana is mined by open pit methods that follow the typical sequence of tasks: grade control drilling, blasthole drilling, blasting, loading by hydraulic shovels (15 m3 and 27 m3), and hauling by off-highway trucks (254 t). The mine started operations in 2008, and now mines an average daily capacity of 260,000 t of total material mined. Mining is done primarily by Lumwana personnel and equipment; however production is also supplemented by a contractor with specialized small articulated fleet of trucks to meet pre-stripping requirements, particularly the stripping of weathered material in the wet season.
MINERAL PROCESSING
The Lumwana concentrator has a nominal design capacity of 25 Mtpa (approximately 68,000 tpd).
There are two crushing circuits, at Malundwe and Chimiwungo, and trucks from the respective mines tip directly into 400 t capacity run-of-mine (ROM) dump hoppers. The ROM pads are used for ore that cannot be directly dumped into the crusher feed hopper, due to blending requirements or crusher availability and capacity constraints. The primary gyratory crushers crush the ROM ore from a nominal top size of 1,500 mm to less than 200 mm. Oversize material is deposited on the ROM pad to be further broken by a mobile rock breaker. Crusher product is then conveyed via overland conveyors to a central collecting conical crushed ore stockpile with 12 hours live capacity. The Malundwe overland conveyor is 4.5km long and Chimiwungo overland conveyor is 3.5km long.
The flotation plant consists of two parallel trains of rougher/scavenger cells. The rougher/scavenger concentrate reports to the regrind circuit to further liberate the copper minerals. Following regrinding, the concentrate is cleaned in a conventional cleaner/re-cleaner circuit to reach final concentrate grade. Final concentrate grades of between 25% to 33% are expected from the Lumwana mine.
| | |
| Barrick Gold Corporation – Lumwana Mine, | | Page 1 -11 |
| Technical Report NI 43 -101 – March 27, 2014 | |
The concentrate is filtered to reduce the moisture content from approximately 35% to approximately 10%. The filtered concentrate is discharged from the pressure filter to the concentrate storage shed, located below the filter. The concentrate is loaded onto trucks using a front end loader and is transported to smelters located in the Zambian Copper Belt.
PROJECT INFRASTRUCTURE
Project infrastructure includes, but is not limited to, the following structures:
| • | | Equipment maintenance facilities, which also includes offices and a warehouse; |
| • | | Fuel storage and distribution for all mobile equipment; |
| • | | A 68,000 tpd crushing, grind, and flotation process facility; |
| • | | Communications facilities for internal and external communications; |
| • | | Solid waste disposal areas; |
| • | | Water treatment and sewage plants; |
| • | | High voltage electrical power at 330 kV is delivered to the site from the Zambia Electricity Supply Company, ZESCO, which is part of the national grid; |
| • | | Project access and site roads, that are reasonably maintained; |
| • | | First aid and a medical treatment facility; |
| • | | Cafeteria and dining facility for the onsite workers; and |
| • | | A town-site with housing units for the staff and their families. |
Waste dumps are designed in areas where condemnation drilling has been completed, as close as practicable to pit ramp exits. The design of the overburden waste dumps provides for an overall slope angle in the order of 20° after battering. Dumps are of terrace construction.
| | |
| Barrick Gold Corporation – Lumwana Mine, | | Page 1 -12 |
| Technical Report NI 43 -101 – March 27, 2014 | |
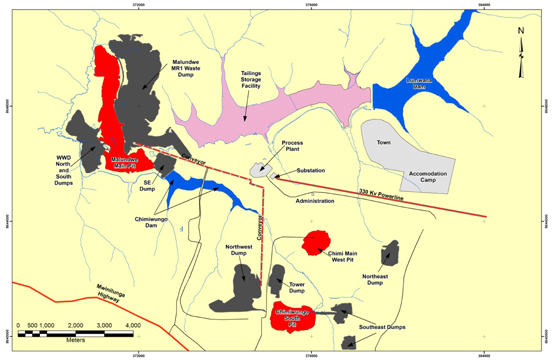
There are three mine waste dumps at Malundwe; Main, HR3, and West. Chimiwungo consists of four main dump areas; West dump, Tower dump, South-East dump and the North-East dump.
Tailings are deposited into the tailings storage facility (TSF), which is a purpose built facility downstream of the water storage facility and upstream of the Malundwe South pit. It involves deposition into the former Lumwana East River valley. The diversion channel diverts water around the tailings dam and Malundwe pit. There is considerable flexibility to adjust the design through the mine life to changing conditions.
The TSF embankment has been constructed as a clay core rock-fill structure, immediately upstream of the Malundwe pit. Any risk of flow to the pit is minimized through the placement of a significant width (>500m) of waste rock between the pit and the TSF dam wall.
The current planned capacity of the TSF is about 600 Mt, with two more raises of construction works to be completed. There is potential to increase site TSF capacity by depositing tailings in the mined out Malundwe pit. Preliminary work on the Malundwe option indicates 100-130Mt capacity potential for minimal construction cost. The remaining required TSF capacity for the current reserves and resources within designed pits is about 540 Mt. At this time approximately 93Mt has been deposited. Final design for the Malundwe option will be undertaken at a time closer to when it is required, so that required capacity can be better estimated.
MARKET STUDIES
The concentrate is sold to custom smelters within Zambia as the export duty on concentrate makes offshore shipment uneconomic.
ENVIRONMENTAL, PERMITTING AND SOCIAL CONSIDERATIONS
A number of environmental studies have been conducted at Lumwana Mine, including environmental baseline studies in 2003 and a full Environmental Impact Assessment (EIA) study for the development of the Lumwana Copper Project in 2005. Other EIAs conducted at Lumwana Mine include the Lumwana Estate EIA in 2006. The Lumwana Estate EIA is for the construction of residential infrastructure for all personnel, key
| | |
| Barrick Gold Corporation – Lumwana Mine, | | Page 1 -13 |
| Technical Report NI 43 -101 – March 27, 2014 | |
contractors, and suppliers working at Lumwana Copper Project. All the EIAs resulted in preparation and submission of an EIS which was reviewed and subsequently approved by Zambia Environmental Management Agency (ZEMA), formerly Environmental Council of Zambia (ECZ).
A further addendum was submitted in October 2013 for the expanded Chimiwungo pits and for the newly designed waste dumps to the north and east of Chimi Main and East. Approval of this Addendum was received in February 2014.
The mine operates within a framework of national environmental legislations that requires it to hold licences and permits for its operations as per regulatory requirements. In terms of environmental issues, the mine holds 35 licences and one permit issued by ZEMA for its various operations and one licence issued by the Radiation Protection Authority. All the licences and the permit are valid until 2029 (25 years after granting) and are renewable for another 25 years. The licences held include those to discharge effluents, to own and operate waste disposal sites, to import and store various process chemicals, as well as a permit to discharge controlled emissions into the ambient air at location from the Hazardous Waste Incinerator.
Most of the Project, except for the Chimiwungo deposit and associated overburden dumps, fall inside the 105 Acres National Forest, an area of rejuvenating Miombo woodland. The forest’s protected status is based on its timber resource and not nature conservation considerations. The area affected by the mine development within the Forest Reserve has been excised and de-gazetted.
The Mine Reclamation Plan focuses on the reclamation of open pits, overburden dumps, TSFs, mill and processing facilities, and river diversion scheme. The main objectives of the plan are to return the land to conditions capable of supporting the former land use or alternative sustainable land uses, and to prevent significant adverse effects on adjacent water resources. Mine reclamation activities are progressive, leaving minimal works outstanding at mine closure except for plant site and TSF decommissioning.
In June 2010, the Commerce, Trade and Industry Minister of the Republic of Zambia launched the Lumwana Multi-Facility Economic Zone (MFEZ) after granting the company
| | |
| Barrick Gold Corporation – Lumwana Mine, | | Page 1 -14 |
| Technical Report NI 43 -101 – March 27, 2014 | |
a statutory instrument to operate the MFEZ within the Lumwana mining licence. The objective of the Lumwana MFEZ is to promote industrial and economic development in the manufacturing sector near Lumwana Mine, and to ultimately enhance domestic and export oriented business activity through the provision of competitive environments that encourage investors to set up businesses with relative ease.
CAPITAL AND OPERATING COST ESTIMATES
Current Life of Mine (LOM) capital costs for the Project are estimated to be US$2,196 million (Table 1-3). The major capital cost for the open pit will be for the mining area, which is estimated to be US$1,529 million, primarily to replace and rebuild mobile equipment. Sustaining capital for the process facilities is estimated to be US$196 million, which consist primarily of replacement capital, tailings pipelines and pumps, and TSF embankment raises. General and Administration (G&A) capital is projected to be US$249 million and closure costs are estimated to be US$223 million.
TABLE 1-3 CAPITAL COST ESTIMATE
Barrick Gold Corporation – Lumwana Mine
| | | | |
Cost Area | | Total (US$ M) | |
Mining | | $ | 1,529 M | |
Processing | | $ | 196 M | |
G&A and other Infrastructure | | $ | 249 M | |
Closure | | $ | 223 M | |
| | | | |
Total | | $ | 2,196M | |
Notes
| 1. | Totals may not add due to rounding. |
The operating cost estimate is presented in Table 1-4.
TABLE 1-4 OPERATING COST ESTIMATE
Barrick Gold Corporation – Lumwana Mine
| | | | | | | | | | | | | | |
Year | | Units | | 2013 Actual | | | 2014 Budget | | | LOM Average | |
Mining | | US$/t mined | | | 4.53 | | | | 3.87 | | | | 3.73 | |
| | | | |
Processing, Treatment and Selling Costs | | US$/t milled | | | 9.36 | | | | 9.68 | | | | 9.72 | |
| | | | |
G&A | | US$/t milled | | | 3.73 | | | | 3.46 | | | | 3.50 | |
| | | | |
Royalty | | % of Gross
Revenue | | | 6.0 | | | | 6.0 | | | | 6.0 | |
| | |
| Barrick Gold Corporation – Lumwana Mine, | | Page 1 -15 |
| Technical Report NI 43 -101 – March 27, 2014 | |
2 INTRODUCTION
The purpose of this Technical Report on the Lumwana Copper Mine, Zambia, is to support public disclosure of Mineral Resource and Mineral Reserve estimates at the Project as at December 31, 2013. This Technical Report conforms to NI 43-101 Standards of Disclosure for Mineral Projects.
Barrick is a Canadian publicly traded mining company with a portfolio of operating mines and advanced exploration and development projects across four continents. The Lumwana Mine is located on the Central African Copperbelt in the North-Western Province of Zambia.
The Lumwana Project includes the major copper deposits of Malundwe and Chimiwungo as well as numerous exploration prospects. Lumwana Mine is a producing copper mine with annual production of approximately 23 Mt of ore by open pit mining. The ore, which is predominantly sulphide, is treated through a conventional sulphide flotation plant, producing copper concentrate for smelting by third party operated smelters in Zambia.
The primary sources of information for this Technical Report is the 2011 Lumwana Project Technical Report prepared by Roscoe Postle Associates, the Project 2013 Year End Resources and Reserves update, and data gathered by Site Operations personnel.
SOURCES OF INFORMATION
This report was prepared by the following Qualified Persons (QPs):
| • | | Benjamin Sanfurgo, Barrick Global Resources – Senior Manager Resources and Reserves |
| • | | David Londono, Lumwana Mine - Senior Manager Mining |
Contributions were collated from the following people:
| • | | Bill MacNevin, General Manager |
| • | | Perry Hamel, Acting Technical Services Manager |
| • | | Peter Preston, Acting Geology Superintendent |
| | |
| Barrick Gold Corporation – Lumwana Mine, | | Page 2 -1 |
| Technical Report NI 43 -101 – March 27, 2014 | |
| • | | Guy Cordingley, Process Manager |
| • | | Wayne Colborne, Mining Manager |
| • | | Grace Walker, Environmental Manager |
| • | | Brenda Liswaniso, Sustainability Manager |
| • | | Martin Raubenheimer, Marketing Superintendent |
| • | | Chris Faulkner, Commercial Manager |
| • | | Mark Kaesehagen, Mine Technical Specialist |
| • | | Pamela Pio, Country Legal Counsel |
| • | | Mike Saarelainen, Senior Manager Planning, Barrick Technical Services Group |
Mr. Sanfurgo reviewed the geology, sampling, assaying, and resource estimate described in Sections 7 to 12 and 14. Mr. Londono reviewed the mining practices, reserve estimate, and economics and is responsible for Sections 15, 16, 18, 19, 21, and 22. The metallurgical aspects of the operation were provided by the Process Manager.
The documentation reviewed, and other sources of information, are listed at the end of this report in Section 27 References.
| | |
| Barrick Gold Corporation – Lumwana Mine, | | Page 2 -2 |
| Technical Report NI 43 -101 – March 27, 2014 | |
LIST OF ABBREVIATIONS
Units of measurement used in this report conform to the Imperial system. All currency in this report is US dollars (US$) unless otherwise noted.
| | | | | | |
| µm | | micron | | km2 | | square kilometre |
| °C | | degree Celsius | | kPa | | kilopascal |
| °F | | degree Fahrenheit | | kVA | | kilovolt-amperes |
| µg | | microgram | | kW | | kilowatt |
| A | | ampere | | kWh | | kilowatt-hour |
| a | | annum | | L | | litre |
| bbl | | barrels | | L/s | | litres per second |
| Btu | | British thermal units | | m | | metre |
| C$ | | Canadian dollars | | M | | mega (million) |
| cal | | calorie | | m2 | | square metre |
| cfm | | cubic feet per minute | | m3 | | cubic metre |
| cm | | centimetre | | min | | minute |
| cm2 | | square centimetre | | MASL | | metres above sea level |
| d | | day | | mm | | millimetre |
| dia. | | diameter | | mph | | miles per hour |
| dmt | | dry metric tonne | | MVA | | megavolt-amperes |
| dwt | | dead-weight ton | | MW | | megawatt |
| ft | | foot | | MWh | | megawatt-hour |
| ft/s | | feet per second | | m3/h | | cubic metres per hour |
| ft2 | | square foot | | opt, oz/st | | ounces per short ton |
| ft3 | | cubic foot | | oz | | Troy ounce (31.1035g) |
| g | | gram | | ppm | | parts per million |
| G | | giga (billion) | | psia | | pounds per square inch absolute |
| Gal | | Imperial gallon | | psig | | pounds per square inch gauge |
| g/L | | grams per litre | | RL | | relative elevation |
| g/t | | grams per tonne | | s | | second |
| gpm | | Imperial gallons per minute | | st | | short ton |
| gr/ft3 | | grains per cubic foot | | stpa | | short tons per year |
| gr/m3 | | grains per cubic metre | | stpd | | short tons per day |
| hr | | hour | | t | | metric tonne |
| ha | | hectare | | tpa | | metric tonnes per year |
| hp | | horsepower | | tpd | | metric tonnes per day |
| in | | inch | | US$ | | United States dollar |
| in2 | | square inch | | USg | | United States gallon |
| J | | joule | | USgpm | | US gallon per minute |
| k | | kilo (thousand) | | V | | volt |
| kcal | | kilocalorie | | W | | watt |
| kg | | kilogram | | wmt | | wet metric tonne |
| km | | kilometre | | yd3 | | cubic yard |
| km/h | | kilometres per hour | | yr | | year |
| | |
| Barrick Gold Corporation – Lumwana Mine, | | Page 2 -3 |
| Technical Report NI 43 -101 – March 27, 2014 | |
3 RELIANCE ON EXPERTS
This section is not relevant as expert opinion was sourced from Barrick experts where appropriate.
| | |
| Barrick Gold Corporation – Lumwana Mine, | | Page 3 -1 |
| Technical Report NI 43 -101 – March 27, 2014 | |
4 PROPERTY DESCRIPTION AND LOCATION
The Lumwana Project is located in the North-Western Province of Zambia, approximately 65 km west from the provincial capital of Solwezi, 220 km west of Chingola, and 400 km northwest of the capital Lusaka (Figure 4-1).
The authors are not aware of any significant factor and risks that may affect access, title, or the right or ability of Barrick to perform work on the Lumwana Project.
OWNERSHIP
In April 2011, Barrick announced an agreement to acquire Equinox through an all-cash offer of C$8.15 per share. The acquisition was completed in July 2011, and Lumwana has been integrated into the Barrick Global Copper Business. The Lumwana mining assets are owned by Lumwana Mining Company Limited (LMCL), an indirect wholly owned subsidiary of Barrick.
FIGURE 4-1 LOCATION MAP

| | |
| Barrick Gold Corporation – Lumwana Mine, | | Page 4 -1 |
| Technical Report NI 43 -101 – March 27, 2014 | |
MINERAL TENURE
The Lumwana Retention Licence RL-01 encompassed 1,265 km2 and includes the two major copper deposits of Malundwe and Chimiwungo together with numerous exploration prospects which make up the Lumwana Project. It was converted to a large-scale mining licence (number LML-49, also known as the Lumwana Mining Lease) on January 6, 2004. The Licence was issued for 25 years (from January 6, 2004) and is renewable for a further 25 years. The Lumwana Project was surveyed by the Ministry of Mines and Mineral Development surveyors in October 2005, and the Large Scale Mining Licence First Schedule was amended to reflect this on November 2, 2005, using UTM co-ordinates based upon an ARC 1950 datum.
In 2012, upon application by LMCL, the original mining licence (LML-49) was subdivided into six licenses in order to comply with the maximum mining licence size restrictions of Minerals Development Act of 2008. These licenses (8089-HQ-LML, 9000-HQ-LML, 9001-HQ-LML, 9002-HQ-LML, 9003-HQ-LML and 9004-HQ-LML) cover substantially all of the property formerly covered by LML-49, including the Malundwe and Chimiwungo deposits and the exploration prospects. The leases were granted for copper, cobalt, gold, silver, uranium and sulfur.
| | |
| Barrick Gold Corporation – Lumwana Mine, | | Page 4 -2 |
| Technical Report NI 43 -101 – March 27, 2014 | |
Figure 4-2 shows the outline of the Lumwana Project with all the six licences.
FIGURE 4-2 MINING LEASE LOCATION
| | |
| Barrick Gold Corporation – Lumwana Mine, | | Page 4 -3 |
| Technical Report NI 43 -101 – March 27, 2014 | |
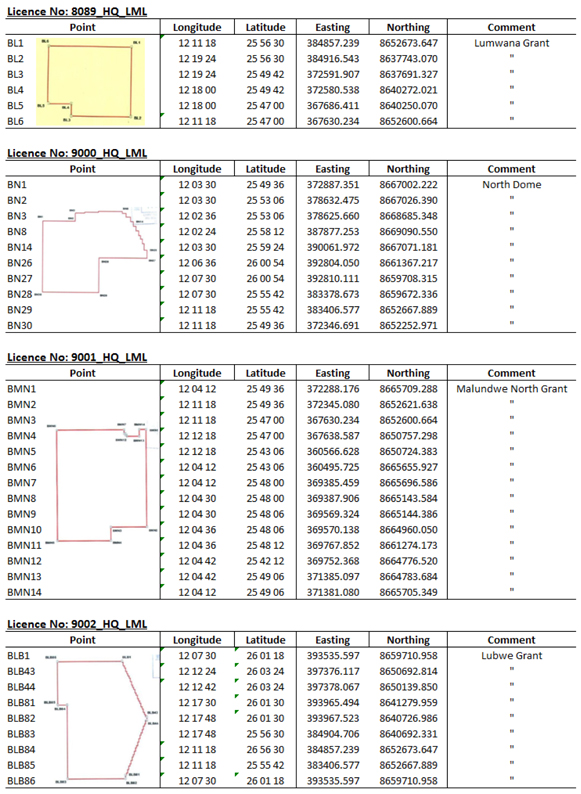
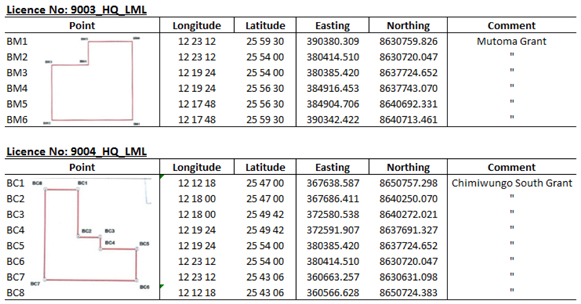
The coordinates of the respective Licences are shown in Figure 4-3.
FIGURE 4-3 MINING LICENCE COORDINATES
| | |
| Barrick Gold Corporation – Lumwana Mine, | | Page 4 -4 |
| Technical Report NI 43 -101 – March 27, 2014 | |
Conditions of the licences include:
| • | | develop the mining area in accordance with approved programme of mining operations; |
| • | | execute the environmental management plan; |
| • | | pay mineral royalty in accordance with the Mines and Minerals Development Act, 2008 and the Income Tax Act Cap 323; |
| • | | maintain at the holders office, complete and accurate technical and financial records of mining operations; |
| • | | permit authorized officers, at any time, to inspect all records, mining or mineral processing operation; |
| • | | submit statutory reports, records and any other information concerning mining operations; |
| • | | submit copies of annual audited financial statement within three months of the end of each financial year; |
| • | | submit report on external supplies of ore, concentrates, tailing slimes or any other mineral fed to the plant; |
| • | | provide current information on recovery from ores, mineral products, production costs and sales; |
| | |
| Barrick Gold Corporation – Lumwana Mine, | | Page 4 -5 |
| Technical Report NI 43 -101 – March 27, 2014 | |
| • | | conduct operations only upon meeting the requirements under the Environmental Protection and Pollution Control Act, Cap 204 and upon obtaining an annual operation permit under the Mines and Minerals Development Act, 2008; |
| • | | contribute to the Environmental Protection Fund as required under the Mines and Minerals Development Act, 2008; |
| • | | obtain appropriate insurances for phases of its operations; |
| • | | comply with the provisions of the Mines and Minerals Development Act, 2008; |
| • | | no illegal mining and trade are permitted in the mining area; |
| • | | no entering into any agreements or transferring the licence without the prior consent of the Director; |
| • | | the holder is liable for any harm or damage caused by the mineral processing or mining operations and must compensate any person to whom harm or damage is caused; |
| • | | no exercise of any rights under the licence without prior consent of legal occupiers of land or local chiefs; |
| • | | apply for a renewal of the licence not later than one year before expiry of the licence and to comply with the abandonement procedures and requirements of the area in terms of Section 24 of the Mines and Minerals Development Act, 2008; |
| • | | pay Area Charges on the grant of the Licence and thereafter annually on the anniversary thereof until the termination of the licence in terms of Section 143 of the Mines and Minerals Development Act, 2008. |
DEVELOPMENT AGREEMENT
The Minister of Mines and Minerals Development has entered into development agreements with holders of large-scale mining licences for the purpose of encouraging and protecting large-scale investments in Zambia’s mining sector. A development agreement between the Government of the Republic of Zambia (GRZ) and Equinox (the Lumwana Development Agreement) was signed on December 16, 2005, providing a 10-year stability period for the key fiscal and taxation provisions related to Lumwana.
| | |
| Barrick Gold Corporation – Lumwana Mine, | | Page 4 -6 |
| Technical Report NI 43 -101 – March 27, 2014 | |
Key issues defined in the Lumwana Development Agreement include a corporate tax rate of 25% and a mineral royalty of 0.6% of gross product. Capital expenditure can be deducted in the year incurred and losses can be carried forward for up to ten years. There has been a deferral of payment of various customs and excise duties and imposts and a confirmation that there will be no withholding tax payable on the remission of profits or the repatriation of capital.
The Lumwana Development Agreement also contains provisions for: arbitration; employment matters; energy and supply; exchange control; export regulations and procedures; regulations and management of companies; mining operation, curtailment of production, resumption of production and closure; waiver of the GRZ’s sovereign immunity; investment agreements; and enforcement of foreign awards.
Incorporated in the Lumwana Development Agreement is a Copper Price Participation Agreement (PPA). The PPA is triggered upon the extinguishment of the Lumwana Project Debt Facility and only if the margin between the copper price and Lumwana operating costs is above an agreed threshold. The total amount due in the event of the above occurring is capped at US$50.0 million with a further US$50.0 million potentially payable for a “windfall” margin between the copper price and Lumwana operating costs. The Lumwana Development Agreement contemplated a refinancing of the Lumwana Project Debt Facility and as such there is no change to the trigger for extinguishment of debt which was aligned to the date the facilities were due for full repayment which was September 30, 2015. Equinox achieved financial close of the Corporate Facility (refinancing of the Lumwana Project Debt) in March 2010. This refinancing did not trigger the PPA.
On April 1, 2008, the GRZ enacted a number of changes to the tax regime, particularly in relation to mining companies. The regime changes included an increase in the corporate tax from 25% to 30%, an increase in the mining royalty from 0.6% to 3%, and a number of other proposed additional imposts including a “variable profit tax”, a “windfall tax” and treatment of hedging income as separate source income (the 2008 Tax Changes). The 2008 Tax Changes coincided with the GRZ unilaterally rescinding tax stability guarantees contained in development agreements through a legislative provision stating that development agreements were no longer binding on the Republic of Zambia. In January 2009, the GRZ announced the abolition of a number of the 2008 Tax Changes,
| | |
| Barrick Gold Corporation – Lumwana Mine, | | Page 4 -7 |
| Technical Report NI 43 -101 – March 27, 2014 | |
including removing the hedging activity quarantine provision, abolishing the windfall tax, and increasing capital allowances back up to 100%. These changes took effect on April 1, 2009.
In December 2011, the GRZ increased the mineral royalty from 3% to 6% and re-introduced the taxation of hedging income as a separate source income (the 2011 Tax Changes). The 2011 Tax Changes took effect from April 1, 2012. Based on local and international legal advice, Barrick believes that the compensation rights for breach of the 10-year stability period granted under the Lumwana Development Agreement prevail over the 2008 and 2011 Tax Changes and any subsequent tax changes to the Zambian tax regime. However, until it resolves the uncertainty surrounding the application of the Lumwana Development Agreement with the GRZ, Barrick is measuring (and during 2013 did measure) its taxation balances for the property on the basis of the enacted legislation, including payment of mineral royalties assessed at 6%. Barrick continues to reserve its right to compensation for breach of the tax stability provisions under the Lumwana Development Agreement and, by agreeing to pay mineral royalties, protect itself from the ZRA assessing interest and penalties on the tax amount.
ZAMBIAN TAXES
The royalties and taxes that apply to the Lumwana Copper Project after the Lumwana Development Agreement expires are listed below:
| • | | Variable Tax (30% to 45%) |
| • | | VAT (exports 0%, in Zambia 16%) |
| • | | Withholding Tax (0% to 15%) |
| • | | Customs Duty (0% to 25%) |
| • | | Capital Allowances (100%) |
| | |
| Barrick Gold Corporation – Lumwana Mine, | | Page 4 -8 |
| Technical Report NI 43 -101 – March 27, 2014 | |
ROYALTY PAYMENTS
Under the Lumwana Development Agreement, a royalty of 0.6% of gross metal value is applicable until 2015; otherwise a royalty of 6.0% of gross metal value will be applicable. Barrick has been paying the statutory rate of 6.0% under a reservation of rights, as addressed in page 4-8 above.
SURFACE RIGHTS
Barrick has secured the long-term land title to some 35,000 ha (350 km2) of township and mine operating areas in the Lumwana Project.
PROJECT LAYOUT
Figure 4-3 shows the locations of the current Malundwe and Chimiwungo pits in conjunction with the tailings and water dams, concentrator and township (Lumwana Estate).
FIGURE 4-4 PROJECT SURFACE LAYOUT
ENVIRONMENTAL LIABILITIES
There are no material environmental liabilities with respect to the property.
| | |
| Barrick Gold Corporation – Lumwana Mine, | | Page 4 -9 |
| Technical Report NI 43 -101 – March 27, 2014 | |
5 ACCESSIBILITY, CLIMATE, LOCAL RESOURCES, INFRASTRUCTURE AND PHYSIOGRAPHY
ACCESSIBILITY
The Lumwana Project is accessed via a 10 km road branching off the North West Highway (T-5), a two-lane highway linking Lumwana and Solwezi to the rest of the Copperbelt and other parts of the North-Western Province.
Commercial airstrips are situated at Solwezi, 65 km to the east of Lumwana and Mwinilunga some 84 km to the west.
CLIMATE
The EIA undertaken for the Copper Project (and approved in 2005) summarized climatic conditions as shown in the table below.
Table5-1: METEOROLOGICAL DATA (FROM 2005 EIA REPORT)
| | | | |
PARAMETER | | DESCRIPTION | | VALUE |
Rainfall | | Total annual | | 1,310 mm |
| | |
Temperature | | Maximum (day time - October) Minimum (night-time - June) | | 34.2
4.0 |
| | |
Wind | | Mean speed Maximum speed Prevailing wind direction | | 0.3 m/s
14.8 m/s South east |
The above datasets have a similar trend and values with the measurements currently being recorded.
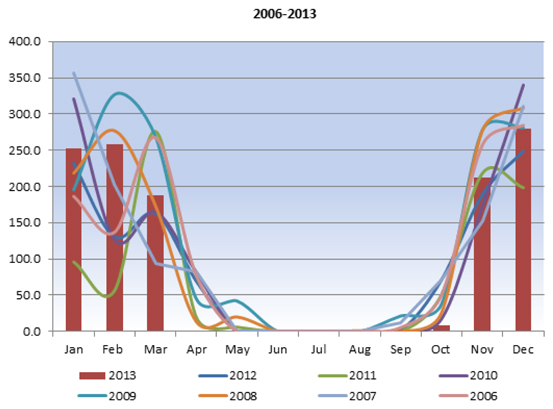
Rainfall
Lumwana has a distinct wet season from October to April and, as such, rainfall is discussed both on an annual basis, January – December, and the wet season (taken from October to May) to capture any variation.
| | |
| Barrick Gold Corporation – Lumwana Mine, | | Page 5 -1 |
| Technical Report NI 43 -101 – March 27, 2014 | |
Table 5-2 and Figure 5-1 below show rainfall statistics since 2006 in tabular and graphical form.
Table5-2: RAINFALL STATISTICS
| | | | |
Year/Season | | Total Rainfall (mm) | |
2006 | | | 1,286.5 | |
2006-2007 Wet Season | | | 1,328 | |
2007 | | | 1,283 | |
2007-2008 Wet Season | | | 1,237 | |
2008 | | | 1,315.5 | |
2008-2009 Wet Season | | | 1,476.5 | |
2009 | | | 1545.5 | |
2009-2010 Wet Season | | | 1309.5 | |
2010 | | | 1,251.0 | |
*2010-2011 Wet Season | | | 1,120.5 | |
*2011 | | | 1,148 | |
2011-2012 Wet Season | | | 1,063 | |
2012 | | | 1,048.5 | |
*2012-2013 Wet Season | | | 1,188 | |
*2013 | | | 1,201.5 | |
| * | Readings from the nearest rain gauge to the weather station as there were problems with the weather station at certain periods during the year |
| | |
| Barrick Gold Corporation – Lumwana Mine, | | Page 5 -2 |
| Technical Report NI 43 -101 – March 27, 2014 | |
FIGURE 5-1: RAINFALL STATISTICS
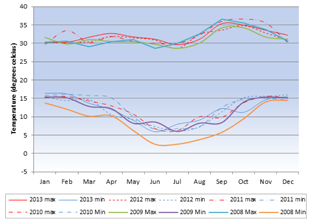
Temperature
Temperatures, as with the rainfall, are within the range of those predicted in the EIA (2005). Figure 5-2 below summarizes temperature data for the past six years from 2008.
Temperature trends are largely uniform over the six years of data; seasonal variation is visible. Temperatures decrease in March and rise again in August.
FIGURE 5-2: TEMERATURE 2008-20013
| | |
| Barrick Gold Corporation – Lumwana Mine, | | Page 5 -3 |
| Technical Report NI 43 -101 – March 27, 2014 | |
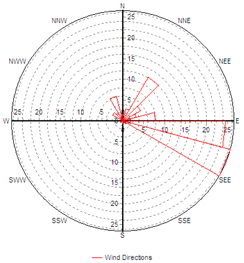
Wind Speed and Direction
The average wind speed varies on average between 0.8 and 2.5 m/s. Figure 5-3 below represents wind direction as a percentage of the whole. The predominant wind direction is south east to east and this is consistent with regional climatic information.
FIGURE 5-3: WIND DIRECTION 2013
LOCAL RESOURCES
A fully sustainable township, Lumwana Estate, has been constructed for the mine employees and their dependants, as well as associated contractors and suppliers required to work during mine operation. This model is designed to maximize residential living proximate to the mine. A light industrial and small business area is incorporated to promote local business activity. The township development also includes recreational facilities, commercial areas, places of worship and schools as appropriate in the various areas.
Mining supplies, contractors, and skilled labour can be sourced from larger centres in the Zambian Copperbelt.
| | |
| Barrick Gold Corporation – Lumwana Mine, | | Page 5 -4 |
| Technical Report NI 43 -101 – March 27, 2014 | |
INFRASTRUCTURE
Other than road access, there was very little established infrastructure in the mine area prior to mine development.
High voltage electrical power at 330 kV is delivered to the site from the Zambia Electricity Supply Company, ZESCO, which operates the national grid.
PHYSIOGRAPHY
The topography of the project area is characterized by gently rolling hills incised by the Lumwana East River and its tributary streams. Elevations range from approximately 1,270 MASL within the Lumwana East River watercourse to around 1,410 MASL within the general vicinity of project operations.
The predominant vegetation in the area of interest is “Miombo” woodland. Generally, the area is well wooded, with a good vegetation cover. The project area is not pristine due to the impacts from tree felling, charcoal burners, slash and burn agriculture and mineral exploration activities. Wetlands (dambo areas) are common along watercourses.
The soils of the area are typical of those found in sub-tropical regions, being heavily leached, low in nutrients, and of poor fertility. Subsistence farming is practised using the traditional Masala method (slash-and-burn). Farming is the main source of livelihood in the local area. The main crop grown is cassava, with maize, sweet potatoes, beans, and pineapples grown in the slightly more fertile dambo soils. There were no permanent dwellings in the mine area prior to mining activities starting, although some peripheral subsistence farming was practised and temporary wooden shelters were erected during the growing season.
There is very little wildlife in the area, mainly due to population pressure and over-hunting.
| | |
| Barrick Gold Corporation – Lumwana Mine, | | Page 5 -5 |
| Technical Report NI 43 -101 – March 27, 2014 | |
6 HISTORY
OWNERSHIP
The Roan Selection Trust Limited (RST) acquired the Lumwana project area in the late 1950s. American Metal Climax Inc (AMAX) took over RST and a new company called Mwinilunga Limited was formed to explore Lumwana through a joint venture between AMAX and Anglo American plc in 1970.
In 1975, the Zambian copper industry was fully nationalized and Lumwana was transferred to Mindeco Limited, a precursor to Zambia Consolidated Copper Mines Limited (ZCCM). In 1976, Rio Tinto-Zinc Corporation (RTZ) Consultants were commissioned by Mindeco to complete a pre-feasibility study.
From 1981 to 1990, Azienda General Italiana Petroli (AGIP) in joint venture with Compagnie Générale Des Matières Nucléaires (COGEMA) conducted uranium exploration in the Mwombezhi Dome.
Phelps Dodge applied for the Mwombezhi Dome Prospecting Licence in late 1992 and Equinox entered into a joint venture with Phelps Dodge in August 1999. Equinox earned a 51% interest in Lumwana by funding a Bankable Feasibility Study in 2003 (2003 BFS), and on December 31, 2004, it acquired the remaining 49% interest from Phelps Dodge.
Barrick acquired Equinox in July 2011, and Lumwana is now part of Barrick’s Global Copper Business.
EXPLORATION
The following is a summary of the exploration and project development of Lumwana.
In the 1930s, prospectors discovered copper in the Lumwana East River adjacent to the Malundwe copper clearing. Between 1957 and 1961, RST conducted regional geochemical and geophysical exploration in the Mwinilunga Concession covering Lumwana.
| | |
| Barrick Gold Corporation – Lumwana Mine, | | Page 6 -1 |
| Technical Report NI 43 -101 – March 27, 2014 | |
In 1961, RST drilled the Malundwe discovery hole in 1961, the Chimiwungo and Lubwe discovery holes in December 1962 and continued drilling through to 1965. A mining scoping study, including the first resource and reserve estimation, was completed by RST in 1968.
Chimiwungo South mineralization was discovered in the early 1970s.
Between 1981 and 1990, a drilling program was conducted by the AGIP-COGEMA joint venture at Lumwana and a prefeasibility study was completed, which focused on developing the Valeria copper uranium deposit at Malundwe and a small portion of the Chimiwungo deposit.
From 1992 until 1996, Phelps Dodge commenced exploration re-focusing on the two copper deposits. Two Pre-Feasibility studies were also completed applying different development scenarios.
In 1999 to 2000, Equinox completed a due diligence study which included reporting Mineral Resources in compliance with the JORC Code by consultants, Resource Services Group. In 2000/2001, Equinox commissioned Bateman Engineering Pty Ltd (Bateman) to conduct a pre-feasibility study that included reporting Mineral Resources and mine design by Mining Resource Technology Pty Ltd (MRT).
The 2003 BFS was completed using Aker Kvaerner as principal consultant for overall project management. Golder Associates Pty Ltd (Golder) was responsible for all geoscientific, environmental, and tailings dam studies. The BFS included an extensive two phase resource definition, metallurgical sampling, geotechnical and hydrogeological drilling program
In 2004 and 2005, an induced polarization (IP) survey and reverse circulation (RC) drilling program were carried out and discovered the Chimiwungo North deposit. The 2003 BFS capital and operating cost estimates were updated in October 2005. GRD Minproc was responsible for the concentrator and infrastructure, Golder was responsible for the Mineral Resource estimation of the Chimiwungo North deposit, Equinox updated the mining plan, and Knight Piésold was responsible for the tailings and water
| | |
| Barrick Gold Corporation – Lumwana Mine, | | Page 6 -2 |
| Technical Report NI 43 -101 – March 27, 2014 | |
management sections. Additional metallurgical and geotechnical drilling, sampling and test-work was also undertaken during this period. In December 2005, project development commenced with the construction of mine access roads and the first stage of the construction camp.
In 2006, the project development contract for Lumwana was awarded. The contract initially was an Engineering Procurement and Construction Management (EPCM) schedule of rates contract, which later converted to an EPC fixed price contract. Equinox completed an infill combined RC and diamond core drill program within the northern half of the 2003 BFS Chimiwungo Pit. Project development works continued in 2006 with concentrator site and water dam earthworks and the expansion of the construction camp.
Pre-production mining began in April 2007, initially focusing upon the pre-stripping of oxidized materials from the Malundwe pit. A total of 170 holes (12 diamond core and 158 RC percussion holes) were drilled within the Malundwe open pit to upgrade most of the uranium Mineral Resources from the Inferred to Indicated category. Exploration drilling south of Malundwe in the Kanga area discovered the southern extension of the Malundwe deposit.
The Lumwana Copper Project was commissioned in December 2008 and the 2008 Uranium Feasibility Study (2008 UFS) was completed in June using Ausenco Limited as principal consultant for overall project management.
Continued exploration in the mining license in 2009 tested historical copper targets and resulted in the definition of several coincident copper soils – IP chargeability anomalies including Odile, North Dome and in the Lubwe trend.
In 2010, a resource infill and extension drilling campaign was carried out at Chimiwungo (79 diamond holes and 150 RC holes) in an attempt to define the limits of the ore body and provide greater data density within the eastern and southern portions of the Chimiwungo deposit. At the end of 2010, the ore body was still open to the south and east with drilling ongoing.
| | |
| Barrick Gold Corporation – Lumwana Mine, | | Page 6 -3 |
| Technical Report NI 43 -101 – March 27, 2014 | |
A comprehensive exploration campaign was undertaken during 2011 and 2012 consisting of both RC and Diamond drilling. The Chimiwungo Resource was extensively drilled (200mx100m drill spacing) to achieve at least an Indicated Resource category. Furthermore, the Roan Shoot, oxide transition zone, was infill drilled (100mx50m drill spacing) to Measured category. The eastern and western margins were drilled to delineate the strike extent of the mineralised package.
Supplementary drilling was undertaken aimed to define the structural architecture of the main ore shoot zones and identify the main cross cutting deformation structures for geotechnical mine planning.
A drilling program was conducted in 2013 that targeted the Malundwe and Chimiwungo resource areas as well provided condemnation drilling.
PREVIOUS RESOURCE ESTIMATES
Previous resource estimates were prepared for Mindeco by RTZ Consultants (RTZ) in 1976, for Phelps Dodge Exploration Corporation by Bateman Minerals and Industrial Limited (Bateman) in 1995, and for Equinox Resources NL by Resource Service Group (RSG) in 1999.
An independent Mineral Resource Estimate was prepared to JORC standards in February 2003 by Golder and reconciled to the standards prescribed by NI 43-101 in June 2004. The Chimiwungo Mineral Resource Estimate was updated in 2005 with the discovery of the Chimiwungo North mineralization. Golder completed a Mineral Resource Estimate for the Chimiwungo North area (Lumwana Technical Report, 2005) in accordance with JORC and NI 43-101 standards.
The Chimiwungo Mineral Resource Estimate was revised by Golder in July 2006 in accordance with JORC and NI 43-101 standards after completion of an infill combined diamond and RC drill program in the northwestern portion of Chimiwungo (within the northern half of the 2003 BFS Chimiwungo Main Pit). The infill program upgraded a significant tonnage of Inferred Mineral Resources to the Indicated Mineral Resource category, and confirmed the continuity of mineralization.
| | |
| Barrick Gold Corporation – Lumwana Mine, | | Page 6 -4 |
| Technical Report NI 43 -101 – March 27, 2014 | |
Table 6-1 contains a summary of the historical Malundwe and Chimiwungo copper tonnage, grade estimates and Copper Mineral Resources and Mineral Reserves developed between 1976 and 2011.
Note that all pre–1999 estimates are not to JORC or National Instrument 43-101 standards, and are listed for reference only. Barrick offers no opinion as to the relevance or reliability of the estimates made under previous ownership.
The Mineral Resource figures include Measured, Indicated and Inferred categories, and are exclusive of Mineral Reserves.
TABLE 6-1 COPPER MINERAL RESOURCE AND RESERVE ESTIMATES PRIOR TO BARRICK OWNERSHIP
Barrick Gold Corporation – Lumwana Mine
| | | | | | | | | | |
| | | Year | | Cut-off Grade
(% Cu) | | Tonnes
(Mt) | | Grade
(% Cu) | | Consultant |
Mineral Resources | | 1976 | | 0.10 | | 957.0 | | 0.70 | | RTZ |
| | 1995 | | 0.20 | | 1,017.0 | | 0.73 | | Bateman |
| | 1999 | | 0.20 | | 1,063.8 | | 0.67 | | RSG |
| | 2003 | | 0.20 | | 901.2 | | 0.70 | | Golder |
| | 2006 | | 0.20 | | 966.2 | | 0.67 | | Golder |
| | 2009 | | 0.20 | | 922.6 | | 0.68 | | Golder |
| | 2011 | | 0.20 | | 962.9 | | 0.60 | | Golder |
| | | | | |
Mineral Reserves | | 1976 | | 0.30 | | 583.0 | | 0.85 | | RTZ |
| | 1995 | | Profit = 0 | | 181.8 | | 0.81 | | Bateman |
| | 2000 | | 0.20 | | 330.0 | | 0.73 | | MRT* |
| | 2003 | | 0.19 to 0.36 | | 212.7 | | 0.82 | | Golder |
| | 2006 | | 0.16 to 0.37 | | 321.3 | | 0.73 | | Golder |
| | 2009 | | 0.16 to 0.27 | | 319.4 | | 0.73 | | Golder |
| | 2011 | | 0.20 to 0.35 | | 426.3 | | 0.52 | | Golder |
| * | Mining and Resources Technology Pty Ltd |
PAST PRODUCTION
Commercial copper production was achieved in April 2009. Table 6-3 presents Lumwana production to the end of 2013.
| | |
| Barrick Gold Corporation – Lumwana Mine, | | Page 6 -5 |
| Technical Report NI 43 -101 – March 27, 2014 | |
TABLE 6-2 LUMWANA PRODUCTION HISTORY
Barrick Gold Corporation – Lumwana Mine
| | | | | | | | |
Year | | Copper (Tonnes) | | | * C1 Cash Cost ($/lb) | |
2009 | | | 109,413 | | | | 1.49 | |
2010 | | | 146,690 | | | | 1.38 | |
2011 | | | 117,022 | | | | 2.25 | |
2012 | | | 81,144 | | | | 3.26 | |
2013 | | | 117,968 | | | | 2.24 | |
| | | | | | | | |
Total | | | 572,237 | | | | 2.02 | |
| | | | | | | | |
Footnote:
| * | Wood Mackenzie C1 Cash Cost |
| | |
| Barrick Gold Corporation – Lumwana Mine, | | Page 6 -6 |
| Technical Report NI 43 -101 – March 27, 2014 | |
7 GEOLOGICAL SETTING AND MINERALIZATION
REGIONAL GEOLOGY
The Lumwana copper deposits of Malundwe and Chimiwungo are hosted within the Mwombezhi Dome, which is a northeast trending basement dome in the western arm of the Lufilian Arc thrust fold belt. The Lufilian Arc is a major tectonic province characterized by broadly north-directed thrust structures and antiformal basement inliers or domes surrounded by Katangan metasediments, which host the Central African Copperbelt in the central part of Zambia.
In Zambia, the Lufilian Arc contains variably deformed and metamorphosed Late Proterozoic metasediments and volcanics of the Katangan Lower and Upper Roan, Mwashia, Nguba and the Kundelungu super groups, which unconformably overly the basement. The basement consists of older metamorphosed gneisses, schists, migmatites, amphibolites and granitoids. Subsequent to the deposition of the Katangan sequences, the basin was inverted, deformed, metamorphosed and uplifted by generally north directed thrusting and folding to produce the late Neoproterozoic – Cambrian Lufilian Arc.
The Mwombezhi Dome extends some 67 km northeast and is up to 20 km wide in the northwest direction. Lumwana Project occupies the north eastern lobe of the Mwombezhi Dome. The edge of the Mwombezhi Dome is interpreted as being defined by a regional shear zone or décollement which consists of intensely sheared muscovite - quartz + talc + hematite + kyanite schist containing, generally at the structural top, semi-continuous lenses of resistive, variably micaceous and carbonate-bearing high magnesium quartzite interpreted to be Lower Roan and referred to locally as the Rimming Quartzite. The regional geology of the Zambian and Central African Copperbelt is shown in Figure 7-1.
| | |
| Barrick Gold Corporation – Lumwana Mine, | | Page 7 -1 |
| Technical Report NI 43 -101 – March 27, 2014 | |
FIGURE 7-1 REGIONAL GEOLOGY
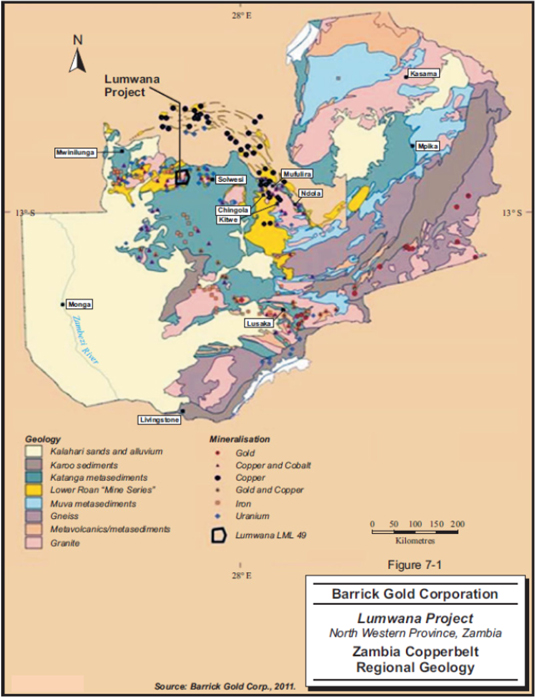
| | |
| Barrick Gold Corporation – Lumwana Mine, | | Page 7 -2 |
| Technical Report NI 43 -101 – March 27, 2014 | |
LOCAL GEOLOGY
The precise structural setting inside the Mwombezhi Dome below the décollement is still being resolved, but a number of Lufilian age, layer-parallel shear zones are recognized. These shears structurally emplaced the Katangan units within the basement, producing a series of tectono-stratigraphic sheets which have been thrust on top of two central cores of the Mwombezhi Dome. Within the Lumwana mining leases, these include the Malundwe and Chimiwungo Sheets.
The local stratigraphy of the Malundwe and Chimiwungo deposits is broadly based on the original basement-Katangan stratigraphy but it has been overturned and modified by shearing, high grade metamorphism and thrusting. The resulting stratigraphy and lithologies are the product of tectonic, metasomatic, and metamorphic processes during the Lufilian Orogeny which bear little resemblance to the original pre-Lufilian Orogeny rock types; thus, the current sequence is tectono-stratigraphic in origin. Although the two deposits are considered to lie within different thrust sheets, and in detail have different tectono-stratigraphies, they share a number of similarities.
The local geology of the Lumwana area is shown below in Figure 7-2.
| | |
| Barrick Gold Corporation – Lumwana Mine, | | Page 7 -3 |
| Technical Report NI 43 -101 – March 27, 2014 | |
FIGURE 7-2 LOCAL GEOLOGY
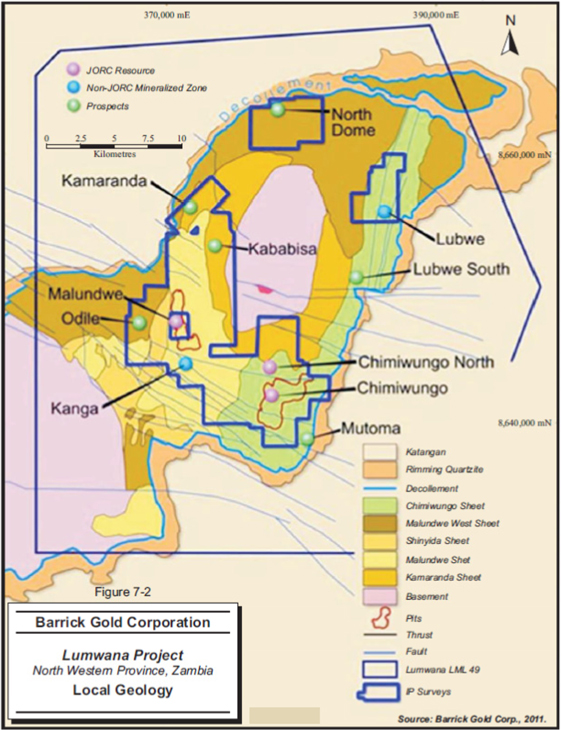
| | |
| Barrick Gold Corporation – Lumwana Mine, | | Page 7 -4 |
| Technical Report NI 43 -101 – March 27, 2014 | |
PROPERTY GEOLOGY
The Lumwana Project consists of two major copper deposits, Malundwe and Chimiwungo. Malundwe is the smaller deposit but has a higher copper grade and contains discrete zones of uranium and gold mineralization with occasional sporadic high cobalt (>0.1%). Chimiwungo is a much larger deposit that is lower in copper grade and contains a number of significant high grade (>0.1%) cobalt zones in addition to some uranium mineralization. Chimiwungo can be sub-divided into the Chimiwungo Main, Chimiwungo South, Chimiwungo North and Chimiwungo East mineralized zones.
The copper mineralization at Malundwe (including Kanga) and Chimiwungo is hosted almost entirely within high grade metamorphosed, intensely mylonitized, recrystallized muscovite–phlogopite–quartz–kyanite schists with disseminated sulphides (typically <5%) dominated by chalcopyrite and bornite which is locally referred to as Mineralized Ore Schist.
The ore host, Mineralized Ore Schist, has an intensely transposed foliation defined by layer-parallel alignment of both mica and quartz. The mineralized zones, as interpreted, comprise a series of interbanded Mineralized Ore Schist and gneissic units which are structurally derived. This fabric is the result of regional layer parallel shearing and subsequently thrusting and possible Nappe folding that has caused the overturning of the sequence. The internal structure of the mineralized package is attenuated and boudinaged in part, causing lensing along strike and down dip. Within the mineralized zone, gneissic units are typically low grade to barren with respect to copper, gold, cobalt and uranium grades.
The distribution of copper mineralization is controlled by visibly identifiable strata-bound geology, within which copper grades are consistent. Optimal grade continuity is aligned to an observed north–south stretching lineation.
MINERALIZATION
The copper mineralization at Lumwana is almost entirely disseminated sulphides (typically <5%) dominated by chalcopyrite and bornite with a minor amount of the resource classified as oxide or transition.
| | |
| Barrick Gold Corporation – Lumwana Mine, | | Page 7 -5 |
| Technical Report NI 43 -101 – March 27, 2014 | |
The overall strike length of mineralization at Malundwe is approximately 6 km north-south, and up to 1.5 km wide (east-west), predominantly as a single Mineralized Ore Schist horizon. The mineralization outcrops in the east, has an overall gentle dip to the west and plunges to the south. It extends to maximum depth of approximately 380 m below surface in the southwest is closed off in all directions (Figure 7-3).
The Chimiwungo deposit is partitioned into three bodies by two steep west-northwest trending dip-slip fault zones. From south to north these mineralized zones are referred to as Chimiwungo South, Chimiwungo Main (includes the recently discovered Chimiwungo East mineralized shoot) and Chimiwungo North. Each is described as a discrete structural entity below, but the reality is that they represent the same mineralized package which has been dismembered by late, steep dip slip faults which will be collectively referred to hereafter as the Chimiwungo deposit.
Chimiwungo South mineralized zone is located south of the Chimiwungo South Fault. The mineralization consists of a package of three Mineralized Ore Schist horizons:
The horizons are separated by two near continuous barren gneiss zones, the Middle Gneiss and the Lower Gneiss. In the thickest and best grade portion of the mineralization, two thicker, higher grade copper mineralized shoot have formed where the barren Lower Gneiss unit is replaced by Mineralized Ore Schist resulting in the merger of the Main and Lower Ore Schists. The mineralized package and the individual Mineralized Ore Schist and gneiss zones have a gentle southerly dip and plunge. The mineralization currently extends up to 5.5 km north-south and 2.8 km in the east-west orientation and remains open to the east and south. The deepest drill intersections of the mineralization currently are approximately 680 m below surface. The northern limit of Chimiwungo South is defined by the Chimiwungo South Fault which has caused the mineralized package to drop down approximately 300 m on the north side of this major structure.
Chimiwungo Main mineralization is the down thrown continuation of Chimiwungo South mineralization on the north side of the Chimiwungo South Fault and is bound between this
| | |
| Barrick Gold Corporation – Lumwana Mine, | | Page 7 -6 |
| Technical Report NI 43 -101 – March 27, 2014 | |
fault and the Chimiwungo North Fault. It consists of the same mineralized package and gneiss units that have a similar average dip and plunge to Chimiwungo South. It also hosts the northern continuation of the ore shoot observed in the Chimiwungo South area which extends approximately 1.4 km north of the Chimiwungo South fault. Drill definition of the mineralization extends approximately 2.7 km north-south, and 4.2 km in the east-west orientation. The deepest mineralization is located at approximately 495 m below surface at the southeastern limit of the Chimiwungo Main deposit adjacent to the Chimiwungo South Fault zone (Figure 7-4).
Chimiwungo North is located immediately north of the Chimiwungo North Fault which is a steep dip slip fault zone similar in style to the Chimiwungo South Fault (Figure 7-5). This fault has dropped the mineralization on the northern side of the fault approximately 100 m, preserving it from erosion. In the area drilled, the mineralization consists of one Mineralized Ore Schist unit which appears to have formed by the merging of the three Mineralized Ore Schist units seen in Chimiwungo Main. The mineralized zone dips and plunges gently to the south and currently extends over an area of 700 m (north-south) by 450 m (east-west). The southern boundary is constrained by the Chimiwungo North fault. Recent drilling indicates the eastern edge of the ore zone is an erosional boundary defined by the current topographical surface. However, a gentle north-south trending antiform has been interpreted to the east of this position which folds the mineralization back below surface in the north eastern portion of Chimiwungo. The Chimiwungo North ore body has a maximum depth of approximately 110 m.
FIGURE 7-3 MALUNDWE MINERALIZATION – CROSS SECTION (LOOKING NORTH)
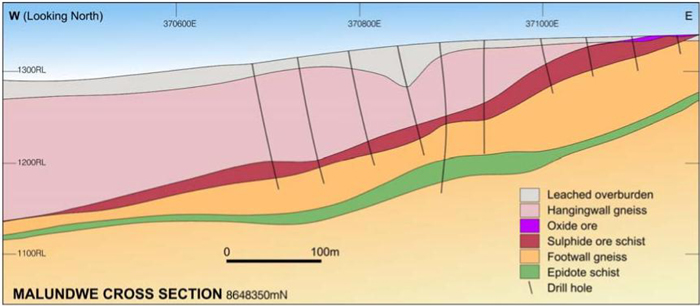
| | |
| Barrick Gold Corporation – Lumwana Mine, | | Page 7 -7 |
| Technical Report NI 43 -101 – March 27, 2014 | |
FIGURE 7-4 CHIMIWUNGO MINERALIZATION – CROSS SECTION (LOOKING WEST)
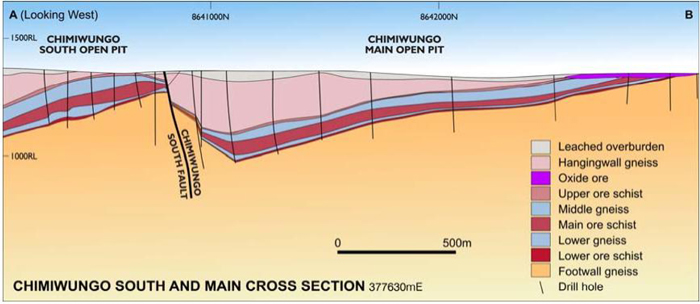
FIGURE 7-5 CHIMIWUNGO NORTH MINERALIZATION – CROSS SECTION (LOOKING WEST)
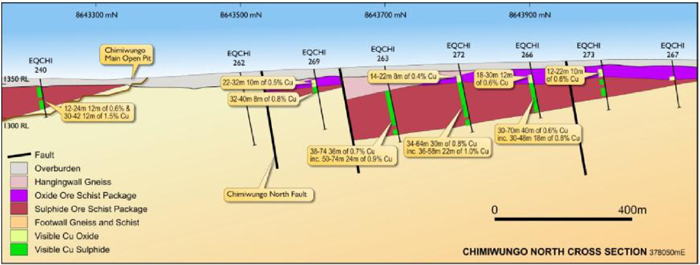
| | |
| Barrick Gold Corporation – Lumwana Mine, | | Page 7 -8 |
| Technical Report NI 43 -101 – March 27, 2014 | |
8 DEPOSIT TYPES
The Central African Copperbelt is a world-class metallogenic province which stretches from the Copperbelt Province in Zambia, through the Katangan Province of the Democratic Republic of Congo and into the North-Western Province of Zambia.
The Lumwana Project lies within the North-Western Province of Zambia and contains two major copper deposits, Malundwe and Chimiwungo, which are structurally controlled shear zone hosted deposits considered to be an end member of Central African Copperbelt class of deposits.
| | |
| Barrick Gold Corporation – Lumwana Mine, | | Page 8 -1 |
| Technical Report NI 43 -101 – March 27, 2014 | |
9 EXPLORATION
Equinox compiled a comprehensive Geographical Information System (GIS) database of the Lumwana region using historical exploration data, recent, airborne and ground geophysics, surface geochemistry, mapping and drill hole information which Barrick has acquired.
Equinox started exploration at Lumwana in 1999 and identified 28 targets within the project area. Of these, the Chimiwungo North and Kanga targets have been converted into Mineral Resources. Exploration targets include Mutoma, Odile and Lubwe as shown inFigure 9-1.
An IP survey was completed in the Chimiwungo South/Mutoma area and drilling was carried out in 2011 to test the potential for shallow mineralization in this area.
FIGURE 9-1 LUMWANA PROJECT AREA EXPLORATION POTENTIAL
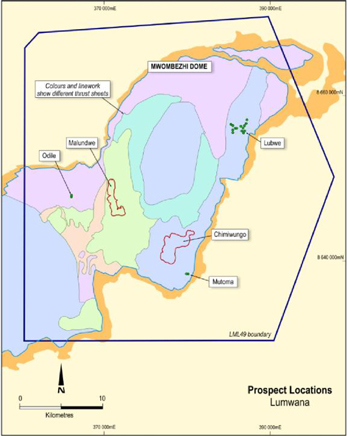
| | |
| Barrick Gold Corporation – Lumwana Mine, | | Page 9 -1 |
| Technical Report NI 43 -101 – March 27, 2014 | |
KANGA
The Kanga area is the southern, down plunge extension of the Malundwe deposit. This part of the Malundwe deposit has previously been referred to as the Malundwe South prospect. Sporadic historical drilling along the eastern margin of the Kanga area has intersected modest widths of copper Mineralized Ore Schist; however, this mineralization was not considered significant by past explorers. In 2006, Equinox completed a ground IP geophysical survey which identified a significant, two kilometre long north-south chargeable anomaly approximately 300 m south of the known Malundwe resource at that time. Drilling to test the IP chargeable anomaly at Kanga commenced in September 2006 and has subsequently confirmed the area to be the southern extension of the Malundwe deposit. The Malundwe deposit now has a north-south strike of approximately six kilometres.
MUTOMA
Mutoma was originally identified by RST in the 1970s as a copper soil anomaly associated with a sub-crop of limonitic mica schist; despite this, no follow-up work was completed at the prospect until 2009. During 2009, ground spectrometer, soil and rock geochemical sampling and regolith mapping were completed by Equinox which defined two, in-situ coincident Cu-U anomalies located on the south side of the Chimiwungo South Fault. The eastern anomaly, located immediately south of the Chimiwungo South Fault has the highest copper response, peaking at 440 ppm Cu. The western anomaly is located 600 m south of the Chimiwungo South Fault, sandwiched between two approximately north-south trending interpreted faults, considered to represent an up faulted block. The Mutoma prospect lies within the Chimiwungo Thrust Sheet, 2.2 km east of the currently defined Chimiwungo deposit.
ODILE
During 2009, extensive field work by Equinox occurred at the Odile Prospect. The prospect was identified by the coincidence of ground spectrometer uranium, copper soil geochemical and IP geophysical chargeable anomalies. The host rocks were interpreted to be comparable to the Malundwe and Chimiwungo deposits, although the prospect lies on a different thrust sheet. In November 2010, a diamond rig was moved to the Odile prospect, where seven holes were drilled by Equinox.
| | |
| Barrick Gold Corporation – Lumwana Mine, | | Page 9 -2 |
| Technical Report NI 43 -101 – March 27, 2014 | |
LUBWE
The Lubwe deposit is located approximately 13 km north-northeast of Chimiwungo, within the Chimiwungo Thrust Sheet. Lubwe was discovered by RST in the 1960s and was further investigated by Phelps Dodge in the mid-1990s and then Equinox between 2004 and 2009. Equinox’s exploration includes soil and rock sampling, ground spectrometer and IP surveys, mapping activities and diamond and RC drilling.
| | |
| Barrick Gold Corporation – Lumwana Mine, | | Page 9 -3 |
| Technical Report NI 43 -101 – March 27, 2014 | |
10 DRILLING
HISTORY
Drilling within the Malundwe deposit commenced in 1961 and the first hole at Chimiwungo was drilled in 1962. Since that time, five companies have drilled within and immediately surrounding the Malundwe and Chimiwungo deposits predominantly for resource definition, but also to obtain metallurgical, geotechnical and hydrogeological data. Table 10-1 summarizes historical drilling at Lumwana.
TABLE 10-1 HISTORICAL DRILLING SUMMARY
Barrick Gold Corporation – Lumwana Mine
| | | | |
Date | | Company | | Details |
| 1961 - 1976 | | RST and related companies (Mwinilunga Mines (1970) Limited and Mindeco Limited) | | 315 diamond core holes |
| | |
| 1982 – 1990 | | AGIP Zambia Limited - COGEMA Joint Venture | | 101 diamond holes and 113 tricone holes |
| | |
| 1993 – 1999 | | Phelps Dodge | | 27 diamond and 14 RC holes |
Equinox’s first drilling was in 2000 at Malundwe to obtain material for metallurgical test-work and hydrogeological data. This short programme consisted of two reverse circulation (RC), three diamond and two open hole percussion holes for a combined metreage of 595 m.
The next stage of Equinox’s drilling was completed for the 2003 BFS which was completed in two phases between November 2001 and November 2002. This program was focused on resource definition drilling but included metallurgical, geotechnical and hydrogeological drilling for a total of 638 holes for 65,237 m being drilled.
In 2004, Equinox discovered the Chimiwungo North deposit immediately north of Chimiwungo and completed geotechnical and metallurgical drilling. Total drilling for the year consisted of 84 holes for 7,247 m.
| | |
| Barrick Gold Corporation – Lumwana Mine, | | Page 10 -1 |
| Technical Report NI 43 -101 – March 27, 2014 | |
In 2005, Equinox completed sterilization, metallurgical and geotechnical diamond drilling for a total of 64 holes for 3,980 m within the vicinity of the Malundwe and Chimiwungo deposits.
During 2006, 69 holes for 7,034 m were drilled at Chimiwungo and in the Kanga area of the Malundwe deposit. This included infill drilling in the northwestern portion of Chimiwungo and upgraded Inferred Resources to Indicated Mineral Resources. Drilling in the Kanga area extended the Malundwe deposit.
During 2007, the UFS drilling programme was completed as well as ongoing drilling in the Kanga area. A total of 216 holes for 21,201 m were completed in the Malundwe deposit in 2007.
Through 2008, drilling was continued in the vicinity of the Malundwe deposit defining the limits of the mineralization especially in the Kanga area. A total of 146 holes for 29,131 m were completed.
In 2010, Equinox discovered a second major high grade ore shoot on the eastern side of Chimiwungo and commenced a major resource, geotechnical, hydrogeology and sterilization drill programme in and around the Chimiwungo deposit. During 2010 a total of 244 holes for 43,194 m were drilled.
In 2011, drilling continued at Chimiwungo. A total of 182 holes for 65,858 m were completed. Drilling had been undertaken along the eastern and western sides of Chimiwungo, within the Chimiwungo South area and down plunge of Chimiwungo South. This has confirmed the presence of a second major mineralized shoot in the eastern side of Chimiwungo and greatly increases the extent of the mineralization at Chimiwungo with the deposit still open to the south and east.
Drilling at Malundwe in 2011 totalled 10 diamond drill holes (1,308 m) and 83 RC holes (8,382 m).
Two diamond drill holes (849 m) and two RC holes (93 m) were drilled at Mutoma in 2011. Each diamond drill hole returned several anomalous intersections of copper with hole MUTA0001 containing the most significant mineralization grading 1.25% Cu over 10 m from 296 m to 306 m.
| | |
| Barrick Gold Corporation – Lumwana Mine, | | Page 10 -2 |
| Technical Report NI 43 -101 – March 27, 2014 | |
Previous drilling at Odile (ODL011) intersected eight metres at 1.02% copper within a chalcopyrite and bornite Mineralized Ore Schist rock type, as well as uraninite associated with a quartz vein. Follow up drilling of the Odile mineralization consisted of 1,230 m in 11 drill holes using an RC drill rig. Although mineralized, none of the new holes returned significant copper intersections.
A previous total of 83 wide spaced RC drill holes and 13 new diamond drill holes (2,637 m) in 2011 have been completed to date by Barrick at Lubwe testing a large coincident copper soil and IP chargeability anomaly. The Barrick geological model considers the Lubwe mineralization to comprise a fault-segmented suite of north-plunging mineralized shoots. The drilling data has been used for an exploration model of the potential tonnes and grade that may be hosted within the deposit. This estimate indicated a tonnes and grade range of the order of 150 Mt to 200 Mt at a grade of between 0.5% Cu and 0.6% Cu.
Types of drilling activities are summarized in Table 10-2.
TABLE 10-2 DRILLING SUMMARY PRIOR TO BARRICK OWNERSHIP
Barrick Gold Corporation – Lumwana Mine
| | | | | | | | | | | | |
Date | | No. Diamond Drill
Holes | | | No. RC
Drill Holes | | | No. Percussion
Drill Holes | |
2000 | | | 4 | | | | 2 | | | | 2 | |
2001-2002 | | | 144 | | | | 474 | | | | 20 | |
2004 | | | 25 | | | | 46 | | | | — | |
2005 | | | 16 | | | | 48 | | | | — | |
2006 | | | 38 | | | | 31 | | | | — | |
2007 | | | 12 | | | | 203 | | | | 1 | |
2008 | | | 18 | | | | 128 | | | | 7 | |
2010 | | | 86 | | | | 150 | | | | — | |
2011 | | | 185 | | | | 118 | | | | — | |
| | | | | | | | | | | | |
Total | | | 528 | | | | 1,200 | | | | 30 | |
A drill hole location plan for Chimiwungo is presented in Figure 10-1.
| | |
| Barrick Gold Corporation – Lumwana Mine, | | Page 10 -3 |
| Technical Report NI 43 -101 – March 27, 2014 | |
FIGURE 10-1 CHIMIWUNGO DRILL HOLE COLLAR LOCATIONS PRIOR TO BARRICK OWNERSHIP
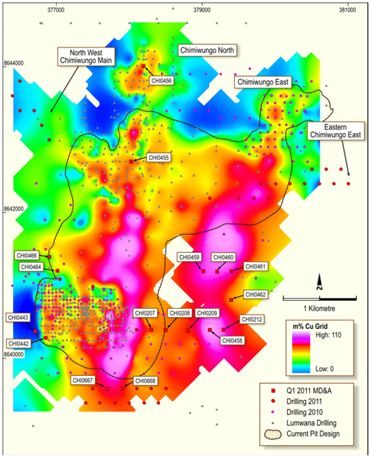
From mid 2011 to the end of 2012 Barrick Exploration commenced an extensive drill-out Program at Chimiwungo. These activities are summarised in Table 10.3 and illustrated in Figure 10.2.
TABLE 10-3 EXPLORATION SUMMARY FOR THE 2011/2012 DRILLING CAMPAIGN
Barrick Gold Corporation – Lumwana Mine
| | | | | | | | | | | | | | | | | | | | | | | | |
| | | RC Drilling | | | RCDD Drilling | | | DD Drilling | |
Date | | Holes | | | Metres | | | Holes | | | Metres | | | Holes | | | Metres | |
2011-2012 | | | 408 | | | | 48,621 | | | | 98 | | | | 37,132 | | | | 584 | | | | 267,045 | |
| | |
| Barrick Gold Corporation – Lumwana Mine, | | Page 10 -4 |
| Technical Report NI 43 -101 – March 27, 2014 | |
FIGURE 10-2 CHIMIWUNGO DRILL HOLE COLLAR LOCATIONS AS AT END OF 2012
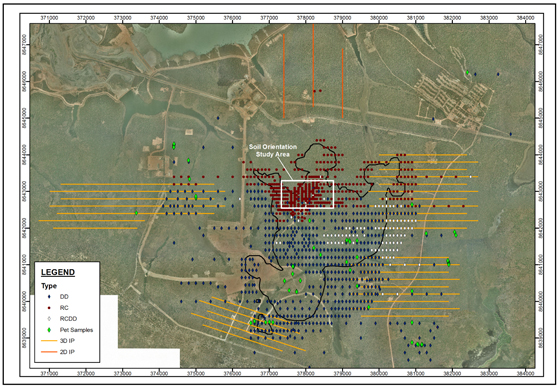
A total of 408 Reverse Circulation (RC) drill holes for 48,621 metres (including holes abandoned and redrilled) were completed during this program, focusing on the shallow up-dip extension of the Chimiwungo Main ore shoot in the oxide transition zone. Drill hole depths varied from 60m to 290m and holes were drilled on an inclination of -80° at a bearing of 000°. The RC program had two main objectives: to convert indicated resources (200x100m) to measured status (100x50m) within the Upper Roan Shoot ahead of starter pit development and to define an indicated resource over the Equinox Shoot, determining the lateral extents of the shoots to the east and west in the process. Better definition of the oxide-transition-sulphide boundaries was also an objective, to provide a better appreciation of the metallurgical recoveries possible from this zone.
In addition to resource drilling, RC pre-collars were drilled at the start of the Chimiwungo drill out ahead of the diamond rig ramp up, so that there were sufficient positions available for diamond rigs that do not have the potential to drill their own pre-collars. The precollars that were drilled had a number of issues including: 1) not penetrating saprock material and casing off in saprolite; 2) hole collapse due to poor collar preparation; 3) no shoe bits on the casing string which required the casing to be pulled ahead of the
| | |
| Barrick Gold Corporation – Lumwana Mine, | | Page 10 -5 |
| Technical Report NI 43 -101 – March 27, 2014 | |
diamond tail, and 4) no geologist was on the rig at the time the precollar was drilled to log or call end of hole. The precollar program was terminated in the early stages of the drill out program.
Due to the depth of the ore shoots below the main oxide transition zone, a large portion of the drill program was executed by diamond drilling. A total of 584 holes for 267,045 metres were drilled utilising up to 25 drill rigs. Holes were drilled on an inclination of -80° and a bearing of 000° with PQ, HQ and NQ core to a depth dictated by drill hole design and proximity to major fault zones. The perpendicular intersection of the drill holes with the main penetrative foliation resulted in a number of core issues including spun core and poor orientations which were measured and gradually improved over the course of the program. The main objectives of the diamond campaign were: 1) to delineate the mineralization on an indicated 200x100m grid pattern; 2) to demarcate major cross cutting structures displacing the ore bodies; 3) to define ore shoot architecture and controls in key geological domains; and 4) to identify the limits of mineralization across the Chimiwungo deposit. A total of 34 field geologists were engaged to complete the geoscientific requirements of the program.
In 2013, drilling predominantly continued to target the known Malundwe and Chimiwungo Resource areas, as well as completing a series of programs to serve condemnation purposes (Lella Deposit, Chimiwungo Resource Extension and Waste Dump Sterilisation).
Diamond and RC drilling in Chimiwungo, targeting the Inter, Roan and Equinox Shoots, resulted in adequate coverage for Reserve Classification of areas scheduled to be mined in the following two years. The Malundwe Resource drilling completed the Stage 10 area confirming the pinching out of the ore body along the western edge of the Malundwe Pit.
Following a review of the Lubwe Trend historic data a 3-D geological model was created. This formed the basis from which a drill program was designed to test the stratigraphy and mineralisation as well as evaluate the significance of the soil geochemical and IP chargeability anomalies. Five of the seven holes intersected low-moderate copper grade mineralisation, successfully confirming the soil copper and IP chargeable anomaly in the north and continuity of the Lubwe Trend resource to the south.
| | |
| Barrick Gold Corporation – Lumwana Mine, | | Page 10 -6 |
| Technical Report NI 43 -101 – March 27, 2014 | |
TABLE 10-4 EXPLORATION SUMMARY FOR THE 2013 DRILLING CAMPAIGN
Barrick Gold Corporation – Lumwana Mine
| | | | | | | | | | | | | | | | |
| | | RC Drilling | | | DD Drilling | |
Date | | Holes | | | Metres | | | Holes | | | Metres | |
Chimiwungo Resource (Inter & Roan Shoots) | | | 69 | | | | 8,093 | | | | 0 | | | | 0 | |
Malundwe Resource (Stage 10) | | | 95 | | | | 12,413 | | | | 0 | | | | 0 | |
Lubwe Trend | | | 0 | | | | 0 | | | | 7 | | | | 2,893 | |
Sterilization (WD’s, Lella inc. $4.38) | | | 52 | | | | 5,426 | | | | 13 | | | | 3,493 | |
The majority of the resource is supported by diamond drilling information. RC drill-sampled information, where present, is generally well intermixed with diamond drilling data. Hole diameters vary, generally from 114 mm to 165 mm for RC with NQ, HQ and PQ sizes being used for diamond drill holes.
Collars of all drill holes used for the resource estimation were surveyed by professional surveyor either contractor surveyors based out of South African or from 2007, LMC’s in-house mine surveyors. For all pre-Equinox and Equinox holes drilled to end of 2002, Global Geomatics was used; for holes drilled between 2003 and 2006 Aermap was used. All surveyors used Zone 35 S UTM (Arc 1950 datum) co-ordinates using a combination of differential GPS (dGPS) and/or total station methods. Minor elevation adjustments were required for a small number of drill holes, with the process completed by transforming the collar RL onto a detailed topographic DTM surface generated as part of the 2003 BFS.
Most resource diamond and RC drill holes were down-hole surveyed for direction by Reflex (digital), Sperry or Eastman single shot cameras or the Tropari method.
Resource estimation holes have the following data:
| • | | Accurate dGPS or total station survey of the collar; |
| • | | Geological logging data; |
| • | | Laboratory assays for the copper and uranium resource estimate and laboratory uranium assays; and |
| • | | If a hole was deeper than 150 m, then acceptable quality downhole survey data at nominal 50 m intervals. |
| | |
| Barrick Gold Corporation – Lumwana Mine, | | Page 10 -7 |
| Technical Report NI 43 -101 – March 27, 2014 | |
Figure 10-3 shows the drill hole collar locations for all holes drilled at Lumwana, in and around Chimiwungo and Malundwe.
FIGURE 10-3 LUMWANA PROJECT DRILL HOLE COLLAR LOCATIONS
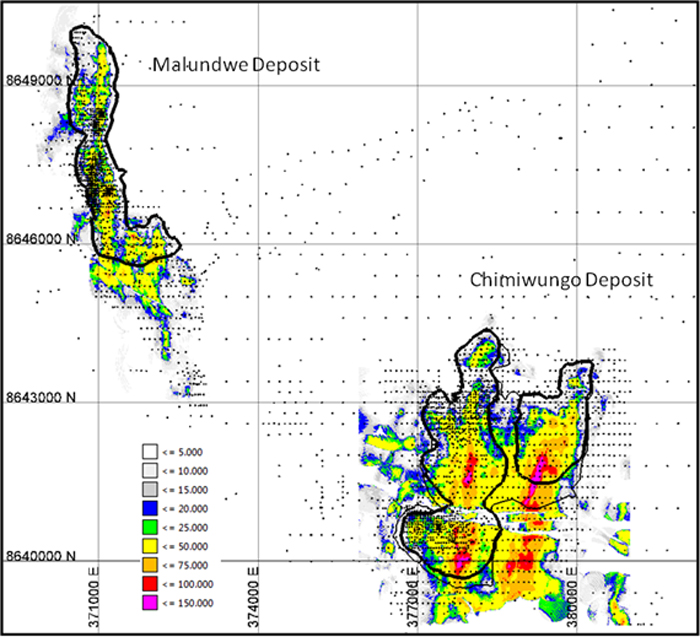
SAMPLING METHODS
Diamond drill hole assays are derived predominantly in the vicinity of the copper ore zones and based on diamond saw cut one third (RST sampling) or half core sampling
| | |
| Barrick Gold Corporation – Lumwana Mine, | | Page 10 -8 |
| Technical Report NI 43 -101 – March 27, 2014 | |
(Phelps Dodge and Equinox/Barrick sampling). The majority of RST drill holes were only assayed for copper. AGIP-COGEMA diamond holes and Equinox’s and Phelps Dodge holes were assayed for copper, cobalt, gold and uranium. Equinox RC samples were Jones riffle split under geologist supervision normally at the drill rig while the hole was in progress. Sample intervals were accurately measured for diamond drill core. RC sample intervals were based on one or two metre samples collected in plastic bags by the drilling contractor, monitored by a geologist. For most of the RC drilling, if more than three consecutive metres of wet samples were encountered within or immediately above a Mineralized Ore Schist (mineralized zone), and then the RC drilling was terminated and converted to an HQ or NQ core hole. This was an infrequent event.
Diamond drill core recovery was measured regularly with good recoveries normally being returned averaging in excess of 90%. The lowest recoveries were recorded within the non-mineralized overburden sequence. RC drilling recoveries were not measured directly because of the drilling method; however, all RC one metre bulk samples were weighed to provide semi qualitative estimate of recovery, which indicated recoveries were acceptable.
| | |
| Barrick Gold Corporation – Lumwana Mine, | | Page 10 -9 |
| Technical Report NI 43 -101 – March 27, 2014 | |
11 SAMPLE PREPARATION, ANALYSES AND SECURITY
CHAIN OF CUSTODY
In order to maintain Chain of Custody and to ensure the validity and integrity of samples the following security measures are undertaken.
For diamond drilling, once the drill core was removed from the barrel it was cleaned and placed in labelled core trays. Hole depth was confirmed through rod counts initiated at bit changes, case offs and at the end of the drill hole. The electronic “E Plod” system served as a secondary check on hole depth.
The core was picked up on a daily basis in specially fabricated cages and transferred to the core yard. These were offloaded and arranged on pre-determined racks which were assigned to specific drill rigs. After the core was processed, logging was undertaken by an assigned responsible Geologist. The selected intervals were marked with flagging tape and were assigned individual sample ID numbers from a sample register. After the sample register was updated, the register interval for the relevant drill hole was printed and the hard copy given to the Core Yard Supervisor. The core then passed through a core scanning facility in its original trays. From the core scanning facility the drill core that had been flagged for sampling was set aside and moved to the core cutting area. The Core Yard Supervisor assigned the sample register cut sheet to a designated Core Technician who cut the core. Once the drill core had been cut, the Core Yard Supervisor notified the responsible Geologist. The product was then transferred to a designated sampling area where the drill core sampling procedure was employed.
Sampling was undertaken by Core Technicians, and the responsible Geologist also carried out the task from time to time to ensure consistency and that protocols were adhered to.
| | |
| Barrick Gold Corporation – Lumwana Mine, | | Page 11 -1 |
| Technical Report NI 43 -101 – March 27, 2014 | |
Core samples were placed in mechanically pre-numbered calico bags with a corresponding ticket ID inserted into the bag. Once all core for a given hole had been sampled, it was placed together as one batch into labelled Bulka-bags ready for transportation to the onsite sample preparation facility. The corresponding submission sheets were then completed by the responsible Geologist, and the sample preparation facility was issued with a submission sheet, a sample despatch sheet and the sample cut sheet. Sample submission sheets were also completed for the ALS primary laboratory and Genalysis umpire laboratory. These were scanned and emailed to the relevant laboratory Managers and the Lumwana Exploration Database Department.
The RC samples were presented in green PVC bags which are placed on the ground in numerical order at the rig side. The bags were labelled with drillhole ID and metres from and to by Exploration Technicians before drilling commences. After sample preparation the green PVC bags were labelled with the first and last sample numbers.
The samples were packaged and despatched to Kitwe. During the extensive drill campaign, this happened weekly. From Kitwe, the samples were transported by couriers to Lusaka and departure customs formalities. They were air freighted to Perth where they passed through Australian quarantine and Inspection Services and on to ALS. ALS forward check assay samples on to the umpire laboratory.
The analytical results were sent to the Database Department who forwarded them to the Responsible Geologist. The batch was then QAQC checked, and once accepted, the batch was imported into the acquire database by the Database Manager.
SAMPLE PREPARATION
Equinox collected Jones riffle split RC samples and diamond saw cut measured sample intervals for diamond drill core.
Between 2000 and 2005, independent laboratory Alfred H Knight Laboratories in Kalulushi, Zambia prepared all Equinox drill samples (RC and diamond core samples).
| | |
| Barrick Gold Corporation – Lumwana Mine, | | Page 11 -2 |
| Technical Report NI 43 -101 – March 27, 2014 | |
During 2006 ALS Chemex (ALS), Johannesburg, South Africa laboratory prepared the drill samples (RC and diamond core samples). In 2007, all samples were prepared by Alfred H Knight Laboratories in Kitwe, Zambia.
Post-2007, all samples were prepared at the Lumwana Exploration Camp facility. The Lumwana Exploration sample preparation facility was regularly audited by an independent consultant chemist and was deemed to be fit for purpose.
All sample preparation facilities crushed and pulverized the drill samples to industry standards.
ANALYSIS
Samples were taken at 1m intervals, once prepared and consisting of 150g of pulverized material (nominally 90% passing - 75µm), were sent airfreight to ALS Chemex in Perth, Australia for analysis. All samples were assayed by inductively coupled plasma atomic emission spectroscopy for copper, cobalt, uranium, nickel, sulphur and iron with fire assay atomic absorption spectrophotometry being used to assays of gold for any sample greater than 2,000 ppm Cu.
ALS Chemex Perth has been the principal assay laboratory used throughout both the Equinox and Barrick drill programs, and is certified by NATA Certification Services International to the international standard ISO 9001 Quality Management Systems (NATA accreditation certificate No. 6112). The check assay laboratory Genalysis is certified by NATA Certification Services International to the international standard ISO/IEC 17025 (1999) (NATA accreditation certificate number is 3244).
QA/QC
Appropriate quality assurance and quality control procedures (QA/QC) have been adhered to throughout all resource drill programs by adopting certified standards, blanks, check samples and field duplicates. The protocols for the QA/QC were as follows:
| • | | Duplicate samples submitted with a frequency of one per 20 (1:20) drill samples. |
| | |
| Barrick Gold Corporation – Lumwana Mine, | | Page 11 -3 |
| Technical Report NI 43 -101 – March 27, 2014 | |
| • | | Certified standard reference samples (made from the projects mineralization) inserted at a frequency one per fifty drill samples up until 2005, after which the insertion ratio was increased to one in twenty (1:20). |
| • | | Blanks of a barren basalt collected from within the Lumwana mining licence inserted at a one in twenty ratio (1:20) from 2006 onwards. |
| • | | Ten percent (10%) of drill samples were selected for check analysed by a secondary laboratory. |
| • | | Grind size checks for crushing and pulverizing stages carried out daily |
The check samples and field duplicate data were analysed to provide a measure of error as bias and precision. Analyses were carried out for copper, cobalt, gold, nickel, iron, uranium and sulphur. The standard reference sample data was assessed to monitor the performance of the laboratory over time by comparing the values from the reference samples submitted to the laboratory at regular intervals to the certified standard reference sample data. External check assays were conducted by Genalysis Laboratory Services Pty Ltd, based in Perth, Western Australia, Australia.
Independent consultants Golder and SRK reviewed the sampling and assay protocols and the assay results from ALS (original laboratory) and Genalysis (check laboratories) in with the results showing no significant systematic difference between the laboratories and acceptable levels of precision. The levels of precision and bias for ALS Cu %, which was the data field used for estimating copper for resource estimates, resulted in a high degree of confidence in the resource estimate for copper.
Barrick’s QA/QC protocols and programs were carried out using the same methodologies as Equinox used and in many cases, using the same geological staff. A dedicated database manager was responsible for monitoring QA/QC results. A Table of Failures was used to determine actions when substandard results are returned. If serious problems exist, the entire batch of samples was re-assayed.
The QA/QC results from Lumwana are acceptable and have shown that sample preparation carried out by Barrick, Equinox, and others plus assaying completed by the commercial laboratories are suitable for resource estimate purposes. Sample security is adequate and meets industry standards.
| | |
| Barrick Gold Corporation – Lumwana Mine, | | Page 11 -4 |
| Technical Report NI 43 -101 – March 27, 2014 | |
12 DATA VERIFICATION
In the past, Equinox has completed routine sieving of the pulverized material on batches of drill samples to determine if the nominal 90% passing -75 µm standards were being achieved. This data shows that on average the above standard was regularly achieved.
Studies have been completed to compare the assay results from RC and diamond drill methods and also assay results from pre Equinox and Equinox drilling. The study comparing RC versus diamond involved drilling twelve holes (six each at Malundwe and Chimiwungo) within five metres of the existing core hole at the same dip and azimuth as the original hole. Analysis of the various elements reflected natural variability and no consistent bias between the drill methods. Some slight differences were noted for both gold and uranium but at very low grades. Typically, the RC drilling produced slightly wider and lower grade intersections compared with the diamond drilling.
A study comparing pre-Equinox (RST and Phelps Dodge) and Equinox drill assays involved 53 drill holes (19 Equinox (11 core and 8 RC holes), 16 Phelps Dodge (all core), and 18 R ST (all core) in 12 areas across the two deposits. This study identified no bias at Malundwe and minor low bias at Chimiwungo for the Equinox assays compared to the pre Equinox data for the Mineralized Ore Schist units. As a result the inclusion of the historic data is considered acceptable and fit for purpose.
Golder and Equinox have examined the sampling procedures on site and validated the sampling precision and assaying precision and accuracy. The available Lumwana data was considered by Golder as being of good standard for the purpose of resource estimation.
Hatch Associates Limited (Hatch) was commissioned in 2005 by Standard Bank of London to conduct a detailed audit of the Lumwana Project as part of the financing of the project. A component of the audit was a rigorous review of the data used for the resource and reserve estimates including drilling, surveying, sampling, assaying methods and the actual data. Hatch confirmed the data was of acceptable quality for the purpose.
| | |
| Barrick Gold Corporation – Lumwana Mine, | | Page 12 -1 |
| Technical Report NI 43 -101 – March 27, 2014 | |
Roscoe Postle Associates also undertook checks of database information, and visually reviewed cross-sectional plots of drilling information as part of completing the 2011 Technical Report for the Project.
The Lumwana resource database is regularly validated by mine staff using mining software validation routines and by regularly checking the drill hole data on-screen visually.
A data verification and compilation project was completed by Barrick in 2012 to review every resource drill hole within 200m of and inside the 2010 $3.50 pit shell, amounting to 1604 holes and in excess of 400,000m of drilling. The process involved comparing the geology logs, core photos, RC chips and assays and correcting the logged data as necessary. The main focus was the “Local Code” geology field which formed the basis of most sectional interpretations. Lithology codes were also changed when considered to be inaccurate as well as the weathering codes. Very rarely, colour codes and textural codes were changed. Assays were not validated, nor were structural data, although some obvious assay problems were flagged.
The overall validation process has;
| • | | Improved the coding of the geology for ease of geologic and resource modelling; |
| • | | Improved the geologic understanding of the deposit; |
| • | | Better defined the hanging-wall contact and its contents; |
| • | | Better constrained internal dilution to the ore package; |
| • | | Better defined stratigraphy and footwall geology; |
| • | | Allowed distinction of mafic sills and dykes; |
| • | | Ensured consistency in weathering codes; |
| • | | Better defined zones of faulting; |
| • | | Identified holes with missing core photos, chip trays and un-sampled mineralisation. |
Corrective measures were introduced in 2013 by a dedicated 5 person team to address all identified problems.
| | |
| Barrick Gold Corporation – Lumwana Mine, | | Page 12 -2 |
| Technical Report NI 43 -101 – March 27, 2014 | |
Based on past evaluations and our current review, the data are considered acceptable for the purposes of overall resource and reserve estimation and economic assessments.
| | |
| Barrick Gold Corporation – Lumwana Mine, | | Page 12 -3 |
| Technical Report NI 43 -101 – March 27, 2014 | |
13 MINERAL PROCESSING AND METALLURGICAL TESTING
INTRODUCTION
Studies to evaluate the mineralogical characteristics and metallurgical behaviour of ore for the Lumwana Project were carried out in eight stages, as summarized in Table 13-1.
TABLE 13-1 PROJECT STUDIES
Barrick Gold Corporation – Lumwana Mine
| | | | |
Date | | Company | | Study |
| 1990 | | Mining Italiana S.p.A. | | Pre-feasibility Study - options for producing uranium and copper |
| | |
| 2000 | | Bateman Engineering | | Pre-feasibility Study - production of copper-cobalt concentrate |
| | |
| 2001 | | Ausenco Ltd | | Lumwana Copper Project Copper Metal Production Options |
| | |
| 2002 | | Aker Kvaerner | | Process Options Study - roast leach electrowinning selected |
| | |
| 2003 | | Aker Kvaerner | | Bankable Feasibility Study |
| | |
| 2004 | | GRD Minproc | | Capital and Operating Cost Update |
| | |
| 2005 | | GRD Minproc | | FEED - characterization of ore hardness |
| | |
| 2008 | | Ausenco | | Uranium Feasibility Study |
| | |
| 2012 | | Hatch | | Expansion Prefeasibility Study |
Test-work relevant to the current operation was carried out in 2003, 2004, 2005 and 2010 by AMMTEC Ltd., Perth, Western Australia (AMMTEC).
Four composite samples were used to conduct the metallurgical test-work to support the 2003 BFS; one composite sample was used for the 2004 testing program; and 150 samples used to determine ore hardness characteristics for the 2005 FEED program. A description of the samples used to conduct the test-work is listed in Table 13-2.
| | |
| Barrick Gold Corporation – Lumwana Mine, | | Page 13 -1 |
| Technical Report NI 43 -101 – March 27, 2014 | |
TABLE 13-2 METALLURGICAL TEST SAMPLES
Barrick Gold Corporation – Lumwana Mine
| | | | |
Program | | Samples | | Description |
| 2003 BFS | | CM1 | | Chimiwungo ore body |
| | CM4 | | Chimiwungo high cobalt |
| | MM2 | | Malundwe ore body |
| 2004 BFS | | OC | | overall composite |
| 2005 FEED | | Chimiwungo – 100 samples Malundwe – 50 samples | | representing first 11 years of operation |
| 2010 Expansion PFS | | Selected samples | | Chimiwungo ore body |
The samples were selected to be representative of the Chimiwungo and Malundwe open pit mines.
Various analyses and techniques were contracted to outside laboratories, as required. The various phases of the test-work program were developed and directed by Aker Kvaerner, Equinox, and GRD Minproc. Details of the testing results are provided in the previous technical report (Equinox Minerals, 2011).
The 2012 Expansion Prefeasibility Study was commenced by Equinox and continued by Barrick.
COPPER RECOVERY
Lumwana estimates copper recovery by using a constant tailings grade of 0.039% Cu for high grade sulphur (HGS) ore. For 2013, the actual copper recovery was 93.42% compared to a budget of 89.43%.
| | |
| Barrick Gold Corporation – Lumwana Mine, | | Page 13 -2 |
| Technical Report NI 43 -101 – March 27, 2014 | |
14 MINERAL RESOURCE ESTIMATE
INTRODUCTION
The Lumwana Mineral Resource includes the Chimiwungo and Malundwe Deposits at EOY2013. The Chimiwungo November 2013 and Malundwe April 2012 Resource Models were used to provide this estimation. The resources were estimated by combination of Barrick Global Resource Group and Lumwana site personnel.
Table 14-1 contains the Lumwana Mineral Resources exclusive of Mineral Reserves as of December 31, 2013. These Mineral Resources could not be converted to Mineral Reserves due to operational constraints or economics (i.e., Measured and Indicated Mineral Resources) or an insufficient level of confidence (i.e., Inferred Mineral Resources).
TABLE 14-1 SUMMARY OF COPPER MINERAL RESOURCES – DECEMBER 31, 2013.
Barrick Gold Corporation – Lumwana Mine
| | | | | | | | | | | | |
Category | | Tonnage
(Mt) | | | Grade
(% Cu) | | | Contained Metal
(Mlb Cu) | |
Sulphide | | | | | | | | | | | | |
Measured | | | 67.5 | | | | 0.39 | | | | 581.4 | |
Indicated | | | 419.1 | | | | 0.52 | | | | 4,794.2 | |
| | | | | | | | | | | | |
Sub-Total | | | 486.6 | | | | 0.50 | | | | 5,375.6 | |
| | | |
Inferred | | | 0.5 | | | | 0.57 | | | | 5.8 | |
| | | | | | | | | | | | |
| | | |
Total Measured + Indicated | | | 486.6 | | | | 0.50 | | | | 5,375.6 | |
Total Inferred | | | 0.5 | | | | 0.57 | | | | 5.8 | |
Notes:
| 1. | CIM definitions were followed for Mineral Resources. |
| 2. | Fresh sulphide Mineral Resources are estimated at a cut-off grade of 0.16% Cu and transition sulphide Mineral Resources are estimated at a cut-off grade of 0.38% Cu. |
| 3. | Mineral Resources are estimated using a long-term copper price of US$3.50 per pound. |
| 4. | A minimum thickness of 2.0 m was used in the wireframe model. |
| 5. | Mineral Resources are exclusive of Mineral Reserves. |
| 6. | Mineral Resources that are not Mineral Reserves do not have demonstrated economic viability. |
| 7. | Numbers may not add due to rounding. |
| | |
| Barrick Gold Corporation – Lumwana Mine, | | Page 14 -1 |
| Technical Report NI 43 -101 – March 27, 2014 | |
The EOY2013 Lumwana Mineral Resources are based on block models generated by Barrick’s Global Resources Group, with assistance from site personnel. The Chimiwungo model was generated in November 2013, and the Malundwe model was generated in 2012.
The EOY2013 Lumwana Mineral Resource estimates are completed to industry standards using reasonable and appropriate parameters and are acceptable for reserve work. The resource estimates conform to NI 43-101.
ASSUMPTIONS
The Mineral Resource estimates for copper are based on a number of factors and assumptions:
| • | | The survey control and down hole survey data are considered adequate for the purposes of this study. Geology has been interpreted and modelled in three-dimensions to define geological zones that have been used to flag the composited sample data for statistical and geostatistical analysis. |
| • | | Estimation parameters are based on the correlogram study. |
| • | | Ordinary Kriging (OK) has been used to estimate grades. |
| • | | Density values have been assigned globally by weathering zone and rock type. |
| • | | A 0.16% Cu (fresh sulphide) and 0.38% Cu (transition) cut-off grade has been calculated to report the copper Mineral Resource. The 0.16% cut-off grade was calculated at the Mineral Resource copper price of $3.50/lb. |
GEOLOGICAL DATABASE
Drilling at Lumwana has been conducted by five separate companies since 1961. These include RST and related companies, AGIP Zambia Limited - COGEMA Joint Venture, Phelps Dodge, Equinox’s and Barrick. Drill holes have been analysed for copper, cobalt, gold, uranium, sulphur and iron with some samples assayed for additional elements such as silver and nickel.
| | |
| Barrick Gold Corporation – Lumwana Mine, | | Page 14 -2 |
| Technical Report NI 43 -101 – March 27, 2014 | |
For geological modelling and resource estimation, only valid drill holes are used and termed “resource holes”. These include diamond, RC, and pre-collared RC diamond drill holes. The resource database consists of header, survey, assay, density, lithology, mineralization, core recovery and weathering data. The Geological Model is based on an analysis of weathering, lithology, mineralized zones and dominant geological structures.
The Drill Hole database has 4,040 holes totalling 715,924m of drilling. Of these 2,059 drill holes totalling 501,066m were drilled at Chimiwungo and 1,382 drill holes totalling 156,094m were drilled at Malundwe.
TABLE 14-2 LUMWANA DRILL HOLE STATISTICS BY PROSPECT
| | | | | | | | |
PROSPECT | | Holes | | | Meters | |
CentDome | | | 2 | | | | 245 | |
Chantete | | | 14 | | | | 1,400 | |
Chimiwungo | | | 2,059 | | | | 501,066 | |
Kababisa | | | 78 | | | | 7,839 | |
Kamaranda | | | 77 | | | | 2,747 | |
Kangrubwe | | | 143 | | | | 6,868 | |
Lella | | | 16 | | | | 1,246 | |
Lubwe | | | 141 | | | | 18,064 | |
Malundwe | | | 1,382 | | | | 156,094 | |
MalundweNt | | | 48 | | | | 12,258 | |
Mutoma | | | 4 | | | | 942 | |
Mwanzo | | | 8 | | | | 363 | |
North Dome | | | 6 | | | | 983 | |
Odile | | | 22 | | | | 2,946 | |
Powerline | | | 27 | | | | 1,261 | |
Shikezi | | | 5 | | | | 428 | |
Shinyindi | | | 8 | | | | 1,175 | |
| | | | | | | | |
Total | | | 4,040 | | | | 715,924 | |
| | | | | | | | |
| | |
| Barrick Gold Corporation – Lumwana Mine, | | Page 14 -3 |
| Technical Report NI 43 -101 – March 27, 2014 | |
TABLE 14-3 CHIMIWUNGO AND MALUNDWE DRILL HOLE STATISTICS BY COMPANY
| | | | | | | | | | | | |
PROSPECT | | Year | | Company | | Holes | | | Meters | |
Malundwe | | 1961 - 1975 | | RST | | | 149 | | | | 20889 | |
Malundwe | | 1982 - 1987 | | AGP | | | 244 | | | | 33436 | |
Malundwe | | 1993 - 1994 | | PPD | | | 22 | | | | 1549 | |
Malundwe | | 2000 - 2010 | | EQN | | | 854 | | | | 88653 | |
Malundwe | | 2011 - 2012 | | BAR | | | 113 | | | | 11566 | |
Chimiwungo | | 1961 - 1975 | | RST | | | 165 | | | | 37435 | |
Chimiwungo | | 1985 - 1986 | | AGP | | | 16 | | | | 3648 | |
Chimiwungo | | 1993 - 1994 | | PPD | | | 20 | | | | 3917 | |
Chimiwungo | | 2000 - 2011 | | EQN | | | 732 | | | | 110894 | |
Chimiwungo | | 2011 - 2013 | | BAR | | | 1126 | | | | 345171 | |
| | | | | | | | | | | | |
Total | | | | | | | 3,441 | | | | 657,159 | |
| | | | | | | | | | | | |
GEOLOGICAL INTERPRETATION AND MODELLING
Geological interpretation and three dimensional modelling were used by Barrick to define spatial zones that were then used to flag the composited sample data for statistical and geostatistical analysis. These interpreted geological boundaries for Chimiwungo and Malundwe deposits are based on drill hole data.
All resource drill holes were logged for lithology. The logs summarized the mineralogical (main gangue and sulphide minerals), textural, lithological, and weathering characteristics for each sampled interval. To simplify and group lithologies into functional categories an additional set of codes were used to define the major rock unit domains. These codes established broad divisions of the geological profile (leached overburden, hanging wall lithologies, mineralized zone, internal barren gneisses and footwall lithologies). Within the mineralized zone, gneissic units were predominantly barren with respect to copper, gold, cobalt and uranium grades.
The Chimiwungo Geology Model was created from lithology, structure and weathering data in Surpac 3D and Micromine software programs by Barrick’s Global Exploration Group. Final adjustment and validation for the ore packet and barren units was completed in Leapfrog software by Barrick’s Global Resources Group.
In addition, weathering codes, supplemented by Cu:S ratios calculated from the chemical assays, were used to define three weathering material type domains, Oxide, Transition and Fresh. These domains were created to allow material classification of the
| | |
| Barrick Gold Corporation – Lumwana Mine, | | Page 14 -4 |
| Technical Report NI 43 -101 – March 27, 2014 | |
waste and mineralization based on their expected physical behaviour during mining (i.e. free dig versus drill and blast) and for the mineralized material, their likely metallurgical behaviour if processed in the Lumwana processing plant.
Geological block models for the Chimiwungo and Malundwe deposits were constructed using Vulcan software. The models were oriented along the project grid.
| • | | Malundwe parent block size of 25 m east-west (X), 25 m north-south (Y) and 4 m vertically (Z) and the smallest sub-block size was 5 m (X) by 5 m (Y) by 2 m (Z). Reblock to 12.5 m (x),12,5 m (y) and 8 m (z) for optimization. |
| • | | Chimiwungo block size of 5 m east-west (X), 5 m north-south (Y) and 2 m vertically (Z). Reblock to 12.5 m (x),12,5 m (y) and 12 m (z) for optimization. |
The 5m x 5m x 2m block dimensions accommodates the horizontal and moderately dipping geological contacts and weathering horizons, necessary for a bulk mining open cut operation. Figure 14-1 provides an isometric view of the Lumwana block models.
FIGURE 14-1 ISOMETRIC VIEW OF BLOCK MODELS (COPPER GRADE > 0.4%)
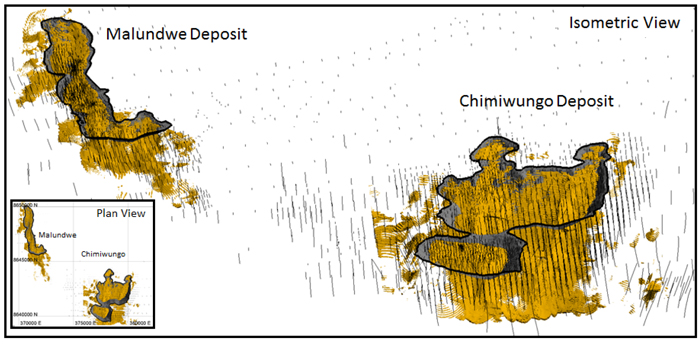
| | |
| Barrick Gold Corporation – Lumwana Mine, | | Page 14 -5 |
| Technical Report NI 43 -101 – March 27, 2014 | |
BULK DENSITY
Bulk density values were assigned to the blocks based on the weathering zone in which the block was located, see Table 14-4.
TABLE 14-4 DENSITY VALUES
Barrick Gold Corporation – Lumwana Mine
| | | | | | | | |
Rock Type | | Density (t/m3)
Malundwe | | | Density (t/m3)
Chimiwungo | |
Cob (oxide) | | | 2.0 | | | | 1.73 | |
Boco (oxide) | | | 2.0 | | | | 2.10 | |
Tofr (transition) | | | 2.6 | | | | 2.70 | |
HW (fresh) | | | 2.8 | | | | 2.74 | |
Ore (fresh) | | | 2.8 | | | | 2.79 | |
Gn (fresh) | | | 2.8 | | | | 2.76 | |
Fw (fresh) | | | 2.8 | | | | 2.79 | |
At Chimiwungo bulk density determination was by water displacement, with a wax coating applied to weathered or porous samples. In drill holes selected for density measurement, samples were taken every 50m through the hanging wall, every 2m through the ore schist package and every 5m within the foot wall to 20m below the ore package. In total 2,794 density measurements were collected across the deposit.
TABLE 14-5 CHIMIWUNGO DENSITY VALUES
| | | | | | | | | | | | | | | | | | | | | | | | | | | | | | | | | | | | | | | | |
Description | | Sample
Qty | | | Sample
% | | | Mean | | | Std.dev | | | Min | | | 1Q | | | Median | | | 3Q | | | Max | | | CV | |
All zones | | | 4,957 | | | | | | | | 2.76 | | | | 0.125 | | | | 1.420 | | | | 2.720 | | | | 2.770 | | | | 2.820 | | | | 3.190 | | | | 0.045 | |
Cob | | | 12 | | | | 0.2 | % | | | 1.73 | | | | 0.152 | | | | 1.560 | | | | 1.610 | | | | 1.710 | | | | 1.870 | | | | 1.970 | | | | 0.088 | |
Boco | | | 50 | | | | 1.0 | % | | | 2.10 | | | | 0.380 | | | | 1.420 | | | | 1.720 | | | | 2.150 | | | | 2.390 | | | | 2.760 | | | | 0.181 | |
Tofr | | | 299 | | | | 5.9 | % | | | 2.70 | | | | 0.107 | | | | 2.340 | | | | 2.650 | | | | 2.710 | | | | 2.770 | | | | 3.070 | | | | 0.040 | |
HW | | | 391 | | | | 7.8 | % | | | 2.74 | | | | 0.081 | | | | 2.510 | | | | 2.700 | | | | 2.740 | | | | 2.780 | | | | 2.970 | | | | 0.029 | |
Ore | | | 2,972 | | | | 59.1 | % | | | 2.79 | | | | 0.076 | | | | 2.380 | | | | 2.740 | | | | 2.790 | | | | 2.830 | | | | 3.190 | | | | 0.027 | |
Gn | | | 929 | | | | 18.5 | % | | | 2.76 | | | | 0.091 | | | | 2.490 | | | | 2.700 | | | | 2.760 | | | | 2.820 | | | | 3.040 | | | | 0.033 | |
Fw | | | 304 | | | | 6.0 | % | | | 2.79 | | | | 0.061 | | | | 2.610 | | | | 2.750 | | | | 2.780 | | | | 2.830 | | | | 2.980 | | | | 0.022 | |
STATISTICAL ANALYSIS
In order to understand and establish metal grade characteristics in the deposits, exploratory data analysis was conducted. Data within the main lithological domains were analyzed.
| | |
| Barrick Gold Corporation – Lumwana Mine, | | Page 14 -6 |
| Technical Report NI 43 -101 – March 27, 2014 | |
Drill hole data were composited to two metre down hole lengths, honouring the geological contacts. Statistical data analysis was conducted by geological domain. For Malundwe, the main domain of interest was the mineralized zone defined between the modelled hanging wall and foot wall surfaces. For Chimiwungo, the analysis compared the grade distributions in the inter-layered Mineralized Ore Schists and barren gneisses.
The most recent statistics for two-metre composited assay data calculated for copper at Chimiwungo are listed in Table 14-6 and Malundwe in Table 14-7.
TABLE 14-6 CHIMIWUNGO COPPER STATISTICS
| | | | | | | | | | | | | | | | | | | | | | | | | | | | | | | | | | | | | | | | | | | | |
| | | | | | | | | | | | Copper Grade (%) . | |
Description | | Code | | | Meters
Qty | | | Meters % | | | Mean | | | Std.dev | | | Min | | | 1Q | | | Median | | | 3Q | | | Max | | | CV | |
All zones | | | | | | | 452,406 | | | | | | | | 0.09 | | | | 0.307 | | | | 0.000 | | | | 0.000 | | | | 0.000 | | | | 0.010 | | | | 9.480 | | | | 3.324 | |
North HW | | | 26 | | | | 2,588 | | | | 0.6 | % | | | 0.02 | | | | 0.031 | | | | 0.000 | | | | 0.000 | | | | 0.000 | | | | 0.036 | | | | 0.209 | | | | 1.521 | |
North Ore | | | 21 | | | | 5,473 | | | | 1.2 | % | | | 0.29 | | | | 0.327 | | | | 0.000 | | | | 0.075 | | | | 0.183 | | | | 0.405 | | | | 3.828 | | | | 1.125 | |
North Gneiss | | | 99 | | | | 1,587 | | | | 0.4 | % | | | 0.05 | | | | 0.072 | | | | 0.000 | | | | 0.010 | | | | 0.031 | | | | 0.062 | | | | 0.624 | | | | 1.390 | |
North FW | | | 27 | | | | 6,978 | | | | 1.5 | % | | | 0.01 | | | | 0.036 | | | | 0.000 | | | | 0.000 | | | | 0.000 | | | | 0.004 | | | | 0.587 | | | | 3.438 | |
Main HW | | | 16 | | | | 155,297 | | | | 34.3 | % | | | 0.00 | | | | 0.030 | | | | 0.000 | | | | 0.000 | | | | 0.000 | | | | 0.000 | | | | 2.210 | | | | 12.714 | |
Main Ore | | | 11 | | | | 50,083 | | | | 11.1 | % | | | 0.44 | | | | 0.530 | | | | 0.000 | | | | 0.067 | | | | 0.233 | | | | 0.626 | | | | 6.350 | | | | 1.218 | |
Main Gneiss | | | 89 | | | | 17,965 | | | | 4.0 | % | | | 0.04 | | | | 0.116 | | | | 0.000 | | | | 0.005 | | | | 0.016 | | | | 0.041 | | | | 2.685 | | | | 2.697 | |
Main FW | | | 17 | | | | 42,216 | | | | 9.3 | % | | | 0.01 | | | | 0.035 | | | | 0.000 | | | | 0.000 | | | | 0.000 | | | | 0.001 | | | | 1.790 | | | | 4.768 | |
South WH | | | 6 | | | | 110,817 | | | | 24.5 | % | | | 0.00 | | | | 0.035 | | | | 0.000 | | | | 0.000 | | | | 0.000 | | | | 0.000 | | | | 3.538 | | | | 12.743 | |
South Ore | | | 1 | | | | 25,133 | | | | 5.6 | % | | | 0.60 | | | | 0.669 | | | | 0.000 | | | | 0.101 | | | | 0.374 | | | | 0.900 | | | | 9.480 | | | | 1.111 | |
South Gneiss | | | 79 | | | | 13,568 | | | | 3.0 | % | | | 0.05 | | | | 0.157 | | | | 0.000 | | | | 0.004 | | | | 0.016 | | | | 0.044 | | | | 2.770 | | | | 3.046 | |
South FH | | | 7 | | | | 18,444 | | | | 4.1 | % | | | 0.01 | | | | 0.045 | | | | 0.000 | | | | 0.000 | | | | 0.000 | | | | 0.003 | | | | 2.280 | | | | 4.901 | |
String_ore | | | 2 | | | | 1,904 | | | | 0.4 | % | | | 0.16 | | | | 0.417 | | | | 0.000 | | | | 0.001 | | | | 0.020 | | | | 0.141 | | | | 7.712 | | | | 2.551 | |
String_ore | | | 3 | | | | 150 | | | | 0.0 | % | | | 0.35 | | | | 0.430 | | | | 0.003 | | | | 0.127 | | | | 0.200 | | | | 0.417 | | | | 3.070 | | | | 1.243 | |
Fault_ore | | | 14 | | | | 204 | | | | 0.0 | % | | | 0.30 | | | | 0.327 | | | | 0.003 | | | | 0.111 | | | | 0.209 | | | | 0.385 | | | | 2.330 | | | | 1.074 | |
TABLE 14-7 MALUNDWE COPPER STATISTICS
| | | | | | | | | | | | | | | | | | | | | | | | | | | | | | | | | | | | | | | | | | | | |
| | | | | | | | | | | | Copper Grade (%) . | |
Description | | Code | | | Meters | | | % Meters | | | Mean | | | Std.dev | | | Min | | | 1Q | | | Median | | | 3Q | | | Max | | | CV | |
All zones | | | | | | | 37,459 | | | | | | | | 0.38 | | | | 0.695 | | | | 0.001 | | | | 0.003 | | | | 0.028 | | | | 0.399 | | | | 10.735 | | | | 1.838 | |
WSO | | | 1 | | | | 1,128 | | | | 3.0 | % | | | 0.06 | | | | 0.063 | | | | 0.001 | | | | 0.014 | | | | 0.048 | | | | 0.077 | | | | 0.733 | | | | 1.131 | |
Norte_HW | | | 2 | | | | 6,487 | | | | 17.3 | % | | | 0.03 | | | | 0.100 | | | | 0.001 | | | | 0.002 | | | | 0.007 | | | | 0.027 | | | | 4.330 | | | | 3.613 | |
North_Ore | | | 3 | | | | 10,676 | | | | 28.5 | % | | | 1.11 | | | | 0.866 | | | | 0.001 | | | | 0.384 | | | | 0.950 | | | | 1.670 | | | | 10.735 | | | | 0.777 | |
North_FW | | | 4 | | | | 10,746 | | | | 28.7 | % | | | 0.02 | | | | 0.042 | | | | 0.001 | | | | 0.001 | | | | 0.004 | | | | 0.017 | | | | 1.338 | | | | 2.312 | |
North_Gneiss | | | 5 | | | | 2,334 | | | | 6.2 | % | | | 0.05 | | | | 0.072 | | | | 0.001 | | | | 0.013 | | | | 0.031 | | | | 0.067 | | | | 1.326 | | | | 1.422 | |
South_HW | | | 12 | | | | 1,765 | | | | 4.7 | % | | | 0.01 | | | | 0.043 | | | | 0.001 | | | | 0.001 | | | | 0.001 | | | | 0.004 | | | | 0.669 | | | | 3.664 | |
South_Ore | | | 13 | | | | 817 | | | | 2.2 | % | | | 0.52 | | | | 0.693 | | | | 0.001 | | | | 0.002 | | | | 0.217 | | | | 0.820 | | | | 3.365 | | | | 1.333 | |
South_Fw | | | 14 | | | | 1,686 | | | | 4.5 | % | | | 0.02 | | | | 0.048 | | | | 0.001 | | | | 0.001 | | | | 0.007 | | | | 0.025 | | | | 0.745 | | | | 2.212 | |
North_Cobo | | | 100 | | | | 522 | | | | 1.4 | % | | | 0.42 | | | | 0.342 | | | | 0.001 | | | | 0.188 | | | | 0.318 | | | | 0.568 | | | | 2.000 | | | | 0.807 | |
South_Cobo | | | 110 | | | | 2 | | | | 0.0 | % | | | 0.20 | | | | 0.000 | | | | 0.197 | | | | 0.197 | | | | 0.197 | | | | 0.197 | | | | 0.197 | | | | 0.000 | |
North_Boco | | | 200 | | | | 120 | | | | 0.3 | % | | | 0.51 | | | | 0.355 | | | | 0.069 | | | | 0.245 | | | | 0.374 | | | | 0.680 | | | | 1.830 | | | | 0.692 | |
South_Boco | | | 210 | | | | 8 | | | | 0.0 | % | | | 0.30 | | | | 0.113 | | | | 0.114 | | | | 0.306 | | | | 0.347 | | | | 0.421 | | | | 0.421 | | | | 0.382 | |
North_Tofr | | | 300 | | | | 1,125 | | | | 3.0 | % | | | 0.83 | | | | 0.638 | | | | 0.002 | | | | 0.338 | | | | 0.700 | | | | 1.230 | | | | 3.982 | | | | 0.765 | |
South_Tofr | | | 310 | | | | 44 | | | | 0.1 | % | | | 0.25 | | | | 0.365 | | | | 0.002 | | | | 0.020 | | | | 0.065 | | | | 0.219 | | | | 1.300 | | | | 1.463 | |
| | |
| Barrick Gold Corporation – Lumwana Mine, | | Page 14 -7 |
| Technical Report NI 43 -101 – March 27, 2014 | |
Statistical analysis is normally completed on raw assays. As most of the mineralization was sampled at two metres, this length was considered appropriate for compositing and analysis.
GRADE CAPPING
The copper assay database was examined for the presence of local high grade outliers which could potentially affect the accuracy of the resource estimate. Once these outliers were identified, criteria used to determine capping grades include the cumulative distribution function, the uncapped CV, and the percentage of metal loss at various caps. Capping grade is primarily determined by a sudden deviation of the cumulative distribution curve.
FIGURE 14-2 CHIMIWUNGO COPPER FREQUENCY DISTRIBUTION
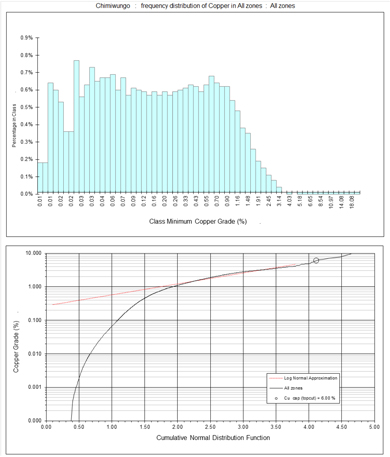
All values greater than 6% Cu are “cut” (i.e., replaced by 6% Cu).
| | |
| Barrick Gold Corporation – Lumwana Mine, | | Page 14 -8 |
| Technical Report NI 43 -101 – March 27, 2014 | |
FIGURE 14-3 MALUNDWE COPPER FREQUENCY DISTRIBUTION

VARIOGRAPHY
A variography study was undertaken to model spatial continuity of the domains in the Chimiwungo and Malundwe deposits. Down hole, directional, and omni-directional correlograms, using the composites for each geological domain, were created. Double, Triple and Quadruple nested spherical models were developed for each domain and the results are summarized in Table 14-8.
| | |
| Barrick Gold Corporation – Lumwana Mine, | | Page 14 -9 |
| Technical Report NI 43 -101 – March 27, 2014 | |
TABLE 14-8 COPPER CORRELOGRAM PARAMETERS
| | | | | | | | | | | | | | | | | | | | | | | | | | | | | | | | | | | | | | | | | | | | | | | | | | | | |
| | | | | | | | | | | | | | | Estructure 1 | | | Estructure 2 | |
Geology | | Nugget | | | Bearing | | | Plunge | | | Dip | | | Model | | Sill | | | Major | | | Semi | | | Minor | | | Model | | Sill | | | Major | | | Semi | | | Minor | |
North Gneiss | | | 0.20 | | | | 10 | | | | 0 | | | | 0 | | | SPHERICAL | | | 0.30 | | | | 100 | | | | 125 | | | | 20 | | | SPHERICAL | | | 0.50 | | | | 300 | | | | 220 | | | | 60 | |
North Ore | | | 0.20 | | | | 0 | | | | 0 | | | | 0 | | | SPHERICAL | | | 0.45 | | | | 40 | | | | 40 | | | | 10 | | | SPHERICAL | | | 0.35 | | | | 200 | | | | 140 | | | | 40 | |
Main Gneiss | | | 0.20 | | | | 10 | | | | 10 | | | | 0 | | | SPHERICAL | | | 0.50 | | | | 45 | | | | 10 | | | | 20 | | | SPHERICAL | | | 0.30 | | | | 150 | | | | 50 | | | | 50 | |
Main Ore | | | 0.15 | | | | 10 | | | | 0 | | | | 0 | | | SPHERICAL | | | 0.50 | | | | 45 | | | | 25 | | | | 10 | | | SPHERICAL | | | 0.35 | | | | 250 | | | | 270 | | | | 75 | |
South Gneiss | | | 0.10 | | | | 0 | | | | 0 | | | | 0 | | | SPHERICAL | | | 0.65 | | | | 25 | | | | 20 | | | | 10 | | | SPHERICAL | | | 0.25 | | | | 120 | | | | 100 | | | | 50 | |
South Ore | | | 0.15 | | | | 0 | | | | 0 | | | | 0 | | | SPHERICAL | | | 0.55 | | | | 50 | | | | 50 | | | | 5 | | | SPHERICAL | | | 0.30 | | | | 150 | | | | 200 | | | | 50 | |
The nugget effect was determined from down hole variograms. It was approximately 15% to 20% for the ore packet and 10% to 20% for the internal gneiss in the packet.
The Directional correlogram gave the range of greatest continuity of the grades. The ranges are very long due to a slow rise from approximately 90% to 100% of the sill. Some examples of the modelled correlograms for the ore packet composites are provided in Figures 14-4 through to 14-6.
FIGURE 14-4 CHIMIWUNGO NORTH ORE CORRELOGRAM
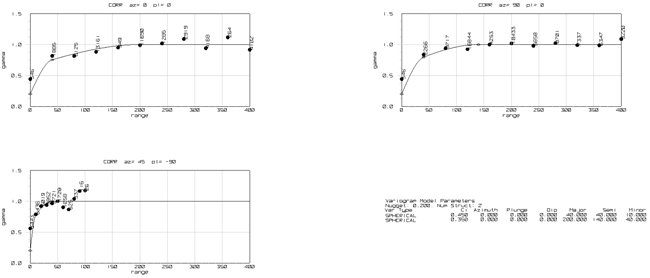
| | |
| Barrick Gold Corporation – Lumwana Mine, | | Page 14 -10 |
| Technical Report NI 43 -101 – March 27, 2014 | |
FIGURE 14-5 CHIMIWUNGO MAIN ORE CORRELOGRAM
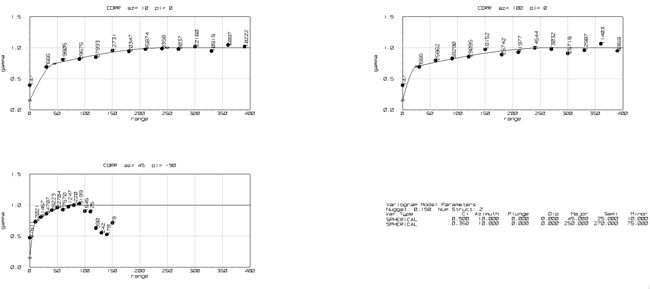
FIGURE 14-6 CHIMIWUNGO SOUTH ORE CORRELOGRAM
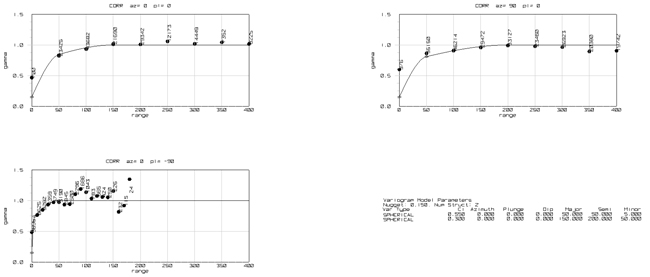
CUT-OFF GRADE
Mineral Resources are reported at a break-even cut-off grade (COG) of 0.16% Cu. At the Chimiwungo deposits the key assumptions used for the COG were based on an average mining cost at $3.78/tonne, processing cost at $9.72/tonne, G&A cost at $3.50/tonne, and fixed tail grade of 0.049% Cu, plus a copper price of $3.50/lb. Royalty of 6% of gross revenue is included.
| | |
| Barrick Gold Corporation – Lumwana Mine, | | Page 14 -11 |
| Technical Report NI 43 -101 – March 27, 2014 | |
GRADE INTERPOLATION AND VALIDATION
Ordinary Kriging methodology was used for resource grade interpolation and estimation of copper, cobalt and gold. Estimation parameters were derived from the variography study. Unfolding techniques have been applied during the grade estimation to compensate for the curvi-linear continuity.
The kriging parameter settings used for grade interpolation of copper, cobalt, sulfur, uranium, pyrite, chalcopyrite, bornite for Chimiwungo and Malundwe were identical as summarized in Table 14-9.
TABLE 14-9 COPPER KRIGING PARAMETERS
| | | | | | | | | | | | | | | | | | | | | | | | | | | | | | | | | | | | | | | | | | | | | | | | | | | | |
| | | | | | Direction | | | Axis | | | Discretization | | | Sample | |
Area | | Run | | | Bearing | | | Plunge | | | Dip | | | Mayor | | | Semi | | | Minor | | | X | | | Y | | | Z | | | Min | | | Max | | | By Hole | |
Chimi North | | | 1 | | | | 10 | | | | 0 | | | | 0 | | | | 150 | | | | 150 | | | | 0.05 | | | | 4 | | | | 4 | | | | 2 | | | | 5 | | | | 9 | | | | 2 | |
| | | 2 | | | | 10 | | | | 0 | | | | 0 | | | | 300 | | | | 300 | | | | 0.1 | | | | 4 | | | | 4 | | | | 2 | | | | 3 | | | | 9 | | | | 2 | |
Chimi Main | | | 1 | | | | 10 | | | | 0 | | | | 0 | | | | 150 | | | | 150 | | | | 0.05 | | | | 4 | | | | 4 | | | | 2 | | | | 5 | | | | 9 | | | | 2 | |
| | | 2 | | | | 10 | | | | 0 | | | | 0 | | | | 300 | | | | 300 | | | | 0.1 | | | | 4 | | | | 4 | | | | 2 | | | | 3 | | | | 9 | | | | 2 | |
Chimi South | | | 1 | | | | 0 | | | | 0 | | | | 0 | | | | 150 | | | | 150 | | | | 0.05 | | | | 4 | | | | 4 | | | | 2 | | | | 5 | | | | 9 | | | | 2 | |
| | | 2 | | | | 0 | | | | 0 | | | | 0 | | | | 300 | | | | 300 | | | | 0.1 | | | | 4 | | | | 4 | | | | 2 | | | | 3 | | | | 9 | | | | 2 | |
Mal North | | | 1 | | | | 165 | | | | 0 | | | | 0 | | | | 250 | | | | 170 | | | | 4 | | | | 4 | | | | 4 | | | | 2 | | | | 6 | | | | 40 | | | | 5 | |
| | | 2 | | | | 165 | | | | 0 | | | | 0 | | | | 500 | | | | 340 | | | | 8 | | | | 4 | | | | 4 | | | | 2 | | | | 2 | | | | 40 | | | | 5 | |
Mal South | | | 1 | | | | 165 | | | | 0 | | | | 0 | | | | 250 | | | | 170 | | | | 4 | | | | 4 | | | | 4 | | | | 2 | | | | 6 | | | | 40 | | | | 5 | |
| | | 2 | | | | 165 | | | | 0 | | | | 0 | | | | 500 | | | | 340 | | | | 8 | | | | 4 | | | | 4 | | | | 2 | | | | 2 | | | | 40 | | | | 5 | |
The first pass for the Chimiwungo model used a maximum of two samples per drill hole and a maximum of nine samples per estimate. The minimum of five samples on the first estimation pass equates to a minimum of three drill holes per estimate. The second pass used a larger search radius to estimate remaining blocks not kriged in the first pass.
The first pass for the Malundwe model used a maximum of five samples per drill hole and a maximum of 40 samples per estimate. The minimum of six samples on the first estimation pass equates to a minimum of two drill holes per estimate. The second pass used a larger search radius to estimate remaining blocks not kriged in the first pass.
| | |
| Barrick Gold Corporation – Lumwana Mine, | | Page 14 -12 |
| Technical Report NI 43 -101 – March 27, 2014 | |
TABLE 14-10 CHIMIWUNGO PIT RESERVE SHELL – INSITU MATERIAL BY CUT-OFF GRADE
| | | | | | | | | | | | | | | | | | | | | | | | |
| | | chimi_nov_05x05x02.bmf | | | chimi_1113_12p5x12p5x12.bmf | |
Cut Off | | Tonnes | | | Cu (%) | | | Kt cu (lbs) | | | Tonnes | | | Cu (%) | | | Kt cu (lbs) | |
| 0.10 | | | 569,218,045 | | | | 0.545 | | | | 6,835,430 | | | | 702,986,539 | | | | 0.444 | | | | 6,887,330 | |
| 0.20 | | | 485,909,779 | | | | 0.613 | | | | 6,564,538 | | | | 571,641,579 | | | | 0.512 | | | | 6,454,955 | |
| 0.30 | | | 408,811,369 | | | | 0.681 | | | | 6,139,421 | | | | 445,502,758 | | | | 0.587 | | | | 5,762,306 | |
| 0.40 | | | 332,685,930 | | | | 0.757 | | | | 5,552,136 | | | | 332,438,215 | | | | 0.667 | | | | 4,889,864 | |
| 0.50 | | | 260,153,646 | | | | 0.843 | | | | 4,833,751 | | | | 234,696,367 | | | | 0.759 | | | | 3,925,084 | |
| 0.60 | | | 197,166,261 | | | | 0.937 | | | | 4,072,014 | | | | 160,912,584 | | | | 0.856 | | | | 3,035,223 | |
| 0.70 | | | 148,167,974 | | | | 1.032 | | | | 3,372,346 | | | | 109,451,653 | | | | 0.953 | | | | 2,300,527 | |
| 0.80 | | | 110,867,952 | | | | 1.128 | | | | 2,757,541 | | | | 74,674,201 | | | | 1.050 | | | | 1,727,922 | |
| 0.90 | | | 82,646,655 | | | | 1.224 | | | | 2,230,345 | | | | 51,364,140 | | | | 1.142 | | | | 1,292,718 | |
| 1.00 | | | 61,053,773 | | | | 1.322 | | | | 1,779,132 | | | | 34,457,491 | | | | 1.237 | | | | 939,991 | |
FIGURE 14-7 CHIMIWUNGO TONNAGE AND GRADE COMPARISON BY BLOCK SIZE
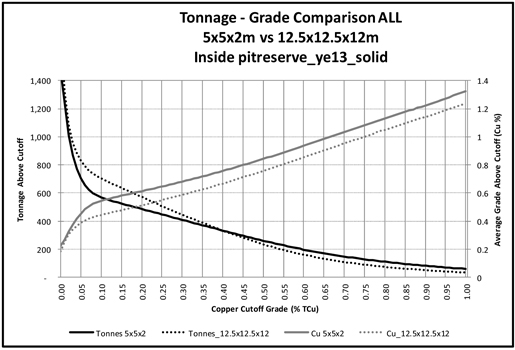
| | |
| Barrick Gold Corporation – Lumwana Mine, | | Page 14 -13 |
| Technical Report NI 43 -101 – March 27, 2014 | |
The resource block models were validated visually in detail to examine the results of estimation of the various geological zones. The models were also checked using swath plots comparing average composite grades versus average block grades. The swath plot results were examined and found to be acceptable. Furthermore, composite statistics were compared to block grade statistics.
FIGURE 14-8 CHIMIWUNGO SWATH PLOT
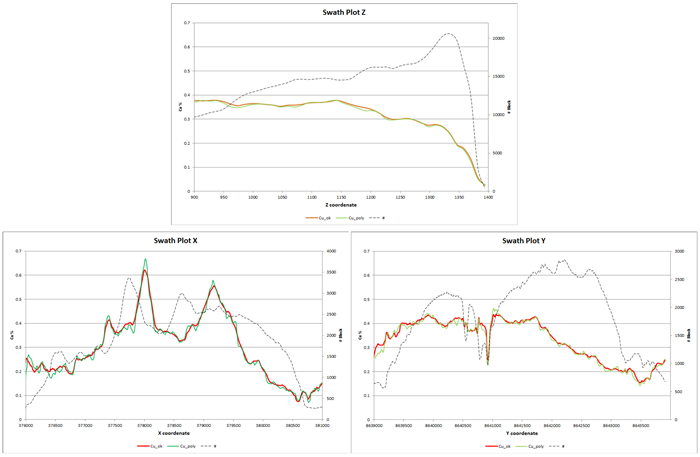
| | |
| Barrick Gold Corporation – Lumwana Mine, | | Page 14 -14 |
| Technical Report NI 43 -101 – March 27, 2014 | |
FIGURE 14-9 MALUNDWE SWATH PLOT
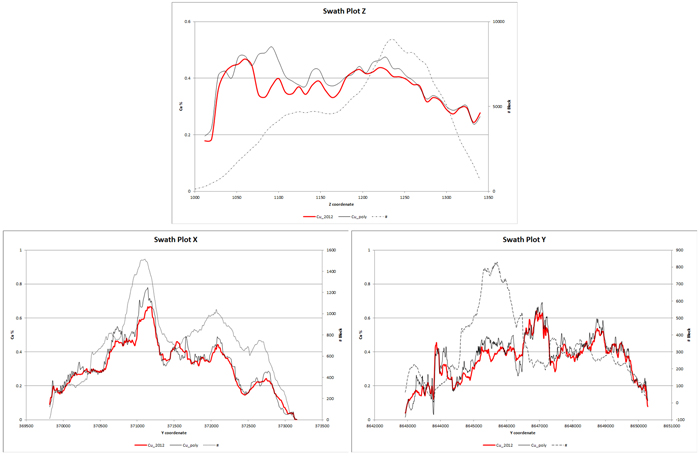
MINERAL RESOURCE CLASSIFICATION
The Chimiwungo and Malundwe deposits have been classified in compliance with CIM definitions as prescribed by NI 43-101. Classification of the Mineral Resources has been completed based principally on data density, quality, and geological confidence criteria.
The initial process used for copper, gold, and cobalt classification for Chimiwungo and Malundwe were as follows:
| • | | If the average weighted sample distance was less than 300 m and the number of drill holes used was greater than two for all domains except overburden material, then the classification was set to Inferred. |
| • | | If the average weighted sample distance was less than 150 m and the number of drill holes used was greater than two for all domains except overburden material, then the classification was set to Indicated. |
| • | | The resource was classified as Measured if the average weighted sample distance was less than 75 m and the number of drill holes used in the estimation was greater than four. |
| | |
| Barrick Gold Corporation – Lumwana Mine, | | Page 14 -15 |
| Technical Report NI 43 -101 – March 27, 2014 | |
An upgrade of the classification was undertaken in areas of dense drilling using wireframe solids representing the Measured category, for all domains except Chimiwungo Main and overburden at Malundwe.
The Inferred, Indicated, and Measured categories were then examined in section and plan. Wireframe solids were used to remove isolated blocks classified as Measured or Indicated for the purpose of obtaining continuity across the deposit and to define geological confidence.
Figures 14-10 through to 14-16 illustrate the distribution of grade and resources classification at the Malundwe and Chimiwungo deposits.
FIGURE 14-10 370.900 E SECTION – CHIMIWUNGO CU ESTIMATION
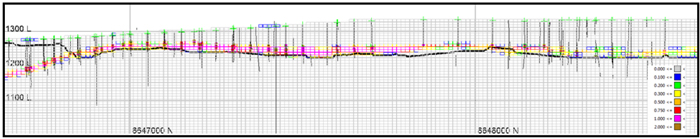
FIGURE 14-11 370.900 E SECTION – CHIMIWUNGO CU ESTIMATION
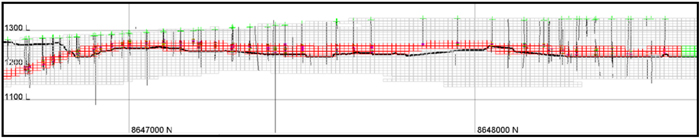
FIGURE 14-12 378.000 E SECTION – CHIMIWUNGO CU ESTIMATION
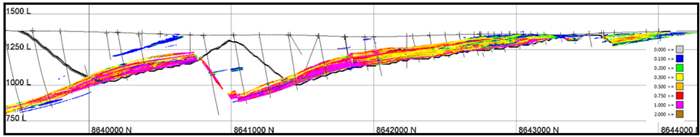
| | |
| Barrick Gold Corporation – Lumwana Mine, | | Page 14 -16 |
| Technical Report NI 43 -101 – March 27, 2014 | |
FIGURE 14-13 378.000 E SECTION – CHIMIWUNGO S ESTIMATION
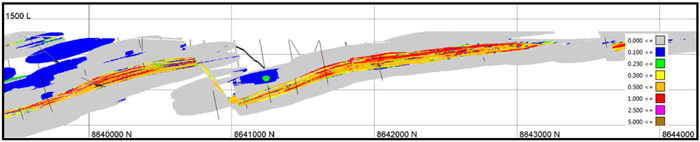
FIGURE 14-14 378.000 E SECTION – CHIMIWUNGO CO ESTIMATION
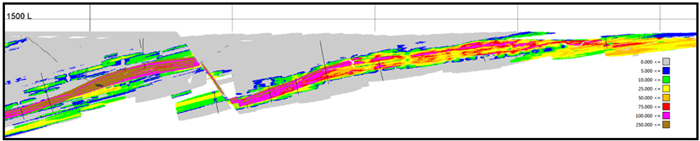
FIGURE 14-15 378.000 E SECTION – CHIMIWUNGO CLASSIFICATION
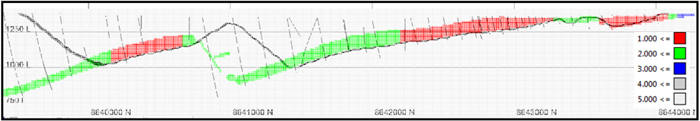
FIGURE 14-16 CHIMIWUNGO RESOURCE CLASSIFICATION PLAN
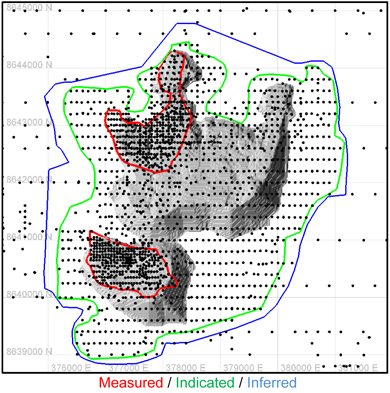
| | |
| Barrick Gold Corporation – Lumwana Mine, | | Page 14 -17 |
| Technical Report NI 43 -101 – March 27, 2014 | |
MINERAL RESOURCE SUMMARY
The Mineral Resources are in addition to Mineral Reserves and could not be converted to Mineral Reserves due to operational constraints or economics (e.g. Measured and Indicated Mineral Resources) or an insufficient level of confidence (e.g. Inferred Mineral Resources). The Mineral Resources are constrained by a basic pit shell based on $3.50/lb copper price. The Measured, Indicated, and Inferred resources are included in the pit shell.
TABLE 14-11 COPPER MINERAL RESOURCES – DECEMBER 31, 2013
Barrick Gold Corporation – Lumwana Mine
| | | | | | | | | | | | |
Category | | Tonnage
(Mt) | | | Grade
(% Cu) | | | Contained Metal
(Mlbs Cu) | |
Measured - Malundwe | | | 0.24 | | | | 0.17 | | | | 0.89 | |
- Chimiwungo | | | 67.29 | | | | 0.39 | | | | 580.49 | |
Sub-total Measured | | | 67.52 | | | | 0.39 | | | | 581.38 | |
| | | |
Indicated - Malundwe | | | 24.03 | | | | 0.60 | | | | 315.50 | |
- Chimiwungo | | | 395.07 | | | | 0.51 | | | | 4,478.69 | |
Sub-total Indicated | | | 419.09 | | | | 0.52 | | | | 4,794.19 | |
| | | | | | | | | | | | |
Measured + Indicated | | | 486.62 | | | | 0.50 | | | | 5,375.57 | |
| | | |
Inferred | | | 0.46 | | | | 0.57 | | | | 5.85 | |
Notes:
| 1. | CIM definitions were followed for Mineral Resources. |
| 2. | Fresh sulphide Mineral Resources are estimated at a cut-off grade of 0.16% Cu and transition sulphide Mineral Resources are estimated at a cut-off grade of 0.38% Cu. |
| 3. | Mineral Resources are estimated using a long-term copper price of US$3.50 per pound. |
| 4. | A minimum thickness of 2.0 m was used in the wireframe model. |
| 5. | Mineral Resources are exclusive of Mineral Reserves. |
| 6. | Mineral Resources that are not Mineral Reserves do not have demonstrated economic viability. |
| 7. | Numbers may not add due to rounding. |
CONCLUSIONS
The Mineral Resource estimates were completed using reasonable and appropriate parameters. The data collection system (i.e., the sample data) is well configured and maintained. Estimation procedures are very well organized and documented.
| | |
| Barrick Gold Corporation – Lumwana Mine, | | Page 14 -18 |
| Technical Report NI 43 -101 – March 27, 2014 | |
The authors are not aware of any environmental, permitting, legal, title, taxation, socio-economic, marketing, political, or other relevant factors which could materially affect the open pit mineral resource estimates.
| | |
| Barrick Gold Corporation – Lumwana Mine, | | Page 14 -19 |
| Technical Report NI 43 -101 – March 27, 2014 | |
15 MINERAL RESERVE ESTIMATE
A summary of the Lumwana Mineral Reserves is shown in Table 15-1. Mineral Reserves at Lumwana are exclusive of Mineral Resources. The ultimate Malundwe pit will measure approximately one kilometre east to west, four kilometres north to south, and have an average depth of approximately 142 m. The ultimate Chimiwungo Main pit will measure approximately 1.7 km east to west, 3.7 km north to south, and have a maximum depth of approximately 350 m. The ultimate Chimiwungo South pit will measure approximately 1.8 km east to west, 1.1 km north to south, and have a maximum depth of approximately 310 m.
TABLE 15-1 MINERAL RESERVES – DECEMBER 31, 2013
Barrick Gold Corporation – Lumwana Mine
��
| | | | | | | | | | | | |
Category | | Tonnes
(Mt) | | | Grade
(% Cu) | | | Contained Metal
(Mlbs Cu) | |
Proven | | | | | | | | | | | | |
Malundwe | | | 9.46 | | | | 0.76 | | | | 159.52 | |
Chimiwungo | | | 223.59 | | | | 0.54 | | | | 2,687.76 | |
Subtotal Proven | | | 233.05 | | | | 0.55 | | | | 2,847.28 | |
| | | |
Probable | | | | | | | | | | | | |
Malundwe | | | 34.22 | | | | 0.69 | | | | 524.39 | |
Chimiwungo | | | 269.61 | | | | 0.54 | | | | 3,231.48 | |
Subtotal Probable | | | 303.83 | | | | 0.56 | | | | 3,755.87 | |
| | | |
Proven + Probable | | | | | | | | | | | | |
Malundwe | | | 43.68 | | | | 0.71 | | | | 683.91 | |
Chimiwungo | | | 493.20 | | | | 0.54 | | | | 5,919.24 | |
Subtotal Proven + Probable | | | 536.88 | | | | 0.56 | | | | 6,603.15 | |
| | | |
Stockpiles (Proven) | | | 1.92 | | | | 0.39 | | | | 16.66 | |
| | | | | | | | | | | | |
Total | | | 538.80 | | | | 0.56 | | | | 6,619.82 | |
Notes:
| 1. | CIM definitions were followed for Mineral Reserves. |
| 2. | Mineral Reserves are estimated at a cut-off grade of 0.20% Cu for fresh sulfide ore and 0.41% for transitional sulfide ore. |
| 3. | Mineral Reserves are estimated using an average long-term copper price of US$3.00 per pound and a US$/C$ exchange rate of 0.95. |
| 4. | Bulk density is 2.0 t/m3 to 2.8 t/m3 depending on degree of weathering and material type |
| 5. | 100% mining recovery and no dilution |
| 6. | Numbers may not add due to rounding. |
| | |
| Barrick Gold Corporation – Lumwana Mine, | | Page 15 -1 |
| Technical Report NI 43 -101 – March 27, 2014 | |
The Malundwe Mineral Reserves are based on the 2013 Malundwe Mineral Resource estimate; the Chimiwungo Mineral Reserves are based on the 2013 Chimiwungo Mineral Resource estimate.
The Lumwana Mineral Reserve estimate is defined in compliance with CIM standards as prescribed by NI 43-101.
The Malundwe and Chimiwungo copper cut-offs are based on producing a concentrate at a long term copper price of $3.00/lb with 2014 budgeted costs to make appropriate allowances for processing, administration, freight and smelter charges. Table 15-2 summarizes the copper cut-off grades applied.
TABLE 15-2 MINERAL RESERVE CUT-OFF GRADES
Barrick Gold Corporation – Lumwana Mine
| | | | | | | | | | | | | | |
Malundwe-
Transitional | | | Chimiwungo-
Transitional | | | Malundwe-
Sulphide | | | Chimiwungo-
Sulphide | |
| | 0.41 | % | | | 0.41 | % | | | 0.20 | % | | | 0.20 | % |
The Malundwe block model has been regularized to 12.5 m x 12.5 m x 8.0 m blocks with dilution included in the geological block models by regularizing the blocks within the mineralized boundary. The reserves within designed pits have been depleted for mining as December 31, 2013.
The economic recovery of ore from Kanga requires the relocation of the diversion channel to the south of the existing Malundwe pit. Hence, Kanga has not been included in the designed pit at the time of reporting with investigations continuing.
For the Chimiwungo Mineral Reserves, dilution and mining recovery have been included in the estimation technique (ordinary kringing) and in the geological block models by regularizing the blocks to 12.5 m x 12.5 m x 12.0 m within the mineralized boundary. Dilution is added both laterally and vertically to allow for rill angles and floor level variations. This has had the overall effect of increasing tonnage by 17.6% and reducing grade by 16.4%
As part of the mine planning process, the effect of changes in variables such as price, metallurgical recovery, and process method have been examined. There are no particular factors other than those covered in this report that should have a significant impact upon these estimates.
| | |
| Barrick Gold Corporation – Lumwana Mine, | | Page 15 -2 |
| Technical Report NI 43 -101 – March 27, 2014 | |
Figure 15-1 shows the final mine designs for the Chimiwungo Pits that was used for the Reserves (South, Main and East).
FIGURE 15-1 CHIMIWUNGO MINE DESIGN
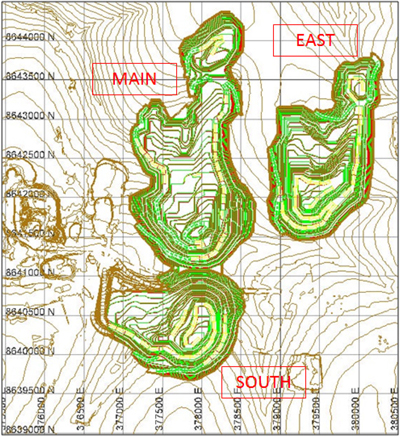
| | |
| Barrick Gold Corporation – Lumwana Mine, | | Page 15 -3 |
| Technical Report NI 43 -101 – March 27, 2014 | |
Figure 15-2 shows the final mine design for Malundwe that was used for the Reserves, with the various mining stages noted.
FIGURE 15-2 MALUNDWE MINE DESIGN
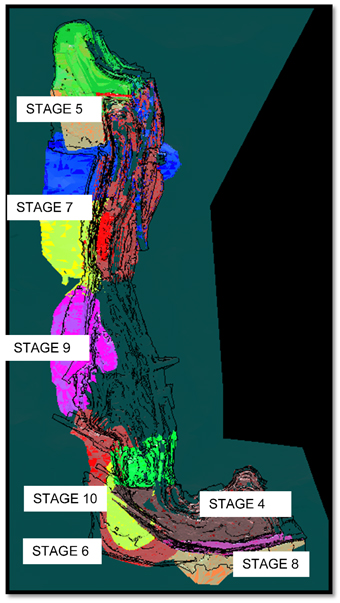
| | |
| Barrick Gold Corporation – Lumwana Mine, | | Page 15 -4 |
| Technical Report NI 43 -101 – March 27, 2014 | |
16 MINING METHODS
The Lumwana Mine currently exploits two deposits, Malundwe in the northwest and Chimiwungo located seven kilometres from Malundwe to the southeast. Potential exists that other deposits could be brought on line.
Pre-stripping of the Malundwe pit began in April 2007, with copper ore being processed in the Lumwana concentrator from December 2008. Mining is scheduled to be completed in Malundwe in 2029. Pre-stripping of the Chimiwungo starter pit started in February 2011, and copper ore production from Chimiwungo started in Q3 2012. Mining is scheduled to be completed in Chimiwungo in 2038.
Copper ore from Malundwe and Chimiwungo is sent to the concentrator, which will produce a concentrate suitable for sale to a smelter.
The Project processes sulphide copper ore at a rate of approximately 23 Mtpa. The oxide ore will be stockpiled close to the ROM pad for possible processing later in the mine life.
MINING OPERATIONS
Sulphide and transitional copper ore at Lumwana is mined by open pit methods. The mine started operations in 2007 and reached a peak daily capacity of 350,000 t of total material. Life of Mine Plans are now based on nominal capacity of 260,000 tonnes per day. Mining is done by Lumwana personnel and equipment, supplemented by a contractor pre-stripping wet weathered material with light mining fleet suitable for this purpose.
The primary Lumwana mining equipment fleet includes:
| • | | Five (5) Hitachi EX 5500 27 m3 front shovels; |
| • | | One (1) Hitachi EX 5500 27 m3 back hoe; |
| • | | One (1) Hitachi EX 2500 15 m3 back hoe; |
| | |
| Barrick Gold Corporation – Lumwana Mine, | | Page 16 -1 |
| Technical Report NI 43 -101 – March 27, 2014 | |
| • | | Thirty-one (31) Hitachi EH 4500 254 tonne haul trucks; and |
| • | | Ten (10) Drilltek D45K blast hole drills; |
| • | | Three (3) Cubex DR560 blast hole drills. |
Lumwana also operate a “light” mining fleet to mine and develop areas where the use of smaller equipment is more applicable. Production from this fleet is 27,000 tonnes per day. This light fleet consists of
| • | | Seven (7) Caterpillar 777 haul trucks; |
| • | | Fourteen (14) Komatsu 785 haul trucks; |
| • | | Fourteen (14) articulated trucks ranging from 30t - 40t |
| • | | Two (2) Cat 993 and one (1) Cat 994 front end loaders |
| • | | Three (3) Cat 365 excavators |
| • | | One (1) Hitachi XS870 excavator |
As mentioned previously, a mining contractor also works at the mine site to supplement production in wet and weathered pre-strip areas. They use 40 tonne capacity Volvo articulated trucks and 90 tonne tracked excavators. The contractors move 45,000 tonnes per day and are scheduled by the Lumwana Mine Engineering Department to coordinate material movements.
The initial mining area at the Malundwe open pit has been nearly mined out and new operations have commenced at Chimiwungo South. A new crusher and an overland conveyor system was constructed to transfer ore from the Chimiwungo ROM area to the mill feed stockpile. It commenced operation in Q3 2012.
Pre-stripping and initial haul road construction commenced at Chimiwungo Main in September 2013.
| | |
| Barrick Gold Corporation – Lumwana Mine, | | Page 16 -2 |
| Technical Report NI 43 -101 – March 27, 2014 | |
LIFE OF MINE PLAN
The Life of Mine (LOM) plan for the currently identified Reserves constitutes mining of the following material quantities.
| | |
Ore | | 543Mt @ 0.55% Cu |
| |
Waste | | 1,480Mt |
| |
Total Material | | 2,023Mt |
| |
Strip Ratio | | 2.73:1 |
Based on existing reserves and production capacity, the expected mine life for Lumwana is approximately 24 years (2014 to 2038) for mining and 25 years (2014 to 2039) for processing.
MINE DESIGN
The berm width and bench height vary depending on pit wall sector, and is primarily dependent on the degree of weathering and presence of structural faults. Haul roads have a maximum grade of 10% and are 50 m wide. Lumwana selectively mines and stockpiles gneiss waste (the most durable material available) for use in road construction and to help with difficult operating conditions. Figures 16-1 shows the relative locations of the Project’s open pits, waste dumps and primary infrastructure for Malundwe and Chimiwungo respectively.
| | |
| Barrick Gold Corporation – Lumwana Mine, | | Page 16 -3 |
| Technical Report NI 43 -101 – March 27, 2014 | |
FIGURE 16-1 LUMWANA SITE LAYOUT

GEOTECHNICAL CONSIDERATIONS
George Orr and Associates (Orr) provided geotechnical assessments and recommendations for the Lumwana Project from 2005 until 2011. Their work included preliminary observations and design recommendations based on geotechnical testing and site inspections of actual ground conditions after the mine opened.
In the fourth quarter of 2011, HTA Consulting was appointed to lead a geotechnical investigation for the Chimiwungo Pits. The investigation came to a close in August 2013. The original purpose of the study was to progress the geotechnical understanding of the Chimiwungo Resource to feasibility level.
The study involved the geotechnical and structural logging of 83 geotechnical holes (18,950m of drill core) and 249 resource holes (60,350m of drill core). Rock and soil laboratory samples were tested for uniaxial and triaxial compressive strength, discontinuity shear strength and foundation indicators.
In addition a hydrogeological investigation component was led by Golder Associates (South Africa). Hydrogeological modelling was carried out by John Shomaker and Associates (USA). Fieldwork included injection packer testing of 19 boreholes and the drilling and pump testing of three boreholes around the Chimiwungo area. John
| | |
| Barrick Gold Corporation – Lumwana Mine, | | Page 16 -4 |
| Technical Report NI 43 -101 – March 27, 2014 | |
The rock mass of the Chimiwungo deposit has a low permeability and groundwater inflows are low. The main conduits for groundwater are a series of WNW-ESE orientated steeply dipping faults that cross the Chimiwungo ore body. These faults are the main targets for the drilling of dewatering boreholes.
The oxides (saprolites) exhibit instability due to the presence of groundwater. Horizontal drainholes may be required to depressurise these saprolites. This will be re-evaluated depending on the success of the dewatering bores in reducing pore pressures in the oxides.
Results of the modelling indicate a total of seven dewatering boreholes will sufficiently depressurise the pit walls to achieve the requirements of the geotechnical design. Capital has been approved to drill four boreholes in 2014. Planning for these boreholes has begun and drilling is expected to commence at the end of the wet season in April 2014. Data from pumping of the dewatering boreholes will be used to update the hydrogeological numerical model.
The various components of the geotechnical investigation were assessed subjectively according the confidence in the data and understanding of each component. The following categories were used; very low, low, moderate, high, very high. The expectation at the end of the study was that each of the components would attain a moderate to high or high level of confidence. The main areas of risk identified in terms of confidence were Groundwater (low – moderate), weathering (moderate), structural interpretation (moderate), and soil strength (moderate).
Confidence in the groundwater model is expected to increase as a result of the drilling and testing of the dewatering boreholes and the subsequent updating of the hydrogeological model.
The weathering and structural models are in the process of the being reviewed by the mine geotechnical staff. An early assessment indicates a potential upside benefit with a re-interpretation of the major structures and weathering surfaces.
| | |
| Barrick Gold Corporation – Lumwana Mine, | | Page 16 -5 |
| Technical Report NI 43 -101 – March 27, 2014 | |
The soil properties are constantly being re-evaluated by way of carrying out back analyses of instabilities in this material. Although instability is fairly common in the oxides the depth of weathering, up to 30m, is not so great to cause major concern.
The pit slope design parameters for Malundwe have not been changed since 2010. Bench scale failures in the footwall have been common throughout the period of mining the Malundwe pit. On occasion, where the footwall dips more steeply these failures have progressed across more than one bench. Although it was a concern in the past, deep seated multi-bench instability has not occurred and slope stability monitoring of the footwall using robotic total stations has picked up no significant movement. The hangingwall slopes have also shown no signs of significant instability. The main risk has been rock fall hazard due to poor blasting and scaling practices in the past.
ORE CONTROL
Ore control is primarily done on samples obtained from RC drills specifically used to collect the material, and augmented with blast holes when necessary. Grade control holes are typically drilled to 36m or 24m depth at Chimiwungo and Malundwe respectively, in order to cover 3 benches in those pits.
Ore control also involves use of visual determinations (ore spotting) by the in-pit crews to maximize ore recovery and reduce dilution. As the predominant mineralization is chalcopyrite and bornite, the ore and barren waste (gneiss) are visually distinct and can be distinguished during excavation. Geologists are in the field at all times to work with Operators and Supervisors to determine whether material is ore or waste and how to optimize recovery/dilution. This is done for hanging wall, footwall and internal waste lens contacts. The dip of the ore body is approximately 17 degrees with rolls and troughs throughout, so the determination of ore/waste may change frequently within individual ore blocks.
The on-site laboratory analyzes the samples for copper, uranium and sulphide sulphur. Sulphide sulphur is used to determine if the copper minerals present will respond to froth flotation.
| | |
| Barrick Gold Corporation – Lumwana Mine, | | Page 16 -6 |
| Technical Report NI 43 -101 – March 27, 2014 | |
Survey crews flag the various ore types identified by the mine geology department, which determines which ore will be processed, which will be stockpiled for future potential blending or processing and which is waste.
Surface stockpiles are used to blend mill feed to achieve acceptable concentrate quality. Typically ROM stocks are built up in dry season when productivity is high, and depleted in wet season when productivity is low and mill feed needs supplementing.
DRILLING AND BLASTING
Blast holes are drilled by the Lumwana fleet and emulsion explosives loaded by a third party supplier. Due to the wet conditions, a 65% emulsion is used exclusively. Powder factor is up to a maximum of 0.30 to 0.35 kg/t depending on whether the material is ore or waste. The blast hole pattern for fresh ore is 4.2m by 4.5m, and 4.7m by 5.2m for fresh waste, with a one metre sub-drill. Transitional material is blasted on either 5m by 6m or 6m by 7m patterns depending on degree of weathering. Oxide material typically does not require blasting.
SURFACE WATER
Lumwana has a distinctive wet and dry season. Total annual rainfall is 1.3 m, with the majority coming in October to April, peaking in November through to March. Monthly rainfall in the wet season averages 225 mm. The ground is saturated, even in the dry season, and standing water is seen on the benches when drainage has not been provided.
Sumps are designed into the lower benches and developed as the pit bottom advances. They are constructed by drilling and blasting two benches in the appropriate area. There are detailed plans for the location and size of sumps, predicted rainfall based on a five year return period, and pump capacity required in order to remove the rainfall from the design areas in under 24 hours.
The pumping fleet at Lumwana includes 12 diesel powered mobile pumps and three electrically powered barge mounted pumps. The largest pumps have a capacity 26,000 m3per day at 200m head.
| | |
| Barrick Gold Corporation – Lumwana Mine, | | Page 16 -7 |
| Technical Report NI 43 -101 – March 27, 2014 | |
Pit water is discharged to settling ponds before release to the natural drainage system.
MINING DILUTION
In the past, predicting mining dilution at Lumwana was challenging, and reconciliation between the geological block model and mining plans was poor, as each model used different size blocks which did not match mining bench heights. This has been rectified and the block models used for planning match the mining parameters, and dilution is incorporated in Reserve and Grade Control blocks.
Similarly, the reserve model used widely spaced exploration holes in many areas, resulting in poor reconciliation between mining and the reserve model, and consequent significant spatial variations. This was especially evident in the transition zone of Chimiwungo. However now that the dedicated Resource drilling campaign was carried out in 2011-2013, all mined material is now in either Measured or Indicated categories and reconciliation is in line with expectations, particularly at Chimiwungo.
The closer spaced Grade Control drilling (15m by 30m pattern) is able to better define internal and external ore/waste contacts so that dilution is minimized. This process is further optimized by ore spotting as previously described.
The typical geometry of the Malundwe ore body is a single favourable horizon, eight metres to 40 m thick, with a dip of 15o to 20o. When viewed on a bench level, the ore zone shifts from side to side. This shifting results in greater spatial variation and poses challenges for mine planning and mine operations. Mining bench heights are normally eight metres with occasional areas where four metre split benches are used.
The Chimiwungo deposit can occur in up to three zones with internal waste between the ore with a dip similar to Malundwe. The presence of three separate ore zones at Chimiwungo adds to the number of ore/waste contacts which increases the amount of potential dilution. The Chimiwungo deposit, however, has a much thicker ore zone than Malundwe so despite the complexity of three ore zones the overall dilution as a percentage of the volume of ore is less for Chimiwungo than it is for Malundwe.
| | |
| Barrick Gold Corporation – Lumwana Mine, | | Page 16 -8 |
| Technical Report NI 43 -101 – March 27, 2014 | |
Hitachi E5500 shovels are the primary loading equipment and have bucket dimensions of 4.7 m wide by 3.5 m high. The Malundwe pit design uses a bench height of 8 m and is suitable for the shovels used. Unavoidable dilution comes from the wedge of material defined by the 20o slope and the level bench. Measured dilution is reported to be in the range of 25% - 30%. It is considered that this is a realistic number given the loading equipment available and the geometry of the deposit.
Mining loss and dilution consists of two types:
Lateral loss and dilution is produced between the block in question and the four blocks that surround it horizontally. The quantity of lost material and diluting material is determined by the angle of the dig face (76 degrees) and bench height, which defines the lateral influence.
Vertical loss and dilution is produced by the blocks located above and below the block in question. This loss and dilution is determined by the operational control of the loading equipment elevation and the quantity of material that is over- or under-excavated from the bench. The assumption for bench elevation control was 0.5 m total or 0.25 m on average in either direction.
CUT-OFF GRADE
Mining, processing, general and administration (G&A), transportation and smelting costs are utilized to calculate the cut-off grade and are presented in Table 16-2. The principal product of the mine and mill is a copper flotation concentrate that is shipped by truck to one of three close-by copper smelters. Production from the Malundwe deposit has been primarily comprised of bornite, 63% Cu, while the Chimiwungo deposit is primarily comprised of chalcopyrite, 34% Cu.
| | |
| Barrick Gold Corporation – Lumwana Mine, | | Page 16 -9 |
| Technical Report NI 43 -101 – March 27, 2014 | |
TABLE 16-1 CUT-OFF GRADE PARAMETERS
Barrick Gold Corporation – Lumwana Mine
| | |
Factor | | Cost (US$) |
| Costs: | | |
Mining Operating Costs: | | $3.73/t mined |
Process, Treatment and Selling Costs | | $9.72/t ore |
Process Sustaining Capital: | | Included in above |
G&A Costs: | | |
Site G&A Costs | | $3.50/t ore |
Royalty | | 6% of gross revenue |
Ag & Cu Credits | | NA |
Re-handle Costs | | Included in the processing costs |
| Assumptions: | | |
Mining Dilution: | | 0% - Model is already diluted |
Specific Gravity: | | varies by rock type from 2.0 to 2.8 |
Process Recovery | | Fixed tail grade of 0.049% for Sulphides and 0.26% for Transitional Material |
Copper Price | | $3.00/lb |
Total site production costs, excluding capital, for 2013 were $2.24 per pound of copper.
The planned stripping ratio for the remaining resource is 2.73:1 (waste tonnes to ore tonne) for Mineral Reserves only.
The majority of the currently treatable resource classified from the block models is coded as sulphide with smaller amounts of mixed ore. Cut off grades calculated for the sulphide and mixed ores differ as they have different copper recovery in the concentrator. The costs are based on expected LOM cost calculations which are benchmarked against current and budget costs.
The cut-off grade for sulphide ore is calculated as:
(Processing cost + G&A cost) / ((Cu Price – selling cost) * Cu payable * Cu Processing recovery)
As per the table below and equation above, the cut off grades are
| | |
• Sulphide Ore | | 0.20% |
| |
• Transition Ore | | 0.41% |
| | |
| Barrick Gold Corporation – Lumwana Mine, | | Page 16 -10 |
| Technical Report NI 43 -101 – March 27, 2014 | |
TABLE 16-2 CUT-OFF GRADES
Barrick Gold Corporation – Lumwana Mine
| | | | | | | | |
Estimated Economic Cut-Off Grade | | 2013YE Reserves at 23Mtpa | |
Ore Type | | | Transition | | | | Sulphide | |
Cu price (US$/lb) | | | 3.00 | | | | 3.00 | |
Cu Payable (%) | | | 95.0 | % | | | 95.0 | % |
Processing, Treatment and Selling Cost (US$/t) | | | 9.72 | | | | 9.72 | |
G&A Cost (US$/t) | | | 3.50 | | | | 3.50 | |
Cu Recovery at Cut-Off (%) | | | 36.6 | % | | | 75.5 | % |
Estimated Concentrate Cu Grade at cut-Off | | | 20.0 | % | | | 20.0 | % |
Cu Cut-Off Grade | | | 0.410 | % | | | 0.199 | % |
The following point should be noted
| • | | With a fixed tailings grade recovery calculation, the recovery at cut-off grade is lower than at the average grade |
For 2013 year, Lumwana mined 22.46 Mt of sulphide ore at an average grade of 0.52% copper. The reconciled mill production for the 2013 calendar year was 21.91Mt grading 0.58% copper. The difference is due to ROM stockpile movements.
A total of 1.92 Mt at 0.39% Cu of sulphide ore was stockpiled at both Malundwe and Chimiwungo ROMs at the close of December 2013.
| | |
| Barrick Gold Corporation – Lumwana Mine, | | Page 16 -11 |
| Technical Report NI 43 -101 – March 27, 2014 | |
17 RECOVERY METHODS
The Lumwana concentrator flow sheet has a nominal design capacity of 25Mtpa.
CRUSHING AND GRINDING
There are two crushers; at Malundwe and Chimiwungo South, which have the same set-up and similar design. The Malundwe crusher was commissioned at the start of operations in 2008, whereas the Chimiwungo South crusher was commissioned in Q3 2011.
Trucks from the mines can tip directly into a 400t capacity run-of-mine (ROM) dump hopper. The ROM pad accepts ore that cannot be directly dumped into the crusher feed hopper due to blending requirements or capacity constraints. The primary gyratory crusher crushes the ROM ore from a nominal top size of 1,500mm to less than 200mm. Oversize material is deposited on the ROM pad to be further broken by a mobile rock breaker. Crusher product is then conveyed via overland conveyor to a conical crushed ore stockpile with 12 hours live capacity. The Malundwe overland conveyor is 4.5km long, and the Chimiwungo South overland conveyor is 3.5km long.
Stockpiled and crushed ore is reclaimed via apron feeders onto a conveyor belt providing direct feed, at a rate of approximately 3,200t/h, into the 38ft diameter by 18ft SAG mill. The SAG mill trommel undersize discharges into a hopper and is pumped to conventional hydrocyclones, operating in closed circuit with a 26ft diameter by 40ft ball mill. The hydrocyclone overflow, with a particle size distribution of 80% passing 380µm, reports to flotation, and the cyclone underflow returns to the ball mill for further size reduction.
FROTH FLOTATION
The flotation plant consists of two parallel trains of rougher/scavenger cells. The rougher/scavenger concentrate reports to the regrind circuit to further liberate the copper minerals. Following regrinding, the concentrate is cleaned in a conventional cleaner/recleaner circuit to reach final concentrate grade. Final concentrate grades of approximately 25% to 33% copper are expected.
| | |
| Barrick Gold Corporation – Lumwana Mine, | | Page 17 -1 |
| Technical Report NI 43 -101 – March 27, 2014 | |
Five 17 m3 Dorr Oliver flotation cells are utilized for re-cleaner flotation. The tailings report to the cleaner flotation cells. The concentrate from the re-cleaner flotation circuit is pumped to the concentrate thickener after passing the final concentrate sample analyser and trash screen. The sample analyser determines the pulp density, and the copper, iron, and cobalt concentrations.
Collector, frother, and flocculant are the primary reagents used in the processing plant at Lumwana. A number of different reagents have been evaluated in an attempt to improve the performance of the plant.
CONCENTRATE DEWATERING AND STORAGE
The concentrate is dewatered in a circuit consisting of high-rate thickening followed by pressure filtration to produce a filter cake suitable for transportation. The concentrate is stored in a seven day capacity storage shed from which it is subsequently loaded onto trucks and transported to market for smelting and refining. Flotation tailings are thickened and pumped to the tailings dam.
The majority of the concentrator water is recovered and recycled from the thickener overflows and tailings dam return water. Fresh make-up water is supplied from a river water dam as required.
CONCENTRATE THICKENER
The concentrate thickener is a high rate 21m diameter unit that dewaters the concentrate from approximately 25%solids to 70%solids, prior to filtration. The concentrate thickener overflow reports to the process water pond. The concentrate thickener underflow is pumped to the two concentrate storage tanks, which provide up to 24 hours storage capacity, prior to the concentrate filter.
CONCENTRATE FILTER
Two centrifugal pumps feed the Larox vertical pressure plate filter from the concentrate storage tanks. The concentrate is filtered to reduce the moisture content from approximately 35% to approximately 10%. Test-work determined that the transportable
| | |
| Barrick Gold Corporation – Lumwana Mine, | | Page 17 -2 |
| Technical Report NI 43 -101 – March 27, 2014 | |
moisture limit is 10.6% for concentrates. The filtered concentrate is discharged from the pressure filter to the concentrate storage shed, located below the filter. The concentrate is loaded onto trucks using a front end loader and is transported to smelters located in the Zambian Copper Belt.
TAILINGS THICKENER
The tailings thickener is a high rate 56m dia. unit that is used to thicken the rougher and scavenger tailings, and the cleaner scavenger tailings, from approximately 38%(w/w) solids to approximately 55%(w/w) solids, prior to disposal in the TSF. The tailings thickener overflow reports to the process water pond.
WATER
Two submersible pumps are used to pump water from the Lumwana River to the raw water pond. A diesel powered fire water pump distributes fire water throughout the plant via a dedicated fire water ring main. The three raw water distribution pumps supply a raw water header pipe, for distribution throughout the plant. The raw water and fire water tanks are also fed from the plant’s raw water header pipe. Raw and fire water are distributed throughout the industrial area using dedicated pumps and piping.
POTABLE WATER
Submersible pumps are used to pump water from the Lumwana River dam to the town raw water and fire water tanks. The potable water treatment plant is designed to remove dissolved metals and to produce water of acceptable drinking standards.
PROCESS CONTROL
Three control rooms are available for control purposes:
| • | | Main Control Room – located between the grinding and flotation sections and is sited so that the accessibility of critical plant areas is maximized. This building also houses the process control system (PCS) hardware, programming computers, and future data logging and expert systems hardware. |
| • | | Crusher Control Room – located adjacent to the tipping point of the gyratory crusher. |
| • | | Concentrate Filter Control Room – located in the filter building. |
| | |
| Barrick Gold Corporation – Lumwana Mine, | | Page 17 -3 |
| Technical Report NI 43 -101 – March 27, 2014 | |
The control rooms allow their respective process areas to be started, stopped, controlled, and monitored. The crushing and filter plant operations are monitored from the main control room. Closed circuit television cameras and monitors are available for monitoring activity in various areas.
PROCESS DESIGN CRITERIA
The major process design criteria for the Lumwana plant are summarized in Table 17-1.
| | |
| Barrick Gold Corporation – Lumwana Mine, | | Page 17 -4 |
| Technical Report NI 43 -101 – March 27, 2014 | |
TABLE 17-1 LUMWANA COPPER PROCESS DESIGN CRITERIA
Barrick Gold Corporation – Lumwana Mine
| | | | | | |
| | | units | | | |
Annual treatment rate | | tpa | | | 25,000,000 | |
Operating schedule | | d/a | | | 365 | |
Operating schedule | | h/d | | | 24 | |
Crusher utilization | | % | | | 70 | |
Crusher feed | | tpd | | | 68,000 | |
Grinding, flotation, tailings availability | | % | | | 92 | |
Throughput rate | | tpd | | | 68,000 | |
Ore grades | | | | | | |
Malundwe LOM average | | % Cu | | | 0.79 | |
Chimiwungo LOM average | | % Cu | | | 0.54 | |
Comminution | | | | | | |
Bond ball mill work index (design, P80 280m) | | kw/t | | | 13.1 | |
SMC Drop weight index | | kWh/t | | | 3.14 | |
JK Parameters (Axb), design | | — | | | 85.6 | |
Copper recovery to final concentrate | | % | | | 94.7 | |
Final concentrate grade | | % Cu | | | 31.0 | |
Flotation stage recoveries: | | | | | | |
Rougher | | % | | | 98 | |
Jameson cell | | % | | | 65 | |
Cleaner | | % | | | 68 | |
Cleaner scavenger | | % | | | 75 | |
Re-cleaner | | % | | | 75 | |
Regrind work index | | kWh/t | | | | |
Solids feed rate | | t/h | | | 190 | |
Solids feed size (F80) | | mm | | | 320 | |
Copper product size (P80) | | mm | | | 66 | |
Re-cleaner solids mass flow | | t/h | | | 82 | |
Re-cleaner mass recovery | | % | | | 2.5 | |
WATER MANAGEMENT
Recycled water from the copper TSF and raw water from the water storage facility (WSF) are used to provide water for copper processing purposes, construction and dust control. Raw water and potable water are supplied from the WSF.
| | |
| Barrick Gold Corporation – Lumwana Mine, | | Page 17- 5 |
| Technical Report NI 43 -101 – March 27, 2014 | |
18 PROJECT INFRASTRUCTURE
Project infrastructure includes, but is not limited to the following structures:
| • | | Equipment Maintenance facilities, which also includes offices and a warehouse; |
| • | | Fuel storage and distribution for all mobile equipment; |
| • | | A 68,000 tonne per day (tpd) crushing, grind, and flotation process facility; |
| • | | Communications facilities for internal and external communications; |
| • | | Solid waste disposal areas; |
| • | | Water treatment and sewage plants; |
| • | | High voltage electrical power at 330 kV is delivered to the site from the Zambia Electricity Supply Company, ZESCO, which is part of the national grid; |
| • | | Water wells and pit dewatering wells; |
| • | | Project access and site roads, that are reasonably maintained; |
| • | | First aid and a medical treatment facility; |
| • | | Cafeteria and dining facility for the onsite workers; and |
| • | | A town-site with housing units for the staff and their families. |
MINE WASTE (OVERBURDEN) DUMPS
Waste dumps are designed in areas where condemnation drilling has been completed, as close as possible to pit ramp exits. The design of the overburden waste dumps provides for an overall slope angle of 20° after battering. Dumps are of terrace construction. Where necessary, sediment catch drains are constructed at the toe of the dumps and in specific areas at the base of the dumps to arrest runoff and channel the water into sumps to allow sediment to settle out before decanting the water into designated channels or pumping to one of the dams.
| | |
| Barrick Gold Corporation – Lumwana Mine, | | Page 18 -1 |
| Technical Report NI 43 -101 – March 27, 2014 | |
As far as practicable, heavily weathered materials and rock types prone to erosion are identified and placed in central areas well away from dump walls. Conversely, more competent, less weathered materials are used to construct the outer dump walls and to dress the slopes. Based on Geochemical studies, sulphide material that is deemed to have potential to cause acidic runoff is placed in the middle of the dumps and encapsulated. Geochemical studies are still underway to determine the nature and quantity of this material. Early indications are that the Chimiwungo deposit has a 10m-15m halo of sulphidic waste in the hanging wall gneiss.
Revegetation of the dump slopes and upper dump surfaces is carried out progressively during the life of mine to produce a sustainable vegetation cover, stabilize slopes, control water flow, improve visual aesthetics and minimize post-closure re-vegetation requirements.
There are three mine waste dumps at Malundwe, namely, Main, HR3, and West. The waste dumps at Chimiwungo are West, South-East and Tower Dumps (all permitted) and North- East Dump (awaiting permit subject to approval of ESIA submitted October 2013).
Test samples show that the material will be NAF and contain a relatively low number of environmentally significant enrichments. The leach testing indicated that copper, uranium and iron will leach from the ore at neutral pH. Any Uranium mineralized ore and waste will be stockpiled in a dedicated facility designed to reduce dust evolution, contact with water, whilst also designed to capture any contaminated water for re-use.
TAILINGS STORAGE FACILITY
Tailings are deposited into the TSF which is a purpose built facility downstream of the water storage facility and upstream of the Malundwe South pit. It involves deposition into the former Lumwana East River valley. The diversion channel diverts water around the tailings dam and Malundwe pit. There is considerable flexibility to adjust the design through the mine life to changing conditions.
| | |
| Barrick Gold Corporation – Lumwana Mine, | | Page 18 -2 |
| Technical Report NI 43 -101 – March 27, 2014 | |
Geochemical characterization studies of the copper tailings-solids and copper tailings slurry-water samples concluded that the copper tailings-solids samples are classified as NAF.
The physical properties of the copper tailings have been assessed by conducting geomechanical test-work carried out on two batches of tailings samples and from sampling of deposited tailings.
The TSF embankment has been constructed as a clay core rockfill structure, immediately upstream of the Malundwe South pit. Any risk of flow to the pit will be minimized through the placement of a significant width (>500 m) of waste rock between the pit and the TSF dam wall.
The current design capacity of the TSF is about 600 Mt at current beach angles. There are two construction lifts remaining to reach design capacity. The required TSF capacity for the current reserves and resources within designed pits is about 630 Mt, being approximately 93Mt placed with 537Mt remaining. There are several feasible options to place the surplus 30Mt. The feasible options include small embankment raises, separate smaller facility or backfilling of Malundwe. Preliminary work on the Malundwe option indicates 100-130Mt capacity potential for minimal construction cost. A final decision will not be made until the end of life as capacity of the TSF is largely dependent on the beach angles achieved across the width of the TSF.
The TSF has a large catchment which has, as far as practicable, been diverted around the facility and around the Malundwe pit. The remaining catchment results in significant rainfall being caught in the facility which results in the TSF being able to provide 70% of the process water over the life of the mine. Excess water does accumulate and will be used during the dry seasons. However, a gradual accumulation, particularly if the climatic conditions are wetter than normal, will result. Depending on the amount of water recycled, discharge is required at various times. Water monitoring shows that the quality is satisfactory and the excess can be discharged to the river system. This is a permitted activity.
| | |
| Barrick Gold Corporation – Lumwana Mine, | | Page 18 -3 |
| Technical Report NI 43 -101 – March 27, 2014 | |
19 MARKET STUDIES AND CONTRACTS
MARKETS
LUMWANA CONCENTRATES
The Malundwe concentrate (2008 to 2010) had high copper grades (> 40%) and was of great interest to the Zambian, Asian and European smelters for blending. These high grades of concentrates have declined since 2010 and are now around 28%-35%. The Chimiwungo concentrate (2012 onwards) has slightly lower copper grades (25% - 35%) compared to the Malundwe pit. Going forward from 2014 onwards, Lumwana will be producing concentrates mostly from the Chimiwungo pits.
Most international smelters today have to run a lower feed blend compared to historical numbers, as present sources of higher copper grade concentrates are declining. The current international concentrate grades are running at an average of 26%. Therefore the concentrates produced from the Chimiwungo pit are still of interest to international as well as the local Zambian smelters for blending.
The Zambian Government has implemented an export tax on copper concentrates for some years now, and that makes any exports of concentrates non viable. That forced Lumwana to market all concentrates to only local Zambian smelters. Current appetite in Zambia for the Lumwana concentrates is healthy, due to the good blending properties.
The indicative chemical specifications for the main elements of the Chimiwungo concentrates are:
| | | | | | |
Cu% | | | - | | | 25 - 35 |
S% | | | - | | | 24 - 31 |
Fe% | | | - | | | 20 - 27 |
SiO2% | | | - | | | 2 - 8 |
This distribution of elements proved to meet the long term feed specification of all the smelters Lumwana have supplied with concentrates.
| | |
| Barrick Gold Corporation – Lumwana Mine, | | Page 19 -1 |
| Technical Report NI 43 -101 – March 27, 2014 | |
CONTRACTS
Lumwana is a large modern operation and Barrick is a major international firm with policies and procedures for the letting of contracts. The contracts for smelting and refining are normal contracts for a large producer.
There are numerous contracts at the mine to provide services which augment Barrick’s efforts.
| | |
| Barrick Gold Corporation – Lumwana Mine, | | Page 19 -2 |
| Technical Report NI 43 -101 – March 27, 2014 | |
20 ENVIRONMENTAL STUDIES, PERMITTING, AND SOCIAL OR COMMUNITY IMPACT
ENVIRONMENTAL STUDIES
A number of environmental studies have been conducted at Lumwana Mine, including environmental baseline studies in 2003 and a full Environmental Impact Assessment (EIA) study for the development of the Lumwana Copper Project in 2005. Other EIAs conducted at Lumwana Mine include the Lumwana Estate EIA in 2006. The Lumwana Estate EIA was for the construction of residential infrastructure for all personnel, key contractors, and suppliers working at the Lumwana Copper Project.
Environmental management across the site is managed through the EMP (Environmental Management Plan). The EMP was reviewed in Q4 2013 to incorporate provisions from the Chimiwungo ESIA and also to align with current operating parameters. Compliance to the EMP commitments are assessed and reported on an annual basis. Key issues of note are discussed below from a monitoring perspective.
Water Quality Monitoring
Water quality monitoring is undertaken across the site with the aim of ensuring protection of the surface and ground waters of the project. With ongoing operations, most activities on site are largely benign.
For surface water, seasonal variations are evident in the surface water quality; with some exceedances noted in some months during the year. The occurrence of heavy metals is considered to be natural in this part of the region (this is evidenced when comparison is made with baseline data where by similar parameters were elevated even prior to any construction or mining activities); though it is appreciated that mining activities also have influence on the quality of surrounding surface water bodies due to sediment loads in the stream especially in the wet season. Concentrations of metals in the surface waters are highly variable, and are not strictly a function of the water chemistry; in circum-neutral, oxygenated waters, concentrations of many of these metals
| | |
| Barrick Gold Corporation – Lumwana Mine, | | Page 20 -1 |
| Technical Report NI 43 -101 – March 27, 2014 | |
that occur at elevated levels that will be almost entirely due to particulate matter, not dissolved metal concentrations. The data indicates that the majority of high metal concentrations occur in samples with high suspended sediment concentrations.
For groundwater, generally groundwater quality is within the water quality guidelines established on site. Some total metal concentrations are periodically elevated. It has been assumed that the elevated concentrations are associated with particulate matter in the water samples. Total metal concentrations measured show that metal concentrations vary with suspended solids content.
LMC has developed a site Water Management plan that is used as a tool for LMC to manage its water resources. The purpose and objective of the Water Management Plan is to provide a strategic framework for management of surface water, ground water, potable water and waste water across the mine site including Lumwana estate and the community. The plan strives to integrate all water resources issues and activities, and to identify improvements, goals or overlaps that will help LMC to effectively and efficiently manage its water resources.
Air Quality
Air quality in the area is generally good. However, seasonal variation in air quality does occur. Dust monitoring is carried across site using dust fall out buckets and Particulate Matter samplers.
Environmental Management Systems
Lumwana is working on implementing the ISO 14001 Environmental Management System. Lumwana Mining Company has developed and consolidated a comprehensive Environmental Obligations Register with obligations drawn from National legislation, licenses, approval conditions, audits, Barrick standards etc. This was recently reviewed in December 2013 to include provisions of the Environmental Management (Licensing) Regulations 2013. The register includes action plans and identifies responsible people identified to close out any non-compliances.
| | |
| Barrick Gold Corporation – Lumwana Mine, | | Page 20 -2 |
| Technical Report NI 43 -101 – March 27, 2014 | |
PROJECT PERMITTING
ENVIRONMENTAL OPERATING LICENCES AND PERMIT
Large Scale Mining License 49 (LML-49) granted under section 25 of the Mines and Minerals Act, 1995 was converted to six “daughter” MLs to conform to the provisions of the current Mines and Minerals Development Act No.7 of 2008.
The Mining Licenses are located within the upper reaches of the Kabompo River Basin, a tributary of the upper Zambezi River. Lumwana mining operations are located partly in degazzetted State Forest reserves, with some of the current mining on diverted river bed.
The mine operates within a framework of national environmental legislations that requires it to hold licenses and permits for its operations as per regulatory requirements. With the passing of the new Statutory Instrument, the Environmental Management (Licensing) Regulations 2013, applications for renewal of applicable permits and licenses have been submitted. A total of 46 licenses and permits are expected. Under the new regulations, these will be valid for 3 years. The licenses include those to discharge effluents, to own and operate waste disposal sites, to import and store various process chemicals, as well as a permit to discharge controlled emissions into the ambient air at location from the medical Incinerator.
SOCIAL AND COMMUNITY REQUIREMENTS
Responding to the social impacts and risk assessment findings, and in line with the Barrick community relations standard, LMC has a Social Management Plan (SMP) incorporating social impact management objectives and actions in the following aspects:
| • | | Influx management; Land use and settlement |
| | |
| Barrick Gold Corporation – Lumwana Mine, | | Page 20 -3 |
| Technical Report NI 43 -101 – March 27, 2014 | |
| • | | Social obligation management |
POPULATION, LAND AND RESETTLEMENT
A census of population in the immediate vicinity of the project area in May 2004 identified a population of about 4,800. A population estimate was derived from baseline reviews in 2012, with an estimate of 30 000+. As these villagers primarily live along the T5 Highway, not in the project area, no relocation was required during mine construction. Government has since approved an integrated development plan to guide future urbanization.
HEALTH AND HIV/AIDS
HIV/AIDS, malaria, and other diseases represent a threat to maintaining a skilled workforce in the mining industry in Zambia. The per capita incidence of HIV/AIDS has been estimated as being one of the highest in the world and as such, HIV/AIDS remains a major healthcare challenge faced by Barrick to ensure a skilled workforce is maintained. Allowances have been made to cover the costs associated with the health and training of the workforce.
HIV/AIDS is not just a public health problem, but a major developmental crisis with implications on the operations of mine. The company has been and will continue to implement an HIV/AIDS policy based on education and prevention, which will be communicated to all employees, including sub-contractors and the local communities in which the company operates.
Substantial progress has been made in sensitizing people on the pandemic. This has been made possible through the support provided by the company and its partners to the Lumwana Community Aids Task Force (LCATF) and the massive campaigns conducted during commemorative events such as VCT and World AIDS Days.
| | |
| Barrick Gold Corporation – Lumwana Mine, | | Page 20 -4 |
| Technical Report NI 43 -101 – March 27, 2014 | |
COMMUNITY SAFETY
Potential safety hazards include inadvertent access by the public into mine areas, movement of heavy equipment and vehicles, drowning in dams, blasting, electric shock, operating machinery and drinking mine effluent. Access into the mine area in search of water has continued especially with the numbers of people putting pressure on the available resources in the surrounding areas.
To mitigate these risks, LMC has continued to implement a community safety awareness programme and erect warning signage in potential hazard areas to safeguard local communities. Some of the actions being undertaken to compliment access restriction to operational areas only via a security gate include Road safety awareness which also includes anti trespass messaging. Fencing off of the greater project area is considered impractical because of its size and the propensity for fences to be stolen, as is the experience at other mine sites in Zambia. LMC has also been sinking water wells in the communities close to the mine as a way of mitigating the hazards of people going to draw water in the mine area.
COMMUNITY PROJECTS
Barrick demonstrates mutual benefit from the business through social and community projects being implemented within and around the Lumwana mine lease area. The projects are being carried out as part of implementation of the current Social management plan (SMP) contribution to the local community development plan. Barrick provides different forms of support towards the projects that include education improvement, health and infrastructure development, as well as women’s empowerment initiatives including production centres, microfinance/village banks, and literacy programs. The support is rendered through the Lumwana Development Trust Fund and other direct initiatives.
Most of the projects are undertaken in the chiefdoms surrounding the Lumwana Project and target local economic development intended for diversification of the Lumwana area. These include the Agrifood innovation, Wealth creation in the North-western province initiatives. Barrick also supports local small and medium enterprise incubation and local contractor development.
| | |
| Barrick Gold Corporation – Lumwana Mine, | | Page 20 -5 |
| Technical Report NI 43 -101 – March 27, 2014 | |
EMPLOYEE HOUSING
There is a housing estate to provide for its employees. The houses were built by Lumwana Property Development Company (LPDC), which is responsible for development and running the affairs of Lumwana Town including development of its commercial and retail facilities. There were 971 housing units built for both junior and senior members of staff at LMC. The houses are rented out to LMC employees.
LUMWANA TOWN INFRASTRUCTURE DEVELOPMENT
Two schools, a clinic, and a number of sports amenities have been built and are operational. A water treatment plant supplying potable water to Lumwana Estate and the mine has also been constructed. There is a network of roads and tracks to access mine facilities and Lumwana residential areas.
In June 2010, the Commerce, Trade and Industry Minister of the Republic of Zambia launched the Lumwana Multi-Facility Economic Zone (MFEZ) after granting the company a statutory instrument to operate the MFEZ within the Lumwana Town Development Area. The objective of the Lumwana MFEZ is to promote an expanded and sustainable employment base through industrial and economic development in the manufacturing sector near Lumwana Mine, and to ultimately enhance domestic and export oriented business activity through the provision of competitive environments that encourage investors to set up businesses with relative ease.
This is one of the initiatives to develop Lumwana Town into a modern and self-sustaining town. The land on which the town, including the MFEZ, is within the Lumwana Mine surface rights area.
| | |
| Barrick Gold Corporation – Lumwana Mine, | | Page 20 -6 |
| Technical Report NI 43 -101 – March 27, 2014 | |
INFLUX MANAGEMENT
With the population increase between the census and baseline studies done in 2005 and 2012 respectively, and presumably thereafter, an Influx Management Plan has been developed.
The Influx impacts include:
| • | | Majority of in-migrants settling in Manyama, either renting or constructing adobe-brick houses in existing villages located along T5 due to existence of settlements, access to water, market, transport and education |
| • | | Concentration of day-time and night-time economic activity in rapidly expanding market area |
| • | | Pressure on education and health services, water and sanitation |
| • | | Reduction in options for promoting systematic, orderly settlement and development |
The management options to compliment other stakeholder interventions include:
| • | | Facilitation of capacity building of Manyama Stakeholder forum to promote ownership, |
| • | | Identification and implementation of projects to help stakeholder forum process |
| • | | Community Relations staff presence in the information centres for effective communication |
| • | | MOU with Solwezi municipal council - LMC future participation in the stakeholder management board instituted by the Solwezi Municipal Council in accordance with the local government act. |
Barrick signed an MOU with the Solwezi Municipal Council that commits the two parties to develop a plan to facilitate the provision of services in the Manyama area. This MOU provides a broad basis for co-operation between the Council and Barrick to facilitate the development of a new Lumwana-Manyama town. The understanding is that an annual owner’s rate approved by the Rating Tribunal shall be paid annually to the Council for a
| | |
| Barrick Gold Corporation – Lumwana Mine, | | Page 20 -7 |
| Technical Report NI 43 -101 – March 27, 2014 | |
period of five years commencing from 2012-2017. Solwezi Municipal Council under the MOU endorses the need for a Development Plan for the area in that an agreed amount of the funds shall be utilized for the provision of public municipal services to the surrounding Manyama area. As this falls mostly within Barrick’s Large Mining Licenses, this assists Lumwana Project in the management of influx population in the area in line with existing laws.
LOCAL RECRUITMENT POLICY
LMC, through implementing the aspect of employment and conditions of service, has designed and implemented a local employment strategy aimed at maximizing recruitment of semi-skilled and unskilled labour from Solwezi and Lumwana areas, particularly from local communities around the mine lease area including the three surrounding Chiefdoms within the project area. The local employment strategy has been agreed upon with the surrounding local communities. A local registration database for potential semi-skilled and unskilled is kept by the relevant stakeholders at the mine and local communities. Approximately 5000 individuals were recruited and employed from the register of whom 50% continue to be in employment at the mine.
MINE CLOSURE REQUIREMENTS
Lumwana Mine has in place an EMP that outlines environmental management objectives for all its environmental aspects during all the project phases (construction, operations, and decommissioning and closure). The mine has developed a closure strategy and closure management plan for its mine components on-site excluding the Lumwana Estate. The plan includes decommissioning and closure management objectives for the mine site some of which are being implemented progressively. Closure criteria for all existing components of the mine have been developed as well. The plan, which is regularly reviewed in line with changing circumstances at the mine, is aimed at restoring the aspects of the mine site and facilities to alternative sustainable land uses through the progressive rehabilitation.
| | |
| Barrick Gold Corporation – Lumwana Mine, | | Page 20 -8 |
| Technical Report NI 43 -101 – March 27, 2014 | |
21 CAPITAL AND OPERATING COSTS
CAPITAL COST ESTIMATES
Current Life of Mine (LOM) capital costs for the Project are estimated to be US$2,196 million (Table 1-3). The major capital cost for the open pit will be for the mining area, which is estimated to be US$1,529 million, primarily to replace and rebuild mobile equipment. Sustaining capital for the process facilities is estimated to be US$196 million, which consist primarily of replacement capital, tailings pipelines and pumps, and TSF embankment raises. General and Administration (G&A) capital is projected to be US$249 million and closure costs are estimated to be US$223 million.
TABLE 21-1 CAPITAL COST ESTIMATE
Barrick Gold Corporation – Lumwana Mine
| | | | |
Cost Area | | Total
(US$ M) | |
Mining | | $ | 1,529 M | |
Processing | | $ | 196 M | |
G&A and other Infrastructure | | $ | 249 M | |
Closure | | $ | 223 M | |
| | | | |
Total | | $ | 2,196M | |
OPERATING COST ESTIMATES
Estimated copper project operating costs were developed for the Mine, Concentrator and Administration departments based on long term prices, including the associated infrastructure are summarized in Table 21-2. Short term costs may vary from the projected figures.
The overall operating costs include the following:
| • | | Mining operating costs; |
| • | | Concentrator operating costs; |
| • | | Off-site smelting and refining costs; |
| • | | Product costs including transportation, marketing, and insurance costs; and |
| | |
| Barrick Gold Corporation – Lumwana Mine, | | Page 21 -1 |
| Technical Report NI 43 -101 – March 27, 2014 | |
TABLE 21-2 OPERATING COST ESTIMATE
Barrick Gold Corporation – Lumwana Mine
| | | | | | | | | | | | | | |
Year | | Units | | 2013 Actual | | | 2014 Budget | | | LOM Average | |
Mining | | US$/t mined | | | 4.53 | | | | 3.87 | | | | 3.73 | |
| | | | |
Processing, Treatment and Selling Costs | | US$/t milled | | | 9.36 | | | | 9.68 | | | | 9.72 | |
| | | | |
G&A | | US$/t milled | | | 3.73 | | | | 3.46 | | | | 3.50 | |
| | | | |
Royalty | | % of Gross Revenue | | | 6.0 | | | | 6.0 | | | | 6.0 | |
| | |
| Barrick Gold Corporation – Lumwana Mine, | | Page 21 -2 |
| Technical Report NI 43 -101 – March 27, 2014 | |
22 ECONOMIC ANALYSIS
Under NI 43-101 rules, producing issuers may exclude the information required for Section 22 - Economic Analysis, on properties currently in production, unless the Technical Report includes a material expansion of current production. Barrick Lumwana is a producing issuer, the Lumwana mine is currently in production, and a material expansion is not being planned. An economic analysis of the Lumwana mine using the estimates presented in this report has been undertaken, and the authors confirm that the outcome is a positive cash flow that supports the statement of Mineral Reserves.
| | |
| Barrick Gold Corporation – Lumwana Mine, | | Page 22 -1 |
| Technical Report NI 43 -101 – March 27, 2014 | |
23 ADJACENT PROPERTIES
There are no mining operations immediately adjacent to the Lumwana Project.
| | |
| Barrick Gold Corporation – Lumwana Mine, | | Page 23-1 |
| Technical Report NI 43 -101 – March 27, 2014 | |
24 OTHER RELEVANT DATA AND INFORMATION
No additional information or explanation is necessary to make this Technical Report understandable and not misleading.
| | |
| Barrick Gold Corporation – Lumwana Mine, | | Page 24 -1 |
| Technical Report NI 43 -101 – March 27, 2014 | |
25 INTERPRETATION AND CONCLUSIONS
Based on the information contained herein and in the opinion of the Qualified Persons, the following conclusions can be made:
GEOLOGY AND MINERAL RESOURCES
| • | | The sampling, sample preparation, analyses, and sample security are appropriate for the style of mineralization and Mineral Resource estimation. |
| • | | The EOY2013 Mineral Resource estimates are completed to industry standards using reasonable and appropriate parameters and are acceptable for use in Mineral Reserve estimation. The resource estimates conform to NI 43-101. |
| • | | Mineral Resources are reported exclusive of Mineral Reserves and are estimated effective December 31, 2013. |
| • | | Measured plus Indicated Mineral Resources total 486.6 Mt, grading 0.50% Cu, containing 5,375.6 million pounds Cu. |
| • | | Inferred Mineral Resources total 0.5 Mt, grading 0.57% Cu, containing 5.8 million pounds Cu. |
MINING AND MINERAL RESERVES
| • | | Proven and Probable Mineral Reserves total 538.8 million tonnes grading 0.56% Cu containing 6,619.8 million pounds Cu. |
| • | | The Mineral Reserve estimates have been prepared utilizing acceptable estimation methodologies and the classification of Proven and Probable Reserves conform to CIM definitions and NI 43-101. |
| • | | Mine planning for the Lumwana open pit mine follows industry standards. |
| • | | Ore control procedures for the Lumwana open pit are well documented, and the ore control results have also been well documented. All records have been kept in good condition and are readily accessible. |
| • | | The methodology used by Lumwana for pit limit determination, cut-off grade optimization, production sequence and scheduling, and estimation of equipment/manpower requirements is in line with industry practice. |
| | |
| Barrick Gold Corporation – Lumwana Mine, | | Page 25 -1 |
| Technical Report NI 43 -101 – March 27, 2014 | |
MINERAL PROCESSING AND METALLURICAL TESTING
| • | | The metallurgical test-work is adequate to support the Project and that the recovery models are reasonable. |
| • | | The 2013 production data indicates that the estimated recovery compares favourably to the actual recovery and meets industry standards. |
| | |
| Barrick Gold Corporation – Lumwana Mine, | | Page 25 -2 |
| Technical Report NI 43 -101 – March 27, 2014 | |
26 RECOMMENDATIONS
MINING AND MINERAL RESERVES
| • | | More hydrogeological data should be gathered and be aimed at any practicable methods useful for reducing the groundwater pressure in the rock units. |
| • | | A road design effort be undertaken to address the soft road conditions encountered in the pit, especially for those areas near the working faces. |
MINERAL PROCESSING
| • | | Current studies to optimize recovery and concentrate grade should be continued. |
ENVIRONMENTAL STUDIES, PERMITTING, AND COMMUNITY IMPACT
| • | | Addendums to the approved EIS highlighting the changes in designs and locations and other relevant information have been prepared by the mine and submitted to ZEMA for review was approved in February 2014. The new conditions resulting from this need to be reviewed and any changes to current conditions need to be included in the Mine Plan and effects on Reserves considered. |
| | |
| Barrick Gold Corporation – Lumwana Mine, | | Page 26 -1 |
| Technical Report NI 43 -101 – March 27, 2014 | |
27 REFERENCES
Aker Kvaerner Australia Pty Ltd, 2003, Lumwana Bankable Feasibility Study – Volume 5 – Metallurgy and Test-work, October 2003.
Corpus Globe Advocates, 2004, Legal Due Diligence Report (Zambia) for Toronto Stock Exchange Listing, February 2004.
Corpus Globe Advocates, 2005, Corporate Status of the Zambian Subsidiaries of Equinox Minerals Limited, August 2005
Deloitte and Touche, 2005, Report on Zambian Taxes Applicable to Equinox Copper Ventures Limited, May 2005.
Equinox Minerals Limited, 2006, Lumwana Copper Project – Technical Report, October 2006.
Equinox Minerals Limited, 2009, Lumwana Copper Project – Technical Report, April 2009
Equinox Minerals Limited, 2010, Debottlenecking and Chimiwungo Development Projects 2010 Feasibility Study Report, December 2010.
Equinox Minerals Limited, 2011, 45 Mtpa Expansion Pre-Feasibility Study Report.
Equinox Minerals Limited, 2011, Lumwana Project, North West Province, Republic of Zambia – Technical Report, May 2011
Golder Associates, 2003, Lumwana Bankable Feasibility – Volume 3 – Geological Modelling and Resource Estimation, Golder Associates Pty Ltd, September 2003.
Golder Associates, 2003, Lumwana Bankable Feasibility – Volume 4 – Mining, Golder Associates Pty Ltd, September 2003.
Golder Associates, 2003, Lumwana Bankable Feasibility – Volume 6 – Plant Site Geotechnical Investigation, Golder Associates Pty Ltd, September 2003.
Golder Associates, 2003, Lumwana Bankable Feasibility – Volume 8 – Water and Waste Management, Golder Associates Pty Ltd, September 2003.
Golder Associates, 2003, Lumwana Bankable Feasibility – Volume 9 – Environmental, Golder Associates Pty Ltd, September 2003.
Golder Associates, 2005, Geological Modelling and Resource Estimation – Chimiwungo North – Lumwana Project, May 2005.
Golder Associates, 2009, Lumwana Malundwe Geological Modelling and Resource Update, September 2009
| | |
| Barrick Gold Corporation – Lumwana Mine, | | Page 27 -1 |
| Technical Report NI 43 -101 – March 27, 2014 | |
Golder Associates, 2011, Lumwana Malundwe Geological Modelling and Resource Update, April 2011
Golder Associates, 2011, Variography and Kriging Parameters for Chimiwungo’s Resource Estimation, July 2011
Government of the Republic of Zambia and Equinox Copper Ventures Limited, Draft Development Agreement for the Lumwana Copper Project, September 2005.
GRD Minproc Ltd, 2005, Lumwana Copper Project Operating Cost Estimate, October 2005
GRD Minproc Ltd, 2005, Lumwana Copper Project Scope Description and Estimate Basis, October 2005
GRD Minproc Ltd, 2005, Lumwana Copper Project Amended Technical Report, October 2005
J. Levin, A Proposal for the Determination of Grindability of Fine Materials, Mintek Report No.M177, Council for Mineral Technology
Knight Piésold, 2005, Lumwana Copper Project, Feasibility Study Update, Tailings Management, Raw Water Supply and River Diversion, PE301-00119/01, May 2005
Knight Piésold Pty Ltd, Lumwana Copper Project, Final Design, Tailings Management, Raw Water Supply, and River Diversion, November 2005
Knight Piésold Pty Ltd, Lumwana Copper Project, Geotechnical Investigation for Final Design, November 2005
Marsh, 2003, Lumwana Copper Project Equinox Resources Limited – Indicative Insurance Cost, August 2003
Neil S. Seldon and Associates Ltd, 2005, Copper Concentrates Marketing Prices Treatment Charges and Logistics Review for the Equinox Copper Ventures Limited Lumwana Project, May 2005
Neil S. Seldon and Associates Ltd, 2005, Lumwana Logistics Review Prepared for Equinox Copper Ventures Limited, July 2005
Neil S Seldon and Associates Ltd, 2006, Lumwana Project Copper and Smelter Charges Prepared for Equinox Minerals, June 2006
Orr, George and Associates, 2005, Lumwana Copper Project Republic of Zambia, Proposed Malundwe Preproduction Pit; Geotechnical Assessment for Mining Feasibility Study, May 2005
Orr, George and Associates, 2007, Lumwana Project Zambia, Malundwe and Chimiwungo Pits Summary of January 2007 Site Discussions, January 2007
| | |
| Barrick Gold Corporation – Lumwana Mine, | | Page 27 -2 |
Technical Report NI 43 -101 – March 27, 2014 | |
Orr, George and Associates, 2010, Lumwana Project Zambia Malundwe Stage 1E and Starter Pits Proposed Malundwe Stage 4N Pit and Proposed Chimiwungo Pit; Summary Geotechnical Report on March 2010 Site Visit, April 2010
Orr, George and Associates, 2010, Lumwana Project Zambia Malundwe Starter Pit Backfill Analysis and Stage 3E Pit Backanalysis Results, April 2010
| | |
| Barrick Gold Corporation – Lumwana Mine, | | Page 27 -3 |
| Technical Report NI 43 -101 – March 27, 2014 | |
28 DATE AND SIGNATURE PAGE
This report titled “Technical Report on the Lumwana Mine, North-Western Province, Republic of Zambia” and dated March 27, 2014, was prepared and signed by the following authors:
| | | | |
| | | | (Signed & Sealed) “Benjamin Sanfurgo” |
| | |
| Dated at Toronto, ON | | | | Benjamin Sanfurgo |
| March 27, 2014 | | | | Senior Manager Reserves and Resources |
| | |
| | | | (Signed & Sealed) “David Londono” |
| | |
| Dated at Lumwana, Zambia | | | | David Londono |
| March 27, 2014 | | | | Senior Manager Mining |
| | |
| Barrick Gold Corporation – Lumwana Mine, | | Page 28 -1 |
Technical Report NI 43 -101 – March 27, 2014 | |
29 CERTIFICATE OF QUALIFIED PERSON
BENJAMIN SANFURGO
I, Benjamin Sanfurgo as an author of this report entitled “Technical Report on the Lumwana Mine, North-Western Province, Republic of Zambia” prepared for Barrick Gold Corporation and dated March 27, 2014, do hereby certify that:
| 1. | I am Senior Manager Reserves and Resources for Barrick Gold Corporation of Suite 3700, 161 Bay St, Toronto, ON, M5J 2S1. |
| 2. | I am a graduate of the Universidad de Chile 1996 Degree in Geology |
| 3. | I am registered as Personas Competentes en Recursos y Reservas Mineras # 68 (Comisión Minera, Chile). I have worked as a geologist for a more than 18 years since my graduation. My relevant experience for the purpose of the Technical Report is: |
| | • | | Mineral Resource and Reserve estimation, feasibility studies, due diligence, corporate review and audit on exploration projects and mining operations world wide |
| | • | | Previous Technical Reports at gold and copper mining operations and advanced projects in South America |
| 4. | I have read the definition of “qualified person” set out in National Instrument 43-101 (NI 43-101) and certify that by reason of my education, affiliation with a professional association (as defined in NI 43-101) and past relevant work experience, I fulfill the requirements to be a “qualified person” for the purposes of NI 43-101. |
| 5. | I visited the Lumwana Mine in January 2014 |
| 6. | I am responsible for Items 3, 4, 5, 6, 7, 8, 9, 10, 11, 12, 14, 23, and parts of Items 1, 2, 25, 26, and 27 of the Technical Report that refer to the Lumwana open pit mine project. |
| 7. | I am not independent of the Issuer applying the test set out in Section 1.5 of NI 43-101. |
| 8. | I have been involved in Lumwana mine from July 2012. |
| 9. | I have read NI 43-101, and the Technical Report has been prepared in compliance with NI 43-101 and Form 43-101F1. |
| 10. | As of the effective date of this Technical Report, to the best of my knowledge, information, and belief, the Technical Report contains all scientific and technical information that is required to be disclosed to make the technical report not misleading. |
| | |
| Barrick Gold Corporation – Lumwana Mine, | | Page 29 -1 |
| Technical Report NI 43 -101 – March 27, 2014 | |
Dated this 27th day of March, 2014
|
| (Signed & Sealed) “Benjamin Sanfurgo” |
|
| Benjamin Sanfurgo |
| | |
| Barrick Gold Corporation – Lumwana Mine, | | Page 29 -2 |
| Technical Report NI 43 -101 – March 27, 2014 | |
DAVID LONDONO
I, David Londono, as an author of this report entitled “Technical Report on the Lumwana Mine, North-Western Province, Republic of Zambia” prepared for Barrick Gold Corporation and dated March 27, 2014, do hereby certify that:
| 1. | I am Senior Manager Mining at Barrick Lumwana Mine at Mwinilunga Rd, Solwezi, North Western Province, Zambia. |
| 2. | I am a graduate of the Colorado School of Mines with a Masters in Mining Engineering, and from Universidad Nacional de Colombia with Bachelor of Mining engineering. |
| 3. | I am registered as a Mining Engineer with the Society of Mining Engineers (Member # 4038617R). I have worked as a mining engineer for a more than 30 years since my graduation. My relevant experience for the purpose of the Technical Report is: |
| | • | | Feasibility studies, due diligence, corporate review and audit for mining operations in North America, South America and Africa. |
| | • | | Various mine engineering positions in North America, South America, Africa and Asia. |
| 4. | I have read the definition of “qualified person” set out in National Instrument 43-101 (NI 43-101) and certify that by reason of my education, affiliation with a professional association (as defined in NI 43-101) and past relevant work experience, I fulfill the requirements to be a “qualified person” for the purposes of NI 43-101. |
| 5. | I have been employed at Lumwana Mine since November 2012. |
| 6. | I am responsible for sections 13, 15, 16, 17, 18, 19, 20, 21, and 22 and parts of sections 1, 2, 25, 26, and 27 of the Technical Report that refer to the Lumwana open pit mine project. |
| 7. | I am not independent of the Issuer applying the test set out in Section 1.5 of NI 43-101. |
| 8. | I have read NI 43-101, and the Technical Report has been prepared in compliance with NI 43-101 and Form 43-101F1. |
| 9. | As of the effective date of this Technical Report, to the best of my knowledge, information, and belief, the Technical Report contains all scientific and technical information that is required to be disclosed to make the technical report not misleading. |
| | |
| Barrick Gold Corporation – Lumwana Mine, | | Page 29 -3 |
| Technical Report NI 43 -101 – March 27, 2014 | |
Dated this 27th day of March, 2014
|
| (Signed & Sealed) “David Londono” |
|
| David Londono |
| | |
| Barrick Gold Corporation – Lumwana Mine, | | Page 29 -4 |
| Technical Report NI 43 -101 – March 27, 2014 | |