Exhibit 99.1

THIRD QUARTER REPORT 2014
Barrick Reports Third Quarter 2014 Results
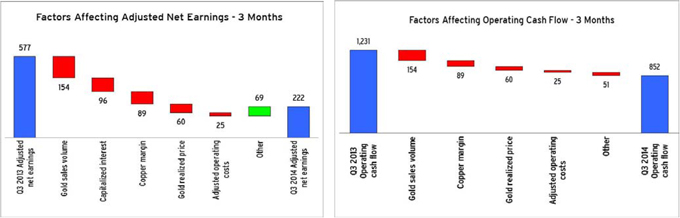
TORONTO, October 29, 2014 – Barrick Gold Corporation (NYSE: ABX, TSX: ABX) (Barrick or the company) today reported third quarter net earnings of $125 million ($0.11 per share). Adjusted net earnings were $222 million ($0.19 per share). Operating cash flow was $852 million. The company reported strong quarterly results with solid production and lower than expected costs which drove the second reduction to annual all-in sustaining cost guidance this year.
OPERATING HIGHLIGHTS AND GUIDANCE
| | | | | | | | | | | | |
| | | Third Quarter | | | Revised | | | Previous | |
| Gold | | 2014 | | | 2014 Guidance | | | 2014 Guidance | |
| | | |
Production (000s of ounces) | | | 1,649 | | | | 6,100-6,400 | | | | 6,000-6,500 | |
| | | |
All-in sustaining costs ($ per ounce) | | | 834 | | | | 880-920 | | | | 900-940 | |
| | | |
Adjusted operating costs ($ per ounce) | | | 589 | | | | | | | | 580-630 | |
| | | |
Copper | | | | | | | | | | | | |
| | | |
Production (millions of pounds) | | | 131 | | | | 440-460 | | | | 410-440 | |
| | | |
C1 cash costs ($ per pound) | | | 1.82 | | | | 1.90-2.00 | | | | 1.90-2.10 | |
| | | |
Total Capital Expenditures ($ millions) | | | 604 | | | | | | | | 2,200-2,500 | |
“We are pleased to report another quarter of strong operating results, underpinned by a disciplined business model that prioritizes shareholder returns,” said Kelvin Dushnisky, Co-President of Barrick. “We are focused on the best assets in the best regions, where we see the most potential to create value for shareholders, areas where we have already established distinctive geological and technical knowledge and strong partnerships. We will only invest in mines and development opportunities that can generate strong returns and free cash flow through commodity cycles. This is reflected in the priorities we have defined for Barrick.”
“Operational excellence remains a top priority for Barrick. Our performance in the third quarter reflects the quality of our mines and our people,” said Jim Gowans, Co-President of Barrick. “Our operating teams continue their relentless efforts to improve performance and cut costs. As a result, we were able to reduce annual cost guidance for the second time this year.”
| | | | |
BARRICK THIRD QUARTER 2014 | | 1 | | PRESS RELEASE |
COMPANY PRIORITIES
This has been a year of transition for the leadership of Barrick. On April 30, 2014, John L. Thornton assumed the Chairman role and the Board of Directors was strengthened through the addition of four new independent directors. On July 16, 2014, the company announced a new executive management structure, including the appointment of Kelvin Dushnisky and Jim Gowans as Co-Presidents, to seamlessly drive the business and execute on Barrick’s priorities. Since that time, two more independent directors have joined the Board of Directors and there have been additional changes to strengthen the executive team.
These changes have rejuvenated the leadership of Barrick and are directed at one overriding objective - to make Barrick the investment of choice among gold producers.
To achieve this objective, the company is focused on the following priorities to drive shareholder value:
| | Ÿ | | Operational Excellence – Excel in all areas of the company, including delivering the full potential of its mines and resources. Put the best people in key roles and enable them to deliver. |
| | Ÿ | | Best Assets and Regions – Focus on assets with the most potential in core regions. |
| | Ÿ | | Strong Partnerships – Establish deep relationships with key stakeholders such as governments, suppliers, and local communities for performance and growth. |
| | Ÿ | | Financial Flexibility – Restore the balance sheet to a position of strength. |
| | Ÿ | | Focus on Returns – Improve free cash flow generation and shareholder returns through operating efficiencies and profitable growth, including the prioritization of near mine opportunities. All investments must meet return on investment thresholds. |
FINANCIAL HIGHLIGHTS
Third quarter 2014 adjusted net earnings were $222 million ($0.19 per share)1 compared to $577 million ($0.58 per share) in the prior year period. The decrease was primarily due to lower gold and copper sales volumes and lower realized gold and copper prices, partially offset by lower cost of sales applicable to gold and copper. Net earnings for the third quarter were $125 million ($0.11 per share) compared to net earnings of $172 million ($0.17 per share) in the prior year quarter. Significant adjusting items for the quarter include:
| | Ÿ | | $51 million in unrealized losses on non-hedge derivative instruments; and |
| | Ÿ | | $42 million in unrealized foreign currency translation losses. |
Third quarter operating cash flow of $852 million compares to $1.2 billion in the prior year period. The decrease in operating cash flow primarily reflects lower sales volumes and lower gross margins, partially offset by a decrease in income tax payments.
1 Adjusted net earnings and adjusted net earnings per share are non-GAAP financial performance measures with no standardized definition under IFRS. See pages 46-51 of Barrick’s Third Quarter 2014 Report.
| | | | |
BARRICK THIRD QUARTER 2014 | | 2 | | PRESS RELEASE |
FINANCIAL FLEXIBILITY
Barrick is committed to restoring its balance sheet to a position of strength. Maintaining financial flexibility will be a key driver of the company’s future strategic direction. Barrick’s strong underlying business underpins its liquidity. The company’s five cornerstone mines produced 1.0 million ounces of gold at average all-in sustaining costs (AISC) of $696 per ounce2 in the third quarter. These mines are anticipated to contribute about 60 percent of production in 2014 at average AISC of $730-$780 per ounce, maintaining Barrick’s position in the first quartile of the industry cost curve.
The company has a modest debt repayment schedule over the next three years with approximately $200 million maturing by the end of 2015 and less than $1.0 billion due by the end of 2017. Including the company’s $4.0 billion undrawn credit facility and $2.7 billion of cash3, Barrick had significant liquidity at the end of the third quarter.
GOLDRUSH AND OTHER OPPORTUNITIES IN NEVADA
The company is concentrating its efforts on the best regions where it has a competitive advantage. Barrick will accelerate the identification and advancement of profitable growth opportunities in these core regions. A regional strategy allows the company to leverage its competitive strengths, which include deep geological and technical expertise as well as strong local relationships. This will help identify the best prospects first and permit them as efficiently as possible, translating into less time to production.
Opportunities at or near existing operations will be the first priority, minimizing risk and maximizing return on invested capital. Accordingly, the company continues to focus its exploration and growth efforts on Nevada. It is among the regions of the world with the best geological potential for gold, has a well-established mining industry, and an area where Barrick has strong relationships with key stakeholders and a proven track record of success. Approximately 50 percent of Barrick’s 2014 exploration budget4 is allocated to Nevada, with a large majority allocated to advance Goldrush, the only significant greenfield discovery by a major gold producer in the past five years. Beyond Goldrush, Barrick has several other growth opportunities and projects in Nevada with the potential to meet company risk-adjusted return hurdles.
The Goldrush project, located about six kilometers from the Cortez mine, is progressing through a prefeasibility study which remains on schedule for completion in mid-2015. Infill drilling continues to demonstrate continuity of high grades. A number of development options are under consideration, including underground mining or a combination of both underground and open pit mining. The company is increasingly certain that there will be an underground mining component. Barrick submitted a permit application for twin exploration declines in the second quarter. The declines will help to better define the existing resource and allow the company to test for additional mineralization beyond the northern end of the deposit.
2 All-in sustaining costs per ounce is a non-GAAP financial performance measure with no standardized definition under IFRS. See pages 46-51 of Barrick’s Third Quarter 2014 Report.
3 Includes $557 million held at African Barrick Gold and Pueblo Viejo, which may not be readily deployed outside of African Barrick Gold and Pueblo Viejo.
4 Barrick’s exploration programs are designed and conducted under the supervision of Robert Krcmarov, Senior Vice President, Global Exploration of Barrick.
| | | | |
BARRICK THIRD QUARTER 2014 | | 3 | | PRESS RELEASE |
Turquoise Ridge contains over 5.0 million ounces (75 percent basis) in reserves at an average grade of 17.3 grams per tonne5, and is the highest reserve grade deposit in the company’s operating portfolio. Barrick believes Turquoise Ridge has the potential to become another core mine. The operation is currently restricted by haulage and ventilation constraints. One option being considered is an additional shaft which could increase production by up to 75 percent for five to eight years. Drilling of the northern extension of the deposit is exceeding expectations, and is supporting a prefeasibility study on the shaft scenario which is expected to be completed in early 2015.
At Cortez, the Lower Zone is characterized by strong and continuous ore zones. A prefeasibility study to evaluate deeper mining below the currently permitted level is expected to be completed by late 2015. Below this level, the Lower Zone is mostly oxide and higher grade than the zones above. Drilling has yet to determine the limits of the Lower Zone and recent drilling results have met or exceeded expectations. Based on these results, the Lower Zone exploration drift will be extended another 500 feet to the south in early 2015 to enable further step-out drilling.
The Spring Valley project, 70 percent owned by Barrick and approximately 60 miles west of Cortez, continues to advance through a prefeasibility study which is on track for completion in late 2015. This is a low capital cost, heap leach project with the potential to become a standalone mine. Barrick expects to report an initial resource estimate with its 2014 year-end results.
OPERATING HIGHLIGHTS
Cortez
The Cortez mine produced 273 thousand ounces at AISC of $589 per ounce in the third quarter. Production in 2014 is expected to be 880-920 thousand ounces, below previous guidance of 925-975 thousand ounces. This is primarily due to negative grade reconciliations which impacted production in the first half of 2014. AISC guidance remains at the high end of the $750-$780 per ounce range. In 2015, production is expected to be below one million ounces due to the sequencing and mining of ore and waste phases.
Goldstrike
Goldstrike produced 239 thousand ounces in the third quarter at AISC of $921 per ounce. Production benefited from higher processed grades. AISC were better than expected due to lower processing costs, mainly as a result of processing less acidic ore and lower sustaining capital. Modifications to the autoclave facility for the thiosulfate project are almost complete and will enable Goldstrike to accelerate the cash flow from about 4.0 million stockpiled ounces through the addition of a patented thiosulfate process. This is expected to contribute an average of 350-450 thousand ounces of annual production at similar AISC to the overall operation in the first full five years. First production is on track for the fourth quarter of 2014 at a total capital cost of approximately $620 million. Lower production is expected in the fourth quarter in part from an autoclave shutdown to facilitate start-up of the thiosulfate project and also from expected lower grades as stripping begins for the next phase
5 Turquoise Ridge reserve grade is 0.505 ounces per ton as of December 31, 2013. For a breakdown of reserves and resources by category and additional information relating to reserves and resources, see pages 27-37 of Barrick’s 2013 Form 40-F.
| | | | |
BARRICK THIRD QUARTER 2014 | | 4 | | PRESS RELEASE |
of the open pit. Production at Goldstrike in 2014 is expected to be 865-915 thousand ounces and AISC guidance has been reduced to $870-$900 per ounce as a result of lower lime consumption at the roaster. In 2015, production is expected to exceed 1.0 million ounces6 with contributions from the thiosulfate process.
Pueblo Viejo
Barrick’s 60 percent share of production from Pueblo Viejo in the third quarter was 168 thousand ounces at AISC of $551 per ounce. Production and recoveries were impacted by planned autoclave shutdowns for maintenance. Fourth quarter production is expected to benefit from higher grade ore. The copper circuit is in the commissioning phase and copper shipments are expected to commence in the first quarter of 2015. Production in 2014 is expected to be 600-700 thousand ounces at AISC of $510-$610 per ounce.
Lagunas Norte
Lagunas Norte produced 157 thousand ounces at AISC of $554 per ounce in the third quarter. Production was higher in the third quarter due to processing higher grade material and a faster leach cycle from stacking ore on the new area of the leach pad. Fourth quarter production is expected to benefit from higher grades. Production in 2014 is anticipated to be 570-610 thousand ounces and AISC guidance has been reduced to $590-$620 per ounce.
Veladero
The Veladero mine produced 178 thousand ounces at AISC of $822 per ounce in the third quarter. Production benefited from higher grades on positive grade reconciliations. This trend is expected to continue into the fourth quarter. Production guidance in 2014 has been increased to 680-720 thousand ounces and AISC guidance has been reduced to $890-$920 per ounce.
North America Portfolio
Barrick’s other North American mines consist of Bald Mountain, Round Mountain, Turquoise Ridge, Golden Sunlight, Ruby Hill and Hemlo. This segment produced 213 thousand ounces in the third quarter at AISC of $980 per ounce. In 2014, production is now expected to be at the high end of the 795-845 thousand ounce range and AISC guidance has been reduced to $980-$1,000 per ounce.
Australia Pacific
Australia Pacific produced 292 thousand ounces at AISC of $855 per ounce in the third quarter. The Porgera mine contributed 137 thousand ounces at AISC of $928 per ounce and benefited from higher throughput and grades. Production guidance in 2014 has been increased to 1,050-1,125 thousand ounces and AISC guidance has been reduced to $885-$910 per ounce.
6 Actual results will vary depending on how the ramp-up of the thiosulfate project progresses.
| | | | |
BARRICK THIRD QUARTER 2014 | | 5 | | PRESS RELEASE |
African Barrick Gold (ABG)
Third quarter attributable production from ABG was 122 thousand ounces at AISC of $1,098 per ounce. Barrick’s share of 2014 production from ABG is anticipated to be above the high end of the 430-460 thousand ounce range and AISC at the low end of the $1,100-$1,175 per ounce range.
Global Copper
Copper production in the third quarter was 131 million pounds at C1 cash costs of $1.82 per pound7. Copper production guidance for 2014 has been increased to 440-460 million pounds and C1 cash costs have been narrowed to $1.90-$2.00 per pound, primarily due to an earlier than expected re-start of operations at Lumwana in July.
Lumwana contributed 75 million pounds at C1 cash costs of $1.84 per pound. Subsequent to quarter end, the Zambian government proposed changes to the country’s mining tax regime that would replace the current corporate income tax and variable profit tax with a 20 percent royalty, which, if approved, would take effect on January 1, 2015. The application of a 20 percent royalty rate compared to the 6 percent royalty the company is currently paying would challenge the economic viability of the mine.
The Zaldívar mine produced 56 million pounds in the third quarter at C1 cash costs of $1.79 per pound. The mine continues to be a steady generator of free cash flow.
In July, Barrick reached an agreement to form a joint venture with Saudi Arabian Mining Company (Ma’aden) to operate the Jabal Sayid copper mine. The transaction is expected to close in the fourth quarter of 2014. First shipments of concentrate are expected in early 2016. Once the mine reaches full production, the average annual output will be 100 million pounds per year, with the potential to increase to 130 million pounds, at first quartile C1 cash costs.
PASCUA-LAMA PROJECT
The project is currently on care and maintenance. A decision to re-start development will depend on improved economics and more certainty regarding legal and permitting matters. Barrick is in the final stages of preliminary engineering for the permanent water management system and is discussing the permitting requirements necessary to obtain approval for construction with Chilean regulators. The company is making progress on establishing a constructive dialogue with a group of 15 Diaguita indigenous communities and associations in Chile’s Huasco province through a Memorandum of Understanding (MoU). Under the MoU, Barrick is providing these groups with technical and environmental information on Pascua-Lama along with financial resources and materials to facilitate their analysis of the information.
Barrick continues to explore opportunities to improve the project’s risk-adjusted returns, including engineering optimization, strategic partnerships or royalty and other income streaming agreements.
7 C1 cash costs per pound is a non-GAAP financial
performance measure with no standardized definition under IFRS. See pages 46-51 of Barrick’s Third Quarter 2014 Report.
| | | | |
BARRICK THIRD QUARTER 2014 | | 6 | | PRESS RELEASE |
APPENDIX –2014 Operating and Financial Guidance
OPERATING GUIDANCE
| | | | | | | | |
| | | Current | | Previous |
| Gold | | Production
(000’s of ounces) | | AISC ($ per ounce) | | Production
(000’s of ounces) | | AISC ($ per ounce) |
Cortez | | 880-920 | | 750-780 (high end) | | 925-975 (low end) | | 750-780 (high end) |
Goldstrike | | 865-915 | | 870-900 | | 865-915 (high end) | | 920-950 (low end) |
Pueblo Viejo (60%) | | 600-700 | | 510-610 | | 600-700 | | 510-610 (high end) |
Lagunas Norte | | 570-610 | | 590-620 | | 570-610 (high end) | | 640-680 (low end) |
Veladero | | 680-720 | | 890-920 | | 650-700 (high end) | | 940-990 (low end) |
| | | 3,700-3,900 | | 730-780 | | 3,800-4,000 | | 750-800 |
North America Portfolio | | 795-845 (high end) | | 980-1,000 | | 795-845 | | 1,075-1,100 (low end) |
Australia Pacific | | 1,050-1,125 | | 885-910 | | 1,000-1,080 (high end) | | 1,050-1,100 (low end) |
African Barrick Gold | | 430-460 (above high end) | | 1,100-1,175 (low end) | | 430-460 (above high end) | | 1,100-1,175 (low end) |
Total Gold | | 6,100-6,400 | | 880-920 | | 6,000-6,500 | | 900-940 |
| | | | |
| Copper | | Production | | C1 cash costs | | Production | | C1 cash costs |
| | | (millions of pounds) | | ($ per pound) | | (millions of pounds) | | ($ per pound) |
Total Copper | | 440-460 | | 1.90-2.00 | | 410-440 | | 1.90-2.10 |
| | | |
FINANCIAL GUIDANCE | | | | | | |
| | | Current ($ millions) | | Previous ($ millions) | | | | |
G&A | | 380-400 | | 380-400 | | | | |
Other expense | | 475-525 | | 475-525 | | | | |
Finance costs | | 800-825 | | 800-825 | | | | |
Exploration & evaluation | | 200-240 | | 200-240 | | | | |
Capital expenditure | | | | | | | | |
Mine site sustaining | | 1,800-2,000 | | 1,800-2,000 | | | | |
Mine site expansion | | 300-375 | | 300-375 | | | | |
Projects | | 100-125 | | 100-125 | | | | |
Total capex | | 2,200-2,500 | | 2,200-2,500 | | | | |
Effective income tax rate | | ~50% | | ~50% | | | | |
| | | | |
BARRICK THIRD QUARTER 2014 | | 7 | | PRESS RELEASE |
Key Statistics
Barrick Gold Corporation
| | | | | | | | | | | | | | | | | | | | |
| (in United States dollars) | | Three months ended September 30 | | | | | | Nine months ended September 30 | |
| | | 2014 | | | 2013 | | | | | | 2014 | | | 2013 | |
Operating Results | | | | | | | | | | | | | | | | | | | | |
Gold production (thousands of ounces)1 | | | 1,649 | | | | 1,845 | | | | | | | | 4,722 | | | | 5,453 | |
Gold sold (thousands of ounces)1 | | | 1,578 | | | | 1,783 | | | | | | | | 4,712 | | | | 5,345 | |
Per ounce data | | | | | | | | | | | | | | | | | | | | |
Average spot gold price | | $ | 1,282 | | | $ | 1,326 | | | | | | | $ | 1,288 | | | $ | 1,456 | |
Average realized gold price2 | | | 1,285 | | | | 1,323 | | | | | | | | 1,286 | | | | 1,453 | |
Adjusted operating costs2 | | | 589 | | | | 573 | | | | | | | | 588 | | | | 564 | |
All-in sustaining costs2 | | | 834 | | | | 914 | | | | | | | | 844 | | | | 919 | |
All-in costs2 | | | 975 | | | | 1,182 | | | | | | | | 951 | | | | 1,269 | |
Adjusted operating costs (on a co-product basis)2 | | | 607 | | | | 593 | | | | | | | | 609 | | | | 588 | |
All-in sustaining costs (on a co-product basis)2 | | | 852 | | | | 934 | | | | | | | | 865 | | | | 943 | |
All-in costs (on a co-product basis)2 | | | 993 | | | | 1,202 | | | | | | | | 972 | | | | 1,293 | |
Copper production (millions of pounds) | | | 131 | | | | 139 | | | | | | | | 302 | | | | 400 | |
Copper sold (millions of pounds) | | | 112 | | | | 135 | | | | | | | | 296 | | | | 385 | |
Per pound data | | | | | | | | | | | | | | | | | | | | |
Average spot copper price | | $ | 3.17 | | | $ | 3.21 | | | | | | | $ | 3.15 | | | $ | 3.35 | |
Average realized copper price2 | | | 3.09 | | | | 3.40 | | | | | | | | 3.08 | | | | 3.41 | |
C1 cash costs2 | | | 1.82 | | | | 1.69 | | | | | | | | 1.98 | | | | 1.94 | |
Depreciation3 | | | 0.44 | | | | 0.29 | | | | | | | | 0.40 | | | | 0.36 | |
Other4 | | | 0.10 | | | | 0.17 | | | | | | | | 0.12 | | | | 0.15 | |
C3 fully allocated costs2 | | | 2.36 | | | | 2.15 | | | | | | | | 2.50 | | | | 2.45 | |
Financial Results(millions) | | | | | | | | | | | | | | | | | | | | |
Revenues | | $ | 2,598 | | | $ | 2,985 | | | | | | | $ | 7,662 | | | $ | 9,585 | |
Net earnings (loss)5 | | | 125 | | | | 172 | | | | | | | | (56 | ) | | | (7,536 | ) |
Adjusted net earnings2 | | | 222 | | | | 577 | | | | | | | | 619 | | | | 2,163 | |
Operating cash flow | | | 852 | | | | 1,231 | | | | | | | | 1,925 | | | | 3,223 | |
Adjusted operating cash flow2 | | | 852 | | | | 1,300 | | | | | | | | 1,925 | | | | 3,274 | |
Per Share Data (dollars) | | | | | | | | | | | | | | | | | | | | |
Net earnings (loss) (basic) | | | 0.11 | | | | 0.17 | | | | | | | | (0.05 | ) | | | (7.53 | ) |
Adjusted net earnings (basic)2 | | | 0.19 | | | | 0.58 | | | | | | | | 0.53 | | | | 2.16 | |
Net earnings (loss) (diluted) | | | 0.11 | | | | 0.17 | | | | | | | | (0.05 | ) | | | (7.53 | ) |
Weighted average basic common shares (millions) | | | 1,165 | | | | 1,001 | | | | | | | | 1,165 | | | | 1,001 | |
Weighted average diluted common shares (millions)6 | | | 1,165 | | | | 1,001 | | | | | | | | 1,165 | | | | 1,001 | |
| | | | | | | | | | | | As at September 30, | | | As at December 31, | |
| | | | | | | | | | | | 2014 | | | 2013 | |
Financial Position(millions) | | | | | | | | | | | | | | | | | | | | |
Cash and equivalents | | | | | | | | | | | | | | $ | 2,705 | | | $ | 2,404 | |
Non-cash working capital | | | | | | | | | | | | | | | 3,341 | | | | 3,060 | |
| 1 | Production includes African Barrick Gold (“ABG”) on a 73.9% basis until February 28, 2014 and a 63.9% basis thereafter and Pueblo Viejo on a 60% basis, both of which reflect our equity share of production. Also includes production from Yilgarn South up to September 30, 2013, Plutonic up to January 31, 2014, Kanowna up to March 1, 2014 and Marigold up to April 4, 2014, the effective dates of sale of these assets. Sales include our equity share of gold sales from ABG and Pueblo Viejo. |
| 2 | Realized price, adjusted operating costs, all-in sustaining costs, all-in costs, adjusted operating costs (on a co-product basis), all-in sustaining costs (on a co-product basis), all-in costs (on a co-product basis), C1 cash costs, C3 fully allocated costs, adjusted net earnings and adjusted operating cash flow are non-gaap financial performance measures with no standard definition under IFRS. Refer to the Non-GAAP Financial Performance Measures section of the Company’s MD&A. |
| 3 | Represents equity depreciation expense divided by equity pounds of copper sold. |
| 4 | For a breakdown, see reconciliation of cost of sales to C1 cash costs and C3 fully allocated costs per pound in the Non-GAAP Financial Performance Measures section of the Company’s MD&A. |
| 5 | Net earnings (loss) represents net earnings (loss) attributable to the equity holders of the Company. |
| 6 | Fully diluted includes dilutive effect of stock options. |
| | | | |
BARRICK THIRD QUARTER 2014 | | 8 | | SUMMARY INFORMATION |
Production and Cost Summary
| | | | | | | | | | | | | | | | | | | | | | | | | | | | | | | | | | | | | | |
| | | Gold Production (attributable ounces) (000’s) | | | | | All-in sustaining costs5($/oz) | |
| | | Three months ended | | | | | Nine months ended | | | | | Three months ended | | | | | Nine months ended | |
| | | September 30, | | | | | September 30, | | | | | September 30, | | | | | September 30, | |
| | | 2014 | | | 2013 | | | | | 2014 | | | 2013 | | | | | 2014 | | | 2013 | | | | | 2014 | | | 2013 | |
Gold | | | | | | | | | | | | | | | | | | | | | | | | | | | | | | | | | | | | | | |
Goldstrike | | | 239 | | | | 233 | | | | | | 715 | | | | 650 | | | | | $ | 921 | | | $ | 874 | | | | | $ | 846 | | | $ | 955 | |
Cortez | | | 273 | | | | 333 | | | | | | 717 | | | | 1,093 | | | | | | 589 | | | | 470 | | | | | | 663 | | | | 416 | |
Pueblo Viejo | | | 168 | | | | 113 | | | | | | 488 | | | | 331 | | | | | | 551 | | | | 770 | | | | | | 575 | | | | 743 | |
Lagunas Norte | | | 157 | | | | 136 | | | | | | 406 | | | | 412 | | | | | | 554 | | | | 696 | | | | | | 552 | | | | 633 | |
Veladero | | | 178 | | | | 154 | | | | | | 525 | | | | 499 | | | | | | 822 | | | | 874 | | | | | | 786 | | | | 785 | |
North America Portfolio1 | | | 213 | | | | 222 | | | | | | 641 | | | | 627 | | | | | | 980 | | | | 1,246 | | | | | | 967 | | | | 1,250 | |
Australia Pacific2 | | | 292 | | | | 497 | | | | | | 865 | | | | 1,409 | | | | | | 855 | | | | 920 | | | | | | 851 | | | | 1,001 | |
African Barrick Gold3 | | | 122 | | | | 122 | | | | | | 354 | | | | 352 | | | | | | 1,098 | | | | 1,270 | | | | | | 1,111 | | | | 1,411 | |
Other4 | | | 7 | | | | 35 | | | | | | 11 | | | | 80 | | | | | | 3,025 | | | | 1,027 | | | | | | 2,424 | | | | 1,218 | |
Total | | | 1,649 | | | | 1,845 | | | | | | 4,722 | | | | 5,453 | | | | | $ | 834 | | | $ | 914 | | | | | $ | 844 | | | $ | 919 | |
| | | |
| | | Copper Production (attributable pounds) (millions) | | | | | C1 Cash Costs5 ($/lb) | |
| | | Three months ended | | | | | Nine months ended | | | | | Three months ended | | | | | Nine months ended | |
| | | September 30, | | | | | September 30, | | | | | September 30, | | | | | September 30, | |
| | | 2014 | | | 2013 | | | | | 2014 | | | 2013 | | | | | 2014 | | | 2013 | | | | | 2014 | | | 2013 | |
Total | | | 131 | | | | 139 | | | | | | 302 | | | | 400 | | | | | $ | 1.82 | | | $ | 1.69 | | | | | $ | 1.98 | | | $ | 1.94 | |
| | | | | | | |
| | | | | | | | | | | | | | | | | | | Total Gold Production Costs($/oz) | |
| | | | | | | | | | | | | | | | | | | Three months ended | | | | | Nine months ended | |
| | | | | | | | | | | | | | | | | | | September 30, | | | | | September 30, | |
| | | | | | | | | | | | | | | | | | | 2014 | | | 2013 | | | | | 2014 | | | 2013 | |
Direct mining costs before impact of hedges at market foreign exchange rates | | $ | 585 | | | $ | 605 | | | | | $ | 592 | | | $ | 607 | |
Gains realized on currency hedge and commodity hedge/economic hedge contracts | | | (17 | ) | | | (39 | ) | | | | | (20 | ) | | | (44 | ) |
Other6 | | | | | | | | | | - | | | | (4 | ) | | | | | - | | | | (11 | ) |
By-product credits | | | | | | | | | | (18 | ) | | | (20 | ) | | | | | (21 | ) | | | (24 | ) |
Royalties | | | | | | | | | | | | | | | | | | | | | | | 39 | | | | 31 | | | | | | 37 | | | | 36 | |
Adjusted operating costs5 | | | | | | | | | | 589 | | | | 573 | | | | | | 588 | | | | 564 | |
Depreciation | | | | | | | | | | 198 | | | | 208 | | | | | | 198 | | | | 205 | |
Other6 | | | | | | | | | | - | | | | 4 | | | | | | - | | | | 11 | |
Total production costs | | | | | | | | | $ | 787 | | | $ | 785 | | | | | $ | 786 | | | $ | 780 | |
Adjusted operating costs5 | | | | | | | | | $ | 589 | | | $ | 573 | | | | | $ | 588 | | | $ | 564 | |
General & administrative costs | | | | | | | | | | 41 | | | | 50 | | | | | | 46 | | | | 44 | |
Rehabilitation - accretion and amortization (operating sites) | | | | | | | | | | 19 | | | | 16 | | | | | | 21 | | | | 19 | |
Mine on-site exploration and evaluation costs | | | | | | | | | | 4 | | | | 10 | | | | | | 3 | | | | 8 | |
Mine development expenditures | | | | | | | | | | 94 | | | | 157 | | | | | | 109 | | | | 162 | |
Sustaining capital expenditures | | | | | | | | | | 87 | | | | 108 | | | | | | 77 | | | | 122 | |
All-in sustaining costs5 | | | | | | | | | $ | 834 | | | $ | 914 | | | | | $ | 844 | | | $ | 919 | |
All-in costs5 | | | | | | | | | $ | 975 | | | $ | 1,182 | | | | | $ | 951 | | | $ | 1,269 | |
| | | | | | | |
| | | | | | | | | | | | | | | | | | | Total Copper Production Costs($/lb) | |
| | | | | | | | | | | | | | | | | | | Three months ended | | | | | Nine months ended | |
| | | | | | | | | | | | | | | | | | | September 30, | | | | | September 30, | |
| | | | | | | | | | | | | | | | | | | 2014 | | | 2013 | | | | | 2014 | | | 2013 | |
C1 cash costs5 | | | | | | | | | $ | 1.82 | | | $ | 1.69 | | | | | $ | 1.98 | | | $ | 1.94 | |
Depreciation7 | | | | | | | | | | 0.44 | | | | 0.29 | | | | | | 0.40 | | | | 0.36 | |
Other8 | | | | | | | | | | 0.10 | | | | 0.17 | | | | | | 0.12 | | | | 0.15 | |
C3 fully allocated costs5 | | | | | | | | | $ | 2.36 | | | $ | 2.15 | | | | | $ | 2.50 | | | $ | 2.45 | |
| 1 | Includes production from Marigold up to April 4, 2014, the effective date of sale of this asset. |
| 2 | Includes production from Yilgarn South up to September 30, 2013, Plutonic up to January 31, 2014 and Kanowna up to March 1, 2014, the effective dates of sale of these assets. |
| 3 | Figures relating to African Barrick Gold are presented on a 73.9% basis until February 28, 2014 and a 63.9% basis thereafter, which reflects our equity share of production. |
| 4 | Production and all-in sustaining costs include Pierina. |
| 5 | Adjusted operating costs, all-in sustaining costs, all-in costs, C1 cash costs and C3 fully allocated costs are non-GAAP financial performance measures with no standard meaning under IFRS. Refer to the Non-GAAP Financial Performance Measures section of the Company’s MD&A. |
| 6 | Represents the Barrick Energy gross margin divided by equity ounces of gold sold. Barrick Energy was divested in the third quarter of 2013. |
| 7 | Represents equity depreciation expense divided by equity pounds of copper sold. |
| 8 | For a breakdown, see reconciliation of cost of sales to C1 cash costs and C3 fully allocated costs per pound in the Non-GAAP Financial Performance Measures section of the Company’s MD&A. |
| | | | |
BARRICK THIRD QUARTER 2014 | | 9 | | SUMMARY INFORMATION |
MANAGEMENT’S DISCUSSION AND ANALYSIS (“MD&A”)
This portion of the Quarterly Report provides management’s discussion and analysis (“MD&A”) of the financial condition and results of operations to enable a reader to assess material changes in financial condition and results of operations as at and for the three and nine month periods ended September 30, 2014, in comparison to the corresponding prior–year period. The MD&A is intended to help the reader understand Barrick Gold Corporation (“Barrick”, “we”, “our” or the “Company”), our operations, financial performance and present and future business environment. This MD&A, which has been prepared as of October 29, 2014, is intended to supplement and complement the condensed unaudited interim consolidated financial statements and notes thereto, prepared in accordance with International Accounting Standard 34 Interim Financial Reporting (“IAS 34”) as issued by the International Accounting Standards Board (“IASB”), for the three and nine month periods ended September 30, 2014 (collectively, the “Financial Statements”), which are included in this Quarterly Report on pages 52 to 76. You are encouraged to review the Financial Statements in conjunction with your review of this MD&A. This MD&A should be read
in conjunction with both the annual audited consolidated financial statements for the two years ended December 31, 2013, the related annual MD&A included in the 2013 Annual Report, and the most recent Form 40–F/Annual Information Form on file with the US Securities and Exchange Commission (“SEC”) and Canadian provincial securities regulatory authorities. Certain notes to the Financial Statements are specifically referred to in this MD&A and such notes are incorporated by reference herein. All dollar amounts in this MD&A are in millions of US dollars, unless otherwise specified.
For the purposes of preparing our MD&A, we consider the materiality of information. Information is considered material if: (i) such information results in, or would reasonably be expected to result in, a significant change in the market price or value of our shares; or (ii) there is a substantial likelihood that a reasonable investor would consider it important in making an investment decision; or (iii) it would significantly alter the total mix of information available to investors. We evaluate materiality with reference to all relevant circumstances, including potential market sensitivity.
CAUTIONARY STATEMENT ON FORWARD-LOOKING INFORMATION
Certain information contained or incorporated by reference in this MD&A, including any information as to our strategy, projects, plans or future financial or operating performance constitutes “forward-looking statements”. All statements, other than statements of historical fact, are forward-looking statements. The words “believe”, “expect”, “anticipate”, “contemplate”, “target”, “plan”, “intend”, “continue”, “budget”, “estimate”, “may”, “will”, “schedule” and similar expressions identify forward-looking statements. Forward-looking statements are necessarily based upon a number of estimates and assumptions that, while considered reasonable by the Company, are inherently subject to significant business, economic and competitive uncertainties and contingencies. Known and unknown factors could cause actual results to differ materially from those projected in the forward-looking statements. Such factors include, but are not limited to: fluctuations in the spot and forward price of gold, copper or certain other commodities (such as silver, diesel fuel and electricity); changes in national and local government legislation, taxation, controls or regulations and/or changes in the administration of laws, policies and
practices, expropriation or nationalization of property and political or economic developments in Canada, the United States, Zambia and other jurisdictions in which the Company does or may carry on business in the future; failure to comply with environmental and health and safety laws and regulations; timing of receipt of, or failure to comply with, necessary permits and approvals; diminishing quantities or grades of reserves; increased costs, delays, suspensions and technical challenges associated with the construction of capital projects; the impact of global liquidity and credit availability on the timing of cash flows and the values of assets and liabilities based on projected future cash flows; adverse changes in our credit rating; the impact of inflation; operating or technical difficulties in connection with mining or development activities; the speculative nature of mineral exploration and development; risk of loss due to acts of war, terrorism, sabotage and civil disturbances; fluctuations in the currency markets; changes in U.S. dollar interest rates; risks arising from holding derivative instruments; litigation; contests over title to properties, particularly title to undeveloped properties, or over access to water,
| | | | |
BARRICK THIRD QUARTER 2014 | | 10 | | MANAGEMENT’S DISCUSSION AND ANALYSIS |
power and other required infrastructure; business opportunities that may be presented to, or pursued by, the Company; our ability to successfully integrate acquisitions or complete divestitures; employee relations; availability and increased costs associated with mining inputs and labor; and the organization of our previously held African gold operations and properties under a separate listed company. In addition, there are risks and hazards associated with the business of mineral exploration, development and mining, including environmental hazards, industrial accidents, unusual or unexpected formations, pressures, cave-ins, flooding and gold bullion, copper cathode or gold or copper concentrate losses (and the risk of inadequate insurance, or inability to obtain insurance, to cover these risks). Many of these uncertainties and contingencies can affect our actual
results and could cause actual results to differ materially from those expressed or implied in any forward-looking statements made by, or on behalf of, us. Readers are cautioned that forward-looking statements are not guarantees of future performance. All of the forward-looking statements made in this MD&A are qualified by these cautionary statements. Specific reference is made to the most recentForm 40-F/Annual Information Form on file with the SEC and Canadian provincial securities regulatory authorities for a discussion of some of the factors underlying forward-looking statements. We disclaim any intention or obligation to update or revise any forward-looking statements whether as a result of new information, future events or otherwise, except as required by applicable law.
| | | | |
BARRICK THIRD QUARTER 2014 | | 11 | | MANAGEMENT’S DISCUSSION AND ANALYSIS |
INDEX
| | | | |
| | | page | |
| |
Overview | | | | |
| |
Review of 2014 Third Quarter Results | | | 13 | |
| |
Key Business Developments | | | 17 | |
| |
Full Year 2014 Outlook | | | 19 | |
| |
Market Overview | | | 19 | |
| |
Review of Financial Results | | | | |
| |
Revenue | | | 22 | |
| |
Production Costs | | | 22 | |
| |
General & Administrative Expenses | | | 23 | |
| |
Other Expense (Income) | | | 23 | |
| |
Exploration and Evaluation | | | 24 | |
| |
Capital Expenditures | | | 24 | |
| |
Finance Cost/ Finance Income | | | 24 | |
| |
Impairment Charges/Reversals | | | 25 | |
| |
Income Tax | | | 25 | |
| |
Review of Operating Segments Performance | | | 25 | |
| |
Financial Condition Review | | | | |
| |
Balance Sheet Review | | | 38 | |
| |
Shareholders’ Equity | | | 38 | |
| |
Comprehensive Income | | | 38 | |
| |
Financial Position and Liquidity | | | 39 | |
| |
Financial Instruments | | | 41 | |
| |
Commitments and Contingencies | | | 41 | |
| |
Internal Control over Financial Reporting and Disclosure Controls and Procedures | | | 42 | |
| |
Review of Quarterly Results | | | 43 | |
| |
IFRS Critical Accounting Policies and Accounting Estimates | | | 44 | |
| |
Non-GAAP Financial Performance Measures | | | 46 | |
| | | | |
BARRICK THIRD QUARTER 2014 | | 12 | | MANAGEMENT’S DISCUSSION AND ANALYSIS |
| | | | | | | | | | | | | | | | | | | | |
Review of 2014 Third Quarter Results | | | | | | | | | | | | | |
| | | |
| ($ millions, except where indicated) | | For the three months ended September 30 | | | | | | For the nine months ended September 30 | |
| | | 2014 | | | 2013 | | | | | | 2014 | | | 2013 | |
Financial Data | | | | | | | | | | | | | | | | | | | | |
Revenue | | | $ 2,598 | | | | $ 2,985 | | | | | | | | $ 7,662 | | | | $ 9,585 | |
Net earnings(loss)1 | | | 125 | | | | 172 | | | | | | | | (56) | | | | (7,536) | |
Per share (“EPS”)2 | | | 0.11 | | | | 0.17 | | | | | | | | (0.05) | | | | (7.53) | |
Adjusted net earnings3 | | | 222 | | | | 577 | | | | | | | | 619 | | | | 2,163 | |
Per share (“adjusted EPS”)2,3 | | | 0.19 | | | | 0.58 | | | | | | | | 0.53 | | | | 2.16 | |
Total project capital expenditures4,5 | | | 66 | | | | 475 | | | | | | | | 113 | | | | 1,776 | |
Total capital expenditures – expansion4 | | | 128 | | | | 103 | | | | | | | | 300 | | | | 346 | |
Total capital expenditures – sustaining4 | | | 410 | | | | 610 | | | | | | | | 1,202 | | | | 1,905 | |
Operating cash flow | | | 852 | | | | 1,231 | | | | | | | | 1,925 | | | | 3,223 | |
Adjusted operating cash flow3 | | | 852 | | | | 1,300 | | | | | | | | 1,925 | | | | 3,274 | |
Free cash flow3 | | | $ 199 | | | | $ 95 | | | | | | | | $ 40 | | | | ($ 862) | |
| | | | | | | | | | | | | | | | | | | | | |
Operating Data | | | | | | | | | | | | | | | | | | | | |
Gold | | | | | | | | | | | | | | | | | | | | |
Gold produced (000s ounces)6 | | | 1,649 | | | | 1,845 | | | | | | | | 4,722 | | | | 5,453 | |
Gold sold (000s ounces)6 | | | 1,578 | | | | 1,783 | | | | | | | | 4,712 | | | | 5,345 | |
Realized price ($ per ounce)3 | | | $ 1,285 | | | | $ 1,323 | | | | | | | | $ 1,286 | | | | $ 1,453 | |
Adjusted operating costs ($ per ounce)3 | | | $ 589 | | | | $ 573 | | | | | | | | $ 588 | | | | $ 564 | |
Adjusted operating costs on a co-product basis ($ per ounce)3 | | | $ 607 | | | | $ 593 | | | | | | | | $ 609 | | | | $ 588 | |
All-in sustaining costs ($ per ounce)3 | | | $ 834 | | | | $ 914 | | | | | | | | $ 844 | | | | $ 919 | |
All-in sustaining costs on a co-product basis ($ per ounce)3 | | | $ 852 | | | | $ 934 | | | | | | | | $ 865 | | | | $ 943 | |
All-in costs ($ per ounce)3 | | | $ 975 | | | | $ 1,182 | | | | | | | | $ 951 | | | | $ 1,269 | |
All-in costs on a co-product basis ($ per ounce)3 | | | $ 993 | | | | $ 1,202 | | | | | | | | $ 972 | | | | $ 1,293 | |
Copper | | | | | | | | | | | | | | | | | | | | |
Copper produced (millions of pounds) | | | 131 | | | | 139 | | | | | | | | 302 | | | | 400 | |
Copper sold (millions of pounds) | | | 112 | | | | 135 | | | | | | | | 296 | | | | 385 | |
Realized price ($ per pound)3 | | | $ 3.09 | | | | $ 3.40 | | | | | | | | $ 3.08 | | | | $ 3.41 | |
C1 cash costs ($ per pound)3 | | | $ 1.82 | | | | $ 1.69 | | | | | | | | $ 1.98 | | | | $ 1.94 | |
| 1 | Net earnings represent net income attributable to the equity holders of the Company. |
| 2 | Calculated using weighted average number of shares outstanding under the basic method. |
| 3 | These are non-GAAP financial performance measures with no standardized definition under IFRS. For further information and detailed reconciliations, please see pages 46 - 51 of this MD&A. |
| 4 | These amounts are presented on a 100% accrued basis. Project and expansion capital expenditures are included in our calculation of all-in costs, but not included in our calculation of all-in sustaining costs. |
| 5 | Project capital expenditures include the reversal of contract claim accruals that were closed out during the period and the reclassification of assets from inventory to construction-in-process at Pascua-Lama. |
| 6 | Gold production and sales include African Barrick Gold (“ABG”) and Pueblo Viejo at our equity share. |
| | | | |
BARRICK THIRD QUARTER 2014 | | 13 | | MANAGEMENT’S DISCUSSION AND ANALYSIS |
THIRD QUARTER FINANCIAL AND OPERATING HIGHLIGHTS
| | • | | Net earnings in third quarter 2014 were $125 million compared to net earnings of $172 million recorded in third quarter 2013. The impact of lower gold and copper sales volumes and realized prices in third quarter 2014 was partially offset by lower income tax expense, primarily due to the third quarter 2013 recognition of an increase in the deferred tax liability and acceleration of current taxes payable at Pueblo Viejo related to the substantive enactment of the revised Special Lease Agreement. Adjusted net earnings in third quarter 2014 were $222 million compared to adjusted net earnings of $577 million recorded in the same prior year period. The decrease was primarily due to lower gold and copper sales volumes and lower realized gold and copper prices, partially offset by lower cost of sales applicable to gold and copper. |
| | • | | EPS and adjusted EPS for third quarter 2014 were $0.11 and $0.19, respectively, compared to $0.17 and $0.58 for the same prior year period. The decrease in EPS over the same prior year period reflects the decrease in net earnings and the impact of the dilutive effect of our equity offering in fourth quarter 2013 that increased our total shares outstanding by 15%. The decrease in adjusted EPS over the same prior year period was primarily due to the decrease in adjusted net earnings, as described above, combined with the increase in total shares outstanding. |
| | • | | Gold production for third quarter 2014 was 1.65 million ounces, down 0.20 million ounces or 11% from the same prior year period, primarily due to the impact of the divestiture of the Yilgarn South assets in fourth quarter 2013, the Plutonic and Kanowna assets in first quarter 2014 and the Marigold assets in second quarter 2014, which produced a combined 0.24 million ounces in the same prior year period. The lower production in third quarter 2014 also reflects lower production at Cortez and Kalgoorlie; partially offset by higher production at Goldstrike, Pueblo Viejo, Lagunas Norte and Veladero. |
| | • | | Adjusted operating costs for third quarter 2014 were $589 per ounce, up 3% from the same prior year period primarily due to the impact of lower production levels on unit production costs; partially offset by lower total direct mining costs. All-in sustaining costs for third quarter 2014 were $834 per ounce, down 9% over the same prior year period, as lower minesite sustaining capital expenditures more than offset the increase in adjusted operating costs. All-in costs for third quarter 2014 were $975 per ounce, down 18% over the same prior year period as a result of lower all-in sustaining costs and lower non-sustaining capital, primarily as a result of the temporary suspension of construction at Pascua-Lama. |
| | • | | Copper production for third quarter 2014 was 131 million pounds, down 6% over the same prior year period, due to lower production at Zaldívar. The decrease in copper production at Zaldívar was due to lower tons processed combined with a higher proportion of sulfide material, which has a lower recovery rate. Production at Lumwana was 6% higher than the same prior year period. Copper C1 cash costs for third quarter 2014 were $1.82 per pound, up 8% over the same prior year period, primarily due to the impact of lower production levels on unit production costs. |
| | • | | Significant adjusting items (net of tax and non-controlling interest effects) in third quarter 2014 include: $51 million in unrealized losses on non-hedge derivative instruments and $42 million in unrealized foreign currency translation losses; partially offset by $12 million in gains on sale of assets. |
| | • | | Operating cash flow in third quarter 2014 was $852 million, down 31% over the same prior year period. The decrease in operating cash flow primarily reflects lower sales volumes and lower gross margins, partially offset by a decrease in income tax payments. |
| | • | | Capital expenditures were $604 million, down 49% over the same prior year period. The decrease is primarily due to our initiatives to reduce sustaining capital at each of our operating sites and lower project capital expenditures; partially offset by increased minesite expansion capital expenditures. The reduction in project capital expenditures is primarily due to our decision in fourth quarter 2013 to temporarily suspend the Pascua- Lama project. |
| | • | | Free cash flow in third quarter 2014 was an inflow of $199 million, an improvement of $104 million over the same prior year period, primarily reflecting lower capital expenditures which more than offset lower operating cash flows. |
| | | | |
BARRICK THIRD QUARTER 2014 | | 14 | | MANAGEMENT’S DISCUSSION AND ANALYSIS |
FIRST NINE MONTHS 2014 vs. FIRST NINE MONTHS 2013
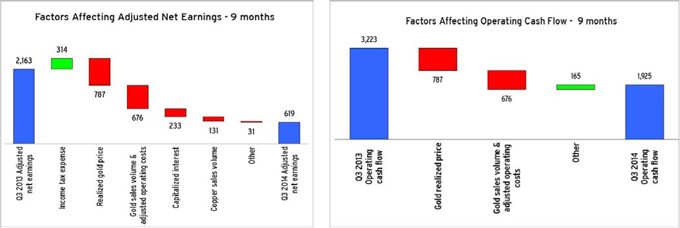
| | • | | Net loss for the nine month period of 2014 was $56 million compared to a net loss $7.5 billion recorded in the nine month period of 2013. The net loss reflects the impact of impairment charges of $514 million recorded in second quarter 2014 as a result of classifying the Jabal Sayid copper project as held for sale, compared to impairment charges of $8.7 billion, primarily related to Pascua-Lama, recorded in the same prior year period. Adjusted net earnings in the first nine months of 2014 were $619 million compared to adjusted net earnings of $2.2 billion recorded in the same prior year period. The decrease was primarily due to a 12% and 10% decrease in realized gold and copper prices, respectively, lower gold and copper sales volumes, and higher interest expense due to the cessation of interest capitalization at our Pascua-Lama project in fourth quarter 2013. This was partially offset by lower cost of sales applicable to gold and copper. |
| | • | | EPS and adjusted EPS for the nine month period of 2014 were ($0.05) and $0.53, respectively, compared to ($7.53) and $2.16, respectively, for the same prior year period. The increase and decrease, respectively, over the same prior year period were due to the lower net loss and decrease in adjusted net earnings, as described above. Both EPS and adjusted EPS were also impacted by the dilutive effect of our equity offering in fourth quarter 2013, which increased our total shares outstanding by about 15%. |
| | • | | Gold production for the nine month period of 2014 was 4.7 million ounces, down 13% from the same prior year period, due to the impact of the divestiture of the Yilgarn South assets in fourth quarter 2013, the Plutonic and Kanowna assets in first quarter 2014 and the Marigold assets in second quarter 2014, which produced a combined 0.63 million ounces in the same prior year period. The lower production for the nine month period of 2014 also reflects lower production at Cortez, Lagunas Norte, and Cowal; partially offset by higher production at Goldstrike, Pueblo Viejo, Veladero and Porgera. |
| | • | | Adjusted operating costs for the nine month period of 2014 were $588 per ounce, up 4% from the same prior year period primarily due to the impact of lower production levels on unit production costs; partially offset by lower total direct mining costs. All-in sustaining costs were $844 per ounce, down 8% over the same prior year period, as lower minesite sustaining capital expenditures more than offset the increase in adjusted operating costs. All-in costs for the nine month period of 2014 were $951 per ounce, down 25% over the same prior year period as a result of lower all-in sustaining costs and lower non-sustaining capital, primarily as a result of the temporary suspension of construction at Pascua-Lama. |
| | • | | Copper production for the nine month period of 2014 was 302 million pounds, down 25% over the same prior year period, due to lower production at both Lumwana and Zaldívar. The decrease in copper production was primarily due to the partial conveyor collapse that occurred at Lumwana which shut down concentrate production for most of second quarter 2014, while the lower production at Zaldívar was mainly due to lower tons processed combined with a higher proportion of sulfide material, which has a lower recovery rate. Copper C1 cash costs for the nine month period of 2014 were $1.98 per pound, up 2% over the same prior year period due to the impact of lower production levels on unit production costs. |
| | • | | Significant adjusting items (net of tax and non-controlling interest effects) for the nine month period of 2014 include: $514 million in goodwill and asset impairment charges as a result of classifying Jabal Sayid as held for sale; $186 million in unrealized foreign currency translation losses; $30 million in demobilization costs relating to the ramp-down of our Pascua-Lama project; $16 million reflecting the impact of the decrease in the discount rate used to calculate the provision for environmental rehabilitation at our closed mines; $10 million in consulting fees |
| | | | |
BARRICK THIRD QUARTER 2014 | | 15 | | MANAGEMENT’S DISCUSSION AND ANALYSIS |
| | related to our operating cost reduction program implemented in the first half of 2014; and $10 million in abnormal costs at Lumwana as a result of the partial conveyor collapse; partially offset by $35 million in gains on sale of assets. |
| | • | | Operating cash flow for the nine month period of 2014 was $1.9 billion, down 40% over the same prior year period. The decrease in operating cash flow primarily reflects lower gross margins, partially offset by a decrease in income tax payments. |
| | • | | Capital expenditures for the nine month period of 2014 were $1.6 billion, down 60% over the same prior year period. The decrease is primarily due to our initiatives to reduce sustaining capital at each of our operating sites and lower project capital expenditures. The reduction in project capital expenditures is primarily due to our decision in fourth quarter 2013 to temporarily suspend the Pascua-Lama project. |
| | • | | Free cash flow for the nine month period of 2014 was an inflow of $40 million, an improvement of $902 million over the same prior year period, primarily reflecting lower capital expenditures which more than offset lower operating cash flows. |
| | | | |
BARRICK THIRD QUARTER 2014 | | 16 | | MANAGEMENT’S DISCUSSION AND ANALYSIS |
Key Business Developments
Proposed Royalty Increase in Zambia
On October 10, 2014, the Zambian government proposed changes to the country’s mining tax regime that would replace the current corporate income tax and variable profit tax with a 20 percent royalty which, if approved, would take effect on January 1, 2015. The application of a 20 percent royalty rate compared to the 6 percent royalty the company is currently paying would challenge the economic viability of the mine. If this tax change is ratified by parliament and implemented as proposed, the royalty could create an unsustainable level of taxation for Lumwana that could result in impairment to the carrying value of the Lumwana asset at current market prices for copper. It may also result in a substantial portion of Lumwana’s reserves being reclassified as resources.
Electricity Price Increase in Zambia
On April 2, 2014 Zambia’s energy regulator approved a 28.8% electricity price increase for mining companies. Subsequently, the bulk power supply agreement tariffs between state power company ZESCO and Copperbelt Energy Corporation were increased to 6.84 cents per KWhr from 5.31 cents per KWhr. The Lumwana Mining Company has a long term power supply contract with ZESCO and does not believe that the rates it pays thereunder should be affected by the announced rate increase. Lumwana and several other mining companies in Zambia have been granted leave to challenge the rate increase in court. To the extent there are significant negative changes to the operating costs of Lumwana as a result of any future increase in electricity rates, the current carrying amount of the mine may not be fully recoverable, which would result in an impairment charge being recorded.
Divestitures
On July 13, 2014 Barrick entered into an agreement to form a joint venture with Ma’aden to operate the Jabal Sayid copper project. Ma’aden, which is 50% owned by the Saudi Arabian government, will acquire its 50% interest in the new joint venture company for cash consideration of $210 million. The acquisition is expected to close in fourth quarter 2014 and is subject to customary closing conditions. Mining operations are expected to recommence in early 2015 and commissioning of the milling and flotation circuits will begin towards the end of the same year with first shipments of concentrate expected in early 2016. Once the mine reaches full production, the average annual output will be 100 million pounds per year, with the potential to increase to 130 million pounds, at first quartile C1 cash costs. As at June 30, 2014, all of the
assets and liabilities of Jabal Sayid were classified as held for sale, as the transaction would result in a loss of control. Consequently the assets and liabilities were written down to their fair value less cost of disposal, which resulted in an impairment loss of $514 million, including $316 million of goodwill and $198 million in asset impairment charges. Refer to page 44 for further details of the impairment loss.
On April 4, 2014, we completed the sale of our minority interest in the Marigold mine for cash consideration of $86 million. As a result of the sale, we recorded a pre-tax gain on sale of $21 million in 2014.
On March 11, 2014, we completed the divestment of 41 million shares in African Barrick Gold (“ABG”), representing in aggregate approximately 10 percent of the issued ordinary shares of ABG, for net proceeds of approximately $186 million. Subsequent to the partial divestment, we continue to hold approximately 262 million shares of ABG, representing approximately 64 percent of the issued ordinary share capital of ABG.
On March 1, 2014, we completed the sale of our Kanowna mine for cash consideration of $67 million. As a result of the sale, we recorded a pre-tax loss of $5 million in 2014.
On January 31, 2014, we completed the sale of our Plutonic mine for cash consideration of $22 million. As a result of the sale, we recorded a pre-tax gain on sale of $8 million in 2014.
Pascua-Lama
The project is currently on care and maintenance. A decision to re-start development will depend on improved economics and more certainty regarding legal and permitting matters. Barrick is in the final stages of preliminary engineering for the permanent water management system and is discussing the permitting requirements necessary to obtain approval for construction with Chilean regulators. The company is making progress on establishing a constructive dialogue with a group of 15 Diaguita indigenous communities and associations in Chile’s Huasco province through a Memorandum of Understanding (MoU). Under the MoU, Barrick is providing these groups with technical and environmental information on Pascua-Lama along with financial resources and materials to facilitate their analysis of the information.
Barrick continues to explore opportunities to improve the project’s risk-adjusted returns, including engineering
| | | | |
BARRICK THIRD QUARTER 2014 | | 17 | | MANAGEMENT’S DISCUSSION AND ANALYSIS |
optimization, strategic partnerships or royalty and other income streaming agreements.
New Executive Management Structure
In third quarter 2014, we unveiled a new executive management structure to respond to the distinct demands and challenges of the mining industry in today’s environment. The new management structure will place a greater emphasis on operational excellence, and acceleration of portfolio optimization and cost reduction initiatives, while fostering a partnership culture. Two Co-Presidents were appointed to execute on operating plans and strategic priorities: Kelvin Dushnisky, formerly Senior Executive Vice President responsible for Corporate and Government Affairs and Chairman of African Barrick Gold plc, and Jim Gowans, formerly Executive Vice President and Chief Operating Officer. The new structure emphasizes the critical importance of joint responsibility and accountability for the management of operations and our key relationships with host governments and local communities that afford the company its license to operate; the Co-Presidents are responsible for the seamless execution of both functions at all times.
In addition, Ammar Al-Joundi, formerly Executive Vice-President and Chief Financial Officer, was promoted to Senior Executive Vice President and Chief Financial Officer and will work with the Chairman on the development and execution of strategy and Darian Rich, formerly Senior Vice President, Human Resources, was promoted to Executive Vice President, Talent Management, reflecting the critical requirement that any company seeking to be the leader in its field must attract, retain and develop exceptional people. Former President and Chief Executive Officer, Jamie Sokalsky stepped down effective September 15, 2014. During third quarter 2014, Barrick added to its leadership team, appointing Woo C. Lee as President, China, Kevin Thomson as Senior Executive Vice President, Strategic Matters, and Richard Williams as Chief of Staff.
Two Independent Directors Appointed
In July 2014, the Board of Directors appointed Mr. J. Michael Evans, former Vice Chairman of Goldman Sachs and Mr. Brian Greenspun, former Chairman and CEO of Greenspun Media Group and a prominent Nevada business leader, to serve as independent directors on Barrick’s Board.
| | | | |
BARRICK THIRD QUARTER 2014 | | 18 | | MANAGEMENT’S DISCUSSION AND ANALYSIS |
Full Year 2014 Outlook
| | | | |
| ($ millions, except per ounce/pound data) | | 2014E | |
Gold production and costs | | | | |
Production (millions of ounces)1 | | | 6.1 - 6.4 | |
Cost of sales2 | | | 5,700 - 6,000 | |
Gold unit production costs | | | | |
All-in sustaining costs ($ per ounce)3 | | | 880 - 920 | |
Adjusted operating costs ($ per ounce)4 | | | 580 - 630 | |
Depreciation ($ per ounce) | | | 200 - 220 | |
Copper production and costs | | | | |
Production (millions of pounds)5 | | | 440 - 460 | |
Cost of sales6 | | | 900 - 1,000 | |
Copper unit production costs | | | | |
C1 cash costs ($ per pound)7 | | | 1.90 - 2.00 | |
Depreciation ($ per pound) | | | 0.40 - 0.50 | |
C3 fully allocated costs ($ per pound)7 | | | 2.50 - 2.60 | |
Exploration and evaluation | | | 200 - 240 | |
Exploration | | | 170 - 200 | |
Evaluation | | | 30 - 40 | |
General and administrative | | | 380 - 400 | |
Other expense | | | 475 - 525 | |
Finance costs | | | 800 - 825 | |
Capital expenditures: | | | | |
Minesite sustaining | | | 1,800 - 2,000 | |
Minesite expansion | | | 300 - 375 | |
Projects | | | 100 - 125 | |
Total capital expenditures | | | 2,200 - 2,500 | |
Effective income tax rate | | | ~50% | |
Key Assumptions | | | | |
Gold Price ($/ounce)8 | | | $ 1,200 | |
Copper Price ($/pound) | | | $ 3.10 | |
Silver Price ($/ounce) | | | $ 17 | |
Oil Price ($/barrel) | | | $ 90 | |
AUD Exchange Rate | | | $ 0.91 | |
ARS Exchange Rate | | | 8.50 | |
CAD Exchange Rate | | | $ 0.91 | |
CLP Exchange Rate | | | 550 | |
| 1 | Guidance for gold production reflects Barrick’s equity share of production from Pueblo Viejo (60%) and ABG (73.9% until March 1, 2014 and 63.9% after March 1, 2014). We now expect gold production to be within a narrowed range of 6.1 - 6.4 million ounces, compared to our previous guidance range of 6.0 - 6.5 million ounces. |
| 2 | Cost of sales applicable to gold includes depreciation expense and cost of sales applicable to the non-controlling equity interest in ABG and Pueblo Viejo. Cost of sales guidance does not include proceeds from by-product metal sales. |
| 3 | All-in sustaining costs are calculated in accordance with the standard published by the World Gold Council (‘WGC’). See page 47 of this MD&A for further details. We now expect all-in sustaining costs to be in the range of $880 - $920 per ounce, compared to our previous guidance range of $900 - $940 per ounce. |
| 4 | Adjusted operating costs reflect our equity share of unit production costs, including the impact of by-product credits, which is calculated in accordance with the standard published by the WGC. See pages 47 of this MD&A for further details. |
| 5 | We now expect copper production to be in the range of 440 - 460 million pounds, compared to our previous guidance range of 410 - 440 million pounds. |
| 6 | Cost of sales applicable to copper includes depreciation expense. |
| 7 | We now expect C1 cash costs per pound to be within a narrowed range of $1.90 to $2.00 per pound, compared to our previous guidance range of $1.90 to $2.10 per pound. We now also expect C3 fully allocated costs per pound to be within a narrowed range of $2.50 - $2.60 per pound, compared to our previous guidance range of $2.50 - $2.75 per pound. |
| 8 | Our long-term gold price assumption for valuation purposes remains $1,300 per ounce. |
Market Overview
Gold and Copper
The market prices of gold and copper are the primary drivers of our profitability and our ability to generate free cash flow for our shareholders. The gold price generally declined over the course of the third quarter, with the price ranging from $1,204 to $1,345 per ounce. The price of gold closed at $1,217 per ounce on September 30, 2014, while the average quarterly market price of $1,282 per ounce represented a $44 per ounce or 3% decrease from the $1,326 per ounce average market price in the same prior year period.
The decline in the price of gold over the course of third quarter primarily occurred as a result of a strengthening US dollar, which was due to a decrease in economic concerns surrounding geopolitical events, a weakening in economic data out of Europe and China and continued tapering of the unprecedented monetary stimulus currently provided by the US Federal Reserve, as well as growing expectations of US benchmark rate increases within the next year. Going forward, we believe that gold will attract investment interest through its role as a safe haven investment, store of value and alternative to fiat currency due to concerns over geopolitical issues, sovereign debt and deficit levels, bank stability, future inflation prospects, and continuing accommodative monetary policies put in place by many of the world’s central banks. While there are risks that investor interest in gold will decrease, we believe that the continuing uncertain macroeconomic environment, together with the limited choice of alternative safe haven investments, is supportive of continued strong demand for gold.
Copper prices in third quarter traded in a range of $3.02 per pound to $3.27 per pound. The average price for third quarter was $3.17 per pound and the closing price was $3.06 per pound on September 30, 2014. Copper prices should continue to be influenced by demand from emerging markets, specifically China, the availability of scrap and production levels of mines and smelters in the future.
Utilizing option collar strategies, the Company has protected the downside on approximately half of our remaining expected 2014 copper production at an average floor price of $3.00 per pound and can
| | | | |
BARRICK THIRD QUARTER 2014 | | 19 | | MANAGEMENT’S DISCUSSION AND ANALYSIS |
participate on the same amount up to an average of $3.75 per pound. Our realized price on all 2014 copper production is expected to be reduced by approximately $0.03 per pound as a result of the net premium paid on option hedging strategies. Our remaining copper production is subject to market prices.
We have provisionally priced copper sales for which final price determination versus the relevant copper index is outstanding at the balance sheet date. As at September 30, 2014, we have recorded 54 million pounds of copper sales subject to final settlement at an average provisional price of $3.04 per pound. The impact to net income before taxation of a 10% movement in the market price of copper would be approximately $16 million, holding all other variables constant.
Silver
Silver prices do not significantly impact our current operating earnings, cash flows or gold adjusted operating costs. Silver prices, however, will have a significant impact on the overall economics for our Pascua-Lama project.
In third quarter, silver prices traded in a range of $16.87 per ounce to $21.58 per ounce, averaged $19.76 per ounce and closed the quarter at $17.11 per ounce. The silver price is driven by factors similar to those influencing investment demand for gold. The physical silver market is currently in surplus and investment demand is expected to be the primary driver of prices in the near term.
Currency Exchange Rates
The results of our mining operations outside of the United States are affected by US dollar exchange rates. We have exposure to the Australian and Canadian dollars through a combination of mine operating and corporate administration costs, as well as exposure to the Chilean peso through expected future capital and operating costs at our Pascua-Lama project and mine operating costs at Zaldívar. We also have exposure to the Argentinean peso through operating costs at our Veladero mine, peso denominated VAT receivable balances and expected future capital and operating costs at our Pascua-Lama project. In addition, we have exposure to the Papua New Guinea kina, Peruvian sol, Zambian kwacha, Tanzanian shilling and Dominican peso through mine operating and capital costs.
Fluctuations in the US dollar increase the volatility of our costs reported in US dollars, subject to protection that we have put in place through our currency hedging program. In third quarter, the Australian dollar traded in a range of $0.87 to $0.95 against the US dollar, while the US dollar
against the Canadian dollar and Chilean peso traded in ranges of $1.06 to $1.12 and CLP 548 to CLP 604, respectively.
In third quarter, we recorded gains in earnings of approximately $24 million from our Australian, Canadian and Chilean peso hedges, primarily impacting our operating and corporate administration costs (Q3 2013: $64 million).
| | | | | | | | | | | | | | | | | | | | |
| AUD Currency Contracts | |
| | | Contracts
(AUD
millions | | | Effective
Average
Hedge
Rate
(AUDUSD) | | | % of Total
Expected
AUD
Exposure1
Hedged | | | % of
Expected
Operating
Cost
Exposure
Hedged | | | Crystallized
Gain/(Loss)
in OCI2
(USD millions) | |
20143 | | | 103 | | | | 0.94 | | | | 47% | | | | 60% | | | | 23 | |
2015 | | | 370 | | | | 0.94 | | | | 48% | | | | 54% | | | | (4) | |
2016 | | | 85 | | | | 0.91 | | | | 12% | | | | 13% | | | | (19) | |
|
| CAD Currency Contracts | |
| | | Contracts
(CAD
millions)4 | | | Effective
Average
Hedge
Rate
(USDCAD) | | | % of Total
Expected
CAD
Exposure1
Hedged | | | % of
Expected
Operating
Cost
Exposure
Hedged | | | Crystallized
Gain/(Loss)
in OCI2
(USD millions) | |
20143 | | | 69 | | | | 1.00 | | | | 46% | | | | 68% | | | | - | |
2015 | | | 240 | | | | 1.03 | | | | 53% | | | | 61% | | | | - | |
|
| CLP Currency Contracts | |
| | | Contracts
(CLP
millions) 5 | | | Effective
Average
Hedge
Rate
(USDCLP) | | | % of Total
Expected
CLP
Exposure1
Hedged | | | % of
Expected
Operating
Cost
Exposure
Hedged | | | Crystallized
Gain/(Loss)
in OCI2
(USD millions) | |
20143 | | | 18,750 | | | | 500 | | | | 27% | | | | 99% | | | | 2 | |
2015 | | | 102,000 | | | | 521 | | | | 50% | | | | 100% | | | | - | |
| 1 | Includes all forecasted operating, administrative, sustainable and eligible project capital expenditures. |
| 2 | To be reclassified from Other Comprehensive Income (‘OCI’) to earnings when indicated. |
| 3 | Amounts presented represent contracts for the remainder of 2014. |
| 4 | Includes C$309 million CAD collar contracts with an average range of $1.02 - $1.13. |
| 5 | Includes CLP 120,750 million collar contracts with an average range of 518 - 597. |
| | | | |
BARRICK THIRD QUARTER 2014 | | 20 | | MANAGEMENT’S DISCUSSION AND ANALYSIS |
Fuel
Concerns over global economic growth, transportation issues, increasing North American supply and geopolitical tensions in certain oil producing regions combined to create volatility in oil prices in third quarter. The price of West Texas Intermediate (“WTI”) crude oil traded in a range of $90 to $106 per barrel in third quarter, averaged $97 per barrel, compared to an average of $106 per barrel in the same prior year period, and ended the quarter at $91 per barrel.
In third quarter, we recorded a hedge gain of $2 million on our fuel hedge positions (Q3 2013: $2 million).
| | | | | | | | | | | | |
| Financial Fuel Hedge Summary | |
| | | Barrels
(thousands) | | | Average Price | | | % of Expected
Exposure | |
20141 | | | 339 | | | | $92 | | | | 30% | |
2015 | | | 2,515 | | | | 91 | | | | 52% | |
2016 | | | 2,400 | | | | 84 | | | | 46% | |
2017 | | | 1,920 | | | | 81 | | | | 42% | |
2018 | | | 1,080 | | | | 79 | | | | 28% | |
| 1 | Amounts presented represent contracts for the remainder of 2014. |
US Dollar Interest Rates
During third quarter, the Federal Open Market Committee of the US Federal Reserve (“FOMC”) released a statement reiterating its view that a highly accommodative stance of monetary policy remains appropriate. In determining how long to maintain the current 0% to 0.25% range for the benchmark rate, the FOMC noted that it will use a wide range of information, including measures of labor market conditions, indicators of inflation pressures and inflation expectations, and readings on financial developments, to assess progress towards its objectives of maximum employment and 2 percent inflation. We expect the US Federal Reserve to end its use of certain monetary policy initiatives, including its purchases of agency-backed mortgage securities and longer-term Treasury securities during fourth quarter. We expect the end of such monetary policy initiatives to be followed some time in 2015 by incremental increases to short-term rates once economic conditions normalize.
At present, our interest rate exposure mainly relates to interest receipts on our cash balances ($2.7 billion at September 30, 2014); the mark-to-market value of derivative instruments; the fair value of and ongoing payments under US dollar interest-rate swaps; the carrying value of certain long lived assets and liabilities; and to the interest payments on our variable-rate debt ($1.5 billion at September 30, 2014). Currently, the amount of interest expense recorded in our consolidated statement of income is not materially impacted by changes in interest rates, because the majority of debt
was issued at fixed interest rates. The relative amounts of variable-rate financial assets and liabilities may change in the future, depending on the amount of operating cash flow we generate, as well as the level of capital expenditures and our ability to borrow on favorable terms using fixed rate debt instruments.
| | | | |
BARRICK THIRD QUARTER 2014 | | 21 | | MANAGEMENT’S DISCUSSION AND ANALYSIS |
REVIEW OF FINANCIAL RESULTS
Revenue
| | | | | | | | | | | | | | | | |
($ millions, except per ounce/pound data in dollars) | | For the three
months ended
September 30 | | | For the nine
months ended
September 30 | |
| | | 2014 | | | 2013 | | | 2014 | | | 2013 | |
Gold | | | | | | | | | | | | | | | | |
000s oz sold1 | | | 1,578 | | | | 1,783 | | | | 4,712 | | | | 5,345 | |
Revenue | | | $ 2,235 | | | | $ 2,511 | | | | $ 6,664 | | | | $ 8,202 | |
Market price2 | | | 1,282 | | | | 1,326 | | | | 1,288 | | | | 1,456 | |
Realized price2,3 | | | 1,285 | | | | 1,323 | | | | 1,286 | | | | 1,453 | |
Copper | | | 112 | | | | 135 | | | | 296 | | | | 385 | |
millions lbs sold1 | | | | | | | | | | | | | | | | |
Revenue | | | $ 318 | | | | $ 432 | | | | $ 860 | | | | $ 1,236 | |
Market price2 | | | 3.17 | | | | 3.21 | | | | 3.15 | | | | 3.35 | |
Realized price2,3 | | | 3.09 | | | | 3.40 | | | | 3.08 | | | | 3.41 | |
Oil & gas sales4 | | | - | | | | $ 13 | | | | - | | | | $ 93 | |
Other metal sales | | | $ 45 | | | | $ 42 | | | | $ 138 | | | | $ 147 | |
| 1 | Includes our equity share of gold ounces from ABG and Pueblo Viejo. |
| 2 | Per ounce/pound weighted average. |
| 3 | Realized price is a non-GAAP financial performance measure with no standard meaning under IFRS. For further information and a detailed reconciliation, please see page 51 of this MD&A. |
| 4 | Relates to revenue from our Barrick Energy segment that was sold in third quarter 2013. |
Gold revenues for the three and nine month periods ended September 30, 2014 were $2,235 million and $6,664 million, respectively, down 11% and 19%, respectively, compared to the same prior year periods. The decreases were primarily due to lower realized gold prices and lower gold sales volumes compared to the same prior year periods. Copper revenues for the three and nine month periods ended September 30, 2014 were $318 million and $860 million, respectively, down 26% and 30%, respectively, compared to the same prior year periods. The decreases were primarily due to the lower copper sales volumes at both Zaldívar and Lumwana, as well as the impact of lower realized copper prices compared to the same prior year periods.
Realized gold prices for the three and nine month periods ended September 30, 2014 were $1,285 per ounce and $1,286 per ounce, respectively, down $38 per ounce and $167 per ounce, respectively, compared to the same prior year periods. The decreases in realized gold prices reflects the lower market gold prices for the three and nine month periods ended September 30, 2014, which averaged $1,288 per ounce over the first nine months of 2014 compared to $1,456 per ounce in the same prior year period. Realized copper prices for three and nine month periods ended September 30, 2014 were $3.09
per pound and $3.08 per pound, respectively, down $0.31 per pound and $0.33 per pound, respectively, compared to the same prior year periods.
Gold production for the three and nine month periods ended September 30, 2014 was 1.65 million ounces and 4.72 million ounces, respectively, a decrease of 11% and 13%, respectively, over the same prior year periods. The decreases were primarily due to lower production at Cortez as well as the impact of recent divestitures, including Marigold in second quarter 2014, Plutonic and Kanowna in first quarter 2014 and Yilgarn South in fourth quarter 2013. This was partially offset by higher production at Goldstrike, Pueblo Viejo and Veladero.
Copper production for the three and nine month periods ended September 30, 2014 decreased by 6% and 25%, respectively, over the same prior year periods. This was primarily due to lower production at Lumwana for the nine month period ended September 30, 2014 due to the conveyor collapse that occurred during second quarter 2014, which shut down the mill and concentrate production for much of the second quarter. At Zaldívar, lower production for the three and nine month period ended September 30, 2014 was due to fewer tons processed combined with a higher proportion of sulfide material, which has a lower recovery rate.
Production Costs
| | | | | | | | | | | | | | | | |
($ millions, except per ounce/pound data in dollars) | | For the three
months ended
September 30 | | | For the nine
months ended
September 30 | |
| | | 2014 | | | 2013 | | | 2014 | | | 2013 | |
Cost of sales | | | | | | | | | | | | | | | | |
Direct mining cost | | | $ 1,152 | | | | $ 1,273 | | | | $ 3,484 | | | | $ 3,892 | |
Depreciation | | | 412 | | | | 441 | | | | 1,214 | | | | 1,290 | |
Royalty expense | | | 78 | | | | 74 | | | | 226 | | | | 248 | |
Cost of sales - gold | | | 1,397 | | | | 1,533 | | | | 4,189 | | | | 4,579 | |
Adjusted operating costs1,2 | | | 589 | | | | 573 | | | | 588 | | | | 564 | |
All-in sustaining costs - gold1,2 | | | 834 | | | | 914 | | | | 844 | | | | 919 | |
Cost of sales - copper | | | 229 | | | | 247 | | | | 677 | | | | 824 | |
C1 cash costs1,2 | | | 1.82 | | | | 1.69 | | | | 1.98 | | | | 1.94 | |
C3 fully allocated costs1,2 | | | $ 2.36 | | | | $ 2.15 | | | | $ 2.50 | | | | $ 2.45 | |
| 1 | Per ounce/pound weighted average. |
| 2 | Adjusted operating costs, all-in sustaining costs, C1 cash costs and C3 fully allocated costs are non-GAAP financial performance measures with no standard meaning under IFRS. For further information and a detailed reconciliation, please see pages 47 - 50 of this MD&A. |
| | | | |
BARRICK THIRD QUARTER 2014 | | 22 | | MANAGEMENT’S DISCUSSION AND ANALYSIS |
Cost of sales applicable to gold for the three and nine month periods ended September 30, 2014 were $1,397 million and $4,189 million, respectively, a decrease of 9% over the same prior year periods. The decreases reflect lower direct mining costs and lower depreciation expense, primarily due to lower sales volumes.
Gold adjusted operating costs for the three and nine month periods ended September 30, 2014 were $589 per ounce and $588 per ounce, respectively, up $16 per ounce and $24 per ounce, respectively, compared to the same prior year periods. The increases were primarily due to the impact of lower production levels on unit production costs. All-in sustaining costs for the three and nine month periods ended September 30, 2014 were $834 per ounce and $844 per ounce, down $80 per ounce and $75 per ounce, respectively, compared to the same prior year periods. The decreases were primarily due to lower mine development and minesite sustaining capital expenditures, which more than offset the increase in adjusted operating costs.
Cost of sales applicable to copper for the three and nine month periods ended September 30, 2014 were $229 million and $677 million, respectively, a decrease of $18 million and $147 million, respectively, compared to the same prior year periods. The decreases were primarily due to lower sales volumes at Lumwana and at Zaldívar due to lower production levels in third quarter 2014 and for the first nine months of 2014.
C1 cash costs for the three and nine month periods ended September 30, 2014 were $1.82 per pound and $1.98 per pound, respectively, up 8% and 2%, respectively, compared to the same prior year periods. The increases are primarily due to the impact of decreased production levels on unit production costs. C3 fully allocated costs per pound for the three and nine month periods ended September 30, 2014 were $2.36 per pound and $2.50 per pound, respectively, up $0.21 per pound and $0.05 per pound, respectively, from the same prior year periods, primarily reflecting the effect of the above factors on C1 cash costs.
General & Administrative Expenses
| | | | | | | | | | | | | | | | |
| ($ millions) | | For the three
months ended
September 30 | | | For the nine
months ended
September 30 | |
| | | 2014 | | | 2013 1 | | | 2014 | | | 2013 1 | |
Corporate administration | | | $ 57 | | | | $ 54 | | | | $ 158 | | | | $ 152 | |
| | | | |
Operating segment administration | | | 41 | | | | 46 | | | | 125 | | | | 145 | |
Total general & administrative expenses | | | $ 98 | | | | $ 100 | | | | $ 283 | | | | $ 297 | |
| 1 | Presentation amended to include certain general & administrative expenditures related to management of our operating unit offices, which were previously classified within other expense. |
General & administrative expenses for the three and nine month periods ended September 30, 2014 were $98 million and $283 million, respectively, down $2 million and $14 million, respectively, compared to the same prior year periods. The decreases were primarily due to the impact of headcount reductions as part of the organizational restructuring that took place in 2013, combined with a decrease in deferred share-based compensation costs; partially offset by severance costs incurred due to the departure of several senior executives during third quarter 2014.
Other Expense (Income)
| | | | | | | | | | | | | | | | |
| ($ millions) | | For the three
months ended
September 30 | | | For the nine
months ended
September 30 | |
| | | 2014 | | | 20131 | | | 2014 | | | 2013 1 | |
Corporate social responsibility | | | 21 | | | | 13 | | | | $ 61 | | | | $ 53 | |
| | | | |
Net currency translation losses | | | 30 | | | | 21 | | | | 140 | | | | 62 | |
| | | | |
Severance and demobilization costs - Pascua-Lama | | | 3 | | | | 1 | | | | 18 | | | | 67 | |
| | | | |
Severance - other | | | 3 | | | | 10 | | | | 7 | | | | 20 | |
| | | | |
Project care and maintenance costs - Pascua-Lama | | | 29 | | | | 16 | | | | 76 | | | | 57 | |
| | | | |
Project care and maintenance costs - Jabal Sayid | | | 7 | | | | 12 | | | | 23 | | | | 40 | |
| | | | |
Cost reduction program consulting fees | | | - | | | | - | | | | 14 | | | | - | |
| | | | |
Lease termination charges | | | - | | | | - | | | | 15 | | | | - | |
| | | | |
Changes in estimate of rehabilitation costs for sites in closure | | | (9) | | | | 72 | | | | 33 | | | | 20 | |
| | | | |
Other items | | | (1) | | | | 24 | | | | 38 | | | | 87 | |
Total other expense | | | $ 83 | | | | $ 169 | | | | $ 425 | | | | $ 406 | |
| 1 | Presentation amended to exclude certain general & administrative expenditures related to management of our operating unit offices, which are now classified within general & administrative expenses. |
| | | | |
BARRICK THIRD QUARTER 2014 | | 23 | | MANAGEMENT’S DISCUSSION AND ANALYSIS |
Other expense for the three and nine month periods ended September 30, 2014 was $83 million and $425 million, respectively, a decrease of $86 million and an increase of $19 million, respectively, compared to the same prior year periods. The decrease for the three month period ended September 30, 2014 is primarily due to a decrease in our estimate of rehabilitation costs at sites that are in closure due to the effect of an increase in the rate applied to discount the remediation liability.
The increase for the nine month period ended September 30, 2014 is primarily due to an increase of $78 million in currency translation losses compared to the same prior year period, primarily due to the impact of the rapid devaluation of the Argentine peso that occurred in early 2014 on our VAT receivables balance. This was partially offset by a gain on sale of $37 million primarily relating to the sale of available-for-sale investments.
Exploration and Evaluation
| | | | | | | | | | | | | | | | |
| ($ millions) | | For the three
months ended
September 30 | | | For the nine
months ended
September 30 | |
| | | 2014 | | | 2013 | | | 2014 | | | 2013 | |
Exploration: | | | | | | | | | | | | | | | | |
| | | | |
Minesite programs | | | $ 6 | | | | $ 12 | | | | $ 23 | | | | $ 38 | |
| | | | |
Global programs | | | 33 | | | | 25 | | | | 92 | | | | 94 | |
| | | | |
Evaluation costs | | | 6 | | | | 11 | | | | 15 | | | | 22 | |
Exploration and evaluation expense | | | $ 45 | | | | $ 48 | | | | $ 130 | | | | $ 154 | |
Exploration and evaluation expense for the three and nine months ended September 30, 2014 was $45 million and $130 million, respectively, a decrease of 6% and 16%, respectively, compared to the same prior year periods. The decrease is primarily due to decreased exploration in Australia-Pacific; partially offset by increased exploration and evaluation expenditures at Goldrush.
Capital Expenditures1
| | | | | | | | | | | | | | | | |
| ($ millions) | | For the three
months ended
September 30 | | | For the nine
months ended
September 30 | |
| | | 2014 | | | 2013 | | | 2014 | | | 2013 | |
Project capital expenditures2,3 | | | $ 66 | | | | $ 371 | | | | $ 113 | | | | $ 1,521 | |
| | | | |
Minesite sustaining4 | | | 180 | | | | 261 | | | | 488 | | | | 858 | |
| | | | |
Mine development | | | 230 | | | | 349 | | | | 712 | | | | 1,041 | |
| | | | |
Minesite expansion2 | | | 120 | | | | 103 | | | | 280 | | | | 346 | |
| | | | |
Capitalized interest | | | 8 | | | | 104 | | | | 22 | | | | 261 | |
| | | | |
Total consolidated capital expenditures | | | $ 604 | | | | $ 1,188 | | | | $ 1,615 | | | | $ 4,027 | |
| 1 | These amounts are presented on a 100% accrued basis. |
| 2 | Project and expansion capital expenditures are included in our calculation of all-in costs, but not included in our calculation of all-in sustaining costs. |
| 3 | Project capital expenditures include the reversal of contract claim accruals that were closed out during the period and the reclassification of assets from inventory to construction-in-process at Pascua-Lama. |
| 4 | Minesite sustaining includes capital expenditures from discontinued operations of $7 million and $64 million for the three and nine months ended September 30, 2013, respectively. |
Capital expenditures for the three and nine month period ended September 30, 2014 were $604 million and $1.6 billion, respectively, a decrease of 49% and 60%, respectively, compared to the same prior year periods. The decreases are primarily due to lower project capital expenditures due to the decision made in fourth quarter 2013 to temporarily suspend the Pascua-Lama project and the completion of the power plant at Pueblo Viejo in fourth quarter 2013. Minesite sustaining capital for the three and nine month periods ended September 30, 2014 decreased 31% and 43%, respectively, which reflects our continued focus on reducing and/or deferring sustaining capital at all of our sites. The increase in minesite expansion expenditures for the three month period ended September 30, 2014 was primarily related to the construction of the thiosulfate project at Goldstrike as well as construction of the CIL plant at Bulyanhulu. Capitalized interest decreased compared to the same prior year periods, primarily due to the cessation of interest capitalization at Pascua-Lama in fourth quarter 2013.
Finance Cost/Finance Income
| | | | | | | | | | | | | | | | |
| ($ millions) | | For the three
months ended
September 30 | | | For the nine
months ended
September 30 | |
| | | 2014 | | | 2013 | | | 2014 | | | 2013 | |
Interest incurred | | | $ 188 | | | | $ 209 | | | | $ 563 | | | | $ 596 | |
Interest capitalized | | | (8) | | | | (104) | | | | (22) | | | | (255) | |
Accretion | | | 18 | | | | 17 | | | | 58 | | | | 50 | |
Finance costs | | | $ 198 | | | | $ 122 | | | | $ 599 | | | | $ 391 | |
Finance income | | | $ 3 | | | | $ 2 | | | | $ 9 | | | | $ 7 | |
| | | | |
BARRICK THIRD QUARTER 2014 | | 24 | | MANAGEMENT’S DISCUSSION AND ANALYSIS |
Finance costs for the three and nine month periods ended September 30, 2014 were $198 million and $599 million, respectively, an increase of $76 million and $208 million, respectively, compared to the same prior year periods. Interest costs incurred for the three and nine month periods ended September 30, 2014 decreased 10% and 6%, respectively, reflecting lower total debt levels compared to the same prior year periods. Interest capitalized for the three and nine month period ended September 30, 2014 decreased by $96 million and $233 million, respectively, compared to the same prior year periods, primarily due to the cessation of interest capitalization at our Pascua-Lama project in fourth quarter 2013.
Impairment Charges/Reversals
| | | | | | | | | | | | | | | | |
| ($ millions) | | For the three
months ended
September 30 | | | For the nine
months ended
September 30 | |
| | | 2014 | | | 2013 | | | 2014 | | | 2013 | |
Copper goodwill | | | - | | | | - | | | | $ 316 | | | | $ 1,033 | |
Australia Pacific goodwill | | | - | | | | - | | | | - | | | | 649 | |
Capital projects goodwill | | | - | | | | - | | | | - | | | | 397 | |
ABG Goodwill | | | - | | | | - | | | | - | | | | 185 | |
Total goodwill impairment charges | | | - | | | | - | | | | $ 316 | | | | $ 2,264 | |
Pascua-Lama | | | - | | | | - | | | | - | | | | $ 5,164 | |
Jabal Sayid | | | - | | | | - | | | | $ 198 | | | | 501 | |
Buzwagi | | | - | | | | - | | | | - | | | | 721 | |
North Mara | | | - | | | | - | | | | - | | | | 153 | |
Pierina | | | - | | | | - | | | | - | | | | 140 | |
Exploration sites | | | - | | | | - | | | | 7 | | | | 112 | |
Granny Smith | | | - | | | | - | | | | - | | | | 73 | |
Kanowna | | | - | | | | - | | | | - | | | | 107 | |
Plutonic | | | - | | | | - | | | | - | | | | 20 | |
Darlot | | | - | | | | - | | | | - | | | | 36 | |
Available for sale investments | | | - | | | | $ 1 | | | | 16 | | | | 21 | |
Other1 | | | $ 18 | | | | 12 | | | | 5 | | | | 33 | |
Total asset impairment charges | | | $ 18 | | | | $ 13 | | | | $ 226 | | | | $ 7,081 | |
Total impairment charges | | | $ 18 | | | | $ 13 | | | | $ 542 | | | | $ 9,345 | |
1Includes the impairment reversal relating to the Pueblo Viejo power assets.
Impairment charges for the three and nine month periods ended September 30, 2014 were $18 million and $542 million, respectively, compared to $13 million and $9.3 billion for the same prior year periods. In second quarter 2014, we recorded goodwill and asset impairment charges of $316 million and $198 million, respectively, as a result of classifying the Jabal Sayid copper project as held for
sale. Refer to page 44 for further details regarding the sale.
Income Tax Expense
Income tax expense was $275 million in the third quarter 2014. The tax rate for income in third quarter 2014 was 61%, which is higher than our effective tax rate for ordinary income of 50%, primarily due to: the impact of net currency translation losses on deferred tax balances, the impact of impairment charges, asset sales, and non-hedge derivatives, the impact of restructuring internal debt to equity, the impact of a tax rate change in Chile, and the impact of non-deductible foreign exchange losses.
The increase in the effective tax rate for ordinary income from 30% in third quarter 2013, to 50% in third quarter 2014, arose primarily due to the Pueblo Viejo Special Lease Agreement amendment which was substantively enacted in third quarter 2013, as well as certain expenditures with no offsetting recognition of deferred tax assets in 2014, primarily at our Pascua Lama project. Refer to Note 13 for further details.
We record deferred tax charges or credits if changes in facts or circumstances affect the estimated tax basis of assets and therefore the amount of deferred tax assets or liabilities to reflect changing expectations in our ability to realize deferred tax assets. The interpretation of tax regulations and legislation and their application to our business is complex and subject to change. We have significant amounts of deferred tax assets, including tax loss carry forwards, and also deferred tax liabilities. Potential changes of any of these amounts, as well as our ability to realize deferred tax assets, could significantly affect net income or cash flow in future periods.
In third quarter 2014, Chile enacted tax rate changes. The corporate level income tax rate for 2014 increased from 20% to 21%, which resulted in a current tax expense of approximately $2 million for the nine months ended September 30, 2014. The corporate level income tax rate will further increase to 22.5% for 2015, 24% for 2016, 25.5% for 2017, and 27% for 2018 and subsequent years. We anticipate that the total combined corporate-level and shareholder-level income tax rate of 35% will continue to apply to Barrick, and therefore, no adjustment was necessary to deferred income taxes, which were previously recorded at the 35% rate.
Review of Operating Segments Performance
Barrick’s business is organized into ten Operating Units: five individual gold mines, two gold mine portfolios, one publicly traded gold company, a global copper business, and one project. As a result of the
| | | | |
BARRICK THIRD QUARTER 2014 | | 25 | | MANAGEMENT’S DISCUSSION AND ANALYSIS |
organizational changes that were implemented in third quarter 2014, we have determined that our Co-Presidents, acting together, are Barrick’s Chief Operating Decision Maker and there were no changes to our reportable segments as a result of this reorganization. Barrick’s Chief Operating Decision Maker reviews the operating results, assesses performance and makes capital allocation decisions for each of these business operations at an Operating Unit level. Therefore, these Operating Units are operating segments for financial reporting purposes.
Segment performance is evaluated based on a number of measures including operating income before tax, production levels and unit production costs. Income tax, corporate administration, finance income and costs, impairment charges and reversals, investment write-downs and gains/losses on non-hedge derivatives are managed on a consolidated basis and are therefore not reflected in segment income.
Cortez
| | | | | | | | | | | | | | | | | | | | | | | | |
| Summary of Operating Data | | For the three months ended September 30 | | | For the nine months ended September 30 | |
| | | 2014 | | | 2013 | | | % Change | | | 2014 | | | 2013 | | | % Change | |
Total tons mined (000s) | | | 40,653 | | | | 41,114 | | | | (1%) | | | | 124,182 | | | | 105,728 | | | | 17% | |
Ore tons processed (000s) | | | 7,843 | | | | 7,938 | | | | (1%) | | | | 21,411 | | | | 16,205 | | | | 32% | |
Average grade (ozs/ton) | | | 0.043 | | | | 0.056 | | | | (23%) | | | | 0.043 | | | | 0.083 | | | | (48%) | |
Gold produced (000s/oz) | | | 273 | | | | 333 | | | | (18%) | | | | 717 | | | | 1,093 | | | | (34%) | |
Gold sold (000s/oz) | | | 252 | | | | 322 | | | | (22%) | | | | 677 | | | | 1,078 | | | | (37%) | |
Cost of sales ($ millions) | | | $ 187 | | | | $ 180 | | | | 4% | | | | $ 486 | | | | $ 475 | | | | 2% | |
Adjusted operating costs (per oz)1 | | | $ 478 | | | | $ 270 | | | | 77% | | | | $ 448 | | | | $ 206 | | | | 117% | |
All-in sustaining costs (per oz)1 | | | $ 589 | | | | $ 470 | | | | 25% | | | | $ 663 | | | | $ 416 | | | | 59% | |
All-in costs (per oz)1 | | | $ 606 | | | | $ 554 | | | | 9% | | | | $ 684 | | | | $ 530 | | | | 29% | |
| | |
| Summary of Financial Data | | For the three months ended September 30 | | | For the nine months ended September 30 | |
| | | 2014 | | | 2013 | | | % Change | | | 2014 | | | 2013 | | | % Change | |
Segment income ($ millions)2 | | | $ 132 | | | | $ 240 | | | | (45%) | | | | $ 372 | | | | $ 1,075 | | | | (65%) | |
Capital expenditures ($ millions)3 | | | $ 31 | | | | $ 85 | | | | (64%) | | | | $ 151 | | | | $ 332 | | | | (55%) | |
Minesite sustaining | | | $ 27 | | | | $ 58 | | | | (53%) | | | | $ 137 | | | | $ 209 | | | | (34%) | |
Minesite expansion | | | $ 4 | | | | $ 27 | | | | (85%) | | | | $ 14 | | | | $ 123 | | | | (89%) | |
| 1 | Adjusted operating costs, all-in sustaining costs and all-in costs are non-GAAP financial performance measures with no standardized meaning under IFRS. For further information and a detailed reconciliation, please see page 47 of this MD&A. |
| 2 | Segment income excludes income taxes. |
| 3 | Amounts presented represent expenditures for minesite expansion and minesite sustaining (including mine development) on an accrual basis excluding capitalized interest. |
Segment income for the three and nine month periods ended September 30, 2014 was $132 million and $372 million, respectively, a decrease of 45% and 65% from the same prior year periods. The decreases were primarily due to a reduction in sales volumes combined with a lower realized gold price. Capital expenditures for the three and nine month periods ended September 30, 2014 decreased by 64% and 55%, respectively, over the same prior year periods. The decreases were primarily due to a reduction in minesite sustaining and minesite expansion capital expenditures.
Gold production for the three and nine month periods ended September 30, 2014 was 18% and 34% lower, respectively, compared to the same prior year periods. The decrease for the three month period ended September 30, 2014 was primarily due to the processing of lower grade ore as anticipated in the mine sequencing
plan. The decrease for the nine month period ended September 30, 2014 was primarily due to the anticipated processing of lower grade ore combined with a negative ore model reconciliation, which was not anticipated and negatively impacted production in the first half of 2014. The decreases were partially offset by an increase in ore tons being placed on the leach pads and an increase in tons mined from the open pit resulting from the commissioning of new trucks at the end of 2013.
Cost of sales for the three and nine month periods ended September 30, 2014 increased by $7 million and $11 million, respectively, an increase of 4% and 2%, respectively, over the same prior year periods. The increases are primarily due to an increase in processing costs resulting from an increase in tons processed, higher reagent costs and a reduction in capitalized stripping costs; partially offset by the lower sales
| | | | |
BARRICK THIRD QUARTER 2014 | | 26 | | MANAGEMENT’S DISCUSSION AND ANALYSIS |
volumes. Adjusted operating costs were $478 per ounce for the three month period ended September 30, 2014, up $208 per ounce or 77% over the same prior year period. For the nine month period ended September 30, 2014, adjusted operating costs were $448 per ounce, up $242 per ounce or 117% over the same prior year period. The increases were primarily due to the impact of lower sales volume on unit production costs. All-in sustaining costs for the three and nine month periods ended September 30, 2014 increased by $119 per ounce and $247 per ounce, respectively, over the same prior year periods due to the higher adjusted operating costs, partially offset by a decrease in minesite sustaining capital expenditures.
In 2014, we now expect production to be 880 to 920 thousand ounces, which is below our previous guidance range of 925 to 975 thousand ounces. This is mainly due to a negative ore model reconciliation, which was not anticipated and negatively impacted production in the first half of 2014. In addition, the Company re-sequenced its ore processing schedule in order to facilitate the commissioning and ramp-up of the thiosulfate technology project at Goldstrike and to maximize overall ore recoveries. As a result, ore from Cortez that was to be processed at Goldstrike in fourth quarter 2014 has been deferred to early 2015. We now expect adjusted operating costs to be in the range of $460 - $490 per
ounce, which is higher than our previous guidance range of $350 to $380 per ounce. This is mainly due to the impact of lower production combined with an increase in expensed mining costs and a corresponding decrease in capitalized stripping costs as a result of a decrease in waste tons mined compared to the original mine plan for 2014. We continue to expect all-in sustaining costs to be at the high end of the range of $750 to $780 per ounce, primarily due to lower than expected production, partially offset by a decrease in minesite sustaining capital expenditures.
Goldrush
The Goldrush project, located about six kilometers from the Cortez mine, is progressing through a prefeasibility study which remains on schedule for completion in mid-2015. Infill drilling continues to demonstrate continuity of high grades. A number of development options are under consideration, including underground mining or a combination of both underground and open pit mining. Barrick is increasingly certain that there will be an underground mining component. Barrick submitted a permit application for an exploration decline in second quarter 2014. The decline will help to better define the existing resource and allow the company to test for additional mineralization beyond the northern end of the deposit.
Goldstrike
| | | | | | | | | | | | | | | | | | | | | | | | |
| Summary of Operating Data | | For the three months ended September 30 | | | For the nine months ended September 30 | |
| | | 2014 | | | 2013 | | | % Change | | | 2014 | | | 2013 | | | % Change | |
Total tons mined (000s) | | | 22,425 | | | | 22,436 | | | | - | | | | 67,949 | | | | 73,677 | | | | (8%) | |
Ore tons processed (000s) | | | 1,798 | | | | 1,871 | | | | (4%) | | | | 4,426 | | | | 5,673 | | | | (22%) | |
Average grade (ozs/ton) | | | 0.163 | | | | 0.153 | | | | 7% | | | | 0.192 | | | | 0.142 | | | | 35% | |
Gold produced (000s/oz) | | | 239 | | | | 233 | | | | 3% | | | | 715 | | | | 650 | | | | 10% | |
Gold sold (000s/oz) | | | 230 | | | | 206 | | | | 12% | | | | 713 | | | | 629 | | | | 13% | |
Cost of sales ($ millions) | | | $ 162 | | | | $ 145 | | | | 12% | | | | $ 502 | | | | $ 482 | | | | 4% | |
Adjusted operating costs (per oz)1 | | | $ 569 | | | | $ 566 | | | | 1% | | | | $ 559 | | | | $ 642 | | | | (13%) | |
All-in sustaining costs (per oz)1 | | | $ 921 | | | | $ 874 | | | | 5% | | | | $ 846 | | | | $ 955 | | | | (11%) | |
All-in costs (per oz)1 | | | $ 1,334 | | | | $ 1,144 | | | | 17% | | | | $ 1,157 | | | | $ 1,197 | | | | (3%) | |
| | |
| Summary of Financial Data | | For the three months ended September 30 | | | For the nine months ended September 30 | |
| | | 2014 | | | 2013 | | | % Change | | | 2014 | | | 2013 | | | % Change | |
Segment income ($ millions)2 | | | $ 132 | | | | $ 125 | | | | 6% | | | | $ 410 | | | | $ 426 | | | | (4%) | |
Capital expenditures ($ millions)3 | | | $ 173 | | | | $ 117 | | | | 48% | | | | $ 417 | | | | $ 341 | | | | 21% | |
Minesite sustaining | | | $ 78 | | | | $ 61 | | | | 28% | | | | $ 196 | | | | $ 189 | | | | 4% | |
Minesite expansion | | | $ 95 | | | | $ 56 | | | | 70% | | | | $ 221 | | | | $ 152 | | | | 45% | |
| 1 | Adjusted operating costs, all-in sustaining costs and all-in costs are non-GAAP financial performance measures with no standardized meaning under IFRS. For further information and a detailed reconciliation, please see page 47 of this MD&A. |
| 2 | Segment income excludes income taxes. |
| 3 | Amounts presented represent expenditures for minesite expansion and minesite sustaining (including mine development) on an accrual basis excluding capitalized interest. |
| | | | |
BARRICK THIRD QUARTER 2014 | | 27 | | MANAGEMENT’S DISCUSSION AND ANALYSIS |
Segment income for the three and nine month periods ended September 30, 2014 was $132 million and $410 million, respectively, an increase of 6% and decrease of 4%, respectively, over the same prior year periods. The increase in segment income for the three month period ended September 30, 2014 is due to an increase in sales volume combined with an increase in capitalized stripping costs; partially offset by a lower realized gold price. The decrease in segment income for the nine month period ended September 30, 2014 was primarily due to a lower realized gold price and an increase in underground mining costs and depreciation expense; partially offset by an increase in capitalized stripping costs. Capital expenditures for the three and nine month periods ended September 30, 2014 increased by 48% and 21%, respectively, over the same prior year periods. The increases were primarily due to an increase in minesite expansion capital expenditure as a result of construction activity at the thiosulfate technology project combined with an increase in minesite sustaining capital expenditures and an increase in capitalized stripping costs.
Gold production for the three and nine month periods ended September 30, 2014 increased by 3% and 10% over the same prior year periods. The increases were primarily due to higher grades from the open pit, combined with increased recoveries; partially offset by a decrease in ore tons processed.
Cost of sales increased by $17 million, or 12%, and $20 million, or 4%, for the three and nine month periods ended September 30, 2014, respectively. The increases were primarily due to the higher sales volume and an increase in depreciation expense; partially offset by a decrease in processing costs and an increase in capitalized stripping costs. Adjusted operating costs were $569 per ounce for the three month period ended September 30, 2014, up $3 per ounce and in line with the same prior year period. For the nine month period ended September 30, 2014, adjusted operating costs were $559 per ounce, down $83 per ounce or 13% over the same prior year period. The decrease was primarily due to the impact of higher sales volume on unit production costs. All-in sustaining costs for the three and nine month periods ended September 30, 2014 increased by $47 per ounce and decreased by $109 per ounce, respectively, over the same prior year periods. The increase for the three month period ended September 30, 2014 was primarily due to an increase in minesite sustaining capital expenditures due to an increase in capitalized stripping costs. The decrease for the nine month period ended September 30, 2014 was primarily due to the lower adjusted operating costs.
In 2014, we continue to expect production to be within the range of 865 to 915 thousand ounces mainly due to higher than expected ore grades from the open pit and the underground. We now expect adjusted operating costs to be in the range of $570 to $600 per ounce, which is below the low end of the previous guidance range of $600 to $640 per ounce, mainly due to lower processing costs as a result of processing less acidic ore and lower lime consumption at the roaster due to using a more efficient lime slaking process. We now expect all-in sustaining costs to be in the range of $870 to $900 per ounce, which is below the low end of the previous guidance range of $920 to $950 per ounce, mainly due to the impact of lower than expected adjusted operating costs and a decrease in sustaining capital expenditures.
Goldstrike thiosulfate technology project
Construction of the thiosulfate technology project, including the retrofitting of the existing plant and the construction of new installations, continued during the quarter. Modifications to the autoclave facility for the thiosulfate project are almost complete and will enable Goldstrike to accelerate the cash flow from about 4.0 million stockpiled ounces through the addition of a patented thiosulfate process. First gold production is on track for fourth quarter 2014, with an average annual contribution of about 350 to 450 thousand ounces of production at similar all-in sustaining costs to the overall operation in the first full five years following implementation of this process. In 2015, production is expected to exceed 1.0 million ounces1 with contributions from the thiosulfate process. Due to higher contractor installation costs, we now expect total project costs to be about $620 million, compared to our previous estimate of $585 million. About $545 million has been spent on the project to date.
| 1 | Actual results will vary depending on how the ramp-up of the thiosulfate project progresses. |
| | | | |
BARRICK THIRD QUARTER 2014 | | 28 | | MANAGEMENT’S DISCUSSION AND ANALYSIS |
Pueblo Viejo
| | | | | | | | | | | | | | | | | | | | | | | | |
| Summary of Operating Data | | For the three months ended September 30 | | | For the nine months ended September 30 | |
| | | 2014 | | | 2013 | | | % Change | | | 2014 | | | 2013 | | | % Change | |
Total tons mined (000s) | | | 5,957 | | | | 1,421 | | | | 319% | | | | 17,381 | | | | 5,773 | | | | 201% | |
Ore tons processed (000s) | | | 1,084 | | | | 673 | | | | 61% | | | | 3,240 | | | | 1,884 | | | | 72% | |
Average grade (ozs/ton) | | | 0.167 | | | | 0.182 | | | | (8%) | | | | 0.162 | | | | 0.186 | | | | (13%) | |
Gold produced (000s/oz) | | | 168 | | | | 113 | | | | 49% | | | | 488 | | | | 331 | | | | 47% | |
Gold sold (000s/oz) | | | 173 | | | | 116 | | | | 49% | | | | 503 | | | | 293 | | | | 72% | |
Cost of sales ($ millions) | | | $ 210 | | | | $ 165 | | | | 27% | | | | $ 615 | | | | $ 372 | | | | 65% | |
Adjusted operating costs (per oz)1 | | | $ 434 | | | | $ 584 | | | | (26%) | | | | $ 432 | | | | $ 547 | | | | (21%) | |
All-in sustaining costs (per oz)1 | | | $ 551 | | | | $ 770 | | | | (28%) | | | | $ 575 | | | | $ 743 | | | | (23%) | |
All-in costs (per oz)1 | | | $ 551 | | | | $ 906 | | | | (39%) | | | | $ 575 | | | | $ 854 | | | | (33%) | |
| | |
| Summary of Financial Data | | For the three months ended September 30 | | | For the nine months ended September 30 | |
| | | 2014 | | | 2013 | | | % Change | | | 2014 | | | 2013 | | | % Change | |
Segment income ($ millions)2 | | | $ 181 | | | | $ 109 | | | | 66% | | | | $ 528 | | | | $ 303 | | | | 74% | |
Capital expenditures ($ millions)3 | | | $ 17 | | | | $ 37 | | | | (54%) | | | | $ 59 | | | | $ 86 | | | | (31%) | |
Minesite sustaining | | | $ 17 | | | | $ 21 | | | | (19%) | | | | $ 59 | | | | $ 54 | | | | 9% | |
Minesite expansion | | | - | | | | - | | | | - | | | | - | | | | - | | | | - | |
Project capex | | | - | | | | $ 16 | | | | (100%) | | | | - | | | | $ 32 | | | | (100%) | |
| 1 | Adjusted operating costs, all-in sustaining costs and all-in costs are non-GAAP financial performance measures with no standardized meaning under IFRS. For further information and a detailed reconciliation, please see page 47 of this MD&A. |
| 2 | Segment income excludes income taxes. |
| 3 | Amounts presented represent our share of expenditures for minesite expansion, minesite sustaining (including mine development) as well as project development on an accrual basis excluding capitalized interest. |
Segment income for the three and nine month periods ended September 30, 2014 was $181 million and $528 million, respectively, an increase of 66% and 74%, respectively, from the same prior year periods. The increases were primarily due to increased sales volume as the minesite ramped up to full production; partially offset by a lower realized gold price. Capital expenditures for the three and nine months ended September 30, 2014 decreased by $20 million and $27 million, respectively, over the same prior year periods. The decreases were primarily due to a decrease in project capital expenditures resulting from the completion of the 215 megawatt power plant that was commissioned in third quarter 2013; partially offset by an increase in capitalized stripping costs.
Gold production for the three and nine month periods ended September 30, 2014 increased by 49% and 47%, respectively, over the same prior year periods. Production was higher in 2014 as the mine ramped up to full production and following the completion of major modifications to the autoclave facility in the second half of 2013, the mine worked to achieve design capacity and all four autoclaves came online. In second quarter 2014, the autoclaves achieved targeted and sustainable run rates. Modifications to the lime circuit are essentially complete and the mine is progressing toward design capacities on copper and silver.
Cost of sales for the three and nine month periods ended September 30, 2014 increased by $45 million and $243 million, respectively, an increase of 27% and 65%, respectively, over the same prior year periods. The increases were primarily due to increased sales volume including higher depreciation costs. Adjusted operating costs were $434 per ounce and $432 per ounce for the three and nine month periods ended September 30, 2014, respectively, a decrease of $150 per ounce and $115 per ounce, respectively, over the same prior year periods. The decreases were primarily due to increasedby-product credits and the impact of higher sales volume on unit production costs compared to the same prior year periods. All-in sustaining costs for the three and nine month periods ended September 30, 2014 decreased by $219 per ounce and $168 per ounce, respectively, over the same prior year periods due to the lower adjusted operating costs.
In 2014, we continue to expect production to be in the range of 600 to 700 thousand ounces at adjusted operating costs of $385 to $445 per ounce and all-in sustaining costs of $510 to $610 per ounce.
In October 2014, Pueblo Viejo Dominicana Corporation (“PVDC”) received a copy of an action filed in an administrative court in the Dominican Republic by Rafael Guillen Beltre (the “Petitioner”), who claims to be
| | | | |
BARRICK THIRD QUARTER 2014 | | 29 | | MANAGEMENT’S DISCUSSION AND ANALYSIS |
affiliated with the Dominican Christian Peace Organization. The Government of the Dominican Republic has also been notified of the action. The action alleges that environmental contamination in the vicinity of the Pueblo Viejo mine has caused illness and affected water quality in violation of the Petitioner’s fundamental rights under the Dominican Constitution and other laws. The primary relief sought in the action, which is styled as
an “Amparo” remedy, is the suspension of operations at the Pueblo Viejo mine as well as other mining projects in the area until an investigation into the alleged environmental contamination has been completed by the relevant governmental authorities. A hearing has been scheduled for November 21, 2014.
Lagunas Norte
| | | | | | | | | | | | | | | | | | | | | | | | |
| Summary of Operating Data | | For the three months ended September 30 | | | For the nine months ended September 30 | |
| | | 2014 | | | 2013 | | | % Change | | | 2014 | | | 2013 | | | % Change | |
Total tons mined (000s) | | | 15,909 | | | | 11,718 | | | | 36% | | | | 40,582 | | | | 28,551 | | | | 42% | |
Ore tons processed (000s) | | | 6,135 | | | | 6,244 | | | | (2%) | | | | 18,024 | | | | 17,363 | | | | 4% | |
Average grade (ozs/ton) | | | 0.027 | | | | 0.028 | | | | (4%) | | | | 0.028 | | | | 0.030 | | | | (7%) | |
Gold produced (000s/oz) | | | 157 | | | | 136 | | | | 15% | | | | 406 | | | | 412 | | | | (1%) | |
Gold sold (000s/oz) | | | 147 | | | | 134 | | | | 10% | | | | 417 | | | | 419 | | | | - | |
Cost of sales ($ millions) | | | $85 | | | | $63 | | | | 35% | | | | $ 214 | | | | $ 193 | | | | 11% | |
Adjusted operating costs (per oz)1 | | | $ 412 | | | | $ 370 | | | | 11% | | | | $ 382 | | | | $ 357 | | | | 7% | |
All-in sustaining costs (per oz)1 | | | $ 554 | | | | $ 696 | | | | (20%) | | | | $ 552 | | | | $ 633 | | | | (13%) | |
All-in costs (per oz)1 | | | $ 554 | | | | $ 696 | | | | (20%) | | | | $ 552 | | | | $ 633 | | | | (13%) | |
| | |
| Summary of Financial Data | | For the three months ended September 30 | | | For the nine months ended September 30 | |
| | | 2014 | | | 2013 | | | % Change | | | 2014 | | | 2013 | | | % Change | |
Segment income ($ millions)2 | | | $ 107 | | | | $ 114 | | | | (6%) | | | | $ 327 | | | | $ 412 | | | | (21%) | |
Capital expenditures ($ millions)3 | | | $ 16 | | | | $ 40 | | | | (60%) | | | | $ 58 | | | | $ 102 | | | | (43%) | |
Minesite sustaining | | | $ 16 | | | | $ 40 | | | | (60%) | | | | $ 58 | | | | $ 102 | | | | (43%) | |
Minesite expansion | | | - | | | | - | | | | - | | | | - | | | | - | | | | - | |
| 1 | Adjusted operating costs, all-in sustaining costs and all-in costs are non-GAAP financial performance measures with no standardized meaning under IFRS. For further information and a detailed reconciliation, please see page 47 of this MD&A. |
| 2 | Segment income excludes income taxes. |
| 3 | Amounts presented represent expenditures for minesite expansion and minesite sustaining (including mine development) on an accrual basis excluding capitalized interest. |
Segment income for the three and nine month periods ended September 30, 2014 was $107 million and $327 million, respectively, a decrease of 6% and 21%, respectively, from the same prior year periods. The decreases were primarily due to lower realized gold price combined with higher operating costs. In third quarter 2014, the lower gold price was partially offset by an increased sales volume. Capital expenditures for the three and nine month periods ended September 30, 2014 decreased by $24 million and $44 million, respectively, over the same prior year periods. The decreases are primarily due to the significant construction progress on the new phase 5 leach pad made in 2013 and which is now operational, combined with the water treatment plants which are currently undergoing commissioning.
Gold production for the three and nine month periods ended September 30, 2014 was 15% higher and 1% lower, respectively, compared to the same prior year periods. The increase for the three month period ended
September 30, 2014 was primarily due to a shorter recovery cycle resulting from the commencement of stacking and leaching ore on the first levels of the new phase 5 leach pad.
Cost of sales for the three and nine month periods ended September 30, 2014 increased by $22 million and $21 million, respectively, an increase of 35% and 11%, respectively, over the same prior year periods. The increases were primarily due to higher operating costs resulting from an increase in ore tons mined combined with higher depreciation expense. Adjusted operating costs were $412 per ounce for the three month period ended September 30, 2014, up $42 per ounce or 11% over the same prior year period. For the nine month period ended September 30, 2014, adjusted operating costs were $382 per ounce, up $25 per ounce or 7% over the same prior year period. The increases were primarily due to increased mining costs resulting from an increase in ore tons mined and higher community relations costs
| | | | |
BARRICK THIRD QUARTER 2014 | | 30 | | MANAGEMENT’S DISCUSSION AND ANALYSIS |
relating to agreements entered into with the local communities. All-in sustaining costs for the three and nine month periods ended September 30, 2014 decreased by $142 per ounce and $81 per ounce, respectively, over the same prior year periods due to lower minesite sustaining capital expenditures; partially offset by the higher adjusted operating costs.
In 2014, we continue to expect production to be in the range of 570 to 610 thousand ounces. We expect adjusted operating costs to be at the low end of the range of $390 to $430 per ounce and now expect all-in sustaining costs to be in the range of $590 to $620 per ounce, below the low end of the previous guidance range of $640 to $680 per ounce, mainly due to a decrease in sustaining capital expenditures.
Veladero
| | | | | | | | | | | | | | | | | | | | | | | | |
| Summary of Operating Data | | For the three months ended September 30 | | | For the nine months ended September 30 | |
| | | 2014 | | | 2013 | | | % Change | | | 2014 | | | 2013 | | | % Change | |
Total tons mined (000s) | | | 17,657 | | | | 18,950 | | | | (7%) | | | | 54,566 | | | | 65,384 | | | | (17%) | |
Ore tons processed (000s) | | | 8,002 | | | | 6,952 | | | | 15% | | | | 23,856 | | | | 24,182 | | | | (1%) | |
Average grade (ozs/ton) | | | 0.033 | | | | 0.030 | | | | 10% | | | | 0.030 | | | | 0.029 | | | | 3% | |
Gold produced (000s/oz) | | | 178 | | | | 154 | | | | 16% | | | | 525 | | | | 499 | | | | 5% | |
Gold sold (000s/oz) | | | 166 | | | | 156 | | | | 6% | | | | 527 | | | | 485 | | | | 9% | |
Cost of sales ($ millions) | | | $ 122 | | | | $ 141 | | | | (13%) | | | | $ 414 | | | | $ 407 | | | | 2% | |
Adjusted operating costs (per oz)1 | | | $ 576 | | | | $ 538 | | | | 7% | | | | $ 580 | | | | $ 458 | | | | 27% | |
All-in sustaining costs (per oz)1 | | | $ 822 | | | | $ 874 | | | | (6%) | | | | $ 786 | | | | $ 785 | | | | - | |
All-in costs (per oz)1 | | | $ 822 | | | | $ 874 | | | | (6%) | | | | $ 786 | | | | $ 785 | | | | - | |
| | |
| Summary of Financial Data | | For the three months ended September 30 | | | For the nine months ended September 30 | |
| | | 2014 | | | 2013 | | | % Change | | | 2014 | | | 2013 | | | % Change | |
Segment income ($ millions)2 | | | $ 71 | | | | $ 54 | | | | 31% | | | | $ 216 | | | | $ 281 | | | | (23%) | |
Capital expenditures ($ millions)3 | | | $ 40 | | | | $ 49 | | | | (18%) | | | | $ 104 | | | | $ 149 | | | | (30%) | |
Minesite sustaining | | | $ 40 | | | | $ 49 | | | | (18%) | | | | $ 104 | | | | $ 149 | | | | (30%) | |
Minesite expansion | | | - | | | | - | | | | - | | | | - | | | | - | | | | - | |
| 1 | Adjusted operating costs, all-in sustaining costs and all-in costs are non-GAAP financial performance measures with no standardized meaning under IFRS. For further information and a detailed reconciliation, please see page 47 of this MD&A. |
| 2 | Segment income excludes income taxes. |
| 3 | Amounts presented represent expenditures for minesite expansion and minesite sustaining (including mine development) on an accrual basis excluding capitalized interest. |
Segment income for the three and nine month periods ended September 30, 2014 was $71 million and $216 million, respectively, an increase of 31% and a decrease of 23%, respectively, from the same prior year periods. The increase for the three month period ended September 30, 2014 was primarily due to an increase in sales volume and lower costs of sales; partially offset by the lower realized gold price. The decrease for the nine month period ended September 30, 2014 was primarily due to the lower realized gold price combined with decreased silver by-product credits, partially offset by an increase in sales volume. Capital expenditures for the three and nine month periods ended September 30, 2014 decreased by $9 million and $45 million, respectively, over the same prior year periods, The decreases were primarily due to lower minesite sustaining capital expenditures as a result of a reduction in costs related to the leach pad expansion, as construction activities relating to both phase 4 and phase 5 were ongoing in the
first half of 2013, combined with lower capitalized stripping costs. This was partially offset by the commencement in third quarter 2014 of a project related to the recirculation of leach solution to achieve improved recoveries.
Gold production for the three and nine month periods ended September 30, 2014 was higher by 16% and 5%, respectively, compared to the same prior year periods. The increases were primarily due to a positive grade reconciliation from Phase 3 of the Federico pit. For the nine month period ended September 30, 2014, the increase was partially offset by lower tons processed due to decreased primary crusher availability resulting from increased maintenance downtime in first quarter 2014.
Cost of sales for the three and nine month periods ended September 30, 2014 decreased by $19 million, or 13%, and increased by $7 million, or 2%, respectively, over the
| | | | |
BARRICK THIRD QUARTER 2014 | | 31 | | MANAGEMENT’S DISCUSSION AND ANALYSIS |
same prior year periods. The decrease for the three month period ended September 30, 2014 was primarily due to lower depreciation expense as a result of impairment charges recorded in 2013, partially offset by the impact of higher sales volume. The increase for the nine month period ended September 30, 2014 was primarily due to an increase in sales volume, partially offset by lower operating costs due to the devaluation of the Argentine peso combined with lower depreciation expense. Adjusted operating costs were $576 per ounce for the three month period ended September 30, 2014, up $38 per ounce or 7% over the same prior year period. For the nine month period ended September 30, 2014, adjusted operating costs were $580 per ounce, up $122 per ounce or 27% over the same prior year period. The increases were primarily due to higher costs of sales and the impact of lower silver by-product credits, partially offset by the impact of higher production levels on unit production costs. All-in sustaining costs for the three month period ended September 30, 2014 decreased by $52 per ounce compared to the same prior year period. The decrease for the three months ended September 30, 2014 is primarily due to a reduction in capitalized stripping costs, partially offset by the higher adjusted operating costs.
In 2014, we now expect production to be 680 to 720 thousand ounces compared to our previous guidance range of 650 to 700 thousand ounces, mainly due to higher than expected ore grades following positive grade reconciliations over the second and third quarter. We now expect adjusted operating costs to be in the range of $560 to $590 per ounce, which is below the low end of the previous guidance range of $620 to $670 per ounce primarily due to the impact of higher production and higher than expected silver by-product credits. We now expect all-in sustaining costs to be in the range of $890 to $920 per ounce, which is below the low end of the previous guidance range of $940 to $990 per ounce, mainly due to the lower than expected adjusted operating costs.
On April 14, 2014, Veladero was formally notified that the Ministry of Mines approved the fourth update to Veladero’s environmental impact study, which incorporates permit amendments related to certain parameters for the pregnant solution storage area within the leach pad. These permit amendments require active management of the leach pad but are not expected to have any impact on our 2014 operating guidance.
North America Portfolio
| | | | | | | | | | | | | | | | | | | | | | | | |
| Summary of Operating Data | | For the three months ended September 30 | | | For the nine months ended September 30 | |
| | | 2014 | | | 2013 | | | % Change | | | 2014 | | | 2013 | | | % Change | |
Total tons mined (000s) | | | 29,598 | | | | 43,847 | | | | (32%) | | | | 97,672 | | | | 128,062 | | | | (24%) | |
Ore tons processed (000s) | | | 10,189 | | | | 7,343 | | | | 39% | | | | 26,910 | | | | 24,494 | | | | 10% | |
Average grade (ozs/ton) | | | 0.027 | | | | 0.031 | | | | (13%) | | | | 0.029 | | | | 0.028 | | | | 4% | |
Gold produced (000s/oz) | | | 213 | | | | 222 | | | | (4%) | | | | 641 | | | | 627 | | | | 2% | |
Gold sold (000s/oz) | | | 211 | | | | 209 | | | | 1% | | | | 661 | | | | 612 | | | | 8% | |
Cost of sales ($ millions) | | | $ 210 | | | | $ 226 | | | | (7%) | | | | $ 664 | | | | $ 666 | | | | - | |
Adjusted operating costs (per oz)1 | | | $ 759 | | | | $ 817 | | | | (7%) | | | | $ 748 | | | | $ 821 | | | | (9%) | |
All-in sustaining costs (per oz)1 | | | $ 980 | | | | $ 1,246 | | | | (21%) | | | | $ 967 | | | | $ 1,250 | | | | (23%) | |
All-in costs (per oz)1 | | | $ 980 | | | | $ 1,246 | | | | (21%) | | | | $ 967 | | | | $ 1,250 | | | | (23%) | |
| | |
| Summary of Financial Data | | For the three months ended September 30 | | | For the nine months ended September 30 | |
| | | 2014 | | | 2013 | | | % Change | | | 2014 | | | 2013 | | | % Change | |
Segment income ($ millions)2 | | | $ 56 | | | | $ 45 | | | | 24% | | | | $ 178 | | | | $ 213 | | | | (16%) | |
Capital expenditures ($ millions)3 | | | $ 39 | | | | $ 75 | | | | (48%) | | | | $ 120 | | | | $ 231 | | | | (48%) | |
Minesite sustaining | | | $ 39 | | | | $ 75 | | | | (48%) | | | | $ 120 | | | | $ 231 | | | | (48%) | |
Minesite expansion | | | - | | | | - | | | | - | | | | - | | | | - | | | | - | |
| 1 | Adjusted operating costs, all-in sustaining costs and all-in costs are non-GAAP financial performance measures with no standardized meaning under IFRS. For further information and a detailed reconciliation, please see page 47 of this MD&A. |
| 2 | Segment income excludes income taxes. |
| 3 | Amounts presented represent expenditures for minesite expansion and minesite sustaining (including mine development) on an accrual basis excluding capitalized interest. |
Segment income for the three and nine month periods ended September 30, 2014 was $56 million and $178 million, respectively, an increase of 24% and a decrease
of 16%, respectively, from the same prior year periods. The increase for the three month period ended September 30, 2014 was primarily due to a decrease in
| | | | |
BARRICK THIRD QUARTER 2014 | | 32 | | MANAGEMENT’S DISCUSSION AND ANALYSIS |
operating costs and an increase in sales volume; partially offset by a lower realized gold price. The decrease for the nine month period ended September 30, 2014 was primarily due to a lower realized gold price, partially offset by an increase in sales volume. Capital expenditures for the three and nine month periods ended September 30, 2014 decreased by $36 million and $111 million respectively, over the same prior year periods. The decreases were primarily due to lower capitalized stripping costs at Bald Mountain and Round Mountain and lower minesite sustaining capital expenditures.
For the three and nine month periods ended September 30, 2014, gold production decreased by 4% and increased by 2%, respectively, compared to the same prior year periods. The decrease for the three month period ended September 30, 2014 was primarily due to the sale of Marigold and lower production at Ruby Hill and Golden Sunlight; partially offset by higher production at Bald Mountain and Turquoise Ridge. The increase for the nine month period ended September 30, 2014 was primarily due to higher production at Bald Mountain and Turquoise Ridge; partially offset by lower production at Golden Sunlight.
For the three and nine month periods ended September 30, 2014, production at Golden Sunlight decreased 24% and 15%, respectively, over the same prior year periods due to high wall stability issues, resulting in limited access to higher grade ore. Production at Ruby Hill decreased by 79% and 48%, respectively, over the same prior year periods due to the cessation of mining in November 2013 after a failure of the high wall, resulting in only residual ounces being recovered from the leach pad. For the three and nine months period ended September 30, 2014 production at Bald Mountain increased by 45% and 31%, respectively, compared to the same prior year periods due to the processing of increased ore tons as the mine went through a significant development phase in 2013. Production at Turquoise Ridge increased by 29% and 37%, respectively, over the same prior year periods due to increased throughput and improved ore grades.
Cost of sales decreased by $16 million, or 7%, for the three month period ended September 30, 2014 compared to the same prior year period. The decrease in costs of sales for the three months ended September 30, 2014 was primarily due to lower operating costs as a result of the sale of Marigold and the closure of an underground mine at Hemlo in second quarter 2014. For the nine month period ended September 30, 2014, costs of sales was in line with the same prior year period. Adjusted operating costs were $759 per ounce and $748 per
ounce for the three and nine month periods ended September 30, 2014, respectively, a decrease of $58 per ounce and $73 per ounce, respectively, over the same prior year periods. The decreases were primarily due to lower operating costs combined with the impact of higher sales volume on unit production costs. All-in sustaining costs for the three and nine month periods ended September 30, 2014 decreased by $266 per ounce and $283 per ounce, respectively, over the same prior year periods due to lower per ounce adjusted operating costs combined with lower minesite sustaining capital expenditures.
In 2014, we now expect production to be at the high end of the guidance range of 795 to 845 thousand ounces mainly due to higher than expected ore grades at Turquoise Ridge and Round Mountain. We now expect adjusted operating costs to be in the range of $750 to $775 per ounce and all-in sustaining costs to be in the range of $980 to $1,000 per ounce, which are both lower than our previous guidance ranges of $780 to $805 per ounce and $1,075 to $1,100 per ounce respectively, mainly due to the impact of the higher than expected production.
| | | | |
BARRICK THIRD QUARTER 2014 | | 33 | | MANAGEMENT’S DISCUSSION AND ANALYSIS |
Australia Pacific
| | | | | | | | | | | | | | | | | | | | | | | | |
| Summary of Operating Data | | For the three months ended September 30 | | | For the nine months ended September 30 | |
| | | 2014 | | | 2013 | | | % Change | | | 2014 | | | 2013 | | | % Change | |
Total tons mined (000s) | | | 21,128 | | | | 26,118 | | | | (19%) | | | | 66,211 | | | | 74,077 | | | | (11%) | |
Ore tons processed (000s) | | | 5,191 | | | | 6,959 | | | | (25%) | | | | 15,830 | | | | 19,972 | | | | (21%) | |
Average grade (ozs/ton) | | | 0.066 | | | | 0.082 | | | | (20%) | | | | 0.064 | | | | 0.081 | | | | (21%) | |
Gold produced (000s/oz) | | | 292 | | | | 497 | | | | (41%) | | | | 865 | | | | 1,409 | | | | (39%) | |
Gold sold (000s/oz) | | | 283 | | | | 489 | | | | (42%) | | | | 867 | | | | 1,396 | | | | (38%) | |
Cost of sales ($ millions) | | | $ 256 | | | | $ 420 | | | | (39%) | | | | $ 788 | | | | $ 1,326 | | | | (41%) | |
Adjusted operating costs (per oz)1 | | | $ 722 | | | | $ 690 | | | | 5% | | | | $ 722 | | | | $ 737 | | | | (2%) | |
All-in sustaining costs (per oz)1 | | | $ 855 | | | | $ 920 | | | | (7%) | | | | $ 851 | | | | $ 1,001 | | | | (15%) | |
All-in costs (per oz)1 | | | $ 855 | | | | $ 920 | | | | (7%) | | | | $ 851 | | | | $ 1,001 | | | | (15%) | |
| | |
| Summary of Financial Data | | For the three months ended September 30 | | | For the nine months ended September 30 | |
| | | 2014 | | | 2013 | | | % Change | | | 2014 | | | 2013 | | | % Change | |
Segment income ($ millions)2 | | | $ 135 | | | | $ 219 | | | | (38%) | | | | $ 322 | | | | $ 753 | | | | (57%) | |
Capital expenditures ($ millions)3 | | | $ 29 | | | | $ 102 | | | | (72%) | | | | $ 95 | | | | $ 333 | | | | (71%) | |
Minesite sustaining | | | $ 29 | | | | $ 102 | | | | (72%) | | | | $ 95 | | | | $ 333 | | | | (71%) | |
Minesite expansion | | | - | | | | - | | | | - | | | | - | | | | - | | | | - | |
| 1 | Adjusted operating costs, all-in sustaining costs and all-in costs are non-GAAP financial performance measures with no standardized meaning under IFRS. For further information and a detailed reconciliation, please see page 47 of this MD&A. |
| 2 | Segment income excludes income taxes. |
| 3 | Amounts presented represent expenditures for minesite expansion and minesite sustaining (including mine development) on an accrual basis excluding capitalized interest. |
Segment income for the three and nine month periods ended September 30, 2014 was $135 million and $322 million, respectively, a decrease of 38% and 57%, respectively, from the same prior year periods. The decreases were primarily due to lower sales volumes, resulting from the sale of the Plutonic, Kanowna and Yilgarn South assets, combined with the impact of the lower realized gold price. Capital expenditures for the three and nine month periods ended September 30, 2014 decreased by $73 million and $238 million, respectively, over the same prior year periods. The decreases were primarily due to a reduction in the number of operating sites within the operating segment combined with a decrease in capitalized stripping costs at the remaining sites.
Gold production for the three and nine month periods ended September 30, 2014 was lower by 41% and 39%, respectively, compared to the same prior year periods. The decreases were primarily due to the disposal of the Yilgarn South assets at the end of 2013 and the disposal of the Kanowna and Plutonic assets during first quarter 2014, which produced a combined 0.22 million ounces and 0.59 million ounces in third quarter 2013 and the first nine months of 2013, respectively. For the three month period ended September 30, 2014, production at the remaining sites was higher than the same prior year period, with the exception of Kalgoorlie. For the nine month period ended September 30, 2014, higher production at Porgera and Kalgoorlie was partially offset
by lower production at Cowal. Production at Porgera was higher due to higher recoveries and throughput, while at Kalgoorlie the increased production was primarily due to higher mill recovery rates.
Cost of sales for the three and nine month periods ended September 30, 2014 decreased by $164 million and $538 million, respectively, a decrease of 39% and 41%, respectively, over the same prior year periods. The decreases were primarily due to lower sales volume as a result of the disposal of the Yilgarn South, Plutonic and Kanowna assets, which were all higher cost mines. This was partially offset by an increase in cost of sales at the remaining mines compared to the same prior year period primarily due to a decrease in capitalized stripping. Adjusted operating costs were $722 per ounce for the three month period ended September 30, 2014, up $32 per ounce or 5%, over the same prior year period. For the nine month period ended September 30, 2014, adjusted operating costs were $722 per ounce, down $15 per ounce or 2%, over the same prior year period. The increase for the three month period ended September 30, 2014 is primarily due to the impact of lower sales volume on unit production costs. The decrease for the nine month period ended September 30, 2014 reflects the disposal of the segment’s higher cost mines. All-in sustaining costs for the three and nine month periods ended September 30, 2014 decreased by $65 per ounce and $150 per ounce, respectively, over the same prior
| | | | |
BARRICK THIRD QUARTER 2014 | | 34 | | MANAGEMENT’S DISCUSSION AND ANALYSIS |
year periods reflecting a significant decrease in minesite sustaining capital expenditures.
In 2014, we now expect production to be in the range of 1,050 to 1,125 thousand ounces, which is higher than our previous guidance range of 1,000 to 1,080 thousand ounces, primarily due to higher production at Porgera as a result of higher throughput and processed grade resulting from higher than expected ore tonnes from Stage 5A of the open pit and higher tonnes from the underground as mining rates continue to ramp up. We now expect adjusted operating costs to be in the range
of $725 to $750 per ounce, which is lower than our previous guidance range of $825 to $875 per ounce, mainly due to the impact of higher production and lower direct operating costs as a result of lower power costs at Cowal and lower open pit costs at Porgera. We now expect all-in sustaining costs to be in the range of $885 to $910 per ounce, which is lower than our previous guidance range of $1,050 to $1,100 per ounce, mainly due the impact of lower than expected adjusted operating costs and a decrease in sustaining capital expenditures for the operating unit.
African Barrick Gold
| | | | | | | | | | | | | | | | | | | | | | | | |
| 100% basis | | | | | | | | | | | | | | | | | | |
| Summary of Operating Data | | For the three months ended September 30 | | | For the nine months ended September 30 | |
| | | 2014 | | | 2013 | | | % Change | | | 2014 | | | 2013 | | | % Change | |
Total tons mined (000s) | | | 12,142 | | | | 14,758 | | | | (18%) | | | | 34,071 | | | | 46,882 | | | | (27%) | |
Ore tons processed (000s) | | | 2,467 | | | | 2,330 | | | | 6% | | | | 6,631 | | | | 6,792 | | | | (2%) | |
Average grade (ozs/ton) | | | 0.103 | | | | 0.079 | | | | 30% | | | | 0.095 | | | | 0.080 | | | | 19% | |
Gold produced (000s/oz) | | | 191 | | | | 165 | | | | 16% | | | | 537 | | | | 476 | | | | 13% | |
Gold sold (000s/oz) | | | 178 | | | | 162 | | | | 10% | | | | 509 | | | | 482 | | | | 6% | |
Cost of sales ($ millions) | | | $ 164 | | | | $ 158 | | | | 4% | | | | $ 493 | | | | $ 572 | | | | (14%) | |
Adjusted operating costs (per oz)1 | | | $ 692 | | | | $ 748 | | | | (7%) | | | | $ 740 | | | | $ 862 | | | | (14%) | |
All-in sustaining costs (per oz)1 | | | $ 1,098 | | | | $ 1,270 | | | | (14%) | | | | $ 1,111 | | | | $ 1,411 | | | | (21%) | |
All-in costs (per oz)1 | | | $ 1,159 | | | | $ 1,293 | | | | (10%) | | | | $ 1,139 | | | | $ 1,489 | | | | (24%) | |
| | |
| Summary of Financial Data | | For the three months ended September 30 | | | For the nine months ended September 30 | |
| | | 2014 | | | 2013 | | | % Change | | | 2014 | | | 2013 | | | % Change | |
Segment income ($ millions)2 | | | $ 61 | | | | $ 58 | | | | 5% | | | | $ 142 | | | | $ 107 | | | | 33% | |
Capital expenditures ($ millions)3 | | | $ 80 | | | | $ 88 | | | | (9%) | | | | $ 193 | | | | $ 294 | | | | (34%) | |
Minesite sustaining | | | $ 59 | | | | $ 67 | | | | (12%) | | | | $ 148 | | | | $ 222 | | | | (33%) | |
Minesite expansion | | | $ 21 | | | | $ 21 | | | | - | | | | $ 45 | | | | $ 72 | | | | (38%) | |
| 1 | Adjusted operating costs, all-in sustaining costs and all-in costs are non-GAAP financial performance measures with no standardized meaning under IFRS. For further information and a detailed reconciliation, please see page 47 of this MD&A. |
| 2 | Segment income excludes income taxes. |
| 3 | Amounts presented represent expenditures for minesite expansion and minesite sustaining (including mine development) on an accrual basis excluding capitalized interest. |
Segment income for the three and nine month periods ended September 30, 2014 was $61 million and $142 million, respectively, an increase of 5% and 33%, respectively, from the same prior year periods. The increases were primarily due to higher sales volumes, partially offset by lower realized gold prices. Capital expenditures for the three and nine month periods ended September 30, 2014 decreased by $8 million and $101 million, respectively, over the same prior year periods. The decrease for the three month period ended September 30, 2014 was primarily due a reduction in minesite sustaining capital expenditures at North Mara. The decrease for the nine month period ended September 30, 2014 was primarily due to a reduction in minesite sustaining capital expenditures across all sites;
partially offset by higher capitalized stripping costs at Buzwagi.
Gold production for the three and nine month periods ended September 30, 2014 was higher by 16% and 13%, respectively, compared to the same prior year periods. The increases were due to higher production at Bulyanhulu and Buzwagi for the three month period ended September 30, 2014, partially offset by lower production at North Mara. For the nine month period ended September 30, 2014, production was higher across all sites.
| | | | |
BARRICK THIRD QUARTER 2014 | | 35 | | MANAGEMENT’S DISCUSSION AND ANALYSIS |
For the three and nine month periods ended September 30, 2014, production at Buzwagi increased by 43% and 27%, respectively, over the same prior year periods, mainly due to higher ore grades and recovery rates. For the three and nine month periods ended September 30, 2014 production at Bulyanhulu increased by 21% and 16%, respectively, over the same prior year periods. The increases were primarily due to an increase in ore grades combined with the contribution of ounces in third quarter 2014 from the CIL plant that is in the final stages of commissioning. For the three and nine month periods ended September 30, 2014 production at North Mara decreased by 5% and increased by 3%, respectively, over the same prior year periods. The decrease for the three month period ended September 30, 2014 was primarily due to lower ore grades, as expected, resulting from the increased mining of lower grade ore tons from the Nyabirama pit. The increase for the nine month period ended September 30, 2014 was primarily due to the processing of more ore tons at slightly higher recovery rates.
Cost of sales for the three and nine month periods ended September 30, 2014 increased by $6 million and decreased $79 million, respectively, an increase of 4% and decrease of 14%, respectively, over the same prior year periods. The increase for the three month period
ended September 30, 2014 was primarily due to higher consumables, maintenance and contracted services costs. The decrease for the nine month period ended September 30, 2014 was primarily due to lower labour costs, partially offset by higher consumable costs and increased maintenance costs. Adjusted operating costs for the three and nine month periods ended September 30, 2014 were $692 per ounce and $740 per ounce, respectively, down $56 per ounce and $122 per ounce, respectively, over the same prior year period. The decreases were primarily due to the reduction in costs of sales combined with the impact of higher production levels on unit production costs. All-in sustaining costs for the three and nine month periods ended September 30, 2014 decreased by $172 per ounce and $300 per ounce, respectively, over the same prior year periods reflecting the lower per ounce adjusted operating costs and a decrease in minesite sustaining capital expenditures.
In 2014, we continue to expect production to be above the high end of the range of 430 to 460 thousand ounces (Barrick’s share), adjusted operating costs to be at the low end of the range of $740 to $790 per ounce and all-in sustaining costs to be at the low end of the range of $1,100 to $1,175 per ounce for the operating unit.
Global Copper
| | | | | | | | | | | | | | | | | | | | | | | | |
| Summary of Operating Data | | For the three months ended September 30 | | | For the nine months ended September 30 | |
| | | 2014 | | | 2013 | | | % Change | | | 2014 | | | 2013 | | | % Change | |
Copper produced (millions of lbs) | | | 131 | | | | 139 | | | | (6%) | | | | 302 | | | | 400 | | | | (25%) | |
Copper sold (millions of lbs) | | | 113 | | | | 135 | | | | (16%) | | | | 296 | | | | 385 | | | | (23%) | |
Cost of sales ($ millions) | | | $ 229 | | | | $ 247 | | | | (7%) | | | | $ 677 | | | | $ 824 | | | | (18%) | |
C1 cash costs (per lb)1 | | | $ 1.82 | | | | $ 1.69 | | | | 8% | | | | $ 1.98 | | | | $ 1.94 | | | | 2% | |
C3 fully allocated costs (per lb)1 | | | $ 2.36 | | | | $ 2.15 | | | | 10% | | | | $ 2.50 | | | | $ 2.45 | | | | 2% | |
| | |
| Summary of Financial Data | | For the three months ended September 30 | | | For the nine months ended September 30 | |
| | | 2014 | | | 2013 | | | % Change | | | 2014 | | | 2013 | | | % Change | |
Segment income ($ millions)2 | | | $ 80 | | | | $ 165 | | | | (52%) | | | | $ 155 | | | | $ 353 | | | | (56%) | |
Capital expenditures ($ millions)3 | | | $ 89 | | | | $ 118 | | | | (25%) | | | | $ 240 | | | | $ 342 | | | | (30%) | |
Minesite sustaining | | | $ 89 | | | | $ 110 | | | | (19%) | | | | $ 233 | | | | $ 289 | | | | (19%) | |
Minesite expansion | | | - | | | | - | | | | - | | | | - | | | | - | | | | - | |
Project capex | | | - | | | | $8 | | | | (100%) | | | | $ 7 | | | | $ 53 | | | | (87%) | |
| 1 | C1 cash costs and C3 fully allocated costs per pound are non-GAAP financial performance measures with no standardized definition under IFRS. For further information and a detailed reconciliation, please see page 50 of this MD&A. |
| 2 | Segment income excludes income taxes. |
| 3 | Amounts presented represent expenditures for minesite expansion, minesite sustaining (including mine development) as well as project development on an accrual basis excluding capitalized interest. |
Segment income for the three and nine month periods ended September 30, 2014 was $80 million and $155 million, respectively, a decrease of 52% and 56%, respectively, from the same prior year periods. The
decreases were primarily due to a decrease in sales volume combined with a lower realized copper price. For the nine month period ended September 30, 2014, the lower sales volume at Lumwana was primarily due to the
| | | | |
BARRICK THIRD QUARTER 2014 | | 36 | | MANAGEMENT’S DISCUSSION AND ANALYSIS |
mill shutdown that occurred for a significant portion of second quarter 2014 as a result of the partial collapse of the terminal end of the main conveyor. This incident resulted in an impairment charge of $5 million and the incurring of $10 million in abnormal costs in second quarter 2014. Capital expenditures for the three and nine month periods ended September 30, 2014 decreased by $28 million and $102 million, respectively, over the same prior year periods. The decreases were primarily due to lower minesite sustaining capital expenditures at Lumwana and Zaldívar due to the deferral of expenditures, as well as lower project capital expenditures at Jabal Sayid, which was put on care and maintenance in late 2013.
Copper production for the three and nine month periods ended September 30, 2014 was lower by 6% and 25%, respectively, compared to the same prior year periods. The decrease for the three month period ended September 30, 2014 was primarily due to lower production at Zaldívar resulting from lower tons processed combined with a higher proportion of sulfide material, which has a lower recovery rate. The decrease for the nine month period ended September 30, 2014 was primarily the result of the conveyor collapse that occurred in second quarter 2014 at Lumwana, which resulted in the shutdown of the mill and concentrate production for a significant portion of the second quarter 2014, combined with the adverse effect of an unusually long and severe rainy season in Zambia during second quarter 2014.
Cost of sales for the three and nine month periods ended September 30, 2014 decreased by $18 million and $147 million, respectively, a decrease of 7% and 18%, respectively, over the same prior year periods. The decreases were primarily due to the lower sales volumes compared to the same prior year periods. C1 cash costs for the three and nine month periods ended September 30, 2014 were $1.82 per pound and $1.98 per pound, respectively, up $0.13 per pound and $0.04 per pound, respectively, from the same prior year periods. The increases in C1 cash costs were due to the impact of decreased production levels on unit production costs. C3 fully allocated costs per pound for the three and nine month periods ended September 30, 2014 were $2.36 per pound and $2.50 per pound, respectively, up $0.21 per pound and $0.05 per pound, respectively, from the same
prior year periods. The increases primarily reflect the effect of the above factors on C1 cash costs.
As a result of the conveyor at Lumwana coming back online sooner than expected, we now expect copper production for 2014 to be in the range of 440 to 460 million pounds, higher than our most recent guidance range of 410 to 440 million pounds. We now expect C1 cash costs to be within a narrowed range of $1.90 to 2.00 per pound, compared to our previous guidance range of $1.90 to $2.10 per pound and now expect C3 fully allocated costs to also be within a narrowed range of $2.50 to $2.60 per pound, compared to our previous guidance range of $2.50 to $2.75 per pound.
On October 10, 2014, the Zambian government proposed changes to the country’s mining tax regime that would replace the current corporate income tax and variable profit tax with a 20 percent royalty which, if approved, would take effect on January 1, 2015. The application of a 20 percent royalty rate compared to the 6 percent royalty the company is currently paying would challenge the economic viability of the mine. If this tax change is ratified by parliament and implemented as proposed, the royalty could create an unsustainable level of taxation for Lumwana that could result in impairment to the carrying value of the Lumwana asset at current market prices for copper. It may also result in a substantial portion of Lumwana’s reserves being reclassified as resources.
On April 2, 2014 Zambia’s energy regulator approved a 28.8% electricity price increase for mining companies. Subsequently, the bulk power supply agreement tariffs between state power company ZESCO and Copperbelt Energy Corporation were increased to 6.84 cents per KWhr from 5.31 cents per KWhr. The Lumwana Mining Company has a long term power supply contract with ZESCO and does not believe that the rates it pays thereunder should be affected by the announced rate increase. Lumwana and several other mining companies in Zambia have been granted leave to challenge the rate increase in court. To the extent there are significant negative changes to the operating costs of Lumwana as a result of any future increase in electricity rates, the current carrying amount of the mine may not be fully recoverable, which would result in an impairment charge being recorded.
| | | | |
BARRICK THIRD QUARTER 2014 | | 37 | | MANAGEMENT’S DISCUSSION AND ANALYSIS |
FINANCIAL CONDITION REVIEW
| | | | | | | | |
| Summary Balance Sheet and Key Financial Ratios1 | | | | | | |
| ($ millions, except ratios and share amounts) | | As at September 30, 2014 | | | As at December 31, 2013 | |
Total cash and equivalents | | | $ 2,705 | | | | $ 2,424 | |
Current assets | | | 4,004 | | | | 3,588 | |
Non-current assets | | | 30,781 | | | | 31,436 | |
Total Assets | | | $ 37,490 | | | | $ 37,448 | |
Current liabilities excluding short-term debt | | | $ 2,232 | | | | $2,626 | |
Non-current liabilities excluding long-term debt | | | 6,141 | | | | 5,741 | |
Debt (current and long-term) | | | 13,094 | | | | 13,080 | |
Total Liabilities | | | $ 21,467 | | | | $ 21,447 | |
Total shareholders’ equity | | | 13,237 | | | | 13,533 | |
Non-controlling interests | | | 2,786 | | | | 2,468 | |
Total Equity | | | $ 16,023 | | | | $ 16,001 | |
Dividends | | | $175 | | | | $508 | |
Debt | | | $ 13,094 | | | | $ 13,080 | |
Total common shares outstanding (millions of shares)2 | | | 1,165 | | | | 1,165 | |
Key Financial Ratios: | | | | | | | | |
Current ratio3 | | | 2.75:1 | | | | 2.14:1 | |
Debt-to-equity4 | | | 0.82:1 | | | | 0.82:1 | |
Debt-to-total capitalization5 | | | 0.39:1 | | | | 0.39:1 | |
| 1 | Figures include assets and liabilities classified as held-for-sale as at September 30, 2014 and December 31, 2013. |
| 2 | Total common shares outstanding do not include 5.8 million stock options. |
| 3 | Represents current assets divided by current liabilities (including short-term debt) as at September 30, 2014 and December 31, 2013. |
| 4 | Represents debt divided by total shareholders’ equity (including minority interest) as at September 30, 2014 and December 31, 2013. |
| 5 | Represents debt divided by capital stock and long-term debt as at September 30, 2014 and December 31, 2013. |
Balance Sheet Review
Total assets were $37.5 billion at September 30, 2014, in line with total assets at December 31, 2013. Our asset base is primarily comprised of non-current assets such as property, plant and equipment and goodwill, reflecting the capital intensive nature of the mining business and our history of growing through acquisitions. Other significant assets include production inventories and cash and equivalents. We typically do not carry a material accounts receivable balance, since only sales of concentrate and copper cathode have a settlement period.
Total liabilities at September 30, 2014 totaled $21.4 billion, consistent with total liabilities at December 31, 2013.
| | | | |
Shareholders’ Equity | | | | |
| |
As at October 21, 2014 | | | Number of shares | |
Common shares | | | 1,164,669,608 | |
Stock options | | | 5,805,251 | |
Comprehensive Income
Comprehensive income consists of net income or loss, together with certain other economic gains and losses, which, collectively, are described as “other comprehensive income” or “OCI”, and excluded from the income statement.
In third quarter 2014, other comprehensive income was a loss of $92 million on an after-tax basis. The decrease of $92 million reflected: (i) a $2 million loss recorded as a result of changes in the fair value of investments held during the quarter; (ii) losses of $35 million on hedge contracts designated for future periods, caused primarily by changes in currency exchange rates, copper prices and fuel prices; (iii) $7 million of gains transferred out of OCI on sale of investments; (iv) $26 million of losses for currency translation adjustments; (v) reclassification adjustments totaling $22 million for gains on hedge contracts designated for 2014 (or ineffective amounts) that were transferred to earnings or property, plant and equipment in conjunction with the recognition of the related hedge exposure.
| | | | |
BARRICK THIRD QUARTER 2014 | | 38 | | MANAGEMENT’S DISCUSSION AND ANALYSIS |
Included in accumulated other comprehensive income at September 30, 2014 were unrealized pre-tax losses on currency, commodity and interest rate hedge contracts totaling $46 million. The balance primarily relates to currency hedge contracts that are designated against operating costs and capital expenditures, primarily over the next three years, including $23 million remaining in crystallized hedge gains, and $23 million remaining in crystallized hedge losses related to our Australian dollar contracts that were settled in the third quarter of 2012 or closed out in the second half of 2013, $21 million in crystallized hedge gains related to our silver contracts and $2 million in crystallized hedge gains related to our Chilean peso contracts that were settled in the second quarter of 2013. These hedge gains/losses are expected to be recorded in earnings at the same time the corresponding hedged operating costs/depreciation are recorded in earnings.
Financial Position and Liquidity
Our capital structure comprises a mix of debt and shareholders’ equity. As at September 30, 2014, our total debt was $13.1 billion (debt net of cash and equivalents was $10.4 billion) and our debt-to-equity ratio and debt-to-total capitalization ratios were 0.82:1 and 0.39:1, respectively. This compares to debt as at December 31, 2013 of $13.1 billion (debt net of cash and equivalents was $10.7 billion), and debt-to-equity and debt-to-total capitalization ratios of 0.82:1 and 0.39:1, respectively. We have attributable debt of approximately $200 million maturing by the end of 2015 and less than $1 billion due by the end of 2017 (refer to note 19B for further details). Our $4.0 billion revolving credit facility (“2012 Credit Facility”) is fully undrawn and expires in January 2019.
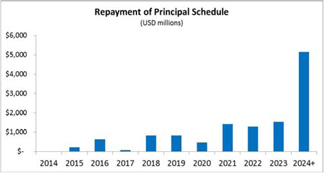
| 1 | Amounts exclude capital leases and include 60% of the Pueblo Viejo financing and 100% of the ABG financing. |
Our primary source of liquidity is our operating cash flow, which is dependent on the ability of our operations to deliver projected future cash flows. Other options to enhance liquidity include drawing the $4.0 billion available under our 2012 Credit Facility (subject to compliance with covenants and the making of certain representations and warranties, this facility is available for drawdown as a source of financing), further asset sales and issuances of debt or equity securities in the public markets or to private investors, which could be undertaken for liquidity enhancement and/or in connection with establishing a strategic partnership. Many factors, including but not limited to, general market conditions and then prevailing metals prices could impact our ability to issue securities on acceptable terms, as could our credit ratings. Moody’s and S&P currently rate our long-term debt Baa2 and BBB, respectively. Changes in our ratings could affect the trading prices of our securities and our cost of capital. If we were to borrow under our 2012 Credit Facility, the applicable interest rate on the amounts borrowed would be based, in part, on our credit ratings at the time. The key financial covenant in the 2012 Credit Facility (undrawn as at September 30, 2014) requires Barrick to maintain a consolidated tangible net worth (“CTNW”) of at least $3.0 billion (Barrick’s CTNW was $7.3 billion as at September 30, 2014).
Cash and equivalents and cash flow
Total cash and cash equivalents as at September 30, 2014 were $2.7 billion2. Our cash position consists of a mix of term deposits, treasury bills and money market investments and is primarily denominated in US dollars.
| 2 | Includes $557 million cash held at ABG and Pueblo Viejo, which may not be readily deployed outside of ABG and/or Pueblo Viejo. |
| | | | |
BARRICK THIRD QUARTER 2014 | | 39 | | MANAGEMENT’S DISCUSSION AND ANALYSIS |
Summary of Cash Inflow (Outflow)
| | | | | | | | | | | | | | | | |
| ($ millions) | | For the three months
ended September 30 | | | For the nine months
ended September 30 | |
| | | 2014 | | | 2013 | | | 2014 | | | 2013 | |
Operating inflows | | | $ 852 | | | | $ 1,231 | | | | $ 1,925 | | | | $ 3,223 | |
Investing activities | | | | | | | | | | | | | | | | |
Capital Expenditures1 | | | $ (653) | | | | $ (1,205) | | | | $ (1,885) | | | | $ (4,136) | |
Divestitures | | | - | | | | 417 | | | | 166 | | | | 417 | |
Other | | | 83 | | | | (93) | | | | 93 | | | | (260) | |
Total investing outflows | | | $ (570) | | | | $ (881) | | | | $ (1,626) | | | | $ (3,979) | |
Financing activities | | | | | | | | | | | | | | | | |
Net change in debt | | | $ (65) | | | | $ (441) | | | | $ (25) | | | | $ 1,398 | |
Dividends | | | (59) | | | | (50) | | | | (175) | | | | (450) | |
Net proceeds from share sale in ABG | | | - | | | | - | | | | 186 | | | | - | |
Other | | | 2 | | | | (5) | | | | 4 | | | | 6 | |
Total financing (outflows) inflows | | | $ (122) | | | | $ (496) | | | | $ (10) | | | | $ 954 | |
Effect of exchange rate | | | (4) | | | | (1) | | | | (8) | | | | (12) | |
Increase/(decrease) in cash and equivalent | | | 156 | | | | (147) | | | | 281 | | | | 186 | |
| 1 | The amounts include capitalized interest of $2 million for the three months ended September 30, 2014 (2013: $51 million) and $15 million for the nine months ended September 30, 2014 (2013: $188 million). |
In third quarter 2014, we generated $852 million in operating cash flow, compared to $1.2 billion of operating cash flow in the same prior year period. In the nine month period of 2014, we generated $1.9 billion in operating cash flow, compared to $3.2 billion of operating cash flow in the same prior year period. The decreases in operating cash flow primarily reflect lower gross margin levels, primarily due to lower sales volumes and lower realized gold and copper prices; partially offset by a decrease in income tax payments of $71 million and $387 million for the three and nine month periods ended September 30, 2014, respectively. The most significant driver of the change in operating cash flow is market gold and copper prices. The ability of our operations to deliver projected future cash flows within the parameters of a reduced production profile, as well as future changes in gold and copper market prices, either favorable or unfavorable, will continue to have a material impact on our cash flow and liquidity. The principal uses of operating cash flow are to fund our capital expenditures, interest and dividend payments.
Cash used in investing activities amounted to $570 million and $1.6 billion for the three and nine month periods ended September 30, 2014, respectively. The decreases of $311 million and $2.4 billion, respectively,
compared to the same prior year periods, are primarily due to a decrease in capital expenditures as well as divestitures relating to our Plutonic, Kanowna and Marigold sites that occurred in the first nine months of 2014. In third quarter 2014, capital expenditures on a cash basis were $653 million, while in the nine month period of 2014 capital expenditures on a cash basis were $1.9 billion. The decreases of $552 million and $2.3 billion, respectively, compared to the same prior year periods, are primarily due to a decrease in project capital expenditures due to the decision made in fourth quarter 2013 to temporarily suspend the Pascua-Lama project, and a decrease in minesite sustaining capital across most sites. The decrease in minesite expansion expenditures was primarily due to a decrease at Pueblo Viejo due to the completion of the power plant in fourth quarter 2013.
Net financing cash outflows for the three month period ended September 30, 2014 amounted to $122 million, compared to $496 million in cash outflows in the same prior year period. For the nine month period of 2014, net financing cash outflows were $10 million, compared to $954 million in cash inflows for the same prior year period. The net financing cash inflows for the nine month period ended September 30, 2013 primarily consists of $1.4 billion in debt securities; partially offset by $450 million of dividend payments.
| | | | |
BARRICK THIRD QUARTER 2014 | | 40 | | MANAGEMENT’S DISCUSSION AND ANALYSIS |
Summary of Financial Instruments
| | | | | | | | | | | | | | |
| As at September 30, 2014 | | | | | | | | | | | | |
| Financial Instrument | | Principal/Notional Amount | | | | | Associated Risks |
| | | | | | | | | | — | | | | Interest rate |
Cash and equivalents | | | | | $2,705 | | | million | | — | | | | Credit |
| | | | | | | | | | — | | | | Credit |
Accounts receivable | | | | | $408 | | | million | | — | | | | Market |
| | | | | | | | | | — | | | | Market |
Available-for-sale securities | | | | | $33 | | | million | | — | | | | Liquidity |
Accounts payable | | | | | $1,661 | | | million | | — | | | | Liquidity |
Debt | | | | | $13,202 | | | million | | — | | | | Interest rate |
Restricted share units | | | | | $31 | | | million | | — | | | | Market |
Deferred share units | | | | | $4 | | | million | | — | | | | Market |
| | CAD | | | 309 | | | million | | — | | | | Market/liquidity |
| | CLP | | | 120,750 | | | million | | — | | | | Credit |
| | AUD | | | 558 | | | million | | — | | | | Interest rate |
Derivative instruments - currency contracts | | ZAR | | | 673 | | | million | | | |
| | | | | | | | | | — | | | | Market/liquidity |
| | | | | | | | | | — | | | | Credit |
Derivative instruments - copper contracts | | | | | 69 | | | million lbs | | — | | | | Interest rate |
| | | | | | | | | | — | | | | Market/liquidity |
| | | | | | | | | | — | | | | Credit |
Derivative instruments - energy contracts | | Diesel | | | 8 | | | million bbls | | — | | | | Interest rate |
| | Receive float interest rate swaps | | | $142 | | | million | | — | | | | Market/liquidity |
Derivative instruments - interest rate contracts | | Receive fixed interest rate swaps | | | $500 | | | million | | — | | | | Interest rate |
Commitments and Contingencies
Litigation and Claims
We are currently subject to various litigation proceedings as disclosed in note 23 to the interim consolidated financial statements, and we may be involved in disputes with other parties in the future that may result in litigation. If we are unable to resolve these disputes favorably, it may have a material adverse impact on our financial condition, cash flow and results of operations.
| | | | |
BARRICK THIRD QUARTER 2014 | | 41 | | MANAGEMENT’S DISCUSSION AND ANALYSIS |
Contractual Obligations and Commitments
| | | | | | | | | | | | | | | | | | | | | | | | | | | | |
| | | | | | Payments due As at September 30, 2014 | | | | | | | | | | |
| ($ millions) | | 20141 | | | 2015 | | | 2016 | | | 2017 | | | 2018 | | | 2019 and
thereafter | | | Total | |
Debt2 | | | | | | | | | | | | | | | | | | | | | | | | | | | | |
Repayment of principal | | | $ 10 | | | | $ 257 | | | | $ 661 | | | | $ 127 | | | | $ 878 | | | | $ 10,904 | | | | $ 12,837 | |
Capital leases | | | 19 | | | | 65 | | | | 65 | | | | 62 | | | | 56 | | | | 98 | | | | 365 | |
Interest | | | 272 | | | | 663 | | | | 654 | | | | 633 | | | | 624 | | | | 7,000 | | | | 9,846 | |
Provisions for environmental rehabilitation3 | | | 59 | | | | 109 | | | | 170 | | | | 174 | | | | 146 | | | | 1,820 | | | | 2,478 | |
Operating leases | | | 23 | | | | 55 | | | | 52 | | | | 51 | | | | 51 | | | | 136 | | | | 368 | |
Restricted share units | | | 3 | | | | 17 | | | | 2 | | | | 9 | | | | - | | | | - | | | | 31 | |
Pension benefits and other post-retirement benefits | | | 6 | | | | 22 | | | | 21 | | | | 21 | | | | 21 | | | | 387 | | | | 478 | |
Derivative liabilities4 | | | 14 | | | | 56 | | | | 26 | | | | - | | | | - | | | | - | | | | 96 | |
Purchase obligations for supplies and consumables5 | | | 324 | | | | 367 | | | | 146 | | | | 109 | | | | 84 | | | | 211 | | | | 1,241 | |
Capital commitments6 | | | 84 | | | | 7 | | | | 5 | | | | 5 | | | | 5 | | | | 15 | | | | 121 | |
Social development costs7 | | | 22 | | | | 60 | | | | 32 | | | | 34 | | | | 8 | | | | 65 | | | | 221 | |
Total | | | $ 836 | | | | $ 1,678 | | | | $ 1,834 | | | | $ 1,225 | | | | $ 1,873 | | | | $ 20,636 | | | | $ 28,082 | |
| 1 | Represents the obligations and commitments for the remainder of the year. |
| 2 | Debt and Interest - Our debt obligations do not include any subjective acceleration clauses or other clauses that enable the holder of the debt to call for early repayment, except in the event that we breach any of the terms and conditions of the debt or for other customary events of default. The debt and interest amounts include 100% of the Pueblo Viejo financing, even though we have only guaranteed our 60% share. We are not required to post any collateral under any debt obligations. Projected interest payments on variable rate debt were based on interest rates in effect at September 30, 2014. Interest is calculated on our long-term debt obligations using both fixed and variable rates. |
| 3 | Provisions for Environmental Rehabilitation - Amounts presented in the table represent the undiscounted uninflated future payments for the expected cost of provisions for environmental rehabilitation. |
| 4 | Derivative Liabilities - Amounts presented in the table relate to derivative contracts disclosed under note 19C to the consolidated financial statements. Payments related to derivative contracts cannot be reasonably estimated given variable market conditions. |
| 5 | Purchase Obligations for Supplies and Consumables - Includes commitments related to new purchase obligations to secure a supply of acid, tires and cyanide for our production process. |
| 6 | Capital Commitments - Purchase obligations for capital expenditures include only those items where binding commitments have been entered into. |
| 7 | Social Development Costs - Includes Pascua-Lama’s commitment related to the potential funding of a power transmission line in Argentina of $118 million, expected to be paid over the period of 2014 to 2017, and for which $15 million has been accrued to date. |
INTERNAL CONTROL OVER FINANCIAL REPORTING AND DISCLOSURE CONTROLS AND PROCEDURES
Management is responsible for establishing and maintaining adequate internal control over financial reporting and disclosure controls and procedures as defined in our 2013 annual MD&A.
Together, internal control over financial reporting and disclosure controls and procedures frameworks provide internal control over financial reporting and disclosure. Due to its inherent limitations, internal control over financial reporting and disclosure may not prevent or detect all fraud or misstatements. Further, the effectiveness of internal control over financial reporting and disclosure is subject to the risk that controls may become inadequate because of changes in conditions, or that the degree of compliance with policies or procedures may change.
As described on page 18 of this report, we announced a new executive management structure in third quarter 2014. As part of this change in senior executive roles and responsibilities, management will assess the impact on internal control over financial reporting and disclosure.
Management will continue to monitor the effectiveness of its internal control over financial reporting and disclosure controls and may make modifications from time to time as considered necessary or desirable.
| | | | |
BARRICK THIRD QUARTER 2014 | | 42 | | MANAGEMENT’S DISCUSSION AND ANALYSIS |
REVIEW OF QUARTERLY RESULTS
Quarterly Information1
| | | | | | | | | | | | | | | | | | | | | | | | | | | | | | | | |
| | | 2014 | | | 2013 | | | 2012 2 | |
| ($ millions, except where indicated) | | Q3 | | | Q2 | | | Q1 | | | Q4 | | | Q3 | | | Q2 | | | Q1 | | | Q4 | |
Revenues | | | $ 2,598 | | | | $ 2,432 | | | | $ 2,632 | | | | $ 2,926 | | | | $ 2,985 | | | | $ 3,201 | | | | $ 3,399 | | | | $ 4,149 | |
Realized price per ounce – gold4 | | | 1,285 | | | | 1,289 | | | | 1,285 | | | | 1,272 | | | | 1,323 | | | | 1,411 | | | | 1,629 | | | | 1,714 | |
Realized price per pound – copper4 | | | 3.09 | | | | 3.17 | | | | 3.03 | | | | 3.34 | | | | 3.40 | | | | 3.28 | | | | 3.56 | | | | 3.54 | |
Cost of sales | | | 1,642 | | | | 1,590 | | | | 1,692 | | | | 1,813 | | | | 1,788 | | | | 1,832 | | | | 1,810 | | | | 2,124 | |
Net earnings (loss) | | | 125 | | | | (269) | | | | 88 | | | | (2,830) | | | | 172 | | | | (8,555) | | | | 847 | | | | (3,013) | |
Per share (dollars)3,4 | | | 0.11 | | | | (0.23) | | | | 0.08 | | | | (2.61) | | | | 0.17 | | | | (8.55) | | | | 0.85 | | | | (3.01) | |
Adjusted net earnings4 | | | 222 | | | | 159 | | | | 238 | | | | 406 | | | | 577 | | | | 663 | | | | 923 | | | | 1,157 | |
Per share (dollars)3,4 | | | 0.19 | | | | 0.14 | | | | 0.20 | | | | 0.37 | | | | 0.58 | | | | 0.66 | | | | 0.92 | | | | 1.16 | |
Operating cash flow | | | 852 | | | | 488 | | | | 585 | | | | 1,016 | | | | 1,231 | | | | 907 | | | | 1,085 | | | | 1,845 | |
Adjusted operating cash flow4 | | | $ 852 | | | | $ 488 | | | | $ 585 | | | | $ 1,085 | | | | $ 1,300 | | | | $ 815 | | | | $ 1,158 | | | | $ 1,925 | |
| 1 | Sum of all the quarters may not add up to the annual total due to rounding. |
| 2 | Figures are restated for the impact of new accounting standards adopted in 2013. |
| 3 | Calculated using weighted average number of shares outstanding under the basic method of earnings per share. |
| 4 | Realized price, adjusted net earnings, adjusted EPS and adjusted operating cash flow are non-GAAP financial performance measures with no standard meaning under IFRS. For further information and a detailed reconciliation, please see pages 46 - 51 of this MD&A. |
Until the past several quarters, our financial results reflected a trend of spot gold prices at historically elevated levels, offset by increasing gold and copper production costs, mainly caused by inflationary pressures. In recent quarters, spot gold prices have declined and as a result of a renewed emphasis on cost control and maximizing free cash flow, costs have also decreased. Our adjusted net earnings and adjusted operating cash flow levels have fluctuated with gold and copper realized prices and production levels each quarter. In second quarter 2014, we recorded asset and goodwill impairment charges of $514 million relating to Jabal Sayid as a result of classifying the project as held
for sale. In fourth quarter 2013, we recorded asset and goodwill impairment charges totaling $2.8 billion (net of tax and non-controlling interest), primarily at Pascua-Lama, Porgera, Veladero and goodwill related to our Australia Pacific segment. The net loss in second quarter 2013 reflected asset and goodwill impairment charges totaling $8.7 billion (net of tax and non-controlling interest effects), primarily at Pascua-Lama, Buzwagi, Jabal Sayid and goodwill related to our global copper, Australia Pacific and Capital Projects segments. The net loss in fourth quarter 2012 reflected impairment charges at Lumwana and goodwill related to our global copper segment totaling $4.2 billion (net of tax effects).
| | | | |
BARRICK THIRD QUARTER 2014 | | 43 | | MANAGEMENT’S DISCUSSION AND ANALYSIS |
IFRS CRITICAL ACCOUNTING POLICIES AND ACCOUNTING ESTIMATES
Management has discussed the development and determination of our critical accounting estimates and significant accounting policies with the Audit Committee of the Board of Directors, and the Audit Committee has reviewed the disclosure relating to such estimates and policies in conjunction with its review of this MD&A. The accounting policies and methods we utilize determine how we report our financial condition and results of operations, and they may require management to make estimates or rely on assumptions about matters that are inherently uncertain. Our significant accounting policies are disclosed in note 2 of our most recent Annual Consolidated Financial Statements. A summary of future accounting policy changes is disclosed in note 2 of the accompanying interim consolidated financial statements.
Critical Accounting Estimates and Judgments
Certain accounting estimates have been identified as being “critical” to the presentation of our financial condition and results of operations because they require us to make subjective and/or complex judgments about matters that are inherently uncertain; or there is a reasonable likelihood that materially different amounts could be reported under different conditions or using different assumptions and estimates. Our significant accounting judgments, estimates and assumptions are disclosed in note 3 of the Annual Consolidated Financial Statements and an update is provided in note 3 of the accompanying interim financial statements.
Accounting for impairment of non-current assets
In accordance with our accounting policy, goodwill is tested for impairment in the fourth quarter and also when there is an indicator of impairment. Non-current assets are tested for impairment when events or changes in circumstances suggest that the carrying amount may not be recoverable. Refer to Note 20 of the Annual Consolidated Financial Statements for further information.
Summary of impairments
For the nine months ended September 30, 2014, we recorded post-tax impairment losses of $230 million (2013: $6.4 billion) for non-current assets and $316 million (2013: $2.3 million) for goodwill, as summarized in the table below:
| | | | | | | | | | | | | | | | |
| | | For the nine months ended September 30 | |
| | | | | | 2014 | | | | | | 2013 | |
| ($ millions) | | Pre-tax
(100%) | | | Post tax
(our
share) | | | Pre-tax
(100%) | | | Post tax
(our
share) | |
Australia Pacific goodwill | | | - | | | | - | | | | $ 649 | | | | $ 649 | |
Copper goodwill | | | $ 316 | | | | $ 316 | | | | 1,033 | | | | 1,033 | |
Capital projects goodwill | | | - | | | | - | | | | 397 | | | | 397 | |
| | | | |
ABG Goodwill | | | - | | | | - | | | | 185 | | | | 185 | |
Total goodwill impairment charges | | | $ 316 | | | | $ 316 | | | | $ 2,264 | | | | $ 2,264 | |
| | | | |
Pascua-Lama | | | - | | | | - | | | | $ 5,164 | | | | $ 5,111 | |
| | | | |
Jabal Sayid | | | $ 198 | | | | $ 198 | | | | 501 | | | | 401 | |
| | | | |
Buzwagi | | | - | | | | - | | | | 721 | | | | 423 | |
| | | | |
North Mara | | | - | | | | - | | | | 153 | | | | 79 | |
| | | | |
Pierina | | | - | | | | - | | | | 140 | | | | 98 | |
| | | | |
Exploration sites | | | 7 | | | | 7 | | | | 112 | | | | 89 | |
| | | | |
Kanowna | | | - | | | | - | | | | 107 | | | | 107 | |
| | | | |
Granny Smith | | | - | | | | - | | | | 73 | | | | 73 | |
| | | | |
Plutonic | | | - | | | | - | | | | 20 | | | | 14 | |
| | | | |
Darlot | | | - | | | | - | | | | 36 | | | | 25 | |
| | | | |
Available for sale investments | | | 16 | | | | 16 | | | | 21 | | | | 18 | |
| | | | |
Other1 | | | 5 | | | | 9 | | | | 33 | | | | 18 | |
Total asset impairment charges | | | $ 226 | | | | $ 230 | | | | $ 7,081 | | | | $ 6,456 | |
Tax effects and NCI | | | - | | | | ($ 4) | | | | - | | | | $ 625 | |
Total impairment charges (100%) | | | $ 542 | | | | $ 542 | | | | $ 9,345 | | | | $ 9,345 | |
| 1 | Includes the impairment reversal relating to the Pueblo Viejo power assets. |
Indicators of impairment
2014
As at June 30, 2014, our Jabal Sayid project in Saudi Arabia met the criteria as an asset held for sale. Accordingly, we were required to allocate goodwill from the Copper Operating Unit to Jabal Sayid and test the Jabal Sayid group of assets for impairment. We determined that the carrying value exceeded the fair value less cost to dispose (“FVLCD”), and consequently recorded $514 million in impairment charges, including the full amount of goodwill allocated on a relative fair value basis, of $316 million. Subsequent to quarter end, on July 13, 2014 we signed an agreement to sell a 50% interest of Jabal Sayid for cash proceeds of $210 million
| | | | |
BARRICK THIRD QUARTER 2014 | | 44 | | MANAGEMENT’S DISCUSSION AND ANALYSIS |
and that transaction is expected to close in fourth quarter 2014.
We reached an agreement to sell a power-related asset at our Pueblo Viejo mine for proceeds that exceeded its carrying value. This asset had previously been impaired in fourth quarter 2012, and therefore we recognized a pre-tax impairment reversal of $9 million. This transaction closed on September 30, 2014.
2013
The significant decrease in our long-term gold, silver and copper price assumptions in second quarter 2013, due to declining market prices, as well as the regulatory challenges to Pascua-Lama in May 2013 and the resulting schedule delays and associated capital expenditure increases; and a significant change to the mine plan at our Pierina mine, were all considered indicators of impairment, and, accordingly, we performed an impairment assessment for every mine site and significant advanced development project. As a result of this assessment, we recorded non-current asset impairment losses of $6.4 billion after any related income tax effects, including a $5.1 billion impairment loss related to the carrying value of the PP&E at Pascua-Lama; $401 million related to the Jabal Sayid project in our copper segment; $502 million related to Buzwagi and North Mara in African Barrick Gold; $219 million related to the Kanowna, Granny Smith, Plutonic and Darlot mines in our Australia Pacific Gold segment; and $98 million related to our Pierina mine in South America.
After reflecting the above non-current asset impairment losses, we conducted goodwill impairment tests and determined that the carrying value of our Copper, Australia Pacific Gold, Capital Projects and African Barrick Gold segments exceeded their FVLCD, and therefore we recorded a total goodwill impairment loss of $2.3 billion. The FVLCD of our copper segment was negatively impacted by the decrease in our long-term copper price assumption in second quarter 2013. The FVLCD of our Australia Pacific Gold segment was negatively impacted by the significant decrease in second quarter 2013 in our long-term gold price assumption. The FVLCD of our Capital Projects segment was negatively impacted by the significant decrease in second quarter 2013 in our long-term gold and silver price assumptions, as well as the schedule delays and associated capital expenditure increase at our Pascua-Lama project. The FVLCD of our African Barrick Gold segment was negatively impacted by significant changes in the life of mine (“LOM”) plans in second quarter 2013 for various assets in the segment, as well as the significant decrease in our long-term gold price assumption.
Key assumptions
The key assumptions and estimates used in determining the FVLCD are related to commodity prices, discount rates, NAV multiples for gold assets, operating costs,
exchange rates and capital expenditures. In addition, assumptions related to comparable entities, market values per ounce and per pound and the inclusion of reserves and resources in market multiples calculations are used. For further details refer to note 20 of the Annual Consolidated Financial Statements.
The key assumptions used in our impairment testing in second quarter 2014 and second quarter 2013 are summarized in the table below:
| | | | | | | | |
| | | Second Quarter
2014 | | | Second Quarter
2013 | |
Gold price per oz | | | N/A | | | | $1,300 | |
Silver price per oz | | | N/A | | | | $23 | |
Copper price per lb | | | $3.25 | | | | $3.25 | |
WACC – gold (range) | | | N/A | | | | 3% - 8% | |
WACC – gold (avg) | | | N/A | | | | 5% | |
WACC – copper (range) | | | 7% - 9% | | | | 6% - 8% | |
WACC – copper (avg) | | | 7% | | | | 7% | |
NAV multiple – gold (avg) | | | N/A | | | | 1.2 | |
LOM years – gold (range) | | | N/A | | | | 2 - 34 | |
LOM years – gold (avg) | | | N/A | | | | 14 | |
LOM years – copper (range) | | | 14 - 24 | | | | 13 - 33 | |
LOM years – copper (avg) | | | 18 | | | | 21 | |
Sensitivities
Based on the results of our last impairment test performed in fourth quarter 2013, the carrying value of the operating segments and CGUs that are most sensitive to the change in sales prices used in the annual test are:
| | | | |
| As at September 30, 2014 | | Carrying value | |
Copper segment1,2,3 | | | 4,372 | |
Cerro Casale | | | 1,511 | |
Pascua-Lama1 | | | 1,505 | |
Australia Pacific segment1,2 | | | 1,455 | |
Lumwana1 | | | 1,035 | |
Veladero1,2 | | | 734 | |
Jabal Sayid1 | | | 560 | |
Porgera1 | | | 362 | |
North Mara1 | | | 339 | |
Round Mountain1 | | | 154 | |
| 1 | These operating segments/CGUs have been impaired in either 2012, 2013 or 2014 and therefore their fair value approximates carrying value. |
| 2 | Includes goodwill (refer to Note 17). |
| 3 | Due to its classification as held-for-sale, Jabal Sayid is not included in this figure. |
As noted in note 23, conditions exist that could result in the cancellation of Cerro Casale’s environmental permits, which would lead to the project’s reserves to be reclassified as resources. We also continue to progress options to improve the overall project economics. However, at current metal prices, it is unlikely that a feasible development alternative will be found to enable a move forward to a positive construction decision. If reserves were to be reclassified to resources or if activity
| | | | |
BARRICK THIRD QUARTER 2014 | | 45 | | MANAGEMENT’S DISCUSSION AND ANALYSIS |
to advance the project were to cease, we would be required to evaluate the recoverability of the project’s carrying value, which could result in an impairment charge being recorded.
In third quarter 2014, Chile enacted tax rate changes (refer to note 13). We are currently assessing the impact of these changes on Zaldívar’s LOM income taxes payable. If this tax rate change results in a significant increase in total income taxes payable, on a LOM basis, the estimated fair value at Zaldívar will be negatively impacted and this may result in an impairment charge being recorded against the goodwill of copper operating segment.
NON-GAAP FINANCIAL PERFORMANCE MEASURES
We use certain non-GAAP financial performance measures in our MD&A. For a detailed description of each of the non-GAAP measures used in this MD&A, please refer to the Non-GAAP Financial Performance Measures in our 2013 annual MD&A. The non-GAAP financial performance measures set out in this MD&A
are intended to provide additional information to investors and do not have any standardized definition under IFRS and should not be considered in isolation or as a substitute for measures of performance prepared in accordance with IFRS.
Reconciliation of Net Earnings to Adjusted Net Earnings, Adjusted Net Earnings per Share and Adjusted Return on Equity1
| | | | | | | | | | | | | | | | |
| ($ millions, except per share amounts in dollars) | | For the three months ended September 30 | | | For the nine months ended September 30 | |
| | | 2014 | | | 2013 | | | 2014 | | | 2013 | |
Net earnings (loss) attributable to equity holders of the Company | | | $ 125 | | | | $ 172 | | | | $ (56) | | | | ($ 7,536) | |
Impairment charges related to intangibles, property, plant and equipment, and investments | | | 10 | | | | 9 | | | | 546 | | | | 8,721 | |
Acquisition/disposition (gains)/losses | | | (12) | | | | 18 | | | | (35) | | | | 473 | |
Foreign currency translation (gains)/losses | | | 42 | | | | 40 | | | | 186 | | | | 95 | |
Tax adjustments | | | - | | | | 280 | | | | (112) | | | | 280 | |
Other expense adjustments2 | | | 6 | | | | 75 | | | | 91 | | | | 187 | |
Unrealized losses/(gains) on non-hedge derivative instruments | | | 51 | | | | (17) | | | | (1) | | | | (57) | |
Adjusted net earnings | | | $ 222 | | | | $ 577 | | | | $ 619 | | | | $ 2,163 | |
Net earnings (loss) per share3 | | | 0.11 | | | | 0.17 | | | | (0.05) | | | | (7.53) | |
Adjusted net earnings per share3 | | | 0.19 | | | | 0.58 | | | | 0.53 | | | | 2.16 | |
| 1 | Amounts presented in this table are after-tax and net of non-controlling interest. |
| 2 | Other expense adjustments include $30 million of demobilization costs relating to Pascua-Lama for the nine months ended September 30, 2014 (2013: $61 million). |
| 3 | Calculated using weighted average number of shares outstanding under the basic method of earnings per share. |
Reconciliation of Operating Cash Flow to Adjusted Operating Cash Flow and Free Cash Flow
| | | | | | | | | | | | | | | | |
| ($ millions) | | For the three months ended September 30 | | | For the nine months ended September 30 | |
| | | 2014 | | | 2013 | | | 2014 | | | 2013 | |
Operating cash flow | | | $ 852 | | | | $ 1,231 | | | | $ 1,925 | | | | $ 3,223 | |
Settlement of currency and commodity contracts | | | - | | | | 69 | | | | - | | | | (5) | |
Non-recurring tax payments | | | - | | | | - | | | | - | | | | 56 | |
Adjusted operating cash flow | | | $ 852 | | | | $ 1,300 | | | | $ 1,925 | | | | $ 3,274 | |
Capital expenditures | | | (653) | | | | (1,205) | | | | (1,885) | | | | (4,136) | |
Free cash flow | | | $ 199 | | | | $ 95 | | | | $40 | | | | ($862) | |
| | | | |
BARRICK THIRD QUARTER 2014 | | 46 | | MANAGEMENT’S DISCUSSION AND ANALYSIS |
Reconciliation of Gold Cost of Sales to Adjusted operating costs per ounce, All-in sustaining costs per ounce and All-in costs per ounce
| | | | | | | | | | | | | | | | | | | | |
($ millions, except per ounce information in dollars) | | | | For the three months ended
September 30 | | | For the nine months ended
September 30 | |
| | | | | Reference | | 2014 | | | 2013 | | | 2014 | | | 2013 | |
| | Cost of sales | | A | | | $ 1,399 | | | | $ 1,535 | | | | $ 4,190 | | | | $ 4,619 | |
| | | Cost of sales applicable to non-controlling interests1 | | B | | | ($ 130) | | | | (97) | | | | (382) | | | | (281) | |
| | Cost of sales applicable to ore purchase arrangement | | C | | | - | | | | - | | | | - | | | | (47) | |
| | Other metal sales | | D | | | ($ 45) | | | | (42) | | | | (138) | | | | (147) | |
| | Realized non-hedge gains/losses on fuel hedges | | E | | | ($ 3) | | | | (6) | | | | (12) | | | | (15) | |
| | Corporate social responsibility costs related to current operations | | F | | | 14 | | | | 10 | | | | 37 | | | | 32 | |
| | Treatment and refinement charges | | G | | | 4 | | | | 1 | | | | 8 | | | | 4 | |
| | Total production costs | | | | | $ 1,239 | | | | $ 1,401 | | | | $ 3,703 | | | | $ 4,165 | |
| | Depreciation | | H | | | ($ 312) | | | | ($ 372) | | | | ($ 935) | | | | ($ 1,096) | |
| | Impact of Barrick Energy | | I | | | - | | | | (8) | | | | - | | | | (57) | |
| | Adjusted operating costs | | | | | $ 927 | | | | $ 1,021 | | | | $ 2,768 | | | | $ 3,012 | |
| | General & administrative costs | | J | | | 66 | | | | 89 | | | | 219 | | | | 235 | |
| | Rehabilitation - accretion and amortization (operating sites) | | K | | | 31 | | | | 29 | | | | 97 | | | | 103 | |
| | Mine on-site exploration and evaluation costs | | L | | | 6 | | | | 17 | | | | 15 | | | | 45 | |
| | Mine development expenditures2 | | M | | | 149 | | | | 280 | | | | 514 | | | | 866 | |
| | Sustaining capital expenditures2 | | M | | | 137 | | | | 192 | | | | 361 | | | | 654 | |
| | All-in sustaining costs | | | | | $ 1,316 | | | | $ 1,628 | | | | $ 3,974 | | | | $ 4,915 | |
| | Corporate social responsibility costs not related to current operations | | F | | | 3 | | | | 2 | | | | 15 | | | | 11 | |
| | Rehabilitation - accretion and amortization not related to current operations | | K | | | 3 | | | | 3 | | | | 9 | | | | 8 | |
| | Exploration and evaluation costs (non-sustaining) | | L | | | 37 | | | | 25 | | | | 108 | | | | 87 | |
| | Non-sustaining capital expenditures2 | | | | | | | | | | | | | | | | | | |
| | Pascua-Lama | | M | | | 61 | | | | 330 | | | | 92 | | | | 1,393 | |
| | Pueblo Viejo | | M | | | - | | | | 15 | | | | - | | | | 32 | |
| | Cortez | | M | | | 4 | | | | 27 | | | | 14 | | | | 123 | |
| | Goldstrike thiosulfate project | | M | | | 95 | | | | 56 | | | | 221 | | | | 152 | |
| | Bulyanhulu CIL | | M | | | 10 | | | | 15 | | | | 28 | | | | 53 | |
| | Other | | M | | | 9 | | | | 6 | | | | 18 | | | | 18 | |
| | All-in costs | | | | | $ 1,538 | | | | $ 2,107 | | | | $ 4,479 | | | | $ 6,792 | |
| | Ounces sold - consolidated basis (000s ounces) | | | | | 1,755 | | | | 1,899 | | | | 5,219 | | | | 5,653 | |
| | Ounces sold - non-controlling interest (000s ounces)1 | | | | | (177) | | | | (116) | | | | (507) | | | | (308) | |
| | Ounces sold - equity basis (000s ounces) | | | | | 1,578 | | | | 1,783 | | | | 4,712 | | | | 5,345 | |
| | Total production costs per ounce3 | | | | | $ 787 | | | | $ 785 | | | | $ 786 | | | | $ 780 | |
| | Adjusted operating costs per ounce3 | | | | | $ 589 | | | | $ 573 | | | | $ 588 | | | | $ 564 | |
| | Adjusted operating costs per ounce (on a co-product basis)3,4 | | | | | $ 607 | | | | $ 593 | | | | $ 609 | | | | $ 588 | |
| | All-in sustaining costs per ounce3 | | | | | $ 834 | | | | $ 914 | | | | $ 844 | | | | $ 919 | |
| | All-in sustaining costs per ounce (on a co-product basis)3,4 | | | | | $ 852 | | | | $ 934 | | | | $ 865 | | | | $ 943 | |
| | All-in costs per ounce3 | | | | | $ 975 | | | | $ 1,182 | | | | $ 951 | | | | $ 1,269 | |
| | All-in costs per ounce (on a co-product basis)3,4 | | | | | $ 993 | | | | $ 1,202 | | | | $ 972 | | | | $ 1,293 | |
| 1 | Relates to interest in Pueblo Viejo and ABG held by outside shareholders. |
| 2 | Amounts represent our share of capital expenditures. |
| 3 | Total production costs, adjusted operating costs, all-in sustaining costs, and all-in costs per ounce may not calculate based on amounts presented in this table due to rounding. |
| 4 | Amounts presented on a co-product basis remove the impact of other metal sales (net of non-controlling interest) from cost per ounce calculations that are produced as a by-product of our gold production. |
| | | | |
BARRICK THIRD QUARTER 2014 | | 47 | | MANAGEMENT’S DISCUSSION AND ANALYSIS |
| | | | | | | | | | | | | | | | | | |
| ($ millions, except per ounce information in dollars) | | For the three months ended
September 30 | | | For the nine months ended
September 30 | |
| | | | | 2014 | | | 2013 | | | 2014 | | | 2013 | |
| | References | | | | | | | | | | | | | | | | |
A | | Cost of sales - gold | | | | | | | | | | | | | | | | |
| | Cost of sales (statement of income) | | | $ 1,642 | | | | $ 1,788 | | | | $ 4,924 | | | | $ 5,430 | |
| | Less: cost of sales - copper (Note 5) | | | (229) | | | | (247) | | | | (677) | | | | (824) | |
| | Direct mining and royalties | | | 179 | | | | 206 | | | | 556 | | | | 686 | |
| | Depreciation | | | 50 | | | | 41 | | | | 121 | | | | 138 | |
| | Add: Barrick Energy depreciation | | | - | | | | 5 | | | | - | | | | 43 | |
| | Less: COS - corporate | | | (14) | | | | (11) | | | | (57) | | | | (30) | |
| | Total Cost of Sales - Gold | | | $ 1,399 | | | | 1,535 | | | | $ 4,190 | | | | 4,619 | |
| | | | | |
B | | Cost of sales applicable to non-controlling interests | | | | | | | | | | | | | | | | |
| | Cost of sales applicable to ABG (Note 5) | | | | | | | | | | | | | | | | |
| | Direct mining and royalties | | | $ 135 | | | | $ 126 | | | | $ 399 | | | | $ 441 | |
| | Depreciation | | | 29 | | | | 32 | | | | 94 | | | | 131 | |
| | Total related to ABG | | | $ 164 | | | | $ 158 | | | | $ 493 | | | | $ 572 | |
| | Portion attributable to non-controlling interest | | | $ 55 | | | | $ 39 | | | | $ 157 | | | | $ 148 | |
| | Cost of sales applicable to Pueblo Viejo (Note 5) | | | | | | | | | | | | | | | | |
| | Direct mining and royalties | | | $ 143 | | | | $ 124 | | | | $ 428 | | | | $ 277 | |
| | Depreciation | | | 67 | | | | 41 | | | | 187 | | | | 95 | |
| | Total related to Pueblo Viejo | | | $ 210 | | | | $ 165 | | | | $ 615 | | | | $ 372 | |
| | Portion attributable to non-controlling interest | | | $ 75 | | | | $ 58 | | | | $ 225 | | | | $ 133 | |
| | Cost of sales applicable to non-controlling interests | | | $ 130 | | | | $ 97 | | | | $ 382 | | | | $ 281 | |
| |
C | | Cost of sales applicable to ore purchase arrangement Equal to the cost of sales from ore purchase agreements that have economic characteristics similar to a toll milling arrangement, as the cost of producing these ounces is not indicative of our normal production costs. These figures cannot be tied directly to the financial statements or notes. | |
| |
D | | Other metal sales By-product revenues from metals produced in conjunction with gold are deducted from the costs incurred to produce gold (note 6). By product revenues from metals produced net of copper and non-controlling interest for the three and nine months ended September 30, 2014 were $32 million and $105 million, respectively (2013: $36 million and $133 million, respectively). | |
| |
E | | Realized non-hedge gains/losses on fuel hedges | |
| | | | | |
| | Fuel gains/(losses) (Note 19D) | | | $ (52) | | | | $ 24 | | | | $ 20 | | | | $ 18 | |
| | Add/Less: Unrealized gains/(losses) | | | 49 | | | | (30) | | | | (32) | | | | (33) | |
| | Realized non-hedge gains/(losses) on fuel hedges | | | $ (3) | | | | $ (6) | | | | $ (12) | | | | $ (15) | |
| | | | | |
F | | Corporate social responsibility costs | | | | | | | | | | | | | | | | |
| | CSR costs (Note 10) | | | $ 21 | | | | $ 13 | | | | $ 61 | | | | $ 53 | |
| | | | | |
| | Less: NCI of CSR | | | (2) | | | | - | | | | (3) | | | | (3) | |
| | Less: CSR costs - non-gold | | | (2) | | | | (1) | | | | (6) | | | | (7) | |
| | Total CSR - gold | | | $ 17 | | | | $ 12 | | | | $ 52 | | | | $ 43 | |
| | Corporate social responsibility costs related to current operations | | | 14 | | | | 10 | | | | 37 | | | | 32 | |
| | Corporate social responsibility costs not related to current operations | | | 3 | | | | 2 | | | | 15 | | | | 11 | |
| | Total CSR - gold | | | $ 17 | | | | $ 12 | | | | $ 52 | | | | $ 43 | |
| | | | |
BARRICK THIRD QUARTER 2014 | | 48 | | MANAGEMENT’S DISCUSSION AND ANALYSIS |
| | | | | | | | | | | | | | | | | | |
| ($ millions, except per ounce information in dollars) | | For the three months ended
September 30 | | | For the nine months ended
September 30 | |
| | | | | 2014 | | | 2013 | | | 2014 | | | 2013 | |
| | | | | |
G | | Treatment and refinement charges | | | | | | | | | | | | | | | | |
| |
| | Treatment and refinement charges, which are recorded against concentrate revenues, for the three and nine months ended September 30, 2014 were $4 million and $8 million, respectively (2013: $1 million and $4 million, respectively). | |
| | | | | |
H | | Depreciation - gold | | | | | | | | | | | | | | | | |
| | Depreciation (Note 7) | | | $ 412 | | | | $ 441 | | | | $ 1,214 | | | | $ 1,290 | |
| | Less: copper depreciation (Note 5) | | | (50) | | | | (41) | | | | (121) | | | | (138) | |
| | Add: Barrick Energy depreciation | | | - | | | | 5 | | | | - | | | | 43 | |
| | Less: NCI portion | | | (36) | | | | (25) | | | | (102) | | | | (71) | |
| | Less: Depreciation - corporate assets | | | (14) | | | | (8) | | | | (56) | | | | (28) | |
| | Total depreciation - gold | | | $ 312 | | | | $ 372 | | | | $ 935 | | | | $ 1,096 | |
| | | | | |
I | | Impact of Barrick Energy (Note 4) | | | | | | | | | | | | | | | | |
| | Revenue related to Barrick Energy | | | $ - | | | | $ 13 | | | | $ - | | | | $93 | |
| | Less: COS related to Barrick Energy | | | - | | | | (10) | | | | - | | | | (79) | |
| | Add: Barrick Energy depreciation | | | - | | | | 5 | | | | - | | | | 43 | |
| | Impact of Barrick Energy | | | $ - | | | | $ 8 | | | | $ - | | | | $57 | |
| | | | | |
J | | General & administrative costs | | | | | | | | | | | | | | | | |
| | Total general & administrative costs (statement of income) | | | $ 98 | | | | $ 100 | | | | $ 283 | | | | $ 297 | |
| | Less: non-gold and non-operating general & administrative costs | | | (15) | | | | (10) | | | | (41) | | | | (42) | |
| | Less: NCI portion | | | (4) | | | | (3) | | | | (10) | | | | (8) | |
| | Add: World Gold Council fees | | | 1 | | | | 2 | | | | 3 | | | | 6 | |
| | Less: non-recurring items1 | | | (14) | | | | - | | | | (16) | | | | (18) | |
| | Total general & administrative costs | | | $ 66 | | | | $ 89 | | | | $ 219 | | | | $ 235 | |
| | 12014 figures include amounts relating to severance costs. | | | | | | | | | | | | | | | | |
| | | | | |
K | | Rehabilitation - accretion and amortization | | | | | | | | | | | | | | | | |
| |
| | Includes depreciation (note 7) on the assets related to rehabilitation provisions of our gold operations of $18 million and $55 million for the three and nine months ended September 30, 2014 (2013: $16 million and $66 million, respectively) and accretion (note 12) on the rehabilitation provision of our gold operations of $16 million and $51 million for the three and nine months ended September 30, 2014, respectively (2013: $16 million and $45 million, respectively). | |
| | | | | |
L | | Exploration and evaluation costs | | | | | | | | | | | | | | | | |
| | Exploration and evaluation costs (statement of income) | | | $ 45 | | | | $ 48 | | | | $ 130 | | | | $ 154 | |
| | Less: exploration and evaluation costs - non-gold & NCI | | | (2) | | | | (6) | | | | (7) | | | | (22) | |
| | Total exploration and evaluation costs - gold | | | $ 43 | | | | $ 42 | | | | $ 123 | | | | $ 132 | |
| | Exploration & evaluation costs (sustaining) | | | 6 | | | | 17 | | | | 15 | | | | 45 | |
| | Exploration and evaluation costs (non-sustaining) | | | 37 | | | | 25 | | | | 108 | | | | 87 | |
| | Total exploration and evaluation costs - gold | | | $ 43 | | | | $ 42 | | | | $ 123 | | | | $ 132 | |
| | | | |
BARRICK THIRD QUARTER 2014 | | 49 | | MANAGEMENT’S DISCUSSION AND ANALYSIS |
| | | | | | | | | | | | | | | | | | |
| ($ millions, except per ounce information in dollars) | | For the three months ended
September 30 | | | For the nine months ended September 30 | |
| | | | | 2014 | | | 2013 | | | 2014 | | | 2013 | |
| | | | | |
M | | Capital expenditures | | | | | | | | | | | | | | | | |
| | Gold segments (Note 5) | | | $ 445 | | | | $ 617 | | | | $ 1,259 | | | | $ 1,934 | |
| | Pascua-Lama operating unit (Note 5) | | | 61 | | | | 415 | | | | 92 | | | | 1,591 | |
| | Other gold projects1 | | | 7 | | | | 41 | | | | 24 | | | | 160 | |
| | Capital expenditures - gold | | | $ 513 | | | | $ 1,073 | | | | $ 1,375 | | | | $ 3,685 | |
| | Less: NCI portion | | | (41) | | | | (48) | | | | (105) | | | | (164) | |
| | Less: capitalized interest (note 12) | | | (8) | | | | (104) | | | | (22) | | | | (230) | |
| | Total capital expenditures - gold | | | $ 464 | | | | $ 921 | | | | $ 1,248 | | | | $ 3,291 | |
| | Mine development expenditures | | | 149 | | | | 280 | | | | 514 | | | | 866 | |
| | Sustaining capital expenditures | | | 137 | | | | 192 | | | | 361 | | | | 654 | |
| | Non-sustaining capital expenditures | | | 179 | | | | 449 | | | | 373 | | | | 1,771 | |
| | Total capital expenditures - gold | | | $ 465 | | | | $ 921 | | | | $ 1,248 | | | | $ 3,291 | |
| 1 | 2013 figures include capital expenditures related to Barrick Energy that was sold in third quarter 2013. |
Reconciliation of Copper Cost of Sales to C1 cash costs per pound and C3 fully allocated costs per pound
| | | | | | | | | | | | | | | | |
($ millions, except per pound information in dollars) | | For the three months ended September 30 | | | For the nine months ended September 30 | |
| | | 2014 | | | 2013 | | | 2014 | | | 2013 | |
Cost of sales | | | $ 229 | | | | $ 247 | | | | $ 677 | | | | $ 824 | |
Depreciation/amortization | | | (50) | | | | (41) | | | | (121) | | | | (138) | |
Treatment and refinement charges | | | 32 | | | | 33 | | | | 79 | | | | 91 | |
Corporate social responsibility costs | | | 2 | | | | 2 | | | | 5 | | | | 7 | |
Less: royalties | | | (8) | | | | (12) | | | | (25) | | | | (36) | |
Non-routine charges | | | - | | | | - | | | | (1) | | | | 3 | |
Other metal sales | | | - | | | | - | | | | (1) | | | | (1) | |
Other2 | | | - | | | | - | | | | (27) | | | | - | |
C1 cash cost of sales | | | $ 205 | | | | $ 229 | | | | $ 586 | | | | $ 750 | |
Depreciation/amortization | | | 50 | | | | 41 | | | | 121 | | | | 138 | |
Royalties | | | 8 | | | | 12 | | | | 25 | | | | 36 | |
Non-routine charges | | | - | | | | - | | | | 1 | | | | (3) | |
Administration costs | | | 5 | | | | 4 | | | | 12 | | | | 13 | |
Other expense (income) | | | (1) | | | | 6 | | | | (3) | | | | 11 | |
C3 fully allocated cost of sales | | | $ 267 | | | | $ 292 | | | | $ 742 | | | | $ 945 | |
Pounds sold - consolidated basis (millions pounds) | | | 112 | | | | 135 | | | | 296 | | | | 385 | |
C1 cash cost per pound1 | | | $ 1.82 | | | | $ 1.69 | | | | $ 1.98 | | | | $ 1.94 | |
C3 fully allocated cost per pound1 | | | $ 2.36 | | | | $ 2.15 | | | | $ 2.50 | | | | $ 2.45 | |
| 1 | C1 cash costs per pound and C3 fully allocated costs may not calculate based on amounts presented in this table due to rounding. |
| 2 | Includes $17 million related to copper cathode purchases and $10 million of abnormal costs related to the conveyor collapse at Lumwana, as these costs are not indicative of our normal production costs. |
| | | | |
BARRICK THIRD QUARTER 2014 | | 50 | | MANAGEMENT’S DISCUSSION AND ANALYSIS |
EBITDA and Adjusted EBITDA
| | | | | | | | | | | | | | | | |
($ millions, except per share
amounts in dollars) | | For the three months ended September 30 | | | For the nine months ended September 30 | |
| | | 2014 | | | 2013 | | | 2014 | | | 2013 | |
Net earnings (loss) | | | $ 177 | | | | $ 9 | | | | $ 81 | | | | $ (7,831) | |
Income tax expense | | | 275 | | | | 748 | | | | 687 | | | | 968 | |
Finance costs | | | 180 | | | | 105 | | | | 541 | | | | 341 | |
Finance income | | | (3) | | | | (2) | | | | (9) | | | | (7) | |
Depreciation | | | 412 | | | | 441 | | | | 1,214 | | | | 1,290 | |
EBITDA | | | $ 1,041 | | | | $ 1,301 | | | | $ 2,514 | | | | $ (5,239) | |
Impairment charges | | | $ 18 | | | | $ 13 | | | | $ 542 | | | | $ 9,345 | |
Adjusted EBITDA | | | $ 1,059 | | | | $ 1,314 | | | | $ 3,056 | | | | $ 4,106 | |
Reconciliation of Sales to Realized Price per ounce/pound
| | | | | | | | | | | | | | | | | | | | | | | | | | | | | | | | |
| | | For the three months ended September 30 | | | For the nine months ended September 30 | |
| | | | |
($ millions, except per ounce/pound information in dollars) | | Gold | | | Copper | | | Gold | | | Copper | |
| | | 2014 | | | 2013 | | | 2014 | | | 2013 | | | 2014 | | | 2013 | | | 2014 | | | 2013 | |
Sales | | | $ 2,235 | | | | $ 2,511 | | | | $ 318 | | | | $ 432 | | | | $ 6,664 | | | | $ 8,202 | | | | $ 860 | | | | $ 1,236 | |
Sales applicable to non-controlling interests | | | (224) | | | | (164) | | | | - | | | | - | | | | (650) | | | | (434) | | | | - | | | | - | |
Sales attributable to ore purchase agreement | | | - | | | | - | | | | - | | | | - | | | | - | | | | (46) | | | | - | | | | - | |
Realized non-hedge gold/copper derivative (losses) gains | | | 1 | | | | - | | | | (3) | | | | (6) | | | | 1 | | | | 1 | | | | (8) | | | | (16) | |
Treatment and refinement charges | | | 4 | | | | 1 | | | | 32 | | | | 33 | | | | 8 | | | | 3 | | | | 79 | | | | 92 | |
Export duties | | | 12 | | | | 10 | | | | - | | | | - | | | | 37 | | | | 39 | | | | - | | | | - | |
Other2 | | | - | | | | - | | | | - | | | | - | | | | | | | | | | | | (17) | | | | - | |
Revenues - as adjusted | | | $ 2,028 | | | | $ 2,358 | | | | $ 347 | | | | $ 459 | | | | $ 6,060 | | | | $ 7,765 | | | | $ 914 | | | | $ 1,312 | |
Ounces/pounds sold (000s ounces/millions pounds) | | | 1,578 | | | | 1,783 | | | | 112 | | | | 135 | | | | 4,712 | | | | 5,345 | | | | 296 | | | | 385 | |
Realized gold/copper price per ounce/pound1 | | | $ 1,285 | | | | $ 1,323 | | | | $ 3.09 | | | | $ 3.40 | | | | $ 1,286 | | | | $ 1,453 | | | | $ 3.08 | | | | $ 3.41 | |
| 1 | Realized price per ounce/pound may not calculate based on amounts presented in this table due to rounding. |
| 2 | Revenue related to copper cathode purchases made in second quarter 2014. |
| | | | |
BARRICK THIRD QUARTER 2014 | | 51 | | MANAGEMENT’S DISCUSSION AND ANALYSIS |
Consolidated Statements of Income
| | | | | | | | | | | | | | | | |
Barrick Gold Corporation (in millions of United States dollars, except per share data) (Unaudited) | | Three months ended
September 30, | | | Nine months ended
September 30, | |
| | | 2014 | | | 2013 | | | 2014 | | | 2013 | |
Revenue(notes 5 and 6) | | $ | 2,598 | | | $ | 2,985 | | | $ | 7,662 | | | $ | 9,585 | |
Costs and expenses (income) | | | | | | | | | | | | | | | | |
Cost of sales (notes 5 and 7) | | | 1,642 | | | | 1,788 | | | | 4,924 | | | | 5,430 | |
General and administrative expenses (note 11) | | | 98 | | | | 100 | | | | 283 | | | | 297 | |
Exploration and evaluation (note 8) | | | 45 | | | | 48 | | | | 130 | | | | 154 | |
Other expense (income) (note 10A) | | | 83 | | | | 169 | | | | 425 | | | | 406 | |
Impairment charges (note 10B) | | | 18 | | | | 13 | | | | 542 | | | | 9,345 | |
Loss (gain) on non-hedge derivatives (note 19D) | | | 65 | | | | (19 | ) | | | - | | | | (74 | ) |
Income (loss) before finance items and income taxes | | | 647 | | | | 886 | | | | 1,358 | | | | (5,973 | ) |
Finance items | | | | | | | | | | | | | | | | |
Finance income | | | 3 | | | | 2 | | | | 9 | | | | 7 | |
Finance costs (note 12) | | | (198 | ) | | | (122 | ) | | | (599 | ) | | | (391 | ) |
Income (loss) from continuing operations before income taxes | | | 452 | | | | 766 | | | | 768 | | | | (6,357 | ) |
Income tax expense (note 13) | | | (275 | ) | | | (748 | ) | | | (687 | ) | | | (968 | ) |
Income (loss) from continuing operations | | | 177 | | | | 18 | | | | 81 | | | | (7,325 | ) |
Loss from discontinued operations | | | - | | | | (9 | ) | | | - | | | | (506 | ) |
Net income (loss) | | $ | 177 | | | $ | 9 | | | $ | 81 | | | $ | (7,831 | ) |
Attributable to: | | | | | | | | | | | | | | | | |
Equity holders of Barrick Gold Corporation | | $ | 125 | | | $ | 172 | | | $ | (56 | ) | | $ | (7,536 | ) |
Non-controlling interests (note 22) | | $ | 52 | | | $ | (163 | ) | | $ | 137 | | | $ | (295 | ) |
| |
Earnings (loss) per share data attributable to the equity holders of Barrick Gold Corporation (note 9) | | | | | |
Income (loss) from continuing operations | | | | | | | | | | | | | | | | |
Basic | | $ | 0.11 | | | $ | 0.18 | | | $ | (0.05 | ) | | $ | (7.02 | ) |
Diluted | | $ | 0.11 | | | $ | 0.18 | | | $ | (0.05 | ) | | $ | (7.02 | ) |
Loss from discontinued operations | | | | | | | | | | | | | | | | |
Basic | | $ | - | | | $ | (0.01 | ) | | $ | - | | | $ | (0.51 | ) |
Diluted | | $ | - | | | $ | (0.01 | ) | | $ | - | | | $ | (0.51 | ) |
Net income (loss) | | | | | | | | | | | | | | | | |
Basic | | $ | 0.11 | | | $ | 0.17 | | | $ | (0.05 | ) | | $ | (7.53 | ) |
Diluted | | $ | 0.11 | | | $ | 0.17 | | | $ | (0.05 | ) | | $ | (7.53 | ) |
The accompanying notes are an integral part of these consolidated financial statements.
| | | | |
BARRICK THIRD QUARTER 2014 | | 52 | | FINANCIAL STATEMENTS (UNAUDITED) |
Consolidated Statements of Comprehensive Income
| | | | | | | | | | | | | | | | |
Barrick Gold Corporation (in millions of United States dollars) (Unaudited) | | Three months ended
September 30, | | | Nine months ended
September 30, | |
| | | 2014 | | | 2013 | | | 2014 | | | 2013 | |
Net income (loss) | | $ | 177 | | | $ | 9 | | | $ | 81 | | | $ | (7,831 | ) |
Other comprehensive income (loss), net of taxes | | | | | | | | | | | | | | | | |
Items that may be reclassified subsequently to profit or loss: | | | | | | | | | | | | | | | | |
| Unrealized gains (losses) on available-for-sale (“AFS”) financial securities, net of tax $nil, $nil, $nil and $4 | | | (2 | ) | | | 4 | | | | 20 | | | | (22 | ) |
| Realized (gains) losses and impairments on AFS financial securities, net of tax $nil, $nil, $nil and ($2) | | | (7 | ) | | | 2 | | | | 16 | | | | 13 | |
| Unrealized gains (losses) on derivatives designated as cash flow hedges, net of tax $2, ($8), $3 and ($7) | | | (35 | ) | | | 4 | | | | (7 | ) | | | (51 | ) |
| Realized (gains) losses on derivatives designated as cash flow hedges, net of tax ($1), $20, $nil and $61 | | | (22 | ) | | | (60 | ) | | | (76 | ) | | | (242 | ) |
Currency translation adjustments, net of tax $nil, $nil, $nil and $nil | | | (26 | ) | | | 24 | | | | (19 | ) | | | (74 | ) |
Total other comprehensive income (loss) | | | (92 | ) | | | (26 | ) | | | (66 | ) | | | (376 | ) |
Total comprehensive income (loss) | | $ | 85 | | | $ | (17 | ) | | $ | 15 | | | $ | (8,207 | ) |
Attributable to: | | | | | | | | | | | | | | | | |
Equity holders of Barrick Gold Corporation | | | | | | | | | | | | | | | | |
Continuing operations | | $ | 33 | | | $ | 135 | | | $ | (122 | ) | | $ | (7,375 | ) |
Discontinued operations | | $ | - | | | $ | 11 | | | $ | - | | | $ | (537 | ) |
Non-controlling interests | | $ | 52 | | | $ | (163 | ) | | $ | 137 | | | $ | (295 | ) |
The accompanying notes are an integral part of these consolidated financial statements.
| | | | |
BARRICK THIRD QUARTER 2014 | | 53 | | FINANCIAL STATEMENTS (UNAUDITED) |
Consolidated Statements of Cash Flow
| | | | | | | | | | | | | | | | |
Barrick Gold Corporation (in millions of United States dollars) (Unaudited) | | Three months ended September 30, | | | Nine months ended September 30, | |
| | | 2014 | | | 2013 | | | 2014 | | | 2013 | |
OPERATING ACTIVITIES | | | | | | | | | | | | | | | | |
Net income (loss) from continuing operations | | $ | 177 | | | $ | 18 | | | $ | 81 | | | $ | (7,325 | ) |
Adjusted for the following items: | | | | | | | | | | | | | | | | |
Depreciation | | | 412 | | | | 441 | | | | 1,214 | | | | 1,290 | |
Finance costs | | | 198 | | | | 122 | | | | 599 | | | | 391 | |
Impairment charges (note 10B) | | | 18 | | | | 13 | | | | 542 | | | | 9,345 | |
Income tax expense (note 13) | | | 275 | | | | 748 | | | | 687 | | | | 968 | |
Increase in inventory | | | (12 | ) | | | (47 | ) | | | (7 | ) | | | (280 | ) |
Proceeds from settlement of hedge contracts | | | - | | | | - | | | | - | | | | 219 | |
Loss (gain) on non-hedge derivatives | | | 65 | | | | (19 | ) | | | - | | | | (74 | ) |
Gain on sale of long-lived assets/investments | | | (14 | ) | | | (16 | ) | | | (37 | ) | | | (25 | ) |
Other operating activities (note 14A) | | | (120 | ) | | | 149 | | | | (345 | ) | | | (316 | ) |
Operating cash flows before interest and income taxes | | | 999 | | | | 1,409 | | | | 2,734 | | | | 4,193 | |
Interest paid | | | (77 | ) | | | (36 | ) | | | (429 | ) | | | (253 | ) |
Income taxes paid | | | (70 | ) | | | (141 | ) | | | (380 | ) | | | (767 | ) |
Net cash provided by operating activities from continuing operations | | | 852 | | | | 1,232 | | | | 1,925 | | | | 3,173 | |
Net cash (used in) provided by operating activities from discontinued operations | | | - | | | | (1 | ) | | | - | | | | 50 | |
Net cash provided by operating activities | | | 852 | | | | 1,231 | | | | 1,925 | | | | 3,223 | |
INVESTING ACTIVITIES | | | | | | | | | | | | | | | | |
Property, plant and equipment | | | | | | | | | | | | | | | | |
Capital expenditures (note 5) | | | (653 | ) | | | (1,205 | ) | | | (1,885 | ) | | | (4,136 | ) |
Sales proceeds | | | 18 | | | | - | | | | 55 | | | | 3 | |
Divestitures | | | - | | | | 417 | | | | 166 | | | | 417 | |
Investments sales | | | 67 | | | | - | | | | 119 | | | | 18 | |
Other investing activities (note 14B) | | | (2 | ) | | | (86 | ) | | | (81 | ) | | | (217 | ) |
Net cash used in investing activities from continuing operations | | | (570 | ) | | | (874 | ) | | | (1,626 | ) | | | (3,915 | ) |
Net cash used in investing activities from discontinued operations | | | - | | | | (7 | ) | | | - | | | | (64 | ) |
Net cash used in investing activities | | | (570 | ) | | | (881 | ) | | | (1,626 | ) | | | (3,979 | ) |
FINANCING ACTIVITIES | | | | | | | | | | | | | | | | |
Proceeds on exercise of stock options | | | - | | | | - | | | | - | | | | 1 | |
Proceeds from divestment of 10% of issued ordinary share capital of ABG | | | - | | | | - | | | | 186 | | | | - | |
Debt | | | | | | | | | | | | | | | | |
Proceeds | | | 6 | | | | 124 | | | | 139 | | | | 5,234 | |
Repayments | | | (71 | ) | | | (565 | ) | | | (164 | ) | | | (3,836 | ) |
Dividends | | | (59 | ) | | | (50 | ) | | | (175 | ) | | | (450 | ) |
Funding from non-controlling interests | | | 2 | | | | 2 | | | | 4 | | | | 34 | |
Other financing activities (note 14C) | | | - | | | | (7 | ) | | | - | | | | (29 | ) |
Net cash (used in) provided by financing activities from continuing operations | | | (122 | ) | | | (496 | ) | | | (10 | ) | | | 954 | |
Net cash used in financing activities from discontinued operations | | | - | | | | - | | | | - | | | | - | |
Net cash (used in) provided by financing activities | | | (122 | ) | | | (496 | ) | | | (10 | ) | | | 954 | |
Effect of exchange rate changes on cash and equivalents | | | (4 | ) | | | (1 | ) | | | (8 | ) | | | (12 | ) |
Net (decrease) increase in cash and equivalents | | | 156 | | | | (147 | ) | | | 281 | | | | 186 | |
Cash and equivalents excluding assets classified as held for sale at the beginning of period | | | 2,549 | | | | 2,422 | | | | 2,404 | | | | 2,097 | |
Add: cash and equivalents of assets classified as held for sale at the beginning of period | | | - | | | | 8 | | | | 20 | | | | - | |
Cash and equivalents at the end of period | | $ | 2,705 | | | $ | 2,283 | | | $ | 2,705 | | | $ | 2,283 | |
Less: cash and equivalents of assets classified as held for sale at the end of period | | | - | | | | - | | | | - | | | | - | |
Cash and equivalents excluding assets classified as held for sale at the end of period | | $ | 2,705 | | | $ | 2,283 | | | $ | 2,705 | | | $ | 2,283 | |
The accompanying notes are an integral part of these consolidated financial statements.
| | | | |
BARRICK THIRD QUARTER 2014 | | 54 | | FINANCIAL STATEMENTS (UNAUDITED) |
Consolidated Balance Sheets
| | | | | | | | |
Barrick Gold Corporation (in millions of United States dollars) (Unaudited) | | As at September 30, | | | As at December 31, | |
| | | 2014 | | | 2013 | |
ASSETS | | | | | | | | |
Current assets | | | | | | | | |
Cash and equivalents (note 19A) | | $ | 2,705 | | | $ | 2,404 | |
Accounts receivable | | | 408 | | | | 385 | |
Inventories (note 15) | | | 2,700 | | | | 2,679 | |
Other current assets | | | 320 | | | | 421 | |
Total current assets (excluding assets classified as held for sale) | | | 6,133 | | | | 5,889 | |
Assets classified as held for sale | | | 576 | | | | 323 | |
Total current assets | | | 6,709 | | | | 6,212 | |
| | |
Non-current assets | | | | | | | | |
Equity in investees | | | 28 | | | | 27 | |
Other investments | | | 33 | | | | 120 | |
Property, plant and equipment (note 16) | | | 21,425 | | | | 21,688 | |
Goodwill (note 17) | | | 5,519 | | | | 5,835 | |
Intangible assets | | | 310 | | | | 320 | |
Deferred income tax assets | | | 765 | | | | 501 | |
Non-current portion of inventory (note 15) | | | 1,685 | | | | 1,679 | |
Other assets | | | 1,016 | | | | 1,066 | |
Total assets | | $ | 37,490 | | | $ | 37,448 | |
LIABILITIES AND EQUITY | | | | | | | | |
Current liabilities | | | | | | | | |
Accounts payable | | $ | 1,661 | | | $ | 2,165 | |
Debt (note 19B) | | | 209 | | | | 179 | |
Current income tax liabilities | | | 198 | | | | 75 | |
Other current liabilities | | | 357 | | | | 303 | |
Total current liabilities (excluding liabilities classified as held for sale) | | | 2,425 | | | | 2,722 | |
Liabilities classified as held for sale | | | 16 | | | | 162 | |
Total current liabilities | | | 2,441 | | | | 2,884 | |
| | |
Non-current liabilities | | | | | | | | |
Debt (note 19B) | | | 12,885 | | | | 12,901 | |
Provisions | | | 2,496 | | | | 2,428 | |
Deferred income tax liabilities | | | 2,587 | | | | 2,258 | |
Other liabilities | | | 1,058 | | | | 976 | |
Total liabilities | | | 21,467 | | | | 21,447 | |
Equity | | | | | | | | |
Capital stock (note 21) | | | 20,863 | | | | 20,869 | |
Deficit | | | (7,812 | ) | | | (7,581 | ) |
Accumulated other comprehensive loss | | | (135 | ) | | | (69 | ) |
Other | | | 321 | | | | 314 | |
Total equity attributable to Barrick Gold Corporation shareholders | | | 13,237 | | | | 13,533 | |
Non-controlling interests (note 22) | | | 2,786 | | | | 2,468 | |
Total equity | | | 16,023 | | | | 16,001 | |
Contingencies and commitments (notes 15, 16 and 23) | | | | | | | | |
Total liabilities and equity | | $ | 37,490 | | | $ | 37,448 | |
The accompanying notes are an integral part of these consolidated financial statements.
| | | | |
BARRICK THIRD QUARTER 2014 | | 55 | | FINANCIAL STATEMENTS (UNAUDITED) |
Consolidated Statements of Changes in Equity
| | | | | | | | | | | | | | | | | | | | | | | | | | | | | | | | |
| Barrick Gold Corporation | | | | | Attributable to equity holders of the company | | | | | | | |
| (in millions of United States dollars) (Unaudited) | |
| Common Shares
(in thousands) |
| | | Capital stock | | |
| Retained
earnings (deficit) |
| |
| Accumulated
other comprehensive income (loss) |
1 | | | Other | 2 | |
| Total equity
attributable to shareholders |
| |
| Non-controlling
interests |
| | | Total equity | |
At January 1, 2014 | | | 1,164,652 | | | $ | 20,869 | | | $ | (7,581 | ) | | $ | (69 | ) | | $ | 314 | | | $ | 13,533 | | | $ | 2,468 | | | $ | 16,001 | |
Net (loss) income | | | - | | | | - | | | | (56 | ) | | | - | | | | - | | | | (56 | ) | | | 137 | | | | 81 | |
Total other comprehensive loss | | | - | | | | - | | | | - | | | | (66 | ) | | | - | | | | (66 | ) | | | - | | | | (66 | ) |
Total comprehensive (loss) income | | | - | | | | - | | | | (56 | ) | | | (66 | ) | | | - | | | | (122 | ) | | | 137 | | | | 15 | |
Transactions with owners | | | | | | | | | | | | | | | | | | | | | | | | | | | | | | | | |
Dividends | | | - | | | | - | | | | (175 | ) | | | - | | | | - | | | | (175 | ) | | | - | | | | (175 | ) |
Issued on exercise of stock options | | | 18 | | | | - | | | | - | | | | - | | | | - | | | | - | | | | - | | | | - | |
Derecognition of stock option expense | | | - | | | | (6 | ) | | | - | | | | - | | | | - | | | | (6 | ) | | | - | | | | (6 | ) |
Recognized on divestment of 10% of African Barrick Gold | | | - | | | | - | | | | - | | | | - | | | | 7 | | | | 7 | | | | 174 | | | | 181 | |
Funding from non-controlling interests | | | - | | | | - | | | | - | | | | - | | | | - | | | | - | | | | 7 | | | | 7 | |
Total transactions with owners | | | 18 | | | | (6 | ) | | | (175 | ) | | | - | | | | 7 | | | | (174 | ) | | | 181 | | | | 7 | |
At September 30, 2014 | | | 1,164,670 | | | $ | 20,863 | | | $ | (7,812 | ) | | $ | (135 | ) | | $ | 321 | | | $ | 13,237 | | | $ | 2,786 | | | $ | 16,023 | |
| | | | | | | | | | | | | | | | | | | | | | | | | | | | | | | | | |
At January 1, 2013 | | | 1,001,108 | | | $ | 17,926 | | | $ | 3,269 | | | $ | 463 | | | $ | 314 | | | $ | 21,972 | | | $ | 2,664 | | | $ | 24,636 | |
Net loss | | | - | | | | - | | | | (7,536 | ) | | | - | | | | - | | | | (7,536 | ) | | | (295 | ) | | | (7,831 | ) |
Total other comprehensive loss | | | - | | | | - | | | | - | | | | (376 | ) | | | - | | | | (376 | ) | | | - | | | | (376 | ) |
Total comprehensive loss | | | - | | | | - | | | | (7,536 | ) | | | (376 | ) | | | - | | | | (7,912 | ) | | | (295 | ) | | | (8,207 | ) |
Transactions with owners | | | | | | | | | | | | | | | | | | | | | | | | | | | | | | | | |
Dividends | | | - | | | | - | | | | (450 | ) | | | - | | | | - | | | | (450 | ) | | | - | | | | (450 | ) |
Issued on exercise of stock options | | | 44 | | | | 1 | | | | - | | | | - | | | | - | | | | 1 | | | | - | | | | 1 | |
Recognition of stock option expense | | | - | | | | 8 | | | | - | | | | - | | | | - | | | | 8 | | | | - | | | | 8 | |
Funding from non-controlling interests | | | - | | | | - | | | | - | | | | - | | | | - | | | | - | | | | 34 | | | | 34 | |
Other decrease in non-controlling interests | | | - | | | | - | | | | - | | | | - | | | | - | | | | - | | | | (14 | ) | | | (14 | ) |
Total transactions with owners | | | 44 | | | | 9 | | | | (450 | ) | | | - | | | | - | | | | (441 | ) | | | 20 | | | | (421 | ) |
At September 30, 2013 | | | 1,001,152 | | | $ | 17,935 | | | $ | (4,717 | ) | | $ | 87 | | | $ | 314 | | | $ | 13,619 | | | $ | 2,389 | | | $ | 16,008 | |
1 Includes cumulative translation losses at September 30, 2014: $99 million (September 30, 2013: losses of $61 million).
2 Includes additional paid-in capital as at September 30, 2014: $283 million (December 31, 2013: $276 million; September 30, 2013: $276 million) and convertible borrowings - equity component as at September 30, 2014: $38 million (December 31, 2013: $38 million; September 30, 2013: $38 million).
The accompanying notes are an integral part of these consolidated financial statements.
| | | | |
BARRICK THIRD QUARTER 2014 | | 56 | | FINANCIAL STATEMENTS (UNAUDITED) |
NOTES TO CONSOLIDATED
FINANCIAL STATEMENTS
Barrick Gold Corporation.Tabular dollar amounts in millions of United States dollars, unless otherwise shown. References to A$, ARS, C$, CLP, DOP, EUR, GBP, JPY, PGK, TZS, ZAR, and ZMW are to Australian dollars, Argentinean pesos, Canadian dollars, Chilean pesos, Dominican Pesos, Euros, British pound sterling, Japanese yen, Papua New Guinea kina, Tanzanian shillings, South African rand, and Zambian kwacha, respectively.
1 > CORPORATE INFORMATION
Barrick Gold Corporation (“Barrick” or the “Company”) is a corporation governed by the Business Corporations Act (Ontario). The Company’s head and registered office is located at Brookfield Place, TD Canada Trust Tower, 161 Bay Street, Suite 3700, Toronto, Ontario, M5J 2S1. We are principally engaged in the production and sale of gold and copper, as well as related activities such as exploration and mine development. Our producing gold mines are concentrated in seven operating units; Goldstrike, Cortez, Pueblo Viejo, Lagunas Norte, Veladero, North America Portfolio and Australia Pacific. We also hold a 63.9% equity interest in African Barrick Gold plc (“ABG”), a company listed on the London Stock Exchange that owns gold mines and exploration properties in Africa. Our Copper business unit contains producing copper mines located in Chile and Zambia and a project under construction located in Saudi Arabia. We also have one significant project located in South America. We sell our gold and copper production into the world market.
2 > SIGNIFICANT ACCOUNTING POLICIES
| A) | Statement of Compliance |
These condensed interim consolidated financial statements have been prepared in accordance with International Accounting Standard 34Interim Financial Reporting (“IAS 34”) as issued by the International Accounting Standards Board (“IASB”). These interim financial statements should be read in conjunction with Barrick’s most recently issued Annual Report which includes information necessary or useful to understanding the Company’s business and financial statement presentation. In particular, the Company’s significant accounting policies were presented in Note 2 of the consolidated financial statements for the year ended December 31, 2013, and have been consistently applied in the preparation of these interim financial statements. These interim consolidated financial statements were authorized for issuance by the Board of Directors on October 29, 2014.
| B) | New Accounting Standards Effective in 2014 |
IFRIC 21 Levies
In May 2013, IASB issued IFRIC 21 Levies, which sets out the accounting for an obligation to pay a levy that is not income tax. The interpretation addresses what the obligating event is that gives rise to the recognition of a liability to pay a levy. We performed an assessment of the impact of IFRIC 21 and concluded it did not have a significant impact on our consolidated financial statements.
| C) | New Accounting Standards Issued But Not Yet Effective |
IFRS 9 Financial Instruments
In July 2014, the IASB issued the final version of IFRS 9 Financial Instruments bringing together the classification and measurement, impairment and hedge accounting phases of the IASB’s project to replace IAS 39 Financial Instruments: Recognition and Measurement. The mandatory effective date of IFRS 9 would be annual periods beginning on or after January 1, 2018, with early adoption permitted. We are currently assessing the impact of adopting IFRS 9 on our consolidated financial statements along with timing of our adoption of IFRS 9.
IFRS 15 Revenue from Contracts with Customers
In May 2014, the IASB issued IFRS 15 Revenue from Contracts with Customers, which covers principles that an entity shall apply to report useful information to users of financial statements about the nature, amount, timing, and uncertainty of revenue and cash flows arising from a contract with a customer. Application of the standard is mandatory for annual reporting periods beginning on or after January 1, 2017, with earlier application permitted. We are currently assessing the impact on our consolidated financial statements along with timing of our adoption of IFRS 15.
3 > SIGNIFICANT JUDGMENTS, ESTIMATES, ASSUMPTIONS AND RISKS
The judgments, estimates, assumptions and risks discussed here reflect updates from the most recently filed annual consolidated financial statements for the year ended December 31, 2013. For judgments, estimates, assumptions and risks related to other areas not discussed in these interim consolidated financial statements, please refer to Notes 3 and 27 of the 2013 annual consolidated financial statements.
| | | | |
BARRICK THIRD QUARTER 2014 | | 57 | | NOTES TO FINANCIAL STATEMENTS (UNAUDITED) |
| A) | Gold and Copper Mineral Reserves |
At the end of each fiscal year, as part of our annual business cycle, we prepare estimates of the proven and probable reserves and the portion of resources expected to be extracted economically for each mineral property. We prospectively revise calculations of depreciation of property, plant and equipment and also transfer amounts allocated to non-depreciable mining interest to mining interest subject to depreciation based on the ounces/pounds that have become probable of being economically extracted. The effect of changes in the proven and probable reserves and the portion of resources expected to be extracted economically on depreciation expense for the three months ended September 30, 2014 was an increase of $51 million (2013: $9 million decrease) and for the nine months ended September 30, 2014 was an increase of $144 million (2013: $38 million decrease). The effect of transfers to mining interest subject to depreciation on depreciation expense for the three months ended September 30, 2014 was an increase of $1 million (2013: $3 million increase) and for the nine months ended September 30, 2014 was an increase of $4 million (2013: $8 million increase).
| B) | Provision for Environmental Rehabilitation (“PER”) |
Provisions are updated each reporting period for changes to expected cash flows and for the effect of changes in the discount rate, and the change in estimate is added or deducted from the related asset and depreciated over the expected economic life of the operation to which it relates. We recorded a decrease of $71 million (2013: $6 million increase) to the PER related to changes in the discount rate at our minesites for the three months ended September 30, 2014.
| C) | Impairment and reversal of impairment for non-current assets and impairment of goodwill |
Non-current assets other than goodwill are tested for impairment, or reversal of impairment, when events or changes in circumstances suggest that the carrying amount may not be fully recoverable, or an impairment loss recognized in prior periods for an asset other than goodwill may no longer exist or may have decreased. We conduct an annual test for impairment of goodwill in the fourth quarter of each fiscal year and at any other time of the year if an indicator of impairment is identified. We recorded $18 million (2013: $13 million) of impairment charges for the three months ended September 30, 2014 and $542 million (2013: $9.3 billion) for the nine months ended September 30, 2014.
In third quarter 2014, we sold a power-related asset at our Pueblo Viejo mine for proceeds that exceeded its carrying
value. This asset had previously been impaired in fourth quarter 2012 and therefore we recognized an impairment reversal of $9 million for the nine months ended September 30, 2014.
We have not identified any other indicators that prior impairments are required to be tested for reversal in the three months ended September 30, 2014.
Refer to note 18 for further details.
Liquidity risk is the risk of loss from not having access to sufficient funds to meet both expected and unexpected cash demands. We manage our exposure to liquidity risk by maintaining cash reserves, access to undrawn credit facilities and access to public debt markets, by staggering the maturities of outstanding debt instruments to mitigate refinancing risk and by monitoring of forecast and actual cash flows.
As part of our capital allocation strategy, we evaluate our capital expenditures in order to ensure they generate risk-adjusted return. We are also divesting assets that do not meet our investment criteria, including the sale of our Kanowna and Plutonic mines and our minority interest in Marigold for total cash proceeds of $175 million during the nine months ended September 30, 2014.
Our primary source of liquidity is our operating cash flow. Other options to enhance liquidity include drawing the $4.0 billion available under our 2012 Credit Facility (subject to compliance with covenants and the making of certain representations and warranties, this facility is available for drawdown as a source of financing), further asset sales and issuances of debt or equity securities in the public markets or to private investors, which could be undertaken for liquidity enhancement and/or in connection with establishing a strategic partnership. Many factors, including but not limited to general market conditions and then prevailing metals prices, could impact our ability to issue securities on acceptable terms, as could our credit ratings. Moody’s and S&P currently rate our long-term debt Baa2 and BBB, respectively. Changes in our ratings could affect the trading prices of our securities or our cost of capital. If we were to borrow under our 2012 Credit Facility, the applicable interest rate on the amounts borrowed would be based, in part, on our credit ratings at the time. The key financial covenant in the 2012 Credit Facility (undrawn as at September 30, 2014) requires Barrick to maintain a consolidated tangible net worth (CTNW”) of at least $3.0 billion (Barrick’s CTNW was $7.3 billion as at September 30, 2014).
| | | | |
BARRICK THIRD QUARTER 2014 | | 58 | | NOTES TO FINANCIAL STATEMENTS (UNAUDITED) |
4 > DIVESTITURES
| A) | Divestment of 50 percent interest in Jabal Sayid |
On July 13, 2014, Barrick entered into an agreement to form a joint venture with Ma’aden to operate the Jabal Sayid copper project. Ma’aden, which is 50 percent owned by the Saudi Arabian government, will acquire its 50 percent interest in the new joint venture company for cash consideration of $210 million. The acquisition is expected to be completed in the fourth quarter of 2014 and is subject to customary closing conditions. As at June 30, 2014, all of the assets and liabilities of Jabal Sayid were classified as held for sale, as the transaction would result in a loss of control. Consequently the assets and liabilities were written down to their fair value less costs of disposal, which resulted in an impairment loss of $514 million, including $316 million of goodwill. Refer to note 18 for further details of the impairment loss.
| B) | Disposition of Australian assets |
On January 31, 2014, we closed the sale of our Plutonic mine for total cash consideration of $22 million. In addition, on March 1, 2014, we completed the sale of our Kanowna mine for total cash consideration of $67 million. Both of the mines were part of our Australia Pacific operating unit. The transactions resulted in a gain of $3 million for the nine months ended September 30, 2014.
| C) | Disposition of 10 percent interest in ABG |
On March 11, 2014, we completed the divestment of 41 million ordinary shares in ABG, representing 10 percent of the issued ordinary share capital of ABG for net cash proceeds of $186 million. Subsequent to the divestment, we continue to retain a controlling financial interest in ABG and continue to consolidate ABG. We have accounted for the divestment as an equity transaction and, accordingly, recorded the difference between the proceeds received and the carrying value of $179 million as $7 million of additional paid-in capital in shareholders’ equity.
| D) | Disposition of Marigold mine |
On April 4, 2014, we completed the divestiture of our minority interest in the Marigold mine, part of our North America Portfolio operating unit, for total cash consideration of $86 million. The transaction resulted in a gain of $21 million, which we recorded in the second quarter.
| E) | Disposition of Barrick Energy |
On July 31, 2013, we closed the sale of Barrick Energy for total proceeds of $435 million, consisting of $387 million in cash and a future royalty of $48 million. As a result of the sale, we recognized a loss of $506 million for the nine months ended September 30, 2013 representing the difference between expected proceeds and our carrying value.
The condensed statements of income for the three and nine months ended September 30, 2013 in respect to Barrick Energy, which has been disclosed as a discontinued operation in the consolidated statements of income, is as follows:
| | | | | | | | |
| | | For the three
months ended
September 30 | | | For the nine
months ended
September 30 | |
| | | 2013 | | | 2013 | |
Revenue | | | $13 | | | | $93 | |
Cost of sales1 | | | 10 | | | | 79 | |
Loss on re-measurement | | | 13 | | | | 519 | |
Other expense | | | - | | | | 13 | |
Loss before finance items and income taxes | | | (10) | | | | (518) | |
Finance items | | | - | | | | (1) | |
Loss before income taxes | | | (10) | | | | (519) | |
Income tax (expense) recovery | | | 1 | | | | 13 | |
Net loss | | | $(9) | | | | $(506) | |
1Includes depreciation of $5 million for the three months ended September 30, 2013 and $43 million for the nine months ended September 30, 2013.
| | | | |
BARRICK THIRD QUARTER 2014 | | 59 | | NOTES TO FINANCIAL STATEMENTS (UNAUDITED) |
5 > SEGMENT INFORMATION
Barrick’s business is organized into ten Operating Units: five individual gold mines, two gold mine portfolios, one publicly traded gold company, a global copper business, and one project. As a result of the organizational changes that were implemented in third quarter 2014, we have determined that our Co-Presidents, acting together are Barrick’s Chief Operating Decision Maker and there were no changes to our reportable segments as a result of this reorganization. Barrick’s Chief Operating Decision Maker reviews the operating results, assesses performance and makes capital allocation decisions for each of these business operations at an Operating Unit level. Therefore, these Operating Units are operating segments for financial reporting purposes.
Segment performance is evaluated based on a number of measures including operating income before tax, production levels and unit production costs. Income tax, operating segment administration, finance income and costs, impairment charges and reversals, investment write-downs and gains/losses on non-hedge derivatives are managed on a consolidated basis and are therefore not reflected in segment income.
Consolidated Statement of Income Information
| | | | | | | | | | | | | | | | | | | | | | | | |
| | | | | | Cost of Sales | | | | | | | | | | |
For the three months ended September 30, 2014 | | Revenue | | | Direct mining &
royalties | | | Depreciation | | | Exploration &
evaluation | | | Other expenses
(income)1 | | | Segment income
(loss) | |
Gold | | | | | | | | | | | | | | | | | | | | | | | | |
Goldstrike | | | $ 295 | | | | $ 131 | | | | $ 31 | | | | $ - | | | | $ 1 | | | | $ 132 | |
Cortez | | | 324 | | | | 120 | | | | 67 | | | | 1 | | | | 4 | | | | 132 | |
Pueblo Viejo | | | 386 | | | | 143 | | | | 67 | | | | - | | | | (5) | | | | 181 | |
Lagunas Norte | | | 190 | | | | 60 | | | | 25 | | | | - | | | | (2) | | | | 107 | |
Veladero | | | 203 | | | | 99 | | | | 23 | | | | - | | | | 10 | | | | 71 | |
North America Portfolio | | | 271 | | | | 162 | | | | 48 | | | | 2 | | | | 3 | | | | 56 | |
Australia Pacific | | | 367 | | | | 199 | | | | 57 | | | | 3 | | | | (27) | | | | 135 | |
ABG | | | 240 | | | | 135 | | | | 29 | | | | 3 | | | | 12 | | | | 61 | |
Copper2 | | | 318 | | | | 179 | | | | 50 | | | | - | | | | 9 | | | | 80 | |
Pascua-Lama | | | - | | | | - | | | | 4 | | | | - | | | | 70 | | | | (74) | |
| | | | $ 2,594 | | | | $ 1,228 | | | | $ 401 | | | | $ 9 | | | | $ 75 | | | | $ 881 | |
| | | | | | | | | | | | | | | | | | | | | | | | | |
| Consolidated Statement of Income Information | |
| | | | | | Cost of Sales | | | | | | | | | | |
For the three months ended September 30, 2013 | | Revenue | | | Direct mining &
royalties | | | Depreciation | | | Exploration &
evaluation | | | Other expenses
(income)1 | | | Segment income
(loss) | |
Gold | | | | | | | | | | | | | | | | | | | | | | | | |
Goldstrike | | | $ 271 | | | | $ 118 | | | | $ 27 | | | | $ - | | | | $ 1 | | | | $ 125 | |
Cortez | | | 425 | | | | 89 | | | | 91 | | | | 4 | | | | 1 | | | | 240 | |
Pueblo Viejo | | | 271 | | | | 124 | | | | 41 | | | | 1 | | | | (4) | | | | 109 | |
Lagunas Norte | | | 182 | | | | 51 | | | | 12 | | | | 1 | | | | 4 | | | | 114 | |
Veladero | | | 212 | | | | 94 | | | | 47 | | | | - | | | | 17 | | | | 54 | |
North America Portfolio | | | 279 | | | | 176 | | | | 50 | | | | 4 | | | | 4 | | | | 45 | |
Australia Pacific | | | 646 | | | | 336 | | | | 84 | | | | 7 | | | | - | | | | 219 | |
ABG | | | 220 | | | | 126 | | | | 32 | | | | 3 | | | | 1 | | | | 58 | |
Copper2 | | | 432 | | | | 206 | | | | 41 | | | | 1 | | | | 19 | | | | 165 | |
Pascua-Lama | | | - | | | | - | | | | 1 | | | | - | | | | 59 | | | | (60) | |
| | | | $ 2,938 | | | | $ 1,320 | | | | $ 426 | | | | $ 21 | | | | $ 102 | | | | $ 1,069 | |
| | | | |
BARRICK THIRD QUARTER 2014 | | 60 | | NOTES TO FINANCIAL STATEMENTS (UNAUDITED) |
Consolidated Statement of Income Information
| | | | | | | | | | | | | | | | | | | | | | | | |
| | | | | | Cost of Sales | | | | | | | | | | |
For the nine months ended September 30, 2014 | | Revenue | | | Direct mining &
royalties | | | Depreciation | | | Exploration &
evaluation | | | Other expenses
(income)1 | | | Segment income
(loss) | |
Gold | | | | | | | | | | | | | | | | | | | | | | | | |
Goldstrike | | | $ 919 | | | | $ 399 | | | | $ 103 | | | | $ 1 | | | | $ 6 | | | | $ 410 | |
Cortez | | | 868 | | | | 304 | | | | 182 | | | | 1 | | | | 9 | | | | 372 | |
Pueblo Viejo | | | 1,133 | | | | 428 | | | | 187 | | | | - | | | | (10) | | | | 528 | |
Lagunas Norte | | | 546 | | | | 163 | | | | 51 | | | | - | | | | 5 | | | | 327 | |
Veladero | | | 659 | | | | 325 | | | | 89 | | | | 1 | | | | 28 | | | | 216 | |
North America Portfolio | | | 856 | | | | 502 | | | | 162 | | | | 5 | | | | 9 | | | | 178 | |
Australia Pacific | | | 1,120 | | | | 615 | | | | 173 | | | | 6 | | | | 4 | | | | 322 | |
ABG | | | 682 | | | | 399 | | | | 94 | | | | 14 | | | | 33 | | | | 142 | |
Copper2 | | | 861 | | | | 556 | | | | 121 | | | | - | | | | 29 | | | | 155 | |
Pascua-Lama | | | - | | | | - | | | | 12 | | | | - | | | | 231 | | | | (243) | |
| | | | $ 7,644 | | | | $ 3,691 | | | | $ 1,174 | | | | $ 28 | | | | $ 344 | | | | $ 2,407 | |
| | | | | | | | | | | | | | | | | | | | | | | | | |
| Consolidated Statement of Income Information | |
| | | | | | Cost of Sales | | | | | | | | | | |
For the nine months ended
September 30, 2013 | | Revenue | | | Direct mining &
royalties | | | Depreciation | | | Exploration &
evaluation | | | Other expenses
(income)1 | | | Segment income
(loss) | |
Gold | | | | | | | | | | | | | | | | | | | | | | | | |
Goldstrike | | | $ 916 | | | | $ 408 | | | | $ 74 | | | | $ - | | | | $ 8 | | | | $ 426 | |
Cortez | | | 1,567 | | | | 226 | | | | 249 | | | | 9 | | | | 8 | | | | 1,075 | |
Pueblo Viejo | | | 680 | | | | 277 | | | | 95 | | | | 1 | | | | 4 | | | | 303 | |
Lagunas Norte | | | 618 | | | | 155 | | | | 38 | | | | 3 | | | | 10 | | | | 412 | |
Veladero | | | 724 | | | | 281 | | | | 126 | | | | 5 | | | | 31 | | | | 281 | |
North America Portfolio | | | 901 | | | | 518 | | | | 148 | | | | 6 | | | | 16 | | | | 213 | |
Australia Pacific | | | 2,104 | | | | 1,080 | | | | 246 | | | | 19 | | | | 6 | | | | 753 | |
ABG | | | 717 | | | | 441 | | | | 131 | | | | 11 | | | | 27 | | | | 107 | |
Copper2 | | | 1,236 | | | | 686 | | | | 138 | | | | 1 | | | | 58 | | | | 353 | |
Pascua-Lama | | | - | | | | - | | | | 2 | | | | - | | | | 249 | | | | (251) | |
| | | | $ 9,463 | | | | $ 4,072 | | | | $ 1,247 | | | | $ 55 | | | | $ 417 | | | | $ 3,672 | |
| 1 | Other expenses include accretion expense, which is included within finance costs in the consolidated statement of income. For the three months ended September 30, 2014, accretion expense was $13 million (2013: $13 million) and for the nine months ended September 30, 2014, accretion expense was $40 million (2013: $37 million). |
| 2 | The Copper segment includes exploration and evaluation expense and losses from equity investees that hold copper projects. |
| | | | |
BARRICK THIRD QUARTER 2014 | | 61 | | NOTES TO FINANCIAL STATEMENTS (UNAUDITED) |
Reconciliation of Segment Income to (Loss) Income Before Income Taxes
| | | | | | | | | | | | | | | | |
| | | For the three months ended September 30 | | | For the nine months ended September 30 | |
| | | 2014 | | | 2013 | | | 2014 | | | 2013 | |
Segment income | | | $ 881 | | | | $ 1,069 | | | | $ 2,407 | | | | $ 3,672 | |
Other revenue1 | | | 4 | | | | 47 | | | | 18 | | | | 122 | |
Other cost of sales/amortization1 | | | (13) | | | | (42) | | | | (59) | | | | (111) | |
Exploration not attributable to segments | | | (33) | | | | (25) | | | | (92) | | | | (94) | |
Evaluation not attributable to segments | | | (3) | | | | (2) | | | | (10) | | | | (5) | |
General and administrative expenses | | | (98) | | | | (100) | | | | (283) | | | | (297) | |
Other (expense) income not attributable to segments | | | (21) | | | | (80) | | | | (121) | | | | (26) | |
Impairment charges not attributable to segments | | | (18) | | | | (13) | | | | (542) | | | | (9,345) | |
Finance income | | | 3 | | | | 2 | | | | 9 | | | | 7 | |
Finance costs (includes non segment accretion) | | | (185) | | | | (109) | | | | (559) | | | | (354) | |
Gain (loss) on non-hedge derivatives | | | (65) | | | | 19 | | | | - | | | | 74 | |
(Loss) income from continuing operations before income taxes | | | $ 452 | | | | $ 766 | | | | $ 768 | | | | $ (6,357) | |
| 1 | Includes revenue and costs from Pierina which is not part of any of our operating segments. Pierina entered closure in 2013. |
| | | | | | | | | | | | | | | | | | | | | | | | |
| Asset Information | | Total Assets | | | Segment capital expenditures1 | |
| | | As at September 30 | | | As at December 31 | | | For the three months ended September 30 | | | For the nine months ended September 30 | |
| | | 2014 | | | 2013 | | | 2014 | | | 2013 | | | 2014 | | | 2013 | |
Gold | | | | | | | | | | | | | | | | | | | | | | | | |
Goldstrike | | | $ 2,529 | | | | $ 2,222 | | | | $ 180 | | | | $ 117 | | | | $ 434 | | | | $ 341 | |
Cortez | | | 2,961 | | | | 3,042 | | | | 31 | | | | 85 | | | | 151 | | | | 332 | |
Pueblo Viejo | | | 4,744 | | | | 4,836 | | | | 28 | | | | 61 | | | | 99 | | | | 144 | |
Lagunas Norte | | | 652 | | | | 614 | | | | 17 | | | | 40 | | | | 60 | | | | 108 | |
Veladero | | | 675 | | | | 634 | | | | 40 | | | | 49 | | | | 104 | | | | 149 | |
North America Portfolio | | | 1,479 | | | | 1,525 | | | | 39 | | | | 75 | | | | 120 | | | | 231 | |
Australia Pacific | | | 1,571 | | | | 1,669 | | | | 29 | | | | 102 | | | | 94 | | | | 333 | |
ABG | | | 1,639 | | | | 1,515 | | | | 81 | | | | 88 | | | | 196 | | | | 296 | |
Copper | | | 2,371 | | | | 3,018 | | | | 89 | | | | 118 | | | | 240 | | | | 342 | |
Pascua-Lama | | | 2,712 | | | | 2,593 | | | | 61 | | | | 415 | | | | 92 | | | | 1,591 | |
Segment total | | | 21,333 | | | | 21,668 | | | | 595 | | | | 1,150 | | | | 1,590 | | | | 3,867 | |
Cash and equivalents | | | 2,705 | | | | 2,404 | | | | | | | | | | | | | | | | | |
Other current assets | | | 3,428 | | | | 3,485 | | | | | | | | | | | | | | | | | |
Other investments | | | 33 | | | | 120 | | | | | | | | | | | | | | | | | |
Intangible assets | | | 310 | | | | 320 | | | | | | | | | | | | | | | | | |
Deferred income tax assets | | | 765 | | | | 501 | | | | | | | | | | | | | | | | | |
Assets held for sale | | | 576 | | | | 323 | | | | | | | | | | | | | | | | | |
Goodwill | | | 5,519 | | | | 5,835 | | | | | | | | | | | | | | | | | |
Other items not allocated to segments2 | | | 2,821 | | | | 2,792 | | | | 9 | | | | 31 | | | | 25 | | | | 96 | |
Total | | | $ 37,490 | | | | $ 37,448 | | | | $ 604 | | | | $ 1,181 | | | | $ 1,615 | | | | $ 3,963 | |
| 1 | Segment capital expenditures are presented for internal management reporting purposes on an accrual basis. Capital expenditures in the Consolidated Statements of Cash Flow are presented on a cash basis. For the three months ended September 30, 2014, cash expenditures were $653 million (2013: $1,205 million) and the decrease in accrued expenditures was $49 million (2013: $24 million decrease). For the nine months ended September 30, 2014, cash expenditures were $1,885 million (2013: $4,136 million) and the decrease in accrued expenditures was $270 million (2013: $173 million decrease). |
| 2 | Primarily relates to long lived assets at Cerro Casale, Pierina and Donlin Gold. |
| | | | |
BARRICK THIRD QUARTER 2014 | | 62 | | NOTES TO FINANCIAL STATEMENTS (UNAUDITED) |
6 > REVENUE
| | | | | | | | | | | | | | | | |
| | | For the three months ended September 30 | | | For the nine months
ended September 30 | |
| | | 2014 | | | 2013 | | | 2014 | | | 2013 | |
Gold bullion sales1 | | | | | | | | | | | | | | | | |
Spot market sales | | | $ 2,158 | | | | $ 2,463 | | | | $ 6,475 | | | | $ 8,024 | |
Concentrate sales | | | 77 | | | | 48 | | | | 189 | | | | 178 | |
| | | 2,235 | | | | 2,511 | | | | 6,664 | | | | 8,202 | |
Copper sales1 | | | | | | | | | | | | | | | | |
Copper cathode sales | | | 182 | | | | 248 | | | | 527 | | | | 735 | |
Concentrate sales | | | 136 | | | | 184 | | | | 333 | | | | 501 | |
| | | | 318 | | | | 432 | | | | 860 | | | | 1,236 | |
Other metal sales2 | | | 45 | | | | 42 | | | | 138 | | | | 147 | |
Total | | | $ 2,598 | | | | $ 2,985 | | | | $ 7,662 | | | | $ 9,585 | |
| 1 | Revenues include amounts transferred from OCI to earnings for commodity cash flow hedges (see note 19C). |
| 2 | Revenues include the sale of by-products for our gold and copper mines. |
Provisional Copper and Gold Sales
We have provisionally priced sales for which price finalization, referenced to the relevant copper and gold index, is outstanding at the balance sheet date. Our exposure at September 30, 2014 to the impact of movements in market commodity prices for provisionally priced sales is set out in the following table:
| | | | | | | | | | | | | | | | |
| | | | | | Impact on net | |
| | | | | | income before | |
| | | Volumes subject to | | | taxation of 10% | |
| | | final pricing | | | movement in | |
| | | Copper (millions) | | | market price | |
| | | Gold (000’s) | | | US$M | |
For the nine months ended September 30 | | 2014 | | | 2013 | | | 2014 | | | 2013 | |
Copper pounds | | | 54 | | | | 65 | | | | $ 16 | | | | $ 21 | |
Gold ounces | | | 31 | | | | 19 | | | | 4 | | | | 3 | |
For the three months ended September 30, 2014, our provisionally priced copper sales included provisional pricing losses of $10 million (2013: $15 million gains) and our provisionally priced gold sales included provisional pricing losses of $2 million (2013: $1 million losses). For the nine months ended September 30, 2014, our provisionally priced copper sales included provisional pricing losses of $25 million (2013: $10 million losses) and our provisionally priced gold sales included no provisional pricing adjustments (2013: $8 million losses).
At September 30, 2014, our provisionally priced copper and gold sales subject to final settlement were recorded at average prices of $3.04/lb (2013: $3.30/lb) and $1,240/oz (2013: $1,349/oz), respectively. The sensitivities in the above table show the impact of a 10 percent change in commodity prices, while holding all other variables constant.
7 > COST OF SALES
| | | | | | | | | | | | | | | | |
| | | For the three months | | | For the nine months | |
| | | ended September 30 | | | ended September 30 | |
| | | 2014 | | | 2013 | | | 2014 | | | 2013 | |
Direct mining cost1,2 | | | $ 1,152 | | | | $ 1,273 | | | | $ 3,484 | | | | $ 3,892 | |
Depreciation | | | 412 | | | | 441 | | | | 1,214 | | | | 1,290 | |
Royalty expense | | | 78 | | | | 74 | | | | 226 | | | | 248 | |
| | | | $ 1,642 | | | | $ 1,788 | | | | $ 4,924 | | | | $ 5,430 | |
| 1 | Direct mining cost includes charges to reduce the cost of inventory to net realizable value as follows: $15 million for the three months ended September 30, 2104 (2013: $7 million) and $56 million for the nine months ended September 30, 2014 (2013: $25 million). |
| 2 | Direct mining cost includes the costs of extracting by-products. |
8 > EXPLORATION AND EVALUATION
| | | | | | | | | | | | | | | | |
| | | For the three months
ended September 30 | | | For the nine months
ended September 30 | |
| | | 2014 | | | 2013 | | | 2014 | | | 2013 | |
Exploration | | | | | | | | | | | | | | | | |
Minesite exploration | | | $ 6 | | | | $ 12 | | | | $ 23 | | | | $ 38 | |
Global programs | | | 33 | | | | 25 | | | | 92 | | | | 94 | |
| | | 39 | | | | 37 | | | | 115 | | | | 132 | |
Evaluation costs | | | 6 | | | | 11 | | | | 15 | | | | 22 | |
Exploration and evaluation expense1 | | | $ 45 | | | | $ 48 | | | | $ 130 | | | | $ 154 | |
| 1 | Approximates the impact on operating cash flow. |
| | | | |
BARRICK THIRD QUARTER 2014 | | 63 | | NOTES TO FINANCIAL STATEMENTS (UNAUDITED) |
9 > EARNINGS PER SHARE
| | | | | | | | | | | | | | | | | | | | | | | | | | | | | | | | |
| | | For the three months ended September 30 | | | For the nine months ended September 30 | |
| | | 2014 | | | 2013 | | | 2014 | | | 2013 | |
($ millions, except shares in millions and per share amounts in dollars) | | Basic | | | Diluted | | | Basic | | | Diluted | | | Basic | | | Diluted | | | Basic | | | Diluted | |
| | | | | | | | |
Income (loss) from continuing operations | | | $ 177 | | | | $ 177 | | | | $ 18 | | | | $ 18 | | | | $ 81 | | | | $ 81 | | | | $ (7,325) | | | | $ (7,325) | |
| | | | | | | | |
Loss from discontinued operations | | | - | | | | - | | | | (9) | | | | (9) | | | | - | | | | - | | | | (506) | | | | (506) | |
Loss (income) attributable to non-controlling interests | | | (52) | | | | (52) | | | | 163 | | | | 163 | | | | (137) | | | | (137) | | | | 295 | | | | 295 | |
Net income (loss) attributable to equity holders of Barrick Gold Corporation | | | $ 125 | | | | $ 125 | | | | $ 172 | | | | $ 172 | | | | $ (56) | | | | $ (56) | | | | $ (7,536) | | | | $ (7,536) | |
Weighted average shares outstanding | | | 1,165 | | | | 1,165 | | | | 1,001 | | | | 1,001 | | | | 1,165 | | | | 1,165 | | | | 1,001 | | | | 1,001 | |
Effect of dilutive securities - stock options | | | - | | | | - | | | | - | | | | - | | | | - | | | | - | | | | - | | | | - | |
| | | | 1,165 | | | | 1,165 | | | | 1,001 | | | | 1,001 | | | | 1,165 | | | | 1,165 | | | | 1,001 | | | | 1,001 | |
Earnings per share data attributable to the equity holders of Barrick Gold Corporation | | | | | | | | | | | | | | | | | | | | | | | | | | | | | | | | |
Income (loss) from continuing operations | | | $ 0.11 | | | | $ 0.11 | | | | $ 0.18 | | | | $ 0.18 | | | | $ (0.05) | | | | $ (0.05) | | | | $ (7.02) | | | | $ (7.02) | |
Loss from discontinued operations | | | $ - | | | | $ - | | | | $ (0.01) | | | | $ (0.01) | | | | $ - | | | | $ - | | | | $ (0.51) | | | | $ (0.51) | |
Net income (loss) | | | $ 0.11 | | | | $ 0.11 | | | | $ 0.17 | | | | $ 0.17 | | | | $ (0.05) | | | | $ (0.05) | | | | $ (7.53) | | | | $ (7.53) | |
10 > OTHER EXPENSES
| | | | | | | | | | | | | | | | |
| | | For the three months ended September 30 | | | For the nine months ended September 30 | |
| | | 2014 | | | 2013 | | | 2014 | | | 2013 | |
Corporate social responsibility | | | $ 21 | | | | $ 13 | | | | $ 61 | | | | $ 53 | |
Changes in estimate of rehabilitation costs at closed mines | | | (9) | | | | 72 | | | | 33 | | | | 20 | |
Net currency translation losses1 | | | 30 | | | | 21 | | | | 140 | | | | 62 | |
Severance and demobilization costs - Pascua-Lama | | | 3 | | | | 1 | | | | 18 | | | | 67 | |
Severance - other | | | 3 | | | | 10 | | | | 7 | | | | 20 | |
Project care and maintenance costs - Pascua-Lama | | | 29 | | | | 16 | | | | 76 | | | | 57 | |
Project care and maintenance costs - Jabal Sayid | | | 7 | | | | 12 | | | | 23 | | | | 40 | |
Cost reduction program consulting fees | | | - | | | | - | | | | 14 | | | | - | |
Lease termination charges | | | - | | | | - | | | | 15 | | | | - | |
Gain on sale of long-lived assets/investments | | | (14) | | | | (16) | | | | (37) | | | | (25) | |
Other income2 | | | (22) | | | | (2) | | | | (37) | | | | (23) | |
Other expense | | | 35 | | | | 42 | | | | 112 | | | | 135 | |
Total | | | $ 83 | | | | $ 169 | | | | $ 425 | | | | $ 406 | |
| 1 | Amounts attributable to currency translation losses on working capital. |
| 2 | For the three months ended September 30, 2014, includes incidental revenue and costs of $26 million and $20 million respectively from the Monte Rio power plant. For the nine months ended September 30, 2014, includes incidental revenue and costs of $67 million and $55 million respectively. |
| | | | | | | | | | | | | | | | |
| | | For the three months ended September 30 | | | For the nine months ended September 30 | |
| | | 2014 | | | 2013 | | | 2014 | | | 2013 | |
Impairment of long-lived assets1 | | | $ 18 | | | | $ 12 | | | | $ 203 | | | | $ 6,948 | |
Impairment of other intangibles1 | | | - | | | | - | | | | 7 | | | | 112 | |
| | | 18 | | | | 12 | | | | 210 | | | | 7,060 | |
Impairment of goodwill1 | | | - | | | | - | | | | 316 | | | | 2,264 | |
Impairment of available for sale investments | | | - | | | | 1 | | | | 16 | | | | 21 | |
Total | | | $ 18 | | | | $ 13 | | | | $ 542 | | | | $ 9,345 | |
| | | | |
BARRICK THIRD QUARTER 2014 | | 64 | | NOTES TO FINANCIAL STATEMENTS (UNAUDITED) |
11 > GENERAL AND ADMINISTRATIVE EXPENSES
| | | | | | | | | | | | | | | | |
| | | For the three months
ended September 30 | | | For the nine months ended September 30 | |
| | | 2014 | | | 2013 | | | 2014 | | | 2013 | |
Corporate administration | | | $ 57 | | | | $ 54 | | | | $ 158 | | | | $ 152 | |
Operating segment administration | | | 41 | | | | 46 | | | | 125 | | | | 145 | |
| | | | |
Total | | | $ 98 | | | | $ 100 | | | | $ 283 | | | | $ 297 | |
| |
| 12 > FINANCE COSTS | | | | | |
| | |
| | | For the three months ended September 30 | | | For the nine months ended September 30 | |
| | | 2014 | | | 2013 | | | 2014 | | | 2013 | |
Interest | | | $ 184 | | | | $ 202 | | | | $ 550 | | | | $ 577 | |
Amortization of debt issue costs | | | 5 | | | | 6 | | | | 15 | | | | 19 | |
Losses (gains) on interest rate hedges | | | (1) | | | | 1 | | | | (2) | | | | - | |
Interest capitalized | | | (8) | | | | (104) | | | | (22) | | | | (255) | |
| | | | |
Accretion | | | 18 | | | | 17 | | | | 58 | | | | 50 | |
| | | | |
Total | | | $ 198 | | | | $ 122 | | | | $ 599 | | | | $ 391 | |
13 > INCOME TAX EXPENSE
| | | | | | | | | | | | | | | | |
| | | For the three months
ended September 30 | | | For the nine months
ended September 30 | |
| | | 2014 | | | 2013 | | | 2014 | | | 2013 | |
Current | | | $ 225 | | | | $ 425 | | | | $ 621 | | | | $ 1,031 | |
Deferred | | | 50 | | | | 323 | | | | 66 | | | | (63) | |
| | | | $ 275 | | | | $ 748 | | | | $ 687 | | | | $ 968 | |
The tax rate for income in the nine months ended September 30, 2014 was 89% (2013: 15%). After adjusting for the impact of net currency translation losses on deferred tax balances, the impact of impairment charges, asset sales and non-hedge derivatives, the impact of restructuring internal debt to equity, the impact of a tax rate change in Chile and the impact of non-deductible foreign exchange losses, the underlying effective tax rate for ordinary income (loss) in the nine months ended September 30, 2014 was 50% (2013: 30%).
The increase in the effective tax rate for ordinary income (loss) from 30% in the nine months ended September 30, 2013 to 50% in the nine months ended September 30, 2014, arose primarily due to the Pueblo Viejo Special Lease Agreement amendment, which was substantively enacted in third quarter 2013, as well as certain expenditures with no offsetting recognition of deferred tax assets in 2014, primarily at our Pascua Lama project.
Currency Translation
Deferred tax balances are subject to remeasurement for changes in currency exchange rates each period. The most significant balances are Argentinean net deferred tax liabilities. In the nine months ended September 30, 2014 and 2013, tax expense of $50 million and $27 million respectively primarily arose from translation losses on tax balances in Argentina, due to the weakening of the Argentinean peso against the US dollar. These translation gains/losses are included within deferred income tax expense/recovery.
Restructure of Internal Debt to Equity
In second quarter 2014, a deferred tax recovery of $112 million arose from a restructure of internal debt to equity in subsidiary corporations, which resulted in the release of a deferred tax liability and a net increase in deferred tax assets.
Tax Rate Change in Chile
In third quarter 2014, a tax rate change was enacted in Chile, resulting in a current tax expense of $2 million.
| | | | |
BARRICK THIRD QUARTER 2014 | | 65 | | NOTES TO FINANCIAL STATEMENTS (UNAUDITED) |
14 > CASH FLOW – OTHER ITEMS
| | | | | | | | | | | | | | | | |
| A Operating Cash Flows – Other Items | | For the three months ended September 30 | | | For the nine months ended September 30 | |
| | | 2014 | | | 2013 | | | 2014 | | | 2013 | |
| | |
Adjustments for non-cash income statement items: | | | | | | | | | |
Net currency translation losses (note 10A) | | | $ 30 | | | | $ 21 | | | | $ 140 | | | | $ 62 | |
RSU expense (recovery) | | | (2) | | | | 13 | | | | 10 | | | | 1 | |
Stock option expense (recovery) | | | 1 | | | | 2 | | | | (6) | | | | 8 | |
Change in estimate of rehabilitation costs at closed mines | | | (9) | | | | 72 | | | | 33 | | | | 20 | |
Net inventory impairment charges (note 15) | | | 15 | | | | 7 | | | | 56 | | | | 25 | |
Cash flow arising from changes in: | | | | | | | | | | | | | | | | |
Derivative assets and liabilities | | | (22) | | | | (68) | | | | (90) | | | | (205) | |
Other current assets | | | 10 | | | | 25 | | | | 2 | | | | (2) | |
Value added tax recoverable | | | 28 | | | | (21) | | | | 62 | | | | (56) | |
Accounts receivable | | | (14) | | | | 99 | | | | (13) | | | | 100 | |
Other current liabilities | | | (3) | | | | (71) | | | | (10) | | | | (42) | |
Prepaid assets | | | 29 | | | | 51 | | | | 57 | | | | 178 | |
Accounts payable and accrued liabilities | | | (38) | | | | 57 | | | | (332) | | | | (157) | |
Other assets and liabilities | | | (116) | | | | (24) | | | | (186) | | | | (209) | |
Settlement of rehabilitation obligations | | | (29) | | | | (14) | | | | (68) | | | | (39) | |
Other net operating activities | | | $ (120) | | | | $ 149 | | | | $ (345) | | | | $ (316) | |
| | |
| B Investing Cash Flows – Other Items | | For the three months ended September 30 | | | For the nine months ended September 30 | |
| | | 2014 | | | 2013 | | | 2014 | | | 2013 | |
Value added tax recoverable on project capital expenditures | | | $ - | | | | $ (71) | | | | $ (58) | | | | $ (197) | |
Derivative settlements | | | - | | | | - | | | | - | | | | 20 | |
Other | | | (2) | | | | (15) | | | | (23) | | | | (40) | |
Other net investing activities | | | $ (2) | | | | $ (86) | | | | $ (81) | | | | $ (217) | |
| | |
| C Financing Cash Flows – Other Items | | For the three months ended September 30 | | | For the nine months ended September 30 | |
| | | 2014 | | | 2013 | | | 2014 | | | 2013 | |
| | | | |
Financing fees on long-term debt | | | $ - | | | | $ (8) | | | | $ - | | | | $ (32) | |
Other | | | - | | | | 1 | | | | - | | | | 3 | |
Other net financing activities | | | $ - | | | | $ (7) | | | | $ - | | | | $ (29) | |
| | | | |
BARRICK THIRD QUARTER 2014 | | 66 | | NOTES TO FINANCIAL STATEMENTS (UNAUDITED) |
15 > INVENTORIES
| | | | | | | | | | | | | | | | | | |
| | | Gold | | | | | Copper | |
| | | | | |
| | | As at September 30, 2014 | | | As at December 31, 2013 | | | | | As at September 30, 2014 | | | As at December 31, 2013 | |
Raw materials | | | | | | | | | | | | | | | | | | |
Ore in stockpiles | | | $ 1,976 | | | | $ 1,835 | | | | | | $ 163 | | | | $ 236 | |
Ore on leach pads | | | 372 | | | | 334 | | | | | | 365 | | | | 320 | |
Mine operating supplies | | | 917 | | | | 1,027 | | | | | | 138 | | | | 151 | |
Work in process | | | 261 | | | | 209 | | | | | | 7 | | | | 6 | |
Finished products | | | | | | | | | | | | | | | | | | |
Gold doré | | | 113 | | | | 177 | | | | | | - | | | | - | |
Copper cathode | | | - | | | | - | | | | | | 18 | | | | 12 | |
Copper concentrate | | | - | | | | - | | | | | | 36 | | | | 47 | |
Gold concentrate | | | 19 | | | | 4 | | | | | | - | | | | - | |
| | | $ 3,658 | | | | $ 3,586 | | | | | | $ 727 | | | | $ 772 | |
Non-current ore in stockpiles1 | | | (1,560) | | | | (1,477) | | | | | | (125) | | | | (202) | |
| | | | $ 2,098 | | | | $ 2,109 | | | | | | $ 602 | | | | $ 570 | |
| 1 | Ore that we do not expect to process in the next 12 months is classified as long-term. |
| | | | | | | | | | | | | | | | |
| | | For the three months ended September 30 | | | For the nine months ended September 30 | |
| | | 2014 | | | 2013 | | | 2014 | | | 2013 | |
Inventory impairment charges | | | $ 15 | | | | $ 7 | | | | $ 56 | | | | $ 32 | |
Inventory impairment charges reversed | | | - | | | | - | | | | - | | | | (7) | |
Purchase Commitments
At September 30, 2014, we had purchase obligations for supplies and consumables of $1,241 million.
16 > PROPERTY, PLANT AND EQUIPMENT
| | | | | | | | |
| | | As at September 30, 2014 | | | As at December 31, 2013 | |
Depreciable assets | | $ | 15,080 | | | $ | 14,761 | |
| | |
Non-depreciable assets | | | | | | | | |
Projects | | | | | | | | |
Pascua-Lama | | | 2,237 | | | | 2,053 | |
Cerro Casale1 | | | 1,920 | | | | 1,920 | |
Jabal Sayid2 | | | - | | | | 687 | |
Donlin Gold | | | 136 | | | | 125 | |
Construction-in-progress3 | | | 1,788 | | | | 1,870 | |
Acquired mineral resources and exploration potential | | | 264 | | | | 272 | |
| | | $ | 21,425 | | | $ | 21,688 | |
| 1 | Amount presented on a 100% basis and includes our partner’s non-controlling interest. |
| 2 | Refer to note 4A for further details. |
| 3 | Represents assets under construction at our operating mine sites. |
Capital Commitments
In addition to entering into various operational commitments in the normal course of business, we had capital commitments of $121 million at September 30, 2014.
17 > GOODWILL
| | | | | | | | |
| | | As at September
30, 2014 | | | As at December
31, 2013 | |
Gold | | | | | | | | |
Goldstrike | | | $ 730 | | | | $ 730 | |
Cortez | | | 869 | | | | 869 | |
Pueblo Viejo | | | 412 | | | | 412 | |
Lagunas Norte | | | 247 | | | | 247 | |
Veladero | | | 195 | | | | 195 | |
North America Portfolio | | | 758 | | | | 758 | |
Australia Pacific | | | 206 | | | | 206 | |
Gold carrying amount | | | $ 3,417 | | | | $ 3,417 | |
Copper1 | | | 2,102 | | | | 2,418 | |
| | |
Total carrying amount | | | $ 5,519 | | | | $ 5,835 | |
| 1 | Refer to note 4A for further details. |
| | | | |
BARRICK THIRD QUARTER 2014 | | 67 | | NOTES TO FINANCIAL STATEMENTS (UNAUDITED) |
18 > IMPAIRMENT OF GOODWILL AND OTHER ASSETS
In accordance with our accounting policy, goodwill is tested for impairment in the fourth quarter and also when there is an indicator of impairment. Non-current assets are tested for impairment when events or changes in circumstances suggest that the carrying amount may not be recoverable. Refer to note 20 of the Annual Consolidated Financial Statements for further information.
A Summary of impairments (reversals)
For the nine months ended September 30, 2014, we recorded impairment losses of $226 million (2013: $7.0 billion) for non-current assets and $316 million (2013: $2.3 billion) for goodwill, as summarized in the following table:
| | | | | | | | | | | | | | | | |
| | | For the three months ended September 30 | | | For the nine months ended
September 30 | |
| | | 2014 | | | 2013 | | | 2014 | | | 2013 | |
Pascua- Lama | | | $ - | | | | $ - | | | | $ - | | | | $ 5,164 | |
Copper goodwill | | | - | | | | - | | | | 316 | | | | 1,033 | |
Australia goodwill | | | - | | | | - | | | | - | | | | 649 | |
| | | | |
Buzwagi | | | - | | | | - | | | | - | | | | 721 | |
Capital project goodwill | | | - | | | | - | | | | - | | | | 397 | |
| | | | |
Jabal Sayid | | | - | | | | - | | | | 198 | | | | 501 | |
| | | | |
Lumwana | | | - | | | | - | | | | 4 | | | | - | |
ABG goodwill | | | - | | | | - | | | | - | | | | 185 | |
| | | | |
Kanowna | | | - | | | | - | | | | - | | | | 107 | |
| | | | |
North Mara | | | - | | | | - | | | | - | | | | 153 | |
Granny Smith | | | - | | | | - | | | | - | | | | 73 | |
| | | | |
Plutonic | | | - | | | | - | | | | - | | | | 20 | |
| | | | |
Darlot | | | - | | | | | | | | - | | | | 36 | |
| | | | |
Pierina | | | - | | | | - | | | | - | | | | 140 | |
Exploration (Tusker, Kainantu, Saudi Licenses) | | | - | | | | - | | | | 7 | | | | 112 | |
| | | | |
Ruby Hill | | | - | | | | - | | | | - | | | | 4 | |
AFS Investments | | | - | | | | 1 | | | | 16 | | | | 21 | |
| | | | |
Tulawaka | | | - | | | | - | | | | - | | | | 16 | |
| | | | |
Other1 | | | 18 | | | | 12 | | | | 1 | | | | 13 | |
Total | | | $ 18 | | | | $ 13 | | | | $ 542 | | | | $ 9,345 | |
| 1 | Includes the impairment reversal relating to the Pueblo Viejo power assets. |
Indicators of impairment
2014
As at June 30, 2014, our Jabal Sayid project in Saudi Arabia met the criteria as an asset held for sale. Accordingly, we were required to allocate goodwill from the Copper Operating Unit to Jabal Sayid and test the Jabal Sayid group of assets for impairment. We determined that the carrying value exceeded the fair value less cost to dispose (“FVLCD”), and consequently recorded $514 million in impairment charges, including the full amount of goodwill allocated on a relative fair value basis, of $316 million. Subsequent to quarter end, on July 13, 2014 we signed an agreement to sell a 50% interest of Jabal Sayid for cash proceeds of $210 million and this transaction is expected to close in fourth quarter 2014.
We reached an agreement to sell a power-related asset at our Pueblo Viejo mine for proceeds that exceeded its carrying value. This asset had previously been impaired in fourth quarter 2012, and therefore we recognized a pre-tax impairment reversal of $9 million. This transaction closed on September 30, 2014.
2013
The significant decrease in our long-term gold, silver and copper price assumptions in second quarter 2013, due to declining market prices, as well as the regulatory challenges to Pascua-Lama in May 2013 and the resulting schedule delays and associated capital expenditure increases; and a significant change to the mine plan at our Pierina mine, were all considered indicators of impairment, and, accordingly, we performed an impairment assessment for every mine site and significant advanced development project. As a result of this assessment, we recorded non-current asset impairment losses of $7.0 billion, including a $5.2 billion impairment loss related to the carrying value of the PP&E at Pascua-Lama; $501 million related to the Jabal Sayid project in our copper segment; $874 million related to Buzwagi and North Mara in African Barrick Gold; $236 million related to the Kanowna, Granny Smith, Plutonic and Darlot mines in our Australia Pacific Gold segment; and $140 million related to our Pierina mine in South America.
After reflecting the above non-current asset impairment losses, we conducted goodwill impairment tests and determined that the carrying value of our Copper, Australia Pacific Gold, Capital Projects and African Barrick Gold segments exceeded their FVLCD, and therefore we recorded a total goodwill impairment loss of $2.3 billion. The FVLCD of our copper segment was negatively impacted by the decrease in our long-term copper price assumption in second quarter 2013. The FVLCD of our Australia Pacific Gold segment was negatively impacted by the significant decrease in second quarter 2013 in our long-term gold price
| | | | |
BARRICK THIRD QUARTER 2014 | | 68 | | NOTES TO FINANCIAL STATEMENTS (UNAUDITED) |
assumption. The FVLCD of our Capital Projects segment was negatively impacted by the significant decrease in second quarter 2013 in our long-term gold and silver price assumptions, as well as the schedule delays and associated capital expenditure increase at our Pascua-Lama project. The FVLCD of our African Barrick Gold segment was negatively impacted by significant changes in the life of mine (“LOM”) plans in second quarter 2013 for various assets in the segment, as well as the significant decrease in our long-term gold price assumption.
Key assumptions
The key assumptions and estimates used in determining the FVLCD are related to commodity prices, discount rates, NAV multiples for gold assets, operating costs, exchange rates and capital expenditures. In addition, assumptions related to comparable entities, market values per ounce and per pound and the inclusion of reserves and resources in market multiples calculations are used. For further details refer to note 20 of the Annual Consolidated Financial Statements.
The key assumptions used in our impairment testing in second quarter 2014 and second quarter 2013 are summarized in the table below:
| | | | | | | | |
| | | Second Quarter 2014 | | | Second Quarter 2013 | |
Gold price per oz | | | N/A | | | | $1,300 | |
Silver price per oz | | | N/A | | | | $23 | |
Copper price per lb | | | $3.25 | | | | $3.25 | |
WACC – gold (range) | | | N/A | | | | 3% - 8% | |
WACC – gold (avg) | | | N/A | | | | 5% | |
WACC – copper (range) | | | 7% - 9% | | | | 6% - 8% | |
WACC – copper (avg) | | | 7% | | | | 7% | |
NAV multiple – gold (avg) | | | N/A | | | | 1.2 | |
LOM years – gold (range) | | | N/A | | | | 2 - 34 | |
LOM years – gold (avg) | | | N/A | | | | 14 | |
LOM years – copper (range) | | | 14 - 24 | | | | 13 - 33 | |
LOM years – copper (avg) | | | 18 | | | | 21 | |
Sensitivities
Based on the results of our last impairment test performed in fourth quarter 2013, the carrying value of the operating segments and CGUs that are most sensitive to the change in sales prices used in the annual test are:
| | | | |
| | |
| As at September 30, 2014 | | Carrying value | |
Copper segment1,2,3 | | | $ 4,372 | |
Cerro Casale | | | 1,511 | |
Pascua-Lama1 | | | 1,505 | |
Australia Pacific segment1,2 | | | 1,455 | |
Lumwana1 | | | 1,035 | |
Veladero1,2 | | | 734 | |
Jabal Sayid1 | | | 560 | |
Porgera1 | | | 362 | |
North Mara1 | | | 339 | |
Round Mountain1 | | | 154 | |
| 1 | These operating segments/CGUs have been impaired in either 2012, 2013 or 2014 and therefore their fair value approximates carrying value. |
| 2 | Includes goodwill (refer to note 17). |
| 3 | Due to the classification of held for sale, Jabal Sayid is not included in this figure. |
As noted in note 23, conditions exist that could result in the cancellation of Cerro Casale’s environmental permits, which would lead to the project’s reserves to be reclassified as resources. We also continue to progress options to improve the overall project economics. However, at current metal prices, it is unlikely that a feasible development alternative will be found to enable a move forward to a positive construction decision. If reserves were to be reclassified to resources or if activity to advance the project were to cease, we would be required to evaluate the recoverability of the project’s carrying value, which could result in an impairment charge being recorded.
In third quarter 2014, Chile enacted tax rate changes (refer to note 13). We are currently assessing the impact of these changes on Zaldívar’s LOM income taxes payable. If this tax rate change results in a significant increase in total income taxes payable, on a LOM basis, the estimated fair value at Zaldívar will be negatively impacted and this may result in an impairment charge being recorded against the goodwill of copper operating segment.
| | | | |
BARRICK THIRD QUARTER 2014 | | 69 | | NOTES TO FINANCIAL STATEMENTS (UNAUDITED) |
19 > FINANCIAL INSTRUMENTS
Financial instruments include cash; evidence of ownership in an entity; or a contract that imposes an obligation on one party and conveys a right to a second entity to deliver/receive cash or another financial instrument.
A Cash and Equivalents
Cash and equivalents include cash, term deposits, treasury bills and money market funds with original maturities of less than 90 days.
B Debt
| | | | | | | | |
| | | As at September 30, 2014 | | | As at December 31, 2013 | |
2.9%/4.4%/5.7% notes1 | | | $ 2,408 | | | | $ 2,406 | |
3.85%/5.25% notes | | | 1,983 | | | | 1,983 | |
5.8% notes | | | 395 | | | | 395 | |
5.75%/6.35% notes | | | 855 | | | | 855 | |
Other fixed rate notes2 | | | 2,716 | | | | 2,712 | |
Project financing3 | | | 848 | | | | 941 | |
Capital leases | | | 365 | | | | 240 | |
Other debt obligations | | | 803 | | | | 829 | |
2.5%/4.10%/5.75% notes4 | | | 2,579 | | | | 2,577 | |
ABG credit facility5 | | | 142 | | | | 142 | |
| | | $ 13,094 | | | | $ 13,080 | |
Less: current portion | | | (209) | | | | (179) | |
| | | | $ 12,885 | | | | $ 12,901 | |
| 1 | Consists of $2.4 billion in conjunction with our wholly-owned subsidiary Barrick North America Finance LLC (“BNAF”). This consists of $229 million of BGC notes due 2016, $1.35 billion of BNAF notes due 2021 and $850 million of BNAF notes due 2041. We provide an unconditional and irrevocable guarantee on all BNAF Notes and generally provide such guarantees on all BNAF notes issued, which will rank equally with our other unsecured and unsubordinated obligations. |
| 2 | Consists of $2.8 billion in conjunction with our wholly-owned subsidiary Barrick North American Finance LLC (“BNAF”) and our wholly-owned subsidiary Barrick (PD) Australia Finance Pty Ltd. (“BPDAF”). This consists of $500 million of BNAF notes due 2018, $750 million of BGC notes due 2019, $400 million of BPDAF notes due 2020, $250 million of BNAF notes due 2038 and $850 million of BPDAF notes due 2039. We provide an unconditional and irrevocable guarantee on all BNAF and BPDAF notes and generally provide such guarantees on all BNAF and BPDAF notes issued, which will rank equally with our other unsecured and unsubordinated obligations. |
| 3 | Consists of original tranches of $400 million, $375 million and $260 million. The coupon rates of the $400 million tranche and the $260 million tranche both increased from LIBOR + 3.25% to LIBOR plus 4.1% (inclusive of political risk insurance premium) effective April 26, 2014 in accordance with the terms of the financing agreement. |
| 4 | Consists of $2.6 billion in conjunction with our wholly-owned subsidiary Barrick North America Finance LLC (“BNAF”). This consists of $252 million of BGC notes due 2018, $1.5 billion of BGC notes due 2023 and $850 million of BNAF notes due 2043. We provide an unconditional and irrevocable guarantee on all BNAF Notes and generally provide such guarantees on all BNAF notes issued, which will rank equally with our other unsecured and unsubordinated obligations. |
| 5 | Consists of an export credit backed term loan facility. |
| | | | |
BARRICK THIRD QUARTER 2014 | | 70 | | NOTES TO FINANCIAL STATEMENTS (UNAUDITED) |
C Derivative Instruments at September 30, 2014
| | | | | | | | | | | | | | | | | | | | | | | | | | | | | | | | |
| | | Notional amount by term to maturity | | | Accounting classification by notional amount | |
| | | | | | | | |
| | | Within 1
year | | | 2 to 3
years | | | 4+ years | | | Total | | | Cash flow
hedge | | | Fair
value
hedge | | | Non-
hedge | | | Fair
value
(USD) | |
US dollar interest rate contracts | | | | | | | | | | | | | | | | | | | | | | | | | | | | | | | | |
Total receive - float swap positions | | | $ 14 | | | | $ 57 | | | | $ 71 | | | | $ 142 | | | | $ 142 | | | | $ - | | | | $ - | | | | $ 1 | |
Total receive - fixed swap positions | | | 100 | | | | - | | | | 400 | | | | 500 | | | | - | | | | 400 | | | | 100 | | | | 3 | |
Currency contracts | | | | | | | | | | | | | | | | | | | | | | | | | | | | | | | | |
A$:US$ contracts (A$ millions) | | | 348 | | | | 210 | | | | - | | | | 558 | | | | 462 | | | | - | | | | 96 | | | | (57) | |
C$:US$ contracts (C$ millions) | | | 249 | | | | 60 | | | | - | | | | 309 | | | | 309 | | | | - | | | | - | | | | (6) | |
CLP:US$ contracts (CLP millions) | | | 95,250 | | | | 25,500 | | | | - | | | | 120,750 | | | | 83,474 | | | | - | | | | 37,276 | | | | (8) | |
ZAR:US$ contracts (ZAR millions) | | | 588 | | | | 85 | | | | - | | | | 673 | | | | 171 | | | | - | | | | 502 | | | | (2) | |
Commodity contracts | | | | | | | | | | | | | | | | | | | | | | | | | | | | | | | | |
Copper collar sell contracts (millions of pounds) | | | 69 | | | | - | | | | - | | | | 69 | | | | 61 | | | | - | | | | 8 | | | | 4 | |
Diesel contracts (thousands of barrels)1 | | | 2,225 | | | | 4,469 | | | | 1,560 | | | | 8,254 | | | | - | | | | - | | | | 8,254 | | | | 14 | |
| 1 | Diesel commodity contracts represent a combination of WTI, BRENT, and BRENT/WTI spread swaps and options. These derivatives hedge physical supply contracts based on the price of ULSD, WTB, MOPS and JET, respectively, plus a spread. WTI represents West Texas Intermediate, BRENT represents Brent Crude Oil, and MOPS represents Mean of Platts Singapore. |
Fair Values of Derivative Instruments
| | | | | | | | | | | | | | | | | | | | | | | | |
| | | Asset Derivatives | | | Liability Derivatives | |
| | | Consolidated
Balance Sheet
Classification | | | Fair Value at
September 30,
2014 | | | Fair Value at
December 31,
2013 | | | Consolidated
Balance Sheet
Classification | | | Fair Value at
September 30,
2014 | | | Fair Value at
December 31,
2013 | |
Derivatives designated as hedging instruments | | | | | | | | | | | | | | | | | | | | | | | | |
US dollar interest rate contracts | | | Other assets | | | | $ 4 | | | | $ 6 | | | | Other liabilities | | | | $ 1 | | | | $ 1 | |
Currency contracts | | | Other assets | | | | - | | | | - | | | | Other liabilities | | | | 53 | | | | 55 | |
Commodity contracts | | | Other assets | | | | 3 | | | | 7 | | | | Other liabilities | | | | - | | | | - | |
Total derivatives classified as hedging instruments | | | | | | | $ 7 | | | | $ 13 | | | | | | | | $ 54 | | | | $ 56 | |
| | | | | | |
Derivatives not designated as hedging instruments | | | | | | | | | | | | | | | | | | | | | | | | |
US dollar interest rate contracts | | | Other assets | | | | $ 1 | | | | $ 2 | | | | Other liabilities | | | | $ - | | | | $ - | |
Currency contracts | | | Other assets | | | | 15 | | | | 12 | | | | Other liabilities | | | | 35 | | | | 39 | |
Commodity contracts | | | Other assets | | | | 22 | | | | 20 | | | | Other liabilities | | | | 7 | | | | 11 | |
Total derivatives not designated as hedging instruments | | | | | | | $ 38 | | | | $ 34 | | | | | | | | $ 42 | | | | $ 50 | |
Total derivatives | | | | | | | $ 45 | | | | $ 47 | | | | | | | | $ 96 | | | | $ 106 | |
As of September 30, 2014, we had 23 counterparties to our derivative positions. We proactively manage our exposure to individual counterparties in order to mitigate both credit and liquidity risks. For those counterparties with which we hold a net asset position (total balance attributable to the counterparties is $18 million), 5 hold greater than 10% of our mark-to-market asset position, with the largest counterparty holding 33%. We have 15 counterparties with which we are in a net liability position, for a total net liability of $69 million. On an ongoing basis, we monitor our exposures and ensure that none of the counterparties with which we hold outstanding contracts has declared insolvency.
| | | | |
BARRICK THIRD QUARTER 2014 | | 71 | | NOTES TO FINANCIAL STATEMENTS (UNAUDITED) |
Cash Flow Hedge Gains (Losses) in Accumulated Other Comprehensive Income
| | | | | | | | | | | | | | | | | | | | | | | | | | | | | | | | |
| | | | | | | | | | | | | | | | | | | | | Interest | | | | |
| | | Commodity price hedges | | | Currency hedges | | | rate hedges | | | | |
| | | | | | | | | | | | Operating | | | Administration/ | | | Capital | | | Long-term | | | | |
| | | Gold/Silver | | | Copper | | | Fuel | | | costs | | | other costs | | | expenditures | | | debt | | | Total | |
At January 1, 2014 | | | $ 18 | | | | $ - | | | | $ (4) | | | | $ 53 | | | | $ (2) | | | | $ - | | | | $ (26) | | | | $ 39 | |
Effective portion of change in fair value of hedging instruments | | | - | | | | - | | | | - | | | | (13) | | | | 5 | | | | - | | | | (1) | | | | (9) | |
Transfers to earnings: | | | | | | | | | | | | | | | | | | | | | | | | | | | | | | | | |
On recording hedged items in earnings/PP&E1 | | | - | | | | - | | | | 4 | | | | (83) | | | | (5) | | | | - | | | | 2 | | | | (82) | |
Hedge ineffectiveness due to changes in original forecasted transaction | | | - | | | | - | | | | - | | | | 6 | | | | - | | | | - | | | | - | | | | 6 | |
At September 30, 2014 | | | $ 18 | | | | $ - | | | | $ - | | | | $ (37) | | | | $ (2) | | | | $ - | | | | $ (25) | | | | $ (46) | |
| 1 | Realized gains (losses) on qualifying currency hedges of capital expenditures are transferred from OCI to PP&E on settlement. |
D Gains (Losses) on Non-hedge Derivatives
| | | | | | | | | | | | | | | | |
| | | For the three months
ended September 30 | | | For the nine months
ended September 30 | |
| | | 2014 | | | 2013 | | | 2014 | | | 2013 | |
Commodity contracts | | | | | | | | | | | | | | | | |
Gold | | | $ 1 | | | | $ - | | | | $ 1 | | | | $ 1 | |
Silver | | | - | | | | (1) | | | | - | | | | 122 | |
Copper | | | - | | | | (11) | | | | 1 | | | | (6) | |
Fuel | | | (52) | | | | 24 | | | | 20 | | | | 18 | |
Currency contracts | | | (9) | | | | (2) | | | | (11) | | | | (4) | |
| | | | $ (60) | | | | $ 10 | | | | $ 11 | | | | $ 131 | |
Gains (losses) attributable to silver option collar hedges1 | | | - | | | | - | | | | - | | | | (32) | |
Gains (losses) attributable to copper option collar hedges1 | | | (2) | | | | 5 | | | | (4) | | | | (16) | |
Gains (losses) attributable to currency option collar hedges1 | | | (3) | | | | 4 | | | | (1) | | | | (9) | |
Hedge ineffectiveness | | | - | | | | - | | | | (6) | | | | - | |
| | | | $ (5) | | | | $ 9 | | | | $ (11) | | | | $ (57) | |
| | | | $ (65) | | | | $ 19 | | | | $ - | | | | $ 74 | |
| 1 | Represents unrealized gains (losses) attributable to changes in the time value of the collars, which are excluded from the hedge effectiveness assessment. |
20 > FAIR VALUE MEASUREMENTS
A Assets and Liabilities Measured at Fair Value on a Recurring Basis
| | | | | | | | | | | | | | | | |
As at September 30, 2014 | | Quoted
prices in
active
markets
for
identical
assets (Level 1) | | | Significant
other
observable
inputs
(Level 2) | | | Significant
unobservable
inputs (Level 3) | | | Aggregate
fair value | |
Cash and equivalents | | | $ 2,705 | | | | $ - | | | | $ - | | | | $ 2,705 | |
Available-for-sale securities | | | 33 | | | | - | | | | - | | | | 33 | |
Derivatives | | | - | | | | (51) | | | | - | | | | (51) | |
Receivables from provisional copper and gold sales | | | - | | | | 190 | | | | - | | | | 190 | |
| | | | $ 2,738 | | | | $ 139 | | | | $ - | | | | $ 2,877 | |
| | | | |
BARRICK THIRD QUARTER 2014 | | 72 | | NOTES TO FINANCIAL STATEMENTS (UNAUDITED) |
B Fair Values of Financial Assets and Liabilities
| | | | | | | | | | | | | | | | |
| | | As at Sept. 30, 2014 | | | As at Dec. 31, 2013 | |
| | | Carrying
amount | | | Estimated
fair value | | | Carrying
amount | | | Estimated
fair value | |
Financial assets | | | | | | | | | | | | | | | | |
Other receivables | | | $ 161 | | | | $ 161 | | | | $ 167 | | | | $ 167 | |
Available-for-sale securities1 | | | 33 | | | | 33 | | | | 120 | | | | 120 | |
Derivative assets | | | 45 | | | | 45 | | | | 47 | | | | 47 | |
| | | | $ 239 | | | | $ 239 | | | | $ 334 | | | | $ 334 | |
Financial liabilities Debt2 | | | 13,094 | | | | 13,531 | | | | 13,080 | | | | 12,525 | |
Derivative liabilities | | | 96 | | | | 96 | | | | 106 | | | | 106 | |
Other liabilities | | | 345 | | | | 345 | | | | 355 | | | | 355 | |
| | | | $ 13,535 | | | | $ 13,972 | | | | $ 13,541 | | | | $ 12,986 | |
| 1 | Recorded at fair value. Quoted market prices are used to determine fair value. |
| 2 | Debt is generally recorded at amortized cost except for obligations that are designated in a fair-value hedge relationship, in which case the carrying amount is adjusted for changes in fair value of the hedging instrument in periods when a hedge relationship exists. The fair value of debt is primarily determined using quoted market prices. Balance includes both current and long-term portions of debt. |
We do not offset financial assets with financial liabilities.
C Assets Measured at Fair Value on a Non-Recurring Basis
| | | | | | | | | | | | | | | | |
As at September 30, 2014 | | Quoted
prices in active
markets
for
identical
assets
(Level 1) | | | Significant
other
observable
inputs
(Level 2) | | | Significant
unobservable
inputs (Level 3) | | | Aggregate
fair value | |
Property, plant and equipment1 | | | $ - | | | | $ - | | | | $ 514 | | | | $ 514 | |
Intangible assets2 | | | - | | | | - | | | | 2 | | | | 2 | |
Goodwill3 | | | - | | | | - | | | | 2,102 | | | | 2,102 | |
| 1 | Property, plant and equipment were written down by $203 million which was included in earnings in this nine month period, to their fair value less costs of disposal of $514 million. |
| 2 | Intangible assets were written down by $7 million which was included in earnings in this nine month period, to their fair value less costs of disposal of $2 million. |
| 3 | Goodwill was written down by $316 million which was included in earnings in this nine month period, to their fair value of $2,102 million. |
Valuation Techniques
Available-for-Sale Securities
The fair value of available-for-sale securities is determined based on the closing price of each security at the balance sheet date. The closing price is a quoted market price obtained from the exchange that is the principal active market for the particular security, and therefore available-
for-sale securities are classified within Level 1 of the fair value hierarchy.
Derivative Instruments
The fair value of derivative instruments is determined using either present value techniques or option pricing models that utilize a variety of inputs that are a combination of quoted prices and market-corroborated inputs. The fair value of all our derivative contracts includes an adjustment for credit risk. For counterparties in a net asset position, credit risk is based upon the observed credit default swap spread for each particular counterparty, as appropriate. For counterparties in a net liability position, credit risk is based upon Barrick’s observed credit default swap spread. The fair value of US dollar interest rate and currency swap contracts is determined by discounting contracted cash flows using a discount rate derived from observed LIBOR and swap rate curves and CDS rates. In the case of currency contracts, we convert non-US dollar cash flows into US dollars using an exchange rate derived from currency swap curves and CDS rates. The fair value of commodity forward contracts is determined by discounting contractual cash flows using a discount rate derived from observed LIBOR and swap rate curves and CDS rates. Contractual cash flows are calculated using a forward pricing curve derived from observed forward prices for each commodity. Derivative instruments are classified within Level 2 of the fair value hierarchy.
Receivables from Provisional Copper and Gold Sales
The fair value of receivables rising from copper and gold sales contracts that contain provisional pricing mechanisms is determined using the appropriate quoted forward price from the exchange that is the principal active market for the particular metal. As such, these receivables, which meet the definition of an embedded derivative, are classified within Level 2 of the fair value hierarchy.
| | | | |
BARRICK THIRD QUARTER 2014 | | 73 | | NOTES TO FINANCIAL STATEMENTS (UNAUDITED) |
21 > CAPITAL STOCK
A Authorized Capital Stock
Our authorized capital stock includes an unlimited number of common shares (issued 1,164,669,608 common shares); an unlimited number of first preferred shares issuable in series (the first series is designated as the “First Preferred Shares, Series A” and consists of 10,000,000 first preferred shares (issued nil), the second series is designated as the “First Preferred Shares, Series B” and consists of 10,000,000 first preferred shares (issued nil) and the third series is designated as the “ First Preferred Share, Series C Special Voting Share” and consists of 1 Special Voting Share (issued nil)); and an unlimited number of second preferred shares issuable in series (the first series is designated as the “Second Preferred Shares, Series A” and consists of 15,000,000 second preferred shares (issued nil)). Our common shares have no par value.
B Dividends
Dividends are declared after a quarter end in the announcement of the results for the quarter. Dividends declared are paid in the same quarter.
22 > NON-CONTROLLING INTERESTS
| | | | | | | | | | | | | | | | | | | | |
| | | Pueblo
Viejo | | | ABG | | | Cerro
Casale | | | Other | | | Total | |
At January 1, 2014 | | | $ 1,432 | | | | $ 522 | | | | $ 514 | | | | $ - | | | | $ 2,468 | |
Share of income (loss) | | | 94 | | | | 49 | | | | (4) | | | | (2) | | | | 137 | |
Cash contributed | | | - | | | | - | | | | 4 | | | | 3 | | | | 7 | |
Increase in non-controlling interest1 | | | - | | | | 174 | | | | - | | | | - | | | | 174 | |
At September 30, 2014 | | | $1,526 | | | | $745 | | | | $514 | | | | $1 | | | | $2,786 | |
| 1 | Primarily represents the increase in non-controlling interests as a result of divestment of 10% of issued ordinary share capital of ABG (see note 4C). |
23 > CONTINGENCIES
Certain conditions may exist as of the date the financial statements are issued that may result in a loss to the Company, but which will only be resolved when one or more future events occur or fail to occur. The impact of any resulting loss from such matters affecting these financial statements and noted below may be material.
Except as noted below, no material changes have occurred with respect to the matters disclosed in Note 35 “Contingencies” to the Company’s audited consolidated financial statements for the year ended December 31, 2013 (the “Audited Annual Financial Statements”), and no new contingencies have occurred that are material to the
Company since the issuance of the Audited Annual Consolidated Financial Statements.
The description set out below should be read in conjunction with Note 35 “Contingencies” to the Audited Consolidated Financial Statements.
A) Litigation and Claims Update
U.S. Shareholder Class Action
The Court held oral arguments on Defendants’ motion to dismiss on September 5, 2014. A decision of the Court is pending.
Proposed Canadian Securities Class Actions
Between April and September 2014, eight proposed class actions were commenced against the Company in Canada in connection with the Pascua Lama project. Four of the proceedings were commenced in Ontario, two were commenced in Alberta, one was commenced in Saskatchewan, and one was commenced in Quebec. The allegations in each of the eight Canadian proceedings are substantially similar to those in the Complaint filed by lead counsel and plaintiffs in the U.S. shareholder class action (see “U.S. Shareholder Class Action” above). Of the eight proposed class actions, two of the Ontario claims, both of the Alberta claims, the Quebec claim and the Saskatchewan claim have been formally served on the Company.
The first Ontario and Alberta actions were commenced by Statement of Claim on April 15, 2014 and April 17, 2014, respectively, and served on May 20, 2014 and July 29, 2014, respectively. The same law firm acts for the plaintiffs in these two proceedings, and the Statements of Claim are largely identical. Aaron Regent, Jamie Sokalsky and Ammar Al-Joundi are also named as defendants in the two actions. Both actions purport to be on behalf of anyone who, during the period from May 7, 2009 to May 23, 2013, purchased Barrick securities in Canada. Both actions seek $4.3 billion in general damages and $350 million in special damages for alleged misrepresentations in the Company’s public disclosure.
The second Ontario action was commenced by Notice of Action on April 24, 2014, and the Statement of Claim was served on May 27, 2014. Aaron Regent, Jamie Sokalsky, Ammar Al-Joundi and Peter Kinver are also named as defendants. Following a September 8, 2014 amendment to the Statement of Claim, this action purports to be on behalf of anyone who acquired Barrick securities during the period from October 29, 2010 to October 30, 2013, and seeks $6 billion in damages for alleged misrepresentations in the Company’s public disclosure. The amended claim also
| | | | |
BARRICK THIRD QUARTER 2014 | | 74 | | NOTES TO FINANCIAL STATEMENTS (UNAUDITED) |
reflects the addition of a law firm that previously acted as counsel in the third Ontario action referred to below.
The third Ontario action was commenced by Notice of Action on April 28, 2014. Aaron Regent, Jamie Sokalsky, Ammar Al-Joundi and Peter Kinver are also named as defendants. This action purports to be on behalf of anyone who acquired Barrick securities during the period from May 7, 2009 to November 1, 2013, and seeks $3 billion in damages for alleged misrepresentations in the Company’s public disclosure. This action has not been served and will not be pursued as counsel has joined the second Ontario action noted above.
The Quebec action was commenced and served on April 30, 3014. Aaron Regent, Jamie Sokalsky, Ammar Al-Joundi and Peter Kinver are also named as defendants. This action purports to be on behalf of any person who resides in Quebec and acquired Barrick securities during the period from May 7, 2009 to November 1, 2013. The action seeks unspecified damages for alleged misrepresentations in the Company’s public disclosure.
The second Alberta action was commenced by Statement of Claim on May 23, 2014, and served on June 6, 2014. Aaron Regent, Jamie Sokalsky, Ammar Al-Joundi and Peter Kinver are also named as defendants. This action purports to be on behalf of any person who acquired Barrick securities during the period from May 7, 2009 to November 1, 2013, and seeks $6 billion in damages for alleged misrepresentations in the Company’s public disclosure.
The Saskatchewan action was commenced by Statement of Claim on May 26, 2014, and served on May 28, 2014. Aaron Regent, Jamie Sokalsky, Ammar Al-Joundi and Peter Kinver are also named as defendants. This action purports to be on behalf of any person who acquired Barrick securities during the period from May 7, 2009 to November 1, 2013, and seeks $6 billion in damages for alleged misrepresentations in the Company’s public disclosure.
The fourth Ontario action was commenced on September 5, 2014. Aaron Regent, Jamie Sokalsky, Ammar Al-Joundi and Peter Kinver are also named as defendants. This action purports to be on behalf of any person who acquired Barrick securities during the period from May 7, 2009 to November 1, 2013 in Canada. The action seeks $3 billion in damages for alleged misrepresentations in the Company’s public disclosure, and may eventually be consolidated with the first Ontario action.
In November 2014, an Ontario court will hear a motion to determine which of the competing counsel groups will take the lead in the Ontario litigation.
Barrick intends to vigorously defend all of the proposed Canadian securities class actions. No amounts have been recorded for any potential liability arising from any of the proposed class actions, as the Company cannot reasonably predict the outcome.
Pascua-Lama – Challenge to SMA Regulatory Sanction
On March 3, 2014, the Environmental Court annulled the SMA Resolution and remanded the matter back to the SMA for further consideration in accordance with its decision. In particular, the Environmental Court ordered the SMA to issue a new administrative decision that recalculates the amount of the fine to be paid by CMN using a different methodology and addresses certain other errors it identified in the Resolution. A new resolution from the SMA could include more severe sanctions against CMN such as an increase in the amount of the fine above the approximately $16 million imposed by the SMA in May 2013 and/or the revocation of the project’s environmental permit. The Environmental Court did not annul the portion of the SMA Resolution that required the Company to halt construction on the Chilean side of the project until the water management system is completed in accordance with the project’s environmental permit. On March 20, 2014, CMN filed an appeal to the Chilean Supreme Court requesting the annulment of the March 3, 2014 decision of the Environmental Court and the issuance by the Chilean Supreme Court of a new decision in the matter. The Chilean Supreme Court held a hearing on CMN’s appeal on September 29, 2014. A decision from the Supreme Court is pending.
Pascua-Lama – Environmental Damage Claim
Hearings in this matter are ongoing and will continue until November 2014.
Pueblo Viejo –Amparo Action
In October 2014, Pueblo Viejo Dominicana Corporation (“PVDC”) received a copy of an action filed in an administrative court in the Dominican Republic by Rafael Guillen Beltre (the “Petitioner”), who claims to be affiliated with the Dominican Christian Peace Organization. The Government of the Dominican Republic has also been notified of the action. The action alleges that environmental contamination in the vicinity of the Pueblo Viejo mine has caused illness and affected water quality in violation of the Petitioner’s fundamental rights under the Dominican Constitution and other laws. The primary relief sought in the action, which is styled as an “Amparo”
| | | | |
BARRICK THIRD QUARTER 2014 | | 75 | | NOTES TO FINANCIAL STATEMENTS (UNAUDITED) |
remedy, is the suspension of operations at the Pueblo Viejo mine as well as other mining projects in the area until an investigation into the alleged environmental contamination has been completed by the relevant governmental authorities. A hearing has been scheduled for November 21, 2014. The Company intends to vigorously defend this matter. No amounts have been recorded for any potential liability or asset impairment arising from this matter, as the Company cannot reasonably predict any potential losses.
Argentine Glacier Legislation and Constitutional Litigation
On October 27, 2014, the Company submitted its response to a motion by the federal government to dismiss the constitutional challenge to the federal glacier law on standing grounds. A decision on the motion is pending. If the federal government’s arguments with respect to standing are accepted then the case will be dismissed. If they are not accepted then the National Supreme Court of Argentina will proceed to hear evidence on the merits.
B) Other Contingencies Update
Jabal Sayid
The Company has entered into an agreement with Ma’aden to form a joint venture to operate the Jabal Sayid copper mine. The agreement contemplates that the Company and Ma’aden will own equal shares of a new joint venture company established to hold the Jabal Sayid assets. The DMMR has approved the proposed transaction and is expected to withdraw its cessation orders upon closing, which is expected to occur in the fourth quarter of 2014 and is subject to customary closing conditions.
Lumwana
On October 10, 2014, the Zambian government proposed changes to the country’s mining tax regime that would replace the current corporate income tax and variable profit tax with a 20 percent royalty at the Company’s Lumwana mine, effective January 1, 2015. The application of a 20 percent royalty rate compared to the 6 percent royalty the Company is currently paying would challenge the economic viability of the Lumwana mine. If this tax change is ratified by parliament and implemented as proposed, the royalty could create an unsustainable level of taxation for Lumwana that could result in impairment to the carrying value of the Lumwana asset at current market prices for copper. It may also result in a substantial portion of Lumwana’s reserves being reclassified as resources.
Cerro Casale
An existing Chilean permitting regulation for undeveloped projects with older environmental approvals (the “Regulation”) would, if applied as written, require the
Company to begin construction at its 75 percent-owned Cerro Casale project by January 2015. One of the environmental permits related to Cerro Casale’s open pit and water supply would be subject to cancellation under the Regulation if construction does not begin by that date. The Company is evaluating possible exemptions from the Regulation, as permits required for the majority of the project’s proposed operations have been obtained under a new environmental approval not subject to the January 2015 deadline, and the Company is not otherwise prepared to begin construction by that date. The Company may also evaluate a potential legal challenge to the Regulation as required.
Although it is not subject to the January 2015 construction deadline, the new environmental approval mentioned above is currently being challenged by local and indigenous community members in an administrative proceeding before the Chilean environmental authority for, among other claims, alleged deficiencies in water quality baseline information and the public consultation process. An unfavorable outcome in this proceeding could result in cancellation of, or changes to, the new environmental permit.
Cancellation of either of the two environmental permits would lead the Company to reclassify the project’s reserves as resources, and could also result in an impairment charge being recorded against the carrying value of the asset. Cerro Casale, on a 75 percent basis, had total proven and probable mineral reserves of 17.4 million ounces of gold and 4.3 billion pounds of copper as at December 31, 2013, and a carrying value on a 100 percent basis of $1.5 billion as at September 30, 2014.
| | | | |
BARRICK THIRD QUARTER 2014 | | 76 | | NOTES TO FINANCIAL STATEMENTS (UNAUDITED) |
| | |
| CORPORATE OFFICE | | TRANSFER AGENTS AND REGISTRARS |
Barrick Gold Corporation | | CST Trust Company |
Brookfield Place, TD Canada Trust Tower | | P.O. Box 700, Postal Station B |
Suite 3700 | | Montreal, Quebec, Canada H3B 3K3 |
161 Bay Street, P.O. Box 212 | | or |
Toronto, Canada M5J 2S1 | | American Stock Transfer & Trust Company, LLC |
Tel: (416) 861-9911 Fax: (416) 861-0727 | | 6201 – 15 Avenue |
Toll-free throughout North America: 1-800-720-7415 | | Brooklyn, NY 11219 |
Email:investor@barrick.com | | Tel: 1-800-387-0825 |
Website:www.barrick.com | | Toll-free throughout North America |
| | Fax: 1-888-249-6189 |
| SHARES LISTED | | Email:inquiries@canstockta.com |
ABX – The New York Stock Exchange | | Website:www.canstockta.com |
The Toronto Stock Exchange | | |
| |
| INVESTOR CONTACT | | MEDIA CONTACT |
Amy Schwalm | | Andy Lloyd |
Vice President, | | Vice President, |
Investor Relations | | Communications |
Tel: (416) 307-7422 | | Tel: (416) 307-7414 |
Email:aschwalm@barrick.com | | Email:alloyd@barrick.com |
CAUTIONARY STATEMENT ON FORWARD-LOOKING INFORMATION
Certain information contained or incorporated by reference in this Third Quarter Report 2014, including any information as to our strategy, projects, plans or future financial or operating performance, constitutes “forward-looking statements”. All statements, other than statements of historical fact, are forward-looking statements. The words “believe”, “expect”, “anticipate”, “contemplate”, “target”, “plan”, “intend”, “continue”, “budget”, “estimate”, “may”, “will”, “schedule” and similar expressions identify forward-looking statements. Forward-looking statements are necessarily based upon a number of estimates and assumptions that, while considered reasonable by the company, are inherently subject to significant business, economic and competitive uncertainties and contingencies. Known and unknown factors could cause actual results to differ materially from those projected in the forward-looking statements. Such factors include, but are not limited to: fluctuations in the spot and forward price of gold, copper or certain other commodities (such as silver, diesel fuel and electricity); changes in national and local government legislation, taxation, controls or regulations and/or changes in the administration of laws, policies and practices, expropriation or nationalization of property and political or economic developments in Canada, the United States, Zambia and other jurisdictions in which the Company does or may carry on business in the future; failure to comply with environmental and health and safety laws and regulations; timing of receipt of, or failure to comply with, necessary permits and approvals; diminishing quantities or grades of reserves; increased costs, delays, suspensions and technical challenges associated with the construction of capital projects; the impact of global liquidity and credit availability on the timing of cash flows and the values of assets and liabilities based on projected future cash flows; adverse changes in our credit rating; the impact of inflation; operating or technical difficulties in connection with mining or development activities; the speculative nature of mineral exploration and development; risk of loss due to acts of war, terrorism, sabotage and civil disturbances; fluctuations in the currency markets; changes in U.S. dollar interest rates; risks arising from holding derivative instruments; litigation; contests over title to properties, particularly title to undeveloped properties, or over access to water, power and other required infrastructure; business opportunities that may be presented to, or pursued by, the company; our ability to successfully integrate acquisitions or complete divestitures; employee relations; availability and increased costs associated with mining inputs and labor; and the organization of our previously held African gold operations and properties under a separate listed company. In addition, there are risks and hazards associated with the business of mineral exploration, development and mining, including environmental hazards, industrial accidents, unusual or unexpected formations, pressures, cave-ins, flooding and gold bullion, copper cathode or gold or copper concentrate losses (and the risk of inadequate insurance, or inability to obtain insurance, to cover these risks). Many of these uncertainties and contingencies can affect our actual results and could cause actual results to differ materially from those expressed or implied in any forward-looking statements made by, or on behalf of, us. Readers are cautioned that forward-looking statements are not guarantees of future performance. All of the forward-looking statements made in this Third Quarter Report 2014 are qualified by these cautionary statements. Specific reference is made to the most recent Form 40-F/Annual Information Form on file with the SEC and Canadian provincial securities regulatory authorities for a discussion of some of the factors underlying forward-looking statements.
The company disclaims any intention or obligation to update or revise any forward-looking statements whether as a result of new information, future events or otherwise, except as required by applicable law.