
FIRST QUARTER REPORT 2015
Barrick Reports First Quarter 2015 Results
| | • | | Production and costs in the first quarter were in line with operating plans. The company produced 1.39 million ounces of gold at all-in sustaining costs (AISC)1 of $927 per ounce and generated $316 million in operating cash flow. |
| | • | | Full-year gold operating guidance remains on track for 6.2-6.6 million ounces at all-in sustaining costs of $860-$895 per ounce, with higher production and lower costs expected in the second half of the year. All-in sustaining costs and cash costs are expected to be highest in the second quarter of the year. |
| | • | | The company remains committed to debt reduction of at least $3 billion by the end of 2015, with asset sales and other initiatives well advanced. |
| | • | | Detailed evaluation of all capital spending plans using a 15 percent hurdle rate is now underway. To date, we have identified $200 million in capital expenditure reductions for 2015, with further reductions expected as the evaluation proceeds. |
| | • | | Barrick is announcing a significant new gold discovery, known as Alturas, on Chile’s prolific El Indio belt. Drilling to date suggests Alturas is geologically similar to Veladero, with the potential to be significantly higher grade. |
| | • | | Barrick has formed a new partnership with Quantum Pacific Exploration, a company using innovative strategies and tools to increase the probability of discovery, faster than conventional approaches and at lower costs. |
| | • | | The Lumwana mine will continue operating following announcement of new tax system by the government of Zambia. Copper production guidance for 2015 has been increased to 480-520 million pounds, with C1 cash costs unchanged at $1.75-$2.00 per pound. |
| | • | | Value Realization Reviews underway to identify opportunities to maximize free cash flow, grow production and lower costs across the portfolio. |
TORONTO, April 27, 2015 – Barrick Gold Corporation (NYSE:ABX) (TSX:ABX) (Barrick or the company) met cost and production targets for the first quarter, reporting net earnings of $57 million ($0.05 per share). Adjusted net earnings were $62 million ($0.05 per share)1. Operating cash flow was $316 million. Gold production guidance for 2015 remains at 6.2-6.6 million ounces, with production 55 percent weighted to the second half of the year, in line with plan. Costs are also expected to be 20 percent lower in the second half of the year, with full-year all-in sustaining costs in line with guidance of $860-$895 per ounce.
1 All-in sustaining costs per ounce, adjusted net earnings and adjusted net earnings per share are non-GAAP financial performance measures with no standardized definition under IFRS. For further information and detailed reconciliations, please see pages 49-54 of Barrick’s First Quarter 2015 Report.
| | | | |
| BARRICK FIRST QUARTER 2015 | | 1 | | PRESS RELEASE |
TAKING BARRICK ‘BACK TO THE FUTURE’
We have revitalized the Board of Directors and the management team; implemented a lean, decentralized operating model to drive greater free cash flow per share; adopted a rigorous capital allocation framework with a minimum hurdle rate of 15 percent; implemented a concrete strategy to reduce debt by at least $3 billion this year; and restored the company’s original partnership culture with the appointment of 35 new partners and the creation of the most owner-centric, long-term compensation system of any company in Canada and within our industry.
We now have superb people, in the right roles, focused on the right things. In our new decentralized model, our miners are free from bureaucracy and are focused on maximizing free cash flow. A small head office is focused on allocating that cash flow to maximize shareholder returns. Our leaders are owners, with deep financial and emotional ownership in the long-term success of the business.
We are determined to once again be the world’s leading gold company, a company that consistently grows free cash flow per share from a portfolio of the best gold assets in the best regions, delivering industry-leading returns to our owners.
BECOMING A TALENT-OBSESSED COMPANY
Barrick is obsessed with talent. People issues are the first topic at every weekly meeting of Barrick’s most senior leaders and the Board of Directors now regularly engages in in-depth talent diagnosis. Darian Rich, elevated to the role of Executive Vice President, Talent Management, reports on people issues at every Board meeting. The company has attracted 13 new senior leaders in the last nine months, individuals who personify the company’s original values and bring vital skills and experience that support the company’s business objectives, such as strengthening the balance sheet, fixing Pascua-Lama, improving efficiency and productivity, and building partnerships in China and beyond. Our newest addition is Dana Easthope. He will join the company in May as Vice President and Corporate Secretary. His first responsibility will be to bring greater depth, continuity, and strength to the relationship between our owners and the Board of Directors. Under his tenure as Corporate Secretary at Sun Life Financial, the company consistently appeared at the top of the Globe and Mail’s annual ranking of companies with the best corporate governance practices, placing first out of 250 companies in Canada in 2012 and 2013 and second in 2014.
RESTORING A STRONG BALANCE SHEET
As we take Barrick ‘back to the future’, no priority is more important than restoring a strong balance sheet. Prudent financial management is a bedrock principle of the company.
Our lean, decentralized operating model will maximize free cash flow per share—with more efficient and rigorous capital spending, reduced general and administrative costs, and profitable growth. These changes will contribute to the strength of our balance sheet over the long-term.
We remain committed to our debt reduction target of at least $3 billion by the end of 2015, and have moved quickly to advance a number of asset sales and joint venture opportunities:
| | | | |
| BARRICK FIRST QUARTER 2015 | | 2 | | PRESS RELEASE |
| | • | | Numerous companies have participated in the sales processes for the Cowal mine and the Porgera Joint Venture. Detailed due diligence on both assets is now underway, including site visits with prospective buyers. |
| | • | | We have begun a process for the sale of a stake in the Zaldívar copper mine in Chile. Zaldívar is a consistently strong performer in the world’s best jurisdiction for copper mining. Potential buyers have expressed a strong interest in acquiring an interest in the mine. |
| | • | | We are actively exploring a number of other joint venture and sales opportunities. |
We will take only those actions that make sense for the business, on terms we consider most favorable to our owners. Our strong liquidity means we can proceed with patience and discipline. We have less than $900 million in debt due over the next three years, a $4 billion undrawn credit facility, and $2.3 billion2 in cash at the end of the first quarter.
CAPITAL ALLOCATION
Barrick has returned to a lean, decentralized operating model with minimal bureaucracy. Our operational leaders are focused on maximizing free cash flow, and the head office, now about half the size it was a year ago, is focused on allocating that cash flow to maximize long-term value for our owners.
At the end of 2014, we implemented a rigorous new capital allocation framework that goes beyond anything Barrick has undertaken in the past. We expect our portfolio to deliver a 10-15 percent return on invested capital through metal price cycles and, as such, individual projects are assessed against a hurdle rate of 15 percent. We will defer, cancel or sell projects that cannot achieve this target.
The capital we invest to sustain or increase production at our existing operations is not spread evenly across the portfolio. Our operations must compete for it. Capital will flow to mines that meet our overall expectations for returns on invested capital. Assets that are unable to meet our capital allocation objectives will be sold.
We are bringing this level of rigor to every part of the business. We have launched a detailed evaluation of all capital expenditures for 2015 and 2016. All spending plans will be re-assessed against our capital allocation objectives, including a minimum hurdle rate of 15 percent return on invested capital. Expenditures that do not meet our capital allocation objectives will be cancelled or deferred.
We have already identified $200 million in capital expenditure reductions for 2015, with further reductions expected as we continue to implement our new capital allocation framework. We will report further progress with our second quarter results.
The reductions identified thus far have been partially offset by an increase in copper sustaining capital following our decision to continue operations at Lumwana. As a result, our total capital expenditure guidance for 2015 has been reduced by $100 million to $1.8-$2.1 billion.
2 Includes $417 million cash held at Acacia and Pueblo Viejo, which may not be readily deployed outside of Acacia and/or Pueblo Viejo.
| | | | |
| BARRICK FIRST QUARTER 2015 | | 3 | | PRESS RELEASE |
OPERATIONAL EXCELLENCE
We remain on track to achieve our overall target of $30 million in savings from reduced general and administrative expenditures and overhead costs in 2015, reaching $70 million in annualized savings by 2016. We expect more to follow, as our operational leaders focus on maximizing free cash flow without the constraints of bureaucracy and unnecessary management layers.
A multidisciplinary team of Barrick’s leading mining experts and independent technical specialists is also in the process of reassessing the economic potential of every Barrick mine, identifying specific projects to maximize free cash flow, increase production and lower costs. Known as the Value Realization Project, these reviews also support our non-core asset sale process by ensuring we understand the full value of every mine before we proceed with any divestiture.
Value Realization reviews are well underway for 10 operations, including our five core mines. Upside opportunities identified as part of the process will be incorporated into current mine plans where the initiatives meet our 15 percent hurdle rate or, where more engineering work and evaluations are required, may be added to mine plans for 2016 and beyond, strengthening our long term business plans. See the Cautionary Statement on Forward-Looking Information on page 25 of this press release.
As one example, the Valuation Realization process completed at Barrick’s Pueblo Viejo mine has identified a number of initiatives designed to increase efficiencies and create substantial value (100 percent basis) to the already successful operation. Key initiatives include:
| | • | | Increasing processing plant throughput by 2019: By making a series of on-going upgrades to the processing plant requiring capital expenditures of approximately $20 million, Barrick anticipates that it could increase plant throughput capacity by up to an additional 10 percent. |
| | • | | Converting the fuel supply at the Quisqueya I power plant from heavy fuel oil to liquefied natural gas (LNG): By converting the fuel supply at the Quisqueya I power plant, which provides electricity to the Pueblo Viejo mine, from heavy fuel oil to LNG, Barrick anticipates that it could significantly reduce power plant operating costs. This initiative is expected to require minimal capital from Barrick, as the power plant is designed to operate on both fuels and could be completed as early as the end of 2017. |
| | • | | Mine plan enhancements: Approximately 7-8 million ounces of mineral resources may potentially be converted into mineral reserves, extending the mine life, as a result of continued optimization efforts and by removing tailings capacity and other constraints and bottlenecks in mining and processing, using Barrick’s current price guidance for reserves. This initiative is expected to require incremental capital expenditures over the life of mine of between $120-$150 million. |
| | • | | Lime Kilns Fuel Conversion by 2017: By converting the fuel supply for the lime kilns at Pueblo Viejo from diesel fuel to LNG, Barrick anticipates that it can reduce energy consumption, costs and greenhouse gas emissions. This initiative will require capital expenditures of approximately $25 million over 18 months, with a payback period of approximately three years. |
| | | | |
| BARRICK FIRST QUARTER 2015 | | 4 | | PRESS RELEASE |
Barrick will complete the technical analysis of these initiatives while its Value Realization team continues its site-by-site review. An updated Technical Report for Pueblo Viejo will be filed by the applicable filing deadline. We expect to provide more details about our Value Realization Project on a quarterly basis.
GROWTH IN THE AMERICAS
Barrick’s five core mines in the Americas are expected to account for 60 percent of our production in 2015 at average all-in sustaining costs of $725-$775 per ounce. At two grams per tonne, these mines have an average reserve grade more than double that of our peer group average. They generate strong free cash flow in today’s gold price environment and offer exceptional leverage to higher gold prices.
We maintain a strong competitive advantage in Nevada and the Andes, with a growing pipeline of projects that have the potential to grow free cash flow per share:
| | • | | Four prefeasibility studies on growth projects in Nevada will be completed by the end of this year; |
| | • | | We have formed an innovative new partnership for exploration in Chile; |
| | • | | We intend to initiate a prefeasibility study to extend the life of the Lagunas Norte mine in Peru; and |
| | • | | We are also announcing a significant new gold discovery on the El Indio belt in Chile. |
Alturas – A significant new gold discovery
Approximately 85 percent of our 2015 exploration budget of $220-$260 million is allocated to the Americas, where our teams have uncovered some of the largest gold discoveries in recent decades, including the Lagunas Norte and Goldrush deposits.
Today we are announcing another significant new gold discovery known as Alturas, located in the Andean region of Chile approximately 30 kilometers south of the former El Indio mine.
Alturas is part of a large mineralized system which extends well beyond the limits of the current drilling area. To date, 35 core holes have been completed in a one-square-kilometer area. Mineralization appears to be oxide in nature and geologically similar to Veladero, with the potential to be significantly higher grade. Intercepts have been thick (typically ranging from 50-150 meters) and continuous.
Assay results for the significant intercepts are provided in Appendix 3 and include the following highlights:
| | • | | ALT-011: 97 meters grading 4.4 grams per tonne |
| | • | | ALT-017: 103.5 meters grading 1.64 grams per tonne |
| | • | | ALT-033: 170 meters grading 2.76 grams per tonne |
| | | | |
| BARRICK FIRST QUARTER 2015 | | 5 | | PRESS RELEASE |
This region of the Andes is home to some of the world’s largest gold deposits, including Veladero, Pascua-Lama, El Indio and Tambo. Barrick controls almost all of the prospective ground on the 140 kilometer long El Indio belt. The new discovery at Alturas is the result of a methodical re-evaluation of the El Indio belt led by our exploration team, including members of the teams behind the Goldrush and Lagunas Norte discoveries. Drilling at Alturas will continue until the end of the summer season in May. With mineralization open in multiple directions, the focus going forward will be on defining the full extent of the deposit, as well as exploring for additional targets nearby. While we expect to report an initial resource at the end of the year, the potential quantities and grades in these preliminary results are conceptual in nature and there has been insufficient exploration to define a mineral resource at this time and it is uncertain that further exploration will result in the target being delineated as a mineral resource.
Lagunas Norte Mine Life Extension
Since it began operations in 2005, Lagunas Norte has outperformed production expectations. In 2014, the mine produced 582,000 ounces of gold at all-in sustaining costs of $543 per ounce. In its early years, production peaked at more than one million ounces per year. To date, Lagunas Norte has operated as an oxide heap leach mine. Barrick is currently evaluating a plan to significantly extend the life of Lagunas Norte by mining the refractory ore below the oxide ore body in the current pit. We intend to initiate a prefeasibility study to evaluate this opportunity. As part of the study, we intend to evaluate the installation of a new grinding-flotation-autoclave processing circuit to treat the refractory ore, including the potential relocation of one autoclave from the Goldstrike mine to Lagunas Norte.
Innovative exploration partnership with QPX
Barrick’s focus is gold. As we have said, we have no plans to expand our existing copper position. Yet we do seek to maximize the value of those assets we already own, including large land positions in Chile in some of the world’s most prolific districts for copper. Thus we have formed a strategic partnership with Quantum Pacific Exploration (QPX) to explore for copper deposits in a number of highly prospective areas of northern Chile.
QPX is a company that focuses on exploring for one mineral commodity—copper—in one country—Chile. It is a part of the Quantum Pacific Group, an international business that includes some of the most innovative companies in natural resources, energy and commodities. Consistent with that theme, QPX is pioneering a new, multidisciplinary approach to exploration. The company has built a world-class team of experts who have a proven track record of copper discoveries and expertise in machine learning and big data analysis, among other disciplines. Their internal R&D lab uses proprietary technology to develop new strategies and tools designed to increase the probability of discovery, faster than conventional approaches and at lower costs. They combine world-class technical expertise with cutting-edge computer science, and they bring in learning from other industries to develop non-traditional approaches.
| | | | |
| BARRICK FIRST QUARTER 2015 | | 6 | | PRESS RELEASE |
QPX also shares Barrick’s spirit of collaboration and regularly seeks out joint ventures with companies that are complementary in assets and expertise. Under the terms of our agreement, QPX will manage the exploration program. Any gold deposits located on Barrick land will remain 100 percent Barrick-owned. If a copper project is identified on either Barrick or QPX land, it will be 50 percent owned by each company. Certain properties where Barrick is already actively exploring, including zones around Zaldívar, Pascua-Lama, Cerro Casale and El Indio, are excluded from the agreement.
The agreement is for five years, with an option to extend for another three years. The partners will contribute up to $30 million per year for exploration, with each bearing 50 percent of the total costs.
Four Nevada Prefeasibility Studies on Track for Delivery in 2015
The Goldrush project, located six kilometers from the Cortez mine, is one of the largest and highest grade gold discoveries of the last decade. The prefeasibility study is now expected to be complete by the end of 2015. Permitting is progressing for twin exploration declines that will allow the company to better explore the northern limits of the known deposit.
At the Turquoise Ridge mine (75 percent owned by Barrick), we are advancing a project to develop an additional shaft, which could bring forward more than one million ounces of production, roughly doubling output to an average of 500,000 ounces per year (100 percent basis) at all-in sustaining costs of about $625-$675 per ounce. The joint venture partners have approved a feasibility study and detailed engineering for the project. Pending receipt of permits and joint venture approval, initial production could commence in 2019. Preliminary estimates indicate capital expenditures of approximately $300-$325 million (100 percent basis) for additional underground development and shaft construction, and an attractive payback period of about two and a half years at a gold price assumption of $1,300 per ounce. Drilling will continue in 2015 at the northern extension of the deposit where the ore body is still open to the north and east with higher grades than the average reserve grade.
A prefeasibility study for expanded underground mining at Cortez below currently permitted levels will be completed in late 2015. Mineralization in this zone is primarily oxide and higher grade compared to the current underground mine, which is refractory in nature. The limits of the Lower Zone have not yet been defined, and drilling has indicated the potential for new targets at depth.
The Spring Valley project (75 percent owned by Barrick) is located approximately 75 miles west of Cortez, is a low capital cost, oxide heap leach project with potential to become another standalone mine in Nevada. In addition, there is good potential to expand the current resource at higher gold prices. The company is on track to complete a prefeasibility study in late 2015.
FINANCIAL DISCUSSION
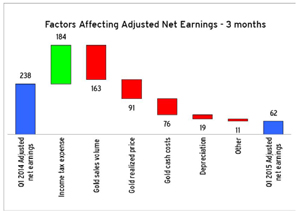
First quarter 2015 net earnings were $57 million ($0.05 per share) compared to $88 million ($0.08 per share) in the prior year period. Operating cash flow in the first quarter was $316 million compared to $585 million in the first quarter of 2014. Lower net earnings and operating cash flow reflect lower realized gold and copper prices, and lower gold sales compared to the prior year period. Adjusted net
| | | | |
| BARRICK FIRST QUARTER 2015 | | 7 | | PRESS RELEASE |
earnings for the first quarter were $62 million ($0.05 per share) compared to $238 million ($0.20 per share) in the first quarter of 2014. Significant adjusting items (net of tax and non-controlling interest effects) in the quarter include:
| | • | | $22 million in gains from asset dispositions; |
| | • | | $13 million adjustment reflecting the use of a lower discount rate to calculate the provision for environmental remediation at our closed mines; and |
| | • | | $6 million in unrealized foreign currency translation losses. |
Barrick expects to be free cash flow positive in 2015 at current gold prices.
OPERATING HIGHLIGHTS AND GUIDANCE
Gold production guidance for 2015 is 6.2-6.6 million ounces at AISC of $860-$895 per ounce. Production will be approximately 55 percent weighted to the second half of the year and costs are expected to be 20 percent lower in that period. Additionally, all-in sustaining costs and cash costs are expected to be highest in the second quarter of the year.
Following the decision to continue operations at Lumwana, total copper guidance for 2015 is now expected to be 480-520 million pounds at C1 cash costs of $1.75-$2.00 per pound.
| | | | | | | | | | | | |
| Gold | | First Quarter 2015 | | | Revised 2015 Guidance | | | Previous 2015 Guidance | |
Production (000s of ounces)3 | | | 1,390 | | | | | | | | 6,200-6,600 | |
All-in sustaining costs ($ per ounce) | | | 927 | | | | | | | | 860-895 | |
Cash costs ($ per ounce)4 | | | 642 | | | | | | | | 600-640 | |
| | | |
Copper | | | | | | | | | | | | |
Production (millions of pounds) | | | 118 | | | | 480-520 | | | | 310-340 | |
C1 cash costs ($ per pound)4 | | | 1.84 | | | | | | | | 1.75-2.00 | |
Total Capital Expenditures ($ millions)5 | | | 456 | | | | 1,800-2,100 | | | | 1,900-2,200 | |
Cortez
The Cortez mine produced 133,000 ounces at AISC of $962 per ounce in the first quarter. Production was higher than expected due to higher grades in both the open pit and underground as well as improved productivity. Costs benefited from higher production as well as lower capitalized stripping. Production at Cortez in 2015 is expected to be 825,000-900,000 ounces at AISC of $760-$835 per ounce. Production is expected to be higher in the second half of 2015 as the open pit mine transitions
3 Barrick’s share.
4 Cash costs per ounce and C1 cash costs per pound are non-GAAP financial performance measures. See pages 49-54 of Barrick’s First Quarter 2015 Report.
5 Barrick’s share on a 100% accrued basis.
| | | | |
| BARRICK FIRST QUARTER 2015 | | 8 | | PRESS RELEASE |
into higher grade material and with the ramp-up of the thiosulfate circuit (TCM) at the Goldstrike mine, which allows for processing of refractory ore from Cortez.
As part of our drive for operational excellence, the mine has identified opportunities to reduce costs by targeting energy costs, contractor services and labor and other process changes.
Goldstrike
The Goldstrike mine contributed 207,000 ounces in the first quarter at AISC of $876 per ounce, largely in line with expectations. The TCM process is an innovative and proprietary technology developed by Barrick which does not use cyanide. Several adjustments are being implemented to improve the throughput of the TCM circuit during the commissioning stage in order to meet the original ramp-up schedule. Production guidance for Goldstrike in 2015 remains unchanged at 1.00-1.15 million ounces and will be largely weighted to the second half of the year as a result of the ramp-up of the TCM circuit. AISC guidance for 2015 is unchanged at $700-$800 per ounce.
Goldstrike is anticipated to continue producing at the one million ounce level for the next three years (2015-2017) at AISC below $900 per ounce. The mine has targeted improved operating performance and reduced costs through better integration of maintenance and supply chain, which is resulting in inventory reductions and improvements in underground contractor costs.
Pueblo Viejo
Barrick’s 60 percent share of production from Pueblo Viejo for the first quarter was 135,000 ounces at AISC of $675 per ounce. Production in the quarter was weaker than planned due to lower grades and recoveries. Costs were impacted primarily by lower gold ounces sold, as well as weaker silver recoveries. Attributable production in 2015 is forecast to be 625,000-675,000 ounces at AISC of $540-$590 per ounce. Production is expected to be stronger in the second half of the year on higher grades and improved autoclave availability, with maintenance shutdowns weighted to the first half of 2015. Operating costs in the second half are also expected to benefit from higher by-product credits. The mine’s first copper concentrate sales are expected to begin in the second quarter.
Annual production of more than one million ounces (100 percent basis) at AISC below $700 per ounce is expected for the next three years (2015-2017). Several improvement initiatives are underway including improving ore blending and autoclave availability, and optimizing maintenance strategies. Longer-term, Pueblo Viejo has significant resources that are not currently in the mine plan but have the potential to extend the life of the mine.
Lagunas Norte
Lagunas Norte contributed 178,000 ounces at AISC of $461 per ounce in the first quarter. Production was stronger than expected due to higher recoveries. Costs benefited from higher ounces sold, lower operating costs and lower sustaining capital. Production in 2015 is anticipated to be 600,000-650,000 ounces at AISC of $675-$725 per ounce in 2015, with lower recoveries expected in the second half.
| | | | |
| BARRICK FIRST QUARTER 2015 | | 9 | | PRESS RELEASE |
The mine continues to explore opportunities to improve efficiencies and reduce costs through several initiatives including reducing leach pad inventory, improving the maintenance strategy for mine fleet engines, reducing cyanide consumption and reducing G&A costs.
Veladero
The Veladero mine produced 149,000 ounces of gold in the first quarter at AISC of $991 per ounce. Positive grade reconciliations continued, resulting in higher than expected production. Costs benefited from lower sustaining capital. Production guidance for 2015 is 575,000-625,000 ounces at AISC of $990-$1,075 per ounce.
The mine is targeting cost savings through improved operating performance and more efficient maintenance and blasting activities, reduced contractor costs and recovery of inventory ounces through better management of the leach pad.
Turquoise Ridge
The Turquoise Ridge mine had a strong first quarter, contributing 49,000 ounces (75 percent basis) at AISC of $709 per ounce, driven by increased tonnage and higher grades as well as improved productivity. Costs were lower than planned primarily due to lower sustaining capital expenditures. The mine is forecast to produce 175,000-200,000 ounces (75 percent basis) in 2015 at AISC of $875-$925 per ounce.
Initiatives are underway to improve operating performance and reduce costs through increased productivity, including enhancing tonnage per foot mined by increasing mining dimensions.
Porgera
The Porgera mine produced 118,000 ounces (95 percent basis) in the first quarter at AISC of $1,064 per ounce. Production was impacted by lower throughput and mill availability. Costs were lower than expected primarily as a result of reduced power and diesel usage and lower sustaining capital. In 2015, production is expected to be 500,000-550,000 ounces at AISC of $1,025-$1,125 per ounce.
The company is evaluating a number of initiatives with the potential to further reduce costs at Porgera. These include lowering energy costs through an alternative electricity supply project and reducing the number of expatriate staff and other external spending.
Other Mines
Barrick’s other mines—consisting of Bald Mountain, Round Mountain, Ruby Hill, Golden Sunlight, Hemlo, Cowal and KCGM—contributed 303,000 ounces at AISC of $987 per ounce in the first quarter.
Acacia Mining
Barrick’s share of first quarter production was 116,000 ounces at AISC of $1,117 per ounce. 2015 production from Acacia is anticipated to be 480,000-510,000 ounces at AISC of $1,050-$1,100 per
| | | | |
| BARRICK FIRST QUARTER 2015 | | 10 | | PRESS RELEASE |
ounce. Production will be weighted to the second half of 2015, driven by operational improvements and a planned ramp-up at Bulyanhulu.
Global Copper
Copper production in the first quarter was 118 million pounds at C1 cash costs of $1.84 per pound. For 2015, copper production is anticipated to be 480-520 million pounds at C1 cash costs of $1.75-$2.00 per pound.
Lumwana contributed 66 million pounds at C1 cash costs of $1.89 per pound in the first quarter. On April 20, 2015, the Zambian government announced amendments to the country’s mining tax regime that would replace the recently adopted 20 percent gross royalty on open pit mines with a nine percent royalty, along with the reintroduction of a 30 percent corporate income tax and a 15 percent variable profits tax. Based on our initial analysis, this system would enable Lumwana to remain free cash flow positive at current copper prices. As a result, we will continue operations at Lumwana. Production is anticipated to be 250-270 million pounds at C1 cash costs of $1.90-$2.15 per pound in 2015.
The Zaldívar mine produced 52 million pounds in the first quarter at C1 cash costs of $1.77 per pound. Production was impacted by an extreme rainfall event that affected mines across Chile’s Atacama region. The mine continues to be a steady generator of free cash flow and production is anticipated to be 230-250 million pounds at C1 cash costs of $1.65-$1.95 per pound in 2015.
Construction to complete safety and security infrastructure has begun at Jabal Sayid, and first shipments of low-cost copper-in-concentrate are anticipated in early 2016. Once the mine reaches full production, the average annual output is expected to be 100 million pounds per year with the potential to increase to 130 million pounds.
Qualified Person
Scientific and technical information relating to exploration at the company’s Alturas property contained in this press release has been reviewed and approved by Robert Krcmarov, Senior Vice President, Global Exploration of Barrick. Scientific and technical information relating to the Value Realization Project at the company’s 60 percent owned Pueblo Viejo mine contained in this press release has been reviewed and approved by Rick Sims, Senior Director, Resources and Reserves of Barrick, Steven Haggarty, Senior Director, Metallurgy of Barrick and Patrick Garretson, Director, Life of Mine Planning of Barrick. Each of Messrs. Krcmarov, Sims, Haggarty and Garretson is a “Qualified Person” as defined in National Instrument 43-101 - Standards of Disclosure for Mineral Projects.
Quality Assurance and Quality Control
The drilling results for the Alturas property contained in this press release have been prepared in accordance with National Instrument 43-101 - Standards of Disclosure for Mineral Projects. All drill hole assay information has been manually reviewed and approved by staff geologists and re-checked by the project manager. Sample preparation and analyses are conducted by an independent laboratory. Procedures are employed to ensure security of samples during their delivery from the
| | | | |
| BARRICK FIRST QUARTER 2015 | | 11 | | PRESS RELEASE |
drill rig to the laboratory. The quality assurance procedures, data verification and assay protocols used in connection with drilling and sampling on the Alturas property conform to industry accepted quality control methods.
| | | | |
| BARRICK FIRST QUARTER 2015 | | 12 | | PRESS RELEASE |
APPENDIX 1 —Detailed 2015 Operating and Capital Expenditure Guidance
| | | | | | |
| GOLD PRODUCTION AND COSTS | | |
| | | Production
(millions of ounces) | | AISC6 ($ per ounce) | | Cash Costs7 ($ per ounce) |
Cortez | | 0.825-0.900 | | 760-835 | | 560-610 |
Goldstrike | | 1.000-1.150 | | 700-800 | | 540-590 |
Pueblo Viejo (60%) | | 0.625-0.675 | | 540-590 | | 390-425 |
Lagunas Norte | | 0.600-0.650 | | 675-725 | | 375-425 |
Veladero | | 0.575-0.625 | | 990-1,075 | | 600-650 |
Sub-total | | 3.800-4.000 | | 725-775 | | 500-540 |
Porgera (95%) | | 0.500-0.550 | | 1,025-1,125 | | 775-825 |
Acacia (63.9%) | | 0.480-0.510 | | 1,050-1,100 | | 695-725 |
KCGM (50%) | | 0.315-0.330 | | 915-940 | | 775-800 |
Cowal | | 0.250-0.280 | | 740-775 | | 630-655 |
Hemlo | | 0.200-0.225 | | 940-980 | | 675-715 |
Turquoise Ridge (75%) | | 0.175-0.200 | | 875-925 | | 570-600 |
Round Mountain (50%) | | 0.170-0.190 | | 1,180-1,205 | | 875-900 |
Bald Mountain | | 0.170-0.195 | | 1,060-1,100 | | 560-600 |
Golden Sunlight | | 0.090-0.105 | | 1,000-1,025 | | 740-765 |
Total Gold | | 6.200-6.6008 | | 860-895 | | 600-640 |
| | | | | | | |
| COPPER PRODUCTION AND COSTS | | | | |
| | | Production (millions of pounds) | | C1 cash costs
($ per pound) | | C3 fully allocated costs9,10
($ per pound) |
Zaldívar | | 230-250 | | 1.65-1.95 | | 2.00-2.30 |
Lumwana | | 250-270 | | 1.90-2.15 | | 2.65-2.95 |
Total Copper | | 480-520 | | 1.75-2.00 | | 2.35-2.65 |
| | | |
| | | | | | | |
| CAPITAL EXPENDITURES | | | | |
| | | ($ millions) | | | | |
Mine site sustaining | | 1,500-1,70011 | | | | |
Mine site expansion | | 150-200 | | | | |
Projects | | 150-200 | | | | |
Total | | 1,800-2,10011 | | | | |
6 All-in sustaining costs are calculated in accordance with the standard published by the World Gold Council (“WGC”). See page 50 of Barrick’s First Quarter 2015 Report for further details.
7 Cash costs reflect our equity share of unit production costs, including the impact of by-product credits, which is calculated in accordance with the standard published by the WGC. See page 50 of Barrick’s First Quarter 2015 Report for further details.
8 Operating unit guidance ranges reflect expectations at each individual operating unit, but do not add up to corporate-wide guidance range total.
9 C3 fully allocated costs per pound is a non-GAAP financial performance measure. See pages 49-54 of Barrick’s First Quarter 2015 Report.
10 As a result of the decision to continue operations at Lumwana, we now expect copper production to be in the range of 480-520 million lbs and C3 fully allocated costs to be in the range of $2.35-$2.65 per pound compared to our previous guidance ranges of 310-340 million lbs and $2.30-$2.60 per pound, respectively.
11 We now expect minesite sustaining capital expenditures to be in the range of $1,500-$1,700 million and total capital expenditures to be in the range of $1,800-$2,100 million compared to our previous guidance ranges of $1,600-$1,800 million and $1,900-$2,200 million, respectively.
| | | | |
| BARRICK FIRST QUARTER 2015 | | 13 | | PRESS RELEASE |
APPENDIX 2 —Outlook Assumptions and Economic Sensitivity Analysis
| | | | | | | | | | |
| | | 2015 Guidance
Assumption | | Hypothetical
Change | | Impact on
AISC12 | | EBITDA12
(millions) | | |
Gold revenue, net of royalties | | $1,200/oz13 | | +/- $100/oz | | n/a | | $495 | | |
Copper revenue, net of royalties | | $2.60/lb | | +/- $0.50/lb | | n/a | | $119 | | |
Gold all-in sustaining costs | | | | | | | | | | |
Gold royalties & production taxes | | $1,200/oz | | $100/oz | | $3/oz | | $15 | | |
WTI crude oil price14, 15 | | $50/bbl | | $10/bbl | | $3/oz | | $13 | | |
Australian dollar exchange rate14 | | 0.80 : 1 | | +10% | | ($4)/oz | | ($19) | | |
Australian dollar exchange rate14 | | 0.80 : 1 | | -10% | | $4/oz | | $19 | | |
Canadian dollar exchange rate14 | | 1.25 : 1 | | +10% | | $2/oz | | $9 | | |
Canadian dollar exchange rate14 | | 1.25 : 1 | | -10% | | ($3)/oz | | ($15) | | |
Copper C1 cash costs | | | | | | Impact on C1 | | | | |
WTI crude oil price14,15 | | $50/bbl | | $10/bbl | | $0.00/lb | | $1 | | |
Chilean peso exchange rate14 | | 610 : 1 | | +10% | | $0.03/lb | | $7 | | |
Chilean peso exchange rate14 | | 610 : 1 | | -10% | | ($0.07)/lb | | ($17) | | |
12 All-in sustaining costs (AISC) and EBITDA are non-GAAP financial performance measures with no standard definition under IFRS. For further information and a detailed reconciliation, please see pages 49-54 of Barrick’s First Quarter 2015 Report.
13 Our outlook assumes an average gold price of $1,200 per ounce for the remainder of 2015, compared to our original assumption of $1,250 per ounce.
14 Due to our hedging activities, which are reflected in these sensitivities, we are partially protected against changes in these factors.
15 Impact on EBITDA only reflects contracts that mature in 2015.
| | | | |
| BARRICK FIRST QUARTER 2015 | | 14 | | PRESS RELEASE |
APPENDIX 3 —Alturas - Significant Intercepts16 through ALT-033
| | | | | | | | | | |
| Core Drill Hole | | Azimuth | | Dip | | Interval (m) | | Width (m)17 | | Au (g/t) |
CAR-01B | | 270 | | -70 | | 120.95 - 132 | | 11.05 | | 1.044 |
CAR-02 | | 90 | | -65 | | 113.3 - 142.9 | | 29.6 | | 1.110 |
| | | | | | 185 - 230 | | 45 | | 1.060 |
| | | | | | 251 - 264.5 | | 13.5 | | 0.742 |
| | | | | | 327.7 - 341 | | 13.3 | | 0.723 |
| | | | | | | 366 - 422.4 | | 56.4 | | 0.666 |
CAR-03 | | 90 | | -70 | | 267 - 287.5 | | 20.6 | | 1.042 |
CAR-04 | | 90 | | -70 | | 221 - 264.4 | | 43.4 | | 1.067 |
| | | | | | | 304 - 314.6 | | 10.6 | | 2.331 |
CAR-05 | | 270 | | -70 | | 312.4 - 338.4 | | 26 | | 0.825 |
CAR-06A | | 90 | | -70 | | 191.6 - 275.118 | | 81.518 | | 2.597 |
ALT-007/007W | | 90 | | -65 | | 343.5 - 403.3 | | 59.8 | | 2.198 |
| | | | | | | 438.5 - 501 | | 62.5 | | 2.312 |
ALT-008A | | 90 | | -65 | | 185 - 196.4 | | 11.5 | | 1.111 |
| | | | | | | 236 - 28718 | | 50.518 | | 1.614 |
ALT-009 | | 90 | | -70 | | 257.2 - 333.3 | | 76.2 | | 2.747 |
| | | | | | | 353.6 - 365 | | 11.4 | | 0.944 |
ALT-010/010W | | 90 | | -70 | | 178.6 - 34918 | | 168.318 | | 1.661 |
| | | | | | | 381.8 - 393.3 | | 11.5 | | 0.574 |
ALT-011 | | 90 | | -70 | | 194 - 291 | | 97 | | 4.400 |
| | | | | | | 323 - 351 | | 28 | | 1.330 |
ALT-015 | | 135 | | -80 | | 188 - 214.818 | | 23.818 | | 6.074 |
| | | | | | | 303 - 443 | | 140 | | 1.003 |
ALT-016 | | 85 | | -73 | | 224 - 233 | | 9 | | 1.121 |
ALT-017 | | 93 | | -69 | | 106.8 - 210.3 | | 103.5 | | 1.641 |
ALT-018 | | 90 | | -75 | | 202.2 - 214.2 | | 12 | | 3.902 |
| | | | | | | 238.2 - 404 | | 165.8 | | 2.129 |
ALT-019A | | 90 | | -69 | | 124 - 238 | | 114 | | 2.044 |
| | | | | | 268 - 316 | | 48 | | 0.945 |
| | | | | | | 328 - 340 | | 12 | | 0.580 |
ALT-020 | | 88 | | -69 | | 132.6 - 198 | | 65.4 | | 1.207 |
| | | | | | 273 - 288 | | 15 | | 0.845 |
16 All significant intercepts calculated using a 0.5 gpt Au cutoff and are uncapped; internal dilution included using reasonable professional discretion (generally less than 10% of total width).
17 General geometry of mineralized body is sub-horizontal; true width of intercepts are uncertain at this stage.
18 Interval and width differ due to exclusion of no core recovery zone from calculation of the weighted average gold grade.
| | | | |
| BARRICK FIRST QUARTER 2015 | | 15 | | PRESS RELEASE |
| | | | | | | | | | |
| Core Drill Hole | | Azimuth | | Dip | | Interval (m) | | Width (m)17 | | Au (g/t) |
| | | | | | | 355 - 366.8 | | 11.8 | | 2.459 |
ALT-021A | | 91 | | -71 | | 162 - 286 | | 124 | | 1.841 |
| | | | | | 310 - 328 | | 18 | | 0.869 |
| | | | | | 338 - 358 | | 20 | | 2.792 |
| | | | | | | 394 - 415 | | 21 | | 13.100 |
ALT-022 | | 90 | | -75 | | 154 - 204 | | 50 | | 0.809 |
ALT-024 | | 90 | | -69 | | 229 - 249 | | 20 | | 1.566 |
ALT-026 | | 93 | | -58 | | 256 - 305.5 | | 44.5 | | 1.319 |
| | | | | | | 337 - 361 | | 24 | | 1.197 |
ALT-027 | | 88 | | -69 | | 203 - 24718 | | 41.118 | | 3.065 |
ALT-029 | | 267 | | -59 | | 188 - 198 | | 10 | | 4.933 |
ALT-030 | | 270 | | -64 | | 189 - 235 | | 46 | | 0.905 |
ALT-031 | | 268 | | -60 | | 150 - 191 | | 41 | | 1.185 |
| | | | | | | 203 - 212.5 | | 9.5 | | 2.559 |
ALT-032 | | 92 | | -68 | | 144 - 154 | | 10 | | 0.798 |
| | | | | | | 214 - 280 | | 66 | | 0.744 |
ALT-033 | | 63 | | -88 | | 149 - 319 | | 170 | | 2.761 |
| | | | |
| BARRICK FIRST QUARTER 2015 | | 16 | | PRESS RELEASE |
Key Statistics
| | | | | | | | |
| Barrick Gold Corporation | | | | | | |
| (in United States dollars) | | Three months ended March 31, | |
| | | | |
| | | 2015 | | | 2014 | |
| |
Operating Results | | | | | | | | |
Gold production (thousands of ounces)1 | | | 1,390 | | | | 1,588 | |
Gold sold (thousands of ounces)1 | | | 1,385 | | | | 1,618 | |
Per ounce data | | | | | | | | |
Average spot gold price | | $ | 1,218 | | | $ | 1,293 | |
Average realized gold price2 | | | 1,219 | | | | 1,285 | |
Cash costs2 | | | 642 | | | | 587 | |
All-in sustaining costs2 | | | 927 | | | | 838 | |
All-in costs2 | | | 1,024 | | | | 938 | |
Cash costs (on a co-product basis)2 | | | 671 | | | | 610 | |
All-in sustaining costs (on a co-product basis)2 | | | 956 | | | | 861 | |
All-in costs (on a co-product basis)2 | | | 1,053 | | | | 961 | |
Copper production (millions of pounds) | | | 118 | | | | 104 | |
Copper sold (millions of pounds) | | | 121 | | | | 111 | |
Per pound data | | | | | | | | |
Average spot copper price | | $ | 2.64 | | | $ | 3.19 | |
Average realized copper price2 | | | 2.55 | | | | 3.03 | |
C1 cash costs2 | | | 1.84 | | | | 2.11 | |
Depreciation3 | | | 0.30 | | | | 0.37 | |
Other4 | | | 0.21 | | | | 0.16 | |
C3 fully allocated costs2 | | | 2.35 | | | | 2.64 | |
| |
Financial Results (millions) | | | | | | | | |
Revenues | | $ | 2,245 | | | $ | 2,647 | |
Net income5 | | | 57 | | | | 88 | |
Adjusted net earnings2 | | | 62 | | | | 238 | |
Operating cash flow | | | 316 | | | | 585 | |
Per Share Data (dollars) | | | | | | | | |
Net earnings (basic) | | | 0.05 | | | | 0.08 | |
Adjusted net earnings (basic)2 | | | 0.05 | | | | 0.20 | |
Net earnings (diluted) | | | 0.05 | | | | 0.08 | |
Weighted average basic and diluted common shares (millions) | | | 1,165 | | | | 1,165 | |
| |
| |
| As at
March 31, |
| |
| As at
December 31, |
|
| | | | |
| | | 2015 | | | | 2014 | |
| |
Financial Position (millions) | | | | | | | | |
Cash and equivalents | | $ | 2,258 | | | $ | 2,699 | |
Non-cash working capital | | | 3,596 | | | | 3,377 | |
| |
| | 1 | Production includes Acacia on a 73.9% basis until February 28, 2014 and a 63.9% basis thereafter and Pueblo Viejo on a 60% basis, both of which reflect our equity share of production. Also includes production from Plutonic up to January 31, 2014, Kanowna up to March 1, 2014 and Marigold up to April 4, 2014, the effective dates of sale of these assets. Sales include our equity share of gold sales from Acacia and Pueblo Viejo. | |
| | 2 | Realized price, cash costs, all-in sustaining costs, all-in costs, cash costs (on a co-product basis), all-in sustaining costs (on a co-product basis), all-in costs (on a co-product basis), C1 cash costs, C3 fully allocated costs and adjusted net earnings are non-GAAP financial performance measures with no standard definition under IFRS. Refer to the Non-GAAP Financial Performance Measures section of the Company’s MD&A. | |
| | 3 | Represents equity depreciation expense divided by equity pounds of copper sold. | |
| | 4 | For a breakdown, see reconciliation of cost of sales to C1 cash costs and C3 fully allocated costs per pound in the Non-GAAP Financial Performance Measures section of the Company’s MD&A. | |
| | 5 | Net income represents net income attributable to the equity holders of the Company. | |
| | | | |
| BARRICK FIRST QUARTER 2015 | | 17 | | SUMMARY INFORMATION |
Production and Cost Summary
| | | | | | | | | | | | | | | | | | |
| | | Gold Production (attributable ounces) (000’s) | | | All-in sustaining costs5 ($/oz) | |
| | | Three months ended March 31, | | | Three months ended
March 31, | |
| | | | | 2015 | | | 2014 | | | 2015 | | | 2014 | |
| | | | | |
Gold | | | | | | | | | | | | | | | | | | |
Goldstrike | | | | | 207 | | | | 262 | | | | $876 | | | | $759 | |
Cortez | | | | | 133 | | | | 227 | | | | 962 | | | | 654 | |
Pueblo Viejo3 | | | | | 135 | | | | 159 | | | | 675 | | | | 600 | |
Lagunas Norte | | | | | 178 | | | | 134 | | | | 461 | | | | 522 | |
Veladero | | | | | 149 | | | | 158 | | | | 991 | | | | 814 | |
Turquoise Ridge | | | | | 49 | | | | 54 | | | | 709 | | | | 526 | |
Porgera | | | | | 118 | | | | 110 | | | | 1,064 | | | | 1,039 | |
Kalgoorlie | | | | | 59 | | | | 78 | | | | 1,271 | | | | 1,014 | |
Acacia2 | | | | | 116 | | | | 118 | | | | 1,117 | | | | 1,131 | |
Other Mines - Gold1 | | | | | 244 | | | | 286 | | | | 916 | | | | 972 | |
Other4 | | | | | 2 | | | | 2 | | | | - | | | | - | |
| |
Total | | | | | 1,390 | | | | 1,588 | | | $ | 927 | | | $ | 838 | |
| |
| | | Copper Production (attributable pounds) (millions) | | | C1 Cash Costs5 ($/lb) | |
| | | Three months ended March 31, | | | Three months ended
March 31, | |
| | | | | 2015 | | | 2014 | | | 2015 | | | 2014 | |
| | | | | |
Lumwana | | | | | 66 | | | | 50 | | | $ | 1.89 | | | $ | 2.58 | |
Zaldívar | | | | | 52 | | | | 54 | | | | 1.77 | | | | 1.68 | |
| |
Total | | | | | 118 | | | | 104 | | | $ | 1.84 | | | $ | 2.11 | |
| |
| | | | | | | | | | | Total Gold Production Costs($/oz) | |
| | | | | | | | | | | Three months ended
March 31, | |
| | | | | | | | | | | 2015 | | | 2014 | |
| |
Direct mining costs before impact of hedges at market foreign exchange rates | | | | | | | | | | $ | 623 | | | $ | 595 | |
Losses (gains) realized on currency hedge and commodity hedge/economic hedge contracts | | | | | | | | | | | 13 | | | | (20) | |
By-product credits | | | | | | | | | | | (29 | ) | | | (23) | |
Royalties | | | | | | | | | | | 35 | | | | 35 | |
| |
Cash costs5 | | | | | | | | | | | | | 642 | | | | 587 | |
Depreciation | | | | | | | | | | | | | 237 | | | | 195 | |
| |
Total production costs | | | | | | | | | | | | $ | 879 | | | $ | 782 | |
| |
Cash costs5 | | | | | | | | | | | | $ | 642 | | | $ | 587 | |
General & administrative costs | | | | | | | | | | | 40 | | | | 54 | |
Rehabilitation - accretion and amortization (operating sites) | | | | | | | | | | | 25 | | | | 21 | |
Mine on-site exploration and evaluation costs | | | | | | | | | | | 4 | | | | 1 | |
Mine development expenditures | | | | | | | | | | | 120 | | | | 117 | |
Sustaining capital expenditures | | | | | | | | | | | 96 | | | | 58 | |
| |
All-in sustaining costs5 | | | | | | | | | | $ | 927 | | | $ | 838 | |
| |
All-in costs5 | | | | | | | | | | $ | 1,024 | | | $ | 938 | |
| |
| | | | | | | | | | | Total Copper Production Costs($/lb) | |
| | | | | | | | | | | Three months ended
March 31, | |
| | | | | | | | | | | 2015 | | | 2014 | |
| |
C1 cash costs5 | | | | | | | | | | | | $ | 1.84 | | | $ | 2.11 | |
Depreciation6 | | | | | | | | | | | | | 0.30 | | | | 0.37 | |
Other7 | | | | | | | | | | | | | 0.21 | | | | 0.16 | |
| |
C3 fully allocated costs4 | | | | | | | | | | | | $ | 2.35 | | | $ | 2.64 | |
| |
| | | | |
1 Includes production from Plutonic up to January 31, 2014, Kanowna up to March 1, 2014 and Marigold up to April 4, 2014, the effective dates of sale of these assets. 2 Figures relating to Acacia are presented on a 73.9% basis until February 28, 2014 and a 63.9% basis thereafter, which reflects our equity share of production. 3 Reflects production from Pueblo Viejo on a 60% basis, which reflects our equity share of production. | | | | |
4 Production and all-in sustaining costs include Pierina. 5 Cash costs, all-in sustaining costs, all-in costs, C1 cash costs and C3 fully allocated costs are non-GAAP financial performance measures with no standard meaning under IFRS. Refer to the Non-GAAP Financial Performance Measures section of the Company’s MD&A. 6 Represents equity depreciation expense divided by equity pounds of copper sold. 7 For a breakdown, see reconciliation of cost of sales to C1 cash costs and C3 fully allocated costs per pound in the Non-GAAP Financial Performance Measures section of the Company’s MD&A. | | |
| | | | |
| BARRICK FIRST QUARTER 2015 | | 18 | | SUMMARY INFORMATION |
MANAGEMENT’S DISCUSSION AND ANALYSIS (“MD&A”)
This portion of the Quarterly Report provides management’s discussion and analysis (“MD&A”) of the financial condition and results of operations to enable a reader to assess material changes in financial condition and results of operations as at and for the three month periods ended March 31, 2015, in comparison to the corresponding prior-year period. The MD&A is intended to help the reader understand Barrick Gold Corporation (“Barrick”, “we”, “our” or the “Company”), our operations, financial performance and present and future business environment. This MD&A, which has been prepared as of April 27, 2015, is intended to supplement and complement the condensed unaudited interim consolidated financial statements and notes thereto, prepared in accordance with International Accounting Standard 34 Interim Financial Reporting (“IAS 34”) as issued by the International Accounting Standards Board (“IASB”), for the three month period ended March 31, 2015 (collectively, the “Financial Statements”), which are included in this Quarterly Report on pages 55 to 74. You are encouraged to review the Financial Statements in conjunction with your review of this MD&A. This MD&A should be read in conjunction with both the annual audited
consolidated financial statements for the two years ended December 31, 2014, the related annual MD&A included in the 2014 Annual Report, and the most recent Form 40-F/Annual Information Form on file with the US Securities and Exchange Commission (“SEC”) and Canadian provincial securities regulatory authorities. Certain notes to the Financial Statements are specifically referred to in this MD&A and such notes are incorporated by reference herein. All dollar amounts in this MD&A are in millions of US dollars, unless otherwise specified.
For the purposes of preparing our MD&A, we consider the materiality of information. Information is considered material if: (i) such information results in, or would reasonably be expected to result in, a significant change in the market price or value of our shares; or (ii) there is a substantial likelihood that a reasonable investor would consider it important in making an investment decision; or (iii) it would significantly alter the total mix of information available to investors. We evaluate materiality with reference to all relevant circumstances, including potential market sensitivity.
CAUTIONARY STATEMENT ON FORWARD-LOOKING INFORMATION
Certain information contained or incorporated by reference in this MD&A, including any information as to our strategy, projects, plans or future financial or operating performance constitutes “forward-looking statements”. All statements, other than statements of historical fact, are forward-looking statements. The words “believe”, “expect”, “anticipate”, “contemplate”, “target”, “plan”, “intend”, “project”, “continue”, “budget”, “estimate”, “potential”, “may”, “will”, “can”, “could” and similar expressions identify forward-looking statements. Forward-looking statements are necessarily based upon a number of estimates and assumptions that, while considered reasonable by the Company in light of management’s experience and perception of current conditions and expected developments, are inherently subject to significant business, economic and competitive uncertainties and contingencies. Known and unknown factors could cause actual results to differ materially from those projected in the forward-looking statements. Such factors include, but are not limited to: fluctuations in the spot and forward price of gold, copper or certain other commodities (such as silver, diesel fuel and electricity); changes in national and
local government legislation, taxation, controls or regulations and/or changes in the administration of laws, policies and practices, expropriation or nationalization of property and political or economic developments in Canada, the United States, Zambia and other jurisdictions in which the Company does or may carry on business in the future; failure to comply with environmental and health and safety laws and regulations; timing of receipt of, or failure to comply with, necessary permits and approvals; diminishing quantities or grades of reserves; increased costs and risks related to the potential impact of climate change; increased costs, delays, suspensions and technical challenges associated with the construction of capital projects; the impact of global liquidity and credit availability on the timing of cash flows and the values of assets and liabilities based on projected future cash flows; adverse changes in our credit rating; the impact of inflation; operating or technical difficulties in connection with mining or development activities, including disruptions in the maintenance or provision of required infrastructure and information technology systems; damage to the Company’s reputation due to the actual or perceived occurrence
| | | | |
| BARRICK FIRST QUARTER 2015 | | 19 | | MANAGEMENT’S DISCUSSION AND ANALYSIS |
of any number of events, including negative publicity with respect to the Company’s handling of environmental matters or dealings with community groups, whether true or not; the speculative nature of mineral exploration and development; the possibility that future exploration results will not be consistent with the Company’s expectations; changes in mineral production performance, exploitation and exploration successes; risks that exploration data may be incomplete and considerable additional work may be required to complete further evaluation, including but not limited to drilling, engineering and socio-economic studies and investment; risk of loss due to acts of war, terrorism, sabotage and civil disturbances; fluctuations in the currency markets; changes in U.S. dollar interest rates; risks arising from holding derivative instruments; litigation; contests over title to properties, particularly title to undeveloped properties, or over access to water, power and other required infrastructure; business opportunities that may be presented to, or pursued by, the Company; our ability to successfully integrate acquisitions or complete divestitures; employee relations; availability and increased costs associated with mining inputs and labor; and the organization of our previously held African gold operations and properties under a separate listed company. In addition, there are risks
and hazards associated with the business of mineral exploration, development and mining, including environmental hazards, industrial accidents, unusual or unexpected formations, pressures, cave-ins, flooding and gold bullion, copper cathode or gold or copper concentrate losses (and the risk of inadequate insurance, or inability to obtain insurance, to cover these risks). Many of these uncertainties and contingencies can affect our actual results and could cause actual results to differ materially from those expressed or implied in any forward-looking statements made by, or on behalf of, us. Readers are cautioned that forward-looking statements are not guarantees of future performance. All of the forward-looking statements made in this MD&A are qualified by these cautionary statements. Specific reference is made to the most recent Form 40-F/Annual Information Form on file with the SEC and Canadian provincial securities regulatory authorities for a discussion of some of the factors underlying forward-looking statements. We disclaim any intention or obligation to update or revise any forward-looking statements whether as a result of new information, future events or otherwise, except as required by applicable law.
| | | | |
| BARRICK FIRST QUARTER 2015 | | 20 | | MANAGEMENT’S DISCUSSION AND ANALYSIS |
INDEX
| | | | |
| | | page | |
Results Overview | | | | |
| |
Review of 2015 First Quarter Results and Full Year Outlook | | | 22 | |
| |
Key Business Developments | | | 25 | |
| |
Market Overview | | | 26 | |
| |
Review of Financial Results | | | | |
| |
Revenue | | | 28 | |
| |
Production Costs | | | 28 | |
| |
Capital Expenditures | | | 29 | |
| |
Additional Significant Statement of Income Items | | | 29 | |
| |
Income Tax Expense | | | 30 | |
| |
Operating Segments Performance | | | 30 | |
| |
Financial Condition Review | | | | |
| |
Balance Sheet Review | | | 42 | |
| |
Shareholders’ Equity | | | 42 | |
| |
Comprehensive Income | | | 42 | |
| |
Financial Position and Liquidity | | | 43 | |
| |
Financial Instruments | | | 45 | |
| |
Commitments and Contingencies | | | 45 | |
| |
Internal Control over Financial Reporting and Disclosure Controls and Procedures | | | 46 | |
| |
Review of Quarterly Results | | | 47 | |
| |
IFRS Critical Accounting Policies and Accounting Estimates | | | 48 | |
| |
Non-GAAP Financial Performance Measures | | | 49 | |
| | | | |
| BARRICK FIRST QUARTER 2015 | | 21 | | MANAGEMENT’S DISCUSSION AND ANALYSIS |
RESULTS OVERVIEW
Review of 2015 First Quarter Results and Full Year Outlook
| | | | | | |
| ($ millions, except where indicated) | | | | | For the three months ended March 31 |
| | | 2015 | | | 2014 |
Financial Data | | | | | | |
Revenue | | | $ 2,245 | | | $ 2,647 |
Net earnings (loss)1 | | | 57 | | | 88 |
Per share (“EPS”)2 | | | 0.05 | | | 0.08 |
Adjusted net earnings3 | | | 62 | | | 238 |
Per share (“adjusted EPS”)2,3 | | | 0.05 | | | 0.20 |
Total project capital expenditures4 | | | 15 | | | 51 |
Total capital expenditures - expansion4 | | | 88 | | | 89 |
Total capital expenditures - sustaining4 | | | 353 | | | 369 |
Operating cash flow | | | 316 | | | 585 |
Adjusted operating cash flow3 | | | 316 | | | 585 |
Free cash flow3 | | | $ (198) | | | $ (31) |
| | | | | | | |
Operating Data | | | | | | |
Gold | | | | | | |
Gold produced (000s ounces)5 | | | 1,390 | | | 1,588 |
Gold sold (000s ounces)5 | | | 1,385 | | | 1,618 |
Realized price ($ per ounce)3 | | | $ 1,219 | | | $ 1,285 |
Cash costs ($ per ounce)3 | | | 642 | | | 587 |
Cash costs on a co-product basis ($ per ounce)3 | | | 671 | | | 610 |
All-in sustaining costs ($ per ounce)3 | | | 927 | | | 838 |
All-in sustaining costs on a co-product basis ($ per ounce)3 | | | 956 | | | 861 |
All-in costs ($ per ounce)3 | | | 1,024 | | | 938 |
All-in costs on a co-product basis ($ per ounce)3 | | | $ 1,053 | | | $ 961 |
Copper | | | | | | |
Copper produced (millions of pounds) | | | 118 | | | 104 |
Copper sold (millions of pounds) | | | 121 | | | 111 |
Realized price ($ per pound)3 | | | $ 2.55 | | | $ 3.03 |
C1 cash costs ($ per pound)3 | | | $ 1.84 | | | $ 2.11 |
| | 1 | Net loss represents net loss attributable to the equity holders of the Company. |
| | 2 | Calculated using weighted average number of shares outstanding under the basic method. |
| | 3 | These are non-GAAP financial performance measures with no standardized definition under IFRS. For further information and detailed reconciliations, please see pages 49 - 54 of this MD&A. |
| | 4 | These amounts are presented on a 100% accrued basis. Project and expansion capital expenditures are included in our calculation of all-in costs, but not included in our calculation of all-in sustaining costs. |
| | 5 | Gold production and sales include our pro rata share of Acacia and Pueblo Viejo at our equity share. |
| | | | |
| BARRICK FIRST QUARTER 2015 | | 22 | | MANAGEMENT’S DISCUSSION AND ANALYSIS |
FIRST QUARTER FINANCIAL AND OPERATING HIGHLIGHTS
Net Income, Adjusted Net Income, Operating Cash Flow and Free Cash Flow
| | • | | Net earnings and adjusted net earnings were 35% and 74% lower, respectively, in first quarter 2015 than in the same prior year period primarily due to a 14% decrease in gold sales volume combined with a 5% and 16% decrease in gold and copper realized prices, respectively, partially offset by a 9% increase in copper sales volume and lower income tax expense. |
| | • | | Significant adjusting items (net of tax and non-controlling interest effects) in first quarter 2015 include: |
| | ¡ | | $22 million in gains from asset dispositions; partially offset by |
| | ¡ | | $13 million adjustment reflecting the impact of the decrease in the discount rate used to calculate the provision for environmental remediation at our closed mines; and |
| | ¡ | | $6 million in unrealized foreign currency translation losses. |

| | • | | Operating cash flow of $316 million was 46% lower than the same prior year period primarily reflecting lower net earnings combined with an increase in inventory due to increased leach pad inventory levels at Zaldívar as a result of the |
| | | severe rain event that occurred at the end of first quarter 2015. |
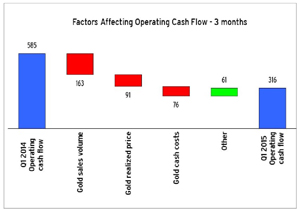
| | • | | Free cash flow in first quarter 2015 was an outflow of $198 million, compared to an outflow of $31 million in the same prior year period. The larger outflow primarily reflects the lower operating cash flows, which more than offset lower capital expenditures. We continue to expect to be free cash flow positive in 2015 at current market gold prices. |

Gold production, cash costs and all-in sustaining costs
| | • | | In first quarter 2015, gold production was 12% lower compared to the same prior year period largely due to the decrease in production at Cortez and Goldstrike, as well as the impact of 2014 asset sales. The lower production was in line with operating plan and consistent with our guidance that 55% of our production will come in the second half of the year. Higher second half production is primarily due to higher production at Goldstrike as the thiosulfate circuit ramps up to commercial production levels; higher production at Cortez as the open pit transitions into higher grade material and the thiosulfate circuit at Goldstrike allows for the processing of existing Cortez stockpiles; and |
| | | | |
| BARRICK FIRST QUARTER 2015 | | 23 | | MANAGEMENT’S DISCUSSION AND ANALYSIS |
| | higher production at Pueblo Viejo due to the availability of higher grade ore and increased throughput due to higher autoclave availability. Production remains in line with our plan and our expected production guidance for 2015 continues to be in the range of 6.2 to 6.6 million ounces. |
| | • | | In first quarter 2015, cash costs increased 9% compared to the same prior year period, primarily due to the impact of lower sales volume on unit costs. All-in sustaining costs for first quarter 2015 increased 11% compared to the same prior year period, as the higher cash costs were partially offset by lower sustaining capital expenditures, primarily due to a reduction in capitalized stripping costs. Second quarter 2015 is expected to be our highest cost quarter for both cash costs and all-in sustaining costs, largely due to the impact of higher costs at Goldstrike due to the impact of lower sales volume as a significant portion of thiosulfate circuit production from the second quarter will not be sold until the third quarter and higher sustaining capital expenditures. We continue to expect 2015 cash costs and all-in sustaining costs to be within our guidance ranges of $600 to $640 and $860 to $895 per ounce, respectively. Costs are expected to be about 20% lower in second half 2015 due to the impact of higher production levels on unit costs as well as lower sustaining capital expenditures. |
| | • | | All-in costs for first quarter 2015 were 9% higher than the same prior year period due to the same factors affecting all-in sustaining costs, partially offset by a reduction in project capital expenditures. |
Copper production and C1 costs
| | • | | In first quarter 2015, copper production increased 13% compared to the same prior year period, due to higher production at Lumwana, partially offset by lower production at Zaldívar due to the impact of a severe rain event at the end of the quarter. |
| | • | | Copper C1 cash costs were 13% lower than the same prior year period due to continued improvements in mine and processing efficiencies at Lumwana. |
Capital Expenditures
| | • | | In first quarter 2015, capital expenditures were down 10% from the same prior year period primarily due to lower project and minesite sustaining capital expenditures. We have incurred $456 million in capital expenditures as at the end of the first quarter. |
| | • | | As a result of a robust review of our sustaining capital expenditure budget in 2015, we now expect our sustaining capital expenditures to be in the range of $1.5 to $1.7 billion and total capital expenditures to be in the range of $1.8 to $2.1 billion, compared to our original guidance ranges of $1.6 to $1.8 billion and $1.9 to $2.2 billion, respectively. We have implemented a new capital allocation process, and, as a result, all significant new and ongoing projects will be reviewed by our investment committee against our target 15% hurdle rate. |
Strengthening the Balance Sheet
| | • | | We remain committed to debt reduction of at least $3 billion by the end of 2015 and are moving quickly to advance a number of asset sales and joint venture opportunities. |
| | • | | Numerous companies have participated in the sales processes for the Cowal mine and the Porgera Joint Venture. Detailed due diligence on both assets is now underway, including site visits with prospective buyers. |
| | • | | We have begun a process for the sale of a stake in the Zaldívar copper mine in Chile. Zaldívar is a consistently strong performer in the world’s best jurisdiction for copper mining. Potential buyers have expressed a strong interest in acquiring an interest in the mine. |
| | • | | We are actively exploring a number of other joint venture and sales opportunities. |
| | | | |
| BARRICK FIRST QUARTER 2015 | | 24 | | MANAGEMENT’S DISCUSSION AND ANALYSIS |
Full Year 2015 Outlook
| | | | |
| ($ millions, except per ounce/pound data) | | 2015E | |
Gold production and costs | | | | |
Production (millions of ounces) | | | 6.2 - 6.6 | |
Gold unit production costs | | | | |
All-in sustaining costs ($ per ounce)1 | | | 860 - 895 | |
Cash costs ($ per ounce)2 | | | 600 - 640 | |
Depreciation ($ per ounce) | | | 240 - 260 | |
Copper production and costs | | | | |
Production (millions of pounds)3 | | | 480 - 520 | |
Copper unit production costs | | | | |
C1 cash costs ($ per pound) | | | 1.75 - 2.00 | |
Depreciation ($ per pound) | | | 0.35 - 0.45 | |
C3 fully allocated costs ($ per pound)3 | | | 2.35 - 2.65 | |
Exploration and project expenses | | | 370 - 460 | |
Exploration and evaluation | | | 220 - 270 | |
Project expenses | | | 150 - 190 | |
General and administrative expenses | | | ~225 | |
Corporate administration | | | ~145 | |
Stock-based compensation | | | ~50 | |
Acacia | | | ~30 | |
Other expense | | | 40 - 60 | |
Finance costs | | | 800 - 825 | |
Capital expenditures: | | | | |
Minesite sustaining4 | | | 1,500 - 1,700 | |
Minesite expansion | | | 150 - 200 | |
Projects | | | 150 - 200 | |
Total capital expenditures4 | | | 1,800 - 2,100 | |
Effective income tax rate | | | ~53% | |
Key Assumptions | | | | |
Gold Price ($/ounce)5 | | | $1,200 | |
Copper Price ($/pound) | | | $2.60 | |
Oil Price ($/barrel) | | | $50 | |
AUD Exchange Rate | | | $0.80 | |
ARS Exchange Rate | | | 9.88 | |
CAD Exchange Rate | | | $1.25 | |
CLP Exchange Rate | | | 610 | |
| 1 | All-in sustaining costs are calculated in accordance with the standard published by the World Gold Council (‘WGC’). See page 50 of this MD&A for further details. |
| 2 | Cash costs reflect our equity share of unit production costs, including the impact of by-product credits, which is calculated in accordance with the standard published by the WGC. See pages 50 of this MD&A for further details. |
| 3 | As a result of the decision to continue operations at Lumwana, we now expect copper production to be in the range of 480 to 520 million lbs and C3 fully allocated costs to be in the range of $2.35 to $2.65 per pound compared to our previous guidance ranges of 310 to 340 million lbs and $2.30 to $2.60 per pound, respectively. |
| 4 | We now expect minesite sustaining capital expenditures to be in the range of $1,500 to $1,700 million and total capital expenditures to be in the range of $1,800 to $2,100 million compared to our previous guidance ranges of $1,600 to $1,800 million and $1,900 to $2,200 million, respectively. |
| 5 | Our outlook assumes an average gold price of $1,200 per ounce for the remainder of 2015, compared to our original assumption of $1,250 per ounce. |
Key Business Developments
Jabal Sayid Financing Facility
On April 2, 2015, Ma’aden Barrick Copper Company (our 50% Barrick owned equity method investment) signed a financing agreement with the Saudi British Bank to finance the Jabal Sayid copper project for SAR 750 million ($200 million USD). The proceeds will be used to fund the expenditures remaining to bring the mine into commercial production.
Royalty Changes in Zambia
On April 20, 2015, the Zambian government announced amendments to the country’s mining tax regime that would replace the recently adopted 20 percent gross royalty on open pit mines with a nine percent royalty, along with the reintroduction of a 30 percent corporate income tax and a 15 percent variable profits tax. Based on our initial analysis, this system would enable Lumwana to remain free cash flow positive at current copper prices. As a result, we will continue operations at Lumwana and have amended our operating guidance to reflect this change. In second quarter 2015 we will complete our analysis and evaluate the potential for a reversal of previous impairments recorded in fourth quarter 2014.
Pascua-Lama Chilean Environmental Court Ruling
On March 23, 2015, Chile’s Environmental Court ruled that the Pascua-Lama project has not damaged glaciers in the project area. Refer to note 21 to the consolidated financial statements for more information about this matter.
Pascua-Lama SMA Regulatory Sanctions
On April 22, 2015, Compañía Minera Nevada, Barrick’s Chilean subsidiary that holds the Chilean portion of the Pascua-Lama project, was notified that Chile’s environmental regulator has initiated a new administrative proceeding for alleged deviations from certain requirements of the Project’s environmental approval, including with respect to the Project’s environmental impact and a series of monitoring requirements. CMN is evaluating the allegations and preparing its response.
Hemlo Land Acquisition
In March 2015, Barrick acquired certain surface and mineral lands adjacent to the Hemlo property in Ontario from subsidiaries of Newmont Mining Corporation for $37.5 million. The acquisition will enable Hemlo to realize additional value through near-term, lower-cost ounces, optimize its current operation with the potential for mine life extensions, and increase exploration potential.
| | | | |
| BARRICK FIRST QUARTER 2015 | | 25 | | MANAGEMENT’S DISCUSSION AND ANALYSIS |
Alturas Gold Discovery
We have made a new gold discovery located in the Andean region of Chile. The new discovery is the result of a methodical re-evaluation of the El Indio belt led by our exploration team. Drilling will continue until the end of the summer season in May and we expect to report an initial resource at the end of the year.
Exploration Partnership with QPX
Our focus is gold and we have no plans to expand our existing copper position. However, we seek to maximize the value of our highly prospective land holdings where there is currently little to no exploration taking place, so we have formed a strategic partnership with Quantum Pacific Exploration (“QPX”) to explore for copper deposits on our land in northern Chile. Any gold deposits located on Barrick land will remain 100 percent Barrick-owned. If a copper deposit project is identified on either Barrick or QPX land, it will be 50 percent owned by each company.
Market Overview
Gold and Copper
The market prices of gold and, to a lesser extent, copper are the primary drivers of our profitability and our ability to generate free cash flow for our shareholders.
The price of gold is subject to volatile price movements over short periods of time and is impacted by numerous industry and macroeconomic factors. During the first quarter, the price of gold ranged from $1,143 to $1,308 per ounce. The price of gold closed at $1,187 per ounce on March 31, 2015, while the average quarterly market price of $1,218 per ounce represented a $75 per ounce or 6% decrease from the $1,293 per ounce average market price in the same prior year period.
Copper prices in first quarter traded in a range of $2.42 per pound to $2.86 per pound. The average price for first quarter was $2.64 per pound and the closing price was $2.74 per pound on March 31, 2015. Copper prices should continue to be influenced by demand from emerging markets, specifically China, the availability of scrap and production levels of mines and smelters in the future.
We have provisionally priced copper sales for which final price determination versus the relevant copper index is outstanding at the balance sheet date. As at March 31, 2015, we have recorded 60 million pounds of copper sales subject to final settlement at an average provisional price of $2.75 per pound. The impact to net income before taxation of a 10% movement in the market price of copper would be approximately $16 million, holding all other variables constant.
Silver
Silver prices do not significantly impact our current operating earnings, cash flows or gold cash costs. Silver prices, however, will have a significant impact on the overall economics for our Pascua-Lama project.
In first quarter, silver prices traded in a range of $15.30 per ounce to $18.49 per ounce, averaged $16.71 per ounce and closed the quarter at $16.60 per ounce. The silver price is driven by factors similar to those influencing investment demand for gold.
Currency Exchange Rates
The results of our mining operations outside of the United States are affected by US dollar exchange rates with non-US denominated currencies comprising approximately 25% of our operating and capital cost exposures. We have exposure to the Australian and Canadian dollars through a combination of mine operating and corporate administration costs, as well as exposure to the Chilean peso through expected future capital and operating costs at our Pascua-Lama project and mine operating costs at Zaldívar. We also have exposure to the Argentinean peso through operating costs at our Veladero mine, peso denominated VAT receivable balances and expected future capital and operating costs at our Pascua-Lama project. In addition, we have exposure to the Papua New Guinea kina, Peruvian sol, Zambian kwacha, Tanzanian shilling and Dominican peso through mine operating and capital costs.
As a means of minimizing the volatility on our operating costs from fluctuations in the US dollar, we have put in place protection through our currency hedging program on our three largest currency exposures, namely the Australian dollar, the Canadian dollar and the Chilean peso. In first quarter, the Australian dollar traded in a range of $0.76 to $0.83 against the US dollar, while the US dollar against the Canadian dollar and Chilean peso traded in ranges of $1.16 to $1.28 and CLP 606 to CLP 643, respectively.
In first quarter 2015, we recorded losses in earnings of approximately $17 million from our Australian, Canadian and Chilean peso hedges, primarily impacting our operating and corporate administration costs (Q1 2014: $32 million gain).
| | | | |
| BARRICK FIRST QUARTER 2015 | | 26 | | MANAGEMENT’S DISCUSSION AND ANALYSIS |
| | | | | | | | | | | | | | | | | | | | |
| AUD Currency Contracts | | | | | | | |
| | | Contracts
(AUD
millions | | | Effective
Average
Hedge
Rate
(AUDUSD) | | | % of Total
Expected
AUD
Exposure1
Hedged | | | % of Expected Operating Cost Exposure Hedged | | | Crystallized
Gain/(Loss)
in OCI 2 (USD
millions) | |
2015 | | | 288 | | | | 0.93 | | | | 52% | | | | 60% | | | | (2) | |
| | | | | |
2016 | | | 85 | | | | 0.91 | | | | 11% | | | | 13% | | | | (19) | |
CAD Currency Contracts | |
| | | Contracts
(CAD
millions)3 | | | Effective
Average
Hedge
Rate
(USDCAD) | | | % of Total
Expected
CAD
Exposure1
Hedged | | | % of Expected
Operating Cost Exposure Hedged | | | Crystallized
Gain/(Loss)
in OCI 2 (USD
millions) | |
2015 | | | 180 | | | | 1.03 | | | | 52% | | | | 59% | | | | - | |
CLP Currency Contracts | |
| | | Contracts
(CLP
millions)4 | | | Effective
Average
Hedge
Rate
(USDCLP) | | | % of Total
Expected
CLP
Exposure1
Hedged | | | % of
Expected
Operating
Cost
Exposure
Hedged | | | Crystallized
Gain/(Loss)
in OCI 2 (USD
millions) | |
2015 | | | 76,500 | | | | 521 | | | | 44% | | | | 77% | | | | - | |
| 1 | Includes all forecasted operating, administrative, sustainable and eligible project capital expenditures. |
| 2 | To be reclassified from Other Comprehensive Income (“OCI”) to earnings when indicated. |
| 3 | Includes C$180 million CAD collar contracts with an average range of $1.03 - $1.15. |
| 4 | Includes CLP 76,500 million collar contracts with an average range of 521 - 601. |
Fuel
For first quarter, the price of West Texas Intermediate (“WTI”) crude oil traded in a range of $42 to $55 per barrel, averaged $49 per barrel, compared to an average of $99 per barrel in the same prior year period, and ended the quarter at $48 per barrel.
In first quarter 2015, we recorded a hedge loss of $3 million on our fuel hedge positions (Q1 2014: $3 million gain).
| | | | | | | | | | | | | | | | |
Financial Fuel Hedge Summary | | | | |
| | | Barrels
(thousands) | | | Average
Price | | | % of
Expected
Exposure | | | Impact of $10
change on Pre-
tax Earnings
(USD millions)1 | |
2015 | | | 2,066 | | | | 90 | | | | 59% | | | | $15 | |
| | | | |
2016 | | | 2,933 | | | | 85 | | | | 64% | | | | 17 | |
| | | | |
2017 | | | 1,963 | | | | 81 | | | | 46% | | | | 23 | |
| | | | |
2018 | | | 1,080 | | | | 79 | | | | 26% | | | | $27 | |
| 1 | Includes the impact of hedges currently in place. |
US Dollar Interest Rates
During first quarter 2015, the Federal Open Market Committee of the US Federal Reserve (“FOMC”) released a statement reiterating its view that a highly accommodative stance of monetary policy remains appropriate. In determining how long to maintain the current 0% to 0.25% range for the benchmark rate, the FOMC noted that it will use a wide range of information, including measures of labor market conditions, indicators of inflation pressures and inflation expectations, and readings on financial and international developments, to assess progress towards its objectives of maximum employment and 2 percent inflation.
At present, our interest rate exposure mainly relates to interest receipts on our cash balances ($2.3 billion at March 31, 2015); the mark-to-market value of derivative instruments; the fair value of and ongoing payments under US dollar interest-rate swaps; the carrying value of certain long lived assets and liabilities; and to the interest payments on our variable-rate debt ($1.0 billion at March 31, 2015). Currently, the amount of interest expense recorded in our consolidated statement of income is not materially impacted by changes in interest rates, because the majority of debt was issued at fixed interest rates. The relative amounts of variable-rate financial assets and liabilities may change in the future, depending on the amount of operating cash flow we generate, as well as the level of capital expenditures and our ability to borrow on favorable terms using fixed rate debt instruments.
| | | | |
| BARRICK FIRST QUARTER 2015 | | 27 | | MANAGEMENT’S DISCUSSION AND ANALYSIS |
REVIEW OF FINANCIAL RESULTS
Revenue
| | | | | | | | |
($ millions, except per ounce/pound data in dollars) | | For the three months
ended March 31 | |
| | | 2015 | | | 2014 | |
Gold | | | | | | | | |
000s oz sold1 | | | 1,385 | | | | 1,618 | |
Revenue | | | $ 1,919 | | | | $ 2,279 | |
Market price2 | | | 1,218 | | | | 1,293 | |
Realized price2,3 | | | $ 1,219 | | | | $ 1,285 | |
Copper | | | | | | | | |
millions lbs sold1 | | | 121 | | | | 111 | |
Revenue | | | $ 267 | | | | $ 305 | |
Market price2 | | | 2.64 | | | | 3.19 | |
Realized price2,3 | | | 2.55 | | | | 3.03 | |
Other sales | | | $ 59 | | | | $ 63 | |
| | 1 | Includes our equity share of gold ounces from Acacia and Pueblo Viejo. |
| | 2 | Per ounce/pound weighted average. |
| | 3 | Realized price is a non-GAAP financial performance measure with no standard meaning under IFRS. For further information and a detailed reconciliation, please see page 54 of this MD&A. |
In first quarter 2015, gold revenues were down 16% compared to the same prior year period. The decrease was primarily due to lower gold sales volume and lower realized gold prices compared to first quarter 2014. Copper revenues for first quarter 2015 were down 12% compared to the same prior year period. The decrease was primarily due to the impact of lower realized copper prices compared to the same prior year period, partially offset by an increase in sales volume.
In first quarter 2015, realized gold prices were down $66 per ounce compared to the same prior year period. The decrease in realized gold prices reflects the lower market gold prices in first quarter 2015 compared to the same prior year period. Realized copper prices in first quarter 2015 were down $0.48 per pound compared to first quarter 2014, due to the 17% decline in market copper prices over the same prior year period.
Gold production in first quarter 2015 of 1.4 million ounces was 12% lower than the same prior year period. The decrease was primarily due to lower production at Cortez and Goldstrike, and the impact of asset sales, partially offset by an increase in production at Lagunas Norte.
In first quarter 2015, copper production increased by 13% compared to the same prior year period due to higher production at Lumwana, partially offset by lower production at Zaldívar. The increased production at Lumwana was primarily due to better operating
conditions at the mine, as rainfall was less than in first quarter 2014, combined with a continued improvement in mine and processing efficiency, while production at Zaldívar was negatively impacted by flooding at the mine that occurred at the end of first quarter 2015 as a result of severe rain.
Production Costs
| | | | | | | | |
($ millions, except per ounce/pound data in dollars) | | For the three months
ended March 31 | |
| | | 2015 | | | 2014 | |
Cost of sales | | | | | | | | |
Direct mining costs | | | $ 1,186 | | | | $ 1,228 | |
Depreciation | | | 421 | | | | 402 | |
Royalty expense | | | 90 | | | | 75 | |
Community relations | | | 11 | | | | 14 | |
Cost of sales - gold1 | | | 1,424 | | | | 1,444 | |
Cash costs2,3 | | | 642 | | | | 587 | |
All-in sustaining costs - gold2,3 | | | 927 | | | | 838 | |
Cost of sales - copper1 | | | 251 | | | | 255 | |
C1 cash costs2,3 | | | 1.84 | | | | 2.11 | |
C3 fully allocated costs2,3 | | | $ 2.35 | | | | $ 2.64 | |
| | 1 | 2014 figures restated to include community relations costs. |
| | 2 | Per ounce/pound weighted average. |
| | 3 | Cash costs, all-in sustaining costs, C1 cash costs and C3 fully allocated costs are non-GAAP financial performance measures with no standard meaning under IFRS. For further information and a detailed reconciliation, please see pages 50 - 53 of this MD&A. |
In first quarter 2015, cost of sales applicable to gold decreased 1% compared to the same prior year period. The decrease reflects lower direct mining costs primarily due to lower sales volumes, partially offset by an increase in depreciation expense as well as the impact of an inventory write-down taken in first quarter 2015.
Gold cash costs in first quarter 2015 were up $55 per ounce, or 9%, compared to the same prior year period. The increase was primarily due to the impact of lower production levels on unit production costs combined with an increase in operating segment administration costs allocated to cost of sales. In first quarter 2015, all-in sustaining costs were up $89 per ounce compared to the same prior year period. The increase was primarily due to the higher cash costs per ounce and an increase in minesite sustaining capital expenditures, partially offset by lower mine development capital expenditures.
In first quarter 2015, cost of sales applicable to copper decreased $4 million compared to the same prior year period. The decrease was primarily due to lower
| | | | |
| BARRICK FIRST QUARTER 2015 | | 28 | | MANAGEMENT’S DISCUSSION AND ANALYSIS |
operating costs at Lumwana as a result of realized cost efficiencies at the mine combined with lower depreciation expense as a result of the impairment recorded in fourth quarter 2014.
C1 cash costs per pound in first quarter 2015 were 13% lower than the same prior year period reflecting lower direct mining costs and the impact of higher sales volume on unit production costs. In first quarter 2015, C3 fully allocated costs were 11% lower than the same prior year period, primarily reflecting the effect of the above factors on C1 cash costs.
Capital Expenditures1
| | | | | | | | |
| ($ millions) | | For the three months
ended March 31 | |
| | | 2015 | | | 2014 | |
Project capital expenditures2 | | | $ 15 | | | | $ 51 | |
Minesite sustaining | | | 153 | | | | 133 | |
Mine development | | | 199 | | | | 235 | |
Minesite expansion2 | | | 80 | | | | 83 | |
Capitalized interest | | | 9 | | | | 7 | |
Total consolidated capital expenditures | | | $ 456 | | | | $ 509 | |
| | 1 | These amounts are presented on a 100% accrued basis. |
| | 2 | Project and expansion capital expenditures are included in our calculation of all-in costs, but not included in our calculation of all-in sustaining costs. |
In first quarter 2015, capital expenditures decreased 10% compared to the same prior year period. The decrease is primarily due to lower project capital expenditures due to the ramp down of construction activities at our Pascua-Lama project, which began in first quarter 2014. Minesite sustaining capital in first quarter 2015 increased 15% over the same prior year period primarily due to an increase in costs at Veladero relating to the phase 4B leach pad expansion, partially offset by a decrease in capital at Pueblo Viejo. Minesite development capital was 15% lower than the same prior year period primarily due to a reduction in capitalized stripping costs at Cortez and at Zaldívar, partially offset by increased capitalized stripping costs at Veladero. Minesite expansion expenditures in first quarter 2015 were in line with the same prior year period reflecting a decrease in expenditures at Goldstrike as the construction of the thiosulfate technology project neared completion and was partially offset by an increase in expansion capital at Hemlo due to the land acquisition that occurred in first quarter 2015. Capitalized interest was in line with first quarter 2014.
Additional Significant Statement of Income Items
| | | | | | | | |
| ($ millions) | | For the three months
ended March 31 | |
| | | 2015 | | | 2014 | |
General & administrative expenses | | | $ 67 | | | | $ 103 | |
Corporate administration1 | | | $ 51 | | | | $ 54 | |
Operating segment administration2 | | | - | | | | $ 33 | |
Stock-based compensation | | | $ 5 | | | | $ 6 | |
Acacia | | | $ 11 | | | | $ 10 | |
Other expense/(income) | | | ($ 18) | | | | $ 19 | |
Exploration, evaluation & project costs | | | $ 86 | | | | $ 100 | |
Finance costs | | | $ 196 | | | | $ 201 | |
Finance income | | | $ 2 | | | | $ 3 | |
Impairments | | | $ 5 | | | | $ 12 | |
| | 1 | Corporate administration costs include approximately $5 million of non-recurring severance costs in Q1 2015. |
| | 2 | In first quarter 2015, operating segment administration costs have been allocated to our operating sites and are now included in cost of sales. |
General & Administrative Expenses
In first quarter 2015, general & administrative expenses were $36 million lower than the same prior year period. The decrease was primarily due to an increase in the allocation of operating segment administration costs from general and administrative expenses to cost of sales, as well as a reduction in head office personnel costs as a result of the restructuring that took place in January 2015. We are on track to achieve our targeted reduction of $30 million in general and administrative and overhead costs in 2015 and remain committed to delivering $70 million in annualized savings by 2016.
Other Expense (Income)
Other income for first quarter 2015 increased by $37 million compared to the same prior year period. The increase is primarily due to $24 million in gains realized in first quarter 2015 on the sale of assets including an exploration property in Papua New Guinea and equipment at Pascua-Lama. For a further breakdown of other expense (income), refer to note 10A to the consolidated financial statements.
Exploration, Evaluation and Project Costs
Exploration, evaluation and project costs for first quarter 2015 decreased $14 million compared to the same prior year period. The decrease is primarily due to a $10 million decrease in project costs at Pascua-Lama as we continue to drive down the cost of ongoing care and maintenance activities combined with a $10 million decrease in project costs at Jabal Sayid. Exploration and evaluation costs increased $13 million compared to the same prior year period,
| | | | |
| BARRICK FIRST QUARTER 2015 | | 29 | | MANAGEMENT’S DISCUSSION AND ANALYSIS |
primarily due to a 54% increase in costs relating to global exploration programs. The increase in exploration costs is mainly attributable to an increase in exploration activities at Goldrush, Alturas and Cortez. For a further breakdown of exploration, evaluation and project costs, refer to note 8 to the consolidated financial statements.
Finance Costs/Finance Income
In first quarter 2015, finance costs and finance income were $5 million and $1 million lower, respectively, compared to the same prior year period. The decrease in finance costs were primarily due to a $5 million decrease in accretion expense, partially offset by a $2 million increase in capitalized interest primarily relating to the thiosulfate technology project at Goldstrike. Interest costs incurred were in line with the same prior year period. For a further breakdown of finance costs/income, refer to note 11 to the consolidated financial statements.
Impairment Charges/Reversals
In first quarter 2015, impairment charges related to miscellaneous PP&E of $5 million were incurred compared to $12 million in the same prior year period. For a further breakdown of impairment charges, refer to note 10B to the consolidated financial statements.
Income Tax Expense
Income tax expense was $105 million in the first quarter 2015. The tax rate for income in first quarter 2015 was 54%. After adjusting for the impact of net currency translation losses on deferred tax balances, the impact of asset sales and non-hedge derivatives, and the impact of non-deductible foreign exchange losses, the underlying effective tax rate for ordinary income in the first quarter 2015 was 53%.
We record deferred tax charges or credits if changes in facts or circumstances affect the estimated tax basis of assets and therefore the amount of deferred tax assets or liabilities to reflect changing expectations in our ability to realize deferred tax assets. The interpretation of tax regulations and legislation and their application to our business is complex and subject to change. We have significant amounts of deferred tax assets, including tax loss carry forwards, and also deferred tax liabilities. Potential changes of any of these amounts, as well as our ability to realize deferred tax assets, could significantly affect net income or cash flow in future periods.
Operating Segments Performance
Review of Operating Segments Performance
Barrick’s business is organized into sixteen individual mine sites, one publicly traded company and one project. Barrick’s Chief Operating Decision Maker (“CODM”), the Co-Presidents, review the operating results, assess performance and make capital allocation decisions at the mine site, Company and/or project level. Therefore, each individual mine site and Acacia are operating segments for financial reporting purposes. For segment reporting purposes, we present our reportable operating segments as follows: eight individual gold mines, Acacia and our Pascua-Lama project. The remaining operating segments have been grouped into two “other” categories: (a) our remaining gold mines and (b) our two copper mines.
Segment performance is evaluated based on a number of measures including operating income before tax, production levels and unit production costs. Certain costs are managed on a consolidated basis and are therefore not reflected in segment income. Starting January 1, 2015, we updated the allocation of our general and administration costs to individual mine sites to reflect the removal of all regional oversight and have the mine sites directly accountable for the cost of the functional services they require to run their business.
| | | | |
| BARRICK FIRST QUARTER 2015 | | 30 | | MANAGEMENT’S DISCUSSION AND ANALYSIS |
Summary of Operations
| | | | | | | | | | | | | | | | | | |
| | | For the three months ended March 31 |
| | | 2015 | | | | 20141 |
| | | Gold
Produced
(ozs) | | Gold Sold
(ozs) | | Cash
Costs
($/oz) | | All-In
sustaining
Costs ($/oz) | | | | Gold
Produced
(ozs) | | Gold Sold
(ozs) | | Cash
Costs
($/oz) | | All-In
sustaining
Costs ($/oz) |
Cortez | | 133 | | 155 | | $816 | | $962 | | | | 227 | | 197 | | $393 | | $654 |
Goldstrike | | 207 | | 199 | | 584 | | 876 | | | | 262 | | 282 | | 577 | | 759 |
Pueblo Viejo (60%) | | 135 | | 134 | | 510 | | 675 | | | | 159 | | 172 | | 463 | | 600 |
Lagunas Norte | | 178 | | 167 | | 317 | | 461 | | | | 134 | | 153 | | 345 | | 522 |
Veladero | | 149 | | 168 | | 572 | | 991 | | | | 158 | | 139 | | 583 | | 814 |
Total Core Mines | | 802 | | 823 | | $559 | | $799 | | | | 940 | | 943 | | $481 | | $678 |
| | | | | | | | | |
Turquoise Ridge (75%) | | 49 | | 45 | | $578 | | $709 | | | | 54 | | 57 | | $412 | | $526 |
Porgera (95%) | | 118 | | 115 | | 807 | | 1,064 | | | | 110 | | 117 | | 977 | | 1,039 |
Kalgoorlie (50%) | | 59 | | 60 | | 959 | | 1,271 | | | | 78 | | 90 | | 823 | | 1,014 |
Acacia (63.9%)2 | | 116 | | 110 | | 783 | | 1,117 | | | | 118 | | 111 | | 756 | | 1,131 |
Cowal | | 73 | | 63 | | 551 | | 636 | | | | 70 | | 70 | | 573 | | 815 |
Hemlo | | 48 | | 47 | | 799 | | 999 | | | | 50 | | 58 | | 853 | | 1,103 |
Round Mountain (50%) | | 42 | | 39 | | 1,106 | | 1,233 | | | | 43 | | 46 | | 814 | | 958 |
Bald Mountain | | 52 | | 49 | | 587 | | 999 | | | | 24 | | 21 | | 911 | | 1,727 |
Golden Sunlight | | 26 | | 30 | | 645 | | 861 | | | | 30 | | 29 | | 761 | | 944 |
Ruby Hill | | 3 | | 4 | | 446 | | 481 | | | | 11 | | 11 | | 586 | | 599 |
Total Continuing Operations | | 1,388 | | 1,385 | | $641 | | $883 | | | | 1,528 | | 1,553 | | $595 | | $800 |
| | | | | | | | | |
Kanowna | | - | | - | | - | | - | | | | 39 | | 37 | | $641 | | $674 |
Pierina | | 2 | | - | | - | | - | | | | 2 | | 6 | | - | | - |
Marigold (33%) | | - | | - | | - | | - | | | | 11 | | 14 | | 992 | | 1,220 |
Plutonic | | - | | - | | - | | - | | | | 8 | | 8 | | 1,120 | | 1,206 |
Total Divested/Closed Sites | | 2 | | - | | - | | - | | | | 60 | | 65 | | $716 | | $795 |
Total Gold3 | | 1,390 | | 1,385 | | $641 | | $883 | | | | 1,588 | | 1,618 | | $600 | | $800 |
Total Consolidated Barrick | | 1,390 | | 1,385 | | $642 | | $927 | | | | 1,588 | | 1,618 | | $587 | | $838 |
| | | | | | | | | |
| | | Copper
Produced
(lbs) | | Copper
Sold (lbs) | | C1 Cash
Costs
($/lb) | | C3 Cash Costs
($/lb) | | | | Copper
Produced
(lbs) | | Copper
Sold (lbs) | | C1 Cash
Costs
($/lb) | | C3 Cash Costs
($/lb) |
Zaldívar | | 52 | | 54 | | $1.77 | | $2.19 | | | | 54 | | 55 | | $1.68 | | $2.05 |
Lumwana | | 66 | | 67 | | 1.89 | | 2.48 | | | | 50 | | 56 | | 2.58 | | 3.25 |
Total Copper | | 118 | | 121 | | $1.84 | | $2.35 | | | | 104 | | 111 | | $2.11 | | $2.64 |
| | 1 | 2014 cash costs per ounce for individual mine sites have been restated to exclude the impact of hedges. |
| | 2 | Acacia presented on a 73.9% basis until February 28, 2014 and a 63.9% basis thereafter. |
| | 3 | Total gold cash costs and all-in sustaining costs per ounce exclude the impact of hedges and/or costs allocated to non-operating sites. |
| | | | |
| BARRICK FIRST QUARTER 2015 | | 31 | | MANAGEMENT’S DISCUSSION AND ANALYSIS |
Cortez, Nevada USA
| | | | | | | | | | | | | | |
Summary of Operating Data | | | | | | | For the three months ended March 31 | |
| | | 2015 | | | | | 2014 | | | % Change | |
Total tonnes mined (000s) | | | 39,648 | | | | | | 37,395 | | | | 6% | |
Ore tonnes processed (000s) | | | 5,157 | | | | | | 7,133 | | | | (28%) | |
Average grade (grams/tonne) | | | 1.01 | | | | | | 1.40 | | | | (28%) | |
Gold produced (000s/oz) | | | 133 | | | | | | 227 | | | | (41%) | |
Gold sold (000s/oz) | | | 155 | | | | | | 197 | | | | (21%) | |
Cost of sales ($ millions) | | | $ 196 | | | | | | $ 129 | | | | 52% | |
Cash costs (per oz)1 | | | $ 816 | | | | | | $ 393 | | | | 108% | |
All-in sustaining costs (per oz)1 | | | $ 962 | | | | | | $ 654 | | | | 47% | |
All-in costs (per oz)1 | | | $ 1,043 | | | | | | $ 683 | | | | 53% | |
Summary of Financial Data | | | | | | | For the three months ended March 31 | |
| | | 2015 | | | | | 2014 | | | % Change | |
Segment EBIT ($ millions) | | | ($ 9) | | | | | | $ 119 | | | | (108%) | |
Segment EBITDA ($ millions)1 | | | $ 61 | | | | | | $ 171 | | | | (64%) | |
Capital expenditures ($ millions)2 | | | $ 33 | | | | | | $ 54 | | | | (39%) | |
Minesite sustaining | | | $ 21 | | | | | | $ 48 | | | | (56%) | |
Minesite expansion | | | $ 12 | | | | | | $ 6 | | | | 100% | |
| | 1 | These are non-GAAP financial performance measures; for further information and a detailed reconciliation, please see pages 49 - 54 of this MD&A. |
| | 2 | Amounts presented exclude capitalized interest. |
Financial Results
Segment EBIT for first quarter 2015 was 108% lower than the same prior year period, primarily due to a significant reduction in sales volumes combined with a lower realized gold price.
In first quarter 2015, gold production of 133 thousand ounces was 41% lower than the same prior year period, as mining was concentrated in the Cortez Hills phase 4 which has been primarily low grade leach ore. The oxide mill feed is primarily from stockpiled lower grade Pipeline ore, whereas higher grade stockpiles were processed in the same prior year period.
Cost of sales for first quarter 2015 was 52% higher than the same prior year period, primarily due to the recognition of a $48 million inventory impairment charge in first quarter 2015 as a result of the mining of low grade ore combined with the impact of high depreciation base for the Cortez Hills open pit, and higher operating costs, due to lower capitalized stripping costs coming from Cortez Hills phase 4. This was partially offset by the impact of lower fuel costs and lower fuel consumption due to shorter hauls and productivity gains and a reduction in sales volumes. Cash costs were higher than the same prior year period, primarily due to higher operating costs as a result of lower capitalized stripping combined with the impact of lower sales volume on unit production costs. All-in sustaining costs for first quarter
2015 increased by $308 per ounce over the same prior year period due to higher cash costs, partially offset by a decrease in minesite sustaining capital expenditures. In first quarter 2015, capital expenditures decreased by 39% compared to the same prior year period. The decrease was primarily due to a reduction in minesite sustaining capital expenditures due to lower capitalized stripping costs.
We are committed to improving our cost structure, and in 2015 the focus will be on improving efficiency and reducing costs through several initiatives, including increased efficiency of open pit equipment, reduced administration staff and decreased diesel consumption. This has allowed us to mine more efficiently, but with the current lower grades, per ounce costs remain elevated. Once we move back into the higher grade areas of the mine, we expect to recognize significant savings on a per ounce basis.
In 2015, we continue to expect gold production to be in the range of 825 to 900 thousand ounces at cash costs of $560 to $610 per ounce and all-in sustaining costs of $760 to $835 per ounce. Production is expected to be higher in the second half of the year as the open pit transitions into higher grade material and the ramp-up of the thiosulfate circuit at Goldstrike allows for processing of existing Cortez stockpiles.
| | | | |
| BARRICK FIRST QUARTER 2015 | | 32 | | MANAGEMENT’S DISCUSSION AND ANALYSIS |
Goldstrike, Nevada USA
| | | | | | | | | | | | | | |
Summary of Operating Data | | | | | | | For the three months ended March 31 | |
| | | 2015 | | | | | 2014 | | | % Change | |
Total tonnes mined (000s) | | | 20,629 | | | | | | 20,452 | | | | 1% | |
Ore tonnes processed (000s) | | | 1,514 | | | | | | 1,261 | | | | 20% | |
Average grade (grams/tonne) | | | 5.19 | | | | | | 7.49 | | | | (31%) | |
Gold produced (000s/oz) | | | 207 | | | | | | 262 | | | | (21%) | |
Gold sold (000s/oz) | | | 199 | | | | | | 282 | | | | (29%) | |
Cost of sales ($ millions) | | | $ 149 | | | | | | $ 205 | | | | (27%) | |
Cash costs (per oz) | | | $ 584 | | | | | | $ 577 | | | | 1% | |
All-in sustaining costs (per oz) | | | $ 876 | | | | | | $ 759 | | | | 15% | |
All-in costs (per oz) | | | $ 1,021 | | | | | | $ 984 | | | | 4% | |
Summary of Financial Data | | | | | | | For the three months ended March 31 | |
| | | 2015 | | | | | 2014 | | | % Change | |
Segment EBIT ($ millions) | | | $ 86 | | | | | | $ 153 | | | | (44%) | |
Segment EBITDA ($ millions) | | | $ 118 | | | | | | $ 195 | | | | (39%) | |
Capital expenditures ($ millions) | | | $ 84 | | | | | | $ 111 | | | | (24%) | |
Minesite sustaining | | | $ 55 | | | | | | $ 48 | | | | 15% | |
Minesite expansion | | | $ 29 | | | | | | $ 63 | | | | (54%) | |
Financial Results
Segment EBIT for first quarter 2015 was 44% lower than the same prior year period. The decrease was primarily due to a lower realized gold price combined with a 29% decrease in sales volume, partially offset by a decrease in open pit and underground mining costs.
In first quarter 2015, gold production of 207 thousand ounces was 21% lower than the same prior year period. The open pit is stripping the North Betze layback with minimal ore mined to date and underground production is similar to the same prior year period. The increase in tonnes processed and the decrease in recoveries are related to the commissioning of the thiosulfate circuit, which is running low grade stockpiles during the ramp up phase.
Cost of sales for first quarter 2015 was 27% lower than the same prior year period, primarily due to a decrease in open pit and underground mining costs resulting from a decrease in fuel costs and fuel consumption as a result of shorter hauls; lower contractor services costs due to the completion of an underground development project; and an increase in capitalized development costs due to the capitalization of the stripping costs related to the North Betze layback. Cash costs of $584 per ounce were in line with the same prior year period as the impact of the lower sales volume on unit production costs was offset by the decrease in cost of sales. All-in sustaining costs for first quarter 2015 increased by $117 per ounce compared to the same prior year period primarily due to an increase in minesite sustaining capital expenditures.
In first quarter 2015, capital expenditures decreased by 24% compared to the same prior year period. The decrease was primarily due to a decrease in minesite expansion capital expenditure as a result of a reduction in costs associated with the thiosulfate circuit as it nears completion.
We are committed to improving our cost structure, and in 2015 we are working towards improving operating performance and reducing costs through several initiatives, including enhanced integration between maintenance and supply chain, which is resulting in inventory optimizations, and also incremental improvements in underground contractor costs.
In 2015, we continue to expect gold production to be in the range of 1,000 to 1,150 thousand ounces at cash costs of $540 to $590 per ounce and all-in sustaining costs of $700 to $800 per ounce. Production will be largely weighted to the second half of the year as a result of the ramp up of the thiosulfate circuit.
| | | | |
| BARRICK FIRST QUARTER 2015 | | 33 | | MANAGEMENT’S DISCUSSION AND ANALYSIS |
Pueblo Viejo, Dominican Republic
| | | | | | | | | | | | | | |
| Summary of Operating Data | | | | | | | For the three months ended March 31 | |
| | | 2015 | | | | | 2014 | | | % Change | |
Total tonnes mined (000s) | | | 4,544 | | | | | | 5,113 | | | | (11%) | |
Ore tonnes processed (000s) | | | 1,116 | | | | | | 981 | | | | 14% | |
Average grade (grams/tonne) | | | 4.30 | | | | | | 5.52 | | | | (22%) | |
Gold produced (000s/oz) | | | 135 | | | | | | 159 | | | | (15%) | |
Gold sold (000s/oz) | | | 134 | | | | | | 172 | | | | (22%) | |
Cost of sales ($ millions) | | | $ 231 | | | | | | $ 223 | | | | 4% | |
Cash costs (per oz) | | | $ 510 | | | | | | $ 463 | | | | 10% | |
All-in sustaining costs (per oz) | | | $ 675 | | | | | | $ 600 | | | | 13% | |
All-in costs (per oz) | | | $ 675 | | | | | | $ 600 | | | | 13% | |
Summary of Financial Data | | | | | | | For the three months ended March 31 | |
| | | 2015 | | | | | 2014 | | | % Change | |
Segment EBIT ($ millions) | | | $ 137 | | | | | | $ 183 | | | | (25%) | |
Segment EBITDA ($ millions) | | | $ 206 | | | | | | $ 237 | | | | (13%) | |
Capital expenditures ($ millions) | | | $ 20 | | | | | | $ 18 | | | | 11% | |
Minesite sustaining | | | $ 20 | | | | | | $ 18 | | | | 11% | |
Minesite expansion | | | - | | | | | | - | | | | - | |
Project capex | | | - | | | | | | - | | | | - | |
Financial Results
Segment EBIT for first quarter 2015 was 25% lower than the same prior year period, primarily due to a 22% decrease in sales volume combined with a lower realized gold price.
In first quarter 2015, gold production of 135 thousand ounces was 15% lower than the same prior year period, primarily due to lower ore grades and decreased recoveries. In 2015, ore was mined from the upper benches of Moore phase 2 with lower recoveries from that area. We have taken measures to improve recoveries and we anticipate that they will be in line with our original expectations for the remainder of 2015. The lower recoveries were partially offset by an increase in ore tonnes processed compared to the same prior year period.
Cost of sales for first quarter 2015 was 4% higher than the same prior year period, primarily due to increased maintenance costs due to the autoclave shutdown in February 2015 combined with an increase in the allocation of operating segment administration costs to the site. This was partially offset by lower fuel costs, lower royalty expense and an increase in capitalized stripping costs. Cash costs were 10% higher than the same prior year period primarily due to the impact of lower sales volume on unit production costs. All-in sustaining costs increased by $75 per ounce compared to the same prior year period due to the higher cash costs
and slightly higher minesite sustaining capital expenditures.
In first quarter 2015, capital expenditures increased by 11% from the same prior year period primarily due to an increase in capitalized stripping costs.
We are committed to improving our cost structure, and in 2015 the focus will be on improving efficiency and reducing costs through several initiatives, including optimizing ore blending and increasing autoclave availability as well as optimizing our maintenance strategies.
In 2015, we continue to expect our equity share of gold production to be in the range of 625 to 675 thousand ounces at cash costs of $390 to $425 per ounce and all-in sustaining costs to be $540 to $590 per ounce. Production is expected to be stronger in the second half of the year as improved grades and higher recoveries are anticipated and higher throughput due to higher autoclave availability (two planned maintenance shutdowns in the first half and only one in the second half of the year.)
| | | | |
| BARRICK FIRST QUARTER 2015 | | 34 | | MANAGEMENT’S DISCUSSION AND ANALYSIS |
Lagunas Norte, Peru
| | | | | | | | | | | | | | |
| Summary of Operating Data | | | | | | | For the three months ended March 31 | |
| | | 2015 | | | | | 2014 | | | % Change | |
Total tonnes mined (000s) | | | 12,662 | | | | | | 9,268 | | | | 37% | |
Ore tonnes processed (000s) | | | 5,649 | | | | | | 5,524 | | | | 2% | |
Average grade (grams/tonne) | | | 1.18 | | | | | | 0.90 | | | | 31% | |
Gold produced (000s/oz) | | | 178 | | | | | | 134 | | | | 33% | |
Gold sold (000s/oz) | | | 167 | | | | | | 153 | | | | 9% | |
Cost of sales ($ millions) | | | $99 | | | | | | $ 71 | | | | 39% | |
Cash costs (per oz) | | | $ 317 | | | | | | $ 345 | | | | (8%) | |
All-in sustaining costs (per oz) | | | $ 461 | | | | | | $ 522 | | | | (12%) | |
All-in costs (per oz) | | | $ 461 | | | | | | $ 522 | | | | (12%) | |
Summary of Financial Data | | | | | | | For the three months ended March 31 | |
| | | 2015 | | | | | 2014 | | | % Change | |
Segment EBIT ($ millions) | | | $ 104 | | | | | | $ 127 | | | | (18%) | |
Segment EBITDA ($ millions) | | | $ 145 | | | | | | $ 142 | | | | 2% | |
Capital expenditures ($ millions) | | | $ 13 | | | | | | $ 24 | | | | (46%) | |
Minesite sustaining | | | $ 13 | | | | | | $ 24 | | | | (46%) | |
Minesite expansion | | | - | | | | | | - | | | | - | |
Financial Results
Segment EBIT for first quarter 2015 decreased 18% from the same prior year period. The decrease was primarily due to a lower realized gold price combined with higher depreciation expense, partially offset by an increase in sales volume.
In first quarter 2015, gold production of 178 thousand ounces was 33% higher than the same prior year period. The increase in production was primarily due to the acceleration in the recovery of ounces as a result of the new leach pad and increased capacity provided by the carbon-in-circuit and Merrill-Crowe plants combined with higher processed grade and higher throughput due to increased crusher availability.
Cost of sales for first quarter 2015 was 39% higher than the same prior year period, primarily due to higher depreciation expense arising from the depreciation of the carbon-in-circuit plant and the new phase 5 leach pad and related facilities, which were both commissioned at the end of 2014. This was partially offset by a decrease in fuel costs. Cash costs were $28 per ounce lower than the same prior year period, primarily due to the impact of increased production levels on unit production costs. All-in sustaining costs decreased 12% from the same prior year period due to the lower cash costs combined
with a decrease in minesite sustaining capital expenditures.
In first quarter 2015, capital expenditures decreased by 46% from the same prior year period, primarily due to completion in 2014 of the carbon-in-circuit plant and the new phase 5 leach pad and related facilities. Capital expenditures in the first quarter of 2015 mainly include the construction of phase 6 of the leach pad.
As part of our commitment towards continuous improvement of our cost structure, our focus in 2015 will be to improve efficiency and reduce costs through several initiatives, including increasing performance of the new carbon-in-circuit plant, reducing leach pad inventory, improving our maintenance strategy for mine fleet engines, and reducing cyanide consumption and general and administrative costs.
We continue to expect production to be in the range of 600 to 650 thousand ounces at cash costs of $375 to $425 per ounce and all-in sustaining costs of $675 to $725 per ounce.
| | | | |
| BARRICK FIRST QUARTER 2015 | | 35 | | MANAGEMENT’S DISCUSSION AND ANALYSIS |
Veladero, Argentina
| | | | | | | | | | | | | | |
| Summary of Operating Data | | | | | | | For the three months ended March 31 | |
| | | 2015 | | | | | 2014 | | | % Change | |
Total tonnes mined (000s) | | | 19,120 | | | | | | 16,660 | | | | 15% | |
Ore tonnes processed (000s) | | | 7,180 | | | | | | 6,785 | | | | 6% | |
Average grade (grams/tonne) | | | 0.78 | | | | | | 0.94 | | | | (17%) | |
Gold produced (000s/oz) | | | 149 | | | | | | 158 | | | | (6%) | |
Gold sold (000s/oz) | | | 168 | | | | | | 139 | | | | 21% | |
Cost of sales ($ millions) | | | $ 128 | | | | | | $ 120 | | | | 7% | |
Cash costs (per oz) | | | $ 572 | | | | | | $ 583 | | | | (2%) | |
All-in sustaining costs (per oz) | | | $ 991 | | | | | | $ 814 | | | | 22% | |
All-in costs (per oz) | | | $ 991 | | | | | | $ 814 | | | | 22% | |
Summary of Financial Data | | | | | | | For the three months ended March 31 | |
| | | 2015 | | | | | 2014 | | | % Change | |
Segment EBIT ($ millions) | | | $ 73 | | | | | | $ 58 | | | | 26% | |
Segment EBITDA ($ millions) | | | $ 99 | | | | | | $ 88 | | | | 13% | |
Capital expenditures ($ millions) | | | $ 68 | | | | | | $ 31 | | | | 119% | |
Minesite sustaining | | | $ 68 | | | | | | $ 31 | | | | 119% | |
Minesite expansion | | | - | | | | | | - | | | | - | |
Financial Results
Segment EBIT for first quarter 2015 was 26% higher than the same prior year period. The increase was primarily due to an increase in sales volume, partially offset by lower silver by-product credits and a lower realized gold price.
In first quarter 2015, gold production of 149 thousand ounces was 6% lower than the same prior year period primarily due to lower ore grades, partially offset by increased throughput due to improved primary crusher availability.
Cost of sales for first quarter 2015 was 7% higher than the same prior year period, primarily due to increased mining costs resulting from increased throughput and production, partially offset by lower cost on the rental of heavy equipment combined with lower fuel costs. Cash costs were $11 per ounce lower than the same prior year period primarily due to the impact of higher sales volume on unit production costs, partially offset by lower silver by-product credits. All-in sustaining costs increased 22% compared to the same prior year period, primarily due to an increase in minesite sustaining costs, partially offset by the lower cash costs.
In first quarter 2015, capital expenditures increased 119% compared to the same prior year period primarily due to an increase in minesite sustaining capital expenditures. The increase was a result of higher capitalized stripping costs and construction of the phase 4B leach pad expansion.
As part of our commitment to continuous cost improvement, we are working towards improving operating performance and reducing costs through improved maintenance and blasting activities, reduced contractor services costs and recovery of ounces from inventory through management of the leach pad.
In 2015, we continue to expect production to be in the range of 575 to 625 thousand ounces at cash costs of $600 to $650 per ounce and all-in sustaining costs to be $990 to $1,075 per ounce.
| | | | |
| BARRICK FIRST QUARTER 2015 | | 36 | | MANAGEMENT’S DISCUSSION AND ANALYSIS |
Turquoise Ridge, Nevada USA
| | | | | | | | | | | | | | |
| Summary of Operating Data | | | | | | | For the three months ended March 31 | |
| | | 2015 | | | | | 2014 | | | % Change | |
Total tonnes mined (000s) | | | 93 | | | | | | 74 | | | | 26% | |
Ore tonnes processed (000s) | | | 84 | | | | | | 86 | | | | (2%) | |
Average grade (grams/tonne) | | | 19.59 | | | | | | 21.21 | | | | (8%) | |
Gold produced (000s/oz) | | | 49 | | | | | | 54 | | | | (9%) | |
Gold sold (000s/oz) | | | 45 | | | | | | 57 | | | | (21%) | |
Cost of sales ($ millions) | | | $ 31 | | | | | | $ 27 | | | | 15% | |
Cash costs (per oz) | | | $ 578 | | | | | | $ 412 | | | | 40% | |
All-in sustaining costs (per oz) | | | $ 709 | | | | | | $ 526 | | | | 35% | |
All-in costs (per oz) | | | $ 709 | | | | | | $ 526 | | | | 35% | |
Summary of Financial Data | | | | | | | For the three months ended March 31 | |
| | | 2015 | | | | | 2014 | | | % Change | |
Segment EBIT ($ millions) | | | $ 24 | | | | | | $ 46 | | | | (48%) | |
Segment EBITDA ($ millions) | | | $ 29 | | | | | | $ 50 | | | | (42%) | |
Capital expenditures ($ millions) | | | $ 6 | | | | | | $ 6 | | | | - | |
Minesite sustaining | | | $ 6 | | | | | | $ 6 | | | | - | |
Minesite expansion | | | - | | | | | | - | | | | - | |
Financial Results
Segment EBIT for first quarter 2015 was 48% lower than the same prior year period, primarily due to an increase in underground mining costs combined with a 21% reduction in sales volume and a lower realized gold price.
In first quarter 2015, gold production of 49 thousand ounces was 9% lower than the same prior year period, primarily due to the processing of lower grade ore. In first quarter 2015 we mined more ore tonnes and ounces resulting from increased productivity as we transitioned to fully mechanized topcuts, which will be processed in the second quarter.
Cost of sales for first quarter 2015 was 15% higher than the same prior year period, primarily due to an increase in labor costs, as we added manpower to support production growth, and higher maintenance costs due to the planned replacement of major components. Cash costs were $166 per ounce higher than the same prior year period. The increase was primarily due to the higher cost of sales combined with the impact of lower sales volume on unit production costs. All-in sustaining costs increased by 35% compared to the same prior year period due to the higher per ounce cash costs.
In first quarter 2015, capital expenditures were in line with the same prior year period.
As part of our commitment to continuous cost improvement, we are working towards improving operating performance and reducing costs through increased productivity, including an initiative to increase tonnage per foot mined by increasing mining dimensions.
In 2015, we continue to expect production to be in the range of 175 to 200 thousand ounces at cash costs of $570 to $600 per ounce and all-in sustaining costs of $875 to $925 per ounce.
| | | | |
| BARRICK FIRST QUARTER 2015 | | 37 | | MANAGEMENT’S DISCUSSION AND ANALYSIS |
Porgera, Papua New Guinea
| | | | | | | | | | | | |
| Summary of Operating Data | | | | | For the three months ended March 31 | |
| | | 2015 | | | 2014 | | | % Change | |
Total tonnes mined (000s) | | | 4,896 | | | | 4,004 | | | | 22% | |
Ore tonnes processed (000s) | | | 1,288 | | | | 1,267 | | | | 2% | |
Average grade (grams/tonne) | | | 3.32 | | | | 3.03 | | | | 10% | |
Gold produced (000s/oz) | | | 118 | | | | 110 | | | | 7% | |
Gold sold (000s/oz) | | | 115 | | | | 117 | | | | (2%) | |
Cost of sales ($ millions) | | | $ 108 | | | | $ 134 | | | | (19%) | |
Cash costs (per oz) | | | $ 807 | | | | $ 977 | | | | (17%) | |
All-in sustaining costs (per oz) | | | $ 1,064 | | | | $ 1,039 | | | | 2% | |
All-in costs (per oz) | | | $ 1,064 | | | | $ 1,039 | | | | 2% | |
Summary of Financial Data | | | | | For the three months ended March 31 | |
| | | 2015 | | | 2014 | | | % Change | |
Segment EBIT ($ millions) | | | $ 35 | | | | $ 16 | | | | 119% | |
Segment EBITDA ($ millions) | | | $ 50 | | | | $ 38 | | | | 32% | |
Capital expenditures ($ millions) | | | $ 28 | | | | $ 6 | | | | 367% | |
Minesite sustaining | | | $ 28 | | | | $ 6 | | | | 367% | |
Minesite expansion | | | - | | | | - | | | | - | |
Financial Results
Segment EBIT for first quarter 2015 was significantly higher than the same prior year period primarily due to a decrease in operating costs, partially offset by a lower realized gold price and a decrease in sales volume.
In first quarter 2015, gold production of 118 thousand ounces was 7% higher than the same prior year period. The increase in production was primarily due to higher head grade driven by the improved performance from both open pit and underground operations. Open pit tonnes and grade have increased in 2015 resulting from higher tonnes from stages 5A and 5C due to improved control over mud flow. Additionally, underground tonnes and grade have increased with improved development rates and maintenance availabilities across the underground fleet.
Cost of sales for first quarter 2015 was 19% lower than the same prior year period. The decrease was primarily due to lower operating costs as a result of a decrease in power and diesel costs, as well as an increase in capitalized stripping costs. Cash costs were $170 per ounce lower compared to the same prior year period, primarily due to the decrease in cost of sales combined with the impact of higher production levels on unit production costs. All-in sustaining costs were 2% higher than the same prior year period as an increase in mine site sustaining capital expenditures was partially offset by lower cash costs.
In first quarter 2015, capital expenditures increased 367% compared to the same prior year period. The increase was primarily due to a significant increase in capitalized stripping costs as a result of a change in the 2015 mine plan that increased open pit mining activity.
In 2015, we continue to expect gold production to be in the range of 500 to 550 thousand ounces at cash costs of $775 to $825 per ounce and all-in sustaining costs of $1,025 to $1,125 per ounce.
| | | | |
| BARRICK FIRST QUARTER 2015 | | 38 | | MANAGEMENT’S DISCUSSION AND ANALYSIS |
Kalgoorlie, Australia
| | | | | | | | | | | | |
| Summary of Operating Data | | | | | For the three months ended March 31 | |
| | | 2015 | | | 2014 | | | % Change | |
Total tonnes mined (000s) | | | 9,275 | | | | 8,939 | | | | 4% | |
Ore tonnes processed (000s) | | | 1,144 | | | | 1,484 | | | | (23%) | |
Average grade (grams/tonne) | | | 1.86 | | | | 1.90 | | | | (2%) | |
Gold produced (000s/oz) | | | 59 | | | | 78 | | | | (24%) | |
Gold sold (000s/oz) | | | 60 | | | | 90 | | | | (33%) | |
Cost of sales ($ millions) | | | $ 66 | | | | $ 85 | | | | (22%) | |
Cash costs (per oz) | | | $ 959 | | | | $ 823 | | | | 17% | |
All-in sustaining costs (per oz) | | | $ 1,271 | | | | $ 1,014 | | | | 25% | |
All-in costs (per oz) | | | $ 1,271 | | | | $ 1,014 | | | | 25% | |
Summary of Financial Data | | | | | For the three months ended March 31 | |
| | | 2015 | | | 2014 | | | % Change | |
Segment EBIT ($ millions) | | | $ 9 | | | | $ 29 | | | | (69%) | |
Segment EBITDA ($ millions) | | | $ 18 | | | | $ 40 | | | | (55%) | |
Capital expenditures ($ millions) | | | $ 17 | | | | $ 16 | | | | 6% | |
Minesite sustaining | | | $ 17 | | | | $ 16 | | | | 6% | |
Minesite expansion | | | - | | | | - | | | | - | |
Financial Results
Segment EBIT for first quarter 2015 was 69% lower than the same prior year period. The decrease was primarily due to a 33% reduction in sales volume combined with a lower realized gold price, partially offset by a decrease in operating costs.
In first quarter 2015, gold production of 59 thousand ounces was 24% lower than the same prior year period. The decrease was primarily due to increased maintenance time on the SAG mill and operational downtime as a result of issues relating to the conveyor and lube system.
Cost of sales for first quarter 2015 was 22% lower than the same prior year period primarily due to lower operating costs, resulting from a decrease in ore tonnes milled combined with lower fuel costs and the impact of the devaluation of the Australian dollar. Cash costs were $136 per ounce higher than the same prior year period primarily due to the impact of the lower sales volume on unit production costs combined with the an increase in operating segment administration costs allocated to the mine site. All-in sustaining costs increased by 25% compared to the same prior year period, primarily due to the higher per ounce cash costs.
In first quarter 2015, capital expenditures increased 6% compared to the same prior year period as higher capital expenditures associated with the emissions reduction program were partially offset by lower capitalized stripping costs.
In 2015, we continue to expect production to be in the range of 315 to 330 thousand ounces at cash costs of $775 to $800 per ounce and all-in sustaining costs of $915 to $940 per ounce
| | | | |
| BARRICK FIRST QUARTER 2015 | | 39 | | MANAGEMENT’S DISCUSSION AND ANALYSIS |
Acacia Mining plc1, Africa
| | | | | | | | | | | | |
| Summary of Operating Data | | | | | For the three months ended March 31 | |
| | | 2015 | | | 2014 | | | % Change | |
Total tonnes mined (000s) | | | 10,153 | | | | 9,537 | | | | 6% | |
Ore tonnes processed (000s) | | | 2,075 | | | | 1,845 | | | | 12% | |
Average grade (grams/tonne) | | | 3.10 | | | | 3.20 | | | | (3%) | |
Gold produced (000s/oz) | | | 182 | | | | 168 | | | | 8% | |
Gold sold (000s/oz) | | | 172 | | | | 159 | | | | 8% | |
Cost of sales ($ millions) | | | $ 174 | | | | $ 162 | | | | 7% | |
Cash costs (per oz) | | | $ 783 | | | | $ 756 | | | | 4% | |
All-in sustaining costs (per oz) | | | $ 1,117 | | | | $ 1,131 | | | | (1%) | |
All-in costs (per oz) | | | $ 1,122 | | | | $ 1,227 | | | | (9%) | |
Summary of Financial Data | | | | | For the three months ended March 31 | |
| | | 2015 | | | 2014 | | | % Change | |
Segment EBIT ($ millions) | | | $ 33 | | | | $ 46 | | | | (28%) | |
Segment EBITDA ($ millions) | | | $ 66 | | | | $ 76 | | | | (13%) | |
Capital expenditures ($ millions) | | | $ 41 | | | | $ 56 | | | | (27%) | |
Minesite sustaining | | | $ 40 | | | | $ 42 | | | | (5%) | |
Minesite expansion | | | $ 1 | | | | $ 14 | | | | (93%) | |
| | 1 | Formerly African Barrick Gold plc. |
Financial Results
Segment EBIT for first quarter 2015 was 28% lower than the same prior year period. The decrease was primarily due to higher cost of sales combined with a lower realized gold price, partially offset by an increase in sales volume.
In first quarter 2015, gold production was 8% higher than the same prior year period primarily due to increased production across all sites. In first quarter 2015, production at North Mara increased by 10% over the same prior year period primarily due to increased throughput as a result of business improvement initiatives in the mining and milling areas, combined with higher grades from the Gokona and Nyambirama pits. Production at Bulyanhulu was 12% higher than the same prior year period primarily due to an increase in ore tonnes processed from the underground and from the processing of reclaimed tailings, partially offset by lower recoveries, due to the underperformance of the elution circuit, and lower grades from the processing of tonnes from the Upper East zone. Production at Buzwagi was in line with first quarter 2014 as increased recoveries resulting from process plant enhancements made in 2014 were offset by slightly lower grade.
Cost of sales for first quarter 2015 was 7% higher than the same prior year period primarily due to a decrease in capitalized stripping costs combined with an increase in
contractor services costs, partially offset by lower labor costs as a result of headcount reductions and lower fuel costs. Cash costs were up 4% from the same prior year period, primarily due to the increase in cost of sales resulting from increased maintenance and contracted services costs at Bulyanhulu and lower capitalized stripping costs at Buzwagi. All-in sustaining costs decreased by 1% over the same prior year period reflecting the 5% decrease in minesite sustaining capital expenditures, partially offset by the higher cash costs.
In first quarter 2015, capital expenditures decreased by 27% from the same prior year period, primarily due to a reduction in minesite expansion capital expenditures. The decrease in expansion capital was primarily due to lower costs at Bulyanhulu relating to the CIL plant which was commissioned in fourth quarter 2014.
In 2015, we continue to expect Acacia’s gold production to be in the range of 480 to 510 thousand ounces (Barrick’s share) at cash costs of $695 to $725 per ounce and all-in sustaining costs of $1,050 to $1,100 per ounce.
| | | | |
| BARRICK FIRST QUARTER 2015 | | 40 | | MANAGEMENT’S DISCUSSION AND ANALYSIS |
Other Mines - Copper, Zambia and Chile
| | | | | | | | | | | | |
| Summary of Operating Data | | | | | For the three months ended March 31 | |
| | | 2015 | | | 2014 | | | % Change | |
Copper produced (millions of lbs) | | | 118 | | | | 104 | | | | 13% | |
Copper sold (millions of lbs) | | | 121 | | | | 111 | | | | 9% | |
Cost of sales ($ millions) | | | $ 251 | | | | $ 258 | | | | (3%) | |
C1 cash costs (per lb) | | | $ 1.84 | | | | $ 2.11 | | | | (13%) | |
C3 fully allocated costs (per lb) | | | $ 2.35 | | | | $ 2.64 | | | | (11%) | |
Summary of Financial Data | | | | | For the three months ended March 31 | |
| | | 2015 | | | 2014 | | | % Change | |
Segment EBIT ($ millions) | | | $ 15 | | | | $ 36 | | | | (58%) | |
Segment EBITDA ($ millions) | | | $ 52 | | | | $ 78 | | | | (33%) | |
Capital expenditures ($ millions) | | | $ 27 | | | | $ 68 | | | | (60%) | |
Minesite sustaining | | | $ 27 | | | | $ 62 | | | | (56%) | |
Minesite expansion | | | - | | | | - | | | | - | |
Project capex | | | - | | | | $ 6 | | | | (100%) | |
Financial Results
Segment EBIT for first quarter 2015 was 58% lower than the same prior year period. The decrease was primarily due to a lower realized copper price, partially offset by a 9% increase in sales volume.
In first quarter 2015, copper production of 118 million pounds was 13% higher than the same prior year period. The increase was a result of higher production at Lumwana due to better operating conditions at the mine, as rainfall was less than in first quarter 2014, coupled with higher tonnes processed during the quarter as a result of realizing greater operational efficiencies. Production at Zaldívar was lower than the same prior year period due to flooding at the mine as a result of a severe rain event experienced at the end of first quarter 2015 which negatively impacted production.
Cost of sales for first quarter 2015 was 3% lower compared to the same prior year period. The decrease was primarily due to lower operating costs at Lumwana as a result of strengthened wet weather season planning coupled with realized cost efficiencies in mining and processing and lower depreciation expense resulting from the impairment charge taken in fourth quarter 2014. C1 cash costs of $1.84 per pound were 13% lower than the same prior year period, primarily due to the impact of increased sales volume and lower overall direct operating expenses. C3 fully allocated costs per pound were 11% lower than the same prior year period, reflecting the effect of the above factors on C1 cash costs, partially offset by an increased royalty rate at Lumwana from 6% to 20% in first quarter 2015.
In first quarter 2015, capital expenditures decreased by 60% compared to the same prior year period. The decrease was primarily due to lower minesite sustaining capital expenditures at both Zaldívar and at Lumwana. At Zaldívar the decrease is primarily due to lower capitalized stripping costs, while at Lumwana the decrease is due to the deferral of expenditures in anticipation of the suspension of operations.
On April 20, 2015, the Zambian government announced amendments to the country’s mining tax regime that would replace the recently adopted 20 percent gross royalty on open pit mines with a nine percent royalty, along with the reintroduction of a 30 percent corporate income tax and a 15 percent variable profits tax. Based on our initial analysis, this system would enable Lumwana to remain free cash flow positive at current copper prices. As a result, we will continue operations at Lumwana and have amended our operating guidance to reflect this change. In second quarter 2015 we will complete our analysis and evaluate the potential for a reversal of previous impairments recorded in fourth quarter 2014.
As a result of the decision to continue operations at Lumwana, we now expect copper production to be in the range of 480 to 520 million lbs and C3 fully allocated costs to be in the range of $2.35 to $2.65 per pound compared to our previous guidance ranges of 310 to 340 million lbs and $2.30 to $2.60 per pound, respectively. We continue to expect C1 cash costs of $1.75 to $2.00 per pound.
| | | | |
| BARRICK FIRST QUARTER 2015 | | 41 | | MANAGEMENT’S DISCUSSION AND ANALYSIS |
FINANCIAL CONDITION REVIEW
| | | | | | | | |
| Summary Balance Sheet and Key Financial Ratios | | | | | | |
($ millions, except ratios and share amounts) | | As at March 31, 2015 | | | As at December 31, 2014 | |
Total cash and equivalents | | | $ 2,258 | | | | $ 2,699 | |
Current assets | | | 3,492 | | | | 3,451 | |
Non-current assets | | | 27,767 | | | | 27,729 | |
Total Assets | | | $ 33,517 | | | | $ 33,879 | |
Current liabilities excluding short-term debt | | | $ 2,029 | | | | $ 2,227 | |
Non-current liabilities excluding long-term debt | | | 5,796 | | | | 5,709 | |
Debt (current and long-term) | | | 12,903 | | | | 13,081 | |
Total Liabilities | | | $ 20,728 | | | | $ 21,017 | |
Total shareholders’ equity | | | 10,185 | | | | 10,247 | |
Non-controlling interests | | | 2,604 | | | | 2,615 | |
Total Equity | | | $ 12,789 | | | | $ 12,862 | |
Total common shares outstanding (millions of shares)1 | | | 1,165 | | | | 1,165 | |
Key Financial Ratios: | | | | | | | | |
Current ratio2 | | | 2.47:1 | | | | 2.40:1 | |
Debt-to-equity3 | | | 1.01:1 | | | | 1.02:1 | |
Debt-to-total capitalization4 | | | 0.38:1 | | | | 0.39:1 | |
| | 1 | Total common shares outstanding do not include 5.1 million stock options. |
| | 2 | Represents current assets divided by current liabilities (including short-term debt) as at March 31, 2015 and December 31, 2014. |
| | 3 | Represents debt divided by total shareholders’ equity (including minority interest) as at March 31, 2015 and December 31, 2014. |
| | 4 | Represents debt divided by capital stock and debt as at March 31, 2015 and December 31, 2014. |
Balance Sheet Review
Total assets were $33.5 billion at March 31, 2015, in line with total assets at December 31, 2014. Our asset base is primarily comprised of non-current assets such as property, plant and equipment and goodwill, reflecting the capital intensive nature of the mining business and our history of growing through acquisitions. Other significant assets include production inventories, indirect taxes and other government receivables, and cash and equivalents. We typically do not carry a material accounts receivable balance, since only sales of concentrate and copper cathode have a settlement period.
Total liabilities at March 31, 2015 totaled $21 billion, consistent with total liabilities at December 31, 2014.
Shareholders’ Equity
| | | | |
| As at April 20, 2015 | | Number of shares | |
Common shares | | | 1,164,669,708 | |
Stock options | | | 5,019,359 | |
Comprehensive Income
Comprehensive income consists of net income or loss, together with certain other economic gains and losses, which, collectively, are described as “other comprehensive income” or “OCI”, and excluded from the income statement.
For first quarter 2015 other comprehensive income was a loss of $62 million on an after-tax basis. The loss reflected losses of $71 million on hedge contracts designated for future periods, caused primarily by changes in currency exchange rates, copper prices, and fuel prices, reclassification adjustments totaling $16 million for losses on hedge contracts designated for 2015 (or ineffective amounts) that were transferred to earnings or PPE in conjunction with the recognition of the related hedge exposure, $5 million of losses recorded as a result in changes in the fair value of investments
| | | | |
| BARRICK FIRST QUARTER 2015 | | 42 | | MANAGEMENT’S DISCUSSION AND ANALYSIS |
held during the quarter and $32 million in losses for currency translation adjustments, partially offset by $17 million of gains recorded as a result of realized changes in equity investments and $13 million gain due to tax recoveries on the overall decrease in OCI.
Included in accumulated other comprehensive income at March 31, 2015 were unrealized pre-tax losses on currency, commodity and interest rate hedge contracts totaling $148 million, $36 million of which was the result of designating the majority of our fuel contracts as hedging instruments upon adopting IFRS 9. The balance primarily relates to currency hedge contracts that are designated against operating costs and capital expenditures, primarily over the next two years, including $21 million remaining in crystallized hedge losses related to our Australian dollar contracts that were settled in third quarter 2012 or closed out in the second half of 2013 and $16 million in crystallized hedge gains related to our silver contracts. These hedge gains/losses are expected to be recorded in earnings at the same time the corresponding hedged operating costs/depreciation are recorded in earnings.
Financial Position and Liquidity
Our capital structure comprises a mix of debt and shareholders’ equity. As at March 31, 2015, our total debt was $12.9 billion (debt net of cash and equivalents was $10.6 billion) and our debt-to-equity ratio and debt-to-total capitalization ratios were 1.01:1 and 0.38:1, respectively. This compares to debt as at December 31, 2014 of $13.1 billion (debt net of cash and equivalents was $10.4 billion), and debt-to-equity and debt-to-total capitalization ratios of 1.02:1 and 0.39:1, respectively. We have attributable debt principal of less than $200 million maturing by the end of 2015 and less than $900 million due by the end of 2017 (refer to note 17B to the consolidated financial statements). Our $4.0 billion revolving credit facility (“2012 Credit Facility”) is fully undrawn and expires in January 2020.
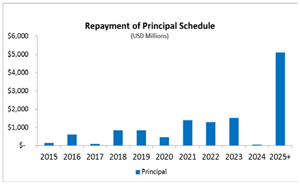
| 1 | Amounts exclude capital leases and include 60% of the Pueblo Viejo financing and 100% of the Acacia financing. |
Our top priority is restoring a strong balance sheet and we have targeted a reduction in our net debt of at least $3 billion by the end of 2015. While our level of debt needs to come down, strong liquidity means the company can tackle its debt in a disciplined manner. Our primary source of liquidity is our operating cash flow, which is dependent on the ability of our operations to deliver projected future cash flows. Other options to enhance liquidity include drawing the $4.0 billion available under our 2012 Credit Facility (subject to compliance with covenants and the making of certain representations and warranties, this facility is available for drawdown as a source of financing); further non-core asset sales or joint ventures opportunities; and issuances of debt or equity securities in the public markets or to private investors, which could be undertaken for liquidity enhancement and/or in connection with establishing a strategic partnership. Many factors, including but not limited to, general market conditions and then prevailing metals prices could impact our ability to issue securities on acceptable terms, as could our credit ratings. Moody’s and S&P currently rate our long-term debt Baa2 (negative) and BBB- (stable), respectively after our credit rating was downgraded by S&P on March 2, 2015 to BBB- (stable), which is the lowest investment grade rating. Further changes in our ratings could affect the trading prices of our securities and our cost of capital. If we were to borrow under our 2012 Credit Facility, the applicable interest rate on the amounts borrowed would be based, in part, on our credit ratings at the time. The key financial covenant in the 2012 Credit Facility (undrawn as at April 27, 2015) requires Barrick to maintain a consolidated tangible net worth (“CTNW”) of at least $3.0 billion. Barrick’s CTNW was $5.7 billion as at March 31, 2015.
| | | | |
| BARRICK FIRST QUARTER 2015 | | 43 | | MANAGEMENT’S DISCUSSION AND ANALYSIS |
Cash and equivalents and cash flow
Total cash and cash equivalents as at March 31, 2015 were $2.3 billion1. Our cash position consists of a mix of term deposits, treasury bills and money market investments and is primarily denominated in US dollars.
Summary of Cash Inflow (Outflow)
| | | | | | | | |
| ($ millions) | | For the three months ended March 31 | |
| | | 2015 | | | 2014 | |
Operating inflows | | | $ 316 | | | | $ 585 | |
Investing activities | | | | | | | | |
Capital Expenditures1 | | | $ (514) | | | | $ (616) | |
Divestitures | | | 2 | | | | 80 | |
Other | | | 44 | | | | 20 | |
Total investing outflows | | | $ (468) | | | | $ (516) | |
Financing activities | | | | | | | | |
Net change in debt | | | $ (182) | | | | $ 58 | |
Dividends | | | (58) | | | | (58) | |
Proceeds from divestment of 10% of issued ordinary share capital of Acacia | | | - | | | | 186 | |
Other | | | (43) | | | | 2 | |
Total financing (outflows) inflows | | | $ (283) | | | | $ 188 | |
Effect of exchange rate | | | (6) | | | | (5) | |
Increase/(decrease) in cash and equivalents | | | ($ 441) | | | | $ 252 | |
| | 1 | The amounts include capitalized interest of $9 million for the three months ended March 31, 2015 (2014: $7 million). |
In first quarter 2015, we generated $316 million in operating cash flow, compared to $585 million of operating cash flow in the same prior year period. The decrease in operating cash flow primarily reflects lower net earnings, primarily due to lower realized gold and copper prices and lower gold sales volume, partially offset by an increase in copper sales volume. Operating cash flow is expected to be stronger in the second half of 2015 as operational performance is expected to improve through higher production and lower cash costs. The most significant driver of the change in operating cash flow is market gold and copper prices. The ability of our operations to deliver projected future cash flows within the parameters of a reduced production profile, as well as future changes in gold and copper market prices, either favorable or unfavorable, will continue to have a material impact on our cash flow and liquidity. The principal uses of operating cash flow are to fund our capital expenditures, interest and dividend payments.
| | 1 | Includes $417 million cash held at Acacia and Pueblo Viejo, which may not be readily deployed outside of Acacia and/or Pueblo Viejo. |
Cash used in investing activities in first quarter 2015 amounted to $468 million compared to $516 million in the same prior year period. The decrease of $48 million from first quarter 2014 is primarily due to a decrease in capital expenditures, partially offset by lower proceeds from divestitures as we completed the sale of two of our Australian mines in first quarter 2014. In first quarter 2015, capital expenditures on a cash basis were $514 million compared to $616 million in first quarter 2014. The decrease of $102 million is primarily due to a decrease in project capital expenditures due to the ramp down in construction activities at Pascua-Lama that commenced in first quarter 2014, combined with a decrease in minesite development capital due to a reduction in capitalized stripping costs. This was partially offset by an increase in minesite sustaining capital expenditures due to an increase in spending at Veladero relating to the phase 4B leach pad expansion.
Net financing cash outflows for first quarter 2015 amounted to $283 million, compared to $188 million of cash inflows in the same prior year period. The net financing cash outflows for first quarter 2015 primarily consist of $182 million of debt repayments and $58 million of dividend payments. The net financing cash inflows for first quarter 2014 primarily consist of $186 million in proceeds from the divestment of 10% of our share ownership in Acacia, partially offset by $58 million of dividend payments.
| | | | |
| BARRICK FIRST QUARTER 2015 | | 44 | | MANAGEMENT’S DISCUSSION AND ANALYSIS |
Summary of Financial Instruments
| | | | | | | | | | | | |
| As at March 31, 2015 | | | | | | | | | | |
Financial Instrument | | Principal/Notional Amount | | | | | Associated Risks |
| | | | | | | | | | | | ● Interest rate |
Cash and equivalents | | | | | | | $ 2,258 | | | million | | ● Credit |
| | | | | | | | | | | | ● Credit |
Accounts receivable | | | | | | | $ 416 | | | million | | ● Market |
| | | | | | | | | | | | ● Market |
Other investments | | | | | | | $ 13 | | | million | | ● Liquidity |
Accounts payable | | | | | | | $ 1,506 | | | million | | ● Liquidity |
Debt | | | | | | | $ 13,005 | | | million | | ● Interest rate |
Restricted share units | | | | | | | $ 37 | | | million | | ● Market |
Deferred share units | | | | | | | $ 3 | | | million | | ● Market |
| | | CAD | | | | 180 | | | million | | ● Market/liquidity |
| | | CLP | | | | 76,500 | | | million | | ● Credit |
| | | AUD | | | | 373 | | | million | | ● Interest rate |
Derivative instruments - currency contracts | | | ZAR | | | | 296 | | | million | | |
| | | | | | | | | | | | ● Market/liquidity |
| | | | | | | | | | | | ● Credit |
Derivative instruments - copper contracts | | | | | | | 2 | | | million lbs | | ● Interest rate |
| | | | | | | | | | | | ● Market/liquidity |
| | | | | | | | | | | | ● Credit |
Derivative instruments - energy contracts | | | Diesel | | | | 8 | | | million bbls | | ● Interest rate |
| | | | |
Derivative instruments - interest rate contracts | | | Receive float interest rate swaps | | | | $ 142 | | | million | | ● Market/liquidity |
Commitments and Contingencies
Litigation and Claims
We are currently subject to various litigation proceedings as disclosed in note 21 to the consolidated financial statements, and we may be involved in disputes with other parties in the future that may result in litigation. If we are unable to resolve these disputes favorably, it may have a material adverse impact on our financial condition, cash flow and results of operations
| | | | |
| BARRICK FIRST QUARTER 2015 | | 45 | | MANAGEMENT’S DISCUSSION AND ANALYSIS |
Contractual Obligations and Commitments
| | | | | | | | | | | | | | | | | | | | | | | | | | | | |
| | | Payments due As at March 31, 2015 | | | | | | | | | | |
| ($ millions) | | 20151 | | | 2016 | | | 2017 | | | 2018 | | | 2019 | | | 2020 and thereafter | | | Total | |
Debt2 | | | | | | | | | | | | | | | | | | | | | | | | | | | | |
Repayment of principal | | | $ 154 | | | | $ 660 | | | | $ 124 | | | | $ 873 | | | | $ 871 | | | | $ 9,985 | | | | $ 12,667 | |
Capital leases | | | 58 | | | | 65 | | | | 62 | | | | 56 | | | | 42 | | | | 55 | | | | 338 | |
Interest | | | 600 | | | | 651 | | | | 630 | | | | 620 | | | | 549 | | | | 6,443 | | | | 9,493 | |
Provisions for environmental rehabilitation3 | | | 95 | | | | 111 | | | | 70 | | | | 77 | | | | 127 | | | | 2,034 | | | | 2,514 | |
Operating leases | | | 46 | | | | 55 | | | | 54 | | | | 54 | | | | 45 | | | | 65 | | | | 319 | |
Restricted share units | | | 16 | | | | 5 | | | | 13 | | | | 3 | | | | - | | | | - | | | | 37 | |
Pension benefits and other post-retirement benefits | | | 17 | | | | 22 | | | | 22 | | | | 22 | | | | 22 | | | | 433 | | | | 538 | |
Derivative liabilities4 | | | 155 | | | | 107 | | | | 39 | | | | 18 | | | | 1 | | | | - | | | | 320 | |
Purchase obligations for supplies and consumables5 | | | 472 | | | | 292 | | | | 198 | | | | 133 | | | | 119 | | | | 263 | | | | 1,477 | |
Capital commitments6 | | | 74 | | | | 9 | | | | 5 | | | | 5 | | | | 4 | | | | 7 | | | | 104 | |
Social development costs7 | | | 68 | | | | 73 | | | | 8 | | | | 9 | | | | 9 | | | | 67 | | | | 234 | |
Total | | | $ 1,755 | | | | $ 2,050 | | | | $ 1,225 | | | | $ 1,870 | | | | $ 1,789 | | | | $ 19,352 | | | | $ 28,041 | |
| 1 | Represents the obligations and commitments for the remainder of the year. |
| 2 | Debt and Interest - Our debt obligations do not include any subjective acceleration clauses or other clauses that enable the holder of the debt to call for early repayment, except in the event that we breach any of the terms and conditions of the debt or for other customary events of default. The debt and interest amounts include 100% of the Pueblo Viejo financing, even though our attributable share is 60 per cent of this total, consistent with our ownership interest in the mine. We are not required to post any collateral under any debt obligations. Projected interest payments on variable rate debt were based on interest rates in effect at March 31, 2015. Interest is calculated on our long-term debt obligations using both fixed and variable rates. |
| 3 | Provisions for Environmental Rehabilitation - Amounts presented in the table represent the undiscounted uninflated future payments for the expected cost of provisions for environmental rehabilitation. |
| 4 | Derivative Liabilities - Amounts presented in the table relate to derivative contracts disclosed under note 17C to the consolidated financial statements. Payments related to derivative contracts may be subject to change given variable market conditions. |
| 5 | Purchase Obligations for Supplies and Consumables - Includes commitments related to new purchase obligations to secure a supply of acid, tires and cyanide for our production process. |
| 6 | Capital Commitments - Purchase obligations for capital expenditures include only those items where binding commitments have been entered into. |
| 7 | Social Development Costs – Includes Pascua-Lama’s commitment related to the potential funding of a power transmission line in Argentina of $119 million, expected to be paid over the period 2015-2016. |
INTERNAL CONTROL OVER FINANCIAL REPORTING AND DISCLOSURE CONTROLS AND PROCEDURES
Management is responsible for establishing and maintaining adequate internal control over financial reporting and disclosure controls and procedures as defined in our 2014 annual MD&A.
Together, the internal control over financial reporting and disclosure controls and procedures frameworks provide internal control over financial reporting and disclosure. Due to its inherent limitations, internal control over financial reporting and disclosure may not prevent or detect all misstatements. Further, the effectiveness of internal control is subject to the risk that controls may become inadequate because of changes in conditions, or that the degree of compliance with policies or procedures may change.
Management will continue to monitor the effectiveness of its internal control over financial reporting and disclosure controls and procedures under the new organizational structure and may make modifications from time to time as considered necessary.
| | | | |
| BARRICK FIRST QUARTER 2015 | | 46 | | MANAGEMENT’S DISCUSSION AND ANALYSIS |
REVIEW OF QUARTERLY RESULTS
Quarterly Information1
| | | | | | | | | | | | | | | | | | | | | | | | | | | | | | | | |
| | | 2015 | | | | | | 2014 | | | | | | | | | 2013 | | | | |
($ millions, except where indicated) | | Q1 | | | Q4 | | | Q3 | | | Q2 | | | Q1 | | | Q4 | | | Q3 | | | Q2 | |
Revenues | | | $ 2,245 | | | | $ 2,510 | | | | $ 2,598 | | | | $ 2,432 | | | | $ 2,647 | | | | $ 2,942 | | | | $ 2,985 | | | | $ 3,201 | |
Realized price per ounce – gold2 | | | 1,219 | | | | 1,204 | | | | 1,285 | | | | 1,289 | | | | 1,285 | | | | 1,272 | | | | 1,323 | | | | 1,411 | |
Realized price per pound – copper2 | | | 2.55 | | | | 2.91 | | | | 3.09 | | | | 3.17 | | | | 3.03 | | | | 3.34 | | | | 3.40 | | | | 3.28 | |
Cost of sales | | | 1,708 | | | | 1,799 | | | | 1,642 | | | | 1,590 | | | | 1,719 | | | | 1,853 | | | | 1,788 | | | | 1,832 | |
Net earnings (loss) | | | 57 | | | | (2,851) | | | | 125 | | | | (269) | | | | 88 | | | | (2,830) | | | | 172 | | | | (8,555) | |
Per share (dollars)2,3 | | | 0.05 | | | | (2.45) | | | | 0.11 | | | | (0.23) | | | | 0.08 | | | | (2.61) | | | | 0.17 | | | | (8.55) | |
Adjusted net earnings2 | | | 62 | | | | 174 | | | | 222 | | | | 159 | | | | 238 | | | | 406 | | | | 577 | | | | 663 | |
Per share (dollars)2,3 | | | 0.05 | | | | 0.15 | | | | 0.19 | | | | 0.14 | | | | 0.20 | | | | 0.37 | | | | 0.58 | | | | 0.66 | |
Operating cash flow | | | 316 | | | | 371 | | | | 852 | | | | 488 | | | | 585 | | | | 1,016 | | | | 1,231 | | | | 907 | |
Adjusted operating cash flow2 | | | $ 316 | | | | $ 371 | | | | $ 852 | | | | $ 488 | | | | $ 585 | | | | $ 1,085 | | | | $ 1,300 | | | | $ 815 | |
| | 1 | Sum of all the quarters may not add up to the annual total due to rounding. |
| | 2 | Calculated using weighted average number of shares outstanding under the basic method of earnings per share. |
| | 3 | Realized price, adjusted net earnings, adjusted EPS and adjusted operating cash flow are non-GAAP financial performance measures with no standard meaning under IFRS. For further information and a detailed reconciliation, please see pages 49 - 54 of this MD&A. |
Our recent financial results reflect a trend of declining spot gold prices, and as a result of an emphasis on cost control and maximizing free cash flow, costs have also decreased. Our adjusted net earnings and adjusted operating cash flow levels have fluctuated with gold and copper realized prices and production levels each quarter. In fourth quarter 2014, we recorded asset and goodwill impairments of $2.8 billion (net of tax effects and non-controlling interests), primarily at Lumwana, Zaldívar and Cerro Casale. The net loss in second quarter 2014 reflected asset and goodwill impairment charges of $514 million relating to Jabal Sayid as a result of classifying the project as held for sale. In fourth quarter 2013, we recorded asset and goodwill impairment charges totaling $2.8 billion (net of tax effects and non-controlling interests), primarily at Pascua-Lama, Porgera, Veladero and goodwill related to our Australia Pacific segment. The net loss in second quarter 2013 reflected asset and goodwill impairment charges totaling $8.7 billion (net of tax and non-controlling interest effects), primarily at Pascua-Lama, Buzwagi, Jabal Sayid and goodwill related to our global copper, Australia Pacific and Capital Projects segments.
| | | | |
| BARRICK FIRST QUARTER 2015 | | 47 | | MANAGEMENT’S DISCUSSION AND ANALYSIS |
IFRS CRITICAL ACCOUNTING POLICIES AND ACCOUNTING ESTIMATES
Management has discussed the development and determination of our critical accounting estimates and significant accounting policies with the Audit Committee of the Board of Directors, and the Audit Committee has reviewed the disclosure relating to such estimates and policies in conjunction with its review of this MD&A. The accounting policies and methods we utilize determine how we report our financial condition and results of operations, and they may require management to make estimates or rely on assumptions about matters that are inherently uncertain. Our significant accounting policies are disclosed in note 2 of our most recent Annual Consolidated Financial Statements. A summary of current and future accounting policy changes is disclosed in notes 2B and 2C of the accompanying interim consolidated financial statements, respectively, including our early adoption of IFRS 9 Financial Instruments in this interim period.
Critical Accounting Estimates and Judgments
Certain accounting estimates have been identified as being “critical” to the presentation of our financial condition and results of operations because they require us to make subjective and/or complex judgments about matters that are inherently uncertain; or there is a reasonable likelihood that materially different amounts could be reported under different conditions or using different assumptions and estimates. Our significant accounting judgments, estimates and assumptions are disclosed in note 3 of the Annual Consolidated Financial Statements and an update is provided in note 3 of the accompanying interim consolidated financial statements.
Accounting for impairment of non-current assets
In accordance with our accounting policy, goodwill is tested for impairment in the fourth quarter and also when there is an indicator of impairment. Non-current assets are tested for impairment when events or changes in circumstances suggest that the carrying amount may not be recoverable. No potential indicators of impairment at our operating segment level were identified in first quarter 2015. Based on the results of our last impairment test performed in fourth quarter 2014, the carrying value of the CGUs that are most sensitive to the change in sales prices used in the annual test are:
| | | | |
As at March 31, 2015 | | Carrying value | |
Cortez1 | | | $3,872 | |
Zaldívar1,2 | | | 2,434 | |
Pascua-Lama2 | | | 1,211 | |
Veladero1 | | | 830 | |
Porgera1,2 | | | 618 | |
Bald Mountain2 | | | 534 | |
Cerro Casale2 | | | 514 | |
Round Mountain2 | | | 146 | |
| 1 | Carrying value includes goodwill. |
| 2 | These CGUs have been impaired or had an impairment reversal in 2014 and therefore their fair value approximates carrying value. |
As disclosed on page 25, the Zambian government announced amendments to the country’s mining tax regime. In second quarter 2015 we will complete our analysis and evaluate the potential for a reversal of previous impairments recorded in fourth quarter 2014.
| | | | |
| BARRICK FIRST QUARTER 2015 | | 48 | | MANAGEMENT’S DISCUSSION AND ANALYSIS |
NON-GAAP FINANCIAL PERFORMANCE MEASURES
We use certain non-GAAP financial performance measures in our MD&A. For a detailed description of each of the non-GAAP measures used in this MD&A, please refer to the Non-GAAP Financial Performance Measures in our 2014 annual MD&A. The non-GAAP financial performance measures set out in this MD&A are intended to provide additional information to investors and do not have any standardized definition under IFRS and should not be considered in isolation or as a substitute for measures of performance prepared in accordance with IFRS.
Starting with this MD&A, we have amended our calculation of cash costs to exclude hedge gains/losses in the individual mine site figures. Hedge
gains/losses will be included in the consolidated company cash costs, but are not allocated because hedging is done at a corporate level and not within the control of the mine site. Comparative figures have been restated to reflect this change.
Also starting with this MD&A, we have begun including costs that were formerly part of operating segment administration costs in cash costs. This was done to reflect the change in our operating structure that occurred at the end of 2014 to remove all regional oversight and have the mine sites directly accountable for the cost of the functional services they require to run their business.
Reconciliation of Net Earnings to Adjusted Net Earnings and Adjusted Net Earnings per Share1
| | | | | | | | |
| ($ millions, except per share amounts in dollars) | | For the three months ended March 31 | |
| | | 2015 | | | 2014 | |
Net earnings (loss) attributable to equity holders of the Company | | | $ 57 | | | | $ 88 | |
| | |
Impairment charges related to intangibles, goodwill, property, plant and equipment, and investments | | | 3 | | | | 11 | |
| | |
Acquisition/disposition (gains)/losses | | | (22) | | | | 1 | |
| | |
Foreign currency translation (gains)/losses | | | 6 | | | | 113 | |
| | |
Other expense adjustments | | | 18 | | | | 43 | |
| | |
Unrealized losses/(gains) on non-hedge derivative instruments | | | - | | | | (18) | |
| | | |
Adjusted net earnings | | | $ 62 | | | | $ 238 | |
| | |
Net earnings (loss) per share2 | | | $0.05 | | | | $0.08 | |
| | |
Adjusted net earnings per share2 | | | $0.05 | | | | $0.20 | |
| | 1 | Amounts presented in this table are after-tax and net of non-controlling interest. |
| | 2 | Calculated using weighted average number of shares outstanding under the basic method of earnings per share. |
Reconciliation of Operating Cash Flow to Free Cash Flow
| | | | | | | | |
| ($ millions) | | For the three months ended March 31 | |
| | | 2015 | | | 2014 | |
| | |
Operating cash flow | | | $ 316 | | | | $ 585 | |
| | |
Capital expenditures | | | (514) | | | | (616) | |
| | | |
Free cash flow | | | ($ 198) | | | | ($ 31) | |
| | | | |
| BARRICK FIRST QUARTER 2015 | | 49 | | MANAGEMENT’S DISCUSSION AND ANALYSIS |
Reconciliation of Gold Cost of Sales to Cash costs per ounce, All-in sustaining costs per ounce and All-in costs per ounce
| | | | | | | | |
| ($ millions, except per ounce information in dollars) | | | | For the three months ended March 31 |
| | | | | Reference | | 2015 | | 2014 |
| | Cost of sales | | A | | $ 1,424 | | $ 1,444 |
| | Cost of sales applicable to non-controlling interests1 | | B | | (158) | | (130) |
| | Cost of sales applicable to power sales | | C | | (13) | | (13) |
| | Other metal sales | | D | | (39) | | (32) |
| | Realized non-hedge gains/losses on fuel hedges | | E | | - | | (4) |
| | Treatment and refinement charges | | F | | 3 | | 1 |
| | Total production costs | | | | $ 1,217 | | $ 1,266 |
| | Depreciation | | G | | ($ 328) | | ($ 316) |
| | Cash Costs | | | | $ 889 | | $ 950 |
| | General & administrative costs | | H | | 55 | | 87 |
| | Rehabilitation - accretion and amortization (operating sites) | | I | | 35 | | 35 |
| | Mine on-site exploration and evaluation costs | | J | | 6 | | 2 |
| | Mine development expenditures2 | | K | | 166 | | 189 |
| | Sustaining capital expenditures2 | | K | | 133 | | 93 |
| | All-in sustaining costs | | | | $ 1,284 | | $ 1,356 |
| | Community relations costs not related to current operations | | L | | 3 | | 5 |
| | Rehabilitation - accretion and amortization not related to current operations | | I | | 2 | | 3 |
| | Exploration and evaluation costs (non-sustaining) | | J | | 35 | | 28 |
| | Non-sustaining capital expenditures2 | | | | | | |
| | Pascua-Lama | | K | | 4 | | 43 |
| | Cortez | | K | | 12 | | 6 |
| | Goldstrike thiosulfate project | | K | | 29 | | 63 |
| | Bulyanhulu CIL | | K | | 1 | | 10 |
| | Hemlo | | K | | 37 | | - |
| | Other | | K | | 11 | | 3 |
| | All-in costs | | | | $ 1,418 | | $ 1,517 |
| | Ounces sold - consolidated basis (000s ounces) | | | | 1,584 | | 1,772 |
| | Ounces sold - non-controlling interest (000s ounces)1 | | | | (199) | | (154) |
| | Ounces sold - equity basis (000s ounces) | | | | 1,385 | | 1,618 |
| | Total production costs per ounce3 | | | | $ 879 | | $ 782 |
| | Cash costs per ounce3 | | | | $ 642 | | $ 587 |
| | Cash costs per ounce (on a co-product basis)3,4 | | | | $ 671 | | $ 610 |
| | All-in sustaining costs per ounce3 | | | | $ 927 | | $ 838 |
| | �� All-in sustaining costs per ounce (on a co-product basis)3,4 | | | | $ 956 | | $ 861 |
| | All-in costs per ounce3 | | | | $ 1,024 | | $ 938 |
| | All-in costs per ounce (on a co-product basis)3,4 | | | | $ 1,053 | | $ 961 |
| | 1 | Relates to interest in Pueblo Viejo and Acacia held by outside shareholders. |
| | 2 | Amounts represent our share of capital expenditures. |
| | 3 | Total production costs, cash costs, all-in sustaining costs, and all-in costs per ounce may not calculate based on amounts presented in this table due to rounding. |
| | 4 | Amounts presented on a co-product basis remove the impact of other metal sales (net of non-controlling interest) from cost per ounce calculations that are produced as a by-product of our gold production. |
| | | | |
| BARRICK FIRST QUARTER 2015 | | 50 | | MANAGEMENT’S DISCUSSION AND ANALYSIS |
| | | | | | | | | | |
| |
| ($ millions, except per ounce information in dollars) | | For the three months ended March 31 | |
| | | | |
| | | | | 2015 | | | 2014 | |
| | | |
| | References | | | | | | | | |
| | | |
A | | Cost of sales - gold | | | | | | | | |
| | | |
| | Cost of sales (statement of income) | | | $ 1,708 | | | | $ 1,719 | |
| | | |
| | Less: cost of sales - copper | | | (251) | | | | (255) | |
| | | |
| | Direct mining, royalties and community relations (Note 5) | | | 214 | | | | 216 | |
| | | |
| | Depreciation (Note 5) | | | 37 | | | | 42 | |
| | | |
| | Hedge gains | | | - | | | | (3) | |
| | | |
| | Less: cost of sales - non-operating sites | | | (2) | | | | (2) | |
| | | |
| | Less: cost of sales - corporate | | | (31) | | | | (18) | |
| | | |
| | Total Cost of Sales - Gold | | | $ 1,424 | | | | 1,444 | |
| | | |
B | | Cost of sales applicable to non-controlling interests | | | | | | | | |
| | | |
| | Cost of sales applicable to Acacia (Note 5) | | | | | | | | |
| | | |
| | Direct mining, royalties and community relations | | | $ 141 | | | | $ 132 | |
| | | |
| | Depreciation | | | 33 | | | | 30 | |
| | | |
| | Total related to Acacia | | | $ 174 | | | | $ 162 | |
| | | |
| | Portion attributable to non-controlling interest | | | $ 61 | | | | $ 46 | |
| | | |
| | Cost of sales applicable to Pueblo Viejo (Note 5) | | | | | | | | |
| | | |
| | Direct mining, royalties and community relations (including hedges) | | | $ 162 | | | | $ 169 | |
| | | |
| | Depreciation | | | 69 | | | | 54 | |
| | | |
| | Total related to Pueblo Viejo | | | $ 231 | | | | $ 223 | |
| | | |
| | Portion attributable to non-controlling interest | | | $97 | | | | $84 | |
| | | |
| | Cost of sales applicable to non-controlling interests | | | $ 158 | | | | $ 130 | |
| | | |
C | | Cost of sales applicable to power sales | | | | | | | | |
| |
| | Equal to the cost of sales related to power sales from our Pueblo Viejo mine that are included in consolidated costs of sales but excluded from cash costs. These figures cannot be tied directly to the financial statements or notes. | |
| | | |
D | | Other metal sales | | | | | | | | |
| |
| | By-product revenues from metals produced in conjunction with gold are deducted from the costs incurred to produce gold (Note 6). By product revenues from metals produced net of copper and non-controlling interest for the three months ended March 31, 2015 were $23 million (2014: $22 million). | |
| | | |
E | | Realized non-hedge gains/losses on fuel hedges | | | | | | | | |
| | | |
| | Fuel hedge (gains)/losses (Note 17D) | | | $- | | | | ($ 14) | |
| | | |
| | Less: unrealized (gains)/losses | | | - | | | | 10 | |
| | | |
| | Realized non-hedge (gains)/losses on fuel hedges1 | | | $- | | | | ($ 4) | |
| | | |
| | 1 In 2015, these amounts are included in cost of sales. | | | | | | | | |
| | | |
F | | Treatment and refinement charges | | | | | | | | |
| |
| | Treatment and refinement charges, which are recorded against concentrate revenues, for the three months ended March 31, 2015 were $3 million (2013: $1 million). | |
| | | | |
| BARRICK FIRST QUARTER 2015 | | 51 | | MANAGEMENT’S DISCUSSION AND ANALYSIS |
| | | | | | | | | | |
| ($ millions, except per ounce information in dollars) | | For the three months ended March 31 | |
| | | | | 2015 | | | 2014 | |
| | | |
G | | Depreciation - gold | | | | | | | | |
| | | |
| | Depreciation (Note 7) | | | $ 421 | | | | $ 402 | |
| | | |
| | Less: copper depreciation (Note 5) | | | (37) | | | | (42) | |
| | | |
| | Less: NCI portion | | | (45) | | | | (28) | |
| | | |
| | Less: Depreciation - corporate assets | | | (11) | | | | (16) | |
| | | |
| | Total depreciation - gold | | | $ 328 | | | | $ 316 | |
| | | |
H | | General & administrative costs | | | | | | | | |
| | | |
| | Total general & administrative costs (statement of income) | | | $ 67 | | | | $ 103 | |
| | | |
| | Less: non-gold and non-operating general & administrative costs | | | (7) | | | | (13) | |
| | | |
| | Less: NCI portion | | | (4) | | | | (3) | |
| | | |
| | Add: World Gold Council fees | | | - | | | | 1 | |
| | | |
| | Less: non-recurring items1 | | | (1) | | | | (1) | |
| | | |
| | Total general & administrative costs | | | $ 55 | | | | $ 87 | |
| | | |
I | | Rehabilitation - accretion and amortization | | | | | | | | |
| |
| | Includes depreciation (Note 7) on the assets related to rehabilitation provisions of our gold operations of $23 million for the three months ended March 31, 2015 (2014: $19 million) and accretion (Note 12) on the rehabilitation provision of our gold operations of $14 million for the three months ended March 31, 2015, respectively (2014: $19 million). | |
| | | |
J | | Exploration and evaluation costs | | | | | | | | |
| | | |
| | Exploration and evaluation costs (Note 8) | | | $ 45 | | | | $ 32 | |
| | | |
| | Less: exploration and evaluation costs - non-gold & NCI | | | (4) | | | | (2) | |
| | | |
| | Total exploration and evaluation costs - gold | | | $ 41 | | | | $ 30 | |
| | | |
| | Exploration & evaluation costs (sustaining) | | | 6 | | | | 2 | |
| | | |
| | Exploration and evaluation costs (non-sustaining) | | | 35 | | | | 28 | |
| | | |
| | Total exploration and evaluation costs - gold | | | $ 41 | | | | $ 30 | |
| | | |
K | | Capital expenditures | | | | | | | | |
| | | |
| | Gold segments (Note 5) | | | $ 423 | | | | $ 396 | |
| | | |
| | Pascua-Lama operating unit (Note 5) | | | 4 | | | | 43 | |
| | | |
| | Other gold projects | | | 2 | | | | 2 | |
| | | |
| | Capital expenditures - gold | | | $ 429 | | | | $ 441 | |
| | | |
| | Less: NCI portion | | | (27) | | | | (27) | |
| | | |
| | Less: capitalized interest (Note 11) | | | (9) | | | | (7) | |
| | | |
| | Total capital expenditures - gold | | | $ 393 | | | | $ 407 | |
| | | |
| | Mine development expenditures | | | 166 | | | | 189 | |
| | | |
| | Sustaining capital expenditures | | | 133 | | | | 93 | |
| | | |
| | Non-sustaining capital expenditures | | | 94 | | | | 125 | |
| | | |
| | Total capital expenditures - gold | | | $ 393 | | | | $ 407 | |
| | | |
L | | Community relations costs | | | | | | | | |
| | | |
| | Community relations costs (Note 7) | | | $ 11 | | | | $ 14 | |
| | | |
| | Less: community relations costs relating to current operations | | | (8) | | | | (9) | |
| | | |
| | Community relations costs not related to current operations | | | $ 3 | | | | $ 5 | |
| | | | |
| BARRICK FIRST QUARTER 2015 | | 52 | | MANAGEMENT’S DISCUSSION AND ANALYSIS |
Reconciliation of Copper Cost of Sales to C1 cash costs per pound and C3 fully allocated costs per pound
| | | | | | | | |
| ($ millions, except per pound information in dollars) | | For the three months ended March 31 | |
| | | 2015 | | | 2014 | |
Cost of sales | | | $ 251 | | | | $ 255 | |
Depreciation/amortization | | | (37) | | | | (42) | |
Treatment and refinement charges | | | 42 | | | | 33 | |
Less: royalties | | | (34) | | | | (11) | |
Non-routine charges | | | - | | | | 1 | |
Other | | | 1 | | | | (3) | |
C1 cash cost of sales | | | $ 223 | | | | $ 233 | |
Depreciation/amortization | | | 37 | | | | 42 | |
Royalties | | | 34 | | | | 11 | |
Non-routine charges | | | - | | | | (1) | |
Other expense (income) | | | (8) | | | | 7 | |
C3 fully allocated cost of sales | | | $ 286 | | | | $ 292 | |
Pounds sold - consolidated basis (millions pounds) | | | 121 | | | | 111 | |
C1 cash cost per pound1 | | | $ 1.84 | | | | $ 2.11 | |
C3 fully allocated cost per pound1 | | | $ 2.35 | | | | $ 2.64 | |
| | 1 | C1 cash costs per pound and C3 fully allocated costs may not calculate based on amounts presented in this table due to rounding. |
EBITDA and Adjusted EBITDA
| | | | | | | | |
($ millions, except per share amounts in dollars) | | For the three months ended March 31 | |
| | | 2015 | | | 2014 | |
| | |
Net earnings (loss) | | | $ 89 | | | | $ 127 | |
| | |
Income tax expense | | | $ 105 | | | | 289 | |
| | |
Finance costs | | | $ 180 | | | | 180 | |
| | |
Finance income | | | $ (2) | | | | (3) | |
| | |
Depreciation | | | $ 421 | | | | 402 | |
| | |
EBITDA | | | $ 793 | | | | $ 995 | |
| | |
Impairment charges | | | $ 5 | | | | 12 | |
| | | |
Adjusted EBITDA | | | $ 798 | | | | $ 1,007 | |
| | |
Reported as: | | | | | | | | |
| | |
Cortez | | | $ 61 | | | | $ 171 | |
| | |
Goldstrike | | | $ 118 | | | | $ 195 | |
| | |
Pueblo Viejo | | | $ 206 | | | | $ 237 | |
| | |
Lagunas Norte | | | $ 145 | | | | $ 142 | |
| | |
Veladero | | | $ 99 | | | | $ 88 | |
| | |
Turquoise Ridge | | | $ 29 | | | | $ 50 | |
| | |
Porgera | | | $ 50 | | | | $ 38 | |
| | |
Kalgoorlie | | | $ 18 | | | | $ 40 | |
| | |
Acacia | | | $ 66 | | | | $ 76 | |
| | |
Copper | | | 52 | | | | 78 | |
| | |
Other | | | (46) | | | | (108) | |
| | |
Impairment charges | | | (5) | | | | (12) | |
| | |
EBITDA | | | $ 793 | | | | $ 995 | |
| | |
Impairment charges | | | $ 5 | | | | $ 12 | |
| | | |
Adjusted EBITDA | | | $ 798 | | | | $ 1,007 | |
| | | | |
| BARRICK FIRST QUARTER 2015 | | 53 | | MANAGEMENT’S DISCUSSION AND ANALYSIS |
Reconciliation of Sales to Realized Price per ounce/pound
| | | | | | | | | | | | | | | | |
| | | For the three months ended March 31 | |
| | | |
| ($ millions, except per ounce/pound information in dollars) | | Gold | | | Copper | |
| | | | |
| | | 2015 | | | 2014 | | | 2015 | | | 2014 | |
| | | | |
Sales | | | $ 1,919 | | | | $ 2,279 | | | | $ 267 | | | | $ 305 | |
| | | | |
Sales applicable to non-controlling interests | | | (243) | | | | (211) | | | | - | | | | - | |
| | | | |
Realized non-hedge gold/copper derivative (losses) gains | | | - | | | | - | | | | - | | | | (3) | |
| | | | |
Treatment and refinement charges | | | 3 | | | | 1 | | | | 42 | | | | 33 | |
| | | | |
Export duties | | | 10 | | | | 10 | | | | - | | | | - | |
| | | | | |
Revenues - as adjusted | | | $ 1,689 | | | | $ 2,079 | | | | $ 309 | | | | $ 335 | |
| | | | |
Ounces/pounds sold (000s ounces/millions pounds) | | | 1,385 | | | | 1,618 | | | | 121 | | | | 111 | |
| | | | | |
Realized gold/copper price per ounce/pound1 | | | $ 1,219 | | | | $ 1,285 | | | | $ 2.55 | | | | $ 3.03 | |
| | 1 | Realized price per ounce/pound may not calculate based on amounts presented in this table due to rounding. |
| | | | |
| BARRICK FIRST QUARTER 2015 | | 54 | | MANAGEMENT’S DISCUSSION AND ANALYSIS |
Consolidated Statements of Income
| | | | | | | | |
Barrick Gold Corporation (in millions of United States dollars, except per share data) (Unaudited) | | Three months ended March 31, | |
| | | 2015 | | | 2014 | |
| | |
Revenue (notes 5 and 6) | | $ | 2,245 | | | $ | 2,647 | |
Costs and expenses (income) | | | | | | | | |
| | |
Cost of sales (notes 5 and 7) | | | 1,708 | | | | 1,719 | |
| | |
General and administrative expenses | | | 67 | | | | 103 | |
| | |
Exploration, evaluation and project expenses (note 8) | | | 86 | | | | 100 | |
| | |
Impairment charges (note 10B) | | | 5 | | | | 12 | |
| | |
(Gain) loss on currency translation | | | (2) | | | | 79 | |
| | |
Closed mine rehabilitation | | | 8 | | | | 22 | |
| | |
Loss (gain) on non-hedge derivatives (note 17D) | | | 3 | | | | (21) | |
| | |
Other (income) expense (note 10A) | | | (18) | | | | 19 | |
Income before finance items and income taxes | | $ | 388 | | | $ | 614 | |
| | |
Finance items | | | | | | | | |
| | |
Finance income | | | 2 | | | | 3 | |
| | |
Finance costs (note 11) | | | (196) | | | | (201) | |
| | |
Income before income taxes | | $ | 194 | | | $ | 416 | |
| | |
Income tax expense (note 12) | | | (105) | | | | (289) | |
| | | |
Net income | | $ | 89 | | | $ | 127 | |
| | |
Attributable to: | | | | | | | | |
| | |
Equity holders of Barrick Gold Corporation | | $ | 57 | | | $ | 88 | |
| | |
Non-controlling interests (note 20) | | $ | 32 | | | $ | 39 | |
| | |
Earnings per share data attributable to the equity holders of Barrick Gold Corporation (note 9) | | | | | | | | |
| | |
Net income | | | | | | | | |
| | |
Basic | | $ | 0.05 | | | $ | 0.08 | |
| | |
Diluted | | $ | 0.05 | | | $ | 0.08 | |
The accompanying notes are an integral part of these consolidated financial statements.
| | | | |
| BARRICK FIRST QUARTER 2015 | | 55 | | FINANCIAL STATEMENTS (UNAUDITED) |
Consolidated Statements of Comprehensive Income
| | | | | | | | |
Barrick Gold Corporation (in millions of United States dollars) (Unaudited) | | Three months ended March 31, | |
| | | 2015 | | | 2014 | |
Net income | | | $ 89 | | | | $ 127 | |
| | |
Other comprehensive income (loss), net of taxes | | | | | | | | |
| | |
Movement in equity investments fair value reserve: | | | | | | | | |
Net unrealized change on equity investments, net of tax $nil and $nil | | | (5) | | | | 17 | |
Net realized change on equity investments, net of tax $nil and $nil | | | 17 | | | | 4 | |
Impairment losses on equity investments, net of tax $nil and $nil | | | - | | | | 2 | |
| | |
Items that may be reclassified subsequently to profit or loss: | | | | | | | | |
Unrealized gains (losses) on derivatives designated as cash flow hedges, net of tax $14 and $4 | | | (57) | | | | 17 | |
Realized (gains) losses on derivatives designated as cash flow hedges, net of tax ($1) and ($2) | | | 15 | | | | (25) | |
Currency translation adjustments, net of tax $nil and $nil | | | (32) | | | | 3 | |
Total other comprehensive income (loss) | | | (62) | | | | 18 | |
Total comprehensive income | | | $ 27 | | | | $ 145 | |
Attributable to: | | | | | | | | |
Equity holders of Barrick Gold Corporation | | | $ (5) | | | | $ 106 | |
| | |
Non-controlling interests | | | $ 32 | | | | $ 39 | |
The accompanying notes are an integral part of these consolidated financial statements.
| | | | |
| BARRICK FIRST QUARTER 2015 | | 56 | | FINANCIAL STATEMENTS (UNAUDITED) |
Consolidated Statements of Cash Flow
| | | | | | | | |
Barrick Gold Corporation (in millions of United States dollars) (Unaudited) | | Three months ended March 31, | |
| | | 2015 | | | 2014 | |
OPERATING ACTIVITIES | | | | | | | | |
Net income | | $ | 89 | | | $ | 127 | |
Adjusted for the following items: | | | | | | | | |
Depreciation | | | 421 | | | | 402 | |
Finance costs | | | 196 | | | | 201 | |
Impairment charges (note 10B) | | | 5 | | | | 12 | |
Income tax expense (note 12) | | | 105 | | | | 289 | |
(Increase) decrease in inventory | | | (24) | | | | 42 | |
Loss (gain) on non-hedge derivatives | | | 3 | | | | (21) | |
Gain on sale of long-lived assets | | | (24) | | | | (1) | |
Other operating activities (note 13A) | | | (209) | | | | (241) | |
Operating cash flows before interest and income taxes | | | 562 | | | | 810 | |
Interest paid | | | (75) | | | | (76) | |
Income taxes paid | | | (171) | | | | (149) | |
Net cash provided by operating activities | | | 316 | | | | 585 | |
INVESTING ACTIVITIES | | | | | | | | |
Property, plant and equipment | | | | | | | | |
Capital expenditures (note 5) | | | (514) | | | | (616) | |
Sales proceeds | | | 12 | | | | 35 | |
Divestitures | | | 2 | | | | 80 | |
Investments sales | | | 33 | | | | 25 | |
Other investing activities (note 13B) | | | (1) | | | | (40) | |
Net cash used in investing activities | | | (468) | | | | (516) | |
FINANCING ACTIVITIES | | | | | | | | |
Proceeds from divestment of 10% of issued ordinary share capital of Acacia | | | - | | | | 186 | |
Debt | | | | | | | | |
Proceeds | | | 2 | | | | 133 | |
Repayments | | | (184) | | | | (75) | |
Dividends | | | (58) | | | | (58) | |
Funding from non-controlling interests | | | 1 | | | | 2 | |
Disbursements to non-controlling interests | | | (44) | | | | - | |
Net cash (used in) provided by financing activities | | | (283) | | | | 188 | |
Effect of exchange rate changes on cash and equivalents | | | (6) | | | | (5) | |
Net (decrease) increase in cash and equivalents | | | (441) | | | | 252 | |
Cash and equivalents excluding assets classified as held for sale at the beginning of period | | | 2,699 | | | | 2,404 | |
Add: cash and equivalents of assets classified as held for sale at the beginning of period | | | - | | | | 20 | |
Cash and equivalents at the end of period | | $ | 2,258 | | | $ | 2,676 | |
Less: cash and equivalents of assets classified as held for sale at the end of period | | | - | | | | 4 | |
Cash and equivalents excluding assets classified as held for sale at the end of period | | $ | 2,258 | | | $ | 2,672 | |
The accompanying notes are an integral part of these consolidated financial statements.
| | | | |
| BARRICK FIRST QUARTER 2015 | | 57 | | FINANCIAL STATEMENTS (UNAUDITED) |
Consolidated Balance Sheets
| | | | | | | | |
| Barrick Gold Corporation | | | | | | |
(in millions of United States dollars) (Unaudited) | | | As at March 31, | | | | As at December 31, | |
| | | | 2015 | | | | 2014 | |
ASSETS | | | | | | | | |
Current assets | | | | | | | | |
Cash and equivalents (note 17A) | | $ | 2,258 | | | $ | 2,699 | |
Accounts receivable | | | 416 | | | | 418 | |
Inventories (note 15) | | | 2,710 | | | | 2,722 | |
Other current assets | | | 366 | | | | 311 | |
Total current assets | | $ | 5,750 | | | $ | 6,150 | |
Non-current assets | | | | | | | | |
Equity in investees (note 14) | | | 207 | | | | 206 | |
Other investments | | | 13 | | | | 35 | |
Property, plant and equipment (note 16) | | | 19,281 | | | | 19,193 | |
Goodwill | | | 4,426 | | | | 4,426 | |
Intangible assets | | | 306 | | | | 308 | |
Deferred income tax assets | | | 683 | | | | 674 | |
Non-current portion of inventory (note 15) | | | 1,664 | | | | 1,684 | |
Other assets | | | 1,187 | | | | 1,203 | |
Total assets | | $ | 33,517 | | | $ | 33,879 | |
LIABILITIES AND EQUITY | | | | | | | | |
Current liabilities | | | | | | | | |
Accounts payable | | $ | 1,506 | | | $ | 1,653 | |
Debt (note 17B) | | | 298 | | | | 333 | |
Current income tax liabilities | | | 29 | | | | 84 | |
Other current liabilities | | | 494 | | | | 490 | |
Total current liabilities | | $ | 2,327 | | | $ | 2,560 | |
Non-current liabilities | | | | | | | | |
Debt (note 17B) | | | 12,605 | | | | 12,748 | |
Provisions | | | 2,618 | | | | 2,561 | |
Deferred income tax liabilities | | | 2,033 | | | | 2,036 | |
Other liabilities | | | 1,145 | | | | 1,112 | |
Total liabilities | | $ | 20,728 | | | $ | 21,017 | |
Equity | | | | | | | | |
Capital stock (note 19) | | | 20,865 | | | | 20,864 | |
Deficit | | | (10,641) | | | | (10,739) | |
Accumulated other comprehensive loss | | | (360) | | | | (199) | |
Other | | | 321 | | | | 321 | |
Total equity attributable to Barrick Gold Corporation shareholders | | $ | 10,185 | | | $ | 10,247 | |
Non-controlling interests (note 20) | | | 2,604 | | | | 2,615 | |
Total equity | | $ | 12,789 | | | $ | 12,862 | |
Contingencies and commitments (notes 15, 16 and 21) | | | | | | | | |
Total liabilities and equity | | $ | 33,517 | | | $ | 33,879 | |
The accompanying notes are an integral part of these consolidated financial statements.
| | | | |
| BARRICK FIRST QUARTER 2015 | | 58 | | FINANCIAL STATEMENTS (UNAUDITED) |
Consolidated Statements of Changes in Equity
| | | | | | | | | | | | | | | | | | | | | | | | | | | | | | | | |
| Barrick Gold Corporation | | | | | Attributable to equity holders of the company | | | | | | | |
| (in millions of United States dollars) (Unaudited) | | Common Shares
(in thousands) | | | Capital stock | | | Retained
deficit | | | Accumulated
other
comprehensive
income (loss)1 | | | Other2 | | | Total equity
attributable to
shareholders | | | Non-
controlling
interests | | | Total equity | |
At December 31, 2014 | | | 1,164,670 | | | $ | 20,864 | | | $ | (10,739) | | | $ | (199) | | | $ | 321 | | | $ | 10,247 | | | $ | 2,615 | | | $ | 12,862 | |
Impact of adopting IFRS 9 on January 1, 2015 (note 2B) | | | - | | | | - | | | | 99 | | | | (99) | | | | - | | | | - | | | | - | | | | - | |
At January 1, 2015 (restated) | | | 1,164,670 | | | $ | 20,864 | | | $ | (10,640) | | | $ | (298) | | | $ | 321 | | | $ | 10,247 | | | $ | 2,615 | | | $ | 12,862 | |
Net income | | | - | | | | - | | | | 57 | | | | - | | | | - | | | | 57 | | | | 32 | | | | 89 | |
Total other comprehensive loss | | | - | | | | - | | | | - | | | | (62) | | | | - | | | | (62) | | | | - | | | | (62) | |
Total comprehensive (loss) income | | | - | | | | - | | | | 57 | | | | (62) | | | | - | | | | (5) | | | | 32 | | | | 27 | |
Transactions with owners | | | | | | | | | | | | | | | | | | | | | | | | | | | | | | | | |
Dividends | | | - | | | | - | | | | (58) | | | | - | | | | - | | | | (58) | | | | - | | | | (58) | |
Recognition of stock option expense | | | - | | | | 1 | | | | - | | | | - | | | | - | | | | 1 | | | | - | | | | 1 | |
Funding from non-controlling interests | | | - | | | | - | | | | - | | | | - | | | | - | | | | - | | | | 1 | | | | 1 | |
Other decrease in non-controlling interest | | | - | | | | - | | | | - | | | | - | | | | - | | | | - | | | | (44) | | | | (44) | |
Total transactions with owners | | | - | | | | 1 | | | | (58) | | | | - | | | | - | | | | (57) | | | | (43) | | | | (100) | |
At March 31, 2015 | | | 1,164,670 | | | $ | 20,865 | | | $ | (10,641) | | | $ | (360) | | | $ | 321 | | | $ | 10,185 | | | $ | 2,604 | | | $ | 12,789 | |
| | | | | | | | | | | | | | | | | | | | | | | | | | | | | | | | |
At January 1, 2014 | | | 1,164,652 | | | $ | 20,869 | | | $ | (7,581) | | | $ | (69) | | | $ | 314 | | | $ | 13,533 | | | $ | 2,468 | | | $ | 16,001 | |
Net income | | | - | | | | - | | | | 88 | | | | - | | | | - | | | | 88 | | | | 39 | | | | 127 | |
Total other comprehensive income | | | - | | | | - | | | | - | | | | 18 | | | | - | | | | 18 | | | | - | | | | 18 | |
Total comprehensive income | | | - | | | | - | | | | 88 | | | | 18 | | | | - | | | | 106 | | | | 39 | | | | 145 | |
Transactions with owners | | | | | | | | | | | | | | | | | | | | | | | | | | | | | | | | |
Dividends | | | - | | | | - | | | | (58) | | | | - | | | | - | | | | (58) | | | | - | | | | (58) | |
Issued on exercise of stock options | | | 18 | | | | - | | | | - | | | | - | | | | - | | | | - | | | | - | | | | - | |
Recognized on divestment of 10% of Acacia | | | - | | | | - | | | | - | | | | - | | | | 7 | | | | 7 | | | | 179 | | | | 186 | |
Other increase in non-controlling interests | | | - | | | | - | | | | - | | | | - | | | | - | | | | - | | | | 2 | | | | 2 | |
Total transactions with owners | | | 18 | | | | - | | | | (58) | | | | - | | | | 7 | | | | (51) | | | | 181 | | | | 130 | |
At March 31, 2014 | | | 1,164,670 | | | $ | 20,869 | | | $ | (7,551) | | | $ | (51) | | | $ | 321 | | | $ | 13,588 | | | $ | 2,688 | | | $ | 16,276 | |
1 Includes cumulative translation losses at March 31, 2015: $154 million (March 31, 2014: losses of $79 million).
2 Includes additional paid-in capital as at March 31, 2015: $283 million (December 31, 2014: $283 million; March 31, 2014: $283 million) and convertible borrowings - equity component as at March 31, 2015: $38 million (December 31, 2014: $38 million; March 31, 2014: $38 million).
The accompanying notes are an integral part of these consolidated financial statements.
| | | | |
| BARRICK FIRST QUARTER 2015 | | 59 | | FINANCIAL STATEMENTS (UNAUDITED) |
NOTES TO CONSOLIDATED
FINANCIAL STATEMENTS
Barrick Gold Corporation. Tabular dollar amounts in millions of United States dollars, unless otherwise shown. References to A$, ARS, C$, CLP, DOP, EUR, GBP, JPY, PGK, SAR, TZS, ZAR, and ZMW are to Australian dollars, Argentine pesos, Canadian dollars, Chilean pesos, Dominican pesos, Euros, British pound sterling, Japanese yen, Papua New Guinea kina, Saudi riyal, Tanzanian shillings, South African rand, and Zambian kwacha, respectively.
1 > CORPORATE INFORMATION
Barrick Gold Corporation (“Barrick” or the “Company”) is a corporation governed by the Business Corporations Act (Ontario). The Company’s head and registered office is located at Brookfield Place, TD Canada Trust Tower, 161 Bay Street, Suite 3700, Toronto, Ontario, M5J 2S1. We are principally engaged in the production and sale of gold and copper, as well as related activities such as exploration and mine development. Our producing gold mines are located in Canada, the United States, Peru, Argentina, Australia, Dominican Republic and Papua New Guinea. We also hold a 63.9% equity interest in Acacia Mining plc (“Acacia”), a company listed on the London Stock Exchange that owns gold mines and exploration properties in Africa. Our Copper business contains producing copper mines located in Chile and Zambia and a mine under construction in Saudi Arabia. We also have projects located in South America and North America. We sell our gold and copper production into the world market.
2 > SIGNIFICANT ACCOUNTING POLICIES
| A) | Statement of Compliance |
These condensed interim consolidated financial statements have been prepared in accordance with International Accounting Standard 34Interim Financial Reporting (“IAS 34”) as issued by the International Accounting Standards Board (“IASB”). These interim financial statements should be read in conjunction with Barrick’s most recently issued Annual Report which includes information necessary or useful to understanding the Company’s business and financial statement presentation. In particular, the Company’s significant accounting policies were presented in Note 2 of the consolidated financial statements for the year ended December 31, 2014, and have been consistently applied in the preparation of these interim financial statements except for note 2J, “Other Investments”, which as a result of the adoption of IFRS 9 in the current interim period has been replaced with the following: Investments in
publicly quoted equity securities that are neither subsidiaries nor associates are categorized as Fair Value through Other Comprehensive Income (“FVOCI”) using the irrevocable election available in IFRS 9 for these instruments. FVOCI equity investments (referred to as “Other Investments”) are recorded at fair value with all realized and unrealized gains and losses recorded permanently in OCI. These interim consolidated financial statements were authorized for issuance by the Board of Directors on April 27, 2015.
| B) | New Accounting Standards Effective in 2015 |
Impact of Adoption of IFRS 9 (2014)
We have early adopted all of the requirements of IFRS 9 Financial Instruments 2014 (“IFRS 9”) as of January 1, 2015. IFRS 9 uses a single approach to determine whether a financial asset is classified and measured at amortized cost or fair value, replacing the multiple rules in IAS 39. The approach in IFRS 9 is based on how an entity manages its financial instruments and the contractual cash flow characteristics of the financial asset. Most of the requirements in IAS 39 for classification and measurement of financial liabilities were carried forward in IFRS 9. IFRS 9 introduced a single expected credit loss impairment model, which is based on changes in credit quality since initial recognition. The adoption of the expected credit loss impairment model did not have a significant impact on the company’s financial statements.
IFRS 9 changes the requirements for hedge effectiveness and, consequently for the application of hedge accounting. The IAS 39 effectiveness test is replaced with a requirement for an economic relationship between the hedged item and hedging instrument, and for the ‘hedged ratio’ to be the same as that used by the entity for risk management purposes. Certain restrictions that prevented some hedging strategies and hedging instruments from qualifying for hedge accounting were removed under IFRS 9. Generally, the mechanics of hedge accounting remain unchanged.
As a result of the early adoption of IFRS 9, we have changed our accounting policy for financial instruments retrospectively, except as described below. The change did not result in a change in carrying value of any of our financial instruments on transition date. The two main areas of change are the accounting for a) equity securities previously classified as available for sale and b) derivative
| | | | |
| BARRICK FIRST QUARTER 2015 | | 60 | | NOTES TO FINANCIAL STATEMENTS (UNAUDITED) |
instruments, which includes the accounting for hedging relationships that now qualify for hedge accounting and the exclusion of the time value component of options from hedging instruments.
| a) | Impact of adoption on the accounting for equity securities previously designated as available for sale |
The revised policy on the accounting for Other Investments, which represent equity securities previously designated as available for sale, is described in note 2A). The adjustment to opening retained earnings on January 1, 2015 was $95 million with a corresponding adjustment to accumulated other comprehensive income. There was no impact on net income for the quarter.
| b) | Impact of adoption on accounting for derivative instruments |
We have reassessed all of our existing hedging relationships that qualified for hedge accounting under IAS 39 upon adoption of IFRS 9 and these have continued to qualify for hedge accounting under IFRS 9. We have also reassessed economic hedges that did not qualify for hedge accounting under IAS 39. IFRS 9 has enabled us to apply hedge accounting for most of our fuel positions, thus reducing the volatility of reported net income. These positions previously did not qualify for hedge accounting since component hedging was not permitted under IAS 39. We have applied these changes prospectively from January 1, 2015.
Under IFRS 9, we also began separating the intrinsic value and time value of option contracts and designating only the change in intrinsic value as the hedging instrument. IFRS 9 does not require restatement of comparatives. However, we have reflected the retrospective impact of the adoption of IFRS 9 relating to the change in accounting for time value of option contracts as an adjustment to opening retained earnings. The adjustment to opening retained earnings on January 1, 2015 was $4 million with a corresponding adjustment to accumulated other comprehensive income. There was no impact on net income.
We recognize a financial asset or a financial liability when we become a party to the contractual provisions of the instrument. Financial assets are initially measured at fair value and are derecognized either when we have transferred substantially all the risks and rewards of ownership of the financial asset or when cash flows expire.
We classify and measure financial assets (excluding derivatives) on initial recognition as described below:
| • | | Cash and equivalents and restricted cash include cash, term deposits, treasury bills and money market investments with original maturities of less than 90 days. All of these are classified as financial assets at fair value through profit or loss and are measured at fair value. Unrealized gains or losses related to changes in fair value are reported in income; |
| • | | Trade and other receivables are classified as and measured at amortized cost using the effective interest method, less impairment allowance, if any; |
| • | | Equity instruments are designated as financial assets at fair value through other comprehensive income and are recorded at fair value on the settlement date, net of transaction costs. Future changes in fair value are recognized in other comprehensive income and are not recycled into income. |
Financial liabilities (excluding derivatives) are derecognized when the obligation specified in the contract is discharged, cancelled or expired. For financial liabilities, IFRS 9 retains most of the IAS 39 requirements and since we do not have any financial liabilities designated at fair value through profit or loss, the adoption of IFRS 9 did not impact our accounting policies for financial liabilities.
| C) | New Accounting Standards Issued But Not Yet Effective |
IFRS 15 Revenue from Contracts with Customers
In May 2014, the IASB issued IFRS 15 Revenue from Contracts with Customers, which covers principles that an entity shall apply to report useful information to users of financial statements about the nature, amount, timing, and uncertainty of revenue and cash flows arising from a contract with a customer. Application of the standard is mandatory for annual reporting periods beginning on or after January 1, 2017, with earlier application permitted. We are currently assessing the impact on our consolidated financial statements along with the planned timing of our adoption of IFRS 15.
3 > SIGNIFICANT JUDGMENTS, ESTIMATES, ASSUMPTIONS AND RISKS
The judgments, estimates, assumptions and risks discussed here reflect updates from the most recently filed annual consolidated financial statements for the year ended December 31, 2014. For judgments, estimates, assumptions and risks related to other areas not discussed in these interim consolidated financial statements, please refer to Notes 3 and 27 of the 2014 annual consolidated financial statements.
| A) | Gold and Copper Mineral Reserves |
At the end of each fiscal year, as part of our annual business cycle, we prepare estimates of the proven and
| | | | |
| BARRICK FIRST QUARTER 2015 | | 61 | | NOTES TO FINANCIAL STATEMENTS (UNAUDITED) |
probable reserves and the portion of resources expected to be extracted economically for each mineral property. We prospectively revise calculations of depreciation of property, plant and equipment and also transfer amounts allocated to non-depreciable mining interest to mining interest subject to depreciation based on the ounces/pounds that have become probable of being economically extracted. The effect of changes in the proven and probable reserves and the portion of resources expected to be extracted economically on depreciation expense for the three months ended March 31, 2015 was an increase of $95 million (2014: $45 million increase). The effect of transfers to mining interest subject to depreciation on depreciation expense for the three months ended March 31, 2015 was an increase of $3 million (2014: $1 million increase).
| B) | Provision for Environmental Rehabilitation (“PER”) |
Provisions are updated each reporting period for changes to expected cash flows and for the effect of changes in the discount rate, foreign exchange rate and the change in estimate is added or deducted from the related asset and depreciated over the expected economic life of the operation to which it relates. We recorded an increase of $55 million (2014: $3 million increase) to the PER at our minesites for the three months ended March 31, 2015 primarily due to a decrease in the discount rate.
| C) | Impairment and reversal of impairment for non-current assets and impairment of goodwill |
Non-current assets other than goodwill are tested for impairment, or reversal of impairment, when events or changes in circumstances suggest that the carrying amount may not be fully recoverable, or an impairment loss recognized in prior periods for an asset other than goodwill may no longer exist or may have decreased. We conduct an annual test for impairment of goodwill in the fourth quarter of each fiscal year and at any other time of the year if an indicator of impairment or reversal of impairment is identified. We recorded $5 million (2014: $10 million) of impairment charges for the three months ended March 31, 2015.
We have not identified any indicators that prior impairments are required to be tested for reversal in the three months ended March 31, 2015.
Liquidity risk is the risk of loss from not having access to sufficient funds to meet both expected and unexpected cash demands. We manage our exposure to liquidity risk by maintaining cash reserves, access to undrawn credit facilities and access to public debt markets, by staggering
the maturities of outstanding debt instruments to mitigate refinancing risk and by monitoring of forecast and actual cash flows.
As part of our capital allocation strategy, we evaluate our capital expenditures in order to ensure they generate an appropriate risk-adjusted return. We work towards divesting assets that do not meet our capital allocation criteria.
Our primary source of liquidity is our operating cash flow. Other options to enhance liquidity include drawing the $4.0 billion available under our 2012 Credit Facility (subject to compliance with covenants and the making of certain representations and warranties, this facility is available for drawdown as a source of financing), further asset sales and issuances of debt or equity securities in the public markets or to private investors, which could be undertaken for liquidity enhancement and/or in connection with establishing a strategic partnership. Many factors, including but not limited to general market conditions and then prevailing metals prices, could impact our ability to issue securities on acceptable terms, as could our credit ratings. Moody’s and S&P currently rate our long-term debt Baa2 (negative) and BBB- (stable), respectively. Our credit rating was downgraded by S&P on March 2, 2015, to BBB- (stable) which is the lowest investment grade rating. Changes in our ratings could affect the trading prices of our securities or our cost of capital. If we were to borrow under our 2012 Credit Facility, the applicable interest rate on the amounts borrowed would be based, in part, on our credit ratings at the time. The key financial covenant in the 2012 Credit Facility (undrawn as at March 31, 2015) requires Barrick to maintain a consolidated tangible net worth (“CTNW”) of at least $3.0 billion (Barrick’s CTNW was $5.7 billion as at March 31, 2015).
4 > DIVESTITURES
| A) | Disposition of Australian assets |
On January 31, 2014, we closed the sale of our Plutonic mine for total cash consideration of $22 million. In addition, on March 1, 2014, we completed the sale of our Kanowna mine for total cash consideration of $67 million. The transactions resulted in a loss of $5 million in 2014.
| B) | Disposition of 10 percent interest in Acacia |
On March 11, 2014, we completed the divestment of 41 million ordinary shares in Acacia, representing 10 percent of the issued ordinary share capital of Acacia for net cash proceeds of $186 million. Subsequent to the divestment, we continue to retain a controlling financial interest in Acacia and continue to consolidate Acacia. We have
| | | | |
| BARRICK FIRST QUARTER 2015 | | 62 | | NOTES TO FINANCIAL STATEMENTS (UNAUDITED) |
accounted for the divestment as an equity transaction and, accordingly, recorded the difference between the proceeds received and the carrying value of $179 million as $7 million of additional paid-in capital in shareholders’ equity.
| C) | Disposition of Marigold mine |
On April 4, 2014, we completed the divestiture of our minority interest in the Marigold mine, for total cash consideration of $86 million. The transaction resulted in a gain of $21 million, which we recorded in 2014.
5 > SEGMENT INFORMATION
As a result of the organizational changes that were implemented in third quarter 2014, we have determined that our Co-Presidents, acting together, are Barrick’s Chief Operating Decision Maker (“CODM”). Beginning in fourth quarter 2014, CODM reviews the operating results, assesses performance and makes capital allocation decisions at the mine site or project level, with the exception of Acacia which is reviewed and assessed as a separate business. Therefore, each individual mine site and Acacia are operating segments for financial reporting purposes. For segment reporting purposes, we present our reportable operating segments as follows: eight individual gold mines, Acacia and our Pascua-Lama project. The remaining operating segments have been grouped into two other categories: (a) our remaining gold mines and (b) our two copper mines.
Segment performance is evaluated based on a number of measures including operating income before tax, production levels and unit production costs. Certain costs are managed on a consolidated basis and are therefore not reflected in segment income. Starting January 1, 2015, we updated the allocation of our general and administration costs to individual mine sites to reflect the removal of all regional oversight and have the mine sites directly accountable for the cost of the functional services they require to run their business.
| | | | | | | | | | | | | | | | | | | | | | | | |
| Consolidated Statement of Income Information | |
| | | | | | Cost of Sales | | | | | | | | | | |
For the three months ended March 31, 2015 | | Revenue | | | Direct mining,
royalties and
community
relations | | | Depreciation | | | Exploration,
evaluation and
project expenses | | | Other expenses
(income)1 | | | Segment income
(loss) | |
Goldstrike | | | $ 237 | | | | $ 117 | | | | $ 32 | | | | $ - | | | | $ 2 | | | | $ 86 | |
Cortez | | | 191 | | | | 126 | | | | 70 | | | | 2 | | | | 2 | | | | (9) | |
Pueblo Viejo | | | 366 | | | | 162 | | | | 69 | | | | - | | | | (2) | | | | 137 | |
Lagunas Norte | | | 205 | | | | 58 | | | | 41 | | | | - | | | | 2 | | | | 104 | |
Veladero | | | 201 | | | | 102 | | | | 26 | | | | 1 | | | | (1) | | | | 73 | |
Turquoise Ridge | | | 55 | | | | 26 | | | | 5 | | | | - | | | | - | | | | 24 | |
Porgera | | | 144 | | | | 93 | | | | 15 | | | | - | | | | 1 | | | | 35 | |
Kalgoorlie | | | 76 | | | | 57 | | | | 9 | | | | - | | | | 1 | | | | 9 | |
Acacia | | | 213 | | | | 141 | | | | 33 | | | | 5 | | | | 1 | | | | 33 | |
Pascua-Lama | | | - | | | | - | | | | 2 | | | | 33 | | | | (11) | | | | (24) | |
Other Mines - Gold | | | 290 | | | | 168 | | | | 74 | | | | 2 | | | | (7) | | | | 53 | |
Other Mines - Copper2 | | | 267 | | | | 214 | | | | 37 | | | | - | | | | 1 | | | | 15 | |
| | | | $ 2,245 | | | | $ 1,264 | | | | $ 413 | | | | $ 43 | | | | $ (11) | | | | $ 536 | |
| | | | |
| BARRICK FIRST QUARTER 2015 | | 63 | | NOTES TO FINANCIAL STATEMENTS (UNAUDITED) |
| | | | | | | | | | | | | | | | | | | | | | | | |
| Consolidated Statement of Income Information | |
| | | | | | Cost of Sales | | | | | | | | | | |
For the three months ended March 31, 2014 | | Revenue | | | Direct mining,
royalties and
community
relations | | | Depreciation | | | Exploration,
evaluation and
project expenses | | | Other expenses
(income)1 | | | Segment income
(loss) | |
Goldstrike | | | $ 360 | | | | $ 163 | | | | $ 42 | | | | $ 1 | | | | $ 1 | | | | $ 153 | |
Cortez | | | 251 | | | | 77 | | | | 52 | | | | - | | | | 3 | | | | 119 | |
Pueblo Viejo | | | 405 | | | | 169 | | | | 54 | | | | - | | | | (1) | | | | 183 | |
Lagunas Norte | | | 201 | | | | 56 | | | | 15 | | | | - | | | | 3 | | | | 127 | |
Veladero | | | 180 | | | | 90 | | | | 30 | | | | - | | | | 2 | | | | 58 | |
Turquoise Ridge | | | 73 | | | | 23 | | | | 4 | | | | - | | | | - | | | | 46 | |
Porgera | | | 150 | | | | 112 | | | | 22 | | | | - | | | | - | | | | 16 | |
Kalgoorlie | | | 116 | | | | 74 | | | | 11 | | | | - | | | | 2 | | | | 29 | |
Acacia | | | 215 | | | | 132 | | | | 30 | | | | 5 | | | | 2 | | | | 46 | |
Pascua-Lama | | | - | | | | - | | | | 2 | | | | 44 | | | | 4 | | | | (50) | |
Other Mines - Gold | | | 382 | | | | 226 | | | | 84 | | | | 1 | | | | (2) | | | | 73 | |
Other Mines - Copper2 | | | 305 | | | | 216 | | | | 42 | | | | 10 | | | | 1 | | | | 36 | |
| | | | $ 2,638 | | | | $ 1,338 | | | | $ 388 | | | | $ 61 | | | | $ 15 | | | | $ 836 | |
1 Other expenses include accretion expense, which is included within finance costs in the consolidated statement of income. For the three months ended March 31, 2015, accretion expense was $11 million (2014: $14 million).
2 Includes exploration and evaluation expense and losses from equity investees that hold copper projects.
Reconciliation of Segment Income to Income Before Income Taxes
| | | | | | | | |
| | | For the three months ended March 31 | |
| | | 2015 | | | 2014 | |
Segment income | | | $ 536 | | | | $ 836 | |
Other revenue1 | | | - | | | | 9 | |
Other cost of sales/amortization1,2 | | | (31) | | | | 7 | |
Exploration, evaluation and project expenses not attributable to segments | | | (43) | | | | (39) | |
General and administrative expenses | | | (67) | | | | (103) | |
Other expense not attributable to segments | | | (4) | | | | (18) | |
Impairment charges not attributable to segments | | | (5) | | | | (12) | |
Gain (loss) on currency translation | | | 2 | | | | (79) | |
Closed mine rehabilitation | | | (8) | | | | (22) | |
Finance income | | | 2 | | | | 3 | |
Finance costs (includes non segment accretion) | | | (185) | | | | (187) | |
(Loss) gain on non-hedge derivatives | | | (3) | | | | 21 | |
Income before income taxes | | | $ 194 | | | | $ 416 | |
1 Includes revenue and costs from Pierina which is not part of any of our operating segments. Pierina entered closure in 2013.
2 Includes all realized hedge gains/losses.
| | | | |
| BARRICK FIRST QUARTER 2015 | | 64 | | NOTES TO FINANCIAL STATEMENTS (UNAUDITED) |
| | | | |
| Capital Expenditures Information | | | | Segment capital expenditures1 |
| | | | | For the three months ended March 31 |
| | | | | | | | |
| | | 2015 | | | 2014 | |
Goldstrike | | | $ 93 | | | | $ 116 | |
| | |
Cortez | | | 33 | | | | 54 | |
| | |
Pueblo Viejo | | | 33 | | | | 31 | |
| | |
Lagunas Norte | | | 13 | | | | 24 | |
| | |
Veladero | | | 68 | | | | 31 | |
| | |
Turquoise Ridge | | | 6 | | | | 6 | |
| | |
Porgera | | | 28 | | | | 6 | |
| | |
Kalgoorlie | | | 17 | | | | 16 | |
| | |
Acacia | | | 41 | | | | 56 | |
| | |
Pascua-Lama | | | 4 | | | | 43 | |
| | |
Other Mines - Gold | | | 91 | | | | 56 | |
| | |
Other Mines - Copper | | | 27 | | | | 68 | |
Segment total | | | $ 454 | | | | $ 507 | |
| | |
Other items not allocated to segments | | | 2 | | | | 2 | |
Total | | | $ 456 | | | | $ 509 | |
| 1 | Segment capital expenditures are presented for internal management reporting purposes on an accrual basis. Capital expenditures in the Consolidated Statements of Cash Flow are presented on a cash basis. For the three months ended March 31, 2015, cash expenditures were $514 million (2014: $616 million) and the decrease in accrued expenditures was $58 million (2014: $107 million decrease). |
6 > REVENUE
| | | | | | | | |
| | | For the three months ended March 31 | |
| | | 2015 | | | 2014 | |
Gold bullion sales1 | | | | | | | | |
Spot market sales | | | $ 1,854 | | | | $ 2,229 | |
Concentrate sales | | | 65 | | | | 50 | |
| | | 1,919 | | | | 2,279 | |
Copper sales | | | | | | | | |
Copper cathode sales | | | 141 | | | | 171 | |
Concentrate sales | | | 126 | | | | 134 | |
| | | | 267 | | | | 305 | |
Other sales1 | | | 59 | | | | 63 | |
Total | | | $ 2,245 | | | | $ 2,647 | |
| 1 | Revenues include the sale of by-products for our gold and copper mines and energy sales from Monte Rio. |
Provisional Copper and Gold Sales
We have provisionally priced sales for which price finalization, referenced to the relevant copper and gold index, is outstanding at the balance sheet date. Our exposure at March 31, 2015 to the impact of movements in market commodity prices for provisionally priced sales is set out in the following table:
| | | | | | | | | | | | | | | | |
| | | Volumes subject to
final pricing
Copper (millions)
Gold (000’s) | | | Impact on net
income before
taxation of 10%
movement in
market price US$ | |
For the three months ended March 31 | | | 2015 | | | | 2014 | | | | 2015 | | | | 2014 | |
Copper pounds | | | 60 | | | | 58 | | | | $ 16 | | | | $ 18 | |
Gold ounces | | | 25 | | | | 28 | | | | 3 | | | | 4 | |
For the three months ended March 31, 2015, our provisionally priced copper sales included provisional pricing losses of $12 million (2014: $19 million losses) and our provisionally priced gold sales included provisional pricing losses of $1 million (2014: $3 million gains).
At March 31, 2015, our provisionally priced copper and gold sales subject to final settlement were recorded at average prices of $2.75/lb (2014: $3.02/lb) and $1,180/oz (2014: $1,336/oz), respectively. The sensitivities in the above table show the impact of a 10 percent change in commodity prices, while holding all other variables constant.
| | | | |
| BARRICK FIRST QUARTER 2015 | | 65 | | NOTES TO FINANCIAL STATEMENTS (UNAUDITED) |
7 > COST OF SALES
| | | | | | | | |
| For the three months ended March 31 | |
| | | 2015 | | | 2014 | |
Direct mining cost1,2 | | $ | 1,186 | | | $ | 1,228 | |
| | |
Depreciation | | | 421 | | | | 402 | |
Royalty expense | | | 90 | | | | 75 | |
| | |
Community relations | | | 11 | | | | 14 | |
| | | $ | 1,708 | | | $ | 1,719 | |
| 1 | Direct mining cost includes charges to reduce the cost of inventory to net realizable value as follows: $55 million for the three months ended March 31, 2015 (2014: $16 million). |
| 2 | Direct mining cost includes the costs of extracting by-products. |
Beginning in January 1, 2015, we updated the allocation of general & administration (“G&A”) costs to individual mine sites to reflect the removal of all regional oversight and have the mine sites directly accountable for the cost of the functional services they require to run their business. These costs now form part of mine site G&A costs which is included within direct mining costs.
8 > EXPLORATION, EVALUATION AND PROJECT COSTS
| | | | | | | | |
For the three months ended March 31 | |
| | | 2015 | | | 2014 | |
Exploration | | | | | | | | |
Minesite exploration | | | $ 7 | | | | $ 7 | |
Global programs | | | 34 | | | | 22 | |
| | | $ 41 | | | | $ 29 | |
Evaluation costs | | | 4 | | | | 3 | |
Exploration and evaluation expense | | | $ 45 | | | | $ 32 | |
Advanced project costs: | | | | | | | | |
Pascua-Lama | | | 32 | | | | 42 | |
Jabal Sayid | | | - | | | | 10 | |
Other project related costs: | | | | | | | | |
Cerro Casale | | | 2 | | | | 3 | |
Kainantu | | | - | | | | 1 | |
Reko Diq | | | - | | | | 2 | |
Corporate Development | | | 6 | | | | 8 | |
Community relations related to projects | | | 1 | | | | 2 | |
Exploration, evaluation and project expenses1 | | | $ 86 | | | | $ 100 | |
| 1 | Approximates the impact on operating cash flow. |
9 > EARNINGS PER SHARE
| | | | | | | | | | | | | | | | |
| | | For the three months ended March 31 | |
| | | 2015 | | | 2014 | |
| ($ millions, except shares in millions and per share amounts in dollars) | | Basic | | | Diluted | | | Basic | | | Diluted | |
Net income | | | $ 89 | | | | $ 89 | | | | $ 127 | | | | $ 127 | |
Net income attributable to non-controlling interests | | | (32) | | | | (32) | | | | (39) | | | | (39) | |
Net income attributable to equity holders of Barrick Gold Corporation | | | $ 57 | | | | $ 57 | | | | $ 88 | | | | $ 88 | |
Weighted average shares outstanding | | | 1,165 | | | | 1,165 | | | | 1,165 | | | | 1,165 | |
Effect of dilutive securities - stock options | | | - | | | | - | | | | - | | | | - | |
| | | | 1,165 | | | | 1,165 | | | | 1,165 | | | | 1,165 | |
Earnings per share data attributable to the equity holders of Barrick Gold Corporation | | | | | | | | | | | | | | | | |
Net income | | | $ 0.05 | | | | $ 0.05 | | | | $ 0.08 | | | | $ 0.08 | |
| | | | |
| BARRICK FIRST QUARTER 2015 | | 66 | | NOTES TO FINANCIAL STATEMENTS (UNAUDITED) |
10 > OTHER EXPENSES
| | | | | | | | |
| | | For the three months
ended March 31 | |
| | | 2015 | | | 2014 | |
Other expense: | | | | | | | | |
Consulting fees | | | $ 2 | | | | $ 6 | |
Bank charges | | | 7 | | | | 5 | |
Insurance expense | | | - | | | | 1 | |
Mine site severance and non-operational costs | | | - | | | | 6 | |
World Gold Council fees | | | - | | | | 1 | |
Pension and other post-retirement benefit expense | | | 1 | | | | 3 | |
Total other expense | | | $ 10 | | | | $ 22 | |
| | |
Other income: | | | | | | | | |
Gain on sale of long-lived assets | | | $ (24 | ) | | | $ (1) | |
Incidental interest income | | | (1 | ) | | | - | |
Management fee income | | | (1 | ) | | | - | |
Royalty income | | | (1 | ) | | | (1) | |
Toll milling | | | | - | | | (1) | |
Incidental income | | | (1 | ) | | | - | |
Total other income | | | $ (28 | ) | | | $ (3) | |
Total | | | $ (18 | ) | | | $ 19 | |
| | |
B Impairment Charges | | | | | | | | |
| | | For the three months
ended March 31 | |
| | | 2015 | | | 2014 | |
Impairment of long-lived assets | | | $ 5 | | | | $ 3 | |
Impairment of other intangibles | | | - | | | | 7 | |
| | | $ 5 | | | | $ 10 | |
Impairment of other investments | | | - | | | | 2 | |
Total | | | $ 5 | | | | $ 12 | |
11 > FINANCE COSTS
| | | | | | | | |
| | | For the three months
ended March 31 | |
| | | 2015 | | | 2014 | |
Interest | | | $ 184 | | | | $ 182 | |
Amortization of debt issue costs | | | 5 | | | | 5 | |
Interest capitalized | | | (9) | | | | (7) | |
Accretion | | | 16 | | | | 21 | |
Total | | | $ 196 | | | | $ 201 | |
12 > INCOME TAX EXPENSE
| | | | | | | | |
| For the three months ended March 31 | |
| | | 2015 | | | 2014 | |
Current | | | $ 102 | | | | $ 194 | |
Deferred | | | 3 | | | | 95 | |
| | | | $ 105 | | | | $ 289 | |
The tax rate for income in the three months ended March 31, 2015 was 54% (2014: 69%). After adjusting for the impact of net currency translation losses on deferred tax balances, the impact of asset sales and non-hedge derivatives and the impact of non-deductible foreign exchange losses, the underlying effective tax rate for ordinary income in the three months ended March 31, 2015 was 53% (2014: 51%).
Currency Translation
Deferred tax balances are subject to remeasurement for changes in currency exchange rates each period. The most significant balances are Argentinean net deferred tax liabilities. In the first quarter 2015 and 2014, tax expense of $6 million and $40 million respectively primarily arose from translation losses on tax balances in Argentina, due to the weakening of the Argentinean peso against the US dollar. These translation gains/losses are included within deferred income tax expense/recovery.
| | | | |
| BARRICK FIRST QUARTER 2015 | | 67 | | NOTES TO FINANCIAL STATEMENTS (UNAUDITED) |
13 > CASH FLOW - OTHER ITEMS
| | | | |
| A Operating Cash Flows - Other Items | | For the three months ended March 31 |
| | | | |
| | | 2015 | | 2014 |
Adjustments for non-cash income statement items: | | | | |
Net currency translation (gains) losses | | $ (2) | | $ 79 |
RSU expense | | 7 | | 8 |
Stock option expense | | 1 | | - |
Change in estimate of rehabilitation costs at closed mines | | 8 | | 22 |
Net inventory impairment charges (note 15) | | 55 | | 16 |
Cash flow arising from changes in: | | | | |
Accounts receivable | | 2 | | (14) |
Other current assets | | (65) | | (70) |
Accounts payable | | (154) | | (277) |
Other current liabilities | | (34) | | (3) |
Other assets and liabilities | | (3) | | 17 |
Settlement of rehabilitation obligations | | (24) | | (19) |
Other net operating activities | | $ (209) | | $ (241) |
| | | | |
| |
| B Investing Cash Flows - Other Items | | For the three months ended March 31 |
| | | | |
| | | 2015 | | 2014 |
Value added tax recoverable on project capital expenditures | | $ - | | $ (19) |
Other | | (1) | | (21) |
Other net investing activities | | $ (1) | | $ (40) |
| | | | |
| BARRICK FIRST QUARTER 2015 | | 68 | | NOTES TO FINANCIAL STATEMENTS (UNAUDITED) |
14 > EQUITY ACCOUNTING METHOD INVESTMENT CONTINUITY
| | | | | | | | | | | | |
| | | Kabanga | | | Jabal Sayid1 | | | Total | |
At January 1, 2014 | | | $ 27 | | | | $ - | | | | $ 27 | |
Funds invested | | | 1 | | | | 178 | | | | 179 | |
At December 31, 2014 | | | $ 28 | | | | $ 178 | | | | $ 206 | |
Funds invested | | | 1 | | | | - | | | | 1 | |
At March 31, 2015 | | | $ 29 | | | | $ 178 | | | | $ 207 | |
Publicly traded | | | No | | | | No | | | | | |
| | |
1 | | A $164 million non-interest bearing shareholder loan due from the Jabal Sayid JV as a result of the divestment of 50 percent interest in Jabal Sayid is presented as part of Other Assets in the Consolidated Financial Statements. |
15 > INVENTORIES
| | | | | | | | | | | | | | | | | | |
| | | Gold | | | | | Copper | |
| | | | | |
| | | As at March 31, 2015 | | | As at December 31, 2014 | | | | | As at March 31, 2015 | | | As at December 31, 2014 | |
Raw materials | | | | | | | | | | | | | | | | | | |
Ore in stockpiles | | | $ 2,058 | | | | $ 2,036 | | | | | | $ 163 | | | | $ 182 | |
Ore on leach pads | | | 352 | | | | 357 | | | | | | 394 | | | | 392 | |
Mine operating supplies | | | 879 | | | | 875 | | | | | | 128 | | | | 132 | |
Work in process | | | 260 | | | | 245 | | | | | | 9 | | | | 7 | |
Finished products | | | | | | | | | | | | | | | | | | |
Gold doré | | | 83 | | | | 129 | | | | | | - | | | | - | |
Copper cathode | | | - | | | | - | | | | | | 9 | | | | 12 | |
Copper concentrate | | | - | | | | - | | | | | | 26 | | | | 28 | |
Gold concentrate | | | 13 | | | | 11 | | | | | | - | | | | - | |
| | | $ 3,645 | | | | $ 3,653 | | | | | | $ 729 | | | | $ 753 | |
Non-current ore in stockpiles1 | | | (1,572) | | | | (1,584) | | | | | | (92) | | | | (100) | |
| | | | $ 2,073 | | | | $ 2,069 | | | | | | $ 637 | | | | $ 653 | |
1 Ore that we do not expect to process in the next 12 months is classified as long-term.
| | | | |
For the three months ended March 31 |
| | | 2015 | | 2014 |
Inventory impairment charges1 | | $ 55 | | $16 |
1 Impairment charges in 2015 primarily relates to impairments at Cortez.
Purchase Commitments
At March 31, 2015, we had purchase obligations for supplies and consumables of $1,477 million.
| | | | |
| BARRICK FIRST QUARTER 2015 | | 69 | | NOTES TO FINANCIAL STATEMENTS (UNAUDITED) |
16 > PROPERTY, PLANT AND EQUIPMENT
| | | | | | | | |
| | | As at March 31,
2015 | | | As at December 31,
2014 | |
Depreciable assets | | | $ 15,240 | | | | $ 14,947 | |
Non-depreciable assets | | | | | | | | |
Projects | | | | | | | | |
Pascua-Lama | | | 1,919 | | | | 1,910 | |
Cerro Casale1 | | | 444 | | | | 444 | |
Donlin Gold | | | 140 | | | | 138 | |
Construction-in-progress2 | | | 1,381 | | | | 1,490 | |
Acquired mineral resources and exploration potential | | | 157 | | | | 264 | |
| | | | $ 19,281 | | | | $ 19,193 | |
| | |
1 | | Amount presented on a 100% basis and includes our partner’s non-controlling interest. |
2 | | Represents assets under construction at our operating mine sites. |
Capital Commitments
In addition to entering into various operational commitments in the normal course of business, we had capital commitments of $104 million at March 31, 2015.
17 > FINANCIAL INSTRUMENTS
Financial instruments include cash; evidence of ownership in an entity; or a contract that imposes an obligation on one party and conveys a right to a second entity to deliver/receive cash or another financial instrument.
A Cash and Equivalents
Cash and equivalents include cash, term deposits, treasury bills and money market funds with original maturities of less than 90 days. Cash and equivalents also include $417 million cash held at Acacia and Pueblo Viejo, which may not be readily deployed outside of Acacia and/or Pueblo Viejo.
B Debt
| | | | | | | | |
| | | As at March 31, 2015 | | | As at December 31, 2014 | |
2.9%/4.4%/5.7% notes1 | | | $ 2,409 | | | | $ 2,409 | |
3.85%/5.25% notes | | | 1,983 | | | | 1,983 | |
5.80% notes | | | 395 | | | | 395 | |
5.75%/6.35% notes | | | 856 | | | | 855 | |
Other fixed rate notes2 | | | 2,721 | | | | 2,720 | |
Project financing | | | 737 | | | | 850 | |
Capital leases3 | | | 338 | | | | 354 | |
Other debt obligations | | | 741 | | | | 794 | |
2.5%/4.10%/5.75% notes4 | | | 2,581 | | | | 2,579 | |
Acacia credit facility5 | | | 142 | | | | 142 | |
| | | $ 12,903 | | | | $ 13,081 | |
Less: current portion | | | (298) | | | | (333) | |
| | | | $ 12,605 | | | | $ 12,748 | |
| | |
1 | | Consists of $2.4 billion in conjunction with our wholly-owned subsidiary Barrick North America Finance LLC (“BNAF”). This consists of $229 million of BGC notes due 2016, $1.35 billion of BNAF notes due 2021 and $850 million of BNAF notes due 2041. We provide an unconditional and irrevocable guarantee on all BNAF Notes and generally provide such guarantees on all BNAF notes issued, which will rank equally with our other unsecured and unsubordinated obligations. |
2 | | Consists of $2.8 billion in conjunction with our wholly-owned subsidiary Barrick North America Finance LLC (“BNAF”) and our wholly-owned subsidiary Barrick (PD) Australia Finance Pty Ltd. (“BPDAF”). This consists of $500 million of BNAF notes due 2018, $750 million of BGC notes due 2019, $400 million of BPDAF notes due 2020, $250 million of BNAF notes due 2038 and $850 million of BPDAF notes due 2039. We provide an unconditional and irrevocable guarantee on all BNAF and BPDAF notes and generally provide such guarantees on all BNAF and BPDAF notes issued, which will rank equally with our other unsecured and unsubordinated obligations. |
3 | | Consists primarily of capital leases at Pascua-Lama $196 million and Lagunas Norte $114 million (2014: $199 million and $123 million, respectively). |
4 | | Consists of $2.6 billion in conjunction with our wholly-owned subsidiary Barrick North America Finance LLC (“BNAF”). This consists of $252 million of BGC notes due 2018, $1.5 billion of BGC notes due 2023 and $850 million of BNAF notes due 2043. We provide an unconditional and irrevocable guarantee on all BNAF notes and generally provide such guarantees on all BNAF notes issued, which will rank equally with our other unsecured and unsubordinated obligations. |
5 | | Consists of an export credit backed term loan facility. |
| | | | |
| BARRICK FIRST QUARTER 2013 | | 70 | | NOTES TO FINANCIAL STATEMENTS (UNAUDITED) |
Jabal Sayid Financing Facility
On April 2, 2015, Ma’aden Barrick Copper Company signed a financing agreement with the Saudi British Bank to finance the Jabal Sayid copper project (an equity method investment for Barrick) for SAR 750 million ($200 million USD). Barrick has provided a guarantee equal to our proportionate ownership interest (50%).
| | | | | | | | | | | | | | | | | | | | | | | | | | | | |
C Derivative Instruments at March 31, 2015 | |
| | | Notional amount by term to maturity | | | Accounting classification by
notional amount | | | | |
| | | | | | | |
| | | Within 1
year | | | 2 to 3
years | | | 4+ years | | | Total | | | Cash flow
hedge | | | Non-hedge | | | Fair value
(USD) | |
US dollar interest rate contracts | | | | | | | | | | | | | | | | | | | | | | | | | | | | |
Total receive - float swap positions | | | $ 28 | | | | $ 57 | | | | $ 57 | | | | $ 142 | | | | $ 142 | | | | $ - | | | | $ - | |
Currency contracts | | | | | | | | | | | | | | | | | | | | | | | | | | | | |
A$:US$ contracts (A$ millions) | | | 313 | | | | 60 | | | | - | | | | 373 | | | | 330 | | | | 43 | | | | (87) | |
C$:US$ contracts (C$ millions) | | | 180 | | | | - | | | | - | | | | 180 | | | | 180 | | | | - | | | | (15) | |
CLP:US$ contracts (CLP millions) | | | 76,500 | | | | - | | | | - | | | | 76,500 | | | | 67,202 | | | | 9,298 | | | | (7) | |
PGK:US$ contracts (PGK millions) | | | 14 | | | | - | | | | - | | | | 14 | | | | - | | | | 14 | | | | - | |
ZAR:US$ contracts (ZAR millions) | | | 296 | | | | - | | | | - | | | | 296 | | | | 171 | | | | 125 | | | | (1) | |
Commodity contracts | | | | | | | | | | | | | | | | | | | | | | | | | | | | |
Copper collar sell contracts (millions of pounds) | | | 2 | | | | - | | | | - | | | | 2 | | | | - | | | | 2 | | | | 1 | |
Fuel contracts (thousands of barrels)1 | | | 2,800 | | | | 4,433 | | | | 810 | | | | 8,043 | | | | 7,440 | | | | 603 | | | | (205) | |
| 1 | Fuel contracts represent a combination of WTI swaps and Brent options. These derivatives hedge physical supply contracts based on the price of fuel across our operating mine sites plus a spread. WTI represents West Texas Intermediate and BRENT represents Brent Crude Oil. |
Fair Values of Derivative Instruments
| | | | | | | | | | | | | | | | | | | | |
| | | Asset Derivatives | | | Liability Derivatives | |
| | | | | | |
| | | Consolidated
Balance Sheet
Classification | | Fair Value at
March 31,
2015 | | | Fair Value at
December 31,
2014 | | | Consolidated
Balance Sheet
Classification | | Fair Value at
March 31,
2015 | | | Fair Value at
December 31,
2014 | |
Derivatives designated as hedging instruments | | | | | | | | | | | | | | | | | | | | |
US dollar interest rate contracts | | Other assets | | | $ 1 | | | | $ 2 | | | Other liabilities | | | $ 1 | | | | $ 1 | |
Currency contracts | | Other assets | | | - | | | | - | | | Other liabilities | | | 87 | | | | 71 | |
Commodity contracts1 | | Other assets | | | - | | | | - | | | Other liabilities | | | 190 | | | | - | |
Total derivatives classified as hedging instruments | | | | | $ 1 | | | | $ 2 | | | | | | $ 278 | | | | $ 72 | |
Derivatives not designated as hedging instruments | | | | | | | | | | | | | | | | | | | | |
US dollar interest rate contracts | | Other assets | | | $ - | | | | $ - | | | Other liabilities | | | $ - | | | | $ - | |
Currency contracts | | Other assets | | | 4 | | | | 4 | | | Other liabilities | | | 27 | | | | 30 | |
Commodity contracts | | Other assets | | | 1 | | | | 3 | | | Other liabilities | | | 15 | | | | 185 | |
Total derivatives not designated as hedging instruments | | | | | $ 5 | | | | $ 7 | | | | | | $ 42 | | | | $ 215 | |
Total derivatives | | | | | $ 6 | | | | $ 9 | | | | | | $ 320 | | | | $ 287 | |
| 1 | Majority of our fuel contracts are now being designated as hedging instruments as a result of adoption of IFRS 9. These contracts did not qualify for hedge accounting in 2014. |
| | | | |
| BARRICK FIRST QUARTER 2015 | | 71 | | NOTES TO FINANCIAL STATEMENTS (UNAUDITED) |
As of March 31, 2015, we had 24 counterparties to our derivative positions. We proactively manage our exposure to individual counterparties in order to mitigate both credit and liquidity risks. We have 2 counterparties with which we hold a net asset position of $1 million, and 22 counterparties with which we are in a net liability position, for a total net liability of $315 million. On an ongoing basis, we monitor our exposures and ensure that none of the counterparties with which we hold outstanding contracts has declared insolvency.
Cash Flow Hedge Gains (Losses) in Accumulated Other Comprehensive Income
| | | | | | | | | | | | | | | | | | | | | | | | | | | | | | | | | | | | |
| | | Commodity price hedges | | | | | Currency hedges | | | | | Interest rate
hedges | | | | |
| | | Gold/Silver | | | Copper | | | Fuel | | | | | Operating
costs | | | Administration/
other costs | | | Capital
expenditures | | | | | Long-term
debt | | | Total | |
At December 31, 2014 | | | $ 18 | | | | $ - | | | | $ - | | | | | | $ (79) | | | | $ (3) | | | | $ - | | | | | | $ (25) | | | | $ (89) | |
Impact of adopting IFRS 9 on January 1, 2015 | | | - | | | | - | | | | - | | | | | | (5) | | | | - | | | | - | | | | | | - | | | | (5) | |
Effective portion of change in fair value of hedging instruments | | | - | | | | - | | | | (39) | | | | | | (19) | | | | (11) | | | | - | | | | | | (1) | | | | (70) | |
Transfers to earnings: | | | | | | | | | | | | | | | | | | | | | | | | | | | | | | | | | | | | |
On recording hedged items in earnings/PP&E1 | | | (5) | | | | - | | | | 3 | | | | | | 14 | | | | 3 | | | | - | | | | | | 1 | | | | 16 | |
At March 31, 2015 | | | $ 13 | | | | $ - | | | | $ (36) | | | | | | $ (89) | | | | $ (11) | | | | $ - | | | | | | $ (25) | | | | $ (148) | |
| 1 | Realized gains (losses) on qualifying currency hedges of capital expenditures are transferred from OCI to PP&E on settlement. |
D Gains (Losses) on Non-hedge Derivatives
| | | | |
| | | For the three months ended March 31 |
| | | | | | | | |
| | | 2015 | | | 2014 | |
Commodity contracts | | | | | | | | |
Silver | | | $ 5 | | | | $ - | |
Copper | | | - | | | | 2 | |
Fuel | | | (1) | | | | 14 | |
Currency contracts | | | (4) | | | | (2) | |
| | | | $ - | | | | $ 14 | |
| | |
Gains (losses) attributable to copper option collar hedges1 | | | $ - | | | | $ 15 | |
Gains (losses) attributable to currency option collar hedges1 | | | - | | | | (2) | |
Hedge ineffectiveness | | | (3) | | | | (6) | |
| | | | $ (3) | | | | $ 7 | |
| | | | $ (3) | | | | $ 21 | |
| 1 | Represents unrealized gains (losses) attributable to changes in the time value of the collars, which were excluded from the hedge effectiveness assessment in 2014. |
18 > FAIR VALUE MEASUREMENTS
A Assets and Liabilities Measured at Fair Value on a Recurring Basis
| | | | | | | | | | | | | | | | |
As at March 31, 2015 | | Quoted
prices in
active
markets
for
identical
assets (Level 1) | | | Significant
other
observable
inputs (Level 2) | | | Significant
un- observable
inputs (Level 3) | | | Aggregate
fair value | |
Cash and equivalents | | | $ 2,258 | | | | $ - | | | | $ - | | | | $ 2,258 | |
Other investments | | | 13 | | | | - | | | | - | | | | 13 | |
Derivatives | | | - | | | | (314) | | | | - | | | | (314) | |
Receivables from provisional copper and gold sales | | | - | | | | 169 | | | | - | | | | 169 | |
| | | | $ 2,271 | | | | $ (145) | | | | $ - | | | | $ 2,126 | |
| | | | |
| BARRICK FIRST QUARTER 2015 | | 72 | | NOTES TO FINANCIAL STATEMENTS (UNAUDITED) |
B Fair Values of Financial Assets and Liabilities
| | | | | | | | | | | | | | | | |
| | | As at Mar. 31, 2015 | | | As at Dec. 31, 2014 | |
| | | Carrying
amount | | | Estimated
fair value | | | Carrying
amount | | | Estimated
fair value | |
Financial assets | | | | | | | | | | | | | | | | |
Other receivables | | | $ 392 | | | | $ 392 | | | | $ 385 | | | | $ 385 | |
Other investments1 | | | 13 | | | | 13 | | | | 35 | | | | 35 | |
Derivative assets | | | 6 | | | | 6 | | | | 9 | | | | 9 | |
| | | | $ 411 | | | | $ 411 | | | | $ 429 | | | | $ 429 | |
Financial liabilities | | | | | | | | | | | | | | | | |
Debt2 | | | 12,903 | | | | 13,358 | | | | 13,081 | | | | 13,356 | |
Derivative liabilities | | | 320 | | | | 320 | | | | 287 | | | | 287 | |
Other liabilities | | | 359 | | | | 359 | | | | 360 | | | | 360 | |
| | | | $ 13,582 | | | | $ 14,037 | | | | $ 13,728 | | | | $ 14,003 | |
| | |
1 | | Recorded at fair value. Quoted market prices are used to determine fair value. |
2 | | Debt is generally recorded at amortized cost. The fair value of debt is primarily determined using quoted market prices. Balance includes both current and long-term portions of debt. |
We do not offset financial assets with financial liabilities.
Valuation Techniques
Other investments
The fair value of other investments is determined based on the closing price of each security at the balance sheet date. The closing price is a quoted market price obtained from the exchange that is the principal active market for the particular security, and therefore other investments are classified within Level 1 of the fair value hierarchy.
Derivative Instruments
The fair value of derivative instruments is determined using either present value techniques or option pricing models that utilize a variety of inputs that are a combination of quoted prices and market-corroborated inputs. The fair value of all our derivative contracts includes an adjustment for credit risk. For counterparties in a net asset position, credit risk is based upon the observed credit default swap spread for each particular counterparty, as appropriate. For counterparties in a net liability position, credit risk is based upon Barrick’s observed credit default swap spread. The fair value of US dollar interest rate and currency swap contracts is determined by discounting contracted cash flows using a discount rate derived from observed LIBOR and swap rate curves and CDS rates. In the case of currency contracts, we convert non-US dollar cash flows into US dollars using an exchange rate derived from currency swap curves and CDS rates. The fair value of commodity forward contracts is determined by discounting contractual cash flows using a discount rate derived from observed LIBOR and swap rate curves and CDS rates. Contractual cash flows are calculated using a forward pricing curve derived from observed forward prices for
each commodity. Derivative instruments are classified within Level 2 of the fair value hierarchy.
Receivables from Provisional Copper and Gold Sales
The fair value of receivables rising from copper and gold sales contracts that contain provisional pricing mechanisms is determined using the appropriate quoted forward price from the exchange that is the principal active market for the particular metal. As such, these receivables, which meet the definition of an embedded derivative, are classified within Level 2 of the fair value hierarchy.
19 > CAPITAL STOCK
A Authorized Capital Stock
Our authorized capital stock includes an unlimited number of common shares (issued 1,164,669,708 common shares); an unlimited number of first preferred shares issuable in series (the first series is designated as the “First Preferred Shares, Series A” and consists of 10,000,000 first preferred shares (issued nil); the second series is designated as the “First Preferred Shares, Series B” and consists of 10,000,000 first preferred shares (issued nil); and the third series is designated as the “First Preferred Share, Series C Special Voting Share” and consists of 1 Special Voting Share (issued nil)); and an unlimited number of second preferred shares issuable in series (the first series is designated as the “Second Preferred Shares, Series A” and consists of 15,000,000 second preferred shares (issued nil)). Our common shares have no par value.
The Company’s practice has been to declare dividends after a quarter end in the announcement of the results for the quarter. Dividends declared are paid in the same quarter.
| | | | |
| BARRICK FIRST QUARTER 2015 | | 73 | | NOTES TO FINANCIAL STATEMENTS (UNAUDITED) |
20 > NON-CONTROLLING INTERESTS
| | | | | | | | | | | | | | | | | | | | |
| | | Pueblo
Viejo | | | Acacia | | | Cerro
Casale | | | Other | | | Total | |
At January 1, 2015 | | | $ 1,521 | | | | $ 758 | | | | $ 319 | | | | $ 17 | | | | $ 2,615 | |
Share of income (loss) | | | 31 | | | | 3 | | | | (1) | | | | (1) | | | | 32 | |
Cash contributed | | | - | | | | - | | | | - | | | | 1 | | | | 1 | |
Decrease in non-controlling interest1 | | | (44) | | | | - | | | | - | | | | - | | | | (44) | |
At March 31, 2015 | | | $ 1,508 | | | | $ 761 | | | | $ 318 | | | | $ 17 | | | | $ 2,604 | |
| | |
1 | | Represents disbursements made to non-controlling interest at Pueblo Viejo. |
21 > CONTINGENCIES
Certain conditions may exist as of the date the financial statements are issued that may result in a loss to the Company, but which will only be resolved when one or more future events occur or fail to occur. The impact of any resulting loss from such matters affecting these financial statements and noted below may be material.
Except as noted below, no material changes have occurred with respect to the matters disclosed in Note 35 “Contingencies” to the Company’s audited consolidated financial statements for the year ended December 31, 2014 (the “Audited Annual Financial Statements”), and no new contingencies have occurred that are material to the Company since the issuance of the Audited Annual Consolidated Financial Statements.
The description set out below should be read in conjunction with Note 35 “Contingencies” to the Audited Consolidated Financial Statements.
A) Litigation and Claims Update
U.S. Shareholder Class Action
On April 1, 2015, the Court issued its ruling on the Defendants’ motion to dismiss. The Court dismissed the plaintiffs’ claims relating to the cost and scheduling of the Project. However, the Court allowed the plaintiffs’ claims relating to the environmental risks of the Project and alleged internal control failures to go forward. On April 15, 2015, Barrick filed a motion for reconsideration regarding the environmental allegations and certain claims against some of the individual defendants. The parties also are beginning to confer on a schedule for discovery. A status conference is scheduled for May 4, 2015.
Proposed Canadian Securities Class Actions
On March 16, 2015, the Divisional Court heard an appeal of the lower court decision that determined which of the competing counsel groups will take the lead in the Ontario litigation. A decision of the Divisional Court is pending, and further appeals could still occur.
Pascua-Lama - SMA Regulatory Sanctions
On April 22, 2015, Compañía Minera Nevada, Barrick’s Chilean subsidiary that holds the Chilean portion of the Pascua-Lama project, was notified that Chile’s environmental regulator has initiated a new administrative proceeding for alleged deviations from certain requirements of the Project’s environmental approval, including with respect to the Project’s environmental impact and a series of monitoring requirements. CMN is evaluating the allegations and preparing its response.
Pascua-Lama - Environmental Damage Claim
On March 23, 2015, the Environmental Court ruled in favor of CMN in this matter, finding that the Pascua-Lama project has not damaged glaciers in the Project area. The plaintiffs may appeal the Environmental Court’s decision to the Chilean Supreme Court.
Pueblo Viejo - Amparo Action
The Trial Court has received the litigation file in this matter, and a preliminary hearing has been scheduled for April 28, 2015.
22 > SUBSEQUENT EVENTS
Royalty Changes in Zambia
On April 20, 2015, the Zambian government announced amendments to the country’s mining tax regime that would replace the recently adopted 20 percent gross royalty on open pit mines with a nine percent royalty, along with the reintroduction of a 30 percent corporate income tax and a 15 percent variable profits tax. Based on our initial analysis, this system would enable Lumwana to remain free cash flow positive at current copper prices. As a result, we will continue operations at Lumwana and in second quarter 2015 we will evaluate the potential for a reversal of previous impairments recorded in fourth quarter 2014.
| | | | |
| BARRICK FIRST QUARTER 2015 | | 74 | | NOTES TO FINANCIAL STATEMENTS (UNAUDITED) |
| | |
| HEAD OFFICE | | TRANSFER AGENTS AND REGISTRARS |
| Barrick Gold Corporation | | CST Trust Company |
| Brookfield Place | | P.O. Box 700, Postal Station B |
| TD Canada Trust Tower | | Montreal, Quebec, Canada H3B 3K3 |
| 161 Bay Street, Suite 3700 | | or |
| P.O. Box 212 | | American Stock Transfer & Trust Company, |
| Toronto, Canada M5J 2S1 | | LLC |
| Tel: (416) 861-9911 Fax: (416) 861-2492 | | 6201 - 15 Avenue |
| Toll-free throughout North America: | | Brooklyn, NY 11219 |
| 1-800-720-7415 | | Tel: 1-800-387-0825 |
| Email: investor@barrick.com | | Toll-free throughout North America |
| Website: www.barrick.com | | Fax: 1-888-249-6189 |
| | Email: inquiries@canstockta.com |
| SHARES LISTED | | Website: www.canstockta.com |
| ABX - The New York Stock Exchange | | |
The Toronto Stock Exchange | | |
| |
| INVESTOR CONTACT | | MEDIA CONTACT |
| Amy Schwalm | | Andy Lloyd |
| Vice President, | | Vice President, |
| Investor Relations | | Communications |
| Tel: (416) 307-7422 | | Tel: (416) 307-7414 |
| Email: aschwalm@barrick.com | | Email: alloyd@barrick.com |
| | | | |
| BARRICK FIRST QUARTER 2015 | | 75 | | PRESS RELEASE |
CAUTIONARY STATEMENT ON FORWARD-LOOKING INFORMATION
Certain information contained or incorporated by reference in this First Quarter 2015 Report, including any information as to our strategy, projects, plans or future financial or operating performance, constitutes “forward-looking statements”. All statements, other than statements of historical fact, are forward-looking statements. The words “believe”, “expect”, “anticipate”, “contemplate”, “target”, “plan”, “intend”, “project”, “continue”, “budget”, “estimate”, “potential”, “may”, “will”, “can”, “could” and similar expressions identify forward-looking statements. In particular, this First Quarter Report 2015 contains forward-looking statements with respect to cash flow forecasts, projected capital, operating and exploration expenditure, mine life and production rates, exploration results, potential mineralization and metal or mineral recoveries, and information pertaining to Barrick’s Value Realization project (including potential improvements to financial and operating performance at Barrick’s Pueblo Viejo mine that may result from certain Value Realization initiatives). Forward-looking statements are necessarily based upon a number of estimates and assumptions that, while considered reasonable by the company in light of management’s experience and perception of current conditions and expected developments, are inherently subject to significant business, economic and competitive uncertainties and contingencies. Known and unknown factors could cause actual results to differ materially from those projected in the forward-looking statements. Such factors include, but are not limited to: fluctuations in the spot and forward price of gold, copper or certain other commodities (such as silver, diesel fuel, liquefied natural gas and electricity); the speculative nature of mineral exploration and development; the possibility that future exploration results will not be consistent with the company’s expectations; changes in mineral production performance, exploitation and exploration successes; risks that exploration data may be incomplete and considerable additional work may be required to complete further evaluation, including but not limited to drilling, engineering and socio-economic studies and investment; diminishing quantities or grades of reserves; increased costs, delays, suspensions and technical challenges associated with the construction of capital projects; operating or technical difficulties in connection with mining or development activities, including disruptions in the maintenance or provision of required infrastructure and information technology systems; uncertainty whether some or all of the Value Realization initiatives will meet the company’s capital allocation objectives; the impact of global liquidity and credit availability on the timing of cash flows and the values of assets and liabilities based on projected future cash flows; adverse changes in our credit rating; the impact of inflation; risk of loss due to acts of war, terrorism, sabotage and civil disturbances; fluctuations in the currency markets; changes in U.S. dollar interest rates; risks arising from holding derivative instruments; changes in national and local government legislation, taxation, controls or regulations and/or changes in the administration of laws, policies and practices, expropriation or nationalization of property and political or economic developments in Canada, the United States, Zambia and other jurisdictions in which the company does or may carry on business in the future; failure to comply with environmental and health and safety laws and regulations; timing of receipt of, or failure to comply with, necessary permits and approvals; litigation; contests over title to properties, particularly title to undeveloped properties, or over access to water, power and other required infrastructure; business opportunities that may be presented to, or pursued by, the company; our ability to successfully integrate acquisitions or complete divestitures; increased costs and risks related to the potential impact of climate change; damage to the company’s reputation due to the actual or perceived occurrence of any number of events, including negative publicity with respect to the company’s handling of environmental matters or dealings with community groups, whether true or not; employee relations; availability and increased costs associated with mining inputs and labor; and the organization of our previously held African gold operations and properties under a separate listed company. In addition, there are risks and hazards associated with the business of mineral exploration, development and mining, including environmental hazards, industrial accidents, unusual or unexpected formations, pressures, cave-ins, flooding and gold bullion, copper cathode or gold or copper concentrate losses (and the risk of inadequate insurance, or inability to obtain insurance, to cover these risks).
Many of these uncertainties and contingencies can affect our actual results and could cause actual results to differ materially from those expressed or implied in any forward-looking statements made by, or on behalf of, us. Readers are cautioned that forward-looking statements are not guarantees of future performance. All of the forward-looking statements made in this First Quarter 2015 Report are qualified by these cautionary statements. Specific reference is made to the most recent Form 40-F/Annual Information Form on file with the SEC and Canadian provincial securities regulatory authorities for a discussion of some of the factors underlying forward-looking statements.
The company disclaims any intention or obligation to update or revise any forward-looking statements whether as a result of new information, future events or otherwise, except as required by applicable law.
| | | | |
| BARRICK FIRST QUARTER 2015 | | 76 | | PRESS RELEASE |