Exhibit 99.1

BARRICK GOLD CORPORATION
TECHNICAL REPORT ON THE
CORTEZ JOINT VENTURE OPERATIONS,
LANDER AND EUREKA COUNTIES,
STATE OF NEVADA, U.S.A.
NI 43-101 Report
Qualified Persons:
Kathleen Ann Altman, Ph.D., P.E.
R. Dennis Bergen, P.Eng.
Stuart Collins, P.E.
Chester Moore, P.Eng.
Wayne Valliant, P.Geo.
|
March 21, 2016 |
RPA Inc.55 University Ave. Suite 501 | Toronto, ON, Canada M5J 2H7 | T+ 1 (416) 947 0907 www.rpacan.com |

Report Control Form
| | | | | | | | | | | | | | | | | | |
| Document Title | | Technical Report on the Cortez Operations, State of Nevada, U.S.A. |
| | | | |
| Client Name & Address | | Barrick Gold Corporation Brookfield Place, TD Canada Trust Tower Suite 3700, 161 Bay Street, P.O. Box 212 Toronto, Ontario M5J 2S1 |
| | | | | | | | | | | | | | | | | | |
| Document Reference | | Project#2471 | | | | Status &
Issue No. | | | | | | | | FINAL Version | | |
| | | | | | | | | | | | | |
| Issue Date | | March 21, 2016 | | | | | | |
| | | | | | | | | | | | | | | | | | |
| Lead Author | | Wayne Valliant Dennis Bergen Stuart Collins Chester Moore Kathleen A. Altman | | | | (Signed)
(Signed) (Signed) (Signed) (Signed) |
| | | | | | | | | | | | |
| Peer Reviewer | | Deborah McCombe | | | | (Signed) |
| | | | | | | | | | | | |
| Project Manager Approval | | Wayne Valliant | | | | (Signed) |
| | | | | | | | | | | | |
| Project Director Approval | | Graham Clow | | | | (Signed) |
| | | | | | | | | | | | | | | | | | |
| Report Distribution | | Name | | No. of Copies |
| | |
| | Client | | |
| | RPA Filing | | 1 (project box) |
| | | |
| | | | | | Roscoe Postle Associates Inc.
55 University Avenue, Suite 501 Toronto, ON M5J 2H7 Canada Tel: +1 416 947 0907 Fax: +1 416 947 0395 mining@rpacan.com |
FORWARD-LOOKING INFORMATION
This report contains forward-looking statements. All statements, other than statements of historical fact regarding Barrick or Cortez, are forward-looking statements. The words “believe”, “expect”, “anticipate”, “contemplate”, “target”, “plan”, “intend”, “project”, “continue”, “budget”, “estimate”, “potential”, “may”, “will”, “can”, “could” and similar expressions identify forward-looking statements. In particular, this report contains forward-looking statements with respect to cash flow forecasts, projected capital, operating and exploration expenditure, targeted cost reductions, mine life and production rates, potential mineralization and metal or mineral recoveries, and information pertaining to potential improvements to financial and operating performance and mine life at the Cortez mine that may result from the Cortez Underground Expansion Project and certain other Value Realization Initiatives. All forward-looking statements in this report are necessarily based on opinions and estimates made as of the date such statements are made and are subject to important risk factors and uncertainties, many of which cannot be controlled or predicted. Material assumptions regarding forward-looking statements are discussed in this report, where applicable. In addition to such assumptions, the forward-looking statements are inherently subject to significant business, economic and competitive uncertainties and contingencies. Known and unknown factors could cause actual results to differ materially from those projected in the forward-looking statements. Such factors include, but are not limited to: fluctuations in the spot and forward price of commodities (including gold, copper, silver, diesel fuel, natural gas and electricity); the speculative nature of mineral exploration and development; changes in mineral production performance, exploitation and exploration successes; risks associated with the fact that the Cortez Underground Expansion Project and certain other Value Realization Initiatives are still in the early stages of evaluation and additional engineering and other analysis is required to fully assess their impact; diminishing quantities or grades of reserves; increased costs, delays, suspensions, and technical challenges associated with the construction of capital projects; operating or technical difficulties in connection with mining or development activities, including disruptions in the maintenance or provision of required infrastructure and information technology systems; damage to Barrick’s or Cortez’s reputation due to the actual or perceived occurrence of any number of events, including negative publicity with respect to the handling of environmental matters or dealings with community groups, whether true or not; risk of loss due to acts of war, terrorism, sabotage and civil disturbances; uncertainty whether the Cortez Underground Expansion Project or any of the other Value Realization Initiatives will meet Barrick’s capital allocation objectives; the impact of global liquidity and credit availability on the timing of cash flows and the values of assets and liabilities based on projected future cash flows; the impact of inflation; fluctuations in the currency markets; changes in interest rates; changes in national and local government legislation, taxation, controls or regulations and/or changes in the administration of laws, policies and practices, expropriation or nationalization of property and political or economic developments in the United States; failure to comply with environmental and health and safety laws and regulations; timing of receipt of, or failure to comply with, necessary permits and approvals; litigation; contests over title to properties or over access to water, power and other required infrastructure; increased costs and physical risks, including extreme weather events and resource shortages, related to climate change; and availability and increased costs associated with mining inputs and labor. In addition, there are risks and hazards associated with the business of mineral exploration, development and mining, including environmental hazards, industrial accidents, unusual or unexpected formations, pressures, cave-ins, flooding and gold bullion, copper cathode or gold or copper concentrate losses (and the risk of inadequate insurance, or inability to obtain insurance, to cover these risks).
Many of these uncertainties and contingencies can affect Barrick’s actual results and could cause actual results to differ materially from those expressed or implied in any forward-looking statements made by, or on behalf of, Barrick. All of the forward-looking statements made in this report are qualified by these cautionary statements. Barrick and RPA and the Qualified Persons who authored this report undertake no obligation to update publicly or otherwise revise any forward-looking statements whether as a result of new information or future events or otherwise, except as may be required by law.
| | |
| | www.rpacan.com |
TABLE OF CONTENTS
| | | | |
| | | PAGE | |
| |
1 SUMMARY | | | 1-1 | |
Executive Summary | | | 1-1 | |
Technical Summary | | | 1-9 | |
| |
2 INTRODUCTION | | | 2-1 | |
| |
3 RELIANCE ON OTHER EXPERTS | | | 3-1 | |
| |
4 PROPERTY DESCRIPTION AND LOCATION | | | 4-1 | |
Land Tenure | | | 4-1 | |
Royalties | | | 4-2 | |
| |
5 ACCESSIBILITY, CLIMATE, LOCAL RESOURCES, INFRASTRUCTURE AND PHYSIOGRAPHY | | | 5-1 | |
Accessibility | | | 5-1 | |
Climate | | | 5-1 | |
Local Resources | | | 5-2 | |
Infrastructure | | | 5-2 | |
Physiography | | | 5-3 | |
| |
6 HISTORY | | | 6-1 | |
| |
7 GEOLOGICAL SETTING AND MINERALIZATION | | | 7-1 | |
Regional Geology | | | 7-1 | |
Local Geology | | | 7-5 | |
Property Geology | | | 7-9 | |
Mineralization | | | 7-12 | |
| |
8 DEPOSIT TYPES | | | 8-1 | |
| |
9 EXPLORATION | | | 9-1 | |
Exploration Potential | | | 9-1 | |
| |
10 DRILLING | | | 10-1 | |
Reverse Circulation Drilling Methods | | | 10-3 | |
Core Drilling Methods | | | 10-3 | |
Conventional and Mud Drilling Methods | | | 10-4 | |
Collar Surveys | | | 10-4 | |
Down Hole Surveys | | | 10-4 | |
Sample Recovery | | | 10-5 | |
Geotechnical and Hydrological Drilling | | | 10-5 | |
Grade Control Drilling | | | 10-6 | |
Mineral Resource Delineation Drilling | | | 10-6 | |
Sampling Method and Approach | | | 10-21 | |
Bulk Density Determination | | | 10-25 | |
Logging, Sampling, and Sample Storage facilities | | | 10-26 | |
| | |
Barrick Gold Corporation – Cortez Operations, Project 2471 Technical Report NI 43-101 – March 21, 2016 | | Page i |
| | |
| | www.rpacan.com |
| | | | |
RPA Comments on Sampling Method and Approach | | | 10-26 | |
Quality Assurance and Quality Control | | | 10-27 | |
Cortez Laboratory | | | 10-31 | |
RPA’s Comments on QA/QC | | | 10-32 | |
| |
11 SAMPLE PREPARATION, ANALYSES AND SECURITY | | | 11-1 | |
Analytical Laboratories | | | 11-1 | |
Sample Preparation | | | 11-2 | |
Analysis | | | 11-3 | |
Sample Security | | | 11-4 | |
RPA’S Comments on Sample Preparation, Analysis, and Security | | | 11-6 | |
| |
12 DATA VERIFICATION | | | 12-1 | |
Databases | | | 12-1 | |
Barrick Reviews | | | 12-1 | |
External Reviews | | | 12-3 | |
RPA Database Review | | | 12-3 | |
RPA Opinion | | | 12-2 | |
| |
13 MINERAL PROCESSING AND METALLURGICAL TESTING | | | 13-1 | |
Introduction | | | 13-1 | |
Metallurgical Testing | | | 13-1 | |
Ore Routing | | | 13-2 | |
Gold Recovery Estimates | | | 13-2 | |
Deep South Zone Metallurgical Testing | | | 13-7 | |
Summary and Conclusions | | | 13-9 | |
| |
14 MINERAL RESOURCE ESTIMATE | | | 14-1 | |
Summary | | | 14-1 | |
Pipeline Complex | | | 14-2 | |
Cortez Hills Complex | | | 14-20 | |
Cortez Pits | | | 14-39 | |
Gold Acres | | | 14-43 | |
| |
15 MINERAL RESERVE ESTIMATE | | | 15-1 | |
Summary | | | 15-1 | |
Open Pit Mineral Reserves | | | 15-6 | |
Underground Mineral Reserves | | | 15-20 | |
Reconciliation | | | 15-26 | |
RPA Opinion | | | 15-36 | |
| |
16 MINING METHODS | | | 16-1 | |
Recent Production History | | | 16-1 | |
Underground Mine | | | 16-15 | |
Cortez Life of Mine Plan | | | 16-41 | |
| |
17 RECOVERY METHODS | | | 17-1 | |
Introduction | | | 17-1 | |
Oxide Ore Milling | | | 17-1 | |
Oxide Ore Heap Leaching | | | 17-3 | |
| | |
Barrick Gold Corporation – Cortez Operations, Project 2471 Technical Report NI 43-101 – March 21, 2016 | | Page ii |
| | |
| | www.rpacan.com |
| | | | |
Refractory Ore Treatment | | | 17-4 | |
| |
18 PROJECT INFRASTRUCTURE | | | 18-1 | |
Roads | | | 18-1 | |
Tailings Storage Facility | | | 18-1 | |
Dumps | | | 18-1 | |
Stockpiles | | | 18-4 | |
Leach Pads | | | 18-4 | |
Power | | | 18-4 | |
| |
19 MARKET STUDIES AND CONTRACTS | | | 19-1 | |
Markets | | | 19-1 | |
Contracts | | | 19-1 | |
| |
20 ENVIRONMENTAL STUDIES, PERMITTING, AND SOCIAL OR COMMUNITY IMPACT | | | 20-1 | |
Environmental Studies | | | 20-1 | |
Mine Permitting | | | 20-1 | |
Social and Community Requirements | | | 20-9 | |
Mine Closure Requirements | | | 20-15 | |
| |
21 CAPITAL AND OPERATING COSTS | | | 21-1 | |
Capital Cost Estimate | | | 21-1 | |
Operating Costs | | | 21-2 | |
| |
22 ECONOMIC ANALYSIS | | | 22-1 | |
| |
23 ADJACENT PROPERTIES | | | 23-1 | |
| |
24 OTHER RELEVANT DATA AND INFORMATION | | | 24-1 | |
| |
25 INTERPRETATION AND CONCLUSIONS | | | 25-1 | |
| |
26 RECOMMENDATIONS | | | 26-1 | |
| |
27 REFERENCES | | | 27-1 | |
| |
28 DATE AND SIGNATURE PAGE | | | 28-1 | |
| |
29 CERTIFICATE OF QUALIFIED PERSON | | | 29-1 | |
LIST OF TABLES
| | | | | | |
| | | | | PAGE | |
| | |
Table 1-1 | | Mineral Resources – December 31, 2015 | | | 1-3 | |
Table 1-2 | | Mineral Reserves – December 31, 2015 | | | 1-4 | |
Table 1-3 | | Capital Costs | | | 1-18 | |
Table 1-4 | | LOM Operating Costs | | | 1-18 | |
Table 6-1 | | History of Exploration and Mining at Cortez Site | | | 6-2 | |
Table 6-2 | | Annual Production, 1969–2015 | | | 6-6 | |
Table 10-1 | | Drill Hole Types | | | 10-1 | |
Table 10-2 | | RC Sample Reduction | | | 10-22 | |
Table 10-3 | | Blast Hole Sample Reduction | | | 10-25 | |
| | |
Barrick Gold Corporation – Cortez Operations, Project 2471 Technical Report NI 43-101 – March 21, 2016 | | Page iii |
| | |
| | www.rpacan.com |
| | | | | | |
Table 11-1 | | Chain of Custody Summary | | | 11-6 | |
Table 13-1 | | Cortez Oxide Mill Gold Recovery Equations | | | 13-3 | |
Table 13-2 | | Cortez Heap Leach Ultimate Gold Recovery Equations | | | 13-3 | |
Table 13-3 | | Refractory Ore Gold Recovery Equations | | | 13-4 | |
Table 13-4 | | Production Data 2013-2015 | | | 13-5 | |
Table 13-5 | | Heap Leach Gold Production | | | 13-6 | |
Table 13-6 | | Deep South Zone Test Results (Au Recovery) | | | 13-8 | |
Table 13-7 | | Deep South Zone Optimization Samples Analytical Results | | | 13-9 | |
Table 14-1 | | Mineral Resource Summary – December 31, 2015 | | | 14-1 | |
Table 14-2 | | Cortez Mineral Resource Models | | | 14-2 | |
Table 14-3 | | Pipeline Complex Mineral Resource Summary – December 31, 2015 | | | 14-3 | |
Table 14-4 | | Pipeline Complex Mineral Resource Reporting Cut-off Grades | | | 14-4 | |
Table 14-5 | | Pipeline Complex Block Model Parameters | | | 14-6 | |
Table 14-6 | | Search Ellipse Orientations Of Structural Domains – Pipeline Complex | | | 14-8 | |
Table 14-7 | | Summary of Gold Grade Caps – Pipeline Complex | | | 14-9 | |
Table 14-8 | | Low Grade Omnidirectional Variogram Models – Pipeline Complex | | | 14-10 | |
Table 14-9 | | Estimation Pass Summary – Pipeline Complex | | | 14-12 | |
Table 14-10 | | Summary of Composite Weights – Pipeline Complex | | | 14-13 | |
Table 14-11 | | Bulk Density – Pipeline Complex | | | 14-14 | |
Table 14-12 | | Comparison of Basic Statistics of Gold Values – Pipeline Complex | | | 14-18 | |
Table 14-13 | | Cortez Hills Complex Mineral Resource Summary – December 31, 2015 | | | 14-20 | |
Table 14-14 | | Cortez Hills Complex Mineral Resource Reporting Cut-off Grades | | | 14-21 | |
Table 14-15 | | Cortez Hills Complex Block Model Parameters | | | 14-23 | |
Table 14-16 | | Cortez Hills Complex CapPing | | | 14-25 | |
Table 14-17 | | Cortez Hills Complex - Bulk Density | | | 14-27 | |
Table 14-18 | | Cortez Hills Complex - Classification Distance Criteria | | | 14-29 | |
Table 14-19 | | Cortez Pits Mineral Resource Summary – December 31, 2015 | | | 14-40 | |
Table 14-20 | | Cortez Pits - Estimation Pass Summary | | | 14-42 | |
Table 14-21 | | Cortez Pits - Bulk Density | | | 14-42 | |
Table 14-22 | | Gold Acres Refractory Mineral Resource Summary – December 31, 2015 | | | 14-44 | |
Table 14-23 | | Gold Acres Indicator Model Estimation Parameters | | | 14-45 | |
Table 14-24 | | Interpolation Passes Inside and Outside the Gold Acres 0.50 Indicator Model | | | 14-46 | |
Table 14-25 | | Gold Acres Bulk Density | | | 14-47 | |
Table 14-26 | | Gold Acres Untransformed Gold Statistics | | | 14-47 | |
Table 15-1 | | Total Mineral Reserves – December 31, 2015 | | | 15-2 | |
Table 15-2 | | Proportion of Reserves by Deposit | | | 15-5 | |
Table 15-3 | | Processing as Percent of Total Tons/Ounces | | | 15-6 | |
Table 15-4 | | Open Pit Leach Cut-Off Grades | | | 15-15 | |
Table 15-5 | | Open Pit Mill Cut-Off Grades | | | 15-16 | |
Table 15-6 | | Open Pit Refractory Cut-Off Grades | | | 15-17 | |
Table 15-7 | | Mill Leach Inter-Process Cut-Off Grade | | | 15-18 | |
Table 15-8 | | Cortez Hills and Pediment Whittle Pit Optimization Parameters | | | 15-19 | |
Table 15-9 | | Pipeline and Crossroads Whittle Pit Optimization Parameters | | | 15-19 | |
Table 15-10 | | Underground Cut-off Grade Calculations | | | 15-23 | |
Table 15-11 | | Cortez Hills Open Pit Reconciliation | | | 15-28 | |
Table 15-12 | | Cortez Hills Open Pit Reconciliation by Process Type | | | 15-29 | |
Table 15-13 | | Pipeline Open Pit Reconciliation | | | 15-31 | |
Table 15-14 | | Pipeline Open Pit Reconciliation By Process Type | | | 15-32 | |
Table 15-15 | | Underground Mineral Reserve Reconciliation | | | 15-33 | |
Table 16-1 | | Mine Operations Summary 2012-2015 | | | 16-1 | |
Table 16-2 | | Cortez Operation – LOM Open Pit Production | | | 16-11 | |
| | |
Barrick Gold Corporation – Cortez Operations, Project 2471 Technical Report NI 43-101 – March 21, 2016 | | Page iv |
| | |
| | www.rpacan.com |
| | | | | | |
Table 16-3 | | Cortez Hills/Pediment – LOM Open Pit Production | | | 16-12 | |
Table 16-4 | | Pipeline/Crossroads – LOM Open Pit Production | | | 16-12 | |
Table 16-5 | | Percentages of Mined Processing Ore Types | | | 16-13 | |
Table 16-6 | | Major Open Pit Equipment | | | 16-14 | |
Table 16-7 | | Rock mass characterization for the Deep South Zone | | | 16-22 | |
Table 16-8 | | Summary of Proposed Hydraulic Radii by Geotechnical Domain | | | 16-23 | |
Table 16-9 | | Underground Equipment Fleet | | | 16-36 | |
Table 16-10 | | Key Factors Deep South Zone PFS | | | 16-37 | |
Table 16-11 | | Underground LOM Production | | | 16-40 | |
Table 16-12 | | Underground LOM Ore Types | | | 16-40 | |
Table 16-13 | | Underground Ore Source By Zone | | | 16-41 | |
Table 16-14 | | Cortez Operation – LOM Mining | | | 16-42 | |
Table 16-15 | | LOM Ore Processed - Roaster | | | 16-43 | |
Table 16-16 | | LOM Ore Processed – Pipeline Mill | | | 16-43 | |
Table 16-17 | | LOM Ore Processed – Heap Leach | | | 16-44 | |
Table 16-18 | | LOM Total Ore Processed | | | 16-44 | |
Table 20-1 | | Important Environmental Documents and Plans of Operations for Pipeline and Cortez Hills | | | 20-3 | |
Table 20-2 | | Major Environmental Permits | | | 20-8 | |
Table 20-3 | | Surface Disturbance Authorization | | | 20-16 | |
Table 21-1 | | Capital Costs | | | 21-1 | |
Table 21-2 | | LOM Operating Costs | | | 21-2 | |
Table 21-3 | | Manpower | | | 21-2 | |
LIST OF FIGURES
| | | | | | |
| | | | | PAGE | |
| | |
Figure 4-1 | | Location Map | | | 4-3 | |
Figure 4-2 | | Land Ownership Map | | | 4-4 | |
Figure 4-3 | | Deposit Locations | | | 4-5 | |
Figure 4-4 | | Cortez Hills Infrastructure | | | 4-6 | |
Figure 4-5 | | Pipeline Complex Infrastructure | | | 4-7 | |
Figure 7-1 | | Regional Geology | | | 7-4 | |
Figure 7-2 | | Local Geology | | | 7-7 | |
Figure 7-3 | | Local Stratigraphy | | | 7-8 | |
Figure 10-1 | | Drill Hole Map | | | 10-2 | |
Figure 10-2 | | Pipeline Complex Drill Hole Plan | | | 10-8 | |
Figure 10-3 | | Pipeline Deposit – Cross Section 58000N (A-A’) | | | 10-9 | |
Figure 10-4 | | Crossroads Deposit - Cross Section 52800N (B-B’) | | | 10-10 | |
Figure 10-5 | | Gold Acres Drill Hole Plan | | | 10-11 | |
Figure 10-6 | | Gold Acres Deposit - Cross Section 59800N (A-A’) | | | 10-12 | |
Figure 10-7 | | Cortez Hills Drill Hole Plan | | | 10-14 | |
Figure 10-8 | | Cortez Hills – Cross Section 28600N (A-A’) Breccia, Middle and Lower Zones | | | 10-15 | |
Figure 10-9 | | Pediment - Long-Section B-B’ | | | 10-16 | |
Figure 10-10 | | Lower Zone - Long-Section C-C’ | | | 10-17 | |
Figure 10-11 | | Cortez Pits Area (NW Deeps) Drill Hole Plan | | | 10-19 | |
Figure 10-12 | | Cortez Pits Area – Cross Section 38200N | | | 10-20 | |
Figure 13-1 | | Historical Heap Leach Data | | | 13-7 | |
| | |
Barrick Gold Corporation – Cortez Operations, Project 2471 Technical Report NI 43-101 – March 21, 2016 | | Page v |
| | |
| | www.rpacan.com |
| | | | | | |
Figure 14-1 | | Resource Estimation Domains Pipeline Complex | | | 14-7 | |
Figure 14-2 | | Low Grade, Omnidirectional Variograms at Pipeline Complex | | | 14-11 | |
Figure 14-3 | | Mineral Resource Classification, Crossroads Deposit, Pipeline Complex | | | 14-15 | |
Figure 14-4 | | Section 52600 N: Comparison of Block and Composite Gold Grades at Crossroads Deposit, Pipeline Complex | | | 14-19 | |
Figure 14-5 | | Resource Estimation Domains Cortez Hills Complex | | | 14-24 | |
Figure 14-6 | | Comparison of Block and Composite Grades at Pediment Deposit, Cortez Hills Complex | | | 14-32 | |
Figure 14-7 | | Comparison of Block and Composite Grades within the Breccia Zone, Open Pit Portion, Cortez Hills Complex | | | 14-33 | |
Figure 14-8 | | Comparison of Block and Composite Grades within the Breccia Zone, Underground Portion, Cortez Hills Complex | | | 14-34 | |
Figure 14-9 | | Comparison of Block and Composite Grades within the Middle Zone, Cortez Hills Complex | | | 14-35 | |
Figure 14-10 | | Comparison of Block and Composite Grades within the Lower Zone, including Deep South, Cortez Hills Complex | | | 14-36 | |
Figure 14-11 | | CHUG Lower Zone Comparison of Block and Composite Mean by Middle Zone one | | | 14-37 | |
Figure 14-12 | | CHUG Middle Zone Comparison of Block and Composite Mean by Middle Zone one | | | 14-37 | |
Figure 14-13 | | CHUG Breccia Zone Comparison of Block and Composite Mean by Middle Zone one | | | 14-38 | |
Figure 14-14 | | CHOP Breccia Zone Comparison of Block and Composite Mean by Middle Zone one | | | 14-38 | |
Figure 14-15 | | CHOP Pediment Zone Comparison of Block and Composite Mean by Middle Zone one | | | 14-39 | |
Figure 15-1 | | Deposit Locations | | | 15-4 | |
Figure 15-2 | | Cortez Hills and Pediment Ultimate Pit Areas | | | 15-9 | |
Figure 15-3 | | Cortez Hills Open Pits, Waste Dumps, and Infrastructure | | | 15-10 | |
Figure 15-4 | | Pipeline and Crossroads Ultimate Pit Areas | | | 15-12 | |
Figure 15-5 | | Pipeline Pits and Phases | | | 15-13 | |
Figure 15-6 | | Schematic View of the Cortez Hills Underground | | | 15-22 | |
Figure 15-7 | | Total Underground Ore Reconciliation 2014-2015 | | | 15-34 | |
Figure 15-8 | | Underground Oxide Ore Reconciliation 2014-2015 | | | 15-35 | |
Figure 15-9 | | Underground Roaster Ore Reconciliation 2014-2015 | | | 15-36 | |
Figure 16-1 | | Site Layout | | | 16-3 | |
Figure 16-2 | | Cortez Hills Open Pit Recommended Pit Slope Design | | | 16-7 | |
Figure 16-3 | | Crossroads Recommended Slope Design | | | 16-8 | |
Figure 16-4 | | CHUG LOM Mine Production Rate | | | 16-16 | |
Figure 16-5 | | CHUG LOM Gold Production and Head Grade | | | 16-17 | |
Figure 16-6 | | Geotechnical Domains | | | 16-23 | |
Figure 16-7 | | Main Ramp Layout Relative to Geological Features, Looking North | | | 16-24 | |
Figure 17-1 | | Pipeline Mill Process Flow Sheet | | | 17-6 | |
Figure 17-2 | | Simplified Heap Leach Flow Sheet | | | 17-7 | |
Figure 17-3 | | Goldstrike Roaster Flow Sheet | | | 17-8 | |
Figure 18-1 | | Pipeline Complex Infrastructure | | | 18-2 | |
Figure 18-2 | | Cortez Hills Complex Infrastructure | | | 18-3 | |
Figure 20-1 | | Boundaries and Permit Areas | | | 20-2 | |
| | |
Barrick Gold Corporation – Cortez Operations, Project 2471 Technical Report NI 43-101 – March 21, 2016 | | Page vi |
| | |
| | www.rpacan.com |
1 SUMMARY
EXECUTIVE SUMMARY
Roscoe Postle Associates Inc. (RPA) was retained by Barrick Gold Corporation (Barrick) to prepare an independent Technical Report on the Cortez Open Pit and Underground Mine Operations (the Cortez Operations or the Mine), in Eureka and Lander Counties, Nevada, USA. The purpose of this report is to support public disclosure of Mineral Resources and Mineral Reserves at Cortez as of December 31, 2015. This Technical Report conforms to NI 43-101 Standards of Disclosure for Mineral Projects. RPA visited the operations between May 5 and 7, 2015.
Barrick is a Canadian publicly traded mining company with a portfolio of operating mines and projects across five continents. The Cortez Operations are located in northeastern Nevada approximately 62 mi west and south of Elko.
The Cortez Mine is a joint venture between two wholly-owned subsidiaries of Barrick, Barrick Cortez Inc. (60%) and Barrick Gold Finance Inc. (40%). The Cortez Operations consist of the Pipeline, Crossroads, Gap, Cortez Hills (CHOP), and Pediment open pits, the Cortez Hills underground (CHUG) mine, a 13,000 ton per day (stpd) carbon-in-leach (CIL) gold plant, heap leach pads and heap leach processing plants, the planned Crossroads open pit, with additional Mineral Resources contained in the Cortez Pits and Gold Acres open pits. The nearby deposit of Hilltop is also part of the Mine but does not have reportable resources at this time.
The open pit is a large scale operation utilizing a conventional truck and shovel fleet and mining approximately 400,000 stpd of ore and waste. Mining operations move between the various pits over the Life of Mine (LOM) plan. The underground mine is a 2,000 stpd mechanized mine. Ore from the mines is treated at an oxide mill at the site, on leach pads, and refractory ore is shipped to Barrick’s Goldstrike operation for processing.
Barrick completed a Pre-feasibility Study (PFS) for underground mining in the Deep South Zone (the Cortez Underground Expansion Project), below currently permitted areas of the CHUG. The PFS indicated that the project has the potential to contribute average underground production of more than 300,000 ounces per year between 2022 and 2026 at average all-in
| | |
Barrick Gold Corporation – Cortez Operations, Project 2471 Technical Report NI 43-101 – March 21, 2016 | | Page 1-1 |
| | |
| | www.rpacan.com |
sustaining costs of approximately $580 per ounce. More detailed planning, subsequent to the PFS, has resulted in the current LOM beginning underground gold production from the Deep South Zone in 2022 and producing 300,000 ounces per year between 2023 and 2027. Initial capital costs are estimated to be $153 million. The PFS supports conversion of approximately 1.7 million ounces of Measured and Indicated Resources in the Deep South Zone to Proven and Probable Reserves as of December 31, 2015.
The PFS timeline assumes that permitting will take approximately three to four years and Barrick expects to commence this process in the first half of 2016. On this basis, following the receipt of permits, dewatering and development work could begin as early as 2019 or 2020, with initial production from the Deep South Zone commencing in 2022. The expansion of the underground mine is expected to offset the impact of the end of mining in the Cortez Hills open pit, which is scheduled to conclude in 2018.
Table 1-1 summarizes the Cortez Mineral Resources as of December 31, 2015. Table 1-2 summarizes the Cortez Mineral Reserves as of December 31, 2015.
| | |
Barrick Gold Corporation – Cortez Operations, Project 2471 Technical Report NI 43-101 – March 21, 2016 | | Page 1-2 |
| | |
| | www.rpacan.com |
TABLE 1-1 MINERAL RESOURCES – DECEMBER 31, 2015
Barrick Gold Corporation – Cortez Operations
| | | | | | | | | | | | | | | | | | | | | | | | | | | | | | | | | | | | | | | | | | | | | | | | |
| | | Measured Resources | | | Indicated Resources | | | Measured + Indicated | | | Inferred Resources | |
Mine | | Tons
(000 st) | | | Grade
(oz/st
Au) | | | Contained
Gold
(000 oz) | | | Tons
(000 st) | | | Grade
(oz/st
Au) | | | Contained
Gold
(000 oz) | | | Tons
(000 st) | | | Grade
(oz/st
Au) | | | Contained
Gold
(000 oz) | | | Tons
(000 st) | | | Grade
(oz/st
Au) | | | Contained
Gold
(000 oz) | |
Open Pit | | | | | | | | | | | | | | | | | | | | | | | | | | | | | | | | | | | | | | | | | | | | | | | | |
Pipeline | | | 1,231 | | | | 0.022 | | | | 27 | | | | 14,617 | | | | 0.019 | | | | 275 | | | | 15,848 | | | | 0.019 | | | | 302 | | | | 1,698 | | | | 0.03 | | | | 44 | |
Gap | | | 167 | | | | 0.025 | | | | 4 | | | | 2,402 | | | | 0.019 | | | | 47 | | | | 2,569 | | | | 0.020 | | | | 51 | | | | — | | | | — | | | | — | |
Crossroads | | | 1,530 | | | | 0.014 | | | | 22 | | | | 17,500 | | | | 0.014 | | | | 237 | | | | 19,030 | | | | 0.014 | | | | 259 | | | | 12,220 | | | | 0.01 | | | | 167 | |
Gold Acres | | | 213 | | | | 0.124 | | | | 26 | | | | 3,266 | | | | 0.104 | | | | 340 | | | | 3,479 | | | | 0.105 | | | | 367 | | | | 305 | | | | 0.10 | | | | 32 | |
Cortez Hills | | | — | | | | — | | | | — | | | | — | | | | — | | | | — | | | | — | | | | — | | | | — | | | | 3,440 | | | | 0.04 | | | | 122 | |
Pediment | | | — | | | | — | | | | — | | | | — | | | | — | | | | — | | | | — | | | | — | | | | — | | | | 411 | | | | 0.01 | | | | 3 | |
Cortez Pits | | | 472 | | | | 0.094 | | | | 45 | | | | 3,611 | | | | 0.051 | | | | 183 | | | | 4,083 | | | | 0.056 | | | | 227 | | | | 1,283 | | | | 0.02 | | | | 27 | |
| | | | | | | | | | | | | | | | | | | | | | | | | | | | | | | | | | | | | | | | | | | | | | | | |
Sub-Total | | | 3,613 | | | | 0.034 | | | | 124 | | | | 41,395 | | | | 0.026 | | | | 1,082 | | | | 45,009 | | | | 0.027 | | | | 1,206 | | | | 19,359 | | | | 0.02 | | | | 395 | |
| | | | | | | | | | | | |
Underground | | | | | | | | | | | | | | | | | | | | | | | | | | | | | | | | | | | | | | | | | | | | | | | | |
Cortez Hills Breccia | | | 167 | | | | 0.339 | | | | 56 | | | | 335 | | | | 0.329 | | | | 110 | | | | 502 | | | | 0.332 | | | | 167 | | | | 9 | | | | 0.47 | | | | 4 | |
Cortez Hills Middle | | | — | | | | — | | | | — | | | | 1,065 | | | | 0.328 | | | | 350 | | | | 1,065 | | | | 0.328 | | | | 350 | | | | 82 | | | | 0.35 | | | | 28 | |
Cortez Hills Lower | | | — | | | | — | | | | — | | | | 942 | | | | 0.273 | | | | 257 | | | | 942 | | | | 0.273 | | | | 257 | | | | 541 | | | | 0.25 | | | | 133 | |
Cortez Deep South | | | — | | | | — | | | | — | | | | 663 | | | | 0.255 | | | | 169 | | | | 663 | | | | 0.255 | | | | 169 | | | | 710 | | | | 0.42 | | | | 301 | |
| | | | | | | | | | | | | | | | | | | | | | | | | | | | | | | | | | | | | | | | | | | | | | | | |
Sub-Total | | | 167 | | | | 0.339 | | | | 56 | | | | 3,005 | | | | 0.295 | | | | 886 | | | | 3,172 | | | | 0.297 | | | | 943 | | | | 1,341 | | | | 0.35 | | | | 466 | |
| | | | | | | | | | | | | | | | | | | | | | | | | | | | | | | | | | | | | | | | | | | | | | | | |
Total | | | 3,780 | | | | 0.048 | | | | 181 | | | | 44,400 | | | | 0.044 | | | | 1,969 | | | | 48,180 | | | | 0.045 | | | | 2,149 | | | | 20,700 | | | | 0.04 | | | | 861 | |
Notes:
| 1. | CIM definitions were followed for Mineral Resources. |
| 2. | Mineral Resources are estimated at various cut-off grades depending on material type and processing stream. |
| 3. | Mineral Resources are estimated using an average gold price of US$1,300 per ounce. |
| 4. | A minimum mining width of 10 ft was used. |
| 5. | Mineral Resources are additional to and exclusive of Mineral Reserves. |
| 6. | Numbers may not add due to rounding. |
| | |
Barrick Gold Corporation – Cortez Joint Venture, Project 2471 Technical Report NI 43-101 – March 21, 2016 | | Page 1-3 |
| | |
| | www.rpacan.com |
TABLE 1-2 MINERAL RESERVES – DECEMBER 31, 2015
Barrick Gold Corporation – Cortez Operations
| | | | | | | | | | | | | | | | | | | | | | | | | | | | | | | | | | | | | | | | |
| | | Total Proven | | Total Probable | | | | | Total Proven + Probable | |
Zone | | Tons
(000) | | | Grade
(oz/st) | | | Contained
Gold
(000 oz) | | | | | Tons
(000 st) | | | Grade
(oz/st Au) | | | Contained
Gold
(000 oz) | | | | | Tons
(000 st) | | | Grade
(oz/st Au) | | | Contained
Gold
(000) | |
Open Pit | | | | | | | | | | | | | | | | | | | | | | | | | | | | | | | | | | | | | | | | |
Pipeline | | | 1,470 | | | | 0.019 | | | | 28 | | | | | | 15,985 | | | | 0.017 | | | | 266 | | | | | | 17,455 | | | | 0.017 | | | | 294 | |
Crossroads | | | 8,135 | | | | 0.035 | | | | 287 | | | | | | 86,613 | | | | 0.033 | | | | 2,880 | | | | | | 94,749 | | | | 0.033 | | | | 3,167 | |
Cortez Hills | | | 1,564 | | | | 0.127 | | | | 198 | | | | | | 17,145 | | | | 0.116 | | | | 1,984 | | | | | | 18,709 | | | | 0.117 | | | | 2,182 | |
Pediment | | | 762 | | | | 0.032 | | | | 24 | | | | | | 20,506 | | | | 0.027 | | | | 547 | | | | | | 21,268 | | | | 0.027 | | | | 571 | |
Open Pit Subtotals | | | 11,931 | | | | 0.045 | | | | 537 | | | | | | 140,249 | | | | 0.040 | | | | 5,677 | | | | | | 152,181 | | | | 0.041 | | | | 6,214 | |
Underground | | | | | | | | | | | | | | | | | | | | | | | | | | | | | | | | | | | | | | | | |
Breccia Zone | | | 120 | | | | 0.514 | | | | 62 | | | | | | 205 | | | | 0.486 | | | | 100 | | | | | | 324 | | | | 0.497 | | | | 161 | |
Middle Zone | | | | | | | | | | | | | | | | | 3.544 | | | | 0.365 | | | | 1,292 | | | | | | 3,544 | | | | 0.365 | | | | 1,292 | |
Lower Zone | | | | | | | | | | | | | | | | | 3.777 | | | | 0.351 | | | | 1,324 | | | | | | 3,777 | | | | 0.351 | | | | 1,324 | |
Deep South | | | | | | | | | | | | | | | | | 5.266 | | | | 0.322 | | | | 1,697 | | | | | | 5,266 | | | | 0.322 | | | | 1,698 | |
Underground Subtotals | | | 120 | | | | 0.514 | | | | 62 | | | | | | 12,792 | | | | 0.345 | | | | 4,414 | | | | | | 12,912 | | | | 0.347 | | | | 4,476 | |
Stockpiles | | | | | | | | | | | | | | | | | | | | | | | | | | | | | | | | | | | | | | | | |
Mill Stockpiles | | | 1,510 | | | | 0.096 | | | | 145 | | | | | | | | | | | | | | | | | | | | | | | | | | | | | |
Leach Stockpiles | | | 57 | | | | 0.014 | | | | 1 | | | | | | | | | | | | | | | | | | | | | | | | | | | | | |
Refractory Stockpiles | | | 2,248 | | | | 0.130 | | | | 293 | | | | | | | | | | | | | | | | | | | | | | | | | | | | | |
Stockpile Subtotals | | | 3,814 | | | | 0.115 | | | | 438 | | | | | | | | | | | | | | | | | | | | 3,814 | | | | 0.115 | | | | 438 | |
Total | | | 15,866 | | | | 0.065 | | | | 1,037 | | | | | | 153,042 | | | | 0.066 | | | | 10,092 | | | | | | 168,908 | | | | 0.066 | | | | 11,129 | |
Notes:
| 1. | CIM definitions were followed for Mineral Reserves. |
| 2. | Mineral Reserves are estimated at cut-off grades that range from 0.004 oz/st Au to 0.205 oz/st Au depending on deposit, mining method, and process type. |
| 3. | Mineral Reserves are estimated using an average gold price of US$1,000 per ounce to year 2020 and US$ 1,200 per ounce thereafter. |
| 4. | A minimum mining width of 15 ft was used. |
| 5. | Bulk density varies from 0.052 st/ft3 to 0.091 st/ft3, depending on material type. |
| 6. | Numbers may not add due to rounding. |
| | |
Barrick Gold Corporation – Cortez Joint Venture, Project 2471 Technical Report NI 43-101 – March 21, 2016 | | Page 1-4 |
| | |
| | www.rpacan.com |
CONCLUSIONS
Based on the site visit and review of the documentation available, RPA offers the following interpretation and conclusions:
GEOLOGY AND MINERAL RESOURCES
| | • | | The Cortez deposits are “Carlin” style porphyry/epithermal deposits hosted by sedimentary rocks. |
| | • | | The sampling, sample preparation, analyses, security, and data verification meet or exceed industry standards and are appropriate for Mineral Resource estimation. |
| | • | | The parameters, assumptions, and methodology used for Mineral Resource estimation are appropriate for the style of mineralization. |
| | • | | Mineral Resources are reported exclusive of Mineral Reserves and are estimated effective December 31, 2015. |
| | • | | Total Mineral Resources at the Cortez Operations are: |
| | • | | Measured - 3.78 million tons, grading 0.048 oz/st Au, containing 181,000 oz Au. |
| | • | | Indicated - 44.40 million tons, grading 0.044 oz/st Au, containing 1,969,000 oz Au. |
| | • | | Inferred - 20.7 million tons, grading 0.04 oz/st Au, containing 861,000 oz Au. |
| | • | | Open Pit Mineral Resources at the Cortez Operations are: |
| | • | | Measured - 3.61 million tons, grading 0.034 oz/st Au, containing 124,000 oz Au. |
| | • | | Indicated - 41.40 million tons, grading 0.026 oz/st Au, containing 1,082,000 oz Au. |
| | • | | Inferred - 19.4 million tons, grading 0.02 oz/st Au, containing 395,000 oz Au. |
| | • | | Underground Mineral Resources at the Cortez Operations are: |
| | • | | Measured - 0.17 million tons, grading 0.339 oz/st Au, containing 56,000 oz Au. |
| | • | | Indicated - 3.01 million tons, grading 0.295 oz/st Au, containing 886,000 oz Au. |
| | • | | Inferred - 1.34 million tons, grading 0.35 oz/st Au, containing 466,000 oz Au. |
MINING AND MINERAL RESERVES
| | • | | The Mineral Reserves are contained within four open pit deposits, four zones in one underground deposit, and surface stockpiles. |
| | • | | The December 31, 2015 Mineral Reserves as stated by Cortez are estimated in a manner consistent with industry practices. |
| | • | | Total Mineral Reserves at the Cortez Operations are: |
| | • | | Proven: 15.9 million tons, grading 0.065 oz/st Au, containing 1.03 million oz Au. |
| | • | | Probable: 153.0 million tons, grading 0.066 oz/st Au, containing 10.09 million oz Au. |
| | • | | Open Pit Mineral Reserves at the Cortez Operations are: |
| | • | | Proven: 11.9 million tons, grading 0.045 oz/st Au, containing 0.54 million oz Au. |
| | |
Barrick Gold Corporation – Cortez Operations, Project 2471 Technical Report NI 43-101 – March 21, 2016 | | Page 1-5 |
| | |
| | www.rpacan.com |
| | • | | Probable: 140.2 million tons, grading 0.040 oz/st Au, containing 5.67 million oz Au. |
| | • | | Underground Mineral Reserves at the Cortez Operations are: |
| | • | | Proven: 0.1 million tons, grading 0.514 oz/st Au, containing 0.06 million oz Au. |
| | • | | Probable: 12.8 million tons, grading 0.345 oz/st Au, containing 4.41 million oz Au. |
| | • | | The open pit mine is a conventional operation that currently has 400 st and 345 st class off-highway haul trucks which are loaded by one 35 yd3 hydraulic shovel and five 48 yd3 to 77 yd3size electric shovels. |
| | • | | The Cortez operation is permitted to dewater up to approximately 36,000 gpm from the underground and open pit mine areas. |
| | • | | Mine production rates are projected to average 157 million tons per year (Mstpa) of total material from 2016 to 2022. Average open pit ore mining rate is approximately 19.1 Mstpa. |
| | • | | CHUG is a mechanized decline access underground mine operating at approximately 2,000 stpd of ore. |
| | • | | The Breccia, Middle, and Lower Zones of the underground mine are mined or planned to be mined using drift and fill mining methods. |
| | • | | The mining methods and equipment are considered to be suitable for the deposits. |
| | • | | In the Deep South Zone, Measured and Indicated Mineral Resources were converted to approximately 1.7 million oz of Proven and Probable Mineral Reserves as of year-end 2015 on the basis of a positive PFS. |
| | • | | The conclusions and recommendations of the Deep South Zone PFS are reasonable and appropriate for the deposit. |
| | • | | The Deep South Zone PFS work included re-evaluation of the geotechnical characteristics and the design for the mining of the Deep South includes long hole stoping which is expected to be more productive and lower cost than the drift and fill mining. |
| | • | | The Deep South Zone has the potential to be a standalone expansion of the CHUG. |
PROCESS
| | • | | RPA is of the opinion that metallurgical test work completed for the Mine has been appropriate to establish optimal processing routes for the different mineralization styles encountered in the deposits and that the gold recovery calculations for all of the processing options are currently appropriate to estimate the amount of gold that will be recovered over the LOM. |
| | |
Barrick Gold Corporation – Cortez Operations, Project 2471 Technical Report NI 43-101 – March 21, 2016 | | Page 1-6 |
| | |
| | www.rpacan.com |
| | • | | The mill and heap leach operations at Cortez are well run, cost effective processing facilities for oxide ore. |
| | • | | There are no appropriate processes for single and double refractory ore at Cortez. Therefore, these ore types are shipped to Goldstrike for processing. Limits to the transportation rates imposed by environmental permits restrict the amount of ore that can be shipped to 1.2 Mstpa. If additional refractory ore is mined, it must be stockpiled. |
| | • | | Total Carbonaceous Material (TCM) processing at Goldstrike is advanced technology that provides additional capacity for processing carbonaceous, preg-robbing ore without displacing material that is processed in the roaster. It also allows processing of ore with elevated concentrations of arsenic. The TCM technology uses calcium thiosulfate (CaTs) to leach the gold after pressure oxidation rather than cyanide and resin-in-pulp to recover the gold from the leach solution. |
ENVIRONMENTAL CONSIDERATIONS
| | • | | One of the risks to the Mine is the receipt of permit approvals from the various government agencies. |
| | • | | Cortez is diligent in managing its permitting and all environmental requirements for the property. |
| | • | | RPA is not aware of any environmental issues that could materially impact Barrick’s ability to extract the Mineral Resources or Mineral Reserves at this time. |
ECONOMIC ANALYSIS
| | • | | RPA has performed an economic analysis of the Cortez Operations using the estimates presented in this report and confirms that the outcome is a positive cash flow that supports the statement of Mineral Reserves. |
RECOMMENDATIONS
Based upon its work, RPA provides the following recommendations.
GEOLOGY AND MINERAL RESOURCES
| | • | | Continue to revise and update the Mineral Resource modelling procedures, with specific consideration to the potential additional mineralization trend in the Crossroads pit and the incorporation of an ordinary kriging run as an additional validation check at Cortez Hills. |
| | • | | Review the classification criteria, with consideration to variogram models based on single mineralization domains at Cortez Hills, and the inclusion of classification wireframe shells, particularly for the Measured component, or the incorporation of classification smoothing scripts. |
MINING AND MINERAL RESERVES
| | • | | Continue ore reconciliation tracking and attempt to identify and report the causes of any large changes on a monthly basis. |
| | |
Barrick Gold Corporation – Cortez Operations, Project 2471 Technical Report NI 43-101 – March 21, 2016 | | Page 1-7 |
| | |
| | www.rpacan.com |
| | • | | Present the reconciliation results showing the percentage differences and not the absolute differences. |
| | • | | Develop a set of orebody characteristics (width, height, grade, rock conditions) considered appropriate for long hole stoping and identify the quantity and location of those portions of the orebody amenable to long hole stoping. |
| | • | | Consider the Lower Zone rock bin capacity to ensure that a smooth ore feed from the mine can be maintained. |
| | • | | Review the small amounts of Inferred material within stope designs with a view to changing the classification of these small areas so that Inferred Mineral Resources are not included in the stope plans. |
| | • | | Modify the LOM and Mineral Reserve estimation process to include: |
| | • | | a reconciliation between the LOM plan and the Mineral Reserve estimate |
| | • | | a tabulation of the Mineral Resources converted by classification including the Inferred Mineral Resources |
| | • | | a review of those Inferred Mineral Resources within the LOM plan to determine whether any can or should be reclassified as Indicated Mineral Resources |
| | • | | the impact on the LOM plan of including the Inferred Mineral Resources within the plan at zero grade |
| | • | | Prepare detailed reconciliations and comparisons for any future conversions to new or different software packages to identify any issues in the process. |
| | • | | Continue the mine dewatering and careful highwall slope monitoring. |
| | • | | Re-evaluate the use of blast movement monitoring to improve grade control. |
| | • | | Develop detailed grade control accounting and stockpile management procedures. |
| | • | | Refine use of cross over grades, and standardize the Mineral Reserve reporting with the LOM production schedule. |
| | • | | Implement ore drive width increases to increase the productivity and/or production rate of the drift and fill mining. |
| | • | | Assess areas of the Lower Zone for the application of long hole stoping methods and implement trials if suitable areas can be identified. |
Continue to advance the planning of the Deep South Zone, which is included in the LOM plan, to optimize the production and development schedules in future years.
| | • | | Continue to evaluate the initiative to process mineralized waste concurrently with material from the underground resource. |
PROCESSING
| | • | | Continue to evaluate new ore types and to optimize the processes to increase recovery and/or to decrease costs. |
| | |
Barrick Gold Corporation – Cortez Operations, Project 2471 Technical Report NI 43-101 – March 21, 2016 | | Page 1-8 |
| | |
| | www.rpacan.com |
| | • | | Continue to work collaboratively with the Goldstrike staff to maintain and improve the metallurgical accounting for treatment of Cortez ore in the roaster and the TCM process. |
ENVIRONMENTAL
| | • | | Continue to expedite environmental permitting as required to support the changes in operations and development of new areas of the Mine. |
COSTS
| | • | | Continue to evaluate and implement opportunities for cost savings and profitability improvements. |
ECONOMIC ANALYSIS
Under NI 43-101 rules, producing issuers may exclude the information required in this section on properties currently in production, unless the technical report includes a material expansion of current production. RPA notes that Barrick is a producing issuer, the Cortez Mine is currently in production, and a material expansion is not being planned. RPA has performed an economic analysis of the Cortez Mine using the estimates presented in this report and confirms that the outcome is a positive cash flow that supports the statement of Mineral Reserves.
TECHNICAL SUMMARY
PROPERTY DESCRIPTION AND LOCATION
The Cortez Operations are located 62 mi southwest of Elko, Nevada, USA, in Eureka and Lander Counties.
All Mineral Reserves and Mineral Resources, in addition to existing and future facilities to be used to exploit the Mine’s deposits, are on public lands administered by the Battle Mountain or Elko Field Offices of the U.S. Department of Interior, Bureau of Land Management (BLM).
At Cortez, Barrick directly controls approximately 216,124 acres of mineral rights with ownership of mining claims and fee lands. There are 10,461 claims consisting of:
| | • | | 9,630 unpatented lode claims |
| | • | | 575 unpatented mill-site claims |
| | • | | 104 patented lode claims |
| | • | | 125 patented mill-site claims |
| | • | | 27 unpatented placer claims and 185 patented mill-site claims |
| | |
Barrick Gold Corporation – Cortez Operations, Project 2471 Technical Report NI 43-101 – March 21, 2016 | | Page 1-9 |
| | |
| | www.rpacan.com |
All lease agreements and claim holdings are current and in good standing.
EXISTING INFRASTRUCTURE
There is extensive infrastructure in place to support the Cortez Operations including:
| | • | | The 13,000 stpd No. 2 Mill complete with run-of-mine (ROM) pad and crushing circuit |
| | • | | Pipeline leach pad areas (Area 28 and Area 30) and gold recovery plant |
| | • | | Area 34 leach pad and gold recovery plant for the CHOP and Pediment |
| | • | | A tailings management facility |
| | • | | A gyratory crusher at the CHOP and an 11 mi long conveyor to the No. 2 Mill |
| | • | | Existing open pit mines at CHOP, Cortez, and Pipeline |
| | • | | Pit dewatering wells and pumps for the open pits and the CHUG |
| | • | | Infiltration ponds for the disposal of water |
| | • | | An existing underground mine at CHUG |
| | • | | Batch plant for shotcrete and cemented rock fill preparation |
| | • | | Stockpile areas for an assortment of ore types |
| | • | | Office complexes at the Mill No. 2, Mill No. 1, CHUG, and CHOP |
| | • | | Equipment maintenance shops at CHOP, CHUG, and adjacent to the Mill No. 2 |
| | • | | Exploration offices, core handling and core storage warehouse |
| | • | | System of public and private roads connecting the facilities |
| | • | | Shared business support services from the business unit offices in Elko |
HISTORY
Mining in the Cortez Mining District began with the discovery of silver ore in 1862. Underground silver mining was conducted in the area until the 1930s. Mineralization at Hilltop was also identified during the 1860s. Gold mineralization at Gold Acres was discovered in the late 1920s and mined by a small mining company from 1935 to 1960.
In 1959, American Exploration & Mining Co. (AMEX), a wholly-owned US subsidiary of Placer Development Ltd. (subsequently Placer Dome Inc.), entered into a lease-option agreement on the properties and started extensive exploration. In 1964, AMEX formed the Cortez Joint Venture (CJV).
The CJV initiated open pit mining in the Cortez open pits from 1968 to 1972 and moved to the Gold Acres North and South pits in 1973. Leaching and milling of Gold Acres stockpiles and
| | |
Barrick Gold Corporation – Cortez Operations, Project 2471 Technical Report NI 43-101 – March 21, 2016 | | Page 1-10 |
| | |
| | www.rpacan.com |
dumps continued until 1983. Mill grade ores were mined from 1987 to 1996 and processed at Cortez Mill No. 1. In 2003, the CJV commenced shipping Gold Acres refractory stockpiles for toll processing at third-party facilities.
The Horse Canyon deposits were discovered in early 1976. Three pits, North, South, and South Extension, were mined in the period from 1984 to 1987. Exploration drilling campaigns at the Horse Creek deposit, originally discovered in the late 1960s, occurred in the mid-1980s and intermittently over the last ten years and are ongoing.
The Pipeline deposit was discovered by CJV geologists in March 1991 during drilling of deep condemnation holes. The Gap deposit was discovered in 1991 adjacent to the planned Stage 9 of the Pipeline pit.
In November 1991, CJV discovered the South Pipeline deposit. Construction of Mill No. 2 and pre-stripping of the first stage of the Pipeline pit began in 1996. Continued drilling resulted in the 1998 discovery of the Crossroads deposit beneath 550 ft of alluvium.
In 1996, CJV geologists began a program that led to the 1998 discovery of the Pediment deposit. The Cortez Hills deposit was discovered in October 2002. In 2004, the Cortez Hills Lower Zone was discovered. In November 2008, the Environmental Impact Statement (EIS) for the Cortez–Pediment development was approved. Production from underground began in late 2008, and the first ore production from CHOP occurred in late December 2009.
Barrick acquired an interest in Cortez through the 2006 acquisition of Placer Dome Inc. In March 2008, Barrick acquired its 100% interest in the Mine, purchasing the former Kennecott 40% interest, from Rio Tinto.
GEOLOGY AND MINERALIZATION
The Cortez gold district is in the eastern Great Basin of the Basin and Range Province. The Paleozoic basement rocks of northeastern Nevada are made up of a western deep-water, eugeoclinal siliclastic assemblage (Upper Plate) and an eastern shallow-water, miogeosynclinal carbonate assemblage (Lower Plate) of sedimentary strata. Cortez lies within the “Battle Mountain-Eureka Trend” (BMT), an alignment of gold mines and occurrences located in a northwest-southeast belt extending from the Marigold Mine some 50 mi northwest
| | |
Barrick Gold Corporation – Cortez Operations, Project 2471 Technical Report NI 43-101 – March 21, 2016 | | Page 1-11 |
| | |
| | www.rpacan.com |
of Cortez, to Ruby Hill at Eureka 60 mi to the southeast. Paleozoic basement rocks have been folded and faulted, and cut by younger Jurassic and Tertiary aged intrusions.
The Cortez deposits are “Carlin” style sedimentary rock-hosted and porphyry/epithermal deposits. Carlin deposits form as structurally and/or stratigraphically controlled replacement bodies consisting of strata-bound, tabular, disseminated gold mineralization occurring in Silurian-Devonian carbonate rocks. Deposits are localized at contacts between contrasting lithologies, metamorphosed to varying extents. They can also be discordant or breccia-related. The deposits are hydrothermal in origin, are usually structurally controlled and at Cortez are hosted in Lower Plate carbonate strata exposed by two erosional windows through allochthonous Upper Plate siliclastic units; the windows are on either side of Crescent Valley.
Mineralization consists primarily of submicron to micrometre-sized gold particles, very fine sulphide grains, and gold in solid solution in pyrite. Gold is disseminated throughout the host rock matrix in zones of silicified and decarbonatized, argillized, silty calcareous rocks, and associated jasperoids. Gold may occur around limonite pseudomorphs of authigenic pyrite and arsenopyrite. Major ore minerals include native gold, pyrite, arsenopyrite, stibnite, realgar, orpiment, cinnabar, fluorite, barite, and rare thallium minerals. Gangue minerals typically comprise fine-grained quartz, barite, clay minerals, carbonaceous matter, and late-stage calcite veins.
In the Cortez district, the favoured host rocks for gold mineralization are the Devonian Wenban Limestone, followed by the Horse Canyon and Roberts Mountain Formations. Mineralization reflects an interplay between structural and lithological ore controls in which hydrothermal solutions from intrusives moved to favourable porous decalcified limestone.
Mineralized host rocks are predominantly characterized as oxides, along with sulphidic and carbonaceous refractory material. Carbon content in the deposits is highly variable and occurs generally in the Devonian Wenban Limestone and the Roberts Mountain Formation. Supergene alteration extends up to 656 ft depth resulting in oxide ores, which overlie the refractory sulphides. Alteration has liberated gold by the destruction of pyrite and resulted in the formation of oxide and secondary sulphate minerals, which include goethite, hematite, jarosite, scorodite, alunite, and gypsum.
| | |
Barrick Gold Corporation – Cortez Operations, Project 2471 Technical Report NI 43-101 – March 21, 2016 | | Page 1-12 |
| | |
| | www.rpacan.com |
EXPLORATION STATUS
Modern exploration commenced along the Battle Mountain–Eureka Trend in the 1960s, and has been nearly continuous since that time. Exploration in the Cortez district has been undertaken by Barrick and its predecessor companies such as the CJV and has included mapping, various geochemical and geophysical surveys, pitting, trenching, petrographic, and mineralogy studies, and various types of drilling.
Barrick has advanced stage exploration drilling projects at Cortez. Exploration projects include underground drilling programs at Cortez Hills Lower Zone (Deep South), Horse Canyon Cortez exploration project, and metallurgical testwork at Hilltop.
MINERAL RESOURCES
RPA considers the December 31, 2015 Mineral Resource estimate completed by Barrick to be reasonable, acceptable, and reported in compliance with Canadian Institute of Mining, Metallurgy and Petroleum (CIM) Definition Standards for Mineral Resources and Mineral Reserves dated May 10, 2014 (CIM definitions) as incorporated by reference into NI 43-101. The Mineral Resources are exclusive of Mineral Reserves and are summarized in Table 1-1.
The Mineral Resources are estimated from three dimensional block models created using Vulcan software. Surfaces and solids representing topography, overburden, geological units, and gold mineralization were incorporated into the resource block models. Resource estimates utilize drill hole, survey, geological, analytical and bulk density information entered, validated and maintained in a centralized acQuire SQL Server database. Industry standard best practices were used to obtain the data; quality assurance and quality control (QA/QC) protocols, as well as data validation procedures, were employed to ensure that the quality and quantity of data used for the resource estimates were appropriate and acceptable.
MINERAL RESERVES
The Mineral Reserves for Cortez as of December 31, 2015 are summarized in Table 1-2. These Mineral Reserves are a combination of the open pit and underground operations and the stockpiles.
RPA considers the Mineral Reserve estimate, completed by Barrick, to be reasonable, acceptable, and reported in accordance with CIM definitions and NI 43-101. The Mineral
| | |
Barrick Gold Corporation – Cortez Operations, Project 2471 Technical Report NI 43-101 – March 21, 2016 | | Page 1-13 |
| | |
| | www.rpacan.com |
Reserves are generated based upon the mine designs applied to the Measured and Indicated Mineral Resources. The design methodology uses both the cut-off grade estimation and economic assessment to design and validate the Mineral Reserves.
MINING METHOD
The current Cortez site has been operating since 1988. Currently, the active mining areas are the Cortez Hills and Pediment pits, the Pipeline and Crossroads pits, and the Cortez Hills underground.
Open pit mining at Cortez Hills and Pipeline is by conventional open pit methods using hydraulic and electric front shovels and large, off-highway dump haul trucks. The open pit mine life is estimated to be three years for Cortez Hills (2016 through 2018) and eight years for the Pipeline Complex (2016 through 2023). The open pit operations has an estimated current daily material movement capacity of 400,000 stpd.
Underground mining is being carried out in the Breccia, Middle, and Lower zones. The underground mine is operating at a rate of 2,000 stpd with all ore hauled to surface by truck. The mining is all by drift and fill mining method. Management are working on plans to increase the mine production by improving the productivity of the drift and fill mining and implementing long hole stoping in some areas of the Lower Zone. Under the current mine plan, which includes the Deep South Zone project, underground mining at Cortez Hills is scheduled through 2028.
As a result of a positive PFS completed in 2015, approximately 1.7 million ounces of Measured and Indicated Mineral Resources in the Deep South Zone, a down dip extension of the Lower Zone below the 3,800 ft level, were converted to Proven and Probable Mineral Reserves as of year-end 2015. Under the current mine plan, which incorporates the Cortez Underground Expansion Project, the Deep South Zone is proposed to be mined using long hole stoping methods and will use extensions to the planned Lower Zone infrastructure for the movement of rock, men, and materials. Mining of the Deep South Zone requires dewatering below the 3,800 ft level and this requires an amendment to the Plan of Operations (PoO). The permitting process is expected to take three to four years. This permit amendment application is planned to be submitted in 2016. On this basis, following the receipt of permits, dewatering and development work could begin as early as 2019 or 2020, with initial production from the Deep South Zone commencing in 2022. The expansion of the underground mine will help to offset
| | |
Barrick Gold Corporation – Cortez Operations, Project 2471 Technical Report NI 43-101 – March 21, 2016 | | Page 1-14 |
| | |
| | www.rpacan.com |
the impact of the end of mining in the Cortez Hills open pit, which is expected to conclude in 2018. The majority of the ore in the Deep South Zone is oxide ore which is proposed to be treated in the Pipeline Mill or at heap leach facilities at Cortez after the Pipeline Mill operation ceases in 2023.
Over the past four years, the underground mine production has been steady at approximately 2,000 stpd to 2,200 stpd ore. Over the same period, the grade has decreased from 1.07 oz/st Au to 0.63 oz/st Au.
In 2015, 23.4 Mst of ore was mined and 24.7 Mst was processed at a head grade of 0.50 oz/st Au. Gold production was 999,278 oz.
MINERAL PROCESSING
Ore from Cortez is either processed on site in the oxide processing facilities or transported to Barrick’s Goldstrike operation for refractory ore treatment.
Mill No. 2, or the Pipeline mill, is a nominal 13,000 stpd oxide processing plant with crushing, a semi-autogenous grinding (SAG) mill, a ball mill, grind thickener, a carbon-in-column (CIC) circuit for the grind thickener overflow solution, a CIL circuit, tailings counter-current-decantation (CCD) wash thickener circuit, carbon stripping and reactivation circuits, and a refinery to produce gold doré.
A primary gyratory crusher is located adjacent to the CHOP together with a series of overland conveyors that transport the ore to the coarse ore stockpile at Mill No. 2. There is a primary jaw crusher at Mill No. 2 that is used when processing ore from Pipeline and in the future, Crossroads.
Tailings are stored in a zero-discharge tailings storage facility. A double liner covers the entire tailings area, extending completely under the dam embankment.
Low-grade oxide material is leached as ROM ore on three prepared double-lined leach pads. Pregnant solution from the leach pads is fed to CIC columns for gold recovery. The loaded carbon from the heap leach operation is transported to the mill for gold recovery.
| | |
Barrick Gold Corporation – Cortez Operations, Project 2471 Technical Report NI 43-101 – March 21, 2016 | | Page 1-15 |
| | |
| | www.rpacan.com |
Area 28 heap leach circuit has a water balance that is interlinked with the Pipeline mill circuit since it uses the tailings pond under-drain solution as leach solution and excess pad effluent is processed in the mill CIC circuit. Area 28 is at maximum capacity for ore stacking and is no longer an operating leach pad. The Area 30 heap leach circuit is independent of the Pipeline mill. Ore delivery to the pad recommenced in 2013 and is set to continue through 2023. Area 34 heap leach is a third pad that was designed to treat CHOP ore. The first cells were placed under leach during March 2011 and ore deliveries are scheduled to continue through 2018 based on the current LOM plan.
Ores that have a cyanide soluble (shake test) to fire assay gold (AA/FA) ratio of less than 50% are transported to Goldstrike for processing in either the pressure oxidation (POX) circuit or the roaster. Haulage of refractory ore to Goldstrike is currently limited by permit to 1.2 Mstpa. At Goldstrike, two options are currently available for processing refractory ore. It will either be processed in the roaster followed by a CIL circuit or in the TCM process, which includes POX followed by resin-in-leach with CaTs.
MARKET STUDIES
Gold is the principal commodity at Cortez and is freely traded, at prices that are widely known, so that prospects for sale of any production are virtually assured. Prices are usually quoted in US dollars per troy ounce.
ENVIRONMENTAL, PERMITTING, AND SOCIAL CONSIDERATIONS
Cortez and Barrick have environmental groups and management systems to ensure that the necessary permits and licences are obtained and maintained. These groups also carry out the required monitoring and reporting required. Cortez has developed an environmental management system (EMS) to help manage the environmental requirements.
The BLM issued the original EIS and Record of Decision (ROD) in November 2008 and a supplemental EIS and ROD in March 2011. In October 2012, Cortez submitted a second proposed amendment to the existing PoO (APO2). All components of the APO2 application were approved by the BLM on February 24, 2014.
Cortez submitted additional proposed modifications to the PoO in August 2014 and then, following a revision, in October 2014. The proposed modifications include:
| | |
Barrick Gold Corporation – Cortez Operations, Project 2471 Technical Report NI 43-101 – March 21, 2016 | | Page 1-16 |
| | |
| | www.rpacan.com |
| | • | | Deepen the Gap Pit from 4,400 ft amsl to 4,360 ft amsl |
| | • | | Construct the Range Front Declines and associated infrastructure |
| | • | | Expand the Area 30 heap leach facilities by 240 acres |
| | • | | Modify mining rate between the Cortez Hills and Pipeline |
| | • | | Add a water treatment plant and infrastructure to reduce naturally occurring arsenic concentrations in the dewatering water |
| | • | | Allow off-site ore haulage up to approximately 1.2 Mstpa site wide |
| | • | | Reconfigure the Pipeline, Canyon, and Gap waste rock facilities |
| | • | | Infrastructure additions |
An APO-3 was approved by the BLM and a ROD was completed in 2015.
A number of permits are required to operate the Cortez Mine. Cortez adheres to permitting guidelines from the BLM, the Nevada Revised Statutes (NRS), the Nevada Administrative Code (NAC), and other federal government requirements.
CAPITAL AND OPERATING COST ESTIMATES
The total capital expenditure in the 2016 LOM plan is $2,011 million broken down as shown in Table 1-3.
This total includes capital required to expand underground mining into the Deep South Zone below currently permitted levels. The project has the potential to contribute underground production beginning in 2022 and will average more than 300,000 ounces per year between 2023 and 2027 at average all-in sustaining costs of approximately $580 per ounce. Initial capital costs are estimated to be $153 million and sustaining capital is estimated to be $58 million, for the Deep South Zone project total of $211 million.
| | |
Barrick Gold Corporation – Cortez Operations, Project 2471 Technical Report NI 43-101 – March 21, 2016 | | Page 1-17 |
| | |
| | www.rpacan.com |
TABLE 1-3 CAPITAL COSTS
Barrick Gold Corporation – Cortez Operations
| | | | | | | | | | | | | | | | | | | | | | | | | | | | | | | | |
Year | | | | | Deferred
Operating | | | Expansion | | | Exploration | | | Fixed
Equipment | | | Mobile
Equipment | | | Regulatory | | | Grand
Total | |
2016 | | US$ | M | | | | 58.6 | | | | 222.1 | | | | 9.8 | | | | 43.5 | | | | 7.4 | | | | 9.1 | | | | 350.5 | |
2017 | | US$ | M | | | | 50.7 | | | | 284.1 | | | | 8.1 | | | | 19.8 | | | | 9.3 | | | | 5.0 | | | | 376.9 | |
2018 | | US$ | M | | | | 145.5 | | | | 169.3 | | | | 11.8 | | | | 22.5 | | | | 12.8 | | | | 37.8 | | | | 399.7 | |
2019 | | US$ | M | | | | 253.8 | | | | 61.5 | | | | 11.0 | | | | 22.5 | | | | 6.1 | | | | 7.4 | | | | 362.2 | |
2020 | | US$ | M | | | | 131.7 | | | | 29.5 | | | | 11.3 | | | | 13.8 | | | | 12.4 | | | | 1.8 | | | | 200.5 | |
2021 | | US$ | M | | | | 19.7 | | | | 21.7 | | | | 6.1 | | | | 13.4 | | | | 7.9 | | | | 1.6 | | | | 70.5 | |
2022 | | US$ | M | | | | 12.9 | | | | 6.8 | | | | 4.0 | | | | 7.5 | | | | 10.7 | | | | 1.6 | | | | 43.6 | |
2023 | | US$ | M | | | | 29.5 | | | | 5.7 | | | | 2.9 | | | | 2.2 | | | | 5.9 | | | | 1.6 | | | | 47.8 | |
2024 | | US$ | M | | | | 46.2 | | | | 7.7 | | | | 2.6 | | | | 0.4 | | | | 8.4 | | | | 1.6 | | | | 67.0 | |
2025 | | US$ | M | | | | 41.4 | | | | 29.4 | | | | 1.8 | | | | 0.4 | | | | 9.8 | | | | 1.7 | | | | 84.5 | |
2026 | | US$ | M | | | | 0.9 | | | | 2.3 | | | | 1.6 | | | | 0.3 | | | | — | | | | 1.6 | | | | 6.7 | |
2027 | | US$ | M | | | | — | | | | — | | | | — | | | | — | | | | — | | | | 0.5 | | | | 0.5 | |
2028 | | US$ | M | | | | — | | | | — | | | | — | | | | — | | | | — | | | | 0.5 | | | | 0.5 | |
Total | | US$ | M | | | | 791 | | | | 840 | | | | 71 | | | | 146 | | | | 91 | | | | 72 | | | | 2,011 | |
The LOM operating costs are shown in Table 1-4.
TABLE 1-4 LOM OPERATING COSTS
Barrick Gold Corporation – Cortez Operations
| | | | | | | | | | | | |
| | | Unit | | | Open Pit | | | Underground | |
Mine $/t mined | | US$ | /st mined | | | | 1.79 | | | | 86.59 | |
| | | |
Mine $/t milled | | US$ | /st milled | | | | 12.60 | | | | 104.82 | |
Process | | US$ | /st milled | | | | 7.43 | | | | 22.87 | |
G&A | | US$ | /st milled | | | | 2.40 | | | | 24.02 | |
Refine freight | | US$ | /st milled | | | | 0.01 | | | | 0.09 | |
Royalty | | US$ | /st milled | | | | 2.21 | | | | 4.90 | |
Total | | US$ | /st milled | | | | 24.66 | | | | 156.70 | |
VALUE REALIZATION INITIATIVES
In addition to the Cortez Underground Expansion, i.e., expanding underground mining into the Deep South Zone, below currently permitted levels, Barrick has recently conducted a technical review of the Cortez Operations with the objective of identifying potential opportunities to increase production capacity. The opportunities that have been identified so far include:
| | |
Barrick Gold Corporation – Cortez Operations, Project 2471 Technical Report NI 43-101 – March 21, 2016 | | Page 1-18 |
| | |
| | www.rpacan.com |
CORTEZ PITS MINING
The Cortez Pits area is located to the north of the current Cortez Hills underground portal and the area was previously mined between 1969 and 1993. There is a remaining resource below the historic Cortez Pits that is a continuation of the mined-out portion of the Cortez deposit. The current reported Measured plus Indicated Mineral Resources total 4.1 Mt at a grade of 0.056 oz/st Au with 227,000 oz of contained gold. Pending the appropriate level of studies to convert the mineralization to Mineral Reserves, mining would be by open pit methods of the primarily heap leach grade material. A total of 163,000 oz is expected to be recovered using a process recovery of 74.1%.
There is sufficient drilling information associated with this deposit to model the resource in terms of gold grade, however, additional drilling information is required for geotechnical guidance and metallurgical testing. The deposit also allows for resource upgrades at gold prices greater than US$1,400.
HAULAGE CAPACITY INCREASE
The Cortez Hills operation currently ships refractory ores via over-the-highway haul trucks to the Goldstrike operation for processing. Haulage is currently limited by permit to 1.2 Mstpa. An opportunity exists to expand the shipping rate to 2.2 Mstpa during the APO-4 permitting process, allowing increased shipping to begin upon permit receipt in 2020. Permit submittal is currently scheduled for Q1 2016.
Additional technical studies are underway to determine increased haulage parameters including fleet sizing and road base suitability.
Increased shipping rates will allow advancing the current LOM production stream of refractory material.
PRODUCTION CAPACITY INCREASE BY 10%
Cortez Hills operation has identified an opportunity to increase production capacity by an approximately 10% increase of the CIL process plan and heap leach (HL) capacity. This will be achieved as follows:
| | • | | Partial solution recycle is pursued applying pregnant leach solution to new material for the first 30 days of leaching. |
| | • | | CIL process plant throughput is achieved by maximizing SAG and ball mill power draw along with improved secondary grinding circuit control strategies. |
| | |
Barrick Gold Corporation – Cortez Operations, Project 2471 Technical Report NI 43-101 – March 21, 2016 | | Page 1-19 |
| | |
| | www.rpacan.com |
| | • | | Increased capacity will advance production and cash flow streams along with slight reduction in unit costs. Implementation is currently underway (10% complete) as the majority of infrastructure is in place. Capital cost is estimated to be $10 million (conceptual level) for solution distribution. Improvements in throughput are estimated to be 10% to 20% for HL and 5% to 12% for CIL. |
| | |
Barrick Gold Corporation – Cortez Operations, Project 2471 Technical Report NI 43-101 – March 21, 2016 | | Page 1-20 |
| | |
| | www.rpacan.com |
2 INTRODUCTION
Roscoe Postle Associates Inc. (RPA) was retained by Barrick Gold Corporation (Barrick) to prepare an independent Technical Report on the Cortez Open Pit and Underground Mine Operations (the Cortez Operations or the Mine), in Eureka and Lander Counties, Nevada, USA. The purpose of this report is to support the public disclosure of Mineral Resources and Mineral Reserves at Cortez as of December 31, 2015. This Technical Report conforms to NI 43-101 Standards of Disclosure for Mineral Projects.
Barrick is a Canadian publicly traded mining company with a portfolio of operating mines and projects across five continents. The Cortez Operations are located in northeastern Nevada approximately 62 mi west and south of Elko.
The Cortez Mine is a joint venture between two wholly-owned subsidiaries of Barrick, Barrick Cortez Inc. (60%) and Barrick Gold Finance Inc. (40%). The Cortez Hills Project is 100% owned by Barrick Cortez Inc. The Cortez Operations consist of the Pipeline, Crossroads, Gap, Cortez Hills (CHOP), and Pediment open pits, the Cortez Hills underground (CHUG) mine, a 13,000 short ton per day (stpd) carbon-in-leach (CIL) gold plant, heap leach pads and heap leach processing plants, and the planned Crossroads open pit, with additional Mineral Resources contained in the Cortez Pits and Gold Acres open pits. The nearby deposit of Hilltop is also part of the Mine but does not have reportable resources at this time.
The open pit is a large scale operation utilizing a conventional truck and shovel fleet and mining approximately 400,000 stpd of ore and waste. Mining operations move between the various pits over the Life of Mine (LOM) plan. The underground mine is a 2,000 stpd mechanized mine. Ore from the mines is treated at an oxide mill at the site and on leach pads and refractory ore is shipped to Barrick’s Goldstrike operation for processing.
Barrick completed a Pre-feasibility Study (PFS) for underground mining in the Deep South Zone (the Cortez Underground Expansion Project), below currently permitted areas of the CHUG. The PFS indicated that the project has the potential to contribute underground production of more than 300,000 ounces per year between 2022 and 2026 at average all-in sustaining costs of approximately $580 per ounce. More detailed planning, subsequent to the PFS, has resulted in the current LOM beginning underground gold production from the Deep
| | |
Barrick Gold Corporation – Cortez Operations, Project 2471 Technical Report NI 43-101 – March 21, 2016 | | Page 2-1 |
| | |
| | www.rpacan.com |
South Zone in 2022 and producing 300,000 ounces per year between 2023 and 2027. Initial capital costs are estimated to be $153 million. The PFS supports conversion of approximately 1.7 million ounces of Measured and Indicated Resources in the Deep South Zone to Proven and Probable Reserves as of December 31, 2015.
The PFS timeline assumes that permitting will take approximately three to four years and Barrick expects to commence this process in the first half of 2016. On this basis, following the receipt of permits, dewatering and development work could begin as early as 2019 or 2020, with initial production from the Deep South Zone commencing in 2022. The expansion of the underground mine is expected to offset the impact of the end of mining in the Cortez Hills open pit, which is scheduled to conclude in 2018.
SOURCES OF INFORMATION
Site visits were carried out by Wayne Valliant, P.Geo., RPA Principal Geologist, Chester Moore P.Eng., RPA Principal Geologist, Dennis Bergen, P.Eng., RPA Associate Principal Mining Engineer, Stuart Collins, P.E., RPA Principal Mining Engineer, and Kathleen Ann Altman, Ph.D., P.E., RPA Principal Metallurgist, from May 5 to 7, 2015.
Discussions were held with personnel from Barrick and Cortez:
| | • | | Larry Snider, Senior Resource Geologist |
| | • | | Roger Bond, Senior Geologist |
| | • | | Andrew Ostendorf, Resource Geologist |
| | • | | Felipe Salamanca, Open Pit Chief Engineer |
| | • | | Robert Dudley, Accounting Supervisor |
| | • | | Jim MacPherson, Senior Mine Engineer |
| | • | | Dave Pierce, Water Management Superintendent |
| | • | | Lynnette Hutson, Senior Business Analyst |
| | • | | Patrick Jenks, Chief Geotechnical Engineer |
| | • | | Mark D. Miller, Environmental Manager |
| | • | | Nick Atiemo, Environmental Superintendent |
| | • | | Brian D. Taylor, Environmental Specialist III (Public Lands) |
| | • | | Amiee Keys, Environmental Specialist II (Environmental Management System) |
| | • | | Steve Cashin, Process Manager |
| | • | | Jon Kamensky, Superintendent Metallurgical Services & Heap Operations |
| | • | | Jeff Olson, Metallurgist |
| | • | | Emrah Yalcin, Senior Metallurgist |
| | • | | Pamela Moyo, Senior Metallurgical Engineer |
| | • | | Erin Lee Buck, Metallurgist |
| | • | | James (Sam) Edens, Metallurgical Coordinator |
| | • | | Brandon Cooper, Metallurgist |
| | • | | Theo Kandawasvika, Technical Services Superintendent |
| | |
Barrick Gold Corporation – Cortez Operations, Project 2471 Technical Report NI 43-101 – March 21, 2016 | | Page 2-2 |
| | |
| | www.rpacan.com |
| | • | | Beverley O’Malley, Cortez Hills Underground, Chief Geologist |
Mr. Valliant is responsible for the overall preparation of this report and reviewed the geology, sampling, assaying, and resource estimate of the open pit part of the operation described in Sections 7 to 12 and 14 as well as the general information in Sections 4, 5, and 6. Mr. Moore reviewed the geology, sampling, assaying, and resource estimate of the underground part of the operation described in Sections 7 to 12 and 14. Mr. Collins reviewed the mining practices, reserve estimate, and economics of the open pit division and is responsible for the open pit portions of Sections 15, 16, 18, 19, 21, and 22. Mr. Bergen reviewed the mining practices, reserve estimate, and economics of the underground division and is responsible for the underground portions of Sections 15, 16, 18, 19, 21, and 22. Dr. Kathleen Ann Altman reviewed the metallurgical and environmental aspects of the operation and is responsible for Sections 13, 17, and 20. All authors share responsibility for Sections 1, 2, 3, 24, 25, 26, and 27.
The documentation reviewed, and other sources of information, are listed at the end of this report in Section 27 References.
| | |
Barrick Gold Corporation – Cortez Operations, Project 2471 Technical Report NI 43-101 – March 21, 2016 | | Page 2-3 |
| | |
| | www.rpacan.com |
LIST OF ABBREVIATIONS
Units of measurement used in this report conform to the imperial system. All currency in this report is US dollars (US$) unless otherwise noted.
| | | | | | |
A | | annum | | kWh | | kilowatt-hour |
amsl | | average mean sea level | | | | |
A | | ampere | | L | | litre |
bbl | | barrels | | lb | | pound |
btu | | British thermal units | | L/s | | litres per second |
°C | | degree Celsius | | m | | metre |
C$ | | Canadian dollars | | M | | mega (million); molar |
cal | | calorie | | m2 | | square metre |
cfm | | cubic feet per minute | | m3 | | cubic metre |
cm | | centimetre | | µ | | micron |
cm2 | | square centimetre | | µg | | microgram |
d | | day | | m3/h | | cubic metres per hour |
dia | | diameter | | mi | | mile |
dmt | | dry metric tonne | | min | | minute |
dwt | | dead-weight ton | | µm | | micrometre |
°F | | degree Fahrenheit | | mm | | millimetre |
ft | | foot | | mph | | miles per hour |
ft2 | | square foot | | MVA | | megavolt-amperes |
ft3 | | cubic foot | | MW | | megawatt |
ft/s | | foot per second | | MWh | | megawatt-hour |
g | | gram | | oz | | Troy ounce (31.1035g) |
G | | giga (billion) | | oz/st | | ounce per short ton |
Gal | | Imperial gallon | | ppb | | part per billion |
g/L | | gram per litre | | ppm | | part per million |
Gpm | | Imperial gallons per minute | | psia | | pound per square inch absolute |
g/t | | gram per tonne | | psig | | pound per square inch gauge |
gr/ft3 | | grain per cubic foot | | RL | | relative elevation |
gr/m3 | | grain per cubic metre | | s | | second |
ha | | hectare | | st | | short ton |
hp | | horsepower | | stpa | | short ton per year |
hr | | hour | | stpd | | short ton per day |
Hz | | hertz | | t | | metric tonne |
in. | | inch | | tpa | | metric tonne per year |
in2 | | square inch | | tpd | | metric tonne per day |
J | | joule | | US$ | | United States dollar |
k | | kilo (thousand) | | USg | | United States gallon |
kcal | | kilocalorie | | USgpm | | US gallon per minute |
kg | | kilogram | | V | | volt |
km | | kilometre | | W | | watt |
km2 | | square kilometre | | wmt | | wet metric tonne |
km/h | | kilometre per hour | | wt% | | weight percent |
kPa | | kilopascal | | yd3 | | cubic yard |
kVA | | kilovolt-amperes | | yr | | year |
kW | | kilowatt | | | | |
| | |
Barrick Gold Corporation – Cortez Operations, Project 2471 Technical Report NI 43-101 – March 21, 2016 | | Page 2-4 |
| | |
| | www.rpacan.com |
3 RELIANCE ON OTHER EXPERTS
This report has been prepared by Roscoe Postle Associates Inc. (RPA) for Barrick Gold Corporation (Barrick). The information, conclusions, opinions, and estimates contained herein are based on:
| | • | | Information available to RPA at the time of preparation of this report, |
| | • | | Assumptions, conditions, and qualifications as set forth in this report, and |
| | • | | Data, reports, and other information supplied by Barrick and other third party sources. |
For the purpose of this report, RPA has relied on ownership information provided by Barrick. RPA has not researched property title or mineral rights for Cortez and expresses no opinion as to the ownership status of the property.
RPA has relied on Barrick for guidance on applicable taxes, royalties, and other government levies or interests, applicable to revenue or income from Cortez.
Except for the purposes legislated under provincial securities laws any use of this report by any third party is at that party’s sole risk.
| | |
Barrick Gold Corporation – Cortez Operations, Project 2471 Technical Report NI 43-101 – March 21, 2016 | | Page 3-1 |
| | |
| | www.rpacan.com |
4 PROPERTY DESCRIPTION AND LOCATION
The Cortez Gold Mine is located 62 mi southwest of Elko, Nevada, USA. The Mine is located in Eureka and Lander Counties (Figure 4-1). The Cortez property is surrounded by the Cortez Joint Venture Area of Interest (CJVAOI) that covers approximately 1,053 mi2 (Figure 4-2). The deposits and infrastructure are illustrated in Figures 4-3, 4-4, and 4-5.
The CJVAOI includes private land, patented, and unpatented mineral claims and fee land and land controlled by competitors. Theco-ordinates of the Pipeline open pit are approximately 40°15’ North latitude and 116°43’ West longitude.
LAND TENURE
At Cortez, Barrick directly controls approximately 216,124 acres of mineral rights with ownership of mining claims and fee lands. There are 10,461 claims consisting of:
| | • | | 9,630 unpatented lode claims |
| | • | | 575 unpatented mill-site claims |
| | • | | 104 patented lode claims |
| | • | | 125 patented mill-site claims |
| | • | | 27 unpatented placer claims and 185 patented mill-site claims |
All lease agreements and claim holdings are current and in good standing.
The 2015 holding costs for the Cortez property include $1.7 million in holding costs and $496,015 in lease payments.
Unpatented lode and mill-site claims are held under the 1872 mining law as amended, which requires the annual payment of $155 per claim on or before noon on the first of September each year. If the annual payment is not made for that specific claim, the claim will lapse and be subject to forfeiture. Patented ground or claims are surveyed by a certified mineral surveyor, and appropriate monuments placed in the ground. Each unpatented claim is marked on the ground, and does not require a mineral survey.
| | |
Barrick Gold Corporation – Cortez Operations, Project 2471 Technical Report NI 43-101 – March 21, 2016 | | Page 4-1 |
| | |
| | www.rpacan.com |
All Mineral Reserves and Mineral Resources, in addition to existing and future facilities to be used to exploit the Mine deposits, are on public lands administered by the Battle Mountain or Elko Field Offices of the U.S. Department of Interior, Bureau of Land Management (BLM).
ROYALTIES
The Cortez operation is subject to a number of royalties. All production at Cortez is subject to a 1.28595% gross smelter return (GSR) royalty payable to the former shareholders of Idaho Mining Corporation. This was originally a 2.5% GSR royalty covered by a capping of ounces produced; the production limit has been met and the royalty reduced to a 1.28595%. GSR is defined as 100% of smelter revenue before deductions for refining and transportation. The Idaho Mining Corporation royalty pertains to any production from the Pipeline, South Pipeline, Crossroads, Gap, Gold Acres, Cortez NW Deep, Cortez Hills, Pediment, and Hilltop deposits.
Royal Gold Inc. (Royal Gold) holds a sliding-scale GSR royalty over the Pipeline/South Pipeline deposits ranging from 0.40% to 5.0%. An additional sliding-scale GSR royalty is held over the undeveloped Crossroads deposit.
ECM Inc. (ECM) holds a net value royalty of 3.75% of gold sales from the South Pipeline deposit.
Rio Tinto holds a sliding-scale royalty (of 0% at gold prices less than $400/oz to 3% at gold prices greater than $900/oz) on 40% of all Cortez production in excess of 15 million ounces on and after January 1, 2008, which has not yet occurred.
The State of Nevada imposes a 5% net proceeds tax on the value of all minerals severed in the State. This tax is calculated and paid based on a prescribed net income formula which is different from book income. RPA is not aware of any environmental liabilities on the property. Barrick has all required permits to conduct work on the property. RPA is not aware of any other significant factors and risks that may affect access, title, or the right or ability to perform work on the property.
| | |
Barrick Gold Corporation – Cortez Operations, Project 2471 Technical Report NI 43-101 – March 21, 2016 | | Page 4-2 |
| | |
| | www.rpacan.com |
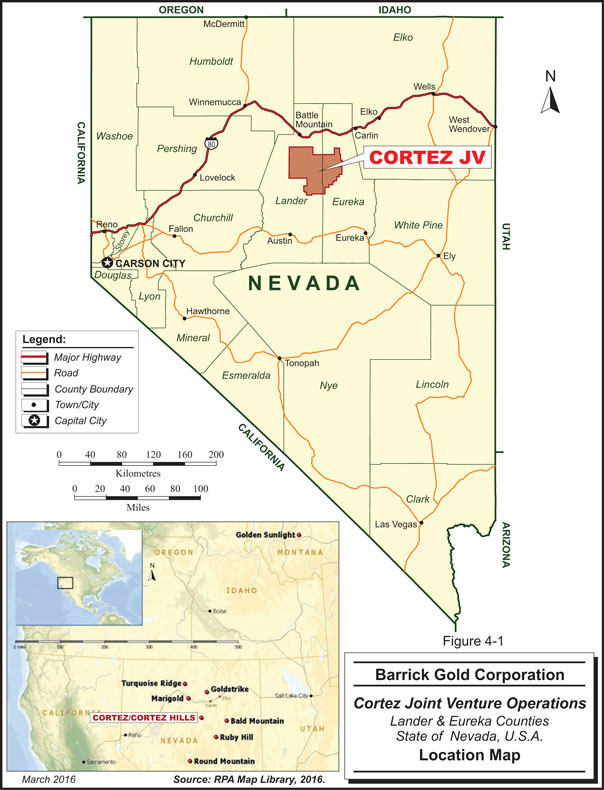
| | |
Barrick Gold Corporation – Cortez Operations, Project 2471 Technical Report NI 43-101 – March 21, 2016 | | Page 4-3 |
| | |
| | www.rpacan.com |
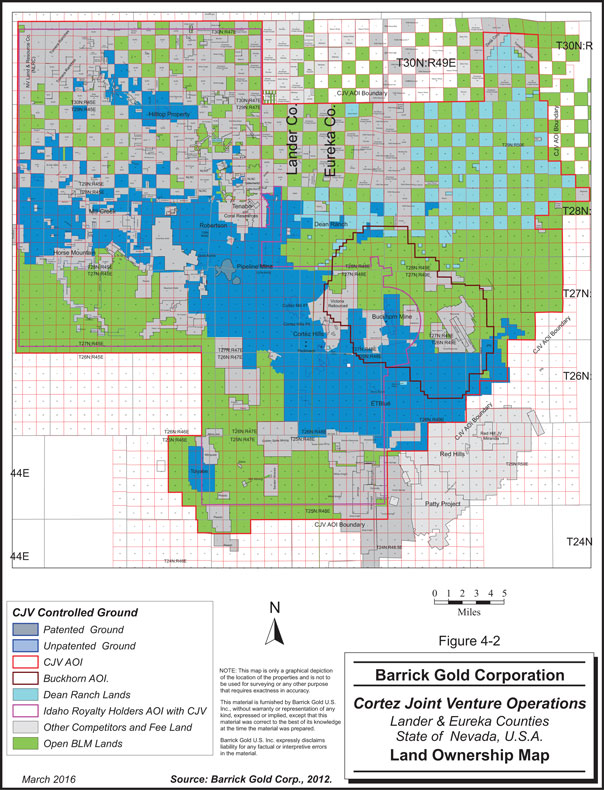
| | |
Barrick Gold Corporation – Cortez Operations, Project 2471 Technical Report NI 43-101 – March 21, 2016 | | Page 4-4 |
| | |
| | www.rpacan.com |
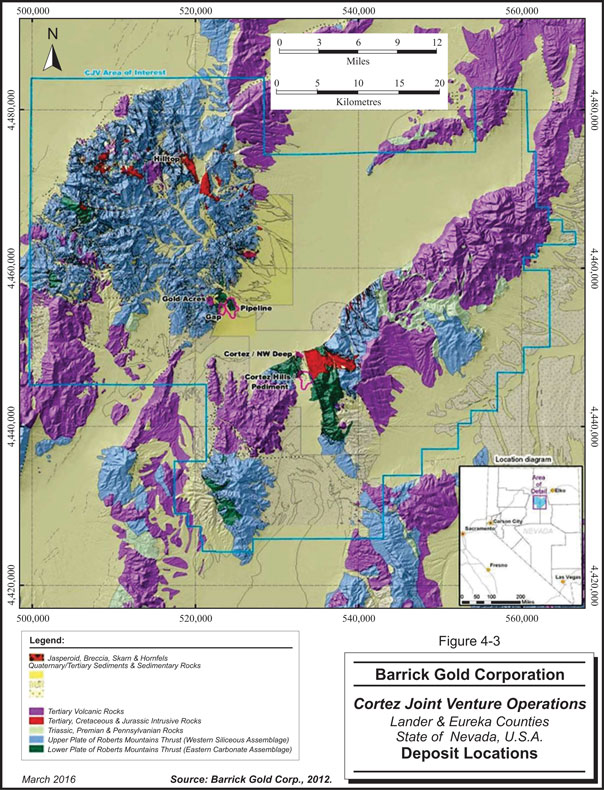
| | |
Barrick Gold Corporation – Cortez Operations, Project 2471 Technical Report NI 43-101 – March 21, 2016 | | Page 4-5 |
| | |
| | www.rpacan.com |
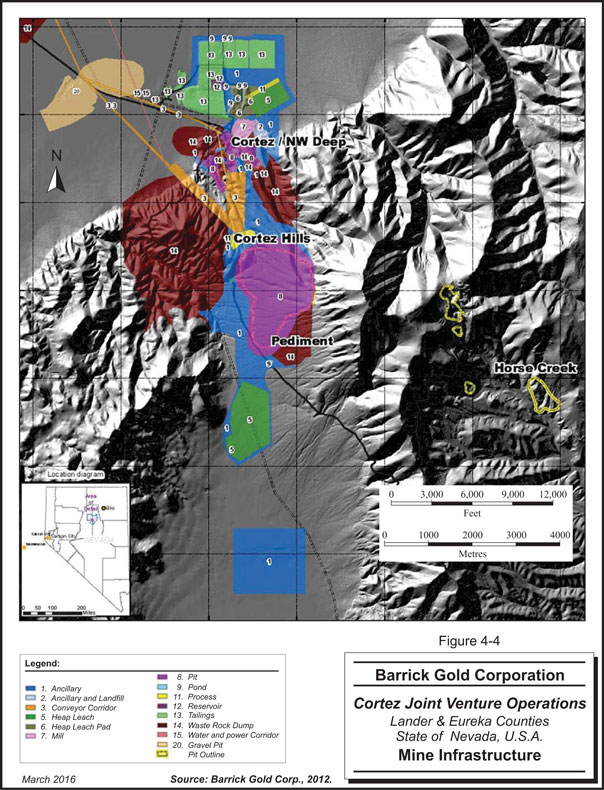
| | |
Barrick Gold Corporation – Cortez Operations, Project 2471 Technical Report NI 43-101 – March 21, 2016 | | Page 4-6 |
| | |
| | www.rpacan.com |
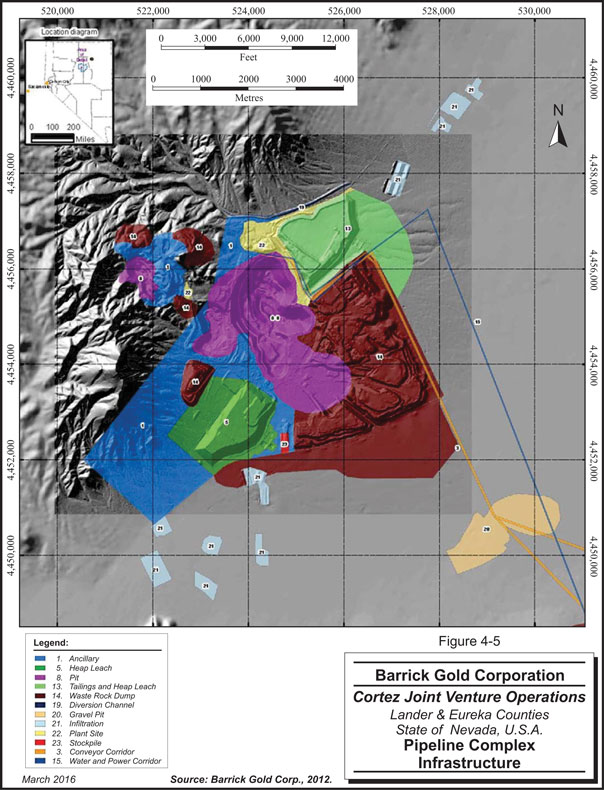
| | |
Barrick Gold Corporation – Cortez Operations, Project 2471 Technical Report NI 43-101 – March 21, 2016 | | Page 4-7 |
| | |
| | www.rpacan.com |
5 ACCESSIBILITY, CLIMATE, LOCAL RESOURCES, INFRASTRUCTURE AND PHYSIOGRAPHY
ACCESSIBILITY
The Mine is reached by travelling approximately 32 mi east from Battle Mountain, Nevada, on US Interstate 80. Alternative access is from Elko, Nevada, approximately 45 mi west to the Beowawe exit, then approximately 35 mi south on Nevada State Route 306, which extends southward from US Interstate 80. Both US Interstate 80 and Nevada State Route 306 are paved roads.
The mining district is also crossed by a network of gravel roads, providing easy access to various portions of the Mine. All roads are suitable for all weather conditions; however, in extreme winter conditions, roads may be closed for short periods for snow removal.
The Union Pacific Rail line runs parallel to US Interstate 80 to the north of the Mine. Elko, the closest city to the Mine, is serviced by daily commercial airline flights to Salt Lake City, Utah.
CLIMATE
The Mine is located in the high desert region of the Basin and Range physiographic province. There are warm summers and generally mild winters, however, overnight freezing conditions are common during winter. The mean annual temperature is 51°F. Precipitation averages six inches per year, primarily derived from snow and summer thunderstorms. Typically, the months with the greatest precipitation are March, May, and November. During the winter months at elevations above approximately 5,500 ft amsl, precipitation generally occurs as snow. Evaporation is estimated at 39 in. per year.
Operations continue on site year-round and are not materially impacted by weather.
| | |
Barrick Gold Corporation – Cortez Operations, Project 2471 Technical Report NI 43-101 – March 21, 2016 | | Page 5-1 |
| | |
| | www.rpacan.com |
LOCAL RESOURCES
Cortez is located in a major mining region and local resources including labour, water, power, contractors and suppliers, and local infrastructure for transportation of supplies are well established. The majority of the workforce lives in the nearby towns of Elko, Spring Creek, Carlin, and Battle Mountain.
Electric power is provided to the Cortez site by NV Energy via an approximately 50 mi long radial transmission line originating at their Falcon substation. The incoming NV Energy line terminates at the Barrick owned Pipeline Substation. Two 120 kV lines that tap onto the NV Energy power line feed Barrick owned 120 kV power lines: an approximately 9 mi extension to serve the Cortez Hills development and an approximately 3 mi extension to serve the South Pipeline and Crossroads pits.
Water for process use at Cortez Mill No. 2 is supplied from the Pipeline open pit dewatering system. Approximately 1,450 gallons per minute of the pit dewatering volume is diverted for plant use. Additional water can be sourced as needed from wells at Mill No. 1.
Process water supply for Cortez Hills will be drawn in whole or in part from dewatering operations. If sufficient volume cannot be produced by dewatering, process water will be supplied by existing production wells at the Pipeline and/or Cortez facilities.
Water from the CHUG is pumped across Crescent Valley to an existing surface re-infiltration area.
INFRASTRUCTURE
There is an extensive infrastructure in place to support the Cortez Operations including:
| | • | | The 13,000 stpd No. 2 Mill complete with run-of-mine (ROM) pad and crushing circuit (including a primary jaw crusher) |
| | • | | Pipeline leach pad and gold recovery plant |
| | • | | Area 34 leach pad and gold recovery plant for Cortez Hills and Pediment |
| | • | | A tailings management facility |
| | |
Barrick Gold Corporation – Cortez Operations, Project 2471 Technical Report NI 43-101 – March 21, 2016 | | Page 5-2 |
| | |
| | www.rpacan.com |
| | • | | A gyratory crusher at the Cortez Hills open pit (CHOP) and an 11 mi long conveyor to the No. 2 Mill |
| | • | | Existing active open pit mines at CHOP, Cortez, Pipeline, and Crossroads |
| | • | | Pit dewatering wells and pumps for the open pits |
| | • | | Infiltration ponds for the disposal of water |
| | • | | An existing underground mine at Cortez Hills Underground (CHUG) |
| | • | | Batch plant for shotcrete and cemented rock fill preparation |
| | • | | Stockpile areas for an assortment of ore types |
| | • | | Office complexes at the Mill No. 2, Mill No. 1, CHUG, and CHOP |
| | • | | Equipment maintenance shops at CHOP, CHUG, and adjacent to the Mill No. 2 |
| | • | | Exploration offices, core handling, and core storage warehouse |
| | • | | System of public and private roads connecting the facilities |
| | • | | Shared business support services from the business unit offices in Elko |
PHYSIOGRAPHY
The Pipeline mine and Mill No. 2 are located at the southern end of the Crescent Valley in Lander County, Nevada. The Cortez Hills deposits and operations are located at the northern end of Eureka County. The Crescent Valley is a structural and topographic basin between the Northern Shoshone Range on the west and the Cortez Range on the east. Most mine facilities are on the west side of the valley at an elevation of approximately 5,000 ft amsl. This includes the original workings of the Gold Acres mine, now inactive, the Pipeline pit, the Gap pit and the proposed Crossroads pit.
The property is located at elevations between 4,500 ft amsl and 6,000 ft amsl on the valley floor and up the side of Mount Tenabo.
The Cortez Mine and Mill No. 1 (both inactive) are located along the northern edge of the Cortez Range seven miles southeast of the Pipeline pit. The Cortez Hills and Pediment deposits are located in the Cortez Hills approximately three miles south of the Cortez Pits and at an elevation of approximately 6,000 ft amsl.
| | |
Barrick Gold Corporation – Cortez Operations, Project 2471 Technical Report NI 43-101 – March 21, 2016 | | Page 5-3 |
| | |
| | www.rpacan.com |
The vegetation consists primarily of shrubs and grasses, such as sagebrush, rabbitbrush, cheatgrass, and grama. Juniper trees, pinion pine, mountain mahogany, and a variety of grasses are also present. In general, vegetation is relatively sparse. The valley floor is sparsely vegetated while the mountain slopes have small pinion pine and juniper trees. No endangered or threatened species, BLM-sensitive species, or plants proposed for listing have been identified in the Mine area.
Fauna that have been observed in the Mine area are typical of those of the Great Basin area, and include jackrabbits, cottontail rabbits, mule deer, antelope, coyotes, various rodents, and reptiles. No proposed threatened, or endangered species are considered to exist within the Mine area.
| | |
Barrick Gold Corporation – Cortez Operations, Project 2471 Technical Report NI 43-101 – March 21, 2016 | | Page 5-4 |
| | |
| | www.rpacan.com |
6 HISTORY
Mining in the Cortez Mining District began with the discovery of silver mineralization in 1862 along the quartzite outcroppings at the western base of Mount Tenabo, some four miles to the southeast of the Cortez Mill No. 1 complex. Underground silver mining was conducted in the area until the 1930s. Mineralization at Hilltop was also identified during the 1860s. The majority of production occurred between 1915 and 1951 from underground sources, with approximate production of 18,000 ounces of gold, 360,000 ounces of silver and subordinate amounts of lead, copper, and antimony. Gold mineralization at Gold Acres was discovered in the late 1920s and mined by a small mining company from 1935 to 1960. The mine was one of the few gold operations to remain open during World War II.
In 1959, American Exploration & Mining Co. (AMEX), a wholly-owned US subsidiary of Placer Development Ltd. (subsequently Placer Dome Inc. (Placer Dome) and Barrick), entered into a lease-option agreement on the properties of the Cortez Metals Co. and started extensive exploration of the mine workings and surrounding area. In 1963 AMEX entered into an exploration agreement with Idaho Mining Corp., which had acquired large areas of mineralized ground adjoining the AMEX holdings. In 1964, AMEX formed the Cortez Joint Venture (CJV) with the added participation of the Bunker Hill Co., Vernon F. Taylor, Jr., and Webb Resources Inc.
The US Geological Survey found anomalous gold in altered outcrops at the base of the Cortez Range in 1966. The CJV shortly afterwards discovered the Cortez deposit. Production at Cortez began in 1969 and continued until 1972, and then resumed from 1988 to 1993. Production was from the F-Canyon, Cortez, and Ada 52 pits. Waste dumps from the operations were reclaimed during the 1990s. The Cortez process facilities include three inactive heap leach pads, West, East and 91-C leach pads, constructed in 1972, 1984, and 1990 respectively. The leach pads have been inactive since 1994. Seven tailings storage areas are situated in the Cortez area, TA 1 to TA 7, inclusive.
| | |
Barrick Gold Corporation – Cortez Operations, Project 2471 Technical Report NI 43-101 – March 21, 2016 | | Page 6-1 |
| | |
| | www.rpacan.com |
TABLE 6-1 HISTORY OF EXPLORATION AND MINING AT CORTEZ SITE
Barrick Gold Corporation – Cortez Operations
| | |
Period | | Activity |
1862–1932 | | Cortez Silver mine in operation |
1912–1921 | | Mining of gold, lead, copper and antimony at Hilltop |
Late 1920s | | Gold Acres deposit discovered |
1935–1960 | | Gold mined from the Gold Acres deposit by other companies. Gold Acres mined as an open pit operation |
1964 | | CJV formed |
1966 | | Cortez deposit discovered |
1968 | | Horse Creek (formerly Red Hill) discovered by Homestake Mining Co. |
1969–1972; 1988–1993 | | Cortez deposit mined |
1973–1976 | | New southern extension of the Gold Acres deposit mined and Horse Canyon deposit discovered |
1976–1983 | | Low-grade oxide ores from Cortez and Gold Acres heap leached |
1983–1987 | | Horse Canyon deposit mined |
1987–1996 | | Mining resumed in the Cortez and Gold Acres deposits |
1989 | | Acquisition of Hilltop deposit |
1991 | | Pipeline, South Pipeline, Crescent and Gap deposits discovered |
1994 | | Commenced mining the Crescent pit within the north western portion of the South Pipeline deposit |
1996 | | Mining commenced on the Pipeline deposit |
1997 | | Production at Mill No. 2 commenced. Total development and capital costs were $250 million. |
1998 | | Crossroads and Pediment deposits discovered. |
1999 | | Mill No. 1 was placed on care and maintenance. |
2001 | | Plan of Operations was submitted for Pipeline expansion and Pediment |
2002 | | South Area heap leach facility was commissioned |
2003 | | Cortez Hills deposit discovery announced |
2004–2009 | | Infill drilling continued at Cortez Hills and Pediment deposits Discovery of Lower Zone at Cortez Hills |
2005 | | Completion of positive internal Feasibility Study on Cortez Hills |
2006 | | Barrick acquires Placer Dome; commencement of mining at the South Gap deposit |
2008 | | Acquisition of remaining 40% interest in the Mine through Barrick purchase of Kennecott interest from Rio Tinto. Positive Record of Decision received for Cortez Hills development |
2009 | | Development of open pit commences at Cortez Hills. Mining halted at the Pipeline Complex. |
2011 | | Goldrush deposit discovered. |
2013 | | Production resumed at Pipeline Complex. |
| | |
Barrick Gold Corporation – Cortez Operations, Project 2471 Technical Report NI 43-101 – March 21, 2016 | | Page 6-2 |
| | |
| | www.rpacan.com |
The CJV initiated exploration drilling around the pre-existing Gold Acres deposit in 1969, and obtained exploration rights to the former mining area in 1969. Open pit mining began in 1973, from the North and South pits. Low-grade ores from Gold Acres were mined and processed by heap leaching until 1976. Leaching and milling of Gold Acres stockpiles and dumps continued until 1983. The Gold Acres heap leach facility is associated with the deposits. Drilling resumed, resulting in the discovery of refractory gold mineralization in the vicinity of the North pit. Mill-grade ores were mined from 1987 to 1996 and processed at the Cortez Mill No. 1. Total production from this deposit (historic and recent) is estimated to exceed 500,000 ounces of gold. In 2003, the CJV commenced shipping Gold Acres refractory stockpiles for toll-processing at third-party facilities.
The Horse Canyon deposits were discovered in early 1976. Three pits, North, South, and South Extension were mined in the period from 1984 to 1987. Approximately 3.5 million tons were mined with approximately 385,000 ounces of gold recovered.
The Pipeline, South Pipeline, and Crossroads gold deposits occur in sequence from northwest to southeast and were entirely concealed beneath pediment gravels up to 300 ft thick. The Pipeline deposit was discovered by CJV geologists in March 1991 during drilling of deep condemnation holes on the pediment east of Gold Acres. The Gap deposit was discovered in 1991 adjacent to the planned Stage 9 of the Pipeline pit.
The Pipeline South area was initially controlled by association placer claims under the control of the CJV since the early 1970s. Only scattered sub-ore grade gold has been identified. The area was over-staked with lode claims by ECM in early 1987. By May 1987, Royal Gold had leased this property, known as the GAS claims, from ECM. The claim conflict was resolved by the formation of the Royal/Cortez Joint Venture between Royal Gold and the CJV later that year.
Royal Gold completed geophysical surveys and drilling programs between 1987 and 1989 that led to the identification of additional sub-economic gold grades, primarily in an anomaly known as GAS 2. Although a mineral resource was estimated no further work was undertaken by Royal Gold or by CJV due to the limited amount of drill data available. No further drilling by Royal Gold occurred due to lack of funding.
| | |
Barrick Gold Corporation – Cortez Operations, Project 2471 Technical Report NI 43-101 – March 21, 2016 | | Page 6-3 |
| | |
| | www.rpacan.com |
In August 1991, the Royal/Cortez Joint Venture was terminated and the CJV leased the property directly from ECM. A later dispute between Royal Gold and the CJV concerning termination of the Royal/Cortez Joint Venture led to the formation of the South Pipeline Project and the royalty structure.
In November 1991, the CJV discovered the South Pipeline deposit. Additional gold was identified in August 1992. Step-out and in-fill drilling continued through July 1994. This drilling confirmed the presence of a relatively shallow gold occurrence above the water table, the Crescent deposit. Mining of the Crescent pit (northwest part of the South Pipeline deposit) commenced in May 1994 and was completed in 1997. The Crescent pit has since been subsumed by the Pipeline pit.
An internal Feasibility Study (FS) covering the Pipeline and South Pipeline deposits was completed by Placer Dome Technical Services in 1995. Construction of Mill No. 2 and pre-stripping of the first stage of the Pipeline pit began in 1996. The Pipeline pit has estimated Mineral Reserves and is included in Barrick’s current LOM plan. Two waste dumps are permitted (Gap and Pipeline). Associated infrastructure includes the integrated Pipeline heap leach and tailings facility, South Area heap leach facility, and Mill No. 2.
Continued drilling along northwest-southeast structural trends at Pipeline in 1998 resulted in discovery of the Crossroads deposit southeast of the South Pipeline deposit. Crossroads is concealed beneath 550 ft of alluvium. It represents a continuation of mineralization from South Pipeline.
In 1996, CJV geologists began a program to test for concealed mineralization south of the Cortez Mine. Geochemical and geophysical surveys were used to guide deep reverse circulation (RC) drilling, initially focusing on an area immediately west of the Cortez Fault. In 1998, the Pediment deposit was discovered in a deep RC drilling program designed to test potential for bedrock mineralization in the central and western portions of the alluvium-covered Cortez Fault Corridor. Subsequent RC and core drilling programs through 2002 defined the Pediment deposit.
The Cortez Hills deposit was discovered in October 2002 as part of an RC drilling exploration program investigating a steep gravity gradient anomaly near the projected intersection of north–northwest-trending Cortez Fault Corridor structures and west–northwest-trending faults
| | |
Barrick Gold Corporation – Cortez Operations, Project 2471 Technical Report NI 43-101 – March 21, 2016 | | Page 6-4 |
| | |
| | www.rpacan.com |
beneath alluvial cover immediately to the north of the Pediment deposit. In 2004, the Cortez Hills Lower Zone was discovered as part of the step-out drilling to the west of the Cortez Hills deposit.
In November 2008, the Environmental Impact Statement (EIS) for the Cortez–Pediment development was approved. The project was developed as two open pits and a concurrent underground development of a high-grade portion underlying the pits. Production from underground began in late 2008, and the first ore production of CHOP phases one through three occurred in late December 2009.
In March 2008, Barrick acquired a 100% interest in the Mine, purchasing the former Kennecott 40% interest for a consideration of $1.695 billion in cash, an additional $50 million payable if and when an additional 12 million ounces of contained gold Mineral Resources were added to Barrick’s December 31, 2007 Mineral Reserve statement for Cortez, and a sliding-scale royalty payable to Rio Tinto on 40% of all Cortez production in excess of 15 million ounces on and after January 1, 2008. In 2012, the threshold of an additional 12 million ounces added to Mineral Resources was reached, and the $50 million payment was made to Rio Tinto.
Production from the Mine in the period 1969 to 2015 is summarized in Table 6-2.
| | |
Barrick Gold Corporation – Cortez Operations, Project 2471 Technical Report NI 43-101 – March 21, 2016 | | Page 6-5 |
| | |
| | www.rpacan.com |
TABLE 6-2 ANNUAL PRODUCTION, 1969–2015
Barrick Gold Corporation – Cortez Operations
| | |
Year Ended | | Gold
(000 oz) |
1969 | | 166 |
1970 | | 209 |
1971 | | 120 |
1972 | | 190 |
1973 | | 76 |
1974 | | 104 |
1975 | | 74 |
1976 | | 28 |
1977 | | 2 |
1978 | | 2 |
1979 | | 2 |
1980 | | 8 |
1981 | | 21 |
1982 | | 25 |
1983 | | 47 |
1984 | | 49 |
1985 | | 56 |
1986 | | 62 |
1987 | | 51 |
1988 | | 42 |
1989 | | 40 |
1990 | | 54 |
1991 | | 58 |
1992 | | 77 |
1993 | | 67 |
1994 | | 70 |
1995 | | 111 |
1996 | | 161 |
1997 | | 407 |
1998 | | 1,138 |
1999 | | 1,328 |
2000 | | 1,010 |
2001 | | 1,188 |
2002 | | 1,082 |
2003 | | 1,065 |
2004 | | 1,052 |
2005 | | 904 |
2006 | | 427 |
2007 | | 323 |
2008 | | 428 |
2009 | | 518 |
2010 | | 1,140 |
2011 | | 1,421 |
2012 | | 1,370 |
2013 | | 1,337 |
2014 | | 901 |
| | |
2015 | | 999 |
| | |
Total | | 20,010 |
Note: Production from 1969 to 2005 is total production, reported on a 100% basis, sourced from corporate annual reports. Production from April to December 2006, 2007, and January to February 2008 is the Barrick interest only, at 60% of production. Barrick production at 100% is included from March 2008 onwards.
| | |
Barrick Gold Corporation – Cortez Operations, Project 2471 Technical Report NI 43-101 – March 21, 2016 | | Page 6-6 |
| | |
| | www.rpacan.com |
7 GEOLOGICAL SETTING AND MINERALIZATION
REGIONAL GEOLOGY
The Mine is located in the eastern Great Basin (Basin and Range Province) at the southern closure of Crescent Valley, a northeast trending structural and topographic basin between the Northern Shoshone Range on the west and the Cortez Range on the east. The Mine lies within the “Battle Mountain-Eureka Trend” (BMT), an alignment of gold mines and occurrences located in a northwest-southeast belt extending from the Marigold Mine some 50 mi northwest of Cortez, to Ruby Hill at Eureka 60 mi to the southeast.
Two regionally recognized Paleozoic assemblages comprise the basement sedimentary strata of northeastern Nevada. These assemblages were deposited on the western continental margin of North America. The western assemblage is a deep water marine package of siliciclastic rocks consisting of mudstone, chert, siltstone, sandstone, and minor limestone. The eastern shallow water sedimentary assemblage consists predominantly carbonate rocks including limestone, dolomite, and some quartzite units. The eastern assemblage underlies all other stratigraphic units in eastern and central Nevada.
Jurassic to Cretaceous intrusive rocks of granitic composition intrude the Paleozoic sedimentary rock and are locally exposed as stocks, sills, and dikes. Tertiary extrusive rocks unconformably overlie the older packages and are dominated by a bimodal suite of rhyolite and basaltic flows with associated felsic tuffs and lesser amounts of intermediate volcanic rocks. Post-mineralization Eocene to Oligocene quartz porphyry dikes and sills have been emplaced along low angle thrust faults as well as high angle structures, in some cases intruding the gold deposits. Late Tertiary and Quaternary erosional products have partially filled the valley basins with coalescing alluvial fan deposits marginal to the mountains and finer-grained alluvium in the valley centres.
The Antler orogeny extensively deformed Paleozoic rocks of the Great Basin in Nevada and western Utah during Late Devonian and Early Mississippian time. In the late Devonian about 350 million years ago, the Antler volcanic island arc terrane collided with what was then the west coast of North America and the North American Plate. The collision zone is marked by
| | |
Barrick Gold Corporation – Cortez Operations, Project 2471 Technical Report NI 43-101 – March 21, 2016 | | Page 7-1 |
| | |
| | www.rpacan.com |
the Roberts Mountains Thrust, a system of low-angle thrust faults along which the Upper Plate clastic rocks were thrust some 90 miles eastward over the Lower Plate carbonates. Mesozoic compressional deformation was also important regionally as indicated by various east and west as well as north-northeast and south-southwest verging thrusts. Tertiary faulting developed basins and ranges with the former subsequently filled with volcanic and sedimentary rocks during Tertiary time. Gold mineralization occurred at the onset of Tertiary volcanism, approximately 39 million years ago.
The stratigraphic section is cut by a series of north-northwest, northwest, northeast, and north-northeast striking high- and low-angle faults with extensive fracturing, brecciation, and folding. These faults both control and displace mineralization, with evidence for both dip-slip and oblique-slip displacements. Jurassic and Tertiary intrusive rocks utilized both high and low-angle faults as they intruded the Paleozoic section. Cenozoic Basin and Range deformation most likely reactivated the majority of faults in the area.
In terms of their regional tectonic setting, the BMT gold deposits are hosted in carbonate rocks within a thick sequence of Paleozoic miogeosynclinal sedimentary rocks coincident with:
| | • | | the thinned western margin of the North American craton in early Paleozoic times, |
| | • | | the west-central portion of the Lower Devonian Antler foreland basin, |
| | • | | the east edge of deformation related to the late Paleozoic Humboldt orogeny, |
| | • | | an area of Jurassic plutonism, metamorphism and deformation, |
| | • | | the hinterland of the early Tertiary Sevier orogenic belt, and |
| | • | | the broad zone of Eocene to Miocene calc-alkaline magmatism and tectonic extension that occurred throughout much of the Great Basin. |
The collision between the Antler terrane and the North America Plate induced higher crustal temperatures and pressures, which produced numerous hot springs along the suture zone. Several episodes of subsurface magmatism are known to have occurred subsequent to the collision. During these episodes, and particularly during the Eocene epoch, hot springs brought dissolved minerals toward the surface, precipitating them out along fissures. Among these minerals were gold and silver. Most of the largest gold deposits lie within approximately 300 ft of the Roberts Mountain Thrust at the base of the Upper Plate allochthon. Geochronologic study indicates that most of the gold in the BMT was emplaced over a short interval of time between approximately 42 Ma and 36 Ma. Analyses of the sulphosalt galkhaite
| | |
Barrick Gold Corporation – Cortez Operations, Project 2471 Technical Report NI 43-101 – March 21, 2016 | | Page 7-2 |
| | |
| | www.rpacan.com |
from the Rodeo deposit at Barrick’s Goldstrike Mine (Carlin Trend) have yielded a mineralization age of 39.8 ± 0.6 Ma.
The regional geology is shown in Figure 7-1.
| | |
Barrick Gold Corporation – Cortez Operations, Project 2471 Technical Report NI 43-101 – March 21, 2016 | | Page 7-3 |
| | |
| | www.rpacan.com |

| | |
Barrick Gold Corporation – Cortez Operations, Project 2471 Technical Report NI 43-101 – March 21, 2016 | | Page 7-4 |
| | |
| | www.rpacan.com |
LOCAL GEOLOGY
Both the western and eastern Paleozoic assemblages are present in the Cortez area. At Cortez the western assemblage, termed the Upper Plate, includes:
| | • | | Devonian Slaven Formation cherts and argillites |
| | • | | Silurian Elder Formation sandstone and Fourmile Canyon Formation |
| | • | | Ordovician Vinini and Valmy Formations siliclastic rocks |
The eastern assemblage, or Lower Plate, consists of:
| | • | | Devonian Horse Canyon Formation laminated calcareous siltstone, mudstones with interbedded chert and silicified siltstones |
| | • | | Early Devonian Wenban Formation carbonate turbidites, debris flows, micrites, and silty limestones |
| | • | | Silurian-Devonian Roberts Mountains Formation laminated silty limestones |
| | • | | Ordovician Eureka Formation quartzites and Hanson Creek Formation sandy dolomites |
| | • | | Cambrian Hamburg dolomite |
Two erosional windows of Lower Plate rocks are mapped in the Cortez area both located at the southern end of Crescent Valley (Figure 7-2). The Gold Acres window on the eastern flank of the Shoshone Range, is buried to the east beneath the alluvial fill of Crescent Valley, and presumably is offset by the Crescent fault located on the south side of the valley near the Cortez Mine. South of the Crescent fault is the Cortez window, which appears to be a continuation of the Gold Acres window. The Cortez window is a two to three mile-wide, north–south trending zone that extends from the margin of Crescent Valley near the existing Cortez Mine south through the Cortez Hills area and into the northern Grass Valley area.
Aeromagnetic studies indicate that intrusive rocks underlie most of the Cortez Mountains. Outcrops of igneous intrusions in the Cortez district are granodiorite of Jurassic-cretaceous age (104 Ma to 150 Ma) and the Jurassic-age quartz monzonite Mill Canyon Stock. Felsic and mafic and dikes of similar age occur primarily in north to northwest striking faults. Contact metamorphism affects the sedimentary rocks adjacent to the larger igneous bodies and is evident in the formation of marble, calc-silicates, hornfels, and skarn. Post-mineral porphyry dacite and rhyodacite dikes and sills of Tertiary age are present and notable where they cross-cut mineralized zones.
| | |
Barrick Gold Corporation – Cortez Operations, Project 2471 Technical Report NI 43-101 – March 21, 2016 | | Page 7-5 |
| | |
| | www.rpacan.com |
The local geology and stratigraphy of the Cortez Mine area is shown in Figures 7-2 and 7-3, respectively.
The Gold Acres, Pipeline, Gap, and Crossroads gold deposits are at the south end of the Shoshone Range located on the west side of Crescent Valley within the Gold Acre Lower Plate window. Gold Acres mineralization is hosted within the Roberts Mountains thrust fault, which is up to 400 feet thick in the mine. The Pipeline, South Pipeline, Gap, and Crossroads deposits occur within Lower Plate Horse Canyon, Wenban, and Roberts Mountains Formations.
The Hilltop gold deposit, located approximately 10 mi north of Gold Acres is hosted by an Eocene porphyry and surrounding brecciated, Upper Plate siliciclastic sedimentary rocks of the Ordovician Valmy Formation along a northwest-trending belt of similar aged intrusions.
The Cortez Pits, Cortez Hills, and Pediment gold deposits are on the south side of Crescent Valley associated with the Cortez Lower Plate window. The Cortez Hills mineralized breccia, thrust fault related Middle and Lower zones are within Horse Canyon, Wenban, and Roberts Mountains units. The Pediment deposit appears to be contained within Miocene-age conglomeratic sediments located immediately southwest of the Cortez Hills deposit. The Horse Canyon deposit is in the Cortez Range approximately four miles east of Cortez Hills and is emplaced in Horse Canyon and Wenban units.
The Buckhorn gold mine, approximately seven miles east of Cortez, is a past producer that shut down in 1991 with historical production of 250,000 ounces of gold. It is a low-sulphidation epithermal vein and replacement mineralization localized by structures and permeable horizons in Tertiary basalts and underlying fanglomerate.
| | |
Barrick Gold Corporation – Cortez Operations, Project 2471 Technical Report NI 43-101 – March 21, 2016 | | Page 7-6 |
| | |
| | www.rpacan.com |
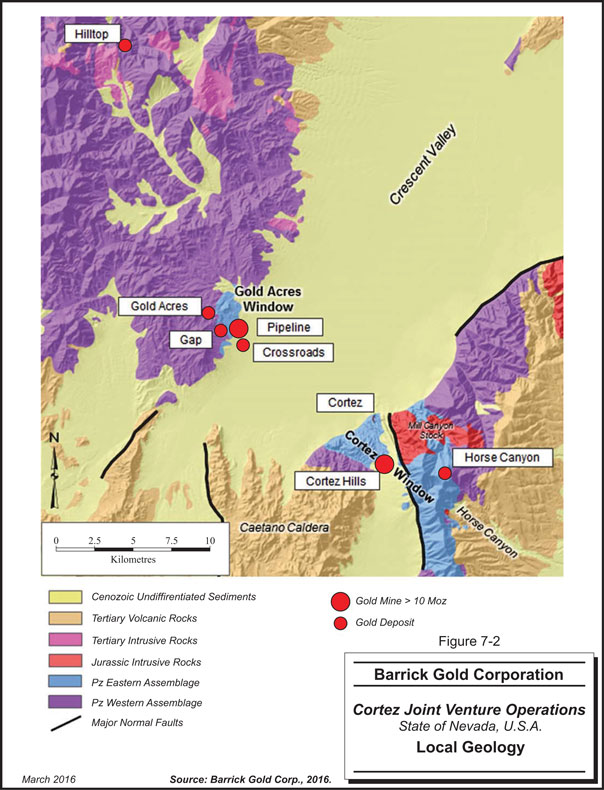
| | |
Barrick Gold Corporation – Cortez Operations, Project 2471 Technical Report NI 43-101 – March 21, 2016 | | Page 7-7 |
| | |
| | www.rpacan.com |
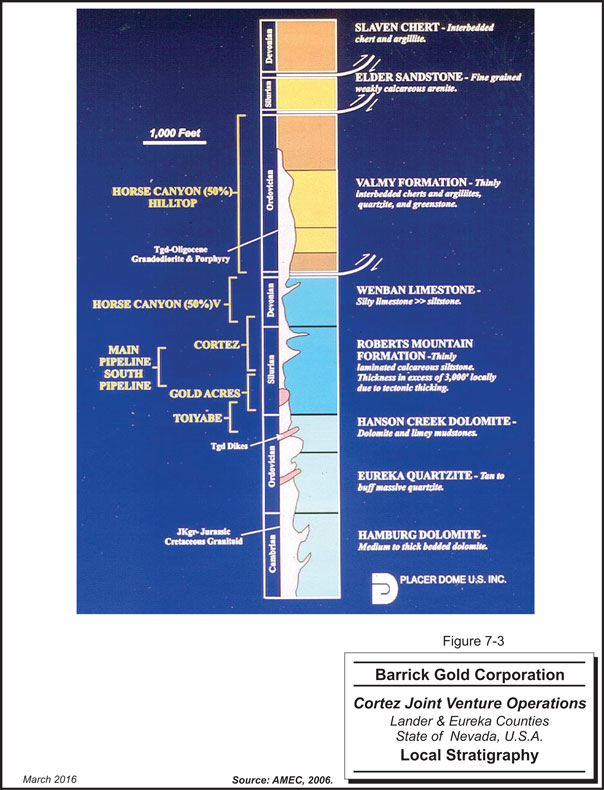
| | |
Barrick Gold Corporation – Cortez Operations, Project 2471 Technical Report NI 43-101 – March 21, 2016 | | Page 7-8 |
| | |
| | www.rpacan.com |
PROPERTY GEOLOGY
Deposit descriptions for the Pipeline Complex, Gold Acres, Pediment, and Cortez Pits deposits were extracted in whole or in part from the Scott Wilson RPA Cortez 2010 Audit Report and modified where required for this Report to reflect the current geological understanding of these areas.
PIPELINE COMPLEX
PIPELINE/SOUTH PIPELINE/CROSSROADS
The Pipeline, South Pipeline, and Crossroads deposits are separate zones of one gold-mineralized system, which collectively strike approximately N20W for over 8,000 ft and extend up to 5,000 ft wide E-W. Economic gold grades do not occur over the full expanse of this system, but variable degrees of hydrothermal alteration are evident including oxidation, decalcification, weak contact metamorphism, argillization, silicification, and carbonization. Mineralization at the Pipeline Complex occurs just outboard of the metamorphic aureole associated with the Gold Acres intrusive. Alluvial cover is absent in the northwest, but thickens up to 450 ft in the eastern Pipeline pit area and ranges from 315 ft to 770 ft over the Crossroads deposit to the south.
The area is characterized by folded and low-angle faulted Paleozoic carbonates. The primary host rocks are variably altered, thin- to thick-bedded, carbonate turbidites, debris flows, micrites, and silty limestones of the Devonian Wenban Limestone and thin-bedded, planar-laminated calcareous siltstones, mudstones, inter-bedded chert, and silicified siltstones of the Devonian Horse Canyon Formation overlying. At depth, planar laminated, silty limestones of the Silurian Roberts Mountains Formation also host mineralization.
Initial porosities in the turbidites, siltstones, and silty limestones were enhanced through argillization and decarbonitization along structural and stratigraphic controls. Thrust and normal faulting have shattered the more brittle cherty and silicified beds creating a secondary porosity. The highest and most continuous gold grades occur in the inter-bedded cherts and silicified turbidites of the Horse Canyon Formation and in the Wenban Formation either where capped by the Horse Canyon Formation or in areas of more intense decarbonitization. Host formations have been thickened and repeated by low-angle thrusting largely associated with the Late Devonian Antler Orogeny.
| | |
Barrick Gold Corporation – Cortez Operations, Project 2471 Technical Report NI 43-101 – March 21, 2016 | | Page 7-9 |
| | |
| | www.rpacan.com |
GAP
The Gap deposit is hosted in Devonian Wenban Limestone and lies west of the Pipeline Deposit. Mineralization occurs where north-northwest and northeast, high-angle faults intersect thermally altered Devonian Wenban Limestone in the axis of the Gold Acres antiform. Bedding in the Devonian Wenban Limestone is sub-horizontal to gently east-dipping. Portions of the limestone host-rocks of the deposit that lie within the metamorphic aureole of the Gold Acres Stock have been altered to calc-silicate marble, hornfels, skarn, and gossan. Skarn within the Gap pit can be correlated with the upper skarn in the Gold Acres deposit.
GOLD ACRES
The Gold Acres pit is centred on the axis of a low-amplitude, north-northwest trending antiform. The primary host rocks to the mineralization are sheared Upper Plate siliciclastics and greenstones of the Ordovician Valmy Formation and cherts and quartz siltstone of the Devonian Slaven Formation, sheared Lower Plate silty limestone with discontinuous thin phosphatic black lenses of the Silurian Roberts Mountains Formation and micrite to silty micrite of the Devonian Wenban Limestone. The intensity of metamorphism associated with the Gold Acres Stock varies depending on original lithology and ranges from hornfels to calc-silicate marble to skarn. Drill hole intercepts indicate that the pluton is 400 ft to 600 ft below the current Gold Acres pits.
Two discrete horizons, referred to as “Upper Skarn” and “Lower Skarn,” have been mapped at Gold Acres. The Upper Skarn unit is a bleached felsic sill-like body with endoskarn development and is presumed to be associated with the granodioritic Gold Acres Stock of Jurassic-Cretaceous (104 Ma to 150 Ma) age. The “Lower Skarn” is a garnet–diopside skarn believed to be lower Wenban Limestone. The two skarn horizons are separated by an 80 ft to 200 ft thick zone comprising slices of Upper and Lower plate rocks known as the Imbricate Thrust Zone (ITZ).
CORTEZ HILLS COMPLEX
The Cortez Hills Complex includes the Cortez Hills Breccia, Middle and Lower zones, and the Pediment deposit.
BRECCIA, MIDDLE AND LOWER ZONES
The upper levels of mineralization in the Cortez Hills deposit are hosted in the Horse Canyon Formation. The bulk of the deposit is hosted in the Devonian Wenban Limestone. At depth,
| | |
Barrick Gold Corporation – Cortez Operations, Project 2471 Technical Report NI 43-101 – March 21, 2016 | | Page 7-10 |
| | |
| | www.rpacan.com |
mineralization is also hosted by Roberts Mountains Formation as well as Hanson Creek Dolomite. The range-bounding Cortez Fault is located just east of the deposit.
The location of Breccia gold mineralization appears to have been emplaced on hydrothermal brecciated and fractured rocks that are centred on a northwest striking and moderately southwest dipping fault and its attendant structures, named the Voodoo Fault. At depth the stratigraphy has been deformed by thrust faulting leading to both folding and fracturing. Gold mineralization at depth occurs as tabular, sub-horizontal to shallow dipping zones associated with calcareous rocks subject to preparation by alteration and deformation; this deeper mineralization forms the Middle and Lower zones at Cortez Hills. Post-mineral quartz porphyry dikes and sills intrude the Cortez Hills deposits. A northwest trending swarm of steely dipping dikes defines the limits between the Middle and Lower zones.
PEDIMENT
The Cortez Pediment deposit is located in a Tertiary gravel-filled canyon immediately south of Cortez Hills and appears to have originated from material and gold eroded from the top of the Cortez Hills deposit. In contrast to rock formations, the gravels at Pediment display inverted stratigraphy in that the deepest unit is a 50 ft to 200 ft thick siltstone-dominated gravel sourced from the gold mineralized Horse Canyon Formation and it underlies a limestone-dominated gravel (100 ft to 800 ft thick) derived from the erosion of uplifted, barren Devonian Wenban Limestone. The gravels are covered by thin, unconsolidated fanglomerate composed of Eureka Quartzite fragments, the quartzite having been exposed by later uplift east of the Cortez Fault. There are no obvious structural controls, although the Pediment deposit is strongly elongated north–northeast.
CORTEZ PITS (NW DEEPS)
The Cortez NW Deeps deposit is hosted by strongly altered, thin- to medium-bedded silty limestone of the Roberts Mountains Formation and by sheared and altered interbedded dolomite and limestones of the underlying Ordovician Hanson Creek Formation. Devonian Wenban Limestone caps most ridges and hills around the NW Deeps deposit and locally appears to have acted as a cap rock over alteration systems in the underlying Roberts Mountains Formation. Prior to mining, Quaternary alluvium formed a thin veneer of cover over the deposit. Alluvium thickens abruptly to the north across the Cortez range-front normal fault.
| | |
Barrick Gold Corporation – Cortez Operations, Project 2471 Technical Report NI 43-101 – March 21, 2016 | | Page 7-11 |
| | |
| | www.rpacan.com |
Quartz monzonites of the Jurassic Mill Canyon Stock are present east of the deposit on the uplifted side of a north–northwest-trending normal fault. Numerous Oligocene quartz porphyry dikes and sills intrude the deposit. These dikes are considered to be post-mineralization.
A series of north–northwest-trending and northeast-trending faults cut the Roberts Mountains Formation at the deposit. Mineralization occurs where these faults intersect shallow east-dipping thrust breccia zones (thrust duplexes) within the Roberts Mountains Formation.
MINERALIZATION
With the exception of Cortez Hills, the description of mineralization for this section is taken largely from the July 2010 Scott Wilson RPA Cortez audit report with modifications as required for this report.
Gold mineralization is reported as Mineral Resources for the following nine deposits in the Cortez area:
| | • | | Pipeline Complex (3 deposits) – Pipeline, Gap and Crossroads |
| | • | | Cortez Hills Complex (4 zones) – Breccia, Middle, Lower and Pediment |
Mineralization consists primarily of submicron to micrometre-sized gold particles, very fine sulphide grains, and gold in solid solution in pyrite. Mineralization occurs disseminated throughout the host rock matrix in zones of silicified and decarbonatized, argillized, silty calcareous rocks, and associated jasperoids. Gold may occur around limonite pseudomorphs of authigenic pyrite and arsenopyrite. Major ore minerals include native gold, pyrite, arsenopyrite, stibnite, realgar, orpiment, cinnabar, fluorite, barite, and rare thallium minerals. Gangue minerals typically comprise fine-grained quartz, barite, clay minerals, carbonaceous matter, and late-stage calcite veins.
Argillization is characterized by removal of kaolinite and growth of illite in proximity to controlling faults. Arsenic, antimony, iron, and copper accompany gold in north–northwest oriented fault structures and silver, arsenic, manganese, and lead in northeast trending faults.
| | |
Barrick Gold Corporation – Cortez Operations, Project 2471 Technical Report NI 43-101 – March 21, 2016 | | Page 7-12 |
| | |
| | www.rpacan.com |
In the Cortez district, the favoured host rocks for gold mineralization are the Wenban Limestone, followed by the Horse Canyon and Roberts Mountain Formations. Mineralization reflects an interplay between structural and lithological ore controls in which hydrothermal solutions from intrusives moved to favourable porous decalcified limestone.
Mineralization is predominantly characterized by oxides, and sulphidic and carbonaceous refractory material. Carbon content in the deposits is highly variable and occurs generally in the Devonian Wenban Limestone and Roberts Mountain Formation.
Supergene alteration extends up to 656 ft depth resulting in oxide ores, which overlie the refractory sulphides. Alteration has liberated gold by the destruction of pyrite and resulted in the formation of oxide and secondary sulphate minerals, which include goethite, hematite, jarosite, scorodite, alunite, and gypsum.
PIPELINE COMPLEX
Mineralization at Pipeline occurs where an east-dipping thrust duplex crosses a deep-seated 305° striking fracture system. The majority of the mineralization is tabular and stratiform with a shallow easterly dip.
The main Pipeline deposit is 50 ft to 300 ft thick, tabular zone at 500 ft to 600 ft beneath the surface; it dips at a low angle to the east and extends 750 ft north-south by 1500 ft east-west. South Pipeline consists of two zones 1) a shallow zone starting at 65 ft to 150 ft depth and 2) a deep zone starting at 1,000 ft. The shallow zone occupies an area of approximately 1,800 ft by 2,000 ft, north and east respectively, and exhibits both low-angle and high-angle structural controls on gold distribution. The deep zone occupies an area 200 ft north-south by 600+ ft east-west, is up to 250 ft thick and is more closely associated with high-angle structures. Drill depths average 1,000 ft although drill holes up to 1,400 ft are not uncommon in the centre of the deposit where mineralization ranges from 400 ft to over 1,000 ft thick.
Crossroads lies at the south end of the Pipeline trend and is deeper, varying in thickness from less than 10 ft to greater than 300 ft with a primary control of low-angle structures sub-parallel to bedding and an overall 20o easterly dip. The zone is intensely sheared, shattered, and/or brecciated, with minor offsets along the high-angle faults. Oxidation extends to depths in excess of 1,300 ft. Crossroads consists of two mineralized zones: an upper stratiform zone
| | |
Barrick Gold Corporation – Cortez Operations, Project 2471 Technical Report NI 43-101 – March 21, 2016 | | Page 7-13 |
| | |
| | www.rpacan.com |
along the Horse Canyon–Wenban contact and a deeper zone controlled by an east-northeast striking, west dipping (20° to 25°) structural zone that cuts across stratigraphy.
At Gap, mineralization occurs where north-northwest and northeast, high-angle faults intersect thermally altered Wenban Formation in the axis of the Gold Acres antiform. A northern zone of mineralization is primarily hosted within gossan horizons cut by high-angle faults in thermally altered Devonian Wenban Limestone. The southern zone is outside the metamorphic aureole; mineralization occurs within a 1,000 ft wide corridor of strong fracturing bounded on the northeast side by a high-angle, N45W northeast-dipping fault. Gold mineralization is post-metamorphic and strongly oxidized. Carbon alteration is prevalent and increases with depth.
GOLD ACRES
At Gold Acres, the mineralized area is approximately 6,000 ft long by 2,500 ft wide with an average thickness ranging from 80 ft to 200 ft. Mineralization is mainly refractory; high gold grades (greater than 0.10 oz/st Au) are associated with secondary carbon and/or fine-grained sooty sulphide minerals. Minor oxide gold mineralization is hosted within the Upper Plate rocks overlying the Imbricate Thrust Zone (ITZ). The Lower Skarn is largely barren of gold, although it does host minor polymetallic mineralization (Zn–Mo–Cu) presumed to be coeval with intrusive emplacement and skarn formation.
The Gold Acres deposit was developed in two lobes, the north (London Extension Pit) and the south (Old Gold Acres Pit, or OGA). The London Extension Pit is bounded on the north by the northeast striking, moderately westward dipping (50° to 60°) Gold Acres Fault. The Gold Acres Fault down drops the ITZ and Gold Acres Stock approximately 200 ft to the northwest. The Island Fault separates the London Extension and OGA pits and strikes approximately to the north–northeast, dipping at 50° to the northwest. The Island Fault apparently down-drops mineralization in the London Extension Pit relative to the OGA Pit. Multiple northeast-trending faults between the Gold Acres and Island Faults incrementally down-drop mineralized stratigraphy to the north in a stair-step pattern. Both pits have been inactive since 1995 except for a small program in the London Extension Pit in 2000–2001 when refractory ore was mined to supply a third-party for processing.
| | |
Barrick Gold Corporation – Cortez Operations, Project 2471 Technical Report NI 43-101 – March 21, 2016 | | Page 7-14 |
| | |
| | www.rpacan.com |
CORTEZ HILLS COMPLEX
BRECCIA, MIDDLE AND LOWER ZONES
Breccia gold mineralization is hosted in hydrothermally brecciated and fractured rocks that are spatially associated with the Voodoo Fault and its attendant structures. Altered, matrix supported breccia bodies contain the highest gold grades and are surrounded by “crackle” breccias and highly fractured rock with moderate gold grades continuing outwards to less fractured rocks with lower grades. Most of the Breccia mineralization dips moderately southwest enveloping the Voodoo Fault. The upper portion has a northeast dip that possibly reflects control by an antithetic structure. Breccia Zone mineralization extends from a near surface elevation of 5,850 ft to 4,070 ft, terminating just east of the Middle Zone. It is approximately 1,000 ft wide with a northwest trend, and varies in width from 250 ft to 1,900 ft.
Mineralization of the Middle and Lower zones lie at depth to the west and southwest of the Breccia zone. These sub-horizontal, tabular zones are associated with alteration localized along a complex zone of thrust faulting and back thrusts in the Roberts Mountain Formation that has also incorporated slices of Devonian Wenban Limestone. A swarm of northwest trending post mineral quartz porphyry dikes separates the Middle from the Lower Zone. The Lower Zone has a distinct northwest-southeast trend in the Roberts Mountain and Hanson Creek Formations that is interpreted as the crest of a plunging antiform. The Middle zone occurs between elevations 4,235 ft and 3,825 ft, is approximately 1,800 ft wide northwest-southeast by 1,300 ft long northeast-southwest, and ranges in thickness from 10 ft to 270 ft. The Lower Zone lies at an elevation of 4,260 ft to the northwest and 3,060 ft to the southeast, extends 4,300 ft northwest-southeast, varies in width from 1,450 ft in the north to 500 ft in the south and ranges in thickness from 60 ft to 270 ft. Both the Middle and Lower zones are open to both the northwest and southeast.
Post-mineral dikes and sills are significant in that they are estimated to account for up to 10% of the waste rock volume within portions the Cortez Hills deposits.
Gold mineralization is often spatially associated with decalcification and to a lesser degree silicification. Deep oxidation at Cortez Hills is inferred to be related to deep, convection-driven circulation of mixed meteoric and spent hydrothermal fluids during the waning stages of the mineralizing event. The enhanced weathering phenomenon resulted in significant carbonate dissolution and clay formation as well as extremely deep oxidation of gold-bearing iron
| | |
Barrick Gold Corporation – Cortez Operations, Project 2471 Technical Report NI 43-101 – March 21, 2016 | | Page 7-15 |
| | |
| | www.rpacan.com |
sulphide minerals. Arsenates of copper and zinc have been noted in, and adjacent to, oxidized mineralization.
PEDIMENT
Most of the gold in the Pediment deposit is present within the lower of the two gravel/ conglomerate units draped over a paleobasement of thermally altered limestone and marble. Two mineralized zones have been delineated 1) a shallow zone along the southern extent of the deposit, with a depth to the top of the zone ranging from 150 ft to 300 ft, and 2) a deeper zone at the northern part of the deposit, which begins at a depth of approximately 500 ft. Both mineralized zones exhibit a tabular geometry and occupy a general area of 3,000 ft north-south by 600 ft east–west. Gold mineralization is associated with clasts of strongly altered carbonate rocks that have been oxidized and are similar to mineralization found in situ in the near-surface portion of the Cortez Hills Complex.
CORTEZ PITS (NW DEEPS)
The Cortez NW Deep deposit is a continuation of the mined-out main Cortez deposit. The deposit consists of remnants of oxide mineralization in the east wall of the Bass Pond pit and deeper, sulphide and carbonaceous mineralization. A series of north–northwest trending and northeast trending faults cut the Roberts Mountains Formation at the deposit. Gold mineralization is localized where these faults intersect shallow east dipping thrust breccia zones (thrust duplexes). Most of the Cortez NW Deep higher-grade gold mineralization (less than 0.1 oz/st Au) occurs in two zones lying between the 4,200 ft and 4,500 ft elevations beneath the old Cortez open pit floor. Present surface elevations are between 4,800 ft and 5,300 ft. One zone consists of an oxidized and strongly altered thrust zone within the Roberts Mountains Formation and the other is an unoxidized, sulphide-bearing thrust zone at the top of the Hanson Creek Formation. Post mineral quartz porphyry dikes have been emplaced along high-angle faults.
Locally, silica overprints all lithologies, but does not show a strong correlation with gold at a local scale. Silicification occurs as massive fault fill, bedding replacements after decalcification and as micro-veinlets. Massive silicification fills both north–northwest and northeast trending faults. Bedding replacement by silica occurs along beds that were originally carbonate-rich.
Oxidation is pervasive at 4,700 ft elevation. Mineralization becomes dominantly refractory at 4,200 ft to 4,350 ft elevation.
| | |
Barrick Gold Corporation – Cortez Operations, Project 2471 Technical Report NI 43-101 – March 21, 2016 | | Page 7-16 |
| | |
| | www.rpacan.com |
8 DEPOSIT TYPES
The Cortez deposits are “Carlin” style sedimentary rock-hosted and porphyry/epithermal deposits. Carlin deposits form as structurally and/or stratigraphically controlled replacement bodies consisting of stratabound, tabular, disseminated gold mineralization occurring in Silurian-Devonian carbonate rocks. Deposits are localized at contacts between contrasting lithologies, metamorphosed to varying extents. They can also be discordant or breccia-related.
Host rocks are most commonly thinly bedded silty or argillaceous carbonaceous limestone or dolomite, commonly with carbonaceous shale. Although less mineralized, non-carbonate siliciclastic and rare metavolcanic rocks can locally host gold that reaches economic grades. Felsic plutons and dikes may also be mineralized at some deposits.
The deposits are hydrothermal in origin and are usually structurally controlled. The carbonate host rocks are part of an autochthonous miogeoclinal carbonate sequence (Lower Plate) exposed as tectonic windows beneath the Roberts Mountain allochthon. The lower Paleozoic allochthonous (Upper Plate) rocks are siliciclastic eugeoclinal rocks that were displaced eastward along the Roberts Mountain Thrust over younger units during the upper Paleozoic Antler Orogeny. Carlin deposits are localized along the thrust.
Current models attribute the genesis of the deposits to:
| | • | | epizonal plutons that contributed heat and possibly fluids and metals; |
| | • | | meteoric fluid circulation resulting from crustal extension and widespread magmatism; |
| | • | | metamorphic fluids, possibly with a magmatic contribution, from deep or mid-crustal levels; |
| | • | | upper crustal orogenic-gold processes within an extensional tectonic regime. |
The past-producing Buckhorn gold-silver mine and the Hilltop gold project are examples of different styles of mineralization in the Cortez District. Buckhorn is a typical example of a low-sulphidation epithermal system while Hilltop is an intrusive-related deposit. Hilltop is an Eocene-age system clearly associated with 38 Ma to 39 Ma felsic gold-copper porphyries, while Buckhorn is a Miocene occurrence, deposited during the initiation of 15 Ma to 17 Ma Northern Nevada Rift extension and associated bimodal volcanism.
| | |
Barrick Gold Corporation – Cortez Operations, Project 2471 Technical Report NI 43-101 – March 21, 2016 | | Page 8-1 |
| | |
| | www.rpacan.com |
9 EXPLORATION
Modern exploration commenced along the Battle Mountain–Eureka Trend in the 1960s, and has been nearly continuous since that time. Exploration in the Cortez District has been undertaken by Barrick and its predecessor companies such as the CJV and has included mapping, various geochemical and geophysical surveys, pitting, trenching, petrographic, and mineralogy studies, and various types of drilling. The description regarding drilling, sampling methods, and sample quality is discussed in Section 10 Drilling.
Many of the targets being investigated are partially or totally concealed by younger overburden and Tertiary rock cover or by allochthonous Upper Plate Paleozoic siliclastic rocks. Geophysical surveys are being used to help map buried bedrock features.
EXPLORATION POTENTIAL
There is potential for further increases in Mineral Resources.
Barrick funds a multi-million dollar exploration budget each year for the Cortez area. Barrick has advanced stage exploration drilling projects at the mine. Exploration planned for 2015 includes:
| | a. | Cortez Hills Lower Zone (Deep South) – $7.9M to complete a 42-hole infill drilling (11,600 m) program for resource advancement in the Cortez Hills Lower Zone below the 3,800 ft amsl elevation (Deep South Pre-feasibility Study (PFS) area). |
| | b. | CHUG Frontiers – $2.7M to complete 12 step out holes (4,270 m) along potential southern extensions of the Deep South resource and to explore the Renegade Zone approximately 200 m below the current resource. |
| | c. | Deep Roberts – $1.7M to complete five holes (2,700 m) to explore for potential deep mineralization in previously untested horizons up to 300 m below the current Deep South resource. |
| | a. | Barrick completed 49 holes for 19,000 ft of drilling at Hilltop, outlining a body of epithermal, intrusive-related gold mineralization. There is still potential to expand this target as it remains open in several directions. The next steps are to complete fill-in drilling for grade continuity, metallurgical test-work for recovery process options and extension drilling to expand the mineralization and establish a reportable mineral resource at Hilltop |
| | |
Barrick Gold Corporation – Cortez Operations, Project 2471 Technical Report NI 43-101 – March 21, 2016 | | Page 9-1 |
| | |
| | www.rpacan.com |
| | b. | Mill Canyon South – $1.5M to complete three holes (2,750 m) to test targets north of the Horse Canyon Mine and Goldrush discovery. |
| | c. | Crescent Valley – $0.6M to complete one drill hole (+1,000m) to evaluate potential for extensions of Cortez mineral system on the hanging-wall side of the Crescent Fault. |
| | d. | Fourmile Canyon –$0.3M to complete a surface evaluation/targeting program in the area north of the Goldrush discovery. |
| | e. | North Pipeline –$0.1M to complete surface evaluation and targeting focusing on the area north of the Pipeline pit. |
Longer-term exploration potential remains for deep underground targets in the Gold Acres Window, as well as for potential open-pit and underground-mineable targets in the southern and eastern Cortez Window.
| | |
Barrick Gold Corporation – Cortez Operations, Project 2471 Technical Report NI 43-101 – March 21, 2016 | | Page 9-2 |
| | |
| | www.rpacan.com |
10 DRILLING
This description of drilling is taken largely from a previous report entitled “Technical Report on the Cortez Joint Venture Operations, Lander and Eureka Counties, State of Nevada, USA”, dated March 2012. It has been updated based on RPA’s site visit and subsequent review of available documentation.
Exploration and drilling activities for resource development in the Cortez district span a period of more than 40 years and include a variety of drilling techniques and the use of numerous different drill contractors. Approximately 20,448 drill holes are currently in the Barrick Cortez database. This number is known to be incomplete, as a significant portion of the drilling completed by companies other than Barrick and the CJV have not been incorporated in the digital database. The drill hole types included in the database are summarized in Table 10-1. RPA notes that a small number of these holes have been completed since the latest Mineral Resource update.
TABLE 10-1 DRILL HOLE TYPES
Barrick Gold Corporation – Cortez Operations
| | | | | | | | |
Drilling Type | | Number of Holes | | | % | |
Reverse Circulation | | | 13,717 | | | | 67 | |
Core | | | 4,345 | | | | 21 | |
Other | | | 2,386 | | | | 12 | |
| | | | | | | | |
Total | | | 20,448 | | | | 100 | |
Figure 10-1 illustrates the distribution of drill holes contained in the database for the Cortez district. Drill hole collars included in this figure are not representative of the total drilling within the Mine. Many of the drill holes external to the Cortez and Gold Acre Windows were completed for reconnaissance purposes.
| | |
Barrick Gold Corporation – Cortez Operations, Project 2471 Technical Report NI 43-101 – March 21, 2016 | | Page 10-1 |
| | |
| | www.rpacan.com |
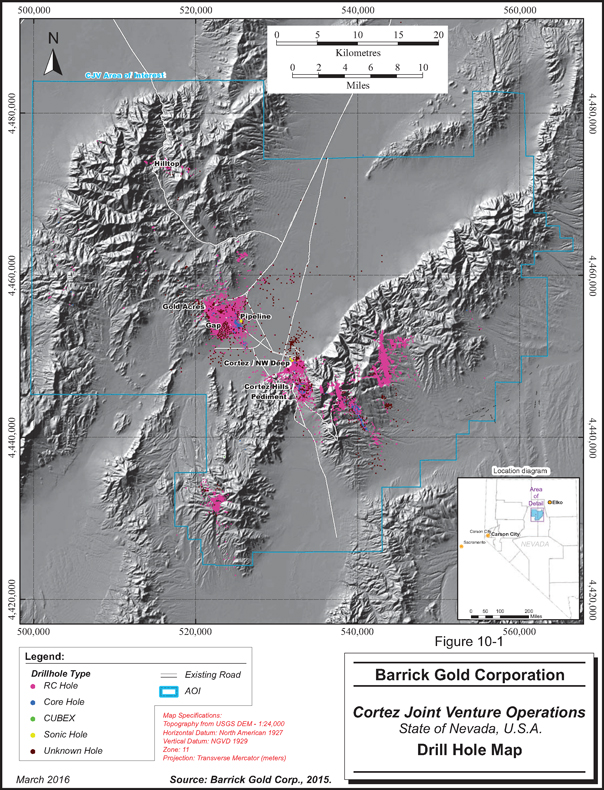
| | |
Barrick Gold Corporation – Cortez Operations, Project 2471 Technical Report NI 43-101 – March 21, 2016 | | Page 10-2 |
| | |
| | www.rpacan.com |
REVERSE CIRCULATION DRILLING METHODS
Reverse circulation (RC) drilling is currently used during the initial phases of exploration, condemnation drilling, and to pre-collar diamond coring holes through intervals of overburden and unaltered cap rocks. RC holes range in diameter from 4.5 in. to 7.0 in. Diameters of 6.5 in. and 6.75 in. are currently used for exploration.
Current practice is for RC holes encountering mineralization to be bracketed on four sides by core holes increasing the density of core holes in mineralized zones. RC pre-collar holes are cased with 4.5 in. casing and core drilling is continued through mineralization and footwall rocks. The depth to which RC drilling is used depends on the water table depth, which is in turn dependent on mining dewatering activity in the area. Since 1980, RC has been typically used for 600 ft to 3,500 ft holes. RC pneumatic hammers are used up to 1,800 ft. Auxiliary compressors are used to increase the effectiveness of the down-hole hammers. Tri-cone rock bits are used at depths below the working depth of hammer bits. Centre-return hammers and bits were used for RC drilling at Pipeline. The deepest RC hole at Pipeline reached a depth of 4,540 ft while the deepest at Cortez Hills has been 4,400 ft.
CORE DRILLING METHODS
Core sizes for wire-line diamond drilling are typically HQ (2.5 in. diameter) for resource development drilling. Occasionally, core holes are reduced from HQ size to NQ (1.9 in. diameter) size in difficult drilling conditions. Surface metallurgical core includes HQ and PQ-3 (3.27 in. diameter) sizes.
Conventional core handling methods and wax impregnated cardboard core boxes are used by the contractors who deliver the core to the logging facility on site. Core runs of 5 ft are typical in waste rock zones, but the shattered and broken nature of the Pipeline shear zone usually results in shorter runs. The drill crew inserts wooden blocks to mark the end of each core run. Manual versus natural breaks in the core are clearly marked with a wax crayon. Core is delivered to the logging shed by technicians or the drilling foreman at least once per shift.
| | |
Barrick Gold Corporation – Cortez Operations, Project 2471 Technical Report NI 43-101 – March 21, 2016 | | Page 10-3 |
| | |
| | www.rpacan.com |
CONVENTIONAL AND MUD DRILLING METHODS
These drilling method use air to pull the sample from the bit to the hole collar up the outside of the drill stem. Typically conventional air holes were short, and terminated at the water table. The drill diameter range was from 5.5 in. to 6.5 in. Conventional mud drilling used a similar sampling technique, with drill water-based bentonite clay/inorganic polymer muds employed facilitating drill sample return. Mud rotary drill holes range in diameter from 6 in. to 9 in. Mud-rotary drills have been used to drill relatively thick sections of alluvium over the Crossroads deposit or in areas being condemned for waste dumps and processing facilities. Core tools were used to complete the bedrock sections of these holes. Limited information remains on the drilling, logging, and sampling methodology for hole-types that were drilled prior to the mid-1990s.
COLLAR SURVEYS
Collar coordinates from the 1960s to the 1980s drilling were determined by optical surveys, field estimates, Brunton compass and pacing, or compass-and-string distance. Recent campaigns have hole collars surveyed with either Total Station electronic distance measurement (EDM) or geodetic-grade, global positioning system (GPS) instruments. Two separate reference grids (Pipeline Mine grid and Cortez grid) are maintained. Survey Data in remote areas is collected in Truncated Universal Transverse Mercator (TUTM) Coordinates and then converted to the appropriate mine grid.
DOWN HOLE SURVEYS
Down hole surveying began in 1991 at the Pipeline deposit. Significant deviations were shown in RC drilling and down hole surveying has been carried out since then. Most holes were surveyed with a recording gyroscope by a commercial contractor. Readings are taken every 50 ft down hole and digitally transferred to the database. Boyles Brothers Drilling used a multi-shot recording gyroscope (MSRG) tool until April 1993. Silver State Surveying later performed all MSRG surveys and currently contractors WelNav and International Directional Services LLC (Deep South) provide the surveys. Mahoney et al. (2009) reports that significant work has been carried out by Cortez to determine the accuracy of the instruments of each contractor.
| | |
Barrick Gold Corporation – Cortez Operations, Project 2471 Technical Report NI 43-101 – March 21, 2016 | | Page 10-4 |
| | |
| | www.rpacan.com |
Underground core holes drilled prior to May 2008 were surveyed down-hole by Deep South. Since then surveying has been done by Cortez personnel using Reflex magnetic instrumentation. Geotechnical holes have been drilled in each discovery to date using oriented tools. These normally use a plasticine, triple scribe, and down-hole camera system.
Down-hole surveys for a limited number of holes are incomplete where ground conditions such as caving restrict access for the survey instrument.
SAMPLE RECOVERY
In general, core-drilling practices at Pipeline, Crossroads, Gap, the Cortez Pits (NW Deeps), Cortez Hills and Pediment ensure a relatively high core recovery. Core recovery is sufficient to provide representative samples of a sedimentary rock-hosted gold deposit. Prior to 1991, core recovery values and RC sample weights were not routinely digitized or added to the general drill hole database. Wet drilling conditions for RC holes prohibit measurements of sample weights as a result recovery of RC materials cannot be calculated.
Core recoveries are maximized by use of triple-tube core barrels, face-discharge bits, and special drilling mud. Core recovery averaged 93% for 314 holes used in the Pipeline and South Pipeline FS (Placer Dome Technical Services, 1995). The median core recovery for the Cortez Hills deposit was 96%. Only four core holes in the Cortez Hills deposit had less than 80% core recovery and were located in an approximate 150 ft by 150 ft geographic area in the upper extreme eastern portion of the lower-grade mineralized area near the intersection of four faults.
GEOTECHNICAL AND HYDROLOGICAL DRILLING
Geotechnical and hydrological holes have been drilled to provide raw data for the hydrological and geotechnical portions of the PFS and FS on the Pipeline and Cortez Hills deposits, and subsequently to support mining operations. Thirty-two underground core holes have been drilled for geotechnical purposes. These holes were designed parallel to planned drifts and served to predict the character of the rock mass to be developed.
| | |
Barrick Gold Corporation – Cortez Operations, Project 2471 Technical Report NI 43-101 – March 21, 2016 | | Page 10-5 |
| | |
| | www.rpacan.com |
GRADE CONTROL DRILLING
OPEN PIT
Blast holes in rock on 50 ft ore benches are drilled on a staggered pattern approximately 22 ft by 25 ft with an 83/4 in. bit. This spacing has been decreased to 16 ft by 16 ft in carbonaceous ore. On 40 ft waste benches, blast hole (83/4 in. bit) spacing ranges from 22 ft by 22 ft up to 27 ft by 27 ft. Blast holes in alluvium employ a 83/4 in or 97/8in bit and are spaced from 22 ft by 22 ft up to 27 ft by 27 ft apart on a square grid as determined by the blast engineer. All blast holes have a four foot sub-drill.
UNDERGROUND
Initial core drilling for the breccia zone was completed with flat fans of HQ core holes drilled to nominal 50 ft spacing across the body of the projected mineralization at Cortez Hills. These fans are drilled approximately every 60 ft to 75 ft on the vertical axis of the body. Additional Cubex RC fan drilling using a four inch bit is carried out on working levels at a nominal 25 ft to 50 ft spacing. Down hole surveys for Cubex are conducted by the drill contractor, Connors Drilling LLC, which uses Reflex instrumentation run within PVC tubing placed in the hole.
Subsequent core drilling has been from drill platforms that drill perpendicular (shower heads) to mineralization. Breccia zone holes were drilled from the hangingwall side of the deposit. Middle and Lower Zones holes are drilled from development drifts located directly above the mineralization. Cubex (underground RC drills) drilling is used for grade control and can be drilled from active mining levels or dedicated drill bays
MINERAL RESOURCE DELINEATION DRILLING
Surface drilling is initially carried out on a 400 ft square pattern, closing in the next stage to a 200 ft grid. In-fill drilling is done on a five-spot pattern, resulting in an average hole spacing of 141 ft. At Pipeline, “X-shaped” patterns of more closely spaced holes have been drilled to provide information for gold grade variography; this may locally decrease the hole spacing to approximately 70 ft.
Underground mineralization is drilled to a nominal 200 ft spacing from surface, then underground drilling is conducted to reduce spacing to 100 ft or less for Mineral Resource to
| | |
Barrick Gold Corporation – Cortez Operations, Project 2471 Technical Report NI 43-101 – March 21, 2016 | | Page 10-6 |
| | |
| | www.rpacan.com |
Mineral Reserve transition. Prior to production additional underground drilling is completed to close up the spacing to between 25 ft and 50 ft for final mine design.
Drill holes are generally vertical. Inclined core holes were drilled at Cortez Hills to confirm the orientation of relatively high-grade gold-mineralized zones and to obtain geotechnical information for the planned Cortez Hills pit. Several angle core holes were drilled at the Cortez Pits (NW Deep) and Pipeline to provide geotechnical data and further delineate areas of mineralization.
PIPELINE COMPLEX AND GOLD ACRES
Drilling in the area of the Pipeline Complex including the Pipeline, Crossroads, Gap and Gold Acres deposits comprises 5,419 drill holes for approximately five million feet. Drilling dates from the 1960s to 2014, and comprises conventional, RC and core drilling. Almost all of the conventional drilling was in upper portions of the deposits, and has subsequently been mined out. Approximately 20 conventional holes were drilled after 2006, for approximately 60,000 ft. The resource estimation database contains 3,266 holes totalling 2,908,456.8 ft of which 2,973 are core holes for 2,704,949 ft and 293 are RC holes for 203,508 ft, including pre-drilling for core holes. Additional metallurgical and ore characterization drilling was done in 2014 in the Pipeline Complex. The resource drilling database for Gold Acres consists of 1,725 surface drill holes for 461,363 ft and includes over 68,700 assays.
Figure 10-2 illustrates a drill hole location plan for the Pipeline Complex including the Pipeline, Crossroads, and Gap deposits.
Figures 10-3 and 10-4 show representative cross sections through the Pipeline and Crossroads deposits, respectively.
Figure 10-5 shows a surface plan with drill hole locations for the Gold Acres deposit and Figure 10-6 provides a representative cross section through the deposit.
| | |
Barrick Gold Corporation – Cortez Operations, Project 2471 Technical Report NI 43-101 – March 21, 2016 | | Page 10-7 |
| | |
| | www.rpacan.com |
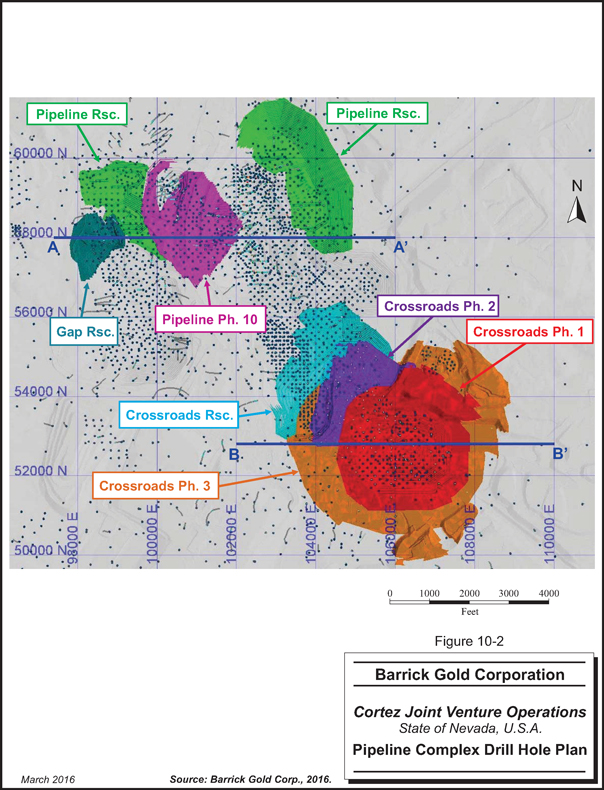
| | |
Barrick Gold Corporation – Cortez Operations, Project 2471 Technical Report NI 43-101 – March 21, 2016 | | Page 10-8 |
| | |
| | www.rpacan.com |
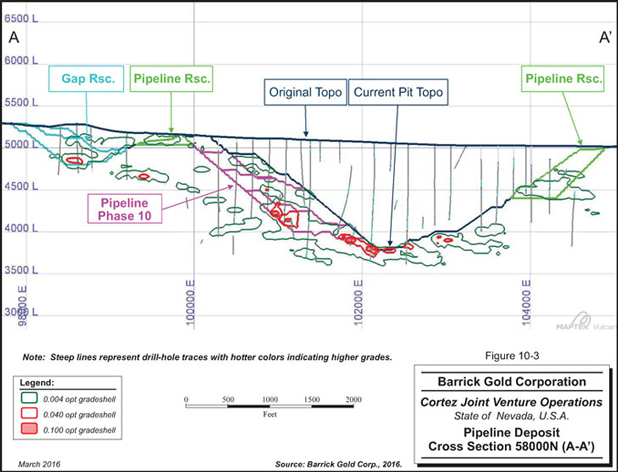
| | |
Barrick Gold Corporation – Cortez Operations, Project 2471 Technical Report NI 43-101 – March 21, 2016 | | Page 10-9 |
| | |
| | www.rpacan.com |
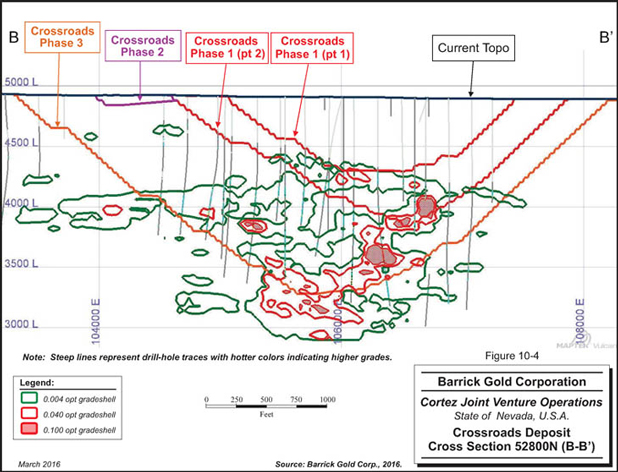
| | |
Barrick Gold Corporation – Cortez Operations, Project 2471 Technical Report NI 43-101 – March 21, 2016 | | Page 10-10 |
| | |
| | www.rpacan.com |
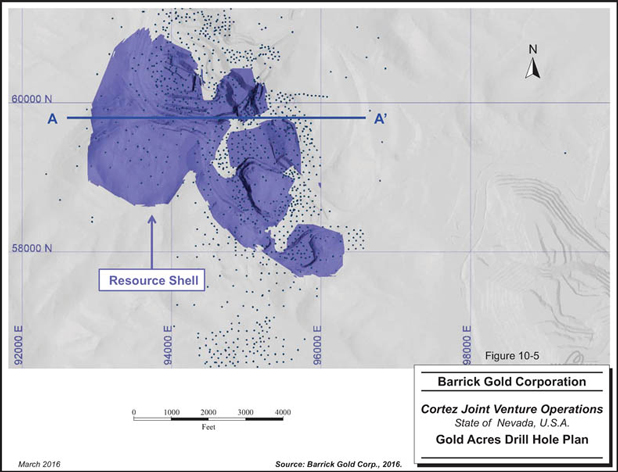
| | |
Barrick Gold Corporation – Cortez Operations, Project 2471 Technical Report NI 43-101 – March 21, 2016 | | Page 10-11 |
| | |
| | www.rpacan.com |
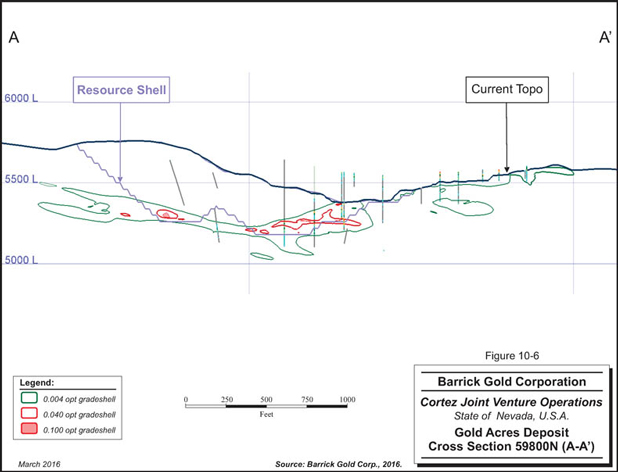
| | |
Barrick Gold Corporation – Cortez Operations, Project 2471 Technical Report NI 43-101 – March 21, 2016 | | Page 10-12 |
| | |
| | www.rpacan.com |
CORTEZ HILLS AND PEDIMENT
The 2015 resource extraction showed that the surface and underground drilling in the area of the Pediment and Cortez Hills deposits totals over two million feet in 3,542 holes completed from 1964 to 2015. This includes RC, core, dewatering, piezometer, and various other drilling types. The drill data for Cortez Hills was culled and data with various quality assurance/quality control quality assurance and quality control (QA/QC) issues (i.e. downhole contamination, poor assay sampling, missing collars and surveys, etc.) was later excluded from the resource estimations.
Drill holes at the Pediment and Cortez Hills deposits are nominally spaced at 100 ft by 100 ft. Underground drilling of the Breccia Zone varies from 50 ft by 50 ft or less in areas of active underground mining to 150 ft by 150 ft within the “open-pit only” portions of the Mineral Resources. Underground drill hole spacing in the Middle Zone of Cortez Hills varies from 50 ft by 50 ft to 25 ft by 25 ft or less. Drill spacing in the Lower Zone of Cortez Hills varies from 50 ft by 50 ft to 100 ft by 100 ft depending on the level delineation across the deposit.
Figure 10-7 shows a location plan for the Cortez Hills Complex including the Breccia, Middle, and Lower Zones of Cortez Hills and the Pediment deposit. Figures 10-8 to 10-10 show cross and longitudinal sections illustrating the geology, gold mineralization limits, and typical drill hole density for the various Cortez Hills zones.
| | |
Barrick Gold Corporation – Cortez Operations, Project 2471 Technical Report NI 43-101 – March 21, 2016 | | Page 10-13 |
| | |
| | www.rpacan.com |
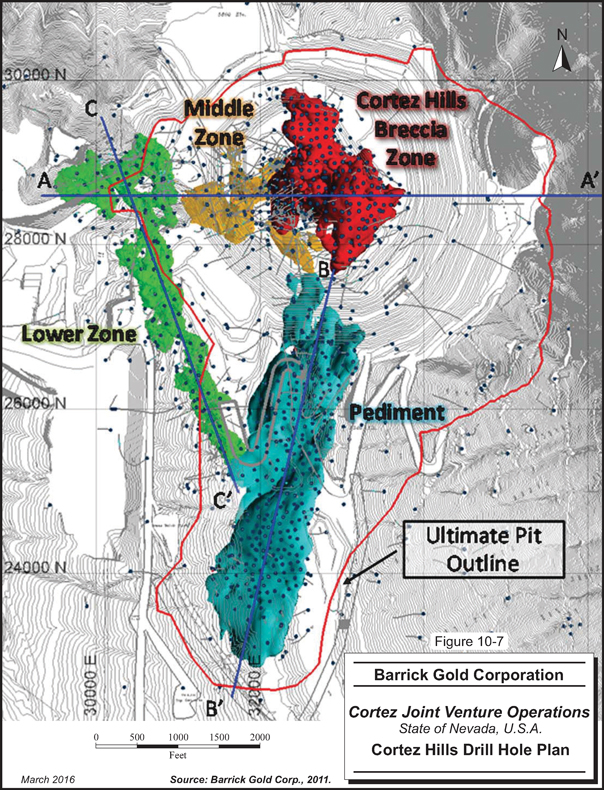
| | |
Barrick Gold Corporation – Cortez Operations, Project 2471 Technical Report NI 43-101 – March 21, 2016 | | Page 10-14 |
| | |
| | www.rpacan.com |
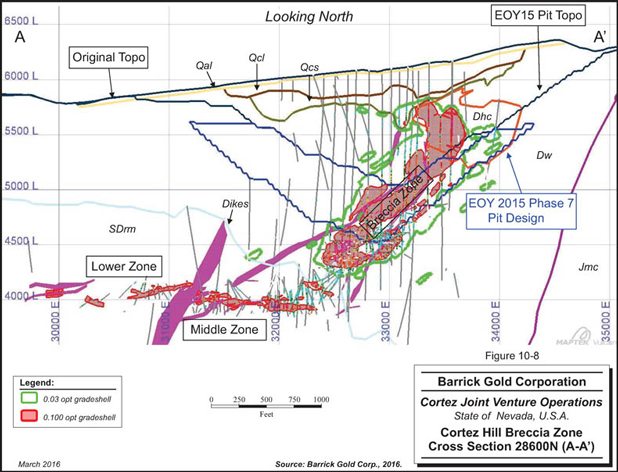
| | |
Barrick Gold Corporation – Cortez Operations, Project 2471 Technical Report NI 43-101 – March 21, 2016 | | Page 10-15 |
| | |
| | www.rpacan.com |
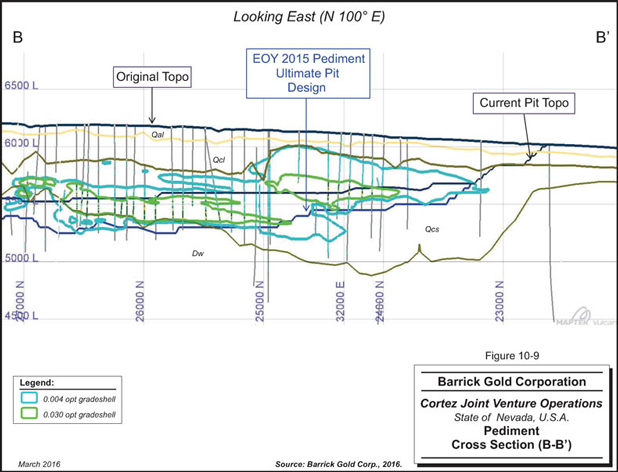
| | |
Barrick Gold Corporation – Cortez Operations, Project 2471 Technical Report NI 43-101 – March 21, 2016 | | Page 10-16 |
| | |
| | www.rpacan.com |
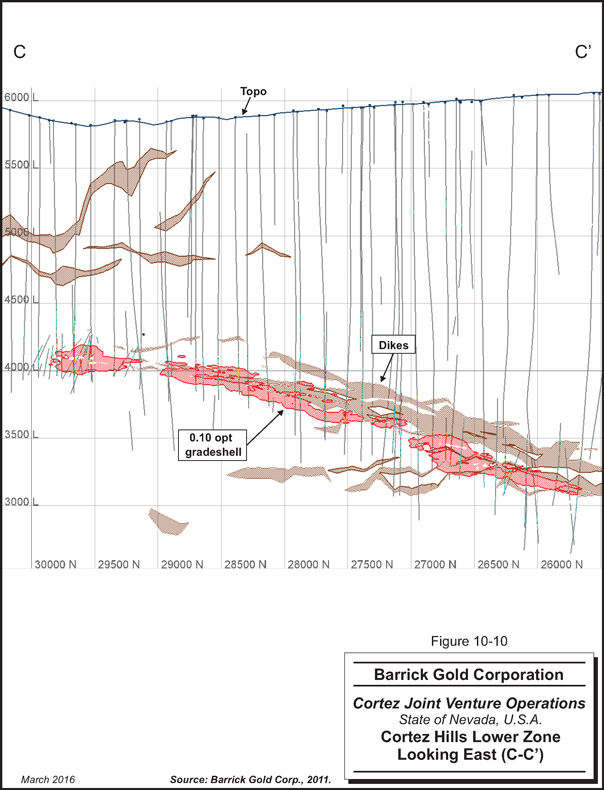
| | |
Barrick Gold Corporation – Cortez Operations, Project 2471 Technical Report NI 43-101 – March 21, 2016 | | Page 10-17 |
| | |
| | www.rpacan.com |
CORTEZ PITS (NW DEEP)
Drilling in the Cortez Pits area dates back to before 1967, but only validated holes from 1986 to 2015 are included in the drill database used for resource work. The Mineral Resource estimate is supported by approximately 280,860 ft of drilling in 450 holes and 37,415 assays. This includes 245,951 ft of RC drilling in 396 holes and 34,952 ft of core drilling in 54 holes.
Figure 10-11 presents the drilling for the Cortez Pits area and Figure 10-12 is a typical cross section.
| | |
Barrick Gold Corporation – Cortez Operations, Project 2471 Technical Report NI 43-101 – March 21, 2016 | | Page 10-18 |
| | |
| | www.rpacan.com |
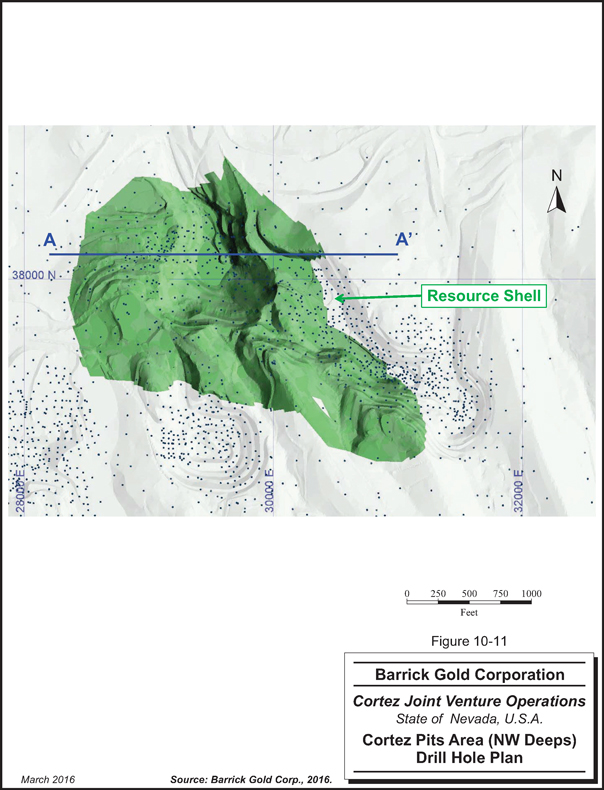
| | |
Barrick Gold Corporation – Cortez Operations, Project 2471 Technical Report NI 43-101 – March 21, 2016 | | Page 10-19 |
| | |
| | www.rpacan.com |
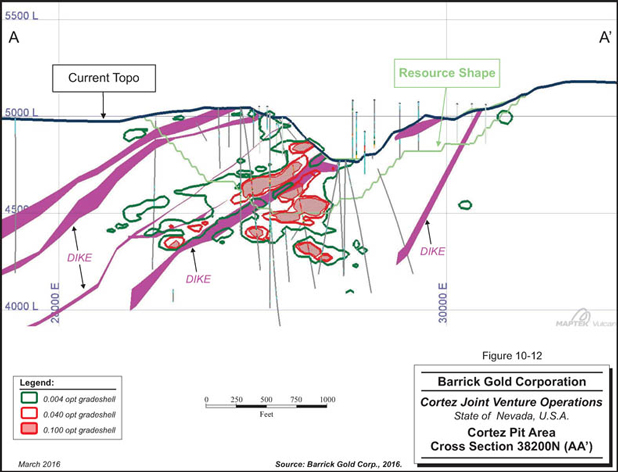
| | |
Barrick Gold Corporation – Cortez Operations, Project 2471 Technical Report NI 43-101 – March 21, 2016 | | Page 10-20 |
| | |
| | www.rpacan.com |
COMMENTS ON DRILLING
In RPA’s opinion, the quantity and quality of the lithological, geotechnical, collar, and down hole survey data collected in the exploration, delineation, and grade control drill programs are sufficient to support Mineral Resource and Mineral Reserve estimation. RPA also notes that:
| | • | | Drill hole orientations are appropriate with respect to the orientation of the mineralization. |
| | • | | Drilling is normally perpendicular to the strike of the mineralization, but depending on the dip of the drill hole and the dip of the mineralization drill intercept widths are typically greater than true widths. |
| | • | | Drill hole intercepts adequately reflect the nature of the gold mineralization. Down hole composite data indicate areas of higher-grade and lower-grade mineralization, and waste material within the deposits. |
| | • | | The deposits have been well drilled. |
| | • | | Through interpretation and aggregation of the drill hole data, the sections provide a representative estimation of the true thickness of the mineralization for the various deposits in relation to planned pit and underground mining boundaries that are used to constrain the Mineral Resources and Mineral Reserves. |
| | • | | Collar surveys have been performed using industry-standard instrumentation. |
| | • | | Down hole surveys have been performed using industry-standard instrumentation. |
SAMPLING METHOD AND APPROACH
RC SAMPLING
Drillers carry out the sampling on the RC drill rig. After material discharges from the hydraulic, revolving wet sample splitter on the cyclone, the fraction to be sampled was subdivided by a Y-shaped joint in a 5 in. sample discharge pipe and each split collected in a five-gallon plastic bucket lined with 19 in. by 22 in. Micro-Pore sample bags. Bags are pre-numbered and tagged by Cortez. Recently, collection has been modified to Micro-Pore bags placed in one-gallon metal sleeves hung beneath each arm of the Y pipe splitter. Samples are allowed to air dry in the field and are then picked up at the drill sites by geological technicians. Where areas are relatively open to the public, this loss of chain of command may compromise sample security.
RC chip samples (typically -1/2 in.) were collected by drillers in 5 ft intervals for Gold Acres drilling and in the initial 1991 drilling at Pipeline. By late 1991, RC samples at Pipeline were collected on 10 ft intervals per the Cortez Hills protocol. The 10 ft samples weigh from 10 lb
| | |
Barrick Gold Corporation – Cortez Operations, Project 2471 Technical Report NI 43-101 – March 21, 2016 | | Page 10-21 |
| | |
| | www.rpacan.com |
to 15 lb and represent a mass reduction to a small percent of the original. The sample reduction is summarized in Table 10-2.
TABLE 10-2 RC SAMPLE REDUCTION
Barrick Gold Corporation – Cortez Operations
| | | | |
| RC Hole | | 10 ft Length |
Diameter | | 10 lb | | 15 lb |
7” | | 2% | | 4% |
4.5” | | 6% | | 9% |
7” | | 41x | | 27x |
4.5” | | 17x | | 11x |
RC sampling procedures were modified for drilling at the Pediment deposit in accordance with recommendations by consultant Francis Pitard in 1999. Samples weighing from 35 lb to 40 lb are now collected from development RC holes at Pediment.
Footage intervals were recorded by a technician on a separate shipment record from the corresponding sample numbers. Commercially prepared standards and blank samples of landscaping marble are inserted by the drillers randomly into the numbering sequence prior to sample pickup.
Chip samples of each RC interval are collected and stored in plastic chip trays for geologic logging. Each chip tray represents about 200 ft of drilling. Chips are logged by project geologists or geological contractors. The logging form is set up to record stratigraphic formation, rock type, rock textural characteristics, veining, significant minerals, alteration, and estimated sulphide, carbonate and carbon content. Completed logs are entered into a master database. Chip trays are stored in a central warehouse facility on site. Until the 1970s, representative RC chips were glued to boards as hole records; however, none have survived. Digital backup copies of the geologic logs are stored offsite. All hardcopy logs that were used prior to the inception of digital logging are archived in files, labelled, and stored in the exploration or mine geology offices.
Drilling is almost always carried out with water injection. Drilling below elevations ranging from 5,000 ft to 5,700 ft at Cortez Hills is below the water table. Total sample weight cannot be measured because of wet drilling conditions; therefore RC recovery cannot be calculated.
| | |
Barrick Gold Corporation – Cortez Operations, Project 2471 Technical Report NI 43-101 – March 21, 2016 | | Page 10-22 |
| | |
| | www.rpacan.com |
CORE LOGGING AND SAMPLING
Drill core is washed and photographed prior to logging. Core is digitally photographed wet, except in cases of exceptionally poor rock quality. Older film photographs have been scanned and electronically archived. Step-out exploratory drill holes are summary-logged and representative chip samples are collected at one foot intervals, making up a composite sample over 20 ft. The chip samples are analyzed for gold as well as multi-element geochemistry. Chip samples are excluded from grade estimations. If the core was later cut, the cut core values are used for grade estimation, if the core was not cut, because of low grade assay results than the chip grades are set 0.0001 oz/st Au and treated as waste during grade estimation. Retained core character samples are stored on site at the Pipeline and Cortez core storage facilities.
When the assays are returned for the exploratory hole, detailed geologic logging is carried over the mineralized interval, bracketed by 100 ft of core above and below. The interval is then cut and resubmitted for gold assay. In-fill and development drill holes are subjected to detailed geologic and geotechnical logging.
The core is logged by a geologist for geological and geotechnical elements. Prior to 2004, logging was either done on paper and then entered into a computer or entered directly into a computer and was verified by Placer Dome software with text and graphics capability. After review by geologists, corrected logs were reprinted and electronically merged into the master database by a computer administrator. After the implementation of an acQuire SQL Server database in 2004, logging was changed to an acQuire data input form. This requires selection of attributes from a prescribed list, avoiding entry of non-standard symbols or qualifiers. The computerized geological logging format allows for recording mineralogy, structure, texture, alteration, rock type, colour, brightness, lightness, grain size, sorting, sphericity, shape, degree of decalcification, and carbon content.
Point load tests of selected intervals and other geotechnical data were collected by staff technicians and the geology department. After mid-2006, Golder Associates Ltd. (Golder) carried out this task, but only on core drilled for geotechnical purposes or upon request.
Most drill-core from Pipeline and Cortez Hills was sampled and assayed at 10 ft intervals, though several holes were assayed at 5 ft or variable geological intervals early in the drilling programs. Since 2004, exploration core holes have been sampled on 10 ft intervals in barren
| | |
Barrick Gold Corporation – Cortez Operations, Project 2471 Technical Report NI 43-101 – March 21, 2016 | | Page 10-23 |
| | |
| | www.rpacan.com |
rock and on geologically defined intervals up to five feet in mineralization. Underground core is sampled on 5 ft intervals, however, samples could be a minimum of 2 ft to a maximum of 6 ft to facilitate respecting lithological or mineralization contacts.
Almost all core was sawn in half by a Cortez technician except for underground core where whole core is sampled. A hydraulic splitter has been used for extremely hard rock to maintain acceptable production rates. Any fragmented core less than one inch diameter was split through a riffle splitter. One-half of the core or a riffle split was placed back in the original core box and the other half in 10 in. by 22 in. Micro-Pore cloth sample bags with a numbered paper sample tag. Sample numbers are assigned using sample ticket books. The sample number was also handwritten on the exterior of the bag with a permanent marking pen, along with the drill hole number. Including drill hole numbers with sample labels is not considered best practice. A technician recorded footage intervals on a separate shipment record form with the corresponding sample number. Metallurgical core was quartered, with one quarter retained as a character sample and the remaining assayed and consumed for metallurgical testing.
The retained core is stored on site. Barrick exploration has a core storage facility, which contains drilling for the site, located near the Pipeline administration office. Other sample storage areas include the East Pit at Cortez Pits and the Gold Acres Pit.
CONVENTIONAL AIR-ROTARY AND MUD-ROTARY SAMPLING
Sampling was carried out at 5 ft to 10 ft intervals. Early (mid-1980s) rotary air sampling may have been accomplished in dry conditions using non-porous plastic bags. Sample numbers were assigned using sample ticket books.
BLAST HOLE SAMPLING
The practice is to double sample the 40 ft blast holes on mineralized horizons. One sample represents the bottom 20 ft, while the other represents the upper 20ft of the hole. Any 40 ft trim shots are single sampled as are 20 ft holes on a 20 ft bench. A representative sample of blast-hole drill cuttings is collected by placing a 6 in. diameter, 12 in. tall vertical cylinder near the drill hole and inside the rig dust rubber curtain. Approximately 7 lb to 8 lb of material is collected. The sample number records the location and uses a bar-coded tag. Samples are assayed at the Cortez Mine assay laboratory. Analytical data are incorporated electronically into the blast-hole database. The blast hole sample reduction is summarized in Table 10-3.
| | |
Barrick Gold Corporation – Cortez Operations, Project 2471 Technical Report NI 43-101 – March 21, 2016 | | Page 10-24 |
| | |
| | www.rpacan.com |
TABLE 10-3 BLAST HOLE SAMPLE REDUCTION
Barrick Gold Corporation – Cortez Operations
| | | | | | | | |
| Diameter | | Sample Reduction to: | | Including Sub-Drill |
(in.) | | 7 lb | | 8 lb | | 7 lb | | 8 lb |
9.875 | | 0.22% | | 0.25% | | 0.20% | | 0.22% |
8.875 | | 0.53% | | 0.61% | | 0.44% | | 0.51% |
9.875 | | 465x | | 407x | | 511x | | 447x |
8.875 | | 188x | | 164x | | 225x | | 197x |
Blast-hole sample results are used for open-pit mine grade control, but are not used for Mineral Resource and Reserve estimates.
UNDERGROUND MUCK SAMPLING (CORTEZ HILLS)
Muck sampling is the only means of grade control currently used at Cortez Hills underground. Grab samples are collected by shovel from the bucket of the 6-yard scoop tram load-haul-dump (LHD). At the truck bay, the LHD operator takes a sample of every 1st, 5th, 10th, and 15th LHD load from the muck pile of a given round.
The muck sample is placed in 12 in. by 18 in. bar coded bags and represents approximately 20 lb of material. Analysis developed by Pierre Gy and screen tests determined that samples of one inch to two inch fragments plus fines are representative. Samples are assayed at the Cortez Mine assay laboratory. Analytical data are incorporated electronically into a muck database within the acQuire database and there is a plan to use the muck sample results and the exploration drilling results in a Vulcan software grade control module to create mini-block models.
Underground muck sample results are used for mine grade control, i.e., material routing on a round by round basis, but are not used for Mineral Resource and Mineral Reserve estimates.
BULK DENSITY DETERMINATION
Whole core sampling for bulk density measurement was initiated in April 1992 at the Pipeline deposit and density was determined for a total of 467 ore and waste samples. Standard practice since 1999 has been to collect samples at 35 ft to 40 ft intervals in mineralized rock and one sample within 50 ft. in the hanging wall and footwall. Generally, density samples are
| | |
Barrick Gold Corporation – Cortez Operations, Project 2471 Technical Report NI 43-101 – March 21, 2016 | | Page 10-25 |
| | |
| | www.rpacan.com |
taken 0 ft to 50 ft above the mineralization, in mineralization, and 0 ft to 50 ft below the mineralization.
Core is prepared by the Cortez geology staff and the mine metallurgical laboratory carries out the density measurements. The primary method of measuring core density is by wax immersion. Competent core is coated in wax and then immersed in water. There are five other methods, which have been used in the past and may be used on occasion depending on the situation. Those other methods are:
| | 1. | Fragment displacement (lacquer coated fragments are immersed in water) |
| | 2. | Core displacement (lacquer coated core is immersed in water) |
| | 3. | Core axis length and diameter is measured and applied to dry weight of sample |
| | 4. | Plastic sleeve (poor quality core in PVC pipe is wrapped and immersed in water) |
| | 5. | Buoyancy (competent core is wrapped in cellophane and immersed in water) |
Cortez has compiled bulk densities for the various rocks and overburden for each deposit. Values range from 11.7 ft3/st to 16.6 ft3/st for rocks and 16.2 ft3/st to 19.1 ft3/st for alluvium and the Pediment deposit.
LOGGING, SAMPLING, AND SAMPLE STORAGE FACILITIES
Cortez has permanent facilities for core logging and sampling, as well as storage warehouses. RPA visited the exploration core facility located near the Pipeline Mill and found the layout to be clean, organized and in line with industry standards for layout, facilities and procedures. Drill core, RC chips, retained character core, pulp, and pulp duplicate samples are stored onsite in the Cortez and Pipeline storage warehouses. Older core for mined-out portions of the deposits has been skeletonized to reduce storage. Samples rejects are retained, but stored outside where they degrade after two to three years at which time they are no longer useful. Prior to 2006, core could be stored in open air core yards, but this practice has been discontinued.
RPA COMMENTS ON SAMPLING METHOD AND APPROACH
In RPA’s opinion, the core handling, logging, and sampling protocols conform to industry-standard practice, are being carried out to a reasonable standard, and are acceptable for Mineral Resource and Mineral Reserve estimation.
| | |
Barrick Gold Corporation – Cortez Operations, Project 2471 Technical Report NI 43-101 – March 21, 2016 | | Page 10-26 |
| | |
| | www.rpacan.com |
QUALITY ASSURANCE AND QUALITY CONTROL
Since 2006, Barrick corporate geochemists have visited the laboratories that undertake analysis and sample preparation for the Cortez Mine. QA/QC for sampling, sample preparation, and assaying has evolved at Cortez since 1991. Current procedures include insertion of blanks and certified standard samples into sample streams to the mine and commercial laboratories, check assays of pulp duplicates by commercial laboratories, and assaying of coarse reject duplicates.
Barrick’s QA/QC practices at Cortez exploration comprise a minimum of one standard, one blank and one duplicate introduced per batch of 30 samples to the sample stream resulting in 10% quality control samples. Underground grade control drilling involves insertion of one standard and one control blank for every 30 samples, however, because whole core is often sampled there is no opportunity for duplicate samples.
The acQuire database is maintained by the Database Administrator at Barrick Gold Exploration Inc. office in Elko. The assay laboratories report results to the central office as well as the project geologist. Monthly QA/QC reports are prepared by the Database Administrator. The report evaluates the performance of the QA/QC samples, identifies any QA/QC failures, and tracks their investigation and resolution including any assay re-runs. Failures are reported to the project geologist who decides on a course of action. Issues that cannot be resolved by the project geologist result in a re-run of an entire batch or in some cases an entire hole. Assays are maintained on temporary status until signed off by the central office and the project geologist.
The QA/QC program for 2015 included standards, blanks, and duplicates, which accounted for greater than 6% of the total, an insertion rate of approximately 1:14. The failure rate was 1.8% and all of the issues were resolved.
STANDARD SAMPLES
Certified Reference Standard (CRM) samples are materials of known values used to check and quantify the analytical accuracy of laboratories.
At Cortez standards were originally made from stockpile materials at the mine. Since 2006, commercially available standards have been used. Certified Reference Standard (CRM)
| | |
Barrick Gold Corporation – Cortez Operations, Project 2471 Technical Report NI 43-101 – March 21, 2016 | | Page 10-27 |
| | |
| | www.rpacan.com |
samples were purchased from Rocklabs as pulps that were assayed in a round robin of 28 laboratories or made from bulk samples sent from Barrick’s Nevada operations to CDN Resource Laboratories Ltd. to make reference material after a 14 laboratory round robin. The average value and its standard deviation (SD) for the round robins are certified. The variation from the standard’s mean value in standard deviations defines the QA/QC variance and is used to determine acceptability of the standard sample assay. Approximately 150 g of sample material is submitted per QA/QC sample.
There are currently fourteen standard samples being used with expected samples ranging from 0.00825 oz/st Au to 0.45442 oz/st Au. Standard samples are inserted into the sample stream at a ratio of 1:30 for surface exploration and approximately 1:15 for open pit production samples and underground diamond drill samples.
The criteria for pass or failure are as follows.
| | • | | Assay value < certified mean ±2 SDg Pass |
| | • | | Assay value³ mean ±2 SD and£ mean ±3 SDg Warning or Failure |
| | • | | Assay value > mean ±3 SDg Failure |
A failure is declared when the same standard exceeds two consecutive ±2 SD warnings or when an individual result exceeds ±3 SD from the expected result.
The geologist in charge is notified when a standard failure occurs. The geologist then determines if the failure can be accepted or if the laboratory needs to re-run the failing batch.
BLANK SAMPLES
A blank control sample is material with a zero gold value. Blanks are inserted to assess sample preparation, specifically to identify “grade smearing” or sample carryover in subsequent samples caused by improper sample preparation and contamination, and to evaluate analytical “background noise”. Prior to 2006, blank material was made from:
| | • | | Un-mineralized drill core from Gold Acres |
| | • | | Waste rock from the Cortez Pits |
| | • | | Alluvial gravel taken from a pit near the Gold Acres haul road |
| | |
Barrick Gold Corporation – Cortez Operations, Project 2471 Technical Report NI 43-101 – March 21, 2016 | | Page 10-28 |
| | |
| | www.rpacan.com |
Since 2006 landscape marble has been the material used to make blank samples for QA/QC at Cortez.
The following criteria are used to evaluate analytical results received for blank samples.
| | • | | Assay result less than 0.002 oz/st Au - Pass |
| | • | | Pass limit is extended by 1% carry-over from surrounding samples |
| | • | | Assay result equal to or greater than 0.002 oz/st Au - Failure |
The geologist in charge is notified when a blank failure occurs. The geologist then determines if the failure can be ignored or if the laboratory needs to re-run the failing batch.
Laboratory procedures include cleaning of the sample preparation circuit after sample batches, however, the 1% allowance of carry-over grade from surrounding samples makes some allowance for potential contamination from high grade samples processed within a sample batch.
DUPLICATE SAMPLES
Duplicate samples of coarse rejects provide information on sample preparation and assay precision, while duplicate pulp samples may be used to quantify analytical precision. The assay results of the duplicates are analyzed by preparing scatter plots and relative difference plots that compare the difference of grade of the pairs to the mean grade of the pairs. The pass/fail criteria used by Barrick for duplicate pulp samples is nominally +/- 20%.
OUTSIDE CHECK SAMPLES
American Assay Laboratories were sent 2% of the Cortez original sample pulps for independent check assays during 2015. Using the original assay results from the primary laboratory as a guide, the geologist selects the pulps to be submitted for check assay. The chosen suite of pulps are representative of the ore types present in the samples, and include high grade, low grade, and waste material. Requirements for this protocol include:
| | 1. | The original pulp splits must be submitted, not a duplicate split taken from pulp rejects. |
| | 2. | The pulps are submitted to the secondary laboratory in one batch and should be assayed together. |
| | 3. | At least one standard sample (SRM) pulp is included with each lot of check assay pulps. |
| | |
Barrick Gold Corporation – Cortez Operations, Project 2471 Technical Report NI 43-101 – March 21, 2016 | | Page 10-29 |
| | |
| | www.rpacan.com |
Recent practices at Cortez for independent check assays are to have the primary laboratory, ALS Chemex, randomly select every 20th pulp and forward these to American Assay Laboratory for a second check assay. This represents a 5% check ratio. Pass/fail criteria used is ±20% of the original value.
In the past, results of check assaying on pulps and coarse rejects were not routinely evaluated. Check assays, however, were used intermittently to evaluate biases between the mine laboratories and commercial laboratories.
For the period 1992 to 1996, a large number of commercial laboratories were used to check assays by Laboratory No. 1. No record was kept of the source laboratories for each check in all cases; therefore, some of the data cannot be differentiated by laboratory. A detailed review of check and duplicate assay records in 2003 reduced the number of unidentified laboratory assays to approximately 4%. No significant bias was detected between the mine and the commercial laboratories.
Check assay plots show a relatively high variability between the mine laboratory and commercial laboratories for 1997 through 1999 assaying. For grades greater than 0.01 oz/st Au, a majority of check assays are within ±20% to ±30% of the original value, which is somewhat higher than the expected ±10%.
Check assays on samples primarily from the Pediment and Cortez Hills deposits by Rocky Mountain Geochemical and American Analytical laboratories in 2000 to 2003 show less variability, with most checks within ±10% of the original value. In 2003, Cortez investigated these biases in detail and adjusted historical assays for the Pipeline, South Pipeline, Crossroads, and Gap deposits for laboratory biases and sampling biases. The practice of adjusting assays has been discontinued.
Checks of the mine laboratory (Laboratory No. 1) assays were made for the 1995 FS. A pulp duplicate was prepared for one in every five Pipeline core sample and one in every ten South Pipeline core sample. A pulp duplicate was prepared for one in every ten RC sample for Pipeline and one every twenty RC sample for South Pipeline. These were assayed by Monitor Geochemical Laboratory and the Placer Dome Research Centre. Since 1995, this procedure of checking the mine laboratory assays has continued using Rocky Mountain Geochemical
| | |
Barrick Gold Corporation – Cortez Operations, Project 2471 Technical Report NI 43-101 – March 21, 2016 | | Page 10-30 |
| | |
| | www.rpacan.com |
Laboratory, American Assay Laboratory, Barringer Laboratories (now Inspectorate), and Monitor Geochemical Laboratory.
SCREEN CHECKS
Screen check assaying is not done at Cortez. Previous test work determined that coarse gold has not been an analytical issue to date, given the disseminated distribution and very fine grained character of the gold mineralization.
CORTEZ LABORATORY
The on-site Cortez laboratory runs its own internal QA/QC program. They use commercial prepared and purchased standards of various grades. Current frequency of control samples is as follows:
| | • | | Production samples (FA-GRAV and CNL-AA) |
| | • | | 1 standard, 1 blank, and 1 duplicate per set |
| | • | | Mill shift samples (solutions and solids) |
| | • | | 1 standard for each solution set of 23 samples and each solid set of 12 samples |
| | • | | 1 standard for each set of 20 samples |
| | • | | Leco – Carbon and sulfur analyses |
| | • | | 1 standard and 1 blank for each set of 22 samples |
| | • | | Exploration samples (FA-GRAV and CNL-AA) |
| | • | | 1 standard, 1 blank, and 1 duplicate per set |
The laboratory is organized such that quality control samples are inserted automatically. Different grades of standards are used and run with underground, open pit and mill process samples.
A monthly QA/QC compliance report details investigative findings regarding samples that fail the control criteria. With respect to gold analysis by both fire assay with a gravity finish (FA-GRAV) and cyanide leach and AA finish (CNL-AA) the following pass/fail criteria are applied by the Cortez laboratory. The pass criterion for standards is two standard deviations; standard
| | |
Barrick Gold Corporation – Cortez Operations, Project 2471 Technical Report NI 43-101 – March 21, 2016 | | Page 10-31 |
| | |
| | www.rpacan.com |
variance between two and three standard deviations is taken as a warning; action is required when variance exceeds three standard deviations. The pass criterion for blanks is gold values less than 0.002 oz/st Au.
RPA’S COMMENTS ON QA/QC
In RPA’s opinion, the QA/QC protocols and reports meet industry-standard practice and provide the necessary control to identify potential analytical problems and allow for corrective follow-up and re-analysis when required.
| | |
Barrick Gold Corporation – Cortez Operations, Project 2471 Technical Report NI 43-101 – March 21, 2016 | | Page 10-32 |
| | |
| | www.rpacan.com |
11 SAMPLE PREPARATION, ANALYSES AND SECURITY
Analytical procedures that support Mineral Resource estimation, including sample preparation and sample analysis, were performed by independent analytical laboratories without company involvement from 2005 to the present. Samples prior to that date were primarily prepared and analyzed by the Cortez laboratory.
ANALYTICAL LABORATORIES
Prior to 2000, the mine laboratories at Mill No. 1 (Laboratory No. 1) and Mill No. 2 (Laboratory No. 2) assayed a majority of exploration samples, principally those for Pipeline, Crossroads, Gap, and Cortez NW Deep (Cortez Pits). Laboratory No. 1 was located at the old Cortez Mine facility and closed in 1997. Laboratory No. 2 was constructed in 1997 and currently is operating at the Pipeline process facility.
A number of commercial laboratories were used for assaying or check assaying since 1991, including Rocky Mountain Geochemical Laboratory, American Assay Laboratory, ALS Chemex, Barringer Laboratories (now Inspectorate), the Placer Dome Research Centre, and Monitor Geochemical Laboratory.
ALS Chemex has been the primary independent commercial laboratory. A majority of core and RC samples for Cortez Hills and Pediment deposits were prepared by the ALS Chemex sample preparation facility in Reno, Nevada, and assayed in Vancouver, B.C.
From 2005, all exploration assaying as well as underground assaying for development drilling at Cortez Hills and supplementary drilling at Pipeline, Gap, and Crossroads, has been performed by ALS Chemex. The mine laboratory has been principally used for mine related grade control samples and processing analysis.
The mineral laboratories used are ISO registered except for the Inspectorate (Barringer), Rocky Mountain Geochemical Laboratory, Monitor Geochemical Laboratory, and the Cortez Mine laboratories.
| | |
Barrick Gold Corporation – Cortez Operations, Project 2471 Technical Report NI 43-101 – March 21, 2016 | | Page 11-1 |
| | |
| | www.rpacan.com |
SAMPLE PREPARATION
Sample preparation protocols for the commercial and mine laboratories were similar. The initial sample preparation for Pipeline drilling in 1991 to 1992 was:
| | • | | Sample bags were dried at 350°F for six to 12 hours. |
| | • | | Samples were weighed on a triple beam balance to an accuracy of 0.1 kg. |
| | • | | Samples were fed through a TM Engineering Ltd.’s (TM) Rhino Jaw Crusher set at 1/8”. |
| | • | | Entire sample was screened to minus 10 mesh. Oversize was run through a Bico disc pulverizer to reduce the oversize to minus 10 mesh. |
| | • | | Entire samples were split to 500 g with a Jones-type splitter. The 500 g split was dried a second time. |
| | • | | A 500 g aliquot was pulverized to 100% passing 150 mesh in a TM vibratory ring pulverizer. Pulverized sample was homogenized on a roll mat. Ring pulverizer was cleaned by pulverizing a crushed crucible between each sample. |
| | • | | Reject was retained and stored. |
The coarse-crush protocol was changed to 80% passing 10 mesh in late 1992, and between 1992 and 1997 it was changed to 95% passing 6 mesh. By 1998, the crushing protocol was changed to:
| | • | | Entire sample crushed to minus 1⁄4 in. using a jaw crusher. |
| | • | | Entire sample crushed to 95% passing 8 mesh in a rolls crusher. |
| | • | | 500 g aliquot split for pulverizing to minus 200 mesh in an automated pulverizer. |
This protocol was maintained until 2000 when new crushing and grinding equipment was acquired by mine Laboratory No. 2. The mine laboratory now uses a RockLabs crusher and rotary splitter and a TM automated ring-and-puck pulverizer for exploration samples. The RockLabs splitter uses a two-stage process to crush the entire exploration sample to 95% passing 10 mesh and produce a 500 g sample aliquot. The 500 g is pulverized for 75 seconds in the automated pulverizer, producing a product of 95% passing 175 mesh. Gravel is pulverized between each run of the 24-compartment pulverizer to clean the unit. Crush and pulverizer specifications are checked once weekly. Balances are calibrated every six months.
Blast-hole samples from 3 lb to 20 lb are crushed to 95% passing 6 mesh in a TM Rhino jaw crusher. A 250 g to 300 g aliquot is split with a Jones-type riffle splitter. No reject is retained.
| | |
Barrick Gold Corporation – Cortez Operations, Project 2471 Technical Report NI 43-101 – March 21, 2016 | | Page 11-2 |
| | |
| | www.rpacan.com |
The 250 g to 300 g aliquot is then pulverized for 150 seconds in a manual ring-and-puck pulverizer or for 75 seconds in the TM automated pulverizer.
ALS Chemex uses the following sample preparation procedures for Cortez samples:
| | • | | High temperature drying of samples (DRY-21 procedure). |
| | • | | Weigh, dry, fine crush entire sample to better than 70% minus 2 mm, split off up to 250 g and pulverize split to greater than 85% passing 75 µm (PREP-31 procedure). |
| | • | | Compositing procedure, homogenize the composite pulp, gravimetric procedure (CMP-22). |
ANALYSIS
A standard fire assay with gravimetric finish is performed on one-assay ton (29.18 g) pulp aliquots for all core and RC samples analyzed by the mine laboratory. If the initial fire assay is greater than 0.1 oz/st Au, an additional fire assay is performed. If the initial fire assay is greater than 0.2 oz/st Au, two additional fire assays are performed. The mean value of the two or three assays was used for resource estimation in the Pipeline FS resource model.
In 2004, ALS Chemex assayed Cortez Hills and Pediment samples by fire assay and AA finish, using a 30 g pulp aliquot. All samples reporting greater than 0.1 oz/st Au on the initial assay were re-assayed by fire assay with gravimetric finish. Cyanide leach gold assays were performed for initial FA assays higher than 0.008 oz/st Au. A cold cyanide shake leach, analyzed by AA, is performed if the initial fire assay is higher than 0.015 oz/st Au. If the initial fire assay is higher than 0.040 oz/st Au and lower than 0.15 oz/st Au, a “preg-rob” test is performed. This is performed by combining 10 g of pulp with 20 mL of a 0.050 oz/st Au cyanide solution and agitating for eight to ten minutes, then analyzing by AA. Samples with a cyanide AA/fire assay ratio of less than 0.3 are routinely assayed for sulphur and total carbon in a LECO furnace.
The current practice is to fire assay, AA, and preg rob on all intervals within pre-selected zones. More selective triggers apply in unmineralized zones. The following general protocol is used for gold and multi-element analyses:
| | • | | Gold analyses: Gold assay (0.005 ppm to 10 ppm) by 30 g fire assay – atomic absorption (AA) analysis (Au-AA23 procedure). |
| | |
Barrick Gold Corporation – Cortez Operations, Project 2471 Technical Report NI 43-101 – March 21, 2016 | | Page 11-3 |
| | |
| | www.rpacan.com |
| | • | | Au (0.03 ppm to 50 ppm by cyanide leach – AAS, 30 g nominal weight (Au-AA13 procedure). |
| | • | | Au by fire assay and gravimetric finish, 30 g nominal weight, range 0.05 ppm to 1,000 ppm Au (Au-GRA21 procedure). |
| | • | | Multi-element analyses by aqua regia digestion/ICP-AES/ICP-MS, 51 elements or 48 element analyses by four acid and ICP-AES/ICP-MS (ME-MS41 procedure or ME-MS61m procedure, respectively). |
A Laboratory Information Management System (LIMS) was implemented at mine Laboratory No. 2 in 1998. Laboratory No. 2 uses a sample bar code system and transfers all information to the mine database electronically via the LIMS. ALS Chemex assay certificates are downloaded from the ALS Chemex website and loaded directly into the mine database using acQuire®.
Twenty foot composites made from core and RC samples are routinely analyzed for a 49 element suite by ALS Chemex. For the underground development holes, multi-element analysis is performed on every sample (~5 ft intervals). The trace-element suite is obtained by inductively coupled plasma–arc atomic absorption spectroscopy (ICP) following an aqua regia digestion of the sample pulp. Trace elements include As, Sb, Hg, Tl, Fe, and Ca, which in association with Au, show positive or negative correlations with mineralized areas. High Hg analyses from the partial-digestion ICP data have been checked against cold-vapour hydride analyses, also run at ALS Chemex, and have shown generally close correlation (±5%) with the cold-vapour values. The multi-element ICP suite has changed in composition and detection limits several times in the last 15 to 20 years as analytical techniques have improved.
Additional assay methods, as recorded in the database of the 1960s, were typically used for exploration or other specialized purposes such as gas sampling, and were not consistently carried out. They include gravimetric, sulphuric acid digest, total copper, neutron activation analysis, X-ray diffraction, and X-ray fluorescence methods.
SAMPLE SECURITY
Grade control samples from operations are managed by employees of the Cortez mining operation and its drill contractors, while exploration samples are managed by Barrick exploration personnel and its contractors. Prior to 2008 the chain-of-custody was managed by CJV staff and their contractors.
| | |
Barrick Gold Corporation – Cortez Operations, Project 2471 Technical Report NI 43-101 – March 21, 2016 | | Page 11-4 |
| | |
| | www.rpacan.com |
Blast hole samples are delivered directly from the pits to the Cortez laboratory. Underground muck samples are delivered initially to the Portal and then to the sample room at the F-Canyon Office block. Underground RC samples are taken directly to the F-Canyon sample room. Underground drill core boxes are taken directly to F-Canyon lay-down area. Exploration samples, after leaving the drill rigs, are taken by Company personnel to the secure Exploration Complex.
Sample security relies on the samples being either always attended to by Company personnel or stored in the locked on-site preparation facility or stored in a secure area prior to pick-up by ALS Laboratory personnel or delivery to the on-site Cortez laboratory. For the most part, a unique and independent sample number is used for each sample with dispatch-submittal sheets and database entries used to track the progress of samples and to ensure that all samples are received by the laboratory.
Unique and independent sample numbers and sample tags are used in all cases except underground muck samples that are identified by location, e.g., heading and footage. Sample dispatch and submittal sheets are used to check and track samples through the system. Sample information is entered into the computer database to help tracking and for receipt of results.
Table 11-1 summarizes the chain-of-custody of the samples from the collection point to the analytical laboratory.
| | |
Barrick Gold Corporation – Cortez Operations, Project 2471 Technical Report NI 43-101 – March 21, 2016 | | Page 11-5 |
| | |
| | www.rpacan.com |
TABLE 11-1 CHAIN OF CUSTODY SUMMARY
Barrick Gold Corporation – Cortez Operations
| | | | | | | | | | | | | | |
| Grade Control | | | | Exploration Drilling |
Blast-holes (OP) | | Muck (UG) | | Core (UG) | | RC (UG) | | | | RC | | | | Core |
| Material Collection at Source | | | | | | | | |
| | | | | | | |
| Cortez drillers | | Cortez loader operator | | Cortez Geotechnician | | Drill Contractor | | | | Drill Contractor | | | | Barrick employees |
| | | | |
| Transportation from Source, Handling, Sample Delivery to Lab | | | | | | | | |
| | | | | | | |
| Cortez drill & blast personnel | | Cortez Supervisor | | Drill Contractor | | Drill Contractor | | | | Barrick employees | | | | Barrick employees |
| | | | | | | |
| | Cortez employees | | Cortez employees | | Cortez employees | | | | Barrick
Geotechnician | | | | |
| | | | | | | |
| | | | ALS employees | | ALS employees | | | | ALS employees | | | | ALS employees |
| | | | |
| Sample Preparation and Analysis | | | | | | | | |
| | | | | | | |
| Cortez lab | | Cortez lab | | ALS lab | | ALS lab | | | | ALS lab | | | | ALS lab |
RPA’S COMMENTS ON SAMPLE PREPARATION, ANALYSIS, AND SECURITY
In RPA’s opinion, the sample preparation, analytical procedures, and sample security used at Cortez for mining operations and exploration projects are adequate for use in the estimation of Mineral Resources.
| | |
Barrick Gold Corporation – Cortez Operations, Project 2471 Technical Report NI 43-101 – March 21, 2016 | | Page 11-6 |
| | |
| | www.rpacan.com |
12 DATA VERIFICATION
RPA checked previous Cortez and external data reviews and has conducted independent reviews in 2010, 2012, and again in the preparation of this Technical Report. RPA did not collect independent samples as the historical production of 19 million ounces of gold clearly demonstrates the presence of economic mineralization.
DATABASES
The Cortez technical database is being managed by the acQuire system implemented in 2004 replacing an earlier database system. Exploration data from a variety of sources are imported into acQuire using a variety of techniques and procedures to check the integrity of the data entered. Data that were collected prior to the introduction of digital logging have been subject to validation, using built-in program triggers that automatically checked data upon upload to the database. Since the mid-1990s, geological data have been validated by software routines and uploaded directly into the database. Analytical data are uploaded from digital sources. Survey data is uploaded by the project geologist from digital survey files. Verification is performed on all digitally collected data upon upload to the main database, and includes checks on surveys, collar co-ordinates, lithology data, and assay data. Since 2009, Cortez Hills and Pipeline Complex blast-hole data and Cortez Hills underground Cubex drilling data are also imported into acQuire.
Database security and integrity is accomplished by restricting access and user level permissions that are set by the Database Manager. Once data entry and validation are completed for a drill hole, access is locked. There are procedures for updates that retain all the original information and prioritize use of the updates.
BARRICK REVIEWS
REVIEW OF ASSAY BIASES
In 2003, an in-house study was carried out to determine the causes of historical biases between resource estimates based on exploration drilling, mine production based on blast-hole models, and mill production. Results indicated that:
| | |
Barrick Gold Corporation – Cortez Operations, Project 2471 Technical Report NI 43-101 – March 21, 2016 | | Page 12-1 |
| | |
| | www.rpacan.com |
| | • | | Blast hole assays performed by atomic absorption were biased low. |
| | • | | Blast hole and exploration hole fire assays performed by the mine laboratories were biased low relative to fire assays by commercial laboratories. |
| | • | | There are sampling losses in exploration holes, which result in an occasional low bias, even though core recovery is very high. |
| | • | | There are smoothing effects in resource estimation procedures that result in lower average grades in RC holes. |
| | • | | Small scale higher grade zones may exist between holes and are missed by drilling. |
Bias adjustment factors were developed, however, by 2006 most of the affected areas had been mined out. Remaining data were evaluated on a hole by hole basis and where a down-hole contamination or bias issue occurred it was noted. The drill hole in question was flagged and was not used to support Mineral Resource or Mineral Reserve estimates. No bias adjustment factors for assay data have been used since 2007.
CORE VERSUS RC DRILL COMPARISON, CORTEZ HILLS
An in-house study, triggered by down-hole contamination noted in at least three RC drill holes, was undertaken in July 2004 to compare results from RC and core holes used in the Cortez Hills resource estimate. Core versus RC twin data were reviewed and resources were estimated separately based on only RC data and on only core data for comparison. Preliminary results suggested that core holes on average were of higher grade than RC holes, depending on the grade range. The core averages were considered to be biased high because core holes were more common in the high-grade centre of the deposit. Individual RC/core twin holes compared reasonably well, showing less of a high bias in the core holes. Additional core drilling at Cortez Hills since 2004 has replaced the contaminated RC holes.
BLAST HOLE SAMPLING REVIEW
Cortez reviewed the use of a pie sampler versus the cylinder sampler and found no significant difference in assays between the methods for 1,900 blast holes. The cylinder sampler has been retained.
| | |
Barrick Gold Corporation – Cortez Operations, Project 2471 Technical Report NI 43-101 – March 21, 2016 | | Page 12-2 |
| | |
| | www.rpacan.com |
EXTERNAL REVIEWS
Sampling reviews were undertaken in 1992 and 1999 by Francis Pitard, checking elements of the sample preparation procedures. Modifications were made to RC sample collection for the Pediment deposit drilling.
AMEC reviewed the Cortez Hills and Pediment drill database in 2004 and 2005, checking lithological and analytical data and database integrity. Data were found to be suitable to support Mineral Resource estimation.
RPA DATABASE REVIEW
RPA undertook reviews of the database as part of an audit review report in July 2010, as part of a Technical Report in 2012, and again in the preparation of this Technical Report.
JULY 2010 REVIEW
RPA received drill hole and block model databases in Vulcan/ISIS formats. Files were reformatted to ASCII and imported into Gemcom GEMS 6.2.2 software for review. GEMS was employed to validate the drill hole database using software routines that trap errors and potential problems.
GEMS validation routines found some down-hole survey records lacking collar zeros (fourth bullet above) and several cases of zero intervals, most at the end of lithology files/tables. None of these minor errors impact on resource estimation. Otherwise the drill hole databases were clean and readily imported.
JANUARY 2012 REVIEW
Drill hole and block model databases for each of the resources reported by Cortez for mid-2011 were received from Barrick in Vulcan/ISIS formats. The validation review focused on the databases supporting the June 30, 2011 Mineral Resource and Reserve estimates for the Cortez Hills Complex open pit, underground, and Lower Zone models that represented 76% of the contained gold in the Mineral Reserves.
| | |
Barrick Gold Corporation – Cortez Operations, Project 2471 Technical Report NI 43-101 – March 21, 2016 | | Page 12-3 |
| | |
| | www.rpacan.com |
The resource databases were imported into Vulcan 3D Version 8.0.3 software for review. Vulcan database validity routines found no errors with out of range values, or from-to intervals, and that sample lengths and assays values were within reasonable limits. With a few minor exceptions drill hole collars were found to be within the area limits of the model.
All the data was consistently presented and organized and all units within the database were consistent.
RPA also carried out a spot check comparison of the supplied resource databases against original documents for collar surveys, down-hole surveys, and laboratory assay certificates. The 35 holes checked for collar surveys were all found to be correctly entered. Two of the 16 holes reviewed for down hole surveys had minor errors that were corrected.
The azimuth and inclination measurements for the remainder of the database entries were found to correspond with the original down hole survey measurements.
The gold fire assay (“fa1”) and cyanide leach assay (“aa1”) values for 16 holes were checked against the original laboratory assay certificates. The fire assay values corresponded to the original certificates for all 16 holes. Two of the 16 holes had cyanide leach values that did not correspond to the laboratory reports and were corrected.
MAY 2015 REVIEW
RPA undertook the following validation checks as part of the database validation routine:
| | 1. | Overlapping sample intervals |
| | 3. | Visually anomalous survey records |
RPA also undertook a spot check comparison of the supplied resource databases against original documents for laboratory assay certificates. The gold fire assay values for 12 underground drill holes and five surface drill holes were checked against the original laboratory assay certificates. All 1,004 fire assay values corresponded to the original certificates.
| | |
Barrick Gold Corporation – Cortez Operations, Project 2471 Technical Report NI 43-101 – March 21, 2016 | | Page 12-4 |
| | |
| | www.rpacan.com |
RPA OPINION
It is RPA’s opinion that the Cortez database is well prepared, as well as adequate and suitable for Mineral Resource estimation.
| | |
Barrick Gold Corporation – Cortez Operations, Project 2471 Technical Report NI 43-101 – March 21, 2016 | | Page 12-2 |
| | |
| | www.rpacan.com |
13 MINERAL PROCESSING AND METALLURGICAL TESTING
INTRODUCTION
During the nearly 40 year history of the Cortez Mine, a significant number of metallurgical studies including laboratory scale and/or pilot plant test work have been completed and historical operating data is available. The Cortez Mine has utilized numerous processes including carbon-in-leach (CIL) for higher grade oxide ore, heap leaching for lower grade oxide ore, roasting for carbonaceous refractory ore and pressure oxidation for higher grade sulphidic ore. Mill No. 1, which included CIL and a roaster, was placed on care and maintenance at the end of October 1999. The roaster has been inactive since 1995, and it is currently being demolished.
METALLURGICAL TESTING
Metallurgical testing of new ore types has confirmed the choices for processing unit operations and provided data to estimate capital and operating costs and gold recovery for the various ore types. Test data has also been generated to determine the expected performance in Mill No. 2 as new reserves have been identified and included in the LOM plans.
Recent metallurgical testing was or is being conducted to confirm the metallurgical performance of Pediment heap leach ore, Gap, Pipeline Phases 10C and 10D, Gold Acres, Cortez Pits, Cortez Hills Underground high grade oxide ore, and Minex samples from East Pediment, among others. Additional work is on-going to predict the metallurgical characteristics of the ore from Deep South (Olson, 2014a, 2014b, 2014c, 2014d, 2015e, Barrick Cortez, Inc., 2015a).
Cortez has extensive metallurgical testing facilities so much of the work is done on site, however, they make use of outside labs when specific expertise is needed or when timing dictates that the data is needed sooner than the in-house lab can provide it. Testing is conducted by McClelland Laboratories Inc., Hazen Research Inc., at the Barrick Goldstrike lab, and by AuTec in Vancouver, British Columbia, among others.
| | |
Barrick Gold Corporation – Cortez Operations, Project 2471 Technical Report NI 43-101 – March 21, 2016 | | Page 13-1 |
| | |
| | www.rpacan.com |
ORE ROUTING
Ore routing is conducted based on cyanide leaching amenability to fire assay ratio (CNAA to FA ratio). If the AA to FA ratio is greater than 50%, the ore is designated as oxide ore. If the AA to FA ratio is less than 50%, the ore is designated as refractory. The oxide ore will be routed to the Pipeline Mill or a heap leach pad depending on the gold grade. The refractory ore is routed to the Goldstrike roaster.
GOLD RECOVERY ESTIMATES
The recovery of gold is a function of the processing method (CIL, heap leaching, roasting, and arsenic concentration for refractory ore) and the lithology of the mineralization being processed. The recoveries used to support Mineral Resource and Mineral Reserve estimations are based on recovery equations that are derived from feasibility studies, metallurgical laboratory test work and historic production data, as summarized in Tables 13-1 to 13-3. These figures are incorporated in the Lerchs–Grossman pit shells that constrain the Mineral Resources and Mineral Reserves to be extracted by open pit mining methods.
Test work reports and plant operating results were reviewed to verify the reported recoveries used in the Mineral Resources and Mineral Reserves estimates.
For leach ore, the estimated recovery figure for Pipeline oxide is based on actual heap performance values.
| | |
Barrick Gold Corporation – Cortez Operations, Project 2471 Technical Report NI 43-101 – March 21, 2016 | | Page 13-2 |
| | |
| | www.rpacan.com |
TABLE 13-1 CORTEZ OXIDE MILL GOLD RECOVERY EQUATIONS
Barrick Gold Corporation – Cortez Operations
| | | | |
Ore Pit | | Head Grade (oz/st Au) | | Recovery Equations |
Cortez Hills Underground | | >0.800 | | % Recovery = 94.0 – 57.1 x Sulphide Sulphur (%) |
| | £ 0.800 | | % Recovery = 25.7 x CNAA/HG + 9.7 x CNAA + 59.3 |
Cortez Hills Open Pit | | >0.920 | | % Recovery = 95.66 – 2.44 |
| | >0.150 | | % Recovery = [100 x HG – 1.3 x Ln(HG) – 4.1] / HG -2.4 |
| | £0.150 | | % Recovery = (18 x HG) + 86.4 – 5.9 |
Cortez Pits1 | | Option 1 | | % Recovery = 89.0 |
| | Option 2 | | % Recovery = 8.36 x HG – 9.78 x AAFA + 96.4 |
Pipeline/ South Pipeline/South Gap | | > 0.207 | | % Recovery = 88.1 – 8.3 |
| | £ 0.207 | | % Recovery = 85.11 x EXP(0.36 x HG) – 11.9 |
Crossroads | | | | % Recovery = 88.0 |
Notes:
| 1 | Prefer Option 2 if there is confidence in the AAFA ratio in the block model |
HG = gold head grade in oz/st
Ln = natural log function
EXP = Exponential Function
CNAA = cyanide shake in oz/st
AAFA = CNAA/HG (ratio)
TABLE 13-2 CORTEZ HEAP LEACH ULTIMATE GOLD RECOVERY EQUATIONS
Barrick Gold Corporation – Cortez Operations
| | |
Open Pit | | Recovery Estimate |
Cortez Hills | | % Recovery = 80% |
Pediment | | % Recovery = 70% |
Cortez Hills Underground (crushed leach) | | Breccia and Middle Zone % Recovery = 84 Lower Zone and Deep South % Recovery = 70 |
Cortez Pits | | % Recovery = 75 |
Pipeline (Phase 10) | | % Recovery = 62% |
Crossroads | | % Recovery = 62% |
South Gap | | % Recovery = 55% |
| | |
Barrick Gold Corporation – Cortez Operations, Project 2471 Technical Report NI 43-101 – March 21, 2016 | | Page 13-3 |
| | |
| | www.rpacan.com |
TABLE 13-3 REFRACTORY ORE GOLD RECOVERY EQUATIONS
Barrick Gold Corporation – Cortez Operations
| | | | |
Process | | Head Grade (oz/st Au) | | Gold Recovery Equations |
Roaster1 | | > 1.150 | | % Recovery = 93.07 |
| | 0.250 < HG £ 1.150 | | % Recovery = 3.1719 x Ln(HG) + 92.612 |
| | 0.125 < HG£ 0.250 | | % Recovery = 71.836 + 40.456 x (HG) - 0.009 x 730 + 0.151 x 85 |
| | £ 0.125 | | % Recovery = -1017.2 x (HG)2 + 377.14 x (HG) + 51.909 |
RF1 Discount | | | | Recovery Discount of 1.5% for Arsenic Discounts |
Notes:
| 1 | Roaster recovery estimates assume 730 tons-per-operating-hour and 85% sulfide oxidation. The estimates for autoclave recovery are not dependent on throughput or efficiency. |
HG = Gold Head Grade in oz/st
Ln = Natural Log Function
TCM = Calcium Thiosulfate Leach
Table 13-4 summarizes the results of the budgeted versus actual data taken from the Cortez Flash Reports, which was evaluated to verify the recovery estimates. For an operating mine, RPA considers this data to be more reliable for determining if the recovery estimates are accurate than reporting on metallurgical test data and samples.
| | |
Barrick Gold Corporation – Cortez Operations, Project 2471 Technical Report NI 43-101 – March 21, 2016 | | Page 13-4 |
| | |
| | www.rpacan.com |
TABLE 13-4 PRODUCTION DATA 2013-2015
Barrick Gold Corporation – Cortez Operations
| | | | | | | | | | | | | | | | | | | | | | |
| | | 2013 | | | | 2014 | | | | 2015 |
| | | Actual | | Budget | | Actual
vs.
Budget | | | | Actual | | Budget | | Actual
vs.
Budget | | | | Actual | | Budget | | Actual
vs.
Budget |
OPEN PIT | | | | | | | | | | | | | | | | | | | | | | |
Pit Mill | | | | | | | | | | | | | | | | | | | | | | |
Grade Processed (oz/st) | | 0.166 | | 0.163 | | 102% | | | | 0.064 | | 0.063 | | 102% | | | | 0.110 | | 0.076 | | 145% |
Recovery Rate (%) | | 89 | | 90 | | 99% | | | | 77 | | 83 | | 93% | | | | 89 | | 85 | | 105% |
Average Tons per Day | | 10,797 | | 11,154 | | 105% | | | | 10,057 | | 10,864 | | 93% | | | | 9,573 | | 11,253 | | 85% |
Leach | | | | | | | | | | | | | | | | | | | | | | |
Grade Processed (oz/st) | | 0.018 | | 0.018 | | 105% | | | | 0.013 | | 0.013 | | 105% | | | | 0.013 | | 0.010 | | 135% |
Recovery Rate (%) | | 40 | | 48 | | 84% | | | | 72 | | 86 | | 83% | | | | 53 | | 101 | | 53% |
Average Tons per Day | | 46,655 | | 49,825 | | 94% | | | | 64,406 | | 61,477 | | 105% | | | | 54,443 | | 37,400 | | 146% |
Autoclave | | | | | | | | | | | | | | | | | | | | | | |
Grade Processed (oz/st) | | 0.265 | | 0.242 | | 109% | | | | | | | | | | | | 0.138 | | NA |
Recovery Rate (%) | | 94 | | 91 | | 103% | | | | | | | | | | | | 68 | | NA |
Average Tons per Day | | 309 | | 327 | | 94% | | | | | | | | | | | | 133 | | NA |
Roaster | | | | | | | | | | | | | | | | | | | | | | |
Grade Processed (oz/st) | | 0.174 | | 0.174 | | 100% | | | | 0.149 | | 0.149 | | 100% | | | | 0.143 | | 0.120 | | 120% |
Recovery Rate (%) | | 94 | | 91 | | 103% | | | | 83 | | 84 | | 99% | | | | 85 | | 82 | | 103% |
Average Tons per Day | | 655 | | 680 | | 96% | | | | 2,196 | | 2,278 | | 96% | | | | 1,341 | | 2,392 | | 56% |
Open Pit Total | | | | | | | | | | | | | | | | | | | | | | |
Grade Processed (oz/st) | | 0.049 | | 0.047 | | 105% | | | | 0.024 | | 0.024 | | 99% | | | | 0.031 | | 0.030 | | 103% |
Recovery Rate (%) | | 74 | | 77 | | 97% | | | | 76 | | 85 | | 89% | | | | 75 | | 88 | | 85% |
Average Tons per Day | | 58,416 | | 61,986 | | 94% | | | | 76,658 | | 74,620 | | 103% | | | | 65,490 | | 51,044 | | 128% |
| | | | | | | | | | | |
UNDERGROUND | | | | | | | | | | | | | | | | | | | | | | |
Mill | | | | | | | | | | | | | | | | | | | | | | |
Grade Processed (oz/st) | | 0.928 | | 0.934 | | 99% | | | | 0.729 | | 0.721 | | 101% | | | | 0.662 | | 0.608 | | 109% |
Recovery Rate (%) | | 91 | | 91 | | 100% | | | | 89 | | 92 | | 97% | | | | 84 | | 88 | | 95% |
Average Tons per Day | | 1,611 | | 1,509 | | 107% | | | | 1,201 | | 1,073 | | 112% | | | | 924 | | 925 | | 100% |
Autoclave | | | | | | | | | | | | | | | | | | | | | | |
Grade Processed (oz/st) | | 0.610 | | 0.608 | | 100% | | | | 0.711 | | 0.804 | | 88% | | | | 0.832 | | 0.871 | | 96% |
Recovery Rate (%) | | 85 | | 86 | | 99% | | | | 84 | | 88 | | 96% | | | | 77 | | 87 | | 88% |
Average Tons per Day | | 371 | | 377 | | 98% | | | | 449 | | 482 | | 93% | | | | 124 | | 724 | | 17% |
Roaster | | | | | | | | | | | | | | | | | | | | | | |
Grade Processed (oz/st) | | | | | | | | | | 0.457 | | 0.371 | | 123% | | | | 0.618 | | 0.311 | | 198% |
Recovery Rate (%) | | | | | | | | | | 81 | | 89 | | 90% | | | | 92 | | 89 | | 104% |
Average Tons per Day | | | | | | | | | | 84 | | 35 | | 241% | | | | 1,130 | | 255 | | 444% |
Underground Total | | | | | | | | | | | | | | | | | | | | | | |
Grade Processed (oz/st) | | 0.869 | | 0.869 | | 100% | | | | 0.711 | | 0.738 | | 96% | | | | 0.648 | | 0.668 | | 97% |
Recovery Rate (%) | | 90 | | 90 | | 100% | | | | 88 | | 91 | | 97% | | | | 88 | | 88 | | 100% |
Average Tons per Day | | 1,982 | | 1,886 | | 105% | | | | 1,734 | | 1,589 | | 109% | | | | 2,178 | | 1,904 | | 114% |
| | |
Barrick Gold Corporation – Cortez Operations, Project 2471 Technical Report NI 43-101 – March 21, 2016 | | Page 13-5 |
| | |
| | www.rpacan.com |
The estimated and actual gold recoveries correlate well which indicates that the recovery estimates are accurate.
Table 13-5 compares the contained, estimated recoverable, and actual recovered gold ounces for the life of the Cortez heap leach pads (i.e. Areas 28, 30, and 34). Figure 13-1 provides the same data graphically.
TABLE 13-5 HEAP LEACH GOLD PRODUCTION
Barrick Gold Corporation – Cortez Operations
| | | | | | | | | | | | |
Year | | Contained
(000 oz) | | | Estimated
Recoverable
(000 oz) | | | Actual
Produced
(000 oz) | |
| 1997 | | | 55 | | | | 38 | | | | 28 | |
| 1998 | | | 228 | | | | 155 | | | | 124 | |
| 1999 | | | 327 | | | | 223 | | | | 211 | |
| 2000 | | | 570 | | | | 387 | | | | 283 | |
| 2001 | | | 1,080 | | | | 735 | | | | 526 | |
| 2002 | | | 1,434 | | | | 966 | | | | 805 | |
| 2003 | | | 1,978 | | | | 1,295 | | | | 1,133 | |
| 2004 | | | 2,773 | | | | 1,780 | | | | 1,626 | |
| 2005 | | | 3,206 | | | | 2,051 | | | | 2,004 | |
| 2006 | | | 3,509 | | | | 2,240 | | | | 2,207 | |
| 2007 | | | 4,020 | | | | 2,540 | | | | 2,491 | |
| 2008 | | | 4,477 | | | | 2,768 | | | | 2,706 | |
| 2009 | | | 4,651 | | | | 2,867 | | | | 2,866 | |
| 2010 | | | 4,725 | | | | 2,920 | | | | 2,925 | |
| 2011 | | | 4,763 | | | | 2,948 | | | | 3,009 | |
| 2012 | | | 4,859 | | | | 3,031 | | | | 3,105 | |
| 2013 | | | 5,173 | | | | 3,256 | | | | 3,245 | |
| 2014 | | | 5,376 | | | | 3,371 | | | | 3,401 | |
| 2015 | | | 5,752 | | | | 3,620 | | | | 3,611 | |
| | |
Barrick Gold Corporation – Cortez Operations, Project 2471 Technical Report NI 43-101 – March 21, 2016 | | Page 13-6 |
| | |
| | www.rpacan.com |
FIGURE 13-1 HISTORICAL HEAP LEACH DATA
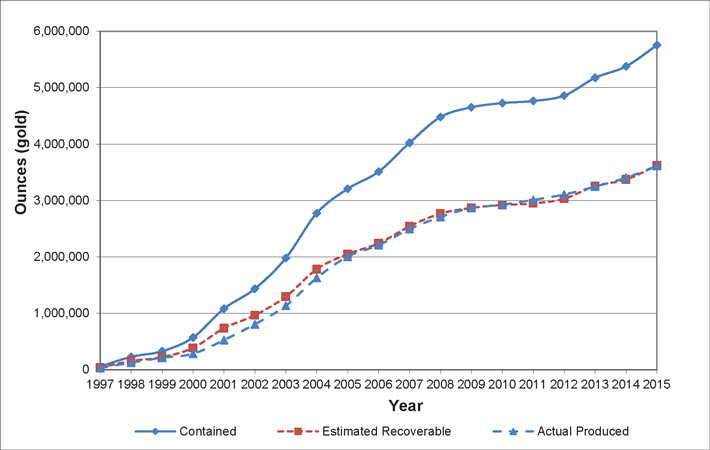
The data clearly shows that the estimated gold production from the heap leach pads and the actual gold production correlate well. This is also true for each individual heap leach pad.
DEEP SOUTH ZONE METALLURGICAL TESTING
AuTec completed optimization and variability testing using samples from the Deep South Zone. McClelland Laboratory, Inc. also completed column leach tests using the oxide samples from Deep South Zone. The results of the testing program were used to support a PFS of the Cortez Underground Expansion Project (AuTec, 2015). Eighty samples were used to create eight composite samples that were used for the optimization testing. Variability testing was also conducted using the 80 samples.
Comminution testing for 60 samples estimated that the majority of the samples are moderately hard (A x b < 40), but a few samples were exceptionally soft (A x b > 300) with respect to SAG milling. Bond work index (BWi) tests were conducted on seven of the composite samples at a closing size of 105 µm. The average BWi is 11.3 kWh/st. The comminution test results indicate
| | |
Barrick Gold Corporation – Cortez Operations, Project 2471 Technical Report NI 43-101 – March 21, 2016 | | Page 13-7 |
| | |
| | www.rpacan.com |
that the grinding characteristics of Deep South samples are similar to the ore mined at Cortez Hills.
A series of tests were conducted using the optimization samples to complete the following tests:
| | • | | Direct cyanide leach (DCN) |
| | • | | Bench top roaster followed by CIL (BTR-CIL) |
| | • | | Bench top alkaline pressure leach tests followed by CIL (BTALK-CIL) |
| | • | | Bench top alkaline pressure leach tests followed by thiosulfate resin in leach (TCM) (BTALK-TCM) |
The results are summarized in Table 13-6.
TABLE 13-6 DEEP SOUTH ZONE TEST RESULTS (AU RECOVERY)
Barrick Gold Corporation – Cortez Operations
| | | | | | | | | | | | | | | | |
Sample | | Ore Type | | Au (oz/st) | | DCN | | CIL | | BTR- CIL | | BTALK- CIL | | BTALK- TCM | | Column Tests |
V1 | | Oxide | | 0.238 | | 67.2% | | 87.4% | | 84.9% | | 81.5% | | 68.4% | | 76.5 |
V2 | | Oxide | | 0.598 | | 82.6% | | 88.1% | | 88,7% | | 88.2% | | 42.2% | | 71.5 |
V3 | | Oxide | | 0.683 | | 83.3% | | 91.2% | | 91,2% | | 89.1% | | 26.8% | | 77.6 |
V4 | | Oxide | | 0.680 | | 63.6% | | 88.1% | | 88.1% | | 76.0% | | 30.2% | | 47.0 |
V5 | | Oxide | | 0.187 | | 82.4% | | 89.1% | | 89.1% | | 89.3% | | 28.7% | | 84.4 |
V6 | | Oxide | | 0.225 | | 77.8% | | 89.9% | | 89.9% | | 88.1% | | 36.9% | | 74.4 |
V7 | | Refractory | | 0.436 | | 12.3% | | 15.7% | | 91.2% | | 83.2% | | 82.6% | | — |
V8 | | Refractory | | 0.256 | | 32.3% | | 85.9% | | 85.9% | | 89.9% | | 89.5% | | — |
Minimum | | | | 0.683 | | 12.4% | | 15.7% | | 84.9% | | 76.0% | | 26.8% | | 47.0 |
Maximum | | | | 0.187 | | 84.0% | | 91.8% | | 91.2% | | 89.9% | | 89.5% | | 84.4 |
Average | | | | 0.418 | | 63.1% | | 72.6% | | 88.6% | | 85.6% | | 50.7% | | 76.9 |
The key assays for the samples are summarized in Table 13-7.
| | |
Barrick Gold Corporation – Cortez Operations, Project 2471 Technical Report NI 43-101 – March 21, 2016 | | Page 13-8 |
| | |
| | www.rpacan.com |
TABLE 13-7 DEEP SOUTH ZONE OPTIMIZATION SAMPLES ANALYTICAL RESULTS
Barrick Gold Corporation – Cortez Operations
| | | | | | | | |
Sample | | Au
(oz/st) | | CNAA/HG | | S= | | Corg |
V1 | | 0.238 | | 65.7% | | 0.10% | | 1.17% |
V2 | | 0.598 | | 92.5% | | 0.05% | | 0.02% |
V3 | | 0.683 | | 91.4% | | £ 0.01% | | 0.02% |
V4 | | 0.680 | | 87.8% | | £ 0.01% | | 0.04% |
V5 | | 0.187 | | 97.6% | | £ 0.01% | | 0.02% |
V6 | | 0.225 | | 89.1% | | £ 0.01% | | 0.03% |
V7 | | 0.436 | | 15.8% | | 1.38% | | £ 0.01% |
V8 | | 0.256 | | 34.3% | | 0.34% | | 0.17% |
The Deep South Zone PFS recommends that the heap leach recovery can be estimated using the relationship between the CNAA and HG ratio and the direct cyanidation test results plus the relationship between DCN and column leaching. The resulting equation is:
HL %Au Recovery = 1.315 x CNAA/HG) – 40.481
The CIL recovery can be estimated accurately by applying the relationship between the CNAA/HG ratio and the CIL recovery using this equation:
CIL % Au Recovery = 0.942 x CNAA/HG
The recovery for refractory ore processed in the Goldstrike roaster followed by CIL were estimated using the current roaster recovery curves and grades from the Deep South Zone PFS production schedule. The average recovery for refractory ore sent to the roaster/CIL plant is estimated to be 88.7%.
SUMMARY AND CONCLUSIONS
Metallurgical test work completed for the Mine has been appropriate to establish optimal processing routes for the different ore types encountered at Cortez. Historical process data demonstrates that the metallurgical recovery models have been reliable. The metallurgical testing data available for ore scheduled to be processed in the LOM plan indicates that the models and methods used for estimating metallurgical performance will continue to be
| | |
Barrick Gold Corporation – Cortez Operations, Project 2471 Technical Report NI 43-101 – March 21, 2016 | | Page 13-9 |
| | |
| | www.rpacan.com |
successful. Based on these observations, RPA concurs that the samples used to generate the metallurgical data and the historical operating data have been representative. Therefore, the estimates used to estimate future performance appear to be accurate.
| | |
Barrick Gold Corporation – Cortez Operations, Project 2471 Technical Report NI 43-101 – March 21, 2016 | | Page 13-2 |
| | |
| | www.rpacan.com |
14 MINERAL RESOURCE ESTIMATE
SUMMARY
A summary of the Mineral Resources, excluding Mineral Reserves, for Cortez as of December 31, 2015, is shown in Table 14-1. The Mineral Resources are presented by the most likely mine extraction method and gold recovery process. Cut-off grades for the Mineral Resources were established using a gold price of US$1,300 per ounce.
TABLE 14-1 MINERAL RESOURCE SUMMARY – DECEMBER 31, 2015
Barrick Gold Corporation – Cortez Operations
| | | | | | | | | | | | | | | | | | | | | | | | |
| | | Total Measured and Indicated | | | Total Inferred | |
| | Tons | | | Grade | | | Contained
Gold | | | Tons | | | Grade | | | Contained
Gold | |
Mine & Process Type | | (000 st) | | | (oz/st Au) | | | (000 oz) | | | (000 st) | | | (oz/st Au) | | | (000 oz) | |
Open Pit | | | | | | | | | | | | | | | | | | | | | | | | |
Mill | | | 6,001 | | | | 0.058 | | | | 345 | | | | 2,031 | | | | 0.09 | | | | 175 | |
Heap Leach | | | 34,998 | | | | 0.011 | | | | 390 | | | | 16,833 | | | | 0.01 | | | | 159 | |
Refractory | | | 4,010 | | | | 0.117 | | | | 471 | | | | 494 | | | | 0.12 | | | | 61 | |
| | | | | | | | | | | | | | | | | | | | | | | | |
Open Pit Total | | | 45,009 | | | | 0.027 | | | | 1,206 | | | | 19,359 | | | | 0.02 | | | | 395 | |
| | | | | | |
Underground | | | | | | | | | | | | | | | | | | | | | | | | |
Mill | | | 1,574 | | | | 0.293 | | | | 462 | | | | 131 | | | | 0.28 | | | | 37 | |
Refractory | | | 1,598 | | | | 0.301 | | | | 481 | | | | 1,210 | | | | 0.36 | | | | 429 | |
| | | | | | | | | | | | | | | | | | | | | | | | |
Underground Total | | | 3,172 | | | | 0.297 | | | | 943 | | | | 1,341 | | | | 0.35 | | | | 466 | |
| | | | | | |
| | | | | | | | | | | | | | | | | | | | | | | | |
Total Open Pit & Underground | | | 48,180 | | | | 0.045 | | | | 2,149 | | | | 20,700 | | | | 0.04 | | | | 861 | |
Notes:
| 1. | CIM definitions were followed for Mineral Resources. |
| 2. | Mineral Resources are reported at the cut-off grades given in Tables 14-4, 14-14, 14-22 and 14-25. |
| 3. | Mineral Resources are reported using a gold price of US$1,300 per ounce. |
| 4. | A minimum mining width of 10 ft was used. |
| 5. | Mineral Resources are additional to and exclusive of Mineral Reserves. |
| 6. | Numbers may not add due to rounding. |
RPA is not aware of any known environmental, permitting, legal, title, taxation, socio-economic, marketing, political, or other relevant factors that could materially affect the Mineral Resource estimate.
Mineral Resources decreased relative to EOY 2014 due to mining depletion as well as the completion of a PFS at Deep South Zone, Cortez Hills as material was reclassified as Mineral
| | |
Barrick Gold Corporation – Cortez Operations, Project 2471 Technical Report NI 43-101 – March 21, 2016 | | Page 14-1 |
| | |
| | www.rpacan.com |
Reserve. Changes in cut-off grades and associated optimized pit shells following lower operating costs increased the Mineral Resources at Pipeline and Gold Acres. New model interpretation and new drilling in the underground portion of Cortez Hills added or upgraded Inferred ounces.
Cortez is currently reporting Mineral Resource estimates for four principal areas in the district. These include the Pipeline Complex and the Gold Acres deposit on the west side of Crescent Valley and the Cortez Hills Complex and Cortez Pits areas on the east side of the valley. Each of the mentioned areas include several gold deposits or zones. Table 14-2 identifies the principal areas, their included deposits or zones, when the Mineral Resources were most recently updated, and which group is responsible for the reported Mineral Resource estimate.
TABLE 14-2 CORTEZ MINERAL RESOURCE MODELS
Barrick Gold Corporation – Cortez Operations
| | | | | | |
| Area | | Deposits or Zones included | | Last Update | | Responsible Group |
| | Pipeline | | MID 2014 | | |
| Pipeline Complex | | Gap | | MID 2014 | | Tucson Technical Group |
| | | Crossroads | | MID 2014 | | |
| | Pediment | | MID 2015 | | Mine Technical Group |
| | Breccia (open pit) | | MID 2015 | | Mine Technical Group |
| Cortez Hills Complex | | Breccia (underground) | | MID 2015 | | Mine Technical Group |
| | Middle | | MID 2015 | | Mine Technical Group |
| | | Lower | | MID 2015 | | Mine Technical Group |
| Cortez Pits | | NW Deeps | | EOY 2012 | | Mine Technical Group |
| Gold Acres | | | | 2008 | | Mine Technical Group |
Details of the Mineral Resource estimation for each area are described in the sections below.
PIPELINE COMPLEX
Mineral Resources, exclusive of Mineral Reserves are listed in Table 14-3. Cut-off grades for the reported Mineral Resources were established using a gold price of US$1,300 per ounce and are shown in Table 14-4.
| | |
Barrick Gold Corporation – Cortez Operations, Project 2471 Technical Report NI 43-101 – March 21, 2016 | | Page 14-2 |
| | |
| | www.rpacan.com |
TABLE 14-3 PIPELINE COMPLEX MINERAL RESOURCE SUMMARY – DECEMBER 31, 2015
Barrick Gold Corporation – Cortez Operations
| | | | | | | | | | | | | | | | | | | | | | | | | | | | | | | | | | | | | | | | | | | | | | | | |
| | | Mill Material | | | Leach Material | | | Refractory Material | | | Total | |
| | | Tons
(000 st) | | | Grade
(oz/st
Au) | | | Ounces
(000 oz) | | | Tons
(000 st) | | | Grade
(oz/st
Au) | | | Ounces
(000 oz) | | | Tons
(000 st) | | | Grade
(oz/st
Au) | | | Ounces
(000 oz) | | | Tons
(000 st) | | | Grade
(oz/st
Au) | | | Ounces
(000 oz) | |
Measured Resources | |
Pipeline | | | 278 | | | | 0.059 | | | | 16 | | | | 953 | | | | 0.011 | | | | 11 | | | | — | | | | — | | | | — | | | | 1,231 | | | | 0.022 | | | | 27 | |
Gap | | | 51 | | | | 0.056 | | | | 3 | | | | 116 | | | | 0.012 | | | | 1 | | | | — | | | | | | | | — | | | | 167 | | | | 0.025 | | | | 4 | |
Crossroads | | | 165 | | | | 0.044 | | | | 7 | | | | 1,364 | | | | 0.011 | | | | 15 | | | | — | | | | — | | | | — | | | | 1,530 | | | | 0.014 | | | | 22 | |
| | | | | | | | | | | | | | | | | | | | | | | | | | | | | | | | | | | | | | | | | | | | | | | | |
Total Measured | | | 494 | | | | 0.053 | | | | 26 | | | | 2,434 | | | | 0.011 | | | | 27 | | | | — | | | | — | | | | — | | | | 2,928 | | | | 0.018 | | | | 53 | |
Indicated Resources | |
Pipeline | | | 2,293 | | | | 0.057 | | | | 130 | | | | 12,242 | | | | 0.011 | | | | 138 | | | | 82 | | | | 0.085 | | | | 7 | | | | 14,617 | | | | 0.019 | | | | 275 | |
Gap | | | 491 | | | | 0.048 | | | | 24 | | | | 1,905 | | | | 0.012 | | | | 23 | | | | 5 | | | | 0.093 | | | | 0 | | | | 2,402 | | | | 0.019 | | | | 47 | |
Crossroads | | | 1,536 | | | | 0.042 | | | | 65 | | | | 15,964 | | | | 0.011 | | | | 172 | | | | — | | | | — | | | | — | | | | 17,500 | | | | 0.014 | | | | 237 | |
| | | | | | | | | | | | | | | | | | | | | | | | | | | | | | | | | | | | | | | | | | | | | | | | |
Total Indicated | | | 4,320 | | | | 0.051 | | | | 219 | | | | 30,112 | | | | 0.011 | | | | 333 | | | | 87 | | | | 0.085 | | | | 7 | | | | 34,519 | | | | 0.016 | | | | 559 | |
Measured & Indicated Resources | |
Pipeline | | | 2,571 | | | | 0.057 | | | | 147 | | | | 13,196 | | | | 0.011 | | | | 149 | | | | 82 | | | | 0.085 | | | | 7 | | | | 15,848 | | | | 0.019 | | | | 302 | |
Gap | | | 542 | | | | 0.049 | | | | 27 | | | | 2,022 | | | | 0.012 | | | | 24 | | | | 5 | | | | 0.093 | | | | 0 | | | | 2,569 | | | | 0.020 | | | | 51 | |
Crossroads | | | 1,701 | | | | 0.042 | | | | 72 | | | | 17,329 | | | | 0.011 | | | | 187 | | | | — | | | | — | | | | — | | | | 19,030 | | | | 0.014 | | | | 259 | |
| | | | | | | | | | | | | | | | | | | | | | | | | | | | | | | | | | | | | | | | | | | | | | | | |
Total M+I | | | 4,814 | | | | 0.051 | | | | 245 | | | | 32,546 | | | | 0.011 | | | | 360 | | | | 87 | | | | 0.085 | | | | 7 | | | | 37,447 | | | | 0.016 | | | | 612 | |
Inferred Resources | |
Pipeline | | | 260 | | | | 0.08 | | | | 20 | | | | 1,387 | | | | 0.01 | | | | 13 | | | | 52 | | | | 0.20 | | | | 10 | | | | 1,698 | | | | 0.03 | | | | 44 | |
| | | | | | | | | | | | | | | | | | | | | | | | | | | | | | | | | | | | | | | | | | | | | | | | |
Crossroads | | | 740 | | | | 0.06 | | | | 47 | | | | 11,378 | | | | 0.01 | | | | 105 | | | | 101 | | | | 0.15 | | | | 15 | | | | 12,220 | | | | 0.01 | | | | 167 | |
| | | | | | | | | | | | | | | | | | | | | | | | | | | | | | | | | | | | | | | | | | | | | | | | |
Total Inferred | | | 1,000 | | | | 0.07 | | | | 67 | | | | 12,765 | | | | 0.01 | | | | 118 | | | | 154 | | | | 0.17 | | | | 26 | | | | 13,918 | | | | 0.02 | | | | 211 | |
Notes:
| 1. | CIM definitions were followed for Mineral Resources. |
| 2. | Mineral Resources are reported using a gold price of US$1,300 per ounce and using cut-off grades given in Table 14-4. |
| 3. | Bulk densities vary by formation and zone and are listed in Table 14-11. |
| 4. | Open pit Mineral Resources are constrained by an optimized pit shell. |
| 5. | Mineral Resources are additional to and exclusive of Mineral Reserves. |
| 6. | Numbers may not add due to rounding. |
| | |
Barrick Gold Corporation – Cortez Joint Venture, Project 2471 Technical Report NI 43-101 – March 21, 2016 | | Page 14-3 |
| | |
| | www.rpacan.com |
TABLE 14-4 PIPELINE COMPLEX MINERAL RESOURCE REPORTING CUT-OFF GRADES
Barrick Gold Corporation – Cortez Operations
| | | | | | | | | | |
Area | | Cut-off grade
(oz/st Au) | | Mill | | | Leach | | Refractory |
Crossroads | | Lower | | | 0.03 | | | 0.004 | | 0.067 |
| | Upper | | | | | | 0.03 | | |
Gap | | Lower | | | 0.03 | | | 0.004 | | 0.065 |
| | Upper | | | | | | 0.03 | | |
Pipeline | | Lower | | | 0.03 | | | 0.004 | | 0.065 |
| | Upper | | | | | | 0.03 | | |
DATA
For resource estimation, the drill hole data were limited to holes within or immediately adjacent to the various block model boundaries. A total of 3,335 drill holes over 2,994,466 ft and 275,123 assays are in the database.
GEOLOGICAL MODELLING
Three-dimensional wireframe surfaces were constructed in 2010 by Rangefront Consulting, LLC (Goss, 2010), representing alluvium-bedrock contact, rock formations, and alteration. The final surfaces were created considering, in order of importance:
| | • | | 1”:1,000’ scale geologic mapping in the Shoshone Range |
| | • | | 1”:50’ scale mapping in Pipeline, Gold Acres London extension, OGA and Gap pits |
| | • | | 27 geologic cross sections covering the Pipeline Complex at a scale of 1”:100’ |
| | • | | Geological logs, based on drill holes completed during or after 2004 |
| | • | | Down hole, multi-element geochemistry in conjunction with analyses from the NITON portable XRF unit |
| | • | | Geophysical interpretations |
Surfaces were triangulated using sub-parallel cross sectional line work, which were modified to fit with surface mapping, intersecting cross sections, drill hole data and/or the results of geophysical interpretations. Snapping to drill hole intercepts was performed on sections with reliable results, but not drill holes between sections. The work was completed using the Mira Geoscience GoCad Mining Suite and the resultant geological interpretation was used to flag formation and alteration contacts in the block model and inform the interpolation design.
| | |
Barrick Gold Corporation – Cortez Operations, Project 2471 Technical Report NI 43-101 – March 21, 2016 | | Page 14-4 |
| | |
| | www.rpacan.com |
In addition to formation and alteration, topography and area wireframe surfaces and solids were used to define boundaries and mineralization controls within the Pipeline Complex block model. The three established areas corresponding to the main deposits, Pipeline, Crossroads, and Gap are shown in Figure 14-1. Deposits Pipeline and Crossroads are separated by the east high-wall fault in the southern end of the Pipeline pit. Each area was treated individually during the estimation process.
ESTIMATION SUMMARY
Gold mineralization in the Pipeline Complex is complex. It ponds and pools at formational contacts and stratigraphic boundaries, but can also follow structural trends related to compressional and extensional faulting. The estimation method developed by the Tucson Technical Group sought to incorporate this understanding into the block model by giving priority to stratigraphic over structural mineralization trends, where interpreted, and by using probabilities to categorize high and low grade blocks, where, due to the nature of the deposit, would be very difficult to accomplish using traditional “wireframing”.
At Crossroads and Gap, this was accomplished by running both a structural and stratigraphic oriented indicator estimation for each area, then, where the stratigraphic indicator reported a higher probability value than the structural indicator, it was flagged as a stratigraphically controlled block in the model. All remaining blocks were assigned as structurally controlled. This mineralization control was then applied to low grade indicator values. High grade indicators were estimated with elements based upon stratigraphic control only. Pipeline was considered too complex to apply this technique and was estimated using trends based upon stratigraphy only. All stratigraphic units at the Pipeline Complex were unfolded prior to the indicator estimation using Maptek’s Vulcan tetramesh modelling feature. Unfold surfaces were based on the 2010 geological model.
Based on the result of the indicator estimation runs and analysis, blocks at Gap and Crossroads were flagged as being structurally or stratigraphically controlled, and as low or high grade. Blocks at Pipeline were flagged as low or high grade based on probability results of the stratigraphically controlled gold grade indicator estimation only. Raw assay samples were then back-flagged from the block model and divided into groupings based on area, dominant mineralization control and indicated grade category. Each sample group was then capped, re-composited, and estimated individually using parameters unique to each group.
| | |
Barrick Gold Corporation – Cortez Operations, Project 2471 Technical Report NI 43-101 – March 21, 2016 | | Page 14-5 |
| | |
| | www.rpacan.com |
The block model was then validated and classified. Details of this multi-stepped mineral resource estimation process at the Pipeline Complex are listed in the following sections.
BLOCK MODEL
A 40 ft x 40 ft x 20 ft block model was developed over the Pipeline Complex in Maptek’s Vulcan software. The block model parameters are listed in Table 14-5. Following estimation of variables, the model was reblocked to 40 ft x 40 ft x 40 ft to conform to bench height for mine design purposes.
TABLE 14-5 PIPELINE COMPLEX BLOCK MODEL PARAMETERS
Barrick Gold Corporation – Cortez Operations
| | | | | | | | | | |
| Easting (ft) | | Northing (ft) | | Elevation (ft) |
Min | | Max | | Min | | Max | | Min | | Max |
| 97,000 | | 109,120 | | 49,500 | | 61,980 | | 2,880 | | 5,540 |
| | | | | | | | | | |
| Block Size (ft) | | Number of Blocks |
Easting | | Northing | | Elev. | | Easting | | Northing | | Elev. |
| 40 | | 40 | | 20 | | 303 | | 312 | | 133 |
| | |
Barrick Gold Corporation – Cortez Operations, Project 2471 Technical Report NI 43-101 – March 21, 2016 | | Page 14-6 |
| | |
| | www.rpacan.com |
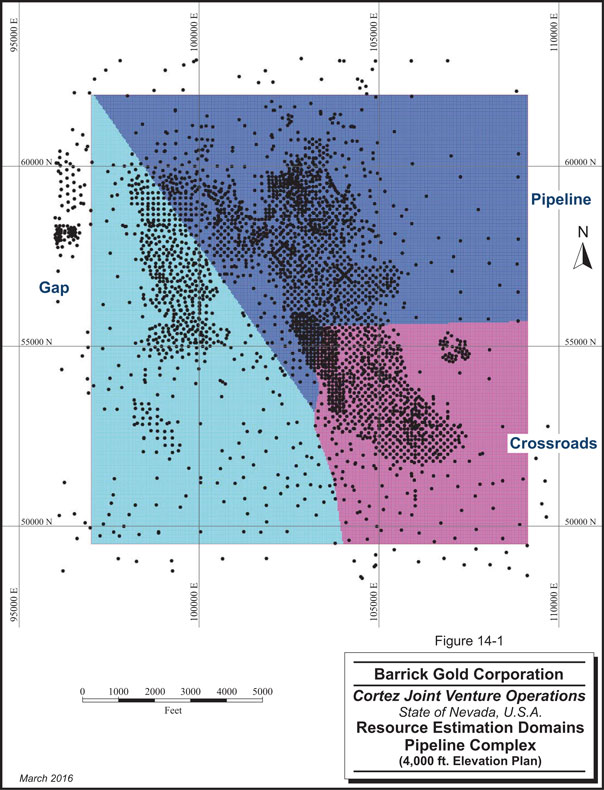
| | |
Barrick Gold Corporation – Cortez Operations, Project 2471 Technical Report NI 43-101 – March 21, 2016 | | Page 14-7 |
| | |
| | www.rpacan.com |
INDICATOR INTERPOLATION
The Tucson Technical Group applied Inverse Distance squared (ID2) for the estimation of high and low grade indicators to categorize each block within each of the areas at the Pipeline Complex as high or low grade, and, in the case of Gap and Pipeline, as dominated by stratigraphic or structural control on mineralization.
A low grade gold indicator was assigned at a threshold of 0.002 oz/st, in all areas. High grade gold indicators were assigned at thresholds of 0.05 oz/st, 0.10 oz/st, 0.15 oz/st for Gap, Crossroads, and Pipeline, respectively. Table 14-6 shows the general orientations of the structural mineralization control search ellipses within each area.
TABLE 14-6 SEARCH ELLIPSE ORIENTATIONS OF STRUCTURAL DOMAINS – PIPELINE COMPLEX
Barrick Gold Corporation – Cortez Operations
| | | | | | |
Domain | | Azimuth | | Plunge | | Dip |
Gap | | 320° | | 20° | | -10° |
Crossroads | | 330° | | 10° | | 10° |
Indicators were estimated into unique high grade stratigraphic, and low grade stratigraphic and structural indicator block variables at Gap and Crossroads, and into high and low grade stratigraphically controlled indicator block variables at Pipeline. Stratigraphic high and low grade indicator estimation runs employed a search ellipse of 400 ft x 400 ft x variable, oriented parallel to the unfolded surfaces of each mineralized formation: Devonian Wenban (DW) within the Devonian Horse Canyon (DHC), Silurian Roberts Mountain (SRM), Hanson Creek (OHC), and the Quaternary Alluvium (QAL). Structural search ellipse dimensions for Gap and Crossroads were 400 ft x 400 ft x 60 ft, and limited to the SRM and DW formations at Gap and to the DW formation at Crossroads.
A minimum and maximum of five and 13 composites, respectively for each indicator variable was used. The number of composites per drill hole was limited to two, which in tandem with composite restrictions, forced contribution from three drill holes to estimate an indicator value for a block.
Following estimation, mineralization control was ranked at Gap and Crossroads based on the outcome of the low grade indicators. Where the stratigraphically control indicator in the low grade threshold yielded a higher probability value than the structurally controlled indicator, it
| | |
Barrick Gold Corporation – Cortez Operations, Project 2471 Technical Report NI 43-101 – March 21, 2016 | | Page 14-8 |
| | |
| | www.rpacan.com |
was ranked as the dominant control. All other blocks were assumed to be structurally controlled.
The results of the indicator estimation and mineralization control ranking as well as the modelled formation and alteration codes were back-flagged from the block model to the original drill hole database to accommodate data selection for grade interpolation.
GRADE CAPPING AND COMPOSITING
Flagged raw gold assays were capped for outliers based on examination of cumulative probability plots and histograms by the Tucson Technical Group. The capped assays were composited using down-hole 20 ft lengths. Composites honoured domain boundaries, and were distributed to prevent the formation of residual composites. A summary of gold grade caps is shown in Table 14-7.
TABLE 14-7 SUMMARY OF GOLD GRADE CAPS – PIPELINE COMPLEX
Barrick Gold Corporation – Cortez Operations
| | | | | | |
Domain | | Gap
(oz/st Au) | | Pipeline
(oz/st Au) | | Crossroads
(oz/st Au) |
High Grade | | 0.40 | | 1.20 | | 0.70 |
Low Grade | | 0.18 | | 0.40 | | 0.30 |
Waste | | 0.07 | | 0.10 | | 0.10 |
QAL | | 0.07 | | 0.07 | | 0.07 |
Where drill holes were completed in mineralization (gold greater or equal to 0.003 oz/st Au), and at depth were poorly supported by surrounding drill hole information, an additional 20 ft composite was added manually to the end of the hole at a null grade to prevent the extension of gold below the depth of drilling. A total of 397 drill holes were modified.
Intervals with poor recovery that could not be sampled were excluded from the compositing routine and estimation, as were selected drill holes identified by the onsite team as having poor location, sampling, or drilling angle to mineralized structures. Unsampled intervals were assigned a background gold grade of 0.0001 oz/st Au.
| | |
Barrick Gold Corporation – Cortez Operations, Project 2471 Technical Report NI 43-101 – March 21, 2016 | | Page 14-9 |
| | |
| | www.rpacan.com |
VARIOGRAPHY
Normalized, omnidirectional variograms were modeled over the low grade domains of Gap, Crossroads and Pipeline, shown in Figure 14-2 and in Table 14-8. Variograms of the blast hole data at Pipeline and Gap were also modeled (not shown).
TABLE 14-8 LOW GRADE OMNIDIRECTIONAL VARIOGRAM MODELS – PIPELINE COMPLEX
Barrick Gold Corporation – Cortez Operations
| | | | | | | | |
Area | | | | Gap | | Pipeline | | Crossroads |
Type | | | | Spherical | | Spherical | | Spherical |
Nugget | | | | 0.1 | | 0.1 | | 0.1 |
Structure 1 | | Range (ft) | | 25 | | 25 | | 25 |
| | Variance | | 0.2 | | 0.2 | | 0.2 |
Structure 2 | | Range (ft) | | 100 | | 100 | | 100 |
| | Variance | | 0.5 | | 0.5 | | 0.5 |
Structure 3 | | Range (ft) | | 350 | | 350 | | 350 |
| | Variance | | 0.05 | | 0.05 | | 0.05 |
Structure 4 | | Range (ft) | | 600 | | 600 | | 600 |
| | Variance | | 0.1 | | 0.1 | | 0.1 |
Total Variance | | | | 0.95 | | 0.95 | | 0.95 |
The models for each of the areas are identical, however, the values derived from the variography for informing search ellipse parameters are based on the raw data.
| | |
Barrick Gold Corporation – Cortez Operations, Project 2471 Technical Report NI 43-101 – March 21, 2016 | | Page 14-10 |
| | |
| | www.rpacan.com |
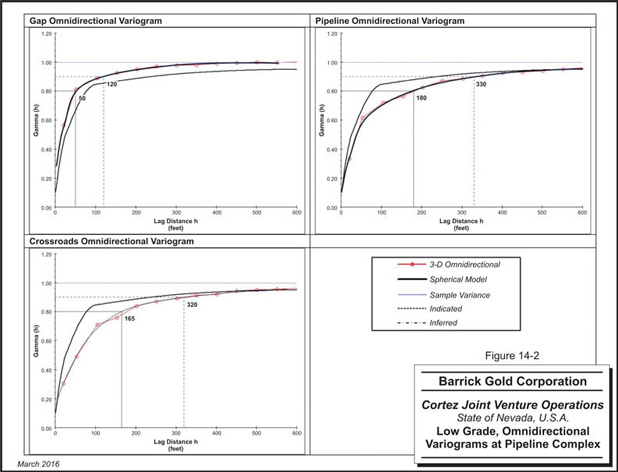
| | |
Barrick Gold Corporation – Cortez Operations, Project 2471 Technical Report NI 43-101 – March 21, 2016 | | Page 14-11 |
| | |
| | www.rpacan.com |
GRADE INTERPOLATION
Gold was interpolated into high and low grade indicator areas individually for each formation within Pipeline, Gap and Crossroads using a five pass inverse distance cubed (ID3) estimation approach, and incorporating mineralization control at Gap and Crossroads (Table 14-9). The first pass employed a box search equal to the block size. Search ellipse dimensions were set to the lag distance at 80% and 90% of the variogram sill for each area for the second and fourth passes, respectively, which were each followed by a pass using a smaller search ellipse with less composite restrictions. As with the indicator estimation, blocks flagged as dominated by stratigraphic mineralization control employed Vulcan’s tetramesh unfolding. Grade estimations incorporating structural control were limited to the DW formation at Crossroads and to the DW and SRM formations at Gap.
TABLE 14-9 ESTIMATION PASS SUMMARY – PIPELINE COMPLEX
Barrick Gold Corporation – Cortez Operations
| | | | | | | | | | | | | | | | | | |
Pass | | Major
(ft) | | | Semi-
major
(ft) | | | Minor-
strat
(ft) | | Minor –
struct
(ft) | | Min
composites | | Max
composites | | Max
composites
per hole |
Gap | | | | | | | | | | | | | | | | | | |
1 | | | 20 | | | | 20 | | | 10 | | 10 | | 1 | | 99 | | 99 |
2 | | | 180 | | | | 180 | | | variable | | 20 | | 2 | | 3 | | 1 |
3 | | | 70 | | | | 70 | | | variable | | 20 | | 1 | | 3 | | 1 |
4 | | | 320 | | | | 320 | | | variable | | 40 | | 2 | | 3 | | 1 |
5 | | | 100 | | | | 100 | | | variable | | 40 | | 1 | | 3 | | 1 |
Pipeline | | | | | | | | | | | | | | | | | | |
1 | | | 20 | | | | 20 | | | 10 | | n/a | | 1 | | 99 | | 99 |
2 | | | 180 | | | | 180 | | | variable | | n/a | | 2 | | 3 | | 1 |
3 | | | 70 | | | | 70 | | | variable | | n/a | | 1 | | 3 | | 1 |
4 | | | 320 | | | | 320 | | | variable | | n/a | | 2 | | 3 | | 1 |
5 | | | 130 | | | | 130 | | | variable | | n/a | | 1 | | 3 | | 1 |
Crossroads | | | | | | | | | | | | | | | | | | |
1 | | | 20 | | | | 20 | | | 10 | | 10 | | 1 | | 99 | | 99 |
2 | | | 180 | | | | 180 | | | variable | | 20 | | 2 | | 3 | | 1 |
3 | | | 70 | | | | 70 | | | variable | | 20 | | 1 | | 3 | | 1 |
4 | | | 320 | | | | 320 | | | variable | | 40 | | 2 | | 3 | | 1 |
5 | | | 130 | | | | 130 | | | variable | | 40 | | 1 | | 3 | | 1 |
Select composite weights were assigned manually by the Tucson Technical Group to allow limited influence of composite groups (grade and mineralization control) across domain boundaries. For example, low grade, stratigraphically controlled composites were assigned a weight of 0.25 in the high grade domain at Gap, and a weight of 0.1 at Pipeline and Crossroads.
| | |
Barrick Gold Corporation – Cortez Operations, Project 2471 Technical Report NI 43-101 – March 21, 2016 | | Page 14-12 |
| | |
| | www.rpacan.com |
A complete summary of composite weights used in grade interpolation are shown in Table 14-10.
TABLE 14-10 SUMMARY OF COMPOSITE WEIGHTS – PIPELINE COMPLEX
Barrick Gold Corporation – Cortez Operations
| | | | | | | | | | | | | | | | | | | | |
Deposit Area/Grade Zones | | High
Grade | | | Low Grade
Stratigraphic
Control | | | Low Grade
Structural
Control | | | Waste
Stratigraphic
Control | | | Waste
Structural
Control | |
Gap | | | | | | | | | | | | | | | | | | | | |
High Grade | | | 1 | | | | 0.25 | | | | | | | | 0.1 | | | | | |
Low Grade Stratigraphic Control | | | 0.75 | | | | 1 | | | | | | | | 0.1 | | | | | |
Low Grade Structural Control | | | 0.75 | | | | | | | | 1 | | | | | | | | 0.1 | |
Waste - Stratigraphic Control | | | 0.1 | | | | 0.1 | | | | | | | | 1 | | | | | |
Waste - Structural Control | | | | | | | | | | | 0.1 | | | | | | | | 1 | |
Pipeline | | | | | | | | | | | | | | | | | | | | |
High Grade | | | 1 | | | | 0.1 | | | | | | | | 0.1 | | | | | |
Low Grade - Stratigraphic Control | | | 0.5 | | | | 1 | | | | | | | | 0.1 | | | | | |
Waste - Stratigraphic Control | | | 0.1 | | | | 0.1 | | | | | | | | 1 | | | | | |
Crossroads | | | | | | | | | | | | | | | | | | | | |
High Grade | | | 1 | | | | 0.1 | | | | | | | | 0.1 | | | | | |
Low Grade - Stratigraphic Control | | | 0.5 | | | | 1 | | | | | | | | 0.1 | | | | | |
Low Grade - Structural Control | | | 0.5 | | | | | | | | 1 | | | | | | | | 0.1 | |
Waste - Stratigraphic Control | | | 0.1 | | | | 0.1 | | | | | | | | 1 | | | | | |
Waste - Structural Control | | | | | | | | | | | 0.1 | | | | | | | | 1 | |
In addition to gold based upon fire assay results, cyanide leach gold and carbon were also estimated for use in material type definition in conjunction with geology, alteration, and area flags. Nearest neighbour interpolation was run in parallel to ID3 for fire assay gold for validation purposes.
Where areas over the Pipeline Complex have been mined and backfilled with waste, grades, and densities were updated to reflect.
BULK DENSITY
Bulk density values were assigned to the rock unit formations and alteration types. Table 14-11 lists the bulk density values used for the deposits in the Pipeline Complex.
| | |
Barrick Gold Corporation – Cortez Operations, Project 2471 Technical Report NI 43-101 – March 21, 2016 | | Page 14-13 |
| | |
| | www.rpacan.com |
TABLE 14-11 BULK DENSITY – PIPELINE COMPLEX
Barrick Gold Corporation – Cortez Operations
| | | | |
Formation | | Density (st/ft3) | |
DW | | | 0.07645 | |
DHC | | | 0.07645 | |
SRM | | | 0.0746 | |
OHC | | | 0.0837 | |
Abyss | | | 0.0798 | |
Marble | | | 0.0779 | |
SRM - Marble | | | 0.08554 | |
Skarn | | | 0.0789 | |
SRM - Skarn | | | 0.091 | |
Gossan | | | 0.0737 | |
SRM - Gossan | | | 0.0655 | |
Shear | | | 0.068 | |
Silica | | | 0.07399 | |
QAL | | | 0.06169 | |
Dumps | | | 0.05714 | |
CLASSIFICATION
The Measured component of the Mineral Resource is assigned to blocks directly intersected by drill holes used in the interpolation, and estimated during the initial box search. Indicated Mineral Resources are defined as when estimated in the second or third pass, equal to a maximum distance range of 80% of the variogram sill. Inferred Mineral Resources are those blocks estimated in the two final passes, where the search ellipse dimensions are equal to, or smaller than, a distance range of 90% of the variogram sill for each area. A classification script updated the block model to reclassify isolated blocks assigned a class of Indicated as Inferred. A cross section showing classification of blocks meeting Mineral Resource criteria over the Crossroads deposit is shown in Figure 14-3.
REBLOCKING
Subsequent to grade estimation, the Pipeline Complex block model was reblocked to 40 ft x 40 ft x 40 ft for use in mine planning. Grade variables were averaged into the larger block size and weighted by density, all other variables were assigned based on majority.
| | |
Barrick Gold Corporation – Cortez Operations, Project 2471 Technical Report NI 43-101 – March 21, 2016 | | Page 14-14 |
| | |
| | www.rpacan.com |
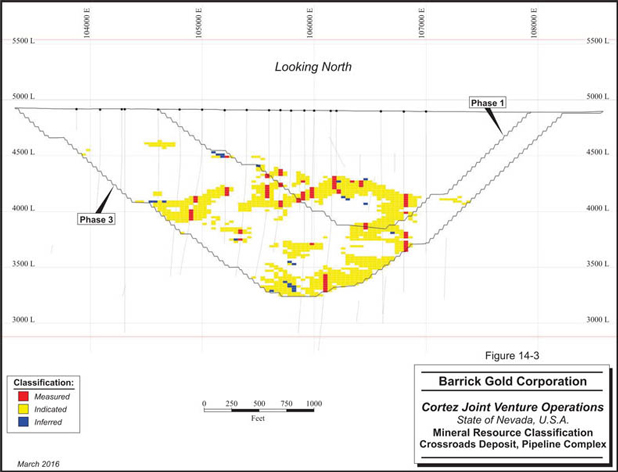
| | |
Barrick Gold Corporation – Cortez Operations, Project 2471 Technical Report NI 43-101 – March 21, 2016 | | Page 14-15 |
| | |
| | www.rpacan.com |
MODEL VALIDATION
Checks and validation performed by the Tucson Technical Group included:
| | • | | Examination of the interpolation scripts and comparison to the interpolation plan |
| | • | | Visual comparisons of interpolated gold grades relative to drill hole composite values on sections and plans. |
| | • | | Results of the estimation were compared to the blast hole block model |
| | • | | Comparison of block model grades and gold assays using histograms and cumulative frequency plots |
| | • | | Comparison of the ID3 estimation to the nearest neighbor (NN) estimation model |
| | • | | Local trends in the grade estimates were reviewed using swath plots |
Following these checks, the Tucson Technical Group concluded that the block model was globally unbiased and demonstrated good correlation between the different estimation methods and different supports.
RPA has reviewed various modelling aspects of the Pipeline Complex, with focus on the Crossroads deposit, which represents approximately 25% of classified material at Cortez. RPA’s observations and comments from the model validation are provided below. All comments are based on the mid 2014 model data, which has been depleted to December 31, 2014.
RPA conducted several checks on the drill hole database and composite file provided by the Tucson Technical Group, including a search for duplicate and missing samples, overlapping intervals, anomalous values and missing tables. No significant errors were found.
Compositing routines were checked to confirm appropriate flagging and selected domains were reviewed using histograms, probability plots, and decile analysis to confirm appropriate gold grade caps. RPA is satisfied with the compositing routines and chosen gold grade caps and finds the composites appropriate for resource estimation.
RPA reviewed the stratigraphic surfaces against the drill hole data and found the general trends of the surfaces to be honoured.
| | |
Barrick Gold Corporation – Cortez Operations, Project 2471 Technical Report NI 43-101 – March 21, 2016 | | Page 14-16 |
| | |
| | www.rpacan.com |
RPA reviewed block and database flagging, field calculation, block estimation, and block calculation files and scripts provided by the Tucson Technical Group for errors and found them to be in good order.
RPA compared flagged formation codes to formation wireframes and expected stratigraphy and density and found the block model to be appropriately flagged.
Block model sizes and orientations were reviewed and found appropriate to the drilling density, mineralization and proposed mining methods.
Assigned density values in the block model were compared to measured density values in drill core using basic statistics. The average values of the measured density within each formation and alteration zone compared well to the assigned block model value, if slightly conservative.
Omnidirectional variography continues to be the predominant tool to evaluate grade continuity and set interpolation search distances. Detailed variography should be carried out, where sample numbers are sufficient, to evaluate grade continuity anisotropy and better quantify search ellipse parameters for interpolation of the grade block models.
Search ellipse dimensions were compared to the omnidirectional variography completed by the Tucson Technical Group and found to be reasonable. A strong northeastern mineralization trend was visually observed by RPA in the composites and resultant block model. RPA is of the opinion that this trend may be discernible using directional variography in unfolded space, which would yield more precise variogram models to inform search ellipse dimensions in future updates. RPA also recommends updating the variogram models to fit with raw data.
RPA created isotropic and anisotropic grade shells using Aranz’ Leapfrog software for comparison with interpolated blocks and to identify mineralization trends. The block model and grade shells were spatially comparable. An additional mineralization trend, dipping approximately 35° to the west was visible within the Crossroads pit. RPA recommends exploring this mineralization trend further.
RPA conducted visual comparisons of assay, composite and block gold values in cross section and plan and found good spatial correlation. Gold grade was not observed to extend into
| | |
Barrick Gold Corporation – Cortez Operations, Project 2471 Technical Report NI 43-101 – March 21, 2016 | | Page 14-17 |
| | |
| | www.rpacan.com |
regions dominated by waste and did not appear to be overly smoothed in higher grade areas. An example cross section of composite and block gold grades is shown in Figure 14-4.
RPA compiled basic statistics, histograms and probability plots of blocks and composites within the SRM, OHC, Abyss fault, DHC including DW, and QAL units of Crossroads, above a gold cut-off of 0.004 oz/st, and found excellent spatial correlation. Basic statistics are summarized in Table 14-12.
|
| TABLE 14-12 COMPARISON OF BASIC STATISTICS OF GOLD VALUES – PIPELINE COMPLEX |
| Barrick Gold Corporation – Cortez Operations |
| | | | | | | | | | | | | | | | |
| | | Minimum
(oz/st Au) | | | Maximum
(oz/st Au) | | | Mean
(oz/st Au) | | | Number of
Data Points | |
Crossroads | | | | | | | | | | | | | | | | |
Blocks | | | 0.004 | | | | 0.649 | | | | 0.024 | | | | 107,788 | |
Composites | | | 0.004 | | | | 0.649 | | | | 0.027 | | | | 7,883 | |
Gap | | | | | | | | | | | | | | | | |
Blocks | | | 0.004 | | | | 0.389 | | | | 0.013 | | | | 93,265 | |
Composites | | | 0.004 | | | | 0.389 | | | | 0.015 | | | | 4,812 | |
Pipeline | | | | | | | | | | | | | | | | |
Blocks | | | 0.004 | | | | 1.200 | | | | 0.031 | | | | 256,466 | |
Composites | | | 0.004 | | | | 1.200 | | | | 0.040 | | | | 18,594 | |
RPA reviewed the classification criteria at the Pipeline Complex as well as visually inspected classified blocks in cross section and plan view. RPA considers restricting the Measured component of the Mineral Resource to those blocks directly intersected by drill holes to be conservative. Additionally, assigning classification of Indicated and Inferred primarily by interpolation pass has resulted in isolated blocks, and a spotted dog appearance in cross section, which is impractical for mine design purposes. RPA recommends a review of classification criteria at Pipeline Complex and is of the opinion that future updates consider the inclusion of classification wireframe shells, and revision of classification smoothing scripts.
| | |
Barrick Gold Corporation – Cortez Operations, Project 2471 Technical Report NI 43-101 – March 21, 2016 | | Page 14-18 |
| | |
| | www.rpacan.com |
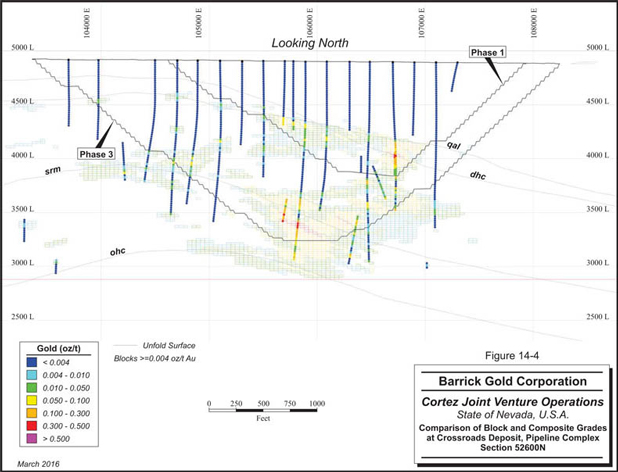
| | |
Barrick Gold Corporation – Cortez Operations, Project 2471 Technical Report NI 43-101 – March 21, 2016 | | Page 14-19 |
| | |
| | www.rpacan.com |
CORTEZ HILLS COMPLEX
Open pit and underground development are present at the Cortez Hills Complex. Areas designated for open pit development include the Pediment deposit and the near-surface portion of the Breccia zone. The Cortez Hills Breccia, Middle and Lower zones, as well as the Deep South extension of the Lower zone, make up the underground component. Mineral Resources at Cortez Hills Complex, exclusive of Mineral Reserves are listed in Table 14-13. Cut-off grades used in reporting Mineral Resources were established using a gold price of US$1,300 per ounce and are shown in Table 14-14. Measured and Indicated Mineral Resources are limited to the underground portions of the Cortez Hills Complex.
TABLE 14-13 CORTEZ HILLS COMPLEX MINERAL RESOURCE SUMMARY – DECEMBER 31, 2015
Barrick Gold Corporation – Cortez Operations
| | | | | | | | | | | | | | | | | | | | | | | | | | | | | | | | | | | | | | | | | | | | | | | | |
| | | Mill Material | | | Leach Material | | | Refractory Material | | | Total | |
| | | Tons
(000 st) | | | Grade
(oz/st Au) | | | Ounces
(000 oz) | | | Tons
(000 st) | | | Grade
(oz/st Au) | | | Ounces
(000 oz) | | | Tons
(000 st) | | | Grade
(oz/st Au) | | | Ounces
(000 oz) | | | Tons
(000 st) | | | Grade
(oz/st Au) | | | Ounces
(000 oz) | |
Measured Resources | | | | | | | | | | | | | | | | | | | | | | | | | | | | | | | | | | | | | | | | | | | | | | | | |
Underground | | | | | | | | | | | | | | | | | | | | | | | | | | | | | | | | | | | | | | | | | | | | | | | | |
Breccia Zone | | | 146 | | | | 0.342 | | | | 50 | | | | — | | | | — | | | | — | | | | 21 | | | | 0.317 | | | | 7 | | | | 167 | | | | 0.339 | | | | 56 | |
| | | | | | | | | | | | | | | | | | | | | | | | | | | | | | | | | | | | | | | | | | | | | | | | |
Total | | | 146 | | | | 0.342 | | | | 50 | | | | — | | | | — | | | | — | | | | 21 | | | | 0.317 | | | | 7 | | | | 167 | | | | 0.339 | | | | 56 | |
Indicated Resources | | | | | | | | | | | | | | | | | | | | | | | | | | | | | | | | | | | | | | | | | | | | | | | | |
Underground | | | | | | | | | | | | | | | | | | | | | | | | | | | | | | | | | | | | | | | | | | | | | | | | |
Breccia Zone | | | 295 | | | | 0.338 | | | | 100 | | | | — | | | | — | | | | — | | | | 40 | | | | 0.261 | | | | 10 | | | | 335 | | | | 0.329 | | | | 110 | |
Middle Zone | | | 200 | | | | 0.300 | | | | 60 | | | | — | | | | — | | | | — | | | | 865 | | | | 0.335 | | | | 290 | | | | 1,065 | | | | 0.328 | | | | 350 | |
Lower Zone | | | 396 | | | | 0.258 | | | | 102 | | | | — | | | | — | | | | — | | | | 546 | | | | 0.284 | | | | 155 | | | | 942 | | | | 0.273 | | | | 257 | |
Deep South | | | 538 | | | | 0.280 | | | | 150 | | | | — | | | | — | | | | — | | | | 125 | | | | 0.149 | | | | 19 | | | | 663 | | | | 0.255 | | | | 169 | |
| | | | | | | | | | | | | | | | | | | | | | | | | | | | | | | | | | | | | | | | | | | | | | | | |
Total | | | 1,428 | | | | 0.288 | | | | 412 | | | | — | | | | — | | | | — | | | | 1,577 | | | | 0.301 | | | | 474 | | | | 3,005 | | | | 0.295 | | | | 886 | |
Measured and Indicated Resources | | | | | | | | | | | | | | | | | | | | | | | | | | | | | | | | | | | | | |
Underground | | | | | | | | | | | | | | | | | | | | | | | | | | | | | | | | | | | | | | | | | | | | | | | | |
Breccia Zone | | | 441 | | | | 0.339 | | | | 149 | | | | — | | | | — | | | | — | | | | 61 | | | | 0.280 | | | | 17 | | | | 502 | | | | 0.332 | | | | 167 | |
Middle Zone | | | 200 | | | | 0.300 | | | | 60 | | | | — | | | | — | | | | — | | | | 865 | | | | 0.335 | | | | 290 | | | | 1,065 | | | | 0.328 | | | | 350 | |
Lower Zone | | | 396 | | | | 0.258 | | | | 102 | | | | — | | | | — | | | | — | | | | 546 | | | | 0.284 | | | | 155 | | | | 942 | | | | 0.273 | | | | 257 | |
Deep South | | | 538 | | | | 0.280 | | | | 150 | | | | — | | | | | | | | — | | | | 125 | | | | 0.149 | | | | 19 | | | | 663 | | | | 0.255 | | | | 169 | |
| | | | | | | | | | | | | | | | | | | | | | | | | | | | | | | | | | | | | | | | | | | | | | | | |
Total | | | 1,574 | | | | 0.293 | | | | 462 | | | | — | | | | — | | | | — | | | | 1,598 | | | | 0.301 | | | | 481 | | | | 3,172 | | | | 0.297 | | | | 943 | |
Inferred Resources | | | | | | | | | | | | | | | | | | | | | | | | | | | | | | | | | | | | | | | | | | | | | | | | |
Open Pit | | | | | | | | | | | | | | | | | | | | | | | | | | | | | | | | | | | | | | | | | | | | | | | | |
Breccia Zone | | | 796 | | | | 0.12 | | | | 93 | | | | 2,615 | | | | 0.01 | | | | 25 | | | | 29 | | | | 0.10 | | | | 3 | | | | 3,440 | | | | 0.04 | | | | 122 | |
Pediment | | | — | | | | — | | | | — | | | | 410 | | | | 0.01 | | | | 3 | | | | — | | | | — | | | | — | | | | 411 | | | | 0.01 | | | | 3 | |
| | | | | | | | | | | | | | | | | | | | | | | | | | | | | | | | | | | | | | | | | | | | | | | | |
Total | | | 798 | | | | 0.12 | | | | 94 | | | | 3,025 | | | | 0.01 | | | | 28 | | | | 29 | | | | 0.10 | | | | 3 | | | | 3,851 | | | | 0.03 | | | | 125 | |
| | |
Barrick Gold Corporation – Cortez Operations, Project 2471 Technical Report NI 43-101 – March 21, 2016 | | Page 14-20 |
| | |
| | www.rpacan.com |
| | | | | | | | | | | | | | | | | | | | | | | | | | | | | | | | | | | | | | | | | | | | | | | | |
| | | Mill Material | | | Leach Material | | | Refractory Material | | | Total | |
| | | Tons
(000 st) | | | Grade
(oz/st Au) | | | Ounces
(000 oz) | | | Tons
(000 st) | | | Grade
(oz/st Au) | | | Ounces
(000 oz) | | | Tons
(000 st) | | | Grade
(oz/st Au) | | | Ounces
(000 oz) | | | Tons
(000 st) | | | Grade
(oz/st Au) | | | Ounces
(000 oz) | |
Underground | | | | | | | | | | | | | | | | | | | | | | | | | | | | | | | | | | | | | | | | | | | | | | | | |
Breccia Zone | | | 9 | | | | 0.47 | | | | 4 | | | | — | | | | — | | | | — | | | | 0 | | | | 0.24 | | | | 0 | | | | 9 | | | | 0.47 | | | | 4 | |
Middle Zone | | | 14 | | | | 0.23 | | | | 3 | | | | — | | | | — | | | | — | | | | 68 | | | | 0.37 | | | | 25 | | | | 82 | | | | 0.35 | | | | 28 | |
Lower Zone | | | 27 | | | | 0.21 | | | | 6 | | | | — | | | | — | | | | — | | | | 513 | | | | 0.25 | | | | 127 | | | | 541 | | | | 0.25 | | | | 133 | |
Deep South | | | 81 | | | | 0.29 | | | | 24 | | | | — | | | | — | | | | — | | | | 629 | | | | 0.44 | | | | 277 | | | | 710 | | | | 0.42 | | | | 301 | |
| | | | | | | | | | | | | | | | | | | | | | | | | | | | | | | | | | | | | | | | | | | | | | | | |
Total | | | 131 | | | | 0.28 | | | | 37 | | | | — | | | | — | | | | — | | | | 1,210 | | | | 0.35 | | | | 429 | | | | 1,341 | | | | 0.35 | | | | 466 | |
Notes:
| 1. | CIM definitions were followed for Mineral Resources. |
| 2. | Mineral Resources are reported using a gold price of US$1,300 per ounce and using cut-off grades given in Table 14-14. |
| 3. | Bulk densities vary by formation and zone and are listed in Table 14-16. |
| 4. | Open pit Mineral Resources are limited to Inferred material inside the reserve pit. There is no optimized pit shell extending beyond the reserve pit at Cortez Hills. |
| 5. | Mineral Resources are additional to and exclusive of Mineral Reserves. |
| 6. | Numbers may not add due to rounding. |
TABLE 14-14 CORTEZ HILLS COMPLEX MINERAL RESOURCE REPORTING CUT-OFF GRADES
Barrick Gold Corporation – Cortez Operations
| | | | | | |
Area | | Material Type | | Lower Cut-off grade
(oz/st Au) | | Upper Cut-off grade
(oz/st Au) |
Open Pit | | | | | | |
Cortez Hill Breccia Zone | | | | |
| | Mill | | 0.03 | | |
| | Leach | | 0.004 | | 0.03 |
| | Refractory | | 0.075 | | |
Pediment | | | | |
| | Mill | | 0.03 | | |
| | Leach | | 0.004 | | 0.03 |
| | Refractory | | 0.075 | | |
Underground | | | | |
Breccia Zone | | | | |
| | Mill | | 0.128 | | |
| | Refractory | | 0.152 | | |
Middle Zone | | | | |
| | Mill | | 0.133 | | |
| | Refractory | | 0.158 | | |
Lower Zone | | | | |
| | Mill | | 0.136 | | |
| | Refractory | | 0.161 | | |
Lower Zone – Deep South | | | | |
| | Mill | | 0.110 | | |
| | Refractory | | 0.110 | | |
| | |
Barrick Gold Corporation – Cortez Operations, Project 2471 Technical Report NI 43-101 – March 21, 2016 | | Page 14-21 |
| | |
| | www.rpacan.com |
DATA
For the purpose of resource estimation, the drill hole data was limited to drill holes within or immediately adjacent to the block model extents. The 2015 resource database includes 3,542 drill holes comprising 310,9661ft and 283,041 assays. This database includes all drill holes used for Mineral Resource estimates for all of Cortez Hills including Pediment open pit, Breccia open pit and underground, and underground Middle and Lower zones.
BLOCK MODEL AND MINERALIZED DOMAINS
Block modelling at the Cortez Hills Complex was performed by the Mine Technical Group at Cortez. Geologic, structural and alteration interpretations were provided by onsite geologists. Three dimensional solids and surfaces constructed from these interpretations were used as the basis for defining mineralization domains.
Cortez Technical Services built a series of estimation domain wireframes using grade breaks derived from statistical analysis of gold distributions in conjunction with structural and alteration elements derived from geological logs and core photographs. This approach was particularly useful for the volumetric definition of the very high-grade transported hydrothermal breccias and the surrounding moderate-grade crackle breccia or fractured rock bodies of the Cortez Hills Breccia zone. All of the mineralized domain wireframes (mzones) were bounded by a sub-economic grade domain wireframe to provide dilution grades for mine planning. Wireframes representing barren, post-mineralization dikes and sills were modelled and cross cut the mineralization domain wireframes.
Pediment deposit grade shells were built in a similar manner with boundaries honouring geological units and contacts, structural features and the distribution of gold mineralization intersected in the drill holes. High grade wireframes at a gold cut-off grade of 0.20 oz/st were built to confine high-angle structural features. Low angle, intermediate grade wireframes were built using a gold cut-off grade of 0.03 oz/st. An outer, low-grade wireframe was built at a gold cut-off grade of 0.004 oz/st to encompass potential heap-leach material and provide dilution grades for mine planning of the higher grade wireframes located within. An overview of the zones at Cortez Hills Complex are shown in Figure 14-5.
Two 10 ft x 10 ft x 10 ft sub-blocked models for the underground areas of the Cortez Hills deposit were built by the Cortez Mine Technical Group. The first was built to define the lower
| | |
Barrick Gold Corporation – Cortez Operations, Project 2471 Technical Report NI 43-101 – March 21, 2016 | | Page 14-22 |
| | |
| | www.rpacan.com |
portions (< 5,000 ft elev) of the Breccia zone and the second, deeper model defines the Middle, and Lower zones, including Deep South. Both were constructed honouring domain boundaries and formational contacts. Minimum and maximum sub block dimensions of 5 ft x 5 ft x 2 ft and 10 ft x 10 ft x 10 ft were defined within mineralized domains; parent blocks of 30 ft x 30 ft x 20 ft were retained in areas outside these zones. A third model over the Pediment deposit and upper Breccia Zone (> 5,000 ft) was defined using parent blocks of 10 ft x 10 ft x 10 ft, with sub block dimensions of 5 ft x 5 ft x 2 ft. Following interpolation of all variables in the sub-blocked model, it was re-blocked to 30 ft x 30 ft x 50 ft. Block model parameters are shown in Table 14-15.
TABLE 14-15 CORTEZ HILLS COMPLEX BLOCK MODEL PARAMETERS
Barrick Gold Corporation – Cortez Operations
| | | | | | | | | | | | |
| | | Easting (ft) | | Northing (ft) | | Elevation (ft) |
| | | Min | | Max | | Min | | Max | | Min | | Max |
Open Pit Breccia Zone and Pediment | | 29,400 | | 36,990 | | 21,000 | | 31,290 | | 3,800 | | 7,200 |
Underground Breccia Zone | | 29,400 | | 36,300 | | 22,320 | | 31,320 | | 3,800 | | 7,200 |
Underground Middle and Lower Zones (including Deep South) | | 29,010 | | 36,300 | | 22,320 | | 31,320 | | 2,800 | | 7,200 |
| | |
| | | Original Block Size (ft) | | Reblocked Block Size (ft) |
| | | Easting | | Northing | | Elev. | | Easting | | Northing | | Elev. |
Open Pit Breccia Zone and Pediment | | 10 | | 10 | | 10 | | 30 | | 30 | | 50 |
Underground Unmineralized Parent | | 30 | | 30 | | 20 | | | | | | |
Underground Mineralized Parent | | 10 | | 10 | | 10 | | | | | | |
Underground Sub-block | | 5 | | 5 | | 2 | | | | | | |
| | |
Barrick Gold Corporation – Cortez Operations, Project 2471 Technical Report NI 43-101 – March 21, 2016 | | Page 14-23 |
| | |
| | www.rpacan.com |
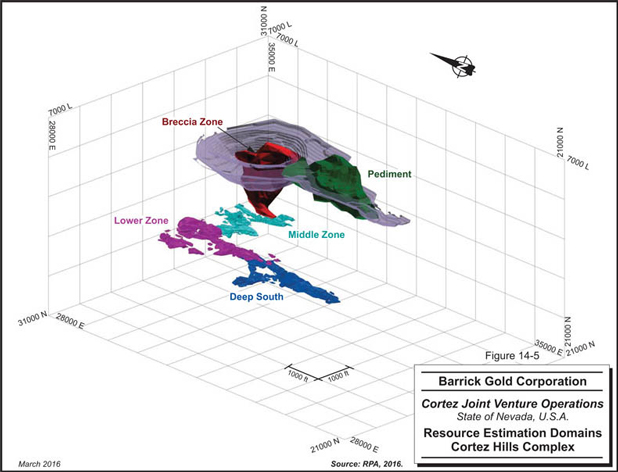
| | |
Barrick Gold Corporation – Cortez Operations, Project 2471 Technical Report NI 43-101 – March 21, 2016 | | Page 14-24 |
| | |
| | www.rpacan.com |
GRADE CAPPING AND COMPOSITING
Assays contained in mineralized envelopes were grouped according to their statistical parameters, and reviewed together to determine the relevant gold caps. Details of the mzone grouping and resultant gold caps is shown in Table 14-16.
TABLE 14-16 CORTEZ HILLS COMPLEX CAPPING
Barrick Gold Corporation – Cortez Operations
| | | | | | |
Area and Group | | Mzone | | Gold Assay Cap
(oz/st) | |
Pediment | | | | | | |
I High Grade | | 321 | | | 3.5 | |
II Intermediate Grade | | 301, 302, 303, 304, 313, 332 | | | 0.6 | |
Breccia | | | | | | |
I Very High Grade | | 30,40,49 | | | 10 | |
II High Grade | | 15-29, 31-39, 41-48, 51 | | | 5.5 | |
III Low Grade | | 11-14 | | | 0.25 | |
Middle Zone | | | | | | |
I High Grade | | 143-149,161,162,198 | | | 2 | |
II High Grade | | 133,135,141,142, 121-126,191,192,196 | | | 2.3 | |
III High Grade | | 131,132,134,151-154,156-158,111,112,155,193-195 | | | 1.7 | |
IV Intermediate Grade | | 110, 130, 140, 150, 190 | | | 0.5 | |
Lower Zone | | | | | | |
I High Grade | | 231, 228, 230, 227, 234, 212, 210, 214, 213, 237 | | | 2 | |
II High Grade | | 224, 225, 220, 226, 232, 215, 219, 233, 216, 235 | | | 1 | |
III High Grade | | 229, 236 | | | 1 | |
IV Intermediate Grade | | 202 | | | 0.4 | |
| | |
Uneconomic Buffer Zone | | 10 | | | 0.1 | |
Unestimated Zones | | 101, 201 | | | | |
Capped assays were composited down hole at 10 ft lengths. This composite length was chosen to allow for the higher resolution grade interpolation needed for underground mine planning and is close to the accepted smallest mining unit for underground (SMU). Intervals with poor recovery that could not be sampled were excluded from the compositing routine and estimation, as were selected drill holes identified by the onsite team as having poor location, sampling, or drilling angle to mineralized structures. Unsampled intervals were assigned a background gold grade of 0.0001 oz/st Au. Assays lengths were distributed within each domain to prevent the formation of residual composites.
| | |
Barrick Gold Corporation – Cortez Operations, Project 2471 Technical Report NI 43-101 – March 21, 2016 | | Page 14-25 |
| | |
| | www.rpacan.com |
VARIOGRAPHY
Directional variograms were developed for gold and used to establish search distances equal to lag at 80% and 90% of the total sill variance range for the different estimation domain groups. In most cases, data from multiple domains was interpreted together in a group. Search ellipses were based on the ranges modeled in the variograms and preferred orientations of modelled mineralized zones.
GRADE INTERPOLATION
Grade models were interpolated using ID3 employing varying search criteria (directions and distances) customized to each domain within the models. The Breccia zone, Middle zone, Lower zone, and Pediment deposit have been modelled with 33, 44, 24, and 8 individual estimation domains, respectively. The interpolation approach within the Middle and Lower zones at Cortez included four nested estimation runs; the first being equal to 80% of the variogram sill, with a minimum of three and maximum of five composites, and only two composites per hole. These composite restrictions were also applied to the third pass, which used a search ellipse equal to 90% of the variogram sill. The second and fourth passes used search ellipses equal to half the dimensions of the first and third passes, respectively, but reduced the composite restrictions to allow a block to be estimated with a single composite. The Pediment and Breccia zone interpolation approached also included an initial box search, 5 ft x 5 ft x 5 ft, which allowed a single composite to estimate a block, if that composite was centred on the block.
BULK DENSITY
Bulk densities were determined from average tonnage factors (TF) measured for the different mineralized domains, rock formations or units, and refractory and oxide materials. Table 14-17 lists the bulk densities used in the block model at the Cortez Hill Complex.
| | |
Barrick Gold Corporation – Cortez Operations, Project 2471 Technical Report NI 43-101 – March 21, 2016 | | Page 14-26 |
| | |
| | www.rpacan.com |
TABLE 14-17 CORTEZ HILLS COMPLEX - BULK DENSITY
Barrick Gold Corporation – Cortez Operations
| | | | | | |
Area | | TF1 | | 1/TF | | Comments |
Default | | 13.5 | | 0.0741 | | default |
QAL (Cortez Hills) | | | | 0.0552 | | |
QCL(Cortez Hills) | | 15 | | 0.0667 | | |
QAL (Pediment) | | 19.1 | | 0.0524 | | |
QCL (Pediment) | | 18.3 | | 0.0546 | | |
QCS | | 17.9 | | 0.0559 | | |
DHC | | 16.2 | | 0.0617 | | |
DW | | 12.4 | | 0.0806 | | |
SRM | | 12.4 | | 0.0806 | | |
Dike (mzone 900) | | 13.8 | | 0.0725 | | |
| | | |
Breccia Zone | | TF | | 1/TF | | Comments |
mzone 11 (oxide) | | 12.6 | | 0.0794 | | low grade halo around main breccia |
mzone 11 (refractory) | | 12.3 | | 0.0813 | | low grade halo around main breccia |
mzone 12 | | 16.6 | | 0.0602 | | low grade capping zone |
mzone 13 | | 13.9 | | 0.0719 | | low grade upper breccia |
mzone 14 | | 13.0 | | 0.0769 | | low grade - north breccia wing |
mzone 15 | | 12.6 | | 0.0794 | | |
mzone 20 (oxide) | | 13.2 | | 0.0758 | | main breccia zone |
mzone 20 (refractory) | | 12.8 | | 0.0781 | | main breccia zone |
mzone 21 | | 12.8 | | 0.0781 | | footwall zones - dominantly breccia |
mzones 22 - 33 | | 12.6 | | 0.0794 | | footwall zones - dominantly breccia |
mzone 34 | | 16.6 | | 0.0602 | | capping zone |
mzone 35 (DHC) | | 15.4 | | 0.0649 | | upper high grade breccia |
mzone 35 (DW) | | 13.8 | | 0.0725 | | upper high grade breccia |
mzone 35 (CHUG model) | | 13.8 | | 0.0725 | | upper high grade breccia |
mzone 36 & 37 | | 13.8 | | 0.0725 | | north breccia wing |
mzone 38 | | 12.6 | | 0.0794 | | south breccia wing |
mzone 39 | | 18.1 | | 0.0552 | | mineralized QCS |
mzone 40 (oxide) | | 14.4 | | 0.0694 | | high grade breccia core |
mzone 40 (refractory) | | 13.7 | | 0.0730 | | high grade breccia core |
mzones 41 - 48 | | 12.6 | | 0.0794 | | footwall zones |
mzone 49 (oxide) | | 14.4 | | 0.0694 | | high grade breccia core |
mzone 49 (refractory) | | 13.7 | | 0.0730 | | high grade breccia core |
mzone 51 | | 12.6 | | 0.0794 | | breccia |
| | | |
Pediment | | TF | | 1/TF | | Comments |
mzone 332 (DW) | | 13.5 | | 0.0741 | | |
mzone 321 (DHC) | | 15.5 | | 0.0647 | | |
| | |
Barrick Gold Corporation – Cortez Operations, Project 2471 Technical Report NI 43-101 – March 21, 2016 | | Page 14-27 |
| | |
| | www.rpacan.com |
| | | | | | | | | | |
mzone 301 | | | 15.9 | | | | 0.0630 | | | |
mzone 302 to 313 | | | 15.9 | | | | 0.0630 | | | based on truck study of alluvial ores |
mzone 321 | | | 15.5 | | | | 0.0647 | | | |
mzone 332 | | | 13.5 | | | | 0.0741 | | | |
mzone 2 (SRM, OHC, QAL) | | | 15.9 | | | | 0.0630 | | | based on truck study of alluvial ores |
mzone 2 (DW and DHC) | | | 13.5 | | | | 0.0741 | | | |
| | | |
Middle Zone | | TF | | | 1/TF | | | Comments |
| | | |
101 | | | 12.1 | | | | 0.0826 | | | |
110 (oxide) | | | 12.1 | | | | 0.0826 | | | |
110 (refractory) | | | 12.3 | | | | 0.0813 | | | |
130, 140, 150 (oxide) | | | 12.1 | | | | 0.0826 | | | |
130, 140, 150 (refractory) | | | 12.2 | | | | 0.0820 | | | |
111, 112, 121 - 126, 191-196 (oxide) | | | 12.5 | | | | 0.0800 | | | |
111, 112, 121 - 126, 191-196 (refractory) | | | 12.8 | | | | 0.0781 | | | |
131 - 135, 141 - 149, 151-158, 161, 162, 198 (oxide) | | | 12.5 | | | | 0.0800 | | | |
131 - 135, 141 - 149, 151-158, 161, 162, 198 (refractory) | | | 13.0 | | | | 0.0769 | | | |
Dikes | | | 13.8 | | | | 0.0725 | | | |
| | | |
Lower Zone | | TF | | | 1/TF | | | Comments |
Default | | | 12.2 | | | | 0.0816 | | | |
Dikes | | | 13.8 | | | | 0.0725 | | | |
201 | | | 12.4 | | | | 0.0806 | | | |
202 (oxide) | | | 13.2 | | | | 0.0758 | | | |
202 (refractory) | | | 12.3 | | | | 0.0813 | | | |
High grade (oxide) | | | 13.3 | | | | 0.0752 | | | mzone 210 to 237 |
High grade (refractory) | | | 13.1 | | | | 0.0763 | | | mzone 210 to 237 |
Notes:
| 2. | QCL : Quaternary conglomerate, limestone dominated clasts |
| 3. | QCS : Quaternary conglomerate, siltstone dominated clasts |
| 4. | DHC : Devonian Horse Canyon Formation |
| 5. | DW : Devonian Wenban Formation |
| 6. | SRM : Silurian Roberts Mountains Formation |
| 8. | mzone : Interpreted mineralized zone used to limit estimation |
CLASSIFICATION
Blocks at the Cortez Hills Complex were classified considering estimation pass and the Cartesian distance to the nearest informing composite sample (same domain), with some downgrading at the discretion of the modelling geologist. In general, blocks estimated in the first estimation pass, a box search, were assigned a classification of Measured; Indicated
| | |
Barrick Gold Corporation – Cortez Operations, Project 2471 Technical Report NI 43-101 – March 21, 2016 | | Page 14-28 |
| | |
| | www.rpacan.com |
Mineral Resources were those with an informing composite sample within 80% of the modelled variogram sill distance for the different domains. All other estimated blocks were assigned a classification of Inferred, equal to a distance of 90% of the modelled variogram sill value for each domain, as well as some additional areas with lower geological confidence. Blocks in the Middle and Lower zones were limited to a classification of Indicated. A summary of classification criteria employed at the Cortez Hills Complex is shown in Table 14-18.
TABLE 14-18 CORTEZ HILLS COMPLEX - CLASSIFICATION DISTANCE CRITERIA
Barrick Gold Corporation – Cortez Operations
| | | | | | |
| | | Maximum Cartesian Distance to Closest Composite (ft) |
| | | Measured | | Indicated | | Inferred |
Breccia Zone | | 5 | | 150 | | 270 |
Pediment | | 5 | | 240 | | 375 |
Middle Zone | | — | | 150 | | 292 |
Lower Zone | | — | | 170 | | 257 |
MODEL VALIDATION
RPA has reviewed various modelling aspects of the Breccia, Middle and Lower Zones, and the Pediment deposit. RPA’s observations and comments from the model validation are provided below. All comments are based on Mid-2015 model data. The model has been depleted to December 31, 2015.
Mineralization solids were checked for conformity to drill hole data, continuity, similarity between sections, overlaps, appropriate terminations between holes and into undrilled areas, and minimum mining thicknesses. The wireframe solids were mostly snapped to drill hole intervals, reasonably consistent, continuous, honoured minimum thickness criteria, and are generally representative of the extents and limits of the mineralization.
Block model sizes and orientations were reviewed and are considered by RPA to be appropriate to the drilling density, mineralization, and proposed mining methods.
Compositing routines were checked to confirm that composites started and stopped at the intersections with the wireframes, that the composite coding is consistent with the wireframes. RPA is satisfied with the compositing routines and finds the composites appropriate for resource estimation.
| | |
Barrick Gold Corporation – Cortez Operations, Project 2471 Technical Report NI 43-101 – March 21, 2016 | | Page 14-29 |
| | |
| | www.rpacan.com |
Capping statistics were reviewed for a series of individual zones and compared to the statistics of capping groups defined by Barrick. RPA is satisfied with the chosen caps, however, they appear to be conservative when compared to caps derived from individual zones. RPA recommends performing capping statistics on individual zones in future updates.
Visual inspection and comparison of drill hole composites against mineralized solids was made for a number of sections from the Breccia, Middle and Lower Zones and Pediment deposit. The mineralized solids and gold grade shells were found to conform well to the drill hole composite grades. A cross section for each zone of the Cortez Hills Complex comparing composite and block gold grades is shown in Figures 14-6 to 14-10.
The drilling data, which include surface as well as tighter spaced underground core and Cubex holes, are locally clustered. Although no de-clustering was employed for the ID3 interpolation, the low number of composites and octant restriction used in the interpolation method helps to de-cluster the composites. Previous auditors have recommended that the current model should be validated by ordinary kriging, so as to limit the overestimation of high-grade tons, typical where dense drilling in high grade underground areas dominates an inverse distance estimation. While this has not been done, regular reconciliation to production reveals that the model does slightly overestimate high grade tons, but also underestimates average grade of processed material. Overall reconciliation between production and the reserve model remains close, but shows consistent positive gains from production relative to the model. RPA recommends validation by ordinary kriging be performed as part of the next model update at Cortez Hills Complex.
Contact plots were prepared for selected mineralization domains and confirmed the appropriateness of hard boundaries between the domains during estimation.
RPA reviewed the variogram models for selected mineralization domain groups and prepared variogram models representing selected individual mineralization domains for comparison. RPA found the trend of the Barrick variogram models to be consistent with the RPA models, however, Barrick consistently resolved longer ranges in all directions than was observed in the RPA models based on a single domain. RPA recommends performing variography on single domains where supported by sufficient sample density, and applying the findings of those variogram models to smaller domains with similar lithological and grade characteristics.
| | |
Barrick Gold Corporation – Cortez Operations, Project 2471 Technical Report NI 43-101 – March 21, 2016 | | Page 14-30 |
| | |
| | www.rpacan.com |
RPA reviewed the classification criteria at the Cortez Hills Complex as well as visually inspected classified blocks in cross section and plan view. RPA considers restricting the Measured component of the Mineral Resource to those blocks directly intersected by drill holes to be conservative. RPA is of the opinion that in general classification of blocks is in line with industry best practices, however, notes that the classification of blocks in the Lower Zone appears to be more aggressive than the Middle and Breccia zones. RPA also notes that the reblocking performed in the open pit has volumetrically reduced the Measured block component of the Breccia zone. RPA recommends reviewing classification criteria using variogram ranges based on individual domains.
RPA is of the opinion that the drill hole density and reconciliation results are supportive of much of the Indicated material within the Breccia zone and some of the Indicated material in the Middle Zone being reclassified as Measured.
RPA confirmed that proposed and actual underground mining areas within the final open pit Breccia Zone were depleted of gold prior to reblocking.
Reported Mineral Resources for the open pit are restricted to Inferred material within the final reserve pit shell. Underground Mineral Resources are limited by a grade shell enclosing blocks above 0.1 oz/st Au, filtered to remove isolated blocks, and a minimum mining width of 10 ft.
Figures 14-11 to 14-15 provide comparative statistics for the Breccia and Pediment open pit model (CHOP), and the Breccia, Middle, and Lower zone underground models (CHUG).
| | |
Barrick Gold Corporation – Cortez Operations, Project 2471 Technical Report NI 43-101 – March 21, 2016 | | Page 14-31 |
| | |
| | www.rpacan.com |
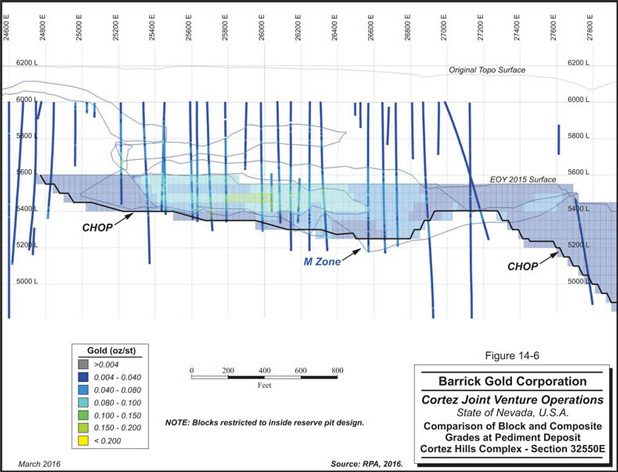
| | |
Barrick Gold Corporation – Cortez Operations, Project 2471 Technical Report NI 43-101 – March 21, 2016 | | Page 14-32 |
| | |
| | www.rpacan.com |
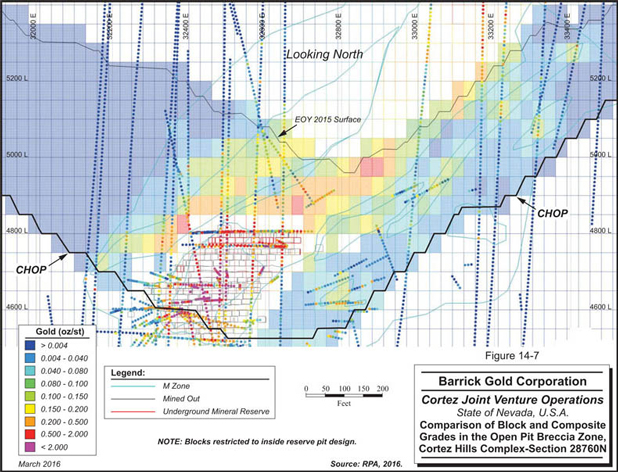
| | |
Barrick Gold Corporation – Cortez Operations, Project 2471 Technical Report NI 43-101 – March 21, 2016 | | Page 14-33 |
| | |
| | www.rpacan.com |
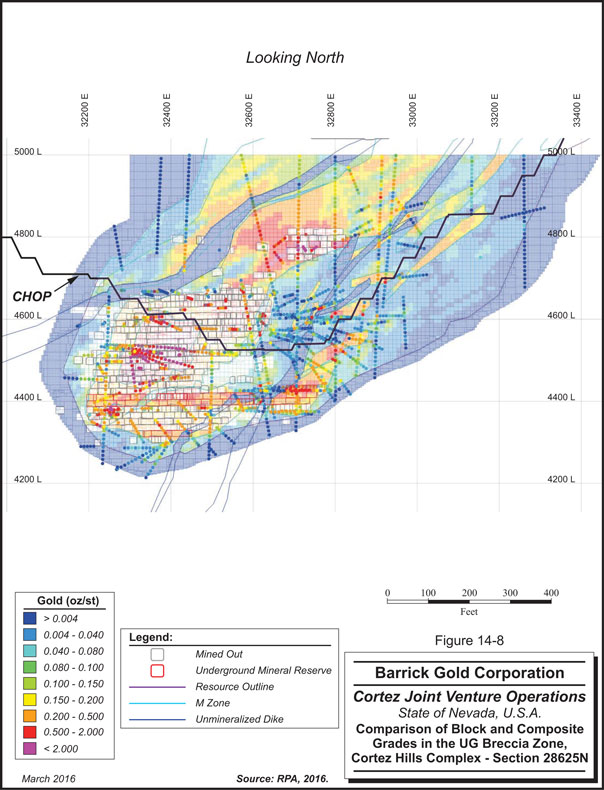
| | |
Barrick Gold Corporation – Cortez Operations, Project 2471 Technical Report NI 43-101 – March 21, 2016 | | Page 14-34 |
| | |
| | www.rpacan.com |
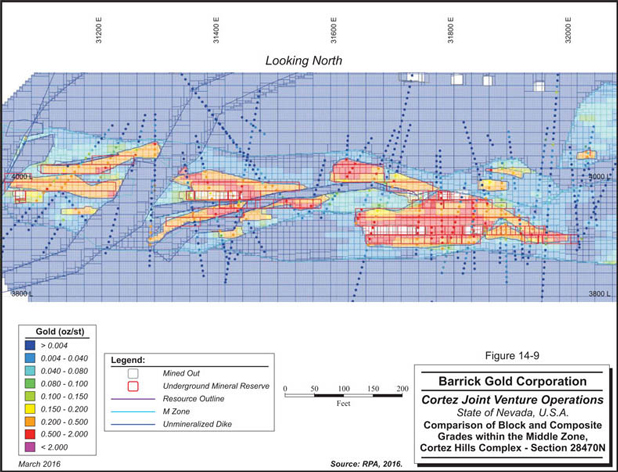
| | |
Barrick Gold Corporation – Cortez Operations, Project 2471 Technical Report NI 43-101 – March 21, 2016 | | Page 14-35 |
| | |
| | www.rpacan.com |
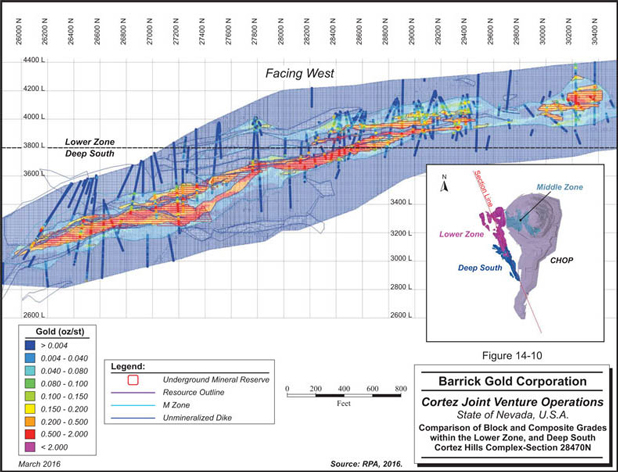
| | |
Barrick Gold Corporation – Cortez Operations, Project 2471 Technical Report NI 43-101 – March 21, 2016 | | Page 14-36 |
| | |
| | www.rpacan.com |
FIGURE 14-11 CHUG LOWER ZONE COMPARISON OF BLOCK AND COMPOSITE MEAN BY MIDDLE ZONE ONE
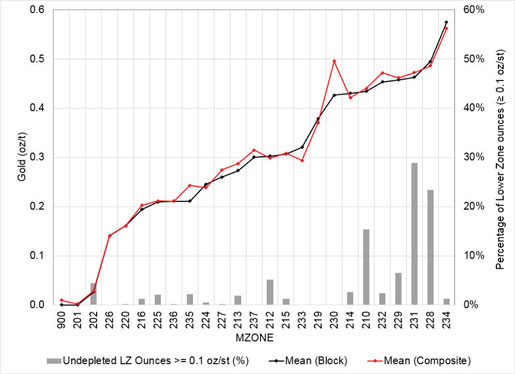
FIGURE 14-12 CHUG MIDDLE ZONE COMPARISON OF BLOCK AND COMPOSITE MEAN BY MIDDLE ZONE ONE
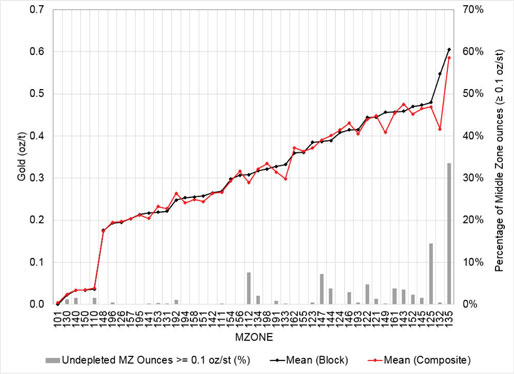
| | |
Barrick Gold Corporation – Cortez Operations, Project 2471 Technical Report NI 43-101 – March 21, 2016 | | Page 14-37 |
| | |
| | www.rpacan.com |
FIGURE 14-13 CHUG BRECCIA ZONE COMPARISON OF BLOCK AND COMPOSITE MEAN BY MIDDLE ZONE ONE
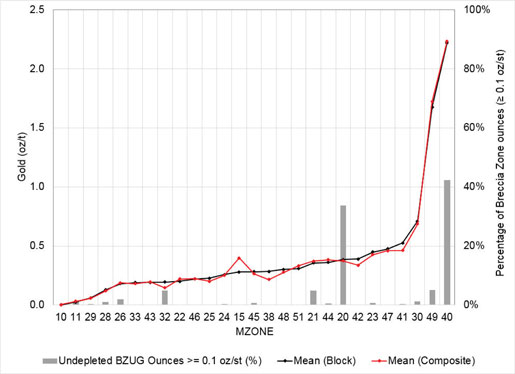
FIGURE 14-14 CHOP BRECCIA ZONE COMPARISON OF BLOCK AND COMPOSITE MEAN BY MIDDLE ZONE ONE
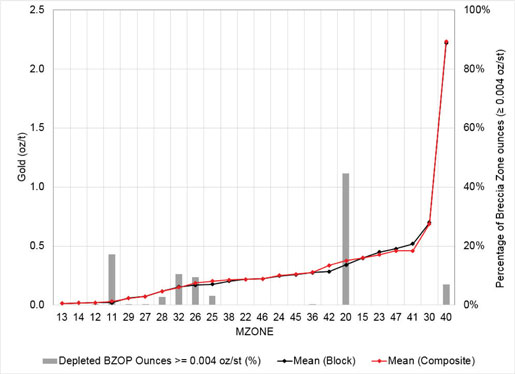
| | |
Barrick Gold Corporation – Cortez Operations, Project 2471 Technical Report NI 43-101 – March 21, 2016 | | Page 14-38 |
| | |
| | www.rpacan.com |
FIGURE 14-15 CHOP PEDIMENT ZONE COMPARISON OF BLOCK AND COMPOSITE MEAN BY MIDDLE ZONE ONE
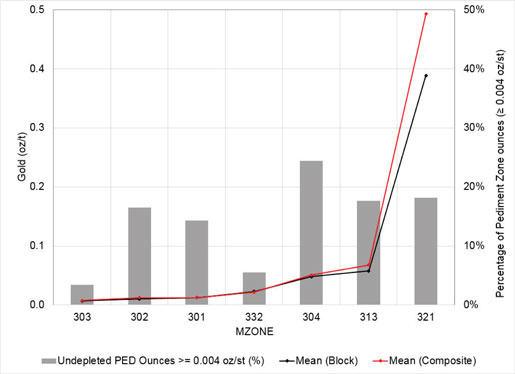
CORTEZ PITS
The Cortez Pits area, one of the Value Realization Initiatives, is located to the north of the current Cortez Hills underground portal and the area was previously mined between 1969 and 1993. There is a remaining resource below the historic Cortez Pits that is a continuation of the mined-out portion of the Cortez deposit. The current reported Measured plus Indicated Mineral Resources total 4.1 Mt at a grade of 0.056 oz/st Au with 227,000 oz of contained gold. Pending the appropriate level of studies to convert the mineralization to Mineral Reserves, mining would be by open pit methods with primarily heap leach processing. A total of 163,000 oz would be expected to be recovered using a process recovery of 74.1%.
There is sufficient drilling information associated with this deposit to model the resource in terms of gold grade, but additional drilling information is required for geotechnical guidance and metallurgical testing. The deposit also allows for resource upgrades at gold prices greater than US$1,400.
| | |
Barrick Gold Corporation – Cortez Operations, Project 2471 Technical Report NI 43-101 – March 21, 2016 | | Page 14-39 |
| | |
| | www.rpacan.com |
As the Cortez Pits Mineral Resources have not been updated since end of year 2012, and represent a very small percentage of the total Mineral Resources at Cortez, the block model was not reviewed by RPA as part of this updated Report. There are no Mineral Reserves at Cortez Pits and only Mineral Resources from the open pit portion of the model have been reported. Cut-off grades for the reported Mineral Resources were established using a gold price of US$1,300 per ounce. Table 14-19 details the Mineral Resources at Cortez Pits.
TABLE 14-19 CORTEZ PITS MINERAL RESOURCE SUMMARY – DECEMBER 31, 2015
Barrick Gold Corporation – Cortez Operations
| | | | | | | | | | | | | | | | | | | | | | | | |
| | | Mill Material | | Leach Material | | Refractory Material | | Total |
| | | Tons | | Grade | | Ounces | | Tons | | Grade | | Ounces | | Tons | | Grade | | Ounces | | Tons | | Grade | | Ounces |
| | | (000 st) | | (oz/st Au) | | (000 oz) | | (000 st) | | (oz/st Au) | | (000 oz) | | (000 st) | | (oz/st Au) | | (000 oz) | | (000 st) | | (oz/st Au) | | (000 oz) |
Measured | | 167 | | 0.121 | | 20 | | 229 | | 0.011 | | 3 | | 76 | | 0.286 | | 22 | | 472 | | 0.094 | | 45 |
Indicated | | 1,020 | | 0.079 | | 80 | | 2,223 | | 0.012 | | 28 | | 368 | | 0.204 | | 75 | | 3,611 | | 0.051 | | 183 |
| | | | | | | | | | | | | | | | | | | | | | | | |
M+I | | 1,187 | | 0.085 | | 100 | | 2,452 | | 0.012 | | 30 | | 444 | | 0.218 | | 97 | | 4,083 | | 0.056 | | 227 |
| | | | | | | | | | | | |
Inferred | | 234 | | 0.06 | | 14 | | 1,043 | | 0.01 | | 13 | | 7 | | 0.08 | | 1 | | 1,283 | | 0.02 | | 27 |
Notes:
| 1. | CIM definitions were followed for Mineral Resources. |
| 2. | Mineral Resources are reported using a gold price of US$1,300 per ounce and gold cut-off grades of 0.030 oz/st and 0.061oz/st for the mill and refractory material, respectively, and a grade range from 0.004 oz/st to 0.030 oz/st for heap leach material. |
| 3. | Bulk densities vary by formation and are listed in Table 14-21. |
| 4. | Mineral Resources are constrained by an optimized pit shell. |
| 5. | Numbers may not add due to rounding. |
The following sections have not been significantly modified from the previous technical report (RPA, 2012).
DATA
Drill hole data in the resource database was limited to valid drill holes within or immediately adjacent to the block model extents. As at July 1, 2011 a total of 450 drill holes for 280,860 ft and 37,415 assays were included in the database. This includes holesre-instated following RPA’s 2010 audit of the deposit which prompted a review of excluded drill holes from 1986 and later by the Mine Technical Group at Cortez to determine their validity for inclusion in the database.
| | |
Barrick Gold Corporation – Cortez Operations, Project 2471 Technical Report NI 43-101 – March 21, 2016 | | Page 14-40 |
| | |
| | www.rpacan.com |
BLOCK MODEL AND MINERALIZED DOMAINS
Wireframe solids and surfaces of rock formations, faults, dikes, overburden, waste dumps, and backfill were constructed from topographic, drill hole and, pit mapping information, as well as interpreted cross-sections.
Approximately 15 wireframe solids of continuous high and low grade mineralization were interpreted through inspection of the drill hole geology and gold grades. High grade domains at depth were based on continuous gold values above a 0.15 oz/st to 0.20 oz/st cut-off grade. At shallower depths, and potentially mineable by open pit, high grade domains were defined based on continuous gold assays greater than 0.030 oz/st. Wireframe solids representing low grade material were built to encompass potential heap-leach material at shallow depths, and to provide dilution grades for mine planning of the higher grade wireframes located within. All the defined high and low grade domains honour the drill data and typically extend only half way to the nearest unmineralized drill hole. A low-grade indicator envelope (0.003 oz/st at a 0.5 probability) was also established to constrain the gold mineralization.
A high resolution, three dimensional block model was constructed using 10 ft x 10 ft x 10 ft blocks to allow use for underground applications and planning.
CAPPING AND COMPOSITING
The capping grades were determined through evaluation of high-grade outliers on cumulative probability plots and histograms constructed for the low and high grade mineralized domains. A capping grade of 1.25 oz/st was applied to raw gold assays inside the high-grade zones and a 0.20 oz/st capping grade was applied to grades outside the high grade domains.
The capped assay values were composited at 10 ft lengths down the hole; a length determined to be appropriate for consideration of underground mining.
GRADE INTERPOLATION
Estimates were made with multiple nested ID3 passes using an octant-based search ellipsoid with a limit of two samples per octant to avoid undue influence from clustered composites. The search ellipse dimensions and distances correspond to ranges at 80% and 100% of variogram sill value, as derived from directional variography. Hard boundaries were applied so that the data used was sourced only from the applicable mineralized solid. The long axis of the search
| | |
Barrick Gold Corporation – Cortez Operations, Project 2471 Technical Report NI 43-101 – March 21, 2016 | | Page 14-41 |
| | |
| | www.rpacan.com |
ellipsoids was suitably oriented to the long axis trend of the individual domains. A number of grade variables were estimated including total gold grade (fire assay, fa) and cyanide leach gold (aa) with the aa/fa ratio used for determining processing options. Table 14-20 summarizes the estimation passes.
TABLE 14-20 CORTEZ PITS - ESTIMATION PASS SUMMARY
Barrick Gold Corporation – Cortez Operations
| | | | | | | | | | | | |
Estimation Pass | | Estimation Flag | | Range (ft) | | Samples
Min/Max/Max per DH | | Purpose |
| | | Major | | Semi-
Major | | Minor | | |
Inside mineralized solids | | | | | | | | | | | | |
1 | | 100 series | | 75 | | 60 | | 30 | | 3/5/2 | | 80% sill |
2 | | 200 series | | 60 | | 40 | | 20 | | 2/5/2 | | filler |
3 | | 300 series | | 130 | | 100 | | 55 | | 1/7/2 | | 100% sill |
Outside mineralized solids | | | | | | | | | | | | |
4 | | 500 | | 15 | | 15 | | 10 | | 1/99/99 | | Proximal to DH |
5 | | 600 | | 130 | | 100 | | 55 | | 1/7/2 | | Distal from DH |
Following interpolation of the gold variables, dike solids were incorporated into the block model with the applicable dilutions of gold grades. The block model was regularized from 10 ft x 10 ft x 10 ft blocks to 30 ft x 30 ft x 20 ft blocks for the portion potentially mineable by open pit.
BULK DENSITY
The rock unit bulk densities for Cortez Pits were updated in 2011 from those used in previous models. Table 14-21 summarizes the bulk densities used for tonnage calculations.
TABLE 14-21 CORTEZ PITS - BULK DENSITY
Barrick Gold Corporation – Cortez Operations
| | | | | | |
Formation/ Rock Type | | Code | | Tonnage Factor
(ft3/st) | | Bulk Density
(st/ft3) |
Roberts Mountain | | SRM | | 13.1 | | 0.076 |
Hansen Creek | | OHC | | 12.2 | | 0.082 |
Eureka Quartzite | | OE | | 12.2 | | 0.082 |
Quaternary Alluvium | | QAL | | 15 | | 0.067 |
Historic Dumps | | | | 18 | | 0.056 |
Dikes | | | | 14.2 | | 0.070 |
| | |
Barrick Gold Corporation – Cortez Operations, Project 2471 Technical Report NI 43-101 – March 21, 2016 | | Page 14-42 |
| | |
| | www.rpacan.com |
CLASSIFICATION
The Measured component of the Mineral Resource is applied to blocks directly intersected by drill holes used for the estimates, essentially a box search. Indicated Mineral Resources are defined as those out to a range at 80% of the sill, and Inferred Mineral Resources at the range of 100% of the variogram sill. Blocks not meeting the above criteria are unclassified. Resulting resources were examined for amenability to development and mining and downgraded where applicable.
MODEL VALIDATION
The Cortez Mine Technical Group undertook validation checks including:
| | • | | Examination of the interpolation scripts and comparison to the interpolation plan |
| | • | | Visual comparisons of interpolated gold grades relative to drill hole composite values on sections and plans |
| | • | | Block model grades were compared to composite grades using histogram and cumulative frequency plots |
| | • | | Comparison of the resource model to a nearest-neighbor (NN) |
The above validation checks supported the conclusions that the block model is globally and locally unbiased, and that there is good agreement between the block and composite gold grades.
GOLD ACRES
As Gold Acres has not been updated since 2008, and represents a very small percentage of the Mineral Resources at Cortez, it was not reviewed by RPA as part of this technical report. There are no Mineral Reserves at Gold Acres and Mineral Resources are limited to refractory ore. Cut-off grades for the reported Mineral Resources were established using a gold price of US$1,300 per ounce. Table 14-22 details the refractory Mineral Resources at Gold Acres.
| | |
Barrick Gold Corporation – Cortez Operations, Project 2471 Technical Report NI 43-101 – March 21, 2016 | | Page 14-43 |
| | |
| | www.rpacan.com |
TABLE 14-22 GOLD ACRES REFRACTORY MINERAL RESOURCE SUMMARY – DECEMBER 31, 2015
Barrick Gold Corporation – Cortez Operations
| | | | | | | | |
| | | | | Tons | | Grade | | Ounces |
| | | | | (000 st) | | (oz/st Au) | | (000 oz) |
Measured | | | | 213 | | 0.124 | | 26 |
Indicated | | | | 3,266 | | 0.104 | | 340 |
| | | | | | | | |
Measured + Indicated | | | | 3,479 | | 0.105 | | 367 |
Inferred | | | | 305 | | 0.103 | | 32 |
Notes:
| 1. | CIM definitions were followed for Mineral Resources. |
| 2. | Mineral Resources are reported using a gold price of US$1,300 per ounce and using a gold cut-off grade of 0.062 oz/st. |
| 3. | Mineral Resources are constrained by an optimized pit shell. |
| 4. | Numbers may not add due to rounding. |
The following sections have not been significantly modified from the previous technical report (RPA, 2012).
DATA
For resource estimation, the drill hole data were limited to holes within or immediately adjacent to the block model extents. A total of 1,725 drill holes for 461,363 ft and 68,702 assays are in the database; the database for Gold Acres has not changed since mid-2008. Holes 4344, 435, 4424, 4425, 4512, 4527, 7404, 89931, and 90816 were excluded. RC holes with potential down-hole contamination remain in the database and their exclusion should be revisited for future models.
CAPPING AND COMPOSITING
Grade distribution statistics show a grade capping level of 0.5 oz/st Au is appropriate. Nine samples were capped in the drill hole database. Capped assays were composited down-hole at 10 ft lengths.
BLOCK MODEL AND MINERALIZED DOMAINS
Geology wireframe surfaces and solids were modelled, however, visual review of the models for the lower skarn, Roberts Mountain Thrust, and Gold Acres Fault suggest that they are not relevant as controls for mineralization. The 2008 resource estimate does not include a
| | |
Barrick Gold Corporation – Cortez Operations, Project 2471 Technical Report NI 43-101 – March 21, 2016 | | Page 14-44 |
| | |
| | www.rpacan.com |
“Carbon” or “Refractory” model since the refractory nature of the deposit could not be predicted geologically or metallurgically at the time.
Three mineralization domains were established based on visual review of the spatial distribution of gold grades by the Mine Technical Group at Cortez.
Domain 1: High grade trending along a fold axis bearing 305°
Domain 2: East dipping mineralization (-15°) bearing 340°
Domain 3: Shallowly dipping mineralization striking 340°, varying in dip direction from eastward in the south, to westward north of section 60250 N
A three-dimensional 20 ft x 20 ft x 10 ft block model was developed over these domains, which were estimated using 10 ft composites. Following grade estimation, the 20 ft x 20 ft x 10 ft blocks were re-blocked up to a 40 ft x 40 ft x 20 ft model to better represent mining on 20 ft benches. The model extends 6,500 ft east, 9,000 ft north, and 1,500 ft vertically, from an origin of 91,000 E, 55,000 N and 4,300 elev. No rotation was applied.
INDICATOR BLOCK MODEL
The composites in the drill hole database were flagged at a gold indicator threshold of 0.015 oz/st Au. The composites were interpolated using orientations in line with the individual domains. Composites within the block model volume defined by the indicator model (greater than or equal to 50% probability of 0.015 oz/st grade) were back flagged in the composite database. Indicator estimation model parameters are listed in Table 14-23.
TABLE 14-23 GOLD ACRES INDICATOR MODEL ESTIMATION PARAMETERS
Barrick Gold Corporation – Cortez Operations
| | | | | | | | | | |
| | | Estimation | | Bearing | | Dip | | Axes (ft) | | No. of Composites
Min./Max./Max. per DH |
Domain 1 | | Indicator 1 | | 305° | | 0° | | 300x300x50 | | 3/15/2 |
Domain 2 | | Indicator 1 | | 340° | | -15° | | 300x300x50 | | 3/15/2 |
Domain 3 | | Indicator 1 | | 160° | | -15° | | 300x300x50 | | 3/15/2 |
GRADE INTERPOLATION
Grade interpolation for Gold Acres was carried out in multiple passes using ID3 inside and outside the indicator model based on parameters shown in Table 14-24. Search ellipse
| | |
Barrick Gold Corporation – Cortez Operations, Project 2471 Technical Report NI 43-101 – March 21, 2016 | | Page 14-45 |
| | |
| | www.rpacan.com |
distances corresponding to 80% and 90% of sill ranges from an omnidirectional correlogram (not shown) defined the second and fourth passes, which were each followed by a pass defined by a smaller search ellipse, and with fewer composite restrictions. Additionally, a nearest neighbour interpolation was performed on gold grades for the purposes of block model validation using a 250 ft x 250 ft x 50 ft search ellipse, estimating 33% of blocks in the model. Mined-out blocks were coded above the topographic surface and waste rock dumps were flagged.
TABLE 14-24 INTERPOLATION PASSES INSIDE AND OUTSIDE THE GOLD ACRES 0.50 INDICATOR MODEL
Barrick Gold Corporation – Cortez Operations
| | | | | | | | | | | | | | |
Estimation | | Azimuth
(°) | | Dip
(°) | | Distance (ft) | | Sample
Min./Max./
Per DH | | Estimated |
| | | | Major
Axis | | Semi-
Major | | Minor
Axis | | |
|
| Inside 0.50 Indicator Model |
11001 | | 0 | | 0 | | 10.1 | | 10.1 | | 5.1 | | 1/9/1 | | 0.4% |
11100 | | 305 | | 0 | | 120 | | 120 | | 30 | | 2/3/1 | | 98.6% |
11131 | | 305 | | 0 | | 50 | | 50 | | 15 | | 1/3/1 | | 4.8% |
11250 | | 305 | | 0 | | 250 | | 250 | | 50 | | 2/3/1 | | 100% |
12100 | | 340 | | -15 | | 120 | | 120 | | 30 | | 2/3/1 | | 59.4% |
12131 | | 340 | | -15 | | 50 | | 50 | | 15 | | 1/3/1 | | 19.1% |
12250 | | 340 | | -15 | | 250 | | 250 | | 50 | | 2/3/1 | | 80.2% |
13100 | | 160 | | -15 | | 120 | | 120 | | 30 | | 2/3/1 | | 54.3% |
13131 | | 160 | | -15 | | 50 | | 50 | | 15 | | 1/3/1 | | 17.4% |
13250 | | 160 | | -15 | | 250 | | 250 | | 50 | | 2/3/1 | | 77.2% |
|
| Outside 0.50 Indicator Model |
21100 | | 305 | | 0 | | 100 | | 100 | | 30 | | 2/3/1 | | 25.2% |
21131 | | 305 | | 0 | | 50 | | 50 | | 15 | | 1/3/1 | | 0.7% |
21250 | | 305 | | 0 | | 250 | | 250 | | 50 | | 2/3/1 | | 8.4% |
22100 | | 340 | | 0 | | -15 | | 100 | | 100 | | 2/3/1 | | 7.9% |
22131 | | 340 | | -15 | | 50 | | 50 | | 15 | | 1/3/1 | | 1.2% |
22250 | | 340 | | -15 | | 250 | | 250 | | 50 | | 2/3/1 | | 10.5% |
23100 | | 160 | | -15 | | 100 | | 100 | | 30 | | 2/3/1 | | 5.4% |
23131 | | 160 | | -15 | | 50 | | 50 | | 15 | | 1/3/1 | | 1.0% |
23250 | | 160 | | -15 | | 250 | | 250 | | 50 | | 2/3/1 | | 8.2% |
BULK DENSITY
Bulk densities are shown in Table 14-25.
| | |
Barrick Gold Corporation – Cortez Operations, Project 2471 Technical Report NI 43-101 – March 21, 2016 | | Page 14-46 |
| | |
| | www.rpacan.com |
TABLE 14-25 GOLD ACRES BULK DENSITY
Barrick Gold Corporation – Cortez Operations
| | | | | | |
Rock Type | | | | Tonnage Factor
(ft3/st) | | Bulk Density
(st/ft3) |
Skarn | | | | 11.49 | | 0.0870 |
Dumps, Backfill | | | | 16.00 | | 0.0625 |
All Other Rocks | | | | 13.00 | | 0.0769 |
CLASSIFICATION
The Measured component of the Mineral Resource is applied to blocks directly intersected by drill holes used for the estimates, essentially a box search. Indicated Mineral Resources are defined as those out to a range at 80% of the sill, and Inferred Mineral Resources at the range of 90% of the variogram sill. Blocks not meeting the above criteria are unclassified. Resulting resources were examined for amenability to development and mining and downgraded where applicable.
MODEL VALIDATION
As part of the 2010 RPA audit, block grades were compared to composites by visual inspection of vertical sections. Gold block grade statistics and distributions were compared to composite grade statistics and distributions for Au greater than or equal to 0.01 oz/st (Table 14-26).
TABLE 14-26 GOLD ACRES UNTRANSFORMED GOLD STATISTICS
Barrick Gold Corporation – Cortez Operations
| | | | | | | | | | | | | | | | | | | | | | |
| | | Gold Cut-off = 0.01 oz/st | | Gold Cut-off = 0.02 oz/st | | Gold Cut-off = 0.03 oz/st | | | | Gold Cut-off = 0.10 oz/st |
| | | (ft) | | Grade
(oz/st Au) | | | | (ft) | | Grade
(oz/st Au) | | | | (ft) | | Grade
(oz/st Au) | | | | (ft) | | Grade
(oz/st Au) |
Blocks - All | | 30,510 | | 0.041 | | | | 20,375 | | 0.055 | | | | 15,194 | | 0.066 | | | | 2,176 | | 0.152 |
Incr. % and grade | | 33.2% | | 0.013 | | | | 17.0% | | 0.024 | | | | 42.7% | | 0.052 | | | | 7.1% | | 0.152 |
Comps | | 95,941 | | 0.049 | | | | 65,057 | | 0.067 | | | | 48,422 | | 0.081 | | | | 11,692 | | 0.169 |
Incr. % and grade | | 32.2% | | 0.013 | | | | 17.3% | | 0.024 | | | | 38.3% | | 0.053 | | | | 12.2% | | 0.169 |
| | |
Barrick Gold Corporation – Cortez Operations, Project 2471 Technical Report NI 43-101 – March 21, 2016 | | Page 14-47 |
| | |
| | www.rpacan.com |
15 MINERAL RESERVE ESTIMATE
SUMMARY
The Mineral Reserves are contained within four open pit deposits, four underground zones in the Cortez Hills deposit, and surface stockpiles. Proven and Probable Mineral Reserves for the Mine as at year-end 2015 are estimated to be 168.9 Mt grading 0.066 oz/st Au containing approximately 11.1 million oz Au. In the Deep South Zone, the PFS supports the conversion of approximately 1.7 million oz of Measured and Indicated Mineral Resources to Proven and Probable Mineral Reserves as at year-end 2015. The Mineral Reserve estimate for Cortez as at December 31, 2015 is summarized in Table 15-1.
Open pit Mineral Reserves represent approximately 90% of the total tons and 56% of the total ounces of contained gold. Current open pit mine life is eight years (2016 to 2023). Underground Mineral Reserves represent approximately 8% of the total tons and 40% of the total ounces of contained gold. Current underground mine life, including the Cortez Underground Expansion Project, is 13 years (2016 to 2028).
RPA is of the opinion that the December 31, 2015 Mineral Reserves as stated by Cortez are estimated by competent professionals in a manner consistent with industry practices.
| | |
Barrick Gold Corporation – Cortez Operations, Project 2471 Technical Report NI 43-101 – March 21, 2016 | | Page 15-1 |
| | |
| | www.rpacan.com |
TABLE 15-1 TOTAL MINERAL RESERVES – DECEMBER 31, 2015
Barrick Gold Corporation – Cortez Operations
| | | | | | | | | | | | | | | | | | | | | | | | | | | | | | | | | | | | | | | | |
| | | Total Proven | | | | | Total Probable | | | | | Total Proven + Probable | |
Zone | | Tons
(000 st) | | | Grade
(oz/st
Au) | | | Contained
Gold
(000 oz) | | | | | Tons
(000) | | | Grade
(oz/st
Au) | | | Contained
Gold
(000 oz) | | | | | Tons
(000 st) | | | Grade
(oz/st
Au) | | | Contained
Gold
(000 oz) | |
Open Pit | | | | | | | | | | | | | | | | | | | | | | | | | | | | | | | | | | | | | | | | |
Pipeline | | | 1,470 | | | | 0.019 | | | | 28 | | | | | | 15,985 | | | | 0.017 | | | | 266 | | | | | | 17,455 | | | | 0.017 | | | | 294 | |
Crossroads | | | 8,135 | | | | 0.035 | | | | 287 | | | | | | 86,613 | | | | 0.033 | | | | 2,880 | | | | | | 94,749 | | | | 0.033 | | | | 3,167 | |
Cortez Hills | | | 1,564 | | | | 0.127 | | | | 198 | | | | | | 17,145 | | | | 0.116 | | | | 1,984 | | | | | | 18,709 | | | | 0.117 | | | | 2,182 | |
Pediment | | | 762 | | | | 0.032 | | | | 24 | | | | | | 20,506 | | | | 0.027 | | | | 547 | | | | | | 21,268 | | | | 0.027 | | | | 571 | |
Open Pit Subtotals | | | 11,931 | | | | 0.045 | | | | 537 | | | | | | 140,249 | | | | 0.040 | | | | 5,677 | | | | | | 152,181 | | | | 0.041 | | | | 6,214 | |
Underground | | | | | | | | | | | | | | | | | | | | | | | | | | | | | | | | | | | | | | | | |
Breccia Zone | | | 120 | | | | 0.514 | | | | 62 | | | | | | 205 | | | | 0.486 | | | | 100 | | | | | | 324 | | | | 0.497 | | | | 161 | |
Middle Zone | | | | | | | | | | | | | | | | | 3.544 | | | | 0.365 | | | | 1,292 | | | | | | 3,544 | | | | 0.365 | | | | 1,292 | |
Lower Zone | | | | | | | | | | | | | | | | | 3.777 | | | | 0.351 | | | | 1,324 | | | | | | 3,777 | | | | 0.351 | | | | 1,324 | |
Deep South | | | | | | | | | | | | | | | | | 5.266 | | | | 0.322 | | | | 1,697 | | | | | | 5,266 | | | | 0.322 | | | | 1,698 | |
Underground Subtotals | | | 120 | | | | 0.514 | | | | 62 | | | | | | 12,792 | | | | 0.345 | | | | 4,414 | | | | | | 12,912 | | | | 0.347 | | | | 4,476 | |
Stockpiles | | | | | | | | | | | | | | | | | | | | | | | | | | | | | | | | | | | | | | | | |
Mill Stockpiles | | | 1,510 | | | | 0.096 | | | | 145 | | | | | | | | | | | | | | | | | | | | | | | | | | | | | |
Leach Stockpiles | | | 57 | | | | 0.014 | | | | 1 | | | | | | | | | | | | | | | | | | | | | | | | | | | | | |
Refractory Stockpiles | | | 2,248 | | | | 0.130 | | | | 293 | | | | | | | | | | | | | | | | | | | | | | | | | | | | | |
Stockpile Subtotals | | | 3,814 | | | | 0.115 | | | | 438 | | | | | | | | | | | | | | | | | | | | 3,814 | | | | 0.115 | | | | 438 | |
Total | | | 15,866 | | | | 0.065 | | | | 1,037 | | | | | | 153,042 | | | | 0.066 | | | | 10,092 | | | | | | 168,908 | | | | 0.066 | | | | 11,129 | |
Notes:
| 1. | CIM definitions were followed for Mineral Reserves. |
| 2. | Mineral Reserves are estimated at cut-off grades that range from 0.004 oz/st Au to 0.205 oz/st Au depending on deposit, mining method, and process type. |
| 3. | Mineral Reserves are estimated using an average gold price of US$1,000 per ounce to year 2020 and US$ 1,200 per ounce thereafter. |
| 4. | A minimum mining width of 15 ft was used. |
| 5. | Bulk density varies from 0.052 st/ft3 to 0.091 st/ft3, depending on material type. |
| 6. | Numbers may not add due to rounding. |
| | |
Barrick Gold Corporation – Cortez Joint Venture, Project 2471 Technical Report NI 43-101 – March 21, 2016 | | Page 15-2 |
| | |
| | www.rpacan.com |
There are two principal locations of the Cortez mineral deposits, Pipeline and Cortez Hills. Pipeline and Crossroads are located on the valley floor approximately seven miles to the northwest of the Cortez Hills/Pediment deposit, which is located on the southern flank of Mount Tenabo. The location of the deposits is shown in Figure 15-1.
The Pipeline pit is nearly completed and previously produced in excess of one million ounces of gold per year for more than seven years. The pit is currently inactive, however, there is pre-stripping occurring in the Crossroads area in 2015. The Phase 10 area of the pit was actively mined in 2015, and this area will be mined in five phases. Portions of the Pipeline pit have been backfilled with mine waste.
The Crossroads pit is located immediately south of the Pipeline pit and stripping is planned to continue in 2016. The planned pit will be up to 1,700 ft deep, and there is extensive alluvium cover, which is 500 ft to 800 ft thick. Crossroads was designed with five phases.
The Cortez Hills deposit is located approximately seven miles to the southeast of the Pipeline pit on the southern flank of Mount Tenabo. Open pit operations commenced at CHOP at the start of 2009, and mining has progressed at a rapid pace. The shops and office facilities, gyratory crusher, 37,000 ft long conveyor from the gyratory crusher to the Mill No. 2 at Pipeline, and the assorted roads and other infrastructure are all in place and operating efficiently. There is one phase of mining left at CHOP.
CHUG is the portion of the Cortez Hills deposit, which is being extracted by underground mining. There are twin declines to the Breccia Zone and production is underway using the mechanized underhand cut and fill mining method with a cemented rock fill (CRF). The underground mine has exploited the part of the Breccia Zone that could not be mined by open pit. Mining is underway in the Middle and Lower Zones above the 3,800 ft level. With the approval of the third proposed amendment (APO3) to the Plan of Operations (PoO) in September 2015, development of the Range Front Declines (RFDs) to access the Lower Zone can commence.
| | |
Barrick Gold Corporation – Cortez Operations, Project 2471 Technical Report NI 43-101 – March 21, 2016 | | Page 15-3 |
| | |
| | www.rpacan.com |
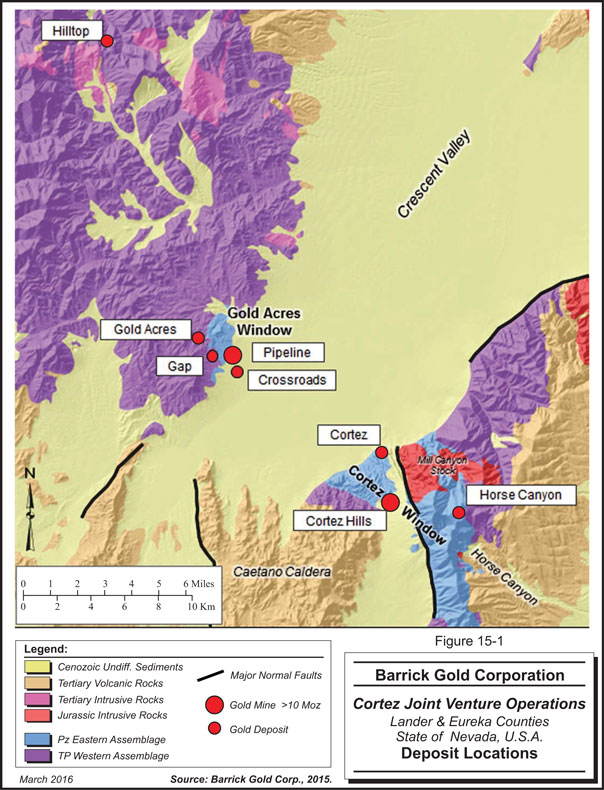
| | |
Barrick Gold Corporation – Cortez Operations, Project 2471 Technical Report NI 43-101 – March 21, 2016 | | Page 15-4 |
| | |
| | www.rpacan.com |
The Deep South Zone is an extension of the Lower Zone below the 3,800 ft level. The Mineral Reserves in this area have been confirmed by a positive PFS. Dewatering and development below the 3,800 ft level will require an amendment to the PoO. The permitting is expected to take three to four years. This permit amendment application is planned to be submitted in 2016. On this basis, following the receipt of permits, dewatering and development work could begin as early as 2019 or 2020, with initial production from the Deep South Zone commencing in 2022 or 2023. The expansion of the underground mine will help to offset the impact of the end of mining in the Cortez Hills open pit, which is expected to conclude in 2018. RPA is of the opinion that there is a reasonable expectation that the permit amendment will be obtained.
The proportion of the total reserve in each of the mineral deposits is shown in Table 15-2. While the Pipeline Complex (Pipeline and Crossroads) has the larger tonnage, the bulk of the gold is in the Cortez Hills deposits.
TABLE 15-2 PROPORTION OF RESERVES BY DEPOSIT
Barrick Gold Corporation – Cortez Operations
| | | | | | | | |
| | | % of Total | | | % of Total | |
Area/Zone | | Mined Tons | | | Mined Ounces | |
Pipeline | | | 10 | % | | | 3 | % |
Crossroads | | | 56 | % | | | 28 | % |
Cortez Hills | | | 11 | % | | | 20 | % |
Pediment | | | 13 | % | | | 5 | % |
Open Pit Subtotals | | | 90 | % | | | 56 | % |
Breccia Zone | | | 0 | % | | | 1 | % |
Middle Zone | | | 2 | % | | | 12 | % |
Lower Zone | | | 2 | % | | | 12 | % |
Deep South Zone | | | 3 | % | | | 15 | % |
Underground Subtotals | | | 8 | % | | | 40 | % |
Mill Stockpiles | | | 1 | % | | | 1 | % |
Leach Stockpiles | | | 0 | % | | | 0 | % |
Refractory Stockpiles | | | 1 | % | | | 3 | % |
Stockpile Subtotals | | | 2 | % | | | 4 | % |
Within the Mineral Reserves, there are four processing classifications. Ore is segregated into one of the following processing methods:
| | • | | Refractory – CaTs Process (also referred to as rf3); |
| | |
Barrick Gold Corporation – Cortez Operations, Project 2471 Technical Report NI 43-101 – March 21, 2016 | | Page 15-5 |
| | |
| | www.rpacan.com |
| | • | | Refractory – Roaster (also referred to as rf2); |
The five processing options are the oxide mill at Pipeline, heap leaching on any one of a number of heap leach pads at Cortez (Cortez Hills/Pediment or Pipeline/Crossroads), and refractory ore treatment processes located at the Barrick Gold’s Goldstrike operation. The planned processing option as a proportion of the Mineral Reserve tons and contained gold is summarized in Table 15-3.
TABLE 15-3 PROCESSING AS PERCENT OF TOTAL TONS/OUNCES
Barrick Gold Corporation – Cortez Operations
| | | | | | | | | | | | | | | | | | | | | | | | |
| | | Mill | | | Leach | | | Refractory | |
Area/Zone | | % of tons | | | % of oz | | | % of tons | | | % of oz | | | % of tons | | | % of oz | |
Pipeline | | | 1 | | | | 1 | | | | 9 | | | | 1 | | | | 0 | | | | 0 | |
Crossroads | | | 13 | | | | 14 | | | | 40 | | | | 7 | | | | 3 | | | | 7 | |
Cortez Hills | | | 5 | | | | 13 | | | | 4 | | | | 1 | | | | 2 | | | | 6 | |
Pediment | | | 5 | | | | 4 | | | | 8 | | | | 2 | | | | 0 | | | | 0 | |
Open Pit Subtotals | | | 23 | | | | 31 | | | | 61 | | | | 11 | | | | 5 | | | | 13 | |
Breccia Zone | | | 0 | | | | 1 | | | | 0 | | | | 0 | | | | 0 | | | | 0 | |
Middle Zone | | | 1 | | | | 3 | | | | 0 | | | | 0 | | | | 1 | | | | 8 | |
Lower Zone | | | 1 | | | | 3 | | | | 0 | | | | 0 | | | | 2 | | | | 9 | |
Deep South Zone | | | 3 | | | | 14 | | | | 0 | | | | 0 | | | | 0 | | | | 1 | |
Underground Subtotals | | | 4 | | | | 21 | | | | 0 | | | | 0 | | | | 3 | | | | 19 | |
Mill Stockpiles | | | 1 | | | | 1 | | | | 0 | | | | 0 | | | | 1 | | | | 3 | |
Leach Stockpiles | | | 0 | | | | 0 | | | | 0 | | | | 0 | | | | 1 | | | | 3 | |
Refractory Stockpiles | | | 0 | | | | 0 | | | | 0 | | | | 11 | | | | 0 | | | | 35 | |
Stockpile Subtotals | | | 1 | | | | 1 | | | | 0 | | | | 11 | | | | 3 | | | | 40 | |
Total | | | 29 | | | | 54 | | | | 61 | | | | 11 | | | | 10 | | | | 35 | |
In the 2015 estimate, there was a redesign of the Cortez Hills Breccia Zone with some of the reserves assigned for underground extraction, and removed from the open pit reserve from 2014. In addition, the Pipeline/Crossroads pit areas were redesigned based on lower operating costs.
OPEN PIT MINERAL RESERVES
The Cortez open pit Mineral Reserves consist of the CHOP, composed of Cortez Hills and Pediment, and the Pipeline, composed of Pipeline and Crossroads. The Mineral Resources within the Cortez Pits and Gold Acres are also planned for open pit mining. Yearly pit designs with corresponding excavation schedules have been developed for both the CHOP and Pipeline pit areas.
| | |
Barrick Gold Corporation – Cortez Operations, Project 2471 Technical Report NI 43-101 – March 21, 2016 | | Page 15-6 |
| | |
| | www.rpacan.com |
OPEN PIT MINE DESIGN
CORTEZ HILLS AND PEDIMENT
Open pit mining is active on the upper portion of the Cortez Hills and Pediment deposits. A four-stage pit was planned for Cortez Hills and a two-stage pit for Pediment. The pits have a shared high wall between the larger and deeper Cortez Hills pit and the Pediment pit. Approximately 71 Mst of pre-stripping occurred during the plant construction period prior to full mining commencement. The CHOP production schedule was initially impacted by delays in permit approvals, and also in 2011, by concerns related to the stability of part of the Phase 3 high wall. These changes have led to uneven ore and waste production, and the required stockpiling of ore when it was available in the mine, however, the mining rate has regularly exceeded the processing capacity. Currently, the open pit mining operations are balanced, and the mine is operating within its targets. Daily mine production rates for the LOM are planned at 300,000 stpd to 500,000 stpd; with an overall average of 400,000 stpd.
The long axis length of the Cortez Hills and Pediment pit is approximately 8,400 ft, and the minor axis width is approximately 5,600 ft. The estimated pit bottom elevation is 4,640 ft amsl. The two, primary pit exits are 5,950 ft amsl and 5,720 ft amsl, respectively.
Typical road widths are 120 ft to the 4820 bench, and from the 4820 bench to the 4640 bench, the haul road narrows to approximately 70 ft to 80 ft wide. Road grades average 10%. Single benching is normal with berm widths that range from 24.5 ft to 36.4 ft. Bench heights are 50 ft. An approximate 100 ft wide catch bench is included for every 420 ft of vertical extent. The in-pit Cortez Hills haul road is approximately 12,500 ft long, and the Pediment in-pit haul road is approximately 6,300 ft long.
The Cortez Hills and Pediment pit areas are shown in Figure 15-2. Figure 15-3 is an isometric view of the Cortez Hills pits, waste dumps, and heap leach processing areas.
All mine material is drilled and blasted. Oxide ore is transported to Mill No. 2 via the 37,000-ft long overland conveyor. A gyratory primary crushing system was constructed at Cortez Hills to reduce maximum rock size prior to conveyance. Mill ore is staged into various grade-based stockpiles at the primary crusher. Materials from these stockpiles are blended into the crusher to meet specific short-term production targets. Refractory ore is shipped by truck to Goldstrike to be processed.
| | |
Barrick Gold Corporation – Cortez Operations, Project 2471 Technical Report NI 43-101 – March 21, 2016 | | Page 15-7 |
| | |
| | www.rpacan.com |
A 100 Mst capacity heap leach facility was constructed south of the Pediment pit to treat low-grade oxide mineralization. This low-grade material is not crushed, but is truck dumped ROM ore. The pad is expected to be approximately 13 million ft2 in final area at the end of the third phase of construction. All leach material is planned to be placed directly on the leach pad.
The carbon absorption plant comprises three trains of carbon columns. Loaded carbon is transported to the Pipeline mill for stripping and gold recovery. Regenerated carbon is returned to the Pediment plant.
Two main waste dumps are utilized. This includes the construction of the North Waste Rock Facility, as well as the expansion of the current Canyon dump. No acid rock drainage is expected from material mined from the Cortez Hills complex.
Because of geotechnical and permitting constraints on the open pit and surface/underground trade-off costing a significant portion of the high grade at Cortez Hills is not amenable to surface mining. The upper portions of the high grade Breccia Zone are being mined from underground.
| | |
Barrick Gold Corporation – Cortez Operations, Project 2471 Technical Report NI 43-101 – March 21, 2016 | | Page 15-8 |
| | |
| | www.rpacan.com |
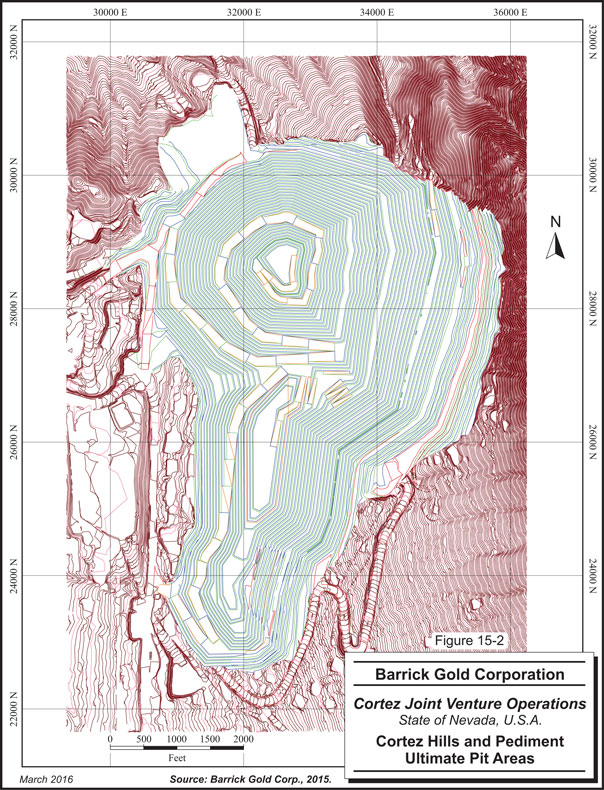
| | |
Barrick Gold Corporation – Cortez Operations, Project 2471 Technical Report NI 43-101 – March 21, 2016 | | Page 15-9 |
| | |
| | www.rpacan.com |
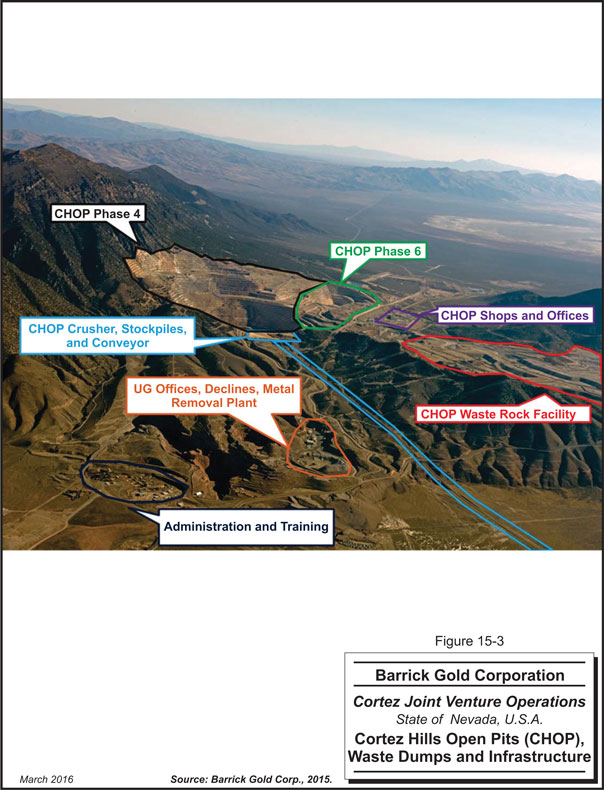
| | |
Barrick Gold Corporation – Cortez Operations, Project 2471 Technical Report NI 43-101 – March 21, 2016 | | Page 15-10 |
| | |
| | www.rpacan.com |
PIPELINE AND CROSSROADS
Barrick plans to operate the Pipeline and Crossroads open pits by using conventional open pit mining techniques. The area has been mined since 1997 in staged development phases (Pipeline and Gap). The next planned mining area will be waste stripping for the Crossroads area.
The long axis length of the Pipeline and Crossroads pits are approximately 12,700 ft, and the minor axis width is approximately 8,100 ft. The estimated pit bottom elevation is 3240 ft amsl. The two, primary pit exits are 4,840 ft amsl and 4,920 ft amsl, respectively. The current Crossroads pit design is a circular shape in plan, with a diameter of about 3,300 ft; a pit floor elevation at 3,240 ft; and overall wall heights between 1,235 ft to 1,300 ft. These heights are based on mining the waste dump in the north/northeast wall areas out, and pushing the toe of this dump well behind the pit crest. The upper walls in Crossroads will be developed in alluvium, and the lower walls in bedrock, with the alluvium exposure increasing from about 350 feet on the west side of the pit, to about 800 feet on the east side. Corresponding elevations for the alluvium/bedrock contact are about 4,520 ft along the west wall, and 4,120 ft along the east wall.
Typical road widths are 120 ft to the 3600 bench, and from the 3600 bench to the 3240 bench, the haul road narrows to approximately 70 ft wide. Road grades average 10%. Single benching is normal with berm widths that range from 25 ft to 27 ft. Bench heights are 40 ft. An approximate 100 ft wide catch bench is design every 420 ft of vertical. The in-pit Crossroads haul road is approximately 18,600 ft long, and the Pipeline in-pit haul road is approximately 14,100 ft long.
The Pipeline and Crossroads ultimate pit areas is shown in Figure 15-4. The Pipeline Complex and the approximate phases are shown in Figure 15-5.
| | |
Barrick Gold Corporation – Cortez Operations, Project 2471 Technical Report NI 43-101 – March 21, 2016 | | Page 15-11 |
| | |
| | www.rpacan.com |
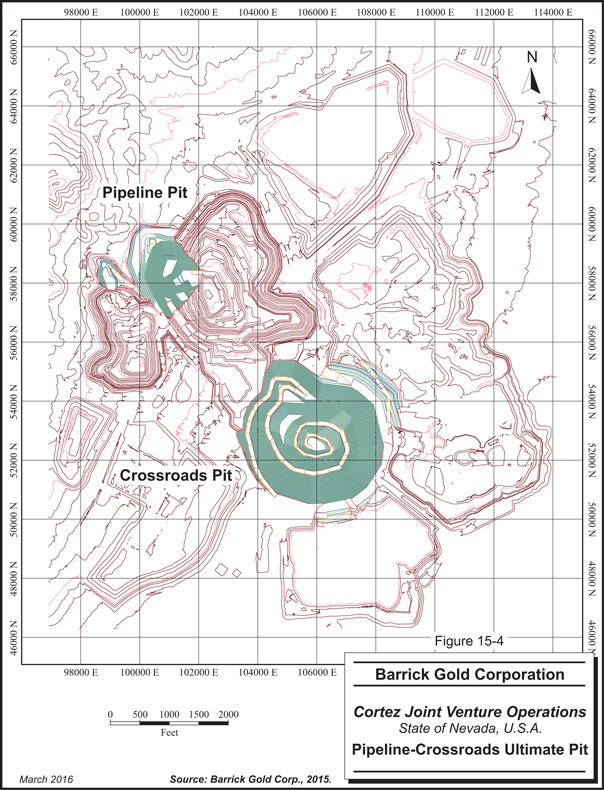
| | |
Barrick Gold Corporation – Cortez Operations, Project 2471 Technical Report NI 43-101 – March 21, 2016 | | Page 15-12 |
| | |
| | www.rpacan.com |
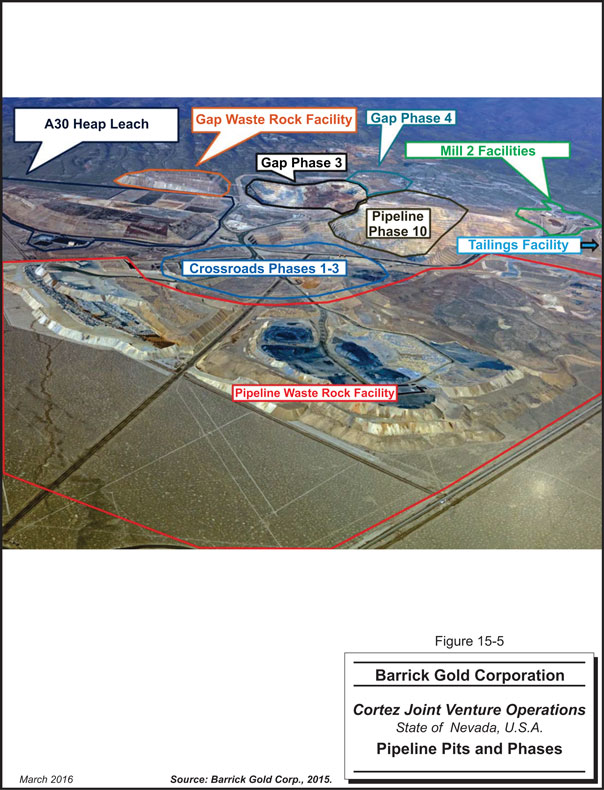
| | |
Barrick Gold Corporation – Cortez Operations, Project 2471 Technical Report NI 43-101 – March 21, 2016 | | Page 15-13 |
| | |
| | www.rpacan.com |
Mining is accomplished with a typical drill, blast, load, and haul cycle, using conventional truck-and-shovel equipment. The bulk of the mining equipment used by Barrick was purchased in 1996 for use in mining the Pipeline and South Pipeline deposits. An additional shovel, additional trucks, and support equipment were purchased in late 2004 and early 2005 to facilitate the mining of Phases 8 and 9. Further haul truck fleet replacements and increases occurred in 2014. Another shovel was purchased and put into production in Q1 of 2013.
All leach material is placed directly on the leach pad. A small portion of the mill ore is stockpiled to ensure consistent crusher feed. Refractory ore is also stockpiled, and shipped Goldstrike for processing. The waste is hauled and placed in permanent waste dumps.
OPEN PIT CUT-OFF GRADE
A cut-off grade estimation report was compiled for the end-of-year (EOY) 2015 Mineral Reserve estimates. The report covers:
| | • | | The gold price $1,000/oz for EOY2015. |
| | • | | The applicable Cortez Mine royalty payments. |
| | • | | The process operating costs and on-site (and off-site) metal recoveries by material type, applicable or selected process method, and orebody. |
Gold prices assumptions are dictated by the corporate office. Royalties at Cortez vary by area, metal price, and processing type. The various royalties cover different areas, which are described internally as royalty areas to assess Mineral Reserves for each area. Certain royalties are held by subsidiaries of Barrick, and these royalties are excluded from consideration in the cut-off grade estimation. The royalty is estimated for each of five different areas, and a realized gold price net of the royalty is estimated for use in the cut-off grade calculation.
A set of process and overhead costs for the various processing options were estimated by the process manager together with a set of six recovery equations relating process recovery to head grade. Cut-off grades (COG) do not include mining costs, unless there is a marginal cost for ore compared to waste in a given pit. Cut-off grades consider the general and administration (G&A) costs as part of the process cost. Since 0.002 to 0.004 oz/st is the lowest detectable range in the assay lab, the heap leach COG of 0.004 oz/st, for practical purposes, was set to 0.004 oz/st. In addition, previous heap leach COG calculations stated 0.004 oz/st
| | |
Barrick Gold Corporation – Cortez Operations, Project 2471 Technical Report NI 43-101 – March 21, 2016 | | Page 15-14 |
| | |
| | www.rpacan.com |
as the breakeven cut-off grade input (BCOGinpit), and the plans for permitting and expanding heap leach facilities were based on this higher COG. If lowering the COG to 0.003 oz/st requires additional permitting or expansions to either facility, then this material will likely become uneconomic to process, and will be routed as waste.
The leach cut-off grades including G&A are shown in Table 15-4 for the various deposits at a gold price of $1,000/oz. The annual, Cortez open pit cut-off grade report includes the cut-off grade estimates that range from $900/oz to $1,400/oz gold prices.
TABLE 15-4 OPEN PIT LEACH CUT-OFF GRADES
Barrick Gold Corporation-Cortez Operations
| | | | | | | | | | | | | | |
| | | | | | | Proc. Cost | | G&A Cost | | Royalty | | Approximate Recovery | | Cut-off Grade |
Deposit | | | | Royalty Region | | ($/st) | | ($/st) | | (%) | | (%) | | (oz/st Au) |
Cortez Hills | | | | 1 | | 1.45 | | 0.81 | | 0.93% | | 80% | | 0.004 |
Pediment | | | | 1 | | 1.45 | | 0.81 | | 0.93% | | 70% | | 0.004 |
Pipeline Phase 10 | | | | 1 | | 1.65 | | 0.81 | | 0.93% | | 75% | | 0.004 |
| | | | 2 | | 1.65 | | 0.81 | | 0.93% | | 62% | | 0.004 |
| | | | 3 | | 1.65 | | 0.81 | | 10.47% | | 62% | | 0.004 |
| | | | 4 | | 1.65 | | 0.81 | | 6.22% | | 62% | | 0.004 |
Crossroads | | | | 2 | | 1.65 | | 0.81 | | 10.47% | | 62% | | 0.004 |
| | | | 4 | | 1.65 | | 0.81 | | 10.47% | | 62% | | 0.004 |
| | | | 5 | | 1.65 | | 0.81 | | 10.47% | | 62% | | 0.004 |
Note: Gold Price used $1,000/oz Au.
For the mill cut-off grade, Cortez applies a base case cut-off grade including G&A costs. Open pit cut-off grades were held constant at 0.030 oz/st Au for reserve reporting. The cut-off grade estimates are shown in Table 15-5.
| | |
Barrick Gold Corporation – Cortez Operations, Project 2471 Technical Report NI 43-101 – March 21, 2016 | | Page 15-15 |
| | |
| | www.rpacan.com |
TABLE 15-5 OPEN PIT MILL CUT-OFF GRADES
Barrick Gold Corporation-Cortez Operations
| | | | | | | | | | | | | | |
| | | | | | | Proc. Cost | | G&A Cost | | Royalty | | Approximate
Recovery | | Cut-off Grade |
Deposit | | | | Royalty Region | | ($/st) | | ($/st) | | (%) | | (%) | | (oz/st Au) |
Cortez Hills | | | | 1 | | 11.17 | | 6.08 | | 0.9% | | 81% | | 0.030 |
Pediment | | | | 1 | | 11.17 | | 6.08 | | 0.9% | | 81% | | 0.030 |
Pipeline Phase 10 | | | | 1 | | 11.17 | | 6.08 | | 0.9% | | 81% | | 0.030 |
| | | 2 | | 11.17 | | 6.08 | | 0.9% | | 74% | | 0.030 |
| | | 3 | | 11.17 | | 6.08 | | 10.5% | | 74% | | 0.030 |
| | | 4 | | 11.17 | | 6.08 | | 6.2% | | 74% | | 0.030 |
Crossroads | | | | 2 | | 11.17 | | 6.08 | | 10.5% | | 74% | | 0.030 |
| | | 4 | | 11.17 | | 6.08 | | 10.5% | | 88% | | 0.030 |
| | | 5 | | 11.17 | | 6.08 | | 10.5% | | 88% | | 0.030 |
Note: Gold Price used $1,000/oz Au.
The recovery equations used in the cut-off grade calculation in Table 15-5 have been developed by the site personnel and are outlined below.
| | | | |
Equation Number | | HG, oz/st | | Oxide Mill Recovery Equation |
| Cortez Hills Open Pit | | >0.920 | | %Rec = 95.66 - 2.4 |
| | >0.150 | | %Rec = [100 x HG - 1.3 x LN(HG)-4.1] / HG - 2.4 |
| | <=0.150 | | %Rec = (18 x HG) + 86.4 – 5.9 |
| Cortez Pits | | Option 1 | | % Rec = 89.0% |
| | | Option 2 | | %Rec = 8.36 x HG – 9.78 x AAFA + 96.4% |
Pipeline/ South Pipeline/ South Gap | | > 0.207 | | %Rec = 88.1 – 8.3 |
| | <= 0.207 | | %Rec = 85.11 x EXP(0.36 x HG) – 11.9 |
| Crossroads | | | | %Rec = 88.0 |
The roaster cut-off grades are estimated in the same manner as the other cut-off grades. The cut-off grades with and without the mining costs are approximately equal to the high-grade and low-grade refractory ore stockpile cut-off grades. The cut-off grade estimates are shown in Table 15-6.
| | |
Barrick Gold Corporation – Cortez Operations, Project 2471 Technical Report NI 43-101 – March 21, 2016 | | Page 15-16 |
| | |
| | www.rpacan.com |
TABLE 15-6 OPEN PIT REFRACTORY CUT-OFF GRADES
Barrick Gold Corporation-Cortez Operations
| | | | | | | | | | | | |
| | | Royalty | | Proc. Cost | | G&A Cost | | Royalty | | Approximate Recovery | | Cut-off Grade |
Deposit | | Region | | ($/st) | | ($/st) | | (%) | | (%) | | (oz/st Au) |
Cortez Hills | | 1 | | 45.03 | | 10.29 | | 0.9% | | 74% | | 0.075 |
Pediment | | | | 45.03 | | 10.29 | | 0.9% | | 74% | | 0.075 |
| | 1 | | 46.68 | | 10.29 | | 0.9% | | 75% | | 0.080 |
| | 2 | | 46.68 | | 10.29 | | 10.5% | | 76% | | 0.080 |
Pipeline Phase 10 | | 3 | | 46.68 | | 10.29 | | 6.2% | | 76% | | 0.080 |
| | 4 | | 46.68 | | 10.29 | | 10.5% | | 76% | | 0.080 |
| | 5 | | 46.68 | | 10.29 | | 9.4% | | 76% | | 0.083 |
| | 2 | | 46.68 | | 10.29 | | 10.5% | | 76% | | 0.083 |
Crossroads | | 4 | | 46.68 | | 10.29 | | 10.5% | | 76% | | 0.083 |
| | 5 | | 46.68 | | 10.29 | | 9.4% | | 76% | | 0.083 |
Note: Gold Price used $1,000/oz Au.
The recovery equations used in the cut-off grade calculation in Table 15-6 have been developed by the site personnel based on operational and verified with extensive metallurgical test, and are outlined below.
Gold Recovery Equations (Alkaline Autoclave/TCM Leach)
| | • | | Recovery = 95.0% - 6.86 -1.5 + 1.95 = 88.59 |
If Au Grade >0.28 &£ 1.3
| | • | | Recovery = 6.4334(HG)3 – 23.02(HG)2 + 28.56(HG) + 82.247 – 6.86 - 1.5 + 1.95 |
If Au Grade£ 0.28
| | • | | Recovery = 661.36(HG)3 – 628.91(HG)2 + 208.23(HG) + 65.114 – 6.86 – 1.5 + 1.95 |
Gold Recovery Equations (Roaster)
| | | | | | |
Ore Type | | HG, oz/st | | Roaster Recovery Equation | | Equation Reference |
Roaster | | > 1.150 | | %Rec = 93.07% | | |
| | > 0.250 | | %Rec = 3.1719 x LN (HG) + 92.612 | | |
| | > 0.125 | | %Rec = 71.836 + 40.456 x HG – 0.009 x 730 x 0.151 x 85 | | |
| | <= 0.125 | | %Rec = -1017.2 x (HG)^2 + 377.14 x HG + 51.909 | | Goldstrike 2015 |
| RF1 Discount | | | | Recovery Discount of 1.5% for Arsenic Impacts | | Met. Guidelines |
In the case where the mine delivery of mill ore exceeds the mill capacity, there is a cut over or cross over grade to dictate which material that exceeds the normal mill cut-off grade should go to the leach pad instead of the mill. The cut-off grade estimates are shown in Table 15-7.
| | |
Barrick Gold Corporation – Cortez Operations, Project 2471 Technical Report NI 43-101 – March 21, 2016 | | Page 15-17 |
| | |
| | www.rpacan.com |
TABLE 15-7 MILL LEACH INTER-PROCESS CUT-OFF GRADE
Barrick Gold Corporation-Cortez Operations
| | | | | | | | | | | | |
| | | | | | | Process Cost | | Process Cost | | Royalty | | Cut-off Grade |
Deposit | | | | Royalty Region | | ($/st) | | ($/st) | | (%) | | (oz/st Au) |
Cortez Hills | | | | 1 | | 1.45 | | 11.17 | | 0.9% | | 0.200 |
Pediment | | | | 1 | | 1.45 | | 11.17 | | 0.9% | | 0.120 |
Pipeline Phase 10 | | | | 1 | | 1.45 | | 11.17 | | 0.9% | | 0.104 |
| | | 2 | | 1.45 | | 11.17 | | 0.9% | | 0.112 |
| | | 3 | | 1.45 | | 11.17 | | 10.5% | | 0.108 |
| | | 4 | | 1.45 | | 11.17 | | 6.2% | | 0.112 |
Crossroads | | | | 2 | | 1.45 | | 11.17 | | 10.5% | | 0.064 |
| | | 4 | | 1.45 | | 11.17 | | 10.5% | | 0.064 |
| | | 5 | | 1.45 | | 11.17 | | 10.5% | | 0.063 |
Note: Gold Price used $1,000/oz Au.
RPA recommends that Cortez continue to refine its detailed grade control accounting and stockpile management procedures.
DILUTION AND EXTRACTION
There is no specific dilution allowance in the open pit Mineral Reserve estimate, as the block size is considered to account for dilution incurred during mining.
The open pit design is based upon 100% extraction of the open pit Mineral Reserves.
Cortez should re-evaluate the use of blast movement monitoring (BMM) to improve grade control, reduction dilution, and maximize mining recovery.
OPEN PIT OPTIMIZATION
The optimized economic pit shells selected for the basis of open pit designs were created using the Whittle 4X software package. Whittle is a commonly used commercial product that uses various geologic, mining, and economic inputs to determine the pit shell of greatest net value. Whittle implements the Lerchs-Grossmann 3D network-flow optimization method. The Lerchs-Grossmann 3D algorithm is a true pit optimizer used for determining the optimal ultimate limit for open-pit mines. Whittle input parameters are presented below. Tables 15-8 and 15-9 summarize the key open pit inputs for the Whittle analysis on each of the primary, two open pit areas; Cortez Hills and Pipeline.
| | |
Barrick Gold Corporation – Cortez Operations, Project 2471 Technical Report NI 43-101 – March 21, 2016 | | Page 15-18 |
| | |
| | www.rpacan.com |
TABLE 15-8 CORTEZ HILLS AND PEDIMENT WHITTLE PIT OPTIMIZATION PARAMETERS
Barrick Gold Corporation – Cortez Operations
| | |
| Block Dimensions | | 30 ft x 30 ft x 50 ft |
| Origin Coordinates | | 29400, 22320, 3800 |
| Number of Columns, Rows, Levels | | 253, 343, 68 |
| Mining Cost Adjustment Factor Formula | | 1.58+IF((IZ-38)>0,abs(IZ-38)*0.0063*2,abs(IZ-38)*0.0082*2) |
| Slope Templates (Interramp Angles, degrees) | | 40,41,35,39,40,39,34,40 degrees, respectively |
| 8 Sectors | | |
| Gold Price | | US$1,000/oz |
| Leach Cost + G&A | | US$1.45 + $0.81 |
| Mill Cost + G&A | | US$11.17 + $6.08 |
| Refractory Cost + G&A | | US$65.76 + $10.29 |
TABLE 15-9 PIPELINE AND CROSSROADS WHITTLE PIT OPTIMIZATION PARAMETERS
Barrick Gold Corporation – Cortez Operations
| | |
Whittle Parameter | | Description |
| Block Dimensions | | 40 ft x 40 ft x 20 ft |
| Origin Coordinates | | 97000, 49500, 2880 |
| Number of Columns, Rows, Levels | | 303, 312, 133 |
| Mining Cost Adjustment Factor Formula | | PL&SG: 1.48+IF((IZ-50)>0,abs(IZ-50)*0.005*2,abs(IZ-50)*0.0066*2) XRS: if(IZ-50>0,XRMC*0.87,XRMC+0.237) XRMC: 1.43+IF((IZ-50)>0,abs(IZ-50)*0.005*2,abs(IZ-50)*0.0066*2) |
| Slope Templates (Interramp Angles, degrees) | | 45,41,44,36.5,37,41,38,45,37,40,43,43.5,21 degrees, respectively |
Thirteen Sectors | |
| Gold Price | | US$1,000/oz |
| Leach Cost + G&A | | US$1.65 + $0.81 |
| Mill Cost + G&A | | US$11.17 + $6.08 |
| Refractory Cost + G&A | | US$46.68 + $10.29 |
| | |
Barrick Gold Corporation – Cortez Operations, Project 2471 Technical Report NI 43-101 – March 21, 2016 | | Page 15-19 |
| | |
| | www.rpacan.com |
UNDERGROUND MINERAL RESERVES
Underground mining is all at the Cortez Hills Underground (CHUG). The CHUG has four zones, the Breccia Zone, Middle Zone, Lower Zone and the Deep South Zone. A schematic view of the underground workings is shown in Figure 15-6. There are Mineral Reserves in all four zones.
The Breccia Zone is at the bottom of the planned open pit with the current underground mining extracting the high grade breccia. Lower grade material around the Breccia Zone will be mined by open pit methods. The open pit mining will ultimately extend to below the uppermost stoping areas of the Breccia Zone. The upper most level of the Breccia Zone is the 4820 level and the base of the CHOP is the 4525 level.
The Middle Zone is being developed and production from the Middle Zone commenced in 2015. The Middle Zone is being mined using cut and fill methods.
The Lower Zone was the subject of a 2014 FS prepared by Stantec-Mining and Barrick. The study provided the basis for the conversion of Lower Zone Mineral Resources to Mineral Reserves. The Lower Zone has a permit boundary at the 3,800 ft level. To avoid the potential to encroach upon that boundary the Mineral Reserves and planned workings were cut off by management at the 3,845 ft level. Mining is planned to be by cut and fill mining. Longhole stoping is also being considered for some areas of the Lower Zone. Development for the Lower Zone is underway with production planned to commence in 2016.
The Deep South Zone is an extension of the Lower Zone but is all below the 3,800 ft level. The Deep South Zone was the subject of a 2015 PFS completed by Barrick and Minetech USA, LLC to support the conversion of approximately 1.7 million ounces of Measured and Indicated Resources to Proven and Probable Reserves. The Deep South mining requires amendments to the PoO to permit dewatering and mining below the 3,800 ft level. This permit amendment application is planned to be submitted in 2016. The permitting is expected to take three to four years. On this basis, following the receipt of permits, dewatering and development work could begin as early as 2019 or 2020, with initial production from the Deep South Zone commencing in 2022 or 2023. The expansion of the underground mine will help to offset the impact of the end of mining in the Cortez Hills open pit, which is expected to conclude in 2018.
| | |
Barrick Gold Corporation – Cortez Operations, Project 2471 Technical Report NI 43-101 – March 21, 2016 | | Page 15-20 |
| | |
| | www.rpacan.com |
The Deep South Zone is expected to be mined using long hole stoping methods. The upper bound of the Deep South Zone Mineral Reserves is the 3,845 ft level.
The twin portals from the F Canyon to the Breccia Zone were commissioned in 2006, with first ore being mined in December of 2008. The underground mine generates high grade milling ore and refractory ore. Mining is currently underway in the Breccia and Middle Zones using a drift and fill mining method with CRF placed in all stoped voids. There has been no production from the Lower Zone to date.
The mine is a mechanized operation with ramp access via the F Canyon twin declines to the Breccia Zone and internal ramps below that for the Breccia Zone and extending to the Middle and Lower Zones. All of the ore is hauled to surface by 30 st haulage trucks and the trucks back haul CRF to the stopes. Ground conditions in the upper ore zone are very poor and headings are all supported with shotcrete and Swellex bolts.
Planning for the Lower Zone includes two new parallel declines accessing the Lower Zone. The drives have been named the Range Front Declines (RFD) for their location. These new declines will reduce the haulage and access distances, provide additional ventilation and escape ways and provide a planned conveyor gallery for the movement of rock from the mine to surface. Planning for the Deep South Zone includes a conveyor system to connect to the conveyor in the RFDs for the movement of ore and waste to surface.
| | |
Barrick Gold Corporation – Cortez Operations, Project 2471 Technical Report NI 43-101 – March 21, 2016 | | Page 15-21 |
| | |
| | www.rpacan.com |
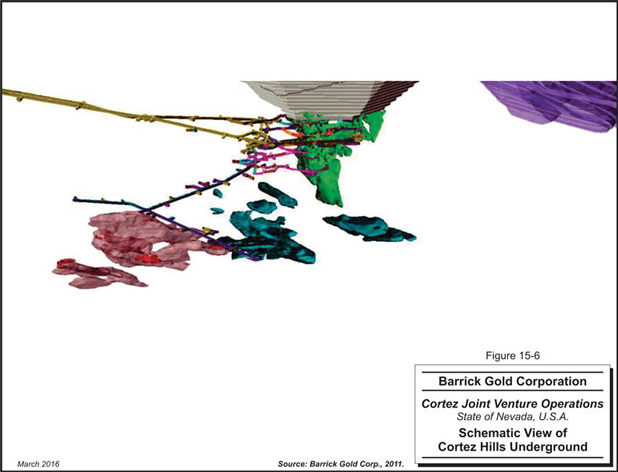
| | |
Barrick Gold Corporation – Cortez Operations, Project 2471 Technical Report NI 43-101 – March 21, 2016 | | Page 15-22 |
| | |
| | www.rpacan.com |
UNDERGROUND CUT-OFF GRADE
A cut-off grade estimation report is compiled for the mid-year 2015 Mineral Reserve estimates. The report covers:
| | • | | The gold price of $1,000/oz for EOY2015 and $1,200/oz after 2021. |
| | • | | The applicable Cortez Mine royalty payments. |
| | • | | The process operating costs and on-site (and off-site) metal recoveries by material type, applicable or selected process method, and orebody. |
Gold price assumptions are set by the corporate office. Royalties at Cortez vary by area, metal price, and processing type. For the CHUG the Net Smelter Return (NSR) used in the COG calculation is 1% for the Breccia, Middle, and Lower Zones and 2.13% for the Deep South. Mining costs, process costs and process recoveries were estimated for the Breccia, Middle, Lower, and Deep South Zones to determine the cut-off grade. Three different processing options are available for ore from the underground mine. The COG results are summarized in Table 15-10.
TABLE 15-10 UNDERGROUND CUT-OFF GRADE CALCULATIONS
Barrick Gold Corporation – Cortez Operations
| | | | | | | | | | | | |
Unit Cost | | Oxide
Heap
Leach | | | Oxide
Mill | | | Roaster | |
| Breccia, Middle, and Lower Zones | |
Gold Price (US$/oz) | | | 1,000 | | | | 1,000 | | | | 1,000 | |
Royalty (%) | | | 0.93 | | | | 0.93 | | | | 0.93 | |
Recovery (Breccia Zone) (%) | | | | | | | 86 | | | | 92 | |
Recovery (Middle Zone) (%) | | | | | | | 83 | | | | 90 | |
Recovery (Lower Zone) (%) | | | | | | | 83 | | | | 90 | |
Mining Operating Cost (Breccia Zone) ($/st ore) | | | | | | | 107.64 | | | | 107.64 | |
Mining Operating Cost (Middle Zone) ($/st ore) | | | | | | | 113.00 | | | | 113.00 | |
Mining Operating Cost (Lower Zone) ($/st ore) | | | | | | | 115.02 | | | | 115.02 | |
Process Operating Cost ($/st ore) | | | 3.31 | | | | 10.37 | | | | 30.38 | |
G&A Operating Cost (All Zones) ($/st ore) | | | | | | | 23.58 | | | | 19.18 | |
Transportation Costs ($/st ore) | | | | | | | | | | | 14.65 | |
Total Operating Cost (Breccia Zone) ($/st ore) | | | | | | | 141.59 | | | | 171.85 | |
Total Operating Cost (Middle Zone) ($/st ore) | | | | | | | 146.95 | | | | 177.21 | |
Total Operating Cost (Lower Zone) ($/st ore) | | | | | | | 148.97 | | | | 179.23 | |
Sustaining Capital UG ($/st ore) | | | | | | | 5.64 | | | | 5.64 | |
Sustaining Capital (Tailings Charge) ($/st ore) | | | | | | | 0.80 | | | | | |
Refining ($/oz) | | | 1.00 | | | | 1.00 | | | | 1.00 | |
BCOG (oz/st Au) 2015 EOY (Breccia Zone) | | | | | | | 0.174 | | | | 0.195 | |
| | |
Barrick Gold Corporation – Cortez Operations, Project 2471 Technical Report NI 43-101 – March 21, 2016 | | Page 15-23 |
| | |
| | www.rpacan.com |
| | | | | | | | | | | | |
Unit Cost | | Oxide
Heap
Leach | | | Oxide
Mill | | | Roaster | |
BCOG (oz/st Au) 2015 EOY (Middle Zone) | | | | | | | 0.187 | | | | 0.205 | |
BCOG (oz/st Au) 2015 EOY (Lower Zone) | | | | | | | 0.189 | | | | 0.208 | |
|
| Deep South Zone | |
Gold Price (from Pre-feasibility Study) (US$/oz) | | | 1,300 | | | | 1,300 | | | | 1,300 | |
Royalty (%) | | | 2.13 | | | | 2.13 | | | | 2.13 | |
Recovery (Deep South Zone) (%) | | | 70 | | | | 85 | | | | 88.7 | |
Mining Operating Cost (Deep South) ($/st ore) | | | 92.95 | | | | 92.95 | | | | 92.95 | |
Process Operating Cost ($/st ore) | | | 3.31 | | | | 10.37 | | | | 30.38 | |
G&A Operating Cost (All Zones) ($/st ore) | | | | | | | | | | | | |
Transportation Costs ($/st ore) | | | | | | | | | | | 14.65 | |
Total Operating Cost (Deep South) ($/st ore) | | | 96.26 | | | | 126.90 | | | | 157.16 | |
Sustaining Capital UG ($/st ore) | | | | | | | 5.64 | | | | 5.64 | |
Sustaining Capital (Tailings Charge) ($/st ore) | | | | | | | 0.80 | | | | | |
Refining ($/oz) | | | 1.00 | | | | 1.00 | | | | 1.00 | |
BCOG (oz/st Au) 2015 EOY (Deep South) | | | 0.108 | | | | 0.123 | | | | 0.144 | |
Ore characterization and ore shape geometry constrains the mining methods that can be used to mine the Middle zone. To successfully segregate the ore and mine the complex geometry in Middle zone a highly selective mining method is being employed. Cut and fill mining provides the required mining selectivity and has been used in the cut-off grade calculations.
DILUTION AND EXTRACTION
The underground Mineral Reserves for the Breccia, Middle, and Lower Zones include an allowance of 5% at zero grade to account for ore handing dilution plus CRF dilution of 3% on primary levels, 5% on secondary levels, and 10% on the bottom levels.
The underground Breccia Zone extraction is based upon the extraction of 100% of the Mineral Reserves within a 0.2 oz/st shape. Edge dilution is accounted for in the Middle and Lower Zones in level pancake designs by extending the extents of the level by 8 ft (a typical round) beyond the planned stope limits.
The Deep South Zone Mineral Reserves include internal dilution consisting of material within the 0.1 oz/st Au COG stope shapes and which will be mined as part of the stope. In addition, an external dilution tonnage allowance of 11.3% at zero grade has been included in the Mineral Reserve estimate. This value was based upon experience at operations using similar mining methods. RPA is of the opinion that the dilution estimate is appropriate at this stage of the
| | |
Barrick Gold Corporation – Cortez Operations, Project 2471 Technical Report NI 43-101 – March 21, 2016 | | Page 15-24 |
| | |
| | www.rpacan.com |
mine development. Stope void surveys and continued reconciliation of production to the Mineral Reserves will demonstrate the accuracy of the dilution estimate.
The Deep South Zone Mineral Reserves, as presented in the PFS, have an extraction factor of 100%. RPA is of the opinion that the extraction of the long hole stopes in the Deep South Zone is unlikely to be 100%. Rather there can be minor losses expected in primary stopes and larger losses in the wider, backfill walled secondary stopes. RPA is of the opinion that the losses should be estimated as 2% in the primary stopes and 8% in the secondary stopes for an overall extraction of 95%.
STOPE PLANNING
In the Breccia Zone, the ore is taken as all of the resource within the 0.2 oz/st grade mine design. For the Middle Zone, stope shapes are developed and the tonnes and grade within these shapes is taken from the block model. The Breccia and Middle Zones are being mined by drift and fill mining. The 2015 Middle Zone Mineral Reserves are based upon drift and fill mining.
In the Lower Zone the Mineral Reserves are based upon the overall design shapes and the planned mining method for the 2015 Mineral Reserve estimate is cut and fill mining. Management are considering long hole mining methods for certain parts of the Lower Zone.
The Deep South Zone has been interpreted as a -20º SE plunging extension of the Lower Zone. It extends for 2,100 ft along strike and is planned to be mined from the 3,800 ft level to the 3,050 ft level. The Deep South Zone consists of an upper section that is an average of 180 ft wide and 120 ft thick, a central section that is an average of 200 ft wide and 85 ft thick, and the lower section, known as Renegade, which is 120 ft long by 160 ft wide and 120 ft thick.
Deep South Zone stopes are planned to be long hole stopes mined in a sequence of primary and secondary stopes. The stopes will be 60 ft high from footwall to footwall. This leaves a 45 ft long hole stope after excavation of the 15 ft high undercut. The primary stopes will be 20 ft wide while the secondary stopes will be 30 ft wide. The stopes will be transverse long hole stopes and the length of the stopes will be the “width” of the Deep South Zone which is up to 200 ft. A 200 ft long primary stope will yield approximately 3,000 tons of ore in development plus 20,000 tons in stope ore.
| | |
Barrick Gold Corporation – Cortez Operations, Project 2471 Technical Report NI 43-101 – March 21, 2016 | | Page 15-25 |
| | |
| | www.rpacan.com |
Stope dimensions were selected based upon operating assumptions as well as geotechnical considerations. Mine Design Engineering prepared a pre-feasibility level geotechnical assessment and provided the parameters for stable stopes for different areas of the Deep South. The analysis used the modified Mathew’s stability analysis and the recommendations were to remain in the stable unsupported region of the stability curve. According to the stope stability analysis, it may be necessary to mine the stopes in 33 ft sections to maintain side wall stability.
Where the ore thickness is over 60 ft, there will either be stacked long hole stopes or mining of the balance of the height by drift and fill.
RPA is of the opinion that the stope designs are appropriate but notes that more detailed design and analysis will be necessary for stope layouts and especially for stope scheduling in view of the potential short panels along the stope length.
RECONCILIATION
An ongoing reconciliation between the Mineral Reserve estimate and the mine production is an important step in assessing the Mineral Reserve estimation and operating parameters at a mine. Cortez maintains a reconciliation between the Mineral Reserve model, the grade control results, and the actual production or Declared Ore Mined (DOM). The stockpiling of ore and the various process streams (mill/leach/autoclave/roaster) complicates the reconciliation between Mineral Reserves and production.
CORTEZ HILLS OPEN PIT
The CHOP yearly open pit reconciliation for 2012 through the end of 2015 is shown in Tables 15-11 and 15-12. Table 15-11 compares the grade control, Mineral Reserve, and declared ore mined on a yearly time basis. Table 15-12 compares the grade control to the Mineral Reserve by processing types (heap leaching, oxide mill, and refractory). The grade control models have consistently reported more tonnage (20% higher in the period), and the gold production has been 13% higher than the Mineral Reserve model.
Barrick notes that the Mineral Reserve blocks are 20 ft high, while the mining is often done on 40 ft to 50 ft benches. The 50 ft benches and the push to advance the pit resulted from
| | |
Barrick Gold Corporation – Cortez Operations, Project 2471 Technical Report NI 43-101 – March 21, 2016 | | Page 15-26 |
| | |
| | www.rpacan.com |
regulatory and legal pressures in Cortez Hills, and the plan is to mine on 20-ft high benches in the future, if dilution reaches unacceptable levels.
A further aspect of the reconciliation is the existence of narrow high-grade, steeply-dipping structures that may have been missed in the exploration drilling, and these structures can contribute to positive reconciliation results over a number of benches. This phenomenon is especially prevalent in Cortez Hills Breccia Zone. It should be noted that practically all material above a 0.004 oz/st Au cut-off grade reports to either heap leaching, the oxide mill, or a refractory processing streams.
The Pediment area of the Cortez Hills pit experienced a high, positive reconciliation for heap leach material in 2014. This positive reconciliation occurred, primarily due to the lack of exploration drilling in the Pediment pit area.
The grade control results and the Mineral Reserve estimates are being compared monthly and that the reconciliation of the two results is reasonable.
| | |
Barrick Gold Corporation – Cortez Operations, Project 2471 Technical Report NI 43-101 – March 21, 2016 | | Page 15-27 |
| | |
| | www.rpacan.com |
TABLE 15-11 CORTEZ HILLS OPEN PIT RECONCILIATION
Barrick Gold Corporation – Cortez Operations
| | | | | | | | | | | | | | | | | | | | | | | | |
| | | | | Grade Control (GC) | | | | Ore Reserve (OR - MI&I) | | | | Declared Ore Mined (DOM) |
Year | | | | Tons | | Grade
(oz/st Au) | | Ounces | | | | Tons | | Grade
(oz/st Au) | | Ounces | | | | Tons | | Grade
(oz/st Au) | | Ounces |
2012 | | | | 10,443,690 | | 0.090 | | 936,890 | | | | 9,898,852 | | 0.080 | | 793,063 | | | | 10,872,068 | | 0.092 | | 996,793 |
2013 | | | | 14,587,764 | | 0.057 | | 834,893 | | | | 14,924,772 | | 0.053 | | 784,051 | | | | 14,699,191 | | 0.057 | | 835,492 |
2014 | | | | 3,006,851 | | 0.035 | | 104,519 | | | | 1,232,478 | | 0.068 | | 83,735 | | | | 3,226,343 | | 0.034 | | 108,424 |
2015 | | | | 20,931,924 | | 0.032 | | 674,678 | | | | 14,910,707 | | 0.040 | | 591,070 | | | | 21,437,492 | | 0.033 | | 702,192 |
2012 - 2015 | | | | 48,970,229 | | 0.052 | | 2,550,980 | | | | 40,966,809 | | 0.055 | | 2,251,919 | | | | 50,235,094 | | 0.053 | | 2,642,901 |
| | | | | | | | | | | | |
| | | | | | | | | | | | | | | | | | | | | | | | |
| | | | | Grade Control vs Ore Reserve | | | | Declared Ore Mined vs Ore Reserve | | | | Declared Ore Mined vs Grade Control |
Year | | | | Tons | | Grade
(oz/st Au) | | Ounces | | | | Tons | | Grade
(oz/st Au) | | Ounces | | | | Tons | | Grade
oz/st Au) | | Ounces |
2012 | | | | 6% | | 13% | | 18% | | | | 10% | | 15% | | 26% | | | | 4% | | 2% | | 6% |
2013 | | | | -2% | | 8% | | 6% | | | | -2% | | 8% | | 7% | | | | 1% | | 0% | | 0% |
2014 | | | | 144% | | -49% | | 25% | | | | 162% | | -50% | | 29% | | | | 7% | | -3% | | 4% |
2015 | | | | 40% | | -19% | | 14% | | | | 44% | | -17% | | 19% | | | | 2% | | 2% | | 4% |
2012 - 2015 | | | | 20% | | -5% | | 13% | | | | 23% | | -4% | | 17% | | | | 3% | | 1% | | 4% |
| | |
Barrick Gold Corporation – Cortez Joint Venture, Project 2471 Technical Report NI 43-101 – March 21, 2016 | | Page 15-28 |
| | |
| | www.rpacan.com |
TABLE 15-12 CORTEZ HILLS OPEN PIT RECONCILIATION BY PROCESS TYPE
Barrick Gold Corporation – Cortez Operations
| | | | | | | | | | | | | | | | | | | | | | | | | | | | | | | | |
| | | | | Leach | | Mill | | Refractory | | | | Totals - Grade Control |
Year | | | | Tons | | Grade
(oz/st Au) | | Ounces | | | | Tons | | Grade
(oz/st Au) | | Ounces | | | | Tons | | Grade
(oz/st Au) | | Ounces | | | | Tons | | Grade
(oz/st Au) | | Ounces |
2012 | | | | 5,204,249 | | 0.016 | | 81,980 | | | | 5,192,066 | | 0.163 | | 847,462 | | | | 47,375 | | 0.157 | | 7,448 | | | | 10,443,690 | | 0.090 | | 936,890 |
2013 | | | | 9,966,234 | | 0.015 | | 151,252 | | | | 4,290,493 | | 0.143 | | 613,131 | | | | 331,037 | | 0.213 | | 70,510 | | | | 14,587,764 | | 0.057 | | 834,893 |
2014 | | | | 2,290,990 | | 0.010 | | 23,773 | | | | 711,587 | | 0.113 | | 80,404 | | | | 4,274 | | 0.080 | | 342 | | | | 3,006,851 | | 0.035 | | 104,519 |
2015 | | | | 17,686,194 | | 0.013 | | 234,402 | | | | 3,245,730 | | 0.136 | | 440,276 | | | | — | | — | | — | | | | 20,931,924 | | 0.032 | | 674,678 |
2012 - 2015 | | | | 35,147,667 | | 0.014 | | 491,407 | | | | 13,439,876 | | 0.147 | | 1,981,273 | | | | 382,686 | | 0.205 | | 78,300 | | | | 48,970,229 | | 0.052 | | 2,550,980 |
| | |
| | | | | Ore Reserve Model (OR) |
| | | | | Leach | | Mill | | Refractory | | | | Totals - Ore Reserve |
Year | | | | Tons | | Grade
(oz/st Au) | | Ounces | | | | Tons | | Grade
(oz/st Au) | | Ounces | | | | Tons | | Grade
(oz/st Au) | | Ounces | | | | Tons | | Grade
(oz/st Au) | | Ounces |
2012 | | | | 5,498,968 | | 0.013 | | 71,117 | | | | 4,355,406 | | 0.164 | | 715,563 | | | | 44,479 | | 0.144 | | 6,383 | | | | 9,898,852 | | 0.080 | | 793,063 |
2013 | | | | 9,786,240 | | 0.011 | | 111,579 | | | | 5,045,976 | | 0.131 | | 659,566 | | | | 92,556 | | 0.139 | | 12,906 | | | | 14,924,772 | | 0.053 | | 784,051 |
2014 | | | | — | | — | | — | | | | 1,232,478 | | 0.068 | | 83,735 | | | | — | | — | | — | | | | 1,232,478 | | 0.068 | | 83,735 |
2015 | | | | 12,171,470 | | 0.017 | | 202,657 | | | | 1,894,103 | | 0.130 | | 246,107 | | | | | | — | | | | | | 14,065,573 | | 0.032 | | 448,764 |
2012 - 2015 | | | | 27,456,678 | | 0.014 | | 385,353 | | | | 12,527,963 | | 0.136 | | 1,704,971 | | | | 137,035 | | 0.141 | | 19,289 | | | | 40,121,675 | | 0.053 | | 2,109,613 |
| | |
| | | | | Grade Control (GC) vs. Ore Reserve Model (OR) |
| | | | | Leach | | Mill | | Refractory | | | | Totals - % Difference |
Year | | | | Tons | | Grade
(oz/st Au) | | Ounces | | | | Tons | | Grade
(oz/st Au) | | Ounces | | | | Tons | | Grade
(oz/st Au) | | Ounces | | | | Tons | | Grade
(oz/st Au) | | Ounces |
2012 | | | | -5% | | 23% | | 15% | | | | 19% | | -1% | | 18% | | | | 7% | | 9% | | 17% | | | | 6% | | 13% | | 18% |
2013 | | | | 2% | | 36% | | 36% | | | | -15% | | 9% | | -7% | | | | 258% | | 53% | | 446% | | | | -2% | | 8% | | 6% |
2014 | | | | 0% | | 0% | | 0% | | | | -42% | | 66% | | -4% | | | | 0% | | 0% | | 0% | | | | 144% | | -49% | | 25% |
2015 | | | | 45% | | -20% | | 16% | | | | 71% | | 4% | | 79% | | | | 0% | | 0% | | 0% | | | | 49% | | 1% | | 50% |
2012 - 2015 | | | | 28% | | 0% | | 28% | | | | 7% | | 8% | | 16% | | | | 179% | | 45% | | 306% | | | | 22% | | -1% | | 21% |
| | |
Barrick Gold Corporation – Cortez Joint Venture, Project 2471 Technical Report NI 43-101 – March 21, 2016 | | Page 15-29 |
| | |
| | www.rpacan.com |
PIPELINE OPEN PIT
There was a hiatus in production from the Pipeline pit from 2009 through 2012. Production was just beginning to enter the ore zone in the Gap Phase 3 pit in the last quarter of 2013, and it was completed in 2014. Portions of the Gap pit area experienced negative reconciliations in 2013 and into 2014. An improved resource model was created in 2014/2015 to address this issue. In addition, the Pipeline mineralization contains varying amounts of heap leach, oxide mill, and refractory material within each pit phase. Only leach ore was mined from the Pipeline area in 2015.
The Pipeline/Gap yearly open pit reconciliation for 2012 through the end of 2015 is shown in Tables 15-13 and 15-14. Table 15-13 compares the grade control, Mineral Reserve, and declared ore mined on a yearly time basis. Table 15-14 compares the grade control to the Mineral Reserve by processing types (heap leaching, oxide mill, and refractory). The grade control models have reported less tonnage (11% lower in the period), and the gold production has been 9% lower than the Mineral Reserve model. Updated Mineral Resource and Mineral Reserve models for the Pipeline complex were completed, and were used for the 2015/2016 mine planning.
| | |
Barrick Gold Corporation – Cortez Operations, Project 2471 Technical Report NI 43-101 – March 21, 2016 | | Page 15-30 |
| | |
| | www.rpacan.com |
TABLE 15-13 PIPELINE OPEN PIT RECONCILIATION
Barrick Gold Corporation – Cortez Operations
| | | | | | | | | | | | | | | | | | | | | | | | |
| | | | | Grade Control (GC) | | | | Ore Reserve (OR - MI) | | | | Declared Ore Mined (DOM) |
Year | | | | Tons | | Grade
(oz/st Au) | | Ounces | | | | Tons | | Grade
(oz/st Au) | | Ounces | | | | Tons | | Grade
(oz/st Au) | | Ounces |
2012 | | | | — | | — | | — | | | | — | | — | | — | | | | 75,528 | | 0.196 | | 14,805 |
2013 | | | | 6,076,378 | | 0.019 | | 116,462 | | | | 9,061,132 | | 0.016 | | 147,006 | | | | 6,102,508 | | 0.02 | | 119,402 |
2014 | | | | 23,018,648 | | 0.016 | | 363,931 | | | | 24,288,534 | | 0.016 | | 395,080 | | | | 23,297,092 | | 0.016 | | 376,262 |
2015 | | | | 1,682,083 | | 0.014 | | 23,476 | | | | 1,226,709 | | 0.011 | | 12,987 | | | | 1,722,710 | | 0.014 | | 24,433 |
2012 - 2015 | | | | 30,777,109 | | 0.016 | | 503,869 | | | | 34,576,375 | | 0.016 | | 555,073 | | | | 31,197,838 | | 0.017 | | 534,902 |
| | | | | | | | | | | | |
| | | | | | | | | | | | | | | | | | | | | | | | |
| | | | | Grade Control vs Ore Reserve | | | | Declared Ore Mined vs Ore Reserve | | | | Declared Ore Mined vs Grade
Control |
Year | | | | Tons | | Grade
(oz/st Au) | | Ounces | | | | Tons | | Grade
(oz/st Au) | | Ounces | | | | Tons | | Grade
(oz/st Au) | | Ounces |
2012 | | | | 0% | | 0% | | 0% | | | | -100% | | 0% | | -100% | | | | 0% | | 0% | | 0% |
2013 | | | | -33% | | 18% | | -21% | | | | -33% | | 21% | | -19% | | | | 0% | | 2% | | 3% |
2014 | | | | -5% | | -3% | | -8% | | | | -4% | | -1% | | -5% | | | | 1% | | 2% | | 3% |
2015 | | | | 37% | | 32% | | 81% | | | | 40% | | 34% | | 88% | | | | 2% | | 2% | | 4% |
2012 - 2015 | | | | -11% | | 2% | | -9% | | | | -10% | | 7% | | -4% | | | | 1% | | 5% | | 6% |
| | |
Barrick Gold Corporation – Cortez Joint Venture, Project 2471 Technical Report NI 43-101 – March 21, 2016 | | Page 15-31 |
| | |
| | www.rpacan.com |
TABLE 15-14 PIPELINE OPEN PIT RECONCILIATION BY PROCESS TYPE
Barrick Gold Corporation – Cortez Operations
| | | | | | | | | | | | | | | | | | | | | | | | | | | | | | |
| | | Grade Control (GC) |
| | | Leach | | Mill | | Refractory | | | | Totals - Grade Control |
Year | | Tons | | Grade
(oz/st Au) | | Ounces | | | | Tons | | Grade
(oz/st Au) | | Ounces | | | | Tons | | Grade
(oz/st Au) | | Ounces | | | | Tons | | Grade
(oz/st Au) | | Ounces |
2012 | | 0 | | — | | 0 | | | | 0 | | — | | 0 | | | | 0 | | — | | 0 | | | | 0 | | — | | 0 |
2013 | | 5,233,801 | | 0.015 | | 76,467 | | | | 834,953 | | 0.046 | | 38,607 | | | | 7,624 | | 0.182 | | 1,388 | | | | 6,076,378 | | 0.019 | | 116,462 |
2014 | | 19,677,465 | | 0.012 | | 232,837 | | | | 3,334,170 | | 0.039 | | 130,351 | | | | 7,013 | | 0.106 | | 743 | | | | 23,018,648 | | 0.016 | | 363,931 |
2015 | | 1,682,083 | | 0.014 | | 23,476 | | | | 0 | | — | | 0 | | | | 0 | | — | | 0 | | | | 1,682,083 | | 0.014 | | 23,476 |
2012 - 2015 | | 26,593,349 | | 0.013 | | 332,780 | | | | 4,169,123 | | 0.041 | | 168,958 | | | | 14,637 | | 0.146 | | 2,131 | | | | 30,777,109 | | 0.016 | | 503,869 |
| |
| | | Ore Reserve Model (OR) |
| | | Leach | | Mill | | Refractory | | | | Totals - Ore Control |
Year | | Tons | | Grade
(oz/st Au) | | Ounces | | | | Tons | | Grade
(oz/st Au) | | Ounces | | | | Tons | | Grade
(oz/st Au) | | Ounces | | | | Tons | | Grade
(oz/st Au) | | Ounces |
2012 | | | | — | | | | | | | | — | | | | | | | | — | | | | | | — | | — | | — |
2013 | | 7,956,961 | | 0.011 | | 91,320 | | | | 1,099,121 | | 0.05 | | 55,342 | | | | 5,050 | | 0.068 | | 343 | | | | 9,061,132 | | 0.016 | | 147,006 |
2014 | | 21,662,378 | | 0.012 | | 250,567 | | | | 2,593,865 | | 0.055 | | 141,535 | | | | 32,291 | | 0.092 | | 2,978 | | | | 24,288,534 | | 0.016 | | 395,080 |
2015 | | 1,226,709 | | 0.011 | | 12,987 | | | | 0 | | — | | 0 | | | | 0 | | — | | 0 | | | | 1,226,709 | | 0.011 | | 12,987 |
2012 - 2015 | | 30,846,048 | | 0.012 | | 354,874 | | | | 3,692,986 | | 0.053 | | 196,877 | | | | 37,341 | | 0.089 | | 3,321 | | | | 34,576,375 | | 0.016 | | 555,073 |
| |
| | | Grade Control (GC) vs. Ore Reserve Model (OR) |
| | | Leach | | Mill | | Refractory | | | | Totals - % Difference |
Year | | Tons | | Grade
(oz/st Au) | | Ounces | | | | Tons | | Grade
(oz/st Au) | | Ounces | | | | Tons | | Grade
(oz/st Au) | | Ounces | | | | Tons | | Grade
(oz/st Au) | | Ounces |
2012 | | 0% | | 0% | | 0% | | | | 0% | | 0% | | 0% | | | | 0% | | 0% | | 0% | | | | 0% | | 0% | | 0% |
2013 | | -34% | | 36% | | -16% | | | | -24% | | -8% | | -30% | | | | 51% | | 168% | | 305% | | | | -33% | | 19% | | -21% |
2014 | | -9% | | 0% | | -7% | | | | 29% | | -29% | | -8% | | | | -78% | | 15% | | -75% | | | | -5% | | 0% | | -8% |
2015 | | 37% | | 32% | | 81% | | | | 0% | | 0% | | 0% | | | | 0% | | 0% | | 0% | | | | 37% | | 32% | | 81% |
2012 - 2015 | | -14% | | 9% | | -6% | | | | 13% | | -24% | | -14% | | | | -61% | | 64% | | -36% | | | | -11% | | 2% | | -9% |
| | |
Barrick Gold Corporation – Cortez Joint Venture, Project 2471 Technical Report NI 43-101 – March 21, 2016 | | Page 15-32 |
| | |
| | www.rpacan.com |
UNDERGROUND
YEAR-YEAR RECONCILIATION
The October 2015 YTD reconciliation for the Breccia Zone and for the Middle Zone is shown in Table 15-15, the majority of the production to date is from the Breccia Zone. Middle Zone production commenced in mid-2013. The table includes the Declared Ore Mined (DOM), grade control (GC), (previously referred to as “as mined”, and Mineral Reserve (MR) values.
In the Breccia Zone the reconciliation compared to the Mineral Reserve is positive. The as mined vs. Mineral Reserve is higher due to the existence of high grade material between drill holes that is not reflected in the model. This material is well above the current mining cut-off grade and delineation drilling in these areas was not required.
In the Middle Zone the reconciliation is even or positive compared to the Mineral Reserves.
There has been no mining of the Lower Zone to date.
RPA is of the opinion that the CHUG mining is demonstrating a good reconciliation to the Mineral Reserves. RPA considers the reconciliation work to be important and recommends continued review of the results, this will be important as mining is moving to new zones and possibly to new methods.
TABLE 15-15 UNDERGROUND MINERAL RESERVE RECONCILIATION
Barrick Gold Corporation – Cortez Operations
| | | | | | | | | | | | | | | | | | | | | | | | |
| | | Tons | | | Grade
(oz/st Au) | | | Oz | | | Tons | | | Grade
(oz/st Au) | | | Oz | |
| Breccia Zone - October 2015 YTD | |
DOM | | | 475,948 | | | | 0.699 | | | | 332,893 | | | | | | | | | | | | | |
DOM vs. GC | | | | | | | | | | | | | | | 104 | % | | | 93 | % | | | 97 | % |
Grade Control | | | 458,999 | | | | 0.749 | | | | 343,870 | | | | | | | | | | | | | |
AM vs. MR | | | | | | | | | | | | | | | 106 | % | | | 115 | % | | | 123 | % |
Mineral Reserve | | | 431,005 | | | | 0.650 | | | | 280,292 | | | | | | | | | | | | | |
DOM vs. MR | | | | | | | | | | | | | | | 110 | % | | | 108 | % | | | 119 | % |
|
| Middle Zone - October 2015 YTD | |
DOM | | | 151,583 | | | | 0.472 | | | | 71,542 | | | | | | | | | | | | | |
DOM vs. GC | | | | | | | | | | | | | | | 102 | % | | | 97 | % | | | 100 | % |
Grade Control | | | 148,004 | | | | 0.486 | | | | 71,866 | | | | | | | | | | | | | |
AM vs. MR | | | | | | | | | | | | | | | 98 | % | | | 115 | % | | | 112 | % |
| | |
Barrick Gold Corporation – Cortez Operations, Project 2471 Technical Report NI 43-101 – March 21, 2016 | | Page 15-33 |
| | |
| | www.rpacan.com |
| | | | | | | | | | | | | | | | | | | | | | | | |
| | | Tons | | | Grade
(oz/st Au) | | | Oz | | | Tons | | | Grade
(oz/st Au) | | | Oz | |
Mineral Reserve | | | 151,699 | | | | 0.422 | | | | 64,011 | | | | | | | | | | | | | |
DOM vs. MR | | | | | | | | | | | | | | | 100 | % | | | 112 | % | | | 112 | % |
MONTHLY RECONCILIATION
Cortez maintains a monthly reconciliation record for the underground including monthly and three month moving average (3MMA) calculations for the total underground ore, oxide ore, and three categories of refractory ores. The reconciliation is broken down by zone (Breccia and Middle) and includes a total for the underground. The monthly total, oxide and autoclave reconciliations are shown below in Figures 15-7 to 15-9. The reconciliation for roaster ore and TCM is not shown due to the limited tonnage produced to date. All of the reconciliation shown in this section is for the comparison of declared ore mine to the Mineral Reserve as this represents the fundamental comparison between the estimate and production.
FIGURE 15-7 TOTAL UNDERGROUND ORE RECONCILIATION 2014-2015
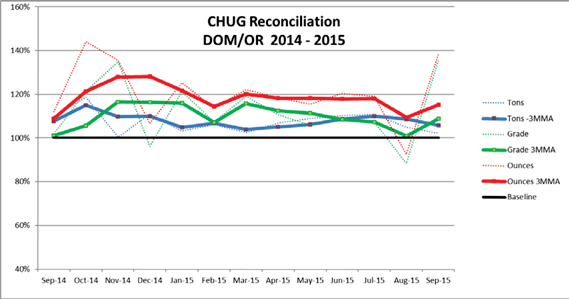
Overall, the underground reconciliation is positive for tons, grade, and ounces and the positive trend was maintained through the period for the 3MMA. Continued positive reconciliation indicates that the Mineral Reserve estimate may be too conservative and a review of the estimation parameters may be warranted.
| | |
Barrick Gold Corporation – Cortez Operations, Project 2471 Technical Report NI 43-101 – March 21, 2016 | | Page 15-34 |
| | |
| | www.rpacan.com |
FIGURE 15-8 UNDERGROUND OXIDE ORE RECONCILIATION 2014-2015
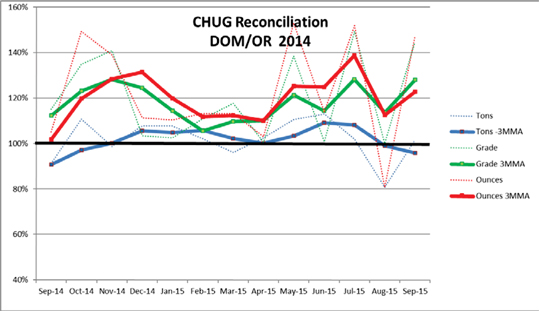
The underground oxide ore tonnage reconciliation has moved from negative to positive and back to negative over the period considered. The grade has demonstrated a larger positive reconciliation initially offsetting the negative reconciliation on tons and then adding to the positive gold reconciliation as the tonnage moved to positive reconciliation. The positive trend in the reconciliation would warrant review and consideration to assess the possible causes but the high grade Breccia Zone is now virtually complete.
| | |
Barrick Gold Corporation – Cortez Operations, Project 2471 Technical Report NI 43-101 – March 21, 2016 | | Page 15-35 |
| | |
| | www.rpacan.com |
FIGURE 15-9 UNDERGROUND ROASTER ORE RECONCILIATION 2014-2015
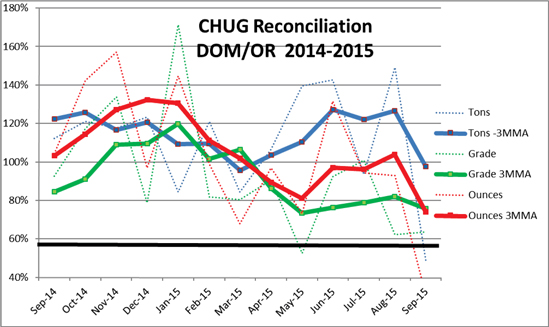
The roaster ore reconciliation has demonstrated a wide range of positive and negative reconciliation results through the period. The tonnage reconciliation has generally been favourable but the grade reconciliation has been generally negative through 2015 leading to a negative reconciliation between the declared ore mined and the Mineral Reserves. RPA recommends that the tracking continue and that attempts to identify the cause of large changes be completed and reported on a monthly basis.
Reconciliation of production, planning and mineral reserves is also maintained for the RF2 and RF3 refractory ores, the results are variable and RPA is of the opinion that the small tonnage to date does not support detailed review. RPA is of the opinion that the maintenance and regular review of the reconciliation is an important part of the Mineral Reserve estimation process. RPA concurs with the presentation of the reconciliation results focused upon the percentage differences and not the absolute differences.
RPA OPINION
RPA is not aware of any known environmental, permitting, legal, title, taxation, socio-economic, marketing, political, or other relevant factors that could materially affect the Mineral Reserve estimate.
| | |
Barrick Gold Corporation – Cortez Operations, Project 2471 Technical Report NI 43-101 – March 21, 2016 | | Page 15-36 |
| | |
| | www.rpacan.com |
RPA notes that permit approval for the mining of the Deep South Zone will be required, however, based on previous experience at the operation, there is a reasonable expectation that the permit will be obtained.
| | |
Barrick Gold Corporation – Cortez Operations, Project 2471 Technical Report NI 43-101 – March 21, 2016 | | Page 15-37 |
| | |
| | www.rpacan.com |
16 MINING METHODS
RECENT PRODUCTION HISTORY
The Cortez Mine consists of an operating open pit and underground mine with production from several open pit deposits and one underground mine. Production is currently coming from the CHOP, the Pipeline open pit, and the CHUG as well as material from stockpiles accumulated from previous mining. The operations at Cortez are well established, systems are in place, and the Mine is reasonably staffed to the correct levels. The mine production history for the past four years (2012-2015) is summarized inTable 16-1.
TABLE 16-1 MINE OPERATIONS SUMMARY 2012-2015
Barrick Gold Corporation – Cortez Operations
| | | | | | | | | | | | | | | | |
Item | | 2012 | | | 2013 | | | 2014 | | | 2015 | |
Open Pit | | | | | | | | | | | | | | | | |
Tons Mined | | | 119,663,896 | | | | 147,106,347 | | | | 167,068,297 | | | | 166,079,219 | |
Tons Per Day | | | 326,951 | | | | 403,031 | | | | 457,721 | | | | 455,011 | |
Tons of Ore | | | 10,443,690 | | | | 20,664,143 | | | | 25,996,090 | | | | 22,614,007 | |
Grade (oz/st Au) | | | 0.090 | | | | 0.046 | | | | 0.018 | | | | 0.031 | |
Contained Ounces | | | 936,890 | | | | 951,356 | | | | 468,087 | | | | 698,154 | |
Tons Operating Waste | | | 70,408,971 | | | | 35,410,750 | | | | 80,635,648 | | | | 120,786,196 | |
Capitalized Tons Waste | | | 38,811,236 | | | | 91,031,454 | | | | 60,436,559 | | | | 22,679,016 | |
Tons Waste | | | 109,220,206 | | | | 126,442,204 | | | | 141,072,207 | | | | 143,465,212 | |
Re-handle Tons | | | 3,393,491 | | | | 3,982,140 | | | | 2,203,327 | | | | 2,113,533 | |
Total Tons Moved | | | 123,057,388 | | | | 151,088,487 | | | | 169,271,624 | | | | 168,192,752 | |
| | | | |
Underground | | | | | | | | | | | | | | | | |
Tons Mined | | | 837,350 | | | | 783,807 | | | | 807,746 | | | | 1,020,966 | |
Tons of Ore | | | 539,029 | | | | 611586 | | | | 643597 | | | | 763,320 | |
Tons Per Day (total) | | | 2,288 | | | | 2,159 | | | | 2,213 | | | | 2,091 | |
Grade (oz/st Au) | | | 1.071 | | | | 0.834 | | | | 0.714 | | | | 0.627 | |
Contained Ounces | | | 577,146 | | | | 510,178 | | | | 459,536 | | | | 478,336 | |
Tons Waste Tons | | | 298,322 | | | | 172,221 | | | | 146,847 | | | | 257,647 | |
Tons Backfill Tons | | | 564,904 | | | | 627,205 | | | | 620,279 | | | | 641,404 | |
Total Feet Development | | | 34,888 | | | | 32,882 | | | | 33,582 | | | | 42,335 | |
| | |
Barrick Gold Corporation – Cortez Operations, Project 2471 Technical Report NI 43-101 – March 21, 2016 | | Page 16-1 |
| | |
| | www.rpacan.com |
OPEN PIT MINE
MINE OPERATIONS
Open pit ore is mined by a conventional shovel-truck process at the rate of approximately 17.7 Mstpa with a LOM stripping ratio of 7:1 (waste tonnes to one tonne of ore). Mining occurs in two separate areas separated by a distance of approximately 12 mi; Cortez Hills composed of Cortez Hills and Pediment, and Pipeline composed of Pipeline, Gap, and Crossroads. Figure 16-1 illustrates the location of the open pit mines.
Benches are a nominal height of 50 ft, and mined in one pass. Blast movement monitoring (BMM) has been used in the past but is not in current use at the Cortez Operations. BMM is carried out using directional transmitters located in dedicated blast holes prior to blasting. After the blast occurs, the directional transmitters emit a frequency with information relating to their respective coordinates, which are in turn compared to their original coordinates in order to determine the overall movement of the blast pile.
Typically, blast patterns are 22 ft by 25 ft. Typical blast hole diameters for Cortez Hills and Pipeline are 8.75 in. and 9.875 in., respectively. Sub-drill length averages four feet. Powder factors for Cortez Hills and Pipeline average 0.388 lb explosive per ton (lbe/st) and 0.479 lbe/st, respectively.
Typical, horizontal waste haul distances for Cortez Hills’s ore and waste are 4,400 ft and 5,700 ft, respectively. Pipeline ore and waste haul horizontal distances are 8,660 ft and 5,800 ft, respectively.
| | |
Barrick Gold Corporation – Cortez Operations, Project 2471 Technical Report NI 43-101 – March 21, 2016 | | Page 16-2 |
| | |
| | www.rpacan.com |
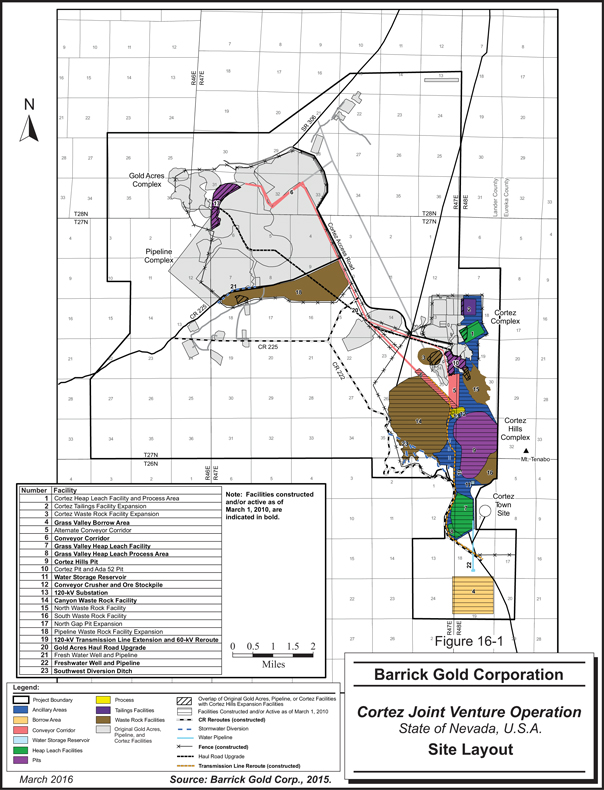
| | |
Barrick Gold Corporation – Cortez Operations, Project 2471 Technical Report NI 43-101 – March 21, 2016 | | Page 16-3 |
| | |
| | www.rpacan.com |
OPEN PIT DESIGN
The open pit designs are based upon an optimized pit design followed by a detailed design and the development of phase plans for each of the pits. The design uses metal prices, costs, and recoveries based upon operating experience. Pit slopes are based upon geotechnical assessments by a third party, and Cortez has a geotechnical engineer on staff to provide ongoing review of the pit slope performance. Dewatering factors also play a major role in the design and development of the open pits with regard to operation efficiencies and geotechnical factors.
MINE DESIGN PARAMETERS
The open pit designs include consideration of the dewatering requirements and of the different types of waste that may be encountered during stripping. At the CHOP, a protected cultural area was declared on the northeast side of the pit, which has limited the pit expansion on that side.
The following design criteria were used for the Cortez Hills and Pediment open pits:
| | • | | 50 ft bench height on primary stripping benches and final walls; |
| | • | | 20 ft bench height within refractory ore benches as needed; |
| | • | | Fresh rock inter-ramp wall slope angles range from 35° to 43° depending on material type and wall orientation; |
| | • | | Bench face angles planned to be 65°; |
| | • | | 12% maximum haul road grade, typically 10%; |
| | • | | 120 ft wide haul roads; |
| | • | | Minimum mining width of 250 ft, however, narrower widths are mined over short distances, e.g., ramp drop cuts. |
The following design criteria are used for the Pipeline, Gap, and Crossroads open pits:
| | • | | 40 ft to 50 ft bench height on primary stripping benches; |
| | • | | 40 ft to 50 ft bench height on ore benches; |
| | • | | 20 ft bench height on ore benches in case that its needed; |
| | • | | Alluvium inter-ramp wall slope angle varying from 35° to 49°; |
| | • | | Fresh rock inter-ramp wall slope angles ranging from 37° to 50° depending on material type and wall orientation; |
| | • | | Bench face angles ranging from 35° to 70° depending on material type; |
| | • | | 12% maximum haul road grade, typically 10%; |
| | • | | 120 ft wide haul roads; |
| | |
Barrick Gold Corporation – Cortez Operations, Project 2471 Technical Report NI 43-101 – March 21, 2016 | | Page 16-4 |
| | |
| | www.rpacan.com |
| | • | | Minimum mining width of 300 ft in Crossroads and 250 ft in Pipeline, however, narrower widths are mined over short distances, e.g., ramp drop cuts. |
GEOMECHANICS
The geotechnical model is a compilation of information sourced from geotechnical cell mapping, geological mapping, core logging, and supplementary drilling designed to intersect areas of geotechnical interest, material strength, highwall performance, and hydrological data. Material strength estimates for the Cortez deposits are derived from:
| | • | | Historic and current material strength testing programs conducted by various consultants. |
| | • | | Core logging by Barrick and external consultant geologists and geotechnical engineers from drill holes located in and around the deposits. |
| | • | | Back-analysis of historical failures in similar rock types. |
Golder, and more recently Piteau Associates Engineering, Ltd. (Piteau), have conducted extensive geotechnical studies on the Pipeline, South Pipeline, Crossroads, and Gap deposits. All four deposits are overlain with up to approximately 600 ft to 800 ft (i.e., Crossroads) of alluvium material. The inter-ramp angles for alluvium are 49° at Pipeline and up to 43° at Cortez Hills/Pediment pit area. In the Pipeline and South Pipeline deposits, final wall slopes in rock are designed with inter-ramp angles ranging from 34° to 50° depending on rock type and wall orientation. The geotechnical work on Crossroads and Gap in 2001 concluded that similar slope design criteria could be applied to these deposits. Subsequent pit designs have incorporated geological, geotechnical, and hydrological conditions so as to provide safe operating conditions.
Golder (2006) recommended a static loading factor of safety of 1.2, and a seismic factor of safety of 1.0. The Operating Basis Earthquake (OBE) acceleration associated with the Crescent Fault is 0.18g. A pseudostatic coefficient equal to 50% of the OBE acceleration, or 0.09g, was applied to evaluate the effects of seismic loading on stability.
Mining operations have been proceeding in these areas since 1998. Cortez undertakes constant monitoring of pit walls through geotechnical cell mapping, geological structure mapping, groundwater monitoring, bench inspections, slope stability, and slope movement analyses. For the most part, the pit walls appear to be in good condition. A high wall multi-bench failure occurred on the west wall of Pipeline, the failure has limited access to the bottom of Phase 9. Cortez actively manages the pit wall failure risks.
| | |
Barrick Gold Corporation – Cortez Operations, Project 2471 Technical Report NI 43-101 – March 21, 2016 | | Page 16-5 |
| | |
| | www.rpacan.com |
Piteau is the geotechnical engineering consultant of record for the Cortez Hills open pit development, and has developed the pit design for the bench scale (including bench face angle and berm widths), inter-ramp scale (inter-ramp angle), and overall slope scale (overall angle). The inter-ramp slope angles range from 37° to 45° depending on rock type and wall orientation. The Cortez Hills Phase 6 pit design sectors are shown in Figure 16-2. A minimum Factor of Safety of 1.2 is required for all inter-ramp and overall slopes.
Summarized below are important geotechnical and hydrogeological recommended by Piteau on July 4, 2014 for the CHOP, and these factors can also be generally applied to the Pipeline pit:
| | • | | Nine distinct hydrogeological compartments in the CHOP, which will require redundant capacity of deep wells (+3,000 ft) and horizontal drains. |
| | • | | Investigate 50 ft high bench designs. |
| | • | | A reduction of Hoek-Brown (2002) Disturbance Factors to account for blasting, stress relief, and slope relaxation based on calibrated, Universal Distinct Element Code (UDEC) modelling of the east wall in the Cortez Hills/Pediment pit. |
| | • | | Use best practice blasting techniques to minimize back break, but maintain optimum rock fragmentation. |
| | • | | Update numerical modelling of the pit to actively monitor the east wall in the CHOP. |
| | |
Barrick Gold Corporation – Cortez Operations, Project 2471 Technical Report NI 43-101 – March 21, 2016 | | Page 16-6 |
| | |
| | www.rpacan.com |
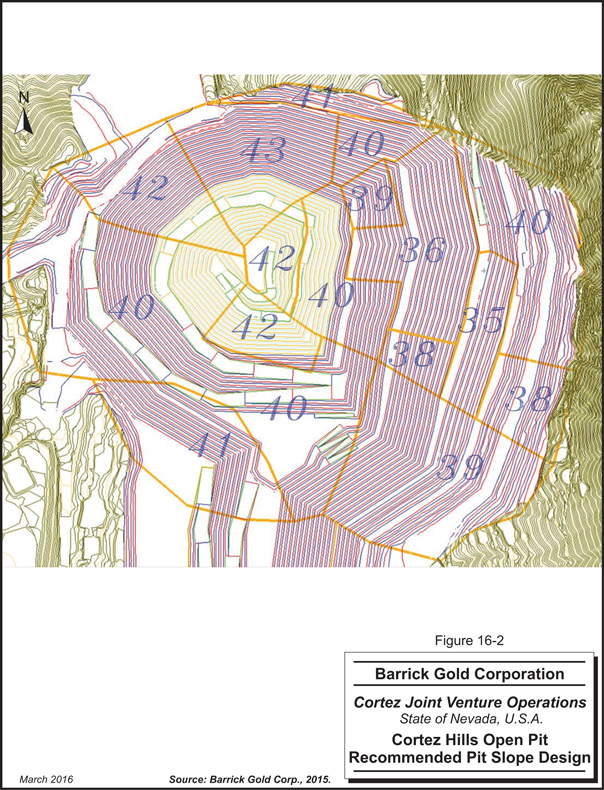
| | |
Barrick Gold Corporation – Cortez Operations, Project 2471 Technical Report NI 43-101 – March 21, 2016 | | Page 16-7 |
| | |
| | www.rpacan.com |
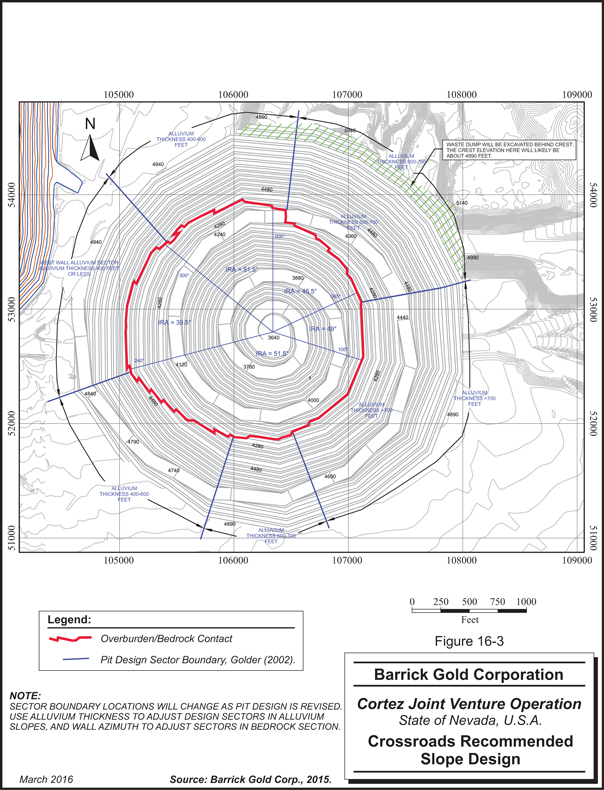
| | |
Barrick Gold Corporation – Cortez Operations, Project 2471 Technical Report NI 43-101 – March 21, 2016 | | Page 16-8 |
| | |
| | www.rpacan.com |
During the FS work for Cortez Hills, relatively poor rock quality conditions were noted in many portions of the proposed pit area, particularly in the northeast, east, and southeast walls in the vicinity of the Cortez Fault Zone, which is located on the east side of the deposits near the base of Mount Tenabo. Maintaining the stability of pit walls, haul roads, and access ramps will require depressurizing zones of high pore pressure up to approximately 1,500 ft behind the pit wall. Maintaining stability will also require limiting the overall and inter-ramp slope angles, excavating wide catch benches/step-outs at designated vertical intervals during excavation of the pit wall, and reducing the potential for inter-ramp slope failures along geologic structures through the use of controlled blasting techniques and managed sinking rates.
DEWATERING
Dewatering is a priority for the Pipeline, Crossroads, Cortez Hills, and Pediment open pit operations. At the Pipeline pit, there are a series of dewatering wells around the perimeter of the pit. These dewatering wells discharge water, which is used for operations and discharged to ground infiltration areas called RIBs. There is a permitted limit on the dewatering rate and Cortez has a dewatering model to predict the rate of dewatering and for planning the locations for wells. The following list summarizes the dewatering amounts for the Cortez mine as referenced in the LOM2015 – MinePlan Summary_v01:
| | • | | Permitted Total Pumping Rates Nevada Department of Water Resources (NDWR) – 44,816 gpm annualized (72,288.4 AFA). |
| | • | | Permitted Dewatering Rate Bureau of Land Management (BLM), 2008 – 36,100 gpm. |
| | • | | Permitted Irrigation Rates NDWR – 4,089 gpm annualized (6,595.27 AFA). |
| | • | | Permitted Consumptive Use Rates NDWR – 3,099 gpm annualized (4,998.74 AFA). |
| | • | | Permitted Infiltration Rates Nevada Department of Environmental Protection (NDEP) Water Pollution Control Permit (WPCP) NEV0095111 – 34,500 gpm (55,648.7AFA). |
| | • | | Permitted Consumptive Rate BLM, 2004e – 34,500 gpm. |
The Cortez Hills/Pediment pit area hydrogeological blocks are more compartmentalized than the Pipeline/Crossroads pit hydrogeological blocks, due to complicated structures, rock types, and pumping depths. One of the major challenges for the successful depressurization/dewatering of the Cortez Pits is the deep bedrock pumping of the aquifers with submersible well pumps that have installed motor horsepower’s of 1,500 hp, which are some of the largest size submersible pump motors manufactured. The installation of surface
| | |
Barrick Gold Corporation – Cortez Operations, Project 2471 Technical Report NI 43-101 – March 21, 2016 | | Page 16-9 |
| | |
| | www.rpacan.com |
booster pumps helps reduce the load/stress on the submersible well pumps. Additional deep wells (3,000 ft to 4,000 ft deep) are required in the Cortez Hills area.
The dewatering operations are modelled to keep the groundwater 50 ft to 100 ft below the pit bottom in the Pipeline pit area. The water is either used in the process facilities (3,099 gpm), irrigation (4,089 gpm), or infiltrated back into the groundwater via infiltration basins (34,500 gpm).
Dewatering of the open pits should continue to be an important priority of the Cortez operation. In conjunction with the dewatering, careful highwall slope monitoring is being done and should be continued.
OPEN PIT PRODUCTION SCHEDULE
The LOM plan schedule is based upon keeping Cortez Mill No. 2 operating at full capacity. There is no planned shutdown, beyond routine maintenance, of the Cortez mill within the LOM plan. Ore will be stockpiled in some years and/or the cut-off grade between leach and mill will be managed to maintain the mill feed. As refractory ore is mined, it is first stockpiled, then it is shipped to Barrick’s Goldstrike operation, which is approximately 70 mi north of Cortez, for processing. Refractory ore trucking is currently subject to permitted tonnage limitations of approximately 1.2 Mstpa. The over-the-highway trucks have an approximate capacity of 23 tons per load.
The open pit mining plan for a given pit is developed by setting up haulage strings by pit, by location in the pit, by pit phase, and by delivery point. With the application of truck speeds, cycle times are then estimated, and with the application of truck availability the total haulage capacity is estimated and scheduled. The same schedule is used to generate the equipment replacement and retirement schedule. Within the scheduling process, the operation is considered to be truck limited. A shovel schedule is maintained, however, as previously noted, the limiting factor in the schedule is considered to be the haulage capacity.
The various open pits are scheduled considering the ore and waste quantities, ore grades, and the centralization of activity to the extent possible. Current mine life is estimated to be eight years (2016–2023). Average, total daily open pit mine production from the Cortez operation is estimated to 400,000 stpd.
| | |
Barrick Gold Corporation – Cortez Operations, Project 2471 Technical Report NI 43-101 – March 21, 2016 | | Page 16-10 |
| | |
| | www.rpacan.com |
Production is currently focused on the CHOP for the period of 2016 through 2018. The modifications to the mine schedules, due to the slow receipt of initial permits and concerns with respect to the stability of the northeastern corner of the Phase 4, have led to an uneven schedule of ore delivery. The permitting delays and highwall stability issues have also resulted in large waste stripping commitments followed by ore production, which must be stockpiled to even out the ore flow to the Cortez Mill No. 2. Table 16-2 is a LOM mine production summary from all of the Cortez open pit operations.
Mining of the Pipeline and Crossroads pit area will primarily be composed of waste mining from 2016 to 2018. Primary ore mining from Pipeline and Crossroads is currently estimated to take place from 2018 through 2023.
TABLE 16-2 CORTEZ OPERATION – LOM OPEN PIT PRODUCTION
Barrick Gold Corporation – Cortez Operations
| | | | | | | | | | | | | | |
Year | | Total Tons
Mined
(000) | | Tons
Per Day | | Tons of Ore
(000) | | Grade
(oz/st Au) | | Contained
Gold
(oz) | | Tons
Waste
(000) | | Stripping
Ratio |
2016 | | 168,844 | | 461,321 | | 25,117 | | 0.032 | | 795,315 | | 143,727 | | 5.7 |
2017 | | 166,756 | | 456,866 | | 12,082 | | 0.101 | | 1,223,721 | | 154,674 | | 12.8 |
2018 | | 167,606 | | 459,195 | | 14,899 | | 0.067 | | 1,005,451 | | 152,707 | | 10.2 |
2019 | | 167,606 | | 459,195 | | 12,982 | | 0.041 | | 536,194 | | 154,624 | | 11.9 |
2020 | | 143,385 | | 391,762 | | 13,064 | | 0.032 | | 422,546 | | 130,321 | | 10.0 |
2021 | | 130,682 | | 358,033 | | 23,769 | | 0.015 | | 365,441 | | 106,913 | | 4.5 |
2022 | | 93,758 | | 256,871 | | 26,919 | | 0.020 | | 543,093 | | 66,839 | | 2.5 |
2023 | | 60,526 | | 165,826 | | 11,741 | | 0.056 | | 660,971 | | 48,785 | | 4.2 |
2024 | | 15,788 | | 40,516 | | 6,228 | | 0.126 | | 787,431 | | 8,561 | | 1.37 |
Totals | | 1,114,951 | | | | 146,801 | | 0.043 | | 6,340,163 | | 967,151 | | 6.59 |
Note: Schedule includes re-handle
Table 16-3 is a summary of the CHOP operation, which consists of the Cortez Hills and Pediment pits.
| | |
Barrick Gold Corporation – Cortez Operations, Project 2471 Technical Report NI 43-101 – March 21, 2016 | | Page 16-11 |
| | |
| | www.rpacan.com |
TABLE 16-3 CORTEZ HILLS/PEDIMENT – LOM OPEN PIT PRODUCTION
Barrick Gold Corporation – Cortez Operations
| | | | | | | | | | | | | | |
Year | | Total Tons
Mined
(000) | | Tons
Per Day | | Tons of
Ore
(000) | | Grade
(oz/st Au) | | Contained
Gold
(oz) | | Tons
Waste
(000) | | Stripping
Ratio |
2016 | | 133,216 | | 363,978 | | 18,824 | | 0.038 | | 706,475 | | 114,392 | | 6.1 |
2017 | | 60,797 | | 166,566 | | 9,765 | | 0.122 | | 1,194,412 | | 51,031 | | 5.2 |
2018 | | 13,836 | | 37,908 | | 5,240 | | 0.145 | | 759,194 | | 8,597 | | 1.6 |
Totals | | 207,849 | | | | 33,829 | | 0.079 | | 2,660,081 | | 174,020 | | 5.1 |
Note. Schedule includes re-handle.
Table 16-4 is an open pit mine production summary for the Pipeline and Crossroads pits.
TABLE 16-4 PIPELINE/CROSSROADS – LOM OPEN PIT PRODUCTION
Barrick Gold Corporation – Cortez Operations
| | | | | | | | | | | | | | |
Year | | Total Tons
Mined
(000) | | Tons
Per Day | | Tons of
Ore
(000) | | Grade
(oz/st Au) | | Contained
Gold
(oz) | | Tons
Waste
(000) | | Stripping
Ratio |
2016 | | 35,628 | | 97,343 | | 6,293 | | 0.014 | | 88,840 | | 29,334 | | 4.7 |
2017 | | 105,960 | | 290,300 | | 2,317 | | 0.013 | | 29,309 | | 103,643 | | 44.7 |
2018 | | 153,770 | | 421,286 | | 9,659 | | 0.025 | | 246,257 | | 144,111 | | 14.9 |
2019 | | 167,606 | | 459,195 | | 12,982 | | 0.041 | | 536,194 | | 154,624 | | 11.9 |
2020 | | 143,385 | | 391,762 | | 13,064 | | 0.032 | | 422,546 | | 130,321 | | 10.0 |
2021 | | 130,682 | | 358,033 | | 23,769 | | 0.015 | | 365,441 | | 106,913 | | 4.5 |
2022 | | 93,758 | | 256,871 | | 26,919 | | 0.020 | | 543,093 | | 66,839 | | 2.5 |
2023 | | 60,526 | | 165,826 | | 11,741 | | 0.056 | | 660,971 | | 48,785 | | 4.2 |
2024 | | 15,788 | | 40,516 | | 6,228 | | 0.126 | | 787,431 | | 8,561 | | 1.37 |
Totals | | 907,103 | | | | 112,972 | | 0.033 | | 3,680,082 | | 793,131 | | 7.02 |
Note. Schedule includes re-handle.
The mine schedule has been developed to yield an average of 4.4 Mstpa of oxide ore for the Cortez Mill No. 2. The total annual tonnage will be 169.5 million tons in 2016, slightly decreasing to 167.6 million tons in 2017, and 167.6 million tons in 2018.
Table 16-5 shows the approximate percentage of each processing category (leach, oxide mill, and refractory) mined for tonnage and contained gold ounces, respectively. Cortez should refine their use of cross over grades, and standardize the Mineral Reserve reporting with the LOM production schedule.
| | |
Barrick Gold Corporation – Cortez Operations, Project 2471 Technical Report NI 43-101 – March 21, 2016 | | Page 16-12 |
| | |
| | www.rpacan.com |
TABLE 16-5 PERCENTAGES OF MINED PROCESSING ORE TYPES
Barrick Gold Corporation – Cortez Operations
| | | | | | | | | | | | | | | | | | | | | | | | |
Area/Zone | | Mill | | | Leach | | | Refractory | |
| | % of Mill
tons | | | % of
oz | | | % of Leach
tons | | | % of
oz | | | % of Refractory
tons | | | % of
oz | |
Pipeline | | | 4 | | | | 2 | | | | 15 | | | | 13 | | | | 1 | | | | 1 | |
Crossroads | | | 44 | | | | 26 | | | | 66 | | | | 66 | | | | 31 | | | | 20 | |
Cortez Hills | | | 18 | | | | 24 | | | | 6 | | | | 7 | | | | 21 | | | | 18 | |
Pediment | | | 16 | | | | 7 | | | | 13 | | | | 14 | | | | 0 | | | | 0 | |
Open Pit Subtotals | | | 82 | | | | 58 | | | | 100 | | | | 100 | | | | 53 | | | | 39 | |
Breccia Zone | | | 1 | | | | 2 | | | | 0 | | | | 0 | | | | 0 | | | | 1 | |
Middle Zone | | | 2 | | | | 6 | | | | 0 | | | | 0 | | | | 14 | | | | 24 | |
Lower Zone | | | 2 | | | | 5 | | | | 0 | | | | 0 | | | | 16 | | | | 26 | |
Deep South Zone | | | 10 | | | | 27 | | | | 0 | | | | 0 | | | | 2 | | | | 3 | |
Underground Subtotals | | | 15 | | | | 40 | | | | 0 | | | | 0 | | | | 33 | | | | 54 | |
Mill Stockpiles | | | 3 | | | | 2 | | | | | | | | | | | | | | | | | |
Leach Stockpiles | | | | | | | | | | | 0 | | | | 0 | | | | | | | | | |
Refractory Stockpiles | | | | | | | | | | | | | | | | | | | 13 | | | | 8 | |
Stockpile Subtotals | | | 3 | | | | 2 | | | | 0 | | | | 0 | | | | 13 | | | | 8 | |
OPEN PIT INFRASTRUCTURE
The open pit infrastructure has been developed at both the CHOP and Pipeline areas. There are shops and offices at the Pipeline mill area to support open pit operations at the Gap, Pipeline, and Crossroads pits, and there are shops and offices at the CHOP to support operations in that area.
The road network for haulage and for light vehicle access is well developed, and there are multiple stockpile areas with storage based upon the grade and processing type of the material being stockpiled.
OPEN PIT EQUIPMENT AND MAINTENANCE
There is an extensive mobile equipment fleet at the Cortez Operations. The major surface mobile equipment is listed in Table 16-6. Dozers (including large rubber-tire dozers), graders, blast hole drills, maintenance vehicles, a heavy haul trailer, and other equipment are present to support the operations. The Cortez operation has an adequate number of primary and support equipment, and the equipment is properly maintained.
| | |
Barrick Gold Corporation – Cortez Operations, Project 2471 Technical Report NI 43-101 – March 21, 2016 | | Page 16-13 |
| | |
| | www.rpacan.com |
TABLE 16-6 MAJOR OPEN PIT EQUIPMENT
Barrick Gold Corporation – Cortez Operations
| | | | | | | | |
Unit | | 2015 Number
of Units | | LOM Average
Number of
Units | | LOM Average
Availability
(%) | | LOM Average
Utilization
(%) |
Liebherr T282B trucks (400 st) | | 25 | | 19 | | 80 | | 70 |
Caterpillar 795F trucks (345 st) | | 30 | | 30 | | 88 | | 70 |
P&H 4100 XPB shovel | | 5 | | 2 | | 87 | | 93 |
P&H 2800 XPB shovel | | 2 | | 3 | | 87 | | 90 |
EX-5500 excavator | | 3 | | 1 | | 85 | | 85 |
L2350 loader1 | | 1 | | 1 | | | | |
Rubber tire dozer1 | | 4 | | 8 | | | | |
Crawler dozer1 | | 2 | | 9 | | | | |
Caterpillar 16H grader1 | | 1 | | 2 | | | | |
Caterpillar 24H grader1 | | 7 | | 4 | | | | |
Atlas Copco PV271 drill | | 2 | | 6 | | 85 | | 75 |
DrillTech SP55 | | 9 | | 1 | | 75 | | 70 |
DrillTech D75K | | 2 | | 1 | | 75 | | 70 |
Water trucks1 | | 4 | | 6 | | | | |
Note 1: 2014 numbers applied to LOM totals.
As of October 2014
In addition, there is a large fleet of light vehicles for crew transportation and supervision. The fleet size is consistent with the needs of this large operation, which is spread over a significant area with outlying facilities.
From a mine planning perspective the mining operation is limited by haulage capacity. Cortez’s truck fleet is currently made up of Caterpillar 795Fs (350 st class) and Liebherr T282Bs (400 st class).
The main loading units are two, P&H 4100 electric shovels (73 yd3 to 77 yd3 buckets); three, P&H 2800 electric shovels (48 yd3 buckets); and one, Hitachi EX-5500 hydraulic excavator (35 yd3 bucket). For planning purposes all the shovels are given target availabilities, machine utilizations, and tons per operating hour (tpoh). For the P&H 4100, 2800, and Hitachi 5500 the planed productivities are approximately 120,000, 70,000, and 45,000 stpd, respectively, during months without planned downs. In 2015, actual P&H 4100, 2800, and Hitachi 5500 shovel productivities averaged approximately 5800 tpoh, 3500 tpoh, and 2400 tpoh, respectively. Truck productivities for the Liebherr T282B and Caterpillar 795F trucks averaged, approximately 730 tpoh and 710 tpoh, respectively in 2015.
| | |
Barrick Gold Corporation – Cortez Operations, Project 2471 Technical Report NI 43-101 – March 21, 2016 | | Page 16-14 |
| | |
| | www.rpacan.com |
A small fleet of self-perform equipment is used to load and haul oxide material from the stockpiles to either the mill, or to the gyratory crusher.
UNDERGROUND MINE
The mining is all mechanized, with large scale equipment. The mining method is underhand cut and fill with a cemented rock backfill. Headings are cycled using conventional drill/blast/muck/support on a round by round basis. Material is loaded into haul trucks, and hauled to surface. Top-cut headings are typically 15 ft by 15 ft and undercut widths vary from 18 ft to 30 ft wide (depending on ground conditions and ore geometry) with 15 ft heights. Wider ore cuts are being implemented to improve productivity and mine production.
The bottom level of the CHOP was originally planned to be the 4,670 ft level; this was the nominal top A cut of the CHUG. Subsequent design changes have resulted in the top of the Breccia Zone moving up to the 4820 level. The pit floor will extend to the 4,525 ft level, however, the high grade centre portion will be a CRF material.
Mine production was approximately 2,100 stpd of ore in 2015. The Breccia Zone production has been decreasing as the reserves in that zone are depleted and the Middle Zone tonnage has been increasing through the year. In 2015, the majority of mine production was still from the Breccia Zone, however, that will change to the Middle Zone in 2016. Lower Zone production and the RFD development are scheduled to begin in 2016. The exploration drift on the 3,800 ft level has been extended to permit further exploration of the Deep South Zone.
Over the past four years the mine production has been steady at approximately 2,200 stpd ore. Over the same period, the grade has decreased from 1.07 oz/st Au to 0.63 oz/st Au.
MINE DESIGN
The CHUG is accessed by twin declines driven to the upper level of the deposit. Access for the lower levels of Breccia Zone and to the Middle and Lower Zones is by a spiral ramp adjacent to the orebody. The twin declines are interconnected at regular intervals and these connections contain air doors to separate the intake and exhaust airways. At the portal area, there are permanent offices and maintenance facilities together with a backfill plant and shotcrete batch plant. In 2016, development of an additional set of twin declines (RFD), for
| | |
Barrick Gold Corporation – Cortez Operations, Project 2471 Technical Report NI 43-101 – March 21, 2016 | | Page 16-15 |
| | |
| | www.rpacan.com |
access to the Lower Zone, will begin. The declines will provide additional means of egress as well as house a conveyor for ore and waste transport from the Lower and Deep South Zones. The mining is all mechanized with large scale equipment.
The plan is to expand the production tonnage rate through the mining of the Middle and Lower zones and then to further increase the production rate with the addition of the Deep South Zone. The increase in production rate over time is shown in Figure 16-4. The gold grade and contained gold in the mine feed are shown in Figure 16-5.
FIGURE 16-4 CHUG LOM MINE PRODUCTION RATE
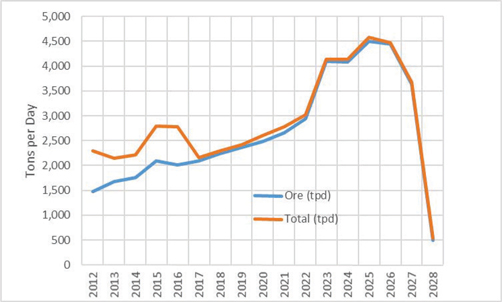
Source: Barrick 2016
| | |
Barrick Gold Corporation – Cortez Operations, Project 2471 Technical Report NI 43-101 – March 21, 2016 | | Page 16-16 |
| | |
| | www.rpacan.com |
FIGURE 16-5 CHUG LOM GOLD PRODUCTION AND HEAD GRADE
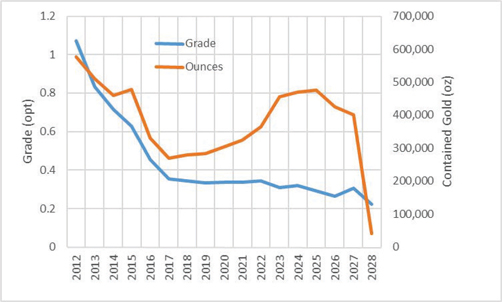
Source: Barrick 2016
BRECCIA ZONE
The mining is carried out by underhand drift and fill with a CRF. Ore is drilled with two boom jumbos, blasted on a round by round basis, loaded into haul trucks, and hauled to surface. The top cut headings are 15 ft high by 15 ft wide. Successive headings (under backfill) are 15 ft high by 20 ft wide and the plan is to increase the width of these headings to 30 ft.
Access headings are typically 16 ft wide by 16 to 18 ft high. The 18 ft heading is needed to provide space for the rigid ventilation ducting.
The Breccia Zone was broken into 75 ft high sections (five cuts) and mined by first taking a top or “A cut” in a section. The A cut is mined to the extent of the high grade (typically, the 0.20 oz/st grade shell), and each drift is filled after mining. The B cut is then taken below the A cut in the same fashion. The E cut is the final cut in a section, and in this case, the floor and back of the stope drives are a CRF. The cuts are offset by a small angle so that the successive CRF “beams” are not exactly over one another.
MIDDLE ZONE
The Middle Zone was initially planned to be mined using blast hole stopes and the mining rate was planned to be increased to 2,500 stpd. After review of the geometry of the Middle Zone
| | |
Barrick Gold Corporation – Cortez Operations, Project 2471 Technical Report NI 43-101 – March 21, 2016 | | Page 16-17 |
| | |
| | www.rpacan.com |
the mining method was changed back to cut and fill mining. This is again under review in the search for more productive mining rates.
The current plan is to mine the Middle Zone in the same manner as the Breccia Zone.
LOWER ZONE
The Lower Zone Mineral Reserves are based upon a FS and the APO3 revision to the PoO, approved in September 2015, which was required before development of the new declines to the Lower Zone could commence. The Lower Zone FS is based upon cut and fill mining.
The Lower zone development of the RFDs will extend to the 3800 level. One of the declines will be used as a conveyor gallery for the transport of ore and waste. Ore and waste that must be removed to surface will be handled by LHD and truck to bins above the 3800 level. From there the rock will be conveyed to surface.
Other services such as a backfill plant and service area will also be constructed in the Lower Zone area near the declines.
DEEP SOUTH ZONE
The Deep South Zone Mineral Reserves are based upon the PFS and a planned revision to the PoO to permit dewatering below the 3,800 ft level which is required before that dewatering can commence. With more detailed geological and geotechnical review after the Scoping Study, the access has been relocated to the footwall on the eastern side of the Deep South Zone to avoid crossing dikes and faults. The Deep South Zone development is expected to follow the dewatering downwards. There will be a stope access ramp as well as a conveyor gallery. The conveyor will be built progressively with a total of four legs. Ore and waste from the Deep South Zone will be handled by truck and LHD on the levels and then fed through feeder breakers before being conveyed to surface via the Deep South and RFD conveyor systems.
The Deep South Zone PFS is based upon long hole stoping with a sequence of primary and secondary stopes.
| | |
Barrick Gold Corporation – Cortez Operations, Project 2471 Technical Report NI 43-101 – March 21, 2016 | | Page 16-18 |
| | |
| | www.rpacan.com |
GEOMECHANICS AND GROUND SUPPORT
GEOTECHNICAL INVESTIGATIONS MIDDLE AND LOWER ZONES
SRK Consulting (Canada) Inc. (SRK) completed a geotechnical assessment of the Middle Zone and Lower Zone based on data collected over a period of seven years. The Lower Zone is an elongated, tabular, shallowly dipping body located within the plane of a low-angle thrust complex that is divided into three domains. Ground conditions outside the plane of the thrust complex are expected to be good to excellent, with rock mass rating (RMR) over 75. Within the complex echelon thrust (known as the Ponderosa fault), which hosts the bulk of mineralization, geotechnical conditions worsen, with RMRs less than 55.
Complex anastomosing faults with heavy decalcification and volume loss in the ore contribute to poor RMR and rock quality designation (RQD). The clay-altered margins of post-ore dikes have RMRs in the 35 to 45 range and below; however, they are generally narrow (<10.0 ft true thickness). The dikes themselves may create aquitards and small-volume perched aquifers, complicating geotechnical conditions. Complete dewatering of the mineable zones will be critical to successful operations.
The geotechnical conditions in the Middle Zone and Lower Zone were evaluated using an assessment of drill core from geologic and geotechnical drilling programs. SRK created a geotechnical block model for the Breccia Zone, Middle Zone, and Lower Zone, and attempted a correlation between the drill hole geotechnical data and the observed ground conditions in the Breccia Zone. This correlation was extrapolated to the Middle Zone and Lower Zone.
The following points summarize the data review completed for the available geotechnical data at Cortez Hills.
| | • | | Good data coverage for the Breccia Zone, moderate-to-good for the Middle Zone, and limited for the Lower Zone. |
| | • | | No structural orientation data (except for limited mapping) for the Middle Zone and Lower Zone. |
| | • | | Categorization of joint conditions in historic data. |
| | • | | Uncertainty of RQD and intact rock strength (IRS) conducted through core logging in all areas. |
| | • | | Limited laboratory strength testing. |
| | |
Barrick Gold Corporation – Cortez Operations, Project 2471 Technical Report NI 43-101 – March 21, 2016 | | Page 16-19 |
| | |
| | www.rpacan.com |
| | • | | Limited QA and QC systems implemented on geotechnical data collection and database. |
SRK believes that the current database is of sufficient quality and density to be used for input to a geotechnical block model.
The geotechnical block model is considered viable for parameter estimation through the Breccia Zone and Middle Zone, and northern portions of the Lower Zone (north of approximately 28300N). Confidence level decreases and estimation risk increases in the southern portions of the Lower Zone as drill hole spacing increases.
Given the limited drill hole coverage in the Lower Zone (and therefore risks to confidence levels), the rock mass evaluation considered each pod as an individual entity based solely on the drill holes intersecting each pod. A re-evaluation of the geotechnical data is not considered necessary for the planned cut-and fill mining methods. Man-entry opening span designs were empirically assessed and determined to be 16 ft to 25 ft in fair rock and less than 10 ft in poor rock.
Longhole stoping opportunities were assessed to develop guidelines for design should longhole stoping mining methods be determined to be appropriate for mining the Lower Zone. The generally weak rock mass, depth, and structure appear to significantly limit longhole stope dimensions. Stability numbers generally plot in the lower range of the database where the stable transition zone is wide, and therefore uncertain. Maximum hydraulic radii for stope configurations are generally <16.4 ft for most stope surfaces, but still carry significant failure risks, which equates to small stopes.
Stope pillars were analyzed by tributary area methods using the Obert pillar formula (Obert and Duvall 1967). A range of pillar configurations at various extraction ratios was examined, and it can be seen that pillar load / extraction dominates stability more than pillar geometry. Stability issues appear at approximately 50% extraction, regardless of pillar geometry. SRK cautions that in poor rock conditions, the problem appears at even lower extraction, approximately 20% to 25%, and further indicates that a longhole stoping mining method in these ground conditions is unsuitable. While this is the most conservative position, ore bodies with similar rock conditions have been successfully mined using longhole stoping mining methods in northern Nevada.
| | |
Barrick Gold Corporation – Cortez Operations, Project 2471 Technical Report NI 43-101 – March 21, 2016 | | Page 16-20 |
| | |
| | www.rpacan.com |
Ground support requirements were determined empirically and by analytical methods. Empirical methods are general and do not define the mechanisms involved in support mechanics, but do offer a good initial estimate.
Continued geotechnical data collection will provide the greatest benefit to the Lower Zone areas. As infill drilling continues along the strike of the Lower Zone, the geotechnical block model can be updated and geotechnical domains established for the Middle Zone. The 2012 drilling updates improved the integrity of the model and showed no need to downgrade previous assumptions.
The current version of the block model should be calibrated and interrogated against actual rock mass conditions, on an ongoing basis, as the areas are exposed underground.
GEOTECHNICAL INVESTIGATION DEEP SOUTH ZONE
Pre-feasibility level geotechnical characterization and assessments were carried out for the determination of longhole stope dimensions and to predict interaction between active production and the underground infrastructure.
Geotechnical core logging has historically been carried out by Cortez Exploration site wide. Since 2014, and to meet Deep South specific requirements, geotechnical core logging has also been done by Golder Associates, Inc (Golder). Early assessment for the Lower Zone by SRK Consulting (SRK) (2011) discouraged the usage of long hole stopes, which was a premise reviewed in the Deep South Zone PFS.
In early 2015, Mine Design Engineering (MDEng) was engaged to provide rock mechanics assessments for determination of stope dimensions and ground support requirements. Geotechnical assessments were completed with the geological interpretations and models provided by Cortez Exploration in Q3 2015, including deposit scale faults, geological contacts. In addition, the geotechnical core logging and oriented core databases developed from the Golder core logging program were also used.
The geotechnical database included approximately 28,000 ft of geotechnical core logging, point load testing and a core sampling and laboratory testing program. A supplementary geotechnical database consisting in over 120,000 ft of core maintained by Cortez Exploration was used to provide additional coverage for context purposes.
| | |
Barrick Gold Corporation – Cortez Operations, Project 2471 Technical Report NI 43-101 – March 21, 2016 | | Page 16-21 |
| | |
| | www.rpacan.com |
MDEng broke down the deposit in three broad geotechnical domains that accounted for the relative distribution of the gold mineralization and the dikes system: the Dike Hanging Wall (Dike HW), imbricated within dikes (within dikes) and the Dike Footwall but in the hanging wall of the Pondex Fault (Dike FW) as depicted in Figure 16-6.
Ground conditions were interpreted to vary from fair to good with mean RMR ranging between 55 and 65. Q’ values rate as very good. A gradual deterioration of ground conditions is observed towards the south into the Dike FW domain. Mean geotechnical parameters per zone and rock formation are presented in Table 16-7.
TABLE 16-7 ROCK MASS CHARACTERIZATION FOR THE DEEP SOUTH ZONE
Barrick Gold Corporation – Cortez Operations
| | | | | | | | | | | | | | | | | | | | | | | | | | | | |
| | | | | North (mostly Dike HW) | | Central (mostly Within Dike) | | South (mostly Dike FW) | | | | |
| | | | | Srm | | Ohc | | QP | | | | Srm | | Ohc | | QP | | | | Srm | | Ohc | | QP | | | | |
Hardness | | | | R3.9 | | R3.9 | | R3.6 | | | | R4.3 | | R4.3 | | R3.8 | | | | R3.2 | | R2.6 | | R2.5 | | | | |
RQD | | | | 76% | | 62% | | 73% | | | | 79% | | 67% | | 63% | | | | 59% | | 25% | | 41% | | | | |
Spacing (ft) | | | | 1.4 | | 1.1 | | 1.6 | | | | 1.4 | | 1.3 | | 1.1 | | | | 1 | | 0.4 | | 0.8 | | | | |
RMR | | | | 63 | | 58 | | 61 | | | | 65 | | 61 | | 57 | | | | 52 | | 37 | | 44 | | | | |
North sector generally north of N-26750; South sector generally south of N-2600 | | | | | | |
| | | |
Hardness scale according to field ISRM scale from R0 to R6 | | | | | | |
| Notes: | Srm refers to the Silurian Roberts Mountain Formation |
Ohc refers to the Ordovician Hanson Creek Formation
QP refers to the Quartz Porphyritic Intrusions
| | |
Barrick Gold Corporation – Cortez Operations, Project 2471 Technical Report NI 43-101 – March 21, 2016 | | Page 16-22 |
| | |
| | www.rpacan.com |
FIGURE 16-6 GEOTECHNICAL DOMAINS
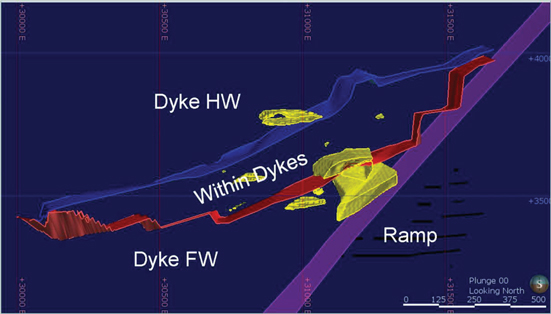
Source: Barrick 2016
MDEng broke the mining area into eight mining domains. Allowable hydraulic radii for the mining domains were estimated using Potvin’s (1988) Modified Mathews Stability Graph. These hydraulic radii are summarized in Table 16-8 and provide the basis for the stope dimensions.
TABLE 16-8 SUMMARY OF PROPOSED HYDRAULIC RADII BY GEOTECHNICAL DOMAIN
Barrick Gold Corporation – Cortez Operations
| | | | | | |
| | | Footwall Domain
(ft) | | Dyke Domain
(ft) | | HW Domain
(ft) |
Back - supported | | 8.2 | | 8.2 to 9.8 | | 9.8 |
Back - unsupported | | 11.5 | | 11.5 to 13.1 | | 13.1 |
N&S Walls | | 8.2 to 13.1 | | 8.2 to 13.1 | | 11.5 to 14.1 |
E&W Walls | | 9.8 to 11.5 | | 9.8 to 11.5 | | 11.5 |
Based on these recommendations, long hole stopes 20 ft wide in the primary and 30 ft wide in the secondary stopes, and 75 ft sill-to-back heights were feasible in the Dike FW and Within Dikes domains. In the more competent Dike HW, long hole stopes 25 ft wide in the primary and 35 ft wide in the secondary stopes were recommended. MDEng recommended panel lengths of 21 ft to 44 ft.
| | |
Barrick Gold Corporation – Cortez Operations, Project 2471 Technical Report NI 43-101 – March 21, 2016 | | Page 16-23 |
| | |
| | www.rpacan.com |
RPA notes that the relatively short panel lengths will increase the scheduling complexity and costs in the planned long hole stoping as each panel will need a slot raise and will need to be filled before successive panels can be mined. The PFS did not consider this level of detail in the mine planning. RPA recommends that the stope designs be reviewed considering the recommended panel lengths and stope orientations provided by MDEng.
UNDERGROUND DEVELOPMENT
The underground development consists of a main ramp and production level accesses spaced vertically every 60 ft. While the main ramp is located in the footwall of the Pondex Fault, all the secondary development for accessing the stopes in production must cross the Pondex Fault from the east.
FIGURE 16-7 MAIN RAMP LAYOUT RELATIVE TO GEOLOGICAL FEATURES, LOOKING NORTH
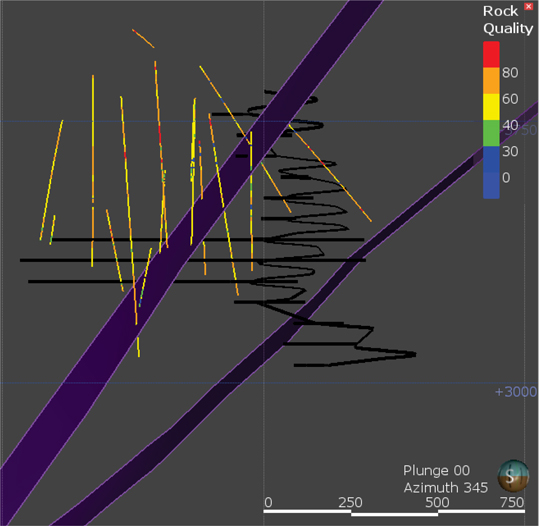
Source: Barrick 2016
| | |
Barrick Gold Corporation – Cortez Operations, Project 2471 Technical Report NI 43-101 – March 21, 2016 | | Page 16-24 |
| | |
| | www.rpacan.com |
This infrastructure corresponds to the Ramp domain. The domain is formed by Srm rock units and has been minimally investigated as it has been outside the Exploration area of interest. Two geotechnical core holes were drilled and logged into this domain; these core holes showed a fair to very good rock mass, hard limestone and dikes with RMR between 60 and 80 but with localized fractured intervals in both dikes and limestone and even fewer intervals with altered/soft rock.
For the Pondex Fault itself, a high level inspection of RMR suggests that Fair to Poor ground conditions can typically be expected. The area is located in a structurally complex zone, where high and low angles faults and dike filled faults occur. Geological interpretations are limited in this area but are enough to recognize possible splays of the Pondex Fault, such as the Bugsby Fault (Bugsby), near the south end of the Deep South. Conditions of sympathetic features like Bugsby are undetermined. As the ramp is sited between these faults, more drilling throughout the far south is required.
NUMERICAL MODELLING
A pre-feasibility level numerical model was developed by MDEng (2015b) in FLAC3D to investigate the possible interactions between the long term infrastructure and the production areas in terms of induced high stresses. Results of these analysis indicated that the proposed main ramp is situated beyond the regions of significant mine induced redistribution of induced stresses and that no adverse stress loading or stress shadowing of the ramp is predicted by the model.
Level accesses will be exposed to stress loading with damage ranging from minor bulking of ribs to severe squeezing and extensive rehabilitation or ultimately loss of access. MDEng noted that these simulations were explicitly run under a conservative set of parameters.
MDEng provided the following recommendations for further geotechnical work:
| | • | | Use of the structural model for further engineering work. |
| | • | | Refinement of the structural model to enable the designer to spatially locate them in the stopes and identify ground control issues. |
| | • | | Identification of additional faults outside of the deposit area especially in the footwall of the Pondex fault. |
| | |
Barrick Gold Corporation – Cortez Operations, Project 2471 Technical Report NI 43-101 – March 21, 2016 | | Page 16-25 |
| | |
| | www.rpacan.com |
| | • | | Modelling of both favourable and adverse alteration modes in and around the Deep South will augment the deposit understanding as well as refining the extents of the geotechnical domains. |
| | • | | Continued geotechnical core logging, core orientation, and additional rock sampling and testing. |
| | • | | Drilling of supplementary geotechnical core holes to cover areas outside the mineralized targets. |
| | • | | Continued usage of exploration core holes to cover areas inside the mineralized targets. |
| | • | | Additional discussions in term of quality assurance issues including auditing the database, review of the geotechnical core logging standard, and re-training current and new geotechnicians. |
| | • | | Core logging to be continued by Cortez Exploration in a systematic manner. |
| | • | | Updating of geotechnical assessments to include revisions on the deposit’s structural model, grade shell, supplemental geotechnical core logging data, and oriented core data. |
| | • | | Numerical modelling to support mine optimization should be continued. |
Current groundwater levels are located above the 4000 level. All analysis assumed dry conditions.
GROUND SUPPORT – BRECCIA ZONE, MIDDLE ZONE, AND LOWER ZONE
The ground conditions in the ore zones are poor and the CRF is more competent than the ore. This is the reason for the choice of mining method and the use of CRF. Rock conditions in the host rock are fair to good.
All production openings are backfilled with a designed backfill with a 700 psi unconfined compressive strength (UCS) based on minus two inches crushed rock, 35% fines, and 7.5% cement binder. Cylinder tests indicate that the CRF strength consistently exceeds the design strength.
The standard ground support regime includes the use of shotcrete and eight foot long Swellex bolts with 12 ft Swellex bolts used in intersections. Mesh is used as required. Other support designs are specific to areas where additional support is considered necessary.
| | |
Barrick Gold Corporation – Cortez Operations, Project 2471 Technical Report NI 43-101 – March 21, 2016 | | Page 16-26 |
| | |
| | www.rpacan.com |
GROUND SUPPORT – DEEP SOUTH
MDEng recommended ground support for development headings according to rock quality. There were three general categories depending upon ground conditions:
| | 1. | Seven foot long resin grouted bolts or inflated bolts with screen mesh |
| | 2. | Bolts and screen plus three inches of shotcrete over the screen |
| | 3. | Shotcrete, then bolts and mesh then shotcrete over mesh. |
Long hole open stopes may be designed according to the unsupported or supported hydraulic radius (HR) Guidelines. “Unsupported” stope backs will require primary ground support for man access during top and bottom cut development and drilling. “Supported” stope backs require added secondary support to maintain stability of larger spans. If it is elected to support stope backs it may be assumed that double strand bulbed cable bolts on a 6.5 ft by 6.5 ft pattern or Super Swellex on a five foot square pattern will be utilized (with cable or bolt length equal to 1⁄2 the stope span). The bolting pattern will likely vary by formation or alteration domain due to variable ground conditions (to be refined once more details on mine methods and plans are available.
RPA notes that the unsupported stope wall span is 33 ft and, to gain the benefits of larger stopes, it will be necessary to provide support for the stope walls.
MINING METHOD – BRECCIA ZONE MIDDLE ZONE AND LOWER ZONE
All of the mining to date and the planned mining of the remaining ore is by underhand cut and fill mining with CRF. This method was selected based upon:
| | • | | the poor ground conditions in many areas |
| | • | | the success in Nevada with generating good backs and walls with CRF |
| | • | | the high grade of the orebody and the desire to minimize losses and dilution |
| | • | | the selectivity of the method to separate the different ore types |
| | • | | experience in other area mines with poor ground conditions |
There are disadvantages to the cut and fill mining, most notably:
| | • | | It is an expensive method as it is virtually a drift and fill method. |
| | • | | It is not a highly productive method. |
| | |
Barrick Gold Corporation – Cortez Operations, Project 2471 Technical Report NI 43-101 – March 21, 2016 | | Page 16-27 |
| | |
| | www.rpacan.com |
In the early planning stages for the Middle Zone, long hole stoping was considered and was coupled with plans for increased mine production. However, not all areas of the Middle Zone are considered to be thick enough for the application of a long hole stoping method.
Management have expressed the desire to increase the output from the underground mine and one of the considerations is a move to long hole stoping in areas where the deposit is considered appropriate for such bulk mining.
RPA is of the opinion that a move to some level of long hole stoping may be practical, however, all aspects of such a mining method should be considered. In particular, RPA is of the opinion that there will be higher dilution and ore losses with a long hole method. In higher grade areas, these impacts can quickly offset expected reductions in operating costs.
RPA recommends that Cortez develop a set of orebody characteristics (width, height, grade, rock conditions) considered appropriate for long hole stoping and identify the quantity and location of those portions of the Middle and Lower zones amenable to long hole stoping. This information coupled with assumptions related to operating costs, dilution, and ore loss would permit an evaluation of the method for the Cortez deposit.
MINING METHOD – DEEP SOUTH
The revised geological interpretation of the Deep South Zone coupled with the geotechnical studies of the area and the geometry of ore zones were used to evaluate a number of mining methods which led to the selection of long hole stoping.
The stope dimensions are, in RPA’s opinion, suitable to provide productivity benefits compared to drift and fill mining without being so tall as to increase the risk of excessive dilution due to improper long hole drilling. The geotechnical analysis does indicate that relatively short stope sections will have to be mined to maintain sidewall stability.
Ore will be blasted using vertical down holes and a slot raise to open mining in the stope. The PFS discusses the use of drop raises but RPA recommends the investigation into a small raise drill or a large diameter drill such as the Machine Roger V30 drill. Blasted ore will be mucked using remote control LHDs and hauled by truck or LHD to ore passes. Ore will be sized using a feeder breaker prior to being conveyed to surface.
| | |
Barrick Gold Corporation – Cortez Operations, Project 2471 Technical Report NI 43-101 – March 21, 2016 | | Page 16-28 |
| | |
| | www.rpacan.com |
RPA is of the opinion that the proposed mining method is suitable for the deposit.
GRADE CONTROL
BRECCIA, MIDDLE AND LOWER ZONES
Faces are sampled as the development advances and the sample grades are used to estimate the mine production grade and to determine the limits of the ore drives. This area of the mine is planned using a 0.2 oz/st Au contour. Muck piles are sampled by the LHD operator, who is to take a sample from every fifth bucket, while mucking.
Ore is hauled to surface by truck and if necessary dumped into separate muck piles for each round. On surface the muck piles can be resampled by the geologist to assess the grade. Ore from the Cortez Hills underground may be oxide and sent to the mill at Cortez or it may be refractory and sent to Goldstrike. After the muck pile grade sample results are in, the muck is taken to a metal removal plant for the removal of scrap metal. After that step, the ore is either stockpiled for shipment to Goldstrike or hauled to the Cortez mill for processing.
All rock with an AA/FA ratio of 0.5 and greater as oxide and rock with ratios less than 0.5 are treated as refractory. Refractory ore is sent in lots to Goldstrike. Sample assay data and LECO results are sent to Goldstrike to assist in their handling of the ore. The Cortez Hills underground ore may be processed in either the roaster or the autoclaves at Goldstrike. Oxide ore is processed in the Cortez plant
DEEP SOUTH ZONE
The majority of the ore from the Deep South Zone is projected to be oxide ore which will be processed at the Pipeline Complex mill as long as that plant is in service. After the Pipeline Mill is shutdown, the Deep South ore is scheduled to be processed on the heap leach pads. The refractory ore from the Deep South is all forecast to be from the Renegade area.
Grade control and ore segregation methods have not been outlined in the PFS. These measures will need to be defined for operations. Long hole stoping provides the opportunity to obtain samples from the long holes as they are drilled and this can then be supplemented with bucket sampling as is currently practised.
| | |
Barrick Gold Corporation – Cortez Operations, Project 2471 Technical Report NI 43-101 – March 21, 2016 | | Page 16-29 |
| | |
| | www.rpacan.com |
INFRASTRUCTURE
ACCESS
The current mine access is via the twin declines. The two declines from the F Canyon extend for approximately 7,000 ft at a -6% grade to the 4770 level. The mine is equipped with a main ramp that accesses the Breccia Zone as well as a second ramp that parallels the main spiral, giving access to the Middle Zone 3920 Level and on to the Lower Zone.
Workings continue on the exploration decline for the Lower Zone. Emergency access is a combination of ladderways in the ventilation system as a supplement to the main spiral ramp as well as an emergency hoist in one of the main ventilation raises.
The Lower Zone will be accessed with two RFDs to the 3810 level. The declines will be connected at regular intervals for ease of construction. When the declines are complete, a conveyor will be installed in the west decline and the other decline will be used for access and ventilation. The F Canyon declines will continue to be used for ventilation and access.
Access to the Deep South Zone was originally planned to be by extension of the RFDs to a loading area at the bottom of the Deep South Zone. The geotechnical investigations indicate that the ground conditions for an extension of the RFDs would be poor and the planned sequence would have required complete dewatering of the Deep South before the loading area could be installed. The plan is to develop the stope access decline in the footwall on the eastern side of the Deep South Zone and to develop a four leg conveying system which can be advanced downwards and put into service in steps as the mine is dewatered.
MINE VENTILATION
The underground mine ventilation is achieved with the air entering the mine in the west decline and proceeding via fresh air raises to each sublevel, and exhaust air travelling up the east decline. The twin declines have connections (with airlock doors) at regular intervals.
Two blind bored ventilation shafts were installed for the mine ventilation circuit. The first was a 12 ft diameter raise and the second was a 14 ft diameter raise. The raises are approximately 1,000 ft long and when fully connected to the mine the ventilation capacity of the mine will be increased to 1.2 million cfm.
| | |
Barrick Gold Corporation – Cortez Operations, Project 2471 Technical Report NI 43-101 – March 21, 2016 | | Page 16-30 |
| | |
| | www.rpacan.com |
Deep South ventilation will be fed from the 3910 development drift to the access ramp, through the stoping levels, and exhaust out the haulage ramp. Access points, as well as ventilation raises, will be coordinated with the existing and planned Lower Zone development above the 3800
Ventilation and escape raises are designed to connect between the footwall access levels and the haulage ramp. The primary fresh airway is the man and material access ramp and the exhaust airway is the haulage and conveyor ramp. It is envisioned that a two stage regulator door be installed on each level to regulate air flow. One stage of the regulator would be for normal mining operating ventilation and the second stage to allow direct venting of blasting gases.
MINE DEWATERING – BRECCIA ZONE, MIDDLE ZONE AND LOWER ZONE
There are two mine dewatering lines and a major pump station at the foot of the main declines. The underground mine pumping system in the F Canyon declines has a capacity of 6,000 gpm based upon the initial mine design. As of May 2015, the dewatering rates are 93 gpm of “contact water” from mining activity and 225 gpm of non-contact water from the underground dewatering of the Sage block of the open pit. The active mining areas of the mine have been dewatered and the mine workings were generally dry, with some muddy areas and small puddles in the stope cuts. In the lower areas of the mine there are spots where the back is wet. RPA did not notice water dripping from the back in any location.
In the Breccia Zone and Middle Zone, horizontal drain holes are drilled into the planned stope A cuts before mine development to drain water before mining commences. A similar strategy will be employed when developing levels in the Lower Zone.
The Middle Zone has been dewatered using surface wells. A dewatering plan is in place for the Lower Zone using surface wells.
Projected Lower Zone average pumping rates for the three wells (DW-15, 20 and 21), all from the surface, are as follows:
| | |
Barrick Gold Corporation – Cortez Operations, Project 2471 Technical Report NI 43-101 – March 21, 2016 | | Page 16-31 |
| | |
| | www.rpacan.com |
The three dewatering wells collectively can pump at a rate of 2,900 gpm (10,980 L/min).
Pumping at this rate is projected to have the Lower Zone dewatered to the 3800 level in Q2 2018. The data used for modeling and predictions for the Lower Zone came from the measured responses of the monitoring wells due to DW-15 pumping.
Although the groundwater monitoring system continues to be developed, a spatially well distributed series of test wells and piezometers have been installed. This network of wells will monitor the proposed drawdown along the decline as well as monitor the western portion of the operating boundary.
MINE DEWATERING DEEP SOUTH- FROM SURFACE WELLS
Dewatering below the 3,800 ft level will require revisions to permits. The Deep South Zone PFS timeline assumes that permitting will take approximately three to four years and Barrick expects to commence this process in 2016. On this basis, following the receipt of permits, dewatering and development work could begin as early as 2019 or 2020, with initial production from the Deep South Zone commencing in 2022 or 2023. There has been a significant quantity of hydrogeological investigation related to the dewatering of the Lower Zone and the Deep South portions of the underground deposit. There are indications that the Lower Zone and Middle Zone aquifers are not directly connected. This may impact the dewatering of the zones and the behaviour of the rocks during mining.
Dewatering wells installed between 2010 and 2014 were not screened deep enough to fully dewater the Deep South orebody. While wells DW-15, DW-20, and DW-21 are able to continue pumping after the 3800 level has been dewatered, they will only be able to dewater to a depth of approximately 3200 ft while the Deep South extends to the 3050 level. Five additional pumping wells will be installed to dewater the orebody to below the lowest proposed mining level. These wells will be installed prior to mining below the 3,800 ft level and will be operated along with existing wells in order to achieve the necessary dewatering rate. Estimated average combined pumping rates of 6,900 gpm, with a peak pumping discharge rate of 9,500 gpm, will be needed for seven years to support mining below the 3800 level.
Once water levels reach the 3,800 ft level, pumping from the existing dewatering wells will be throttled back to maintain groundwater levels at the 3,800 ft level. Active dewatering of the ore body is scheduled to begin when the Record of Decision (ROD) is received for mining of
| | |
Barrick Gold Corporation – Cortez Operations, Project 2471 Technical Report NI 43-101 – March 21, 2016 | | Page 16-32 |
| | |
| | www.rpacan.com |
Deep South. Additional surface wells, as well as infrastructure, will be required to attain dewatering and meet development and ore production schedules from 2020 to 2027. It is currently envisioned that this will require five additional surface dewatering wells. The drilling and construction of these wells is scheduled to commence in 2016 with the construction of one well each year until 2020. This schedule must be maintained in order to achieve desired dewatering levels. This array of new production dewatering wells in conjunction with the existing well network will allow dewatering of the orebody to meet production schedules.
MINE DEWATERING DEEP SOUTH – FROM UNDERGROUND
The primary dewatering of Deep South is by the use of surface deep well pumps. The addition of pump stations is to address any fugitive or perched water that is encountered during operations. The system is designed to handle a nominal 1,000 gpm. An 8 inch schedule 40 steel discharge line is included in the haulage decline. One mobile pump skid with a receiver tank will support the development as it advances. A similar system without the receiver tank will be placed in the first permanent pump station. The mobile pump will be placed in the second permanent pump station at the completion of the development work. Sump excavations are included in the development estimate.
BACKFILL AND SHOTCRETE
A dual purpose backfill/shotcrete batch plant is located at the mine portal in F Canyon. Mine trucks are loaded at the portal elevation and the backfill is taken into the mine as a back haul. There is also a shotcrete batch plant located at the portal and there are mix trucks to haul the prepared shotcrete mix to the face.
As part of the development plan for the Middle and Lower zones, a backfill and shotcrete plant is proposed near the base of the RFD. The plant will be set up so that sand rock and concrete can be delivered from surface via boreholes. As the open pit expands, it will be necessary to relocate the backfill crusher to a location consistent with the planned surface area above the planned backfill plant.
In the future, a fleet of underground trucks will still be required to haul ore from stopes and to haul backfill from the new plant to the stoping areas.
Cemented backfill for the primary stopes of the Deep South will come from the underground backfill plant to be constructed to service the Lower Zone.
| | |
Barrick Gold Corporation – Cortez Operations, Project 2471 Technical Report NI 43-101 – March 21, 2016 | | Page 16-33 |
| | |
| | www.rpacan.com |
ROCK HANDLING
Rock is all hauled by truck up the declines to the F Canyon yard with the exception of some waste rock which can be used as backfill in the course of mining. The rock handling via the F Canyon declines will remain in service until after completion of the RFDs and a new rock handling system. After that time, the F Canyon declines will not be needed for rock haulage.
With the planned conveyor to be installed in the RFD, there will be ore passes for material where practical and ore haulage from other areas to a series of five bins to be located at the base of the conveyor system. The five bins will provide a dedicated bin for each of the three ore types plus waste rock with one bin left as a spare for use as required. The bins are planned to be 12 ft in diameter and 60 ft tall to provide approximately 350 ton capacity in each. The bins will be fed by dumping upon grizzlies equipped with rock breakers and designed to provide -12 in. material.
Waste handling for primary development of the Deep South Zone will require LHD and truck haulage until the orepass/conveyor system is established. Once the system is in place, ore and waste handling from the work areas will be by LHD only. Truck traffic in the working areas of the mine will be limited to backfill haulage only.
LHDs will deliver the ore to the level orepass, through a grizzly and onto a feeder breaker at the haulage ramp. The feeder breaker will load the Deep South Zone conveyor for transport to the material storage bins.
Ore will be transferred to the material storage bins at the 3,830 ft level, then enter the RFD conveyor system for transport out of the mine. The Deep South steering committee recommended the installation of a conveyor system after consideration of the alternatives.
The uppermost conveyor is planned to be installed and operational by 2022 to support mining of the Deep South Zone. This conveyor would also be able to support the mining of the Lower Zone above the 3,800 ft level.
MAINTENANCE
All of the underground equipment maintenance is performed at a shop complex located adjacent to portal. There is also a small maintenance bay on the 420 level.
| | |
Barrick Gold Corporation – Cortez Operations, Project 2471 Technical Report NI 43-101 – March 21, 2016 | | Page 16-34 |
| | |
| | www.rpacan.com |
POWER
Power is supplied to the mine via the F Canyon declines and via a power line installed in the ventilation raise. When the RFDs are in place, another power line will service the mine via the RFD. There will then be three electrical feeds to the mine which will provide good backup and options for the delivery of power to the work places.
The mine is fed by the F Canyon substation, power is then distributed underground to various switch gear at 13.8 kV. From the underground switch gear power is then distributed to various mobile load centres ranging from 750 kVA to 1,250 kVA. The mobile load centres then transform 13.8 kV to 480 V to supply power to the various working faces and infrastructure within the underground for use. A series of three backup generators are located in F Canyon to provide backup power to the underground in the event of power outage at the main substation.
The existing operating average power demand for underground operations is 4.4 MW with an additional 0.7 MW from the North Vent Raise. Lower Zone expansion is expected to add an additional 2MW to 4 MW of operating load to the existing infrastructure. The Deep South power loads are expected to add 6.7 MW in surface loads (pumps) and 5.6 MW in underground loads. With an estimated diversity factor of 70% the operating load for the Deep South is estimated to be 8.2 MW
As part of the Lower Zone expansion, a new underground distribution substation, 4400 substation, will be located below the North Ventilation Raise footprint. Permanent power for the expanded underground will be fed through this substation via two 350 MCM feeders to the underground distribution system. The 4400 substation is fed from two separate circuits originating at Cortez Hills by 13.8 kV overhead power lines. A separate power circuit to the Deep South will come from a 13.8 kV cable feeder originating at the RFD Surface Portal.
COMMUNICATIONS
The underground mine communications system includes radio and fibre-optic cables, and a mine dispatch system which utilizes Jigsaw software. This system provides real time monitoring for all underground equipment and permits the monitoring of activity.
| | |
Barrick Gold Corporation – Cortez Operations, Project 2471 Technical Report NI 43-101 – March 21, 2016 | | Page 16-35 |
| | |
| | www.rpacan.com |
OFFICES
Underground mine offices, and the mine dry are located at a building adjacent to the portal. There is a small office underground for shift supervisors located just below the 4445 level.
MINE EQUIPMENT
The underground mobile equipment fleet consists of large scale LHDs and haulage trucks, two boom jumbos, and ground support jumbos. There are also concrete and shotcrete carriers and shotcrete units. A list of the underground equipment is shown in Table 16-9. It is RPA’s opinion that the equipment is appropriately sized for the planned operations.
The mine equipment is serviced at a surface shop immediately adjacent to the portal.
TABLE 16-9 UNDERGROUND EQUIPMENT FLEET
Barrick Gold Corporation – Cortez Operations
| | |
Unit | | Number |
Jumbo - 2 boom | | 4 |
Cat R1600 G loader | | 9 |
Bolter | | 6 |
Truck AD-30 | | 11 |
Scissor Lift/Lube/Utility | | 6 |
Grader | | 2 |
Telehandler | | 4 |
Tractors | | 11 |
Concrete hauler | | 3 |
Shotcrete units | | 2 |
Forklift | | 2 |
Other | | 11 |
DEEP SOUTH MINING AND EQUIPMENT
The Deep South Zone PFS presents the study as a stand-alone case, but the mine equipment included in the capital costs presents the equipment as if the Deep South Zone was an extension of the CHUG and was relying on replacement of units already in service.
Additional capital may be required for the Deep South if the active units are still in use in the Middle Zone and Lower Zone.
| | |
Barrick Gold Corporation – Cortez Operations, Project 2471 Technical Report NI 43-101 – March 21, 2016 | | Page 16-36 |
| | |
| | www.rpacan.com |
SUMMARY OF THE DEEP SOUTH PRE-FEASIBILITY STUDY
The Deep South Zone as described in more detail in the preceding sections of this report is the southern (down dip) extent of the Lower Zone located below the 3,800 ft level. A revision to the PoO is required for mining in this area. The area was the subject of a PFS completed in December 2015 by Barrick and Minetech USA LLC. The Deep South Zone PFS advanced the level of study from the previous scoping level study. Based upon geotechnical review the access was revised and the use of longhole stoping was accepted.
The key parameters of the Deep South Zone PFS study are shown in Table 16-10. The total capital of $211.6 million includes initial capital costs of $153 million and sustaining capital of $58 million at average all-in sustaining costs of approximately $580 per ounce.
TABLE 16-10 KEY FACTORS DEEP SOUTH ZONE PFS
Barrick Gold Corporation – Cortez Operations
| | | | | | |
Ore tons | | (000) | | | 6,006 | |
Contained Oz | | (000) | | | 2,072 | |
Recovered Oz | | (000) | | | 1,605 | |
| | |
Capital Development | | | | | | |
Primary | | US$ M | | | 26.7 | |
Footwall | | US$ M | | | 23.4 | |
Material Handling | | US$ M | | | 5.5 | |
Ventilation | | US$ M | | | 9.3 | |
Fixed Equipment | | US$ M | | | 36.1 | |
Mobile equipment | | US$ M | | | 30 | |
Dewatering | | US$ M | | | 23 | |
Engineering | | US$ M | | | 14.9 | |
Total Development | | US$ M | | | 179.4 | |
Contingency | | US$ M | | | 32.2 | |
Total Capital | | US$ M | | | 211.6 | |
| | |
Operating Costs | | | | | | |
Direct operating | | US$ M | | | 696.9 | |
Refining | | US$ M | | | 1.2 | |
Royalties | | US$ M | | | 19.4 | |
Total | | US$ M | | | 717.6 | |
| | |
AISC | | US$/oz | | | 580 | |
The Deep South Zone is planned to commence operation in 2022 after receipt of permits and increased surface pumping to lower the water levels. The Deep South ore is largely oxide ore
| | |
Barrick Gold Corporation – Cortez Operations, Project 2471 Technical Report NI 43-101 – March 21, 2016 | | Page 16-37 |
| | |
| | www.rpacan.com |
in nature with the PFS estimating only 15% of the ore as refractory. The oxide processing extends beyond the planned life of the pipeline mill and the majority of the Deep South oxide ore will be processed by heap leaching.
The recommendation of the PFS was to move ahead with the design and implementation of the plans for the Deep South Zone. The work plan for the Deep South Zone includes the following elements:
| | • | | Finish drilling the orebody on 100 ft (30m) nominal centres to define edges and extent of gold mineralization. |
| | • | | Perform additional drilling for geotechnical information in the footwall of the Pondex Fault, specifically in areas of the proposed ramp design that lack geotechnical data. |
| | • | | Carry out additional lab testing to characterize material strength. |
| | • | | Conduct geotechnical evaluation of the vertical development utilizing dedicated geotechnical pilot holes. |
| | • | | Complete further geotechnical modeling to address any influence of geotechnical components on long-term infrastructure stability including constructing refined constitutive models (plasticity), the incorporation of large-scale structural features, and simulation of extractive sequences. |
| | • | | Construct an alteration model to assist in geotechnical evaluation. |
| | • | | Investigate stope sizing parameters; current recommendations are based on the most conservative formation in each ore zone and domain and possibilities exist that higher rock mass opportunities exist locally that will allow increasing panel lengths in primary stopes during transverse stoping. |
| | • | | Continue to optimize both transverse and longitudinal longhole stope designs evaluating stability of openings proposed in the PFS. |
| | • | | Investigate alternative bulk mining methods such as modified sub-level stoping. |
| | • | | Implement dewatering strategy starting in 2016; one well will be drilled and constructed for each of the following five years so that the full dewatering infrastructure will be in place at the time the ROD for AP04 is granted. |
| | • | | Carry out additional column leach and direct cyanidation tests of composites representing the various material types. |
| | • | | Perform additional CIL testing of carbonaceous oxide material. |
| | • | | Repeat BTALK-TCM tests to assess noise in the procedure. |
| | |
Barrick Gold Corporation – Cortez Operations, Project 2471 Technical Report NI 43-101 – March 21, 2016 | | Page 16-38 |
| | |
| | www.rpacan.com |
| | • | | Investigate the potential for continued oxide milling past proposed current shutdown date (other oxide sources and or toll milling). |
| | • | | Study integration of Deep South mine plan with existing Lower Zone mine plan to boost production to 5,000 stpd. |
| | • | | Do further evaluation of underground pumping requirements. |
| | • | | Verify ventilation requirements for increased production rates. |
| | • | | Evaluate manpower and equipment requirements based on integration of Deep South into Lower Zone mine plan. |
| | • | | Prepare a plan of execution. |
| | • | | A contingency plan will need to be performed as part of the Deep South FS to assure that sufficient emergency generator capacity exists to meet the operating and safety requirements of the Cortez Hills Underground division. |
RPA concurs with the overall recommendation of the PFS and the elements of the work plan. RPA recommends special attention be paid to the:
| | • | | longhole stope design parameters |
| | • | | impact of the longhole stope designs upon the production scheduling |
| | • | | alternative processing options after the open pits are completed to increase the recovery of gold. |
RPA is of the opinion that the study has been completed to a level consistent with that of a PFS and is suitable for the conversion of Mineral Resources to Mineral Reserves.
UNDERGROUND PRODUCTION SCHEDULE
The current CHUG production schedule, which includes the Deep South Zone, is based upon the mining of approximately 2,000 stpd of ore increasing to approximately 4,000 stpd by 2023. The mining rate is expected to drop off to 3,000 stpd in 2027 before terminating in 2028. The mining moves from the nearly depleted Breccia Zone to the Middle Zone then the Lower Zone and ultimately to the Deep South Zone. The Deep South Zone has the potential to contribute underground gold production beginning in 2022 and averaging approximately 300,000 oz per year between 2023 and 2027. This timing differs slightly from the PFS as the current LOM is based on more detailed planning subsequent to the PFS. The underground LOM plan is shown in Table 16-11.
| | |
Barrick Gold Corporation – Cortez Operations, Project 2471 Technical Report NI 43-101 – March 21, 2016 | | Page 16-39 |
| | |
| | www.rpacan.com |
TABLE 16-11 UNDERGROUND LOM PRODUCTION
Barrick Gold Corporation – Cortez Operations
| | | | | | | | | | | | | | | | |
| | | | | Ore
Tons
(000) | | Grade
(oz/st
Au) | | Contained
Ounces
(000) | | Tons Per
Day | | Waste
Tons
(000) | | Waste
Tons Per
Day | | Total
Backfill
Tons (000) |
| 2016 | | | | 727 | | 0.454 | | 330 | | 2,007 | | 285 | | 788 | | 645 |
| 2017 | | | | 760 | | 0.343 | | 260 | | 2,092 | | 378 | | 1,041 | | 690 |
| 2018 | | | | 774 | | 0.342 | | 264 | | 2,138 | | 224 | | 620 | | 702 |
| 2019 | | | | 853 | | 0.332 | | 283 | | 2,357 | | 271 | | 749 | | 831 |
| 2020 | | | | 899 | | 0.337 | | 303 | | 2,484 | | 86 | | 239 | | 823 |
| 2021 | | | | 951 | | 0.339 | | 323 | | 2,619 | | 127 | | 351 | | 831 |
| 2022 | | | | 1,011 | | 0.362 | | 365 | | 2,792 | | 259 | | 717 | | 877 |
| 2023 | | | | 1,348 | | 0.348 | | 469 | | 3,723 | | 341 | | 943 | | 1,235 |
| 2024 | | | | 1,353 | | 0.357 | | 483 | | 3,736 | | 358 | | 989 | | 1,499 |
| 2025 | | | | 1,483 | | 0.331 | | 491 | | 4,086 | | 165 | | 454 | | 1,589 |
| 2026 | | | | 1,423 | | 0.311 | | 443 | | 3,930 | | 150 | | 415 | | 1,478 |
| 2027 | | | | 1,169 | | 0.358 | | 419 | | 3,230 | | 64 | | 176 | | 1,545 |
| 2028 | | | | 162 | | 0.260 | | 42 | | 447 | | 8 | | 21 | | 291 |
| Total | | | | 12,912 | | 0.347 | | 4,476 | | 2,228 | | 2,717 | | 469 | | 13,035 |
The underground LOM production by ore type is shown in Table 16-12. The split on the refractory ore type varies from year to year, but overall the underground production is projected to be approximately 53% oxide and 47% refractory. The production split by zone is shown in Table 16-13.
TABLE 16-12 UNDERGROUND LOM ORE TYPES
Barrick Gold Corporation – Cortez Operations
| | | | | | | | | | | | | | | | | | |
| | | | | Percent of Tons | | Percent of Ounces |
Year | | | | Ox | | Rf1 | | Rf2 | | Rf3 | | OX | | Rf1 | | Rf2 | | Rf3 |
| 2016 | | | | 40 | | 17 | | 43 | | 0 | | 41 | | 28 | | 31 | | 0 |
| 2017 | | | | 42 | | 13 | | 45 | | 0 | | 37 | | 21 | | 42 | | 0 |
| 2018 | | | | 35 | | 9 | | 56 | | 0 | | 31 | | 12 | | 56 | | 0 |
| 2019 | | | | 32 | | 4 | | 64 | | 0 | | 31 | | 7 | | 62 | | 0 |
| 2020 | | | | 36 | | 6 | | 58 | | 0 | | 32 | | 9 | | 59 | | 0 |
| 2021 | | | | 20 | | 12 | | 68 | | 0 | | 17 | | 18 | | 65 | | 0 |
| 2022 | | | | 32 | | 11 | | 57 | | 0 | | 32 | | 16 | | 53 | | 0 |
| 2023 | | | | 61 | | 5 | | 33 | | 0 | | 62 | | 7 | | 30 | | 0 |
| 2024 | | | | 63 | | 8 | | 29 | | 0 | | 57 | | 13 | | 30 | | 0 |
| 2025 | | | | 71 | | 7 | | 22 | | 0 | | 65 | | 12 | | 23 | | 0 |
| 2026 | | | | 87 | | 1 | | 12 | | 0 | | 88 | | 1 | | 11 | | 0 |
| 2027 | | | | 92 | | 0 | | 8 | | 0 | | 92 | | 0 | | 8 | | 0 |
| 2028 | | | | 89 | | 0 | | 11 | | 0 | | 90 | | 0 | | 10 | | 0 |
| Total | | | | 56 | | 7 | | 37 | | 0 | | 53 | | 11 | | 36 | | 0 |
| | |
Barrick Gold Corporation – Cortez Operations, Project 2471 Technical Report NI 43-101 – March 21, 2016 | | Page 16-40 |
| | |
| | www.rpacan.com |
TABLE 16-13 UNDERGROUND ORE SOURCE BY ZONE
Barrick Gold Corporation – Cortez Operations
| | | | | | | | | | | | | | | | | | |
| | | | | Breccia | | Middle | | Lower | | Deep South |
Year | | | | Tons | | Ounces | | Tons | | Ounces | | Tons | | Ounces | | Tons | | Ounces |
2016 | | | | 213 | | 140 | | 441 | | 167 | | 72 | | 22 | | | | |
2017 | | | | 80 | | 15 | | 477 | | 176 | | 202 | | 69 | | | | |
2018 | | | | 30 | | 6 | | 471 | | 159 | | 272 | | 100 | | | | |
2019 | | | | | | | | 417 | | 143 | | 437 | | 141 | | | | |
2020 | | | | | | | | 428 | | 138 | | 472 | | 166 | | | | |
2021 | | | | | | | | 534 | | 175 | | 414 | | 147 | | 2 | | 0.5 |
2022 | | | | | | | | 335 | | 135 | | 449 | | 160 | | 226 | | 70 |
2023 | | | | | | | | 118 | | 39 | | 381 | | 138 | | 849 | | 292 |
2024 | | | | | | | | 170 | | 86 | | 367 | | 131 | | 815 | | 265 |
2025 | | | | | | | | 131 | | 69 | | 352 | | 123 | | 1000 | | 300 |
2026 | | | | | | | | 21 | | 6 | | 173 | | 65 | | 1228 | | 372 |
2027 | | | | | | | | | | | | 153 | | 55 | | 1016 | | 364 |
2028 | | | | | | | | | | | | 34 | | 8 | | 128 | | 34 |
RPA recommends that Cortez modify the LOM and Mineral Reserve estimation process to include:
| | • | | a reconciliation between the LOM plan and the Mineral Reserve estimate |
| | • | | a tabulation of the mineral resources converted by classification including the Inferred Mineral Resources |
| | • | | a review of those Inferred Mineral Resources within the LOM plan to determine whether any can or should be reclassified as Indicated Mineral Resources |
| | • | | show the impact on the LOM plan of including the Inferred Mineral Resources within the plan at zero grade |
RPA recommends that any future conversions to new or different software packages be accompanied by detailed reconciliations and comparisons to identify and resolve the type of issues identified above.
CORTEZ LIFE OF MINE PLAN
The Cortez LOM plan, which incorporates the Deep South Zone, includes the open pit mining of the Cortez Hills, Pediment, Pipeline, and Crossroads open pits as well as the underground mining at Cortez Hills. The ore will be processed at the Pipeline mill, heap leach facilities at
| | |
Barrick Gold Corporation – Cortez Operations, Project 2471 Technical Report NI 43-101 – March 21, 2016 | | Page 16-41 |
| | |
| | www.rpacan.com |
Cortez, and at the roaster and autoclave facilities at the Barrick Goldstrike operations. The LOM plan is developed by site personnel on an annual basis as part of the budgeting process. The plan is routinely updated to reflect changing conditions that may impact upon the site gold delivery schedule.
In the immediate future, the planned processing rate for refractory ores sent to Goldstrike has been limited to 1.2 million stpa total. This is considered to be a regulatory issue related to the highway transportation of the ore from Cortez to Goldstrike and emissions from the processing facilities.
MINING
The LOM plan for the open pit and underground mining is shown in Table 16-14. Open pit mining continues to 2023, while the CHUG mining continues until 2028.
TABLE 16-14 CORTEZ OPERATION – LOM MINING
Barrick Gold Corporation – Cortez Operations
| | | | | | | | | | | | | | |
Year | | | | OP Ore
Tons
(000 st) | | Overall
Ore Grade
(oz/st Au) | | Contained OP
Gold Ounces
(000) | | UG Ore
Tons
(000 st) | | Ore
Grade
(oz/st Au) | | Contained UG
Gold Ounces
(000 oz Au) |
2016 | | | | 32,458 | | 0.032 | | 1,047 | | 727 | | 0.454 | | 330 |
2017 | | | | 10,680 | | 0.094 | | 1,008 | | 760 | | 0.343 | | 260 |
2018 | | | | 13,698 | | 0.061 | | 829 | | 774 | | 0.342 | | 264 |
2019 | | | | 15,797 | | 0.044 | | 695 | | 853 | | 0.332 | | 283 |
2020 | | | | 13,576 | | 0.044 | | 596 | | 899 | | 0.337 | | 303 |
2021 | | | | 35,001 | | 0.021 | | 724 | | 951 | | 0.339 | | 323 |
2022 | | | | 23,874 | | 0.027 | | 652 | | 1,011 | | 0.362 | | 365 |
2023 | | | | 8,404 | | 0.086 | | 722 | | 1,348 | | 0.348 | | 469 |
2024 | | | | 2,100 | | 0.148 | | 311 | | 1,353 | | 0.357 | | 483 |
2025 | | | | 1,369 | | 0.139 | | 191 | | 1,483 | | 0.331 | | 491 |
2026 | | | | 1,603 | | 0.077 | | 123 | | 1,423 | | 0.311 | | 443 |
2027 | | | | 1,767 | | 0.073 | | 129 | | 1,169 | | 0.358 | | 419 |
2028 | | | | 883 | | 0.065 | | 57 | | 162 | | 0.260 | | 42 |
Totals | | | | 161,212 | | 0.044 | | 7,084 | | 12,912 | | 0.347 | | 4,476 |
The underground mine production is 7% of the total tonnage mined, but the contained gold is 38% of the total gold mined at Cortez. The LOM plan includes the increase in mining rate in the underground mine. This rate increase will assist in maintaining the gold production rate as the underground grades in the future are considerably lower than in the past.
| | |
Barrick Gold Corporation – Cortez Operations, Project 2471 Technical Report NI 43-101 – March 21, 2016 | | Page 16-42 |
| | |
| | www.rpacan.com |
PROCESSING
The processing portion of the LOM plan is shown in Tables 16-15 to 16-18. Ore is treated in the oxide mill at the Pipeline complex until the end of 2026. The final two years of operation are low grade material. The LOM plan generally treats high grade material sooner than lower grade material and the large amount of heap leach ore results in high tonnage and relatively low grade overall. Refractory ore is hauled to Goldstrike with the highest grade ore available always shipped first.
At Cortez; the plan is to reduce stockpiling of ore to the extent practical, so that lower grade material, planned for the leach pad, may be diverted to fill excess capacity at the Pipeline mill. Conversely, lower grade ore from the material planned to go the mill, may be diverted to the heap leach facility so that gold can be recovered rather than stored in stockpiles.
TABLE 16-15 LOM ORE PROCESSED - ROASTER
Barrick Gold Corporation – Cortez Operations
| | | | | | | | | | | | |
Year | | | | Tons
Processed
(000) | | Grade
(oz/st Au) | | Contained
Ounces | | Recovery
(%) | | Recovered
Gold (000 oz) |
2016 | | | | 1,269 | | 0.243 | | 308 | | 87 | | 269 |
2017 | | | | 1,205 | | 0.233 | | 281 | | 87 | | 245 |
2018 | | | | 1,211 | | 0.278 | | 337 | | 88 | | 297 |
2019 | | | | 1,215 | | 0.282 | | 343 | | 88 | | 303 |
2020 | | | | 1,207 | | 0.293 | | 353 | | 88 | | 312 |
2021 | | | | 1,992 | | 0.231 | | 461 | | 87 | | 402 |
2022 | | | | 1,976 | | 0.184 | | 363 | | 85 | | 309 |
2023 | | | | 1,849 | | 0.238 | | 440 | | 87 | | 383 |
2024 | | | | 1,839 | | 0.256 | | 471 | | 87 | | 412 |
2025 | | | | 1,800 | | 0.202 | | 364 | | 86 | | 313 |
2026 | | | | 1,785 | | 0.100 | | 178 | | 79 | | 141 |
2027 | | | | 1,863 | | 0.088 | | 163 | | 77 | | 126 |
2028 | | | | 901 | | 0.068 | | 61 | | 73 | | 45 |
Total | | | | 20,112 | | 0.205 | | 4,123 | | 86 | | 3,557 |
TABLE 16-16 LOM ORE PROCESSED – PIPELINE MILL
Barrick Gold Corporation – Cortez Operations
| | | | | | | | | | | | |
Year | | | | Tons
Processed
(000) | | Grade
(oz/st Au) | | Contained
Ounces | | Recovery
(%) | | Recovered
Gold (000 oz) |
2016 | | | | 4,487 | | 0.121 | | 544 | | 84 | | 459 |
2017 | | | | 4,536 | | 0.202 | | 916 | | 87 | | 796 |
2018 | | | | 4,344 | | 0.142 | | 618 | | 86 | | 529 |
2019 | | | | 3,967 | | 0.111 | | 442 | | 79 | | 350 |
2020 | | | | 3,955 | | 0.111 | | 439 | | 80 | | 350 |
| | |
Barrick Gold Corporation – Cortez Operations, Project 2471 Technical Report NI 43-101 – March 21, 2016 | | Page 16-43 |
| | |
| | www.rpacan.com |
| | | | | | | | | | | | |
Year | | | | Tons
Processed
(000) | | Grade
(oz/st Au) | | Contained
Ounces | | Recovery
(%) | | Recovered
Gold (000 oz) |
2021 | | | | 3,943 | | 0.062 | | 244 | | 79 | | 192 |
2022 | | | | 3,895 | | 0.101 | | 393 | | 79 | | 311 |
2023 | | | | 3,960 | | 0.168 | | 665 | | 79 | | 525 |
2024 | | | | 764 | | 0.060 | | 46 | | 80 | | 37 |
Total | | | | 33,852 | | 0.127 | | 4,307 | | 82 | | 3,548 |
TABLE 16-17 LOM ORE PROCESSED – HEAP LEACH
Barrick Gold Corporation – Cortez Operations
| | | | | | | | | | | | |
Year | | | | Tons
Processed
(000) | | Grade
(oz/st Au) | | Contained
Ounces | | Recovery
(%) | | Recovered
Gold (000 oz) |
2016 | | | | 27,429 | | 0.019 | | 525 | | 34 | | 180 |
2017 | | | | 5,699 | | 0.013 | | 72 | | 237 | | 170 |
2018 | | | | 8,917 | | 0.015 | | 138 | | 136 | | 188 |
2019 | | | | 11,468 | | 0.017 | | 193 | | 95 | | 184 |
2020 | | | | 9,313 | | 0.011 | | 107 | | 69 | | 74 |
2021 | | | | 30,018 | | 0.011 | | 342 | | 29 | | 100 |
2022 | | | | 19,013 | | 0.014 | | 261 | | 42 | | 110 |
2023 | | | | 3,943 | | 0.022 | | 86 | | 146 | | 126 |
2024 | | | | 850 | | 0.326 | | 277 | | 101 | | 280 |
2025 | | | | 1,053 | | 0.302 | | 318 | | 71 | | 226 |
2026 | | | | 1,241 | | 0.313 | | 388 | | 68 | | 265 |
2027 | | | | 1,073 | | 0.359 | | 385 | | 68 | | 262 |
2028 | | | | 145 | | 0.263 | | 38 | | 68 | | 26 |
Total | | | | 120,160 | | 0.026 | | 3,130 | | 70 | | 2,190 |
TABLE 16-18 LOM TOTAL ORE PROCESSED
Barrick Gold Corporation – Cortez Operations
| | | | | | | | | | | | |
Year | | | | Tons
Processed
(000) | | Grade
(oz/st Au) | | Contained
Ounces | | Recovery
(%) | | Recovered
Gold (000 oz) |
2016 | | | | 33,185 | | 0.041 | | 1,376 | | 66 | | 908 |
2017 | | | | 11,440 | | 0.111 | | 1,269 | | 95 | | 1,210 |
2018 | | | | 14,472 | | 0.076 | | 1,093 | | 93 | | 1,014 |
2019 | | | | 16,650 | | 0.059 | | 978 | | 86 | | 837 |
2020 | | | | 14,475 | | 0.062 | | 899 | | 82 | | 736 |
2021 | | | | 35,952 | | 0.029 | | 1,047 | | 66 | | 694 |
2022 | | | | 24,884 | | 0.041 | | 1,017 | | 72 | | 730 |
2023 | | | | 9,752 | | 0.122 | | 1,191 | | 87 | | 1,034 |
2024 | | | | 3,453 | | 0.230 | | 794 | | 92 | | 729 |
2025 | | | | 2,852 | | 0.239 | | 682 | | 79 | | 539 |
2026 | | | | 3,026 | | 0.187 | | 566 | | 72 | | 405 |
2027 | | | | 2,936 | | 0.187 | | 548 | | 71 | | 388 |
2028 | | | | 1,045 | | 0.095 | | 99 | | 71 | | 70 |
Total | | | | 174,124 | | 0.066 | | 11,560 | | 80 | | 9,295 |
| | |
Barrick Gold Corporation – Cortez Operations, Project 2471 Technical Report NI 43-101 – March 21, 2016 | | Page 16-44 |
| | |
| | www.rpacan.com |
17 RECOVERY METHODS
INTRODUCTION
Historically, Cortez ore was processed in a 1,800 stpd CIL plant called Mill No. 1, as crushed ore on heap leach pads, and refractory ore was pre-oxidized in a circulating fluid bed roaster. The crushing and leaching circuits were built in 1969; the roasting circuit was completed in 1990. The Mill No. 1 processing facilities were placed on care and maintenance in 1999.
Ore from Cortez can either be processed on site in the oxide processing facilities or transported to the Goldstrike operation for refractory ore treatment.
OXIDE ORE MILLING
Mill No. 2, or the Pipeline mill, was commissioned in 1997 to process oxide ore from the Pipeline open pit mine. The treatment plant currently includes crushing, semi-autogenous grinding (SAG) mill, ball mill, grind thickener, carbon-in-column (CIC) circuit for the grind thickener overflow solution, carbon-in-leach (CIL) circuit, tailings counter-current-decantation (CCD) wash thickener circuit, carbon stripping and reactivation circuits, and a refinery to produce gold doré. A debottlenecking project was completed during March 2011. Plant throughput is currently estimated at 13,000 stpd depending on the hardness of the ore being processed. Figure 17-1 provides the simplified process flow sheet for Mill No. 2.
To accommodate the incoming ore feed from Cortez Hills, a primary gyratory crusher was installed adjacent to the Cortez Hills open pit. The crusher discharges onto a series of overland conveyors that transport the ore to the coarse ore stockpile at Mill No. 2.
ROM ore from South Pipeline is dumped into the crusher dump pocket at the mill and discharges onto a vibrating grizzly. Grizzly oversize material is crushed in a jaw crusher. Grizzly undersize material and the jaw crusher discharge are conveyed to the coarse ore stockpile. The grinding circuit includes one SAG mill and one overflow ball mill. Discharge from the SAG mill is screened on one of two vibrating screens.
| | |
Barrick Gold Corporation – Cortez Operations, Project 2471 Technical Report NI 43-101 – March 21, 2016 | | Page 17-1 |
| | |
| | www.rpacan.com |
Screen oversize is conveyed to a cone crusher where it is crushed prior to being recycled to the SAG mill feed. Screen undersize and ball mill discharge flow by gravity to the hydrocyclone feed pump box. The slurry is pumped from the pump box to the hydrocyclones. The ball mill is operated in closed circuit with the hydrocyclones to produce the target grind size for the CIL circuit, which is nominally 110 µm. The underflow from the hydrocyclones is recycled to the ball mill feed; the overflow from the hydrocyclones discharges into an agitated surge tank, which feeds the grind thickener.
An appreciable amount of gold is dissolved in the grinding circuit so a CIC circuit is used to recover gold from the grind thickener overflow solution. The grind thickener underflow is pumped to the CIL circuit, which consists of eight CIL tanks, sixteen screens, and eight carbon-forwarding pumps. The slurry overflows by gravity from the first tank to the eighth. Carbon that has been stripped and reactivated is added to the last tank and is advanced counter current to the slurry flow. Cyanide and milk-of-lime are added stage-wise to maintain optimum leaching conditions. The nominal retention time is 44 hours. This is increased to 54 hours when milling harder ore at a lower plant throughput. The discharge from the CIL circuit flows by gravity to the tailings CCD thickener circuit. The CIL tailings are washed in two high-capacity thickeners. The wash solution from the CCD circuit is pumped to the process water tank for reuse in the grinding and CIL circuits.
Loaded carbon from the CIL and CIC circuits is washed with dilute (3%) hydrochloric acid before elution. The acid is removed from the carbon by washing with fresh water. The washed carbon is transferred to the elution column by pressure eduction. Three columns provide for acid washing and three for gold elution. The pressurized Zadra process is used for gold elution. Hot strip solution containing approximately two percent sodium hydroxide is circulated through the elution column. Elevated temperature and pressure are maintained in the elution column. Pregnant strip solution is stored in the preg tank before being pumped to the electro-winning (EW) cells.
Electro-winning takes place in six EW cells. After loading with gold, the stainless steel wool cathodes are washed with high pressure water. The gold sludge from the EW cells is dewatered in a filer press. The stripped cathodes are returned to the EW cells. The filter cake is dried, melted in an induction furnace, and poured into doré bars. The stripped carbon is transferred from the elution column over a screen and into the reactivation furnace feed tanks. Carbon reactivation is accomplished in two propane-fired kiln-type furnaces.
| | |
Barrick Gold Corporation – Cortez Operations, Project 2471 Technical Report NI 43-101 – March 21, 2016 | | Page 17-2 |
| | |
| | www.rpacan.com |
Tailings are stored in a zero-discharge tailings storage facility (TSF). A double liner covers the entire tailings area, extending completely under the dam embankment. A two foot thick blanket drain of crushed rock covers the liner to permit seepage from the tailings to be collected in a lined ditch outside the dam embankment. All tailings solutions return to the mill.
OXIDE ORE HEAP LEACHING
Low-grade oxide material is leached as ROM ore on three prepared double-lined leach pads. Pregnant solution from the leach pads is fed to CIC columns for gold recovery. The loaded carbon from the heap leach operation is transported to the mill for gold recovery in the carbon elution and EW circuits and the refinery. The carbon is also acid washed and regenerated at the mill. Make-up solutions come from the mill or mine dewatering wells to account for evaporative losses and ore saturation requirements. A simplified flow sheet for the heap leach operation is shown as Figure 17-2.
Area 28 heap leach circuit has a water balance that is interlinked with the Pipeline mill circuit since it uses the tailings pond under-drain solution as leach solution and excess pad effluent is processed in the mill CIC circuit. Area 28 is at maximum capacity for ore stacking and is no longer an operating leach pad. The Area 30 heap leach circuit is independent of the Pipeline mill. Ore delivery to the pad recommenced in 2013 and is set to continue through 2023. Area 34 heap leach is a third pad that was designed to treat Cortez Hills open pit ore. The first cells were placed under leach during March 2011 and ore deliveries are scheduled to continue through 2018 based on the current LOM plan.
PRODUCTION CAPACITY INCREASE BY 10% - VALUE REALIZATION INITIATIVE
Cortez Hills operation has identified an opportunity to increase production capacity by an approximately 10% increase of the CIL process plan and heap leach (HL) capacity. This will be achieved as follows:
| | • | | Partial solution recycle is pursued applying pregnant leach solution to new material for the first 30 days of leaching. |
| | • | | CIL process plant throughput is achieved by maximizing SAG and ball mill power draw along with improved secondary grinding circuit control strategies. |
| | • | | Increased capacity will advance production and cash flow streams along with slight reduction in unit costs. Implementation is currently underway (10% complete) as the |
| | |
Barrick Gold Corporation – Cortez Operations, Project 2471 Technical Report NI 43-101 – March 21, 2016 | | Page 17-3 |
| | |
| | www.rpacan.com |
| | majority of infrastructure is in place. Capital cost is estimated to be $10 million (conceptual level) for solution distribution. Improvements in throughput are estimated to be 10% to 20% for HL and 5% to 12% for CIL. |
REFRACTORY ORE TREATMENT
Ores that have a cyanide soluble (shake test) to fire assay gold (AA/FA) ratio of less than 50% are transported to Goldstrike for processing in the roaster. Haulage of refractory ore to Goldstrike is currently limited by permit to 1.2 million stpa. At Goldstrike, the ore will be processed in the roaster followed by a CIL circuit. Goldstrike also has the opportunity to process refractory ore using the total carbonaceous material (TCM) process, which includes pressure oxidation (POX) followed by resin-in-leach (RIL) with calcium thio-sulphate (CaTs) but this option is not contemplated for Cortez ore at this time.
Fluid bed roasters were constructed at Goldstrike in 1999 to treat carbonaceous refractory ores that could not be treated effectively by the POX circuit that existed at Goldstrike at that time. The roasters process double refractory (i.e., sulphide refractory and total organic carbon refractory) feed with a moderate carbonate content to help fix the sulphur dioxide that is generated by the oxidation reactions. Minimum sulphide sulphur levels are required to maintain sufficient bed temperatures. When the ore does not contain the minimum required sulphide sulphur content, sulphur prills are used as a supplement to provide the energy necessary to operate the roasters. The flow sheet for the Goldstrike roasters is shown in Figure 17-3.
The roasters use oxygen to oxidize organic carbon and sulphide sulphur prior to processing the neutralized slurry in a conventional CIL circuit. There are two circuits, each include crushing and dry grinding followed by a two stage roaster, a calcine quenching tank, and dust and gas handling operations. The quenched gas goes to the gas cleaning stage, which is common to both roaster circuits, and the calcine is processed in common neutralization and CIL circuits. The loaded carbon is sent to the main refinery for elution, regeneration, and production of the gold doré.
Ore routing from Cortez to Goldstrike is optimized to provide maximum value to the Cortez operation.
| | |
Barrick Gold Corporation – Cortez Operations, Project 2471 Technical Report NI 43-101 – March 21, 2016 | | Page 17-4 |
| | |
| | www.rpacan.com |
HAULAGE CAPACITY INCREASE – VALUE REALIZATION INITIATIVE
The Cortez Hills operation currently ships mined refractory ores via over-the-highway haul trucks to the Goldstrike operation for processing. Haulage is currently limited by permit to 1.2 million stpa. An opportunity exists to expand the shipping rate to 2.2 million stpa during the AP-04 permitting process, allowing increased shipping to begin upon permit receipt in 2020. Permit submittal is currently scheduled for Q1 2016.
Additional technical studies are underway to determine increased haulage parameters including fleet sizing and road base suitability.
Increased shipping rates will allow advancing the current LOM production stream of refractory material.
| | |
Barrick Gold Corporation – Cortez Operations, Project 2471 Technical Report NI 43-101 – March 21, 2016 | | Page 17-5 |
| | |
| | www.rpacan.com |
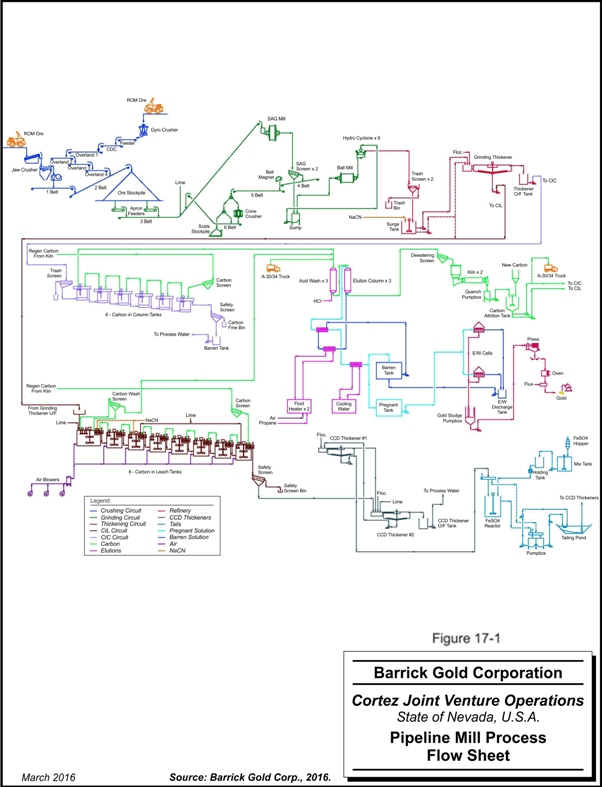
| | |
Barrick Gold Corporation – Cortez Operations, Project 2471 Technical Report NI 43-101 – March 21, 2016 | | Page 17-6 |
| | |
| | www.rpacan.com |
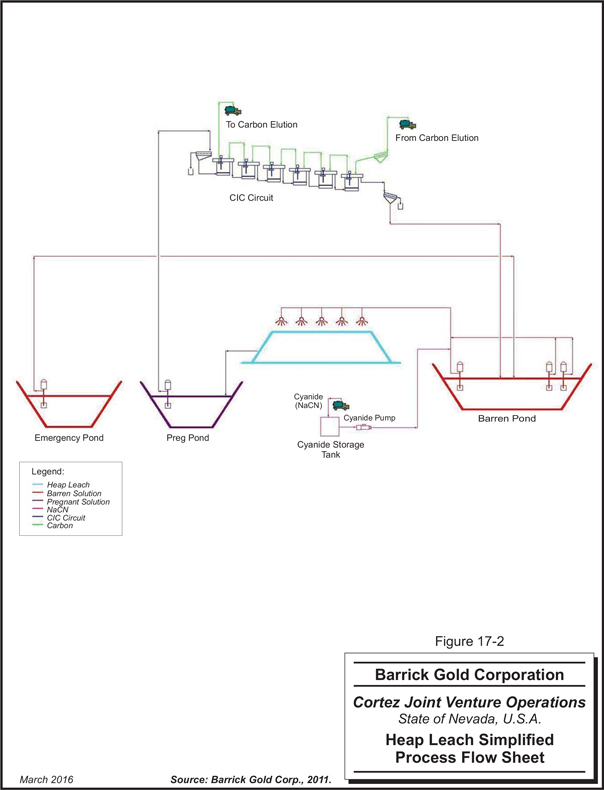
| | |
Barrick Gold Corporation – Cortez Operations, Project 2471 Technical Report NI 43-101 – March 21, 2016 | | Page 17-7 |
| | |
| | www.rpacan.com |
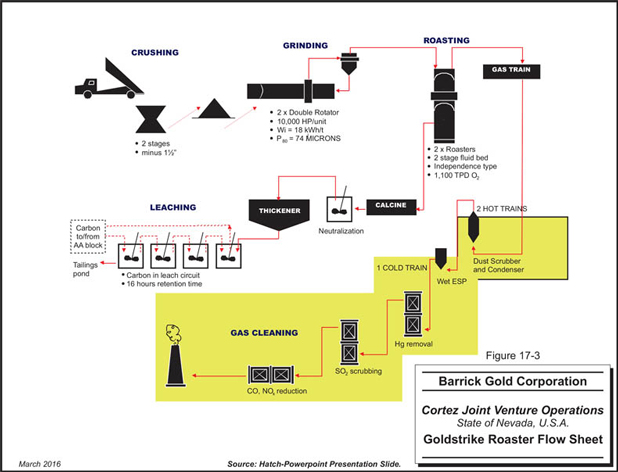
| | |
Barrick Gold Corporation – Cortez Operations, Project 2471 Technical Report NI 43-101 – March 21, 2016 | | Page 17-8 |
| | |
| | www.rpacan.com |
18 PROJECT INFRASTRUCTURE
The infrastructure for the Cortez Operations is developed and in service. The facilities and infrastructure in the vicinity of the Pipeline and Cortez Hills Complex is shown in Figures 18-1 and 18-2.
ROADS
The Cortez Operations are accessed by paved public roads. The Mine has a number of private roads for access to the various facilities. The private roads include small vehicle roads as well as a network of haul roads. The haul roads are built to a width suitable for the haul trucks.
The development of the CHOP included the construction of a new public road to replace the original public road, which has now become part of the CHOP waste dump.
TAILINGS STORAGE FACILITY
Current capacity is expected to accommodate the tailings from Mill No. 2 through 2012. The Phase IV raise was under construction at the end of 2011 and is expected to provide capacity through the first and second quarter of 2013. A permit application for the Cell 4 starter dam is expected for January 2012, which will make Cell 4 available for additional tailing storage in January 2013. The engineering of the Phase V raise for the TSF is underway.
DUMPS
There are permitted waste dumps at the CHOP, Pipeline, and Gap pits for the storage of waste.
| | |
Barrick Gold Corporation – Cortez Operations, Project 2471 Technical Report NI 43-101 – March 21, 2016 | | Page 18-1 |
| | |
| | www.rpacan.com |
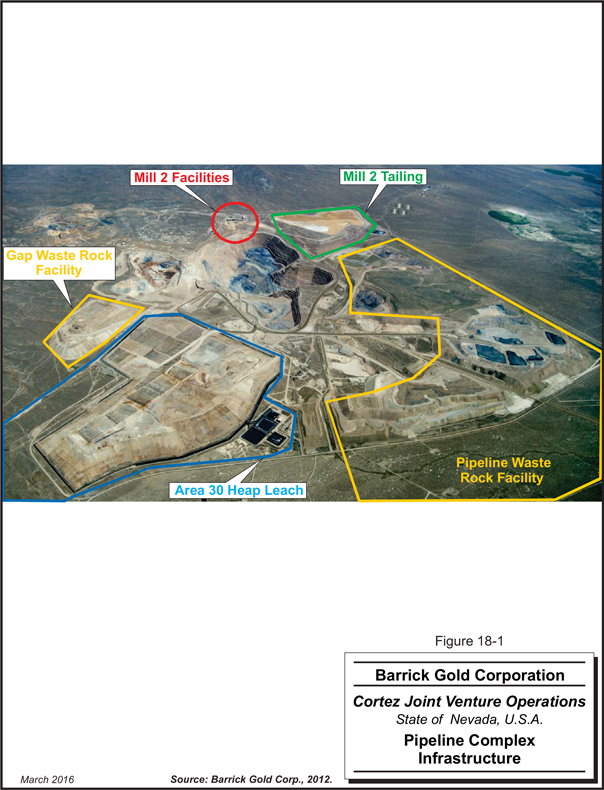
| | |
Barrick Gold Corporation – Cortez Operations, Project 2471 Technical Report NI 43-101 – March 21, 2016 | | Page 18-2 |
| | |
| | www.rpacan.com |
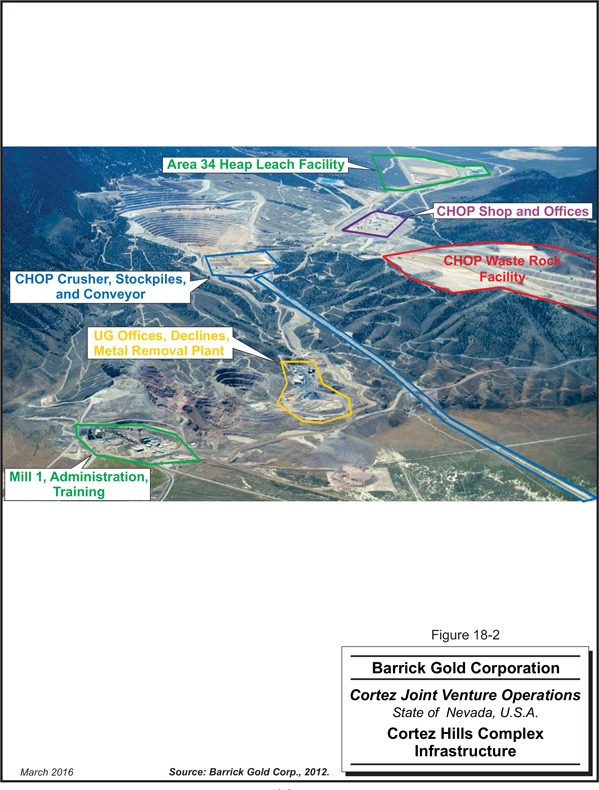
| | |
Barrick Gold Corporation – Cortez Operations, Project 2471 Technical Report NI 43-101 – March 21, 2016 | | Page 18-3 |
| | |
| | www.rpacan.com |
STOCKPILES
The open pit production schedules have significant variation in ore delivery over time and there is a high proportion of the ore, which is stockpiled after mining and before processing. There are 14 oxide stockpile options all based upon the grade of material and varying from leach grade to ore in excess of 0.75 oz/st Au. Leach material is generally delivered directly to the leach pad. There are 12 key mill ore categories based on a range of grades, and from 0.02 oz/st Au to 0.1 oz/st Au, the categories are separated by 0.01 oz/st Au. There are 12 refractory ore stockpile categories ranging from 0.04 oz/st Au to greater than 0.4 oz/st Au.
Production scheduling for the oxide mill is based upon a balance of feed grade based upon the material available in the stock piles plus the expected ore delivery from the pits. For the refractory material the selection of material to be processed is based upon the highest grade stockpiles being shipped to Barrick’s Goldstrike facility first.
LEACH PADS
The LOM capital plan allows $24 million for the expansion of heap leach pads.
POWER
Electrical power is obtained from the grid and from the Western 102 power plant with transmission by NV Energy. Power is purchased on a wholesale basis using dedicated buyers. The load is predicted on an hourly basis and the Western 102 supply is used to balance the load. The Western 102 plant delivers power to Barrick operations at Cortez, Goldstrike, and Turquoise Ridge.
Electric power is provided to the Cortez site by NV Energy via an approximately 50-mile long radial transmission line originating at their Falcon substation. The incoming NV Energy line terminates at the Barrick owned Pipeline Substation. Two, 120kV Taps onto the NV Energy power line feed the Barrick-owned 120kV power lines as follow:
| | • | | Approximately nine miles of extension to serve the Cortez Hills development; and |
| | • | | Approximately three miles of extension to serve the South Pipeline and Crossroads pits. |
| | |
Barrick Gold Corporation – Cortez Operations, Project 2471 Technical Report NI 43-101 – March 21, 2016 | | Page 18-4 |
| | |
| | www.rpacan.com |
The current load at Cortez has a peak of 36 MW. The current transmission lines have the capacity for 44 MW, and with the addition of capacitors, the capacity of the line could be increased to 56 MW. Further improvements could increase the capacity to 70 MW to 80 MW, but any expansion beyond 80 MW, additional transmission capacity will be required.
The Cortez Mine currently has 54MW of Network Integrated Transmission Service from NV Energy for the delivery of capacity and energy from the Midpoint 345 kV and Dove 120 kV points of receipt. The Cortez Mine also has a Distribution Service DOS agreement with NV Energy to a level of 31 MW. Barrick purchases power from the western electric grid for delivery to Midpoint 345 kV and/or generates power at Barrick’s Western 102 power plant for delivery to the Dove 120 kV bus.
Electric demand at the Cortez Mine was estimated in 2014 to approach 50 MW through the LOM. NV Energy has completed a preliminary study that concluded that the existing average power is 30 MW and 33 MW peak. Cortez Mine has expressed interest to NV Energy to match the Transmission Service and DOS agreements at 54 MW. NV Energy has instructed Cortez Mine that modifying the DOS agreement to 54 MW based on projected LOM power demand will require that two 10 MVAR capacitor banks be installed at the Cortez mine. Cortez mine has budgeted for the installation of one 120 kV, 10 MVAR capacitor bank in each 2016 and 2017.
The radial 120 kV transmission line serving the Cortez Mine is thermally limited to about 100 MVA of capacity; however, the real capacity restriction is related to the line voltage drop that occurs between Falcon substation and the Cortez Mine. NV Energy is required to limit this voltage drop to 5% per their regulators, the North American Electric Reliability Corporation. The ultimate power delivery capacity of this existing line is likely between 60 MW and 70 MW with the addition of voltage support capacitors. A series capacitor and/or a static VAR compensator may result in additional capacity. Barrick will be contracting with a transmission consultant to identify the actual ultimate capacity of this existing line. The consultant will also identify options to construct transmission infrastructure to increase the transmission capacity to Cortez beyond the limits of the existing line.
| | |
Barrick Gold Corporation – Cortez Operations, Project 2471 Technical Report NI 43-101 – March 21, 2016 | | Page 18-5 |
| | |
| | www.rpacan.com |
19 MARKET STUDIES AND CONTRACTS
MARKETS
Gold is the principal commodity at Cortez and is freely traded, at prices that are widely known, so that prospects for sale of any production are virtually assured. Prices are usually quoted in US dollars per troy ounce.
CONTRACTS
Cortez is a large modern operation and the owner is a major international firm with policies and procedures for the letting of contracts. These policies and procedures would lead to contracts that are normal for this scale of operation. The contracts for smelting and refining are normal contracts for a large producer.
The joint venture agreement remains in place though it is now between two wholly owned subsidiaries of Barrick.
| | |
Barrick Gold Corporation – Cortez Operations, Project 2471 Technical Report NI 43-101 – March 21, 2016 | | Page 19-1 |
| | |
| | www.rpacan.com |
20 ENVIRONMENTAL STUDIES, PERMITTING, AND SOCIAL OR COMMUNITY IMPACT
ENVIRONMENTAL STUDIES
Due to the size of the various projects, environmental studies are on-going at Cortez to ensure that the required monitoring is completed and reported and that best practices are utilized to meet the environmental requirements.
MINE PERMITTING
The Cortez Operations are predominantly located on public lands administered by the Bureau of Land Management (BLM) with a small portion on private lands owned by Barrick Cortez Inc. The operations are located in Eureka and Lander counties with BLM jurisdiction from the Battle Mountain and Elko field offices. No facilities are located in Eureka Country, however, the Mine boundary extends onto BLM-administered lands in Eureka County to accommodate a portion of the Cortez Hills open pit and ancillary facilities. The boundaries and permit areas are shown in Figure 20-1.
As shown in the legend of the figure, properties of cultural and religious importance are designated by PCRI and HC/CUEP is the abbreviation for Horse Canyon/Cortez Unified Exploration Project.
Cortez has established, documented, and implemented an Environmental Management System (EMS) in accordance with the ISO 14001:2004 Standard, the Barrick Environmental Policy (the Policy), and the Barrick Gold Environmental Management System Standard (BGEMS). Cortez utilizes the Responsibility Information Management System (RIMS) web-based software platform as a primary tool for establishing, implementing, and maintaining various elements of the EMS (Barrick Cortez, 2014a).
| | |
Barrick Gold Corporation – Cortez Operations, Project 2471 Technical Report NI 43-101 – March 21, 2016 | | Page 20-1 |
| | |
| | www.rpacan.com |
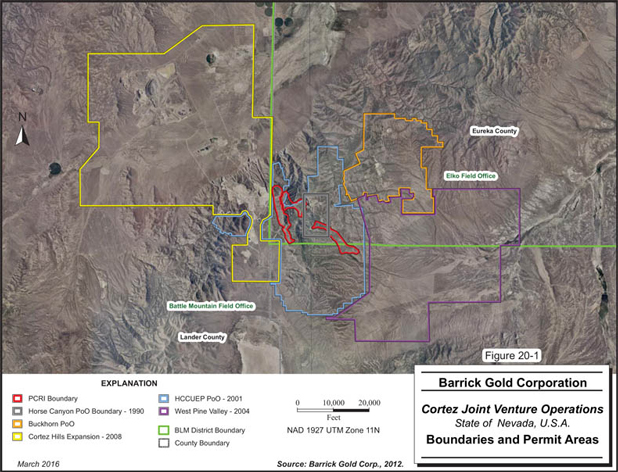
| | |
Barrick Gold Corporation – Cortez Operations, Project 2471 Technical Report NI 43-101 – March 21, 2016 | | Page 20-2 |
| | |
| | www.rpacan.com |
MAJOR PERMIT REQUIREMENTS
The major permits required for operating on public lands are the approval of the Plan of Operations (PoO) by the BLM and a Reclamation Permit from the BLM and Nevada Division of Environmental Protection (NDEP). The Cortez property has received approval for a number of plans of operations (PoO) and reclamation permits since the early 1980s. Permits were issued to allow mining and processing of ore from the East Pit, Horse Canyon Pit, Gold Acres, South Extension Pit, Cortez Canyon, Cortez Hills, and other areas that are no longer actively mined. Table 20-1 lists the major environmental analysis documents (e.g. Environmental Assessment (EA), Environmental Impact Statement (EIS), and Supplemental Environmental Impact Statement (SEIS), Record of Decision (ROD)) and PoOs that have been issued for the currently active areas of the Mine (i.e., Cortez, Pipeline, and Cortez Hills).
TABLE 20-1 IMPORTANT ENVIRONMENTAL DOCUMENTS AND PLANS OF OPERATIONS FOR PIPELINE AND CORTEZ HILLS
Barrick Gold Corporation – Cortez Operations
| | |
Dates | | Description |
January 1996 | | Cortez Pipeline Gold Deposit Final EIS |
January 2000 | | South Pipeline Project Final EIS |
December 2003 | | Pipeline/South Pipeline Pit Expansion Project Final EIS |
November 2008 | | Cortez Hills Expansion Project Final EIS |
November 2008 | | ROD and PoO Amendment Approval |
January 2011 | | Cortez Hills Expansion Project Supplemental Final EIS |
March 2011 | | Cortez Hills Expansion Project ROD and PoO Amendment Approval |
October 2012 | | 2012 Amendment to Plan of Operations and Reclamation Permit Application |
February 2014 | | 2012 Amendment to PoO and ROD Approval |
October 2014 | | Revised Amendment 3 to PoO and Reclamation Permit Application |
September 2015 | | Revised Amendment 3 to PoO Approval |
CORTEZ HILLS EXPANSION PROJECT (APO1)
In August 2005, Cortez submitted an Amendment to the Pipeline/Pipeline South Plan of Operations for the Cortez Hills Expansion Project and associated Modification to Reclamation Plan Permit Application to the BLM. The BLM prepared the Draft EIS in 2007. In 2008, the Final EIS and a ROD and Plan of Operations Amendment Approval were issued by the BLM. BLM’s decision to approve the expansion project was challenged in federal court. The US Court of Appeals for the Ninth Circuit found that the plaintiffs were likely to succeed on the merits of their challenge with respect to the environmental analysis in the EIS for shipping of refractory ore to Goldstrike for processing and increased pumping of groundwater. Following
| | |
Barrick Gold Corporation – Cortez Operations, Project 2471 Technical Report NI 43-101 – March 21, 2016 | | Page 20-3 |
| | |
| | www.rpacan.com |
the finding of the Court of Appeals, the BLM prepared an SEIS to address those areas. (BLM, 2007)
While the SEIS was prepared, on remand from the US Circuit Court, the Nevada US District Court granted BLM’s motion for summary judgement for the areas of the EIS that were considered adequate, but they entered a limited injunction against shipping of refractory ore from Cortez Hills and pumping volumes of groundwater that were higher than previously approved rates. Following the completion of the SEIS, the BLM issued a second ROD and Plan of Operations Amendment Approval. A summary of the proposed activities (BLM, 2011) include:
Cortez Hills Complex:
| | • | | New open pit (Cortez Hills Pit) for development of Cortez Hills and Pediment ore zones |
| | • | | Development of underground operation |
| | • | | New groundwater dewatering system to include in-pit, perimeters, and underground facilities |
| | • | | New Grass Valley Heap Leach Facility with associated solutions ponds, new carbon-in-column (CIC) facility, and reagent storage area |
| | • | | New stockpiles for ore, subgrade ore, and growth media |
| | • | | New waste rock facilities (Canyon, North, and South) |
| | • | | New ancillary facilities (maintenance shop, safety, security, and administrative facilities, 90 day temporary waste storage area, and fuel and lubricant storage facilities) |
| | • | | New primary crusher, conveyor offload stockpiles, and a conveyor system that is approximately 12 miles long |
| | • | | Two new water supply wells and associated power distribution, water pipelines, and water reservoir or head tank |
| | • | | Construction and upgrade of haul roads |
| | • | | Relocation of portions of an existing county road and 60 kV power transmission line within the Mine boundary |
| | • | | Installation of a new 120 kV power transmission line segment and substation |
| | • | | Construction of a new Class III waivered landfill |
| | • | | Development of a new borrow source in Grass Valley |
| | • | | Modification of the existing Horse Canyon/Cortez Unified Exploration Project (HC/CUEP) boundary to remove overlap with the Cortez Gold Mines PoO boundary |
Cortez Complex:
| | |
Barrick Gold Corporation – Cortez Operations, Project 2471 Technical Report NI 43-101 – March 21, 2016 | | Page 20-4 |
| | |
| | www.rpacan.com |
| | • | | Deepening of existing Cortez Mine open pit |
| | • | | Expansion of existing Cortez Waste Rock Facility |
| | • | | Expansion of existing F-Canyon backfill |
| | • | | New Cortez Heap Leach Facility with associated solution ponds, CIC facility, and reagent storage area |
| | • | | Expansion of existing tailings facility |
| | • | | Expansion of diesel fuel storage facilities |
| | • | | Ancillary facilities for underground support (backfill crushing, additional ore stockpiles, shotcrete plant, conveyor onload area, and haul road) |
Pipeline Complex:
| | • | | Expansion of existing Pipeline Pit (North Gap Pit Expansion) |
| | • | | Expansion of existing Pipeline Waste Rock Facility |
| | • | | Relocation of existing county road around waste rock facility expansion area |
| | • | | Expansion of the existing Pipeline Mill to facilitate an increase in throughput from currently permitted 13,500 stpd to an average of 15,000 stpd |
| | • | | Modification of the existing Pipeline/South Pipeline/Gold Acres exploration permit boundary to remove overlap with the Cortez Gold Mines PoO boundary |
2012 AMENDMENT TO PLAN OF OPERATIONS AND RECLAMATION PERMIT APPLICATION (APO2)
In October 2012, Cortez submitted a second proposed amendment to the existing PoO. The proposed modifications were (Barrick, 2012):
| | • | | Reconfiguring the North Waste Rock Facility (NWRF) footprint and storm water diversions within an area previously authorized for waste rock, ancillary, and conveyor corridor disturbance |
| | • | | Incorporating an ore stockpile on the surface of the NWRF footprint |
| | • | | Relocating a six million ton stockpile of ore to Goldstrike at the rate of 800,000 stpa for approximately eight years |
| | • | | Adding ancillary facilities including a potable water well and associated distribution pipeline, and a bank of capacitors |
| | • | | Constructing approximately ten miles of rangeland fence to the perimeter of the relocated County Road 225 |
All components of the APO2 application were approved by the BLM on February 24, 2014.
| | |
Barrick Gold Corporation – Cortez Operations, Project 2471 Technical Report NI 43-101 – March 21, 2016 | | Page 20-5 |
| | |
| | www.rpacan.com |
AMENDMENT 3 TO PLAN OF OPERATIONS AND RECLAMATION PERMIT APPLICATION (APO3)
In August 2014 and revised in October 2014, Cortez submitted additional proposed modifications to the PoO (Barrick Cortez, 2014b). The proposed modifications include:
| | • | | Deepen the Gap Pit from 4,400 ft amsl to 4,360 ft amsl |
| | • | | Construct the Range Front Declines and associated infrastructure |
| | • | | Construct twin declines and associated surface infrastructure on the range front north of the Canyon waste rock facility |
| | • | | Establish additional surface facilities to support the Cortez Hills Underground |
| | • | | Expand the Area 30 heap leach facilities by 240 acres |
| | • | | Modify mining rate between the Cortez Hills and Pipeline areas to optimize surface mining activities |
| | • | | Add a water treatment plant and infrastructure to reduce naturally occurring arsenic concentrations in the dewatering water |
| | • | | Allow off-site ore haulage up to approximately 1.2 million tons per year site wide (i.e., no longer limit the haulage from the stockpiles to 800,000 stpa). |
| | • | | Reconfigure the Pipeline, Canyon, and Gap waste rock facilities |
| | • | | Expand the Gap waste rock facility by 220 acres and increase the height by 200 ft |
| | • | | Increase the height of the Pipeline waste rock facility by 300 ft |
| | • | | Increase the height of the Canyon waste rock facility by 160 ft |
| | • | | Infrastructure addition |
| | • | | Administration building, maintenance shop, fuel skid in the ancillary facility area |
| | • | | Reconfigure the LOM power line locations |
All components of the APO3 application were approved by the BLM on September 28, 2015.
APO4: DEEP SOUTH EXPANSION AND INCREASE DEPTH OF CROSSROADS PIT
Cortez began discussions for the next proposed changes with the BLM and the State of Nevada in April 2015 (Barrick Cortez, 2015b). Major elements of the expansion include:
| | • | | Expansion of the existing Cortez Hills underground mine by increasing the depth of mining from 3,800 ft to 2,500 ft |
| | • | | Expand the Pediment portion of the Cortez Hills Pit and shift the Plan boundary to the east |
| | • | | Backfill the Cortez Hills Pit |
| | • | | Expand the Grass Valley heap leach facility |
| | • | | Expand the existing Cortez Pit and WRF |
| | |
Barrick Gold Corporation – Cortez Operations, Project 2471 Technical Report NI 43-101 – March 21, 2016 | | Page 20-6 |
| | |
| | www.rpacan.com |
| | • | | Expand/deepen the Crossroads Pit (Pipeline Complex) by 200 ft and reconfigure the backfill |
| | • | | Add Stage 11 to the Pipeline Pit |
| | • | | Expand the existing Gold Acres Pit and expand the WRF |
| | • | | Construct an additional water treatment plant in the Cortez Hills Complex |
| | • | | Add rapid infiltration basin (RIB) galleries and surface pipeline on fee land outside the PoO in Crescent Valley |
| | • | | Construct additional RIBs in Grass Valley and Pine Valley |
| | • | | Construct a surface water line in Pine Valley to convey treated dewatering water |
| | • | | Potentially construct a water reservoir and pipelines at Rocky Pass for dewatering water management |
| | • | | Additions/revisions to facilities and disturbance |
| | • | | Expand the Plan boundary to capture proposed facilities |
| | • | | Modify the surface mining rate to allow up to 600,000 tons per day |
| | • | | Expand the existing Pipeline oxide ore stockpile |
| | • | | Additional ore stockpiles |
| | • | | Add ancillary disturbance around existing and proposed facilities |
| | • | | Powerlines, pipelines, buildings, communication sites, haul roads, access roads, borrow areas, etc. |
| | • | | Underground surface infrastructure (vent raises, boreholes, surface plants, etc.) |
| | • | | Increase off-site ore haulage to 2.5 Mstpa with the potential for backhauling ore to Cortez |
| | • | | Revise dewatering and disposal rates |
The Deep South Zone PFS timeline assumes that permitting will take approximately three to four years and Barrick expects to commence this process in 2016.
OTHER PERMIT REQUIREMENTS
A number of federal and state permits are required to operate the Cortez Mine. Cortez adheres to permitting guidelines from the BLM, the Nevada Revised Statutes (NRS), the Nevada Administrative Code (NAC), and additional federal government requirements. A summary of the major environmental permits for the Cortez Operations is provided in Table 20-2.
| | |
Barrick Gold Corporation – Cortez Operations, Project 2471 Technical Report NI 43-101 – March 21, 2016 | | Page 20-7 |
| | |
| | www.rpacan.com |
TABLE 20-2 MAJOR ENVIRONMENTAL PERMITS
Barrick Gold Corporation – Cortez Operations
| | | | | | | | | | | | |
Activity or Permit | | Jurisdiction | | Agency | | Permit Name | | Number | | Issued | | Expires |
| Integrated Monitoring Plan | | Federal | | BLM | | Integrated Monitoring Plan | | | | 09-01-95 | | NA |
| Water Pollution Control Permit | | State | | NDEP - BMRR | | Pipeline Infiltration | | NEV0095111 | | 11-02-95 | | 10-20-16 |
| Water Pollution Control Permit | | State | | NDEP - BMRR | | Pipeline Project | | NEV0093109 | | 05-01-93 | | 01-23-17 |
| | | | Cortez Hills Expansion | | NEV2007106 | | 07-30-07 | | 09-11-18 |
| | | | Cortez Gold Mine | | NEV0000023 | | 04-13-90 | | 07-22-151 |
Water rights/reallocation/ diversion changes | | State | | NDWR | | | | On-going | | | | |
| | | | | | |
| Dam storage permits | | State | | NDWR | | Pipeline Tails Dam Buttress | | J-553 | | 03-23-10 | | NA |
| | | | Pipeline Tails Dam Phase III Raise | | J-647 | | 07-26-10 | | NA |
| | | | Cortez Hills Fresh Water Reservoir | | J-626 | | 06-01-09 | | NA |
| | | | Cortez Hills Storm Water Retention Pond #1, #2 Dams | | J-656 & J657 | | 06-08-11 | | NA |
| | | | Cortez Area 28 TSF Cell 4 Dam | | J-659 | | 01-05-12 | | NA |
| | | | Cortez Area 28 TSF Phase IV Raise | | J-663 | | 08-09-11 | | NA |
| Reclamation Permit | | State | | NDEP - BMRR | | Reclamation Permit | | 0093 | | 07-13-00 | | NA |
| Air Quality Permits | | State | | NDEP - BAPC | | Class I Air Quality Operating Permit | | AP1041-2141 | | 01-28-08 | | 01-28-132 |
| Discharge/ Underground Injection Permit | | State | | NDEP - BWPC | | Mill #1 UIC | | GU07RL-51036 | | 10-10-12 | | 10-09-17 |
| Industrial Artificial Pond Permits | | State | | NDOW | | Pipeline Mill | | S-34569 | | 11-14-11 | | 11-14-16 |
| | | | Pipeline Heap Leach Facilities | | S-34567 | | 11-14-11 | | 11-14-16 |
| | | | Cortez Hills Process Facility | | S-31579 | | 04-20-14 | | 04-21-19 |
| | | | Cortez Mill No. 1 Facility | | S-314104 | | 04-01-11 | | 03-31-16 |
| Potable Water Permit | | State | | NDEP - BSDW | | Barrick Cortez Gold Mines Pipeline | | LA-0892-12NTN | | 04-09-15 | | 04-30-16 |
| | |
Barrick Gold Corporation – Cortez Operations, Project 2471 Technical Report NI 43-101 – March 21, 2016 | | Page 20-8 |
| | |
| | www.rpacan.com |
| | | | | | | | | | | | |
Activity or Permit | | Jurisdiction | | Agency | | Permit Name | | Number | | Issued | | Expires |
| | | | | | NV0000892 | | C | | | | |
| | | | Cortez Mill No. 1 Potable Water System NV0002570 | | LA-2570-12NTNC | | 04-09-15 | | 04-30-16 |
| | | | Barrick Cortez Hills | | LA-1097-NTNC | | 04-09-15 | | 04-30-16 |
| Storm Water Permit | | State | | NDEP - BWPC | | Storm Water General Permit | | NVR300000 | | 03-01-13 | | 02-28-18 |
| Mercury Operating Permit to Construct Phase II | | State | | NDEP - BAPC | | Mercury Operating Permit to Construct | | AP1041-2220 | | 07-16-12 | | |
| Hazardous Materials Storage | | State | | Nevada State Fire Marshall | | Cortez Gold Mines | | 50304 & 50330 | | 03-01-15 | | 02-29-16 |
| Jurisdiction Determination | | Federal | | Army Corps of Engineers | | Cortez Mining Area South of Crescent Valley | | JD | | 02-25-10 | | 06-16-20 |
| Landfill | | State | | NDEP - BWM | | Class III Waivered Landfill | | | | 03-31-14 | | 03-31-19 |
1 – Five year renewal permit application is under review by NDEP-BMRR; Cortez continues to operate under existing permit
2 – Five year renewal permit application is under review by NDEP-BAPC; Cortez continues to operate under existing permit
| | |
NDEP – Nevada Division of Environment Protection | | NDWR – Nevada Division of Water Resources |
BMRR – Bureau of Mining Regulation and Reclamation | | BSDW – Bureau of Safe Drinking Water |
BAPC – Bureau of Air Pollution Control | | BWM – Bureau of Waste Management |
SOCIAL AND COMMUNITY REQUIREMENTS
Barrick is a major corporation and employer in Nevada that is actively involved in being a responsible corporate citizen.
CORTEZ COMMUNITY CONTEXT
The Cortez mine site is located approximately 30 miles southeast of Battle Mountain, Nevada in Lander County. The majority of its approximately 1300 employees reside in the Elko/Spring Creek area (Elko County) with about ten percent residing in Battle Mountain (Lander County) and ten percent residing in Crescent Valley Township (Eureka County).
The rural communities located in northeastern Nevada are primarily dependent upon the mining industry for employment and economic security. This has created a very supportive, pro-mining culture in these communities where most employees live, however, Cortez operates on lands traditionally used by the Western Shoshone tribes and bands, and operations make great efforts to demonstrate respect for indigenous cultural resources,
| | |
Barrick Gold Corporation – Cortez Operations, Project 2471 Technical Report NI 43-101 – March 21, 2016 | | Page 20-9 |
| | |
| | www.rpacan.com |
environmental stewardship, and shared benefits to receive support from Western Shoshone communities.
Water resources, air quality, and public safety associated with the use of over-the-road trucking for ore transport are key concerns for both the rural communities and Western Shoshone communities. Crescent Valley Township is the community most affected by mining operations, as it shares a watershed, air shed, and roadways with the Cortez Operations. Furthermore, agricultural water users throughout the Humboldt River Basin routinely express interest in new water allocations and uses with the area, and insist on protection of established water rights.
Barrick’s Community Relations Department engages regularly with community members and leadership of the rural host communities and Western Shoshone communities in various formal and informal settings. The Community Relations (CR) department (and at times mine staff) participate in numerous education, health, economic development, cultural, and family welfare initiatives at the community level (e.g., community investments, Gold Fever educational programming for elementary school students, community event sponsorships, economic development authorities) and regional level (e.g., support for Great Basin College programs, the White Ribbon Project for prevention of domestic violence, and Western Shoshone language and cultural preservation efforts).
A full demographic report appears in the Environmental Impact Statement (EIS) completed for the Cortez Hills Project in November 2008 (see Section 3.13 of that document). The demographic and statistical information was updated by Barrick in 2014. Key updates are summarized in the text below.
POPULATION AND DEMOGRAPHICS
Of the three counties from which Cortez draws its workforce, Elko County has the largest population at approximately 49,000 with a growth rate around three percent. Lander County’s population is approximately 6,000 residents while Eureka County has approximately 2,000 residents. Approximately 400 Eureka County residents are located in Crescent Valley, the closest community to Cortez (approximately 15 miles north).
Ethnically, the local populations are more than 80% white and approximately five percent Native American, with the balance of the residents identified primarily as Hispanic. A comparison to the 2000 census shows a reduction in the relative percentage of Native
| | |
Barrick Gold Corporation – Cortez Operations, Project 2471 Technical Report NI 43-101 – March 21, 2016 | | Page 20-10 |
| | |
| | www.rpacan.com |
American residents census caused primarily by the immigration of other ethnicities and stagnant tribal enrollments.
CONSULTATION PROCESSES/STAKEHOLDER ENGAGEMENT/COMMUNITY INTERACTIONS
Because permitting efforts require a formal consultation process managed by the BLM, the CR group works collaboratively with the Permitting Group to ensure that consultation efforts are complementary to the BLM’s process.
As new projects develop, Barrick holds public meetings (and advertise a local grievance mechanism according to the Grievance Management Procedure) if internal strategy deems appropriate so that citizens in the surrounding areas may come to learn more and express their support or concerns. Barrick may also share employment growth projections with local government and organizations if needed for local planning purposes.
Barrick also strives to maintain a positive, open relationship with the local media. Traditionally Barrick has been proactive in initiating coverage of projects, expansions, or changes in operations or processes. As deemed appropriate, the Barrick Communications Group will engage the media for coverage.
In addition to mandated regulatory processes, Barrick’s CR team maintains a regular program of engagement with local governments, community members, local organizations, and other stakeholders associated with projects under development and in operation. This program includes meeting these stakeholders in both formal and informal settings, providing opportunity to gain a greater understanding of concerns and opinions related to Barrick’s projects and operations.
OTHER INFORMATION
GRIEVANCE PROCEDURE
In accordance with Barrick’s Community Relations Management System and documented Grievance Management Procedure, any and all grievances presented to the company will be brought to the attention of CR and other relevant internal parties so that immediate action may be taken. The entity bringing the grievance will be engaged as soon as practical to ensure all parties fully understand the grievance and how a mutually agreeable resolution may be reached. Barrick is committed to cooperating with concerned parties, within reason, to mitigate
| | |
Barrick Gold Corporation – Cortez Operations, Project 2471 Technical Report NI 43-101 – March 21, 2016 | | Page 20-11 |
| | |
| | www.rpacan.com |
concerns. As needed, and appropriate, site tours may be conducted to ensure a better understanding of the Mine and mining operations.
KEY IMPACTS/OPPORTUNITIES
Opportunities for proactively addressing social risks include open, up front communication, timely response to enquiries and concerns, and providing assurance that Barrick will continue to operate within the guidelines mandated by local, state, and federal regulatory agencies. Barrick has, and will continue to conduct its operations in full compliance with all regulatory agency requirements.
Community impacts include:
| | • | | Mine development and operation should maintain (and potentially increase) local employment and tax revenues. |
| | • | | Ore hauling and/or processing options may increase water consumption by mine operations, generate air emissions that require mitigating controls, increase truck traffic over area roadways, and disturb grounds with potential cultural resources and/or wildlife habitat. |
| | • | | Dewatering operations would increase the extent of groundwater drawdown and may require mitigation controls to address potential impacts to groundwater resources, surface water resources, and/or riparian habitat and associated existing uses. |
EMPLOYMENT
Unemployment rates in the area are relatively low (approximately 3.4%) with about one quarter of the workforce directly employed in the mining industry. Lander and Eureka Counties have an unusual situation where total employment in the counties is greater than their populations due to commuting workforces based primarily in Elko County.
HOUSING
Vacancy rates in the area for all housing range from 10% to 15%, however, short-term and rental housing options have a much lower vacancy rate than long-term housing. Economically-driven slowing in the mining industry is causing vacancy rates to increase at the present time.
Temporary housing is available in numerous hotel/motels and RV parks in the area.
Occupancy rates for the temporary housing are decreasing at the present time due to the current slowdown in area mining activity.
| | |
Barrick Gold Corporation – Cortez Operations, Project 2471 Technical Report NI 43-101 – March 21, 2016 | | Page 20-12 |
| | |
| | www.rpacan.com |
EMERGENCY SERVICES
In general, law enforcement, fire protection, and ambulance services are available to service the communities from which Cortez draws its employees. Staffing emergency services in Crescent Valley remains a challenge as fire and ambulance services depend exclusively on volunteers from a community where residents are frequently short-term.
Cortez maintains its own fire protection and ambulance services to meet the needs of its employees, and may assist communities under special circumstances at their request.
COMMUNITY RELATIONS MANAGEMENT PLAN
Cortez is incorporated into the Community Relations Management System for North American operations. Community Relations incorporates any required new components into the Social Management Plan and site specific plans will be developed if needed.
Specific components of the Social Management Plan pertaining to this project include:
| | • | | Proactive engagement with local communities and nearby residents to provide updates and timely response to any questions and concerns from the communities. |
| | • | | Execution of the Community Development Plan to assist communities in their ability to share economic benefits and maintain/expand a local workforce. |
| | • | | Diligent pursuit of a Mine Operations and Benefit Sharing Agreement (MOBSA) with the Western Shoshone communities in the area to recognize their traditional use of the area and formalize benefit sharing arrangements. |
| | • | | Proactive engagement with local communities to describe the water quantity, water quality and air quality impacts, and planned mitigation measures. |
| | • | | Working with the Crescent Valley residents to identify and mitigate the effects of increased truck haulage on State Route 306 (in conjunction with the Permitting Groups’ interaction with the Nevada Department of Transportation). |
| | • | | Working with Western Shoshone communities on the observation of and/or participation in the management of cultural resources and traditional plants. |
| | • | | Engaging with wildlife organizations regarding the potential impacts to habitat and their mitigation. |
| | • | | Working with Pine Valley residents, and other interested agricultural users in the Humboldt River Basin, to understand the effects of dewatering on groundwater and surface water resources and mitigate any potential impacts to water rights. |
| | |
Barrick Gold Corporation – Cortez Operations, Project 2471 Technical Report NI 43-101 – March 21, 2016 | | Page 20-13 |
| | |
| | www.rpacan.com |
SUMMARY OF GOVERNMENT RELATIONS
The local government has historically supported the Cortez Mine with an unusual exception in 2004 stemming from needs to balance competing development issues primarily related to water resources and housing that was readily resolved. The Nevada State government is generally supportive of mining. Its regulatory agencies are mature, and the license and permitting processes are well established and understood by the mining industry.
Some Western Shoshone communities have administratively and legally challenged Cortez permits on the basis of perceived insufficient mitigation of impacts to cultural and water resources.
The federal government and its agencies generally oppose new land disturbance on public lands without offsetting mitigation efforts. Although the National Environmental Policy Act (NEPA) process is well understood, positive permitting outcomes and timelines are never certain.
POLITICAL AND INVESTMENT CLIMATE
The citizenry within the area in which Barrick Cortez Mine operates are generally supportive of Barrick activities, but there are many constituencies within the area that will need attention to ensure support. Fortunately, Barrick has excellent opportunities to build relationships and alliances with these groups on common ground issues such as water management, economic development and protection, and management of sage grouse habitat.
Mining is a major contributor to the local economy in the form of wages and taxes, however, Barrick Cortez and any proposed projects or changes to the operation are expected to generate political controversy to some extent, based on past experience regarding the resolution of water resources, air quality, and cultural resource impacts. The investment climate within Nevada remains one of the best in the United States, however the nation is an increasingly difficult country in which to develop new projects, and this environment could deteriorate further depending on new regulation and taxes.
GOVERNMENT PORTFOLIO OF AGENCIES
The Mount Lewis Field Office of the BLM, located in Battle Mountain, Nevada, would be the lead agency with respect to any National Environmental Policy Act (NEPA) process. Under NEPA, the BLM would include input from NDEP, as a cooperating agency, for review of air,
| | |
Barrick Gold Corporation – Cortez Operations, Project 2471 Technical Report NI 43-101 – March 21, 2016 | | Page 20-14 |
| | |
| | www.rpacan.com |
water, and hazardous waste impacts. Other likely cooperating agencies during NEPA include the US Fish and Wildlife Service, the Nevada Natural Heritage Program, the NDOW, and various Native American tribes.
GOVERNMENT RELATIONS MANAGEMENT PLAN
The key impacts are water resources, air quality, and increased truck traffic. Barrick will continue to engage with the Lander County Commissioners, Crescent Valley Town Board, Eureka County Commissioners, Pine Valley residents, and other local communities to discuss these impacts, identify any unforeseen impacts related to population growth, housing, or other issues, and to identify effective mitigation strategies.
The Permitting Group and site environmental staff interact with the BLM and NDEP to secure the necessary environmental permits for the project. The regulations and processes needed to obtain the permits from the various State agencies are well understood, and the process itself is not expected to be problematic.
Obtaining additional revenue is a key issue for Nevada at present. There are frequent attempts to modify the existing taxation formula for industry in general and mining in particular. Tactics and strategy for dealing with these attempts are delegated to the corporate level within Barrick.
Many members of the Cortez staff contribute to Barrick’s political action committee. These funds are used to support Senators and Representatives that are supportive of the mining industry. This committee has been instrumental in influencing new regulation and shaping opinion on mining law. These activities are delegated to US Executive Director and others within the corporate team.
MINE CLOSURE REQUIREMENTS
Cortez submitted an amendment application to the PoO and Reclamation Permits in November 2011. The PoO amendment (APO2) was approved by the BLM in February 2014. The approved APO2 authorized an additional 41 acres on public lands to be disturbed and reclassified an additional 98 acres of previously authorized disturbance. An amendment (APO3) to APO2 was submitted to the BLM in August 2014 to accommodate planned mine expansion activities. APO3 was approved on September 28, 2015.
| | |
Barrick Gold Corporation – Cortez Operations, Project 2471 Technical Report NI 43-101 – March 21, 2016 | | Page 20-15 |
| | |
| | www.rpacan.com |
Reclamation of disturbed areas resulting from mining activities will follow the approved Reclamation Plan and will be completed in accordance with BLM and NDEP regulations that are intended to prevent unnecessary or undue degradation of public lands by operators authorized by the mining laws.
The authorized surface disturbance for the Cortez areas is summarized in Table 20-3.
TABLE 20-3 SURFACE DISTURBANCE AUTHORIZATION
Barrick Gold Corporation – Cortez Operations
| | | | | | | | | | | | |
Complex | | Public
(acres) | | | Private
(acres) | | | Total
(acres) | |
Cortez Hills | | | 4,599 | | | | 8 | | | | 4,607 | |
Cortez | | | 1,477 | | | | 589 | | | | 2,066 | |
Pipeline | | | 9,381 | | | | 53 | | | | 9,434 | |
Gold Acres | | | 361 | | | | 232 | | | | 593 | |
Total | | | 15,818 | | | | 882 | | | | 16,700 | |
The state of Nevada requires a reclamation bond based on the disturbed areas. Following approval of APO3, the bond increased to $227,523,322. The surety amount is reviewed every three years or whenever a PoO amendment is submitted for review and approval to determine if the current bond is still adequate to execute the approved Reclamation Plan. The permit is valid for the life of the Mine unless it is modified, suspended, or revoked by NDEP.
To the best of RPA’s knowledge, there are no environmental issues that could materially impact Barrick’s ability to extract the mineral resources or mineral reserves at this time.
| | |
Barrick Gold Corporation – Cortez Operations, Project 2471 Technical Report NI 43-101 – March 21, 2016 | | Page 20-16 |
| | |
| | www.rpacan.com |
21 CAPITAL AND OPERATING COSTS
CAPITAL COST ESTIMATE
The total capital expenditure in the 2016 LOM plan is $2,011. The total includes capital required to expand underground mining into the Deep South Zone below currently permitted levels. The Deep South Zone has the potential to contribute average underground production of more than 300,000 ounces per year between 2023 and 2027 at average all-in sustaining costs of approximately $580 per ounce. Initial capital costs are estimated to be $153 million and sustaining capital is estimated to be $58 million, for the Deep South project total of $211 million.
The capital costs for Cortez are developed and revised on an annual basis as part of the budget cycle. The 2016 LOM capital plan as developed at the site for approval by the corporation is shown below in Table 21-1.
The capital includes ongoing sustaining capitals as well as capital for the expansion of some of the facilities. The scope of the capital costs for the Mine is appropriate.
TABLE 21-1 CAPITAL COSTS
Barrick Gold Corporation – Cortez Operations
| | | | | | | | | | | | | | | | | | |
Year | | | | | | Deferred
Operating | | Expansion | | Exploration | | Fixed
Equipment | | Mobile
Equipment | | Regulatory | | Grand
Total |
2016 | | | | US$ M | | 58.6 | | 222.1 | | 9.8 | | 43.5 | | 7.4 | | 9.1 | | 350.5 |
2017 | | | | US$ M | | 50.7 | | 284.1 | | 8.1 | | 19.8 | | 9.3 | | 5.0 | | 376.9 |
2018 | | | | US$ M | | 145.5 | | 169.3 | | 11.8 | | 22.5 | | 12.8 | | 37.8 | | 399.7 |
2019 | | | | US$ M | | 253.8 | | 61.5 | | 11.0 | | 22.5 | | 6.1 | | 7.4 | | 362.2 |
2020 | | | | US$ M | | 131.7 | | 29.5 | | 11.3 | | 13.8 | | 12.4 | | 1.8 | | 200.5 |
2021 | | | | US$ M | | 19.7 | | 21.7 | | 6.1 | | 13.4 | | 7.9 | | 1.6 | | 70.5 |
2022 | | | | US$ M | | 12.9 | | 6.8 | | 4.0 | | 7.5 | | 10.7 | | 1.6 | | 43.6 |
2023 | | | | US$ M | | 29.5 | | 5.7 | | 2.9 | | 2.2 | | 5.9 | | 1.6 | | 47.8 |
2024 | | | | US$ M | | 46.2 | | 7.7 | | 2.6 | | 0.4 | | 8.4 | | 1.6 | | 67.0 |
2025 | | | | US$ M | | 41.4 | | 29.4 | | 1.8 | | 0.4 | | 9.8 | | 1.7 | | 84.5 |
2026 | | | | US$ M | | 0.9 | | 2.3 | | 1.6 | | 0.3 | | — | | 1.6 | | 6.7 |
2027 | | | | US$ M | | — | | — | | — | | — | | — | | 0.5 | | 0.5 |
2028 | | | | US$ M | | — | | — | | — | | — | | — | | 0.5 | | 0.5 |
Total | | | | US$ M | | 791 | | 840 | | 71 | | 146 | | 91 | | 72 | | 2,011 |
| | |
Barrick Gold Corporation – Cortez Operations, Project 2471 Technical Report NI 43-101 – March 21, 2016 | | Page 21-1 |
| | |
| | www.rpacan.com |
OPERATING COSTS
The operating costs for Cortez are developed annually as part of the site budget process. In the mine area the costs are developed on a zero based budgeting system incorporating experience from previous periods. The LOM operating costs are shown in Table 21-2. In RPA’s opinion, the operating costs for the Mine are reasonable.
TABLE 21-2 LOM OPERATING COSTS
Barrick Gold Corporation – Cortez Operations
| | | | | | | | | | |
| | | | | Open Pit | | | Underground | |
Mine $/t mined | | US$/st mined | | | 1.79 | | | | 86.59 | |
| | | |
Mine $/t milled | | US$/st milled | | | 12.60 | | | | 104.82 | |
Process | | US$/st milled | | | 7.43 | | | | 22.87 | |
G&A | | US$/st milled | | | 2.40 | | | | 24.02 | |
Refine/Freight | | US$/st milled | | | 0.01 | | | | 0.09 | |
Royalty | | US$/st milled | | | 2.21 | | | | 4.90 | |
Total | | US$/st milled | | | 24.66 | | | | 156.70 | |
MANPOWER
Manpower levels for the LOM plan are shown in Table 21-3. Manpower levels remain relatively steady through the mine life until the cessation of mining, and then the cessation of processing at the site.
TABLE 21-3 MANPOWER
Barrick Gold Corporation- Cortez Operations
| | | | | | | | | | | | |
Year | | | | Open Pit
Mining | | Underground
Mining | | Processing | | G&A, Site Services,
Safety, Security,
Environmental | | Total |
2016 | | | | 631 | | 343 | | 182 | | 126 | | 1,282 |
2017 | | | | 631 | | 367 | | 182 | | 126 | | 1,306 |
2018 | | | | 648 | | 375 | | 171 | | 126 | | 1,320 |
2019 | | | | 604 | | 379 | | 171 | | 115 | | 1,269 |
2020 | | | | 527 | | 379 | | 171 | | 120 | | 1,197 |
2021 | | | | 527 | | 379 | | 168 | | 120 | | 1,194 |
2022 | | | | 492 | | 379 | | 157 | | 101 | | 1,129 |
2023 | | | | 401 | | 379 | | 147 | | 74 | | 1,001 |
| | |
Barrick Gold Corporation – Cortez Operations, Project 2471 Technical Report NI 43-101 – March 21, 2016 | | Page 21-2 |
| | |
| | www.rpacan.com |
22 ECONOMIC ANALYSIS
Under NI 43-101 rules, producing issuers may exclude the information required for Section 22 Economic Analysis on properties currently in production, unless the technical report includes a material expansion of current production. RPA notes that Barrick is a producing issuer, the Cortez Mine is currently in production, and a material expansion is not being planned. RPA has performed an economic analysis of the Cortez Operations using the estimates presented in this report and confirms that the outcome is a positive cash flow that supports the statement of Mineral Reserves.
| | |
Barrick Gold Corporation – Cortez Operations, Project 2471 Technical Report NI 43-101 – March 21, 2016 | | Page 22-1 |
| | |
| | www.rpacan.com |
23 ADJACENT PROPERTIES
In 2011 the discovery of the Red Hill and Goldrush deposits was announced by Barrick. The two deposits are located four miles southeast of the Cortez Hills mine and 15 mi southeast of the Pipeline mine.
Based on the results of wide spaced drilling, Barrick originally outlined two zones of gold mineralization along a seven kilometer long trend. The mineralization is primarily hosted in a favorable carbonate unit and has a tabular geometry. Host rocks are similar to those found at Barrick’s Cortez Hills and Goldstrike mines. The majority of the mineralization intersected to date is refractory and occurs at depths between 150 m and 500 m. Continued drilling of the mineralization has shown that the two deposits are in fact joined. As a result, the deposit has been renamed Goldrush, which includes both Red Hill and the original Goldrush deposits.
At December 31, 2015, Barrick reported (2015 Year-End Report and Fourth Quarter Results) Measured and Indicated Mineral Resources for Goldrush to be 27.7 million tons grading 0.308 oz/st Au and containing 8.6 million ounces of gold, plus an Inferred Mineral Resource of 6.3 million tons grading 0.262 oz/st Au and containing 1.6 million ounces of gold.
In addition, Barrick has identified a new target known as Fourmile, located one to three kilometers north of the Goldrush discovery. This area is geologically similar to the high grade Deep-Post and Deep-Star deposits in the Goldstrike area. Early drilling has intersected mineralization well above the average grade of the Measured and Indicated Resources at Goldrush. Potential quantities and grades in these preliminary results are conceptual in nature and there has been insufficient exploration at Fourmile to define a Mineral Resource at this time and it is uncertain that further exploration will result in the target being delineated as a Mineral Resource.
RPA has not independently verified this information and this information is not necessarily indicative of the mineralization at Cortez.
| | |
Barrick Gold Corporation – Cortez Operations, Project 2471 Technical Report NI 43-101 – March 21, 2016 | | Page 23-1 |
| | |
| | www.rpacan.com |
24 OTHER RELEVANT DATA AND INFORMATION
No additional information or explanation is necessary to make this Technical Report understandable and not misleading.
| | |
Barrick Gold Corporation – Cortez Operations, Project 2471 Technical Report NI 43-101 – March 21, 2016 | | Page 24-1 |
| | |
| | www.rpacan.com |
25 INTERPRETATION AND CONCLUSIONS
Based on the site visit and review of the documentation available, RPA offers the following interpretation and conclusions:
GEOLOGY AND MINERAL RESOURCES
| | • | | The Cortez deposits are “Carlin” style porphyry/epithermal deposits hosted by sedimentary rocks. |
| | • | | The sampling, sample preparation, analyses, security, and data verification meet or exceed industry standards and are appropriate for Mineral Resource estimation. |
| | • | | The parameters, assumptions, and methodology used for Mineral Resource estimation are appropriate for the style of mineralization. |
| | • | | Mineral Resources are reported exclusive of Mineral Reserves and are estimated effective December 31, 2015. |
| | • | | Total Mineral Resources at the Cortez Operations are: |
| | • | | Measured - 3.78 million tons, grading 0.048 oz/st Au, containing 181,000 oz Au. |
| | • | | Indicated - 44.40 million tons, grading 0.044 oz/st Au, containing 1,969,000 oz Au. |
| | • | | Inferred - 20.7 million tons, grading 0.04 oz/st Au, containing 861,000 oz Au. |
| | • | | Open Pit Mineral Resources at the Cortez Operations are: |
| | • | | Measured - 3.61 million tons, grading 0.034 oz/st Au, containing 124,000 oz Au. |
| | • | | Indicated - 41.40 million tons, grading 0.026 oz/st Au, containing 1,082,000 oz Au. |
| | • | | Inferred - 19.4 million tons, grading 0.02 oz/st Au, containing 395,000 oz Au. |
| | • | | Underground Mineral Resources at the Cortez Operations are: |
| | • | | Measured - 0.17 million tons, grading 0.339 oz/st Au, containing 56,000 oz Au. |
| | • | | Indicated - 3.01 million tons, grading 0.295 oz/st Au, containing 886,000 oz Au. |
| | • | | Inferred - 1.34 million tons, grading 0.35 oz/st Au, containing 466,000 oz Au. |
MINING AND MINERAL RESERVES
| | • | | The Mineral Reserves are contained within four open pit deposits, four zones in one underground deposit, and surface stockpiles. |
| | • | | The December 31, 2015 Mineral Reserves as stated by Cortez are estimated in a manner consistent with industry practices. |
| | • | | Total Mineral Reserves at the Cortez Operations are: |
| | • | | Proven: 15.9 million tons, grading 0.065 oz/st Au, containing 1.03 million oz Au. |
| | • | | Probable: 153.0 million tons, grading 0.066 oz/st Au, containing 10.09 million oz Au. |
| | |
Barrick Gold Corporation – Cortez Operations, Project 2471 Technical Report NI 43-101 – March 21, 2016 | | Page 25-1 |
| | |
| | www.rpacan.com |
| | • | | Open Pit Mineral Reserves at the Cortez Operations are: |
| | • | | Proven: 11.9 million tons, grading 0.045 oz/st Au, containing 0.54 million oz Au. |
| | • | | Probable: 140.2 million tons, grading 0.040 oz/st Au, containing 5.67 million oz Au. |
| | • | | Underground Mineral Reserves at the Cortez Operations are: |
| | • | | Proven: 0.1 million tons, grading 0.514 oz/st Au, containing 0.06 million oz Au. |
| | • | | Probable: 12.8 million tons, grading 0.345 oz/st Au, containing 4.41 million oz Au. |
| | • | | The open pit mine is a conventional operation with 400 st and 345 st class off-highway haul trucks which are loaded a 35 yd3 hydraulic shovel and five 48 yd3 to 77 yd3electric shovels. |
| | • | | The Cortez operation is permitted to dewater up to approximately 36,000 gpm from the underground and open pit mine areas. |
| | • | | Mine production rates are projected to average 157 Mstpa over the next six years from 2016 to 2022. Average open pit ore mining rate is approximately 19.1 Mstpa. |
| | • | | CHUG is a mechanized decline access underground mine operating at approximately 2,000 stpd of ore. |
| | • | | The Breccia, Middle, and Lower Zones of the underground mine are mined or planned to be mined using drift and fill mining methods. |
| | • | | Mineral Resources in the Deep South Zone were converted to Mineral Reserves on the basis of a positive PFS completed by Barrick and Minetech (USA) LLC. |
| | • | | The mining methods and equipment are considered to be suitable for the deposits. |
��
| | • | | In the Deep South Zone, approximately 1.7 million oz of Measured and Indicated Mineral Resources were converted to Proven and Probable Mineral Reserves as of year-end 2015 on the basis of a positive PFS. |
| | • | | The conclusions and recommendations of the Deep South Zone PFS are reasonable and appropriate for the deposit. |
| | • | | The Deep South Zone PFS work included re-evaluation of the geotechnical characteristics and the design for the mining of the Deep South Zone includes long hole stoping which is expected to be more productive and lower cost than the drift and fill mining. |
| | • | | The Deep South Zone has the potential to be a standalone expansion of the CHUG. |
| | |
Barrick Gold Corporation – Cortez Operations, Project 2471 Technical Report NI 43-101 – March 21, 2016 | | Page 25-2 |
| | |
| | www.rpacan.com |
MINERAL PROCESSING AND METALLURGICAL TESTING
| | • | | RPA is of the opinion that metallurgical test work completed for the Mine has been appropriate to establish optimal processing routes for the different mineralization styles encountered in the deposits and that the gold recovery calculations for all of the processing options are currently appropriate to estimate the amount of gold that will be recovered over the LOM. |
| | • | | The mill and heap leach operations at Cortez are well run, cost effective processing facilities for oxide ore. |
| | • | | There are no appropriate processes for single and double refractory ore at Cortez. Therefore, these ore types are shipped to Goldstrike for processing. Limits to the transportation rates imposed by environmental permits restrict the amount of ore that can be shipped to 1.2 Mstpa. If additional refractory ore is mined, it must be stockpiled. |
| | • | | TCM processing at Goldstrike is advanced technology that provides additional capacity for processing carbonaceous, preg-robbing ore without displacing material that is processed in the roaster. It also allows processing of ore with elevated concentrations of arsenic. The TCM technology uses calcium thiosulfate to leach the gold after pressure oxidation rather than cyanide and resin-in-pulp to recover the gold from the leach solution. |
ENVIRONMENTAL CONSIDERATIONS
| | • | | One of the risks to the Mine is the receipt of permit approvals from the various government agencies. |
| | • | | Cortez is diligent in managing its permitting and all environmental requirements for the property. |
| | • | | RPA is not aware of any environmental issues that could materially impact Barrick’s ability to extract the Mineral Resources or Mineral Reserves at this time. |
ECONOMIC ANALYSIS
| | • | | RPA has performed an economic analysis of the Cortez Operations using the estimates presented in this report and confirms that the outcome is a positive cash flow that supports the statement of Mineral Reserves. |
| | |
Barrick Gold Corporation – Cortez Operations, Project 2471 Technical Report NI 43-101 – March 21, 2016 | | Page 25-3 |
| | |
| | www.rpacan.com |
26 RECOMMENDATIONS
Based upon its work, RPA provides the following recommendations.
GEOLOGY AND MINERAL RESOURCES
| | • | | Continue to revise and update the Mineral Resource modelling procedures, with specific consideration to the potential additional mineralization trend in the Crossroads pit and the incorporation of an ordinary kriging run as an additional validation check at Cortez Hills. |
| | • | | Review the classification criteria, with consideration to variogram models based on single mineralization domains at Cortez Hills, and the inclusion of classification wireframe shells, particularly for the Measured component, or the incorporation of classification smoothing scripts. |
MINING AND MINERAL RESERVES
| | • | | Continue ore reconciliation tracking and attempt to identify and report the causes of any large changes on a monthly basis. |
| | • | | Present the reconciliation results showing the percentage differences and not the absolute differences. |
| | • | | Develop a set of orebody characteristics (width, height, grade, rock conditions) considered appropriate for long hole stoping and identify the quantity and location of those portions of the orebody amenable to long hole stoping. |
| | • | | Consider the Lower Zone rock bin capacity to ensure that a smooth ore feed from the mine can be maintained. |
| | • | | Review the small amounts of Inferred material within stope designs with a view to changing the classification of these small areas so that Inferred Mineral Resources are not included in the stope plans. |
| | • | | Modify the LOM and Mineral Reserve estimation process to include: |
| | • | | a reconciliation between the LOM plan and the Mineral Reserve estimate |
| | • | | a tabulation of the Mineral Resources converted by classification including the Inferred Mineral Resources |
| | • | | a review of those Inferred Mineral Resources within the LOM plan to determine whether any can or should be reclassified as Indicated Mineral Resources |
| | • | | the impact on the LOM plan of including the Inferred Mineral Resources within the plan at zero grade |
| | • | | Prepare detailed reconciliations and comparisons for any future conversions to new or different software packages to identify any issues in the process. |
| | • | | Continue the mine dewatering and careful highwall slope monitoring. |
| | |
Barrick Gold Corporation – Cortez Operations, Project 2471 Technical Report NI 43-101 – March 21, 2016 | | Page 26-1 |
| | |
| | www.rpacan.com |
| | • | | Re-evaluate the use of blast movement monitoring to improve grade control. |
| | • | | Develop detailed grade control accounting and stockpile management procedures. |
| | • | | Refine use of cross over grades, and standardize the Mineral Reserve reporting with the LOM production schedule. |
| | • | | Implement ore drive width increases to increase the productivity and/or production rate of the drift and fill mining. |
| | • | | Assess areas of the Lower Zone for the application of long hole stoping methods and implement trials if suitable areas can be identified. |
Continue to advance the planning of the Deep South Zone, which is included in the LOM plan, to optimize the production and development schedules in future years.
| | • | | Continue to evaluate the initiative to process mineralized waste concurrently with material from the underground resource. |
PROCESSING
| | • | | Continue to evaluate new ore types and to optimize the processes to increase recovery and/or to decrease costs. |
| | • | | Continue to work collaboratively with the Goldstrike staff to maintain and improve the metallurgical accounting for treatment of Cortez ore in the roaster and the TCM process. |
ENVIRONMENTAL
| | • | | Continue to expedite environmental permitting as required to support the changes in operations and development of new areas of the mine. |
COSTS
| | • | | Continue to evaluate and implement opportunities for cost savings and profitability improvements. |
| | |
Barrick Gold Corporation – Cortez Operations, Project 2471 Technical Report NI 43-101 – March 21, 2016 | | Page 26-2 |
| | |
| | www.rpacan.com |
27 REFERENCES
AuTec Innovative Extractive Solutions Ltd., 2015, Cortez – Deep South Project Update 3, May 12, 2015.
Barrick Gold Corporation, 2015, 2015 Year-End Report and Fourth Quarter Results, February 17, 2016
Barrick Gold Corporation, 2016, Press Release – Barrick Reports Project Study Results, February 22, 2016.
Barrick of North America and Stantec-Mining, 2014, Concerning: Cortez Hills Lower Zone Feasibility Study Revision 0, May 15, 2014.
Barrick of North America, 2014, Concerning: Cortez Hills Underground Mine Expansion below 3800 Level Scoping Study Revision 0, August 25, 2014.
Barrick Gold of North America and Minetech USA, LLC, 2015 Cortez Hills Deep South Prefeasibility Study, December 7, 2015.
Barrick Cortez, Inc., 2012, 2012 Amendment to Plan of Operations and Reclamation Permit Application (NVN-067575 (11-4A)), October 2012.
Barrick Cortez, Inc., 2014a, Barrick Cortez, Inc. Environmental Management System Practices Manual, November 2014.
Barrick Cortez, Inc., 2014b, Amendment 3 to Plan of Operations and Reclamation Permit Application (NVN-067575 (11-4A)), August 2014, Revised October 2014.
Barrick Cortez, Inc., 2015a, Ore Characterization Project Schedule, May 6, 2015.
Barrick Cortez, Inc., 2015b, Barrick Cortez – Deep South Expansion Project Initial Project Presentation/Pre-Plan of Operations Kick-Off Meeting, April 20, 2015.
Bureau of Land Management, 2008, Cortez Hills Expansion Project, Record of Decision and Plan of Operations Amendment Approval, NVN-067575, NV063-EIS06-011, November 2008.
Bureau of Land Management, 2011, Cortez Hills Expansion Project, Record of Decision and Plan of Operations Amendment Approval, NVN-067575, DOI-BLM-NV2010-0132-SEIS, November 2011.
Choi, Y., Baron, J.Y., Wang, Q., Langhans, J., Kondos, P., 2013, Thiosulfate Processing – From Lab Curiosity to Commercial Application, World Gold Conference, Brisbane, Australia, September 26–29, 2013.
Ring, G., 2015, Cortez Hills Lower Zone Deep South Dewatering Schedule, a memo from to D. King, November 3, 2015.
Goss, J., 2010, Gold Acres Window Geologic Modeling, prepared for Barrick Gold-Cortez by Rangefront Consulting, LLC (January 1, 2010).
| | |
Barrick Gold Corporation – Cortez Operations, Project 2471 Technical Report NI 43-101 – March 21, 2016 | | Page 27-1 |
| | |
| | www.rpacan.com |
MD Eng, 2015, MDEng Report #1111-R1505-01, Scoping Study Geotechnical Mine Design for Cortez Hills Deep South, May 25, 2015.
MD Eng, 2015, MDEng Report #1111-R1510-01, Prefeasibility Study Geotechnical Mine Design for Cortez Hills Deep South.
MD Eng, 2015, Cortez Deep South Prefeasibility Level Site Characterization, September 10, 2015.
MD Eng, 2015, Cortez Deep South Prefeasibility Level Stress Modelling, October 2, 2015.
Minetech USA, LLC, 2015, Cortez Deep South Underground Mining Report, December 7, 2015.
Olson, J., 2014a, Ore Characterization Meeting Minutes, June 26, 2014.
Olson, J., 2014b, Ore Characterization Meeting Minutes, July 31, 2014.
Olson, J., 2014c, Minutes from the Ore Characterization Meeting, August 28, 2014.
Olson, J., 2014d, Revision to Lech Ore Routing Guidelines, November 6, 2014.
Olson, J., 2014e, Ore Control Guidance Update Memo, November 24, 2014.
Olson, J., 2015, Ore Characterization Meeting Minutes, January 22, 2015.
Potvin, Y., 1988, Empirical Open Stope Design in Canada. Ph.D. Thesis. University of British Columbia, 343 p.
RPA, 2012, Technical Report on the Cortez Joint Venture Operations, Lander and Eureka Counties, State of Nevada, U.S.A., prepared for Barrick Gold Corporation, filed on SEDAR March 28, 2012.
SRK, 2011, Cortez Hills Underground Geotechnical Assessment for the Middle and Lower Zones”, August 2011.
| | |
Barrick Gold Corporation – Cortez Operations, Project 2471 Technical Report NI 43-101 – March 21, 2016 | | Page 27-2 |
| | |
| | www.rpacan.com |
28 DATE AND SIGNATURE PAGE
This report titled “Technical Report on the Cortez Operations, State of Nevada, U.S.A.” and dated March 21, 2016 was prepared and signed by the following authors:
| | | | |
| | | | (Signed and Sealed) “Kathleen Ann Altman” |
| | |
Dated at Toronto, ON | | | | |
March 21, 2016 | | | | Kathleen Ann Altman, Ph.D., P.E. |
| | | | Principal Metallurgist |
| | |
| | | | (Signed and Sealed) “R. Dennis Bergen” |
| | |
Dated at Toronto, ON | | | | |
March 21, 2016 | | | | R. Dennis Bergen, P.Eng. |
| | | | Principal Mining Engineer |
| | |
| | | | (Signed and Sealed) “Stuart E. Collins” |
| | |
Dated at Toronto, ON | | | | |
March 21, 2016 | | | | Stuart E. Collins, P.E. |
| | | | Principal Mining Engineer |
| | |
| | | | (Signed and Sealed) “Chester M. Moore” |
| | |
Dated at Toronto, ON | | | | |
March 21, 2016 | | | | Chester M. Moore, P.Eng. |
| | | | Principal Geologist |
| | |
| | | | (Signed and Sealed) “Wayne W. Valliant” |
| | |
Dated at Toronto, ON | | | | |
March 21, 2016 | | | | Wayne W. Valliant, P.Geo. |
| | | | Principal Geologist |
| | |
Barrick Gold Corporation – Cortez Operations, Project 2471 Technical Report NI 43-101 – March 21, 2016 | | Page 28-1 |
| | |
| | www.rpacan.com |
29 CERTIFICATE OF QUALIFIED PERSON
KATHLEEN ANN ALTMAN
I Kathleen Ann Altman, Ph.D., P.E., as an author of this report entitled “Technical Report on the Cortez Operations, State of Nevada, U.S.A.” prepared for Barrick Gold Corporation and dated March 21, 2016, do hereby certify that:
| 1. | I am Principal Metallurgist and Director, Mineral Processing and Metallurgy with RPA (USA) Ltd. of Suite 505, 143 Union Boulevard, Lakewood, Co., USA 80228. |
| 2. | I am a graduate of the Colorado School of Mines in 1980 with a B.S. in Metallurgical Engineering. I am a graduate of the University of Nevada, Reno Mackay School of Mines with an M.S. in Metallurgical Engineering in 1994 and a Ph.D. in Metallurgical Engineering in 1999. |
| 3. | I am registered as a Professional Engineer in the State of Colorado (Reg. #37556) and a Qualified Professional Member of the Mining and Metallurgical Society of America (Member #01321QP). I have worked as a metallurgical engineer for a total of 33 years since my graduation. My relevant experience for the purpose of the Technical Report is: |
| | • | | Review and report as a metallurgical consultant on numerous mining operations and projects around the world for due diligence and regulatory requirements. |
| | • | | I have worked for operating companies, including the Climax Molybdenum Company, Barrick Goldstrike, and FMC Gold in a series of positions of increasing responsibility. |
| | • | | I have worked as a consulting engineer on mining projects for approximately 15 years in roles such a process engineer, process manager, project engineer, area manager, study manager, and project manager. Projects have included scoping, pre-feasibility and feasibility studies, basic engineering, detailed engineering and start-up and commissioning of new projects. |
| | • | | I was the Newmont Professor for Extractive Mineral Process Engineering in the Mining Engineering Department of the Mackay School of Earth Sciences and Engineering at the University of Nevada, Reno from 2005 to 2009. |
| 4. | I have read the definition of “qualified person” set out in National Instrument 43-101 (NI 43-101) and certify that by reason of my education, affiliation with a professional association (as defined in NI 43-101) and past relevant work experience, I fulfill the requirements to be a “qualified person” for the purposes of NI 43-101. |
| 5. | I visited the Cortez Operations on May 5-7, 2015. |
| 6. | I am responsible for Sections 13, 17, and 20 and share responsibility with my co-author for Sections 1, 2, 3, 24, 25, and 27 of the Technical Report. |
| 7. | I am independent of the Issuer applying the test set out in Section 1.5 of NI 43-101. |
| 8. | I co-authored a previous report on the property entitled Technical Report on the Cortez Joint Venture Operations, Lander and Eureka Counties, State of Nevada, U.S.A. |
| 9. | I have read NI 43-101, and the Technical Report has been prepared in compliance with NI 43-101 and Form 43-101F1. |
| | |
Barrick Gold Corporation – Cortez Operations, Project 2471 Technical Report NI 43-101 – March 21, 2016 | | Page 29-1 |
| | |
| | www.rpacan.com |
| 10. | At the effective date of the Technical Report, to the best of my knowledge, information, and belief, the Technical Report contains all scientific and technical information that is required to be disclosed to make the Technical Report not misleading. |
Dated this 21st day of March, 2016
(Signed and Sealed) “Kathleen Ann Altman”
Kathleen Ann Altman, Ph.D., P.E.
| | |
Barrick Gold Corporation – Cortez Operations, Project 2471 Technical Report NI 43-101 – March 21, 2016 | | Page 29-2 |
| | |
| | www.rpacan.com |
R. DENNIS BERGEN
I, Raymond Dennis Bergen, P.Eng., as an author of this report entitled “Technical Report on the Cortez Operations, State of Nevada, U.S.A.” prepared for Barrick Gold Corporation and dated March 21, 2016, do hereby certify that:
| | 1. | I am an Associate Principal Mining Engineer with Roscoe Postle Associates Inc. of Suite 501, 55 University Ave. Toronto, ON, M5J 2H7. |
| | 2. | I am a graduate of the University of British Columbia, Vancouver, B.C., Canada, in 1979 with a Bachelor of Applied Science degree in Mineral Engineering. I am a graduate of the British Columbia Institute of Technology in Burnaby, B.C., Canada, in 1972 with a Diploma in Mining Technology. |
| | 3. | I am registered as a Professional Engineer in the Province of British Columbia (Reg. #16064) and as a Licensee with the Association of Professional Engineers, Geologists and Geophysicists of the Northwest Territories (Licence L1660). I have worked as an engineer for a total of 35 years since my graduation. My relevant experience for the purpose of the Technical Report is: |
| | • | | Practice as a mining engineer, production superintendent, mine manager, Vice President Operations and a consultant in the design, operation, and review of mining operations. |
| | • | | Review and report, as an employee and as a consultant, on numerous mining operations and projects around the world for due diligence and operational review related to project acquisition and technical report preparation. |
| | • | | Engineering and operating superintendent at the Con gold mine, a deep underground gold mine, Yellowknife, NWT, Canada |
| | • | | General Manager of the Ketza River Mine, Yukon, Canada |
| | • | | Vice President Operations in charge of the restart of the Golden Bear Mine, BC, Canada |
| | • | | General Manager in Charge of the Reopening of the Cantung Mine, NWT, Canada |
| | • | | Mine Manager at three different mines with open pit and underground operations. |
| | • | | Consulting engineer (RPA Associate Principal Mining Engineer) for over nine years working on project reviews, engineering studies, Mineral Reserve audits, technical report preparation, and other studies for a wide range of worldwide projects. |
| | 4. | I have read the definition of “qualified person” set out in National Instrument 43-101 (NI 43-101) and certify that by reason of my education, affiliation with a professional association (as defined in NI 43-101) and past relevant work experience, I fulfill the requirements to be a “qualified person” for the purposes of NI 43-101. |
| | 5. | I visited the Cortez Operations on May 5-7, 2015. |
| | 6. | I am responsible for the underground portions of Sections 15, 16, 18, 19, 21, and 22 and share responsibility with my co-authors for Sections 1, 2, 3, 24, 25, 26, and 27 of the Technical Report. |
| | 7. | I am independent of the Issuer applying the test set out in Section 1.5 of NI 43-101. |
| | 8. | I co-authored a previous report on the property entitled Technical Report on the Cortez Joint Venture Operations, Lander and Eureka Counties, State of Nevada, U.S.A. |
| | |
Barrick Gold Corporation – Cortez Operations, Project 2471 Technical Report NI 43-101 – March 21, 2016 | | Page 29-3 |
| | |
| | www.rpacan.com |
| | 9. | I have read NI 43-101, and the Technical Report has been prepared in compliance with NI 43-101 and Form 43-101F1. |
| | 10. | At the effective date of the Technical Report, to the best of my knowledge, information, and belief, the Technical Report contains all scientific and technical information that is required to be disclosed to make the Technical Report not misleading. |
Dated this 21st day of March, 2016
(Signed and Sealed) “R. Dennis Bergen”
Raymond Dennis Bergen, P.Eng.
| | |
Barrick Gold Corporation – Cortez Operations, Project 2471 Technical Report NI 43-101 – March 21, 2016 | | Page 29-4 |
| | |
| | www.rpacan.com |
STUART E. COLLINS
I, Stuart E. Collins, P.E., as an author of this report entitled “Technical Report on the Cortez Operations, State of Nevada, U.S.A.” prepared for Barrick Gold Corporation and dated March 21, 2016, do hereby certify that:
| 1. | I am Principal Mining Engineer with RPA (USA) Ltd. of 143 Union Boulevard, Suite 505, Lakewood, Colorado, USA 80228. |
| 2. | I am a graduate of South Dakota School of Mines and Technology, Rapid City, South Dakota, U.S.A., in 1985 with a B.S. degree in Mining Engineering. |
| 3. | I am a Registered Professional Engineer in the state of Colorado (#29455). I have been a member of the Society for Mining, Metallurgy, and Exploration (SME) since 1985, and a Registered Member (#612514) since September 2006. I have worked as a mining engineer for a total of 28 years since my graduation. My relevant experience for the purpose of the Technical Report is: |
| | • | | Review and report as a consultant on numerous exploration, development and production mining projects around the world for due diligence and regulatory requirements; |
| | • | | Mine engineering, mine management, mine operations and mine financial analyses, involving copper, gold, silver, nickel, cobalt, uranium, coal, and base metals located in the United States, Canada, Mexico, Turkey, Bolivia, Chile, Brazil, Costa Rica, Peru, Argentina, and Colombia. |
| | • | | Engineering Manager for a number of mining-related companies; |
| | • | | Business Development for a small, privately owned mining company in Colorado; |
| | • | | Operations supervisor at a large gold mine in Nevada, USA; |
| | • | | Involvement with the development and operation of a small underground gold mine in Arizona, USA. |
| 4. | I have read the definition of “qualified person” set out in National Instrument 43-101 (NI 43-101) and certify that by reason of my education, affiliation with a professional association (as defined in NI 43-101) and past relevant work experience, I fulfill the requirements to be a “qualified person” for the purposes of NI 43-101. |
| 5. | I visited the Cortez Operations on May 5-7, 2015. |
| 6. | I am responsible for the open pit portions of Sections 15, 16, 18, 19, 21, and 22 and responsibility with my co-author for Sections 1, 2, 3, 24, 25, 26, and 27 of the Technical Report. |
| 7. | I am independent of the Issuer applying the test set out in Section 1.5 of NI 43-101. |
| 8. | I have had no prior involvement with the property that is the subject of the Technical Report. |
| 9. | I have read NI 43-101, and the Technical Report has been prepared in compliance with NI 43-101 and Form 43-101F1. |
| | |
Barrick Gold Corporation – Cortez Operations, Project 2471 Technical Report NI 43-101 – March 21, 2016 | | Page 29-5 |
| | |
| | www.rpacan.com |
| 10. | At the effective date of the Technical Report, to the best of my knowledge, information, and belief, the Technical Report contains all scientific and technical information that is required to be disclosed to make the Technical Report not misleading. |
Dated this 21st day of March, 2016
(Signed and Sealed) “Stuart E. Collins”
Stuart E. Collins, P.E.
| | |
Barrick Gold Corporation – Cortez Operations, Project 2471 Technical Report NI 43-101 – March 21, 2016 | | Page 29-6 |
| | |
| | www.rpacan.com |
CHESTER M. MOORE
I, Chester M. Moore, P.Eng., as an author of this report entitled “Technical Report on the Cortez Operations, State of Nevada, U.S.A.” prepared for Barrick Gold Corporation and dated March 21, 2016, do hereby certify that:
| | 1. | I am Principal Geologist with Roscoe Postle Associates Inc. of Suite 501, 55 University Ave Toronto, ON, M5J 2H7. |
| | 2. | I am a graduate of the University of Toronto, Toronto, Ontario, Canada in 1972 with a Bachelor of Applied Science degree in Geological Engineering. |
| | 3. | I am registered as a Professional Engineer in the Province of Ontario (Reg. #32455016). I have worked as a geologist for over 40 years since my graduation. My relevant experience for the purpose of the Technical Report is: |
| | • | | Mineral Resource and Reserve estimation, feasibility studies, due diligence, corporate review and audit on exploration projects and mining operations world wide |
| | • | | Various advanced exploration and mine geology positions at base metal and gold mining operations in Ontario, Manitoba and Saskatchewan |
| | • | | Director, Mineral Reserve Estimation and Reporting at the corporate offices of a major Canadian base metal producer |
| | 4. | I have read the definition of “qualified person” set out in National Instrument 43-101 (NI 43-101) and certify that by reason of my education, affiliation with a professional association (as defined in NI 43-101) and past relevant work experience, I fulfill the requirements to be a “qualified person” for the purposes of NI 43-101. |
| | 5. | I visited the Cortez Operations on May 5-7, 2015. |
| | 6. | I am responsible for the underground portions of Sections 7 through 12 and 14 and share responsibility with my co-authors for Sections 1, 2, 3, 24, 25, 26, and 27 of the Technical Report. |
| | 7. | I am independent of the Issuer applying the test set out in Section 1.5 of NI 43-101. |
| | 8. | I have had no prior involvement with the property that is the subject of the Technical Report. |
| | 9. | I have read NI 43-101, and the Technical Report has been prepared in compliance with NI 43-101 and Form 43-101F1. |
| | 10. | At the effective date of the Technical Report, to the best of my knowledge, information, and belief, the Technical Report contains all scientific and technical information that is required to be disclosed to make the Technical Report not misleading. |
Dated this 21st day of March, 2016
(Signed and Sealed) “Chester M. Moore”
Chester M. Moore, P.Eng.
| | |
Barrick Gold Corporation – Cortez Operations, Project 2471 Technical Report NI 43-101 – March 21, 2016 | | Page 29-7 |
| | |
| | www.rpacan.com |
WAYNE W. VALLIANT
I, Wayne W. Valliant, P.Geo., as an author of this report entitled “Technical Report on the Cortez Operations, State of Nevada, U.S.A.” prepared for Barrick Gold Corporation and dated March 21, 2016, do hereby certify that:
| | 1. | I am Principal Geologist with Roscoe Postle Associates Inc. of Suite 501, 55 University Ave Toronto, ON, M5J 2H7. |
| | 2. | I am a graduate of Carleton University, Ottawa, Ontario, Canada in 1973 with a Bachelor of Science degree in Geology. |
| | 3. | I am registered as a Geologist in the Province of Ontario (Reg. #1175). I have worked as a geologist for a total of 40 years since my graduation. My relevant experience for the purpose of the Technical Report is: |
| | • | | Review and report as a consultant on more than fifty mining operations and projects around the world for due diligence and resource/reserve estimation |
| | • | | General Manager of Technical Services for corporation with operations and mine development projects in Canada and Latin America |
| | • | | Superintendent of Technical Services at three mines in Canada and Mexico |
| | • | | Chief Geologist at three Canadian mines, including two gold mines |
| | 4. | I have read the definition of “qualified person” set out in National Instrument 43-101 (NI 43-101) and certify that by reason of my education, affiliation with a professional association (as defined in NI 43-101) and past relevant work experience, I fulfill the requirements to be a “qualified person” for the purposes of NI 43-101. |
| | 5. | I visited the Cortez Operations on May 5-7, 2015. |
| | 6. | I am responsible for Sections 4, 5, 6, the open pit portions of Sections 7 through 12 and 14 and share responsibility with my co-authors for Sections 1, 2, 3, 24, 25, 26, and 27 of the Technical Report. |
| | 7. | I am independent of the Issuer applying the test set out in Section 1.5 of NI 43-101. |
| | 8. | I have had no prior involvement with the property that is the subject of the Technical Report. |
| | 9. | I have read NI 43-101, and the Technical Report has been prepared in compliance with NI 43-101 and Form 43-101F1. |
| | 10. | At the effective date of the Technical Report, to the best of my knowledge, information, and belief, the Technical Report contains all scientific and technical information that is required to be disclosed to make the Technical Report not misleading. |
Dated this 21st day of March, 2016
(Signed and Sealed) “Wayne W. Valliant”
Wayne W. Valliant, P. Geo.
| | |
Barrick Gold Corporation – Cortez Operations, Project 2471 Technical Report NI 43-101 – March 21, 2016 | | Page 29-8 |