
FIRST QUARTER REPORT 2016
All amounts expressed in US dollars
Barrick Reports First Quarter 2016 Results
| | • | | Barrick reported adjusted net earnings of $127 million ($0.11 per share)1, and a net loss of $83 million ($0.07 per share), in the first quarter. |
| | • | | The company generated $181 million in free cash flow1 in the first quarter, marking four consecutive quarters of positive free cash flow. First quarter EBITDA was $696 million1. |
| | • | | Gold production in the first quarter was 1.28 million ounces at all-in sustaining costs (AISC) of $706 per ounce1. |
| | • | | We reduced all-in sustaining costs by 24 percent and cash costs by 14 percent compared to the first quarter of 2015, reflecting the impact of ongoing operating and capital cost savings initiatives as well as lower fuel prices and foreign exchange gains. |
| | • | | All-in sustaining cost guidance for 2016 has been reduced to $760-$810 per ounce, down from our original guidance of $775-$825 per ounce. We continue to expect gold production of 5.0-5.5 million ounces for the year. |
| | • | | We have reduced total debt by $842 million year-to-date, and we remain on track to achieve our $2 billion debt reduction target for the year. |
| | • | | During the quarter, we established a Growth Group, comprised of Rob Krcmarov, Catherine Raw and Kevin Thomson, to develop and advance strategies that will grow free cash flow per share over the long-term. |
TORONTO, April 26, 2016 — Barrick Gold Corporation (NYSE:ABX)(TSX:ABX) (Barrick or the company) today reported adjusted net earnings of $127 million ($0.11 per share) for the first quarter, and a net loss of $83 million ($0.07 per share). The net loss for the quarter primarily reflects the impact of one-time foreign currency losses. First quarter free cash flow was $181 million and EBITDA was $696 million.
Production in the first quarter was 1.28 million ounces of gold at all-in sustaining costs of $706 per ounce. Cash costs were $553 per ounce1. We continue to expect full-year production of 5.0-5.5 million ounces of gold at lower all-in sustaining costs of $760-$810 per ounce.
Our operations performed well in the first quarter as we began to deliver on our 2016 priorities, including progress on lowering our free cash flow breakeven gold price to $1,000 per ounce, reducing total debt by $2 billion, implementing Best-in-Class to improve efficiency and productivity across all operations, and maintaining strict capital discipline.
STRATEGIC FRAMEWORK
After a year of renewal that laid the foundation to create long-term value for our owners, every action we take is focused on one overarching objective: growing free cash flow per share. We are doing this through the pursuit of three strategic goals. The first is a profound commitment to building partnerships of real depth and trust with host governments, local communities, NGOs, indigenous people, and others. The second goal is to produce the leading margins in the industry by operating in a way that is gold-price agnostic. Whatever the gold price, we are constantly pushing ourselves to reduce our costs by being first in productivity and efficiency. That means a continuous, relentless cycle of improvement and innovation, such that we should weather gold price volatility better than any other miner, while growing free cash flow per share over the long-term. The third goal is superior portfolio management. We measure our production in quality, not quantity. While we produce fewer ounces than we have in recent years, we are generating significantly more free cash flow per share. We will manage our portfolio to grow our cash margin over growing ounces, and we will assess existing and new opportunities, both internal and external, with that goal in mind.
RESTORING A STRONG BALANCE SHEET
Strengthening our balance sheet remains one of our top priorities. In 2016, we intend to reduce our total debt by at least $2 billion by drawing on our existing cash balance, delivering free cash flow from operations, selling additional non-core assets, and creating new joint ventures and partnerships.
So far this year, we have reduced our total debt by $842 million, representing 42 percent of our debt reduction target for the year. Since the start of 2015, we have reduced our total debt by $3.95 billion, or roughly 30 percent. This is expected to reduce our interest payments by approximately $180 million on an annualized basis.
The company’s liquidity position is strong and continues to improve, underpinned by stronger free cash flow generation across the business, and modest near-term debt repayment obligations. At the end of the first quarter, Barrick had a consolidated cash balance of approximately $2.3 billion2. The company has less than $200 million in debt due before 2018, and about $5 billion of our outstanding debt of $9.1 billion does not mature until after 20323.
In the medium term, we aim to reduce our debt to below $5 billion. Philosophically, our goal is to have no debt at all. We will continue to pursue debt reduction with discipline, taking only those actions that make sense for the business, on terms we consider favorable to our shareholders.
FINANCIAL DISCUSSION
Free cash flow for the first quarter was $181 million, marking four consecutive quarters of positive free cash flow after a prolonged period of negative free cash flow. This reflects our driving focus on maximizing free cash flow through greater capital discipline, improved operational efficiency, and stronger cost management.
The company generated $696 million of EBITDA in the first quarter compared to $793 million in the prior year period. First quarter adjusted net earnings were $127 million ($0.11 per share) compared to $62 million ($0.05 per share) in the prior year period. Higher adjusted net earnings
| | | | |
| BARRICK FIRST QUARTER 2016 | | 2 | | PRESS RELEASE |
compared to the prior-year period were driven by lower cash costs, higher sales volumes (excluding the impact of divested sites) as well as lower exploration and evaluation costs, in part reflecting lower spending at Pascua-Lama. The net loss for the quarter was $83 million ($0.07 per share) compared to net earnings of $57 million ($0.05 per share) in the prior year period. Lower net earnings primarily reflect the impact of lower production as a result of asset sales completed in the second half of 2015 and the first quarter of 2016, combined with lower realized prices.
Significant adjusting items (net of tax and non-controlling interest effects) in first quarter 2016 include:
| | • | | $119 million in foreign currency translation losses, including deferred currency translation losses released as a result of the disposal and reorganization of certain Australian entities, and unrealized foreign currency translation losses primarily related to the devaluation of the Argentine Peso on VAT receivables; |
| | • | | $26 million in losses on the extinguishment of debt; and |
| | • | | $17 million adjustment reflecting the impact of a decrease in the discount rate used to calculate the provision for environment remediation at our closed mines. |
Despite lower gold prices, operating cash flow was $451 million compared to $316 million in the prior year period, reflecting the impact of lower energy and fuel prices, as well as the impact of reduced labor and contracting costs, and other operational efficiencies driven by Best-in-Class.
OPERATING HIGHLIGHTS
Our over-arching objective as a business is to grow our free cash flow per share in any foreseeable gold price environment. In support of this objective, we intend to achieve and maintain industry-leading margins by improving the productivity and efficiency of our operations. This means a continuous, relentless cycle of improvement and innovation underpinned by our recently launched Best-in-Class program. Our aspiration is to achieve all-in sustaining costs below $700 per ounce by 2019.
We are making progress. In the first quarter of 2016, Barrick produced 1.28 million ounces of gold at all-in sustaining costs of $706 per ounce, compared to 1.39 million ounces at all-in sustaining costs of $927 per ounce in the prior year period. When excluding in the impact of divested mines, gold production for the quarter actually increased, driven by higher production at Cortez, Goldstrike, and Pueblo Viejo.
Cash costs were $553 per ounce in the first quarter of 2016, compared to $642 per ounce in the first quarter of 2015. This represents a 24 percent reduction in all-in sustaining costs, and a 14 percent reduction in cash costs, compared to first quarter of 2015. These savings were driven by the impact of ongoing cost savings initiatives, including lower sustaining capital spending, and lower operating costs. First quarter costs also benefited from lower fuel prices and foreign exchange gains, primarily associated with the devaluation of the Argentine peso.
We continue to expect full-year gold production of 5.0-5.5 million ounces. We have reduced our all-in sustaining cost guidance for 2016 to $760-$810 per ounce, down from our original guidance of
| | | | |
| BARRICK FIRST QUARTER 2016 | | 3 | | PRESS RELEASE |
$775-$825 per ounce, reflecting the impact of lower fuel costs, favorable foreign exchange rates, and early Best-in-Class productivity and efficiency initiatives. We have also lowered the top end of our capital expenditure guidance, now expected to be $1.35-$1.55 billion, adjusted from our original guidance of $1.35-$1.65 billion.
As we continue to embed Best-in-Class across the portfolio, we expect to identify additional savings opportunities over the course of the year.
| | | | | | | | | | |
| | | First Quarter | | | Current | | | Original |
| Gold | | 2016 | | | 2016 Guidance | | | 2016 Guidance |
| | | |
Production (000s of ounces)4 | | | 1,280 | | | | 5,000-5,500 | | | 5,000-5,500 |
AISC ($ per ounce) | | | 706 | | | | 760-810 | | | 775-825 |
Cash costs ($ per ounce) | | | 553 | | | | 540-580 | | | 550-590 |
| | | |
Copper | | | | | | | | | | |
Production (millions of pounds)4 | | | 111 | | | | 370-410 | | | 370-410 |
AISC ($ per pound) | | | 1.97 | | | | 1.95-2.25 | | | 2.05-2.35 |
C1 cash costs ($ per pound)1 | | | 1.47 | | | | 1.35-1.65 | | | 1.45-1.75 |
| | | | | | | | | | | |
Total Capital Expenditures ($ millions)5 | | | 215 | | | | 1,350-1,550 | | | 1,350-1,650 |
Cortez
The Cortez mine produced 247,000 ounces of gold in the first quarter at lower all-in sustaining costs of $469 per ounce. Lower costs primarily reflect the impact of higher sales volumes, combined with lower cash costs and lower sustaining capital spend, in part driven by progress on Best-in-Class initiatives. We continue to anticipate 2016 production of 900,000-1,000,000 ounces of gold. All-in sustaining cost guidance for the year has been reduced to $580-$640 per ounce, down from $640-$710 per ounce.
Priority Best-in-Class initiatives in execution at Cortez for 2016 are focused on reducing open pit mining costs by improving the productivity and efficiency of open pit operations. This includes optimizing haul truck loading, and increasing haul truck availability, by compressing preventive maintenance downtime, improving handover times, and reducing unplanned maintenance. The mine is also targeting a reduction in long-duration shovel maintenance times to further improve open pit mining productivity.
Following the completion of prefeasibility studies in late 2015, we have moved two significant growth projects in the Cortez district to the feasibility study phase. This includes a feasibility study for expanded underground mining in the Deep South zone, below currently permitted areas of the Cortez Hills underground mine6. The project has the potential to contribute average underground production of more than 300,000 ounces per year between 2023 and 2027, at average all-in sustaining costs of approximately $580 per ounce. Initial capital costs for Deep South are estimated to be $153 million. Barrick is also advancing a feasibility study for an underground mine at the company’s Goldrush deposit, located six kilometers from the Cortez Hills mine. The prefeasibility
| | | | |
| BARRICK FIRST QUARTER 2016 | | 4 | | PRESS RELEASE |
study contemplates a mine life of 21 years, with average annual production of 440,000 ounces of gold in the first full five years of operation, at all-in sustaining costs of $665 per ounce. Initial capital costs are estimated to be approximately $1 billion.
On March 28, 2016, Barrick filed an updated National Instrument 43-101 Technical Report for the Cortez property. The capital expenditure estimates included in the report were based on the life of mine plan in place at Cortez in support of our year-end 2015 mineral reserve statement. Following subsequent optimization work, we have made improvements to the Cortez mine plan that resulted in the deferral of certain capital expenditures. This optimized plan is reflected in the capital expenditure guidance provided by the company on February 17, 2016, for the years 2016, 2017, and 2018.
Goldstrike
The Goldstrike mine contributed 249,000 ounces in the first quarter at all-in sustaining costs of $709 per ounce. Lower all-in sustaining costs primarily reflect lower sustaining capital spend in the quarter. Optimization of contract labor also helped to reduce underground mining costs by $22 per ounce compared to the prior-year period. We continue to expect 2016 gold production of 975,000-1,075,000 ounces at all-in sustaining costs of $780-$850 per ounce.
Major Best-in-Class initiatives in execution include increasing tonnes mined from the underground through improvements to dispatch systems, and better paste fill utilization. Goldstrike is also targeting an increase in overall equipment availability at the thiosulfate leaching plant through maintenance and reliability improvements.
Pueblo Viejo (60 percent)
Barrick’s 60 percent share of production from Pueblo Viejo for the first quarter was 172,000 ounces at all-in sustaining costs of $496 per ounce. Lower all-in sustaining costs were driven by lower cash costs, reflecting lower maintenance, contractor, and energy costs, and a reduction in sustaining capital expenditures. We continue to expect attributable production of 600,000-650,000 ounces of gold in 2016. All-in sustaining cost guidance for the year has been reduced to $550-$590 per ounce, down from $570-$620 per ounce.
Best-in-Class priorities include a project to increase revenue by selling excess power generated by Pueblo Viejo’s Quisqueya power plant to the national energy grid. The mine is also pursuing an opportunity to increase gold recoveries through adjustments to fresh water and reclaimed water use upstream and downstream from the autoclaves.
Lagunas Norte
The Lagunas Norte mine contributed 100,000 ounces at all-in sustaining costs of $551 per ounce in the first quarter. Higher all-in sustaining costs compared to the prior year period primarily reflect the impact of lower production and lower grades as the operation nears the end of its existing mine life, in addition to higher capital expenditures, driven by higher capitalized stripping costs. Production in 2016 is expected to be 410,000–450,000 ounces at all-in sustaining costs of $570-$640 per ounce.
Priority Best-in-Class initiatives in execution include efforts to increase production by improving the efficiency of the carbon-in-column circuit through incremental reductions in the residual amount
| | | | |
| BARRICK FIRST QUARTER 2016 | | 5 | | PRESS RELEASE |
of gold in barren solution returning to the leach pad. In addition, the mine has reduced operating costs through an initiative to renegotiate major contracts. This year, Lagunas Norte will also focus on improving equipment availability and lowering maintenance costs by reducing costs of replacement components, extending the life of components, and reducing unplanned maintenance activities.
We are now advancing a two-phase feasibility study on a plan to extend the life of Lagunas Norte by approximately nine years by mining the refractory material below the oxide ore body in the current open pit6. This requires the installation of a grinding-flotation-autoclave and carbon-in-leach processing circuit to treat the refractory material. The prefeasibility study, completed in late 2015, contemplates average annual production of 240,000 ounces of gold in the first five years at all-in sustaining costs of $625 per ounce. Initial capital costs are estimated to be approximately $640 million.
Veladero
The Veladero mine produced 132,000 ounces of gold in the first quarter at all-in sustaining costs of $675 per ounce. Lower all-in sustaining costs reflect a decrease in sustaining capital expenditures combined with lower cash costs, driven by cost savings initiatives and the impact of local currency devaluation, including lower labor, maintenance, and diesel costs. Production guidance for 2016 is unchanged at 630,000-690,000 ounces of gold. All-in sustaining cost guidance for the year has been reduced to $790-$860 per ounce, down from $830-$900 per ounce.
Best-in-Class initiatives in execution for 2016 include more efficient contractor demand management, improvements in mine productivity through more efficient drilling, loading and hauling, completing more maintenance tasks in-house, and improved planning and load sharing of auxiliary equipment.
The mine is also focused on improving its long-term business plan through optimizing crushing and conveying activities, selective high wall steepening to reduce costs, more efficient leach pad construction, maintenance cost reductions, and savings in supply chain.
Turquoise Ridge (75 percent)
The Turquoise Ridge mine contributed 50,000 ounces of gold to Barrick in the first quarter at all-in sustaining costs of $728 per ounce. We continue to expect production of 200,000-220,000 ounces in 2016 at all-in sustaining costs of $770-$850 per ounce.
Best-in-Class initiatives in execution at Turquoise Ridge include the implementation of an operator competency and training management system designed to drive greater consistency of production rates, and sustainable increases in production over time. The mine is also implementing a project to improve the efficiency and effectiveness of ground support rehabilitation activities, while maintaining a focus on safety. In addition, Turquoise Ridge is targeting maintenance improvements for mining equipment to improve availability and utilization.
We have completed a feasibility study for the development of a third shaft at Turquoise Ridge, which has the potential to increase output to an average of 500,000 ounces per year (100 percent basis) at all-in sustaining costs of $625-$675 per ounce. The project would require
| | | | |
| BARRICK FIRST QUARTER 2016 | | 6 | | PRESS RELEASE |
initial capital expenditures of approximately $300-$325 million (100 percent basis) for additional underground development and shaft construction. Given the positive impact of early Best-in-Class efforts, we have determined the optimal path forward is to defer the construction of an additional shaft in favor of a three-phase approach for the development of Turquoise Ridge. The first phase, underway now, contemplates additional improvements to sustain a throughput rate of 1,825 tonnes per day at the lowest possible cost. In support of this goal, we are pursuing greater productivity through continuous mining, additional ventilation modifications, and other alternative mining methods. The second phase contemplates the installation of a new ventilation shaft. Adding a ventilation shaft would allow Turquoise Ridge to maintain throughput of 1,825 tonnes per day as mining moves deeper and further away from the existing shaft and ventilation infrastructure. The third phase, representing full implementation of the feasibility study, contemplates the conversion of the ventilation shaft into a full production shaft. Additional processing capacity would be required for production rates above 1,850 tonnes per day.
Other Mines
Barrick’s other mines—consisting of Golden Sunlight, Hemlo, KCGM, and Porgera—contributed 208,000 ounces at all-in sustaining costs of $764 per ounce in the first quarter.
Acacia Mining (63.9 percent)
Barrick’s share of first quarter production was 122,000 ounces of gold at all-in sustaining costs of $959 per ounce. We continue to expect our share of 2016 production from Acacia to be 480,000-500,000 ounces at all-in sustaining costs of approximately $950-$980 per ounce.
Copper
Copper production in the first quarter was 111 million pounds at all-in sustaining costs of $1.97 per pound. For 2016, we continue to anticipate copper production of 370-410 million pounds. Reflecting the impact of successful Best-in-Class cost reduction initiatives at Lumwana, we have lowered our copper all-in sustaining cost guidance to $1.95-$2.25 per pound, down from our original range of $2.05-$2.35 per pound.
In April 2016, the Zambian government introduced legislation that would replace the current nine percent royalty on mining operations with a sliding scale royalty rate, ranging from four percent at copper prices below $2.04 per pound, five percent at copper prices between $2.04 and $2.72 per pound, and six percent at a copper price of $2.72 per pound and above. Legislation has also been introduced to remove the 15 percent variable profit tax on income from mining companies. We expect these changes to be enacted in the second quarter of 2016, with an effective date of April 1, 2016.
The Jabal Sayid project, a 50-50 joint venture with Saudi Arabian Mining Company (Ma’aden), is expected to achieve commercial production in the second quarter of 2016, ramping up to a production rate of about 100 million pounds per year in the second half of 2017, as additional underground development is completed.
| | | | |
| BARRICK FIRST QUARTER 2016 | | 7 | | PRESS RELEASE |
CREATION OF GROWTH GROUP
Our overarching objective is to grow our free cash flow per share. Planning for and managing this future growth is critical. Achieving it relies on many groups working together, including Mine Exploration, Global Exploration, Business Development, our Reserves and Resources team, and Finance. It also requires close collaboration with our General Managers and Executive Directors. To support this effort, we have created a new Growth Group at the most senior levels of the company. The Group is comprised of: Rob Krcmarov, Executive Vice President, Exploration and Growth; Catherine Raw, Executive Vice President and Chief Financial Officer; and Kevin Thomson, Senior Executive Vice President, Strategic Matters.
The Growth Group will evaluate strategies to optimize the development of our existing reserves and resources, while adding new resources through exploration. It will also play a central role in assessing external acquisitions and earn-in opportunities, all with the objective of growing free cash flow per share over the long term. The Group will serve as a central clearing house to ensure strategic alignment and appropriate coordination of all major growth initiatives across the company.
EXPLORATION PARTNERSHIP
During the first quarter, Barrick formed a new exploration partnership with Alicanto Minerals Ltd. at the Arakaka gold project in Guyana. The Arakaka project is located in a relatively underexplored area of the highly prospective Guiana Shield. The project has a strike length of 12 kilometers, of which less than five percent has been drill tested. As part of the agreement, Barrick has the option to earn a 65 percent interest in the project after meeting $10 million in funding requirements, including $8 million in exploration expenditures over four years, and $2 million paid to Alicanto upon completion of the exploration earn-in expenditures. Initial drill testing under this agreement is scheduled to commence in the second quarter.
| | | | |
| BARRICK FIRST QUARTER 2016 | | 8 | | PRESS RELEASE |
APPENDIX 1 —Updated 2016 Operating and Capital Expenditure Guidance
GOLD PRODUCTION AND COSTS
| | | | | | |
| | | Production
(millions of ounces) | | AISC7
($ per ounce) | | Cash Costs7
($ per ounce) |
Cortez | | 0.900-1.000 | | 580-640 | | 430-470 |
Goldstrike | | 0.975-1.075 | | 780-850 | | 560-610 |
Pueblo Viejo (60%) | | 0.600-0.650 | | 550-590 | | 420-450 |
Lagunas Norte | | 0.410-0.450 | | 570-640 | | 380-420 |
Veladero | | 0.630-0.690 | | 790-860 | | 520-570 |
Sub-total | | 3.500-3.900 | | 660-730 | | 470-520 |
Porgera (47.5%) | | 0.230-0.260 | | 990-1,080 | | 700-750 |
Acacia (63.9%) | | 0.480-0.500 | | 950-980 | | 670-700 |
KCGM (50%) | | 0.350-0.365 | | 670-700 | | 610-630 |
Hemlo | | 0.200-0.220 | | 790-870 | | 600-660 |
Turquoise Ridge (75%) | | 0.200-0.220 | | 770-850 | | 560-620 |
Golden Sunlight | | 0.030-0.045 | | 1,000-1,050 | | 920-990 |
Total Gold | | 5.000-5.5008 | | 760-810 | | 540-580 |
| | |
COPPER PRODUCTION AND COSTS | | | | |
| | | Production
(millions of pounds) | | AISC ($ per pound) | | C1 cash costs ($ per pound) |
Zaldívar (50%) | | 100-120 | | 2.20-2.40 | | 1.70-1.90 |
Lumwana | | 270-290 | | 1.80-2.10 | | 1.20-1.50 |
Total Copper | | 370-410 | | 1.95-2.25 | | 1.35-1.65 |
| | | |
CAPITAL EXPENDITURES | | | | | | |
| | | ($ millions) | | | | |
Mine site sustaining | | 1,200-1,350 | | | | |
Project9 | | 150-200 | | | | |
Total | | 1,350-1,550 | | | | |
| | | | |
| BARRICK FIRST QUARTER 2016 | | 9 | | PRESS RELEASE |
APPENDIX 2 —2016 Outlook Assumptions and Economic Sensitivity Analysis
| | | | | | | | | | |
| | | 2016 Guidance
Assumption | | Hypothetical
Change | | Impact on
AISC | | Impact on
EBITDA (millions) | | |
Gold revenue, net of royalties | | $1,200/oz | | +/- $100/oz | | n/a | | $410 | | |
Copper revenue, net of royalties | | $2.15/lb | | +/- $0.50/lb | | n/a | | $92 | | |
Gold all-in sustaining costs | | | | | | | | | | |
Gold royalties & production taxes | | $1,200/oz | | $100/oz | | ($3)/oz | | $12 | | |
WTI crude oil price10,11 | | $34/bbl | | $10/bbl | | ($2)/oz | | $7 | | |
Australian dollar exchange rate10 | | 0.73 : 1 | | +10% | | $4/oz | | ($17) | | |
Australian dollar exchange rate10 | | 0.73 : 1 | | -10% | | ($4)/oz | | $17 | | |
Canadian dollar exchange rate | | 1.35 : 1 | | +10% | | ($5)/oz | | $21 | | |
Canadian dollar exchange rate | | 1.35 : 1 | | -10% | | $6/oz | | ($26) | | |
Copper all-in sustaining costs | | | | | | | | | | |
WTI crude oil price10,11 | | $34/bbl | | $10/bbl | | ($0.02)/lb | | $4 | | |
Chilean peso exchange rate | | 691 : 1 | | +10% | | ($0.03)/lb | | $6 | | |
Chilean peso exchange rate | | 691 : 1 | | -10% | | $0.04/lb | | ($7) | | |
ENDNOTES
| 1 | Adjusted net earnings, free cash flow, EBITDA, all-in sustaining costs per ounce/pound, cash costs per ounce, and C1 cash costs per pound, are non-GAAP financial performance measures with no standardized definition under IFRS. For further information and detailed reconciliations, please see pages 35-40 of Barrick’s First Quarter 2016 Report. |
| 2 | Total includes $534 million held at Acacia and Pueblo Viejo, which may not be readily deployed outside of Acacia and/or Pueblo Viejo. |
| 3 | Amount excludes capital leases and includes project financing payments at Pueblo Viejo (60 percent basis) and Acacia (100 percent basis). |
| 5 | Barrick’s share on a 100 percent accrued basis. |
| 6 | Scientific and technical information relating to the Cortez expanded underground mining project and the Lagunas Norte refractory ore mine life extension project contained in this press release has, in each case, been reviewed and approved by Rick Sims, Registered Member SME, Senior Director, Resources and Reserves of Barrick; Steven Haggarty, P.Eng., Senior Director, Metallurgy of Barrick; and Patrick Garretson, Registered Member SME, Senior Director, Life of Mine Planning of Barrick. Each of Messrs. Sims, Haggarty and Garretson is a “Qualified Person” as defined in National Instrument 43-101 - Standards of Disclosure for Mineral Projects. For further information with respect to the key assumptions, parameters and risks associated with these projects, and other related technical information, please refer to the updated National Instrument 43-101 technical reports filed on SEDAR (www.sedar.com) and EDGAR (www.sec.gov) on March 28, 2016, for each of Barrick’s Cortez and Lagunas Norte mines. |
| 7 | Total gold cash costs and all-in sustaining costs per ounce exclude the impact of hedges and/or costs allocated to non-operating sites. |
| 8 | Operating unit guidance ranges reflect expectations at each individual operating unit, but do not add up to corporate-wide guidance range total. |
| 9 | We have combined our previous capital expenditure categories of Minesite expansion and Projects into one category called Project. |
| 10 | Due to our hedging activities, which are reflected in these sensitivities, we are partially protected against changes in these factors. |
| 11 | Impact on EBITDA only reflects contracts that mature in 2016. |
| | | | |
| BARRICK FIRST QUARTER 2016 | | 10 | | PRESS RELEASE |
Key Statistics
| | | | | | | | |
| Barrick Gold Corporation | | | | | | |
| (in United States dollars) | | Three months ended March 31, | |
| | | | |
| | | 2016 | | | 2015 | |
| |
Operating Results | | | | | | | | |
Gold production (thousands of ounces)1 | | | 1,280 | | | | 1,390 | |
Gold sold (thousands of ounces)1 | | | 1,306 | | | | 1,385 | |
Per ounce data | | | | | | | | |
Average spot gold price | | $ | 1,183 | | | $ | 1,218 | |
Average realized gold price2 | | | 1,181 | | | | 1,219 | |
Cash costs2 | | | 553 | | | | 642 | |
All-in sustaining costs2 | | | 706 | | | | 927 | |
All-in costs2 | | | 758 | | | | 1,024 | |
Cash costs (on a co-product basis)2 | | | 577 | | | | 671 | |
All-in sustaining costs (on a co-product basis)2 | | | 730 | | | | 956 | |
All-in costs (on a co-product basis)2 | | | 782 | | | | 1,053 | |
| | |
Copper production (millions of pounds)3 | | | 111 | | | | 118 | |
Copper sold (millions of pounds) | | | 103 | | | | 121 | |
| | |
Per pound data | | | | | | | | |
Average spot copper price | | $ | 2.12 | | | $ | 2.64 | |
Average realized copper price2 | | | 2.18 | | | | 2.55 | |
C1 cash costs2 | | | 1.47 | | | | 1.84 | |
All-in sustaining costs2 | | | 1.97 | | | | 2.40 | |
| |
Financial Results (millions) | | | | | | | | |
Revenues | | $ | 1,930 | | | $ | 2,245 | |
Net Income (loss)4 | | | (83 | ) | | | 57 | |
Adjusted net earnings2 | | | 127 | | | | 62 | |
Adjusted EBITDA2 | | | 697 | | | | 798 | |
Total project capital expenditures5 | | | 40 | | | | 103 | |
Total capital expenditures - sustaining5 | | | 175 | | | | 353 | |
Operating cash flow | | | 451 | | | | 316 | |
Free cash flow2 | | | 181 | | | | (198 | ) |
Per Share Data (dollars) | | | | | | | | |
Net income (loss) (basic and diluted) | | | (0.07 | ) | | | 0.05 | |
Adjusted net earnings (basic)2 | | | 0.11 | | | | 0.05 | |
Weighted average basic and diluted common shares (millions) | | | 1,165 | | | | 1,165 | |
| |
| | |
| | | As at March 31, | | | As at December 31, | |
| | | | | | | | |
| | | 2016 | | | 2015 | |
| |
Financial Position (millions) | | | | | | | | |
Cash and equivalents | | $ | 2,323 | | | $ | 2,455 | |
Working capital (excluding cash) | | | 1,201 | | | | 1,310 | |
| |
| 1 | Production includes Acacia on a 63.9% basis and Pueblo Viejo on a 60% basis, both of which reflect our equity share of production. Also includes production from Bald Mountain and Round Mountain up to January 11, 2016, the effective date of sale of the assets. 2015 includes production from Porgera on a 95% basis whereas 2016 figures are on a 47.5% basis reflecting the sale of 50% of Porgera in third quarter 2015. Sales include our equity share of gold sales from Acacia and Pueblo Viejo. |
| 2 | Realized price, cash costs, all-in sustaining costs, all-in costs, cash costs (on a co-product basis), all-in sustaining costs (on a co-product basis), all-in costs (on a co-product basis), C1 cash costs, adjusted net earnings, adjusted EBITDA and free cash flow are non-GAAP financial performance measures with standard definition under IFRS. Refer to the Non-GAAP Financial Performance Measures section on pages 35 - 40 of the Company’s MD&A. |
| 3 | Reflects production from Jabal Sayid and Zaldívar on a 50% basis, which reflects our equity share of production. 2015 production includes Zaldívar on a 100% basis prior to the sale of 50% of the mine in fourth quarter 2015. |
| 4 | Net Income (loss) represents net income attributable to the equity holders of the Company. |
| 5 | Amounts presented on a 100% accrued basis. Project capital expenditures are included in our calculation of all-in costs, but not included in our calculation of all-in sustaining costs. |
| | | | |
| BARRICK FIRST QUARTER 2016 | | 11 | | SUMMARY INFORMATION |
Production and Cost Summary
| | | | | | | | | | | | | | | | |
| | | Gold Production (attributable ounces) (000s) | | | All-in sustaining costs5 ($/oz) | |
| | | | |
| | | Three months ended | | | | | | Three months ended | |
| | | | | | March 31, | | | | | | March 31, | |
| | | | | | | | |
| | | 2016 | | | 2015 | | | 2016 | | | 2015 | |
| | | | | |
Gold | | | | | | | | | | | | | | | | |
Goldstrike | | | 249 | | | | 207 | | | $ | 709 | | | $ | 876 | |
Cortez | | | 247 | | | | 133 | | | | 469 | | | | 962 | |
Pueblo Viejo1 | | | 172 | | | | 135 | | | | 496 | | | | 675 | |
Lagunas Norte | | | 100 | | | | 178 | | | | 551 | | | | 461 | |
Veladero | | | 132 | | | | 149 | | | | 675 | | | | 991 | |
Turquoise Ridge | | | 50 | | | | 49 | | | | 728 | | | | 709 | |
Acacia2 | | | 122 | | | | 116 | | | | 959 | | | | 1,117 | |
Other Mines - Gold3 | | | 208 | | | | 423 | | | | 764 | | | | 1,009 | |
| |
Total | | | 1,280 | | | | 1,390 | | | $ | 706 | | | $ | 927 | |
| |
| | |
| | | Copper Production (attributable pounds)4 (millions) | | | C1 Cash Costs5($/lb) | |
| | | | |
| | | Three months ended | | | | | | Three months ended | |
| | | | | | March 31, | | | | | | March 31, | |
| | | | | | | | |
| | | 2016 | | | 2015 | | | 2016 | | | 2015 | |
| |
Total | | | 111 | | | | 118 | | | $ | 1.47 | | | $ | 1.84 | |
| |
| | |
| | | | | | Total Gold Production Costs ($/oz) | |
| | | | | | | | | | | | |
| | | | | | | | | | | | Three months ended | |
| | | | | | | | | | | | March 31, | |
| | | | | | | | | | | | |
| | | | | | | | | 2016 | | | 2015 | |
| |
Direct mining costs before impact of hedges at market foreign exchange rates | | | $ | 526 | | | $ | 623 | |
Losses realized on currency hedge and commodity hedge/economic hedge contracts | | | | 23 | | | | 13 | |
By-product credits | | | | | | | | | | | (24 | ) | | | (29 | ) |
Royalties | | | | | | | | | | | 28 | | | | 35 | |
| |
Cash costs5 | | | | | | | | | | | 553 | | | | 642 | |
Depreciation | | | | | | | | | | | 252 | | | | 237 | |
| |
Total production costs | | | | | | | | | | $ | 805 | | | $ | 879 | |
| |
Cash costs5 | | | | | | | | | | $ | 553 | | | $ | 642 | |
General & administrative costs | | | | 37 | | | | 40 | |
Rehabilitation - accretion and amortization (operating sites) | | | | 7 | | | | 25 | |
Mine on-site exploration and evaluation costs | | | | 4 | | | | 4 | |
Mine development expenditures | | | | 57 | | | | 120 | |
Sustaining capital expenditures | | | | 48 | | | | 96 | |
| |
All-in sustaining costs5 | | | | | | | | | | $ | 706 | | | $ | 927 | |
| |
All-in costs5 | | | | | | | | | | $ | 758 | | | $ | 1,024 | |
| |
| | |
| | | | | | Total Copper Production Costs ($/lb) | |
| | | | | | | | | | | | |
| | | | | | | | | | | | Three months ended | |
| | | | | | | | | | | | March 31, | |
| | | | | | | | | | | | |
| | | | | | | | | 2016 | | | 2015 | |
| |
C1 cash costs5 | | | | | | | | | | $ | 1.47 | | | $ | 1.84 | |
General & administrative costs | | | | 0.06 | | | | 0.05 | |
Royalties and inventory impairments | | | | 0.14 | | | | 0.28 | |
Rehabilitation - accretion and amortization (operating sites) | | | | 0.01 | | | | 0.01 | |
Mine development expenditures | | | | 0.24 | | | | 0.16 | |
Sustaining capital expenditures | | | | 0.05 | | | | 0.06 | |
| |
All-in sustaining costs5 | | | | | | | | | | $ | 1.97 | | | $ | 2.40 | |
| |
| 1 | Reflects production from Pueblo Viejo on a 60% basis, which reflects our equity share of production. |
| 2 | Reflects production from Acacia on a 63.9% basis, which reflects our equity share of production. |
| 3 | In 2016, Other Mines - Gold includes Golden Sunlight, Hemlo, Cowal, Ruby Hill, Porgera on a 47.5% basis and Kalgoorlie. Also includes production from Bald Mountain and Round Mountain up to January 11, 2016, the effective date of sale of these assets. In 2015, Other Mines - Gold included Bald Mountain, Round Mountain, Golden Sunlight, Hemlo, Pierina, Cowal, Ruby Hill, Plutonic up to January 31, Kanowna up to March 1, Marigold, Porgera on a 95% basis, and Kalgoorlie. |
| 4 | In 2016, reflects production from Jabal Sayid on a 50% basis and from Zald ívar on a 50% basis, which reflects our equity share. In 2015, reflects production from Zaldívar on a 100% basis. |
| 5 | Cash costs, all-in sustaining costs, all-in costs and C1 cash costs are non-GAAP financial performance measures with no standard meaning under IFRS. Refer to the Non-GAAP Financial Performance Measures section on pages 35 - 40 of the Company’s MD&A. |
| | | | |
| BARRICK FIRST QUARTER 2016 | | 12 | | SUMMARY INFORMATION |
MANAGEMENT’S DISCUSSION AND ANALYSIS (“MD&A”)
This portion of the Quarterly Report provides management’s discussion and analysis (“MD&A”) of the financial condition and results of operations to enable a reader to assess material changes in financial condition and results of operations as at and for the three month period ended March 31, 2016, in comparison to the corresponding prior–year periods. The MD&A is intended to help the reader understand Barrick Gold Corporation (“Barrick”, “we”, “our” or the “Company”), our operations, financial performance and present and future business environment. This MD&A, which has been prepared as of April 26, 2016, is intended to supplement and complement the condensed unaudited interim consolidated financial statements and notes thereto, prepared in accordance with International Accounting Standard 34 Interim Financial Reporting (“IAS 34”) as issued by the International Accounting Standards Board (“IASB”), for the three month period ended March 31, 2016 (collectively, the “Financial Statements”), which are included in this Quarterly Report on pages 41 to 55. You are encouraged to review the Financial Statements in conjunction with your review of this MD&A. This MD&A should be read in conjunction with both the annual audited consolidated financial statements for the two years
ended December 31, 2015, the related annual MD&A included in the 2015 Annual Report, and the most recent Form 40–F/Annual Information Form on file with the US Securities and Exchange Commission (“SEC”) and Canadian provincial securities regulatory authorities. These documents and additional information relating to the Company are available on SEDAR at www.sedar.com and EDGAR at www.sec.gov. Certain notes to the Financial Statements are specifically referred to in this MD&A and such notes are incorporated by reference herein. All dollar amounts in this MD&A are in millions of US dollars, unless otherwise specified.
For the purposes of preparing our MD&A, we consider the materiality of information. Information is considered material if: (i) such information results in, or would reasonably be expected to result in, a significant change in the market price or value of our shares; or (ii) there is a substantial likelihood that a reasonable investor would consider it important in making an investment decision; or (iii) it would significantly alter the total mix of information available to investors. We evaluate materiality with reference to all relevant circumstances, including potential market sensitivity.
CAUTIONARY STATEMENT ON FORWARD-LOOKING INFORMATION
Certain information contained or incorporated by reference in this MD&A, including any information as to our strategy, projects, plans or future financial or operating performance constitutes “forward-looking statements”. All statements, other than statements of historical fact, are forward-looking statements. The words “believe”, “expect”, “anticipate”, “contemplate”, “target”, “plan”, “objective”, “intend”, “project”, “continue”, “budget”, “estimate”, “potential”, “may”, “will”, “can”, “could” and similar expressions identify forward-looking statements. In particular, this MD&A contains forward-looking statements including, without limitation, with respect to cash flow forecasts, projected capital, operating and exploration expenditures, targeted debt reductions and cash flow improvements, mine life and production rates, potential mineralization and metal or mineral recoveries, Barrick’s Best-in-Class program (including potential improvements to financial and operating performance and mine life that may result from certain Best-in-Class initiatives), and expectations regarding future price assumptions, financial performance and other outlook or guidance.
Forward-looking statements are necessarily based upon a number of estimates and assumptions that, while considered reasonable by the Company in light of management’s experience and perception of current conditions and expected developments, are inherently subject to significant business, economic and competitive uncertainties and contingencies. Known and unknown factors could cause actual results to differ materially from those projected in the forward-looking statements and undue reliance should not be placed on such statements and information. Such factors include, but are not limited to: fluctuations in the spot and forward price of gold, copper or certain other commodities (such as silver, diesel fuel, natural gas and electricity); the speculative nature of mineral exploration and development; changes in mineral production performance, exploitation and exploration successes; diminishing quantities or grades of reserves; increased costs, delays, suspensions and technical challenges associated with the construction of capital projects; operating or technical difficulties in connection with mining or development activities,
| | | | |
| BARRICK FIRST QUARTER 2016 | | 13 | | MANAGEMENT’S DISCUSSION AND ANALYSIS |
including geotechnical challenges and disruptions in the maintenance or provision of required infrastructure and information technology systems; failure to comply with environmental and health and safety laws and regulations; timing of receipt of, or failure to comply with, necessary permits and approvals; the impact of global liquidity and credit availability on the timing of cash flows and the values of assets and liabilities based on projected future cash flows; adverse changes in our credit ratings; the impact of inflation; fluctuations in the currency markets; changes in U.S. dollar interest rates; risks arising from holding derivative instruments; changes in national and local government legislation, taxation, controls or regulations and/or changes in the administration of laws, policies and practices, expropriation or nationalization of property and political or economic developments in Canada, the United States and other jurisdictions in which the Company does or may carry on business in the future; damage to the Company’s reputation due to the actual or perceived occurrence of any number of events, including negative publicity with respect to the Company’s handling of environmental matters or dealings with community groups, whether true or not; risk of loss due to acts of war, terrorism, sabotage and civil disturbances; litigation; contests over title to properties, particularly title to undeveloped properties, or over access to water, power and other required infrastructure; business opportunities that may be presented to, or pursued by, the Company; our ability to successfully integrate acquisitions or complete divestitures; risks associated with working with partners in jointly controlled assets; employee relations; increased costs and physical risks, including extreme weather events and resource shortages, related to climate change; availability and increased costs associated with mining inputs and labor; and the organization of our previously held African gold operations and properties under a separate listed company. In addition, there are risks and hazards associated with the business of mineral exploration, development and mining, including environmental hazards, industrial accidents, unusual or unexpected formations, pressures, cave-ins, flooding and gold bullion, copper cathode or gold or copper concentrate losses (and the risk of inadequate insurance, or inability to obtain insurance, to cover these risks). Many of these uncertainties and contingencies can affect our actual results and could cause actual results to differ materially from those expressed or implied in any forward-looking statements made by, or on behalf of, us.
Readers are cautioned that forward-looking statements are not guarantees of future performance. All of the forward-looking statements made in this MD&A are qualified by these cautionary statements. Specific reference is made to the most recent Form 40-F/Annual Information Form on file with the SEC and Canadian provincial securities regulatory authorities for a more detailed discussion of some of the factors underlying forward-looking statements and the risks that may affect Barrick’s ability to achieve the expectations set forth in the forward-looking statements contained in this MD&A. We disclaim any intention or obligation to update or revise any forward-looking statements whether as a result of new information, future events or otherwise, except as required by applicable law.
| | |
| INDEX | | page |
| | |
Results Overview | | |
| | |
Review of 2016 First Quarter Results and Full Year Outlook | | 15 |
Key Business Developments | | 17 |
Full Year 2016 Outlook | | 18 |
| | |
Review of Financial Results | | |
| | |
Revenue | | 19 |
Production Costs | | 20 |
Capital Expenditures | | 20 |
Additional Significant Statement of Income Items | | 21 |
Income Tax Expense | | 21 |
| | |
Financial Condition Review | | |
| | |
Balance Sheet Review | | 22 |
Shareholders’ Equity | | 22 |
Financial Position and Liquidity | | 22 |
Summary of Cash Inflow (Outflow) | | 23 |
| | |
| Operating Segments Performance | | 24 |
| | |
| Commitments and Contingencies | | 32 |
| | |
| Review of Quarterly Results | | 33 |
| | |
| Internal Control over Financial Reporting and Disclosure Controls and Procedures | | 34 |
| | |
| IFRS Critical Accounting Policies and Accounting Estimates | | 34 |
| | |
| Non-GAAP Financial Performance Measures | | 35 |
| | | | |
| BARRICK FIRST QUARTER 2016 | | 14 | | MANAGEMENT’S DISCUSSION AND ANALYSIS |
RESULTS OVERVIEW
Review of 2016 First Quarter Results and Full Year Outlook
FINANCIAL AND OPERATING HIGHLIGHTS
Strengthening the Balance Sheet
| | • | | Our liquidity position is strong and continues to improve, with robust cash flow generation, modest near-term debt repayment obligations, a $4 billion undrawn credit facility and a consolidated cash balance of $2.3 billion. We recorded $181 million in free cash flow in first quarter 2016, continuing the trend of positive free cash flow in four consecutive quarters. |
| | • | | We intend to reduce our total debt by at least $2 billion in 2016 through the following levers: drawing on our cash balance; delivering free cash flow from operations; and selling additional non-core assets and creating new joint ventures and partnerships. We have already made $842 million in debt reductions in first quarter 2016, using a combination of proceeds of our sale of Bald Mountain and 50% interest in Round Mountain, which closed on January 11, 2016 and cash flow from operations. |
Cost Reductions
| | • | | Our continued focus on disciplined capital allocation and lower capital spending, combined with reductions in corporate overhead and other operating cost savings, helped us to achieve a 24% reduction in our all-in sustaining costs over the same prior year period, from $927 per ounce in first quarter 2015 to $706 per ounce in first quarter 2016. We are revising our 2016 all-in sustaining cost guidance from $775 to $825 per ounce to $760 to $810 per ounce reflecting the impact of lower fuel costs, favorable foreign exchange rates, identified opportunities from our Best-in-Class productivity and efficiency initiatives and our ongoing commitment towards disciplined capital allocation. |
| | • | | In 2016, we have implemented a Best-in-Class program designed to maximize value creation from our operations by driving improvements in efficiency and productivity, as well as sustainable reductions in costs, across our portfolio. The initiative will bring together, in a single system, all of our existing and future improvement initiatives. |
Net Loss, Adjusted Net Earnings, Operating Cash Flow and Free Cash Flow
| | |
The net loss for first quarter 2016 was $83 million compared to net earnings of $57 million in the same prior year period, largely impacted by lower sales volumes primarily due to the impact of the asset sales that occurred in the second half of 2015 and first quarter 2016 combined with lower realized prices. This was further impacted by the realization of $54 million of deferred currency translation losses released upon the disposal and reorganization of certain Australian entities during first quarter 2016. These were partially offset by a decrease in direct operating costs as a result of lower energy and fuel prices and as some of our Best-in-Class initiatives started to be realized resulting in lower labor and contractor costs along with improved operating efficiencies. Adjusted net earnings of $127 million were 105% higher than the same prior year period despite lower realized prices, primarily due to the reduction in cash | | 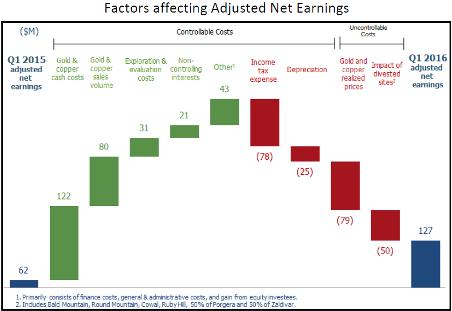 |
costs as discussed above, higher sales volumes (excluding the impact of divested sites) as well as lower exploration
| | | | |
| BARRICK FIRST QUARTER 2016 | | 15 | | MANAGEMENT’S DISCUSSION AND ANALYSIS |
and evaluation costs as a result of lower spending on Pascua-Lama and global exploration costs. This was partly offset by higher income tax expense and the earnings impact associated with the divested sites.
Significant adjusting items (net of tax and non-controlling interest effects) in first quarter 2016 include:
| • | | $119 million in foreign currency translation losses, including deferred currency translation losses released as a result of the disposal and reorganization of certain Australian entities and unrealized foreign currency translation losses primarily related to the impact of the devaluation of the Argentine Peso on VAT receivables; |
| • | | $26 million in losses on the extinguishment of debt; and |
| • | | $17 million in losses reflecting the impact of the decrease in the discount rate used to calculate the provision for environment remediation at our closed mines. |
Refer to page 35 for a full reconciliation of adjusted net income.
Operating cash flow of $451 million was 43% higher compared to the same prior year period despite lower realized prices, reflecting lower cash costs as a result of lower energy and fuel prices and as some of our Best-in-Class initiatives started to be realized resulting in lower labor and contractor costs along with improved operating efficiencies. Other factors impacting operating cash flow in first quarter 2016 included a decrease in income taxes paid, higher sales volumes (excluding the impact of divested sites), partially offset by the impact of divested sites.
| | |
Free cash flow for first quarter 2016 was $181 million, reflecting an increase of $379 million from the same prior year period despite lower realized prices. The inflow primarily reflects higher operating cash flows as a result of lower cash costs and higher sales volumes (excluding the impact of divested sites), combined with decreased capital expenditures as a result of our disciplined capital allocation approach. These factors were partly offset by operating cash flows associated with divested sites. We have now generated positive free cash flow in four consecutive quarters, reflecting our emphasis on cost control and maximizing free cash flow. | | 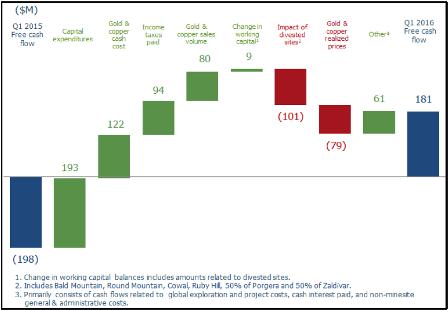
|
| |
Gold Production, Cash Costs and All-in Sustaining Costs
Gold production for first quarter 2016 was 1,280 thousand ounces, 110 thousand ounces or 8% lower than the same prior year period. Excluding the impact of sites divested, production increased by 112 thousand ounces in first quarter 2016. This was primarily due to increases in production at Cortez, Goldstrike and Pueblo Viejo mainly due to higher grade and throughput, partially offset by lower production at Lagunas Norte. The sites which were divested in the second half of 2015 and first quarter 2016, contributed an additional 222 thousand production ounces in first quarter 2015 as compared to first quarter 2016.
Gold cash costs for first quarter 2016 were $553 per ounce, lower by $89 per ounce or 14%, as a result of lower direct mining costs, particularly lower fuel and energy prices, reduced royalty expense and also benefited from Best-in-Class initiatives, including lower labor and contractor costs and improved operating efficiencies.
All-in sustaining costs for first quarter 2016 decreased 24% to $706 per ounce compared to the same prior year period primarily due to a reduction in minesite sustaining capital expenditures, largely comprised of lower capitalized stripping costs, combined with lower cash costs per ounce. All-in costs for first quarter 2016 were 26% lower than the same prior year period due to the same factors affecting all-in sustaining costs, combined with a reduction in project capital expenditures. The lower project capital expenditures are primarily a result of the completion of the thiosulfate circuit at Goldstrike, which entered commercial production in third quarter 2015 and a decrease at Hemlo
| | | | |
| BARRICK FIRST QUARTER 2016 | | 16 | | MANAGEMENT’S DISCUSSION AND ANALYSIS |
in project capital expenditures due to a land acquisition that occurred in first quarter 2015; partially offset by an increase in pre-production stripping at South Arturo. For further details on capital expenditures, refer to page 20 of this MD&A.
Copper Production, C1 Costs and All-in Sustaining Costs
Copper production for first quarter 2016 decreased 6% compared to the same prior year period primarily due to lower production at Zaldívar, partially offset by an increase in production at Lumwana and Jabal Sayid. The decreased production at Zaldívar reflects the divestment of 50% of our ownership in the mine that was completed on December 1, 2015. Production at Lumwana was higher primarily as a result of increased productivity and availability of the mill and crusher in first quarter 2016. C1 cash costs in first quarter 2016 were 20% lower than the same prior year period due to the impact of lower direct mining costs as a result of improved cost controls and lower fuel costs at Lumwana and lower fuel and acid costs at Zaldívar. All-in sustaining costs per pound were 18% lower than the same prior year period primarily reflecting the effect of the above factors on C1 cash costs combined with lower royalty expense at Lumwana resulting from a decreased royalty rate (9% in first quarter 2016 compared to 20% in first quarter 2015.) We now expect C1 cash costs of $1.35 to $1.65 per pound and all-in sustaining costs of $1.95 to $2.25 per pound, compared to previous ranges of $1.45 to $1.75 per pound and $2.05 to $2.35 per pound, respectively, driven by reduced fuel costs and an expected reduction in the royalty rates at Lumwana as discussed on page 17.
Key Business Developments
Divestitures
On January 11, 2016, we completed the sale of our Bald Mountain mine and our 50% interest in the Round Mountain mine to Kinross Gold Corporation for cash consideration of $610 million. In first quarter 2016, we have recognized a loss of $15 million as we work towards the expected finalization of the purchase adjustments in second quarter 2016.
On December 1, 2015, we completed the sale of 50% of our Zaldívar copper mine in Chile to Antofagasta Plc for total consideration of $1.005 billion. We received $950 million upon closing of the transaction, net of $10 million for working capital items, $20 million being held in escrow pending finalization of the working capital adjustment and remaining $25 million will be received over the next five years. The transaction remains subject to a net working capital adjustment period to complete the review of the working capital. The net working capital of Zaldívar (on a 100% basis) was $522 million as at December 1, 2015. We have determined that Zaldívar will be accounted for as a joint venture and upon closing we began accounting for our investment under the equity method. The purchase price allocation underlying our equity method investment will be finalized when the working capital adjustment is finalized.
Debt Management
We are committed to reducing our total debt by at least $2 billion in 2016 and made significant strides against this target in the first quarter. Toward that goal, total debt was reduced by $842 million in first quarter 2016. In particular, on March 21, 2015, Barrick completed a cash tender offer resulting in an approximately $718 million
reduction in the principal amount of Barrick’s outstanding notes and a loss on debt extinguishment of $37 million. The debt repayment is expected to result in an annualized interest savings of approximately $43 million.
Royalty Changes in Zambia
In July 2015, the Zambian government passed amendments to the country’s mining tax regime that replaced a recently adopted 20% gross royalty on open pit mines with a 9% royalty, along with the reintroduction of a 30% corporate income tax, a 50% of taxable income limitation on the utilization of tax loss carryforwards, and a 15% variable profits tax.
In April 2016, the Zambian government introduced legislation to amend the royalty tax for mining operations to a variable rate based on the prevailing copper price. These rates are 4% at copper prices below $2.04; 5% at copper prices between $2.04 and $2.72; and 6% at a copper price of $2.72 and above. Legislation has also been introduced to remove the 15% variable profit tax on income from mining companies. We expect this change to be enacted in second quarter 2016, with an effective date of April 1, 2016 and have updated our copper C1 and all-in sustaining cost guidance on that basis. We will continue to monitor the legislation, including with respect to implementation details as it progresses towards finalization and the potential for a reversal of impairments previously recorded at Lumwana.
| | | | |
| BARRICK FIRST QUARTER 2016 | | 17 | | MANAGEMENT’S DISCUSSION AND ANALYSIS |
Pascua-Lama SMA Regulatory Sanctions – Remanded Administrative Proceeding
On April 4, 2016, as part of the remanded administrative proceeding, Chile’s environmental regulator (known as the SMA) issued two reports assessing water quality data previously provided by Compañía Minera Nevada (“CMN”), Barrick’s Chilean subsidiary that holds the Chilean portion of the Pascua-Lama project. The SMA will consider these reports when issuing a new administrative decision in this matter, as required by the March 3, 2014 decision of the Environmental Court. CMN has challenged one of the reports on procedural grounds and has also challenged the methodology and conclusions of both reports. Refer to Note 15 to the Financial Statements for more information regarding this matter.
Pascua-Lama – Constitutional Protection Action
On April 11, 2016, the court postponed a hearing that had been scheduled for that day. A new hearing date has not yet been scheduled. Refer to Note 15 to the Financial Statements for more information regarding this matter.
Management Structure Refinements
In March 2016, Shaun Usmar, Senior Executive Vice President and Chief Financial Officer, announced his resignation from Barrick. Catherine Raw, formerly Executive Vice President, Business Performance, will succeed Mr. Usmar as Chief Financial Officer on April 27, 2016, subsequent the company’s Annual Meeting of Shareholders. Mr. Usmar will be available in an advisory capacity for two months to support a seamless transition. In March 2016, we also announced that Rob Krcmarov, formerly Senior Vice President, Global Exploration, has been elevated to the position of Executive Vice President, Exploration and Growth, and has become a member of Barrick’s Executive Committee, a group of the company’s most senior partners.
Board Resignations & Appointments
In 2016, the Board of Directors appointed Kelvin Dushnisky, President of Barrick, as a director. The Board has also nominated Graham G. Clow, Chairman of Roscoe Postle Associates Inc., and Gary Doer, former Canadian Ambassador to the United States, as directors. Bill Birchall will retire from the Board at the conclusion of the company’s Annual General Meeting on April 26, 2016. Barrick continues to renew the talent on its Board, with eight of the 13 directors expected to be elected on April 26, 2016 (excluding the Executive Chairman) new to the company since April 2014.
Full Year 2016 Outlook
| | | | |
| ($ millions, except per ounce/pound data) | | 2016E | |
Gold production and costs | | | | |
Production (millions of ounces) | | | 5.0 - 5.5 | |
Gold unit production costs | | | | |
All-in sustaining costs ($ per oz)1,2 | | | 760 - 810 | |
Cash costs ($ per oz)1,3 | | | 540 - 580 | |
Depreciation ($ per oz) | | | 240 - 260 | |
Copper production and costs | | | | |
Production (millions of pounds) | | | 370 - 410 | |
Copper unit production costs | | | | |
C1 cash costs ($ per lb)1,4 | | | 1.35 - 1.65 | |
Depreciation ($ per lb) | | | 0.20 - 0.30 | |
Copper all-in sustaining costs ($ per lb)1,5 | | | 1.95 - 2.25 | |
Exploration and project expenses | | | 225 - 275 | |
Exploration and evaluation | | | 125 - 155 | |
Project expenses | | | 100 - 120 | |
General and administrative expenses | | | ~215 | |
Corporate administration | | | ~145 | |
Stock-based compensation6 | | | ~45 | |
Acacia | | | ~25 | |
Other expense7 | | | 20 - 40 | |
Finance costs | | | 690 - 730 | |
Capital expenditures: | | | | |
Minesite sustaining8 | | | 1,200 - 1,350 | |
Project9 | | | 150 - 200 | |
Total capital expenditures8 | | | 1,350 - 1,550 | |
Effective income tax rate10 | | | ~50% | |
Key Assumptions | | | | |
Gold Price ($/ounce) | | | $1,200 | |
Copper Price ($/pound) | | | $2.15 | |
Oil Price ($/barrel) | | | $34 | |
AUD Exchange Rate | | | $0.73 | |
ARS Exchange Rate | | | $15.28 | |
CAD Exchange Rate | | | $1.35 | |
CLP Exchange Rate | | | 691 | |
| 1 | Cash costs, all-in sustaining costs and C1 cash costs are non-GAAP financial performance measures with no standard meaning under IFRS. For further information and a detailed reconciliation, please see pages 35 - 40 of this MD&A. |
| 2 | We now expect gold all-in sustaining costs to be in the range of $760 to $810 per ounce, compared to our previous guidance range of $775 to $825 per ounce reflecting a reduction cash operating costs and in minesite sustaining capital expenditures. |
| 3 | We now expect cash costs to be within a narrowed range of $540 to $580 per ounce, compared to our previous guidance range of $550 to $590 per ounce reflecting the impact of reduced fuel costs and favorable currency impacts. |
| 4 | We now expect C1 cash costs to be in the range of $1.35 to $1.65 per pound, compared to our previous guidance range of $1.45 to $1.75 per pound, driven by reduced fuel costs and an expected reduction in the royalty rates at Lumwana as discussed on page 17. |
| 5 | We now expect copper all-in sustaining costs to be in the range of $1.95 to $2.25 per pound, compared to our previous guidance range of $2.05 to $2.35 per pound, driven by lower C1 cash costs. |
| 6 | Based on US$8.00 share price. |
| 7 | Other expense excludes adjusting items for which we cannot forecast. |
| 8 | We now expect minesite sustaining capital expenditures to be in the range of $1,200 to $1,350 million compared to our previous guidance range of $1,200 to $1,400 million. As a result, we now expect total capital expenditures to be in the range of $1,350 million to $1,550 million compared to our previous range of $1,350 to $1,650 million. |
| 9 | We have combined our previous capital expenditure categories of Minesite expansion and Projects into one category called Project. |
| 10 | We now expect the effective tax rate to be approximately 50% compared to our previous guidance of 133%. The higher gold price assumption ($1,200 vs $1,000 previously) results in a lower taxes primarily due to a lower impact from non-recognition of deferred tax assets in non-operating entities. |
| | | | |
| BARRICK FIRST QUARTER 2016 | | 18 | | MANAGEMENT’S DISCUSSION AND ANALYSIS |
Hedge Summary Tables
| | | | | | | | | | | | | | | | | | | | |
| AUD Currency Contracts | |
| | | Contracts
(AUD
millions) | | | Effective
average
hedge rate
(AUDUSD) | | | % of total
expected
AUD
exposure1
hedged | | | % of expected
operating cost
exposure hedged | | | Crystalized gain/(loss) in OCI2 (USD millions) | |
2016 | | | 60 | | | | 0.90 | | | | 18% | | | | 21% | | | | (10) | |
| | 1 | Includes all forecasted operating, administrative, sustainable and eligible project capital expenditures. |
| | 2 | To be reclassified from Other Comprehensive Income (“OCI”) to earnings when indicated. |
| | | | | | | | | | | | | | | | |
| Financial Fuel Hedge Summary | |
| | | Barrels
(thousands) | | | Average
price | | | % of total
expected
exposure | | | Impact of $10
change on pre-tax
earnings (USD
millions)1 | |
2016 | | | 2,200 | | | | 85 | | | | 68% | | | | 10 | |
2017 | | | 2,110 | | | | 81 | | | | 52% | | | | 20 | |
2018 | | | 1,080 | | | | 79 | | | | 24% | | | | 34 | |
| | 1 | Includes the impact of hedges currently in place. |
REVIEW OF FINANCIAL RESULTS
Revenue
| | | | | | | | |
($ millions, except per ounce/pound data in dollars) | | For the three months
ended March
31 | |
| | | 2016 | | | 2015 | |
Gold | | | | | | | | |
000s oz sold1 | | | 1,306 | | | | 1,385 | |
000s oz produced1 | | | 1,280 | | | | 1,390 | |
Revenue | | | $ 1,768 | | | | $ 1,919 | |
Market price2 | | | 1,183 | | | | 1,218 | |
Realized price2,3 | | | $ 1,181 | | | | $ 1,219 | |
Copper | | | | | | | | |
millions lbs sold1 | | | 103 | | | | 121 | |
millions lbs produced1 | | | 111 | | | | 118 | |
Revenue4 | | | $ 179 | | | | $ 267 | |
Market price2 | | | 2.12 | | | | 2.64 | |
Realized price2,3 | | | 2.18 | | | | 2.55 | |
Other sales | | | $ 38 | | | | $ 59 | |
| | 1 | Includes our equity share of gold ounces from Acacia and Pueblo Viejo and copper pounds from Zaldívar. |
| | 2 | Per ounce/pound weighted average. |
| | 3 | Realized price is a non-GAAP financial performance measure with no standard meaning under IFRS. For further information and a detailed reconciliation, please see page 40 of this MD&A. |
| | 4 | 2016 includes $55 million of revenue relating to our 50% equity share of Zaldívar. |
In first quarter 2016, gold revenues were down 8% compared to the same prior year period primarily due to a decrease in gold sales volume combined with a lower realized gold price. During first quarter 2016, the gold price ranged from $1,062 per ounce to $1,285 per ounce. The average market price for the quarter of $1,183 per ounce represented a decrease of 3% versus the same prior year period.
In first quarter 2016, gold production was 8% lower than the same prior year period. Excluding the impact of sites divested production increased by 112 thousand ounces in first quarter 2016. This was primarily due to increases in production at Cortez, Goldstrike and Pueblo Viejo mainly due to higher grade and throughput, partially offset by
lower production at Lagunas Norte. The sites which were divested in the second half of 2015 and first quarter 2016, contributed an additional 222 thousand production ounces in first quarter 2015 as compared to first quarter 2016.
Copper revenues for first quarter 2016 were down 33% compared to the same prior year period primarily due to a decrease in sales volume resulting from the divestment of 50% of our ownership in Zaldívar that was completed on December 1, 2015, combined with a lower realized copper price. The copper price ranged from $1.96 per pound to $2.33 per pound. The average market price for the quarter of $2.12 per pound represented a decrease of 20% versus the same prior year period.
Copper production for first quarter 2016 decreased by 6% compared to the same prior year period due to lower production following the divestment of 50% of our ownership in the Zaldívar mine. This was partly offset by higher production at Lumwana due to increased productivity and availability of the mill and crusher in first quarter 2016.
| | | | |
| BARRICK FIRST QUARTER 2016 | | 19 | | MANAGEMENT’S DISCUSSION AND ANALYSIS |
Production Costs
| | | | | | | | |
($ millions, except per ounce/pound data in dollars) | | For the three months
ended March 31 | |
| | | 2016 | | | 2015 | |
Cost of sales | | | | | | | | |
Direct mining costs | | | $ 870 | | | | $ 1,186 | |
Depreciation | | | 386 | | | | 421 | |
Royalty expense | | | 59 | | | | 90 | |
Community relations | | | 9 | | | | 11 | |
Cost of sales - gold | | | 1,200 | | | | 1,424 | |
Cash costs1,2 | | | 553 | | | | 642 | |
All-in sustaining costs - gold1,2 | | | 706 | | | | 927 | |
Cost of sales - copper3 | | | 138 | | | | 251 | |
C1 cash costs1,2 | | | 1.47 | | | | 1.84 | |
All-in sustaining costs per pound1,2 | | | $ 1.97 | | | | $ 2.40 | |
| | 1 | Per ounce/pound weighted average. |
| | 2 | Cash costs, all-in sustaining costs and C1 cash costs are non-GAAP financial performance measures with no standard meaning under IFRS. For further information and a detailed reconciliation, please see pages 35 - 40 of this MD&A. |
| | 3 | 2016 includes $49 million of cost of sales relating to our 50% equity share of Zaldívar. |
In first quarter 2016, cost of sales applicable to gold was 16% lower than the same prior year period due to a decrease in direct mining costs and royalties resulting from decreased sales volumes, combined with a decrease in depreciation expense as a result of the divested sites.
Gold cash costs for first quarter 2016 were $89 per ounce lower, or 14%, as a result of decreased direct mining costs, particularly lower fuel and energy prices, reduced royalty expense and the impact of Best-in-Class initiatives, including lower labor and contractor costs and improved operating efficiencies. In first quarter 2016, all-in sustaining costs were down $221 per ounce compared to the same prior year period primarily due to a reduction in minesite sustaining capital expenditures combined with lower cash costs per ounce.
In first quarter 2016, cost of sales applicable to copper decreased $113 million compared to the same prior year period primarily due to lower direct mining costs combined with lower depreciation expense at Lumwana and lower royalty expense at Lumwana as a result of a lower royalty rate in first quarter 2016.
C1 cash costs per pound for first quarter 2016 were 20% lower than the same prior year period reflecting lower direct mining costs as a result of improved cost controls and lower fuel costs at Lumwana and lower fuel and acid costs at Zaldívar. All-in sustaining costs per pound were 18% lower than the same prior year period primarily reflecting the effect of the above factors on C1 cash costs combined with lower royalty expense at Lumwana resulting from a decreased royalty rate (9% in first quarter 2016 compared to 20% in first quarter 2015). As noted on page 17 this royalty is expected to be revised lower in second quarter 2016.
Capital Expenditures1
| | | | | | | | |
| For the three months | |
| ($ millions) | | ended March 31 | |
| | | 2016 | | | 2015 | |
Project capital expenditures2,3 | | | $ 40 | | | | $ 95 | |
Minesite sustaining | | | 77 | | | | 153 | |
Mine development | | | 98 | | | | 199 | |
Capitalized interest | | | - | | | | 9 | |
Total consolidated capital expenditures | | | $ 215 | | | | $ 456 | |
| | 1 | These amounts are presented on a 100% accrued basis. |
| | 2 | Project capital expenditures are included in our calculation of all-in costs, but not included in our calculation of all-in sustaining costs. |
| | 3 | Includes both minesite expansion and projects. |
In first quarter 2016, capital expenditures decreased 53% compared to the same prior year period. The decrease is due to a decrease in mine development and minesite sustaining capital expenditures combined with lower project capital expenditures and capitalized interest. The 51% reduction in mine development is due to lower capitalized stripping costs, primarily at Goldstrike, Veladero, Porgera, Bald Mountain and Kalgoorlie. The decrease in minesite sustaining capital expenditures is primarily due to our disciplined capital allocation approach combined with a decrease in costs at Veladero relating to the phase 4B leach pad expansion. Project capital expenditures decreased 58% compared to the same prior year period as a result of the completion of the thiosulfate circuit at Goldstrike, which entered commercial production in third quarter 2015 and a decrease at Hemlo in project capital expenditures due to a land acquisition that occurred in first quarter 2015; partially offset by an increase in initial waste stripping at South Arturo.
| | | | |
| BARRICK FIRST QUARTER 2016 | | 20 | | MANAGEMENT’S DISCUSSION AND ANALYSIS |
Additional Significant Statement of Income Items
| | | | | | | | |
| ($ millions) | | For the three months ended
March 31 | |
| | | 2016 | | | 2015 | |
General & administrative expenses | | | $ 58 | | | | $ 67 | |
Corporate administration1 | | | $ 38 | | | | $ 51 | |
Stock-based compensation | | | $ 11 | | | | $ 5 | |
Acacia | | | $ 9 | | | | $ 11 | |
Other expense/(income) | | | $ 14 | | | | ($ 18) | |
Loss (gain) on currency translation | | | $ 139 | | | | ($ 2) | |
Exploration, evaluation & project costs | | | $ 55 | | | | $ 86 | |
Finance costs, net | | | $ 211 | | | | $ 194 | |
Interest expense | | | $ 158 | | | | $ 184 | |
Accretion | | | $ 14 | | | | $ 16 | |
Other finance costs | | | $ 43 | | | | ($ 4) | |
Finance income | | | ($ 4) | | | | ($ 2) | |
Impairments | | | $ 1 | | | | $ 5 | |
| | 1 | For the three months ended March 31, 2016, corporate administration costs include approximately $1 million of severance costs (2015: $5 million). |
General and Administrative Expenses
General and administrative expenses were $9 million lower than the same prior year period, primarily related to a reduction in overhead costs and severance costs as a result of the actions taken to restructure our business in the prior year, partly offset by higher stock-based compensation due to a higher Barrick share price.
Contributing to the decrease in general and administrative expense, we are on track to achieve our targeted reduction of $90 million in annualized overhead costs, excluding severance, stock-based compensation and Acacia corporate administration, which is recorded within general and administrative expense and cost of sales.
Other Expense (Income)
Other income for first quarter 2016 decreased by $32 million compared to the same prior year period. The decrease is primarily due to $15 million in losses associated with the sale of our Bald Mountain mine and our 50% interest in the Round Mountain mine, which closed January 11, 2016. This is compared to gains realized during first quarter 2015 on the sale of assets including an exploration property in Papua New Guinea and equipment in Pascua-Lama. For a further breakdown of other expense (income), refer to note 8 to the Financial Statements.
Loss (gain) on currency translation
Loss (gain) on currency translation for first quarter 2016 increased $141 million compared to the same
prior year period. The increased loss is primarily due to the release of $91 million of currency translation losses as a result of the disposal and reorganization of certain Australian entities during first quarter 2016. This was combined with unrealized foreign currency translation losses primarily related to the devaluation of the Argentine Peso on VAT receivables.
Exploration, Evaluation and Project Costs
Exploration, evaluation and project costs for first quarter 2016 decreased $31 million compared to the same prior year period. The decrease is primarily due to an $18 million decrease in project costs at Pascua-Lama (from $32 million to $14 million in 2016) combined with a $13 million decrease in global exploration costs (from $34 million to $21 million in 2016).
Finance Costs, Net
In first quarter 2016, net finance costs were $17 million higher than the same prior year period primarily due to the recognition of a $37 million loss on extinguishment arising from the debt repurchase that occurred in first quarter 2016, partially offset by lower interest expense as a result of the debt reductions made over the past 15 months.
Income Tax Expense
Income tax expense was $186 million in first quarter 2016. The underlying effective tax rate for ordinary income in the first quarter 2016 was 49.5% after adjusting for the impact of Acacia income tax provisions in Tanzania (for further details refer to note 9); the impact of net currency translation losses on deferred tax balances; the impact of asset sales and non-hedge derivatives; and the impact of non-deductible foreign exchange losses. The unadjusted tax rate for income in first quarter 2016 was 163% of the income before income taxes.
We record deferred tax charges or credits if changes in facts or circumstances affect the estimated tax basis of assets and therefore the amount of deferred tax assets or liabilities to reflect changing expectations in our ability to realize deferred tax assets. The interpretation of tax regulations and legislation and their application to our business is complex and subject to change. We have significant amounts of deferred tax assets, including tax loss carry forwards, and also deferred tax liabilities. Potential changes of any of these amounts, as well as our ability to realize deferred tax assets, could significantly affect net income or cash flow in future periods.
| | | | |
| BARRICK FIRST QUARTER 2016 | | 21 | | MANAGEMENT’S DISCUSSION AND ANALYSIS |
FINANCIAL CONDITION REVIEW
| | | | | | | | |
| Summary Balance Sheet and Key Financial Ratios | | | | | | |
| | |
| ($ millions, except ratios and share amounts) | | As at March 31, 2016 | | | As at December 31, 2015 | |
Total cash and equivalents | | | $ 2,323 | | | | $ 2,455 | |
Current assets | | | 2,197 | | | | 3,013 | |
Non-current assets | | | 20,846 | | | | 20,840 | |
Total Assets | | | $ 25,366 | | | | $ 26,308 | |
Current liabilities excluding short-term debt | | | $ 1,495 | | | | $ 1,644 | |
Non-current liabilities excluding long-term debt | | | 5,302 | | | | 5,241 | |
Debt (current and long-term) | | | 9,126 | | | | 9,968 | |
Total Liabilities | | | $ 15,923 | | | | $ 16,853 | |
Total shareholders’ equity | | | 7,173 | | | | 7,178 | |
Non-controlling interests | | | 2,270 | | | | 2,277 | |
Total Equity | | | $ 9,443 | | | | $ 9,455 | |
Total common shares outstanding (millions of shares)1 | | | 1,165 | | | | 1,165 | |
| | |
Key Financial Ratios: | | | | | | | | |
Current ratio2 | | | 2.69:1 | | | | 2.77:1 | |
Debt-to-equity3 | | | 0.97:1 | | | | 1.05:1 | |
| 1 | Total common shares outstanding do not include 2.6 million stock options. |
| 2 | Represents current assets (excluding assets held-for-sale) divided by current liabilities (including short-term debt and excluding liabilities held-for-sale) as at March 31, 2016 and December 31, 2015. |
| 3 | Represents debt divided by total shareholders’ equity (including minority interest) as at March 31, 2016 and December 31, 2015. |
Balance Sheet Review
Total assets were $25.4 billion at March 31, 2016, approximately $0.9 billion lower than at December 31, 2015, primarily reflecting the sale of Bald Mountain and our 50% interest in Round Mountain, which were presented as held for sale and included in current assets at December 31, 2015. Our asset base is primarily comprised of non-current assets such as property, plant and equipment and goodwill, reflecting the capital intensive nature of the mining business and our history of growing through acquisitions. Other significant assets include production inventories, indirect taxes and other government receivables, and cash and equivalents. We typically do not carry a material accounts receivable balance, since only sales of concentrate and copper cathode have a settlement period. Total liabilities at March 31, 2016 totaled $15.9 billion, approximately $0.9 billion lower than at December 31, 2015, primarily reflecting $0.8 billion of debt repayments made during the quarter.
Shareholders’ Equity
| | | | |
| As at April 18, 2016 | | Number of shares | |
Common shares | | | 1,165,215,209 | |
Stock options | | | 2,314,486 | |
Financial Position and Liquidity
Total cash and cash equivalents as at March 31, 2016 was $2.3 billion1. Our capital structure comprises a mix of debt and shareholders’ equity. As at March 31, 2016, our total debt was $9.1 billion (debt net of cash and equivalents was $6.8 billion) and our debt-to-equity ratio was 0.97:1. This compares to debt as at December 31, 2015 of $10.0 billion (debt net of cash and equivalents was $7.5 billion), and a debt-to-equity ratio of 1.05:1.
At the beginning of 2016, we set a debt reduction target of $2 billion. We have reduced debt by $842 million in first quarter 2016 in furtherance of this goal. We currently have less than $200 million2 in debt due before 2018 and approximately $5 billion of our outstanding debt matures after 2032.
Our primary source of liquidity is our operating cash flow, which is dependent on the ability of our operations to deliver projected future cash flows.The market prices of gold, and, to a lesser extent, copper are the primary drivers of our operating cash flow. Other
| 1 | Includes $534 million cash held at Acacia and Pueblo Viejo, which may not be readily deployed outside of Acacia and/or Pueblo Viejo. |
| 2 | Amount excludes capital leases and includes project financing payments at Pueblo Viejo (60% basis) and Acacia (100% basis). |
| | | | |
| BARRICK FIRST QUARTER 2016 | | 22 | | MANAGEMENT’S DISCUSSION AND ANALYSIS |
options to enhance liquidity include further non-core asset sales or joint venture opportunities; issuance of debt or equity securities in the public markets or to private investors, which could be undertaken for liquidity enhancement and/or in connection with establishing a strategic partnership; and drawing the $4.0 billion available under our fully undrawn credit facility (subject to compliance with covenants and the making of certain representations and warranties, this facility is available for drawdown as a source of financing). Many factors, including but not limited to, general market conditions and then prevailing metals prices could impact our ability to issue securities on acceptable terms, as could our credit ratings. Moody’s and S&P currently rate our long-term debt Baa3 and BBB-, both of which are the lowest investment grade ratings. In January 2016, Moody’s placed Barrick’s long-term debt rating on review for downgrade. In March 2016, Moody’s affirmed the Company’s Baa3 rating and assigned a negative outlook. Further changes in our ratings could affect the trading prices of our securities and our cost of capital. If we were to borrow under our credit facility, the applicable interest rate on the amounts borrowed would be based, in part, on our credit ratings at the time. The key financial covenant in our fully undrawn credit facility requires Barrick to maintain a net debt to total capitalization ratio of less than 0.60:1. Barrick’s net debt to total capitalization was 0.41:1 as at March 31, 2016 (0.44:1 as at December 31, 2015.)
Summary of Cash Inflow (Outflow)
| | | | | | | | |
| ($ millions) | | For the three months ended
March 31 | |
| | | 2016 | | | 2015 | |
Operating inflows | | | $ 451 | | | | $ 316 | |
Investing activities | | | | | | | | |
Capital expenditures1 | | | $ (270) | | | | $ (514) | |
Divestitures | | | 610 | | | | 2 | |
Other | | | 1 | | | | 44 | |
Total investing inflows/(outflows) | | | $ 341 | | | | $ (468) | |
Financing activities | | | | | | | | |
Net change in debt | | | $ (850) | | | | $ (182) | |
Dividends | | | (22) | | | | (58) | |
Other | | | (55) | | | | (43) | |
Total financing inflows/(outflows) | | | $ (927) | | | | $ (283) | |
Effect of exchange rate | | | 3 | | | | (6) | |
Increase/(decrease) in cash and equivalents | | | ($132) | | | | ($441) | |
| 1 | The amounts include capitalized interest of $nil for the three months ended March 31, 2016 (2015: $9 million). |
In first quarter 2016, we generated $451 million in operating cash flow, compared to $316 million of operating cash flow in the same prior year period. Despite lower realized prices, the increase in operating cash flow primarily reflects lower cash costs as a result of lower energy and fuel prices and as some of our Best-in-Class initiatives started to be realized resulting in lower labor and contractor costs along with improved operating efficiencies. Other factors impacting operating cash flow in first quarter 2016 included higher sales volumes (excluding the impact of divested sites), a decrease in income taxes paid, partially offset by the impact of divested sites. The most significant driver of the change in operating cash flow is market gold and copper prices. The ability of our operations to deliver projected future cash flows within the parameters of a reduced production profile, as well as future changes in gold and copper market prices, either favorable or unfavorable, will continue to have a material impact on our cash flow and liquidity. The principal uses of operating cash flow are to fund our capital expenditures, interest, exploration, corporate overhead and dividends.
Cash inflows from investing activities in first quarter 2016 amounted to $341 million compared to $468 million of cash outflows in the same prior year period. The increase of $809 million compared to first quarter 2015 is primarily due to $610 million of net proceeds from the divestiture of our Bald Mountain mine and our 50% interest in the Round Mountain mine, which closed January 11, 2016. In first quarter 2016, capital expenditures on a cash basis were $270 million compared to $514 million in first quarter 2015. The decrease of $244 million is primarily due to a decrease in capitalized stripping costs as a result of fewer waste tonnes mined combined with a reduction in sustaining and project capital expenditures.
Net financing cash outflows for first quarter 2016 amounted to $927 million, compared to $283 million of cash outflows in the same prior year period. The net financing cash outflows for first quarter 2016 primarily consist of $850 million of net debt repayments and $22 million of dividend payments, compared to $182 million of net debt repayments and $58 million of dividend payments in the same prior year period.
| | | | |
| BARRICK FIRST QUARTER 2016 | | 23 | | MANAGEMENT’S DISCUSSION AND ANALYSIS |
OPERATING SEGMENTS PERFORMANCE
Review of Operating Segments Performance
Barrick’s business is organized into thirteen individual minesites, one publicly traded company and one project. Barrick’s Chief Operating Decision Maker (“CODM”), the President, reviews the operating results, assesses performance and makes capital allocation decisions at the minesite, Company and/or project level. Therefore, each individual minesite, Acacia and the Pascua-Lama project are operating segments for financial reporting purposes. Following the divestitures that were completed in 2015 and early 2016, we re-evaluated our reportable operating segments and no longer report on our interests in the following non-core properties: Porgera, Kalgoorlie, Zaldívar and Lumwana. Our updated presentation of our reportable operating segments will now be limited to six individual gold mines, Acacia and our Pascua-Lama project. The remaining operating segments, including the non-core properties referred to above and our remaining gold and copper mines, have been grouped into an “other” category and will not be reported on individually. The prior periods have been restated to reflect the change in presentation. Segment performance is evaluated based on a number of measures including operating income before tax, production levels and unit production costs. Certain costs are managed on a consolidated basis and are therefore not reflected in segment income.
In our year end 2015 report, we disclosed guidance ranges for these properties and updates have been provided below.
At Porgera we continue to expect 2016 gold production to be in the range of 230 to 260 thousand ounces (Barrick’s 47.5% share) at cash costs of $700 to $750 per ounce and all-in sustaining costs of $990 to $1,080 per ounce.
At Kalgoorlie we continue to expect 2016 production to be in the range of 350 to 365 thousand ounces (Barrick’s share), at cash costs of $610 to $630 per ounce and all-in sustaining costs of $670 to $700 per ounce.
At Zaldívar, we continue to expect 2016 copper production to be in the range of 100 to 120 million pounds (Barrick’s 50% share), at C1 cash costs of $1.70 to $1.90 per pound and all-in sustaining costs of $2.20 to $2.40 per pound.
At Lumwana we continue to expect 2016 copper production to be in the range of 270 to 290 million pounds. We now expect C1 cash costs of $1.20 to $1.50 per pound and all-in sustaining costs of $1.80 to $2.10 per pound, compared to previous ranges of $1.35 to $1.60 per pound and $1.90 to $2.20 per pound, respectively.
| | | | |
| BARRICK FIRST QUARTER 2016 | | 24 | | MANAGEMENT’S DISCUSSION AND ANALYSIS |
Cortez, Nevada USA
| | | | | | | | | | | | |
| Summary of Operating Data | | | | | For the three months ended March 31 | |
| | | 2016 | | | 2015 | | | % Change | |
Total tonnes mined (000s) | | | 30,271 | | | | 39,648 | | | | (24%) | |
Ore tonnes processed (000s) | | | 7,304 | | | | 5,157 | | | | 42% | |
Average grade (grams/tonne) | | | 1.62 | | | | 1.01 | | | | 60% | |
Gold produced (000s/oz) | | | 247 | | | | 133 | | | | 86% | |
Gold sold (000s/oz) | | | 278 | | | | 155 | | | | 79% | |
Cost of sales ($ millions) | | | $ 252 | | | | $ 196 | | | | 29% | |
Cash costs (per oz)1 | | | $ 407 | | | | $ 816 | | | | (50%) | |
All-in sustaining costs (per oz)1 | | | $ 469 | | | | $ 962 | | | | (51%) | |
All-in costs (per oz)1 | | | $ 490 | | | | $ 1,043 | | | | (53%) | |
| | |
| Summary of Financial Data | | | | | For the three months ended March 31 | |
| | | 2016 | | | 2015 | | | % Change | |
Segment EBIT ($ millions) | | | $ 73 | | | | ($ 9) | | | | 911% | |
Segment EBITDA ($ millions)1 | | | $ 212 | | | | $ 61 | | | | 248% | |
Capital expenditures ($ millions)2 | | | $ 20 | | | | $ 33 | | | | (39%) | |
Minesite sustaining | | | $ 15 | | | | $ 21 | | | | (29%) | |
Project capex | | | $ 5 | | | | $ 12 | | | | (58%) | |
| 1 | These are non-GAAP financial performance measures; for further information and a detailed reconciliation, please see pages 35 - 40 of this MD&A. |
| 2 | Amounts presented exclude capitalized interest. |
Financial Results
Cortez’s earnings before income and taxes (“EBIT”) for first quarter 2016 were $82 million higher than the same prior year period, primarily due to an increase in sales volume, partially offset by a lower realized gold price and higher depreciation due to an increase in ounces mined at the Cortez Hills pit, which have a higher depreciation charge per ounce than other areas at Cortez.
In first quarter 2016, gold production was 86% higher than the same prior year period, as we processed higher grade mill ore in the current period compared to lower grade leach material in the same prior year period. In addition, more underground ore is being mined and processed at the Goldstrike roaster than in the prior year and mill throughput and recoveries in first quarter 2016 have improved over the same prior year period due to improved efficiencies and higher grades processed.
Cost of sales for first quarter 2016 was 29% higher than the same prior year period, primarily due to the impact of higher depreciation from an increase in ounces mined at the Cortez Hills open pit. The increase in cost of sales was partially offset by lower spending on external services resulting from Best-in-Class initiatives aimed at reducing the use of contractors including in particular maintenance contractors. The increase in cost of sales was also offset by lower open pit consumable costs ($38/oz impact) including lower fuel prices in 2016, combined with lower inventory write-downs compared to the same prior year period. Further offsetting higher
depreciation for first quarter 2016, royalty payments were lower compared to the same prior year period, as more ore was produced from the Cortez Hills pit, which has lower associated royalties. Cash costs were $409 per ounce lower than the same prior year period, primarily due to overall lower operating costs combined with the impact of higher sales volume on unit production costs. All-in sustaining costs decreased by $493 per ounce from the same prior year period, primarily due to the impact of higher sales volume combined with lower cash costs and lower sustaining capital spend.
In first quarter 2016, capital expenditures decreased by 39% from the same prior year period. Lower sustaining capital is attributed to efforts to reduce costs and optimize capital allocation in 2016 as well as the completion of a leach expansion project for which expenditures were incurred in 2015. Project capital expenditures are lower due to decreasing Lower Zone expansion project costs, primarily as a result of timing.
We continue to expect 2016 gold production to be in the range of 900 to 1,000 thousand ounces. We now expect cash costs of $430 to $470 per ounce and all-in sustaining costs of $580 to $640 per ounce, compared to our previous ranges of $480 to $530 per ounce and $640 to $710 per ounce, respectively. These changes reflect improved fuel costs, mining of increased ore tons and reductions in sustaining capital expenditure.
| | | | |
| BARRICK FIRST QUARTER 2016 | | 25 | | MANAGEMENT’S DISCUSSION AND ANALYSIS |
Goldstrike, Nevada USA
| | | | | | | | | | | | |
| Summary of Operating Data | | | | | For the three months ended March 31 | |
| | | 2016 | | | 2015 | | | % Change | |
Total tonnes mined (000s)1 | | | 16,709 | | | | 20,629 | | | | (19%) | |
Ore tonnes processed (000s) | | | 1,772 | | | | 1,514 | | | | 17% | |
Average grade (grams/tonne) | | | 5.50 | | | | 5.19 | | | | 6% | |
Gold produced (000s/oz) | | | 249 | | | | 207 | | | | 20% | |
Gold sold (000s/oz) | | | 246 | | | | 199 | | | | 24% | |
Cost of sales ($ millions) | | | $ 212 | | | | $ 149 | | | | 42% | |
Cash costs (per oz) | | | $ 621 | | | | $ 584 | | | | 6% | |
All-in sustaining costs (per oz) | | | $ 709 | | | | $ 876 | | | | (19%) | |
All-in costs (per oz) | | | $ 709 | | | | $ 1,021 | | | | (31%) | |
| | |
| Summary of Financial Data | | | | | For the three months ended March 31 | |
| | | 2016 | | | 2015 | | | % Change | |
Segment EBIT ($ millions) | | | $ 75 | | | | $ 86 | | | | (13%) | |
Segment EBITDA ($ millions) | | | $ 134 | | | | $ 118 | | | | 14% | |
Capital expenditures ($ millions)2 | | | $ 39 | | | | $ 88 | | | | (56%) | |
Minesite sustaining | | | $ 20 | | | | $ 55 | | | | (64%) | |
Project capex2 | | | $ 19 | | | | $ 33 | | | | (42%) | |
| 1 | Includes tonnes mined relating to South Arturo. |
| 2 | Includes our share of capital expenditures related to South Arturo. |
Financial Results
Goldstrike’s EBIT for first quarter 2016 was 13% lower than the same prior year period. The decrease was primarily due to increased processing and depreciation expense associated with the operation of the thiosulfate circuit partially offset by an increase in sales volume.
In first quarter 2016, gold production was 20% higher than the same prior year period. The increase was a result of higher autoclave production, higher grade ore mined from the North Betze layback, and an increase in roaster production due to improved operating efficiencies.
Cost of sales for first quarter 2016 was 42% higher than the same prior year period, primarily due to an increase in operating costs ($192/oz) and depreciation expense from the operation of the autoclave due to the thiosulfate circuit which was commissioned in third quarter 2015 and operates at a higher cost than the roaster. This is slightly offset by a decrease in underground costs ($22/oz) due to a Best-in-Class initiative aimed at lowering contractor costs. Cash costs were $37 per ounce higher than the same prior year period, primarily due to higher cost of sales, partially offset by the impact of higher sales volume on unit production costs. All-in sustaining costs for first quarter
2016 decreased $167 per ounce compared to the same prior year period, primarily due to a reduction in sustaining capital expenditures and the increase in sales volume, partially offset by the impact of higher cash costs.
In first quarter 2016, capital expenditures decreased by 56% compared to the same prior year period. Sustaining capital was higher in the prior year due to open pit equipment replacements, replacements of boilers and relining autoclave tanks, and phase 2 construction of the tailings storage facility which was completed in fourth quarter 2015. Lower sustaining capital is also attributed to efforts to reduce costs and optimize capital allocation. The decrease in project capital is due to reduced spending associated with the autoclave thiosulfate circuit, which entered commercial production in third quarter 2015. This is partially offset by capital stripping at Arturo, which started in late March 2015.
We continue to expect 2016 gold production to be in the range of 975 to 1,075 thousand ounces at cash costs of $560 to $610 per ounce and all-in sustaining costs of $780 to $850 per ounce.
| | | | |
| BARRICK FIRST QUARTER 2016 | | 26 | | MANAGEMENT’S DISCUSSION AND ANALYSIS |
Pueblo Viejo (60% basis), Dominican Republic
| | | | | | | | | | | | |
| Summary of Operating Data | | | | | For the three months ended March 31 | |
| | | 2016 | | | 2015 | | | % Change | |
Total tonnes mined (000s) | | | 6,319 | | | | 4,544 | | | | 39% | |
Ore tonnes processed (000s) | | | 1,146 | | | | 1,116 | | | | 3% | |
Average grade (grams/tonne) | | | 5.34 | | | | 4.30 | | | | 24% | |
Gold produced (000s/oz) | | | 172 | | | | 135 | | | | 27% | |
Gold sold (000s/oz) | | | 169 | | | | 134 | | | | 26% | |
Cost of sales (100%) ($ millions) | | | $ 167 | | | | $ 231 | | | | (28%) | |
Cash costs (per oz) | | | $ 411 | | | | $ 510 | | | | (19%) | |
All-in sustaining costs (per oz) | | | $ 496 | | | | $ 675 | | | | (27%) | |
All-in costs (per oz) | | | $ 496 | | | | $ 675 | | | | (27%) | |
| | |
| Summary of Financial Data | | | | | For the three months ended March 31 | |
| | | 2016 | | | 2015 | | | % Change | |
Segment EBIT (100%) ($ millions) | | | $ 183 | | | | $ 137 | | | | 34% | |
Segment EBITDA (100%) ($ millions) | | | $ 226 | | | | $ 206 | | | | 10% | |
Capital expenditures ($ millions) | | | $ 13 | | | | $ 20 | | | | (35%) | |
Minesite sustaining | | | $ 13 | | | | $ 20 | | | | (35%) | |
Project capex | | | - | | | | - | | | | - | |
Financial Results
Pueblo Viejo’s EBIT for first quarter 2016 was 34% higher than the same prior year period, primarily due to an increase in gold sales volume combined with a decrease in cost of sales, partially offset by a lower realized gold price.
In first quarter 2016, gold production was 27% higher than the same prior year period. The increase was primarily due to lower throughput in first quarter 2015 due to autoclave availability. This was partially offset by lower recoveries in first quarter 2016 than the same prior year period due to a higher amount of carbonaceous ore processed.
Cost of sales for first quarter 2016 was 28% lower than the same prior year period, primarily due to lower processing costs as a result of lower maintenance ($36/oz) and contractor ($9/oz) costs as there were autoclave shutdowns in first quarter 2015 but not in the current year. This was combined with lower energy ($31/oz) and diesel ($9/oz) costs as a result of lower prices compared to the same prior year period and lower depreciation as a result of the impairment recorded in fourth quarter 2015; offset by increased labor costs and higher limestone consumption. Cash costs were $99 per
ounce lower than the same prior year period. The decrease was primarily due to decreased cost of sales combined with the impact of higher sales volume on unit production costs. All-in sustaining costs decreased by $179 per ounce compared to the same prior year period due to lower cash costs combined with a reduction in minesite sustaining capital expenditures.
In first quarter 2016, capital expenditures decreased by 35% compared to the same prior year period, primarily due to the deferral and cancellation of non-critical minesite sustaining capital expenditures and a decrease in capitalized stripping costs due to the large stripping activity required in order to start Moore Phase 2 that was occurring in the same prior year period.
In 2016, we continue to expect our share of gold production to be in the range of 600 to 650 thousand ounces. We now expect cash costs of $420 to $450 per ounce and all-in sustaining costs of $550 to $590 per ounce, compared to previous ranges of $440 to $480 per ounce and $570 to $620 per ounce, respectively. These changes reflect improved fuel costs and favorable currency impacts.
| | | | |
| BARRICK FIRST QUARTER 2016 | | 27 | | MANAGEMENT’S DISCUSSION AND ANALYSIS |
Lagunas Norte, Peru
| | | | | | | | | | | | |
| Summary of Operating Data | | | | | For the three months ended March 31 | |
| | | 2016 | | | 2015 | | | % Change | |
Total tonnes mined (000s) | | | 10,003 | | | | 12,662 | | | | (21%) | |
Ore tonnes processed (000s) | | | 4,415 | | | | 5,649 | | | | (22%) | |
Average grade (grams/tonne) | | | 0.93 | | | | 1.18 | | | | (21%) | |
Gold produced (000s/oz) | | | 100 | | | | 178 | | | | (44%) | |
Gold sold (000s/oz) | | | 101 | | | | 167 | | | | (40%) | |
Cost of sales ($ millions) | | | $ 68 | | | | $ 99 | | | | (31%) | |
Cash costs (per oz) | | | $ 341 | | | | $ 317 | | | | 8% | |
All-in sustaining costs (per oz) | | | $ 551 | | | | $ 461 | | | | 20% | |
All-in costs (per oz) | | | $ 551 | | | | $ 461 | | | | 20% | |
| | |
| Summary of Financial Data | | | | | For the three months ended March 31 | |
| | | 2016 | | | 2015 | | | % Change | |
Segment EBIT ($ millions) | | | $ 55 | | | | $ 104 | | | | (47%) | |
Segment EBITDA ($ millions) | | | $ 83 | | | | $ 145 | | | | (43%) | |
Capital expenditures ($ millions) | | | $ 19 | | | | $ 13 | | | | 46% | |
Minesite sustaining | | | $ 19 | | | | $ 13 | | | | 46% | |
Project capex | | | - | | | | - | | | | - | |
Financial Results
Lagunas Norte’s EBIT for first quarter 2016 was 47% lower than the same prior year period, primarily due to lower sales volumes combined with a lower realized gold price, partially offset by lower operating costs mostly driven by lower tonnage mined, lower fuel prices and lower depreciation expense.
In first quarter 2016, gold production was 44% lower than the same prior year period, primarily due to fewer ounces placed on the leach pad as a result of lower tonnage placed on the pad and lower grades, and in line with expectations as the mine matures.
Cost of sales for first quarter 2016 was 31% lower than the same prior year period mainly due to a decrease in depreciation expense as a result of lower production and lower direct mining costs resulting from lower tonnage mined and processed, lower fuel prices and realized cost savings from Best-in-Class initiatives such as the initiatives to improve efficiencies in the carbon in column circuit and renegotiate certain service contracts. Cash costs per ounce were $24 per ounce higher than the same prior year period, primarily driven by the impact of
decreased sales volume. All-in sustaining costs increased by $90 per ounce over the same prior year period, primarily due to the impact of decreased sales volume (derived from the lower production) and higher capital expenditures mostly driven by higher capitalized stripping costs.
In first quarter 2016, capital increased by 46% compared to the same prior year period. The increase was primarily due to an increase in capitalized stripping costs combined with an increase in the costs relating to the construction of phase 6 of the leach pad.
We continue to expect 2016 gold production to be in the range of 410 to 450 thousand ounces with cash costs between $380 and $420 per ounce and all-in sustaining costs of $570 to $640 per ounce.
| | | | |
| BARRICK FIRST QUARTER 2016 | | 28 | | MANAGEMENT’S DISCUSSION AND ANALYSIS |
Veladero, Argentina
| | | | | | | | | | | | |
| Summary of Operating Data | | | | | For the three months ended March 31 | |
| | | 2016 | | | 2015 | | | % Change | |
Total tonnes mined (000s) | | | 22,314 | | | | 19,120 | | | | 17% | |
Ore tonnes processed (000s) | | | 7,271 | | | | 7,180 | | | | 1% | |
Average grade (grams/tonne) | | | 0.46 | | | | 0.78 | | | | (41%) | |
Gold produced (000s/oz) | | | 132 | | | | 149 | | | | (11%) | |
Gold sold (000s/oz) | | | 124 | | | | 168 | | | | (26%) | |
Cost of sales ($ millions) | | | $ 105 | | | | $ 128 | | | | (18%) | |
Cash costs (per oz) | | | $ 513 | | | | $ 572 | | | | (10%) | |
All-in sustaining costs (per oz) | | | $ 675 | | | | $ 991 | | | | (32%) | |
All-in costs (per oz) | | | $ 675 | | | | $ 991 | | | | (32%) | |
| | |
| Summary of Financial Data | | | | | For the three months ended March 31 | |
| | | 2016 | | | 2015 | | | % Change | |
Segment EBIT ($ millions) | | | $ 47 | | | | $ 73 | | | | (36%) | |
Segment EBITDA ($ millions) | | | $ 72 | | | | $ 99 | | | | (27%) | |
Capital expenditures ($ millions) | | | $ 19 | | | | $ 68 | | | | (72%) | |
Minesite sustaining | | | $ 19 | | | | $ 68 | | | | (72%) | |
Project capex | | | - | | | | - | | | | - | |
Financial Results
Veladero’s EBIT for first quarter 2016 was 36% lower than the same prior year period, primarily due to a decrease in sales volume combined with foreign exchange losses mainly related to VAT and income tax payments, partially offset by lower operating costs.
In first quarter 2016, gold production was 11% lower than the same prior year period, despite having more tonnes placed on the leach pad. Production was down reflecting lower grades and a buildup of ounces on the leach pad as a result of the initial placement of material during pad construction.
Cost of sales for first quarter 2016 was 18% lower than the same prior year period, primarily due to lower operating costs as a result of savings initiatives and the impact of local currency devaluation, primarily labor ($68/oz), maintenance ($43/oz) and diesel costs ($17/oz). This was partially offset by lower capitalized stripping costs and the environmental fine accrued in first quarter 2016. In first quarter 2016, cash costs were $59 per ounce lower than the same prior year period, primarily due to the impact of lower cost of sales partly offset by the impact of lower sales volume on unit production costs. All-in sustaining costs decreased by $316 per ounce over the same prior year period due to a decrease in minesite sustaining capital expenditures combined with lower cash costs.
In first quarter 2016, capital expenditures decreased by 72% compared to the same prior year period, primarily due to a decrease in minesite sustaining expenditures mainly related to the construction of the phase 4B leach
pad combined with a decrease in capitalized stripping costs.
On October 9, 2015, the San Juan mining authority initiated an administrative sanction process against MInera Argentina Gold S.A. (“MAGSA”), Barrick’s Argentine subsidiary that operates the Veladero mine, for alleged violations of the mining code relating to a valve failure and release of cyanide-bearing process solution in September 2015. On March 11, 2016, the San Juan Provincial mining authority announced its intention to impose an administrative fine against MAGSA, in connection with the solution release. MAGSA was formally notified of this decision on March 15, 2016. On April 6, 2016, MAGSA sought reconsideration of certain aspects of the decision but did not challenge the amount of the administrative fine. On April 14, 2016, in accordance with local requirements, MAGSA paid the administrative fine of approximately $10 million (at the then-applicable Argentine peso/$ exchange rate) while the request for reconsideration is pending. Refer to Note 15 to the Financial Statements for more information regarding this matter.
We continue to expect 2016 gold production to be in the range of 630 to 690 thousand ounces. We now expect cash costs of $520 to $570 per ounce and all-in sustaining costs of $790 to $860 per ounce, compared to previous ranges of $550 to $600 per ounce and $830 to $900 per ounce, respectively. These changes reflect improved fuel costs and favorable currency impacts.
| | | | |
| BARRICK FIRST QUARTER 2016 | | 29 | | MANAGEMENT’S DISCUSSION AND ANALYSIS |
Turquoise Ridge (75% basis), Nevada USA
| | | | | | | | | | | | |
| Summary of Operating Data | | | | | For the three months ended March 31 | |
| | | 2016 | | | 2015 | | | % Change | |
Total tonnes mined (000s) | | | 130 | | | | 93 | | | | 40% | |
Ore tonnes processed (000s) | | | 101 | | | | 84 | | | | 20% | |
Average grade (grams/tonne) | | | 16.86 | | | | 19.59 | | | | (14%) | |
Gold produced (000s/oz) | | | 50 | | | | 49 | | | | 2% | |
Gold sold (000s/oz) | | | 48 | | | | 45 | | | | 7% | |
Cost of sales ($ millions) | | | $ 35 | | | | $ 31 | | | | 13% | |
Cash costs (per oz) | | | $ 600 | | | | $ 578 | | | | 4% | |
All-in sustaining costs (per oz) | | | $ 728 | | | | $ 709 | | | | 3% | |
All-in costs (per oz) | | | $ 728 | | | | $ 709 | | | | 3% | |
| | |
| Summary of Financial Data | | | | | For the three months ended March 31 | |
| | | 2016 | | | 2015 | | | % Change | |
Segment EBIT ($ millions) | | | $ 20 | | | | $ 24 | | | | (17%) | |
Segment EBITDA ($ millions) | | | $ 26 | | | | $ 29 | | | | (10%) | |
Capital expenditures ($ millions) | | | $ 6 | | | | $ 6 | | | | - | |
Minesite sustaining | | | $ 6 | | | | $ 6 | | | | - | |
Project capex | | | - | | | | - | | | | - | |
Financial Results
Turquoise Ridge’s EBIT for first quarter 2016 was 17% lower than the same prior year period, primarily due to an increase in operating costs combined with a lower realized gold price. This was partially offset by an increase in sales volume compared to first quarter 2015.
In first quarter 2016, gold production was 2% higher than the same prior year period, primarily due to an increase in tonnes mined and processed resulting from increased labor to support production growth combined with improved equipment availability. In first quarter 2015, the mine transitioned to fully mechanized topcuts, which resulted in increased productivity and the processing of more ore tonnes in subsequent quarters, including first quarter 2016.
Cost of sales was 13% higher than the same prior year period primarily due to a reduction in capitalized underground development costs, partially offset by increased productivities resulting in mining cost per ton
decreasing by 5%. The increased productivities and unit cost reductions are due to the investment in equipment and facilities made in 2015 as well as a focus on equipment utilization, equipment maintenance and consumables consumption. Cash costs were $22 per ounce higher compared to the same prior year period, primarily due to the higher cost of sales, partially offset by the impact of higher sales volume on unit production costs. All-in sustaining costs increased by $19 per ounce over the same prior year period, primarily due to higher cash costs.
In first quarter 2016, capital expenditures were in line with the same prior year period.
We continue to expect attributable 2016 gold production to be in the range of 200 to 220 thousand ounces at cash costs of $560 to $620 per ounce and all-in sustaining costs of $770 to $850 per ounce.
| | | | |
| BARRICK FIRST QUARTER 2016 | | 30 | | MANAGEMENT’S DISCUSSION AND ANALYSIS |
Acacia Mining plc (100% basis), Africa
| | | | | | | | | | | | |
| Summary of Operating Data | | | | | For the three months ended March 31 | |
| | | 2016 | | | 2015 | | | % Change | |
Total tonnes mined (000s) | | | 9,407 | | | | 10,153 | | | | (7%) | |
Ore tonnes processed (000s) | | | 2,488 | | | | 2,075 | | | | 20% | |
Average grade (grams/tonne) | | | 2.80 | | | | 3.10 | | | | (10%) | |
Gold produced (000s/oz) | | | 190 | | | | 182 | | | | 4% | |
Gold sold (000s/oz) | | | 184 | | | | 172 | | | | 7% | |
Cost of sales ($ millions)2 | | | $ 169 | | | | $ 174 | | | | (3%) | |
Cash costs (per oz) | | | $ 693 | | | | $ 783 | | | | (11%) | |
All-in sustaining costs (per oz) | | | $ 959 | | | | $ 1,117 | | | | (14%) | |
All-in costs (per oz) | | | $ 960 | | | | $ 1,122 | | | | (14%) | |
| | |
| Summary of Financial Data | | | | | For the three months ended March 31 | |
| | | 2016 | | | 2015 | | | % Change | |
Segment EBIT ($ millions) | | | $ 40 | | | | $ 33 | | | | 21% | |
Segment EBITDA ($ millions) | | | $ 76 | | | | $ 66 | | | | 15% | |
Capital expenditures ($ millions) | | | $ 34 | | | | $ 41 | | | | (17%) | |
Minesite sustaining | | | $ 34 | | | | $ 40 | | | | (15%) | |
Project capex | | | - | | | | $ 1 | | | | (100%) | |
Financial Results
Acacia’s EBIT for first quarter 2016 was 21% higher than the same prior year period primarily due to an increase in sales volume and a decrease in cost of sales, partially offset by a lower realized gold price.
In first quarter 2016, gold production was 4% higher than the same prior year period primarily due to an increase in production at Bulyanhulu, partially offset by decreased production at Buzwagi. In first quarter 2016, production at Bulyanhulu increased 27% compared to the same prior year period primarily due to higher grades and increased production from the CIL plant due to a significant increase in throughput. Production at North Mara in first quarter 2016 was in line with the same prior year period as an increase in throughput and higher recoveries were offset by lower grades. Production at Buzwagi decreased 16% compared to the same prior year period primarily due to a reduction in grade as the mine focused its efforts on waste stripping.
Cost of sales for 2016 was 3% lower than the same prior year period primarily due to lower labor costs as a result of headcount reductions and lower energy and fuel costs due to lower diesel prices. Cash costs per ounce were 11% lower than the same prior year period primarily reflecting the lower cost of sales and the impact of higher sales volume on unit production costs. All-in sustaining costs were 14% lower than the same prior year period due to lower cash costs combined with a decrease in minesite sustaining capital expenditures.
In first quarter 2016, capital expenditures decreased by 17% compared to the same prior year period. The decrease was primarily due to a reduction in minesite sustaining capital expenditures at Bulyanhulu.
We continue to expect Acacia’s 2016 gold production to be in the range of 480 to 500 thousand ounces (Barrick’s share), at cash costs in the range of $670 to $700 per ounce, and all-in sustaining costs are expected to be $950 to $980 per ounce.
| | | | |
| BARRICK FIRST QUARTER 2016 | | 31 | | MANAGEMENT’S DISCUSSION AND ANALYSIS |
COMMITMENTS AND CONTINGENCIES
Litigation and Claims
We are currently subject to various litigation proceedings as disclosed in note 15 to the Financial Statements, and we may be involved in disputes with other parties in the future that may result in litigation. If we are unable to resolve these disputes favorably, it may have a material adverse impact on our financial condition, cash flow and results of operations.
Contractual Obligations and Commitments
| | | | | | | | | | | | | | | | | | | | | | | | | | | | |
| | | Payments due As at March 31, 2016 | | | | | | | |
| | | | | | | |
| ($ millions) | | 20161 | | | 2017 | | | 2018 | | | 2019 | | | 2020 | | | 2021 and thereafter | | | Total | |
Debt2 | | | | | | | | | | | | | | | | | | | | | | | | | | | | |
Repayment of principal | | | $ 90 | | | | $ 116 | | | | $ 494 | | | | $395 | | | | $ 337 | | | | $ 7,622 | | | | $ 9,054 | |
Capital leases | | | 30 | | | | 37 | | | | 30 | | | | 16 | | | | 9 | | | | 19 | | | | 141 | |
Interest | | | 445 | | | | 490 | | | | 484 | | | | 448 | | | | 429 | | | | 5,822 | | | | 8,118 | |
Provisions for environmental rehabilitation3 | | | 66 | | | | 60 | | | | 56 | | | | 95 | | | | 103 | | | | 1,840 | | | | 2,220 | |
Operating leases | | | 17 | | | | 19 | | | | 14 | | | | 10 | | | | 7 | | | | 15 | | | | 82 | |
Restricted share units | | | 18 | | | | 32 | | | | 5 | | | | 7 | | | | - | | | | - | | | | 62 | |
Pension benefits and other post-retirement benefits | | | 16 | | | | 20 | | | | 20 | | | | 20 | | | | 20 | | | | 371 | | | | 467 | |
Derivative liabilities4 | | | 117 | | | | 73 | | | | 36 | | | | 3 | | | | - | | | | - | | | | 229 | |
Purchase obligations for supplies and consumables5 | | | 480 | | | | 223 | | | | 125 | | | | 71 | | | | 66 | | | | 126 | | | | 1,091 | |
Capital commitments6 | | | 66 | | | | 8 | | | | 6 | | | | 4 | | | | 4 | | | | 4 | | | | 92 | |
Social development costs7 | | | 26 | | | | 3 | | | | 3 | | | | 3 | | | | 3 | | | | 182 | | | | 220 | |
| | | | | | | |
Total | | | $ 1,371 | | | | $ 1,081 | | | | $ 1,273 | | | | $ 1,072 | | | | $ 978 | | | | $ 16,001 | | | | $ 21,776 | |
| | 1 | Represents the obligations and commitments for the remainder of the year. |
| | 2 | Debt and Interest - Our debt obligations do not include any subjective acceleration clauses or other clauses that enable the holder of the debt to call for early repayment, except in the event that we breach any of the terms and conditions of the debt or for other customary events of default. The debt and interest amounts include 100% of the Pueblo Viejo financing, even though our attributable share is 60 percent of this total, consistent with our ownership interest in the mine. We are not required to post any collateral under any debt obligations. Projected interest payments on variable rate debt were based on interest rates in effect at March 31, 2016. Interest is calculated on our long-term debt obligations using both fixed and variable rates. |
| | 3 | Provisions for Environmental Rehabilitation - Amounts presented in the table represent the undiscounted uninflated future payments for the expected cost of provisions for environmental rehabilitation. |
| | 4 | Derivative Liabilities - Amounts presented in the table relate to derivative contracts disclosed under note 24 to the 2015 Annual Report. Payments related to derivative contracts may be subject to change given variable market conditions. |
| | 5 | Purchase Obligations for Supplies and Consumables - Includes commitments related to new purchase obligations to secure a supply of acid, tires and cyanide for our production process. |
| | 6 | Capital Commitments - Purchase obligations for capital expenditures include only those items where binding commitments have been entered into. |
| | 7 | Social Development Costs - Includes Pascua-Lama’s commitment related to the potential funding of a power transmission line in Argentina of $114 million, which is not expected to be paid prior to 2021. |
| | | | |
| BARRICK FIRST QUARTER 2016 | | 32 | | MANAGEMENT’S DISCUSSION AND ANALYSIS |
REVIEW OF QUARTERLY RESULTS
Quarterly Information1
| | | | | | | | | | | | | | | | | | | | | | | | | | | | | | | | |
| | | 2016 | | | | | | 2015 | | | | | | | | | | | | 2014 | | | | |
| ($ millions, except where indicated) | | Q1 | | | Q4 | | | Q3 | | | Q2 | | | Q1 | | | Q4 | | | Q3 | | | Q2 | |
Revenues | | | $ 1,930 | | | | $ 2,238 | | | | $ 2,315 | | | | $ 2,231 | | | | $ 2,245 | | | | $ 2,510 | | | | $ 2,624 | | | | $ 2,458 | |
Realized price per ounce - gold2 | | | 1,181 | | | | 1,105 | | | | 1,125 | | | | 1,190 | | | | 1,219 | | | | 1,204 | | | | 1,285 | | | | 1,289 | |
Realized price per pound - copper2 | | | 2.18 | | | | 2.16 | | | | 2.18 | | | | 2.66 | | | | 2.55 | | | | 2.91 | | | | 3.09 | | | | 3.17 | |
Cost of sales | | | 1,324 | | | | 1,768 | | | | 1,742 | | | | 1,689 | | | | 1,708 | | | | 1,799 | | | | 1,681 | | | | 1,631 | |
Net earnings (loss) | | | (83) | | | | (2,622) | | | | (264) | | | | (9) | | | | 57 | | | | (2,851) | | | | 125 | | | | (269) | |
Per share (dollars)2,3 | | | (0.07) | | | | (2.25) | | | | (0.23) | | | | (0.01) | | | | 0.05 | | | | (2.45) | | | | 0.11 | | | | (0.23) | |
Adjusted net earnings2 | | | 127 | | | | 91 | | | | 131 | | | | 60 | | | | 62 | | | | 174 | | | | 222 | | | | 159 | |
Per share (dollars)2,3 | | | 0.11 | | | | 0.08 | | | | 0.11 | | | | 0.05 | | | | 0.05 | | | | 0.15 | | | | 0.19 | | | | 0.14 | |
Operating cash flow4 | | | 451 | | | | 698 | | | | 1,255 | | | | 525 | | | | 316 | | | | 371 | | | | 852 | | | | 488 | |
Free cash flow2 | | | $ 181 | | | | $ 387 | | | | $ 866 | | | | $ 26 | | | | ($ 198) | | | | ($ 176) | | | | $ 199 | | | | ($ 128) | |
| | 1 | Sum of all the quarters may not add up to the annual total due to rounding. |
| | 2 | Calculated using weighted average number of shares outstanding under the basic method of earnings per share. |
| | 3 | Realized price, adjusted net earnings, adjusted EPS and adjusted operating cash flow are non-GAAP financial performance measures with no standard meaning under IFRS. For further information and a detailed reconciliation, please see pages 35 - 40 of this MD&A. |
| | 4 | Q3 2015 includes $610 million of proceeds from the gold and silver streaming transaction with Royal Gold. |
Our recent financial results reflect our emphasis on cost control and maximizing free cash flow. While gold prices have fluctuated around $1,200 per ounce we have been able to reduce all-in sustaining costs and record positive free cash flow in four consecutive quarters. In fourth quarter 2015, we recorded asset and goodwill impairments of $2.6 billion (net of tax effects and non-controlling interests), primarily related to our Pueblo Viejo, and Goldstrike mines and Pascua-Lama project. In third quarter 2015, we recorded a goodwill impairment charge of $476 million relating to our Zaldívar mine upon reclassification of the mine’s net assets as held-for-sale
as the agreed selling price was lower than previously recognized carrying values. In fourth quarter 2014, we recorded asset and goodwill impairments of $2.8 billion (net of tax effects and non-controlling interests), primarily at Lumwana, Zaldívar and Cerro Casale. The net loss in second quarter 2014 reflected asset and goodwill impairment charges of $514 million relating to Jabal Sayid as a result of classifying the project as held-for-sale.
| | | | |
| BARRICK FIRST QUARTER 2016 | | 33 | | MANAGEMENT’S DISCUSSION AND ANALYSIS |
INTERNAL CONTROL OVER FINANCIAL REPORTING AND DISCLOSURE CONTROLS AND PROCEDURES
Management is responsible for establishing and maintaining adequate internal control over financial reporting and disclosure controls and procedures as defined in our 2015 annual MD&A.
Together, the internal control over financial reporting and disclosure controls and procedures frameworks provide internal control over financial reporting and disclosure. Due to its inherent limitations, internal control over financial reporting and disclosure may not prevent or detect all misstatements. Further, the effectiveness of internal control is subject to the risk that controls may become inadequate because of changes in conditions, or that the degree of compliance with policies or procedures may change.
Management will continue to monitor the effectiveness of its internal control over financial reporting and disclosure controls and procedures including those related to our management structure refinements and may make modifications from time to time as considered necessary.
IFRS CRITICAL ACCOUNTING POLICIES AND ACCOUNTING ESTIMATES
Management has discussed the development and selection of our critical accounting estimates with the Audit Committee of the Board of Directors, and the Audit Committee has reviewed the disclosure relating to such estimates in conjunction with its review of this MD&A. The accounting policies and methods we utilize determine how we report our financial condition and results of operations, and they may require management to make estimates or rely on assumptions about matters that are inherently uncertain. The consolidated financial statements have been prepared in accordance with International Financial Reporting Standards (“IFRS”) as issued by the International Accounting Standards Board (“IASB”) under the historical cost convention, as modified by revaluation of certain financial assets, derivative contracts and post-retirement assets. Our significant accounting policies are disclosed in note 2 of the
consolidated financial statements, including a summary of current and future changes in accounting policies.
Critical Accounting Estimates and Judgments
Certain accounting estimates have been identified as being “critical” to the presentation of our financial condition and results of operations because they require us to make subjective and/or complex judgments about matters that are inherently uncertain; or there is a reasonable likelihood that materially different amounts could be reported under different conditions or using different assumptions and estimates. Our significant accounting judgments, estimates and assumptions are disclosed in note 3 of the accompanying financial statements.
| | | | |
| BARRICK FIRST QUARTER 2016 | | 34 | | MANAGEMENT’S DISCUSSION AND ANALYSIS |
NON GAAP FINANCIAL PERFORMANCE MEASURES
We use certain non-GAAP financial performance measures in our MD&A. For a detailed description of each of the non-GAAP measures used in this MD&A, please refer to the Non-GAAP Financial Performance Measures in our 2015 annual MD&A. The non-GAAP financial performance measures set out in this MD&A are
intended to provide additional information to investors and do not have any standardized definition under IFRS and should not be considered in isolation or as a substitute for measures of performance prepared in accordance with IFRS.
Reconciliation of Net Earnings to Adjusted Net Earnings and Adjusted Net Earnings per Share1
| | | | | | | | | | |
| ($ millions, except per share amounts in dollars) | | For the three months ended March 31 | |
| | | | | 2016 | | | 2015 | |
Net earnings (loss) attributable to equity holders of the Company | | | $ (83) | | | | $ 57 | |
Impairment charges related to intangibles, goodwill, property, plant and equipment, and investments2 | | | 1 | | | | 3 | |
Acquisition/disposition (gains)/losses3 | | | 3 | | | | (22) | |
Foreign currency translation losses4 | | | 119 | | | | 6 | |
Tax adjustments5 | | | 45 | | | | - | |
Other expense adjustments6 | | | 46 | | | | 18 | |
Unrealized gains on non-hedge derivative instruments7 | | | (4) | | | | - | |
Adjusted net earnings | | | $ 127 | | | | $ 62 | |
Net earnings (loss) per share8 | | | (0.07) | | | | 0.05 | |
Adjusted net earnings per share8 | | | 0.11 | | | | 0.05 | |
| | 1 | Amounts presented in this table are after-tax and net of non-controlling interest. |
| | 2 | Impairment charges for the three months March 31, 2016 is presented net of tax and non-controlling interest $nil (2015: ($2) million benefit). |
| | 3 | Acquisition/disposition (gains)/losses for the three months ended March 31, 2016 is presented net of tax and non-controlling interest ($5) million benefit (2015: $2 million expense). |
| | 4 | Foreign currency translation losses for the three months ended March 31, 2016 is presented net of tax and non-controlling interest ($1) million benefit (2015: $1 million expense). |
| | 5 | Tax adjustments for the three months ended March 31, 2016 is presented net of non-controlling interest $25 million (2015: $nil). |
| | 6 | Other expense adjustments for the three months ended March 31, 2016 is presented net of tax and non-controlling interest ($21) million benefit (2015: ($7) million benefit). |
| | 7 | Unrealized losses/(gains) on non-hedge derivative instruments for the three months ended March 31, 2016 is presented net of tax and non-controlling interest $1 million expense (2015: $nil). |
| | 8 | Calculated using weighted average number of shares outstanding under the basic method of earnings per share. |
Reconciliation of Operating Cash Flow to Free Cash Flow
| | | | | | | | |
| ($ millions) | | For the three months ended March 31 | |
| | | 2016 | | | 2015 | |
Operating cash flow | | | $ 451 | | | | $ 316 | |
Capital expenditures | | | (270) | | | | (514) | |
Free cash flow | | | $ 181 | | | | ($ 198) | |
| | | | |
| BARRICK FIRST QUARTER 2016 | | 35 | | MANAGEMENT’S DISCUSSION AND ANALYSIS |
Reconciliation of Gold Cost of Sales to Cash costs per ounce, All-in sustaining costs per ounce and All-in costs per ounce
| | | | | | | | | | | | | | |
| ($ millions, except per ounce information in dollars) | | | | | For the three months ended March 31 | |
| | | | | Reference | | | 2016 | | | 2015 | |
| | Cost of sales | | | A | | | | $ 1,200 | | | | $ 1,424 | |
| | Cost of sales applicable to non-controlling interests1 | | | B | | | | (114) | | | | (158) | |
| | Cost of sales applicable to power sales | | | C | | | | (5) | | | | (13) | |
| | Other metal sales | | | D | | | | (33) | | | | (39) | |
| | Realized (gains)/losses on hedge and non-hedge | | | E | | | | 31 | | | | - | |
| | Non-recurring items2 | | | | | | | (10) | | | | - | |
| | Treatment and refinement charges | | | F | | | | 4 | | | | 3 | |
| | Impact of Pierina6 | | | | | | | (19) | | | | - | |
| | Total production costs | | | | | | | $ 1,054 | | | | $ 1,217 | |
| | Depreciation | | | G | | | | ($ 334) | | | | ($ 328) | |
| | Cash costs | | | | | | | $ 720 | | | | $ 889 | |
| | General & administrative costs | | | H | | | | 48 | | | | 55 | |
| | Rehabilitation - accretion and amortization (operating sites) | | | I | | | | 15 | | | | 35 | |
| | Mine on-site exploration and evaluation costs | | | J | | | | 5 | | | | 6 | |
| | Mine development expenditures3 | | | K | | | | 75 | | | | 166 | |
| | Sustaining capital expenditures3 | | | K | | | | 64 | | | | 133 | |
| | Impact of Pierina6 | | | | | | | (6) | | | | - | |
| | All-in sustaining costs | | | | | | | $ 921 | | | | $ 1,284 | |
| | Community relations costs not related to current operations | | | L | | | | 2 | | | | 3 | |
| | Rehabilitation - accretion and amortization not related to current operations | | | I | | | | 2 | | | | 2 | |
| | Exploration and evaluation costs (non-sustaining) | | | J | | | | 23 | | | | 35 | |
| | Project capital expenditures3 | | | | | | | | | | | | |
| | Pascua-Lama | | | K | | | | 1 | | | | 4 | |
| | �� Cortez Lower Zone | | | K | | | | 5 | | | | 12 | |
| | Goldstrike thiosulfate project | | | K | | | | - | | | | 29 | |
| | Bulyanhulu CIL | | | K | | | | - | | | | 1 | |
| | Hemlo land acquisition | | | K | | | | - | | | | 37 | |
| | Arturo | | | K | | | | 32 | | | | 6 | |
| | Other | | | K | | | | 2 | | | | 5 | |
| | All-in costs | | | | | | | $ 988 | | | | $ 1,418 | |
| | Ounces sold - consolidated basis (000s ounces) | | | | | | | 1,485 | | | | 1,584 | |
| | Ounces sold - non-controlling interest (000s ounces)1 | | | | | | | (179) | | | | (199) | |
| | Ounces sold - equity basis (000s ounces) | | | | | | | 1,306 | | | | 1,385 | |
| | Total production costs per ounce4 | | | | | | | $ 805 | | | | $ 879 | |
| | Cash costs per ounce4 | | | | | | | $ 553 | | | | $ 642 | |
| | Cash costs per ounce (on a co-product basis)4,5 | | | | | | | $ 577 | | | | $ 671 | |
| | All-in sustaining costs per ounce4 | | | | | | | $ 706 | | | | $ 927 | |
| | All-in sustaining costs per ounce (on a co-product basis)4,5 | | | | | | | $ 730 | | | | $ 956 | |
| | All-in costs per ounce4 | | | | | | | $ 758 | | | | $ 1,024 | |
| | All-in costs per ounce (on a co-product basis)4,5 | | | | | | | $ 782 | | | | $ 1,053 | |
| | 1 | Amounts represent our share of capital expenditures. |
| | 2 | Non-recurring items consist of $10 million in abnormal costs at Veladero. These costs are not indicative of our cost of production and have been excluded from the calculation of cash costs. |
| | 3 | Amounts represent our share of capital expenditures. |
| | 4 | Total production costs, cash costs, all-in sustaining costs, and all-in costs per ounce may not calculate based on amounts presented in this table due to rounding. |
| | 5 | Amounts presented on a co-product basis remove the impact of other metal sales (net of non-controlling interest) from cost per ounce calculations that are produced as a by-product of our gold production. |
| | 6 | 2016 figures exclude Pierina from ounces sold and the calculation of cash costs per ounce, all-in sustaining costs, and all-in costs per ounce. |
| | | | |
| BARRICK FIRST QUARTER 2016 | | 36 | | MANAGEMENT’S DISCUSSION AND ANALYSIS |
| | | | | | | | | | |
| |
| ($ millions, except per ounce information in dollars) | | For the three months ended March 31 | |
| | | | |
| | | | | 2016 | | | 2015 | |
| | References | | | | | | | | |
A | | Cost of sales - gold | | | | | | | | |
| | Cost of sales (statement of income) | | | $ 1,324 | | | | $ 1,708 | |
| | Less: cost of sales - copper | | | (90) | | | | (251) | |
| | Direct mining, royalties and community relations | | | 79 | | | | 214 | |
| | Depreciation | | | 11 | | | | 37 | |
| | Hedge gains | | | - | | | | - | |
| | Less: cost of sales - non-operating sites | | | - | | | | (2) | |
| | Less: cost of sales - corporate | | | (34) | | | | (31) | |
| | Total Cost of Sales - Gold | | | $ 1,200 | | | | 1,424 | |
| | | |
B | | Cost of sales applicable to non-controlling interests | | | | | | | | |
| | Cost of sales applicable to Acacia (Note 5) | | | | | | | | |
| | Direct mining, royalties and community relations | | | $ 133 | | | | $ 141 | |
| | Depreciation | | | 36 | | | | 33 | |
| | Total related to Acacia | | | $ 169 | | | | $ 174 | |
| | Portion attributable to non-controlling interest | | | $ 58 | | | | $ 61 | |
| | Cost of sales applicable to Pueblo Viejo (Note 5) | | | | | | | | |
| | Direct mining, royalties and community relations | | | $ 124 | | | | $ 162 | |
| | Depreciation | | | 43 | | | | 69 | |
| | Total related to Pueblo Viejo | | | $ 167 | | | | $ 231 | |
| | Portion attributable to non-controlling interest | | | $ 56 | | | | $ 97 | |
| | Cost of sales applicable to non-controlling interests | | | $ 114 | | | | $ 158 | |
| | | |
C | | Cost of sales applicable to power sales | | | | | | | | |
| |
| | Equal to the cost of sales related to power sales from our Pueblo Viejo mine that are included in consolidated cost of sales but excluded from cash costs. These figures cannot be tied directly to the financial statements or notes. | |
| | | |
D | | Other metal sales | | | | | | | | |
| |
| | By-product revenues from metals produced in conjunction with gold are deducted from the costs incurred to produce gold (Note 6). By product revenues from metals produced net of copper, power revenues and non-controlling interest for the three months ended March 31, 2016 were $24 million (2015: $23 million). | |
| | | |
E | | Realized gains/losses on hedge and non-hedge | | | | | | | | |
| | Realized (gains)/losses on non-hedge derivatives | | | $ 31 | | | | $ - | |
| | Realized (gains)/losses on hedge derivatives | | | - | | | | - | |
| | Realized (gains)/losses on hedge and non-hedge | | | $ 31 | | | | $ - | |
| | | |
F | | Treatment and refinement charges | | | | | | | | |
| |
| | Treatment and refinement charges, which are recorded against concentrate revenues, for the three months ended March 31, 2016 were $4 million (2015: $3 million). | |
| | | | |
| BARRICK FIRST QUARTER 2016 | | 37 | | MANAGEMENT’S DISCUSSION AND ANALYSIS |
| | | | | | | | | | |
| ($ millions, except per ounce information in dollars) | | For the three months ended March 31 | |
| | | | |
| | | | | 2016 | | | 2015 | |
G | | Depreciation - gold | | | | | | | | |
| | Depreciation | | | $ 386 | | | | $ 421 | |
| | Less: copper depreciation | | | (11) | | | | (37) | |
| | Less: NCI portion | | | (29) | | | | (45) | |
| | Less: Pierina6 | | | (4) | | | | - | |
| | Less: Depreciation - corporate assets | | | (8) | | | | (11) | |
| | Total depreciation - gold | | | $ 334 | | | | $ 328 | |
| | | |
H | | General & administrative costs | | | | | | | | |
| | Total general & administrative costs (statement of income) | | | $ 58 | | | | $ 67 | |
| | Less: non-gold and non-operating general & administrative costs | | | (7) | | | | (7) | |
| | Less: NCI portion | | | (3) | | | | (4) | |
| | Add: World Gold Council fees | | | - | | | | - | |
| | Less: non-recurring items | | | - | | | | (1) | |
| | Total general & administrative costs | | | $ 48 | | | | $ 55 | |
| | | |
I | | Rehabilitation - accretion and amortization | | | | | | | | |
| |
| | Includes depreciation on the assets related to rehabilitation provisions of our gold operations of $3 million for the three months ended March 31, 2016 (2015: $23 million) and accretion on the rehabilitation provision of our gold operations of $9 million for the three months ended March 31, 2016 (2015: $14 million). | |
| | | |
J | | Exploration and evaluation costs | | | | | | | | |
| | Exploration and evaluation costs | | | $ 30 | | | | $ 45 | |
| | Less: exploration and evaluation costs - non-gold & NCI | | | (2) | | | | (4) | |
| | Total exploration and evaluation costs - gold | | | $ 28 | | | | $ 41 | |
| | Exploration & evaluation costs (sustaining) | | | 5 | | | | 6 | |
| | Exploration and evaluation costs (non-sustaining) | | | 23 | | | | 35 | |
| | Total exploration and evaluation costs - gold | | | $ 28 | | | | $ 41 | |
| | | |
K | | Capital expenditures | | | | | | | | |
| | Gold segments (Note 5) | | | $ 193 | | | | $ 423 | |
| | Pascua-Lama operating unit (Note 5) | | | 1 | | | | 4 | |
| | Other gold projects | | | 6 | | | | 2 | |
| | Capital expenditures - gold | | | $ 200 | | | | $ 429 | |
| | Less: NCI portion | | | (21) | | | | (27) | |
| | Less: capitalized interest | | | - | | | | (9) | |
| | Total capital expenditures - gold | | | $ 179 | | | | $ 393 | |
| | Mine development expenditures | | | 75 | | | | 166 | |
| | Sustaining capital expenditures | | | 64 | | | | 133 | |
| | Non-sustaining capital expenditures | | | 40 | | | | 94 | |
| | Total capital expenditures - gold | | | $ 179 | | | | $ 393 | |
| | | | |
| BARRICK FIRST QUARTER 2016 | | 38 | | MANAGEMENT’S DISCUSSION AND ANALYSIS |
| | | | | | | | | | |
| ($ millions, except per ounce information in dollars) | | For the three months ended March 31 | |
| | | | |
| | | | | 2016 | | | 2015 | |
L | | Community relations costs | | | | | | | | |
| | Community relations costs | | | $ 9 | | | | $ 11 | |
| | Less: community relations costs relating to current operations | | | (7) | | | | (8) | |
| | Community relations costs not related to current operations | | | $ 2 | | | | $ 3 | |
Reconciliation of Copper Cost of Sales to C1 cash costs per pound and All-in sustaining costs per pound
| | | | | | | | |
| ($ millions, except per pound information in dollars) | | For the three months ended March 31 | |
| | | 2016 | | | 2015 | |
Cost of sales | | | $ 89 | | | | $ 251 | |
Depreciation/amortization | | | (11) | | | | (37) | |
Treatment and refinement charges | | | 46 | | | | 42 | |
Cost of sales applicable to equity method investments1 | | | 41 | | | | - | |
Less: royalties | | | (14) | | | | (34) | |
Other | | | - | | | | 1 | |
C1 cash cost of sales | | | $ 151 | | | | $ 223 | |
General & administrative costs | | | 7 | | | | 6 | |
Rehabilitation - accretion and amortization | | | 1 | | | | 2 | |
Royalties | | | 14 | | | | 34 | |
Mine development expenditures | | | 25 | | | | 19 | |
Sustaining capital expenditures | | | 5 | | | | 7 | |
All-in sustaining costs | | | $ 203 | | | | $ 291 | |
Pounds sold - consolidated basis (millions pounds) | | | 103 | | | | 121 | |
C1 cash cost per pound2 | | | $ 1.47 | | | | $ 1.84 | |
All-in sustaining costs per pound2 | | | $ 1.97 | | | | $ 2.40 | |
| | 1 | 2016 figures include $41 million of cash costs related to our 50% share of Zaldívar due to the divestment of 50% of our interest in the mine on December 1 , 2015 and subsequent accounting as an equity method investment. |
| | 2 | C1 cash costs per pound and all-in sustaining costs per pound may not calculate based on amounts presented in this table due to rounding. |
| | | | |
| BARRICK FIRST QUARTER 2016 | | 39 | | MANAGEMENT’S DISCUSSION AND ANALYSIS |
Reconciliation of Net Earnings to EBITDA and Adjusted EBITDA
| | | | | | | | |
($ millions, except per share amounts in dollars) | | | For the three months ended March 31 | |
| | | 2016 | | | 2015 | |
Net earnings (loss) | | | $ (72) | | | | $ 89 | |
Income tax expense | | | 186 | | | | 105 | |
Finance costs, net1 | | | 197 | | | | 178 | |
Depreciation | | | 385 | | | | 421 | |
EBITDA | | | $ 696 | | | | $ 793 | |
Impairment charges | | | 1 | | | | 5 | |
Adjusted EBITDA | | | $ 697 | | | | $ 798 | |
Reported as: | | | | | | | | |
Cortez | | | $ 212 | | | | $ 61 | |
Goldstrike | | | 134 | | | | 118 | |
Pueblo Viejo | | | 226 | | | | 206 | |
Lagunas Norte | | | 83 | | | | 145 | |
Veladero | | | 72 | | | | 99 | |
Turquoise Ridge | | | 26 | | | | 29 | |
Acacia | | | 76 | | | | 66 | |
Other | | | (132) | | | | 74 | |
Impairment charges | | | (1) | | | | (5) | |
EBITDA | | | $ 696 | | | | $ 793 | |
Impairment charges | | | 1 | | | | 5 | |
Adjusted EBITDA | | | $ 697 | | | | $ 798 | |
| | 1 | Finance costs exclude accretion. |
Reconciliation of Sales to Realized Price per ounce/pound
| | | | | | | | | | | | | | | | | | |
| | | | | | | | | For the three months ended March 31 | |
| ($ millions, except per ounce/pound information in dollars) | | Gold | | | | | Copper | |
| | | 2016 | | | 2015 | | | | | 2016 | | | 2015 | |
Sales | | | $ 1,768 | | | | $ 1,919 | | | | | | $ 124 | | | | $ 267 | |
Sales applicable to non-controlling interests | | | (211) | | | | (243) | | | | | | - | | | | - | |
Sales applicable to equity method investments1 | | | - | | | | - | | | | | | 55 | | | | - | |
Sales applicable to Pierina2 | | | (22) | | | | - | | | | | | - | | | | - | |
Treatment and refinement charges | | | 4 | | | | 3 | | | | | | 46 | | | | 42 | |
Export duties | | | 2 | | | | 10 | | | | | | - | | | | - | |
Revenues - as adjusted | | | $ 1,541 | | | | $ 1,689 | | | | | | $ 225 | | | | $ 309 | |
Ounces/pounds sold (000s ounces/millions pounds)2 | | | 1,306 | | | | 1,385 | | | | | | 103 | | | | 121 | |
Realized gold/copper price per ounce/pound3 | | | $1,181 | | | | $ 1,219 | | | | | | $2.18 | | | | $ 2.55 | |
| | 1 | Represents sales applicable to our 50% equity method investment in Zaldívar effective December 1, 2015 and subsequent accounting as an equity method investment. |
| | 2 | 2016 figures exclude Pierina from the calculation of realized price per ounce. |
| | 3 | Realized price per ounce/pound may not calculate based on amounts presented in this table due to rounding. |
| | | | |
| BARRICK FIRST QUARTER 2016 | | 40 | | MANAGEMENT’S DISCUSSION AND ANALYSIS |
Consolidated Statements of Income
| | | | | | | | |
| Barrick Gold Corporation | | Three months ended | |
| (in millions of United States dollars, except per share data) (Unaudited) | | March 31, | |
| | | 2016 | | | 2015 | |
| | |
Revenue (notes 5 and 6) | | $ | 1,930 | | | $ | 2,245 | |
Costs and expenses (income) | | | | | | | | |
Cost of sales (note 5) | | | 1,324 | | | | 1,708 | |
General and administrative expenses | | | 58 | | | | 67 | |
Exploration, evaluation and project expenses | | | 55 | | | | 86 | |
Impairment charges | | | 1 | | | | 5 | |
Loss (gain) on currency translation (note 8B) | | | 139 | | | | (2 | ) |
Closed mine rehabilitation | | | 23 | | | | 8 | |
Gain from equity investees | | | (5 | ) | | | - | |
(Gain) loss on non-hedge derivatives | | | (4 | ) | | | 3 | |
Other expense (income) (note 8A) | | | 14 | | | | (18 | ) |
Income before finance costs and income taxes | | $ | 325 | | | $ | 388 | |
Finance costs, net | | | (211 | ) | | | (194 | ) |
Income before income taxes | | $ | 114 | | | $ | 194 | |
Income tax expense (note 9) | | | (186 | ) | | | (105 | ) |
Net income (loss) | | $ | (72 | ) | | $ | 89 | |
Attributable to: | | | | | | | | |
Equity holders of Barrick Gold Corporation | | $ | (83 | ) | | $ | 57 | |
Non-controlling interests (note 14) | | $ | 11 | | | $ | 32 | |
|
Earnings (loss) per share data attributable to the equity holders of Barrick Gold Corporation (note 7) | |
Net income (loss) | | | | | | | | |
Basic | | $ | (0.07 | ) | | $ | 0.05 | |
Diluted | | $ | (0.07 | ) | | $ | 0.05 | |
The accompanying notes are an integral part of these condensed interim consolidated financial statements.
| | | | |
| BARRICK FIRST QUARTER 2016 | | 41 | | FINANCIAL STATEMENTS (UNAUDITED) |
Consolidated Statements of Comprehensive Income
| | | | | | | | |
| Barrick Gold Corporation | | Three months ended | |
| (in millions of United States dollars) (Unaudited) | | March 31, | |
| | | 2016 | | | 2015 | |
Net income (loss) | | $ | (72 | ) | | $ | 89 | |
Other comprehensive income (loss), net of taxes | | | | | | | | |
| | |
Movement in equity investments fair value reserve: | | | | | | | | |
Net unrealized change on equity investments, net of tax $nil and $nil | | | 1 | | | | (5 | ) |
Net realized change on equity investments, net of tax $nil and $nil | | | - | | | | 17 | |
| | |
Items that may be reclassified subsequently to profit or loss: | | | | | | | | |
Unrealized gains (losses) on derivatives designated as cash flow hedges, net of tax $1 and $14 | | | (10 | ) | | | (57 | ) |
Realized losses on derivatives designated as cash flow hedges, net of tax ($2) and ($1) | | | 18 | | | | 15 | |
Currency translation adjustments, net of tax $nil and $nil | | | 91 | | | | (32 | ) |
Total other comprehensive income (loss) | | | 100 | | | | (62 | ) |
Total comprehensive income | | $ | 28 | | | $ | 27 | |
Attributable to: | | | | | | | | |
Equity holders of Barrick Gold Corporation | | $ | 17 | | | $ | (5 | ) |
Non-controlling interests | | $ | 11 | | | $ | 32 | |
The accompanying notes are an integral part of these condensed interim consolidated financial statements.
| | | | |
| BARRICK FIRST QUARTER 2016 | | 42 | | FINANCIAL STATEMENTS (UNAUDITED) |
Consolidated Statements of Cash Flow
| | | | | | | | |
| Barrick Gold Corporation | | Three months ended | |
| (in millions of United States dollars) (Unaudited) | | | | | March 31, | |
| | | 2016 | | | 2015 | |
OPERATING ACTIVITIES | | | | | | | | |
Net income (loss) | | $ | (72 | ) | | $ | 89 | |
Adjusted for the following items: | | | | | | | | |
Depreciation | | | 385 | | | | 421 | |
Finance costs | | | 215 | | | | 196 | |
Impairment charges | | | 1 | | | | 5 | |
Income tax expense (note 9) | | | 186 | | | | 105 | |
Increase in inventory | | | (31 | ) | | | (24 | ) |
(Gain) loss on non-hedge derivatives | | | (4 | ) | | | 3 | |
Loss (gain) on sale of long-lived assets | | | 9 | | | | (24 | ) |
Other operating activities (note 10) | | | (53 | ) | | | (209 | ) |
Operating cash flows before interest and income taxes | | | 636 | | | | 562 | |
Interest paid | | | (67 | ) | | | (75 | ) |
Income taxes paid | | | (118 | ) | | | (171 | ) |
Net cash provided by operating activities | | | 451 | | | | 316 | |
INVESTING ACTIVITIES | | | | | | | | |
Property, plant and equipment | | | | | | | | |
Capital expenditures (note 5) | | | (270 | ) | | | (514 | ) |
Sales proceeds | | | 4 | | | | 12 | |
Divestitures (note 4) | | | 610 | | | | 2 | |
Investments sales | | | - | | | | 33 | |
Other investing activities | | | (3 | ) | | | (1 | ) |
Net cash (used in) provided by investing activities | | | 341 | | | | (468 | ) |
FINANCING ACTIVITIES | | | | | | | | |
Debt | | | | | | | | |
Proceeds | | | 3 | | | | 2 | |
Repayments | | | (853 | ) | | | (184 | ) |
Dividends | | | (22 | ) | | | (58 | ) |
Funding from non-controlling interests | | | 13 | | | | 1 | |
Disbursements to non-controlling interests | | | (31 | ) | | | (44 | ) |
Debt extinguishment costs | | | (37 | ) | | | - | |
Net cash used in financing activities | | | (927 | ) | | | (283 | ) |
Effect of exchange rate changes on cash and equivalents | | | 3 | | | | (6 | ) |
Net decrease in cash and equivalents | | | (132 | ) | | | (441 | ) |
Cash and equivalents at the beginning of period | | | 2,455 | | | | 2,699 | |
Cash and equivalents at the end of period | | $ | 2,323 | | | $ | 2,258 | |
The accompanying notes are an integral part of these condensed interim consolidated financial statements.
| | | | |
| BARRICK FIRST QUARTER 2016 | | 43 | | FINANCIAL STATEMENTS (UNAUDITED) |
Consolidated Balance Sheets
| | | | | | | | |
| Barrick Gold Corporation | | | |
| (in millions of United States dollars) (Unaudited) | | As at March 31, | | | As at December 31, | |
| | | 2016 | | | 2015 | |
ASSETS | | | | | | | | |
Current assets | | | | | | | | |
Cash and equivalents (note 11A) | | $ | 2,323 | | | $ | 2,455 | |
Accounts receivable | | | 288 | | | | 275 | |
Inventories | | | 1,655 | | | | 1,717 | |
Other current assets | | | 254 | | | | 263 | |
Total current assets (excluding assets classified as held for sale) | | $ | 4,520 | | | $ | 4,710 | |
Assets classified as held for sale | | | - | | | | 758 | |
Total current assets | | $ | 4,520 | | | $ | 5,468 | |
| | |
Non-current assets | | | | | | | | |
Equity in investees | | | 1,207 | | | | 1,199 | |
Property, plant and equipment | | | 14,428 | | | | 14,434 | |
Goodwill | | | 1,371 | | | | 1,371 | |
Intangible assets | | | 270 | | | | 271 | |
Deferred income tax assets | | | 1,018 | | | | 1,040 | |
Non-current portion of inventory | | | 1,538 | | | | 1,502 | |
Other assets | | | 1,014 | | | | 1,023 | |
Total assets | | $ | 25,366 | | | $ | 26,308 | |
LIABILITIES AND EQUITY | | | | | | | | |
Current liabilities | | | | | | | | |
Accounts payable | | $ | 1,055 | | | $ | 1,158 | |
Debt (note 11B) | | | 186 | | | | 203 | |
Current income tax liabilities | | | 117 | | | | - | |
Other current liabilities | | | 323 | | | | 337 | |
Total current liabilities (excluding liabilities classified as held for sale) | | $ | 1,681 | | | $ | 1,698 | |
Liabilities classified as held for sale | | | - | | | | 149 | |
Total current liabilities | | $ | 1,681 | | | $ | 1,847 | |
| | |
Non-current liabilities | | | | | | | | |
Debt (note 11B) | | | 8,940 | | | | 9,765 | |
Provisions | | | 2,262 | | | | 2,102 | |
Deferred income tax liabilities | | | 1,472 | | | | 1,553 | |
Other liabilities | | | 1,568 | | | | 1,586 | |
Total liabilities | | $ | 15,923 | | | $ | 16,853 | |
Equity | | | | | | | | |
Capital stock (note 13) | | $ | 20,871 | | | $ | 20,869 | |
Deficit | | | (13,749 | ) | | | (13,642 | ) |
Accumulated other comprehensive loss | | | (270 | ) | | | (370 | ) |
Other | | | 321 | | | | 321 | |
Total equity attributable to Barrick Gold Corporation shareholders | | $ | 7,173 | | | $ | 7,178 | |
Non-controlling interests (note 14) | | | 2,270 | | | | 2,277 | |
Total equity | | $ | 9,443 | | | $ | 9,455 | |
Contingencies and commitments (notes 5 and 15) | | | | | | | | |
Total liabilities and equity | | $ | 25,366 | | | $ | 26,308 | |
The accompanying notes are an integral part of these condensed interim consolidated financial statements.
| | | | |
| BARRICK FIRST QUARTER 2016 | | 44 | | FINANCIAL STATEMENTS (UNAUDITED) |
Consolidated Statements of Changes in Equity
| | | | | | | | | | | | | | | | | | | | | | | | | | | | | | | | |
| Barrick Gold Corporation | | | | | Attributable to equity holders of the company | | | | | | | |
| (in millions of United States dollars) (Unaudited) | | Common Shares
(in thousands) | | | Capital stock | | | Retained
deficit | | | Accumulated
other
comprehensive
income (loss)1 | | | Other2 | | | Total equity
attributable to
shareholders | | | Non-controlling interests | | | Total equity | |
At January 1, 2016 | | | 1,165,081 | | | $ | 20,869 | | | $ | (13,642 | ) | | $ | (370 | ) | | $ | 321 | | | $ | 7,178 | | | $ | 2,277 | | | $ | 9,455 | |
Net income (loss) | | | - | | | | - | | | | (83 | ) | | | - | | | | - | | | | (83 | ) | | | 11 | | | | (72 | ) |
Total other comprehensive income | | | - | | | | - | | | | - | | | | 100 | | | | - | | | | 100 | | | | - | | | | 100 | |
Total comprehensive income (loss) | | | - | | | | - | | | | (83 | ) | | | 100 | | | | - | | | | 17 | | | | 11 | | | | 28 | |
Transactions with owners | | | | | | | | | | | | | | | | | | | | | | | | | | | | | | | | |
Dividends | | | - | | | | - | | | | (22 | ) | | | - | | | | - | | | | (22 | ) | | | - | | | | (22 | ) |
Funding from non-controlling interests | | | - | | | | - | | | | - | | | | - | | | | - | | | | - | | | | 13 | | | | 13 | |
Other decrease in non-controlling interest | | | - | | | | - | | | | - | | | | - | | | | - | | | | - | | | | (31 | ) | | | (31 | ) |
Dividend reinvestment plan (note 13) | | | 134 | | | | 2 | | | | (2 | ) | | | - | | | | - | | | | - | | | | - | | | | - | |
Total transactions with owners | | | 134 | | | | 2 | | | | (24 | ) | | | - | | | | - | | | | (22 | ) | | | (18 | ) | | | (40 | ) |
At March 31, 2016 | | | 1,165,215 | | | $ | 20,871 | | | $ | (13,749 | ) | | $ | (270 | ) | | $ | 321 | | | $ | 7,173 | | | $ | 2,270 | | | $ | 9,443 | |
| | | | | | | | | | | | | | | | | | | | | | | | | | | | | | | | |
At January 1, 2015 | | | 1,164,670 | | | $ | 20,864 | | | $ | (10,640 | ) | | $ | (298 | ) | | $ | 321 | | | $ | 10,247 | | | $ | 2,615 | | | $ | 12,862 | |
Net income | | | - | | | | - | | | | 57 | | | | - | | | | - | | | | 57 | | | | 32 | | | | 89 | |
Total other comprehensive loss | | | - | | | | - | | | | - | | | | (62 | ) | | | - | | | | (62 | ) | | | - | | | | (62 | ) |
Total comprehensive income (loss) | | | - | | | | - | | | | 57 | | | | (62 | ) | | | - | | | | (5 | ) | | | 32 | | | | 27 | |
Transactions with owners | | | | | | | | | | | | | | | | | | | | | | | | | | | | | | | | |
Dividends | | | - | | | | - | | | | (58 | ) | | | - | | | | - | | | | (58 | ) | | | - | | | | (58 | ) |
Recognition of stock option expense | | | - | | | | 1 | | | | - | | | | - | | | | - | | | | 1 | | | | - | | | | 1 | |
Funding from non-controlling interests | | | - | | | | - | | | | - | | | | - | | | | - | | | | - | | | | 1 | | | | 1 | |
Other decrease in non-controlling interests | | | - | | | | - | | | | - | | | | - | | | | - | | | | - | | | | (44 | ) | | | (44 | ) |
Total transactions with owners | | | - | | | | 1 | | | | (58 | ) | | | - | | | | - | | | | (57 | ) | | | (43 | ) | | | (100 | ) |
At March 31, 2015 | | | 1,164,670 | | | $ | 20,865 | | | $ | (10,641 | ) | | $ | (360 | ) | | $ | 321 | | | $ | 10,185 | | | $ | 2,604 | | | $ | 12,789 | |
1 Includes cumulative translation losses at March 31, 2016: $87 million (March 31, 2015: $154 million).
2 Includes additional paid-in capital as at March 30, 2016: $283 million (December 31, 2015: $283 million; March 31, 2015: $283 million) and convertible borrowings—equity component as at March 31, 2016: $38 million (December 31, 2015: $38 million; March 31, 2015: $38 million).
The accompanying notes are an integral part of these condensed interim consolidated financial statements.
| | | | |
| BARRICK FIRST QUARTER 2016 | | 45 | | FINANCIAL STATEMENTS (UNAUDITED) |
NOTES TO CONSOLIDATED
FINANCIAL STATEMENTS
Barrick Gold Corporation. Tabular dollar amounts in millions of United States dollars, unless otherwise shown. References to A$, ARS, C$, CLP, DOP, EUR, GBP, PGK, SAR, TZS, ZAR, and ZMW are to Australian dollars, Argentine pesos, Canadian dollars, Chilean pesos, Dominican pesos, Euros, British pound sterling, Papua New Guinea kina, Saudi riyal, Tanzanian shillings, South African rand, and Zambian kwacha, respectively.
1 > CORPORATE INFORMATION
Barrick Gold Corporation (“Barrick”, “we” or the “Company”) is a corporation governed by the Business Corporations Act (Ontario). The Company’s head and registered office is located at Brookfield Place, TD Canada Trust Tower, 161 Bay Street, Suite 3700, Toronto, Ontario, M5J 2S1. We are principally engaged in the production and sale of gold and copper, as well as related activities such as exploration and mine development. Our producing gold mines are located in Canada, the United States, Peru, Argentina, Australia and Dominican Republic. We hold a 50% equity interest in Barrick Niugini Limited (“BNL”), which owns a 95% interest in Porgera, a gold mine located in Papua New Guinea. We also hold a 63.9% equity interest in Acacia Mining plc (“Acacia”), a company listed on the London Stock Exchange that owns gold mines and exploration properties in Africa. We have a copper mine that is located in Zambia, a 50% interest in a copper mine in Saudi Arabia, and a 50% interest in Zaldívar, located in Chile. We also have various gold projects located in South America and North America. We sell our gold and copper production into the world market.
2 > SIGNIFICANT ACCOUNTING POLICIES
| A) | Statement of Compliance |
These condensed interim consolidated financial statements have been prepared in accordance with International Accounting Standard 34Interim Financial Reporting (“IAS 34”) as issued by the International Accounting Standards Board (“IASB”). These interim financial statements should be read in conjunction with Barrick’s most recently issued Annual Report which includes information necessary or useful to understanding the Company’s business and financial statement presentation. In particular, the Company’s significant accounting policies were presented in Note 2 of the consolidated financial statements for the year ended December 31, 2015, and have been consistently applied in the preparation of these interim financial statements. These interim consolidated financial
statements were authorized for issuance by the Board of Directors on April 25, 2016.
| B) | New Accounting Standards Issued But Not Yet Effective |
IFRS 15 Revenue from Contracts with Customers
In May 2014, the IASB issued IFRS 15 Revenue from Contracts with Customers, which covers principles that an entity shall apply to report useful information to users of financial statements about the nature, amount, timing, and uncertainty of revenue and cash flows arising from a contract with a customer. In September 2015, the IASB deferred the effective date of the standard to annual reporting periods beginning on or after January 1, 2018, with earlier application permitted. We are currently assessing the impact on our consolidated financial statements along with the planned timing of our adoption of IFRS 15.
IFRS 16 Leases
In January 2016, the IASB issued IFRS 16 Leases, which requires lessees to recognize assets and liabilities for most leases. Application of the standard is mandatory for annual reporting periods beginning on or after January 1, 2019, with earlier application permitted, provided the new revenue standard, IFRS 15 Revenue from Contracts with Customers, has been applied or is applied at the same date as IFRS 16. We are currently assessing the impact on our consolidated financial statements along with timing of our adoption of IFRS 16.
3 > SIGNIFICANT JUDGMENTS, ESTIMATES, ASSUMPTIONS AND RISKS
The judgments, estimates, assumptions and risks discussed here reflect updates from the most recently filed annual consolidated financial statements for the year ended December 31, 2015. For judgments, estimates, assumptions and risks related to other areas not discussed in these interim consolidated financial statements, please refer to Notes 3 and 27 of the 2015 annual consolidated financial statements.
| A) | Provision for Environmental Rehabilitation (“PER”) |
Provisions are updated each reporting period for changes to expected cash flows and for the effect of changes in the discount rate, foreign exchange rate and the change in estimate is added or deducted from the related asset and depreciated over the expected economic life of the
| | | | |
| BARRICK FIRST QUARTER 2016 | | 46 | | NOTES TO FINANCIAL STATEMENTS (UNAUDITED) |
operation to which it relates. We recorded an increase of $156 million (2015: $55 million increase) to the PER at our minesites for the three months ended March 31, 2016 primarily due to decrease in the discount rate.
| B) | Impairment and reversal of impairment for non-current assets and impairment of goodwill |
We have not identified any indicators that any non-current assets and goodwill as well as prior impairments, require testing for impairments or reversals for the three months ended March 31, 2016.
Contingencies can be either possible assets or possible liabilities arising from past events which, by their nature, will only be resolved when one or more future events not wholly within our control occur or fail to occur. The assessment of such contingencies inherently involves the exercise of significant judgment and estimates of the outcome of future events. Refer to note 15 for further details on contingencies.
4 > DIVESTITURES
| A) | Disposition of Bald Mountain and Round Mountain Mines |
On January 11, 2016, we closed the sale of our Bald Mountain and Round Mountain mines for total cash consideration of $610 million. The transactions resulted in a loss of $15 million.
| B) | Disposition of 50 percent interest in Zaldívar mine |
On December 1, 2015, we completed the sale of 50% of our Zaldívar copper mine in Chile to Antofagasta Plc for total consideration of $1.005 billion. The transaction remains subject to net working capital adjustments.
5 > SEGMENT INFORMATION
Barrick’s business is organized into thirteen individual minesites, one publicly traded company and one project. Barrick’s Chief Operating Decision Maker (“CODM”), the President, reviews the operating results, assesses performance and makes capital allocation decisions at the minesite, Company and/or project level. Therefore, each individual minesite, Acacia and the Pascua-Lama project are operating segments for financial reporting purposes. Following the divestitures that were completed in 2015 and early 2016, we re-evaluated our reportable operating segments and no longer report on our interests in the following non-core properties: Porgera, Kalgoorlie, Zaldívar and Lumwana. Our updated presentation of our reportable operating segments will now be limited to six individual gold mines, Acacia and our Pascua-Lama project. The remaining operating segments, including the non-core properties referred to above and our remaining gold and copper mines, have been grouped into an “other” category and will not be reported on individually. The prior periods have been restated to reflect the change in presentation. Segment performance is evaluated based on a number of measures including operating income before tax, production levels and unit production costs. Certain costs are managed on a consolidated basis and are therefore not reflected in segment income.
| | | | | | | | | | | | | | | | | | | | | | | | |
| Consolidated Statement of Income Information | |
| | | | | | Cost of Sales | | | | | | | | | | |
For the three months ended March 31, 2016 | | Revenue | | | Direct mining,
royalties and
community
relations | | | Depreciation | | | Exploration,
evaluation and
project expenses | | | Other expenses
(income)1 | | | Segment
income (loss) | |
Goldstrike | | $ | 289 | | | $ | 153 | | | $ | 59 | | | $ | - | | | $ | 2 | | | $ | 75 | |
Cortez | | | 327 | | | | 113 | | | | 139 | | | | - | | | | 2 | | | | 73 | |
Pueblo Viejo | | | 351 | | | | 124 | | | | 43 | | | | - | | | | 1 | | | | 183 | |
Lagunas Norte | | | 124 | | | | 40 | | | | 28 | | | | - | | | | 1 | | | | 55 | |
Veladero | | | 152 | | | | 80 | | | | 25 | | | | - | | | | - | | | | 47 | |
Turquoise Ridge | | | 56 | | | | 29 | | | | 6 | | | | - | | | | 1 | | | | 20 | |
Acacia | | | 219 | | | | 133 | | | | 36 | | | | 6 | | | | 4 | | | | 40 | |
Pascua-Lama | | | - | | | | - | | | | 2 | | | | 14 | | | | (5 | ) | | | (11 | ) |
Other Mines | | | 412 | | | | 241 | | | | 44 | | | | 1 | | | | 5 | | | | 121 | |
| | | $ | 1,930 | | | $ | 913 | | | $ | 382 | | | $ | 21 | | | $ | 11 | | | $ | 603 | |
| | | | |
| BARRICK FIRST QUARTER 2016 | | 47 | | NOTES TO FINANCIAL STATEMENTS (UNAUDITED) |
| | | | | | | | | | | | | | | | | | | | | | | | |
| Consolidated Statement of Income Information | |
| | | | | | Cost of Sales | | | | | | | | | | |
For the three months ended March 31, 2015 | | Revenue | | | Direct mining,
royalties and
community relations | | | Depreciation | | | Exploration,
evaluation and
project expenses | | | Other expenses
(income)1 | | | Segment
income (loss) | |
Goldstrike | | | $ 237 | | | | $ 117 | | | | $ 32 | | | | $ - | | | | $ 2 | | | | $ 86 | |
Cortez | | | 191 | | | | 126 | | | | 70 | | | | 2 | | | | 2 | | | | (9 | ) |
Pueblo Viejo | | | 366 | | | | 162 | | | | 69 | | | | - | | | | (2 | ) | | | 137 | |
Lagunas Norte | | | 205 | | | | 58 | | | | 41 | | | | - | | | | 2 | | | | 104 | |
Veladero | | | 201 | | | | 102 | | | | 26 | | | | 1 | | | | (1 | ) | | | 73 | |
Turquoise Ridge | | | 55 | | | | 26 | | | | 5 | | | | - | | | | - | | | | 24 | |
Acacia | | | 213 | | | | 141 | | | | 33 | | | | 5 | | | | 1 | | | | 33 | |
Pascua-Lama | | | - | | | | - | | | | 2 | | | | 33 | | | | (11 | ) | | | (24 | ) |
Other Mines2 | | | 777 | | | | 532 | | | | 135 | | | | 2 | | | | (4 | ) | | | 112 | |
| | | | $ 2,245 | | | | $ 1,264 | | | | $ 413 | | | | $ 43 | | | | $ (11 | ) | | | $ 536 | |
| 1 | Other expenses include accretion expense, which is included within finance costs in the consolidated statement of income. For the three months ended March 31, 2016, accretion expense was $13 million (2015: $11 million). |
| 2 | For the three months ended March 31, 2015, includes revenues and segment income(loss) for Porgera ($144 million, $35 million), Kalgoorlie ($76 million, 9 million), Lumwana ($126 million, $11 million loss) and Zaldivar ($141 million, $24 million). These mines were individually disclosed as operating segments in the prior year. |
Reconciliation of Segment Income to Income Before Income Taxes
| | | | | | | | |
| For the three months ended March 31 | |
| | | 2016 | | | 2015 | |
Segment income | | $ | 603 | | | $ | 536 | |
Other cost of sales/amortization1,2 | | | (29 | ) | | | (31 | ) |
Exploration, evaluation and project expenses not attributable to segments | | | (34 | ) | | | (43 | ) |
General and administrative expenses | | | (58 | ) | | | (67 | ) |
Other expense not attributable to segments | | | (16 | ) | | | (4 | ) |
Impairment charges not attributable to segments | | | (1 | ) | | | (5 | ) |
Gain (loss) on currency translation | | | (139 | ) | | | 2 | |
Closed mine rehabilitation | | | (23 | ) | | | (8 | ) |
Gain from equity investees | | | 5 | | | | - | |
Finance costs, net (includes non segment accretion) | | | (198 | ) | | | (183 | ) |
Gain (loss) on non-hedge derivatives | | | 4 | | | | (3 | ) |
Income before income taxes | | $ | 114 | | | $ | 194 | |
| 1 | Includes costs from Pierina in 2015 which was not considered part of any of our operating segments. |
| 2 | Includes all realized hedge gains/losses. |
| | | | |
| BARRICK FIRST QUARTER 2016 | | 48 | | NOTES TO FINANCIAL STATEMENTS (UNAUDITED) |
| | | | | | | | |
| Capital Expenditures Information | | Segment capital expenditures1 | |
| For the three months ended March 31 | |
| | | 2016 | | | 2015 | |
Goldstrike | | | $ 52 | | | | $ 93 | |
Cortez | | �� | 20 | | | | 33 | |
Pueblo Viejo | | | 22 | | | | 33 | |
Lagunas Norte | | | 19 | | | | 13 | |
Veladero | | | 19 | | | | 68 | |
Turquoise Ridge | | | 6 | | | | 6 | |
Acacia | | | 34 | | | | 41 | |
Pascua-Lama | | | 1 | | | | 4 | |
Other Mines2 | | | 36 | | | | $ 163 | |
Segment total | | | $ 209 | | | | $ 454 | |
Other items not allocated to segments | | | 6 | | | | 2 | |
Total | | | $ 215 | | | | $ 456 | |
| 1 | Segment capital expenditures are presented for internal management reporting purposes on an accrual basis. Capital expenditures in the Consolidated Statements of Cash Flow are presented on a cash basis. For the three months ended March 31, 2016, cash expenditures were $270 million (2015: $514 million) and the decrease in accrued expenditures was $55 million (2015: $58 million decrease). |
| 2 | For the three months ended March 31, 2015, includes capital expenditures for Porgera ($28 million), Kalgoorlie ($17 million), Lumwana ($14 million) and Zaldivar ($13 million). These mines were individually disclosed as operating segments in the prior year. |
Purchase Commitments
At March 31, 2016, we had purchase obligations for supplies and consumables of $1,091 million.
Capital Commitments
In addition to entering into various operational commitments in the normal course of business, we had capital commitments of $92 million at March 31, 2016.
| | | | |
| BARRICK FIRST QUARTER 2016 | | 49 | | NOTES TO FINANCIAL STATEMENTS (UNAUDITED) |
6 > REVENUE
| | | | | | | | |
| For the three months ended March 31 | |
| | | 2016 | | | 2015 | |
Gold bullion sales | | | | | | | | |
Spot market sales | | | $ 1,707 | | | | $ 1,854 | |
Concentrate sales | | | 61 | | | | 65 | |
| | | $ 1,768 | | | | $ 1,919 | |
Copper sales | | | | | | | | |
Copper cathode sales1 | | | $ - | | | | $ 141 | |
Concentrate sales | | | 124 | | | | 126 | |
| | | | $ 124 | | | | $ 267 | |
Other sales2 | | | $ 38 | | | | $ 59 | |
Total | | | $ 1,930 | | | | $ 2,245 | |
| 1 | Copper cathode sales for the three months ended March 31, 2015 relate to Zaldivar which is now accounted for as an equity method investment. Refer to note 4B. |
| 2 | Revenues include the sale of by-products for our gold and copper mines and energy sales from Monte Rio. |
7 > EARNINGS (LOSS) PER SHARE
| | | | | | | | | | | | | | | | |
| | | For the three months ended March 31 | |
| | | 2016 | | | 2015 | |
| | | | |
| ($ millions, except shares in millions and per share amounts in dollars) | | Basic | | | Diluted | | | Basic | | | Diluted | |
Net income (loss) | | | $ (72) | | | | $ (72) | | | | $ 89 | | | | $ 89 | |
Net income attributable to non-controlling interests | | | (11) | | | | (11) | | | | (32) | | | | (32) | |
Net income (loss) attributable to equity holders of Barrick Gold Corporation | | | $ (83) | | | | $ (83) | | | | $ 57 | | | | $ 57 | |
Weighted average shares outstanding | | | 1,165 | | | | 1,165 | | | | 1,165 | | | | 1,165 | |
Earnings per share data attributable to the equity holders of Barrick Gold Corporation Net income (loss) | | | $ (0.07) | | | | $ (0.07) | | | | $ 0.05 | | | | $ 0.05 | |
| | | | |
| BARRICK FIRST QUARTER 2016 | | 50 | | NOTES TO FINANCIAL STATEMENTS (UNAUDITED) |
8 > OTHER EXPENSES
A Other Expense (Income)
| | | | | | | | |
| For the three months ended | |
| | | | | | March 31 | |
| | | 2016 | | | 2015 | |
Other expense: | | | | | | | | |
Consulting fees | | | $ 2 | | | | $ 2 | |
Bank charges | | | 6 | | | | 7 | |
Loss (gain) on sale of long-lived assets | | | 9 | | | | (24) | |
Other | | | 3 | | | | 1 | |
Total other expense | | | $ 20 | | | | $ (14) | |
| | |
Other income: | | | | | | | | |
Office closure costs | | | $ (4) | | | | $ - | |
Other | | | (2) | | | | (4) | |
Total other income | | | $ (6) | | | | $ (4) | |
Total | | | $ 14 | | | | $ (18) | |
B Loss (Gain) on Currency Translation
| | | | | | | | |
| For the three months ended | |
| | | | | | March 31 | |
| | | 2016 | | | 2015 | |
Currency translation losses released as a result of the disposal and reorganization of entities | | | $ 91 | | | | $ - | |
Foreign currency translation losses (gains) | | | 48 | | | | (2) | |
Total | | | $ 139 | | | | $ (2) | |
9 > INCOME TAX EXPENSE (RECOVERY)
| | | | | | | | |
| For the three months ended | |
| | | | | | March 31 | |
| | | 2016 | | | 2015 | |
Current | | | $ 246 | | | | $ 102 | |
Deferred | | | (60) | | | | 3 | |
| | | | $ 186 | | | | $ 105 | |
Income tax expense was $186 million in first quarter 2016. The underlying effective tax rate for ordinary income in the first quarter 2016 was 49.5% after adjusting for the impact of income tax assessments in Tanzania, the impact of net currency translation losses on deferred tax balances, the impact of asset sales and non-hedge derivatives, and the impact of non-deductible foreign exchange losses. The unadjusted tax rate for income in first quarter 2016 was 163% of the income before income taxes.
Tax Assessments in Tanzania
In first quarter 2016, Acacia received a judgment from the Tanzanian Court of Appeal regarding a long standing dispute over tax calculations at Bulyanhulu from 2000-2006. The Court of Appeal was reviewing seven issues initially raised by the Tanzania Revenue Authority (TRA) in 2012 regarding certain historic tax loss carry forwards and ruled in favor of Bulyanhulu by the Tax Appeals Board in 2013. The TRA appealed against this ruling and in 2014 the Tax Tribunal reversed the decision for all seven issues. Acacia appealed against this judgment and in March 2016 the Court of Appeal found in favor of the TRA in five of the seven issues. The legal route in Tanzania has now been exhausted; however Acacia is considering options for the next steps. Acacia has yet to receive a revised tax assessment following the judgment, but has booked further tax provisions of $70 million in Q1 2016 in order to address the direct impact of the ruling on Bulyanhulu’s tax loss carry forwards and the potential impact this may have on the applicability of certain capital deductions for other years and our other mines in Tanzania.
Currency Translation
Deferred tax balances are subject to remeasurement for changes in currency exchange rates each period. The most significant balances are Argentinean net deferred tax liabilities. In the three months ended March 31, 2016 and 2015, tax expense of $18 million and $6 million respectively primarily arose from translation losses on tax balances in Argentina, due to the weakening of the Argentinean peso against the US dollar. These translation losses are included within deferred income tax expense/recovery.
| | | | |
| BARRICK FIRST QUARTER 2016 | | 51 | | NOTES TO FINANCIAL STATEMENTS (UNAUDITED) |
10 > CASH FLOW – OTHER ITEMS
| | | | |
| Operating Cash Flows – Other Items | | For the three months ended March 31 |
| | | | | | | | |
| | | 2016 | | | 2015 | |
Adjustments for non-cash income statement items: | | | | | | | | |
Net currency translation (gains) losses | | | $ 139 | | | | $ (2) | |
RSU expense | | | 20 | | | | 7 | |
Stock option expense | | | - | | | | 1 | |
Gain from investment in equity investees | | | (5) | | | | - | |
Change in estimate of rehabilitation costs at closed mines | | | 23 | | | | 8 | |
Net inventory impairment charges1 | | | 26 | | | | 55 | |
Cash flow arising from changes in: | | | | | | | | |
Accounts receivable | | | (13) | | | | 2 | |
Other current assets | | | 13 | | | | (65) | |
Accounts payable | | | (246) | | | | (154) | |
Other current liabilities | | | 94 | | | | (34) | |
Other assets and liabilities | | | (86) | | | | (3) | |
Settlement of rehabilitation obligations | | | (18) | | | | (24) | |
Other net operating activities | | | $ (53) | | | | $ (209) | |
1 Net inventory impairment charges include impairment charges for the three months ended March 31, 2016 of $26 million (2015: $55 million) and impairment reversals of $nil million (2015: $nil million).
| | | | |
| BARRICK FIRST QUARTER 2016 | | 52 | | NOTES TO FINANCIAL STATEMENTS (UNAUDITED) |
11 > FINANCIAL INSTRUMENTS
Financial instruments include cash; evidence of ownership in an entity; or a contract that imposes an obligation on one party and conveys a right to a second entity to deliver/receive cash or another financial instrument.
A Cash and Equivalents
Cash and equivalents include cash, term deposits, treasury bills and money market funds with original maturities of less than 90 days. Cash and equivalents also include $534 million cash that is held in subsidiaries which have regulatory regulations, contractual restrictions or operate in countries where exchange controls and other legal restrictions apply and are therefore not available for general use by the Company.
B Debt1
| | | | | | | | |
| | | As at March 31, 2016 | | | As at December 31, 2015 | |
4.4%/5.7% notes2,9 | | | $ 2,058 | | | | $ 2,182 | |
3.85%/5.25% notes | | | 1,078 | | | | 1,077 | |
5.80% notes3,9 | | | 395 | | | | 395 | |
6.35% notes4,9 | | | 592 | | | | 592 | |
Other fixed rate notes5,9 | | | 1,880 | | | | 2,451 | |
Project financing | | | 550 | | | | 646 | |
Capital leases6 | | | 141 | | | | 153 | |
Other debt obligations | | | 645 | | | | 654 | |
2.5%/4.10%/5.75% notes7,9 | | | 1,673 | | | | 1,690 | |
Acacia credit facility8 | | | 114 | | | | 128 | |
| | | $ 9,126 | | | | $ 9,968 | |
Less: current portion10 | | | (186) | | | | (203) | |
| | | | $ 8,940 | | | | $ 9,765 | |
| 1 | The agreements that govern our long-term debt each contain various provisions which are not summarized herein. These provisions allow Barrick to, at its option, redeem indebtedness prior to maturity at specified prices and also may permit redemption of debt by Barrick upon the occurrence of certain specified changes in tax legislation. |
| 2 | Consists of $2.1 billion (2015: $2.2 billion) in conjunction with our wholly-owned subsidiary Barrick North America Finance LLC (“BNAF”). This consists of $1.225 billion (2015: $1.35 billion) of BNAF notes due 2021 and $850 million of BNAF notes due 2041. |
| 3 | Consists of $400 million of 5.80% notes which mature in 2034. |
| 4 | Consists of $600 million of 6.35% notes which mature in 2036. |
| 5 | Consists of $1.9 billion (2015: $2.5 billion) in conjunction with our wholly-owned subsidiary Barrick North America Finance LLC (“BNAF”) and our wholly-owned subsidiary Barrick (PD) Australia Finance Pty Ltd. (“BPDAF”). This consists of $273 million (2015: $500 million) of BNAF notes due 2018, $279 million (2015: $475 million) of BGC notes due 2019, $248 million (2015: $400 million) of BPDAF notes due 2020, $250 million of BNAF notes due 2038 and $850 million of BPDAF notes due 2039. |
| 6 | Consists primarily of capital leases at Pascua-Lama, $55 million, and Lagunas Norte, $79 million (2015: $57 million and $88 million, respectively). |
| 7 | Consists of $1.7 billion (2015: $1.7 billion) in conjunction with our wholly-owned subsidiary Barrick North America Finance LLC (“BNAF”). This consists of $105 million (2015: $123 million) of BGC notes due 2018, $731 million of BGC notes due 2023 and $850 million of BNAF notes due 2043. |
| 8 | Consists of an export credit backed term loan facility. |
| 9 | We provide an unconditional and irrevocable guarantee on all Barrick North America Finance LLC (“BNAF”), Barrick (PD) Australia Finance Pty Ltd. (“BPDAF”), Barrick Gold Finance Company (“BGFC”), and Barrick (HMC) Mining (“BHMC”) notes and generally provide such guarantees on all BNAF, BPDAF, BGFC, and BHMC notes issued, which will rank equally with our other unsecured and unsubordinated obligations. |
| 10 | The current portion of long-term debt consists of project financing ($84 million; 2015: $89 million), other debt obligations ($35 million; 2015: $45 million), capital leases ($39 million; 2015: $41 million) and Acacia credit facility ($28 million; 2015: $28 million). |
Jabal Sayid Financing Facility
On April 2, 2015, Ma’aden Barrick Copper Company signed a financing agreement with the Saudi British Bank to finance the Jabal Sayid copper project (an equity method investment for Barrick) for SAR 750 million ($200 million USD). Barrick has provided a guarantee equal to our proportionate ownership interest (50%).
Debt Management
On March 21, 2016, we settled a cash tender offer up to $750 million for specified series of outstanding notes. The settlement resulted in a debt extinguishment loss of $37 million.
| | | | |
| BARRICK FIRST QUARTER 2016 | | 53 | | NOTES TO FINANCIAL STATEMENTS (UNAUDITED) |
12 > FAIR VALUE MEASUREMENTS
A Assets and Liabilities Measured at Fair Value on a Recurring Basis
| | | | | | | | | | | | | | | | |
| | | Quoted | | | | | | | | | | |
| | | prices in | | | | | | | | | | |
| | | active | | | | | | | | | | |
| | | markets | | | Significant | | | | | | | |
| | | for | | | other | | | Significant | | | | |
| | | identical | | | observable | | | unobservable | | | | |
| As at March | | assets | | | inputs | | | inputs | | | Aggregate | |
| 31, 2016 | | (Level 1) | | | (Level 2) | | | (Level 3) | | | fair value | |
Cash and equivalents | | | $ 2,323 | | | | $ - | | | | $ - | | | | $ 2,323 | |
Other investments | | | 12 | | | | - | | | | - | | | | 12 | |
Derivatives | | | - | | | | (228) | | | | - | | | | (228) | |
Receivables from provisional copper and gold sales | | | - | | | | 76 | | | | - | | | | 76 | |
| | | | $ 2,335 | | | | $ (152) | | | | $ - | | | | $ 2,183 | |
B Fair Values of Financial Assets and Liabilities
| | | | | | | | | | | | | | | | |
| | | As at March 31, 2016 | | | As at Dec. 31, 2015 | |
| | | Carrying | | | Estimated | | | Carrying | | | Estimated | |
| | | amount | | | fair value | | | amount | | | fair value | |
Financial assets | | | | | | | | | | | | | | | | |
Other receivables | | | $ 385 | | | | $ 385 | | | | $ 365 | | | | $ 365 | |
Other investments1 | | | 12 | | | | 12 | | | | 8 | | | | 8 | |
Derivative assets | | | 1 | | | | 1 | | | | 1 | | | | 1 | |
| | | | $ 398 | | | | $ 398 | | | | $ 374 | | | | $ 374 | |
Financial liabilities | | | | | | | | | | | | | | | | |
Debt2 | | | $ 9,126 | | | | $ 8,740 | | | | $ 9,968 | | | | $ 8,516 | |
Derivative liabilities | | | 229 | | | | 229 | | | | 264 | | | | 264 | |
Other liabilities | | | 235 | | | | 235 | | | | 223 | | | | 223 | |
| | | | $ 9,590 | | | | $ 9,204 | | | | $ 10,455 | | | | $ 9,003 | |
| 1 | Recorded at fair value. Quoted market prices are used to determine fair value. |
| 2 | Debt is generally recorded at amortized cost. The fair value of debt is primarily determined using quoted market prices. Balance includes both current and long-term portions of debt. |
We do not offset financial assets with financial liabilities.
The Company’s valuation techniques were presented in Note 25 of the consolidated financial statements for the year ended December 31, 2015 and have been consistently applied in these interim financial statements.
13 > CAPITAL STOCK
A Authorized Capital Stock
Our authorized capital stock includes an unlimited number of common shares (issued 1,165,215,209 common shares); an unlimited number of first preferred shares issuable in series (the first series is designated as the “First Preferred Shares, Series A” and consists of 10,000,000 first preferred shares (issued nil); the second series is designated as the “First Preferred Shares, Series B” and consists of 10,000,000 first preferred shares (issued nil); and the third series is designated as the “ First Preferred Share, Series C Special Voting Share” and consists of 1 Special Voting Share (issued nil)); and an unlimited number of second preferred shares issuable in series (the first series is designated as the “Second Preferred Shares, Series A” and consists of 15,000,000 second preferred shares (issued nil)). Our common shares have no par value.
B Dividends
The Company’s practice has been to declare dividends after a quarter end in the announcement of the results for the quarter. Dividends declared are paid in the same quarter.
The Company’s dividend reinvestment plan resulted in 133,830 common shares issued to shareholders.
14 > NON-CONTROLLING INTERESTS
| | | | | | | | | | | | | | | | | | | | |
| | | Pueblo
Viejo | | | Acacia | | | Cerro
Casale | | | Other | | | Total | |
At January 1, 2016 | | $ | 1,232 | | | $ | 677 | | | $ | 318 | | | $ | 50 | | | $ | 2,277 | |
Share of income (loss) | | | 31 | | | | (19) | | | | - | | | | (1) | | | | 11 | |
Cash contributed | | | - | | | | - | | | | 1 | | | | 12 | | | | 13 | |
Decrease in non-controlling interest1 | | | (31) | | | | - | | | | - | | | | - | | | | (31) | |
At March 31, 2016 | | $ | 1,232 | | | $ | 658 | | | $ | 319 | | | $ | 61 | | | $ | 2,270 | |
| 1 | Represents disbursements made to non-controlling interest at Pueblo Viejo. |
| | | | |
| BARRICK FIRST QUARTER 2016 | | 54 | | NOTES TO FINANCIAL STATEMENTS (UNAUDITED) |
15 > CONTINGENCIES
Certain conditions may exist as of the date the financial statements are issued that may result in a loss to the Company, but which will only be resolved when one or more future events occur or fail to occur. The impact of any resulting loss from such matters affecting these financial statements and noted below may be material.
Except as noted below, no material changes have occurred with respect to the matters disclosed in Note 35 “Contingencies” to the Company’s audited consolidated financial statements for the year ended December 31, 2015 (the “Audited Annual Financial Statements”), and no new contingencies have occurred that are material to the Company since the issuance of the Audited Annual Consolidated Financial Statements.
The description set out below should be read in conjunction with Note 35 “Contingencies” to the Audited Consolidated Financial Statements.
Litigation and Claims Update
Pascua-Lama – SMA Regulatory Sanctions
Remanded Administrative Proceeding
On April 4, 2016, as part of the remanded administrative proceeding, the SMA issued two reports assessing water quality data previously provided by CMN. The SMA will consider these reports when issuing a new administrative decision in this matter, as required by the March 3, 2014 decision of the Environmental Court. CMN has challenged one of the reports on procedural grounds and has also challenged the methodology and conclusions of both reports.
Pascua-Lama – Constitutional Protection Action
On April 11, 2016, the court postponed a hearing that had been scheduled for that day. A new hearing date has not yet been scheduled.
Veladero – Release of Cyanide-Bearing Process Solution
San Juan Provincial Regulatory Sanction Proceeding
On March 11, 2016, the San Juan Provincial mining authority announced its intention to impose an administrative fine against MAGSA, Barrick’s Argentine subsidiary that operates the Veladero mine, in connection with the solution release. MAGSA was formally notified of this decision on March 15, 2016. On April 6, 2016, MAGSA sought reconsideration of certain aspects of the decision but did
not challenge the amount of the administrative fine. On April 14, 2016, in accordance with local requirements, MAGSA paid the administrative fine of approximately $10 million (at the then-applicable Argentine peso/$ exchange rate) while the request for reconsideration is pending.
Criminal Matters
On March 11, 2016, a San Juan Provincial court laid criminal charges based on alleged negligence against nine current and former MAGSA employees in connection with the solution release (the “Provincial Action”). The individual defendants have appealed the indictment.
In addition, a federal criminal investigation is underway by a Buenos Aires federal court based on the alleged failure of certain current and former government officials and individual directors of MAGSA to prevent the solution release (the “Federal Investigation”). The federal judge overseeing the Federal Investigation has admitted a local group in San Juan Province as a party. In March 2016, this group requested an injunction against the operations of the Veladero mine. While the request for an injunction is being considered by the court, the federal judge ordered technical studies to assess the solution release and its impact. The federal judge also appointed a committee to conduct a site visit, which occurred in late April 2016. To date, no charges have been laid against any specific individuals in connection with this federal matter.
The San Juan provincial judge presiding over the Provincial Action has challenged the jurisdiction of the Buenos Aires federal court in the Federal Investigation before the National Supreme Court of Argentina. A former MAGSA director has also filed a similar jurisdictional challenge.
MAGSA is not a party to either the Provincial Action or the Federal Investigation. No amounts have been recorded for any potential liability arising from these matters, as the Company cannot reasonably predict any potential losses.
| | | | |
| BARRICK FIRST QUARTER 2016 | | 55 | | NOTES TO FINANCIAL STATEMENTS (UNAUDITED) |
| | |
| HEAD OFFICE | | TRANSFER AGENTS AND REGISTRARS |
| |
| Barrick Gold Corporation | | CST Trust Company |
| Brookfield Place | | P.O. Box 700, Postal Station B |
| TD Canada Trust Tower | | Montreal, Quebec H3B 3K3 |
| 161 Bay Street, Suite 3700 | | or |
Toronto, Ontario M5J 2S1 Telephone: +1 416 861-9911 Toll-free: 1-800-720-7415 Fax: +1 416 861-2492 | | American Stock Transfer & Trust Company, LLC 6201 - 15 Avenue Brooklyn, New York 11219 Telephone: 1-800-387-0825 |
| Email:investor@barrick.com | | Fax: 1-888-249-6189 |
| Website:www.barrick.com | | Email:inquiries@canstockta.com |
| | Website:www.canstockta.com |
| |
| SHARES LISTED | | |
| |
| ABX – The New York Stock Exchange | | |
| The Toronto Stock Exchange | | |
| |
| INVESTOR CONTACTS | | MEDIA CONTACT |
| |
| Angela Parr | | Andy Lloyd |
| Vice President | | Senior Vice President |
| Investor Relations | | Communications |
| Telephone: +1 416 307-7426 | | Telephone: +1 416 307-7414 |
| Email:aparr@barrick.com | | Email:alloyd@barrick.com |
| |
| Susan Muir | | |
Vice President | | |
Investor Communications | | |
Telephone: +1 416 307-5107 | | |
Email:s.muir@barrick.com | | |
CAUTIONARY STATEMENT ON FORWARD-LOOKING INFORMATION
Certain information contained or incorporated by reference in this First Quarter Report 2016, including any information as to our strategy, projects, plans or future financial or operating performance, constitutes “forward-looking statements”. All statements, other than statements of historical fact, are forward-looking statements. The words “believe”, “expect”, “anticipate”, “contemplate”, “target”, “plan”, “objective” “aspiration”, “aim”, “intend”, “project”, “goal”, “continue”, “budget”, “estimate”, “potential”, “may”, “will”, “can”, “should”, “could” and similar expressions identify forward-looking statements. In particular, this First Quarter Report 2016 contains forward-looking statements including, without limitation, with respect to: (i) Barrick’s forward-looking production guidance; (ii) estimates of future all-in-sustaining costs per ounce/pound, cash costs per ounce and C1 cash costs per pound; (iii) cash flow forecasts; (iv) projected capital, operating and exploration expenditures; (v) targeted debt and cost reductions; (vi) mine life and production rates; (vii) potential mineralization and metal or mineral recoveries; (viii) Barrick’s Best-in-Class program (including potential improvements to financial and operating performance and mine life that may result from certain Best-in-Class initiatives); (ix) expectations regarding future price assumptions, financial performance and other outlook or guidance; and (x) the estimated timing and conclusions of technical reports and other studies. Forward-looking statements are necessarily based upon a number of estimates and assumptions that, while considered reasonable by the company as at the date of this press release in light of management’s experience and perception of current conditions and expected developments, are inherently subject to significant business, economic and competitive uncertainties and contingencies. Known and unknown factors could cause actual results to differ materially from those projected in the forward-looking statements and undue reliance should not be placed on such statements and information. Such factors include, but are not limited to: fluctuations in the spot and forward price of gold, copper or certain other commodities (such as silver, diesel fuel, natural gas and electricity); the speculative nature of mineral exploration and development; changes in mineral production performance, exploitation and exploration successes; risks associated with the fact that certain Best-in-Class initiatives are still in the early stages of evaluation and additional engineering and other analysis is required to fully assess their impact; diminishing quantities or grades of reserves; increased costs, delays, suspensions and technical challenges associated with the construction of capital projects; operating or technical difficulties in connection with mining or development activities, including geotechnical challenges and disruptions in the maintenance or provision of required infrastructure and information technology systems; failure to comply with environmental and health and safety laws and regulations; timing of receipt of, or failure to comply with, necessary permits and approvals; uncertainty whether some or all of the Best-in-Class initiatives will meet the company’s capital allocation objectives; the impact of global liquidity and credit availability on the timing of cash flows and the values of assets and liabilities based on projected future cash flows; adverse changes in our credit ratings; the impact of inflation;
fluctuations in the currency markets; changes in U.S. dollar interest rates; risks arising from holding derivative instruments; changes in national and local government legislation, taxation, controls or regulations and/or changes in the administration of laws, policies and practices, expropriation or nationalization of property and political or economic developments in Canada, the United States and other jurisdictions in which the company does or may carry on business in the future; damage to the company’s reputation due to the actual or perceived occurrence of any number of events, including negative publicity with respect to the company’s handling of environmental matters or dealings with community groups, whether true or not; risk of loss due to acts of war, terrorism, sabotage and civil disturbances; litigation; contests over title to properties, particularly title to undeveloped properties, or over access to water, power and other required infrastructure; business opportunities that may be presented to, or pursued by, the company; our ability to successfully integrate acquisitions or complete divestitures; risks associated with working with partners in jointly controlled assets; employee relations; increased costs and physical risks, including extreme weather events and resource shortage, related to climate change; availability and increased costs associated with mining inputs and labor; and the organization of our previously held African gold operations and properties under a separate listed company. In addition, there are risks and hazards associated with the business of mineral exploration, development and mining, including environmental hazards, industrial accidents, unusual or unexpected formations, pressures, cave-ins, flooding and gold bullion, copper cathode or gold or copper concentrate losses (and the risk of inadequate insurance, or inability to obtain insurance, to cover these risks).
Many of these uncertainties and contingencies can affect our actual results and could cause actual results to differ materially from those expressed or implied in any forward-looking statements made by, or on behalf of, us. Readers are cautioned that forward-looking statements are not guarantees of future performance. All of the forward-looking statements made in this First Quarter Report 2016 are qualified by these cautionary statements. Specific reference is made to the most recent Form 40-F/Annual Information Form on file with the SEC and Canadian provincial securities regulatory authorities for a more detailed discussion of some of the factors underlying forward-looking statements and the risks that may affect Barrick’s ability to achieve the expectations set forth in the forward-looking statements contained in this press release.
The company disclaims any intention or obligation to update or revise any forward-looking statements whether as a result of new information, future events or otherwise, except as required by applicable law.