Exhibit 99.1

2016YEAR-END REPORT AND FOURTH QUARTER RESULTS
All amounts expressed in U.S. dollars
Barrick Reports 2016 Full Year and Fourth Quarter Results
Record free cash flow driven by industry-leading margins, and disciplined capital allocation
| | • | | For 2016, Barrick reported net earnings attributable to equity holders of Barrick (“net earnings”) of $655 million ($0.56 per share), and adjusted net earnings1 of $818 million ($0.70 per share). |
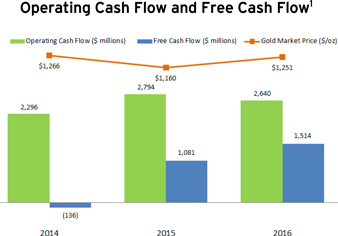
| | • | | The Company reported annual revenues of $8.56 billion, net cash provided by operating activities (“operating cash flow”) of $2.64 billion, and free cash flow2 of $1.51 billion. |
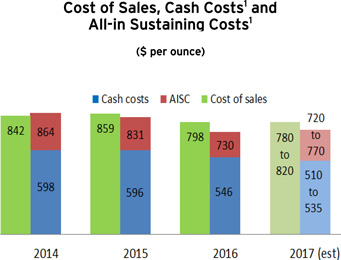
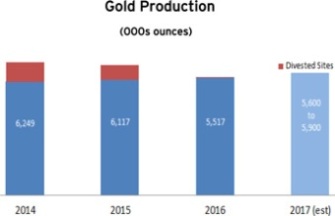
| | • | | Full year gold production was 5.52 million ounces. Cost of sales applicable to gold was $798 per ounce, andall-in sustaining costs3 were $730 per ounce. |
| | • | | Barrick reported fourth quarter net earnings of $425 million ($0.36 per share), and adjusted net earnings1 of $255 million ($0.22 per share). |
| | • | | Fourth quarter revenue was $2.32 billion; operating cash flow was $711 million, and free cash flow2 was $385 million. |
| | • | | Gold production in the fourth quarter was 1.52 million ounces, at a cost of sales applicable to gold of $784 per ounce, andall-in sustaining costs3 of $732 per ounce. |
| | • | | Proven and probable gold reserves were 85.9 million ounces4 as of December 31, 2016. |
| | • | | For 2017, production guidance is5.60-5.90 million ounces of gold, at a cost of sales applicable to gold of$780-$820 per ounce, andall-in sustaining costs3 of$720-$770 per ounce. |
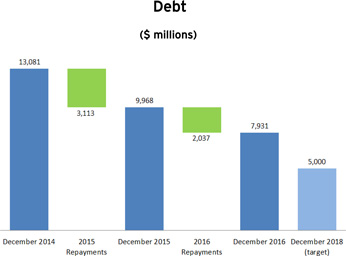
| | • | | We intend to reduce our total debt by $2.9 billion, to $5 billion, by the end of 2018—half of which we are targeting in 2017. |
| | • | | The Board of Directors has approved an increase in our quarterly dividend from $0.02 per share to $0.03 per share. |
| | • | | Operations and Technical Update will be webcast on February 22 at www.barrick.com. Please join us for additional technical insights on our operations, projects, and other priorities. |
TORONTO, February 15, 2017 — Barrick Gold Corporation (NYSE:ABX)(TSX:ABX) (“Barrick” or the ”Company“) reported annual results that exceeded the Company’s key targets for the year. In 2016, our mines generated operating cash flow of $2.64 billion, and free cash flow2 of $1.51 billion—a record level of annual free cash flow for the Company. We reduced our cost of sales applicable to gold to $798 per ounce, and ourall-in sustaining costs3 fell by 12 percent, to $730 per ounce. We continued to strengthen our balance sheet, cutting our total debt by $2.04 billion, or 20 percent. And we brought greater discipline and rigor to our capital allocation process with the appointment of the Company’s first-ever Chief Investment Officer.
STRATEGIC FRAMEWORK
Our vision is the generation of wealth through responsible mining—wealth for our owners, our people, and the countries and communities with which we partner. In support of this vision, our overarching objective is to grow our free cash flow per share.
We are cultivating a high-performance culture defined by the following principles: a deep commitment to partnership, consistent execution, operational excellence, disciplined capital allocation, and continual self-improvement. We are obsessed with talent, and seek out fresh perspectives from other industries, challenging ourselves to think differently as we aim to transform Barrick into a leading 21st century company.
We will grow free cash flow per share over the long term by: maintaining and growing industry-leading margins, increasingly driven by innovation and our digital transformation; by managing our portfolio and allocating capital with discipline and rigor; and by leveraging our distinctive partnership culture as a competitive advantage.
Our prospects for growing free cash flow per share build on a foundation of core mines that are among the longest-life, lowest-cost gold operations in the world. We have the largest gold reserves and resources in the industry5, including a deep pipeline of projects that provide extraordinary optionality and leverage to gold prices. Our exploration programs have a demonstrated track record of value creation. And we are evaluating acquisitions and partnerships with the potential to improve the overall quality of our portfolio over the long term.
GROWING FREE CASH FLOW PER SHARE THROUGH INDUSTRY-LEADING MARGINS
Through ourBest-in-Class approach, we pursue industry-leading margins by continuously improving the productivity and efficiency of existing systems and operations. Equally, we pursue step changes in performance byre-designing those systems and introducing new technologies; and we innovate to redefine what is possible.
As one example, we are pursuing step changes in performance in Nevada by fully integrating the Cortez and Goldstrike operations. Over the past two years, these mines have benefited from increasing collaboration, including joint metal planning to optimize ore processing. By fully integrating the management of their assets, infrastructure, and expertise, we expect to further accelerate improvements in efficiency and productivity. For example, we will fully integrate processing operations and create an integrated digital operations management center that will serve both mines—all under a single, site-based leadership structure. We will also develop an integrated strategic plan for the combined operation that optimizes site resources and capital spending to maximize long-term value creation.
Our digital transformation will be anotherBest-in-Class priority for 2017. Since announcing our partnership with Cisco in September, we have completed proofs of concept for digital projects at Cortez, our pilot digital operation, and we are now implementing them in the field. This work is supported from our digital innovation center in Elko, Nevada, where frontline operators are working with software programmers and other external partners to develop customized digital solutions.
The integration of Cortez and Goldstrike will also allow us to further accelerate the implementation and impact of digital transformation in Nevada. As we continue to demonstrate value in the field, we intend to expand digital solutions to other Barrick operations, starting at Veladero, with a focus on
| | | | |
| BARRICK 2016 FULL YEAR AND FOURTH QUARTER | | 2 | | PRESS RELEASE |
digital environmental management systems. We will provide further updates on digital projects during our Operations and Technical Update on February 22.
While today’s digital technologies are already helping to improve the productivity and efficiency of our operations, in 2017 we will develop a long-term innovation strategy to redefine what is possible in mining, including an innovation road map for the Company.
GROWING FREE CASH FLOW PER SHARE THROUGH SUPERIOR PORTFOLIO MANAGEMENT
In 2016, we continued to strengthen our investment review and capital allocation process with the appointment of Mark Hill as the Company’s first Chief Investment Officer. Mr. Hill was Head of Mining and led the Evaluations group at Waterton Global Resource Management, a private investement firm with an outstanding track record of capital allocation—expertise he combines with earlier experience at Barrick. The Chief Investment Officer is responsible for ensuring that a high degree of consistency and rigor is applied to all capital allocation decisions at the Company—whether at existing operations, development projects, exploration (both near-mine and greenfields), or potential acquisitions and divestments. As part of our revamped capital allocation system, all proposals go through a rigorous, independent peer review process led by our Evaluations team, before they go to the Investment Committee. They are then ranked, prioritized, and sequenced to optimize capital spending over time on a strategic basis, allowing us to anticipate and plan for funding requirements.
We expect our portfolio to deliver a10-15 percent return on invested capital through metal price cycles and, as such, all new capital spending is measured against a hurdle rate of 15 percent based on the Company’s long-term gold price assumption of $1,200 per ounce. Over time, assets that are unable to meet our return expectations will be divested. We are also continuously evaluating external opportunities to increase the long-term value of our portfolio through acquisitions, joint ventures, and other partnerships.
GROWING FREE CASH FLOW PER SHARE THROUGH PARTNERSHIPS
We believe an authentic partnership culture is our most distinctive and sustainable competitive advantage. For Barrick, partnership means a trust-based culture, and the currency of trust is transparency. It is a culture of peers. Those who are part of Barrick recognize that in general, the collective is stronger than the aggregation of individuals. By embracing these values, we aim to be the preferred partner of host governments and communities, the most sought-after employer among the world’s best talent, and the natural choice for long-term investors.
Last year, we created a program to make every Barrick employee—from the rock face to the head office—an owner of the Company, with an initial allocation of 25 common shares per person. We expect this to grow over time, in line with Barrick’s performance. Our goal is not simply to be aligned with our owners, we want our people tobe owners.
We also created a new partnership with Cisco to drive Barrick’s digital transformation. Working with Cisco and other technology partners, we have begun to develop our flagship digital operation at the Cortez mine in Nevada—embedding digital technology in every dimension of the mine to deliver better, faster, and safer mining. This transformation will improve not only productivity and efficiency, but also environmental and safety performance—which will allow Barrick to build and maintain greater trust with communities, governments, NGOs, and other partners.
| | | | |
| BARRICK 2016 FULL YEAR AND FOURTH QUARTER | | 3 | | PRESS RELEASE |
We continue to strengthen our relationships with other external partners, including Zijin Mining, Ma’aden, and Antofagasta Plc—our joint venture partners at the Porgera, Jabal Sayid, and Zaldívar mines. And we are working to develop new partnerships with the potential to unlock value across our business, and grow free cash flow per share over the long term.
OUTLOOK 2017-2019
In 2017, we expect to produce5.60-5.90 million ounces of gold, at a cost of sales applicable to gold of$780-$820 per ounce, andall-in sustaining costs3 of$720-$770 per ounce. This represents an improvement over our previous 2017 guidance of5.0-5.5 million ounces of gold, atall-in sustaining costs3 of$740-$790 per ounce. As we did last year, our intention is to improve upon our plans as we advance our digital transformation, and otherBest-in-Class initiatives.
For 2017, we are once again targeting a free cash flow breakeven gold price of $1,000 per ounce, which should ensure that we can generate cash in periods of lower gold prices, while generating a windfall when gold prices rise.
For 2018, we expect to produce4.80-5.30 million ounces of gold, at a cost of sales applicable to gold of$790-$840 per ounce, andall-in sustaining costs3 of$710-$770 per ounce.
In 2019, we expect to produce4.60-5.10 million ounces of gold, at a cost of sales applicable to gold of$800-$870 per ounce, andall-in sustaining costs3 of$700-$770 per ounce.
Based on our current asset mix and subject to potential divestments, we expect to maintain annual production of at least 4.5 million ounces of gold through 2021.
Please see page 11 for detailed operating and capital expenditure guidance. The table found in the appendix at the end of this press release outlines the material assumptions used to develop the forward-looking statements in our outlook and guidance, and provides an economic sensitivity analysis of those assumptions. For certain related risk factors, please see the cautionary statement on forward-looking information at the end of this press release.
FINANCIAL HIGHLIGHTS
Full-year net earnings were $655 million ($0.56 per share), compared to a net loss of $2.84 billion ($2.44 per share) in 2015. In 2016, adjusted net earnings1 were $818 million ($0.70 per share), compared to $344 million ($0.30 per share) in 2015.
This significant improvement in earnings was largely due to $3.9 billion of impairment charges recorded in 2015, compared to net impairment reversals of $250 million recorded in 2016. Higher earnings were also driven by higher gold and copper prices, combined with higher sales volumes (excluding the impact of divested sites), lower operating costs, and lower expenses for exploration, evaluation, and projects.
After adjusting for items that are not indicative of future operating earnings, adjusted net earnings1 of $818 million in 2016 were 138 percent higher than in 2015. This improvement was primarily due to higher gold and copper prices, higher gold and copper sales volumes (excluding the impact of divested sites), and lower operating costs.
| | | | |
| BARRICK 2016 FULL YEAR AND FOURTH QUARTER | | 4 | | PRESS RELEASE |
Significant adjusting items to net earnings(pre-tax andnon-controlling interest effects) in 2016 include:
| | • | | $199 million in foreign currency translation losses, including deferred currency translation losses released as a result of the disposal and reorganization of certain Australian entities in the first quarter of 2016, and unrealized foreign currency translation losses related to the devaluation of the Argentine Peso on VAT receivables; |
| | • | | $114 million in other expense adjustments primarily relating to losses on debt extinguishment, partly offset by insurance proceeds relating to the 2015 oxygen plant motor failure at Pueblo Viejo; |
| | • | | $43 million in significant tax adjustments primarily relating to a tax provision in Acacia in the first quarter of 2016; |
| | • | | $42 million in disposition losses primarily relating to the divestment of 50 percent of Zaldívar; |
| | • | | The above are partially offset by $250 million in net impairment reversals at Veladero and Lagunas Norte in the fourth quarter of 2016, net of an impairment charge relating to the write down of our retained equity method investment in Zaldívar. |
Full-year revenues were $8.56 billion, compared to $9.03 billion in 2015. Operating cash flow in 2016 was $2.64 billion, compared to $2.79 billion in 2015. Free cash flow2 for 2016 was $1.51 billion, compared to $471 million6 in 2015.
Excluding the proceeds of the Pueblo Viejo streaming transaction in 2015, operating cash flow for 2016 was $456 million higher than the prior year, despite a $355 million reduction in operating cash flow associated with the divestment ofnon-core assets. Strong operating cash flow was driven by higher gold prices and lower direct mining costs, as a result of lower energy and fuel costs (despite being hedged on a significant portion of our fuel consumption), combined with lower labor, consumable, and contractor costs, and improved operating efficiencies driven byBest-in-Class initiatives, as well as lower cash interest paid.
Fourth quarter net earnings were $425 million ($0.36 per share), compared to a net loss of $2.62 billion ($2.25 per share) in the prior-year period. Adjusted net earnings1 for the fourth quarter were $255 million ($0.22 per share), compared to $91 million ($0.08 per share) in the prior-year period.
Net earnings in the fourth quarter reflect an increase in realized gold and copper prices, and lower cost of sales, in addition to $146 million (net of tax effects andnon-controlling interests) in net impairment reversals, compared to impairment charges of $2.6 billion (net of tax effects andnon-controlling interests) recorded in the fourth quarter of 2015.
Fourth quarter revenues were $2.32 billion, compared to $2.24 billion in the prior-year period. Operating cash flow in the fourth quarter was $711 million, compared to $698 million in the fourth quarter of 2015. Free cash flow2 for the fourth quarter was $385 million, compared to $387 million in the prior year period.
RESTORING A STRONG BALANCE SHEET
Achieving and maintaining a strong balance sheet remains a top priority. In 2016, we reduced our total debt by $2.04 billion, or 20 percent, slightly exceeding our $2 billion target for the year.
| | | | |
| BARRICK 2016 FULL YEAR AND FOURTH QUARTER | | 5 | | PRESS RELEASE |
At the end of the fourth quarter, Barrick had a consolidated cash balance of approximately $2.4 billion.7 Barrick has less than $200 million in debt due before 2019.8 About $5 billion, or 63 percent of our outstanding total debt of $7.9 billion, does not mature until after 2032.
We intend to reduce our total debt by $2.9 billion, to $5 billion, by the end of 2018—half of which we are targeting in 2017. We will achieve this by using cash flow from operations, selling additionalnon-core assets, and creating new joint ventures and partnerships.
OPERATING HIGHLIGHTS
Barrick’s operations delivered progressively-stronger performance over the course of 2016, with three consecutive quarters of improvedall-in sustaining cost guidance and gold production at the high end of our annual production forecast. These results reflect our ongoing focus on capital discipline, andBest-in-Class improvements that are driving greater productivity and efficiency.
We also improved our safety performance, achieving a total reportable injury frequency rate (TRIFR)9 of 0.40—the best result in the Company’s history. Since 2009, we have reduced our TRIFR by 67 percent. Despite these improvements, Meckson Makompe, an employee at our Lumwana mine, lost his life in a workplace accident last year. Subsequently, Williams Garrido, a contractor working at the Pascua-Lama project, was involved in a fatal accident this month. Every person at Barrick must go home safe and healthy every single day, and we will never be satisfied with our performance until we achieve this paramount goal.
In 2016, our mines produced 5.52 million ounces of gold, at a cost of sales applicable to gold of $798 per ounce.All-in sustaining costs3 were $730 per ounce, a reduction of 12 percent compared to 2015. We also reduced our cash costs3 by eight percent, from $596 per ounce in 2015, to $546 per ounce in 2016.
Gold production in the fourth quarter was 1.52 million ounces, at a cost of sales applicable to gold of $784 per ounce, andall-in sustaining costs3 of $732 per ounce, compared to 1.62 million ounces at a cost of sales of $848 per ounce, andall-in sustaining costs3 of $733 per ounce in the prior-year period.
Copper production in 2016 was 415 million pounds, at a cost of sales attribute to copper of $1.43 per pound, andall-in sustaining costs10 of $2.05 per pound, in line with our guidance for the year. This compares to 511 million pounds, at a cost of sales attributable to copper of $1.65 per pound, andall-in sustaining costs10 of $2.33 per pound in 2015.
The Jabal Sayid project, a50-50 joint venture with Saudi Arabian Mining Company (Ma’aden), commenced commercial production on July 1, 2016. Barrick’s 50 percent share of production in 2017 is expected to be30-40 million pounds.
In 2016, capital expenditures on a cash basis were $1.12 billion, compared to $1.71 billion in 2015. A decrease of $327 million, excluding the impact of $260 million in capital expenditures associated with divested sites, was primarily due to lower capitalized stripping costs at Veladero, a decrease in leach pad expansion costs at Veladero and Lagunas Norte, and our ongoing focus on capital discipline across the Company. Lower capital costs also reflected lower project spending compared to 2015, mainly relating to the completion of the thiosulfate leaching circuit at Goldstrike, and decreased capital expenditures at Pascua-Lama.
| | | | |
| BARRICK 2016 FULL YEAR AND FOURTH QUARTER | | 6 | | PRESS RELEASE |
| | | | | | | | | | | | |
Gold | | Fourth Quarter
2016 | | | Full Year
2016 | | | 2017
Guidance | |
Production (000s of ounces) | | | 1,516 | | | | 5,517 | | | | 5,600-5,900 | |
Cost of sales applicable to gold ($ per ounce) | | | 784 | | | | 798 | | | | 780-820 | |
All-in sustaining costs ($ per ounce)3 | | | 732 | | | | 730 | | | | 720-770 | |
| | | |
Copper | | | | | | | | | |
Production (millions of pounds) | | | 101 | | | | 415 | | | | 400-450 | |
Cost of sales applicable to copper ($ per pound) | | | 1.45 | | | | 1.43 | | | | 1.50-1.70 | |
All-in sustaining costs ($ per pound)10 | | | 2.04 | | | | 2.05 | | | | 2.10-2.40 | |
Total Attributable Capital Expenditures ($ millions) | | | 1,357 | | | | 1,122 | | | | 1,300-1,500 | |
MINERAL RESOURCE MANAGEMENT
Barrick manages the industry’s largest inventory of gold reserves and resources5, with a strong track record of adding reserves and resources at our operations and projects through exploration.
The Company’s five core mines, which are expected to account for approximately 70 percent of our production in 2017, have an average reserve grade of 1.84 grams per tonne—more than double that of our peer group average.5 The majority of our reserves and resources are situated in regions where we have proven operating experience, a critical mass of infrastructure, technical and exploration expertise, and established partnerships with suppliers, host governments, and communities.
To calculate our 2016 reserves, we have applied a short-term gold price assumption of $1,000 per ounce for the next four years, and a long-term gold price of $1,200 per ounce from 2021 onwards, consistent with our approach in 2015.
As of December 31, 2016, Barrick’s proven and probable gold reserves were 85.9 million ounces4, compared to 91.9 million ounces at the end of 2015. Approximately 1.9 million ounces were divested last year, and 6.8 million ounces were depleted through mining and processing. We replaced approximately 60 percent of the ounces we depleted through drilling and cost improvements at our operating mines. Significant additions included 1.1 million ounces at Lagunas Norte, 920,000 ounces at Hemlo, and 640,000 ounces at the Goldstrike underground mine. Reserves at Pascua-Lama declined by 1.3 million ounces as a result of design modifications to enhance safety and environmental mitigation at the project. Reserves at Acacia’s Bulyanhulu mine also declined by 430,000 ounces.
In 2016, measured, indicated, and inferred resources were calculated using a gold price assumption of $1,500 per ounce. This compares to $1,300 per ounce in 2015.
Measured and indicated gold resources decreased to 75.2 million ounces4 at the end of 2016, compared to 79.1 million ounces at the end of 2015. Approximately 4.3 million ounces of measured and indicated gold resources were divested in 2016, and 2.7 million ounces were upgraded to proven and probable gold reserves. Approximately 5.3 million ounces were added to measured and indicated resources as a result of using a $1,500 per ounce gold price assumption.
| | | | |
| BARRICK 2016 FULL YEAR AND FOURTH QUARTER | | 7 | | PRESS RELEASE |
Inferred gold resources increased to 30.7 million ounces4 at the end of 2016, compared to 27.4 million ounces at the end of 2015. Approximately 3.2 million ounces were upgraded to measured and indicated resources. Approximately 5.3 million ounces were added through drilling, including 2.0 million ounces at Veladero, 1.3 million ounces at Hemlo and 1.1 million ounces at Alturas. Approximately 1.7 million ounces were added to inferred resources as a result of using a $1,500 per ounce gold price assumption. The addition of 5.2 million ounces of inferred gold resources through drilling underscores the value of our investments in near-mine exploration, and sets the stage for replenishing and upgrading our reserve and resource portfolio in future years.
Proven and probable copper reserves were calculated using a short-term copper price of $2.25 per pound, and a long-term price of $2.75 per pound. This compares to a short-term copper price of $2.75 per pound, and a long-term price of $3.00 per pound, in 2015.
Copper reserves, including copper within gold reserves, were 11.1 billion pounds4 at the end of 2016, compared to 11.7 billion pounds, at the end of 2015. Measured and indicated copper resources, including copper within measured and indicated gold resources, increased slightly to 9.7 billion pounds4, compared to 9.6 billion pounds, at the end of 2016.
EXPLORATION AND PROJECTS
Barrick has the largest gold reserves and resources in the industry5, including some of the largest undeveloped gold projects in the world, which gives us significant optionality and leverage to gold prices. We have a demonstrated track record of creating value through exploration. Since 1990, we have found 143 million ounces of gold for an overall discovery cost of $25 per ounce, or roughly half the average finding cost across the industry.
After several years of exploration focused primarily on existing core districts and projects, we are increasing our budget and broadening our focus to include new greenfield opportunities.
Approximately 80 percent of our total exploration budget of$185-$225 million is allocated to the Americas. The majority of the remaining budget is allocated to Acacia. Our exploration programs balance high-quality brownfield projects, greenfield exploration, and emerging discoveries that have the potential to become profitable mines.
In the short term, every one of our operating mines has the potential to identify new reserves and resources through near-mine exploration (MINEX). In many cases, these ounces can be quickly incorporated into mine plans, driving improvements in production, cash flow, and earnings.
Over the medium term, we are advancing a pipeline of high-confidence projects at or near our existing operations. These projects remain on track, with the potential to begin contributing new production to our portfolio beginning in 2021. This includes three significant projects in Nevada: the Cortez Deep South underground expansion; the potential development of an underground mine at Goldrush; and a significant expansion of throughput at the Turquoise Ridge mine. At the Lagunas Norte mine in Peru, we are advancing a project to extend the life of the mine by mining the refractory material below the oxide ore body in the current open pit.
At the Alturas project in Chile, we have added an additional 1.1 million ounces of inferred gold resources, bringing the total inferred resource to 6.8 million ounces.4 We expect to complete a scoping study for Alturas in 2017. We have also initiated a prefeasibility study to evaluate the construction of an underground mine at Lama, on the Argentinean side of the Pascua-Lama project.
| | | | |
| BARRICK 2016 FULL YEAR AND FOURTH QUARTER | | 8 | | PRESS RELEASE |
If the study concludes that a phased underground development option meets our risk and financial criteria, and is a more compelling investment proposition than the permittedbi-national open pit plan, we would expect to recalculate reserves and resources at Pascua-Lama to reflect an underground mine plan, likely resulting in a reduction to current reserves and resources at the project.
We will provide further details on these projects during our Operations and Technical Update on February 22. Visit www.barrick.com for webcast details.
Our successful track record of greenfield exploration, combined with our existing pipeline of undeveloped projects, represents significant long-term value and optionality for our shareholders.
Highlights of our greenfield exploration program for 2017 include the Fourmile target, adjacent to our Goldrush discovery in Nevada, and the Frontera District on the border of Argentina and Chile. We have also formed new partnerships with Alicanto Minerals in Guyana, and Osisko Mining in the Labrador Trough of Northern Québec, where we see the potential to develop new core mineral districts for Barrick.
Our portfolio also contains a number of the world’s largest undeveloped gold deposits, including Donlin Gold, Cerro Casale, and Pascua-Lama. These projects contain nearly 31.5 million ounces of gold in proven and probable reserves4 (Barrick’s share), and 29.3 million ounces in measured and indicated resources4 (Barrick’s share).
At Donlin Gold, we continue to advance through the permitting process. We are also working with our joint venture partner on strategies to further optimize the project. This includes evaluating alternative development scenarios with the potential to lower capital intensity, as well as incorporating innovation, automation, and otherBest-in-Class opportunities to improve overall economics.
At Pascua-Lama, the initiation of a prefeasibility study for an underground mine at Lama in Argentina represents an opportunity to unlock the value of this deposit, and the wider district, through a phased approach that reduces execution risks and upfront capital requirements. Concurrently, the team in Chile remains focused on optimizing the Chilean components of the project.
FILING OF SHELF PROSPECTUS
Shortly, Barrick intends to file an MJDS universal shelf prospectus qualifying for distribution of securities with an aggregate offering amount of up to $4 billion with Canadian securities regulators and the United States Securities and Exchange Commission. The filing of a shelf prospectus is consistent with the practice of the majority of issuers included in the S&P/TSX 60 Index. The filing provides the Company with increased financing flexibility over the next 25 month period. We have no current intention to offer securities under the shelf prospectus.
| | | | |
| BARRICK 2016 FULL YEAR AND FOURTH QUARTER | | 9 | | PRESS RELEASE |
TECHNICAL INFORMATION
The scientific and technical information contained in this press release has been reviewed and approved by Steven Haggarty, P. Eng., Senior Director, Metallurgy of Barrick, Rick Sims, Registered Member SME, Senior Director, Resources and Reserves of Barrick, and Patrick Garretson, Registered Member SME, Senior Director, Life of Mine Planning of Barrick, each a “Qualified Person” as defined in National Instrument43-101 Standards of Disclosure for Mineral Projects.
| | | | |
| BARRICK 2016 FULL YEAR AND FOURTH QUARTER | | 10 | | PRESS RELEASE |
Detailed operating and capital expenditure guidance is as follows:
| | | | | | | | | | |
2017 GOLD PRODUCTION AND COSTS |
| | | Production
(millions of
ounces) | | | Cost of sales
($ per ounce) | | Cash costs3
($ per ounce) | | All-in sustaining
costs3
($ per ounce) |
Cortez | | | 1.250-1.290 | | | 730-760 | | 360-380 | | 430-470 |
Goldstrike | | | 0.910-0.950 | | | 950-990 | | 650-680 | | 910-980 |
Pueblo Viejo (60%) | | | 0.625-0.650 | | | 650-680 | | 400-420 | | 530-560 |
Lagunas Norte | | | 0.380-0.420 | | | 710-780 | | 430-470 | | 560-620 |
Veladero | | | 0.770-0.830 | | | 750-800 | | 500-540 | | 840-940 |
Sub-total | | | 3.900-4.100 | | | 770-810 | | 470-500 | | 650-710 |
Turquoise Ridge (75%) | | | 0.260-0.280 | | | 575-625 | | 460-500 | | 650-730 |
Porgera (47.5%) | | | 0.250-0.270 | | | 780-840 | | 650-700 | | 900-970 |
Kalgoorlie (50%) | | | 0.390-0.410 | | | 750-790 | | 600-630 | | 670-710 |
Acacia (63.9%) | | | 0.545-0.575 | | | 860-910 | | 580-620 | | 880-920 |
Hemlo | | | 0.205-0.220 | | | 800-860 | | 640-690 | | 880-980 |
Golden Sunlight | | | 0.035-0.050 | | | 900-1,200 | | 900-950 | | 950-1,040 |
Total Gold | | | 5.600-5.900 | | | 780-820 | | 510-535 | | 720-770 |
2017 COPPER PRODUCTION AND COSTS
| | | | | | | | |
| | | Production
(millions of
pounds) | | Cost of sales
($ per pound) | | C1 cash costs10
($ per pound) | | All-in sustaining
costs10
($ per pound) |
Zaldívar (50%) | | 120-135 | | 2.00-2.20 | | ~1.50 | | 1.90-2.10 |
Lumwana | | 250-275 | | 1.20-1.40 | | 1.40-1.60 | | 2.10-2.30 |
Jabal Sayid (50%) | | 30-40 | | 2.10-2.80 | | 1.50-1.90 | | 2.30-2.80 |
Total Copper | | 400-450 | | 1.50-1.70 | | 1.40-1.60 | | 2.10-2.40 |
2017 CAPITAL EXPENDITURES
| | | | |
| | | ($ millions) | | |
Mine site sustaining | | 1,050-1,200 | | |
Project | | 250-300 | | |
Total | | 1,300-1,500 | | |
| | | | |
| BARRICK 2016 FULL YEAR AND FOURTH QUARTER | | 11 | | PRESS RELEASE |
2018-2019 GOLD PRODUCTION AND COSTS
| | | | | | | | |
| | | 2018 | | | | 2019 | | |
Production (millions of ounces) | | 4.800-5.300 | | | | 4.600-5.100 | | |
Cost of sales ($ per ounce) | | 790-840 | | | | 800-870 | | |
All-in sustaining costs3($ per ounce) | | 710-770 | | | | 700-770 | | |
2018-2019 CAPITAL EXPENDITURES
| | | | | | | | |
($ millions) | | 2018 | | | | 2019 | | |
Mine site sustaining | | 1,050-1,250 | | | | 850-1,000 | | |
Projects | | 300-400 | | | | 450-500 | | |
Total | | 1,350-1,650 | | | | 1,300-1,500 | | |
| | | | |
| BARRICK 2016 FULL YEAR AND FOURTH QUARTER | | 12 | | PRESS RELEASE |
APPENDIX
2017 Outlook Assumptions and Economic Sensitivity Analysis
| | | | | | | | | | | | |
| | | 2017 Guidance
Assumption | | Hypothetical
Change | | Impact on
Revenue (millions) | | Impact on
Cost of Sales (millions) | | Impact on
AISC3,10 | | |
Gold revenue, net of royalties11 | | $1,050/oz | | +/- $100/oz | | +/- $571 | | n/a | | +/- $3/oz | | |
Copper revenue, net of royalties12 | | $2.25/lb | | + $0.50/lb | | + $213 | | n/a | | + $0.03/lb | | |
Copper revenue, net of royalties12 | | $2.25/lb | | - $0.50/lb | | - $171 | | n/a | | - $0.03/lb | | |
Goldall-in sustaining costs3 | | | | | | | | | | | | |
WTI crude oil price11 | | $55/bbl | | +/- $10/bbl | | n/a | | +/- $17 | | +/- $3/oz | | |
Australian dollar exchange rate | | 0.75 : 1 | | +/- 10% | | n/a | | +/- $29 | | +/- $5/oz | | |
Canadian dollar exchange rate | | 1.32 : 1 | | +/- 10% | | n/a | | +/- $32 | | +/- $6/oz | | |
Copperall-in sustaining costs10 | | | | | | | | | | | | |
WTI crude oil price11 | | $55/bbl | | +/- $10/bbl | | n/a | | +/- $5 | | +/- $0.01/lb | | |
Chilean peso exchange rate | | 675 : 1 | | +/- 10% | | n/a | | +/- $6 | | +/- $0.01/lb | | |
2018 Outlook Assumptions and Economic Sensitivity Analysis
| | | | | | | | | | | | |
| | | 2018 Guidance
Assumption | | Hypothetical
Change | | Impact on
Revenue (millions) | | Impact on
Cost of Sales (millions) | | Impact on
AISC3,10 | | |
Gold revenue, net of royalties | | $1,200/oz | | +/- $100/oz | | +/- $500 | | +/- $14 | | +/- $3/oz | | |
Copper revenue, net of royalties | | $2.50/lb | | +/- $0.50/lb | | +/- $225 | | +/- $15 | | +/-$0.03/lb | | |
Goldall-in sustaining costs3 | | | | | | | | | | | | |
WTI crude oil price11 | | $60/bbl | | +/- $10/bbl | | n/a | | +/- $25 | | +/- $5/oz | | |
Australian dollar exchange rate | | 0.75 : 1 | | +/- 10% | | n/a | | +/- $29 | | +/- $6/oz | | |
Canadian dollar exchange rate | | 1.30 : 1 | | +/- 10% | | n/a | | +/- $32 | | +/- $6/oz | | |
Copperall-in sustaining costs10 | | | | | | | | | | | | |
WTI crude oil price11 | | $60/bbl | | +/- $10/bbl | | n/a | | +/- $6 | | +/- $0.01/lb | | |
Chilean peso exchange rate | | 675 : 1 | | +/- 10% | | n/a | | +/- $4 | | +/- $0.01/lb | | |
2019 Outlook Assumptions and Economic Sensitivity Analysis
| | | | | | | | | | | | |
| | | 2019 Guidance
Assumption | | Hypothetical
Change | | Impact on
Revenue (millions) | | Impact on
Cost of Sales (millions) | | Impact on
AISC3,10 | | |
Gold revenue, net of royalties | | $1,200/oz | | +/- $100/oz | | +/- $475 | | +/- $13 | | +/- $3/oz | | |
Copper revenue, net of royalties | | $2.75/lb | | +/- $0.50/lb | | +/-$200 | | +/- $13 | | +/- $0.03/lb | | |
Goldall-in sustaining costs3 | | | | | | | | | | | | |
WTI crude oil price11 | | $65/bbl | | +/- $10/bbl | | n/a | | +/- $35 | | +/- $7/oz | | |
Australian dollar exchange rate | | 0.75 : 1 | | +/- 10% | | n/a | | +/- $26 | | +/- $5/oz | | |
Canadian dollar exchange rate | | 1.25 : 1 | | +/- 10% | | n/a | | +/- $34 | | +/- $7/oz | | |
Copperall-in sustaining costs10 | | | | | | | | | | | | |
WTI crude oil price11 | | $65/bbl | | +/- $10/bbl | | n/a | | +/- $5 | | +/-$0.01/lb | | |
Chilean peso exchange rate | | 650 : 1 | | +/- 10% | | n/a | | +/- $7 | | +/-$0.02/lb | | |
| | | | |
| BARRICK 2016 FULL YEAR AND FOURTH QUARTER | | 13 | | PRESS RELEASE |
ENDNOTE 1
“Adjusted net earnings” and “adjusted net earnings per share” arenon-GAAP financial performance measures. Adjusted net earnings excludes the following from net earnings: certain impairment charges (reversals), gains (losses) and otherone-time costs relating to acquisitions or dispositions, foreign currency translation gains (losses), significant tax adjustments not related to current period earnings and unrealized gains (losses) onnon-hedge derivative instruments. The Company uses this measure internally to evaluate our underlying operating performance for the reporting periods presented and to assist with the planning and forecasting of future operating results. Barrick believes that adjusted net earnings is a useful measure of our performance because these adjusting items do not reflect the underlying operating performance of our core mining business and are not necessarily indicative of future operating results. Adjusted net earnings and adjusted net earnings per share are intended to provide additional information only and do not have any standardized meaning under IFRS and may not be comparable to similar measures of performance presented by other companies. They should not be considered in isolation or as a substitute for measures of performance prepared in accordance with IFRS. Further details on thesenon-GAAP measures are provided in the MD&A accompanying Barrick’s financial statements filed from time to time on SEDAR at www.sedar.com and on EDGAR at www.sec.gov.
Reconciliation of Net Earnings to Net Earnings per Share, Adjusted Net Earnings and Adjusted Net Earnings per Share
| | | | | | | | | | | | | | | | | | | | |
($ millions, except per share amounts in dollars) | | For the years ended December 31 | | | For the three months ended December 31 | |
| | | 2016 | | | 2015 | | | 2014 | | | 2016 | | | 2015 | |
Net earnings (loss) attributable to equity holders of the Company | | | $655 | | | | ($2,838) | | | | ($2,907) | | | | $425 | | | | $(2,622) | |
Impairment charges related to intangibles, goodwill, property, plant and equipment, and investments | | | (250) | | | | 3,897 | | | | 4,106 | | | | (304) | | | | 3,405 | |
Acquisition/disposition (gains)/losses | | | 42 | | | | (187) | | | | (50) | | | | 7 | | | | (107) | |
Foreign currency translation (gains)/losses | | | 199 | | | | 120 | | | | 132 | | | | 18 | | | | 132 | |
Significant tax adjustments1 | | | 43 | | | | 134 | | | | (3) | | | | (16) | | | | 95 | |
Other expense adjustments2 | | | 114 | | | | 135 | | | | 119 | | | | 39 | | | | 40 | |
Unrealized gains onnon-hedge derivative instruments | | | (32) | | | | 11 | | | | 181 | | | | (9) | | | | 4 | |
Tax effect andnon-controlling interest | | | 47 | | | | (928) | | | | (785) | | | | 95 | | | | (856) | |
Adjusted net earnings | | | $818 | | | | $344 | | | | $793 | | | | $255 | | | | $91 | |
Net earnings (loss) per share3 | | | 0.56 | | | | (2.44) | | | | (2.50) | | | | 0.36 | | | | (2.25) | |
Adjusted net earnings per share3 | | | 0.70 | | | | 0.30 | | | | 0.68 | | | | 0.22 | | | | 0.08 | |
| 1 | Significant tax adjustments for the current year primarily relate to a tax provision booked by Acacia in Q1 2016. |
| 2 | Other expense adjustments for the current year relate to losses on debt extinguishment, the impact of the decrease in the discount rate used to calculate the provision for environmental remediation at our closed mines and a reduction in cost of sales attributed to insurance proceeds recorded in the third quarter of 2016 relating to the 2015 oxygen plant motor failure at Pueblo Viejo. |
| 3 | Calculated using weighted average number of shares outstanding under the basic method of earnings per share. |
ENDNOTE 2
“Free cash flow” is anon-GAAP financial performance measure which excludes capital expenditures from Net cash provided by operating activities. Barrick believes this to be a useful indicator of our ability to operate without reliance on additional borrowing or usage of existing cash. Free cash flow is intended to provide additional information only and does not have any standardized meaning under IFRS and may not be comparable to similar measures of performance presented by other companies. Free cash flow should not be considered in isolation or as a substitute for measures of performance prepared in accordance with IFRS. Further details on thesenon-GAAP measures are provided in the MD&A accompanying Barrick’s financial statements filed from time to time on SEDAR at www.sedar.com and on EDGAR at www.sec.gov.
Reconciliation of Net Cash Provided by Operating Activities to Free Cash Flow
| | | | | | | | | | | | | | | | | | | | |
($ millions) | | For the years ended December 31 | | | For the three months ended December 31 | |
| | | 2016 | | | 2015 | | | 2014 | | | 2016 | | | 2015 | |
Net cash provided by operating activities | | | $2,640 | | | | $2,794 | | | | $2,296 | | | | $711 | | | | $698 | |
Capital expenditures | | | (1,126) | | | | (1,713) | | | | (2,432) | | | | (326) | | | | (311) | |
Free cash flow | | | $1,514 | | | | $1,081 | | | | ($136) | | | | $385 | | | | $387 | |
| | | | |
| BARRICK 2016 FULL YEAR AND FOURTH QUARTER | | 14 | | PRESS RELEASE |
ENDNOTE 3
“Cash costs” per ounce and“All-in sustaining costs” per ounce arenon-GAAP financial performance measures. “Cash costs” per ounce is based on cost of sales but excludes, among other items, the impact of depreciation.“All-in sustaining costs” per ounce begins with “Cash costs” per ounce and adds further costs which reflect the additional costs of operating a mine, primarily sustaining capital expenditures, general & administrative costs and minesite exploration and evaluation costs. Barrick believes that the use of “cash costs” per ounce and“all-in sustaining costs” per ounce will assist investors, analysts and other stakeholders in understanding the costs associated with producing gold, understanding the economics of gold mining, assessing our operating performance and also our ability to generate free cash flow from current operations and to generate free cash flow on an overall Company basis. “Cash costs” per ounce and“All-in sustaining costs” per ounce are intended to provide additional information only and do not have any standardized meaning under IFRS. Although a standardized definition ofall-in sustaining costs was published in 2013 by the World Gold Council (a market development organization for the gold industry comprised of and funded by 18 gold mining companies from around the world, including Barrick), it is not a regulatory organization, and other companies may calculate this measure differently. These measures should not be considered in isolation or as a substitute for measures prepared in accordance with IFRS. Further details on thesenon-GAAP measures are provided in the MD&A accompanying Barrick’s financial statements filed from time to time on SEDAR at www.sedar.com and on EDGAR at www.sec.gov.
Reconciliation of Gold Cost of Sales to Cash costs,All-in sustaining costs andAll-in costs, including on a per ounce basis
| | | | | | | | | | | | | | | | | | | | | | |
($ millions, except per ounce information in dollars) | | | | For the years ended December 31 | | | For the three months ended December 31 | |
| | | Footnote | | 2016 | | | 2015 | | | 2014 | | | 2016 | | | 2015 | |
Cost of sales related to gold production | | | | | $ 4,979 | | | | $ 5,904 | | | | $ 5,893 | | | | $ 1,347 | | | | $ 1,575 | |
Depreciation | | | | | (1,503 | ) | | | (1,613 | ) | | | (1,414 | ) | | | (396 | ) | | | (462) | |
By-product credits | | 1 | | | (184 | ) | | | (214 | ) | | | (271 | ) | | | (41 | ) | | | (48) | |
Realized (gains)/losses on hedge andnon-hedge derivatives | | 2 | | | 89 | | | | 128 | | | | (94 | ) | | | 18 | | | | 50 | |
Non-recurring items | | 3 | | | 24 | | | | (210 | ) | | | - | | | | - | | | | (149) | |
Other | | 4 | | | (44 | ) | | | 25 | | | | 26 | | | | (20 | ) | | | 7 | |
Non-controlling interests (Pueblo Viejo and Acacia) | | 5 | | | (358 | ) | | | (394 | ) | | | (379 | ) | | | (91 | ) | | | (78) | |
Cash costs | | | | | $ 3,003 | | | | $ 3,626 | | | | $ 3,761 | | | | $ 817 | | | | $ 895 | |
General & administrative costs | | | | | 256 | | | | 233 | | | | 385 | | | | 39 | | | | 52 | |
Minesite exploration and evaluation costs | | 6 | | | 44 | | | | 47 | | | | 38 | | | | 18 | | | | 11 | |
Minesite sustaining capital expenditures | | 7 | | | 944 | | | | 1,359 | | | | 1,638 | | | | 298 | | | | 303 | |
Rehabilitation - accretion and amortization (operating sites) | | 8 | | | 59 | | | | 145 | | | | 135 | | | | 18 | | | | 26 | |
Non-controlling interest, copper operations and other | | 9 | | | (287 | ) | | | (362 | ) | | | (532 | ) | | | (78 | ) | | | (86) | |
All-in sustaining costs | | | | | $ 4,019 | | | | $ 5,048 | | | | $ 5,425 | | | | $ 1,112 | | | | $ 1,201 | |
Project exploration and evaluation and project costs | | 6 | | | 193 | | | | 308 | | | | 354 | | | | 64 | | | | 75 | |
Community relations costs not related to current operations | | | | | 8 | | | | 12 | | | | 29 | | | | 2 | | | | - | |
Project capital expenditures | | 7 | | | 175 | | | | 133 | | | | 596 | | | | 51 | | | | (48) | |
Rehabilitation - accretion and amortization(non-operating sites) | | 8 | | | 11 | | | | 12 | | | | 11 | | | | 4 | | | | 3 | |
Non-controlling interest and copper operations | | 9 | | | (42 | ) | | | (43 | ) | | | (74 | ) | | | (4 | ) | | | (20) | |
All-in costs | | | | | $ 4,364 | | | | $ 5,470 | | | | $ 6,341 | | | | $ 1,229 | | | | $ 1,211 | |
Ounces sold - equity basis (000s ounces) | | 10 | | | 5,503 | | | | 6,083 | | | | 6,284 | | | | 1,519 | | | | 1,636 | |
Cost of sales per ounce | | 11,12 | | | $ 798 | | | | $ 859 | | | | $ 842 | | | | $ 784 | | | | $ 848 | |
Cash costs per ounce | | 12 | | | $ 546 | | | | $ 596 | | | | $ 598 | | | | $ 540 | | | | $ 547 | |
Cash costs per ounce (on aco-product basis) | | 12,13 | | | $ 569 | | | | $ 619 | | | | $ 618 | | | | $ 557 | | | | $ 566 | |
All-in sustaining costs per ounce | | 12 | | | $ 730 | | | | $ 831 | | | | $ 864 | | | | $ 732 | | | | $ 733 | |
All-in sustaining costs per ounce (on aco-product basis) | | 12,13 | | | $ 753 | | | | $ 854 | | | | $ 884 | | | | $ 749 | | | | $ 752 | |
All-in costs per ounce | | 12 | | | $792 | | | | $900 | | | | $1,010 | | | | $809 | | | | $741 | |
All-in costs per ounce (on aco-product basis) | | 12,13 | | | $ 815 | | | | $ 923 | | | | $ 1,030 | | | | $ 826 | | | | $ 760 | |
| | | | |
BARRICK 2016 FULL YEAR AND FOURTH QUARTER | | 15 | | PRESS RELEASE |
| | Revenues include the sale ofby-products for our gold and copper mines for the three months ended December 31, 2016 of $41 million (2015: $34 million) and the year ended December 31, 2016 of $151 million (2015: $140 million; 2014: $183 million) and energy sales from the Monte Rio power plant at our Pueblo Viejo mine for the three months ended December 31, 2016 of $nil (2015: $14 million) and the year ended December 31, 2016, of $33 million (2015: $74 million; 2014: $88 million) up until its disposition on August 18, 2016. |
| 2 | Realized (gains)/losses on hedge andnon-hedge derivatives |
| | Includes realized hedge losses of $14 million and $73 million for the three months and year ended December 31, 2016, respectively (2015: $40 million and $106 million, respectively; 2014: $86 million gains), and realizednon-hedge losses of $4 million and $16 million for the three months and year ended December 31, 2016, respectively (2015: $10 million and $22 million, respectively; 2014: $8 million gains). Refer to Note 5 of the Financial Statements for further information. |
| | Non-recurring items in 2016 consist of $34 million in a reduction in cost of sales attributed to insurance proceeds recorded in the third quarter of 2016 relating to the 2015 oxygen plant motor failure at Pueblo Viejo and $10 million in abnormal costs at Veladero relating to the administrative fine in connection to the cyanide incident that occurred in 2015. These gains/costs are not indicative of our cost of production and have been excluded from the calculation of cash costs. |
| | Other adjustments include adding the net margins related to power sales at Pueblo Viejo of $nil and $5 million, respectively, (2015: $2 million and $12 million, respectively; 2014: $16 million) and adding the cost of treatment and refining charges of $4 million and $16 million, respectively (2015: $4 million and $14 million, respectively; 2014: $11 million). 2016 includes the removal of cash costs associated with our Pierina mine which is mining incidental ounces as it enters closure of $24 million and $66 million, respectively. |
| 5 | Non-controlling interests (Pueblo Viejo and Acacia) |
| | Non-controlling interests includenon-controlling interests related to gold production of $127 million and $508 million, respectively, for the three months and year ended December 31, 2016 (2015: $188 million and $681 million, respectively; 2014: $602 million). Refer to Note 5 of the Financial Statements for further information. |
| 6 | Exploration and evaluation costs |
| | Exploration, evaluation and project expenses are presented as minesite sustaining if it supports current mine operations and project if it relates to future projects. Refer to page 45 of Barrick’s Fourth Quarter andYear-End 2016 Report. |
| | Capital expenditures are related to our gold sites only and are presented on a 100% accrued basis. They are split between minesite sustaining and project capital expenditures. Project capital expenditures are distinct projects designed to increase the net present value of the mine and are not related to current production. Significant projects in the current year are Arturo, Cortez Lower Zone and Lagunas Norte Refractory Ore Project. Refer to page 44 of Barrick’s Fourth Quarter andYear-End 2016 Report. |
| 8 | Rehabilitation—accretion and amortization |
| | Includes depreciation on the assets related to rehabilitation provisions of our gold operations and accretion on the rehabilitation provision of our gold operations, split between operating andnon-operating sites. |
| 9 | Non-controlling interest and copper operations |
| | Removes general & administrative costs related tonon-controlling interests and copper based on a percentage allocation of revenue. Also removes exploration, evaluation and project costs, rehabilitation costs and capital expenditures incurred by our copper sites and thenon-controlling interest of our Acacia and Pueblo Viejo operating segment and Arturo. In 2016, figures remove the impact of Pierina. The impact is summarized as the following: |
| | | | | | | | | | | | | | | | | | | | |
($ millions) | | For the years ended December 31 | | | For the three months
ended December 31 | |
Non-controlling interest, copper operations and other | | 2016 | | | 2015 | | | 2014 | | | 2016 | | | 2015 | |
General & administrative costs | | | ($ 36 | ) | | | ($ 53 | ) | | | ($ 86 | ) | | | ($ 5 | ) | | | ($ 5 | ) |
Minesite exploration and evaluation costs | | | (9 | ) | | | (8 | ) | | | (18 | ) | | | (3 | ) | | | (3 | ) |
Rehabilitation - accretion and amortization (operating sites) | | | (9 | ) | | | (13 | ) | | | (12 | ) | | | (4 | ) | | | (4 | ) |
Minesite sustaining capital expenditures | | | (233 | ) | | | (288 | ) | | | (416 | ) | | | (66 | ) | | | (74 | ) |
All-in sustaining costs total | | | ($ 287 | ) | | | ($ 362 | ) | | | ($ 532 | ) | | | ($ 78 | ) | | | ($ 86 | ) |
Project exploration and evaluation and project costs | | | (12 | ) | | | (11 | ) | | | (43 | ) | | | (4 | ) | | | (9 | ) |
Project capital expenditures | | | (30 | ) | | | (32 | ) | | | (31 | ) | | | - | | | | (11 | ) |
All-in costs total | | | ($ 42 | ) | | | ($ 43 | ) | | | ($ 74 | ) | | | ($ 4 | ) | | | ($ 20 | ) |
| 10 | Ounces sold - equity basis |
| | In 2016, figures remove the impact of Pierina as the mine is currently going through closure. |
| 11 | Cost of sales per ounce |
| | In 2016, figures remove the cost of sales impact of Pierina of $30 million and $82 million, respectively for the three months and year ended December 31, 2016, as the mine is currently going through closure. Cost of sales per ounce excludesnon-controlling interest related to gold productions. Cost of sales related to gold per ounce is calculated using cost of sales on an attributable basis (removing thenon-controlling interest of 40% Pueblo Viejo and 36.1% Acacia from cost of sales), divided by attributable gold ounces. |
| | Cost of sales per ounce, cash costs per ounce,all-in sustaining costs per ounce andall-in costs per ounce may not calculate based on amounts presented in this table due to rounding. |
| 13 | Co-product costs per ounce |
| | | | |
| BARRICK 2016 FULL YEAR AND FOURTH QUARTER | | 16 | | PRESS RELEASE |
Cash costs per ounce,all-in sustaining costs per ounce andall-in costs per ounce presented on aco-product basis remove the impact ofby-product credits of our gold production (net ofnon-controlling interest) calculated as:
| | | | | | | | | | | | | | | | | | | | |
($ millions) | | For the years ended December 31 | | | For the three months
ended December 31 | |
| | | 2016 | | | 2015 | | | 2014 | | | 2016 | | | 2015 | |
By-product credits | | | $184 | | | | $214 | | | | $271 | | | | $41 | | | | $48 | |
Non-controlling interest | | | (53) | | | | (62) | | | | (80) | | | | (13) | | | | (14) | |
By-product credits (net ofnon-controlling interest) | | | $131 | | | | $152 | | | | $191 | | | | $28 | | | | $34 | |
ENDNOTE 4
Estimated in accordance with National Instrument43-101 as required by Canadian securities regulatory authorities. Estimates are as of December 31, 2016, unless otherwise noted. Proven reserves of 480.3 million tonnes grading 1.68 g/t, representing 25.9 million ounces of gold, and 173.3 million tonnes grading 0.533%, representing 2.035 billion pounds of copper. Probable reserves of 1.5 billion tonnes grading 1.22 g/t, representing 60.1 million ounces of gold, and 276 million tonnes grading 0.638%, representing 3.886 billion pounds of copper. Measured resources of 82.9 million tonnes grading 2.52 g/t, representing 6.7 million ounces of gold, and 83.2 million tonnes grading 0.410%, representing 753.4 million pounds of copper. Indicated resources of 1.2 billion tonnes grading 1.74 g/t, representing 68.5 million ounces of gold, and 650.3 million tonnes grading 0.526%, representing 7.545 billion pounds of copper. Inferred resources of 781 million tonnes grading 1.22 g/t, representing 30.7 million ounces of gold, and 114.1 million tonnes grading 0.501%, representing 1.259 billion pounds of copper. Complete mineral reserve and mineral resource data for all mines and projects referenced in this press release, including tonnes, grades, and ounces, can be found on pages 88-93 of Barrick’s Fourth Quarter andYear-End 2016 Report.
ENDNOTE 5
Comparison based on the average overall reserve grade for Goldcorp Inc., Kinross Gold Corporation, Newmont Mining Corporation, and Newcrest Mining Limited, as reported in each of the Kinross and Newmont reserve reports as of December 31, 2015, as reported in the Goldcorp reserve report as of June 30, 2016, and as reported in the Newcrest reserve report as of December 31, 2016.
ENDNOTE 6
Excludes $610 million in proceeds related to the Pueblo Viejo streaming transaction.
ENDNOTE 7
Includes $943 million cash primarily held at Acacia and Pueblo Viejo, which may not be readily deployed outside of Acacia and/or Pueblo Viejo.
ENDNOTE 8
Amount excludes capital leases and includes project financing payments at Pueblo Viejo (60% basis) and Acacia (100% basis).
ENDNOTE 9
Total reportable incident frequency rate (TRIFR) is ratio calculated as follows: number of reportable injuries x 200,000 hours divided by the total number of hours worked. Reportable injuries include fatalities, lost time injuries, restricted duty injuries, and medically treated injuries.
ENDNOTE 10
“C1 cash costs” per pound and“All-in sustaining costs” per pound arenon-GAAP financial performance measures. “C1 cash costs” per pound is based on cost of sales but excludes the impact of depreciation and royalties and includes treatment and refinement charges.“All-in sustaining costs” per pound begins with “C1 cash costs” per pound and adds further costs which reflect the additional costs of operating a mine, primarily sustaining capital expenditures, general & administrative costs and royalties. Barrick believes that the use of “C1 cash costs” per pound and“all-in sustaining costs” per pound will assist investors, analysts, and other stakeholders in understanding the costs associated with producing copper, understanding the economics of copper mining, assessing our operating performance, and also our ability to generate free cash flow from current operations and to generate free cash flow on an overall Company basis. “C1 cash costs” per pound and“All-in sustaining costs” per pound are intended to provide additional information only, do not have any standardized meaning under IFRS, and may not be comparable to similar measures of performance presented by other companies. These measures should not be considered in isolation or as a substitute for measures of performance prepared in accordance with IFRS. Further details on thesenon-GAAP
| | | | |
BARRICK 2016 FULL YEAR AND FOURTH QUARTER | | 17 | | PRESS RELEASE |
measures are provided in the MD&A accompanying Barrick’s financial statements filed from time to time on SEDAR at www.sedar.com and on EDGAR at www.sec.gov.
Reconciliation of Copper Cost of Sales to C1 cash costs and All-in sustaining costs, including on a per pound basis
| | | | | | | | | | | | | | | | | | | | |
| ($ millions, except per pound information in dollars) | | For the years ended December 31 | | | For the three months ended December 31 | |
| | | 2016 | | | 2015 | | | 2014 | | | 2016 | | | 2015 | |
Cost of sales | | | $ 319 | | | | $ 814 | | | | $ 954 | | | | $ 84 | | | | $ 116 | |
Depreciation/amortization1 | | | (45) | | | | (104) | | | | (171) | | | | (15) | | | | (23) | |
Treatment and refinement charges | | | 161 | | | | 178 | | | | 120 | | | | 41 | | | | 49 | |
Cash cost of sales applicable to equity method
investments2 | | | 209 | | | | 23 | | | | - | | | | 55 | | | | 23 | |
Less: royalties | | | (41) | | | | (101) | | | | (39) | | | | (9) | | | | (16) | |
Non-routine charges | | | - | | | | - | | | | (1) | | | | - | | | | - | |
Other metal sales | | | - | | | | (1) | | | | (1) | | | | - | | | | - | |
Other | | | - | | | | 72 | | | | (27) | | | | - | | | | 72 | |
C1 cash cost of sales | | | $ 603 | | | | $ 881 | | | | $ 835 | | | | $ 156 | | | | $ 221 | |
General & administrative costs | | | 14 | | | | 21 | | | | 40 | | | | 3 | | | | 4 | |
Rehabilitation - accretion and amortization | | | 7 | | | | 6 | | | | 8 | | | | 2 | | | | - | |
Royalties | | | 41 | | | | 101 | | | | 39 | | | | 9 | | | | 16 | |
Minesite exploration and evaluation costs | | | - | | | | - | | | | 1 | | | | - | | | | - | |
Minesite sustaining capital expenditures | | | 169 | | | | 177 | | | | 294 | | | | 48 | | | | 44 | |
Inventory write-downs | | | - | | | | - | | | | 1 | | | | - | | | | - | |
All-in sustaining costs | | | $ 834 | | | | $ 1,186 | | | | $ 1,218 | | | | $ 218 | | | | $ 285 | |
Pounds sold - consolidated basis (millions pounds) | | | 405 | | | | 510 | | | | 435 | | | | 107 | | | | 132 | |
Cost of sales per pound3,4 | | | $ 1.43 | | | | $ 1.65 | | | | $ 2.19 | | | | $ 1.45 | | | | $ 1.09 | |
C1 cash cost per pound3 | | | $ 1.49 | | | | $ 1.73 | | | | $ 1.92 | | | | $ 1.47 | | | | $ 1.66 | |
All-in sustaining costs per pound3 | | | $ 2.05 | | | | $ 2.33 | | | | $ 2.79 | | | | $ 2.04 | | | | $ 2.15 | |
| | 1 | For the year ended December 31, 2016, depreciation excludes $50 million (2015: $6 million; 2014: $nil) of depreciation applicable to equity method investments. |
| | 2 | For the year ended December 31, 2016, figures include $177 million (2015: $23 million; 2014: $nil) of cash costs related to our 50% share of Zaldívar due to the divestment of 50% of our interest in the mine on December 1 , 2015, as well as $32 million (2015: $nil; 2014: $nil) of cash costs related to our 50% share of Jabal Sayid due to the divestment of 50% of our interest in the mine on December 4, 2014 and subsequent accounting as equity method investments. |
| | 3 | Cost of sales per pound, C1 cash costs per pound andall-in sustaining costs per pound may not calculate based on amounts presented in this table due to rounding. |
| | 4 | Cost of sales related to copper per pound is calculated using cost of sales including our proportionate share of cost of sales attributable to equity method investments (Zaldívar and Jabal Sayid), divided by consolidated copper pounds (including our proportionate share of copper pounds from our equity method investments). |
ENDNOTE 11
Due to our hedging activities, which are reflected in these sensitivities, we are partially protected against changes in these factors.
ENDNOTE 12
Impact on cost of sales only reflects contracts that mature in 2017.
Utilizing option collar strategies, the Company has protected the downside of a portion of its expected 2017 copper production at an average floor price of $2.20 per pound, and can participate on the same amount up to an average price of $2.82 per pound. Our remaining copper production is subject to market prices.
| | | | |
| BARRICK 2016 FULL YEAR AND FOURTH QUARTER | | 18 | | PRESS RELEASE |
Key Statistics
Barrick Gold Corporation
| | | | | | | | | | | | | | | | |
| (in United States dollars) | | Three months ended December 31 | | | Twelve months ended December 31 | |
| | | 2016 | | | 2015 | | | 2016 | | | 2015 | |
Financial Results (millions) | | | | | | | | | | | | | | | | |
Revenues | | | $ 2,319 | | | | $ 2,238 | | | | $ 8,558 | | | | $ 9,029 | |
Cost of sales | | | 1,454 | | | | 1,768 | | | | 5,405 | | | | 6,907 | |
Net earnings (loss)1 | | | 425 | | | | (2,622) | | | | 655 | | | | (2,838) | |
Adjusted net earnings2 | | | 255 | | | | 91 | | | | 818 | | | | 344 | |
Adjusted EBITDA2 | | | 1,049 | | | | 722 | | | | 3,827 | | | | 3,187 | |
Total project capital expenditures3 | | | 51 | | | | (49) | | | | 175 | | | | 150 | |
Total capital expenditures - sustaining3 | | | 299 | | | | 303 | | | | 944 | | | | 1,359 | |
Net cash provided by operating activities | | | 711 | | | | 698 | | | | 2,640 | | | | 2,794 | |
| | | | |
Free cash flow2 | | | 385 | | | | 387 | | | | 1,514 | | | | 1,081 | |
| | | | |
Per share data (dollars) | | | | | | | | | | | | | | | | |
Net earnings (loss) (basic and diluted) | | | 0.36 | | | | (2.25) | | | | 0.56 | | | | (2.44) | |
Adjusted net earnings (basic)2 | | | 0.22 | | | | 0.08 | | | | 0.70 | | | | 0.30 | |
| | | | |
Weighted average basic common shares (millions) | | | 1,165 | | | | 1,165 | | | | 1,165 | | | | 1,165 | |
Weighted average diluted common shares (millions) | | | 1,166 | | | | 1,165 | | | | 1,165 | | | | 1,165 | |
| | | | |
Operating Results | | | | | | | | | | | | | | | | |
Gold production (thousands of ounces)4 | | | 1,516 | | | | 1,619 | | | | 5,517 | | | | 6,117 | |
Gold sold (thousands of ounces)4 | | | 1,519 | | | | 1,636 | | | | 5,503 | | | | 6,083 | |
Per ounce data | | | | | | | | | | | | | | | | |
Average spot gold price | | | $ 1,222 | | | | $ 1,106 | | | | $ 1,251 | | | | $ 1,160 | |
Average realized gold price2 | | | 1,217 | | | | 1,105 | | | | 1,248 | | | | 1,157 | |
Cost of sales (Barrick’s share)5 | | | 784 | | | | 848 | | | | 798 | | | | 859 | |
All-in sustaining costs2 | | | 732 | | | | 733 | | | | 730 | | | | 831 | |
| | | | |
Copper production (millions of pounds)6 | | | 101 | | | | 138 | | | | 415 | | | | 511 | |
Copper sold (millions of pounds) | | | 107 | | | | 132 | | | | 405 | | | | 510 | |
| | | | |
Per pound data | | | | | | | | | | | | | | | | |
Average spot copper price | | | $ 2.39 | | | | $ 2.22 | | | | $ 2.21 | | | | $ 2.49 | |
Average realized copper price2 | | | 2.62 | | | | 2.16 | | | | 2.29 | | | | 2.37 | |
Cost of sales (Barrick’s share)7 | | | 1.45 | | | | 1.09 | | | | 1.43 | | | | 1.65 | |
All-in sustaining costs2 | | | 2.04 | | | | 2.15 | | | | 2.05 | | | | 2.33 | |
| | | | |
| | | | | | | | | As at December 31, | | | As at December 31, | |
| | | | | | | | | 2016 | | | 2015 | |
Financial Position (millions) | | | | | | | | | | | | | | | | |
Cash and equivalents | | | | | | | | | | | $ 2,389 | | | | $ 2,455 | |
Working capital (excluding cash) | | | | | | | | | | | 1,155 | | | | 1,310 | |
| | 1 | Net earnings (loss) represents net earnings attributable to the equity holders of the Company. |
| | 2 | Adjusted net earnings, adjusted EBITDA, free cash flow, adjusted net earnings per share, realized gold price,all-in sustaining costs and realized copper price arenon-GAAP financial performance measures with no standardized meaning under IFRS and therefore may not be comparable to similar measures presented by other issuers. For further information and a detailed reconciliation of eachnon-GAAP measure to the most directly comparable IFRS measure, please see pages 71 to 85 of this MD&A. |
| | 3 | Amounts presented on a 100% accrued basis. Project capital expenditures are included in our calculation ofall-in costs, but not included in our calculation ofall-in sustaining costs. |
| | 4 | Production includes Acacia on a 63.9% basis and Pueblo Viejo on a 60% basis, both of which reflect our equity share of production. Also includes production from Bald Mountain and Round Mountain up to January 11, 2016, the effective date of sale of the assets. 2015 includes production from Porgera on a 95% basis up to August 2015 and on a 47.5% basis thereafter, whereas 2016 figures are on a 47.5% basis reflecting the sale of 50% of our interest in Porgera in third quarter 2015. Sales include our equity share of gold sales from Acacia and Pueblo Viejo. |
| | 5 | Cost of sales per ounce (Barrick’s share) is calculated as cost of sales - gold on an attributable basis excluding Pierina divided by gold ounces sold. |
| | 6 | In 2016, reflects production from Jabal Sayid and Zaldívar on a 50% basis, which reflects our equity share of production, and 100% of Lumwana. 2015 production includes Zaldívar on a 100% basis up to November 30 and on a 50% basis therafter, and 100% of Lumwana. |
| | 7 | Cost of sales per pound (Barrick’s share) is calculated as cost of sales - copper plus our equity share of cost of sales attributable to Zaldívar and Jabal Sayid divided by copper pounds sold. |
| | | | |
| BARRICK YEAR-END 2016 | | 19 | | SUMMARY INFORMATION |
Production and Cost Summary
| | | | | | | | | | | | | | | | | | | | | | | | | | |
| | | | | | Production | |
| | | | | | Three months ended December 31, | | Twelve months ended December 31, | |
| | | | | | 2016 | | | | | 2015 | | | | | 2016 | | | | | 2015 | |
Gold (equity ounces (000s)) | | | | | | | | | | | | | | | | | | | | | | | | | | |
Cortez | | | | | | | 310 | | | | | | 352 | | | | | | 1,059 | | | | | | 999 | |
Goldstrike | | | | | | | 291 | | | | | | 312 | | | | | | 1,096 | | | | | | 1,053 | |
Pueblo Viejo1 | | | | | | | 189 | | | | | | 134 | | | | | | 700 | | | | | | 572 | |
Lagunas Norte | | | | | | | 110 | | | | | | 119 | | | | | | 435 | | | | | | 560 | |
Veladero | | | | | | | 177 | | | | | | 159 | | | | | | 544 | | | | | | 602 | |
Turquoise Ridge | | | | | | | 65 | | | | | | 61 | | | | | | 266 | | | | | | 217 | |
Acacia2 | | | | | | | 136 | | | | | | 129 | | | | | | 530 | | | | | | 468 | |
Other Mines - Gold3 | | | | | | | 238 | | | | | | 353 | | | | | | 887 | | | | | | 1,646 | |
Total | | | | | | | 1,516 | | | | | | 1,619 | | | | | | 5,517 | | | | | | 6,117 | |
| | | | | | | | | | | | | | | | | | | | | | | | | | | |
Copper (equity pounds)4 (millions) | | | | | | | 101 | | | | | | 138 | | | | | | 415 | | | | | | 511 | |
| | |
| | | | | | Cost of Sales per unit (Barrick’s share) | |
| | | | | | Three months ended December 31, | | Twelve months ended December 31, | |
| | | | | | 2016 | | | | | 2015 | | | | | 2016 | | | | | 2015 | |
Gold Cost of Sales per ounce ($/oz)5 | | | | | | | | | | | | | | | | | | | | | | | | | | |
Cortez | | $ | | | | | 846 | | | | | $ | 703 | | | | | $ | 901 | | | | | $ | 841 | |
Goldstrike | | | | | | | 880 | | | | | | 727 | | | | | | 852 | | | | | | 723 | |
Pueblo Viejo1 | | | | | | | 450 | | | | | | 849 | | | | | | 564 | | | | | | 881 | |
Lagunas Norte | | | | | | | 612 | | | | | | 690 | | | | | | 651 | | | | | | 669 | |
Veladero | | | | | | | 892 | | | | | | 785 | | | | | | 872 | | | | | | 792 | |
Turquoise Ridge | | | | | | | 595 | | | | | | 685 | | | | | | 603 | | | | | | 697 | |
Acacia2 | | | | | | | 935 | | | | | | 1,526 | | | | | | 880 | | | | | | 1,161 | |
Total | | $ | | | | | 784 | | | | | $ | 848 | | | | | $ | 798 | | | | | $ | 859 | |
| | | | | | | | | | | | | | | | | | | | | | | | | | | |
Copper Cost of Sales per pound ($/lb)6 | | $ | | | | | 1.45 | | | | | $ | 1.09 | | | | | $ | 1.43 | | | | | $ | 1.65 | |
| | |
| | | | | | All-in sustaining costs7 | |
| | | | | | Three months ended December 31, | | Twelve months ended December 31, | |
| | | | | | 2016 | | | | | 2015 | | | | | 2016 | | | | | 2015 | |
GoldAll-in Sustaining Costs ($/oz) | | | | | | | | | | | | | | | | | | | | | | | | | | |
Cortez | | $ | | | | | 517 | | | | | $ | 406 | | | | | $ | 518 | | | | | $ | 603 | |
Goldstrike | | | | | | | 734 | | | | | | 581 | | | | | | 714 | | | | | | 658 | |
Pueblo Viejo1 | | | | | | | 443 | | | | | | 496 | | | | | | 490 | | | | | | 597 | |
Lagunas Norte | | | | | | | 436 | | | | | | 506 | | | | | | 529 | | | | | | 509 | |
Veladero | | | | | | | 905 | | | | | | 915 | | | | | | 769 | | | | | | 946 | |
Turquoise Ridge | | | | | | | 610 | | | | | | 735 | | | | | | 625 | | | | | | 742 | |
Acacia2 | | | | | | | 952 | | | | | | 1,004 | | | | | | 958 | | | | | | 1,112 | |
Total | | $ | | | | | 732 | | | | | $ | 733 | | | | | $ | 730 | | | | | $ | 831 | |
| | | | | | | | | | | | | | | | | | | | | | | | | | |
CopperAll-in Sustaining Costs ($/lb) | | $ | | | | | 2.04 | | | | | $ | 2.15 | | | | | $ | 2.05 | | | | | $ | 2.33 | |
| 1 | Reflects production from Pueblo Viejo on a 60% basis, which reflects our equity share of production. |
| 2 | Reflects production from Acacia on a 63.9% basis, which reflects our equity share of production. |
| 3 | In 2016, Other Mines - Gold includes Golden Sunlight, Hemlo, Porgera on a 47.5% basis and Kalgoorlie. Also includes production from Bald Mountain and Round Mountain up to January 11, 2016, the effective date of sale of these assets. In 2015, Other Mines - Gold includes Bald Mountain, Round Mountain, Golden Sunlight, Hemlo, Pierina, Cowal, Ruby Hill, Porgera on a 95% basis up to August 2015 and on a 47.5% basis thereafter, and Kalgoorlie. |
| 4 | In 2016, reflects production from Jabal Sayid and Zaldívar on a 50% basis, which reflects our equity share of production, and 100% of Lumwana. 2015 production includes Zaldívar on a 100% basis up to November 30 and on a 50% basis thereafter, and 100% of Lumwana. |
| 5 | Cost of sales per ounce (Barrick’s share) is calculated as cost of sales - gold on an attributable basis excluding Pierina divided by gold ounces sold. |
| 6 | Cost of sales per pound (Barrick’s share) is calculated as cost of sales - copper plus our equity share of cost of sales attributable to Zaldívar and Jabal Sayid divided by copper pounds sold. |
| 7 | All-in sustaining costs is anon-GAAP financial performance measure with no standardized meaning under IFRS and therefore may not be comparable to similar measures presented by other issuers. For further information and a detailed reconciliation of thisnon-GAAP measure to the most directly comparable IFRS measure, please see pages 71 to 85 of this MD&A. |
| | | | |
| BARRICK YEAR-END 2016 | | 20 | | SUMMARY INFORMATION |
MANAGEMENT’S DISCUSSION AND ANALYSIS (“MD&A”)
Management’s Discussion and Analysis (“MD&A”) is intended to help the reader understand Barrick Gold Corporation (“Barrick”, “we”, “our” or the “Company”), our operations, financial performance and the present and future business environment. This MD&A, which has been prepared as of February 15, 2017, should be read in conjunction with our audited consolidated financial statements for the year ended December 31, 2016. Unless otherwise indicated, all amounts are presented in U.S. dollars.
For the purposes of preparing our MD&A, we consider the materiality of information. Information is considered material if: (i) such information results in, or would reasonably be expected to result in, a significant change in the market price or value of our shares; or (ii) there is a substantial likelihood that a
reasonable investor would consider it important in making an investment decision; or (iii) it would significantly alter the total mix of information available to investors. We evaluate materiality with reference to all relevant circumstances, including potential market sensitivity.
Continuous disclosure materials, including our most recentForm 40-F/Annual Information Form, annual MD&A, audited consolidated financial statements, and Notice of Annual Meeting of Shareholders and Proxy Circular will be available on our website at www.barrick.com, on SEDAR at www.sedar.com and on EDGAR at www.sec.gov. For an explanation of terminology unique to the mining industry, readers should refer to the glossary on page 87.
CAUTIONARY STATEMENT ON FORWARD-LOOKING INFORMATION
Certain information contained or incorporated by reference in this MD&A, including any information as to our strategy, projects, plans or future financial or operating performance constitutes “forward-looking statements”. All statements, other than statements of historical fact, are forward-looking statements. The words “believe”, “expect”, “anticipate”, “contemplate”, “target”, “plan”, “objective”, “aim”, “intend”, “project”, “goal”, “continue”, “budget”, “estimate”, “potential”, “may”, “will”, “can”, “could” and similar expressions identify forward-looking statements. In particular, this MD&A contains forward-looking statements including, without limitation, with respect to: (i) Barrick’s forward-looking production guidance; (ii) estimates of future cost of sales per ounce for gold and per pound for copper,all-in-sustaining costs per ounce/pound, cash costs per ounce and C1 cash costs per pound; (iii) cash flow forecasts; (iv) projected capital, operating and exploration expenditures; (v) targeted debt and cost reductions; (vi) targeted investments by the Company; (vii) mine life and production rates; (viii) potential mineralization and metal or mineral recoveries; (ix) Barrick’sBest-in-Class program (including potential improvements to financial and operating performance that may result from certainBest-in-Class initiatives); (x) the Lama starter project and the potential for phased in development of the Pascua Lama project; (xi) timing and completion of acquisitions; (xii) asset sales or joint ventures; and (xiii) expectations regarding future price assumptions, financial performance and other outlook or guidance.
Forward-looking statements are necessarily based upon a number of estimates and assumptions including material estimates and assumptions related to the factors set forth below that, while considered reasonable by the Company as at the date of this MD&A in light of Management’s experience and perception of current conditions and expected developments, are inherently subject to significant business, economic and competitive uncertainties and contingencies. Known and unknown factors could cause actual results to differ materially from those projected in the forward-looking statements and undue reliance should not be placed on such statements and information. Such factors include, but are not limited to: fluctuations in the spot and forward price of gold, copper or certain other commodities (such as silver, diesel fuel, natural gas and electricity); the speculative nature of mineral exploration and development; changes in mineral production performance, exploitation and exploration successes; risks associated with the fact that certainBest-in-Class initiatives are still in the early stages of evaluation and additional engineering and other analysis is required to fully assess their impact; diminishing quantities or grades of reserves; increased costs, delays, suspensions and technical challenges associated with the construction of capital projects; operating or technical difficulties in connection with mining or development activities, including geotechnical challenges and disruptions in the maintenance or provision of required infrastructure and information technology systems;
| | | | |
| BARRICK YEAR-END 2016 | | 21 | | MANAGEMENT’S DISCUSSION AND ANALYSIS |
failure to comply with environmental and health and safety laws and regulations; timing of receipt of, or failure to comply with, necessary permits and approvals; uncertainty whether some or all of theBest-in-Class initiatives and investments targeted by the Company will meet the company’s capital allocation objectives; the impact of global liquidity and credit availability on the timing of cash flows and the values of assets and liabilities based on projected future cash flows; adverse changes in our credit ratings; the impact of inflation; fluctuations in the currency markets; changes in U.S. dollar interest rates; risks arising from holding derivative instruments; changes in national and local government legislation, taxation, controls or regulations and/or changes in the administration of laws, policies and practices, expropriation or nationalization of property and political or economic developments in Canada, the United States and other jurisdictions in which the Company does or may carry on business in the future; lack of certainty with respect to foreign legal systems, corruption and other factors that are inconsistent with the rule of law; damage to the Company’s reputation due to the actual or perceived occurrence of any number of events, including negative publicity with respect to the Company’s handling of environmental matters or dealings with community groups, whether true or not; risk of loss due to acts of war, terrorism, sabotage and civil disturbances; litigation; contests over title to properties, particularly title to undeveloped properties, or over access to water, power and other required infrastructure; business opportunities that may be presented to, or pursued by, the Company; our ability to successfully integrate acquisitions or complete divestitures; risks associated with working with partners in jointly controlled assets; employee relations including loss of key employees; increased costs and physical risks, including extreme weather
events and resource shortages, related to climate change; availability and increased costs associated with mining inputs and labor; and the organization of our previously held African gold operations and properties under a separate listed company. In addition, there are risks and hazards associated with the business of mineral exploration, development and mining, including environmental hazards, industrial accidents, unusual or unexpected formations, pressures,cave-ins, flooding and gold bullion, copper cathode or gold or copper concentrate losses (and the risk of inadequate insurance, or inability to obtain insurance, to cover these risks).
Many of these uncertainties and contingencies can affect our actual results and could cause actual results to differ materially from those expressed or implied in any forward-looking statements made by, or on behalf of, us. Readers are cautioned that forward-looking statements are not guarantees of future performance. All of the forward-looking statements made in this MD&A are qualified by these cautionary statements. Specific reference is made to the most recent Form40-F/Annual Information Form on file with the SEC and Canadian provincial securities regulatory authorities for a more detailed discussion of some of the factors underlying forward-looking statements and the risks that may affect Barrick’s ability to achieve the expectations set forth in the forward-looking statements contained in this MD&A.
We disclaim any intention or obligation to update or revise any forward-looking statements whether as a result of new information, future events or otherwise, except as required by applicable law.
| | | | |
| BARRICK YEAR-END 2016 | | 22 | | MANAGEMENT’S DISCUSSION AND ANALYSIS |
CHANGES IN PRESENTATION OFNON-GAAP FINANCIAL PERFORMANCE MEASURES
We use the followingnon-GAAP financial performance measures in our MD&A:
| | • | | “adjusted net earnings” |
| | • | | “C1 cash costs per pound” |
| | • | | “all-in sustaining costs per ounce/pound” |
| | • | | “all-in costs per ounce” and |
For a detailed description of each of thenon-GAAP measures used in this MD&A and a detailed reconciliation, please refer to theNon-GAAP Financial Performance Measures section of this MD&A on pages 71 to 85. Eachnon-GAAP financial performance measure has been annotated with a reference to an endnote on page 86. Thenon-GAAP financial performance measures set out in this MD&A are intended to provide additional information to investors and do not have any standardized meaning under International Financial Reporting Standards (“IFRS”), and therefore may not be comparable to other issuers, and should not be considered in isolation or as a substitute for measures of performance prepared in accordance with IFRS. In 2016, we made changes to the followingnon-GAAP performance measures:
EBITDA
Starting with the third quarter 2016 MD&A, we are presenting a reconciliation of net earnings to EBITDA and adjusted EBITDA for each of our reportable operating segments. We believe this additional information will assist analysts, investors and other stakeholders of Barrick in understanding the details of thisnon-GAAP metric on asegment-by-segment basis.
Adjusted net earnings
In the third quarter 2016 MD&A, we amended the reconciliation of net earnings to adjusted net earnings to present the adjusting items on apre-tax and fully consolidated basis, and including the tax effect andnon-controlling interest as a separate line. We believe that this change will assist analysts, investors and other stakeholders of Barrick to better understand how we calculate thisnon-GAAP performance measure and simplify how it reconciles to our financial statements. This change to the presentation of our reconciliation does not result in any change to the final calculation of adjusted net earnings.
Cash costs per ounce,all-in sustaining cash costs per ounce andall-in costs per ounce
Starting with the third quarter 2016 MD&A, we have presented this reconciliation for each of our reportable operating segments. We believe this additional information will assist analysts, investors and other stakeholders of Barrick in understanding the details of thesenon-GAAP metrics on asegment-by-segment basis.
Starting with the second quarter 2016 MD&A, we condensed and simplified the reconciliation from cost of sales to “cash costs”,“all-in sustaining costs” and“all-in costs”, including on a per ounce basis for gold and per pound basis for copper, to present items on a fully consolidated basis and includenon-controlling interest as a separate line. As part of this simplification, we have grouped several minor items into one line labeled “Other”, with further detail in the footnote to the reconciliation. We believe that these changes will assist analysts, investors and other stakeholders of Barrick to better understand how we calculate thesenon-GAAP performance measures and simplify how they reconcile to our financial statements. This change to the presentation of our reconciliation does not result in any change to the figures calculated, except as noted below for“all-in costs”.
Also starting with the second quarter 2016 MD&A, we adjusted the amount included as “project exploration and evaluation costs and project costs” as part of our“all-in costs” measure to include all exploration and evaluation costs related to our advanced mining and business improvement projects and corporate development activities, where previously it did not. The impact of this adjustment for the three and twelve month periods ended December 31, 2016 was $22/oz and $17/oz, respectively (2015: $27/oz and $30/oz, respectively; 2014: $25/oz). We believe this change will assist analysts, investors and other stakeholders of Barrick in understanding all of the expenditures related to growing our business.
The tables on pages 71 to 85 reconcile thesenon-GAAP measures to the most directly comparable IFRS measures and previous period reconciliations have been modified to be presented in a manner consistent with our current format.
| | | | |
| BARRICK YEAR-END 2016 | | 23 | | MANAGEMENT’S DISCUSSION AND ANALYSIS |
INDEX
| | |
| | | page |
| |
Overview | | |
| |
Our Business | | 25 |
| |
Our Vision | | 25 |
| |
Our Strategy | | 25 |
| |
Full Year Financial and Operating Highlights | | 26 |
| |
Outlook for 2017 | | 33 |
| |
Risks and Risk Management | | 38 |
| |
Market Overview | | 40 |
| |
Review of Annual Financial Results | | |
| |
Revenue | | 43 |
| |
Production Costs | | 43 |
| |
Capital Expenditures | | 44 |
| |
General and Administrative Expenses | | 45 |
| |
Exploration, Evaluation and Project Costs | | 45 |
| |
Finance Costs, Net | | 45 |
| |
Additional Significant Statement of Income Items | | 46 |
| |
Income Tax Expense | | 46 |
| |
Financial Condition Review | | 48 |
| |
Balance Sheet Review | | 48 |
| |
Shareholders’ Equity | | 48 |
| |
Financial Position and Liquidity | | 48 |
| |
Summary of Cash Inflow (Outflow) | | 49 |
| |
Summary of Financial Instruments | | 51 |
| |
Operating Segments Performance | | 51 |
| |
Cortez | | 52 |
| |
Goldstrike | | 54 |
| |
Pueblo Viejo | | 56 |
| |
Lagunas Norte | | 58 |
| |
Veladero | | 60 |
| |
Turquoise Ridge | | 63 |
| |
Acacia Mining plc | | 65 |
| |
Pascua-Lama | | 67 |
| |
Commitments and Contingencies | | 68 |
| |
Review of Quarterly Results | | 69 |
| |
Internal Control over Financial Reporting and Disclosure Controls and Procedures | | 70 |
| |
IFRS Critical Accounting Policies and Accounting Estimates | | 70 |
| |
Non-GAAP Financial Performance Measures | | 71 |
| |
Technical Information | | 86 |
| |
Glossary of Technical Terms | | 87 |
| | | | |
| BARRICK YEAR-END 2016 | | 24 | | MANAGEMENT’S DISCUSSION AND ANALYSIS |
OVERVIEW
Our Business
Barrick is one of the world’s leading gold mining companies with annual gold production and gold reserves that are the largest in the industry. We are principally engaged in the production and sale of gold and copper, as well as related activities such as exploration and mine development. We have 9 producing gold mines, which are located in Canada, the United States, Peru, Argentina, Australia, the Dominican Republic and a 47.5% interest in a producing mine in Papua New Guinea. We also hold a 63.9% equity interest in Acacia Mining plc (“Acacia”), a company listed on the London Stock Exchange (“LSE”) that owns gold mines and exploration properties in Africa. More than 75% of our gold production comes from the Americas region. Our copper business contains a wholly-owned copper mine in Zambia and 50% interests in copper mines in Chile and Saudi Arabia. We also have projects located throughout the Americas. We sell our production in the world market through the following distribution channels: gold bullion is sold in the gold spot market; and gold and copper concentrate is sold to independent smelting companies. Barrick’s shares trade on the New York Stock Exchange (“NYSE”) and the Toronto Stock Exchange under the symbol ABX.
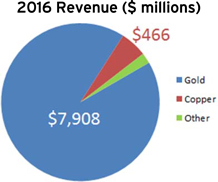
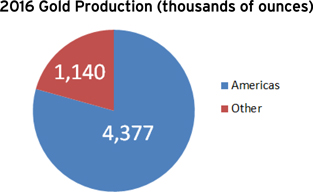
Our Vision
Our vision is the generation of wealth through responsible mining; wealth for our owners, our people, and the countries and communities with which we partner. In support of this vision, our overarching objective is to grow our free cash flow per share.
Our Strategy
Our strategy is to grow our free cash flow per share over the long term. We expect to achieve this through three areas of focus:
Growing free cash flow per share through industry-leading margins
Through ourBest-in-Class approach, we pursue industry-leading margins by continuously improving the productivity and efficiency of existing systems and operations. Equally, we pursue step changes in performance byre-designing those systems and introducing new technologies; and we innovate to redefine what is possible. Our digital transformation partnership with Cisco will be anotherBest-in-Class priority for 2017.
Growing free cash flow per share through superior portfolio management
As part of our revamped capital allocation system, all proposals go through a rigorous, independent peer review process led by our Evaluations team, before they go to the Investment Committee. They are then ranked, prioritized and sequenced to optimize capital spending over time on a strategic basis, allowing us to anticipate and plan for funding requirements. Over time, assets that are unable to meet our return expectations will be divested. We are continuously evaluating external opportunities to increase the long-term value of our portfolio through acquisitions, joint ventures, and other partnerships.
Growing free cash flow per share through partnerships
We believe an authentic partnership culture is our most distinctive and sustainable competitive advantage. For Barrick, partnership means a trust-based culture, and the currency of trust is transparency. It is a culture of peers. Those who are part of Barrick recognize that in general, the collective is stronger than the aggregation of individuals. By embracing these values, we aim to be the preferred partner of host governments and communities, the most sought-after employer among the world’s best talent, and the natural choice for
| | | | |
| BARRICK YEAR-END 2016 | | 25 | | MANAGEMENT’S DISCUSSION AND ANALYSIS |
long-term investors. We also created a new partnership with Cisco to drive Barrick’s digital transformation and have also continued to strengthen our relationships with other external partners, including Zijin Mining, Ma’aden, and Antofagasta Plc –our joint venture partners at the Porgera mine, the Jabal Sayid mine, and the Zaldívar mine. And we are working to develop new partnerships with the potential to unlock value across our business, and grow free cash flow per share over the long term.
Last year, we created the Global Employee Share Plan, a program to make every Barrick employee – from the rock face to the head office – an owner of the Company, with an initial allocation of 25 common shares per person. We expect this to grow over time, in line with Barrick’s performance. Our goal is not simply to be aligned with our owners, we want our people to be owners. Implementation of the program began in late 2016 and we expect to complete the initial roll out in the first half of 2017.
FULL YEAR FINANCIAL AND OPERATING HIGHLIGHTS
| | | | |
| BARRICK YEAR-END 2016 | | 26 | | MANAGEMENT’S DISCUSSION AND ANALYSIS |
| | | | | | | | | | | | | | | | | | | | |
($ millions, except per share amounts in dollars) | | | For the years ended December 31 | | | | For the three months ended December 31 | |
| | | | | | |
| | | | 2016 | | | | 2015 | | | | 2014 | | | | 2016 | | | | 2015 | |
Net earnings (loss) attributable to equity holders of the Company | | | $ 655 | | | | $ (2,838) | | | | $ (2,907) | | | | $ 425 | | | | $ (2,622) | |
Per share (dollars)1 | | | 0.56 | | | | (2.44) | | | | (2.50) | | | | 0.36 | | | | (2.25) | |
Adjusted net earnings2 | | | 818 | | | | 344 | | | | 793 | | | | 255 | | | | 91 | |
Per share (dollars)1,2 | | | 0.70 | | | | 0.30 | | | | 0.68 | | | | 0.22 | | | | 0.08 | |
Operating cash flow | | | 2,640 | | | | 2,794 | | | | 2,296 | | | | 711 | | | | 698 | |
Free cash flow2 | | | $ 1,514 | | | | $ 1,081 | | | | $ (136) | | | | $ 385 | | | | $ 387 | |
| | 1 | Calculated using weighted average number of shares outstanding under the basic method of earnings per share of 1,165 million shares in 2016 (2015: 1,165 million shares; 2014: 1,165 million shares). |
| | 2 | Adjusted net earnings and free cash flow arenon-GAAP financial performance measures with no standardized meaning under IFRS and therefore may not be comparable to similar measures of performance presented by other issuers. For further information and a detailed reconciliation of thenon-GAAP measures used in this section of the MD&A to the most directly comparable IFRS measure, please see pages 71 to 85 of this MD&A. |
In 2016, we exceeded all of our key targets for the year. Our mines generated net cash flow provided by operating activities (“operating cash flow”) of $2.6 billion in 2016 and free cash flow1 of $1.5 billion for the year, a record level of annual free cash flow for Barrick. We reduced our cost of sales applicable to gold by seven percent to $798 per ounce, and ourall-in sustaining costs1 fell by 12% to $730 per ounce, driven byBest-in-Class improvements in efficiency and productivity across our portfolio. At the same time, we continued to strengthen our balance sheet, and we further strengthened our capital allocation process with the appointment of the company’s first ever Chief Investment Officer.
Balance Sheet and Liquidity
In 2016, we reduced our total debt by $2.04 billion, or 20%, from $9.97 billion to $7.93 billion, exceeding our original target of $2 billion. Approximately $5 billion of our $7.9 billion in outstanding debt matures after 2032. In 2015 and 2016 we have reduced our debt by a total of $5.15 billion, which will reducepre-tax interest payments by approximately $235 million on an annualized basis. Over the same period, the average tenor on our outstanding public debt has increased from approximately 14 years to approximately 17 years. Our liquidity position is strong and continues to improve, with robust cash flow generation, modest near-term debt repayment obligations, a $4 billion undrawn credit facility and a consolidated cash balance of approximately $2.4 billion3. We intend to reduce our total debt by $2.9 billion to $5 billion by the end of 2018, half of which we are targeting in 2017. We will achieve this by using cash flow from operations, selling additionalnon-core assets, and creating new joint ventures and partnerships.
Cost Performance
In 2016, we continued our focus on capital discipline, identifying productivity and efficiency savings opportunities through ourBest-in-Class program and maintaining reductions in corporate overhead. Cost of sales per ounce4 in 2016 decreased 7% to $798 per ounce and minesite sustaining capital expenditures decreased 31% compared to the prior year. Combined with an overall decrease in direct mining costs, a positive change in our sales mix with higher production at our lower cost mines and as a result of the divestment of some of our higher cost mine sites, reduced ourall-in sustaining costs1 for 2016 by 12% to $730 per ounce, compared to the prior year.
| | | | |
| BARRICK YEAR-END 2016 | | 27 | | MANAGEMENT’S DISCUSSION AND ANALYSIS |
Net Earnings (Loss), Adjusted Net Earnings, Operating Cash Flow and Free Cash Flow
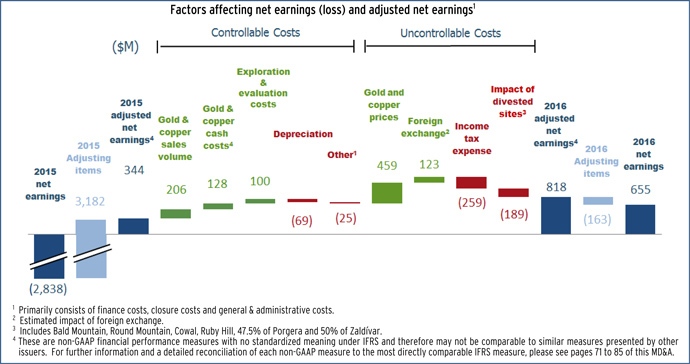
Net earnings attributable to equity holders of Barrick (“net earnings”) for 2016 was $655 million compared with a net loss of $2,838 in the prior year. This significant improvement in earnings was largely due to $3,897 million of impairment charges recorded in 2015 compared to net impairment reversals of $250 million recorded in 2016, partially offset by an income tax expense in 2016 compared to an income tax recovery in the prior year. The higher earnings were also caused by higher gold and copper prices combined with higher sales volumes (excluding the impact of divested sites), decreased operating costs and lower exploration, evaluation and project expenses. These were partially offset by an increase in costs relating to closed mine rehabilitation combined with losses on currency translation primarily related to the realization of deferred currency translation losses in Australia of $91 million during the first quarter of 2016. After adjusting for items that are not indicative of future operating earnings, adjusted net earnings1 of $818 million in 2016 were 138% higher than the prior year primarily due to the impact of higher gold and copper prices combined with higher gold and copper sales volumes (excluding the impact of divested sites) and lower operating costs. These were partially offset by higher income tax expense and the impact of divested sites. For a breakdown of asset impairment charges/reversals recognized in 2016, see page 46 of this MD&A.
Significant adjusting items to net earnings(pre-tax andnon-controlling interest effects) in 2016 include:
| ● | | $199 million in foreign currency translation losses, including deferred currency translation losses released as a result of the disposal and reorganization of certain Australian entities in the first quarter of 2016 and unrealized foreign currency translation losses related to the devaluation of the Argentinean Peso on VAT receivables; |
| ● | | $114 million in other expense adjustments primarily relating to losses on debt extinguishment, partly offset by insurance proceeds relating to the 2015 oxygen plant motor failure at Pueblo Viejo; |
| ● | | $43 million in significant tax adjustments primarily relating to a tax provision in Acacia in the first quarter of 2016; |
| ● | | $42 million in disposition losses primarily relating to the divestment of 50% of Zaldívar; |
| ● | | The above are partially offset by $250 million in net impairment reversals at Veladero and Lagunas Norte in the fourth quarter of 2016, net of an impairment charge relating to the write-down of our retained equity method investment in Zaldívar. |
| | | | |
| BARRICK YEAR-END 2016 | | 28 | | MANAGEMENT’S DISCUSSION AND ANALYSIS |
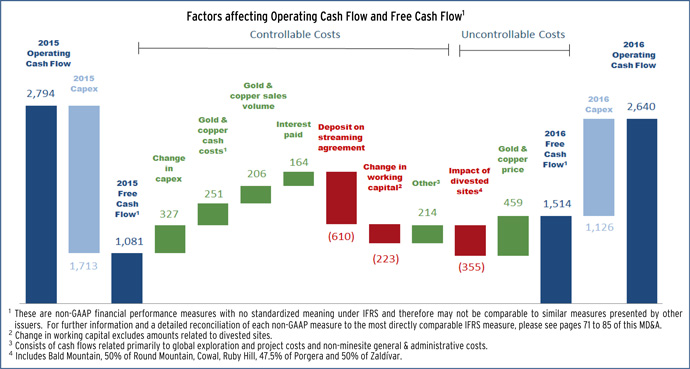
In 2016, we generated $2,640 million in operating cash flow, compared to $2,794 million of operating cash flow in the prior year. 2015 operating cash flow included a $610 million deposit relating to the gold and silver streaming arrangement with Royal Gold. Excluding this transaction, operating cash flow for 2016 was $456 million higher than the prior year despite the $355 million reduction in operating cash flow associated with the divestment of somenon-core assets. We benefited from higher market gold prices and lower direct mining costs as a result of lower energy and fuel costs (despite being hedged on a significant portion of our fuel consumption) combined with the continued realization of lower labor and consumable costs and improved operating efficiencies resulting from ourBest-in-Class initiatives and also lower cash interest paid. These improvements were largely offset by the impact of lower gold and copper volumes sold, primarily as a result of the aforementioned divestitures, combined with the impact of unfavorable working capital movements compared to the prior year, mainly as a result of inventory balances, and higher income taxes paid.
Free cash flow1 for 2016 was $1,514 million, compared to $1,081 million in the prior year. Excluding the $610 million streaming deposit transaction recorded in 2015, we generated $1,043 million additional free cash flow in the current year. The increase primarily reflects the higher operating cash flows combined with lower capital expenditures. In 2016, capital expenditures on a cash basis were $1,126 million compared to $1,713 million in 2015. The decrease of $327 million, excluding the impact of $260 million in capital expenditures associated with divested sites, is primarily due to lower capitalized stripping costs at our Veladero mine, a decrease in leach pad expansion costs at our Veladero mine and our Lagunas Norte mine and our continued focus on capital discipline across the Company. This was combined with a decrease in project costs mainly relating to the completion of the thiosulfate circuit at Goldstrike in the prior year and decreased capital expenditures on a cash basis at Pascua-Lama.
| | | | |
| BARRICK YEAR-END 2016 | | 29 | | MANAGEMENT’S DISCUSSION AND ANALYSIS |
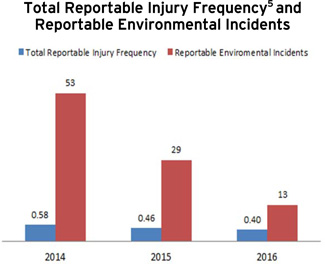
Safety
Nothing is more important to Barrick than the safety, health and well-being of workers and their families. In 2016, we continued our trend of improving our total reportable injury frequency rate5 (“TRIFR”) and since 2009, there has been a 67% improvement in the TRIFR (from 1.20 to 0.40). The foundation underpinning this improvement continues to be our Courageous Leadership program, which was updated in 2015 with a new program called “Courage to Care”. Courage to Care is designed to help Barrick make the next step in safety performance through a team approach. In addition we continue to focus on compliance with elements of the Barrick “Safety and Health Management System”. Although we are pleased with these trends, this performance was overshadowed by the tragic occurrence of an incident in 2016 when a truck operator at Lumwana suffered fatal injuries resulting from a fire on the truck he was operating. Unfortunately, another tragic event occurred early in 2017 as a contract employee was involved in a fatal accident while performing scheduled maintenance work at Pascua-Lama. Barrick’s goal is zero fatalities with the implementation of Critical Control Management based upon the guidance published by the International Council on Mining and Metals (“ICMM”) in 2015. In addition, following a successful trial of mobile equipment collision avoidance technology in 2015, a full-scale deployment of the technology was implemented at the Cortez mine in 2016.
Environment
The unfortunate 2015 cyanide release at our Veladero site in Argentina and the consequent loss of confidence from regulators and investors was, in many ways, awake-up call for the Company. Since that time, the Board and Executive leadership of Barrick have been absolutely clear that our obligation to be a responsible steward of the environment is second only to our commitment to protecting the health and safety of our workers and their families. Over the past three years, we have reduced the number of reportable environmental incidents by more than 75%. This reduction has been accomplished by relentlessly scrutinizing our operations for sources of environmental risk. In 2016, we had a second incident at Veladero although no solution reached surface water or escaped the site, and extensive sampling confirmed that the incident did not result in any environmental impact. Nonetheless, due to heightened regulatory sensitivity surrounding the site, production was temporarily suspended while the site completed upgrades to the berms surrounding the leach pad. In 2017, our operations will be focused on adapting the ICMM Critical Control Management guidance to our environmental operations. By doing so, we expect to be able to further reduce the number of environmental incidents and continue to rebuild Barrick’s reputation for environmental excellence and become the preferred partner of host governments and communities.
Climate Change
Climate change, including temperature and precipitation shifts as well as more frequent and severe extreme weather events, will have complex impacts on the mining industry. Volatile climatic conditions can affect the stability and effectiveness of infrastructure and equipment; potentially impact environmental protection and site closure practices; lead to changes in the regulatory environment, including increased financial exposure to carbon tax regimes; and potentially impact the stability and cost of water and energy supplies. Mining is an energy-intensive business and we understand the important link between energy use and climate change. Barrick considers climate change to be a company, community, and global concern. By effectively managing our energy use, we are able to reduce our greenhouse gas (“GHG”) emissions, achieve more efficient production, reduce our draw from local energy grids, and save a significant proportion of our direct mining costs.
Through 2017, we will continue to align with the ICMM Position Statement on Climate Change and support placing a market price on GHG emissions. We will also be participating in multi-stakeholder forums, such as the Carbon Pricing Leadership Coalition, to advance our understanding and share knowledge on climate change solutions. In addition we have established an internal Climate Change Committee to build on our existing energy management plan and develop a comprehensive climate change strategy. By the end of 2017 we plan to conduct a climate change risk assessment and establish targets to reduce our GHG emissions.
| | | | |
| BARRICK YEAR-END 2016 | | 30 | | MANAGEMENT’S DISCUSSION AND ANALYSIS |
Reserves and Resources
To calculate our 2016 reserves, we have applied a short-term gold price assumption of $1,000 per ounce for the next four years, and a long-term gold price of $1,200 per ounce from 2021 onwards, consistent with our approach in 2015.
As of December 31, 2016, Barrick’s proven and probable gold reserves were 85.9 million ounces6, compared to 91.9 million ounces at the end of 2015. Approximately 1.9 million ounces were divested last year, and 6.8 million ounces were depleted through mining and processing. We replaced approximately 60 percent of the ounces we depleted through drilling and cost improvements at our operating mines. Significant additions included 1.1 million ounces at Lagunas Norte, 920,000 ounces at Hemlo, and 640,000 ounces at the Goldstrike underground mine. Reserves at Pascua-Lama declined by 1.3 million ounces as a result of design modifications to enhance safety and environmental mitigation at the project. Reserves at Acacia’s Bulyanhulu mine also declined by 430,000 ounces.
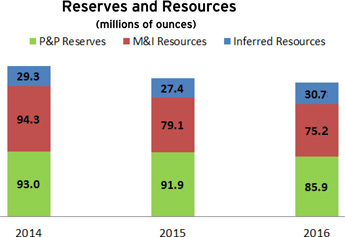
In 2016, measured, indicated, and inferred resources were calculated using a gold price assumption of $1,500 per ounce. This compares to $1,300 per ounce in 2015.
Measured and indicated gold resources decreased to 75.2 million ounces6 at the end of 2016, compared to 79.1 million ounces at the end of 2015. Approximately 4.3 million ounces of measured and indicated gold resources were divested in 2016, and 2.7 million ounces were upgraded to proven and probable gold reserves. Approximately 5.3 million ounces were added to measured and indicated resources as a result of using a $1,500 per ounce gold price assumption.
Inferred gold resources increased to 30.7 million ounces at the end of 2016, compared to 27.4 million ounces6 at the end of 2015. Approximately 3.2 million ounces were upgraded to measured and indicated resources. Approximately 5.3 million ounces were added through drilling, including 2.0 million ounces at Veladero, 1.3 million ounces at Hemlo, and 1.1 million ounces at Alturas. Approximately 1.7 million ounces were added to inferred resources as a result of using a $1,500 per ounce gold price assumption. The addition of 5.3 million ounces of inferred gold resources through drilling underscores the value of our investments in near-mine exploration and sets the stage for replenishing and upgrading our reserve and resource portfolio in future years.
Proven and probable copper reserves were calculated using a short-term copper price of $2.25 per pound and a long-term price of $2.75 per pound. This compares to a short-term copper price of $2.75 and a long-term price of $3.00 per pound in 2015.
Copper reserves, including copper and gold reserves, were 11.1 billion pounds6 at the end of 2016, compared to 11.7 billion pounds at the end of 2015. Measured and indicated copper resources, including copper within measured and indicated gold reserves, increased slightly to 9.7 billion pounds4, compared to 9.6 billion pounds, at the end of 2016.
Exploration and Projects
After several years of exploration focused primarily on existing core districts and projects, we are increasing our budget and broadening our focus to include new greenfield opportunities. In the short term, every one of our operating mines has the potential to identify new reserves and resources through near-mine exploration. In many cases, these ounces can be quickly incorporated into mine plans, driving improvements in production, cash flow, and earnings. Over the medium term, we are advancing a pipeline of high-confidence projects at or near our existing operations. These projects remain on track and are expected to begin contributing new production to our portfolio beginning in 2021. This includes three significant projects in Nevada: the Cortez Deep South underground expansion; the potential development of an underground mine at Goldrush; and a significant expansion of throughput at the Turquoise Ridge mine. At the Lagunas Norte mine in Peru, we are advancing a project to extend the life of the mine by approximately nine years by mining the refractory material below the oxide ore body in the current open pit. At the Alturas project in Chile, we have added an additional 1.1 million ounces of inferred gold resources, bringing the total inferred resource to 6.8 million ounces6. We expect to complete a scoping study for Alturas in
| | | | |
| BARRICK YEAR-END 2016 | | 31 | | MANAGEMENT’S DISCUSSION AND ANALYSIS |
2017. We have also initiated a prefeasibility study to evaluate the construction of an underground mine at Lama, on the Argentinean side of the Pascua-Lama project.
Highlights of our greenfield exploration program for 2017 include the Fourmile target, adjacent to our Goldrush discovery in Nevada, and the Frontera District on the border of Argentina and Chile. We have also formed new partnerships with Alicanto Minerals in Guyana and Osisko Mining in the Labrador Trough of Northern Quebec, where we see the potential to develop new core mineral districts for Barrick. Our portfolio also contains a number of the world’s largest undeveloped gold deposits, including Donlin Gold, Cerro Casale, and Pascua-Lama. These projects contain 31.5 million ounces of gold in proven and probable reserves (Barrick’s share), and 29.3 million ounces in measured and indicated resources (Barrick’s share).
Management Structure Refinements
In December 2016, Michelle Ash, formerly Senior Vice President, Business Transformation & Innovation, was elevated to the position of Chief Innovation Officer and Matt Gili, formerly Executive General Manager for the Cortez District in Nevada, was elevated to Chief Technical Officer.
In August 2016, we announced the appointment of Mark Hill as Chief Investment Officer and a member of Barrick’s Executive Committee, a group of the Company’s most senior partners. In this newly-created position, Mr. Hill will chair Barrick’s Investment Committee and apply a high degree of consistency and rigor to all capital allocation decisions at the company – whether at existing operations, development projects, exploration (both near-mine and greenfields), or potential acquisitions and divestments.
In March 2016, Shaun Usmar, then Barrick’s Senior Executive Vice President and Chief Financial Officer, announced his resignation from Barrick. Catherine Raw, formerly Executive Vice President, Business Performance, succeeded Mr. Usmar as Chief Financial Officer on April 27, 2016, subsequent to the Company’s 2016 Annual General Meeting. In March 2016, we also announced that Rob Krcmarov, formerly Senior Vice President, Global Exploration, had been elevated to the position of Executive Vice President, Exploration and Growth, and had become a member of Barrick’s Executive Committee.
Board Renewal & Appointments
In 2016, the Board of Directors appointed Kelvin Dushnisky, President of Barrick, as a director. Graham G. Clow, Chairman of Roscoe Postle Associates Inc., and Gary Doer, former Canadian Ambassador to the United States, were elected as new directors at Barrick’s Annual General Meeting on April 26, 2016. William Birchall retired from the Board at the conclusion of the Company’s 2016 Annual General Meeting. On December 6, 2016, the Company appointed Pablo Marcet to its Board of Directors. Mr. Marcet is a seasoned mining professional with nearly 30 years of experience in the exploration, development, and operation of mines across Latin America and East Africa. He has held senior management positions in geology, mining operations, and business development, including 15 years at BHP Billiton. Barrick continues to renew the talent on its Board, with nine of the 14 directors (excluding the Executive Chairman) being new to the Company since April 2014.
| | | | |
| BARRICK YEAR-END 2016 | | 32 | | MANAGEMENT’S DISCUSSION AND ANALYSIS |
Outlook for 2017
Operating Unit Guidance
Our 2016 gold and copper production, cost of sales, cash costs,all-in sustaining costs and 2017 forecast gold and copper production, cost of sales, cash costs andall-in sustaining costs ranges by operating unit are as follows:
| | | | | | | | | | | | | | | | | | | | | | | | | | | | | | | | |
Operating Unit | |
| 2016
production (000s ozs) |
| | | 2016 cost of sales ($/oz) | | |
| 2016 cash
costs1
($/oz) |
| |
| 2016 all-in sustaining1
costs ($/oz) |
| |
| 2017 forecast
production (000s ozs) |
| |
| 2017 forecast
cost of sales ($/oz) |
| | | 2017 forecast cash costs1 ($/oz) | | | | 2017 forecast all-in sustaining1 costs ($/oz) | |
Gold | | | | | | | | | | | | | | | | | | | | | | | | | | | | | | | | |
Cortez | | | 1,059 | | | | $901 | | | | $430 | | | | $518 | | | | 1,250 - 1,290 | | | | $730 - $760 | | | | $360 - $380 | | | | $430 - $470 | |
Goldstrike | | | 1,096 | | | | 852 | | | | 572 | | | | 714 | | | | 910 - 950 | | | | 950 - 990 | | | | 650 - 680 | | | | 910 - 980 | |
Pueblo Viejo (60%) | | | 700 | | | | 564 | | | | 395 | | | | 490 | | | | 625 - 650 | | | | 650 - 680 | | | | 400 - 420 | | | | 530 - 560 | |
Lagunas Norte | | | 435 | | | | 651 | | | | 383 | | | | 529 | | | | 380 - 420 | | | | 710 - 780 | | | | 430 - 470 | | | | 560 - 620 | |
Veladero | | | 544 | | | | 872 | | | | 582 | | | | 769 | | | | 770 - 830 | | | | 750 - 800 | | | | 500 - 540 | | | | 840 - 940 | |
Total Core Mines | | | 3,834 | | | | $793 | | | | $480 | | | | $606 | | | | 3,900 - 4,100 | | | | $770 - $810 | | | | $470 - $500 | | | | $665 - $710 | |
Turquoise Ridge (75%) | | | 266 | | | | 603 | | | | 498 | | | | 625 | | | | 260 - 280 | | | | 575 - 625 | | | | 460 - 500 | | | | 650 - 730 | |
Porgera (47.5%) | | | 234 | | | | 836 | | | | 689 | | | | 858 | | | | 250 - 270 | | | | 780 - 840 | | | | 650 - 700 | | | | 900 - 970 | |
Kalgoorlie (50%) | | | 376 | | | | 762 | | | | 627 | | | | 706 | | | | 390 - 410 | | | | 750 - 790 | | | | 600 - 630 | | | | 670 - 710 | |
Acacia (63.9%) | | | 530 | | | | 880 | | | | 640 | | | | 958 | | | | 545 - 575 | | | | 860 - 910 | | | | 580 - 620 | | | | 880 - 920 | |
Hemlo | | | 235 | | | | 795 | | | | 679 | | | | 839 | | | | 205 - 220 | | | | 800 - 860 | | | | 640 - 690 | | | | 880 - 980 | |
Golden Sunlight | | | 34 | | | | 1,512 | | | | 1,376 | | | | 1,493 | | | | 35 - 50 | | | | 900 - 1,200 | | | | 900 - 950 | | | | 950 - 1,040 | |
Total Continuing Operations | | | 5,509 | | | | $844 | | | | $523 | | | | $659 | | | | 5,600 - 5,900 | | | | $780 - $820 | | | | $510 - $535 | | | | $700 - $750 | |
Round Mountain (50%)2 | | | 5 | | | | 701 | | | | 608 | | | | 601 | | | | - | | | | - | | | | - | | | | - | |
Bald Mountain2 | | | 3 | | | | 1,112 | | | | 723 | | | | 1,692 | | | | - | | | | - | | | | - | | | | - | |
Pierina | | | 92 | | | | 911 | | | | 662 | | | | 1,301 | | | | - | | | | - | | | | - | | | | - | |
Total Divested/Closed Sites | | | 100 | | | | $897 | | | | $658 | | | | $1,250 | | | | - | | | | - | | | | - | | | | - | |
Total Gold3 | | | 5,609 | | | | $798 | | | | $518 | | | | $668 | | | | 5,600 - 5,900 | | | | $780 - $820 | | | | $510 - $535 | | | | $700 - $750 | |
Total Consolidated Barrick4,5 | | | 5,609 | | | | $798 | | | | $546 | | | | $730 | | | | 5,600 - 5,900 | | | | $780 - $820 | | | | $510 - $535 | | | | $720 - $770 | |
| | | | | | | | |
| | |
| 2016
production (millions lbs) |
| |
| 2016
cost of sales ($/lb) |
| |
| 2016
C1 cash costs1 ($/lb) |
| |
| 2016
all-in sustaining1 costs ($/lb) |
| |
| 2017 forecast
production (millions lbs) |
| |
| 2017 forecast
cost of sales ($/lb) |
| |
| 2017
forecast C1 cash1 costs ($/lb) |
| |
| 2017 forecast
all-in sustaining1 costs ($/lb) |
|
Copper | | | | | | | | | | | | | | | | | | | | | | | | | | | | | | | | |
Zaldívar (50%) | | | 114 | | | | $1.93 | | | | $1.55 | | | | $2.05 | | | | 120 - 135 | | | | $2.00 - $2.20 | | | | ~$1.50 | | | | $1.90 - $2.10 | |
Lumwana | | | 271 | | | | 1.16 | | | | 1.44 | | | | 1.97 | | | | 250 - 275 | | | | 1.20 - 1.40 | | | | 1.40 - 1.60 | | | | 2.10 - 2.30 | |
Jabal Sayid (50%) | | | 30 | | | | 2.33 | | | | 1.97 | | | | 2.98 | | | | 30 - 40 | | | | 2.10 - 2.80 | | | | 1.50 - 1.90 | | | | 2.30 - 2.80 | |
Total Copper | | | 415 | | | | $1.43 | | | | $1.49 | | | | $2.05 | | | | 400 - 450 | | | | $1.50 - $1.70 | | | | $1.40 - $1.60 | | | | $2.10 - $2.40 | |
| | 1 | Cash costs,all-in sustaining costs and C1 cash costs arenon-GAAP financial performance measures with no standardized meaning under IFRS and therefore may not be comparable to similar measures of performance presented by other issuers. For further information and a detailed reconciliation of thenon-GAAP measures used in this section of the MD&A to the most directly comparable IFRS measure, please see pages 71 to 85 of this MD&A. |
| | 2 | Includes results from Bald Mountain and Round Mountain up to January 11, 2016, the effective date of sale of these assets. |
| | 3 | Total gold cash costs andall-in sustaining costs per ounce exclude the impact of hedges and/or costs allocated tonon-operating sites. |
| | 4 | Operating unit guidance ranges reflect expectations at each individual operating unit, and may not add up to the company-wide guidance range total. The company-wide guidance ranges exclude Pierina which is mining incidental ounces as it enters closure and Bald Mountain and Round Mountain which were disposed of in January 2016. |
| | 5 | Total Consolidated Barrickall-in sustaining costs include corporate administration costs and expected savings from an improved capital management program that have not been reflected in the individual site guidance ranges at this time. |
| | | | |
| BARRICK YEAR-END 2016 | | 33 | | MANAGEMENT’S DISCUSSION AND ANALYSIS |
Operating Unit, Consolidated Expense and Capital Guidance
Our 2016 gold and copper production, cost of sales, cash costs1,all-in sustaining costs1, consolidated expenses and capital expenditures and forecast gold and copper production, cost of sales, cash costs1,all-in sustaining costs1, consolidated expenses and capital expenditures for 2017 are as follows:
| | | | | | | | | | | | | | | | |
($ millions, except per ounce/pound data) | | 2016 Original Guidance | | | Q3 2016 Guidance | | | 2016 Actual | | | 2017 Guidance | |
| |
Gold production and costs | | | | | | | | | | | | | | | | |
Production (millions of ounces) | | | 5.00 - 5.50 | | | | 5.25 - 5.55 | | | | 5.52 | | | | 5.60 - 5.90 | |
Gold unit production costs | | | | | | | | | | | | | | | | |
Cost of sales - gold ($ per oz) | | | - | | | | 800 - 850 | | | | 798 | | | | 780 - 820 | |
All-in sustaining costs ($ per oz)1 | | | 775 - 825 | | | | 740 - 775 | | | | 730 | | | | 720 - 770 | |
Cash costs ($ per oz)1 | | | 550 - 590 | | | | 540 - 565 | | | | 546 | | | | 510 - 535 | |
Depreciation ($ per oz) | | | 240 - 260 | | | | 240 - 260 | | | | 249 | | | | 245 - 265 | |
| |
Copper production and costs | | | | | | | | | | | | | | | | |
Production (millions of pounds) | | | 370 - 410 | | | | 380 - 430 | | | | 415 | | | | 400 - 450 | |
Copper unit production costs | | | | | | | | | | | | | | | | |
Cost of sales - copper ($ per lb) | | | - | | | | 1.35 - 1.55 | | | | 1.43 | | | | 1.50 - 1.70 | |
C1 cash costs ($ per lb)1 | | | 1.45 - 1.75 | | | | 1.40 - 1.60 | | | | 1.49 | | | | 1.40 - 1.60 | |
Depreciation ($ per lb) | | | 0.20 - 0.30 | | | | 0.20 - 0.30 | | | | 0.23 | | | | 0.30 - 0.40 | |
Copperall-in sustaining costs ($ per lb) 1 | | | 2.05 - 2.35 | | | | 2.00 - 2.20 | | | | 2.05 | | | | 2.10 - 2.40 | |
| |
Exploration and project expenses | | | 225 - 275 | | | | 195 - 245 | | | | 237 | | | | 415 - 495 | |
Exploration and evaluation | | | 125 - 155 | | | | 115 - 145 | | | | 132 | | | | 185 - 225 | |
Project expenses | | | 100 - 120 | | | | 80 - 100 | | | | 105 | | | | 230 - 270 | |
General and administrative expenses | | | ~215 | | | | ~260 | | | | 256 | | | | ~285 | |
Corporate administration | | | ~145 | | | | ~160 | | | | 163 | | | | ~200 | |
Stock-based compensation2 | | | ~45 | | | | ~40 | | | | 38 | | | | ~40 | |
Acacia3 | | | ~25 | | | | ~60 | | | | 55 | | | | ~45 | |
Other expense4 | | | 20 - 40 | | | | 20 - 40 | | | | 60 | | | | 25 - 45 | |
Finance costs | | | 690 - 730 | | | | 710 - 750 | | | | 788 | | | | 600 - 650 | |
Attributable capital expenditures: | | | | | | | | | | | | | | | | |
Attributable minesite sustaining | | | 1,200 - 1,400 | | | | 1,050 - 1,100 | | | | 977 | | | | 1,050 - 1,200 | |
Attributable project | | | 150 - 250 | | | | 150 - 200 | | | | 145 | | | | 250 - 300 | |
Total attributable capital expenditures 5 | | | 1,350 - 1,650 | | | | 1,200 - 1,300 | | | | 1,122 | | | | 1,300 - 1,500 | |
| |
| 1 | Cash costs,all-in sustaining costs and C1 cash costs arenon-GAAP financial performance measures with no standardized meaning under IFRS and therefore may not be comparable to similar measures of performance presented by other issuers. For further information and a detailed reconciliation of thenon-GAAP measures used in this section of the MD&A to the most directly comparable IFRS measure, please see pages 71 to 85 of this MD&A. |
| 2 | 2016 actual based on US$15.98 and 2017 guidance based on a three month trailing average ending December 31, 2016 of US$16.92 per share and excludes Acacia. |
| 3 | 2016 actual includes $32 million in stock-based compensation. 2017 guidance includes ~$20 million in stock-based compensation. |
| 4 | 2016 actual includes a net loss on debt extinguishment of $129 million. |
| 5 | 2016 actual attributable capital expenditures are presented on the same basis as 2016 guidance, which include our 60% share of Pueblo Viejo and Arturo and our 50% share of Zaldívar and Jabal Sayid. 2017 Guidance includes our 60% share of Pueblo Viejo and Arturo, our 63.9% share of Acacia and our 50% share of Zaldívar and Jabal Sayid. |
| | | | |
| BARRICK YEAR-END 2016 | | 34 | | MANAGEMENT’S DISCUSSION AND ANALYSIS |
2017 Guidance Analysis
Estimates of future production, cost of sales, and cash costs presented in this MD&A are based on mine plans that reflect the expected method by which we will mine reserves at each site. Actual gold and copper production and associated costs may vary from these estimates due to a number of operational andnon-operational risk factors (see the “Cautionary Statement on Forward-Looking Information” on page 21 of this MD&A for a description of certain risk factors that could cause actual results to differ materially from these estimates).
In 2017 we expect improvements to our mine site AISC and capital expenditures guidance as we identify further savings from our continued focus on capital discipline, currently reflected in the overall company guidance.
Production
We expect 2017 gold production to be in the range of 5.6 to 5.9 million ounces. 2017 gold production is expected to be higher than 2016, primarily as a result of increases at Cortez and Veladero, partially offset by Goldstrike and Pueblo Viejo.
Production at Cortez in 2017 is expected to be 18% to 22% higher than the prior year due to an increase in open pit production, primarily from higher grade oxide ore as well as increased throughput at the mill processed on site and larger volumes of refractory ore being processed at Goldstrike. This is partially offset by an expected decline in underground ore grade as the mine transitions to lower grade ore zones deeper in the deposit.
Significantly higher production is expected at Veladero in 2017 compared to the prior year. The expected increase in production at Veladero is due to higher grade ore being processed and faster recovery from the leach pad, as a result of better operational management. In addition, our 2017 production guidance for Veladero anticipates higher ore tonnes mined and processed in 2017, given the suspension, environmental and bad weather incidents experienced in 2016.
At Goldstrike, we expect 2017 production to be in the range of 910 to 950 thousand ounces, 13% to 17% lower than the prior year. Our emphasis at the underground in 2017 will be on development deeper in the mine and ore mined will also be impacted by a slightly higher percentage of cut and fill tonnage. Production from the open pit is expected to be lower as we transition from ore mining at the Arturo pit to stripping the 3rd and 4th northwest laybacks at the Betze Post pit.
Production at Pueblo Viejo is expected to be lower than the prior year due to reduced gold grades, partially offset by increased gold recovery from ore blending andBest-in-
Class initiatives improving availability and utilization of autoclaves.
Cost of Sales
On a per ounce basis, cost of sales attributable to gold, after removing the portion related tonon-controlling interests, is expected to be in the range of $780 to $820 per ounce, in line with the prior year. In our 2017 guidance, we do not anticipate inventory impairment charges (2016: $68 million) or hedge losses from our currency and fuel hedging programs (2016: $89 million loss).
We are currently projecting higher energy and consumables costs in 2017, increasing direct mining costs from the prior year. We plan to offset those rising costs with a continued focus on lowering our other direct mining costs throughBest-in-Class initiatives, which should improve operating efficiencies and lower labor and contractor costs.
Cash Costs per ounce
Cash costs1 are expected to be in the range of $510 to $535 per ounce, in line with the prior year, after excluding hedge losses of $13 per ounce from 2016. Expected improvements in cash costs at Cortez and Veladero are partially offset by increases at Goldstrike and Lagunas Norte.
We expect significantly lower cash costs at Cortez in 2017 compared to the prior year, as productivity improvements generated by digitization andBest-in-Class start contributing to additional mining and processing volumes which more than offset increases in energy and consumable cost assumptions.
Lower expected cash costs at Veladero in 2017 compared to the prior year, are the result of higher production on unit costs which more than offsets our higher energy and consumable cost assumptions.
These cash cost decreases are expected to be partially offset by increases in cash costs at Goldstrike and Lagunas Norte due to lower expected production and higher expected energy and consumables costs, partially offset by improvements to direct mining costs as a result ofBest-in-Class initiatives.
All-In Sustaining Costs per ounce
All-in sustaining costs1 are expected to be in the range of $720 to $770 per ounce for gold, which is comparable to the $730 per ounce in 2016. In 2017, we will continue to focus onBest-in-Class initiatives to reduce mining and
| | | | |
| BARRICK YEAR-END 2016 | | 35 | | MANAGEMENT’S DISCUSSION AND ANALYSIS |
labor costs, partially offsetting higher expected energy and consumable costs, digitization costs at our mine sites ($14 per ounce) and an increase in corporate administration expense ($7 per ounce), as we seek to optimize our process and systems through business improvement initiatives, including digitization.
The expected increase in mine site sustaining capital in 2017 compared to the prior year is expected to be offset by the impact of higher expected production on unit costs and targeted capital savings from our continued focus on capital discipline process.
Exploration and Project Expenses
We expect to incur approximately $185 to $225 million of exploration and evaluation (“E&E”) expenditures in 2017 with approximately 80 percent of that spend allocated to the Americas. The majority of the remaining budget is allocated to Acacia. Our exploration programs balance high-quality brownfield projects, greenfield exploration, and emerging discoveries that have the potential to become profitable mines. We continue to take advantage of existing infrastructure and advance key growth projects, including three significant projects in Nevada: the Cortez Deep South underground expansion, the potential development of an underground mine at Goldrush and a significant expansion of throughput at the Turquoise Ridge mine. At the Lagunas Norte mine in Peru, we are advancing a project to extend the life of the mine by approximately nine years by mining the refractory material below the oxide ore body in the current open pit.
Highlights of our greenfield exploration program for 2017 include the Fourmile target, adjacent to our Goldrush discovery in Nevada, and the Frontera District on the border of Argentina and Chile.
We expect to incur approximately $230 to $270 million of project expenses in 2017, compared to $105 million in 2016. The increase in project expenses primarily reflects the cost to complete a prefeasibility study we have initiated to evaluate the construction of an underground mine at Lama, the Argentinean side of the Pascua-Lama project. If successful, it could support a staged development of the Pascua-Lama deposit. Project expenses also includes the cost of Pascua-Lama water management and monitoring activities and other holding costs as part of the temporary closure plan; and the costs associated with our Alturas, Donlin Gold and Cerro Casale projects.
General and Administrative Expenses
In 2017 we expect corporate administration costs to be in the range of $175 to $200 million, an increase from the prior year, as we seek to optimize our process and
systems through business improvement initiatives, including digitization.
Finance Costs
Finance costs of $600 to $650 million primarily represent interest expense on long-term debt. We expect finance costs in 2017 to be lower than 2016 levels primarily due to lower interest expense in 2017 following $2.04 billion of debt repayments in 2016. The impact of any further debt reductions accomplished in 2017 has not been reflected in our guidance on interest expense. 2016 finance costs included a $129 million net loss on the extinguishment of debt and further debt repurchases could lead to additional losses on extinguishment that could cause an increase to forecasted finance costs.
Capital Expenditures
Total attributable capital expenditures for 2017 are expected to be in the range of $1.3 to $1.5 billion, compared to $1.1 billion in 2016, which reflects an increase in both sustaining and project capital.
Minesite sustaining capital expenditures reflect the capital spending required to support current planned production levels and those which do not meet our definition of project capital. This includes capitalized production phase stripping costs at our open pit mines, underground mine development and mine site E&E expenditures that meet our criteria for capitalization.
Attributable minesite sustaining capital expenditures are expected to increase from 2016 expenditure levels of $977 million to a range of $1,050 to $1,200 million, mainly due to our digitization project, planned tailings expansions and increased stripping at Goldstrike and Veladero, equipment rebuilds and other process facility upgrades at Hemlo, Lumwana and Pueblo Viejo. These increases in sustaining capital are partially offset by expected savings from our continued focus on capital discipline process. These savings are not reflected in the minesite guidance ranges at this time and are expected to be included in updates through the year.
At Goldstrike in 2017, sustaining capital expenditures are expected to increase primarily due to planned tailings expansions, process improvements, and underground sustaining projects to enable mining at greater depth. Capitalized waste stripping is expected to increase compared to the prior year as we shift from mining ore at Arturo to stripping the 3rd and 4th northwest laybacks in the Betze Post pit, partially offset by reduced operating spend driven by savings initiatives to optimize planned production at the lowest cost.
| | | | |
| BARRICK YEAR-END 2016 | | 36 | | MANAGEMENT’S DISCUSSION AND ANALYSIS |
At Veladero, a significant increase in capital is expected in 2017, mainly related to expansion of the leach pad, digitization, equipment purchases and increased capitalized waste stripping due to phases 5 and 6 of the Federico pit.
At Pueblo Viejo, the increase in sustaining capital in 2017 is related to initiatives to improve the plant and mine operational efficiency, process facility upgrades and construction of a substation.
At Lumwana, the 2017 increases in sustaining capital are related to Chimi South 2 Embankment for water diversion and equipment rebuilds.
At Hemlo, sustaining capital increases are primarily related to a tailings dam expansion and replacement of the semi-autogenous grinding mill shell in 2017.
Project capital expenditures reflect capital expenditures at new projects and existing operations that are related to discrete projects intended to increase production and will
not benefit production for at least 12 months. Project capital expenditures also include capital expenditures related to the initial construction of a project and include all of the expenditures required to bring the project into operation and achieve commercial production levels.
Attributable project capital expenditures are expected to increase to a range of $250 to $300 million in 2017. The increase in project capital expenditures in 2017 compared to the prior year is primarily due to the Cortez Lower Zone expansion project, and an increase inpre-production waste stripping at Crossroads phase 1 at Cortez compared to 2016, the finalization of the Robertson acquisition and a slight increase in spend at Pascua-Lama. This is partially offset by the completion ofpre-production waste stripping at Arturo in 2016.
Effective Income Tax Rate
At current spot gold prices, our expected effective tax rate for 2017 is approximately 45%.
Outlook Assumptions and Economic Sensitivity Analysis
| | | | | | | | | | |
| | | 2017 Guidance | | Hypothetical | | Impact on | | Impact on Cost of | | Impact on |
| | | Assumption | | Change | | Revenue (millions) | | Sales (millions) | | AISC1 |
Gold revenue, net of royalties3 | | $1,050/oz | | +/- $100/oz | | +/- $571 | | n/a | | +/- $3/oz |
Copper revenue, net of royalties2 | | $2.25/lb | | + $0.50/lb | | + $213 | | n/a | | + $0.03/lb |
Copper revenue, net of royalties2 | | $2.25/lb | | - $0.50/lb | | - $171 | | n/a | | - $0.03/lb |
Goldall-in sustaining costs | | | | | | | | | | |
WTI crude oil price3 | | $55/bbl | | +/- $10/bbl | | n/a | | +/- $17 | | +/- $3/oz |
Australian dollar exchange rate | | 0.75 : 1 | | +/- 10% | | n/a | | +/- $29 | | +/- $5/oz |
Canadian dollar exchange rate | | 1.32 : 1 | | +/- 10% | | n/a | | +/- $32 | | +/- $6/oz |
Copperall-in sustaining costs | | | | | | | | | | |
WTI crude oil price3 | | $55/bbl | | +/- $10/bbl | | n/a | | +/- $5 | | +/- $0.01/lb |
Chilean peso exchange rate | | 675 : 1 | | +/- 10% | | n/a | | +/- $6 | | +/- $0.01/lb |
| | 1 | All-in sustaining costs is anon-GAAP financial performance measure with no standardized definition under IFRS. For further information and a detailed reconciliation, please see page 71 to 85 of this MD&A. |
| | 2 | Utilizing option collar strategies, the company has protected the downside of a portion of its expected 2017 copper production at an average floor price of $2.20 per pound and can participate on the same amount up to an average price of $2.82 per pound. Our remaining copper production is subject to market prices. |
| | 3 | Due to our hedging activities, which are reflected in these sensitivities, we are partially protected against changes in these factors. |
| | | | |
| BARRICK YEAR-END 2016 | | 37 | | MANAGEMENT’S DISCUSSION AND ANALYSIS |
Risks and Risk Management
Overview
The ability to deliver on our vision, strategic objectives and operating guidance depends on our ability to understand and appropriately respond to the uncertainties or “risks” we face that may prevent us from achieving our objectives. In order to achieve this we:
| ● | | Maintain a framework that ensures we manage risk effectively and in a manner that creates the greatest value; |
| ● | | Integrate a process for managing risk into all our important decision-making processes so that we reduce the effect of uncertainty on achieving our objectives; |
| ● | | Ensure that the key controls we rely on to achieve the company’s objectives are actively monitored so that they remain in place and are effective at all times; and |
| ● | | Provide assurance to the Executives and relevant Committees of the Board of Directors on the effectiveness of key control activities. |
Board and Committee Oversight
We maintain strong risk oversight practices, with responsibilities outlined in the Board’s and related committees’ mandates. The Board’s mandate makes clear the responsibility for reviewing and discussing with management the processes used to assess and manage risk, including the identification by management of the principal risks of the business, and the implementation of appropriate systems to deal with such risks.
The Risk Committee of the Board of Directors assists the Board in overseeing the Company’s management of principal risks as well as the implementation of policies and standards for monitoring and modifying such risks, and monitoring and reviewing the Company’s financial position and financial risk management programs generally. The Audit Committee and Corporate Responsibility Committee also provide oversight focusing on financial and operational (e.g. Safety & Health, Environmental, Community, Security, etc.) risk exposures, respectively.
Management Oversight
On a weekly basis, the global leadership team, including the Executive Committee and representatives from each of Barrick’s country offices, mine sites and corporate functions, participate in a Business Plan Review (“BPR”) meeting. This forum allows for the timely identification of
key risks that may prevent the Company from achieving its objectives. It also fosters a culture of transparent, real-time risk management as a collective and enables a learning organization.
Principal Risks
The following subsections describe some of our key sources of uncertainty and most important risk modification activities. The risks described below are not the only ones facing Barrick. Our business is subject to inherent risks in financial, regulatory, strategic and operational areas. For a more comprehensive discussion of those inherent risks, see “Risk Factors” in our most recent Form40-F/Annual Information Form on file with the SEC and Canadian provincial securities regulatory authorities. Also see the “Cautionary Statement on Forward-Looking Information” on page 21.
Financial position and liquidity
Our liquidity profile, level of indebtedness and credit ratings are all factors in our ability to meetshort- and long-term financial demands. Barrick’s outstanding debt balances impact liquidity through scheduled interest and principal repayments and the results of leverage ratio calculations, which could influence our investment grade credit ratings and ability to access capital markets. In addition, the Company’s ability to draw on our credit facility is subject to meeting its covenants. Our primary source of liquidity is our operating cash flow, which is dependent on the ability of our operations to deliver projected future cash flows. The ability of our operations to deliver projected future cash flows, as well as future changes in gold and copper market prices, either favorable or unfavorable, will continue to have a material impact on our cash flow and liquidity.
Key risk modification activities:
| ● | | Reduced notional and lengthened average tenor of our outstanding debt through liability management activities; |
| ● | | Continued focus on generating positive free cash flow by improving the underlying cost structures of our operations in a sustainable manner; |
| ● | | Disciplined capital allocation criteria for all investments; |
| ● | | Preparation of budgets and forecasts to understand the impact of different price scenarios on liquidity, and formulate appropriate strategies; and |
| | | | |
| BARRICK YEAR-END 2016 | | 38 | | MANAGEMENT’S DISCUSSION AND ANALYSIS |
| ● | | Other options to enhance liquidity include drawing on our $4.0 billion undrawn credit facility, asset sales, joint ventures, or issuance of debt or equity securities. |
Improving free cash flow and AISC
Our ability to improve productivity, drive down operating costs and reduce working capital remains a focus in 2017 and is subject to several sources of uncertainty. This includes our ability to achieve and maintain industry-leading margins by improving the productivity and efficiency of our operations through ourBest-in-Class program which includes the digital transformation of Barrick.
Key risk modification activities:
| ● | | Formal project management protocols are established around these business transformation programs. The status of these projects is reviewed on a weekly basis during the BPR meetings to ensure the timely identification of key risk exposures that may affect their successful delivery; |
| ● | | Ongoing implementation of aBest-in-Class program to unleash the full potential of our mines and encompassing: |
| | ● | | A standardized, performance-oriented, measurement scorecard linking top operational and economic measures; |
| | ● | | Monthly optimization forums as a way to communicate and review theBest-in-Class projects and performance to targets; and |
| | ● | | Innovation and digitization program focused on driving value across the business. |
Social license to operate
At Barrick, we are committed to building, operating, and closing our mines in a safe and responsible manner. To do this, we develop long-term and mutually-beneficial relationships with host governments and communities while working to minimize the social and environmental impacts of our activities. Incidents of corruption in the extractive industry are indicative of the risks related to interaction with government officials and the potential consequences to our partnerships in the locations where we operate. Environmental incidents in the extractive industry emphasize the hazards (e.g. water management, tailings storage facilities, etc.) and the potential consequences to both the environment and community health and safety. Our ability to maintain compliance with environmental, regulatory and community obligations remains one of our top priorities.
Key risk modification activities:
| ● | | Our external Corporate Social Responsibility Advisory Board was formed in 2012 and provides expert advice to the Company on a range of corporate responsibility matters, including community relations, sustainable development, water, energy, climate change, security and human rights; |
| ● | | Our obligations, expectations and intentions are codified in our Vision and Values and the Code of Business Conduct and Ethics, and they are reinforced regularly at all levels of the Company; |
| ● | | Barrick’s community relations, environment, safety and health, security and compliance management systems set expectations, define performance standards and provide the necessary tools to modify the related risks; |
| ● | | We take a partnership approach with our home and host governments. This means we work to balance our own interests and priorities with those of our government partners, working to ensure that everyone derives real value from our operations; |
| ● | | We participate in the annual CDP Climate Change and Water Disclosure process, providing investors and other interested partners with detailed information on our water and energy use and emissions data; and |
| ● | | We open our social and environmental performance to third-party scrutiny, including through the ISO 14001re-certification process, International Cyanide Management Code audits, annual human rights impact assessments, and an annual assurance against the International Council on Mining and Metal’s Sustainable Development Framework. |
Resources and reserves and production outlook
Like any mining company, we face the risk that we are unable to discover or acquire new resources or that we do not convert resources into production. As we move into 2017 and beyond, our overriding objective of growing free cash flow per share is underpinned by a strong pipeline of organic projects and minesite expansion opportunities in our core regions as discussed on page 31. Uncertainty related to these and other opportunities exists (potentially both favorable and unfavorable) due to the speculative nature of mineral exploration and development as well as the potential for increased costs, delays, suspensions and technical challenges associated with the construction of capital projects.
Key risk modification activities:
| ● | | Focus on responsible Mineral Resource Management and continuously improved orebody |
| | | | |
| BARRICK YEAR-END 2016 | | 39 | | MANAGEMENT’S DISCUSSION AND ANALYSIS |
| | knowledge, adding to and upgrading reserves and resources (organically and inorganically); |
| ● | | Develop and advance a balanced pipeline of high-return projects and seek to exit those that do not meet expectations; |
| ● | | Pursue high-return growth options with a mindset of innovation, cost control, and risk mitigation; |
| ● | | Enhance project design to stagger capital outlay and optimize timing of cash flows; and |
| ● | | Exploration activities including minesite exploration and global programs. |
Market Overview
The market prices of gold, and, to a lesser extent, copper are the primary drivers of our profitability and our ability to generate free cash flow for our shareholders.
Gold
The price of gold is subject to volatile price movements over short periods of time and is affected by numerous industry and macroeconomic factors. During the year, the gold price ranged from $1,061 per ounce to $1,375 per ounce. The average market price for the year of $1,251 per ounce represented an increase of 8% versus 2015.
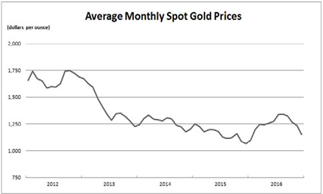
The price of gold in 2016 generally rose over the first half of the year, reaching its high for the year in early July, and generally declined over the second half of the year. In the first half of 2016, the gold price was positively influenced by declining expectations regarding increases in the benchmark U.S. interest rate, low and negative interest rates on sovereign debt issued by many of the world’s largest economies, global economic and political uncertainty highlighted by the British referendum in favor of leaving the European Union, and investor interest in gold as a safe haven asset. In the second half of 2016, the gold price was negatively influenced by a stronger U.S. dollar, rising U.S. and global interest rates, expectations of fiscal stimulus measures in the U.S. to be put in place by the newly elected administration, subdued physical
demand in key consuming countries of China and India due to government measures to maintain currency valuations, and a decline in investor sentiment.
Copper
During 2016, London Metal Exchange (“LME”) copper prices traded in a range of $1.96 to $2.74 per pound, averaged $2.21 per pound, and closed the year at $2.50 per pound. Copper prices are significantly influenced by physical demand from emerging markets, especially China.
The price of copper traded in a subdued range in 2016, before achieving significant price upside in the fourth quarter due to positive economic and copper usage data from China, expectations of increased infrastructure spending in the U.S., an increase in the price of othernon-precious mined commodities, and an increase in investor sentiment. Challenging near-term fundamentals currently limit the potential copper price upside, but a dearth of new projects scheduled to enter production later in the decade could begin to positively impact prices in the coming years should physical demand continue to grow.
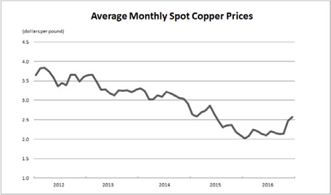
Utilizing option collar strategies, and excludingco-product copper hedges put in place by Acacia, we have protected the downside on approximately 65 million pounds of expected 2017 copper production at an average floor price of $2.20 per pound and can participate up to an average price of $2.82 per pound. These positions expire evenly over the first six months of the year. In addition, Acacia hasco-product copper collar hedges in place on approximately 13 million pounds of expected 2017 copper production at an average floor price of $2.30 per pound and can participate up to an average price of $2.78 per pound. Our remaining copper production is subject to market prices.
We have provisionally priced copper sales for which final price determination versus the relevant copper index is
| | | | |
| BARRICK YEAR-END 2016 | | 40 | | MANAGEMENT’S DISCUSSION AND ANALYSIS |
outstanding at the balance sheet date. As at December 31, 2016, we recorded 44 million pounds of copper sales subject to final settlement at an average provisional price of $2.51 per pound. The impact to net income before taxation of a 10% movement in the market price of copper would be approximately $11 million, holding all other variables constant.
Silver
Silver traded in a range of $13.75 to $21.14 per ounce in 2016, averaged $17.14 per ounce and closed the year at $16.24 per ounce. The silver price is driven by factors similar to those influencing investment demand for gold.
Silver prices do not significantly impact our current operating earnings, cash flows, or gold cash costs. Silver prices, however, will have a significant impact on the overall economics for our Pascua-Lama project.
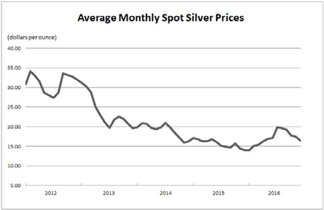
Currency Exchange Rates
The results of our mining operations outside of the United States are affected by US dollar exchange rates withnon-US denominated currencies comprising approximately 25% of our operating and capital cost exposures. Although we have made dispositions, we continue to have exposure to the Australian and Canadian dollars through a combination of mine operating and corporate administration costs, as well as exposure to the Chilean peso through expected future capital and operating costs at our Pascua-Lama project and mine operating costs at Zaldívar. We also have exposure to the Argentinean peso through operating costs at our Veladero mine, peso denominated VAT receivable balances and expected future capital and operating costs at our Pascua-Lama project. In addition, we have exposure to the Papua New Guinea kina, Peruvian sol, Zambian kwacha, Tanzanian shilling and Dominican peso through mine operating and capital costs.
Fluctuations in the US dollar increase the volatility of our costs reported in US dollars, subject to positions put in place through our currency hedging program. In 2016, the Australian dollar traded in a range of $0.68 to $0.78 against the US dollar, while the US dollar against the Canadian dollar, Chilean peso and Argentinean peso ranged from $1.25 to $1.47, CLP642 to CLP733 and ARS 12.90 to ARS 16.17, respectively.
Due to expectations of a strengthened US dollar, in recent years we have reduced our overall foreign currency derivative positions, whether by closing out positions before maturity or limiting the addition of new positions. As a result, at the end of 2016, we did not have any foreign currency hedge positions.
During the year, we recorded losses in earnings of approximately $28 million from our foreign currency derivatives, primarily impacting our operating and corporate administration costs (2015: $87 million loss; 2014: $97 million gain).
A strengthening US dollar versus our key currency exposures is beneficial to our cost structure in 2017, as we are unhedged against such exposures as at December 31, 2016.
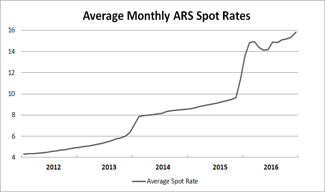
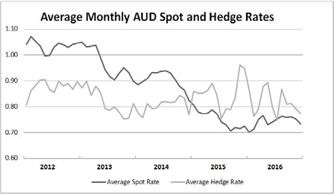
| | | | |
| BARRICK YEAR-END 2016 | | 41 | | MANAGEMENT’S DISCUSSION AND ANALYSIS |
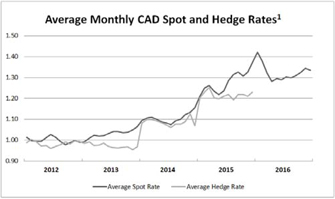
| 1 | There were no CAD hedge positions in 2016. |
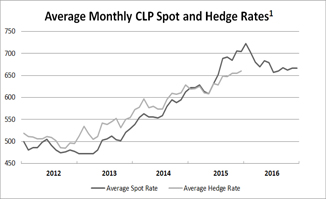
| 1 | There were no CLP hedge positions in 2016. |
Fuel
For 2016, the price of West Texas Intermediate (“WTI”) crude oil traded in a wide range between $26 and $55 per barrel, averaged $43 per barrel and closed the year at $54 per barrel. During 2016, the price of crude oil generally rose after reaching multi-year lows in the middle of the first quarter. Reduced supply and increasing demand have helped towards balancing the physical market, and a recent agreement by major producing nations to cap production has improved overall market sentiment towards crude oil.
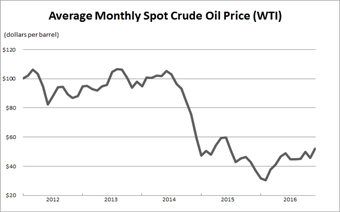
In 2016, we recorded hedge losses in earnings of $47 million on our fuel hedge positions (2015: $19 million loss and 2014: $4 million loss). Assuming December 31, 2016 market forward curves andyear-end spot prices, we expect to realize fuel hedge losses of approximately $47 million in 2017. A significant portion of these losses has already been recorded in the consolidated statements of income as an unrealized loss onnon-hedge derivatives. Beginning in January 2015, upon early adoption of IFRS 9, Barrick’s fuel hedges qualified for hedge accounting and unrealized gains and losses began being recorded in Other Comprehensive Income.
| | | | | | | | |
Financial Fuel Hedge Summary |
| | | Barrels
(thousands) | | Average
price | | % of total
expected
exposure | | Impact of $10
change onpre-tax
earnings (USD
millions)1 |
| 2017 | | 2,214 | | 80 | | 50% | | 22 |
2018 | | 1,207 | | 78 | | 28% | | 31 |
| | 1 | Includes the impact of hedges currently in place. |
US Dollar Interest Rates
Beginning in 2008, in response to the contraction of global credit markets and in an effort to spur economic activity and avoid potential deflation, the US Federal Reserve reduced the range for its benchmark rate to between 0% and 0.25%. The benchmark was kept at this level until December 2015, when the range was increased by 25 basis points. The range was raised by an additional 25 basis points in December 2016. As economic conditions in the US continue to normalize, we expect incremental increases to short-term rates to continue in 2017.
At present, our interest rate exposure mainly relates to interest receipts on our cash balances ($2.4 billion at December 31, 2016); themark-to-market value of derivative instruments; the fair value of and ongoing payments under US dollar interest-rate swaps; the carrying value of certain long lived assets and liabilities; and to the interest payments on our variable-rate debt ($0.4 billion at December 31, 2016). Currently, the amount of interest expense recorded in our consolidated statement of income is not materially impacted by changes in interest rates, because the majority of debt was issued at fixed interest rates. The relative amounts of variable-rate financial assets and liabilities may change in the future, depending on the amount of operating cash flow we generate, as well as the level of capital expenditures and our ability to borrow on favorable terms using fixed rate debt instruments. Changes in interest rates affect the accretion expense recorded on our provision for environmental rehabilitation and therefore would affect our net earnings.
| | | | |
| BARRICK YEAR-END 2016 | | 42 | | MANAGEMENT’S DISCUSSION AND ANALYSIS |
REVIEW OF ANNUAL FINANCIAL RESULTS
| | | | | | | | | | | | |
Revenue | | | | | | | | | | | | |
($ millions, except per ounce/pound data in dollars) | | | For the years ended | |
| | December 31 | |
| | | 2016 | | | 2015 | | | 2014 | |
Gold | | | | | | | | | | | | |
000s oz sold1 | | | 5,503 | | | | 6,083 | | | | 6,284 | |
000s oz produced1 | | | 5,517 | | | | 6,117 | | | | 6,249 | |
Revenue | | | $ 7,908 | | | | $ 7,813 | | | | $ 8,744 | |
Market price2 | | | 1,251 | | | | 1,160 | | | | 1,266 | |
Realized price2,3 | | | $ 1,248 | | | | $ 1,157 | | | | $ 1,265 | |
Copper | | | | | | | | | | | | |
millions lbs sold1 | | | 405 | | | | 510 | | | | 435 | |
millions lbs produced1 | | | 415 | | | | 511 | | | | 436 | |
Revenue | | | $ 466 | | | | $ 1,002 | | | | $ 1,224 | |
Market price2 | | | 2.21 | | | | 2.49 | | | | 3.11 | |
Realized price2,3 | | | 2.29 | | | | 2.37 | | | | 3.03 | |
Other sales | | | $ 184 | | | | $ 214 | | | | $ 271 | |
Total revenue | | | $ 8,558 | | | | $ 9,029 | | | | $ 10,239 | |
| 1 | Includes our equity share of gold ounces from Acacia and Pueblo Viejo and copper pounds from Zaldívar and Jabal Sayid. |
| 2 | Per ounce/pound weighted average. |
| 3 | Realized price is anon-GAAP financial performance measure with no standardized meaning under IFRS and therefore may not be comparable to similar measures of performance presented by other issuers. For further information and a detailed reconciliation of eachnon-GAAP measure used in this section of the MD&A to the most directly comparable IFRS measure, please see pages 71 to 85 of this MD&A. |
In 2016, gold revenues were up 1% compared to the prior year primarily due to a higher realized gold price, partially offset by a decrease in gold sales volume. Excluding the impact of divested sites, gold revenues were up 14% compared to the prior year due to an increase in gold sales volume combined with higher realized gold prices. Realized gold prices1 for 2016 were up $91 per ounce compared to the prior year reflecting the higher market gold prices in 2016, which were up 8% compared to 2015.
In 2016, gold production was 600 thousand ounces or 10% lower than the prior year primarily as a result of the divestment ofnon-core assets. Excluding the impact of these divested sites, production increased by 2% or 114 thousand ounces due to higher grade and throughput at Pueblo Viejo, Cortez, Turquoise Ridge, Goldstrike and Acacia, partially offset by lower production at Lagunas Norte and Veladero.
Copper revenues for 2016 were down 53% compared to the prior year primarily due to the divestment of 50% of our ownership in Zaldívar which was completed on December 1, 2015, combined with a lower realized copper
price1. In 2016, the realized copper price1 was down $0.08 per pound compared to 2015, due to the 11% decline in market copper prices over the prior year and the negative provisional pricing adjustments recognized in 2016.
Copper production for 2016 decreased by 96 million pounds or 19% compared to the prior year due to lower production contribution from Zaldívar following the divestment of 50% of our ownership. Excluding the impact of the divestiture, copper production increased by 7 million pounds primarily related to the achievement of commercial production at Jabal Sayid in July 2016, partially offset by lower production at Lumwana due to lower tonnes mined due to equipment availability and lower grades.
| | | | | | | | | | | | |
Production Costs | |
($ millions, except per ounce/pound data | |
in dollars) | | | For the years ended December 31 | |
| | | 2016 | | | 2015 | | | 2014 | |
Direct mining costs | | | $ 3,215 | | | | $ 4,006 | | | | $ 4,155 | |
Depreciation | | | 1,503 | | | | 1,613 | | | | 1,414 | |
Royalty expense | | | 224 | | | | 235 | | | | 263 | |
Community relations | | | 37 | | | | 50 | | | | 61 | |
Cost of sales - gold | | | $ 4,979 | | | | $ 5,904 | | | | $ 5,893 | |
Cost of sales - gold (per oz)1 | | | 798 | | | | 859 | | | | 842 | |
Cash costs2,3 | | | 546 | | | | 596 | | | | 598 | |
All-in sustaining costs - gold2,3 | | | 730 | | | | 831 | | | | 864 | |
Cost of sales - copper | | | $ 319 | | | | $ 814 | | | | $ 954 | |
Cost of sales - copper (per lb)1 | | | 1.43 | | | | 1.65 | | | | 2.19 | |
C1 cash costs2,3 | | | 1.49 | | | | 1.73 | | | | 1.92 | |
All-in sustaining costs - copper2,3 | | | $2.05 | | | | $2.33 | | | | $ 2.79 | |
| 1 | Cost of sales related to gold per ounce is calculated using cost of sales related to gold on an attributable basis (removing thenon-controlling interest of 40% Pueblo Viejo and 36.1% Acacia from cost of sales), divided by attributable gold ounces. Cost of sales related to copper per pound is calculated using cost of sales related to copper including our proportionate share of cost of sales attributable to equity method investments (Zaldívar and Jabal Sayid), divided by consolidated copper pounds (including our proportionate share of copper pounds from our equity method investments). |
| 2 | Per ounce/pound weighted average. |
| 3 | Cash costs,all-in sustaining costs and C1 cash costs arenon-GAAP financial performance measures with no standardized meaning under IFRS and therefore may not be comparable to similar measures of performance presented by other issuers. For further information and a detailed reconciliation of eachnon-GAAP measure used in this section of the MD&A to the most directly comparable IFRS measure, please see pages 71 to 85 of this MD&A. |
In 2016, cost of sales applicable to gold was 16% lower than the prior year primarily due to lower ounces sold, as discussed above. On a per ounce basis, cost of sales applicable to gold4 after removing the portion related tonon-controlling interests, was 7% lower than the prior
| | | | |
| BARRICK YEAR-END 2016 | | 43 | | MANAGEMENT’S DISCUSSION AND ANALYSIS |
year primarily due to a decrease in direct mining costs combined with a positive change in our sales mix as a result of the divestment of some of our higher cost mine sites. Direct mining costs have decreased as a result of lower fuel and energy prices, despite a significant proportion of our oil exposure being hedged, as well as the impact ofBest-in-Class initiatives, including lower labor and consumable costs and improved operating efficiencies. Lower cost of sales was also attributable to lower inventory impairment charges combined with lower depreciation expense as a result of divested sites, lower depreciation at Pueblo Viejo as a result of the impairment recorded in the fourth quarter of 2015 and a life of mine extension at Lagunas Norte; partially offset by higher depreciation expense at Cortez due to increased sales volume attributed to the Cortez Hills open pit and Arturo as it entered commercial production on August 1, 2016.
In 2016, goldall-in sustaining costs1 were down $101 per ounce or 12% compared to the prior year primarily due to a reduction in minesite sustaining capital expenditures, as a result of lower capitalized stripping costs and our continued capital discipline, combined with lower direct mining costs as described above. In addition, 2016all-in sustaining costs were favorably impacted by a higher proportion of our sales coming from lower cost operations such as Pueblo Viejo and Cortez.
In 2016, cost of sales applicable to copper was 61% lower than the prior year following the divestment of 50% of our ownership in the Zaldívar mine. Our remaining 50% interest in Zaldívar is equity accounted for and therefore we do not include Zaldívar’s cost of sales in our consolidated copper cost of sales. On a per pound basis, cost of sales applicable to copper4, after including our proportionate share of cost of sales at our equity method investees, decreased 13% compared to the prior year primarily due to lower direct mining costs as part of initiatives to reduce costs and increase efficiencies combined with lower royalty expense at Lumwana resulting from a decreased royalty rate (as noted below) combined with lower depreciation expense. These were partially offset by the cost of sales associated with Jabal Sayid; our 50% owned copper mine in Saudi Arabia, which entered commercial production on July 1, 2016 combined with lower sales volumes at Lumwana and Zaldívar.
In June 2016, the Zambian government passed legislation to amend the royalty tax for mining operations to a variable rate based on the prevailing copper price effective June 1, 2016. These rates are 4% at copper prices below $2.04 per pound; 5% at copper prices
between $2.04 per pound and $2.72 per pound; and 6% at copper prices of $2.72 per pound and above. Legislation was also passed to remove the 15% variable profit tax on income from mining companies.
Copperall-in sustaining costs1, which have been adjusted to include our proportionate share of equity method investments, were 12% lower than the prior year primarily reflecting lower direct mining costs as a result of improved cost controls at Lumwana and lower fuel and acid costs at Zaldívar, combined with lower royalty expense at Lumwana. These were partly offset by lower sales volumes.
| | | | | | | | | | | | |
Capital Expenditures1 | | | | | | | | | | | | |
($ millions) | | For the years ended December 31 | |
| | | 2016 | | | 2015 | | | 2014 | |
Minesite sustaining2 | | | $ 944 | | | | $ 1,359 | | | | $ 1,638 | |
Project capital expenditures3,4 | | | 175 | | | | 133 | | | | 596 | |
Capitalized interest | | | - | | | | 17 | | | | 30 | |
Total consolidated capital expenditures | | | $ 1,119 | | | | $ 1,509 | | | | $ 2,264 | |
Attributable consolidated capital expenditures5 | | | $ 1,122 | | | | $ 1,477 | | | | $ 2,204 | |
| | 1 | These amounts are presented on a 100% accrued basis, except for attributable consolidated capital expenditures. |
| | 2 | Includes both minesite sustaining and mine development. |
| | 3 | Project capital expenditures are included in our calculation ofall-in costs, but not included in our calculation ofall-in sustaining costs. |
| | 4 | Includes both minesite expansion and projects. |
| | 5 | These amounts are presented on the same basis as our guidance. For 2016, these amounts include our 60% share of Pueblo Viejo and Arturo and our 50% share of Zaldívar and Jabal Sayid. For 2015, these amounts include our 60% share of Pueblo Viejo and Arturo and our 50% share of Jabal Sayid. |
In 2016, total consolidated capital expenditures decreased 26% compared to the prior year or 10% excluding the impact of divested sites. The decrease is primarily due to a decrease in minesite sustaining capital expenditures combined with lower capitalized interest, partially offset by increased project capital expenditures. The 31% decrease in minesite sustaining capital expenditures is primarily due to the impact of divested sites. Excluding this impact, minesite sustaining capital expenditures decreased 14% primarily due to lower capitalized stripping costs, primarily at Veladero, and our continued focus on capital discipline across the Company and in particular at Veladero and at Lagunas Norte. Capitalized interest decreased by $17 million compared to the prior year as a result of the completion of the thiosulfate circuit at Goldstrike, which entered commercial production in the third quarter of 2015. Project capital expenditures increased by $42 million as a result of $81 million in reversals of accruals for contract claims and other
| | | | |
| BARRICK YEAR-END 2016 | | 44 | | MANAGEMENT’S DISCUSSION AND ANALYSIS |
project costs at Pascua-Lama in the prior year, partially offset by a $33 million decrease in project expenditures on the thiosulfate circuit at Goldstrike. Significant project capital expenditures in 2016 were Arturo, progressing with feasibility studies at Cortez Lower Zone and Lagunas Norte Refractory Ore Project.
General and Administrative Expenses
| | | | | | | | | | | | |
| ($ millions) | | For the years ended December 31 | |
| | | 2016 | | | 2015 | | | 2014 | |
Corporate administration1 | | | $ 163 | | | | $ 176 | | | | $ 332 | |
Stock-based compensation2 | | | 38 | | | | 15 | | | | 9 | |
Acacia | | | 55 | | | | 42 | | | | 44 | |
General & administrative expenses | | | $ 256 | | | | $ 233 | | | | $ 385 | |
| | 1 | For the year ended December 31, 2016, corporate administration costs include approximately $9 million of severance costs (2015: $29 million). Starting in 2015, operating segment administration costs have been allocated to our operating sites and are now included in cost of sales. In 2014, this amount was $120 million. |
| | 2 | Based on US$15.98 share price as at December 31, 2016 (2015: US$7.38; 2014: US$10.75) and excludes Acacia. |
General and administrative expenses were $23 million higher than the prior year, primarily related to higher stock-based compensation expense combined with higher expenses at Acacia (also primarily relating to their stock-based compensation), partially offset by a reduction in overhead costs and severance costs as a result of actions taken to restructure our business in the prior year. Higher stock-based compensation expense resulted from the 117%year-to-date increase in Barrick’s NYSE share price and the 108%year-to-date increase in Acacia’s LSE share price as at December 31, 2016.
We exceeded our targeted reduction of $90 million in annualized minesite and corporate overhead costs (excluding severance, stock-based compensation and Acacia corporate administration), which is recorded within general and administrative expense and cost of sales.
Exploration, Evaluation and Project Costs
| | | | | | | | | | | | |
| ($ millions) | | For the years ended December 31 | |
| | | 2016 | | | 2015 | | | 2014 | |
Minesite exploration and evaluation | | | $ 44 | | | | $ 47 | | | | $ 38 | |
Global exploration and evaluation | | | 88 | | | | 116 | | | | 146 | |
Advanced project costs: | | | | | | | | | | | | |
Pascua-Lama | | | 59 | | | | 119 | | | | 113 | |
Cerro Casale | | | 6 | | | | 8 | | | | 14 | |
Jabal Sayid | | | - | | | | - | | | | 30 | |
Other | | | 11 | | | | 4 | | | | 16 | |
Corporate development | | | 14 | | | | 42 | | | | 35 | |
Business improvement | | | 15 | | | | 19 | | | | - | |
Global exploration and evaluation and project expense | | | $ 193 | | | | $ 308 | | | | $ 354 | |
Total exploration, evaluation and project expenses | | | $ 237 | | | | $ 355 | | | | $ 392 | |
Exploration, evaluation and project costs for 2016 decreased $118 million compared to the prior year. The decrease is primarily due to a reduction in project costs at Pascua-Lama ($60 million) combined with a decrease in corporate development costs ($28 million). In addition, the decrease in global exploration costs primarily related to Goldrush as the project has progressed to the study phase, and is now being capitalized.
Finance Costs, Net
| | | | | | | | | | | | |
| ($ millions) | | For the years ended December 31 | |
| | | 2016 | | | 2015 | | | 2014 | |
Interest expense1 | | | $ 591 | | | | $ 737 | | | | $ 733 | |
Accretion | | | 50 | | | | 63 | | | | 75 | |
Loss (gain) on debt extinguishment | | | 129 | | | | (68) | | | | - | |
Other finance costs | | | 18 | | | | 7 | | | | (12) | |
Finance income | | | (13) | | | | (13) | | | | (11) | |
Finance costs, net | | | $ 775 | | | | $ 726 | | | | $ 785 | |
| | 1 | For the year ended December 31, 2016, interest expense includes approximately $100 million ofnon-cash interest expense relating to the gold and silver streaming agreements with Silver Wheaton Corp. and Royal Gold, Inc. (2015: $61 million). |
In 2016, net finance costs were $49 million higher than the prior year primarily due to the recognition of $129 million of extinguishment costs arising from the debt repurchases made through the year compared to the recognition of a $68 million net gain in the prior year. This was combined with an increase of $39 million ofnon-cash interest expense on our gold and silver streaming agreements. These increases more than offset a $185 million reduction in interest expense as a result of debt reductions made over the
| | | | |
| BARRICK YEAR-END 2016 | | 45 | | MANAGEMENT’S DISCUSSION AND ANALYSIS |
past two years. These debt reductions will reduce interest payments by approximately $235 million on an annualized basis.
Additional Significant Statement of Income Items
| | | | | | | | | | | | |
| ($ millions) | | For the years ended December 31 | |
| | | 2016 | | | 2015 | | | 2014 | |
Impairment charges (reversals) | | | ($ 250) | | | | $ 3,897 | | | | $ 4,106 | |
Loss (income) on currency translation | | | $199 | | | | $120 | | | | $ 132 | |
Other expense/(income) | | | $60 | | | | ($ 113) | | | | ($ 14) | |
| |
| Impairment Charges (Reversals) | |
| | |
| ($ millions) | | For the years ended December 31 | |
| | | 2016 | | | 2015 | | | 2014 | |
| | | Post-tax (our share) | | | Post-tax (our share) | | | Post-tax (our share) | |
Asset impairments (reversals) | | | | | | | | | | | | |
Veladero | | | $ (179) | | | | $ - | | | | $ - | |
Equity method investments | | | 49 | | | | - | | | | - | |
Lagunas Norte | | | (20) | | | | 26 | | | | - | |
Pascua-Lama | | | 1 | | | | 399 | | | | 382 | |
Pueblo Viejo | | | - | | | | 386 | | | | - | |
Buzwagi | | | - | | | | 30 | | | | - | |
Round Mountain/Bald Mountain | | | - | | | | 53 | | | | - | |
Lumwana | | | - | | | | - | | | | 720 | |
Cerro Casale | | | - | | | | - | | | | 778 | |
Jabal Sayid | | | - | | | | - | | | | 198 | |
Porgera | | | - | | | | - | | | | (160) | |
Cortez | | | - | | | | - | | | | 29 | |
Kalgoorlie | | | - | | | | - | | | | 9 | |
Exploration sites | | | - | | | | - | | | | 7 | |
AFS investments | | | - | | | | - | | | | 18 | |
Other | | | 3 | | | | 53 | | | | 4 | |
| Total asset impairment charges (reversals) | | | $ (146) | | | | $ 947 | | | | $ 1,985 | |
Goodwill | | | | | | | | | | | | |
Goldstrike | | | $ - | | | | $ 730 | | | | $ - | |
Zaldívar | | | - | | | | 427 | | | | 712 | |
Pueblo Viejo | | | - | | | | 412 | | | | - | |
Cortez | | | - | | | | 355 | | | | - | |
Lagunas Norte | | | - | | | | 247 | | | | - | |
Jabal Sayid | | | - | | | | - | | | | 316 | |
Lumwana | | | - | | | | - | | | | 214 | |
Bald Mountain | | | - | | | | - | | | | 131 | |
Round Mountain | | | - | | | | - | | | | 36 | |
Total goodwill impairment charges | | | $ - | | | | $ 2,171 | | | | $ 1,409 | |
Tax effects and NCI | | | (104) | | | | 779 | | | | 712 | |
| Total impairment charges (reversals) (100%) | | | $ (250) | | | | $ 3,897 | | | | $ 4,106 | |
In 2016, primarily as a result of improvements in the cost structure at Veladero and Lagunas Norte, we recognized $146 million (net of tax andnon-controlling interests) of net impairment reversals fornon-current assets. This compares to goodwill andnon-current asset impairment losses of $2.2 billion and $947 million (net of tax andnon-controlling interests), respectively, in the prior year. Refer to note 21 to the Financial Statements for a full description of impairment charges, includingpre-tax amounts and sensitivity analysis.
Loss (Income) on Currency Translation
Loss on currency translation for 2016 increased $79 million compared to the prior year. The increased loss is primarily due to the release of $91 million of currency translation losses as a result of the disposal and reorganization of certain Australian entities during the first quarter of 2016. This was combined with increased unrealized foreign currency translation losses relating to the Zambian kwacha, partly offset by lower unrealized foreign currency translation losses relating to the Argentinean peso, Australian dollar and Tanzanian shilling.
Other Expense (Income)
Other expense was $60 million in 2016 compared to income of $113 million in the prior year. The expense in the current year was primarily due to a $39 million additional loss on disposition relating to Zaldívar as a result of the final purchase price adjustments recorded in the third quarter of 2016. The income in the prior year was primarily a result of the realization of gains on the sale of our Cowal mine and 50% of our interest in the Porgera mine, which closed in the third quarter of 2015; and partly offset by $30 million in office closure costs primarily relating to the exiting of leases at our Toronto and Salt Lake City offices. For a further breakdown of other expense (income), refer to note 9 to the Financial Statements.
Income Tax Expense
Income tax expense was $917 million in 2016. The underlying effective tax rate for ordinary income in 2016 was 44% after adjusting for the net impact of currency translation losses on deferred tax balances; the impact of the increase in income tax related contingent liabilities in Tanzania; the impact of tax rate changes; the impact of impairment (reversals) charges; the impact of asset sales andnon-hedge derivatives; and the impact ofnon-deductible foreign exchange losses. The unadjusted tax rate for income
| | | | |
| BARRICK YEAR-END 2016 | | 46 | | MANAGEMENT’S DISCUSSION AND ANALYSIS |
in 2016 was 52% of the income before income taxes.
We record deferred tax charges or credits if changes in facts or circumstances affect the estimated tax basis of assets and therefore the amount of deferred tax assets or liabilities to reflect changing expectations in our ability to realize deferred tax assets. The interpretation of tax regulations and legislation and their application to our business is complex and subject to change. We have significant amounts of deferred tax assets, including tax loss carry forwards, and also deferred tax liabilities. Potential changes of any of these amounts, as well as our ability to realize deferred tax assets, could significantly affect net income or cash flow in future periods.
| | | | | | | | |
| Reconciliation to Canadian Statutory Rate | |
For the years ended December 31 | | | 2016 | | | | 2015 | |
At 26.5% statutory rate | | $ | 471 | | | $ | (833) | |
Increase (decrease) due to: | | | | | | | | |
Allowances and special tax deductions1 | | | (134) | | | | (103) | |
Impact of foreign tax rates2 | | | 113 | | | | (110) | |
Expenses not tax deductible | | | 54 | | | | 55 | |
Goodwill impairment charges not tax deductible | | | - | | | | 736 | |
Impairment charges not recognized in deferred tax assets | | | - | | | | 246 | |
Net currency translation losses on deferred tax balances | | | 23 | | | | 62 | |
Tax impact of profits from equity accounted investments | | | (5) | | | | - | |
Current year tax losses not recognized in deferred tax assets | | | 35 | | | | 56 | |
Internal restructures | | | - | | | | (116) | |
De-recognition of a deferred tax asset | | | - | | | | 20 | |
Non-recognition of US AMT credits | | | 13 | | | | 19 | |
Adjustments in respect of prior years | | | (4) | | | | 44 | |
Increase to income tax related contingent liabilities | | | 70 | | | | 13 | |
Impact of tax rate changes | | | (13) | | | | - | |
Other withholding taxes | | | 11 | | | | 12 | |
Mining taxes | | | 267 | | | | (125) | |
Other items | | | 16 | | | | (7) | |
Income tax expense (recovery) | | $ | 917 | | | $ | (31) | |
| | 1 | We are able to claim certain allowances and tax deductions unique to extractive industries that result in a lower effective tax rate. |
| | 2 | We operate in multiple foreign tax jurisdictions that have tax rates different than the Canadian statutory rate. |
The more significant items impacting income tax expense in 2016 and 2015 include the following:
Currency Translation
Deferred tax balances are subject to remeasurement for changes in currency exchange rates each period. The
most significant balances are Argentinean deferred tax liabilities. In 2016 and 2015, tax expense of $23 million and $62 million, respectively, primarily arose from translation losses due to the weakening of the Argentinean peso against the US dollar. These losses are included within deferred tax expense/recovery.
Non-Recognition of US Alternative Minimum Tax (AMT) Credits
In the fourth quarter of 2016 and 2015, we recorded a deferred tax expense of $13 million and $19 million, respectively, related to US AMT credits which are not probable to be realized based on our current life of mine plans.
Increase in Income Tax Related Contingent Liabilities in Tanzania
In the first quarter of 2016, Acacia received a judgement from the Tanzania Court of Appeal regarding a long-standing dispute over tax calculations at Bulyanhulu from 2000-2006. The Court of Appeal was reviewing seven issues initially raised by the Tanzania Revenue Authority (TRA) in 2012 regarding certain historic tax loss carry forwards and ruled in favor of Bulyanhulu by the Tax Appeals Board in 2013. The TRA appealed against this ruling and in 2014 the Tax Tribunal reversed the decision for all seven issues. The legal route in Tanzania has now been exhausted; however Acacia is considering its options for the next steps. Acacia is yet to receive a revised tax assessment following the judgement, but has raised further tax provisions of US$70 million in Q1 2016 in order to address the direct impact of the ruling on Bulyanhulu’s tax loss carry forwards and the potential impact this may have on the applicability of certain capital deductions for other years and our other mines in Tanzania.
Tax Rate Changes
In the fourth quarter of 2016, a tax rate change was enacted in Peru, increasing corporate income tax rates. This resulted in a deferred tax recovery of $13 million due to recording the deferred tax asset in Peru at the higher rates.
Internal Restructures
In the fourth quarter of 2015, a deferred tax recovery of $116 million arose from a loss that was realized on internal restructuring of subsidiary corporations. This resulted in a net increase in deferred tax assets.
De-recognition of a Deferred Tax Asset
In the second quarter of 2015, we recorded a deferred tax expense of $20 million related tode-recognition of a deferred tax asset in Pueblo Viejo.
| | | | |
| BARRICK YEAR-END 2016 | | 47 | | MANAGEMENT’S DISCUSSION AND ANALYSIS |
| | | | | | | | | | | | |
FINANCIAL CONDITION REVIEW | | | | | | | | | | | | |
| | |
Summary Balance Sheet and Key Financial Ratios | | | | | | | | | |
($ millions, except ratios and share amounts) | | | As at December 31, 2016 | | | | As at December 31, 2015 | | | | As at December 31, 2014 | |
Total cash and equivalents | | | $ 2,389 | | | | $ 2,455 | | | | $ 2,699 | |
Current assets | | | 2,485 | | | | 3,013 | | | | 3,451 | |
Non-current assets | | | 20,390 | | | | 20,840 | | | | 27,729 | |
Total Assets | | | $ 25,264 | | | | $ 26,308 | | | | $ 33,879 | |
Current liabilities excluding short-term debt | | | $ 1,676 | | | | $ 1,644 | | | | $ 2,154 | |
Non-current liabilities excluding long-term debt1 | | | 5,344 | | | | 5,241 | | | | 5,782 | |
Debt (current and long-term) | | | 7,931 | | | | 9,968 | | | | 13,081 | |
Total Liabilities | | | $ 14,951 | | | | $ 16,853 | | | | $ 21,017 | |
Total shareholders’ equity | | | 7,935 | | | | 7,178 | | | | 10,247 | |
Non-controlling interests | | | 2,378 | | | | 2,277 | | | | 2,615 | |
Total Equity | | | $ 10,313 | | | | $ 9,455 | | | | $ 12,862 | |
Total common shares outstanding (millions of shares)2 | | | 1,166 | | | | 1,165 | | | | 1,165 | |
| | | |
Key Financial Ratios: | | | | | | | | | | | | |
Current ratio3 | | | 2.68:1 | | | | 2.77:1 | | | | 2.47:1 | |
Debt-to-equity4 | | | 0.77:1 | | | | 1.05:1 | | | | 1.02:1 | |
| | 1 | Non-current financial liabilities as at December 31, 2016 were $8,002 million (2015: $10,068 million; 2014: $13,108 million). |
| | 2 | Total common shares outstanding do not include 2.1 million stock options. |
| | 3 | Represents current assets (excluding assetsheld-for-sale) divided by current liabilities (including short-term debt and excluding liabilitiesheld-for-sale) as at December 31, 2016 and December 31, 2015. |
| | 4 | Represents debt divided by total shareholders’ equity (including minority interest) as at December 31, 2016 and December 31, 2015. |
Balance Sheet Review
Total assets were $25.3 billion at December 31, 2016, approximately $1.0 billion lower than at December 31, 2015, primarily reflecting the sale of Bald Mountain and our 50% interest in Round Mountain, which were presented as held-for-sale and included in current assets at December 31, 2015 and of which the cash proceeds were used to reduce our debt balance. Our asset base is primarily comprised ofnon-current assets such as property, plant and equipment and goodwill, reflecting the capital-intensive nature of the mining business and our history of growing through acquisitions. Other significant assets include production inventories, indirect taxes recoverable and receivable, concentrate sales receivable and other government transaction and joint venture related receivables, and cash and equivalents. Total liabilities at December 31, 2016 totaled $15.0 billion; approximately $1.9 billion lower than at December 31, 2015, reflecting $2.0 billion of debt repayments made during the year.
| | | | |
Shareholders’ Equity | | | | |
| |
As at February 7, 2017 | | | Number of shares | |
Common shares | | | 1,165,574,071 | |
Stock options | | | 2,074,210 | |
Financial Position and Liquidity
Total cash and cash equivalents as at December 31, 2016 was $2.4 billion3. Our capital structure comprises a mix of debt and shareholders’ equity. As at December 31, 2016, our total debt was $7.9 billion (debt net of cash and equivalents was $5.5 billion) and ourdebt-to-equity ratio was 0.77:1. This compares to debt as at December 31, 2015 of $10.0 billion (debt net of cash and equivalents was $7.5 billion), and adebt-to-equity ratio of 1.05:1.
At the beginning of 2016, we set a debt reduction target of $2 billion. We have exceeded this target by reducing debt by $2.04 billion in 2016. We currently have less than $200 million2 in debt due before 2019, and approximately $5 billion of our outstanding debt matures after 2032.
In 2017, we have capital commitments of $52 million and expect to incur attributable sustaining and project capital expenditures of approximately $1,300 to $1,500 million in 2017 based on our guidance range on page 33. In 2017,
| | | | |
| BARRICK YEAR-END 2016 | | 48 | | MANAGEMENT’S DISCUSSION AND ANALYSIS |
we have contractual obligations and commitments of $402 million in purchase obligations for supplies and consumables and $51 million in derivative liabilities which will form part of operating costs. In addition, we have $434 million in interest payments and other amounts as detailed in the table on page 68. We expect to fund these commitments through operating cash flow, which is our primary source of liquidity, as well as existing cash balances.
Our operating cash flow is dependent on the ability of our operations to deliver projected future cash flows. The market prices of gold, and to a lesser extent copper, are the primary drivers of our operating cash flow. Other options to enhance liquidity include furthernon-core asset sales or joint venture opportunities; issuance of debt or equity securities in the public markets or to private investors, which could be undertaken for liquidity enhancement and/or in connection with establishing a strategic partnership; and drawing the $4.0 billion available under our fully undrawn credit facility (subject to compliance with covenants and the making of certain representations and warranties, this facility is available for drawdown as a source of financing).
Many factors, including but not limited to general market conditions and then prevailing metals prices, could impact our ability to issue securities on acceptable terms, as could our credit ratings. Moody’s and S&P currently rate our long-term debt as investment grade, with ratings of Baa3 andBBB-, respectively. In August 2016, Moody’s affirmed the Company’s Baa3 rating and revised its outlook to stable from negative. Also in August 2016, S&P affirmed the Company’sBBB- rating and raised its outlook to positive from stable. Further changes in our ratings could affect the trading prices of our securities and our cost of capital. If we were to borrow under our credit facility, the applicable interest rate on the amounts borrowed would be based, in part, on our credit ratings at the time. The key financial covenant in our fully undrawn credit facility requires Barrick to maintain a net debt to total capitalization ratio of less than 0.60:1. Barrick’s net debt to total capitalization ratio was 0.35:1 as at December 31, 2016 (0.44:1 as at December 31, 2015).
| | | | |
Summary of Cash Inflow (Outflow) | | |
($ millions) | | For the years ended December 31 |
| | | 2016 | | 2015 |
Net cash provided by operating activities | | $ 2,640 | | $ 2,794 |
Investing activities | | | | |
Capital expenditures1 | | $ (1,126) | | $ (1,713) |
Divestitures | | 588 | | 1,904 |
Other | | 126 | | 59 |
Total investing inflows/(outflows) | | $ (412) | | $ 250 |
Financing activities | | | | |
Net change in debt | | $ (2,057) | | $ (3,133) |
Dividends2 | | (86) | | (160) |
Other | | (154) | | 18 |
Total financing inflows/(outflows) | | $ (2,297) | | $ (3,275) |
Effect of exchange rate | | 3 | | (13) |
Increase/(decrease) in cash and equivalents | | $ (66) | | $ (244) |
| 1 | The amounts include capitalized interest of $nil for the year ended December 31, 2016 (2015: $17 million). |
| 2 | In 2016, we declared and paid dividends in US dollars totaling $0.08 per share (2015: $0.14 per share; 2014: $0.20 per share). |
In 2016, we generated $2,640 million in operating cash flow, compared to $2,794 million of operating cash flow in the prior year. 2015 operating cash flow included a $610 million deposit relating to the gold and silver streaming arrangement with Royal Gold. Excluding this transaction, operating cash flow for 2016 was $456 million higher than the prior year despite the reduction in operating cash flow associated with the divestment of somenon-core assets. We benefited from higher market gold prices and lower operating costs, as a result of lower energy and fuel costs (despite being hedged on a significant portion of our fuel consumption) combined with the continued realization of lower labor and consumable costs and improved operating efficiencies resulting from ourBest-in-Class initiatives and also lower cash interest paid. These were largely offset by lower gold and copper volumes sold, primarily as a result of the aforementioned divestitures, combined with the impact of unfavorable working capital movements, mainly as a result of higher inventory balances and income taxes paid compared to the prior year. The ability of our operations to deliver projected future cash flows within the parameters of a reduced production profile, as well as future changes in gold and copper market prices, either favorable or unfavorable, will continue to have a material impact on our cash flow and liquidity.
Cash outflows from investing activities in 2016 amounted to $412 million compared to $250 million of cash inflows
| | | | |
| BARRICK YEAR-END 2016 | | 49 | | MANAGEMENT’S DISCUSSION AND ANALYSIS |
in the prior year. The decrease of $662 million compared to 2015 is primarily due to $1,316 million of additional proceeds from the divestitures in the prior year. In 2016, we received proceeds from the sale of Bald Mountain and our 50% interest in Round Mountain. In 2015, we received proceeds from the divestitures of Cowal, Spring Valley, Ruby Hill and partial divestitures of Zaldívar and Porgera. This was partially offset by a decrease in capital expenditures as 2016 capital expenditures on a cash basis were $1,126 million compared to $1,713 million in 2015. The decrease of $587 million is primarily due to the impact of divested sites combined with lower capitalized stripping costs at Veladero and a decrease in leach pad expansion costs at Veladero and Lagunas Norte. This was combined with a decrease in project costs mainly relating to the completion of the thiosulfate circuit at Goldstrike in the prior year and decreased spending at Pascua-Lama.
Net financing cash outflows for 2016 amounted to $2,297 million, compared to $3,275 million of cash outflows in the prior year. The net financing cash outflows in 2016 and 2015 primarily consist of net debt repayments of $2,057 million and $3,133 million, respectively, as we achieved our debt reduction goals. This was combined with debt extinguishment costs of $129 million (2015: $68 million gains) and $86 million (2015: $160 million) of dividend payments.
| | | | |
| BARRICK YEAR-END 2016 | | 50 | | MANAGEMENT’S DISCUSSION AND ANALYSIS |
| | | | | | | | | | | | |
Summary of Financial Instruments | | | | | | | | | | | | |
As at December 31, 2016 | | | | | | | | | | | | |
Financial Instrument | | Principal/Notional Amount | | | | | Associated Risks1 |
| | | | | | | | | | | | ● Interest rate |
Cash and equivalents | | | | | | $ 2,389 | | | million | | | ● Credit |
| | | | | | | | | | | | | ● Credit |
Accounts receivable | | | | | | $249 | | | million | | | ● Market |
| | | | | | | | | | | | | ● Market |
Other investments | | | | | | $18 | | | million | | | ● Liquidity |
Accounts payable | | | | | | $ 1,084 | | | million | | | ● Liquidity |
Debt | | | | | | $ 7,989 | | | million | | | ● Interest rate |
Restricted share units | | | | | | $ 62 | | | million | | | ● Market |
Deferred share units | | | | | | $ 9 | | | million | | | ● Market |
Derivative instruments - currency contracts | | | AUD | | | 23 | | | million | | | ● Market/liquidity |
| | | PGK | | | 21 | | | million | | | |
Derivative instruments - gold contracts | | | | | | 43 | | | million oz | | | ● Market/liquidity |
Derivative instruments - copper contracts | | | | | | 78 | | | million lbs | | | ● Credit |
| | | | | | | | | | | | ● Interest rate |
Derivative instruments - energy contracts | | | Diesel | | | 3 | | | million bbls | | | ● Market/liquidity |
| | | | | | | | | | | | ● Credit |
| | | | | | | | | | | | ● Interest rate |
Derivative instruments - interest rate contracts | | | Receive float interest rate swaps | | | $ 99 | | | million | | | ● Market/liquidity |
| 1 | Refer to note 28 to the Financial Statements for more information regarding risks associated with financial instruments. |
OPERATING SEGMENTS PERFORMANCE
Review of Operating Segments Performance
Barrick’s business is organized into thirteen individual mine sites, one publicly traded company and one project. Barrick’s Chief Operating Decision Maker (“CODM”), the President, reviews the operating results, assesses performance and makes capital allocation decisions at the minesite, Company and/or project level. Therefore, each individual minesite, Acacia and the Pascua-Lama project are operating segments for financial reporting purposes. Following the divestitures that were completed in 2015 and early 2016, were-evaluated our reportable operating segments and no longer report on our interests in the followingnon-core properties: Porgera, Kalgoorlie, Zaldívar and Lumwana. Our updated presentation of our reportable operating segments will now be limited to six individual gold mines, Acacia and our Pascua-Lama project. The remaining operating segments, including thenon-core properties referred to
above and our remaining gold and copper mines, have been grouped into an “other” category and will not be reported on individually. The prior periods have been restated to reflect the change in presentation. Segment performance is evaluated based on a number of measures including operating income before tax, production levels and unit production costs. Certain costs are managed on a consolidated basis and are therefore not reflected in segment income.
| | | | |
| BARRICK YEAR-END 2016 | | 51 | | MANAGEMENT’S DISCUSSION AND ANALYSIS |
Cortez,Nevada USA
| | | | | | | | | | | | | | | | |
| Summary of Operating and Financial Data | | | | | | | For the years ended December 31 | |
| | | | 2016 | | | | 2015 | | | | % Change | | | | 2014 | |
Total tonnes mined (000s) | | | 124,919 | | | | 151,357 | | | | (17%) | | | | 152,146 | |
Ore tonnes processed (000s) | | | 25,112 | | | | 22,406 | | | | 12% | | | | 25,957 | |
Average grade (grams/tonne) | | | 1.73 | | | | 1.73 | | | | - | | | | 1.34 | |
Gold produced (000s/oz) | | | 1,059 | | | | 999 | | | | 6% | | | | 902 | |
Gold sold (000s/oz) | | | 1,059 | | | | 982 | | | | 8% | | | | 865 | |
Segment revenue ($ millions) | | | $ 1,314 | | | | $ 1,129 | | | | 16% | | | | $ 1,093 | |
Cost of sales ($ millions) | | | 955 | | | | 826 | | | | 16% | | | | 687 | |
Segment income ($ millions) | | | 340 | | | | 287 | | | | 18% | | | | 393 | |
Segment EBITDA ($ millions)1 | | | 839 | | | | 630 | | | | 33% | | | | 648 | |
Capital expenditures ($ millions)2 | | | 142 | | | | 148 | | | | (4%) | | | | 189 | |
Minesite sustaining | | | 75 | | | | 101 | | | | (26%) | | | | 170 | |
Project | | | 67 | | | | 47 | | | | 43% | | | | 19 | |
Cost of sales (per oz) | | | 901 | | | | 841 | | | | 7% | | | | 794 | |
Cash costs (per oz)1 | | | 430 | | | | 486 | | | | (12%) | | | | 498 | |
All-in sustaining costs (per oz)1 | | | 518 | | | | 603 | | | | (14%) | | | | 706 | |
All-in costs (per oz)1 | | | $ 581 | | | | $ 650 | | | | (11%) | | | | $ 728 | |
| 1 | These arenon-GAAP financial performance measures with no standardized meaning under IFRS and therefore may not be comparable to similar measures presented by other issuers. For further information and a detailed reconciliation of eachnon-GAAP measure used in this section of the MD&A to the most directly comparable IFRS measure, please see pages 71 to 85 of this MD&A. |
| 2 | Amounts presented exclude capitalized interest. |
Financial Results
Cortez’s segment income for 2016 was 18% higher than the prior year primarily due to a higher gold sales volume combined with a higher gold price, partly offset by higher depreciation due to an increase in ounces mined at the Cortez Hills pit, which have a higher depreciation charge per ounce than other areas at Cortez.
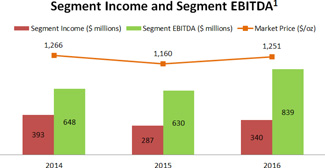
In 2016, gold production was 6% higher than the prior year primarily due to higher grades mined in the Cortez Hills open pit (“CHOP”) for both mill feed and leach placement. While less total open pit tonnes were mined in the current year, ore tonnes were higher due to a focus on mining higher grade ore from CHOP compared to more waste mining in the prior year. This was combined withBest-in-Class underground initiatives increasing mining time per shift and process improvements resulting in increased tonnes mined and throughput, respectively, and partly offset by lower
grades than the prior year in the underground as mining is advancing from the high grade Breccia zone to the lower grade Middle zone.
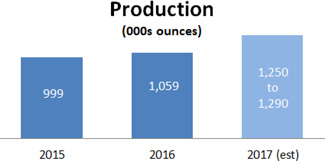
Cost of sales per ounce4 for 2016 was $60 per ounce higher than the prior year primarily due to the impact of higher depreciation from an increase in ounces mined at the CHOP combined with lower waste stripping activity associated with lower stripping at the Cortez Hills open pit in 2016 compared to 2015. The increases in cost of sales were partially offset by lower open pit consumable costs, including lower fuel prices in 2016, and lower inventory write-downs compared to the prior year. Further offsetting higher depreciation in 2016, royalty payments were lower compared to the prior year, as more ore was produced from the Cortez Hills open pit, which has lower associated royalties. For 2016, cost of sales per ounce4 was also positively impacted by higher
| | | | |
| BARRICK YEAR-END 2016 | | 52 | | MANAGEMENT’S DISCUSSION AND ANALYSIS |
sales volume.All-in sustaining costs1 decreased by $85 per ounce from the prior year primarily due to the impact of higher sales volume combined with lower sustaining capital spend and lower inventory write-downs.

In 2016, capital expenditures decreased by 4% from the prior year as lower minesite sustaining capital expenditures were almost offset by higher project expenditures. Lower sustaining capital is attributed to the completion of leach and tailings expansions in 2015, as well as continued efforts to reduce costs and optimize capital allocation in 2016. This was combined with higher capitalized stripping at the Cortez Hills pit in the prior year compared to the current year. Project capital expenditures in 2016 are higher as a result of increased expenditures for the underground development at Cortez
Hills Lower Zone and stripping at Crossroads during the fourth quarter of 2016.
Outlook
At Cortez we expect 2017 gold production to be in the range of 1,250 to 1,290 thousand ounces, an increase from 2016 production levels. This is due to a significant increase in open pit production, primarily from higher grade oxide ore and increased throughput at the mill processed on site and larger volumes of refractory ore, at grades similar to 2016, being processed at Goldstrike. This is somewhat offset by an expected decline in underground ore grade as the mine transitions to lower grade ore zones deeper in the deposit.
In 2017, we expect cost of sales per ounce4 to be in the range of $730 to $760 per ounce, which is a material decrease from 2016 due to increased sales volume. Cost of sales show only a slight increase from 2016 to 2017. We expect cash costs1 to be in the range of $360 to $380 per ounce, a decrease from 2016. Operating costs are in line with 2016, while productivity improvements generated by digitization andBest-in-Class initiatives are expected to start contributing to additional mining and processing volumes.All-in sustaining costs1 are expected to be in the range of $430 to $470 per ounce, again a decrease from 2016, primarily due to higher sold ounces mentioned above.
| | | | |
| BARRICK YEAR-END 2016 | | 53 | | MANAGEMENT’S DISCUSSION AND ANALYSIS |
Goldstrike,Nevada USA
| | | | | | | | | | | | | | | | |
| Summary of Operating and Financial Data | | | | | | | For the years ended December 31 | |
| | | | 2016 | | | | 2015 | | | | % Change | | | | 2014 | |
Total tonnes mined (000s)1 | | | 67,834 | | | | 72,304 | | | | (6%) | | | | 81,410 | |
Ore tonnes processed (000s) | | | 7,361 | | | | 6,752 | | | | 9% | | | | 5,307 | |
Average grade (grams/tonne) | | | 5.65 | | | | 6.01 | | | | (6%) | | | | 6.28 | |
Gold produced (000s/oz) | | | 1,096 | | | | 1,053 | | | | 4% | | | | 902 | |
Gold sold (000s/oz) | | | 1,103 | | | | 999 | | | | 10% | | | | 908 | |
Segment revenue ($ millions) | | | $ 1,389 | | | | $ 1,143 | | | | 22% | | | | $ 1,154 | |
Cost of sales ($ millions) | | | 940 | | | | 722 | | | | 30% | | | | 651 | |
Segment income ($ millions) | | | 442 | | | | 408 | | | | 8% | | | | 496 | |
Segment EBITDA ($ millions)2 | | | 749 | | | | 600 | | | | 25% | | | | 628 | |
Capital expenditures ($ millions)3 | | | 186 | | | | 191 | | | | (3%) | | | | 540 | |
Minesite sustaining | | | 142 | | | | 110 | | | | 29% | | | | 245 | |
Project | | | 44 | | | | 81 | | | | (46%) | | | | 295 | |
Cost of sales (per oz) | | | 852 | | | | 723 | | | | 18% | | | | 718 | |
Cash costs (per oz)2 | | | 572 | | | | 522 | | | | 10% | | | | 571 | |
All-in sustaining costs (per oz)2 | | | 714 | | | | 658 | | | | 9% | | | | 854 | |
All-in costs (per oz)2 | | | $ 754 | | | | $ 738 | | | | 2% | | | | $ 1,179 | |
| 1 | Includes tonnes mined relating to Arturo. |
| 2 | These arenon-GAAP financial performance measures with no standardized meaning under IFRS and therefore may not be comparable to similar measures presented by other issuers. For further information and a detailed reconciliation of eachnon-GAAP measure used in this section of the MD&A to the most directly comparable IFRS measure, please see pages 71 to 85 of this MD&A. |
| 3 | Includes our share of capital expenditures related to Arturo. |
Financial Results
Segment income for 2016 was 8% higher than the prior year primarily due to an increase in sales volume and higher gold prices, partially offset by increased processing and depreciation expense associated with full year operation of the autoclave combined with higher depreciation from the Arturo pit, which entered commercial production August 1, 2016 and has a high depreciation charge per ounce due to the short mine life.
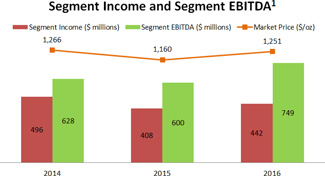
In 2016, gold production was 4% higher than the prior year primarily as a result of higher autoclave production, slightly offset by processing ore from the 60% owned Arturo pit in the second half of 2016, compared to full ownership production in the prior year. The increase in production at similar grades and recoveries was further helped by an increase in roaster throughput due to blend
optimization and Arturo’s ore chemistry, as well as further improvements at the autoclave facility.
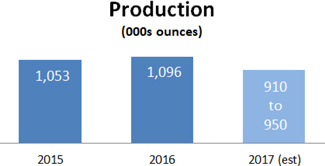
Cost of sales per ounce4 in 2016 was $129 per ounce higher than the prior year primarily due to higher operating costs and depreciation expense from the operation of the autoclave combined with higher depreciation from the Arturo pit, which has a high depreciation charge per ounce. The autoclave thiosulfate circuit was commissioned in the third quarter of 2015 and operates at a higher cost than the roaster. The higher operating costs are also due in part to increases in stock-based compensation as a result of movements in Barrick’s share price and consulting costs related to ourBest-in-Class program. These increases are partially offset by favorable fuel prices, energy prices, andBest-in-Class initiatives aimed at better utilizing open pit
| | | | |
| BARRICK YEAR-END 2016 | | 54 | | MANAGEMENT’S DISCUSSION AND ANALYSIS |
equipment, improving underground mining efficiency, and lowering contractor costs, which are reflected in lower direct mining costs. In 2016, this was partially offset by the impact of an increase in sales volume.All-in sustaining costs1 increased by $56 per ounce compared to the prior year primarily due to higher operating costs combined with higher sustaining capital, partly offset by an increase in sales volume.
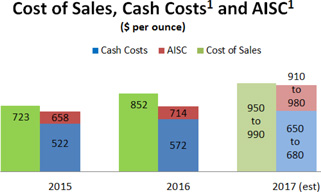
In 2016, capital expenditures decreased by 3%, compared to the prior year which was mainly due to lower project expenditures associated with the autoclave thiosulfate circuit, which entered commercial production in the third quarter of 2015. This was partly offset by higher minesite sustaining capital expenditures in 2016 due to major projects such as the roaster CIL tank expansion, dewatering well projects and stage 3 of the tailings storage facility compared to process equipment replacements and phase 2 construction of the tailings storage facility which were completed in the prior year.
Lower sustaining capital in the current year is also attributed to efforts to reduce costs and optimize capital allocation.
Outlook
At Goldstrike we expect 2017 production to be in the range of 910 to 950 thousand ounces, which is lower than 2016 production levels. Lower ounce production is expected from both the underground and open pit operations. At the underground, emphasis in 2017 will be on development deeper in the mine and ore mined will also be impacted by a slightly higher percentage of cut and fill tonnage. Contribution from open pit production is expected to be lower as we transition from ore mining at the Arturo pit to stripping the 3rd and 4th NW laybacks in the Betze Post pit.
For 2017, we expect cost of sales per ounce4 to be in the range of $950 to $990 per ounce for 2017, higher than 2016 due to sold ounces decreasing over 2016 primarily, offset slightly by lower operating spend driven byBest-in-Class initiatives. We expect cash costs1 to be in the range of $650 to $680 per ounce, higher than 2016 due to lower ounce production, primarily offset by slightly lower operating spend driven by operational excellence.All-in sustaining costs1 are expected to be $910 to $980 per ounce, an increase from 2016 due to lower ounce production and higher sustaining capital expenditures for tailings expansions, process improvements, and underground sustaining projects to enable mining deeper in the mine.
| | | | |
| BARRICK YEAR-END 2016 | | 55 | | MANAGEMENT’S DISCUSSION AND ANALYSIS |
Pueblo Viejo(60% basis)1,Dominican Republic
| | | | | | | | | | | | | | | | |
| Summary of Operating and Financial Data | | | | | | | For the years ended December 31 | |
| | | | 2016 | | | | 2015 | | | | % Change | | | | 2014 | |
Total tonnes mined (000s) | | | 23,278 | | | | 22,736 | | | | 2% | | | | 21,055 | |
Ore tonnes processed (000s) | | | 4,527 | | | | 4,150 | | | | 9% | | | | 4,027 | |
Average grade (grams/tonne) | | | 5.29 | | | | 4.94 | | | | 7% | | | | 5.53 | |
Gold produced (000s/oz) | | | 700 | | | | 572 | | | | 22% | | | | 665 | |
Gold sold (000s/oz) | | | 700 | | | | 597 | | | | 17% | | | | 667 | |
Segment revenue ($ millions) | | | $ 925 | | | | $ 757 | | | | 22% | | | | $ 940 | |
Cost of sales ($ millions) | | | 395 | | | | 525 | | | | (25%) | | | | 524 | |
Segment income ($ millions) | | | 528 | | | | 230 | | | | 130% | | | | 417 | |
Segment EBITDA ($ millions)2 | | | 621 | | | | 390 | | | | 59% | | | | 555 | |
Capital expenditures ($ millions) | | | 61 | | | | 61 | | | | - | | | | 80 | |
Minesite sustaining | | | 61 | | | | 61 | | | | - | | | | 80 | |
Project | | | - | | | | - | | | | - | | | | - | |
Cost of sales (per oz) | | | 564 | | | | 881 | | | | (36%) | | | | 786 | |
Cash costs (per oz)2 | | | 395 | | | | 467 | | | | (15%) | | | | 446 | |
All-in sustaining costs (per oz)2 | | | 490 | | | | 597 | | | | (18%) | | | | 588 | |
All-in costs (per oz)2 | | | $ 490 | | | | $ 597 | | | | (18%) | | | | $ 588 | |
| 1 | Pueblo Viejo is accounted for as a subsidiary with a 40%non-controlling interest. The results in the table and the discussion that follows are based on our 60% share only. |
| 2 | These arenon-GAAP financial performance measures with no standardized meaning under IFRS and therefore may not be comparable to similar measures presented by other issuers. For further information and a detailed reconciliation of eachnon-GAAP measure used in this section of the MD&A to the most directly comparable IFRS measure, please see pages 71 to 85 of this MD&A. |
Financial Results
Pueblo Viejo’s segment income for 2016 was 130% higher than the prior year primarily due to an increase in sales volumes combined with higher gold prices and lower cost of sales.
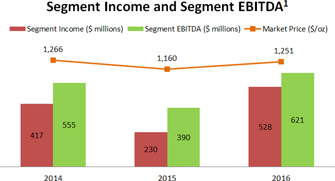
In 2016, gold production was 22% higher than the prior year primarily due to higher ore grades and recoveries compared to the prior year due to a lower amount of carbonaceous ore processed in 2016. This was combined with lower throughput in 2015, as a result of the mechanical failure at the oxygen plant in the fourth quarter of 2015.
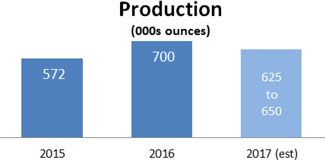
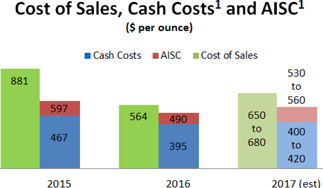
Cost of sales per ounce4 in 2016 was $317 per ounce lower than the prior year primarily due to lower depreciation as a result of the impairment recorded in the fourth quarter of 2015 and an increase in the life of mine, combined with insurance proceeds recorded in the third quarter of 2016 relating to the 2015 oxygen plant motor failure. Cost of sales per ounce4 was further impacted by lower maintenance costs due to the timing of maintenance activities and lower costs attributed to shutdowns as a result ofBest-in-Class initiatives
| | | | |
| BARRICK YEAR-END 2016 | | 56 | | MANAGEMENT’S DISCUSSION AND ANALYSIS |
combined with lower energy and fuel prices and the impact of higher sales volume on unit production costs. In 2016,all-in sustaining costs1 decreased by $107 per ounce compared to the prior year due to lower direct mining costs combined with the impact of higher sales volume on unit production costs.All-in sustaining costs1 did not benefit from the aforementioned insurance proceeds as they were excluded from our calculation.
In 2016, capital expenditures were in line with the prior year as an increase in capitalized stripping costs was offset by the deferral and cancellation ofnon-critical sustaining capital expenditures.
Outlook
At Pueblo Viejo, we expect our equity share of 2017 gold production to be in the range of 625 to 650 thousand ounces, below 2016 production levels, driven by reduced gold head grade offset by increased gold recovery related to improved availability and utilization achieved through the optimization of maintenance strategies and ore blending.
In 2017, we expect cost of sales per ounce4 to be in the range of $650 to $680 per ounce, cash costs1 to be $400 to $420 per ounce andall-in-sustaining costs1 to be $530 to $560 per ounce. All three indicators will be higher than 2016 primarily due to a reduction in total ounces sold affected by head grades, cost increases related to corporate allocations, higher maintenance costs, and higher sustaining costs owing to the deferral of projects from 2016 into 2017 which also affects depreciation.By-product credits are expected to be higher than 2016, impacted both by prices and recoveries for silver and copper, while power sales will benefit from the proceeds from frequency and capacity fees that Quisqueya I Power Plant will start to receive in 2017.
| | | | |
| BARRICK YEAR-END 2016 | | 57 | | MANAGEMENT’S DISCUSSION AND ANALYSIS |
Lagunas Norte,Peru
| | | | | | | | | | | | | | | | |
| Summary of Operating and Financial Data | | | | | | | For the years ended December 31 | |
| | | | 2016 | | | | 2015 | | | | % Change | | | | 2014 | |
Total tonnes mined (000s) | | | 40,847 | | | | 49,126 | | | | (17%) | | | | 50,030 | |
Ore tonnes processed (000s) | | | 17,253 | | | | 21,880 | | | | (21%) | | | | 22,110 | |
Average grade (grams/tonne) | | | 1.12 | | | | 1.02 | | | | 10% | | | | 0.99 | |
Gold produced (000s/oz) | | | 435 | | | | 560 | | | | (22%) | | | | 582 | |
Gold sold (000s/oz) | | | 425 | | | | 565 | | | | (25%) | | | | 604 | |
Segment revenue ($ millions) | | | $ 548 | | | | $ 673 | | | | (19%) | | | | $ 775 | |
Cost of sales ($ millions) | | | 276 | | | | 378 | | | | (27%) | | | | 335 | |
Segment income ($ millions) | | | 260 | | | | 285 | | | | (9%) | | | | 439 | |
Segment EBITDA ($ millions)1 | | | 356 | | | | 454 | | | | (22%) | | | | 531 | |
Capital expenditures ($ millions) | | | 56 | | | | 67 | | | | (16%) | | | | 81 | |
Minesite sustaining | | | 51 | | | | 67 | | | | (24%) | | | | 81 | |
Project | | | 5 | | | | - | | | | 100% | | | | - | |
Cost of sales (per oz) | | | 651 | | | | 669 | | | | (3%) | | | | 555 | |
Cash costs (per oz)1 | | | 383 | | | | 329 | | | | 16% | | | | 379 | |
All-in sustaining costs (per oz)1 | | | 529 | | | | 509 | | | | 4% | | | | 543 | |
All-in costs (per oz)1 | | | $ 540 | | | | $ 509 | | | | 6% | | | | $ 543 | |
| 1 | These arenon-GAAP financial performance measures with no standardized meaning under IFRS and therefore may not be comparable to similar measures presented by other issuers. For further information and a detailed reconciliation of eachnon-GAAP measure used in this section of the MD&A to the most directly comparable IFRS measure, please see pages 71 to 85 of this MD&A. |
Financial Results
Lagunas Norte’s segment income for 2016 was 9% lower than the prior year primarily due to lower sales volumes, partially offset by lower depreciation expense, higher gold prices and lower operating costs mostly driven by lower tonnage mined due to ore depletion of the oxide deposit and lower fuel prices.
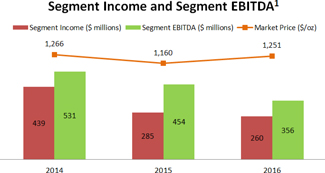
In 2016, gold production was 22% lower than the prior year primarily due to fewer ounces placed on the leach pad as a result of lower equipment availability, combined with processing harder material and a higher percentage of older stock material, in line with expectations as the mine matures. The decrease in gold production was partially offset by higher ore grades.
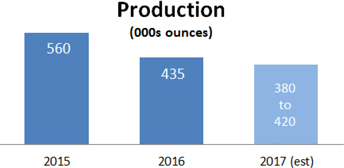
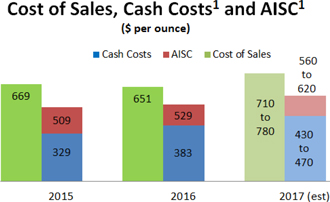
Cost of sales per ounce4 for 2016 was $18 per ounce lower than the prior year mainly due to a decrease in depreciation expense and lower direct mining costs resulting from lower tonnage mined and processed, lower fuel prices and lower royalties derived from lower sales. These were combined with realized cost savings from theBest-in-Class program such as the initiatives to improve
| | | | |
| BARRICK YEAR-END 2016 | | 58 | | MANAGEMENT’S DISCUSSION AND ANALYSIS |
efficiencies in the carbon in column circuit, implementation of short interval control, improvements in planned maintenance and renegotiation of certain service contracts. In 2016,all-in sustaining costs1 increased by $20 per ounce compared to the prior year primarily due to lower sales volume, partially offset by the lower direct mining costs and royalty costs combined with a decrease in minesite sustaining capital expenditures.
In 2016, capital expenditures decreased by 16% compared to the prior year due to lower minesite sustaining capital relating to the end of construction of phase 6 of the leach pad in 2015 partially offset by higher capitalized stripping in 2016. Project expenditures in 2016 relate to the Refractory Ore Project.
Outlook
At Lagunas Norte we expect 2017 production to be in the range of 380 to 420 thousand ounces, lower than 2016 production levels, as a result of the progressive
depletion of oxide ores, which are being replaced with sulfide ores with lower kinetics and recoveries.
We expect cost of sales per ounce4 to be in the range of $710 to $780 per ounce. This increase, in comparison with 2016, is mainly driven by higher cost of sales attributed to an expected increase in depreciation expense, higher direct operating costs and CSR expenses, partially offset byBest-in-Class initiatives. We expect cash costs1 to be in the range of $430 to $470 per ounce andall-in sustaining costs1 to be in the range of $560 to $620 per ounce. The increase inall-in sustaining costs1 in comparison with 2016 is driven mainly by the decrease in production; sustaining capital expenditures are decreasing in 2017. Operational cost increases are expected to be partially offset byBest-in-Class operational initiatives including service and material contract renegotiation, increased component life, improvements in preventative maintenance, and energy optimization programs. Structural cost reduction in mine stripping and employee profit sharing are expected to occur due to the reduced mine production plan.
| | | | |
| BARRICK YEAR-END 2016 | | 59 | | MANAGEMENT’S DISCUSSION AND ANALYSIS |
Veladero,Argentina
| | | | | | | | | | | | | | | | |
| Summary of Operating and Financial Data | | | | | | | For the years ended December 31 | |
| | | | 2016 | | | | 2015 | | | | % Change | | | | 2014 | |
Total tonnes mined (000s) | | | 62,227 | | | | 83,409 | | | | (25%) | | | | 67,686 | |
Ore tonnes processed (000s) | | | 28,028 | | | | 28,385 | | | | (1%) | | | | 29,500 | |
Average grade (grams/tonne) | | | 0.82 | | | | 0.82 | | | | (2%) | | | | 1.00 | |
Gold produced (000s/oz) | | | 544 | | | | 602 | | | | (10%) | | | | 722 | |
Gold sold (000s/oz) | | | 532 | | | | 629 | | | | (15%) | | | | 724 | |
Segment revenue ($ millions) | | | $ 685 | | | | $ 720 | | | | (5%) | | | | $ 894 | |
Cost of sales ($ millions) | | | 464 | | | | 499 | | | | (7%) | | | | 554 | |
Segment income ($ millions) | | | 220 | | | | 216 | | | | 2% | | | | 330 | |
Segment EBITDA ($ millions)1 | | | 338 | | | | 324 | | | | 4% | | | | 446 | |
Capital expenditures ($ millions) | | | 95 | | | | 242 | | | | (61%) | | | | 173 | |
Minesite sustaining | | | 95 | | | | 242 | | | | (61%) | | | | 173 | |
Project | | | - | | | | - | | | | - | | | | - | |
Cost of sales (per oz) | | | 872 | | | | 792 | | | | 10% | | | | 764 | |
Cash costs (per oz)1 | | | 582 | | | | 552 | | | | 5% | | | | 566 | |
All-in sustaining costs (per oz)1 | | | 769 | | | | 946 | | | | (19%) | | | | 815 | |
All-in costs (per oz)1 | | | $ 769 | | | | $ 946 | | | | (19%) | | | | $ 815 | |
| 1 | These arenon-GAAP financial performance measures with no standardized meaning under IFRS and therefore may not be comparable to similar measures presented by other issuers. For further information and a detailed reconciliation of eachnon-GAAP measure used in this section of the MD&A to the most directly comparable IFRS measure, please see pages 71 to 85 of this MD&A. |
Financial Results
Veladero’s segment income for 2016 was 2% higher than the prior year primarily due to lower operating costs combined with higher gold prices, partially offset by a decrease in sales volume.
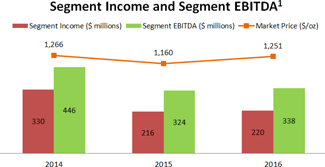
In 2016, gold production was 10% lower compared to the prior year mainly reflecting lower grade tonnes placed on the leach pad in efforts to manage water balances in the leach pad. This was further impacted by the temporary suspension of operations late in the third quarter of 2016 combined with unexpected severe winter weather conditions in the second quarter of 2016.
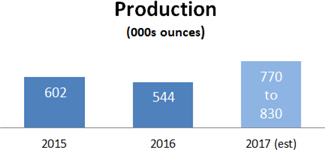
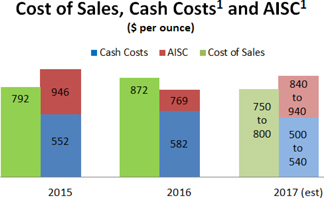
Cost of sales per ounce4 in 2016 was $80 per ounce higher than the prior year primarily due to the impact of lower sales volume on unit production costs relating to the severe weather conditions and temporary suspension of operations during 2016 combined with lower waste stripping activity and higher depreciation expense. This was partially offset by lower direct mining costs as a result of lower tonnes mined due to severe weather conditions and the temporary suspension of operations, combined withBest-in-Class savings initiatives such as optimizing consumables usage, improving efficiencies in mine operations and the impact of lower contractor costs. In 2016,all-in sustaining costs1 decreased by $177
| | | | |
| BARRICK YEAR-END 2016 | | 60 | | MANAGEMENT’S DISCUSSION AND ANALYSIS |
per ounce compared to the prior year primarily due to a decrease in minesite sustaining capital expenditures combined with lower direct mining costs, partly offset by the impact of lower sales volume on unit production costs.
In 2016, capital expenditures decreased by 61% compared to the prior year primarily due to a decrease in minesite sustaining expenditures mainly related to lower capitalized stripping costs and the construction of the phase 4B leach pad combined with higher capitalized infrastructure improvement costs in the prior year as a result of the cyanide incident that occurred in the third quarter of 2015.
On October 9, 2015, the San Juan mining authority initiated an administrative sanction process against Minera Argentina Gold SRL (“MAG”), Barrick’s Argentine subsidiary that operates the Veladero mine, for alleged violations of the mining code relating to a valve failure and release of cyanide-bearing process solution in September 2015. On March 11, 2016, the San Juan Provincial mining authority announced its intention to impose an administrative fine against MAG in connection with the solution release. MAG was formally notified of this decision on March 15, 2016. On April 6, 2016, MAG sought reconsideration of certain aspects of the decision but did not challenge the amount of the administrative fine. On April 14, 2016, in accordance with local requirements, MAG paid the administrative fine of approximately $10 million (at the then-applicable Argentine peso/$ exchange rate) while the request for reconsideration is pending. MAG is implementing a remedial action plan at Veladero in response to the incident as required by the San Juan mining authority. Certain construction-related activities in the Valley Fill Leach Facility (“VLF”) are still pending. Refer to note 36 to the Financial Statements for more information regarding this matter.
On September 8, 2016, ice rolling down the slope of the leach pad at the Veladero mine damaged a pipe carrying process solution, causing some material to leave the leach pad. This material, primarily crushed ore saturated with process solution, was contained on the mine site and returned to the leach pad. Extensive water monitoring in the area conducted by MAG has confirmed that the incident did not result in any environmental impact. A temporary suspension of operations at the Veladero mine was ordered by the San Juan Provincial mining authority and a San Juan Provincial court on September 15, 2016 and September 22, 2016, respectively, as a result of this incident. On October 4, 2016, following, among other
matters, the completion of certain urgent works required by the San Juan Provincial mining authority and a judicial inspection of the mine, the San Juan Provincial court lifted the suspension of operations and ordered that mining activities be resumed.
On September 14, 2016, the San Juan Provincial mining authority commenced an administrative proceeding in connection with this incident that included, in addition to the issue of the suspension order, an infringement proceeding against MAG. On December 2, 2016, the San Juan Provincial mining authority notified MAG of two charges under the infringement proceeding for alleged violations of the Mining Code. Refer to note 36 to the Financial Statements for more information regarding this matter.
On December 15, 2016, MAG was served notice of a lawsuit by certain persons who claim to be living in Jachal, Argentina and to be affected by the Veladero mine and, in particular, the VLF. In the lawsuit, which was filed in the San Juan Provincial court, the plaintiffs have requested a court order that MAG cease leaching metals with cyanide solutions, mercury and other similar substances at the Veladero mine and replace that process with one that is free of hazardous substances, that MAG implement a closure and remediation plan for the VLF and surrounding areas, and create a committee to monitor this process. The lawsuit is proceeding as an ordinary civil action. The Company expects to reply to the lawsuit inmid-February 2017, and the case will then proceed to the evidentiary stage. Refer to note 36 to the Financial Statements for more information regarding this matter.
On December 30, 2016, the San Juan Mining Authority approved the fifth update to the Veladero mine’s environmental impact study (“EIS”), which as submitted by the Company had included a request for approval of the leach pad expansion for Phases 6 to 9. The fifth EIA update did not include an approval of Phases 6 to 9. Rather, the San Juan Mining Authority required additional technical information. Veladero submitted an initial response to the San Juan Mining Authority on January 12, 2017, and expects to provide additional information in late February 2017 as requested by the San Juan Mining Authority. Future production at Veladero after 2017 could be impacted if the leach pad expansion is not timely approved.
Outlook
At Veladero we expect 2017 production to be in the range of 770 to 830 thousand ounces, higher than
| | | | |
| BARRICK YEAR-END 2016 | | 61 | | MANAGEMENT’S DISCUSSION AND ANALYSIS |
2016 production levels. The increase is mainly a result of a higher head grade in ore processed due to mine sequence phases at Federico pit. This is combined with higher ore tonnes mined and processed given the suspension, environmental and bad weather incidents in 2016 all leading to improved mining productivity, higher operating hours, and fewer days lost. In addition, a higher inventory draw-down, due to better operational management of the leach pad, will contribute to higher production.
Cost of sales per ounce4 is expected to be decreasing from $872 to an expected range of $750 to $800, mainly due to the impact of higher sales compared to 2016 and higher mining costs capitalized as stripping. These positive variances are expected to be partly offset by higher direct operating costs and the impact of higher charges from the production inventory movements stemming from the expected drawdown of leach pad inventories. Higher gross direct operating costs are expected in 2017 as a consequence of higher operating hours and higher tonnage to be moved combined with higher costs in process area in order to improve the management of leach facilities.
We expect cash costs1 in 2017 to be in the range of $500 to $540 per ounce, lower than 2016 levels mainly due to the increase in gold production driving higher sales combined with higher credits from capitalized stripping.All-in sustaining costs1 are expected to be between $840 and $940 per ounce, higher than 2016 levels mainly due to the increase in capital expenditures requirements combined with higher direct operating costs. At Veladero, a number of initiatives are underway to reduce operating costs, mainly in the areas of supply chain and inventory management, maintenance practices, mining productivity and energy costs. Higher gross direct operating costs are expected in 2017 as a consequence of higher operating hours and higher tonnage to be moved combined with higher costs in process area in order to improve the management of leach facilities. Operating costs at Veladero are also highly sensitive to local inflation and fluctuations in foreign exchange rates. We have assumed an average ARS:USD exchange rate of $16.5 and a local inflation rate of 20% for the purposes of preparing our cash cost andall-in sustaining cost guidance for 2017.
| | | | |
| BARRICK YEAR-END 2016 | | 62 | | MANAGEMENT’S DISCUSSION AND ANALYSIS |
Turquoise Ridge(75% basis),Nevada USA
| | | | | | | | | | | | | | | | |
| Summary of Operating and Financial Data | | | | | | | For the years ended December 31 | |
| | | | 2016 | | | | 2015 | | | | % Change | | | | 2014 | |
Total tonnes mined (000s) | | | 598 | | | | 349 | | | | 71% | | | | 312 | |
Ore tonnes processed (000s) | | | 523 | | | | 390 | | | | 34% | | | | 335 | |
Average grade (grams/tonne) | | | 17.04 | | | | 18.82 | | | | (9%) | | | | 19.62 | |
Gold produced (000s/oz) | | | 266 | | | | 217 | | | | 23% | | | | 195 | |
Gold sold (000s/oz) | | | 257 | | | | 202 | | | | 27% | | | | 200 | |
Segment revenue ($ millions) | | | $ 322 | | | | $ 235 | | | | 37% | | | | $ 252 | |
Cost of sales ($ millions) | | | 155 | | | | 141 | | | | 10% | | | | 111 | |
Segment income ($ millions) | | | 166 | | | | 92 | | | | 80% | | | | 139 | |
Segment EBITDA ($ millions)1 | | | 193 | | | | 115 | | | | 68% | | | | 156 | |
Capital expenditures ($ millions) | | | 32 | | | | 32 | | | | - | | | | 30 | |
Minesite sustaining | | | 32 | | | | 32 | | | | - | | | | 30 | |
Project | | | - | | | | - | | | | - | | | | - | |
Cost of sales (per oz) | | | 603 | | | | 697 | | | | (13%) | | | | 559 | |
Cash costs (per oz)1 | | | 498 | | | | 581 | | | | (14%) | | | | 473 | |
All-in sustaining costs (per oz)1 | | | 625 | | | | 742 | | | | (16%) | | | | 628 | |
All-in costs (per oz)1 | | | $ 625 | | | | $ 742 | | | | (16%) | | | | $ 628 | |
| 1 | These arenon-GAAP financial performance measures with no standardized meaning under IFRS and therefore may not be comparable to similar measures presented by other issuers. For further information and a detailed reconciliation of eachnon-GAAP measure used in this section of the MD&A to the most directly comparable IFRS measure, please see pages 71 to 85 of this MD&A. |
Financial Results
Turquoise Ridge’s segment income for 2016 was 80% higher than the prior year primarily due to an increase in sales volume due to increased mining productivity combined with higher gold prices.
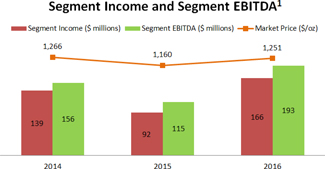
In 2016, gold production was 23% higher than the prior year primarily due to an increase in tonnes mined and processed resulting from increasing labor to support production growth combined with improved equipment availability and improved mine engineering to take advantage of the larger ore geometry. In the first quarter of 2015, the mine transitioned to fully mechanized topcuts, larger excavations and otherBest-in-Class activities, which resulted in increased productivity and the processing of more ore tonnes in subsequent quarters. The aim of the productivity improvements is to have a more consistent ore flow from the mine from month to month.
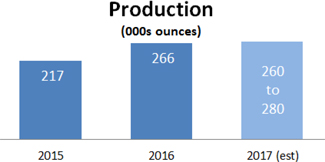
Cost of sales per ounce4 in 2016 was $94 per ounce lower than the prior year mainly reflecting the impact of higher sales volume on unit production costs combined with an increase in capitalized underground development costs. Although operating costs have increased due to the increased productivity rates in 2016, they have decreased on a per unit basis compared to the prior year. The increased productivity and unit cost reductions are due to the investment in equipment and facilities made in 2015 as well as a focus on equipment utilization, equipment maintenance and consumables consumption as part of ourBest-in-Class program. In 2016,all-in sustaining costs1 decreased by $117 per ounce compared to the prior year primarily reflecting the impact of lower cost of sales per ounce4.
| | | | |
| BARRICK YEAR-END 2016 | | 63 | | MANAGEMENT’S DISCUSSION AND ANALYSIS |
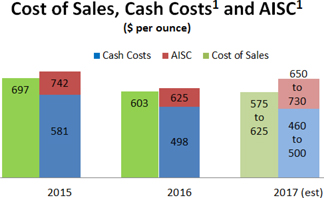
In 2016, capital expenditures were in line with the prior year as higher capitalized development costs were offset by lower minesite sustaining capital.
Outlook
At Turquoise Ridge we expect 2017 production to be in the range of 260 to 280 thousand ounces (Barrick’s share), in line with 2016 production levels, as mine productivity improves slightly, offset by slightly lower grade. Turquoise Ridge has completely transitioned to standardized equipment allowing for greater mining flexibility with higher reliability and less equipment. Capital and waste development requirements are in line with 2016 mining rates.
The cost of sales per ounce4 is expected to be in the range of $575 to $625 per ounce which is in line with 2016. We expect cash costs1 in 2016 to be in the range of $460 to $500 per ounce, consistent with 2016, andall-in sustaining costs1 to be in the range of $650 to $730 per ounce.All-in sustaining costs1 in 2017 are expected to be higher than 2016 due to increased spend on sustaining capital for the initial construction and final engineering of a third shaft.
| | | | |
| BARRICK YEAR-END 2016 | | 64 | | MANAGEMENT’S DISCUSSION AND ANALYSIS |
Acacia Mining plc(100% basis),Africa
| | | | | | | | | | | | | | | | |
| Summary of Operating and Financial Data | | | | | | | For the years ended December 31 | |
| | | | 2016 | | | | 2015 | | | | % Change | | | | 2014 | |
Total tonnes mined (000s) | | | 38,491 | | | | 41,390 | | | | (7%) | | | | 41,684 | |
Ore tonnes processed (000s) | | | 9,818 | | | | 9,268 | | | | 6% | | | | 8,413 | |
Average grade (grams/tonne) | | | 3.00 | | | | 2.80 | | | | 7% | | | | 3.00 | |
Gold produced (000s/oz) | | | 830 | | | | 732 | | | | 13% | | | | 719 | |
Gold sold (000s/oz) | | | 817 | | | | 721 | | | | 13% | | | | 704 | |
Segment revenue ($ millions) | | | $ 1,045 | | | | $ 860 | | | | 22% | | | | $ 923 | |
Cost of sales ($ millions) | | | 719 | | | | 837 | | | | (14%) | | | | 693 | |
Segment income ($ millions) | | | 299 | | | | (1) | | | | 30,000% | | | | 191 | |
Segment EBITDA ($ millions)1 | | | 465 | | | | 142 | | | | 227% | | | | 320 | |
Capital expenditures ($ millions) | | | 191 | | | | 177 | | | | 8% | | | | 251 | |
Minesite sustaining | | | 190 | | | | 178 | | | | 7% | | | | 195 | |
Project | | | 1 | | | | (1) | | | | 200% | | | | 56 | |
Cost of sales (per oz) | | | 880 | | | | 1,161 | | | | (24%) | | | | 985 | |
Cash costs (per oz)1 | | | 640 | | | | 772 | | | | (17%) | | | | 732 | |
All-in sustaining costs (per oz)1 | | | 958 | | | | 1,112 | | | | (14%) | | | | 1,105 | |
All-in costs (per oz)1 | | | $ 960 | | | | $ 1,111 | | | | (14%) | | | | $ 1,190 | |
| 1 | These arenon-GAAP financial performance measures with no standardized meaning under IFRS and therefore may not be comparable to similar measures presented by other issuers. For further information and a detailed reconciliation of eachnon-GAAP measure used in this section of the MD&A to the most directly comparable IFRS measure, please see pages 71 to 85 of this MD&A. |
Financial Results
Acacia’s segment income for 2016 was $300 million higher than the prior year primarily due to lower cost of sales combined with a higher gold price and an increase in sales volume.
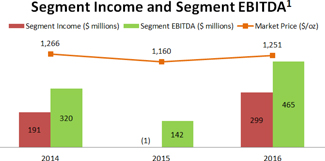
In 2016, gold production was 13% higher than the prior year primarily due to an increase in production at North Mara as a result of higher grade ore from the underground Gokona mine combined with higher recovery rates.
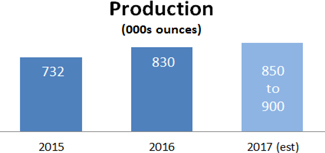
Cost of sales per ounce4 in 2016 was 24% lower than the prior year primarily reflecting the impact of $109 million of impairments at Buzwagi relating to supplies inventory and the long-term stockpile in 2015 combined with higher sales volume on unit production costs. This was partly offset by higher capitalized operating costs at North Mara relating to capitalized stripping combined with lower labor costs as a result of headcount reductions.All-in sustaining costs1 were 14% lower than the prior year as the lower cost of sales per ounce4 was partially offset by an increase in minesite sustaining capital expenditures.
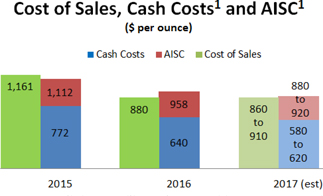
In 2016, capital expenditures increased by 8% compared to the prior year primarily due to an increase in capitalized stripping costs at North Mara primarily related to higher waste stripping at Nyabirama Stage 4, partially offset by a reduction in minesite sustaining
| | | | |
| BARRICK YEAR-END 2016 | | 65 | | MANAGEMENT’S DISCUSSION AND ANALYSIS |
capital expenditures primarily relating to capitalized development, equipment and infrastructure expenditures.
Outlook
We expect Acacia’s 2017 gold production to be in the range of 545 to 575 thousand ounces (Barrick’s share), which is higher than 2016 production levels. Acacia’s production is expected to be higher than 2016 mainly due to a revision to the mine plan at Buzwagi, where mining has been extended by approximately six months. Production at Bulyanhulu is expected to be in line with 2016 and North Mara is expected to be lower in 2017 as an increased
proportion of underground ore is sourced from the lower grade West Zone which will offset the impact of the increase in underground tonnes mined.
We expect cost of sales per ounce4 to be in the range of $860 to $910 per ounce. We expect cash costs1 to be in the range of $580 to $620 per ounce andall-in sustaining costs1 to be in the range of $880 to $920 per ounce. The decrease inall-in sustaining costs in comparison with 2016 is driven mainly by the increased production at Buzwagi.
| | | | |
| BARRICK YEAR-END 2016 | | 66 | | MANAGEMENT’S DISCUSSION AND ANALYSIS |
Pascua-Lama,Argentina/Chile
The Pascua-Lama project, located on the border between Chile and Argentina, is one of the world’s largest undeveloped gold and silver deposits, with the potential to generate significant free cash flow over a long mine life. In the third quarter of 2016, we announced the appointment of George Bee as Senior Vice President for Lama and Frontera District Development. Mr. Bee and his team have initiated a prefeasibility study for an underground mine at Lama in Argentina, which represents an opportunity to unlock the value of this deposit, and the wider district, through a phased approach that reduces execution risks and upfront capital requirements. Concurrently, the team in Chile remains focused on optimizing the Chilean components of the project, while addressing outstanding legal, regulatory, and permitting matters.
Our Investment Committee will continue to scrutinize the project as it advances, applying a high degree of consistency and rigor – as we do for all capital allocation decisions at the company – before further review by the Executive Committee and the Board at each stage of advancement.
U.S. Shareholder Class Action
On May 31, 2016, the Company confirmed that it had reached a $140 million settlement in this matter. The settlement was approved by the Court on December 2, 2016. The amount of the settlement is insured. The Company continues to believe that the allegations by the lead plaintiffs in this matter are unfounded, and under the terms of the settlement agreement, the Company has not accepted any allegations of wrongdoing or liability. Refer to note 36 to the Financial Statements for more information regarding this matter.
SMA Regulatory Sanctions
On June 8, 2016, Chile’s environmental regulator (the Superintendencia del Medio Ambiente, or “SMA”) consolidated the two administrative proceedings against Compañía Minera Nevada (“CMN”), Barrick’s Chilean subsidiary that holds the Chilean portion of the Pascua-Lama project, into a single proceeding encompassing both the reconsideration of the 2013 Resolution in accordance with the decision of the Environmental Court and the alleged deviations from the Project’s environmental approval notified by the SMA in April 2015. A final resolution from the SMA with respect to these matters is pending and could result in additional sanctions including new administrative fines and/or the revocation of the Project’s environmental permit. Refer to note 36 to the Financial Statements for more information regarding this matter.
Constitutional Protection Action
On August 12, 2016, the court ruled in favor of CMN and the Chilean mining authority (Sernageomin), rejecting the plaintiffs’ challenges to the Temporary and Partial Closure Plan for the Pascua-Lama project. On August 19, 2016, the plaintiffs appealed the court’s decision to the Chilean Supreme Court. A decision from the Supreme Court on this matter is pending. Refer to note 36 to the Financial Statements for more information regarding this matter.
Water Quality Review
CMN initiated a review of the baseline water quality of the Rio Estrecho in August 2013 as required by a July 15, 2013 decision of the Court of Appeals of Copiapo, Chile. The purpose of the review was to establish whether the water quality baseline has changed since the Pascua-Lama project received its environmental approval in February 2006 and, if so, to require CMN to adopt the appropriate corrective measures. As a result of that study, CMN requested certain modifications to its environmental permit water quality requirements. On June 6, 2016, the responsible agency approved a partial amendment of the environmental permit to better reflect the water quality baseline from 2009. That approval was appealed by certain water users and indigenous residents of the Huasco Valley. On October 19, 2016, the Chilean Committee of Ministers for the Environment, which has jurisdiction over claims of this nature, voted to uphold the permit amendments. On January 27, 2017, the Environmental Court agreed to consider an appeal of the Committee’s decision brought by CMN and the water users and indigenous residents. Refer to note 36 to the Financial Statements for more information regarding this matter.
Water Treatment Plant
The water treatment plant on the Chilean side of the Pascua-Lama project was damaged during the second quarter of 2016 as a result of heavy snowfall. The water treatment plant consists of two main components, the high density sludge unit followed by the reverse osmosis unit. The damage to the reverse osmosis plant is still under repair. On August 10, operation of the high density sludge unit and discharges were reestablished. Exceptional snowfall during the winter and an early melt has increased inflows to the plant to an extent that it is difficult to keep discharges within permit limits. CMN has reviewed its contingency plan with Chilean regulatory authorities.
| | | | |
| BARRICK YEAR-END 2016 | | 67 | | MANAGEMENT’S DISCUSSION AND ANALYSIS |
COMMITMENTS AND CONTINGENCIES
Litigation and Claims
We are currently subject to various litigation proceedings as disclosed in note 36 to the Financial Statements, and we may be involved in disputes with other parties in the future that may result in litigation. If we are unable to resolve these disputes favorably, it may have a material adverse impact on our financial condition, cash flow and results of operations.
Contractual Obligations and Commitments
In the normal course of business, we enter into contracts that give rise to commitments for future minimum payments. The following table summarizes the remaining contractual maturities of our financial liabilities and operating and capital commitments shown on an undiscounted basis:
| | | | | | | | | | | | | | | | | | | | | | | | | | | | |
| ($ millions) | | Payments due as at December 31, 2016 | |
| | | 2017 | | | 2018 | | | 2019 | | | 2020 | | | 2021 | | | 2022 and
thereafter | | | Total | |
Debt1 | | | | | | | | | | | | | | | | | | | | | | | | | | | | |
Repayment of principal | | | $ 105 | | | | $ 105 | | | | $ 381 | | | | $ 304 | | | | $ 678 | | | | $ 6,302 | | | | $ 7,875 | |
Capital leases | | | 38 | | | | 31 | | | | 16 | | | | 9 | | | | 6 | | | | 14 | | | | 114 | |
Interest | | | 434 | | | | 430 | | | | 415 | | | | 398 | | | | 371 | | | | 5,410 | | | | 7,458 | |
Provisions for environmental rehabilitation2 | | | 75 | | | | 78 | | | | 84 | | | | 110 | | | | 102 | | | | 1,804 | | | | 2,253 | |
Operating leases | | | 17 | | | | 18 | | | | 12 | | | | 11 | | | | 7 | | | | 8 | | | | 73 | |
Restricted share units | | | 46 | | | | 14 | | | | 2 | | | | - | | | | - | | | | - | | | | 62 | |
Pension benefits and other post-retirement benefits | | | 20 | | | | 20 | | | | 20 | | | | 20 | | | | 20 | | | | 408 | | | | 508 | |
Derivative liabilities3 | | | 51 | | | | 25 | | | | 2 | | | | - | | | | - | | | | - | | | | 78 | |
Purchase obligations for supplies and consumables4 | | | 402 | | | | 254 | | | | 144 | | | | 100 | | | | 68 | | | | 2 | | | | 970 | |
Capital commitments5 | | | 52 | | | | 16 | | | | 4 | | | | 4 | | | | 4 | | | | 23 | | | | 103 | |
Social development costs6 | | | 13 | | | | 3 | | | | 4 | | | | 2 | | | | 1 | | | | 146 | | | | 169 | |
Total | | | $ 1,253 | | | | $ 994 | | | | $ 1,084 | | | | $ 958 | | | | $ 1,257 | | | | $ 14,117 | | | | $ 19,663 | |
| | 1 | Debt and Interest - Our debt obligations do not include any subjective acceleration clauses or other clauses that enable the holder of the debt to call for early repayment, except in the event that we breach any of the terms and conditions of the debt or for other customary events of default. The debt and interest amounts include 100% of the Pueblo Viejo financing, even though our attributable share is 60% of this total, consistent with our ownership interest in the mine. We are not required to post any collateral under any debt obligations. Projected interest payments on variable rate debt were based on interest rates in effect at December 31, 2016. Interest is calculated on our long-term debt obligations using both fixed and variable rates. |
| | 2 | Provisions for Environmental Rehabilitation - Amounts presented in the table represent the undiscounted uninflated future payments for the expected cost of provisions for environmental rehabilitation. |
| | 3 | Derivative Liabilities - Amounts presented in the table relate to derivative contracts disclosed under note 25C to the Financial Statements. Payments related to derivative contracts may be subject to change given variable market conditions. |
| | 4 | Purchase Obligations for Supplies and Consumables - Includes commitments related to new purchase obligations to secure a supply of acid, tires and cyanide for our production process. |
| | 5 | Capital Commitments - Purchase obligations for capital expenditures include only those items where binding commitments have been entered into. |
| | 6 | Social Development Costs – Includes Pascua-Lama’s commitment of $146 million related to the potential funding of a power transmission line in Argentina, which is not expected to be paid prior to 2022. |
| | | | |
| BARRICKYEAR-END 2016 | | 68 | | MANAGEMENT’S DISCUSSION AND ANALYSIS |
REVIEW OF QUARTERLY RESULTS
Quarterly Information1
| | | | | | | | | | | | | | | | | | | | | | | | | | | | | | | | |
| | | 2016 | | | 2015 | |
($ millions, except where indicated) | | Q4 | | | Q3 | | | Q2 | | | Q1 | | | Q4 | | | Q3 | | | Q2 | | | Q1 | |
Revenues | | | $2,319 | | | | $2,297 | | | | $2,012 | | | | $ 1,930 | | | | $ 2,238 | | | | $ 2,315 | | | | $ 2,231 | | | | $ 2,245 | |
Realized price per ounce – gold2 | | | 1,217 | | | | 1,333 | | | | 1,259 | | | | 1,181 | | | | 1,105 | | | | 1,125 | | | | 1,190 | | | | 1,219 | |
Realized price per pound – copper2 | | | 2.62 | | | | 2.18 | | | | 2.14 | | | | 2.18 | | | | 2.16 | | | | 2.18 | | | | 2.66 | | | | 2.55 | |
Cost of sales | | | 1,454 | | | | 1,291 | | | | 1,336 | | | | 1,324 | | | | 1,768 | | | | 1,742 | | | | 1,689 | | | | 1,708 | |
Net earnings (loss) | | | 425 | | | | 175 | | | | 138 | | | | (83) | | | | (2,622) | | | | (264) | | | | (9) | | | | 57 | |
Per share (dollars)3 | | | 0.36 | | | | 0.15 | | | | 0.12 | | | | (0.07) | | | | (2.25) | | | | (0.23) | | | | (0.01) | | | | 0.05 | |
Adjusted net earnings2 | | | 255 | | | | 278 | | | | 158 | | | | 127 | | | | 91 | | | | 131 | | | | 60 | | | | 62 | |
Per share (dollars)2,3 | | | 0.22 | | | | 0.24 | | | | 0.14 | | | | 0.11 | | | | 0.08 | | | | 0.11 | | | | 0.05 | | | | 0.05 | |
Operating cash flow4 | | | 711 | | | | 951 | | | | 527 | | | | 451 | | | | 698 | | | | 1,255 | | | | 525 | | | | 316 | |
Cash capital expenditures | | | 326 | | | | 277 | | | | 253 | | | | 270 | | | | 311 | | | | 389 | | | | 499 | | | | 514 | |
Free cash flow2,4 | | | $ 385 | | | | $674 | | | | $274 | | | | $ 181 | | | | $ 387 | | | | $ 866 | | | | $ 26 | | | | ($ 198) | |
| | |
| 1 | | Sum of all the quarters may not add up to the annual total due to rounding. |
| 2 | | Realized price, adjusted net earnings, adjusted net earnings per share and free cash flow arenon-GAAP financial performance measures with no standardized meaning under IFRS and therefore may not be comparable to similar measures of performance presented by other issuers. For further information and a detailed reconciliation of eachnon-GAAP measure used in this section of the MD&A to the most directly comparable IFRS measure, please see pages 71 to 85 of this MD&A. |
| 3 | | Calculated using weighted average number of shares outstanding under the basic method of earnings per share. |
| 4 | | Q3 2015 includes $610 million of proceeds from the gold and silver streaming transaction with Royal Gold, Inc. |
Our recent financial results reflect our emphasis on cost control and growing operating cash flow and free cash flow. While gold prices have fluctuated around $1,200 per ounce, we have been able to record positive free cash flow1 in seven consecutive quarters. In the fourth quarter of 2016, we recorded a net asset impairment reversal of $146 million (net of tax effects andnon-controlling interests) primarily relating to impairment reversals at Veladero and Lagunas Norte. In the fourth quarter of 2015, we recorded asset and goodwill impairments of $2.6 billion (net of tax effects andnon-controlling interests), primarily related to our Pueblo Viejo and Goldstrike mines and Pascua-Lama project. In the third quarter of 2015, we recorded a goodwill impairment charge of $476 million relating to our Zaldívar mine upon reclassification of the mine’s net assets asheld-for-sale as the agreed selling price is lower than previously recognized carrying values.
Fourth Quarter Results
In the fourth quarter of 2016, we reported net earnings of $425 million and adjusted net earnings1 of $255 million, compared to a net loss of $2.6 billion and adjusted net earnings1 of $91 million in the fourth quarter of 2015. The net earnings in the fourth quarter of 2016 reflect the recording of $146 million (net of tax effects andnon-controlling interests) in net impairment reversals compared to impairment charges of $2.6 billion (net of tax effects andnon-controlling interests) recorded in the fourth quarter of 2015.
The higher net earnings in the fourth quarter of 2016 reflect an increase in realized gold and copper prices and lower cost of sales combined with the recognition of impairment reversals rather than impairment charges, partly offset by lower sales volumes due to divested sites compared to the same prior year period. The increase in adjusted net earnings primarily reflects the higher realized gold and copper prices, partly offset by a decrease in gold and copper sales volumes compared to the fourth quarter of 2015.
In the fourth quarter of 2016, gold and copper sales were 1.52 million ounces and 107 million pounds, respectively, compared to 1.64 million ounces (1.48 million ounces excluding the impact of divested sites) and 132 million pounds (114 million pounds excluding the impact of divested sites), respectively, in the fourth quarter of 2015. Revenues in the fourth quarter of 2016 were higher than the same prior year period, reflecting higher market prices for gold and copper, partially offset by lower gold and copper sales volumes. In the fourth quarter of 2016, cost of sales was $1.5 billion, a decrease of $314 million compared to the same prior year period, reflecting lower direct mining costs and depreciation expense attributed mainly to divested sites, combined with lower consumable prices andBest-in-Class initiatives. Cost of sales per ounce4 was $784 per ounce, a decrease of $64 per ounce, primarily due to a positive change in our sales mix as a result of the divestment of some of our higher cost mine sites combined with lower consumable costs, inventory impairment charges and
| | | | |
| BARRICKYEAR-END 2016 | | 69 | | MANAGEMENT’S DISCUSSION AND ANALYSIS |
lower depreciation expense. Cost of sales per pound4 was $1.45 per pound, an increase of $0.36 per pound from the same prior year period due to lower sales volume at Lumwana and Zaldívar, partially offset by higher cost of sales at Jabal Sayid combined with lower royalty expense at Lumwana.
In the fourth quarter of 2016, operating cash flow was $711 million, up 2% from the same prior year period. The increase in operating cash flow primarily reflects higher realized gold and copper prices, partially offset by lower gold and copper sales volume combined with an increase in income tax payments.
In the fourth quarter of 2016, free cash flow1 was $385 million, in line with the $387 million in the same prior year period. The higher operating cash flow generated in the fourth quarter of 2016 compared to the same prior year period was offset by higher cash capital expenditures of $326 million, compared to $311 million in the fourth quarter of 2015. The higher cash capital expenditures were a result of greater spending at Cortez, Veladero and Goldstrike, partially offset by the impact of divested sites.
INTERNAL CONTROL OVER FINANCIAL REPORTING AND DISCLOSURE CONTROLS AND PROCEDURES
Management is responsible for establishing and maintaining adequate internal control over financial reporting and disclosure controls and procedures. Internal control over financial reporting is a framework designed to provide reasonable assurance regarding the reliability of financial reporting and the preparation of financial statements for external purposes in accordance with IFRS. The Company’s internal control over financial reporting framework includes those policies and procedures that (i) pertain to the maintenance of records that, in reasonable detail, accurately and fairly reflect the transactions and dispositions of the assets of the Company; (ii) provide reasonable assurance that transactions are recorded as necessary to permit preparation of financial statements in accordance with IFRS, and that receipts and expenditures of the Company are being made only in accordance with authorizations of management and directors of the Company; and (iii) provide reasonable assurance regarding prevention or timely detection of unauthorized acquisition, use or disposition of the Company’s assets that could have a material effect on the Company’s consolidated financial statements.
Disclosure controls and procedures form a broader framework designed to provide reasonable assurance that other financial information disclosed publicly fairly presents in all material respects the financial condition, results of operations and cash flows of the Company for the periods presented in this MD&A and Barrick’s Annual Report. The Company’s disclosure controls and procedures framework includes processes designed to ensure that material information relating to the Company, including its consolidated subsidiaries, is made
known to management by others within those entities to allow timely decisions regarding required disclosure.
Together, the internal control over financial reporting and disclosure controls and procedures frameworks provide internal control over financial reporting and disclosure. Due to its inherent limitations, internal control over financial reporting and disclosure may not prevent or detect all misstatements. Further, the effectiveness of internal control is subject to the risk that controls may become inadequate because of changes in conditions, or that the degree of compliance with policies or procedures may change.
The management of Barrick, at the direction of our President and Chief Financial Officer, evaluated the effectiveness of the design and operation of internal control over financial reporting as of the end of the period covered by this report based on the framework and criteria established in Internal Control – Integrated Framework (2013) as issued by the Committee of Sponsoring Organizations of the Treadway Commission (COSO). Based on that evaluation, Management concluded that the Company’s internal control over financial reporting was effective as at December 31, 2016.
Barrick’s annual management report on internal control over financial reporting and the integrated audit report of Barrick’s auditors for the year ended December 31, 2016 will be included in Barrick’s 2016 Annual Report and its 2016 Form40-F/Annual Information Form on file with the US Securities and Exchange Commission and Canadian provincial securities regulatory authorities.
IFRS CRITICAL ACCOUNTING POLICIES AND ACCOUNTING ESTIMATES
Management has discussed the development and selection of our critical accounting estimates with the
Audit Committee of the Board of Directors, and the Audit Committee has reviewed the disclosure relating to such
| | | | |
| BARRICKYEAR-END 2016 | | 70 | | MANAGEMENT’S DISCUSSION AND ANALYSIS |
estimates in conjunction with its review of this MD&A. The accounting policies and methods we utilize determine how we report our financial condition and results of operations, and they may require management to make estimates or rely on assumptions about matters that are inherently uncertain. The consolidated financial statements have been prepared in accordance with IFRS as issued by the International Accounting Standards Board (“IASB”) under the historical cost convention, as modified by revaluation of certain financial assets, derivative contracts and post-retirement assets. Our significant accounting policies are disclosed in note 2 of the consolidated financial statements, including a
summary of current and future changes in accounting policies.
Critical Accounting Estimates and Judgments
Certain accounting estimates have been identified as being “critical” to the presentation of our financial condition and results of operations because they require us to make subjective and/or complex judgments about matters that are inherently uncertain; or there is a reasonable likelihood that materially different amounts could be reported under different conditions or using different assumptions and estimates. Our significant accounting judgments, estimates and assumptions are disclosed in note 3 of the accompanying financial statements.
NON-GAAP FINANCIAL PERFORMANCE MEASURES
Adjusted Net Earnings and Adjusted Net Earnings per Share
Adjusted net earnings is anon-GAAP financial measure which excludes the following from net earnings:
| • | | Impairment charges (reversals) related to intangibles, goodwill, property, plant and equipment, and investments; |
| • | | Acquisition/disposition gains/losses; |
| • | | Foreign currency translation gains/losses; |
| • | | Significant tax adjustments; |
| • | | Unrealized gains/losses onnon-hedge derivative instruments; and |
| • | | Tax effect andnon-controlling interest of the above items. |
Management uses this measure internally to evaluate our underlying operating performance for the reporting periods presented and to assist with the planning and forecasting of future operating results. Management believes that adjusted net earnings is a useful measure of our performance because impairment charges, acquisition/disposition gains/losses and significant tax adjustments do not reflect the underlying operating performance of our core mining business and are not necessarily indicative of future operating results. Furthermore, foreign currency translation gains/losses and unrealized gains/losses fromnon-hedge derivatives are not necessarily reflective of the underlying operating results for the reporting periods presented. The tax effect andnon-controlling interest of the adjusting items are also excluded to reconcile the amounts to Barrick’s share on apost-tax basis, consistent with net earnings.
As noted, we use this measure for internal purposes. Management’s internal budgets and forecasts and public guidance do not reflect the types of items we adjust for.
Consequently, the presentation of adjusted net earnings enables investors and analysts to better understand the underlying operating performance of our core mining business through the eyes of Management. Management periodically evaluates the components of adjusted net earnings based on an internal assessment of performance measures that are useful for evaluating the operating performance of our business segments and a review of thenon-GAAP measures used by mining industry analysts and other mining companies.
Adjusted net earnings is intended to provide additional information only and does not have any standardized definition under IFRS and should not be considered in isolation or as a substitute for measures of performance prepared in accordance with IFRS. The measures are not necessarily indicative of operating profit or cash flow from operations as determined under IFRS. Other companies may calculate these measures differently. The following table reconciles thesenon-GAAP measures to the most directly comparable IFRS measure.
Starting with the second quarter 2016 MD&A, we have amended the reconciliation from net earnings to adjusted net earnings to present the adjusting items on apre-tax and fully consolidated basis and including the tax effect andnon-controlling interest as a separate line. We believe that this change will assist analysts, investors and other stakeholders of Barrick to better understand how we calculate thisnon-GAAP performance measure and simplify how it reconciles to our financial statements. This change to the presentation of our reconciliation does not result in any change to the final calculation of adjusted net earnings.
| | | | |
| BARRICKYEAR-END 2016 | | 71 | | MANAGEMENT’S DISCUSSION AND ANALYSIS |
Reconciliation of Net Earnings to Net Earnings per Share, Adjusted Net Earnings and Adjusted Net Earnings per Share
| | | | | | | | | | | | | | | | | | | | |
| ($ millions, except per share amounts in dollars) | | For the years ended December 31 | | | For the three months ended December 31 | |
| | | 2016 | | | 2015 | | | 2014 | | | 2016 | | | 2015 | |
Net earnings (loss) attributable to equity holders of the Company | | | $ 655 | | | | ($ 2,838) | | | | ($2,907) | | | | $ 425 | | | | $ (2,622) | |
Impairment charges related to intangibles, goodwill, property, plant and equipment, and investments | | | (250) | | | | 3,897 | | | | 4,106 | | | | (304) | | | | 3,405 | |
Acquisition/disposition (gains)/losses | | | 42 | | | | (187) | | | | (50) | | | | 7 | | | | (107) | |
Foreign currency translation (gains)/losses | | | 199 | | | | 120 | | | | 132 | | | | 18 | | | | 132 | |
Significant tax adjustments1 | | | 43 | | | | 134 | | | | (3) | | | | (16) | | | | 95 | |
Other expense adjustments2 | | | 114 | | | | 135 | | | | 119 | | | | 39 | | | | 40 | |
Unrealized gains onnon-hedge derivative instruments | | | (32) | | | | 11 | | | | 181 | | | | (9) | | | | 4 | |
Tax effect andnon-controlling interest | | | 47 | | | | (928) | | | | (785) | | | | 95 | | | | (856) | |
Adjusted net earnings | | | $ 818 | | | | $ 344 | | | | $793 | | | | $ 255 | | | | $ 91 | |
Net earnings (loss) per share3 | | | 0.56 | | | | (2.44) | | | | (2.50) | | | | 0.36 | | | | (2.25) | |
Adjusted net earnings per share3 | | | 0.70 | | | | 0.30 | | | | 0.68 | | | | 0.22 | | | | 0.08 | |
| | 1 | Significant tax adjustments for the current year primarily relate to a tax provision booked by Acacia in Q1 2016. |
| | 2 | Other expense adjustments for the current year relate to losses on debt extinguishment, the impact of the decrease in the discount rate used to calculate the provision for environmental remediation at our closed mines and a reduction in cost of sales attributed to insurance proceeds recorded in the third quarter of 2016 relating to the 2015 oxygen plant motor failure at Pueblo Viejo. |
| | 3 | Calculated using weighted average number of shares outstanding under the basic method of earnings per share. |
Free Cash Flow
Free cash flow is a measure that excludes capital expenditures from net cash provided by operating activities. Management believes this to be a useful indicator of our ability to operate without reliance on additional borrowing or usage of existing cash.
Free cash flow is intended to provide additional information only and does not have any standardized definition under IFRS, and should not be considered in
isolation or as a substitute for measures of performance prepared in accordance with IFRS. The measure is not necessarily indicative of operating profit or cash flow from operations as determined under IFRS. Other companies may calculate this measure differently. The following table reconciles thisnon-GAAP measure to the most directly comparable IFRS measure.
Reconciliation of Net Cash Provided by Operating Activities to Free Cash Flow
| | | | | | | | | | | | | | | | | | | | |
| ($ millions) | | For the years ended December 31 | | | For the three months ended December 31 | |
| | | 2016 | | | 2015 | | | 2014 | | | 2016 | | | 2015 | |
Net cash provided by operating activities | | | $ 2,640 | | | | $ 2,794 | | | | $ 2,296 | | | | $ 711 | | | | $ 698 | |
Capital expenditures | | | (1,126) | | | | (1,713) | | | | (2,432) | | | | (326) | | | | (311) | |
Free cash flow | | | $ 1,514 | | | | $ 1,081 | | | | ($ 136) | | | | $ 385 | | | | $ 387 | |
| | | | |
| BARRICKYEAR-END 2016 | | 72 | | MANAGEMENT’S DISCUSSION AND ANALYSIS |
Cash costs per ounce,All-in sustaining costs per ounce,All-in costs per ounce, C1 cash costs per pound andAll-in sustaining costs per pound
Cash costs per ounce,all-in sustaining costs per ounce andall-in costs per ounce arenon-GAAP financial measures which are calculated based on the definition published by the World Gold Council (“WGC”) (a market development organization for the gold industry comprised of and funded by 18 gold mining companies from around the world, including Barrick). The WGC is not a regulatory organization. Management uses these measures to monitor the performance of our gold mining operations and its ability to generate positive cash flow, both on an individual site basis and an overall company basis.
Cash costs start with our cost of sales related to gold production and removes depreciation, thenon-controlling interest of cost of sales and includes by-product credits.All-in sustaining costs start with cash costs and include sustaining capital expenditures, general & administrative costs, minesite exploration and evaluation costs and reclamation cost accretion and amortization. These additional costs reflect the expenditures made to maintain current production levels.
All-in costs start withall-in sustaining costs and adds additional costs that reflect the varying costs of producing gold over the life-cycle of a mine, including:non-sustaining capital expenditures (capital expenditures at new projects and discrete projects at existing operations intended to increase production capacity and will not benefit production for at least 12 months) and othernon-sustaining costs (primarily exploration and evaluation costs, community relations costs and general and administrative costs that are not associated with current operations). These definitions recognize that there are different costs associated with the life-cycle of a mine, and that it is therefore appropriate to distinguish between sustaining andnon-sustaining costs.
We believe that our use of cash costs,all-in sustaining costs andall-in costs will assist analysts, investors and other stakeholders of Barrick in understanding the costs associated with producing gold, understanding the economics of gold mining, assessing our operating performance and also our ability to generate free cash flow from current operations and to generate free cash flow on an overall company basis. Due to the capital-intensive nature of the industry and the long useful lives over which these items are depreciated, there can be a significant timing difference between net earnings calculated in accordance with IFRS and the amount of free cash flow that is being generated by a mine and therefore we believe these measures are useful non-
GAAP operating metrics and supplement our IFRS disclosures. These measures are not representative of all of our cash expenditures as they do not include income tax payments, interest costs or dividend payments. These measures do not include depreciation or amortization.
Cash costs per ounce,all-in sustaining costs andall-in costs are intended to provide additional information only and do not have standardized definitions under IFRS, and should not be considered in isolation or as a substitute for measures of performance prepared in accordance with IFRS. These measures are not equivalent to net income or cash flow from operations as determined under IFRS. Although the WGC has published a standardized definition, other companies may calculate these measures differently.
In addition to presenting these metrics on aby-product basis, we have calculated these metrics on aco-product basis. Ourco-product metrics remove the impact of other metal sales that are produced as aby-product of our gold production from cost per ounce calculations, but does not reflect a reduction in costs for costs associated with other metal sales.
C1 cash costs per pound andAll-in sustaining costs per pound arenon-GAAP financial measures related to our copper mine operations. We believe that C1 cash costs per pound enables investors to better understand the performance of our copper operations in comparison to other copper producers who present results on a similar basis. C1 cash costs per pound excludes royalties andnon-routine charges as they are not direct production costs.All-in sustaining costs per pound is similar to the goldall-in sustaining costs metric and Management uses this to better evaluate the costs of copper production. We believe this change will enable investors to better understand the operating performance of our copper mines as this measure reflects all of the sustaining expenditures incurred in order to produce copper.All-in sustaining costs per pound includes C1 cash costs, corporate general and administrative costs, minesite exploration and evaluation costs, royalties, environmental rehabilitation costs and write-downs taken on inventory to net realizable value.
Starting with the third quarter 2016 MD&A, we have presented this reconciliation for each of our reportable operating segments. We believe this additional information will assist analysts, investors and other stakeholders of Barrick in understanding the details of
| | | | |
| BARRICK YEAR-END 2016 | | 73 | | MANAGEMENT’S DISCUSSION AND ANALYSIS |
thesenon-GAAP metrics on asegment-by-segment basis.
Starting with the second quarter 2016 MD&A, we have condensed and simplified the reconciliation from cost of sales to “cash costs”,“all-in sustaining costs” and“all-in costs”, including on a per ounce basis for gold and per pound basis for copper, to present items on a fully consolidated basis and includenon-controlling interest as a separate line. As part of this simplification, we have grouped several minor items into one line labeled “Other”, with further detail in the footnote to the reconciliation. We believe that these changes will assist analysts, investors and other stakeholders of Barrick to better understand how we calculate thesenon-GAAP performance measures and simplify how they reconcile to our financial statements. This change to the presentation of our reconciliation does not result in any change to the figures calculated, except as noted below for“all-in costs”.
Also starting with the second quarter 2016 MD&A, we have adjusted the amount included as “project exploration and evaluation costs and project costs” as part of our“all-in costs” measure to include all exploration and evaluation costs related to our advanced mining and business improvement projects and corporate development activities, where previously it did not. The impact of this adjustment for the three and twelve month periods ended December 31, 2016, was $22/oz and $17/oz, respectively (2015: $27/oz and $30/oz, respectively; 2014: $25/oz). We believe this change will assist analysts, investors and other stakeholders of Barrick in understanding all of the expenditures related to growing our business.
| | | | |
| BARRICK YEAR-END 2016 | | 74 | | MANAGEMENT’S DISCUSSION AND ANALYSIS |
Reconciliation of Gold Cost of Sales to Cash costs,All-in sustaining costs andAll-in costs, including on a per ounce basis
| | | | | | | | | | | | | | | | | | | | | | | | |
($ millions, except per ounce information in dollars) | | | | | | | For the years ended December 31 | | | | For the three months ended December 31 | |
| | | Footnote | | | 2016 | | | 2015 | | | 2014 | | | 2016 | | | 2015 | |
Cost of sales related to gold production | | | | | | | $ 4,979 | | | | $ 5,904 | | | | $ 5,893 | | | | $ 1,347 | | | | $ 1,575 | |
Depreciation | | | | | | | (1,503) | | | | (1,613) | | | | (1,414) | | | | (396) | | | | (462) | |
By-product credits | | | 1 | | | | (184) | | | | (214) | | | | (271) | | | | (41) | | | | (48) | |
Realized (gains)/losses on hedge andnon-hedge derivatives | | | 2 | | | | 89 | | | | 128 | | | | (94) | | | | 18 | | | | 50 | |
Non-recurring items | | | 3 | | | | 24 | | | | (210) | | | | - | | | | - | | | | (149) | |
Other | | | 4 | | | | (44) | | | | 25 | | | | 26 | | | | (20) | | | | 7 | |
Non-controlling interests (Pueblo Viejo and Acacia) | | | 5 | | | | (358) | | | | (394) | | | | (379) | | | | (91) | | | | (78) | |
Cash costs | | | | | | | $ 3,003 | | | | $ 3,626 | | | | $ 3,761 | | | | $ 817 | | | | $ 895 | |
General & administrative costs | | | | | | | 256 | | | | 233 | | | | 385 | | | | 39 | | | | 52 | |
Minesite exploration and evaluation costs | | | 6 | | | | 44 | | | | 47 | | | | 38 | | | | 18 | | | | 11 | |
Minesite sustaining capital expenditures | | | 7 | | | | 944 | | | | 1,359 | | | | 1,638 | | | | 298 | | | | 303 | |
Rehabilitation - accretion and amortization (operating sites) | | | 8 | | | | 59 | | | | 145 | | | | 135 | | | | 18 | | | | 26 | |
Non-controlling interest, copper operations and other | | | 9 | | | | (287) | | | | (362) | | | | (532) | | | | (78) | | | | (86) | |
All-in sustaining costs | | | | | | | $ 4,019 | | | | $ 5,048 | | | | $ 5,425 | | | | $ 1,112 | | | | $ 1,201 | |
Project exploration and evaluation and project costs | | | 6 | | | | 193 | | | | 308 | | | | 354 | | | | 64 | | | | 75 | |
Community relations costs not related to current operations | | | | | | | 8 | | | | 12 | | | | 29 | | | | 2 | | | | - | |
Project capital expenditures | | | 7 | | | | 175 | | | | 133 | | | | 596 | | | | 51 | | | | (48) | |
Rehabilitation - accretion and amortization(non-operating sites) | | | 8 | | | | 11 | | | | 12 | | | | 11 | | | | 4 | | | | 3 | |
Non-controlling interest and copper operations | | | 9 | | | | (42) | | | | (43) | | | | (74) | | | | (4) | | | | (20) | |
All-in costs | | | | | | | $ 4,364 | | | | $ 5,470 | | | | $ 6,341 | | | | $ 1,229 | | | | $ 1,211 | |
Ounces sold - equity basis (000s ounces) | | | 10 | | | | 5,503 | | | | 6,083 | | | | 6,284 | | | | 1,519 | | | | 1,636 | |
Cost of sales per ounce | | | 11,12 | | | | $ 798 | | | | $ 859 | | | | $ 842 | | | | $ 784 | | | | $ 848 | |
Cash costs per ounce | | | 12 | | | | $ 546 | | | | $ 596 | | | | $ 598 | | | | $ 540 | | | | $ 547 | |
Cash costs per ounce (on aco-product basis) | | | 12,13 | | | | $ 569 | | | | $ 619 | | | | $ 618 | | | | $ 557 | | | | $ 566 | |
All-in sustaining costs per ounce | | | 12 | | | | $ 730 | | | | $ 831 | | | | $ 864 | | | | $ 732 | | | | $ 733 | |
All-in sustaining costs per ounce (on aco-product basis) | | | 12,13 | | | | $ 753 | | | | $ 854 | | | | $ 884 | | | | $ 749 | | | | $ 752 | |
All-in costs per ounce | | | 12 | | | | $ 792 | | | | $ 900 | | | | $ 1,010 | | | | $ 809 | | | | $ 741 | |
All-in costs per ounce (on aco-product basis) | | | 12,13 | | | | $ 815 | | | | $ 923 | | | | $ 1,030 | | | | $ 826 | | | | $ 760 | |
Revenues include the sale ofby-products for our gold and copper mines for the three months ended December 31, 2016 of $41 million (2015: $34 million) and the year ended December 31, 2016 of $151 million (2015: $140 million; 2014: $183 million) and energy sales from the Monte Rio power plant at our Pueblo Viejo mine for the three months ended December 31, 2016 of $nil (2015: $14 million) and the year ended December 31, 2016, of $33 million (2015: $74 million; 2014: $88 million) up until its disposition on August 18, 2016.
| 2 | Realized (gains)/losses on hedge andnon-hedge derivatives |
Includes realized hedge losses of $14 million and $73 million for the three months and year ended December 31, 2016, respectively (2015: $40 million and $106 million, respectively; 2014: $86 million gains), and realizednon-hedge losses of $4 million and $16 million for the three months and year ended December 31, 2016, respectively (2015: $10 million and $22 million, respectively; 2014: $8 million gains). Refer to Note 5 of the Financial Statements for further information.
Non-recurring items in 2016 consist of $34 million in a reduction in cost of sales attributed to insurance proceeds recorded in the third quarter of 2016 relating to the 2015 oxygen plant motor failure at Pueblo Viejo and $10 million in abnormal costs at Veladero relating to the administrative fine in connection with the cyanide incident that occurred in 2015. These gains/costs are not indicative of our cost of production and have been excluded from the calculation of cash costs.
Other adjustments include adding the net margins related to power sales at Pueblo Viejo of $nil and $5 million, respectively (2015: $2 million and $12 million, respectively; 2014: $16 million) and adding the cost of treatment and refining charges of $4 million and $16 million, respectively (2015: $4 million and $14 million, respectively; 2014: $11 million). 2016 includes the removal of cash costs associated with our Pierina mine, which is mining incidental ounces as it enters closure, of $24 million and $66 million, respectively.
| | | | |
| BARRICK YEAR-END 2016 | | 75 | | MANAGEMENT’S DISCUSSION AND ANALYSIS |
| 5 | Non-controlling interests (Pueblo Viejo and Acacia) |
Non-controlling interests includenon-controlling interests related to gold production of $127 million and $508 million, respectively, for the three months and year ended December 31, 2016 (2015: $188 million and $681 million, respectively; 2014: $602 million). Refer to Note 5 of the Financial Statements for further information.
| 6 | Exploration and evaluation costs |
Exploration, evaluation and project expenses are presented as minesite sustaining if it supports current mine operations and project if it relates to future projects. Refer to page 45 of this MD&A.
Capital expenditures are related to our gold sites only and are presented on a 100% accrued basis. They are split between minesite sustaining and project capital expenditures. Project capital expenditures are distinct projects designed to increase the net present value of the mine and are not related to current production. Significant projects in the current year are Arturo, Cortez Lower Zone and Lagunas Norte Refractory Ore Project. Refer to page 44 of this MD&A.
| 8 | Rehabilitation - accretion and amortization |
Includes depreciation on the assets related to rehabilitation provisions of our gold operations and accretion on the rehabilitation provision of our gold operations, split between operating andnon-operating sites.
| 9 | Non-controlling interest and copper operations |
Removes general & administrative costs related tonon-controlling interests and copper based on a percentage allocation of revenue. Also removes exploration, evaluation and project costs, rehabilitation costs and capital expenditures incurred by our copper sites and thenon-controlling interest of our Acacia and Pueblo Viejo operating segment and Arturo. In 2016, figures remove the impact of Pierina. The impact is summarized as the following:
| | | | | | | | | | | | | | | | | | | | |
| ($ millions) | | For the years ended December 31 | | | For the three months
ended December 31 | |
Non-controlling interest, copper operations and other | | 2016 | | | 2015 | | | 2014 | | | 2016 | | | 2015 | |
General & administrative costs | | | ($ 36) | | | | ($ 53) | | | | ($ 86) | | | | ($ 5) | | | | ($ 5) | |
Minesite exploration and evaluation costs | | | (9) | | | | (8) | | | | (18) | | | | (3) | | | | (3) | |
Rehabilitation - accretion and amortization (operating sites) | | | (9) | | | | (13) | | | | (12) | | | | (4) | | | | (4) | |
Minesite sustaining capital expenditures | | | (233) | | | | (288) | | | | (416) | | | | (66) | | | | (74) | |
All-in sustaining costs total | | | ($ 287) | | | | ($ 362) | | | | ($ 532) | | | | ($ 78) | | | | ($ 86) | |
Project exploration and evaluation and project costs | | | (12) | | | | (11) | | | | (43) | | | | (4) | | | | (9) | |
Project capital expenditures | | | (30) | | | | (32) | | | | (31) | | | | - | | | | (11) | |
All-in costs total | | | ($ 42) | | | | ($ 43) | | | | ($ 74) | | | | ($ 4) | | | | ($ 20) | |
| 10 | Ounces sold - equity basis |
In 2016, figures remove the impact of Pierina as the mine is currently going through closure.
| 11 | Cost of sales per ounce |
In 2016, figures remove the cost of sales impact of Pierina of $30 million and $82 million, respectively, for the three months and year ended December 31, 2016, as the mine is currently going through closure. Cost of sales per ounce excludesnon-controlling interest related to gold production. Cost of sales related to gold per ounce is calculated using cost of sales on an attributable basis (removing thenon-controlling interest of 40% Pueblo Viejo and 36.1% Acacia from cost of sales), divided by attributable gold ounces.
Cost of sales per ounce, cash costs per ounce,all-in sustaining costs per ounce andall-in costs per ounce may not calculate based on amounts presented in this table due to rounding.
| 13 | Co-product costs per ounce |
Cash costs per ounce,all-in sustaining costs per ounce andall-in costs per ounce presented on aco-product basis remove the impact ofby-product credits of our gold production (net ofnon-controlling interest) calculated as:
| | | | | | | | | | | | | | | | | | | | |
| ($ millions) | | For the years ended December 31 | | | For the three months
ended December 31 | |
| | | 2016 | | | 2015 | | | 2014 | | | 2016 | | | 2015 | |
By-product credits | | | $ 184 | | | | $ 214 | | | | $ 271 | | | | $ 41 | | | | $ 48 | |
Non-controlling interest | | | (53) | | | | (62) | | | | (80) | | | | (13) | | | | (14) | |
By-product credits (net ofnon-controlling interest) | | | $ 131 | | | | $ 152 | | | | $ 191 | | | | $ 28 | | | | $ 34 | |
| | | | |
| BARRICK YEAR-END 2016 | | 76 | | MANAGEMENT’S DISCUSSION AND ANALYSIS |
Reconciliation of Gold Cost of Sales to Cash costs,All-in sustaining costs andAll-in costs, including on a per ounce basis, by operating segment
| | | | | | | | | | | | | | | | | | | | | | | | | | | | | | | | | | |
($ millions, except per ounce information in dollars) | | | | | | | | | | | | | | | | | | | For the three months ended December 31, 2016 | |
| | | | | Footnote | | | Cortez | | | Goldstrike | | | Pueblo
Viejo | | | Lagunas
Norte | | | Veladero | | | Turquoise
Ridge | | | Acacia | |
| | Cost of sales related to gold production | | | | | | | $ 235 | | | | $ 269 | | | | $ 144 | | | | $ 60 | | | | $ 173 | | | | $ 41 | | | | $ 195 | |
| | Depreciation | | | | | | | (119) | | | | (105) | | | | (21) | | | | (19) | | | | (42) | | | | (8) | | | | (44) | |
| | By-product credits | | | 1 | | | | - | | | | - | | | | (17) | | | | (4) | | | | (7) | | | | - | | | | (10) | |
| | Non-recurring items | | | 2 | | | | - | | | | - | | | | - | | | | - | | | | - | | | | - | | | | - | |
| | Other | | | 3 | | | | - | | | | - | | | | 1 | | | | - | | | | - | | | | - | | | | 1 | |
| | Non-controlling interests | | | | | | | - | | | | - | | | | (39) | | | | - | | | | - | | | | - | | | | (52) | |
| | Cash costs | | | | | | | $ 116 | | | | $ 164 | | | | $ 68 | | | | $ 37 | | | | $ 124 | | | | $ 33 | | | | $ 90 | |
| | General & administrative costs | | | | | | | - | | | | - | | | | - | | | | - | | | | - | | | | - | | | | (1) | |
| | Minesite exploration and evaluation costs | | | 4 | | | | 6 | | | | 1 | | | | - | | | | - | | | | 1 | | | | - | | | | 1 | |
| | Minesite sustaining capital expenditures | | | 5 | | | | 19 | | | | 55 | | | | 32 | | | | 3 | | | | 49 | | | | 9 | | | | 56 | |
| | Rehabilitation - accretion and amortization | | | | | | | | | | | | | | | | | | | | | | | | | | | | | | | | |
| | (operating sites) | | | 6 | | | | 3 | | | | 6 | | | | 2 | | | | 2 | | | | 1 | | | | - | | | | 2 | |
| | Non-controlling interests | | | | | | | - | | | | (4) | | | | (13) | | | | - | | | | - | | | | - | | | | (21) | |
| | All-in sustaining costs | | | | | | | $ 144 | | | | $ 222 | | | | $ 89 | | | | $ 42 | | | | $ 175 | | | | $ 42 | | | | $ 127 | |
| | Project capital expenditures | | | 5 | | | | 33 | | | | - | | | | - | | | | 1 | | | | - | | | | - | | | | - | |
| | Non-controlling interests | | | | | | | - | | | | - | | | | - | | | | - | | | | - | | | | - | | | | - | |
| | All-in costs | | | | | | | $ 177 | | | | $ 222 | | | | $ 89 | | | | $ 43 | | | | $ 175 | | | | $ 42 | | | | $ 127 | |
| | Ounces sold - equity basis (000s ounces) | | | | | | | 277 | | | | 305 | | | | 198 | | | | 98 | | | | 194 | | | | 69 | | | | 134 | |
| | Cost of sales per ounce | | | 7,8 | | | | $846 | | | | $880 | | | | $450 | | | | $612 | | | | $892 | | | | $595 | | | | $935 | |
| | Cash costs per ounce | | | 8 | | | | $ 418 | | | | $ 534 | | | | $ 341 | | | | $ 379 | | | | $ 642 | | | | $ 484 | | | | $ 679 | |
| | Cash costs per ounce (on aco-product basis) | | | 8,9 | | | | $ 418 | | | | $ 536 | | | | $ 471 | | | | $ 418 | | | | $ 716 | | | | $ 484 | | | | $ 713 | |
| | All-in sustaining costs per ounce | | | 8 | | | | $ 517 | | | | $ 734 | | | | $ 443 | | | | $ 436 | | | | $ 905 | | | | $ 610 | | | | $ 952 | |
| | All-in sustaining costs per ounce (on aco-product basis) | | | 8,9 | | | | $ 517 | | | | $ 736 | | | | $ 573 | | | | $ 475 | | | | $ 979 | | | | $ 610 | | | | $ 986 | |
| | All-in costs per ounce | | | 8 | | | | $ 637 | | | | $ 734 | | | | $ 443 | | | | $ 447 | | | | $ 905 | | | | $ 610 | | | | $ 953 | |
| | All-in costs per ounce (on aco-product basis) | | | 8,9 | | | | $ 637 | | | | $ 736 | | | | $ 573 | | | | $ 486 | | | | $ 979 | | | | $ 610 | | | | $ 987 | |
| | | | |
| BARRICK YEAR-END 2016 | | 77 | | MANAGEMENT’S DISCUSSION AND ANALYSIS |
| | | | | | | | | | | | | | | | | | | | | | | | | | | | | | | | | | |
($ millions, except per ounce information in dollars) | | | | | | | | | | | | | | | | | | | For the three months ended December 31, 2015 | |
| | | | | Footnote | | | Cortez | | | Goldstrike | | | Pueblo
Viejo | | | Lagunas
Norte | | | Veladero | | | Turquoise
Ridge | | | Acacia | |
| | Cost of sales related to gold production | | | | | | | $ 242 | | | | $ 251 | | | | $ 197 | | | | $ 81 | | | | $ 123 | | | | $ 35 | | | | $ 303 | |
| | Depreciation | | | | | | | (122) | | | | (73) | | | | (55) | | | | (37) | | | | (29) | | | | (6) | | | | (44) | |
| | By-product credits | | | 1 | | | | (1) | | | | - | | | | (26) | | | | (4) | | | | (4) | | | | - | | | | (9) | |
| | Non-recurring items | | | 2 | | | | - | | | | - | | | | (38) | | | | - | | | | (2) | | | | - | | | | (109) | |
| | Other | | | 3 | | | | - | | | | - | | | | 3 | | | | - | | | | - | | | | - | | | | 4 | |
| | Non-controlling interests | | | | | | | - | | | | - | | | | (27) | | | | - | | | | - | | | | - | | | | (51) | |
| | Cash costs | | | | | | | $ 119 | | | | $ 178 | | | | $ 54 | | | | $ 40 | | | | $ 88 | | | | $ 29 | | | | $ 94 | |
| | General & administrative costs | | | | | | | - | | | | - | | | | - | | | | - | | | | - | | | | - | | | | 9 | |
| | Minesite exploration and evaluation costs | | | 4 | | | | 1 | | | | 2 | | | | 1 | | | | 1 | | | | - | | | | - | | | | - | |
| | Minesite sustaining capital expenditures | | | 5 | | | | 15 | | | | 16 | | | | 19 | | | | 17 | | | | 55 | | | | 9 | | | | 43 | |
| | Rehabilitation - accretion and amortization | | | | | | | | | | | | | | | | | | | | | | | | | | | | | | | | |
| | (operating sites) | | | 6 | | | | 4 | | | | 3 | | | | 7 | | | | 2 | | | | 1 | | | | - | | | | 2 | |
| | Non-controlling interests | | | | | | | - | | | | - | | | | (11) | | | | - | | | | - | | | | - | | | | (20) | |
| | All-in sustaining costs | | | | | | | $ 139 | | | | $ 199 | | | | $ 70 | | | | $ 60 | | | | $ 144 | | | | $ 38 | | | | $ 128 | |
| | Project capital expenditures | | | 5 | | | | 5 | | | | 24 | | | | - | | | | - | | | | - | | | | - | | | | - | |
| | Non-controlling interests | | | | | | | - | | | | (9) | | | | - | | | | - | | | | - | | | | - | | | | - | |
| | All-in costs | | | | | | | $ 144 | | | | $ 214 | | | | $ 70 | | | | $ 60 | | | | $ 144 | | | | $ 38 | | | | $ 128 | |
| | Ounces sold - equity basis (000s ounces) | | | | | | | 344 | | | | 345 | | | | 141 | | | | 118 | | | | 156 | | | | 51 | | | | 127 | |
| | Cost of sales per ounce | | | 7,8 | | | | $703 | | | | $727 | | | | $849 | | | | $690 | | | | $785 | | | | $685 | | | | $1,526 | |
| | Cash costs per ounce | | | 8 | | | | $ 348 | | | | $ 514 | | | | $ 383 | | | | $ 337 | | | | $ 556 | | | | $ 571 | | | | $ 728 | |
| | Cash costs per ounce (on aco-product basis) | | | 8,9 | | | | $ 348 | | | | $ 516 | | | | $ 505 | | | | $ 370 | | | | $ 594 | | | | $ 571 | | | | $ 756 | |
| | All-in sustaining costs per ounce | | | 8 | | | | $ 406 | | | | $ 581 | | | | $ 496 | | | | $ 506 | | | | $ 915 | | | | $ 735 | | | | $ 1,004 | |
| | All-in sustaining costs per ounce (on aco-product basis) | | | 8,9 | | | | $ 406 | | | | $ 583 | | | | $ 618 | | | | $ 539 | | | | $ 953 | | | | $ 735 | | | | $ 1,032 | |
| | All-in costs per ounce | | | 8 | | | | $ 419 | | | | $ 623 | | | | $ 496 | | | | $ 506 | | | | $ 915 | | | | $ 735 | | | | $ 1,005 | |
| | All-in costs per ounce (on aco-product basis) | | | 8,9 | | | | $ 419 | | | | $ 625 | | | | $ 618 | | | | $ 539 | | | | $ 953 | | | | $ 735 | | | | $ 1,033 | |
| | | | |
| BARRICK YEAR-END 2016 | | 78 | | MANAGEMENT’S DISCUSSION AND ANALYSIS |
| | | | | | | | | | | | | | | | | | | | | | | | | | | | | | | | | | |
($ millions, except per ounce information in dollars) | | | | | | | | | | | | | | | | | | | For the year ended December 31, 2016 | |
| | | | | Footnote | | | Cortez | | | Goldstrike | | | Pueblo
Viejo | | | Lagunas
Norte | | | Veladero | | | Turquoise
Ridge | | | Acacia | |
| | Cost of sales related to gold production | | | | | | | $ 955 | | | | $ 940 | | | | $ 644 | | | | $ 276 | | | | $ 464 | | | | $ 155 | | | | $ 719 | |
| | Depreciation | | | | | | | (499) | | | | (307) | | | | (147) | | | | (96) | | | | (118) | | | | (27) | | | | (166) | |
| | By-product credits | | | 1 | | | | - | | | | (1) | | | | (90) | | | | (17) | | | | (27) | | | | - | | | | (39) | |
| | Non-recurring items | | | 2 | | | | - | | | | - | | | | 34 | | | | - | | | | (10) | | | | - | | | | - | |
| | Other | | | 3 | | | | - | | | | - | | | | 5 | | | | - | | | | - | | | | - | | | | 8 | |
| | Non-controlling interests | | | | | | | - | | | | - | | | | (170) | | | | - | | | | - | | | | - | | | | (188) | |
| | Cash costs | | | | | | | $ 456 | | | | $ 632 | | | | $ 276 | | | | $ 163 | | | | $ 309 | | | | $ 128 | | | | $ 334 | |
| | General & administrative costs | | | | | | | - | | | | - | | | | - | | | | - | | | | - | | | | - | | | | 55 | |
| | Minesite exploration and evaluation costs | | | 4 | | | | 6 | | | | 4 | | | | - | | | | 2 | | | | 1 | | | | - | | | | 3 | |
| | Minesite sustaining capital expenditures | | | 5 | | | | 75 | | | | 142 | | | | 101 | | | | 51 | | | | 95 | | | | 32 | | | | 190 | |
| | Rehabilitation - accretion and amortization | | | | | | | | | | | | | | | | | | | | | | | | | | | | | | | | |
| | (operating sites) | | | 6 | | | | 12 | | | | 14 | | | | 10 | | | | 8 | | | | 4 | | | | 1 | | | | 6 | |
| | Non-controlling interests | | | | | | | - | | | | (4) | | | | (44) | | | | - | | | | - | | | | - | | | | (88) | |
| | All-in sustaining costs | | | | | | | $ 549 | | | | $ 788 | | | | $ 343 | | | | $ 224 | | | | $ 409 | | | | $ 161 | | | | $ 500 | |
| | Project capital expenditures | | | 5 | | | | 67 | | | | 74 | | | | - | | | | 5 | | | | - | | | | - | | | | 1 | |
| | Non-controlling interests | | | | | | | - | | | | (30) | | | | - | | | | - | | | | - | | | | - | | | | - | |
| | All-in costs | | | | | | | $ 616 | | | | $ 832 | | | | $ 343 | | | | $ 229 | | | | $ 409 | | | | $ 161 | | | | $ 501 | |
| | Ounces sold - equity basis (000s ounces) | | | | | | | 1,059 | | | | 1,103 | | | | 700 | | | | 425 | | | | 532 | | | | 257 | | | | 522 | |
| | Cost of sales per ounce | | | 7,8 | | | | $901 | | | | $852 | | | | $564 | | | | $651 | | | | $872 | | | | $603 | | | | $880 | |
| | Cash costs per ounce | | | 8 | | | | $ 430 | | | | $ 572 | | | | $ 395 | | | | $ 383 | | | | $ 582 | | | | $ 498 | | | | $ 640 | |
| | Cash costs per ounce (on aco-product basis) | | | 8,9 | | | | $ 430 | | | | $ 573 | | | | 473 | | | | $ 423 | | | | $ 632 | | | | $ 498 | | | | $ 677 | |
| | All-in sustaining costs per ounce | | | 8 | | | | $ 518 | | | | $ 714 | | | | $ 490 | | | | $ 529 | | | | $ 769 | | | | $ 625 | | | | $ 958 | |
| | All-in sustaining costs per ounce (on aco-product basis) | | | 8,9 | | | | $ 518 | | | | $ 715 | | | | $ 568 | | | | $ 569 | | | | $ 819 | | | | $ 625 | | | | $ 995 | |
| | All-in costs per ounce | | | 8 | | | | $ 581 | | | | $ 754 | | | | $ 490 | | | | $ 540 | | | | $ 769 | | | | $ 625 | | | | $ 960 | |
| | All-in costs per ounce (on aco-product basis) | | | 8,9 | | | | $ 581 | | | | $ 755 | | | | $ 568 | | | | $ 580 | | | | $ 819 | | | | $ 625 | | | | $ 997 | |
| | | | |
| BARRICK YEAR-END 2016 | | 79 | | MANAGEMENT’S DISCUSSION AND ANALYSIS |
| | | | | | | | | | | | | | | | | | | | | | | | | | | | | | | | | | |
($ millions, except per ounce information in dollars) | | | | | | | | | | | | | | | | | | | For the year ended December 31, 2015 | |
| | | | | Footnote | | | Cortez | | | Goldstrike | | | Pueblo
Viejo | | | Lagunas
Norte | | | Veladero | | | Turquoise
Ridge | | | Acacia | |
| | Cost of sales related to gold production | | | | | | | $ 826 | | | | $ 722 | | | | $ 904 | | | | $ 378 | | | | $ 499 | | | | $ 141 | | | | $ 837 | |
| | Depreciation | | | | | | | (343) | | | | (192) | | | | (277) | | | | (169) | | | | (108) | | | | (23) | | | | (143) | |
| | By-product credits | | | 1 | | | | (1) | | | | (1) | | | | (120) | | | | (18) | | | | (22) | | | | - | | | | (36) | |
| | Non-recurring items | | | 2 | | | | (5) | | | | (7) | | | | (47) | | | | (5) | | | | (21) | | | | (1) | | | | (109) | |
| | Other | | | 3 | | | | - | | | | - | | | | 13 | | | | - | | | | - | | | | - | | | | 8 | |
| | Non-controlling interests | | | | | | | - | | | | - | | | | (194) | | | | - | | | | - | | | | - | | | | (200) | |
| | Cash costs | | | | | | | $ 477 | | | | $ 522 | | | | $ 279 | | | | $ 186 | | | | $ 348 | | | | $ 117 | | | | $ 357 | |
| | General & administrative costs | | | | | | | - | | | | - | | | | - | | | | - | | | | - | | | | - | | | | 42 | |
| | Minesite exploration and evaluation costs | | | 4 | | | | 2 | | | | 10 | | | | 1 | | | | 3 | | | | 2 | | | | - | | | | 2 | |
| | Minesite sustaining capital expenditures | | | 5 | | | | 101 | | | | 110 | | | | 102 | | | | 67 | | | | 242 | | | | 32 | | | | 178 | |
| | Rehabilitation - accretion and amortization | | | | | | | | | | | | | | | | | | | | | | | | | | | | | | | | |
| | (operating sites) | | | 6 | | | | 12 | | | | 15 | | | | 25 | | | | 32 | | | | 4 | | | | 1 | | | | 9 | |
| | Non-controlling interests | | | | | | | - | | | | - | | | | (51) | | | | - | | | | - | | | | - | | | | (75) | |
| | All-in sustaining costs | | | | | | | $ 592 | | | | $ 657 | | | | $ 356 | | | | $ 288 | | | | $ 596 | | | | $ 150 | | | | $ 513 | |
| | Project capital expenditures | | | 5 | | | | 47 | | | | 112 | | | | - | | | | - | | | | - | | | | - | | | | (1) | |
| | Non-controlling interests | | | | | | | - | | | | (31) | | | | - | | | | - | | | | - | | | | - | | | | - | |
| | All-in costs | | | | | | | $ 639 | | | | $ 738 | | | | $ 356 | | | | $ 288 | | | | $ 596 | | | | $ 150 | | | | $ 512 | |
| | Ounces sold - equity basis (000s ounces) | | | | | | | 982 | | | | 999 | | | | 597 | | | | 565 | | | | 629 | | | | 202 | | | | 461 | |
| | Cost of sales per ounce | | | 7,8 | | | | $841 | | | | $723 | | | | $881 | | | | $669 | | | | $792 | | | | $697 | | | | $1,161 | |
| | Cash costs per ounce | | | 8 | | | | $ 486 | | | | $ 522 | | | | $ 467 | | | | $ 329 | | | | $ 552 | | | | $ 581 | | | | $ 772 | |
| | Cash costs per ounce (on aco-product basis) | | | 8,9 | | | | $ 487 | | | | $ 523 | | | | $ 595 | | | | $ 361 | | | | $ 587 | | | | $ 581 | | | | $ 810 | |
| | All-in sustaining costs per ounce | | | 8 | | | | $ 603 | | | | $ 658 | | | | $ 597 | | | | $ 509 | | | | $ 946 | | | | $ 742 | | | | $ 1,112 | |
| | All-in sustaining costs per ounce (on aco-product basis) | | | 8,9 | | | | $ 604 | | | | $ 659 | | | | $ 725 | | | | $ 541 | | | | $ 981 | | | | $ 742 | | | | $ 1,150 | |
| | All-in costs per ounce | | | 8 | | | | $ 650 | | | | $ 738 | | | | $ 597 | | | | $ 509 | | | | $ 946 | | | | $ 742 | | | | $ 1,111 | |
| | All-in costs per ounce (on aco-product basis) | | | 8,9 | | | | $ 651 | | | | $ 739 | | | | $ 725 | | | | $ 541 | | | | $ 981 | | | | $ 742 | | | | $ 1,149 | |
| | | | |
| BARRICK YEAR-END 2016 | | 80 | | MANAGEMENT’S DISCUSSION AND ANALYSIS |
| | | | | | | | | | | | | | | | | | | | | | | | | | | | | | | | | | |
($ millions, except per ounce information in dollars) | | | | | | | | | | | | | | | | | | | For the year ended December 31, 2014 | |
| | | | | Footnote | | | Cortez | | | Goldstrike | | | Pueblo
Viejo | | | Lagunas
Norte | | | Veladero | | | Turquoise
Ridge | | | Acacia | |
| | Cost of sales related to gold production | | | | | | | $ 687 | | | | $ 651 | | | | $ 885 | | | | $ 335 | | | | $ 554 | | | | $ 111 | | | | $ 693 | |
| | Depreciation | | | | | | | (255) | | | | (132) | | | | (243) | | | | (92) | | | | (116) | | | | (17) | | | | (129) | |
| | By-product credits | | | 1 | | | | (1) | | | | (1) | | | | (163) | | | | (14) | | | | (28) | | | | - | | | | (45) | |
| | Non-recurring items | | | 2 | | | | - | | | | - | | | | - | | | | - | | | | - | | | | - | | | | - | |
| | Other | | | 3 | | | | - | | | | - | | | | 16 | | | | - | | | | - | | | | - | | | | (8) | |
| | Non-controlling interests | | | | | | | - | | | | - | | | | (197) | | | | - | | | | - | | | | - | | | | (182) | |
| | Cash costs | | | | | | | $ 431 | | | | $ 518 | | | | $ 298 | | | | $ 229 | | | | $ 410 | | | | $ 94 | | | | $ 329 | |
| | General & administrative costs | | | | | | | - | | | | - | | | | - | | | | - | | | | - | | | | - | | | | 44 | |
| | Minesite exploration and evaluation costs | | | 4 | | | | 1 | | | | 2 | | | | - | | | | 1 | | | | 3 | | | | - | | | | 1 | |
| | Minesite sustaining capital expenditures | | | 5 | | | | 170 | | | | 245 | | | | 134 | | | | 81 | | | | 173 | | | | 30 | | | | 195 | |
| | Rehabilitation - accretion and amortization | | | | | | | | | | | | | | | | | | | | | | | | | | | | | | | | |
| | (operating sites) | | | 6 | | | | 9 | | | | 10 | | | | 23 | | | | 17 | | | | 4 | | | | 1 | | | | 8 | |
| | Non-controlling interests | | | | | | | - | | | | - | | | | (62) | | | | - | | | | - | | | | - | | | | (80) | |
| | All-in sustaining costs | | | | | | | $ 611 | | | | $ 775 | | | | $ 393 | | | | $ 328 | | | | $ 590 | | | | $ 125 | | | | $ 497 | |
| | Project capital expenditures | | | 5 | | | | 19 | | | | 300 | | | | - | | | | - | | | | - | | | | - | | | | 56 | |
| | Non-controlling interests | | | | | | | - | | | | (5) | | | | - | | | | - | | | | - | | | | - | | | | (17) | |
| | All-in costs | | | | | | | $ 630 | | | | $ 1,070 | | | | $ 393 | | | | $ 328 | | | | $ 590 | | | | $ 125 | | | | $ 536 | |
| | Ounces sold - equity basis (000s ounces) | | | | | | | 865 | | | | 908 | | | | 667 | | | | 604 | | | | 724 | | | | 200 | | | | 450 | |
| | Cost of sales per ounce | | | 7,8 | | | | $ 794 | | | | $ 718 | | | | $ 786 | | | | $ 555 | | | | $ 764 | | | | $ 559 | | | | $ 985 | |
| | Cash costs per ounce | | | 8 | | | | $ 498 | | | | $ 571 | | | | $ 446 | | | | $ 379 | | | | $ 566 | | | | $ 473 | | | | $ 732 | |
| | Cash costs per ounce (on aco-product basis) | | | 8,9 | | | | $ 499 | | | | $ 572 | | | | $ 521 | | | | $ 403 | | | | $ 604 | | | | $ 473 | | | | $ 786 | |
| | All-in sustaining costs per ounce | | | 8 | | | | $ 706 | | | | $ 854 | | | | $ 588 | | | | $ 543 | | | | $ 815 | | | | $ 628 | | | | $ 1,105 | |
| | All-in sustaining costs per ounce (on aco-product basis) | | | 8,9 | | | | $ 707 | | | | $ 855 | | | | $ 663 | | | | $ 567 | | | | $ 853 | | | | $ 628 | | | | $ 1,159 | |
| | All-in costs per ounce | | | 8 | | | | $ 728 | | | | $ 1,179 | | | | $ 588 | | | | $ 543 | | | | $ 815 | | | | $ 628 | | | | $ 1,190 | |
| | All-in costs per ounce (on aco-product basis) | | | 8,9 | | | | $ 729 | | | | $ 1,180 | | | | $ 663 | | | | $ 567 | | | | $ 853 | | | | $ 628 | | | | $ 1,244 | |
Revenues include the sale ofby-products for our gold mines and energy sales from the Monte Rio power plant at our Pueblo Viejo mine for the three months and year ended December 31, 2016, of $nil and $33 million, respectively (2015: $14 million and $74 million, respectively; 2014: $88 million).
Non-recurring items in 2016 consist of $34 million in a reduction in cost of sales attributed to insurance proceeds recorded in the third quarter of 2016 relating to the 2015 oxygen plant motor failure at Pueblo Viejo and $10 million in abnormal costs at Veladero relating to the administrative fine in connection with the cyanide incident that occurred in 2015. These gains/costs are not indicative of our cost of production and have been excluded from the calculation of cash costs.
Other adjustments include adding the net margins related to power sales at Pueblo Viejo of $nil and $5 million, respectively (2015: $2 million and $12 million, respectively; 2014: $16 million) and adding the cost of treatment and refining charges of $2 million and $9 million, respectively (2015: $3 million and $8 million, respectively; 2014: $7 million).
| 4 | Exploration and evaluation costs |
Exploration, evaluation and project expenses are presented as minesite sustaining if it supports current mine operations and project if it relates to future projects. Refer to page 45 of this MD&A.
Capital expenditures are related to our gold sites only and are presented on a 100% accrued basis. They are split between minesite sustaining and project capital expenditures. Project capital expenditures are distinct projects designed to increase the net present value of the mine and are not related to current production. Significant projects in the current year are Arturo, Cortez Lower Zone and Lagunas Norte Refractory Ore Project. Refer to page 44 of this MD&A.
| 6 | Rehabilitation - accretion and amortization |
Includes depreciation on the assets related to rehabilitation provisions of our gold operations and accretion on the rehabilitation provision of our gold operations, split between operating andnon-operating sites.
| | | | |
| BARRICK YEAR-END 2016 | | 81 | | MANAGEMENT’S DISCUSSION AND ANALYSIS |
Cost of sales related to gold per ounce is calculated using cost of sales on an attributable basis (removing thenon-controlling interest of 40% Pueblo Viejo and 36.1% Acacia from cost of sales), divided by attributable gold ounces.
Cost of sales per ounce, cash costs per ounce,all-in sustaining costs per ounce andall-in costs per ounce may not calculate based on amounts presented in this table due to rounding.
| 9 | Co-product costs per ounce |
Cash costs per ounce,all-in sustaining costs per ounce andall-in costs per ounce presented on aco-product basis remove the impact ofby-product credits of our gold production (net ofnon-controlling interest) calculated as:
| | | | | | | | | | | | | | | | | | | | | | | | | | | | |
| ($ millions) | | For the three months ended December 31, 2016 | |
| | | | | | | |
| | | Cortez | | | Goldstrike | | | Pueblo Viejo | | | Lagunas Norte | | | Veladero | | | Turquoise Ridge | | | Acacia | |
By-product credits | | | $- | | | | $- | | | | $ 17 | | | | $ 4 | | | | $ 7 | | | | $- | | | | $ 10 | |
Non-controlling interest | | | - | | | | - | | | | (9) | | | | - | | | | - | | | | - | | | | (4) | |
By-product credits (net of non-controlling interest) | | | $- | | | | $- | | | | $ 8 | | | | $ 4 | | | | $ 7 | | | | $- | | | | $ 6 | |
| |
| | | For the three months ended December 31, 2015 | |
| | | | | | | |
| | | Cortez | | | Goldstrike | | | Pueblo Viejo | | | Lagunas Norte | | | Veladero | | | Turquoise Ridge | | | Acacia | |
By-product credits | | | $ 1 | | | | $- | | | | $ 26 | | | | $ 4 | | | | $ 4 | | | | $- | | | | $ 9 | |
Non-controlling interest | | | - | | | | - | | | | (10) | | | | - | | | | - | | | | - | | | | (3) | |
By-product credits (net of non-controlling interest) | | | $ 1 | | | | $- | | | | $ 16 | | | | $ 4 | | | | $ 4 | | | | $- | | | | $ 6 | |
| |
| | | For year ended December 31, 2016 | |
| | | | | | | |
| | | Cortez | | | Goldstrike | | | Pueblo Viejo | | | Lagunas Norte | | | Veladero | | | Turquoise Ridge | | | Acacia | |
By-product credits | | | $- | | | | $ 1 | | | | $ 90 | | | | $ 17 | | | | $ 27 | | | | $- | | | | $ 39 | |
Non-controlling interest | | | - | | | | - | | | | (39) | | | | - | | | | - | | | | - | | | | (14) | |
By-product credits (net of non-controlling interest) | | | $- | | | | $ 1 | | | | $ 51 | | | | $ 17 | | | | $ 27 | | | | $- | | | | $ 25 | |
| |
| | | For the year ended December 31, 2015 | |
| | | | | | | |
| | | Cortez | | | Goldstrike | | | Pueblo Viejo | | | Lagunas Norte | | | Veladero | | | Turquoise Ridge | | | Acacia | |
By-product credits | | | $ 1 | | | | $ 1 | | | | $ 120 | | | | $ 18 | | | | $ 22 | | | | $- | | | | $ 36 | |
Non-controlling interest | | | - | | | | - | | | | (49) | | | | - | | | | - | | | | - | | | | (13) | |
By-product credits (net of non-controlling interest) | | | $ 1 | | | | $ 1 | | | | $ 71 | | | | $ 18 | | | | $ 22 | | | | $- | | | | $ 23 | |
| |
| | | For the year ended December 31, 2014 | |
| | | | | | | |
| | | Cortez | | | Goldstrike | | | Pueblo Viejo | | | Lagunas Norte | | | Veladero | | | Turquoise Ridge | | | Acacia | |
By-product credits | | | $ 1 | | | | $ 1 | | | | $ 163 | | | | $ 14 | | | | $ 28 | | | | $- | | | | $ 45 | |
Non-controlling interest | | | - | | | | - | | | | (64) | | | | - | | | | - | | | | - | | | | (16) | |
By-product credits (net of non-controlling interest) | | | $ 1 | | | | $ 1 | | | | $ 99 | | | | $ 14 | | | | $ 28 | | | | $- | | | | $ 29 | |
| | | | |
| BARRICK YEAR-END 2016 | | 82 | | MANAGEMENT’S DISCUSSION AND ANALYSIS |
Reconciliation of Copper Cost of Sales to C1 cash costs andAll-in sustaining costs, including on a per pound basis
| | | | | | | | | | | | | | | | | | | | |
| ($ millions, except per pound information in dollars) | | For the years ended December 31 | | | For the three months ended December 31 | |
| | | 2016 | | | 2015 | | | 2014 | | | 2016 | | | 2015 | |
Cost of sales | | | $ 319 | | | | $ 814 | | | | $ 954 | | | | $ 84 | | | | $ 116 | |
Depreciation/amortization1 | | | (45) | | | | (104) | | | | (171) | | | | (15) | | | | (23) | |
Treatment and refinement charges | | | 161 | | | | 178 | | | | 120 | | | | 41 | | | | 49 | |
Cash cost of sales applicable to equity method investments2 | | | 209 | | | | 23 | | | | - | | | | 55 | | | | 23 | |
Less: royalties | | | (41) | | | | (101) | | | | (39) | | | | (9) | | | | (16) | |
Non-routine charges | | | - | | | | - | | | | (1) | | | | - | | | | - | |
Other metal sales | | | - | | | | (1) | | | | (1) | | | | - | | | | - | |
Other | | | - | | | | 72 | | | | (27) | | | | - | | | | 72 | |
C1 cash cost of sales | | | $ 603 | | | | $ 881 | | | | $ 835 | | | | $ 156 | | | | $ 221 | |
General & administrative costs | | | 14 | | | | 21 | | | | 40 | | | | 3 | | | | 4 | |
Rehabilitation - accretion and amortization | | | 7 | | | | 6 | | | | 8 | | | | 2 | | | | - | |
Royalties | | | 41 | | | | 101 | | | | 39 | | | | 9 | | | | 16 | |
Minesite exploration and evaluation costs | | | - | | | | - | | | | 1 | | | | - | | | | - | |
Minesite sustaining capital expenditures | | | 169 | | | | 177 | | | | 294 | | | | 48 | | | | 44 | |
Inventory write-downs | | | - | | | | - | | | | 1 | | | | - | | | | - | |
All-in sustaining costs | | | $ 834 | | | | $ 1,186 | | | | $ 1,218 | | | | $ 218 | | | | $ 285 | |
Pounds sold - consolidated basis (millions pounds) | | | 405 | | | | 510 | | | | 435 | | | | 107 | | | | 132 | |
Cost of sales per pound3,4 | | | $ 1.43 | | | | $ 1.65 | | | | $ 2.19 | | | | $ 1.45 | | | | $ 1.09 | |
C1 cash cost per pound3 | | | $ 1.49 | | | | $ 1.73 | | | | $ 1.92 | | | | $ 1.47 | | | | $ 1.66 | |
All-in sustaining costs per pound3 | | | $ 2.05 | | | | $ 2.33 | | | | $ 2.79 | | | | $ 2.04 | | | | $ 2.15 | |
| | 1 | For the year ended December 31, 2016, depreciation excludes $50 million (2015: $6 million; 2014: $nil) of depreciation applicable to equity method investments. |
| | 2 | For the year ended December 31, 2016, figures include $177 million (2015: $23 million; 2014: $nil) of cash costs related to our 50% share of Zaldívar due to the divestment of 50% of our interest in the mine on December 1 , 2015, as well as $32 million (2015: $nil; 2014: $nil) of cash costs related to our 50% share of Jabal Sayid due to the divestment of 50% of our interest in the mine on December 4, 2014 and subsequent accounting as equity method investments. |
| | 3 | Cost of sales per pound, C1 cash costs per pound andall-in sustaining costs per pound may not calculate based on amounts presented in this table due to rounding. |
| | 4 | Cost of sales related to copper per pound is calculated using cost of sales including our proportionate share of cost of sales attributable to equity method investments (Zaldívar and Jabal Sayid), divided by consolidated copper pounds (including our proportionate share of copper pounds from our equity method investments). |
EBITDA and Adjusted EBITDA
EBITDA is anon-GAAP financial measure, which excludes the following from net earnings:
Management believes that EBITDA is a valuable indicator of our ability to generate liquidity by producing operating cash flow to: fund working capital needs, service debt obligations, and fund capital expenditures. Management uses EBITDA for this purpose. EBITDA is also frequently used by investors and analysts for valuation purposes whereby EBITDA is multiplied by a factor or “EBITDA multiple” that is based on an observed or inferred relationship between EBITDA and market values to determine the approximate total enterprise value of a company.
Adjusted EBITDA removes the effect of “impairment charges”. These charges are not reflective of our ability to generate liquidity by producing operating cash flow, and therefore this adjustment will result in a more meaningful valuation measure for investors and analysts to evaluate our performance in the period and assess our future ability to generate liquidity.
EBITDA and adjusted EBITDA are intended to provide additional information to investors and analysts and do not have any standardized definition under IFRS, and should not be considered in isolation or as a substitute for measures of performance prepared in accordance with IFRS. EBITDA and adjusted EBITDA exclude the impact of cash costs of financing activities and taxes, and the effects of changes in operating working capital balances, and therefore are not necessarily indicative of operating profit or cash flow from operations as determined under IFRS. Other companies may calculate EBITDA and adjusted EBITDA differently.
| | | | |
| BARRICK YEAR-END 2016 | | 83 | | MANAGEMENT’S DISCUSSION AND ANALYSIS |
Starting with the third quarter 2016 MD&A, we have presented this reconciliation for each of our reportable operating segments. We believe this additional
information will assist analysts, investors and other stakeholders of Barrick in understanding the details of thesenon-GAAP metrics on asegment-by-segment basis.
Reconciliation of Net Earnings to EBITDA and Adjusted EBITDA
| | | | | | | | | | | | | | | | | | | | |
| | | |
| ($ millions) | | For the years ended December 31 | | | For the three months ended December 31 | |
| | | | | |
| | | 2016 | | | 2015 | | | 2014 | | | 2016 | | | 2015 | |
Net earnings (loss) | | | $ 861 | | | | $ (3,113) | | | | $ (2,959) | | | | $ 512 | | | | $ (2,941) | |
Income tax expense | | | 917 | | | | (31) | | | | 306 | | | | 223 | | | | (361) | |
Finance costs, net1 | | | 725 | | | | 663 | | | | 710 | | | | 200 | | | | 120 | |
Depreciation | | | 1,574 | | | | 1,771 | | | | 1,648 | | | | 418 | | | | 499 | |
EBITDA | | | $ 4,077 | | | | $ (710) | | | | $ (295) | | | | $ 1,353 | | | | $ (2,683) | |
Impairment charges | | | (250) | | | | 3,897 | | | | 4,106 | | | | (304) | | | | 3,405 | |
Adjusted EBITDA | | | $ 3,827 | | | | $ 3,187 | | | | $ 3,811 | | | | $ 1,049 | | | | $ 722 | |
| 1 | Finance costs exclude accretion. |
Reconciliation of Segment Income to Segment EBITDA
| | | | | | | | | | | | | | | | | | | | | | | | | | | | |
| |
| ($ millions) | | For the year ended December 31, 2016 | |
| | | | | | | |
| | | Cortez | | | Goldstrike | | | Pueblo Viejo (60%) | | | Lagunas Norte | | | Veladero | | | Turquoise Ridge | | | Acacia | |
Segment Income | | | $ 340 | | | | $ 442 | | | | $ 528 | | | | $ 260 | | | | $ 220 | | | | $ 166 | | | | $ 299 | |
Depreciation | | | 499 | | | | 307 | | | | 93 | | | | 96 | | | | 118 | | | | 27 | | | | 166 | |
Segment EBITDA | | | $ 839 | | | | $ 749 | | | | $ 621 | | | | $ 356 | | | | $ 338 | | | | $ 193 | | | | $ 465 | |
| |
| | | For the year ended December 31, 2015 | |
| | | Cortez | | | Goldstrike | | | Pueblo Viejo (60%) | | | Lagunas Norte | | | Veladero | | | Turquoise Ridge | | | Acacia | |
Segment Income | | | $ 287 | | | | $ 408 | | | | $ 230 | | | | $ 285 | | | | $ 216 | | | | $ 92 | | | | ($1) | |
| Depreciation | | | 343 | | | | 192 | | | | 160 | | | | 169 | | | | 108 | | | | 23 | | | | 143 | |
| Segment EBITDA | | | $ 630 | | | | $ 600 | | | | $ 390 | | | | $ 454 | | | | $ 324 | | | | $ 115 | | | | $ 142 | |
| |
| | | For the year ended December 31, 2014 | |
| | | Cortez | | | Goldstrike | | | Pueblo Viejo (60%) | | | Lagunas Norte | | | Veladero | | | Turquoise Ridge | | | Acacia | |
Segment Income | | | $ 393 | | | | $ 496 | | | | $ 417 | | | | $ 439 | | | | $ 330 | | | | $ 139 | | | | $ 191 | |
| Depreciation | | | 255 | | | | 132 | | | | 138 | | | | 92 | | | | 116 | | | | 17 | | | | 129 | |
| Segment EBITDA | | | $ 648 | | | | $ 628 | | | | $ 555 | | | | $ 531 | | | | $ 446 | | | | $ 156 | | | | $ 320 | |
| | | | |
| BARRICK YEAR-END 2016 | | 84 | | MANAGEMENT’S DISCUSSION AND ANALYSIS |
Realized Price
Realized price is anon-GAAP financial measure which excludes from sales:
| • | | Unrealized gains and losses onnon-hedge derivative contracts; |
| • | | Unrealizedmark-to-market gains and losses on provisional pricing from copper and gold sales contracts; |
| • | | Sales attributable to ore purchase arrangements; |
| • | | Treatment and refining charges; and |
This measure is intended to enable Management to better understand the price realized in each reporting period for gold and copper sales because unrealizedmark-to-market values ofnon-hedge gold and copper derivatives are subject to change each period due to changes in market factors such as market and forward gold and copper prices so that prices ultimately realized may differ from those recorded. The exclusion of such unrealizedmark-to-market gains and losses from the presentation of this performance measure enables investors to understand performance based on the realized proceeds of selling gold and copper production.
The gains and losses onnon-hedge derivatives and receivable balances relate to instruments/balances that mature in future periods, at which time the gains and
losses will become realized. The amounts of these gains and losses reflect fair values based on market valuation assumptions at the end of each period and do not necessarily represent the amounts that will become realized on maturity. We also exclude export duties that are paid upon sale and netted against revenues as well as treatment and refining charges that are paid to the refiner on gold and copper concentrate sales that are netted against revenues. We believe this provides investors and analysts with a more accurate measure with which to compare to market gold prices and to assess our gold sales performance. For those reasons, management believes that this measure provides a more accurate reflection of our past performance and is a better indicator of its expected performance in future periods.
The realized price measure is intended to provide additional information, and does not have any standardized definition under IFRS and should not be considered in isolation or as a substitute for measures of performance prepared in accordance with IFRS. The measure is not necessarily indicative of sales as determined under IFRS. Other companies may calculate this measure differently. The following table reconciles realized prices to the most directly comparable IFRS measure.
Reconciliation of Sales to Realized Price per ounce/pound
| | | | | | | | | | | | | | | | | | | | | | | | |
| | | For the years ended December 31 | |
| ($ millions, except per ounce/pound information in dollars) | | Gold | | | Copper | |
| | | 2016 | | | 2015 | | | 2014 | | | 2016 | | | 2015 | | | 2014 | |
Sales | | | $ 7,908 | | | | $ 7,813 | | | | $ 8,744 | | | | $ 466 | | | | $ 1,002 | | | | $ 1,224 | |
Sales applicable tonon-controlling interests | | | (948) | | | | (826) | | | | (851) | | | | - | | | | - | | | | - | |
Sales applicable to equity method investments1 | | | - | | | | - | | | | - | | | | 299 | | | | 26 | | | | - | |
Realizednon-hedge gold/copper derivative (losses) gains | | | (2) | | | | - | | | | 1 | | | | - | | | | - | | | | (11) | |
Sales applicable to Pierina2 | | | (112) | | | | - | | | | - | | | | - | | | | - | | | | - | |
Treatment and refinement charges | | | 16 | | | | 14 | | | | 11 | | | | 161 | | | | 178 | | | | 120 | |
Export duties | | | 2 | | | | 34 | | | | 48 | | | | - | | | | - | | | | - | |
Other3 | | | - | | | | - | | | | - | | | | - | | | | - | | | | (17) | |
Revenues - as adjusted | | | $ 6,864 | | | | $ 7,035 | | | | $ 7,953 | | | | $ 926 | | | | $ 1,206 | | | | $ 1,316 | |
Ounces/pounds sold (000s ounces/millions pounds)2 | | | 5,503 | | | | 6,083 | | | | 6,284 | | | | 405 | | | | 510 | | | | 435 | |
Realized gold/copper price per ounce/pound4 | | | $ 1,248 | | | | $ 1,157 | | | | $ 1,265 | | | | $ 2.29 | | | | $ 2.37 | | | | $ 3.03 | |
| 1 | Represents sales of $259 million for the year ended December 31, 2016 (2015: $26 million; 2014: $nil) applicable to our 50% equity method investment in Zaldívar effective December 1, 2015 as well as $40 million (2015: $nil; 2014: $nil) applicable to our 50% equity method investment in Jabal Sayid effective December 3, 2014 and subsequent accounting as equity method investments. |
| 2 | 2016 figures exclude Pierina from the calculation of realized price per ounce as the mine is currently going through closure. |
| 3 | Revenue related to copper cathode purchases made in the second quarter of 2014. |
| 4 | Realized price per ounce/pound may not calculate based on amounts presented in this table due to rounding. |
| | | | |
| BARRICK YEAR-END 2016 | | 85 | | MANAGEMENT’S DISCUSSION AND ANALYSIS |
TECHNICAL INFORMATION
The scientific and technical information contained in this MD&A has been reviewed and approved by Steven Haggarty, P. Eng., Senior Director, Metallurgy of Barrick; Rick Sims, Registered Member SME, Senior Director, Resources and Reserves of Barrick; and Patrick Garretson, Registered Member SME, Senior Director, Life of Mine Planning of Barrick who are each a “Qualified Person” as defined in National Instrument43-101 - Standards of Disclosure for Mineral Projects.
ENDNOTES
| 1 | These arenon-GAAP financial performance measures with no standardized meaning under IFRS and therefore may not be comparable to similar measures presented by other issuers. For further information and a detailed reconciliation of eachnon-GAAP measure to the most directly comparable IFRS measure, please see pages 71 to 85 of this MD&A. |
| 2 | Amount excludes capital leases and includes project financing payments at Pueblo Viejo (60% basis) and Acacia (100% basis). |
| 3 | Includes $943 million cash primarily held at Acacia and Pueblo Viejo, which may not be readily deployed outside of Acacia and/or Pueblo Viejo. |
| 4 | Cost of sales related to gold per ounce is calculated using cost of sales related to gold on an attributable basis (removing thenon-controlling interest of 40% Pueblo Viejo and 36.1% Acacia from cost of sales), divided by attributable gold ounces. Cost of sales related to copper per pound is calculated using cost of sales related to copper including our proportionate share of cost of sales attributable to equity method investments (Zaldívar and Jabal Sayid), divided by consolidated copper pounds (including our proportionate share of copper pounds from our equity method investments). |
| 5 | Total reportable incident frequency rate (TRIFR) is a ratio calculated as follows: number of reportable injuries x 200,000 hours divided by the total number of hours worked. Reportable injuries include fatalities, lost time injuries, restricted duty injuries, and medically treated injuries. |
| 6 | Estimated in accordance with National Instrument 43-101 as required by Canadian securities regulatory authorities. Estimates are as of December 31, 2016, unless otherwise noted. Proven reserves of 480.3 million tonnes grading 1.68 g/t, representing 25.9 million ounces of gold, and 173.3 million tonnes grading 0.533%, representing 2.035 billion pounds of copper. Probable reserves of 1.5 billion tonnes grading 1.22 g/t, representing 60.1 million ounces of gold, and 276 million tonnes grading 0.638%, representing 3.886 billion pounds of copper. Measured resources of 82.9 million tonnes grading 2.52 g/t, representing 6.7 million ounces of gold, and 83.2 million tonnes grading 0.410%, representing 753.4 million pounds of copper. Indicated resources of 1.2 billion tonnes grading 1.74 g/t, representing 68.5 million ounces of gold, and 650.3 million tonnes grading 0.526%, representing 7.545 billion pounds of copper. inferred resources of 781 million tonnes grading 1.22 g/t, representing 30.7 million ounces of gold, and 114.1 million tonnes grading 0.501%, representing 1.259 billion pounds of copper. Complete mineral reserve and mineral resource data for all mines and projects referenced in this press released, including tonnes, grades, and ounces, can be found on pages 88-93 of Barrick’s Fourth Quarter and Year-End 2016 Report. |
| | | | |
| BARRICK YEAR-END 2016 | | 86 | | MANAGEMENT’S DISCUSSION AND ANALYSIS |
GLOSSARY OF TECHNICAL TERMS
ALL-IN SUSTAINING COSTS: A measure of cost per ounce/pound for gold/copper. Refer to page 75 of this MD&A for further information and a reconciliation of the measure.
AUTOCLAVE: Oxidation process in which high temperatures and pressures are applied to convert refractory sulfide mineralization into amenable oxide ore.
BY-PRODUCT: A secondary metal or mineral product recovered in the milling process such as silver.
C1 CASH COSTS: A measure of cost per pound for copper. Refer to page 83 of this MD&A for further information and a reconciliation of the measure.
CASH COSTS: A measure of cost per ounce for gold. Refer to page 75 of this MD&A for further information and a reconciliation of the measure.
CONCENTRATE: A very fine, powder-like product containing the valuable ore mineral from which most of the waste mineral has been eliminated.
CONTAINED OUNCES: Represents ounces in the ground before reduction of ounces not able to be recovered by the applicable metallurgical process.
DEVELOPMENT: Work carried out for the purpose of opening up a mineral deposit. In an underground mine this includes shaft sinking, crosscutting, drifting and raising. In an open pit mine, development includes the removal of overburden.
DILUTION: The effect of waste orlow-grade ore which is unavoidably included in the mined ore, lowering the recovered grade.
DORÉ: Unrefined gold and silver bullion bars usually consisting of approximately 90 percent precious metals that will be further refined to almost pure metal.
DRILLING:
Core: drilling with a hollow bit with a diamond cutting rim to produce a cylindrical core that is used for geological study and assays. Used in mineral exploration.
In-fill: any method of drilling intervals between existing holes, used to provide greater geological detail and to help establish reserve estimates.
EXPLORATION: Prospecting, sampling, mapping, diamond-drilling and other work involved in searching for ore.
FREE CASH FLOW: A measure that reflects our ability to generate cash flow. Refer to page 72 of this MD&A for a definition.
GRADE: The amount of metal in each tonne of ore, expressed as troy ounces per ton or grams per tonne for precious metals and as a percentage for most other metals.
Cut-off grade: the minimum metal grade at which an ore body can be economically mined (used in the calculation of ore reserves).
Mill-head grade: metal content of mined ore going into a mill for processing.
Recovered grade: actual metal content of ore determined after processing.
Reserve grade: estimated metal content of an ore body, based on reserve calculations.
HEAP LEACHING: A process whereby gold/copper is extracted by “heaping” broken ore on sloping impermeable pads and continually applying to the heaps a weak cyanide solution/sulfuric acid which dissolves the contained gold/copper. The gold/copper-laden solution is then collected for gold/copper recovery.
HEAP LEACH PAD: A large impermeable foundation or pad used as a base for ore during heap leaching.
MERRILL-CROWE PROCESS: A separation technique for removing gold from a cyanide solution.
MILL: A processing facility where ore is finely ground and thereafter undergoes physical or chemical treatment to extract the valuable metals.
MINERAL RESERVE: See pages 88 to 93 – Summary Gold/ Copper Mineral Reserves and Mineral Resources.
MINERAL RESOURCE: See pages 88 to 93 – Summary Gold/Copper Mineral Reserves and Mineral Resources.
MINING RATE: Tonnes of ore mined per day or even specified time period.
OPEN PIT: A mine where the minerals are mined entirely from the surface.
ORE: Rock, generally containing metallic or non–metallic minerals, which can be mined and processed at a profit.
ORE BODY: A sufficiently large amount of ore that can be mined economically.
OUNCES: Troy ounces of a fineness of 999.9 parts per 1,000 parts.
RECLAMATION: The process by which lands disturbed as a result of mining activity are modified to support beneficial land use. Reclamation activity may include the removal of buildings, equipment, machinery and other physical remnants of mining, closure of tailings storage facilities, leach pads and other mine features, and contouring, covering and re–vegetation of waste rock and other disturbed areas.
RECOVERY RATE: A term used in process metallurgy to indicate the proportion of valuable material physically recovered in the processing of ore. It is generally stated as a percentage of the material recovered compared to the total material originally present.
REFINING: The final stage of metal production in which impurities are removed from the molten metal.
STRIPPING: Removal of overburden or waste rock overlying an ore body in preparation for mining by open pit methods. Expressed as the total number of tonnes mined or to be mined for each ounce of gold or pound of copper.
TAILINGS: The material that remains after all economically and technically recoverable precious metals have been removed from the ore during processing.
| | | | |
| BARRICK YEAR-END 2016 | | 87 | | MANAGEMENT’S DISCUSSION AND ANALYSIS |
GOLD MINERAL RESERVES(1,2)
| | | | | | | | | | | | | | | | | | | | | | | | | | | | | | | | | | | | | | | | | | | | |
| As at December 31, 2016 | | PROVEN | | | | | | PROBABLE | | | | | | TOTAL | |
| Based on attributable ounces | | Tonnes
(000’s) | | | Grade
(gm/t) | | | Contained ozs
(000’s) | | | | | | Tonnes
(000’s) | | | Grade
(gm/t) | | | Contained ozs
(000’s) | | | | | | Tonnes
(000’s) | | | Grade
(gm/t) | | | Contained ozs
(000’s) | |
NORTH AMERICA | | | | | | | | | | | | | | | | | | | | | | | | | | | | | | | | | | | | | | | | | | | | |
Goldstrike Open Pit | | | 54,473 | | | | 2.86 | | | | 5,012 | | | | | | | | 10,527 | | | | 3.72 | | | | 1,259 | | | | | | | | 65,000 | | | | 3.00 | | | | 6,271 | |
Goldstrike Underground | | | 2,996 | | | | 11.11 | | | | 1,070 | | | | | | | | 2,689 | | | | 8.51 | | | | 736 | | | | | | | | 5,685 | | | | 9.88 | | | | 1,806 | |
Goldstrike Property Total | | | 57,469 | | | | 3.29 | | | | 6,082 | | | | | | | | 13,216 | | | | 4.70 | | | | 1,995 | | | | | | | | 70,685 | | | | 3.55 | | | | 8,077 | |
Pueblo Viejo (60.00%) | | | 60,668 | | | | 2.82 | | | | 5,505 | | | | | | | | 25,153 | | | | 3.19 | | | | 2,582 | | | | | | | | 85,821 | | | | 2.93 | | | | 8,087 | |
Cortez | | | 16,196 | | | | 1.52 | | | | 793 | | | | | | | | 134,806 | | | | 2.18 | | | | 9,427 | | | | | | | | 151,002 | | | | 2.11 | | | | 10,220 | |
Turquoise Ridge (75.00%) | | | 4,288 | | | | 15.54 | | | | 2,143 | | | | | | | | 4,003 | | | | 14.65 | | | | 1,886 | | | | | | | | 8,291 | | | | 15.11 | | | | 4,029 | |
South Arturo (60.00%) | | | 851 | | | | 3.95 | | | | 108 | | | | | | | | 129 | | | | 3.38 | | | | 14 | | | | | | | | 980 | | | | 3.87 | | | | 122 | |
Hemlo | | | 1,018 | | | | 3.64 | | | | 119 | | | | | | | | 24,764 | | | | 1.85 | | | | 1,469 | | | | | | | | 25,782 | | | | 1.92 | | | | 1,588 | |
Golden Sunlight | | | 288 | | | | 1.30 | | | | 12 | | | | | | | | 539 | | | | 3.40 | | | | 59 | | | | | | | | 827 | | | | 2.67 | | | | 71 | |
SOUTH AMERICA | | | | | | | | | | | | | | | | | | | | | | | | | | | | | | | | | | | | | | | | | | | | |
Cerro Casale (75.00%) | | | 172,276 | | | | 0.65 | | | | 3,586 | | | | | | | | 725,926 | | | | 0.59 | | | | 13,848 | | | | | | | | 898,202 | | | | 0.60 | | | | 17,434 | |
Pascua-Lama | | | 29,247 | | | | 1.94 | | | | 1,828 | | | | | | | | 248,623 | | | | 1.53 | | | | 12,222 | | | | | | | | 277,870 | | | | 1.57 | | | | 14,050 | |
Veladero | | | 23,986 | | | | 0.78 | | | | 602 | | | | | | | | 228,139 | | | | 0.84 | | | | 6,147 | | | | | | | | 252,125 | | | | 0.83 | | | | 6,749 | |
Lagunas Norte | | | 26,322 | | | | 1.83 | | | | 1,548 | | | | | | | | 44,348 | | | | 1.87 | | | | 2,670 | | | | | | | | 70,670 | | | | 1.86 | | | | 4,218 | |
AUSTRALIA PACIFIC | | | | | | | | | | | | | | | | | | | | | | | | | | | | | | | | | | | | | | | | | | | | |
Porgera (47.50%) | | | 444 | | | | 12.26 | | | | 175 | | | | | | | | 14,011 | | | | 4.51 | | | | 2,032 | | | | | | | | 14,455 | | | | 4.75 | | | | 2,207 | |
Kalgoorlie (50.00%) | | | 72,472 | | | | 0.94 | | | | 2,193 | | | | | | | | 27,601 | | | | 2.19 | | | | 1,947 | | | | | | | | 100,073 | | | | 1.29 | | | | 4,140 | |
AFRICA | | | | | | | | | | | | | | | | | | | | | | | | | | | | | | | | | | | | | | | | | | | | |
Bulyanhulu (63.90%) | | | 1,464 | | | | 10.52 | | | | 495 | | | | | | | | 12,494 | | | | 6.91 | | | | 2,776 | | | | | | | | 13,958 | | | | 7.29 | | | | 3,271 | |
North Mara (63.90%) | | | 4,683 | | | | 3.25 | | | | 489 | | | | | | | | 10,519 | | | | 2.13 | | | | 720 | | | | | | | | 15,202 | | | | 2.47 | | | | 1,209 | |
Buzwagi (63.90%) | | | 5,798 | | | | 0.95 | | | | 178 | | | | | | | | 3,826 | | | | 1.74 | | | | 214 | | | | | | | | 9,624 | | | | 1.27 | | | | 392 | |
Jabal Sayid (50.00%) | | | 2,855 | | | | 0.26 | | | | 24 | | | | | | | | 8,476 | | | | 0.23 | | | | 62 | | | | | | | | 11,331 | | | | 0.24 | | | | 86 | |
| | | | | | | | | | | |
TOTAL | | | 480,325 | | | | 1.68 | | | | 25,880 | | | | | | | | 1,526,573 | | | | 1.22 | | | | 60,070 | | | | | | | | 2,006,898 | | | | 1.33 | | | | 85,950 | |
COPPER MINERAL RESERVES(1,2) | | | | | | | | | | | | | | | | | | | | | | | | | | | | | | | | | |
| | | | | |
| As at December 31, 2016 | | PROVEN | | | | | | PROBABLE | | | | | | TOTAL | |
| Based on attributable pounds | | Tonnes
(000’s) | | | Grade
(%) | | | Contained lbs
(millions) | | | | | | Tonnes
(000’s) | | | Grade
(%) | | | Contained lbs
(millions) | | | | | | Tonnes
(000’s) | | | Grade
(%) | | | Contained lbs
(millions) | |
Zaldivar (50.00%) | | | 142,666 | | | | 0.501 | | | | 1,575.1 | | | | | | | | 87,736 | | | | 0.535 | | | | 1,035.0 | | | | | | | | 230,402 | | | | 0.514 | | | | 2,610.1 | |
Lumwana | | | 27,786 | | | | 0.516 | | | | 315.8 | | | | | | | | 179,860 | | | | 0.597 | | | | 2,367.9 | | | | | | | | 207,646 | | | | 0.586 | | | | 2,683.7 | |
Jabal Sayid (50.00%) | | | 2,855 | | | | 2.289 | | | | 144.1 | | | | | | | | 8,476 | | | | 2.585 | | | | 483.0 | | | | | | | | 11,331 | | | | 2.510 | | | | 627.1 | |
TOTAL | | | 173,307 | | | | 0.533 | | | | 2,035.0 | | | | | | | | 276,072 | | | | 0.638 | | | | 3,885.9 | | | | | | | | 449,379 | | | | 0.598 | | | | 5,920.9 | |
| (1) | See accompanying endnote #1. |
| (2) | See accompanying endnote #2. |
GOLD MINERAL RESOURCES(1,2)
| | | | | | | | | | | | | | | | | | | | | | | | | | | | | | | | | | | | | | | | |
| As at December 31, 2016 | | MEASURED (M) | | | INDICATED (I) | | | (M) + (I) | | | INFERRED | |
| | | | | | | | | | | | | |
| Based on attributable ounces | | Tonnes (000’s) | | | Grade (gm/t) | | | Contained ozs (000’s) | | | Tonnes (000’s) | | | Grade (gm/t) | | | Contained ozs (000’s) | | | Contained ozs
(000’s) | | | Tonnes (000’s) | | | Grade (gm/t) | | | Contained ozs (000’s) | |
| | | | | | | | | | | | | |
NORTH AMERICA | | | | | | | | | | | | | | | | | | | | | | | | | | | | | | | | | | | | | | | | |
Goldstrike Open Pit | | | 1,329 | | | | 2.74 | | | | 117 | | | | 3,896 | | | | 2.63 | | | | 330 | | | | 447 | | | | 81 | | | | 1.92 | | | | 5 | |
Goldstrike Underground | | | 984 | | | | 11.73 | | | | 371 | | | | 2,022 | | | | 9.81 | | | | 638 | | | | 1,009 | | | | 1,064 | | | | 10.06 | | | | 344 | |
Goldstrike Property Total | | | 2,313 | | | | 6.56 | | | | 488 | | | | 5,918 | | | | 5.09 | | | | 968 | | | | 1,456 | | | | 1,145 | | | | 9.48 | | | | 349 | |
Pueblo Viejo (60.00%) | | | 10,183 | | | | 2.33 | | | | 764 | | | | 95,459 | | | | 2.33 | | | | 7,146 | | | | 7,910 | | | | 2,845 | | | | 2.04 | | | | 187 | |
Cortez | | | 2,199 | | | | 2.04 | | | | 144 | | | | 29,137 | | | | 2.13 | | | | 1,999 | | | | 2,143 | | | | 14,506 | | | | 1.64 | | | | 763 | |
Goldrush | | | 161 | | | | 10.43 | | | | 54 | | | | 30,837 | | | | 9.60 | | | | 9,522 | | | | 9,576 | | | | 7,343 | | | | 8.18 | | | | 1,931 | |
Turquoise Ridge (75.00%) | | | 13,426 | | | | 6.97 | | | | 3,009 | | | | 37,364 | | | | 5.39 | | | | 6,476 | | | | 9,485 | | | | 15,979 | | | | 6.34 | | | | 3,257 | |
South Arturo (60.00%) | | | 7 | | | | 1.33 | | | | 0.3 | | | | 22 | | | | 1.41 | | | | 1 | | | | 1.3 | | | | 6 | | | | 5.18 | | | | 1 | |
Hemlo | | | 126 | | | | 2.72 | | | | 11 | | | | 58,771 | | | | 0.90 | | | | 1,709 | | | | 1,720 | | | | 7,765 | | | | 1.94 | | | | 484 | |
Golden Sunlight | | | 825 | | | | 1.51 | | | | 40 | | | | 14,320 | | | | 1.37 | | | | 631 | | | | 671 | | | | 5,123 | | | | 1.32 | | | | 218 | |
Donlin Gold (50.00%) | | | 3,865 | | | | 2.52 | | | | 313 | | | | 266,803 | | | | 2.24 | | | | 19,190 | | | | 19,503 | | | | 46,108 | | | | 2.02 | | | | 2,997 | |
SOUTH AMERICA | | | | | | | | | | | | | | | | | | | | | | | | | | | | | | | | | | | | | | | | |
Cerro Casale (75.00%) | | | 17,217 | | | | 0.30 | | | | 167 | | | | 205,268 | | | | 0.36 | | | | 2,362 | | | | 2,529 | | | | 371,580 | | | | 0.38 | | | | 4,493 | |
Pascua-Lama | | | 13,562 | | | | 1.69 | | | | 736 | | | | 143,111 | | | | 1.43 | | | | 6,561 | | | | 7,297 | | | | 15,400 | | | | 1.74 | | | | 863 | |
Veladero | | | 7,637 | | | | 0.48 | | | | 118 | | | | 204,698 | | | | 0.48 | | | | 3,185 | | | | 3,303 | | | | 21,389 | | | | 0.33 | | | | 229 | |
Lagunas Norte | | | 3,253 | | | | 0.65 | | | | 68 | | | | 54,192 | | | | 0.63 | | | | 1,100 | | | | 1,168 | | | | 3,946 | | | | 0.71 | | | | 90 | |
Alturas | | | - | | | | - | | | | - | | | | - | | | | - | | | | - | | | | - | | | | 210,965 | | | | 1.00 | | | | 6,793 | |
AUSTRALIA PACIFIC | | | | | | | | | | | | | | | | | | | | | | | | | | | | | | | | | | | | | | | | |
Porgera (47.50%) | | | 168 | | | | 5.92 | | | | 32 | | | | 13,607 | | | | 4.05 | | | | 1,770 | | | | 1,802 | | | | 13,528 | | | | 3.39 | | | | 1,476 | |
Kalgoorlie (50.00%) | | | 3,123 | | | | 0.67 | | | | 67 | | | | 10,991 | | | | 0.95 | | | | 335 | | | | 402 | | | | 553 | | | | 2.47 | | | | 44 | |
AFRICA | | | | | | | | | | | | | | | | | | | | | | | | | | | | | | | | | | | | | | | | |
Bulyanhulu (63.90%) | | | 874 | | | | 11.53 | | | | 324 | | | | 8,011 | | | | 8.62 | | | | 2,220 | | | | 2,544 | | | | 15,469 | | | | 9.75 | | | | 4,848 | |
North Mara (63.90%) | | | 2,174 | | | | 2.66 | | | | 186 | | | | 10,714 | | | | 2.30 | | | | 793 | | | | 979 | | | | 6,703 | | | | 2.51 | | | | 540 | |
Buzwagi (63.90%) | | | 83 | | | | 1.50 | | | | 4 | | | | 16,449 | | | | 1.23 | | | | 650 | | | | 654 | | | | 1,315 | | | | 1.37 | | | | 58 | |
Nyanzaga (57.51%) | | | 1,685 | | | | 3.78 | | | | 205 | | | | 12,520 | | | | 3.45 | | | | 1,389 | | | | 1,594 | | | | 2,933 | | | | 3.49 | | | | 329 | |
Golden Ridge (63.90%) | | | - | | | | - | | | | - | | | | 5,076 | | | | 2.78 | | | | 454 | | | | 454 | | | | 904 | | | | 2.27 | | | | 66 | |
Tankoro (31.95%) | | | - | | | | - | | | | - | | | | - | | | | - | | | | - | | | | - | | | | 13,739 | | | | 1.52 | | | | 671 | |
Jabal Sayid (50.00%) | | | 57 | | | | - | | | | - | | | | 3,125 | | | | 0.60 | | | | 60 | | | | 60 | | | | 1,765 | | | | 0.42 | | | | 24 | |
| | | | | | | | | | | | | | | | |
| | | | | | | | | | |
TOTAL | | | 82,938 | | | | 2.52 | | | | 6,730 | | | | 1,226,393 | | | | 1.74 | | | | 68,521 | | | | 75,251 | | | | 781,009 | | | | 1.22 | | | | 30,711 | |
| | | | | | | | | | | | | |
|
| COPPER MINERAL RESOURCES(1,2) | |
| As at December 31, 2016 | | MEASURED (M) | | | INDICATED (I) | | | (M) + (I) | | | INFERRED | |
| | | | | | | | | | | | | |
| Based on attributable pounds | | Tonnes (000’s) | | | Grade (%) | | | Contained lbs (millions) | | | Tonnes (000’s) | | | Grade (%) | | | Contained lbs (millions) | | | Contained lbs
(millions) | | | Tonnes (000’s) | | | Grade (%) | | | Contained lbs (millions) | |
| | | | | | | | | | | | | |
Zaldivar (50.00%) | | | 58,039 | | | | 0.410 | | | | 524.9 | | | | 22,354 | | | | 0.399 | | | | 196.7 | | | | 721.6 | | | | 4,062 | | | | 0.529 | | | | 47.4 | |
Lumwana | | | 25,154 | | | | 0.409 | | | | 226.8 | | | | 624,826 | | | | 0.522 | | | | 7,191.8 | | | | 7,418.6 | | | | 108,266 | | | | 0.468 | | | | 1,116.3 | |
Jabal Sayid (50.00%) | | | 57 | | | | 1.353 | | | | 1.7 | | | | 3,125 | | | | 2.277 | | | | 156.9 | | | | 158.6 | | | | 1,765 | | | | 2.454 | | | | 95.5 | |
| | | | | | | | | | |
TOTAL | | | 83,250 | | | | 0.410 | | | | 753.4 | | | | 650,305 | | | | 0.526 | | | | 7,545.4 | | | | 8,299 | | | | 114,093 | | | | 0.501 | | | | 1,259.2 | |
| | | | | | | | | | | | | |
| (1) | Resources which are not reserves do not have demonstrated economic viability. |
| (2) | See accompanying endnote #1. |
SUMMARY GOLD MINERAL RESERVES AND MINERAL RESOURCES(1,2,3,4)
| | | | | | | | | | | | | | | | | | | | | | | | | | |
For the year ended December 31, 2016 | | | | | 2016 | | | | 2015 | |
Based on attributable ounces | | | |
| Tonnes
(000’s) |
| |
| Grade
(gm/t) |
| |
| Ounces
(000’s) |
| |
| Tonnes
(000’s) |
| |
| Grade
(gm/t) |
| |
| Ounces
(000’s) |
|
NORTH AMERICA | | | | | | | | | | | | | | | | | | | | | | | | | | |
Goldstrike Open Pit | | (proven and probable) | | | 65,000 | | | | 3.00 | | | | 6,271 | | | | 69,073 | | | | 3.11 | | | | 6,911 | |
| | | (mineral resource) | | | 5,225 | | | | 2.66 | | | | 447 | | | | 5,116 | | | | 2.46 | | | | 404 | |
Goldstrike Underground | | (proven and probable) | | | 5,685 | | | | 9.88 | | | | 1,806 | | | | 4,952 | | | | 10.23 | | | | 1,628 | |
| | | (mineral resource) | | | 3,006 | | | | 10.44 | | | | 1,009 | | | | 4,107 | | | | 10.47 | | | | 1,382 | |
Goldstrike Property Total | | (proven and probable) | | | 70,685 | | | | 3.55 | | | | 8,077 | | | | 74,025 | | | | 3.59 | | | | 8,539 | |
| | | (mineral resource) | | | 8,231 | | | | 5.50 | | | | 1,456 | | | | 9,223 | | | | 6.02 | | | | 1,786 | |
Pueblo Viejo (60.00%) | | (proven and probable) | | | 85,821 | | | | 2.93 | | | | 8,087 | | | | 93,877 | | | | 2.97 | | | | 8,960 | |
| | | (mineral resource) | | | 105,642 | | | | 2.33 | | | | 7,910 | | | | 97,881 | | | | 2.46 | | | | 7,731 | |
Cortez | | (proven and probable) | | | 151,002 | | | | 2.11 | | | | 10,220 | | | | 153,232 | | | | 2.26 | | | | 11,129 | |
| | | (mineral resource) | | | 31,336 | | | | 2.13 | | | | 2,143 | | | | 43,709 | | | | 1.53 | | | | 2,150 | |
Goldrush | | (proven and probable) | | | - | | | | - | | | | - | | | | - | | | | - | | | | - | |
| | | (mineral resource) | | | 30,998 | | | | 9.61 | | | | 9,576 | | | | 25,166 | | | | 10.58 | | | | 8,557 | |
Bald Mountain (0.00%)5 | | (proven and probable) | | | - | | | | - | | | | - | | | | 49,083 | | | | 0.72 | | | | 1,142 | |
| | | (mineral resource) | | | - | | | | - | | | | - | | | | 172,472 | | | | 0.67 | | | | 3,698 | |
Turquoise Ridge (75.00%) | | (proven and probable) | | | 8,291 | | | | 15.11 | | | | 4,029 | | | | 8,564 | | | | 15.30 | | | | 4,214 | |
| | | (mineral resource) | | | 50,790 | | | | 5.81 | | | | 9,485 | | | | 74,989 | | | | 4.74 | | | | 11,426 | |
Round Mountain (0.00%)5 | | (proven and probable) | | | - | | | | - | | | | - | | | | 33,072 | | | | 0.69 | | | | 736 | |
| | | (mineral resource) | | | - | | | | - | | | | - | | | | 21,079 | | | | 0.50 | | | | 342 | |
South Arturo (60.00%) | | (proven and probable) | | | 980 | | | | 3.87 | | | | 122 | | | | 1,289 | | | | 5.62 | | | | 233 | |
| | | (mineral resource) | | | 29 | | | | 1.07 | | | | 1 | | | | 158 | | | | 1.38 | | | | 7 | |
Hemlo | | (proven and probable) | | | 25,782 | | | | 1.92 | | | | 1,588 | | | | 13,191 | | | | 2.16 | | | | 917 | |
| | | (mineral resource) | | | 58,897 | | | | 0.91 | | | | 1,720 | | | | 42,746 | | | | 1.06 | | | | 1,451 | |
Golden Sunlight | | (proven and probable) | | | 827 | | | | 2.67 | | | | 71 | | | | 1,054 | | | | 2.18 | | | | 74 | |
| | | (mineral resource) | | | 15,145 | | | | 1.38 | | | | 671 | | | | 14,806 | | | | 1.45 | | | | 691 | |
Donlin Gold (50.00%) | | (proven and probable) | | | - | | | | - | | | | - | | | | - | | | | - | | | | - | |
| | | (mineral resource) | | | 270,668 | | | | 2.24 | | | | 19,503 | | | | 270,668 | | | | 2.24 | | | | 19,503 | |
SOUTH AMERICA | | | | | | | | | - | | | | | | | | | | | | - | | | | | |
Cerro Casale (75.00%) | | (proven and probable) | | | 898,202 | | | | 0.60 | | | | 17,434 | | | | 898,202 | | | | 0.60 | | | | 17,434 | |
| | | (mineral resource) | | | 222,485 | | | | 0.35 | | | | 2,529 | | | | 222,485 | | | | 0.35 | | | | 2,529 | |
Pascua-Lama | | (proven and probable) | | | 277,870 | | | | 1.57 | | | | 14,050 | | | | 324,626 | | | | 1.47 | | | | 15,384 | |
| | | (mineral resource) | | | 156,673 | | | | 1.45 | | | | 7,297 | | | | 157,465 | | | | 1.28 | | | | 6,459 | |
Veladero | | (proven and probable) | | | 252,125 | | | | 0.83 | | | | 6,749 | | | | 276,933 | | | | 0.85 | | | | 7,544 | |
| | | (mineral resource) | | | 212,335 | | | | 0.48 | | | | 3,303 | | | | 75,228 | | | | 0.53 | | | | 1,287 | |
Lagunas Norte | | (proven and probable) | | | 70,670 | | | | 1.86 | | | | 4,218 | | | | 63,641 | | | | 1.82 | | | | 3,729 | |
| | | (mineral resource) | | | 57,445 | | | | 0.63 | | | | 1,168 | | | | 37,553 | | | | 1.36 | | | | 1,644 | |
AUSTRALIA PACIFIC | | | | | | | | | - | | | | | | | | | | | | - | | | | | |
Porgera (47.50%)6 | | (proven and probable) | | | 14,455 | | | | 4.75 | | | | 2,207 | | | | 14,471 | | | | 4.24 | | | | 1,971 | |
| | | (mineral resource) | | | 13,775 | | | | 4.07 | | | | 1,802 | | | | 9,444 | | | | 5.47 | | | | 1,660 | |
Kalgoorlie (50.00%) | | (proven and probable) | | | 100,073 | | | | 1.29 | | | | 4,140 | | | | 100,838 | | | | 1.28 | | | | 4,154 | |
| | | (mineral resource) | | | 14,114 | | | | 0.89 | | | | 402 | | | | 15,450 | | | | 0.88 | | | | 439 | |
AFRICA | | | | | | | | | - | | | | | | | | | | | | - | | | | | |
Bulyanhulu (63.90%) | | (proven and probable) | | | 13,958 | | | | 7.29 | | | | 3,271 | | | | 17,488 | | | | 6.99 | | | | 3,930 | |
| | | (mineral resource) | | | 8,885 | | | | 8.91 | | | | 2,544 | | | | 14,159 | | | | 7.03 | | | | 3,201 | |
North Mara (63.90%) | | (proven and probable) | | | 15,202 | | | | 2.47 | | | | 1,209 | | | | 14,685 | | | | 2.67 | | | | 1,262 | |
| | | (mineral resource) | | | 12,888 | | | | 2.36 | | | | 979 | | | | 8,099 | | | | 2.66 | | | | 692 | |
Buzwagi (63.90%) | | (proven and probable) | | | 9,624 | | | | 1.27 | | | | 392 | | | | 9,382 | | | | 1.32 | | | | 399 | |
| | | (mineral resource) | | | 16,532 | | | | 1.23 | | | | 654 | | | | 28,213 | | | | 1.35 | | | | 1,221 | |
Nyanzaga (57.51%) | | (proven and probable) | | | - | | | | - | | | | - | | | | - | | | | - | | | | - | |
| | | (mineral resource) | | | 14,205 | | | | 3.49 | | | | 1,594 | | | | 62,208 | | | | 1.31 | | | | 2,621 | |
Golden Ridge (63.90%) | | (proven and probable) | | | - | | | | - | | | | - | | | | - | | | | - | | | | - | |
| | | (mineral resource) | | | 5,076 | | | | 2.78 | | | | 454 | | | | - | | | | - | | | | - | |
OTHER | | (proven and probable) | | | 11,331 | | | | 0.24 | | | | 86 | | | | 12,496 | | | | 0.27 | | | | 107 | |
| | | (mineral resource) | | | 3,182 | | | | 0.59 | | | | 60 | | | | 19 | | | | - | | | | - | |
TOTAL | | (proven and probable) | | | 2,006,898 | | | | 1.33 | | | | 85,950 | | | | 2,160,149 | | | | 1.32 | | | | 91,858 | |
| | | (mineral resource) | | | 1,309,331 | | | | 1.79 | | | | 75,251 | | | | 1,403,220 | | | | 1.75 | | | | 79,095 | |
| (1) | Resources which are not reserves do not have demonstrated economic viability. |
| (2) | See accompanying endnote #1. |
| (3) | Measured plus indicated resources |
| (4) | See accompanying endnote #2. |
| (5) | See accompanying endnote #3. |
| (6) | See accompanying endnote #4. |
CONTAINED SILVER WITHIN REPORTED GOLD RESERVES(1)
| | | | | | | | | | | | | | | | | | | | | | | | | | | | | | | | | | | | | | | | | | | | |
| For the year ended Dec. 31, 2016 | | IN PROVEN GOLD RESERVES | | | | | | IN PROBABLE GOLD RESERVES | | | TOTAL | |
| | | | | | | | | | | | | |
| | | | | | | | | | | |
Based on attributable ounces | |
| Tonnes
(000s) |
| |
| Grade
(gm/t) |
| |
| Contained ozs
(000s) |
| | | | | |
| Tonnes
(000s) |
| |
| Grade
(gm/t) |
| |
| Contained ozs
(000s) |
| |
| Tonnes
(000s) |
| |
| Grade
(gm/t) |
| |
| Contained ozs
(000s) |
| |
| Process recovery
%
|
|
| | | | | | | | | | | | | |
NORTH AMERICA | | | | | | | | | | | | | | | | | | | | | | | | | | | | | | | | | | | | | | | | | | | | |
Pueblo Viejo (60.00%) | | | 60,668 | | | | 18.678 | | | | 36,432 | | | | | | | | 25,153 | | | | 14.07 | | | | 11,377 | | | | 85,821 | | | | 17.33 | | | | 47,809 | | | | 80.0% | |
SOUTH AMERICA | | | | | | | | | | | | | | | | | | | | | | | | | | | | | | | | | | | | | | | | | | | | |
Cerro Casale (75.00%) | | | 172,276 | | | | 1.907 | | | | 10,565 | | | | | | | | 725,926 | | | | 1.43 | | | | 33,451 | | | | 898,202 | | | | 1.52 | | | | 44,016 | | | | 69.0% | |
Pascua-Lama | | | 29,247 | | | | 70.342 | | | | 66,143 | | | | | | | | 248,623 | | | | 67.64 | | | | 540,657 | | | | 277,870 | | | | 67.92 | | | | 606,800 | | | | 82.0% | |
Lagunas Norte | | | 26,322 | | | | 3.686 | | | | 3,119 | | | | | | | | 44,348 | | | | 5.74 | | | | 8,180 | | | | 70,670 | | | | 4.97 | | | | 11,299 | | | | 31.5% | |
Veladero | | | 23,986 | | | | 7.714 | | | | 5,949 | | | | | | | | 228,139 | | | | 14.81 | | | | 108,602 | | | | 252,125 | | | | 14.13 | | | | 114,551 | | | | 9.8% | |
AFRICA | | | | | | | | | | | | | | | | | | | | | | | | | | | | | | | | | | | | | | | | | | | | |
Bulyanhulu (63.90%)2 | | | 1,464 | | | | 6.05 | | | | 285 | | | | | | | | 8,544 | | | | 8.46 | | | | 2,325 | | | | 10,008 | | | | 8.11 | | | | 2,610 | | | | 65.0% | |
| | | | | | | | | | | | | |
TOTAL | | | 313,963 | | | | 12.14 | | | | 122,493 | | | | | | | | 1,280,733 | | | | 17.11 | | | | 704,592 | | | | 1,594,696 | | | | 16.13 | | | | 827,085 | | | | 70.4% | |
| | | | | | | | | | | | | |
| (1)Silver is accounted for as aby-product credit against reported or projected gold production costs. | |
|
| CONTAINED COPPER WITHIN REPORTED GOLD RESERVES(1) | |
For the year ended Dec. 31, 2016 | | | IN PROVEN GOLD RESERVES | | | | | | | | IN PROBABLE GOLD RESERVES | | | | TOTAL | |
| | | | | | | | | | | | | |
| | | | | | | | | | | |
Based on attributable pounds | |
| Tonnes
(000s) |
| |
| Grade
(%) |
| |
| Contained lbs
(millions) |
| | | | | |
| Tonnes
(000s) |
| |
| Grade
(%) |
| |
| Contained lbs
(millions) |
| |
| Tonnes
(000s) |
| |
| Grade
(%) |
| |
| Contained lbs
(millions) |
| |
| Process recovery
%
|
|
| | | | | | | | | | | | | |
NORTH AMERICA | | | | | | | | | | | | | | | | | | | | | | | | | | | | | | | | | | | | | | | | | | | | |
Pueblo Viejo (60.00%) | | | 60,668 | | | | 0.093 | | | | 124.9 | | | | | | | | 25,153 | | | | 0.100 | | | | 55.3 | | | | 85,821 | | | | 0.095 | | | | 180.2 | | | | 47.6% | |
| | | | | | | | | | | | | |
SOUTH AMERICA | | | | | | | | | | | | | | | | | | | | | | | | | | | | | | | | | | | | | | | | | | | | |
Cerro Casale (75.00%) | | | 172,276 | | | | 0.190 | | | | 721.3 | | | | | | | | 725,926 | | | | 0.226 | | | | 3,613.3 | | | | 898,202 | | | | 0.219 | | | | 4,334.6 | | | | 87.4% | |
Pascua-Lama | | | 29,247 | | | | 0.101 | | | | 65.0 | | | | | | | | 248,623 | | | | 0.080 | | | | 440.3 | | | | 277,870 | | | | 0.082 | | | | 505.3 | | | | 29.9% | |
| | | | | | | | | | | | | |
AFRICA | | | | | | | | | | | | | | | | | | | | | | | | | | | | | | | | | | | | | | | | | | | | |
Bulyanhulu (63.90%)2 | | | 1,464 | | | | 0.431 | | | | 13.9 | | | | | | | | 8,544 | | | | 0.565 | | | | 106.4 | | | | 10,008 | | | | 0.545 | | | | 120.3 | | | | 90.0% | |
Buzwagi (63.90%) | | | 5,798 | | | | 0.070 | | | | 9.0 | | | | | | | | 3,826 | | | | 0.140 | | | | 11.8 | | | | 9,624 | | | | 0.098 | | | | 20.8 | | | | 64.9% | |
| | | | | | | | | | | | | |
TOTAL | | | 269,453 | | | | 0.157 | | | | 934.1 | | | | | | | | 1,012,072 | | | | 0.189 | | | | 4,227.1 | | | | 1,281,525 | | | | 0.183 | | | | 5,161.2 | | | | 80.4% | |
| | | | | | | | | | | | | |
(1)Copper is accounted for as aby-product credit against reported or projected gold production costs.
(2) See accompanying endnote #5.
CONTAINED SILVER WITHIN REPORTED GOLD RESOURCES(1)
| | | | | | | | | | | | | | | | | | | | | | | | | | | | | | | | | | | | | | | | | | | | | | | | | | | | |
For the year ended Dec. 31, 2016 | | | MEASURED (M) | | | | | | | | INDICATED (I) | | | | | | | | (M) + (I) | | | | | | | | INFERRED | |
Based on attributable ounces | |
| Tonnes
(000’s |
) | |
| Grade
(gm/t |
) | |
| Contained ozs
(000’s |
) | | | | | |
| Tonnes
(000’s |
) | |
| Grade
(gm/t |
) | |
| Contained ozs
(000’s |
) | | | | | |
| Ounces
(000’s |
) | | | | | |
| Tonnes
(000’s |
) | |
| Grade
(gm/t |
) | |
| Contained ozs
(000’s |
) |
NORTH AMERICA | | | | | | | | | | | | | | | | | | | | | | | | | | | | | | | | | | | | | | | | | | | | | | | | | | | | |
Pueblo Viejo (60.00%) | | | 10,183 | | | | 14.53 | | | | 4,758 | | | | | | | | 95,459 | | | | 11.22 | | | | 34,449 | | | | | | | | 39,207 | | | | | | | | 2,845 | | | | 9.76 | | | | 893 | |
SOUTH AMERICA | | | | | | | | | | | | | | | | | | | | | | | | | | | | | | | | | | | | | | | | | | | | | | | | | | | | |
Cerro Casale (75.00%) | | | 17,217 | | | | 1.19 | | | | 661 | | | | | | | | 205,268 | | | | 1.06 | | | | 6,985 | | | | | | | | 7,646 | | | | | | | | 371,580 | | | | 1.04 | | | | 12,379 | |
Pascua-Lama | | | 13,562 | | | | 28.91 | | | | 12,604 | | | | | | | | 143,111 | | | | 25.44 | | | | 117,060 | | | | | | | | 129,664 | | | | | | | | 15,400 | | | | 17.83 | | | | 8,830 | |
Lagunas Norte | | | 3,253 | | | | 2.91 | | | | 304 | | | | | | | | 54,192 | | | | 3.01 | | | | 5,250 | | | | | | | | 5,554 | | | | | | | | 3,946 | | | | 4.17 | | | | 529 | |
Veladero | | | 7,637 | | | | 9.38 | | | | 2,304 | | | | | | | | 204,698 | | | | 12.38 | | | | 81,459 | | | | | | | | 83,763 | | | | | | | | 21,389 | | | | 10.13 | | | | 6,966 | |
AFRICA | | | | | | | | | | | | | | | | | | | | | | | | | | | | | | | | | | | | | | | | | | | | | | | | | | | | |
Bulyanhulu (63.90%) | | | 874 | | | | 7.15 | | | | 201 | | | | | | | | 8,011 | | | | 6.58 | | | | 1,696 | | | | | | | | 1,897 | | | | | | | | 15,469 | | | | 6.96 | | | | 3,461 | |
TOTAL | | | 52,726 | | | | 12.29 | | | | 20,832 | | | | | | | | 710,739 | | | | 10.80 | | | | 246,899 | | | | | | | | 267,731 | | | | | | | | 430,629 | | | | 2.39 | | | | 33,058 | |
(1) Resources which are not reserves do not have demonstrated economic viability. | |
|
| CONTAINED COPPER WITHIN REPORTED GOLD RESOURCES(1) | |
For the year ended Dec. 31, 2016 | | | IN MEASURED (M) GOLD RESOURCES | | | | | | | | IN INDICATED (I) GOLD RESOURCES | | | | (M) + (I) | | | | | | | | INFERRED | |
Based on attributable pounds | |
| Tonnes
(000’s) |
| |
| Grade
(%) |
| |
| Contained lbs
(millions) |
| | | | | |
| Tonnes
(000’s) |
| |
| Grade
(%) |
| |
| Contained lbs
(millions) |
| | | | | |
| Contained lbs
(millions) |
| | | | | |
| Tonnes
(000’s) |
| |
| Grade
(%) |
| |
| Contained lbs
(millions) |
|
NORTH AMERICA | | | | | | | | | | | | | | | | | | | | | | | | | | | | | | | | | | | | | | | | | | | | | | | | | | | | |
Pueblo Viejo (60.00%) | | | 10,183 | | | | 0.090 | | | | 20.2 | | | | | | | | 95,459 | | | | 0.085 | | | | 179.7 | | | | | | | | 199.9 | | | | | | | | 2,845 | | | | 0.022 | | | | 1.4 | |
SOUTH AMERICA | | | | | | | | | | | | | | | | | | | | | | | | | | | | | | | | | | | | | | | | | | | | | | | | | | | | |
Cerro Casale (75.00%) | | | 17,217 | | | | 0.132 | | | | 50.1 | | | | | | | | 205,268 | | | | 0.164 | | | | 743.8 | | | | | | | | 793.9 | | | | | | | | 371,580 | | | | 0.192 | | | | 1,570.2 | |
Pascua-Lama | | | 13,562 | | | | 0.103 | | | | 30.7 | | | | | | | | 143,111 | | | | 0.084 | | | | 264.3 | | | | | | | | 295.0 | | | | | | | | 15,400 | | | | 0.049 | | | | 16.5 | |
AFRICA | | | | | | | | | | | | | | | | | | | | | | | | | | | | | | | | | | | | | | | | | | | | | | | | | | | | |
Bulyanhulu (63.90%) | | | 874 | | | | 0.405 | | | | 7.8 | | | | | | | | 8,011 | | | | 0.449 | | | | 79.3 | | | | | | | | 87.1 | | | | | | | | 15,469 | | | | 0.632 | | | | 215.5 | |
Buzwagi (63.90%) | | | 83 | | | | 0.109 | | | | 0.2 | | | | | | | | 16,449 | | | | 0.116 | | | | 42.1 | | | | | | | | 42.3 | | | | | | | | 1,315 | | | | 0.128 | | | | 3.7 | |
TOTAL | | | 41,919 | | | | 0.118 | | | | 109.0 | | | | | | | | 468,298 | | | | 0.127 | | | | 1,309.2 | | | | | | | | 1,418.2 | | | | | | | | 406,609 | | | | 0.202 | | | | 1,807.3 | |
(1) Resources which are not reserves do not have demonstrated economic viability. | |
|
| NICKEL MINERAL RESOURCES(1) | |
For the year ended Dec. 31, 2016 | | | MEASURED (M) | | | | | | | | INDICATED (I) | | | | (M) + (I) | | | | | | | | INFERRED | |
Based on attributable pounds | |
| Tonnes
(000’s) |
| |
| Grade
(%) |
| |
| Contained lbs
(millions) |
| | | | | |
| Tonnes
(000’s) |
| |
| Grade
(%) |
| |
| Contained lbs
(millions) |
| | | | | |
| Contained lbs
(millions) |
| | | | | |
| Tonnes
(000’s) |
| |
| Grade
(%) |
| |
| Contained lbs
(millions) |
|
AFRICA | | | | | | | | | | | | | | | | | | | | | | | | | | | | | | | | | | | | | | | | | | | | | | | | | | | | |
Kabanga (50.00%) | | | - | | | | | | | | 0.0 | | | | | | | | - | | | | | | | | 0.0 | | | | | | | | 0.0 | | | | | | | | - | | | | | | | | 0.0 | |
| (1) | Resources which are not reserves do not have demonstrated economic viability. |
Mineral Reserves and Resources Endnotes
1. Mineral reserves (“reserves”) and mineral resources (“resources”) have been estimated as at December 31, 2016 in accordance with National Instrument43-101 as required by Canadian securities regulatory authorities. For United States reporting purposes, Industry Guide 7 under the Securities and Exchange Act of 1934 (as interpreted by Staff of the SEC), applies different standards in order to classify mineralization as a reserve. Accordingly, for U.S. reporting purposes, approximately 1.9 million ounces of proven and probable gold reserves at Cortez are classified as mineralized material. In addition, while the terms “measured”, “indicated” and “inferred” mineral resources are required pursuant to National Instrument43-101, the U.S. Securities and Exchange Commission does not recognize such terms. Canadian standards differ significantly from the requirements of the U.S. Securities and Exchange Commission, and mineral resource information contained herein is not comparable to similar information regarding mineral reserves disclosed in accordance with the requirements of the U.S. Securities and Exchange Commission. U.S. investors should understand that “inferred” mineral resources have a great amount of uncertainty as to their existence and great uncertainty as to their economic and legal feasibility. In addition, U.S. investors are cautioned not to assume that any part or all of Barrick’s mineral resources constitute or will be converted into reserves. Calculations have been prepared by employees of Barrick, its joint venture partners or its joint venture operating companies, as applicable, under the supervision of Rick Sims, Senior Director, Resources and Reserves, of Barrick, Steven Haggarty, Senior Director, Metallurgy, of Barrick and Patrick Garretson, Senior Director, Life of Mine Planning, of Barrick. Except as noted below, reserves have been estimated based on an assumed gold price of US$1,000 per ounce for 2017 through 2020 and US$1,200 per ounce from 2021 onwards, an assumed silver price of US$13.75 per ounce for 2017 through 2020 and US$16.50 from 2021 onwards, and an assumed copper price of US$2.25 per pound for 2017 through 2020 and US$2.75 per pound from 2021 onwards (for more information about Barrick’stwo-tiered approach to estimating reserves, see page 31 of the Fourth Quarter andYear-End Report 2016) and long-term average exchange rates of 1.30 CAD/US$ and 0.75 US$/AUD. Reserves at Kalgoorlie assumed a gold price of AUD$1,600 and Bulyanhulu, North Mara and Buzwagi assumed a gold price of US$1,100. Reserve estimates incorporate current and/or expected mine plans and cost levels at each property. Varyingcut-off grades have been used depending on the mine and type of ore contained in the reserves. Barrick’s normal data verification procedures have been employed in connection with the calculations. Verification procedures include industry-standard quality control practices. Resources as at December 31, 2016 have been estimated using varyingcut-off grades, depending on both the type of mine or project, its maturity and ore types at each property. For a breakdown of reserves and resources by category and for a more detailed description of the key assumptions, parameters, and methods used in estimating Barrick’s reserves and resources, see Barrick’s most recent Annual Information Form/Form40-F on file with Canadian provincial securities regulatory authorities and the U.S. Securities and Exchange Commission.
2. In confirming our annual reserves for each of our mineral properties, projects, and operations we conduct a reserve test on December 31 of each year to verify that the future undiscounted cash flow from reserves is positive. The cash flow ignores all sunk costs and only considers future operating and closure expenses as well as any future capital costs.
3. On January 11, 2016, the Company divested the Bald Mountain mine and its interest in the Round Mountain mine. For additional information regarding this matter, see page 116 of Barrick’s Fourth Quarter andYear-End Report 2016.
4. On August 31, 2015, the Company divested 50% of its interest in the Porgera mine. For additional information regarding this matter, see page 116 of Barrick’s Fourth Quarter andYear-End Report 2016.
5. Silver and copper probable reserve tonnage at the Bulyanhulu mine is less than the gold probable reserve tonnage because the gold reserve includes 3.95 million tonnes of tailings material which are being separately reprocessed for recovery of gold only.
MANAGEMENT’S RESPONSIBILITY
Management’s Responsibility for Financial Statements
The accompanying consolidated financial statements have been prepared by and are the responsibility of the Board of Directors and Management of the Company.
The consolidated financial statements have been prepared in accordance with International Financial Reporting Standards as issued by the International Accounting Standards Board and reflect Management’s best estimates and judgments based on currently available information. The Company has developed and maintains a system of internal controls in order to ensure, on a reasonable and cost effective basis, the reliability of its financial information.
The consolidated financial statements have been audited by PricewaterhouseCoopers LLP, Chartered Professional Accountants. Their report outlines the scope of their examination and opinion on the consolidated financial statements.

Catherine Raw
Executive Vice President
and Chief Financial Officer
Toronto, Canada
February 15, 2017
| | | | |
| BARRICK YEAR-END 2016 | | 94 | | MANAGEMENT’S RESPONSIBILITY |
MANAGEMENT’S REPORT ON INTERNAL CONTROL OVER FINANCIAL REPORTING
Barrick’s management is responsible for establishing and maintaining internal control over financial reporting.
Barrick’s management assessed the effectiveness of the Company’s internal control over financial reporting as at December 31, 2016. Barrick’s Management used the Internal Control – Integrated Framework (2013) as issued by the Committee of Sponsoring Organizations of the Treadway Commission (COSO) to evaluate the effectiveness of Barrick’s internal control over financial reporting. Based on management’s assessment, Barrick’s internal control over financial reporting is effective as at December 31, 2016.
The effectiveness of the Company’s internal control over financial reporting as at December 31, 2016 has been audited by PricewaterhouseCoopers LLP, Chartered Professional Accountants, as stated in their report which is located on pages 96-98 of Barrick’s 2016 Annual Financial Statements.
| | | | |
| BARRICK YEAR-END 2016 | | 95 | | MANAGEMENT’S REPORT ON INTERNAL CONTROL OVER FINANCIAL REPORTING |

February 15, 2017
Independent Auditor’s Report
To the Shareholders of
Barrick Gold Corporation
We have completed integrated audits of Barrick Gold Corporation’s (the company) 2016 and 2015 consolidated financial statements and its internal control over financial reporting as at December 31, 2016. Our opinions, based on our audits are presented below.
Report on the consolidated financial statements
We have audited the accompanying consolidated financial statements of Barrick Gold Corporation, which comprise the consolidated balance sheets as at December 31, 2016 and December 31, 2015 and the consolidated statements of income, comprehensive income, cash flow and changes in equity for the years then ended, and the related notes, which comprise a summary of significant accounting policies and other explanatory information.
Management’s responsibility for the consolidated financial statements
Management is responsible for the preparation and fair presentation of these consolidated financial statements in accordance with International Financial Reporting Standards (IFRS) as issued by the International Accounting Standards Board (IASB) and for such internal control as management determines is necessary to enable the preparation of consolidated financial statements that are free from material misstatement, whether due to fraud or error.
Auditor’s responsibility
Our responsibility is to express an opinion on these consolidated financial statements based on our audits. We conducted our audits in accordance with Canadian generally accepted auditing standards and the standards of the Public Company Accounting Oversight Board (United States). Those standards require that we plan and perform the audit to obtain reasonable assurance about whether the consolidated financial statements are free from material misstatement. Canadian generally accepted auditing standards also require that we comply with ethical requirements.
An audit involves performing procedures to obtain audit evidence, on a test basis, about the amounts and disclosures in the consolidated financial statements. The procedures selected depend on the auditor’s judgment, including the assessment of the risks of material misstatement of the consolidated financial statements, whether due to fraud or error. In making those risk assessments, the auditor considers internal control relevant to the company’s preparation and fair presentation of the consolidated financial statements in order to design audit procedures that are appropriate in the circumstances. An audit also includes evaluating the appropriateness of accounting principles and policies used and the reasonableness of accounting estimates made by management, as well as evaluating the overall presentation of the consolidated financial statements.
| | | | |
| | | | PricewaterhouseCoopers LLP PwC Tower, 18 York Street, Suite 2600, Toronto, Ontario, Canada M5J oB2 T: +1 416 863 1133, F: +1 416 365 8215, www.pwc.com/ca “PwC” refers to PricewaterhouseCoopers LLP, an Ontario limited liability partnership. |
We believe that the audit evidence we have obtained in our audits is sufficient and appropriate to provide a basis for our audit opinion on the consolidated financial statements.
Opinion
In our opinion, the consolidated financial statements present fairly, in all material respects, the financial position of Barrick Gold Corporation as at December 31, 2016 and December 31, 2015 and its financial performance and its cash flows for the years then ended in accordance with IFRS as issued by the IASB.
Report on internal control over financial reporting
We have also audited Barrick Gold Corporation’s internal control over financial reporting as at
December 31, 2016, based on criteria established in Internal Control—Integrated Framework (2013), issued by the Committee of Sponsoring Organizations of the Treadway Commission (COSO).
Management’s responsibility for internal control over financial reporting
Management is responsible for maintaining effective internal control over financial reporting and for its assessment of the effectiveness of internal control over financial reporting included in the accompanying
Management’s Report on Internal Control over Financial Reporting.
Auditor’s responsibility
Our responsibility is to express an opinion on the company’s internal control over financial reporting based on our audit. We conducted our audit of internal control over financial reporting in accordance with the standards of the Public Company Accounting Oversight Board (United States). Those standards require that we plan and perform the audit to obtain reasonable assurance about whether effective internal control over financial reporting was maintained in all material respects.
An audit of internal control over financial reporting includes obtaining an understanding of internal control over financial reporting, assessing the risk that a material weakness exists, testing and evaluating the design and operating effectiveness of internal control, based on the assessed risk, and performing such other procedures as we consider necessary in the circumstances.
We believe that our audit provides a reasonable basis for our audit opinion on the company’s internal control over financial reporting.
Definition of internal control over financial reporting
A company’s internal control over financial reporting is a process designed to provide reasonable assurance regarding the reliability of financial reporting and the preparation of financial statements for external purposes in accordance with generally accepted accounting principles. A company’s internal control over financial reporting includes those policies and procedures that: (i) pertain to the maintenance of records that, in reasonable detail, accurately and fairly reflect the transactions and dispositions of the assets of the company; (ii) provide reasonable assurance that transactions are recorded as necessary to permit preparation of financial statements in accordance with generally accepted accounting principles, and that receipts and expenditures of the company are being made only in accordance with authorizations of management and directors of the company; and (iii) provide reasonable assurance regarding prevention or timely detection of unauthorized acquisition, use, or disposition of the company’s assets that could have a material effect on the financial statements.
2
Inherent limitations
Because of its inherent limitations, internal control over financial reporting may not prevent or detect misstatements. Also, projections of any evaluation of effectiveness to future periods are subject to the risk that controls may become inadequate because of changes in conditions or that the degree of compliance with the policies or procedures may deteriorate.
Opinion
In our opinion, Barrick Gold Corporation maintained, in all material respects, effective internal control over financial reporting as at December 31, 2016, based on criteria established in Internal Control – Integrated Framework (2013) issued by COSO.
(Signed) “PricewaterhouseCoopers LLP”
Chartered Professional Accountants, Licensed Public Accountants
3
Consolidated Statements of Income
| | | | | | | | |
Barrick Gold Corporation For the years ended December 31 (in millions of United States dollars, except per share data) | | | | | | |
| | | 2016 | | | 2015 | |
| | |
| Revenue(notes 5 and 6) | | $ | 8,558 | | | $ | 9,029 | |
| Costs and expenses | | | | | | | | |
| Cost of sales(notes 5 and 7) | | | 5,405 | | | | 6,907 | |
| General and administrative expenses(note 11) | | | 256 | | | | 233 | |
| Exploration, evaluation and project expenses(notes 5 and 8) | | | 237 | | | | 355 | |
| Impairment (reversals) charges(note 10) | | | (250) | | | | 3,897 | |
| Loss on currency translation(note 9b) | | | 199 | | | | 120 | |
| Closed mine rehabilitation(note 27b) | | | 130 | | | | 3 | |
| (Income) loss from equity investees(note 16) | | | (20) | | | | 7 | |
| (Gain) loss onnon-hedge derivatives(note 25e) | | | (12) | | | | 38 | |
| Other expense (income)(note 9a) | | | 60 | | | | (113) | |
| Income (loss) before finance items and income taxes | | | 2,553 | | | | (2,418) | |
| Finance costs, net(note 14) | | | (775) | | | | (726) | |
| Income (loss) before income taxes | | | 1,778 | | | | (3,144) | |
| Income tax (expense) recovery(note 12) | | | (917) | | | | 31 | |
| Net income (loss) | | $ | 861 | | | $ | (3,113) | |
| Attributable to: | | | | | | | | |
| Equity holders of Barrick Gold Corporation | | $ | 655 | | | $ | (2,838) | |
| Non-controlling interests(note 32) | | $ | 206 | | | $ | (275) | |
|
| Earnings per share data attributable to the equity holders of Barrick Gold Corporation (note 13) | |
| Net income (loss) | | | | | | | | |
Basic | | $ | 0.56 | | | $ | (2.44) | |
Diluted | | $ | 0.56 | | | $ | (2.44) | |
The accompanying notes are an integral part of these consolidated financial statements.
| | | | |
| BARRICK YEAR-END 2016 | | 99 | | FINANCIAL STATEMENTS |
Consolidated Statements of Comprehensive Income
| | | | | | | | |
| Barrick Gold Corporation | | | |
| For the years ended December 31 (in millions of United States dollars) | | 2016 | | | 2015 | |
| Net income (loss) | | $ | 861 | | | $ | (3,113) | |
| Other comprehensive income (loss), net of taxes | | | | | | | | |
| | |
| Items that may be reclassified subsequently to profit or loss: | | | | | | | | |
| Unrealized gains (losses) on derivatives designated as cash flow hedges, net of tax ($9) and $43 | | | 16 | | | | (134) | |
| Realized (gains) losses on derivatives designated as cash flow hedges, net of tax ($8) and ($20) | | | 64 | | | | 111 | |
| Currency translation adjustments, net of tax $nil and $nil | | | 95 | | | | (56) | |
| | |
| Items that will not be reclassified to profit or loss: | | | | | | | | |
| Actuarial gain (loss) on post-employment benefit obligations, net of tax ($4) and ($3) | | | 7 | | | | 5 | |
| Net unrealized change on equity investments, net of tax $nil and $nil | | | 6 | | | | (11) | |
| Net realized change on equity investments, net of tax $nil and $nil | | | - | | | | 18 | |
| Total other comprehensive income (loss) | | | 188 | | | | (67) | |
| Total comprehensive income (loss) | | $ | 1,049 | | | $ | (3,180) | |
| Attributable to: | | | | | | | | |
| Equity holders of Barrick Gold Corporation | | $ | 843 | | | $ | (2,905) | |
| Non-controlling interests | | $ | 206 | | | $ | (275) | |
The accompanying notes are an integral part of these consolidated financial statements.
| | | | |
| BARRICK YEAR-END 2016 | | 100 | | FINANCIAL STATEMENTS |
Consolidated Statements of Cash Flow
| | | | | | | | |
| Barrick Gold Corporation | | | |
| For the years ended December 31 (in millions of United States dollars) | | 2016 | | | 2015 | |
| OPERATING ACTIVITIES | | | | | | | | |
| Net income (loss) | | $ | 861 | | | $ | (3,113) | |
| Adjustments for the following items: | | | | | | | | |
| Depreciation | | | 1,574 | | | | 1,771 | |
| Finance costs(note 14) | | | 788 | | | | 739 | |
| Impairment (reversals) charges(note 10) | | | (250) | | | | 3,897 | |
| Income tax expense (recovery)(note 12) | | | 917 | | | | (31) | |
| Net currency translation losses(note 9b) | | | 199 | | | | 120 | |
| Loss (gain) on sale ofnon-current assets/investments | | | 42 | | | | (187) | |
| Deposit on gold and silver streaming agreement(note 29) | | | - | | | | 610 | |
| Change in working capital(note 15a) | | | (315) | | | | (39) | |
| Other operating activities(note 15a) | | | (176) | | | | (4) | |
| Operating cash flows before interest and income taxes | | | 3,640 | | | | 3,763 | |
| Interest paid | | | (513) | | | | (677) | |
| Income taxes paid | | | (487) | | | | (292) | |
| Net cash provided by operating activities | | | 2,640 | | | | 2,794 | |
| INVESTING ACTIVITIES | | | | | | | | |
| Property, plant and equipment | | | | | | | | |
| Capital expenditures(note 5) | | | (1,126) | | | | (1,713) | |
| Sales proceeds | | | 135 | | | | 43 | |
| Divestitures(note 4) | | | 588 | | | | 1,904 | |
| Investment sales | | | - | | | | 33 | |
| Other investing activities(note 15b) | | | (9) | | | | (17) | |
| Net cash provided by (used in) investing activities | | | (412) | | | | 250 | |
| FINANCING ACTIVITIES | | | | | | | | |
| Debt(note 25b) | | | | | | | | |
| Proceeds | | | 5 | | | | 9 | |
| Repayments | | | (2,062) | | | | (3,142) | |
| Dividends(note 31) | | | (86) | | | | (160) | |
| Funding fromnon-controlling interests(note 32) | | | 70 | | | | 40 | |
| Disbursements tonon-controlling interests(note 32) | | | (95) | | | | (90) | |
| Debt extinguishment costs | | | (129) | | | | 68 | |
| Net cash used in financing activities | | | (2,297) | | | | (3,275) | |
| Effect of exchange rate changes on cash and equivalents | | | 3 | | | | (13) | |
| Net decrease in cash and equivalents | | | (66) | | | | (244) | |
| Cash and equivalents at beginning of year(note 25a) | | | 2,455 | | | | 2,699 | |
| Cash and equivalents at the end of year | | $ | 2,389 | | | $ | 2,455 | |
The accompanying notes are an integral part of these consolidated financial statements.
| | | | |
| BARRICK YEAR-END 2016 | | 101 | | FINANCIAL STATEMENTS |
Consolidated Balance Sheets
| | | | | | | | |
| Barrick Gold Corporation | | As at | | | As at | |
| | | December 31, | | | December 31, | |
| (in millions of United States dollars) | | 2016 | | | 2015 | |
| ASSETS | | | | | | | | |
| Current assets | | | | | | | | |
| Cash and equivalents(note 25a) | | | $ 2,389 | | | | $ 2,455 | |
| Accounts receivable(note 18) | | | 249 | | | | 275 | |
| Inventories(note 17) | | | 1,930 | | | | 1,717 | |
| Other current assets(note 18) | | | 306 | | | | 263 | |
| Total current assets (excluding assets classified as held-for-sale) | | | 4,874 | | | | 4,710 | |
| Assets classified asheld-for-sale(note 4) | | | - | | | | 758 | |
| Total current assets | | | 4,874 | | | | 5,468 | |
| | |
| Non-current assets | | | | | | | | |
| Non-current portion of inventory(note 17) | | | 1,536 | | | | 1,502 | |
| Equity in investees(note 16) | | | 1,185 | | | | 1,199 | |
| Property, plant and equipment(note 19) | | | 14,103 | | | | 14,434 | |
| Intangible assets(note 20a) | | | 272 | | | | 271 | |
| Goodwill(note 20b) | | | 1,371 | | | | 1,371 | |
| Deferred income tax assets(note 30) | | | 977 | | | | 1,040 | |
| Other assets(note 22) | | | 946 | | | | 1,023 | |
| Total assets | | | $ 25,264 | | | | $ 26,308 | |
| LIABILITIES AND EQUITY | | | | | | | | |
| Current liabilities | | | | | | | | |
| Accounts payable(note 23) | | | $ 1,084 | | | | $ 1,158 | |
| Debt(note 25b) | | | 143 | | | | 203 | |
| Current income tax liabilities | | | 283 | | | | - | |
| Other current liabilities(note 24) | | | 309 | | | | 337 | |
| Total current liabilities (excluding liabilities classified as held-for-sale) | | | 1,819 | | | | 1,698 | |
| Liabilities classified asheld-for-sale(note 4) | | | - | | | | 149 | |
| Total current liabilities | | | 1,819 | | | | 1,847 | |
| | |
| Non-current liabilities | | | | | | | | |
| Debt(note 25b) | | | 7,788 | | | | 9,765 | |
| Provisions(note 27) | | | 2,363 | | | | 2,102 | |
| Deferred income tax liabilities(note 30) | | | 1,520 | | | | 1,553 | |
| Other liabilities(note 29) | | | 1,461 | | | | 1,586 | |
| Total liabilities | | | 14,951 | | | | 16,853 | |
| Equity | | | | | | | | |
| Capital stock(note 31) | | | 20,877 | | | | 20,869 | |
| Deficit | | | (13,074) | | | | (13,642) | |
| Accumulated other comprehensive loss | | | (189) | | | | (370) | |
| Other | | | 321 | | | | 321 | |
| Total equity attributable to Barrick Gold Corporation shareholders | | | 7,935 | | | | 7,178 | |
| Non-controlling interests(note 32) | | | 2,378 | | | | 2,277 | |
| Total equity | | | 10,313 | | | | 9,455 | |
| Contingencies and commitments(notes 2, 17, 19 and 36) | | | | | | | | |
| Total liabilities and equity | | | $ 25,264 | | | | $ 26,308 | |
The accompanying notes are an integral part of these consolidated financial statements.
| | | | |
| Signed on behalf of the Board, | | | | |
| | |
| John L. Thornton, Chairman | | Steven J. Shapiro, Director | | |
| | | | |
| BARRICK YEAR-END 2016 | | 102 | | FINANCIAL STATEMENTS |
Consolidated Statements of Changes in Equity
| | | | | | | | | | | | | | | | | | | | | | | | | | | | | | | | |
| Barrick Gold Corporation | | | | | Attributable to equity holders of the Company | | | | | | | |
| (in millions of United States dollars) | | Common Shares
(in thousands) | | | Capital stock | | | Retained
earnings
(deficit) | | | Accumulated
other
comprehensive
income (loss)1 | | | Other2 | | | Total equity
attributable to
shareholders | | | Non-
controlling
interests | | | Total
equity | |
| At January 1, 2016 | | | 1,165,081 | | | | $ 20,869 | | | | $ (13,642) | | | | $ (370) | | | | $ 321 | | | | $ 7,178 | | | | $ 2,277 | | | | $ 9,455 | |
| Net income | | | - | | | | - | | | | 655 | | | | - | | | | - | | | | 655 | | | | 206 | | | | 861 | |
Total other comprehensive
income | | | - | | | | - | | | | 7 | | | | 181 | | | | - | | | | 188 | | | | - | | | | 188 | |
| Total comprehensive income | | | - | | | | $ - | | | | $ 662 | | | | $ 181 | | | | $ - | | | | $ 843 | | | | $ 206 | | | | $ 1,049 | |
| Transactions with owners | | | | | | | | | | | | | | | | | | | | | | | | | | | | | | | | |
| Dividends | | | - | | | | - | | | | (86) | | | | - | | | | - | | | | (86) | | | | - | | | | (86) | |
| Dividend reinvestment plan | | | 493 | | | | 8 | | | | (8) | | | | - | | | | - | | | | - | | | | - | | | | - | |
Funding fromnon-controlling
interests | | | - | | | | - | | | | - | | | | - | | | | - | | | | - | | | | 70 | | | | 70 | |
Other decrease innon-controlling interests | | | - | | | | - | | | | - | | | | - | | | | - | | | | - | | | | (175) | | | | (175) | |
| Total transactions with owners | | | 493 | | | | $ 8 | | | | $ (94) | | | | $ - | | | | $ - | | | | $ (86) | | | | $ (105) | | | | $ (191) | |
| At December 31, 2016 | | | 1,165,574 | | | | $ 20,877 | | | | $ (13,074) | | | | $ (189) | | | | $ 321 | | | | $ 7,935 | | | | $ 2,378 | | | | $ 10,313 | |
| | | | | | | | | | | | | | | | | | | | | | | | | | | | | | | | | |
| At January 1, 2015 | | | 1,164,670 | | | | $ 20,864 | | | | $ (10,739) | | | | $ (199) | | | | $ 321 | | | | $ 10,247 | | | | $ 2,615 | | | | $ 12,862 | |
Impact of adopting IFRS 9 on
January 1, 2015 (note 25) | | | - | | | | - | | | | 99 | | | | (99) | | | | - | | | | - | | | | - | | | | - | |
| At January 1, 2015 (restated) | | | 1,164,670 | | | | $ 20,864 | | | | $ (10,640) | | | | $ (298) | | | | $ 321 | | | | $ 10,247 | | | | $ 2,615 | | | | $ 12,862 | |
| Net loss | | | - | | | | - | | | | (2,838) | | | | - | | | | - | | | | (2,838) | | | | (275) | | | | (3,113) | |
| Total other comprehensive income (loss) | | | - | | | | - | | | | 5 | | | | (72) | | | | - | | | | (67) | | | | - | | | | (67) | |
| Total comprehensive loss | | | - | | | | $ - | | | | $ (2,833) | | | | $ (72) | | | | $ - | | | | $ (2,905) | | | | $ (275) | | | | $ (3,180) | |
| Transactions with owners | | | | | | | | | | | | | | | | | | | | | | | | | | | | | | | | |
| Dividends | | | - | | | | - | | | | (160) | | | | - | | | | - | | | | (160) | | | | - | | | | (160) | |
| Dividend reinvestment plan | | | 411 | | | | 3 | | | | (3) | | | | - | | | | - | | | | - | | | | - | | | | - | |
Recognition of stock option
expense | | | - | | | | 2 | | | | - | | | | - | | | | - | | | | 2 | | | | - | | | | 2 | |
Funding fromnon-controlling
interests | | | - | | | | - | | | | - | | | | - | | | | - | | | | - | | | | 41 | | | | 41 | |
Other decrease innon-controlling interests | | | - | | | | - | | | | - | | | | - | | | | - | | | | - | | | | (104) | | | | (104) | |
| Other decreases | | | - | | | | - | | | | (6) | | | | - | | | | - | | | | (6) | | | | - | | | | (6) | |
| Total transactions with owners | | | 411 | | | | $ 5 | | | | $ (169) | | | | $ - | | | | $ - | | | | $ (164) | | | | $ (63) | | | | $ (227) | |
| At December 31, 2015 | | | 1,165,081 | | | | $ 20,869 | | | | $ (13,642) | | | | $ (370) | | | | $ 321 | | | | $ 7,178 | | | | $ 2,277 | | | | $ 9,455 | |
1 Includes cumulative translation adjustments as at December 31, 2016: $95 million loss (2015: $178 million).
2 Includes additionalpaid-in capital as at December 31, 2016: $283 million (December 31, 2015: $283 million) and convertible borrowings - equity component as at December 31, 2016: $38 million (December 31, 2015: $38 million).
The accompanying notes are an integral part of these consolidated financial statements.
| | | | |
| BARRICK YEAR-END 2016 | | 103 | | FINANCIAL STATEMENTS |
NOTES TO CONSOLIDATED FINANCIAL STATEMENTS
Barrick Gold Corporation. Tabular dollar amounts in millions of United States dollars, unless otherwise shown. References to A$, ARS, C$, CLP, DOP, EUR, GBP, PGK, SAR, TZS, ZAR, and ZMW are to Australian dollars, Argentinean pesos, Canadian dollars, Chilean pesos, Dominican pesos, Euros, British pound sterling, Papua New Guinea kina, Saudi riyal, Tanzanian shillings, South African rand, and Zambian kwacha, respectively.
1 > CORPORATE INFORMATION
Barrick Gold Corporation (“Barrick” or the “Company”) is a corporation governed by the Business Corporations Act (Ontario). The Company’s head and registered office is located at Brookfield Place, TD Canada Trust Tower, 161 Bay Street, Suite 3700, Toronto, Ontario, M5J 2S1. We are principally engaged in the production and sale of gold and copper, as well as related activities such as exploration and mine development. Our producing gold mines are located in Canada, the United States, Peru, Argentina and the Dominican Republic and our producing copper mine is in Zambia. We hold a 50% interest in KCGM, a gold mine located in Australia and hold a 50% equity interest in Barrick Niugini Limited (“BNL”), which owns a 95% interest in Porgera, a gold mine located in Papua New Guinea. We also hold a 63.9% equity interest in Acacia Mining plc (“Acacia”), a company listed on the London Stock Exchange that owns gold mines and exploration properties in Africa. We have a 50% interest in Zaldívar, a copper mine located in Chile and a 50% interest in Jabal Sayid, a copper mine located in Saudi Arabia. We also have various gold projects located in South America and North America. We sell our gold and copper production into the world market.
2 > SIGNIFICANT ACCOUNTING POLICIES
| A) | Statement of Compliance |
These consolidated financial statements have been prepared in accordance with International Financial Reporting Standards (“IFRS”) as issued by the International Accounting Standards Board (“IASB”) under the historical cost convention, as modified by revaluation of derivative contracts and certain financial assets. Accounting policies are consistently applied to all years presented, unless otherwise stated. These consolidated financial statements were approved for issuance by the Board of Directors on February 15, 2017.
Subsidiaries
These consolidated financial statements include the accounts of Barrick and its subsidiaries. All intercompany balances, transactions, income and expenses, and profits or losses have been eliminated on consolidation. We consolidate subsidiaries where we have the ability to exercise control. Control of an investee is defined to exist when we are exposed to variable returns from our involvement with the investee and have the ability to affect those returns through our power over the investee. Specifically, we control an investee if, and only if, we have all of the following: power over the investee (i.e., existing rights that give us the current ability to direct the relevant activities of the investee); exposure, or rights, to variable returns from our involvement with the investee; and the ability to use our power over the investee to affect its returns. For non wholly-owned, controlled subsidiaries, the net assets attributable to outside equity shareholders are presented as“non-controlling interests” in the equity section of the consolidated balance sheet. Profit or loss for the period that is attributable tonon-controlling interests is calculated based on the ownership of the minority shareholders in the subsidiary.
Joint Arrangements
A joint arrangement is defined as one over which two or more parties have joint control, which is the contractually agreed sharing of control over an arrangement. This exists only when the decisions about the relevant activities (being those that significantly affect the returns of the arrangement) require the unanimous consent of the parties sharing control. There are two types of joint arrangements, joint operations (“JO”) and joint ventures (“JV”).
A JO is a joint arrangement whereby the parties that have joint control of the arrangement have rights to the assets and obligations for the liabilities, relating to the arrangement. In relation to our interests in joint operations, we recognize our share of any assets, liabilities, revenues and expenses of the JO.
A JV is a joint arrangement whereby the parties that have joint control of the arrangement have rights to the net assets of the joint venture. Our investments in JVs are accounted for using the equity method.
| | | | |
| BARRICK YEAR-END 2016 | | 104 | | NOTES TO FINANCIAL STATEMENTS |
On acquisition, an equity method investment is initially recognized at cost. The carrying amount of equity method investments includes goodwill identified on acquisition, net of any accumulated impairment losses. The carrying amount is adjusted by our share of post-acquisition net income or loss; depreciation, amortization or impairment of the fair value adjustments made on the underlying balance sheet at the date of acquisition; dividends; cash contributions; and our share of post-acquisition movements in Other Comprehensive Income (“OCI”).
Outlined below is information related to our joint arrangements and entities other than 100% owned Barrick subsidiaries at December 31, 2016:
| | | | | | | | |
| | | Place of business | | Entity type | | Economic interest1 | | Method2 |
Acacia Mining plc3 | | Tanzania | | Subsidiary, publicly traded | | 63.9% | | Consolidation |
Cerro Casale Project3 | | Chile | | Subsidiary | | 75% | | Consolidation |
Pueblo Viejo3 | | Dominican Republic | | Subsidiary | | 60% | | Consolidation |
South Arturo3 | | United States | | Subsidiary | | 60% | | Consolidation |
Donlin Gold Project | | United States | | JO | | 50% | | Our share |
Kalgoorlie Mine | | Australia | | JO | | 50% | | Our share |
Porgera Mine4 | | Papua New Guinea | | JO | | 47.5% | | Our share |
Turquoise Ridge Mine5 | | United States | | JO | | 75% | | Our share |
GNX6,7 | | Chile | | JV | | 50% | | Equity Method |
Jabal Sayid6 | | Saudi Arabia | | JV | | 50% | | Equity Method |
Kabanga Project6,7 | | Tanzania | | JV | | 50% | | Equity Method |
Zaldívar6,8 | | Chile | | JV | | 50% | | Equity Method |
| 1 | Unless otherwise noted, all of our joint arrangements are funded by contributions made by their partners in proportion to their economic interest. |
| 2 | For our JOs, we recognize our share of any assets, liabilities, revenues and expenses of the JO. |
| 3 | We consolidate our interests in Acacia, Cerro Casale, Pueblo Viejo and South Arturo and record anon-controlling interest for the 36.1%, 25%, 40% and 40%, respectively, that we do not own. |
| 4 | We divested 50% of our 95% interest in Porgera in 2015, bringing our interest down to 47.5%. |
| 5 | We have joint control given that decisions about relevant activities require unanimous consent of the parties to the joint operation. |
| 6 | Barrick has commitments of $188 million relating to its interest in the joint ventures. |
| 7 | These JVs are early stage exploration projects and, as such, do not have any significant assets, liabilities, income, contractual commitments or contingencies. Expenses are recognized through our equitypick-up (loss). Refer to note 16 for further details. |
| 8 | We divested 50% of our interest in 2015. |
On the acquisition of a business, the acquisition method of accounting is used, whereby the purchase consideration is allocated to the identifiable assets and liabilities on the basis of fair value at the date of acquisition. Provisional fair values allocated at a reporting date are finalized as soon as the relevant information is available, within a period not to exceed twelve months from the acquisition date with retroactive restatement of the impact of adjustments to those provisional fair values effective as at the acquisition date. Incremental costs related to acquisitions are expensed as incurred.
When the cost of the acquisition exceeds the fair values of the identifiable net assets acquired, the difference is recorded as goodwill. If the fair value attributable to
Barrick’s share of the identifiable net assets exceeds the cost of acquisition, the difference is recognized as a gain in the consolidated statement of income.
Non-controlling interests represent the fair value of net assets in subsidiaries, as at the date of acquisition that are not held by Barrick and are presented in the equity section of the consolidated balance sheet.
| D) | Non-current Assets and Disposal GroupsHeld-for-Sale and Discontinued Operations |
Non-current assets and disposal groups are classified as assets held-for-sale (“HFS”) if it is highly probable that the value of these assets will be recovered primarily through sale rather than through continuing use. They are recorded at the lower of carrying amount and fair value less cost of
| | | | |
| BARRICK YEAR-END 2016 | | 105 | | NOTES TO FINANCIAL STATEMENTS |
disposal. Impairment losses on initial classification as HFS and subsequent gains and losses on remeasurement are recognized in the income statement. Once classified as HFS, property, plant and equipment are no longer amortized. The assets and liabilities are presented as HFS in the consolidated balance sheet when the sale is highly probable, the asset or disposal group is available for immediate sale in its present condition and management is committed to the sale, which should be expected to be completed within one year from the date of classification.
A discontinued operation is a component of the Company that can be clearly distinguished from the rest of the Company and represents a major line of business or geographic area, and the value of this component is expected to be recovered primarily through sale rather than continuing use.
Results of operations and any gain or loss from disposal are excluded from income before finance items and income taxes and are reported separately as income/loss from discontinued operations.
| E) | Foreign Currency Translation |
The functional currency of the Company, for each subsidiary of the Company, and for joint arrangements and associates, is the currency of the primary economic environment in which it operates. The functional currency of all of our operations is the US dollar. We translatenon-US dollar balances for these operations into US dollars as follows:
| • | | Property, plant and equipment (“PP&E”), intangible assets and equity method investments using the rates at the time of acquisition; |
| • | | Fair value through other comprehensive income (“FVOCI”) equity investments using the closing exchange rate as at the balance sheet date with translation gains and losses permanently recorded in Other Comprehensive Income (“OCI”); |
| • | | Deferred tax assets and liabilities using the closing exchange rate as at the balance sheet date with translation gains and losses recorded in income tax expense; |
| • | | Other assets and liabilities using the closing exchange rate as at the balance sheet date with translation gains and losses recorded in other income/expense; and |
| • | | Income and expenses using the average exchange rate for the period, except for expenses that relate tonon-monetary assets and liabilities measured at historical rates, which are translated using the same historical rate as the associatednon-monetary assets and liabilities. |
We record revenue when evidence exists that all of the following criteria are met:
| • | | The significant risks and rewards of ownership of the product have been transferred to the buyer; |
| • | | Neither continuing managerial involvement to the degree usually associated with ownership, nor effective control over the goods sold, has been retained; |
| • | | The amount of revenue can be reliably measured; |
| • | | It is probable that the economic benefits associated with the sale will flow to us; and |
| • | | The costs incurred or to be incurred in respect of the sale can be reliably measured. |
These conditions are generally satisfied when title passes to the customer.
Gold Bullion Sales
Gold bullion is sold primarily in the London spot market. The sales price is fixed on the date of sale based on the gold spot price. Generally, we record revenue from gold bullion sales at the time of physical delivery, which is also the date that title to the gold passes.
Concentrate Sales
Under the terms of concentrate sales contracts with independent smelting companies, gold and copper sales prices are provisionally set on a specified future date after shipment based on market prices. We record revenues under these contracts at the time of shipment, which is also when the risk and rewards of ownership pass to the smelting companies, using forward market gold and copper prices on the expected date that final sales prices will be determined. Variations between the price recorded at the shipment date and the actual final price set under the smelting contracts are caused by changes in market gold and copper prices, which result in the existence of an embedded derivative in accounts receivable. The embedded derivative is recorded at fair value each period until final settlement occurs, with changes in fair value classified as provisional price adjustments and included in revenue in the consolidated statement of income.
Copper Cathode Sales
Under the terms of copper cathode sales contracts, copper sales prices are provisionally set on a specified future date based upon market commodity prices plus certain price adjustments. Revenue is recognized at the time of shipment, which is also when the risks and rewards of ownership pass to the customer. Revenue is provisionally measured using forward market prices on the expected date that final selling prices will be determined. Variations occur between the price recorded on the date of revenue recognition and the actual final price under the terms of
| | | | |
| BARRICK YEAR-END 2016 | | 106 | | NOTES TO FINANCIAL STATEMENTS |
the contracts due to changes in market copper prices, which result in the existence of an embedded derivative in accounts receivable. This embedded derivative is recorded at fair value each period until final settlement occurs, with changes in fair value classified as provisional price adjustments and included in revenue in the consolidated statement of income.
| G) | Exploration and Evaluation (“E&E”) |
Exploration expenditures are the costs incurred in the initial search for mineral deposits with economic potential or in the process of obtaining more information about existing mineral deposits. Exploration expenditures typically include costs associated with prospecting, sampling, mapping, diamond drilling and other work involved in searching for ore.
Evaluation expenditures are the costs incurred to establish the technical and commercial viability of developing mineral deposits identified through exploration activities or by acquisition. Evaluation expenditures include the cost of (i) establishing the volume and grade of deposits through drilling of core samples, trenching and sampling activities in an ore body that is classified as either a mineral resource or a proven and probable reserve; (ii) determining the optimal methods of extraction and metallurgical and treatment processes; (iii) studies related to surveying, transportation and infrastructure requirements; (iv) permitting activities; and (v) economic evaluations to determine whether development of the mineralized material is commercially justified, including scoping, prefeasibility and final feasibility studies.
Exploration and evaluation expenditures are expensed as incurred unless management determines that probable future economic benefits will be generated as a result of the expenditures. Once the technical feasibility and commercial viability of a program or project has been demonstrated with a prefeasibility study, and we have recognized reserves in accordance with the Canadian Securities Administrators’ National Instrument43-101, we account for future expenditures incurred in the development of that program or project in accordance with our policy for Property, Plant & Equipment, as described in note 2n.
A mine that is under construction is determined to enter the production stage when the project is in the location and condition necessary for it to be capable of operating in the manner intended by management. We use the following factors to assess whether these criteria have been met: (1) the level of capital expenditures compared to construction
cost estimates; (2) the completion of a reasonable period of testing of mine plant and equipment; (3) the ability to produce minerals in saleable form (within specifications); and (4) the ability to sustain ongoing production of minerals.
When a mine construction project moves into the production stage, the capitalization of certain mine construction costs ceases and costs are either capitalized to inventory or expensed, except for capitalizable costs related to property, plant and equipment additions or improvements, open pit stripping activities that provide a future benefit, underground mine development or expenditures that meet the criteria for capitalization in accordance with IAS 16 Property, Plant and Equipment.
Earnings per share is computed by dividing net income available to common shareholders by the weighted average number of common shares outstanding for the period. Diluted earnings per share reflect the potential dilution that could occur if additional common shares are assumed to be issued under securities that entitle their holders to obtain common shares in the future. For stock options, the number of additional shares for inclusion in diluted earnings per share calculations is determined using the treasury stock method. Under this method, stock options, whose exercise price is less than the average market price of our common shares, are assumed to be exercised and the proceeds are used to repurchase common shares at the average market price for the period. The incremental number of common shares issued under stock options and repurchased from proceeds is included in the calculation of diluted earnings per share.
Current tax for each taxable entity is based on the local taxable income at the local statutory tax rate enacted or substantively enacted at the balance sheet date and includes adjustments to tax payable or recoverable in respect of previous periods.
Deferred tax is recognized using the balance sheet method in respect of all temporary differences between the tax bases of assets and liabilities, and their carrying amounts for financial reporting purposes, except as indicated below.
| | | | |
| BARRICK YEAR-END 2016 | | 107 | | NOTES TO FINANCIAL STATEMENTS |
Deferred income tax liabilities are recognized for all taxable temporary differences, except:
| • | | Where the deferred income tax liability arises from the initial recognition of goodwill, or the initial recognition of an asset or liability in an acquisition that is not a business combination and, at the time of the acquisition, affects neither the accounting profit nor taxable profit or loss; and |
| • | | In respect of taxable temporary differences associated with investments in subsidiaries and interests in joint arrangements, where the timing of the reversal of the temporary differences can be controlled and it is probable that the temporary differences will not reverse in the foreseeable future. |
Deferred income tax assets are recognized for all deductible temporary differences and the carry forward of unused tax assets and unused tax losses, to the extent that it is probable that taxable profit will be available against which the deductible temporary differences and the carry forward of unused tax assets and unused tax losses can be utilized, except:
| • | | Where the deferred income tax asset relating to the deductible temporary difference arises from the initial recognition of an asset or liability in an acquisition that is not a business combination and, at the time of the acquisition, affects neither the accounting profit nor taxable profit or loss; and |
| • | | In respect of deductible temporary differences associated with investments in subsidiaries and interests in joint arrangements, deferred tax assets are recognized only to the extent that it is probable that the temporary differences will reverse in the foreseeable future and taxable profit will be available against which the temporary differences can be utilized. |
The carrying amount of deferred income tax assets is reviewed at each balance sheet date and reduced to the extent that it is no longer probable that sufficient taxable profit will be available to allow all or part of the deferred income tax asset to be utilized. To the extent that an asset not previously recognized fulfills the criteria for recognition, a deferred income tax asset is recorded.
Deferred tax is measured on an undiscounted basis at the tax rates that are expected to apply in the periods in which the asset is realized or the liability is settled, based on tax rates and tax laws enacted or substantively enacted at the balance sheet date.
Current and deferred tax relating to items recognized directly in equity are recognized in equity and not in the income statement.
Royalties and Special Mining Taxes
Income tax expense includes the cost of royalty and special mining taxes payable to governments that are calculated based on a percentage of taxable profit whereby taxable profit represents net income adjusted for certain items defined in the applicable legislation.
Indirect Taxes
Indirect tax recoverable is recorded at its undiscounted amount, and is disclosed asnon-current if not expected to be recovered within twelve months.
Investments in publicly quoted equity securities that are neither subsidiaries nor associates are categorized as fair value through other comprehensive income (“FVOCI”) pursuant to the irrevocable election available in IFRS 9 for these instruments. FVOCI equity investments (referred to as “other investments”) are recorded at fair value with all realized and unrealized gains and losses recorded permanently in OCI.
Material extracted from our mines is classified as either ore or waste. Ore represents material that, at the time of extraction, we expect to process into a saleable form and sell at a profit. Raw materials are comprised of both ore in stockpiles and ore on leach pads as processing is required to extract benefit from the ore. Ore is accumulated in stockpiles that are subsequently processed into gold/copper in a saleable form. The recovery of gold and copper from certain oxide ores is achieved through the heap leaching process. Work in process represents gold/copper in the processing circuit that has not completed the production process, and is not yet in a saleable form. Finished goods inventory represents gold/copper in saleable form.
Metal Inventories are valued at the lower of cost and net realizable value. Cost is determined on a weighted average basis and includes all costs incurred, based on a normal production capacity, in bringing each product to its present location and condition. Cost of inventories comprises direct labor, materials and contractor expenses, includingnon-capitalized stripping costs; depreciation on PP&E including capitalized stripping costs; and an allocation of general and administrative costs. As ore is removed for processing, costs are removed based on the average cost per ounce/pound in the stockpile. Net realizable value is determined with reference to relevant market prices less applicable variable selling expenses.
| | | | |
| BARRICK YEAR-END 2016 | | 108 | | NOTES TO FINANCIAL STATEMENTS |
Mine operating supplies represent commodity consumables and other raw materials used in the production process, as well as spare parts and other maintenance supplies that are not classified as capital items. Provisions are recorded to reduce mine operating supplies to net realizable value, which is generally calculated by reference to its salvage or scrap value, when it is determined that the supplies are obsolete. Provisions are reversed to reflect subsequent recoveries in net realizable value where the inventory is still on hand.
Certain of our properties are subject to royalty arrangements based on mineral production at the properties. The primary type of royalty is a net smelter return (NSR) royalty. Under this type of royalty we pay the holder an amount calculated as the royalty percentage multiplied by the value of gold production at market gold prices less third-party smelting, refining and transportation costs. Royalty expense is recorded on completion of the production or sales process in cost of sales. Other types of royalties include:
| Ø | Net profits interest (NPI) royalty to other than a government, |
| Ø | Modified net smelter return (NSR) royalty, |
| Ø | Net smelter return sliding scale (NSRSS) royalty, |
| Ø | Gross proceeds sliding scale (GPSS) royalty, |
| Ø | Gross smelter return (GSR) royalty, |
| Ø | Land tenement (LT) royalty, and a |
| N) | Property, Plant and Equipment |
Estimated useful lives of Major Asset Categories
| | | | |
Buildings, plant and equipment | | 7 – 32 years | | |
| Underground mobile equipment | | 5 - 7 years | | |
| Light vehicles and other mobile equipment | | 2 - 3 years | | |
| Furniture, computer and office equipment | | 2 - 3 years | | |
Buildings, Plant and Equipment
At acquisition, we record buildings, plant and equipment at cost, including all expenditures incurred to prepare an asset for its intended use. These expenditures consist of: the purchase price; brokers’ commissions; and installation costs including architectural, design and engineering fees, legal fees, survey costs, site preparation costs, freight charges, transportation insurance costs, duties, testing and preparation charges.
We capitalize costs that meet the asset recognition criteria. Costs incurred that do not extend the productive capacity
or useful economic life of an asset are considered repairs and maintenance expense and are accounted for as a cost of the inventory produced in the period.
Buildings, plant and equipment are depreciated on a straight-line basis over their expected useful life, which commences when the assets are considered available for use. Once buildings, plant and equipment are considered available for use they are measured at cost less accumulated depreciation and applicable impairment losses.
Depreciation on equipment utilized in the development of assets, including open pit and underground mine development, is recapitalized as development costs attributable to the related asset.
Mineral Properties
Mineral properties consist of: the fair value attributable to mineral reserves and resources acquired in a business combination or asset acquisition; underground mine development costs; open pit mine development costs; capitalized exploration and evaluation costs; and capitalized interest. In addition, we incur project costs which are generally capitalized when the expenditures result in a future benefit.
i) Acquired Mining Properties
On acquisition of a mining property, we prepare an estimate of the fair value attributable to the proven and probable mineral reserves, mineral resources and exploration potential attributable to the property. The estimated fair value attributable to the mineral reserves and the portion of mineral resources considered to be probable of economic extraction at the time of the acquisition is depreciated on a units of production (“UOP”) basis whereby the denominator is the proven and probable reserves and the portion of mineral resources considered to be probable of economic extraction. The estimated fair value attributable to mineral resources that are not considered to be probable of economic extraction at the time of the acquisition is not subject to depreciation until the resources become probable of economic extraction in the future. The estimated fair value attributable to exploration licenses is recorded as an intangible asset and is not subject to depreciation until the property enters production.
ii) Underground Mine Development Costs
At our underground mines, we incur development costs to build new shafts, drifts and ramps that will enable us to physically access ore underground. The time over which we will continue to incur these costs depends on the mine life.
| | | | |
| BARRICK YEAR-END 2016 | | 109 | | NOTES TO FINANCIAL STATEMENTS |
These underground development costs are capitalized as incurred.
Capitalized underground development costs are depreciated on a UOP basis, whereby the denominator is the estimated ounces/pounds of gold/copper in proven and probable reserves and the portion of resources considered probable of economic extraction based on the current LOM plan that benefit from the development and are considered probable of economic extraction.
iii) Open Pit Stripping Costs
In open pit mining operations, it is necessary to remove overburden and other waste materials to access ore from which minerals can be extracted economically. The process of mining overburden and waste materials is referred to as stripping. Stripping costs incurred in order to provide initial access to the ore body (referred to aspre-production stripping) are capitalized as open pit mine development costs.
Pre-production stripping costs are capitalized until an “other than de minimis” level of mineral is extracted, after which time such costs are either capitalized to inventory or, if it qualifies as an open pit stripping activity that provides a future benefit, to PP&E. We consider various relevant criteria to assess when an “other than de minimis” level of mineral is produced. Some of the criteria considered would include, but are not limited to, the following: (1) the amount of minerals mined versus total ounces in life of mine (“LOM”) ore; (2) the amount of ore tons mined versus total LOM expected ore tons mined; (3) the current stripping ratio versus the LOM strip ratio; and (4) the ore grade versus the LOM grade.
Stripping costs incurred during the production stage of a pit are accounted for as costs of the inventory produced during the period that the stripping costs are incurred, unless these costs are expected to provide a future economic benefit to an identifiable component of the ore body. Components of the ore body are based on the distinct development phases identified by the mine planning engineers when determining the optimal development plan for the open pit. Production phase stripping costs generate a future economic benefit when the related stripping activity: (i) improves access to a component of the ore body to be mined in the future; (ii) increases the fair value of the mine (or pit) as access to future mineral reserves becomes less costly; and (iii) increases the productive capacity or extends the productive life of the mine (or pit). Production phase stripping costs that are expected to generate a future economic benefit are capitalized as open pit mine development costs.
Capitalized open pit mine development costs are depreciated on a UOP basis whereby the denominator is the estimated ounces/pounds of gold/copper in proven and probable reserves and the portion of resources considered probable of economic extraction based on the current LOM plan.
Construction-in-Progress
Assets under construction are capitalized asconstruction-in-progress until the asset is available for use. The cost ofconstruction-in-progress comprises its purchase price and any costs directly attributable to bringing it into working condition for its intended use.Construction-in-progress amounts related to development projects are included in the carrying amount of the development project.Construction-in-progress amounts incurred at operating mines are presented as a separate asset within PP&E.Construction-in-progress also includes deposits on long lead items.Construction-in-progress is not depreciated. Depreciation commences once the asset is complete and available for use.
Leasing Arrangements
The determination of whether an arrangement is, or contains, a lease is based on the substance of the arrangement at inception date, including whether the fulfillment of the arrangement is dependent on the use of a specific asset or assets or whether the arrangement conveys a right to use the asset.
Leasing arrangements that transfer substantially all the risks and rewards of ownership of the asset to Barrick are classified as finance leases. Assets acquired via a finance lease are recorded as an asset with a corresponding liability at an amount equal to the lower of the fair value of the leased property and the present value of the minimum lease payments. Each lease payment is allocated between the liability and finance costs using the effective interest method, whereby a constant rate of interest expense is recognized on the balance of the liability outstanding. The interest element of the lease is charged to the consolidated statement of income as a finance cost.
PP&E assets acquired under finance leases are depreciated over the shorter of the useful life of the asset and the lease term.
All other leases are classified as operating leases. Operating lease payments are recognized as an operating cost in the consolidated statements of income on a straight-line basis over the lease term.
| | | | |
| BARRICK YEAR-END 2016 | | 110 | | NOTES TO FINANCIAL STATEMENTS |
Capitalized Interest
We capitalize interest costs for qualifying assets. Qualifying assets are assets that require a significant amount of time to prepare for their intended use, including projects that are in the exploration and evaluation, development or construction stages. Qualifying assets also include significant expansion projects at our operating mines. Capitalized interest costs are considered an element of the cost of the qualifying asset which is determined based on gross expenditures incurred on an asset. Capitalization ceases when the asset is substantially complete or if active development is suspended or ceases. Where the funds used to finance a qualifying asset form part of general borrowings, the amount capitalized is calculated using a weighted average of rates applicable to the relevant borrowings during the period. Where funds borrowed are directly attributable to a qualifying asset, the amount capitalized represents the borrowing costs specific to those borrowings. Where surplus funds available out of money borrowed specifically to finance a project are temporarily invested, the total capitalized interest is reduced by income generated from short-term investments of such funds.
Insurance
We record losses relating to insurable events as they occur. Proceeds receivable from insurance coverage are recorded at such time as receipt is receivable or virtually certain and the amount receivable is fixed or determinable. For business interruption insurance the amount recoverable is only recognized when receipt is virtually certain, as supported by notification of a minimum or proposed settlement amount from the insurance adjuster.
| O) | Impairment (and Reversals of Impairment) ofNon-Current Assets |
We review and test the carrying amounts of PP&E and intangible assets with finite lives when an indicator of impairment is considered to exist. Impairment assessments on PP&E and intangible assets are conducted at the level of the cash generating unit (“CGU”), which is the lowest level for which identifiable cash flows are largely independent of the cash flows of other assets and includes most liabilities specific to the CGU. For operating mines and projects, the individual mine/project represents a CGU for impairment testing.
The recoverable amount of a CGU is the higher of Value in Use (“VIU”) and Fair Value Less Costs of Disposal (“FVLCD”). We have determined that the FVLCD is greater than the VIU amounts and therefore used as the recoverable amount for impairment testing purposes. An impairment loss is recognized for any excess of the
carrying amount of a CGU over its recoverable amount where both the recoverable amount and carrying value include the associated other assets and liabilities, including taxes where applicable, of the CGU. Where it is not appropriate to allocate the loss to a separate asset, an impairment loss related to a CGU is allocated to the carrying amount of the assets of the CGU on a pro rata basis based on the carrying amount of itsnon-monetary assets.
Impairment Reversal
An assessment is made at each reporting date to determine whether there is an indication that previously recognized impairment losses may no longer exist or may have decreased. A previously recognized impairment loss is reversed only if there has been a change in the assumptions used to determine the CGU’s recoverable amount since the last impairment loss was recognized. This reversal is recognized in the consolidated statements of income and is limited to the carrying value that would have been determined, net of any depreciation where applicable, had no impairment charge been recognized in prior years. When an impairment reversal is undertaken, the recoverable amount is assessed by reference to the higher of VIU and FVLCD. We have determined that the FVLCD is greater than the VIU amounts and therefore used as recoverable amount for impairment testing purposes.
Intangible assets acquired by way of an asset acquisition or business combination are recognized if the asset is separable or arises from contractual or legal rights and the fair value can be measured reliably on initial recognition.
On acquisition of a mineral property in the exploration stage, we prepare an estimate of the fair value attributable to the exploration licenses acquired, including the fair value attributable to mineral resources, if any, of that property. The fair value of the exploration license is recorded as an intangible asset (acquired exploration potential) as at the date of acquisition. When an exploration stage property moves into development, the acquired exploration potential attributable to that property is transferred to mining interests within PP&E.
We also have water rights associated with our mineral properties. Upon acquisition, they are measured at initial cost and are depreciated when they are being used. They are also subject to impairment testing when an indicator of impairment is considered to exist.
| | | | |
| BARRICK YEAR-END 2016 | | 111 | | NOTES TO FINANCIAL STATEMENTS |
Under the acquisition method of accounting, the costs of business combinations are allocated to the assets acquired and liabilities assumed based on the estimated fair value at the date of acquisition. The excess of the fair value of consideration paid over the fair value of the identifiable net assets acquired is recorded as goodwill. Goodwill is not amortized; instead it is tested for impairment in the fourth quarter and also when there is an indicator of impairment. At the date of acquisition, goodwill is assigned to the CGU or group of CGUs that is expected to benefit from the synergies of the business combination. For the purposes of impairment testing, goodwill is allocated to the Company’s operating segments, which are our individual mine sites and corresponds to the level at which goodwill is internally monitored by the Chief Operating Decision Maker (“CODM”), the President.
The recoverable amount of an operating segment is the higher of VIU and FVLCD. A goodwill impairment is recognized for any excess of the carrying amount of the operating segment over its recoverable amount. Goodwill impairment charges are not reversible.
Debt is recognized initially at fair value, net of financing costs incurred, and subsequently measured at amortized cost. Any difference between the amounts originally received and the redemption value of the debt is recognized in the consolidated statements of income over the period to maturity using the effective interest method.
| S) | Derivative Instruments and Hedge Accounting |
Derivative Instruments
Derivative instruments are recorded at fair value on the consolidated balance sheet, classified based on contractual maturity. Derivative instruments are classified as either hedges of the fair value of recognized assets or liabilities or of firm commitments (“fair value hedges”), hedges of highly probable forecasted transactions (“cash flow hedges”) ornon-hedge derivatives. Derivatives designated as either a fair value or cash flow hedge that are expected to be highly effective in achieving offsetting changes in fair value or cash flows are assessed on an ongoing basis to determine that they actually have been highly effective throughout the financial reporting periods for which they were designated. Derivative assets and derivative liabilities are shown separately in the balance sheet unless there is a legal right to offset and intent to settle on a net basis.
Fair Value Hedges
Changes in the fair value of derivatives that are designated and qualify as fair value hedges are recorded in the
consolidated statements of income, together with any changes in the fair value of the hedged asset or liability or firm commitment that is attributable to the hedged risk.
Cash Flow Hedges
The effective portion of changes in the fair value of derivatives that are designated and qualify as cash flow hedges is recognized in equity. The gain or loss relating to the ineffective portion is recognized in the consolidated statements of income. Amounts accumulated in equity are transferred to the consolidated statements of income in the period when the forecasted transaction impacts earnings. When the forecasted transaction that is hedged results in the recognition of anon-financial asset or anon-financial liability, the gains and losses previously deferred in equity are transferred from equity and included in the measurement of the initial carrying amount of the asset or liability.
When a derivative designated as a cash flow hedge expires or is sold and the forecasted transaction is still expected to occur, any cumulative gain or loss relating to the derivative that is recorded in equity at that time remains in equity and is recognized in the consolidated statements of income when the forecasted transaction occurs. When a forecasted transaction is no longer expected to occur, the cumulative gain or loss that was recorded in equity is immediately transferred to the consolidated statements of income.
Non-Hedge Derivatives
Derivative instruments that do not qualify as either fair value or cash flow hedges are recorded at their fair value at the balance sheet date, with changes in fair value recognized in the consolidated statements of income.
Derivatives embedded in other financial instruments or executory contracts are accounted for as separate derivatives when their risks and characteristics are not closely related to their host financial instrument or contract. In some cases, the embedded derivatives may be designated as hedges and are accounted for as described above.
| U) | Environmental Rehabilitation Provision |
Mining, extraction and processing activities normally give rise to obligations for environmental rehabilitation. Rehabilitation work can include facility decommissioning and dismantling; removal or treatment of waste materials; site and land rehabilitation, including compliance with and monitoring of environmental regulations; security and other site-related costs required to perform the
| | | | |
| BARRICK YEAR-END 2016 | | 112 | | NOTES TO FINANCIAL STATEMENTS |
rehabilitation work; and operation of equipment designed to reduce or eliminate environmental effects. The extent of work required and the associated costs are dependent on the requirements of relevant authorities and our environmental policies. Routine operating costs that may impact the ultimate closure and rehabilitation activities, such as waste material handling conducted as an integral part of a mining or production process, are not included in the provision. Costs arising from unforeseen circumstances, such as the contamination caused by unplanned discharges, are recognized as an expense and liability when the event that gives rise to an obligation occurs and reliable estimates of the required rehabilitation costs can be made.
Provisions for the cost of each rehabilitation program are normally recognized at the time that an environmental disturbance occurs or a constructive obligation is determined. When the extent of disturbance increases over the life of an operation, the provision is increased accordingly. The major parts of the carrying amount of provisions relate to tailings pond closure/rehabilitation; demolition of buildings/mine facilities; ongoing water treatment; and ongoing care and maintenance and security of closed mines. Costs included in the provision encompass all closure and rehabilitation activity expected to occur progressively over the life of the operation at the time of closure and post-closure in connection with disturbances as at the reporting date. Estimated costs included in the determination of the provision reflect the risks and probabilities of alternative estimates of cash flows required to settle the obligation at each particular operation. The expected rehabilitation costs are estimated based on the cost of external contractors performing the work or the cost of performing the work internally depending on management’s intention.
The timing of the actual rehabilitation expenditure is dependent upon a number of factors such as the life and nature of the asset, the operating license conditions and the environment in which the mine operates. Expenditures may occur before and after closure and can continue for an extended period of time depending on rehabilitation requirements. Rehabilitation provisions are measured at the expected value of future cash flows, which exclude the effect of inflation, discounted to their present value using a current US dollar real risk-freepre-tax discount rate. The unwinding of the discount, referred to as accretion expense, is included in finance costs and results in an increase in the amount of the provision. Provisions are updated each reporting period for changes to expected cash flows and for the effect of changes in the discount rate, and the change in estimate is added or deducted from
the related asset and depreciated over the expected economic life of the operation to which it relates.
Significant judgments and estimates are involved in forming expectations of future activities and the amount and timing of the associated cash flows. Those expectations are formed based on existing environmental and regulatory requirements or, if more stringent, our environmental policies which give rise to a constructive obligation. When provisions for closure and rehabilitation are initially recognized, the corresponding cost is capitalized as an asset, representing part of the cost of acquiring the future economic benefits of the operation. The capitalized cost of closure and rehabilitation activities is recognized in PP&E and depreciated over the expected economic life of the operation to which it relates.
Adjustments to the estimated amount and timing of future closure and rehabilitation cash flows are a normal occurrence in light of the significant judgments and estimates involved. The principal factors that can cause expected cash flows to change are: the construction of new processing facilities; changes in the quantities of material in reserves and resources with a corresponding change in the life of mine plan; changing ore characteristics that impact required environmental protection measures and related costs; changes in water quality that impact the extent of water treatment required; changes in discount rates; changes in foreign exchange rates; changes in Barrick’s closure policies; and changes in laws and regulations governing the protection of the environment.
Rehabilitation provisions are adjusted as a result of changes in estimates and assumptions. Those adjustments are accounted for as a change in the corresponding cost of the related assets, including the related mineral property, except where a reduction in the provision is greater than the remaining net book value of the related assets, in which case the value is reduced to nil and the remaining adjustment is recognized in the consolidated statements of income. In the case of closed sites, changes in estimates and assumptions are recognized immediately in the consolidated statements of income. For an operating mine, the adjusted carrying amount of the related asset is depreciated prospectively. Adjustments also result in changes to future finance costs.
| V) | Litigation and Other Provisions |
Provisions are recognized when a present obligation exists (legal or constructive), as a result of a past event, for which it is probable that an outflow of resources will be required to settle the obligation, and a reliable estimate can be made of the amount of the obligation. Provisions are discounted
| | | | |
| BARRICK YEAR-END 2016 | | 113 | | NOTES TO FINANCIAL STATEMENTS |
to their present value using a current US dollar real risk-freepre-tax discount rate and the accretion expense is included in finance costs.
Certain conditions may exist as of the date the financial statements are issued, which may result in a loss to the Company, but which will only be resolved when one or more future events occur or fail to occur. In assessing loss contingencies related to legal proceedings that are pending against us or unasserted claims that may result in such proceedings, the Company with assistance from its legal counsel evaluate the perceived merits of any legal proceedings or unasserted claims as well as the perceived merits of the amount of relief sought or expected to be sought.
If the assessment of a contingency suggests that a loss is probable, and the amount can be reliably estimated, then a loss is recorded. When a contingent loss is not probable but is reasonably possible, or is probable but the amount of loss cannot be reliably estimated, then details of the contingent loss are disclosed. Loss contingencies considered remote are generally not disclosed unless they involve guarantees, in which case we disclose the nature of the guarantee. Legal fees incurred in connection with pending legal proceedings are expensed as incurred. Contingent gains are only recognized when the inflow of economic benefits is virtually certain.
| W) | Stock-Based Compensation |
We recognize the expense related to these plans over the vesting period, beginning once the grant has been approved and announced to the beneficiaries.
Cash-settled awards are measured at fair value initially using the market value of the underlying shares on the day preceding the date of the grant of the award and are required to be remeasured to fair value at each reporting date until settlement. The cost is then recorded over the vesting period of the award. This expense, and any changes in the fair value of the award, is recorded to the same expense category as the award recipient’s payroll costs. The cost of a cash-settled award is recorded within liabilities until settled. Barrick offers cash-settled (Restricted Share Units (“RSU”), Deferred Share Units (“DSU”), Performance Restricted Share Units (“PRSU”)) awards to certain employees, officers and directors of the Company.
Equity-settled awards are measured at fair value using the Lattice model with market related inputs as of the date of the grant. The cost is recorded over the vesting period of the award to the same expense category as the award
recipient’s payroll costs (i.e., cost of sales, general and administrative) and the corresponding entry is recorded in equity. Equity-settled awards are not remeasured subsequent to the initial grant date. Barrick offers equity-settled (Employee Stock Option Plan (“ESOP”), Employee Share Purchase Plan (“ESPP”) Performance Granted Share Units (“PGSU”) and Global Employee Share Plan (“GESP”)), awards to certain employees, officers and directors of the Company.
We use the accelerated method (also referred to as ‘graded’ vesting) for attributing stock option expense over the vesting period. Stock option expense incorporates an expected forfeiture rate. The expected forfeiture rate is estimated based on historical forfeiture rates and expectations of future forfeiture rates. We make adjustments if the actual forfeiture rate differs from the expected rate.
Employee Stock Option Plan (“ESOP”)
Under Barrick’s ESOP, certain officers and key employees of the Corporation may purchase common shares at an exercise price that is equal to the closing share price on the day before the grant of the option. The grant date is the date when the details of the award, including the number of options granted to the individual and the exercise price, are approved. Stock options vest equally over four years, beginning in the year after granting. The ESOP arrangement has graded vesting terms, and therefore multiple vesting periods must be valued and accounted for separately over their respective vesting periods. The compensation expense of the instruments issued for each grant under the ESOP is calculated using the Lattice model. The compensation expense is adjusted by the estimated forfeiture rate which is estimated based on historical forfeiture rates and expectations of future forfeiture rates. We make adjustments if the actual forfeiture rate differs from the expected rate.
Restricted Share Units (“RSU”)
Under our RSU plan, selected employees are granted RSUs where each RSU has a value equal to one Barrick common share. RSUs generally vest within three years and primarily settle in cash upon vesting. Additional RSUs are credited to reflect dividends paid on Barrick common shares over the vesting period.
A liability for RSUs is measured at fair value on the grant date and is subsequently adjusted for changes in fair value. The liability is recognized on a straight-line basis over the vesting period, with a corresponding charge to compensation expense, as a component of corporate administration and operating segment administration.
| | | | |
| BARRICK YEAR-END 2016 | | 114 | | NOTES TO FINANCIAL STATEMENTS |
Compensation expenses for RSUs incorporate an estimate for expected forfeiture rates based on which the fair value is adjusted.
Deferred Share Units (“DSU”)
Under our DSU plan, Directors must receive at least 75% of their basic annual retainer in the form of DSUs or cash to purchase common shares that cannot be sold, transferred or otherwise disposed of until the Director leaves the Board. Each DSU has the same value as one Barrick common share. DSUs must be retained until the Director leaves the Board, at which time the cash value of the DSUs is paid out. Additional DSUs are credited to reflect dividends paid on Barrick common shares. The initial fair value of the liability is calculated as of the grant date and is recognized immediately. Subsequently, at each reporting date and on settlement, the liability is remeasured, with any change in fair value recorded as compensation expense in the period. Officers may also elect to receive a portion or all of their incentive compensation in the form of DSUs. The plan also allows granting of DSUs to other officers and employees at the discretion of the Board Compensation Committee.
Performance Restricted Share Units (“PRSU”)
Under our PRSU plan, selected employees are granted PRSUs, where each PRSU has a value equal to one Barrick common share. PRSUs vest at the end of a three-year period and are settled in cash on the third anniversary of the grant date. Additional PRSUs are credited to reflect dividends paid on Barrick common shares over the vesting period. Vesting, and therefore the liability, is based on the achievement of performance goals and the target settlement ranges from 0% to 200% of the original grant of units.
The value of a PRSU reflects the value of a Barrick common share and the number of shares issued is adjusted for its relative performance against certain competitors and other internal financial performance measures. Therefore, the fair value of the PRSUs is determined with reference to the closing stock price at each remeasurement date.
The initial fair value of the liability is calculated as of the grant date and is recognized within compensation expense using the straight-line method over the vesting period. Subsequently, at each reporting date and on settlement, the liability is remeasured, with any changes in fair value recorded as compensation expense. The fair value is adjusted for the revised estimated forfeiture rate.
Performance Granted Share Units (“PGSU”)
Under our PGSU plan, selected employees are granted PGSUs, where each PGSU has a value equal to one Barrick common share. Annual PGSU awards are determined based on a multiple ranging from one to six times base salary (depending on position and level of responsibility) multiplied by a performance factor. The number of PGSUs granted to a plan participant is determined by dividing the dollar value of the award by the closing price of Barrick common shares on the day prior to the grant, or if the grant date occurs during a blackout period, by the greater of (i) the closing price of Barrick common shares on the day prior to the grant date and (ii) the closing price of Barrick common shares on the first day following the expiration of the blackout. Upon vesting, theafter-tax value of the award is used to purchase common shares and these shares cannot be sold until the employee retires or leaves Barrick. PGSUs vest at the end of the third year from the date of the grant.
The initial fair value of the liability is calculated as of the grant date and is recognized within compensation expense using the straight-line method over the vesting period. Subsequently, at each reporting date and on settlement, the liability is remeasured, with any changes in fair value recorded as compensation expense.
Employee Share Purchase Plan (“ESPP”)
Under our ESPP plan, Barrick employees can purchase Company shares through payroll deduction. Each year, employees may contribute1%-6% of their combined base salary and annual short-term incentive, and Barrick will match 50% of the contribution, up to a maximum of C$5,000 per year.
Both Barrick and the employee make the contributions on a semi-monthly basis with the funds being transferred to a custodian who purchases Barrick Common Shares in the open market. Shares purchased with employee contributions have no vesting requirement; however, shares purchased with Barrick’s contributions vest approximately one year from contribution date. All dividend income is used to purchase additional Barrick shares.
Barrick records an expense equal to its semi-monthly cash contribution. No forfeiture rate is applied to the amounts accrued. Where an employee leaves prior to vesting, any accrual for contributions by Barrick during the year related to that employee is reversed.
| | | | |
| BARRICK YEAR-END 2016 | | 115 | | NOTES TO FINANCIAL STATEMENTS |
Global Employee Share Plan (“GESP”)
Under our GESP plan, Barrick employees are awarded Company Common Shares. These shares vest immediately, but must be held until the employee ceases to be employed by the Company. Barrick recognizes the expense when the award is announced and has no ongoing liability.
| X) | Post-Retirement Benefits |
Defined Contribution Pension Plans
Certain employees take part in defined contribution employee benefit plans whereby we contribute up to 6% of the employee’s annual salary. We also have a retirement plan for certain officers of Barrick under which we contribute 15% of the officer’s annual salary and annual short-term incentive. The contributions are recognized as compensation expense as incurred. The Company has no further payment obligations once the contributions have been paid.
Defined Benefit Pension Plans
We have qualified defined benefit pension plans that cover certain former United States and Canadian employees and provide benefits based on employees’ years of service. Our policy is to fund the amounts necessary on an actuarial basis to provide enough assets to meet the benefits payable to plan members. Independent trustees administer assets of the plans, which are invested mainly in fixed-income and equity securities.
As well as the qualified plans, we havenon-qualified defined benefit pension plans covering certain employees and former directors of Barrick. No funding is done on these plans and contributions for future years are required to be equal to benefit payments.
Actuarial gains and losses arising from experience adjustments and changes in actuarial assumptions are charged or credited to equity in OCI in the period in which they arise.
Our valuations are carried out using the projected unit credit method. We record the difference between the fair value of the plan assets and the present value of the plan obligations as an asset or liability on the consolidated balance sheets.
Pension Plan Assets and Liabilities
Pension plan assets, which consist primarily of fixed-income and equity securities, are valued using current market quotations. Plan obligations and the annual pension expense are determined on an actuarial basis and are affected by numerous assumptions and estimates including the market value of plan assets, estimates of the expected
return on plan assets, discount rates, future wage increases and other assumptions.
The discount rate and life expectancy are the assumptions that generally have the most significant impact on our pension cost and obligation.
Other Post-Retirement Benefits
We provide post-retirement medical, dental, and life insurance benefits to certain employees. Actuarial gains and losses resulting from variances between actual results and economic estimates or actuarial assumptions are recorded in OCI.
| Y) | New Accounting Standards Adopted during the Year |
The Company has adopted IFRS 9 (2014) effective January 1, 2015.
IFRS 9 (2014)
We early adopted all of the requirements of IFRS 9 Financial Instruments 2014 (“IFRS 9”) as of January 1, 2015. IFRS 9 uses a single approach to determine whether a financial asset is classified and measured at amortized cost or fair value, replacing the multiple rules in IAS 39. The approach in IFRS 9 is based on how an entity manages its financial instruments and the contractual cash flow characteristics of the financial asset. Most of the requirements in IAS 39 for classification and measurement of financial liabilities were carried forward in IFRS 9. IFRS 9 introduced a single expected credit loss impairment model, which is based on changes in credit quality since initial recognition. The adoption of the expected credit loss impairment model did not have a significant impact on the Company’s financial statements.
IFRS 9 changed the requirements for hedge effectiveness and consequently for the application of hedge accounting. The IAS 39 effectiveness test was replaced with a requirement for an economic relationship between the hedged item and hedging instrument, and for the ‘hedged ratio’ to be the same as that used by the entity for risk management purposes. Certain restrictions that prevented some hedging strategies and hedging instruments from qualifying for hedge accounting were removed under IFRS 9. Generally, the mechanics of hedge accounting remain unchanged.
As a result of the early adoption of IFRS 9, we changed our accounting policy for financial instruments retrospectively, except as described below. The change did not result in a change in carrying value of any of our financial instruments on transition date. The two main areas of change are the accounting for a) equity securities previously classified as
| | | | |
| BARRICK YEAR-END 2016 | | 116 | | NOTES TO FINANCIAL STATEMENTS |
available for sale and b) derivative instruments, which includes the accounting for hedging relationships that now qualify for hedge accounting and the exclusion of the time value component of options from hedging instruments.
| i) | Impact of adoption on the accounting for equity securities previously designated as available for sale |
The revised policy on the accounting for Other Investments, which represent equity securities previously designated as available for sale, is described in note 2k. The adjustment to opening retained earnings on January 1, 2015 for historical gains and losses on existing investments was $95 million with a corresponding adjustment to accumulated other comprehensive income. There was no impact on net loss for 2015.
| ii) | Impact of adoption on accounting for derivative instruments |
We have reassessed all of our existing hedging relationships that qualified for hedge accounting under IAS 39 upon adoption of IFRS 9 and these have continued to qualify for hedge accounting under IFRS 9. We have also reassessed economic hedges that did not qualify for hedge accounting under IAS 39. IFRS 9 enabled us to apply hedge accounting for most of our fuel positions, thus reducing the volatility of reported net income. These positions previously did not qualify for hedge accounting since component hedging was not permitted under IAS 39. We have applied these changes prospectively from January 1, 2015.
Under IFRS 9, we also began separating the intrinsic value and time value of option contracts and designating only the change in intrinsic value as the hedging instrument. IFRS 9 does not require restatement of comparatives. However, we have reflected the retrospective impact of the adoption of IFRS 9 relating to the change in accounting for time value of option contracts as an adjustment to opening retained earnings. The adjustment to opening retained earnings on January 1, 2015 was $4 million with a corresponding adjustment to accumulated other comprehensive income. There was no impact on net loss for 2015.
We recognize a financial asset or a financial liability when we become a party to the contractual provisions of the instrument. Financial assets are initially measured at fair value and are derecognized either when we have transferred substantially all the risks and rewards of ownership of the financial asset or when cash flows expire.
We classify and measure financial assets (excluding derivatives) on initial recognition as described below:
| • | | Cash and equivalents and restricted cash include cash, term deposits, treasury bills and money market investments with original maturities of less than 90 days. All of these are classified as financial assets at fair value through profit or loss and are measured at fair value. Unrealized gains or losses related to changes in fair value are reported in income; |
| • | | Trade and other receivables are classified as and measured at amortized cost using the effective interest method, less impairment allowance, if any; |
| • | | Equity instruments are designated as financial assets at fair value through other comprehensive income and are recorded at fair value on the settlement date, net of transaction costs. Future changes in fair value are recognized in other comprehensive income and are not recycled into income. |
Financial liabilities (excluding derivatives) are derecognized when the obligation specified in the contract is discharged, cancelled or expired. For financial liabilities, IFRS 9 retains most of the IAS 39 requirements and since we do not have any financial liabilities designated at fair value through profit or loss, the adoption of IFRS 9 did not impact our accounting policies for financial liabilities.
| Z) | New Accounting Standards Issued But Not Yet Effective |
IFRS 15 Revenue from Contracts with Customers
In May 2014, the IASB issued IFRS 15 Revenue from Contracts with Customers, which covers principles that an entity shall apply to report useful information to users of financial statements about the nature, amount, timing, and uncertainty of revenue and cash flows arising from a contract with a customer. In September 2015, the IASB deferred the effective date of the standard to annual reporting periods beginning on or after January 1, 2018, with earlier application permitted. We will not be early adopting IFRS 15. We are currently assessing the impact on our consolidated financial statements. We have identified two potential areas of impact:
| • | | Bullion (gold and silver) sales – we do not anticipate these sales to be significantly affected by IFRS 15 |
| • | | Concentrate (gold and copper) and cathode (copper) sales – we do not anticipate these sales or the associated provisional pricing adjustments to be significantly affected by IFRS 15 |
We will continue to assess and implement the new revenue recognition policy and any related impact on our internal controls throughout 2017.
| | | | |
| BARRICK YEAR-END 2016 | | 117 | | NOTES TO FINANCIAL STATEMENTS |
IFRS 16 Leases
In January 2016, the IASB issued IFRS 16 Leases, which requires lessees to recognize assets and liabilities for most leases. Application of the standard is mandatory for annual reporting periods beginning on or after January 1, 2019, with earlier application permitted, provided the new revenue standard, IFRS 15 Revenue from Contracts with Customers, has been applied or is applied at the same date as IFRS 16. We are currently assessing the impact on our consolidated financial statements along with timing of our adoption of IFRS 16. We expect that IFRS 16 will result in an increase in assets and liabilities as fewer leases will be expensed as payments are made. We expect an increase in depreciation and accretion expenses and also an increase in cash flow from operating activities as these lease payments will be recorded as financing outflows in our cash flow statement. In 2017, we plan to develop a full implementation plan and will provide updates to our assessment in our quarterly interim financial statements.
3 > CRITICAL JUDGMENTS, ESTIMATES, ASSUMPTIONS AND RISKS
Many of the amounts included in the consolidated balance sheet require management to make judgments and/or estimates. These judgments and estimates are continuously evaluated and are based on management’s experience and knowledge of the relevant facts and circumstances. Actual results may differ from the estimates. Information about such judgments and estimates is contained in the description of our accounting policies and/or other notes to the financial statements. The key areas where judgments, estimates and assumptions have been made are summarized below.
Life of Mine (“LOM”) Plans and Reserves and Resources
Estimates of the quantities of proven and probable mineral reserves and mineral resources form the basis for our LOM plans, which are used for a number of important business and accounting purposes, including: the calculation of depreciation expense; the capitalization of production phase stripping costs; and forecasting the timing of the payments related to the environmental rehabilitation provision. In addition, the underlying LOM plans are used in the impairment tests for goodwill andnon-current assets. In certain cases, these LOM plans have made assumptions about our ability to obtain the necessary permits required to complete the planned activities. We estimate our ore reserves and mineral resources based on information compiled by qualified persons as defined in accordance with the Canadian Securities Administrators’ National Instrument43-101 Standards of Disclosure for Mineral Projects requirements. As at December 31, 2016, we have
used a per ounce gold price of $1,000 short-term and $1,200 long-term to calculate our gold reserves, consistent with what was used as at December 31, 2015. Refer to notes 19 and 21.
Inventory
The measurement of inventory including the determination of its net realizable value, especially as it relates to ore in stockpiles, involves the use of estimates. Estimation is required in determining the tonnage, recoverable gold and copper contained therein, and in determining the remaining costs of completion to bring inventory into its saleable form. Judgment also exists in determining whether to recognize a provision for obsolescence on mine operating supplies, and estimates are required to determine salvage or scrap value of supplies.
Estimates of recoverable gold or copper on the leach pads are calculated from the quantities of ore placed on the leach pads (measured tons added to the leach pads), the grade of ore placed on the leach pads (based on assay data) and a recovery percentage (based on ore type).
Impairment and Reversal of Impairment forNon-current Assets and Impairment of Goodwill
Goodwill andnon-current assets are tested for impairment if there is an indicator of impairment or reversal of impairment, and in the case of goodwill, annually during the fourth quarter for all of our operating segments. We consider both external and internal sources of information for indications thatnon-current assets and/or goodwill are impaired. External sources of information we consider include changes in the market, economic and legal environment in which the CGU operates that are not within its control and affect the recoverable amount of mining interests and goodwill. Internal sources of information we consider include the manner in which mining properties and plant and equipment are being used or are expected to be used and indications of economic performance of the assets. Calculating the FVLCD of CGUs fornon-current asset and goodwill impairment tests requires management to make estimates and assumptions with respect to future production levels, operating and capital costs in our LOM plans, future metal prices, foreign exchange rates, Net Asset Value (“NAV”) multiples, value of reserves outside LOM plans in relation to the assumptions related to comparable entities and the market values per ounce and per pound and discount rates. Changes in any of the assumptions or estimates used in determining the fair values could impact the impairment analysis. Refer to notes 2o, 2q and 21 for further information.
| | | | |
| BARRICK YEAR-END 2016 | | 118 | | NOTES TO FINANCIAL STATEMENTS |
Provisions for Environmental Rehabilitation
Management assesses its provision for environmental rehabilitation on an annual basis or when new information becomes available. This assessment includes the estimation of the future rehabilitation costs, the timing of these expenditures, and the impact of changes in discount rates and foreign exchange rates. The actual future expenditures may differ from the amounts currently provided if the estimates made are significantly different than actual results or if there are significant changes in environmental and/or regulatory requirements in the future. Refer to notes 2u and 27 for further information.
Taxes
Management is required to make estimations regarding the tax basis of assets and liabilities and related deferred income tax assets and liabilities, amounts recorded for uncertain tax positions, the measurement of income tax expense and indirect taxes, and estimates of the timing of repatriation of earnings, which would impact the recognition of withholding taxes and taxes related to the outside basis on subsidiaries/associates. A number of these estimates require management to make estimates of future taxable profit, as well as the recoverability of indirect taxes, and if actual results are significantly different than our estimates, the ability to realize the deferred tax assets and indirect tax receivables recorded on our balance sheet could be impacted. Refer to notes 2j, 12 and 30 for further information.
Contingencies
Contingencies can be either possible assets or possible liabilities arising from past events which, by their nature, will only be resolved when one or more future events not wholly within our control occur or fail to occur. The assessment of such contingencies inherently involves the exercise of significant judgment and estimates of the outcome of future events. In assessing loss contingencies related to legal proceedings that are pending against us or unasserted claims that may result in such proceedings or regulatory or government actions that may negatively impact our business or operations, the Company with assistance from its legal counsel evaluates the perceived merits of any legal proceedings or unasserted claims or actions as well as the perceived merits of the nature and amount of relief sought or expected to be sought, when determining the amount, if any, to recognize as a contingent liability or assessing the impact on the carrying value of assets. Contingent assets are not recognized in the consolidated financial statements. Refer to note 36 for more information.
Pascua-Lama
The Pascua-Lama project received $429 million as at December 31, 2016 ($382 million as at December 31, 2015) in value added tax (“VAT”) refunds in Chile relating to the development of the Chilean side of the project. Under the current arrangement this amount plus interest of $236 million (2015: $170 million) must be repaid if the project does not evidence exports for an amount of $3,538 million within a term that expires on June 30, 2018. On January 25, 2017, Barrick applied for an extension of the 2018 deadline. No amounts have been recorded for any potential liability related to VAT refunds in Chile. We have recorded $255 million in VAT recoverable in Argentina as of December 31, 2016 ($308 million, December 31, 2015) relating to the development of the Argentine side of the project. These amounts may not be recoverable if the project does not enter into production and are subject to devaluation risk as the amounts are recoverable in Argentinean pesos.
Streaming Transactions
The upfront cash deposit received from Royal Gold on the gold and silver streaming transaction has been accounted for as deferred revenue as we have determined that it is not a derivative as it will be satisfied through the delivery ofnon-financial items (i.e., gold and silver) rather than cash or financial assets. It is our intention to settle the obligations under the streaming arrangement through our own production and if we were to fail to settle the obligations with Royal Gold through our own production, this would lead to the streaming arrangement becoming a derivative. This would cause a change to the accounting treatment, resulting in the revaluation of the fair value of the agreement through profit and loss on a recurring basis. Refer to note 25 for further details.
Our silver sale agreement with Silver Wheaton Corp. (“Silver Wheaton”) requires us to deliver 25% of the life of mine silver production from the Pascua-Lama project once it is constructed and 100% of silver from Lagunas Norte, Pierina and Veladero mines until March 31, 2018. The completion date for Pascua-Lama was originally December 31, 2015 but was subsequently extended to June 30, 2020. Per the terms of the amended silver purchase agreement, if the requirements of the completion guarantee have not been satisfied by June 30, 2020, the agreement may be terminated by Silver Wheaton, in which case, they will be entitled to the return of the upfront cash consideration paid less credit for silver delivered up to the date of that event. The cash liability at December 31, 2016 is $288 million.
| | | | |
| BARRICK YEAR-END 2016 | | 119 | | NOTES TO FINANCIAL STATEMENTS |
Refer to note 28 for a summary of our key financial risks.
Other Notes to the Financial Statements
| | | | |
| | | Note | |
Acquisitions and Divestitures | | | 4 | |
Segment information | | | 5 | |
Revenue | | | 6 | |
Cost of sales | | | 7 | |
Exploration, evaluation and project expenses | | | 8 | |
Other expense (income) | | | 9 | |
Impairment (reversals) charges | | | 10 | |
General and administrative expenses | | | 11 | |
Income tax expense (recovery) | | | 12 | |
Earnings (loss) per share | | | 13 | |
Finance costs, net | | | 14 | |
Cash flow - other items | | | 15 | |
Investments | | | 16 | |
Inventories | | | 17 | |
Accounts receivable and other current assets | | | 18 | |
Property, plant and equipment | | | 19 | |
Goodwill and other intangible assets | | | 20 | |
| Impairment of goodwill and impairment and reversal of non-current assets | | | 21 | |
Other assets | | | 22 | |
Accounts payable | | | 23 | |
Other current liabilities | | | 24 | |
Financial instruments | | | 25 | |
Fair value measurements | | | 26 | |
Provisions | | | 27 | |
Financial risk management | | | 28 | |
Othernon-current liabilities | | | 29 | |
Deferred income taxes | | | 30 | |
Capital stock | | | 31 | |
Non-controlling interests | | | 32 | |
Remuneration of key management personnel | | | 33 | |
Stock-based compensation | | | 34 | |
Post-retirement benefits | | | 35 | |
Contingencies | | | 36 | |
| | | | |
| BARRICK YEAR-END 2016 | | 120 | | NOTES TO FINANCIAL STATEMENTS |
4 > ACQUISITIONS AND DIVESTITURES
| | | | | | | | |
| For the year ended December 31 | |
| | | 2016 | | | 2015 | |
Gross cash proceeds on divesture | | | | | | | | |
Bald Mountain | | | $ 423 | | | | $ - | |
Round Mountain | | | 165 | | | | - | |
Zaldívar | | | - | | | | 950 | |
Cowal | | | - | | | | 550 | |
Porgera | | | - | | | | 298 | |
Spring Valley | | | - | | | | 58 | |
Ruby Hill | | | - | | | | 52 | |
Other | | | - | | | | 2 | |
| | | $ 588 | | | | $ 1,910 | |
Less: cash divested | | | - | | | | (6) | |
| | | | $ 588 | | | | $ 1,904 | |
| A) | Acquisition of Robertson Property in Nevada |
On June 21, 2016, we entered into an agreement to purchase the Robertson Property in Nevada from Coral Gold Resources (“Coral”). The transaction consists of a payment of $16 million of cash along with the return of 4.15 million shares (approximate value of $1 million) of Coral currently held by Barrick and a royalty on production. The transaction has been approved by Coral shareholders and, subject to satisfaction of the remaining closing conditions, is expected to close in 2017.
| B) | Disposition of Bald Mountain and Round Mountain Mines |
On January 11, 2016, we closed the sale of our Bald Mountain mine and our 50% interest in the Round Mountain mine. We received net cash consideration of $588 million, which reflected working capital adjustments of $22 million in the second quarter of 2016. The transactions resulted in a loss of $17 million for the year ended December 31, 2016. As at December 31, 2015, all of the assets and liabilities of Bald Mountain and our 50% interest in Round Mountain were classified asheld-for-sale.
| C) | Disposition of 50 percent interest in Zaldívar mine |
On December 1, 2015, we completed the sale of 50% of our Zaldívar copper mine in Chile to Antofagasta Plc for total consideration of $1.005 billion. We received $950 million upon closing of the transaction, net of $10 million for working capital items, $20 million being held in escrow pending finalization of working capital adjustment and the remaining $25 million was to be received over the next five
years. As the agreed selling price was lower than the previously recorded book values of the Zaldívar cash generating unit, we recorded a goodwill impairment charge of $427 million for the full year 2015. The transaction resulted in a loss of $16 million for the year ended December 31, 2015 based on movements in working capital from the date of announcement until the date of completing the transaction. The transaction remained subject to a net working capital adjustment period to complete the review of the working capital which was finalized in August 2016. The finalization of consideration resulted in an additional loss on disposition of $39 million as we agreed to forfeit the amount remaining in escrow and the right to receive $25 million over five years. It also changed the fair value of the 50% of Zaldívar we retained, resulting in a write-down of our equity method investment of $49 million. We have determined that Zaldívar will be accounted for as a joint venture and upon completion we began accounting for our investment under the equity method.
| D) | Divestments of Ruby Hill and Spring Valley |
On December 17, 2015, we closed the sale of our Ruby Hill mine and Spring Valley, a development stage project, for total cash consideration of $110 million. The transaction resulted in a gain of $110 million for the year ended December 31, 2015.
| E) | Disposition of Cowal and 50 percent interest in Porgera mines |
On July 23, 2015, we completed the sale of our Cowal mine in Australia for cash consideration of $550 million. The transaction resulted in a gain of $34 million for the year ended December 31, 2015.
On August 31, 2015, we completed the sale of 50% of our interest in the Porgera mine in Papua New Guinea to Zijin Mining Group Company (“Zijin”) for cash consideration of $298 million. The transaction resulted in a gain of $39 million for the year ended December 31, 2015. Subsequent to completion of the transaction, we account for Porgera as a joint operation and include our share of Porgera’s assets, liabilities, revenues and expenses in our financial statements.
| | | | |
| BARRICK YEAR-END 2016 | | 121 | | NOTES TO FINANCIAL STATEMENTS |
5 > SEGMENT INFORMATION
Barrick’s business is organized into thirteen individual minesites, one publicly traded company and one project. Barrick’s Chief Operating Decision Maker (“CODM”), the President, reviews the operating results, assesses performance and makes capital allocation decisions at the minesite, Company and/or project level. Therefore, each individual minesite, Acacia and the Pascua-Lama project are operating segments for financial reporting purposes. Following the divestitures that were completed in 2015 and early 2016, were-evaluated our reportable operating segments and no longer report on our interests in the followingnon-core properties: Porgera, Kalgoorlie, Zaldívar and Lumwana. Our updated presentation of our reportable operating segments is now limited to six individual gold mines, Acacia and our Pascua-Lama project. The remaining operating segments, including thenon-core properties referred to above and our remaining gold and copper mines, have been grouped into an “other” category and will not be reported on individually. The prior periods have been restated to reflect the change in presentation. Segment performance is evaluated based on a number of measures including operating income before tax, production levels and unit production costs. Certain costs are managed on a consolidated basis and are therefore not reflected in segment income.
Consolidated Statements of Income Information
| | | | | | | | | | | | | | | | | | | | | | | | |
| | | | | | Cost of Sales | | | | | | | | | | |
For the year ended December 31, 2016 | | Revenue | | | Direct Mining,
Royalties and
Community Relations | | | Depreciation | | | Exploration, Evaluation
and Project Expenses | | | Other Expenses
(Income)1 | | | Segment
Income (Loss) | |
Goldstrike | | | $ 1,389 | | | | $ 633 | | | | $ 307 | | | | $ 4 | | | | $ 3 | | | | $ 442 | |
Cortez | | | 1,314 | | | | 456 | | | | 499 | | | | 6 | | | | 13 | | | | 340 | |
Pueblo Viejo3 | | | 1,548 | | | | 497 | | | | 147 | | | | - | | | | 3 | | | | 901 | |
Lagunas Norte | | | 548 | | | | 180 | | | | 96 | | | | 3 | | | | 9 | | | | 260 | |
Veladero | | | 685 | | | | 346 | | | | 118 | | | | 1 | | | | - | | | | 220 | |
Turquoise Ridge | | | 322 | | | | 128 | | | | 27 | | | | - | | | | 1 | | | | 166 | |
Acacia3 | | | 1,045 | | | | 553 | | | | 166 | | | | 27 | | | | - | | | | 299 | |
Pascua-Lama | | | - | | | | - | | | | 7 | | | | 59 | | | | 1 | | | | (67) | |
Other Mines4 | | | 1,707 | | | | 958 | | | | 188 | | | | 6 | | | | 52 | | | | 503 | |
| | | | $ 8,558 | | | | $ 3,751 | | | | $ 1,555 | | | | $ 106 | | | | $ 82 | | | | $ 3,064 | |
Consolidated Statements of Income Information
| | | | | | | | | | | | | | | | | | | | | | | | |
| | | | | | Cost of Sales | | | | | | | | | | |
For the year ended
December 31, 2015 | | Revenue | | | Direct Mining,
Royalties and
Community Relations | | | Depreciation | | | Exploration, Evaluation
and Project Expenses | | | Other Expenses
(Income)1 | | | Segment
Income (Loss) | |
Goldstrike | | | $ 1,143 | | | | $ 530 | | | | $ 192 | | | | $ 9 | | | | $ 4 | | | | $ 408 | |
Cortez | | | 1,129 | | | | 483 | | | | 343 | | | | 2 | | | | 14 | | | | 287 | |
Pueblo Viejo3 | | | 1,332 | | | | 627 | | | | 277 | | | | 2 | | | | 1 | | | | 425 | |
Lagunas Norte | | | 673 | | | | 209 | | | | 169 | | | | 2 | | | | 8 | | | | 285 | |
Veladero | | | 720 | | | | 391 | | | | 108 | | | | 2 | | | | 3 | | | | 216 | |
Turquoise Ridge | | | 235 | | | | 118 | | | | 23 | | | | - | | | | 2 | | | | 92 | |
Acacia3 | | | 860 | | | | 694 | | | | 143 | | | | 26 | | | | (2) | | | | (1) | |
Pascua-Lama | | | - | | | | - | | | | 22 | | | | 118 | | | | (9) | | | | (131) | |
Other Mines2,4 | | | 2,937 | | | | 1,969 | | | | 463 | | | | 9 | | | | 12 | | | | 484 | |
| | | | $ 9,029 | | | | $ 5,021 | | | | $ 1,740 | | | | $ 170 | | | | $ 33 | | | | $ 2,065 | |
| 1 | Includes accretion expense, which is included with finance costs in the consolidated statements of income. For the year ended December 31, 2016, accretion expense was $41 million (2015: $54 million). Refer to note 9a for details of other expenses (income). |
| 2 | Includes revenues and segment income (loss) for the year ended December 31, 2015, for Porgera ($506 million, $125 million), Kalgoorlie ($358 million, $45 million), Lumwana ($501 million, $53 million) and Zaldívar ($528 million, $104 million). These mines were individually disclosed as operating segments in the prior year. |
| 3 | Includesnon-controlling interest portion of revenues, cost of sales and segment income for the year ended December 31, 2016, for Pueblo Viejo $623 million, $249 million, $373 million (2015: $575 million, $379 million, $195 million) and Acacia $377 million, $259 million, $108 million (2015: $310 million, $302 million, $nil million). |
| 4 | Includes cost of sales of Pierina for the year ended December 31, 2016 of $82 million (2015: $62 million). |
| | | | |
| BARRICK YEAR-END 2016 | | 122 | | NOTES TO FINANCIAL STATEMENTS |
Reconciliation of Segment Income to Loss from Continuing Operations Before Income Taxes
| | | | | | | | |
| For the years ended December 31 | | 2016 | | | 2015 | |
Segment income | | | $ 3,064 | | | | $ 2,065 | |
Other cost of sales/amortization1 | | | (99) | | | | (146) | |
Exploration, evaluation and project expenses not attributable to segments | | | (131) | | | | (185) | |
General and administrative expenses | | | (256) | | | | (233) | |
Other (expense) income not attributable to segments | | | (19) | | | | 92 | |
Impairment reversals (charges) | | | 250 | | | | (3,897) | |
Loss on currency translation | | | (199) | | | | (120) | |
Closed mine rehabilitation | | | (130) | | | | (3) | |
Income (loss) from equity investees | | | 20 | | | | (7) | |
Finance costs, net (includesnon-segment accretion)2 | | | (734) | | | | (672) | |
Gain (loss) onnon-hedge derivatives3 | | | 12 | | | | (38) | |
Income (loss) before income taxes | | | $ 1,778 | | | | $ (3,144) | |
| 1 | Includes all realized hedge losses of $73 million (2015: $106 million). |
| 2 | Includes debt extinguishment losses of $129 million (2015: $68 million gains). |
| 3 | Includes unrealizednon-hedge gains and losses of $32 million gains (2015: $5 million losses). |
Geographic Information
| | | | | | | | | | | | | | | | | | | | |
| | | Non-current assets | | | | | | Revenue1 | |
| | | As at Dec. 31, 2016 | | | As at Dec. 31, 2015 | | | | | | 2016 | | | 2015 | |
United States | | | $ 6,768 | | | | $ 7,375 | | | | | | | | $ 3,081 | | | | $ 3,076 | |
Dominican Republic | | | 3,540 | | | | 3,576 | | | | | | | | 1,548 | | | | 1,332 | |
Argentina | | | 2,366 | | | | 2,177 | | | | | | | | 685 | | | | 720 | |
Chile | | | 1,945 | | | | 2,020 | | | | | | | | - | | | | 502 | |
Tanzania | | | 1,673 | | | | 1,648 | | | | | | | | 1,045 | | | | 860 | |
Peru | | | 678 | | | | 627 | | | | | | | | 663 | | | | 734 | |
Australia | | | 478 | | | | 518 | | | | | | | | 472 | | | | 552 | |
Zambia | | | 473 | | | | 422 | | | | | | | | 466 | | | | 501 | |
Papua New Guinea | | | 353 | | | | 342 | | | | | | | | 304 | | | | 506 | |
Saudi Arabia | | | 346 | | | | 344 | | | | | | | | - | | | | - | |
Canada | | | 503 | | | | 470 | | | | | | | | 294 | | | | 246 | |
Unallocated | | | 1,267 | | | | 1,321 | | | | | | | | - | | | | - | |
Total | | | $ 20,390 | | | | $ 20,840 | | | | | | | | $ 8,558 | | | | $ 9,029 | |
| 1 | Presented based on the location from which the product originated. |
| | | | |
| BARRICK YEAR-END 2016 | | 123 | | NOTES TO FINANCIAL STATEMENTS |
Capital Expenditures Information
| | | | | | | | |
| | | Segment Capital Expenditures1 | |
| | |
| | | For the year ended
Dec. 31, 2016 | | | For the year ended
Dec. 31, 2015 | |
| Goldstrike | | | $ 216 | | | | $ 240 | |
| Cortez | | | 142 | | | | 148 | |
| Pueblo Viejo | | | 101 | | | | 102 | |
| Lagunas Norte | | | 56 | | | | 67 | |
| Veladero | | | 95 | | | | 242 | |
| Turquoise Ridge | | | 32 | | | | 32 | |
| Acacia | | | 191 | | | | 177 | |
| Pascua-Lama | | | 20 | | | | (81) | |
| Other Mines2 | | | 230 | | | | 546 | |
| Segment total | | | $ 1,083 | | | | $ 1,473 | |
| Other items not allocated to segments | | | 36 | | | | 36 | |
| Total | | | $ 1,119 | | | | $ 1,509 | |
| 1 | Segment capital expenditures are presented for internal management reporting purposes on an accrual basis. Capital expenditures in the consolidated statements of cash flow are presented on a cash basis. In 2016, cash expenditures were $1,126 million (2015: $1,713 million) and the decrease in accrued expenditures was $7 million (2015: $204 million decrease). |
| 2 | For the year ended December 31, 2015, includes capital expenditures for Porgera ($93 million), Kalgoorlie ($34 million), Lumwana ($99 million) and Zaldívar ($85 million). These mines were individually disclosed as operating segments in the prior year. |
| | | | |
| BARRICK YEAR-END 2016 | | 124 | | NOTES TO FINANCIAL STATEMENTS |
6 > REVENUE
| | | | | | | | |
| For the years ended December 31 | | 2016 | | | 2015 | |
| Gold bullion sales1 | | | | | | | | |
| Spot market sales | | | $ 7,650 | | | | $ 7,559 | |
| Concentrate sales | | | 258 | | | | 254 | |
| | | | $ 7,908 | | | | $ 7,813 | |
| Copper sales1 | | | | | | | | |
| Copper cathode sales | | | $ - | | | | $ 501 | |
| Concentrate sales | | | 466 | | | | 501 | |
| | | | $ 466 | | | | $ 1,002 | |
| Other Sales2 | | | $ 184 | | | | $ 214 | |
| Total | | | $ 8,558 | | | | $ 9,029 | |
| 1 | Revenues include amounts transferred from OCI to earnings for commodity cash flow hedges (see note 25d). Revenue is presented net of direct sales taxes of $2 million (2015: $34 million). |
| 2 | Revenues include the sale ofby-products from our gold and copper mines and energy sales to third parties from the Monte Rio power plant at our Pueblo Viejo mine up until its disposition on August 18, 2016. |
Principal Products
All of our gold mining operations produce gold in doré form, except Acacia’s gold mines of Bulyanhulu and Buzwagi, which produce both gold doré and gold concentrate. Gold doré is unrefined gold bullion bars usually consisting of 90% gold that is refined to pure gold bullion prior to sale to our customers. Concentrate is a processing product containing the valuable ore mineral from which most of the waste mineral has been eliminated. Our Lumwana and Jabal Sayid mines produce a concentrate that primarily contains copper. At our Zaldívar mine we produce copper cathode, which consists of 99.9% copper. In December 2015 we disposed of 50% of our Zaldívar mine and began equity accounting for it. Incidental revenues from the sale ofby-products, primarily copper, silver and energy at our gold mines, are classified within other sales.
Provisional Copper and Gold Sales
We have provisionally priced sales for which price finalization, referenced to the relevant copper and gold index, is outstanding at the balance sheet date. Our exposure at December 31, 2016 to the impact of movements in market commodity prices for provisionally priced sales is set out in the following table:
| | | | | | | | | | | | | | | | |
| | | Volumes subject to
final pricing
Copper (millions)
Gold (000s) | | | Impact on net
income before
taxation of 10%
movement in
market price US$ | |
| As at December 31 | | 2016 | | | 2015 | | | 2016 | | | 2015 | |
| | | | |
| Copper pounds | | | 44 | | | | 55 | | | | $ 11 | | | | $ 11 | |
| Gold ounces | | | 13 | | | | 16 | | | | 2 | | | | 2 | |
For the year ended December 31, 2016, our provisionally priced copper sales included provisional pricing gains of $22 million (2015: $67 million loss) and our provisionally priced gold sales included provisional pricing adjustments of $nil million (2015: $3 million loss).
At December 31, 2016, our provisionally priced copper and gold sales subject to final settlement were recorded at average prices of $2.51/lb (2015: $2.10/lb) and $1,152/oz (2015: $1,068/oz), respectively. The sensitivities in the above tables have been determined as the impact of a 10% change in commodity prices at each reporting date, while holding all other variables, including foreign currency exchange rates, constant.
7 > COST OF SALES
| | | | | | | | | | | | | | | | | | | | | | | | | | | | | | | | |
| | | Gold | | | Copper | | | Other5 | | | Total | |
| For the years ended December 31 | | 2016 | | | 2015 | | | 2016 | | | 2015 | | | 2016 | | | 2015 | | | 2016 | | | 2015 | |
| Direct mining cost1,2,3,4 | | | $ 3,215 | | | | $ 4,006 | | | | $ 228 | | | | $603 | | | | $ 77 | | | | $ 129 | | | | $ 3,520 | | | | $ 4,738 | |
| Depreciation | | | 1,503 | | | | 1,613 | | | | 45 | | | | 104 | | | | 26 | | | | 54 | | | | $ 1,574 | | | | $ 1,771 | |
| Royalty expense | | | 224 | | | | 235 | | | | 41 | | | | 101 | | | | - | | | | - | | | | $ 265 | | | | $ 336 | |
| Community relations | | | 37 | | | | 50 | | | | 5 | | | | 6 | | | | 4 | | | | 6 | | | | $ 46 | | | | $ 62 | |
| | | | | | | | | | | | | | | | | | | | | | | | | | | | | | | | | |
| Total | | | $ 4,979 | | | | $ 5,904 | | | | $ 319 | | | | $814 | | | | $ 107 | | | | $ 189 | | | | $ 5,405 | | | | $ 6,907 | |
| | | | | | | | | | | | | | | | | | | | | | | | | | | | | | | | | |
| 1 | Direct mining cost includes charges to reduce the cost of inventory to net realizable value of $68 million (2015: $285 million). |
| 2 | Direct mining cost includes the costs of extractingby-products. |
| 3 | Includes employee costs of $1,048 million (2015: $1,302 million). |
| 4 | Cost of sales also includes costs associated with power sales to third parties from our Monte Rio power plant in the Dominican Republic up until its disposition on August 18, 2016. |
| 5 | Other includes all realized hedge gains and losses and corporate amortization. |
| | | | |
| BARRICK YEAR-END 2016 | | 125 | | NOTES TO FINANCIAL STATEMENTS |
8 > EXPLORATION, EVALUATION AND PROJECT
EXPENSES
| | | | | | | | |
| For the years ended December 31 | | 2016 | | | 2015 | |
Minesite exploration and evaluation | | $ | 44 | | | $ | 47 | |
Global exploration and evaluation | | | 88 | | | | 116 | |
Advanced project costs: | | | | | | | | |
Pascua-Lama | | | 59 | | | | 119 | |
Cerro Casale | | | 6 | | | | 8 | |
Other | | | 11 | | | | 4 | |
Corporate development | | | 14 | | | | 42 | |
Business improvement | | | 15 | | | | 19 | |
Total exploration, evaluation and project expenses1 | | $ | 237 | | | $ | 355 | |
| 1 | Approximates the impact on operating cash flow. |
9 > OTHER EXPENSE (INCOME)
| | | | | | | | |
| A Other expense (income) | | | | | | | | |
| For the years ended December 31 | | 2016 | | | 2015 | |
Other Expense: | | | | | | | | |
Consulting fees | | | $ 12 | | | | $ 12 | |
Bank charges | | | 20 | | | | 19 | |
Loss (gain) on sale ofnon-current assets1 | | | 42 | | | | (187) | |
Office closure | | | (4) | | | | 30 | |
Other | | | 6 | | | | 27 | |
| Total other expense | | | $ 76 | | | | $ (99) | |
| | |
| Other Income: | | | | | | | | |
Other | | | (16) | | | | (14) | |
| Total other income | | | $ (16) | | | | $ (14) | |
| Total | | | $ 60 | | | | $ (113) | |
| 1 | 2016 includes losses of $17 million from the sale of Bald Mountain and Round Mountain and $39 million from the sale of Zaldívar. 2015 includes gains of $110 million from the sale of Ruby Hill and Spring Valley, $39 million from the sale of Porgera, and $34 million from the sale of Cowal. |
B Loss on currency translation
| | | | | | | | |
| For the years ended December 31 | | 2016 | | | 2015 | |
Currency translation losses released as a result of the disposal and reorganization of entities | | | $ 91 | | | | $ - | |
| Foreign currency translation losses | | | 108 | | | | 120 | |
| Total | | | $ 199 | | | | $ 120 | |
10 > IMPAIRMENT (REVERSALS) CHARGES
| | | | | | | | |
| For the years ended December 31 | | 2016 | | | 2015 | |
| Impairment ofnon-current assets1 | | | $ (250) | | | | $ 1,726 | |
| Impairment of goodwill1 | | | - | | | | 2,171 | |
| Total | | | $ (250) | | | | $ 3,897 | |
| 1 | Refer to note 21 for further details. |
11 > GENERAL AND ADMINISTRATIVE EXPENSES
| | | | | | | | |
| For the years ended December 31 | | 2016 | | | 2015 | |
| Corporate administration2 | | | $ 201 | | | | $ 191 | |
| Operating segment administration | | | 55 | | | | 42 | |
| Total1 | | | $ 256 | | | | $ 233 | |
| 1 | Includes employee costs of $153 million (2015: $155 million). |
| 2 | Includes $9 million (2015: $29 million) related toone-time severance payments. |
| | | | |
| BARRICK YEAR-END 2016 | | 126 | | NOTES TO FINANCIAL STATEMENTS |
12 > INCOME TAX EXPENSE (RECOVERY)
| | | | | | | | |
| For the years ended December 31 | | 2016 | | | 2015 | |
| Tax on profit | | | | | | | | |
| Current tax | | | | | | | | |
Charge for the year | | | $ 911 | | | | $ 476 | |
Adjustment in respect of prior years | | | (2) | | | | (71) | |
| | | | $ 909 | | | | $ 405 | |
| Deferred tax | | | | | | | | |
Origination and reversal of temporary differences in the current year | | | $ 10 | | | | $ (551) | |
Adjustment in respect of prior years | | | (2) | | | | 115 | |
| | | | $ 8 | | | | $ (436) | |
| Income tax expense (recovery) | | | $ 917 | | | | $ (31) | |
| Tax expense related to continuing operations | |
| Current | | | | | | | | |
Canada | | | $ 7 | | | | $3 | |
International | | | 902 | | | | 402 | |
| | | | $ 909 | | | | $ 405 | |
| Deferred | | | | | | | | |
Canada | | | $ (30) | | | | $ (32) | |
International | | | 38 | | | | (404) | |
| | | | $ 8 | | | | $ (436) | |
| Income tax expense (recovery) | | | $ 917 | | | | $ (31) | |
Currency Translation
Deferred tax balances are subject to remeasurement for changes in currency exchange rates each period. The most significant balances are Argentinean deferred tax liabilities. In 2016 and 2015, tax expense of $23 million and $62 million, respectively, primarily arose from translation losses due to the weakening of the Argentinean peso against the US dollar. These losses are included within deferred tax expense/recovery.
Non-Recognition of US Alternative Minimum Tax (AMT) Credits
In the fourth quarter 2016 and 2015, we recorded a deferred tax expense of $13 million and $19 million, respectively, related to US AMT credits which are not probable to be realized based on our current life of mine plans.
| | | | | | | | |
Reconciliation to Canadian Statutory Rate | | | | | |
For the years ended December 31 | | | 2016 | | | | 2015 | |
At 26.5% statutory rate | | | $471 | | | | $(833) | |
Increase (decrease) due to: | | | | | | | | |
Allowances and special tax deductions1 | | | (134) | | | | (103) | |
Impact of foreign tax rates2 | | | 113 | | | | (110) | |
Expenses not tax deductible | | | 54 | | | | 55 | |
Goodwill impairment charges not tax deductible | | | - | | | | 736 | |
Impairment charges not recognized in deferred tax assets | | | - | | | | 246 | |
Net currency translation losses on deferred tax balances | | | 23 | | | | 62 | |
Tax impact of profits from equity accounted investments | | | (5) | | | | - | |
Current year tax losses not recognized in deferred tax assets | | | 35 | | | | 56 | |
Internal restructures | | | - | | | | (116) | |
De-recognition of a deferred tax asset | | | - | | | | 20 | |
Non-recognition of US AMT credits | | | 13 | | | | 19 | |
Adjustments in respect of prior years | | | (4) | | | | 44 | |
Increase to income tax related contingent liabilities | | | 70 | | | | 13 | |
Impact of tax rate changes | | | (13) | | | | - | |
Other withholding taxes | | | 11 | | | | 12 | |
Mining taxes | | | 267 | | | | (125) | |
Other items | | | 16 | | | | (7) | |
Income tax expense (recovery) | | | $917 | | | | $(31) | |
| 1 | We are able to claim certain allowances and tax deductions unique to extractive industries that result in a lower effective tax rate. |
| 2 | We operate in multiple foreign tax jurisdictions that have tax rates different than the Canadian statutory rate |
Increase in Income Tax Related Contingent Liabilities in Tanzania
In the first quarter 2016, Acacia received a judgement from the Tanzania Court of Appeal regarding a long-standing dispute over tax calculations at Bulyanhulu from 2000-2006. The Court of Appeal was reviewing seven issues initially raised by the Tanzania Revenue Authority (TRA) in 2012 regarding certain historic tax loss carry forwards and ruled in favour of Bulyanhulu by the Tax Appeals Board in 2013. The TRA appealed against this ruling and in 2014 the Tax Tribunal reversed the decision for all seven issues. The legal route in Tanzania has now been exhausted; however Acacia is considering its options for the next steps. Acacia is yet to receive a revised tax assessment following the judgement, but has raised further tax provisions of US$70 million in Q1 2016 in order to address the direct impact of the ruling on Bulyanhulu’s tax loss carry forwards and the potential impact this may have on the applicability of certain capital deductions for other years and our other mines in Tanzania.
| | | | |
| BARRICK YEAR-END 2016 | | 127 | | NOTES TO FINANCIAL STATEMENTS |
Tax Rate Changes
In the fourth quarter 2016, a tax rate change was enacted in Peru, increasing corporate income tax rates. This resulted in a deferred tax recovery of $13 million due to recording the deferred tax asset in Peru at the higher rates.
Internal Restructures
In the fourth quarter 2015, a deferred tax recovery of $116 million arose from a loss that was realized on internal restructuring of subsidiary corporations. This resulted in a net increase in deferred tax assets.
13 > EARNINGS (LOSS) PER SHARE
De-recognition of a Deferred Tax Asset
In the second quarter 2015, we recorded a deferred tax expense of $20 million related tode-recognition of a deferred tax asset in Pueblo Viejo.
| | | | | | | | | | | | | | | | | | | | |
For the years ended December 31 ($ millions, except shares in millions and | | | 2016 | | | | | | | | 2015 | |
per share amounts in dollars) | | | Basic | | | | Diluted | | | | | | | | Basic | | | | Diluted | |
Net income (loss) | | | $ 861 | | | | $ 861 | | | | | | | | $ (3,113) | | | | $ (3,113) | |
Net (income) loss attributable tonon-controlling interests | | | (206) | | | | (206) | | | | | | | | 275 | | | | 275 | |
Net income (loss) attributable to equity holders of Barrick Gold Corporation | | | $ 655 | | | | $ 655 | | | | | | | | $ (2,838) | | | | $ (2,838) | |
Weighted average shares outstanding | | | 1,165 | | | | 1,165 | | | | | | | | 1,165 | | | | 1,165 | |
Basic and diluted earnings (loss) per share data attributable to the equity holders of Barrick Gold Corporation | | | $ 0.56 | | | | $ 0.56 | | | | | | | | $ (2.44) | | | | $ (2.44) | |
14 > FINANCE COSTS, NET
| | | | | | | | |
For the years ended December 31 | | | 2016 | | | | 2015 | |
Interest1 | | | $ 591 | | | | $ 737 | |
Amortization of debt issue costs | | | 17 | | | | 19 | |
Amortization of discount | | | 2 | | | | 3 | |
Loss (gain) on interest rate hedges | | | (1) | | | | 2 | |
Interest capitalized2 | | | - | | | | (17) | |
Accretion | | | 50 | | | | 63 | |
Loss (gain) on debt extinguishment3 | | | 129 | | | | (68) | |
Finance income | | | (13) | | | | (13) | |
Total | | | $ 775 | | | | $ 726 | |
| 1 | Interest in the consolidated statements of cash flow are presented on a cash basis. In 2016, cash interest paid was $513 million (2015: $677 million). |
| 2 | For the year ended December 31, 2016, the general capitalization rate was 5.90% (2015: 5.80%). |
| 3 | 2016 loss arose from partial repayment of several notes during the year (2.5% notes due 2018, 4.4% notes due 2021, 4.95% notes due 2020, 6.8% notes due 2018 and 6.95% notes due 2019). 2015 gain arose from partial repayment of several notes during the year (2.50% notes due 2018, 3.85% notes due 2022, 4.10% notes due 2023 and 6.95% notes due 2019). |
| | | | |
| BARRICK YEAR-END 2016 | | 128 | | NOTES TO FINANCIAL STATEMENTS |
15 > CASH FLOW – OTHER ITEMS
| | | | | | | | |
| A Operating Cash Flows - Other Items | | | | | | |
| | |
| For the years ended December 31 | | 2016 | | | 2015 | |
| Adjustments fornon-cash income statement items: | | | | | | | | |
(Gain) loss onnon-hedge derivatives (note 25e) | | | $ (12) | | | | $38 | |
Stock-based compensation expense | | | 82 | | | | 18 | |
(Income) loss from investment in equity investees (note 16) | | | (20) | | | | 7 | |
Change in estimate of rehabilitation costs at closed mines | | | 130 | | | | 3 | |
Net inventory impairment charges (note 17) | | | 68 | | | | 285 | |
| Change in other assets and liabilities | | | (362) | | | | (266) | |
Settlement of rehabilitation obligations | | | (62) | | | | (89) | |
| Other operating activities | | | (176) | | | | (4) | |
| Cash flow arising from changes in: | | | | | | | | |
Accounts receivable | | | (5) | | | | 81 | |
Inventory | | | (190) | | | | 24 | |
Other current assets | | | 41 | | | | 39 | |
Accounts payable | | | (190) | | | | (35) | |
Other current liabilities | | | 29 | | | | (148) | |
| Change in working capital | | | $ (315) | | | | $ (39) | |
| | |
| B Investing Cash Flows - Other Items | | | | | | |
| | |
| For the years ended December 31 | | 2016 | | | 2015 | |
| | |
| Funding of investments in equity investees (note 16) | | | $ (9) | | | | $ (7) | |
| Other | | | - | | | | (10) | |
| Other investing activities | | | $ (9) | | | | $ (17) | |
| | | | |
| BARRICK YEAR-END 2016 | | 129 | | NOTES TO FINANCIAL STATEMENTS |
16 > INVESTMENTS
Equity Accounting Method Investment Continuity
| | | | | | | | | | | | | | | | | | | | |
| | | Kabanga | | | Jabal Sayid | | | Zaldívar | | | GNX | | | Total | |
| At January 1, 2015 | | | $ 28 | | | | $ 178 | | | | $ - | | | | $ - | | | | $ 206 | |
| Funds invested | | | 2 | | | | - | | | | - | | | | 5 | | | | 7 | |
| Transfer to equity accounting method investment | | | - | | | | - | | | | 993 | | | | - | | | | 993 | |
| Loss from equity investees | | | - | | | | - | | | | (3) | | | | (4) | | | | (7) | |
| At December 31, 2015 | | | $ 30 | | | | $ 178 | | | | $ 990 | | | | $ 1 | | | | $ 1,199 | |
| Funds invested | | | 1 | | | | - | | | | - | | | | 8 | | | | 9 | |
| Working capital adjustments | | | - | | | | - | | | | 6 | | | | - | | | | 6 | |
| Equitypick-up (loss) from equity investees | | | (1) | | | | 2 | | | | 27 | | | | (8) | | | | 20 | |
| Impairment charges | | | - | | | | - | | | | (49) | | | | - | | | | (49) | |
| At December 31, 2016 | | | $ 30 | | | | $ 180 | | | | $ 974 | | | | $ 1 | | | | $ 1,185 | |
| Publicly traded | | | No | | | | No | | | | No | | | | No | | | | | |
| | | | | | | | | | | | | | | | |
| Summarized Equity Investee Financial Information | | | | | | | | |
| | | Jabal Sayid | | | Zaldívar | |
For the years ended December 31 | | | 2016 | | | | 2015 | | | | 2016 | | | | 2015 | |
Revenue | | | $ 80 | | | | $ - | | | | $ 518 | | | | $ 51 | |
Cost of sales (excluding depreciation) | | | 65 | | | | - | | | | 354 | | | | 46 | |
Depreciation | | | 12 | | | | - | | | | 87 | | | | 12 | |
Finance expense | | | - | | | | - | | | | 2 | | | | - | |
Other expense | | | - | | | | - | | | | (5) | | | | - | |
Income (loss) from continuing operations before tax | | | $3 | | | | $ - | | | | $ 80 | | | | $ (7) | |
Income tax (expense) recovery | | | - | | | | | | | | (25) | | | | 1 | |
Income (loss) from continuing operations after tax | | | $ 3 | | | | $ - | | | | $ 55 | | | | $ (6) | |
Total comprehensive income (loss) | | | $ 3 | | | | $ - | | | | $ 55 | | | | $ (6) | |
| | | | |
| Summarized Balance Sheet | | | | | | | | | | | | | | | | |
| | | Jabal Sayid | | | Zaldívar | |
For the years ended December 31 | | | 2016 | | | | 2015 | | | | 2016 | | | | 2015 | |
Cash and equivalents | | | $14 | | | | $6 | | | | $102 | | | | $17 | |
Other current assets1 | | | 56 | | | | 66 | | | | 482 | | | | 565 | |
Total current assets | | | $70 | | | | $72 | | | | $584 | | | | $582 | |
Non-current assets | | | 473 | | | | 452 | | | | 1,603 | | | | 1,640 | |
Total assets | | | $543 | | | | $524 | | | | $2,187 | | | | $2,222 | |
| | | | | | | | | | | | | | | | | |
Current financial liabilities (excluding trade, other payables & provisions) | | | $ - | | | | $ - | | | | $ - | | | | $ - | |
Other current liabilities | | | 27 | | | | 12 | | | | 107 | | | | 145 | |
Total current liabilities | | | $27 | | | | $12 | | | | $107 | | | | $145 | |
Non-current financial liabilities (excluding trade, other payables & provisions) | | | - | | | | - | | | | 26 | | | | 7 | |
Othernon-current liabilities | | | 402 | | | | 401 | | | | 87 | | | | 60 | |
Totalnon-current liabilities | | | $402 | | | | $401 | | | | $113 | | | | $67 | |
Total liabilities | | | $429 | | | | $413 | | | | $220 | | | | $212 | |
| | | | | | | | | | | | | | | | | |
Net assets | | | $114 | | | | $111 | | | | $1,967 | | | | $2,010 | |
| | | | | | | | | | | | | | | | | |
| 1 | Zaldívar other current assets include inventory of $429 million (2015: $471 million). |
The information above reflects the amounts presented in the financial information of the joint venture adjusted for differences between IFRS and local GAAP.
| | | | |
| BARRICK YEAR-END 2016 | | 130 | | NOTES TO FINANCIAL STATEMENTS |
| | | | | | | | |
Reconciliation of Summarized Financial Information to Carrying Value | | | | | | | | |
| | | | Jabal Sayid1 | | | | Zaldívar | |
Opening net assets | | | $ 111 | | | | $ 2,010 | |
Income for the period | | | 3 | | | | 55 | |
Impairment | | | - | | | | (98) | |
Closing net assets, December 31 | | | $ 114 | | | | $ 1,967 | |
Barrick’s share of net assets (50%) | | | 57 | | | | 984 | |
Equity earnings adjustment | | | - | | | | (10) | |
Goodwill recognition | | | 123 | | | | - | |
Carrying value | | | $ 180 | | | | $ 974 | |
| 1 | A $165 million non-interest bearing shareholder loan due from the Jabal Sayid JV is presented as part of Other Assets (see note 22). |
17 > INVENTORIES
| | | | | | | | | | | | | | | | |
| | | Gold | | | | Copper | |
| | |
| As at
Dec. 31, 2016 |
| |
| As at
Dec. 31, 2015 |
| |
| As at
Dec. 31, 2016 |
| |
| As at
Dec. 31, 2015 |
|
Raw materials | | | | | | | | | | | | | | | | |
Ore in stockpiles | | | $ 2,067 | | | | $ 1,912 | | | | $ 72 | | | | $ 48 | |
Ore on leach pads | | | 406 | | | | 292 | | | | - | | | | - | |
Mine operating supplies | | | 585 | | | | 633 | | | | 62 | | | | 74 | |
Work in process | | | 219 | | | | 210 | | | | - | | | | - | |
Finished products | | | 50 | | | | 42 | | | | 5 | | | | 8 | |
| | | $ 3,327 | | | | $ 3,089 | | | | $ 139 | | | | $ 130 | |
Non-current ore in stockpiles1 | | | (1,536) | | | | (1,494) | | | | - | | | | (8) | |
| | | | $ 1,791 | | | | $ 1,595 | | | | $ 139 | | | | $ 122 | |
| 1 | Ore that we do not expect to process in the next 12 months is classified within other long-term assets. |
| | | | | | | | |
Inventory Impairment Charges | | | | | | | | |
For the years ended December 31 | | | 2016 | | | | 2015 | |
Cortez | | | $ 57 | | | | $ 84 | |
Golden Sunlight | | | 7 | | | | 25 | |
Porgera | | | 3 | | | | 2 | |
Pierina | | | 1 | | | | 3 | |
Buzwagi | | | - | | | | 109 | |
Goldstrike | | | - | | | | 7 | |
Pueblo Viejo | | | - | | | | 16 | |
Veladero | | | - | | | | 16 | |
Lagunas Norte | | | - | | | | 5 | |
Turquoise Ridge | | | - | | | | 1 | |
Other | | | - | | | | 17 | |
Inventory impairment charges1 | | | $ 68 | | | | $ 285 | |
| 1 | Impairment charges in 2016 primarily relate to stockpiles at Cortez. Impairment charges in 2015 primarily relate to production costs exceeding net realizable value at Cortez, stockpile and supplies impairments at Buzwagi as well as mine operating supplies obsolescence across the sites. |
| | | | |
| BARRICK YEAR-END 2016 | | 131 | | NOTES TO FINANCIAL STATEMENTS |
| | | | | | | | |
Ore in Stockpiles | | | | | | | | |
| | | | As at Dec. 31, 2016 | | | | As at Dec. 31, 2015 | |
Gold | | | | | | | | |
Goldstrike | | | $ 932 | | | | $ 906 | |
Pueblo Viejo | | | 475 | | | | 406 | |
Cortez | | | 196 | | | | 179 | |
Porgera | | | 77 | | | | 77 | |
Kalgoorlie | | | 127 | | | | 113 | |
Lagunas Norte | | | 91 | | | | 80 | |
Buzwagi | | | 64 | | | | 38 | |
North Mara | | | 41 | | | | 48 | |
Veladero | | | 38 | | | | 34 | |
Turquoise Ridge | | | 22 | | | | 20 | |
Other | | | 4 | | | | 11 | |
Copper | | | | | | | | |
Lumwana | | | 72 | | | | 48 | |
| | | | $ 2,139 | | | | $ 1,960 | |
| | |
Ore on Leach pads | | | | | | | | |
| | | | As at Dec. 31, 2016 | | | | As at Dec. 31, 2015 | |
Gold | | | | | | | | |
Veladero | | | $ 172 | | | | $ 136 | |
Cortez | | | 109 | | | | 71 | |
Lagunas Norte | | | 97 | | | | 81 | |
Pierina | | | 28 | | | | 4 | |
| | | | $ 406 | | | | $ 292 | |
Purchase Commitments
At December 31, 2016, we had purchase obligations for supplies and consumables of approximately $970 million (2015: $1,151 million).
18 > ACCOUNTS RECEIVABLE AND OTHER CURRENT ASSETS
| | | | | | | | |
| | | | As at Dec. 31, 2016 | | | | As at Dec. 31, 2015 | |
Accounts receivable | | | | | | | | |
Amounts due from concentrate sales | | | $ 110 | | | | $ 77 | |
Receivable from Dominican Republic government1 | | | 30 | | | | 47 | |
Working capital adjustments held in escrow | | | - | | | | 20 | |
Other receivables | | | 109 | | | | 131 | |
| | | | $ 249 | | | | $ 275 | |
Other current assets | | | | | | | | |
Derivative assets (note 25f) | | | $ 1 | | | | $ - | |
Goods and services taxes recoverable2 | | | 239 | | | | 199 | |
Prepaid expenses | | | 48 | | | | 46 | |
Other | | | 18 | | | | 18 | |
| | | | $ 306 | | | | $ 263 | |
| 1 | Amounts receivable from the Dominican Republic government primarily relate to payments made by Pueblo Viejo on behalf of the government. |
| 2 | Primarily includes VAT and fuel tax recoverables of $124 million in Tanzania, $52 million in Argentina, $32 million in Chile, $10 million in the Dominican Republic, and $6 million in Peru (Dec. 31, 2015: $56 million, $56 million, $44 million, $18 million and $9 million, respectively). |
| | | | |
| BARRICK YEAR-END 2016 | | 132 | | NOTES TO FINANCIAL STATEMENTS |
19 > PROPERTY, PLANT AND EQUIPMENT
| | | | | | | | | | | | | | | | |
| | |
| Buildings,
plant and
equipment |
| |
| Mining property
costs subject to
depreciation1,3 |
| |
| Mining property costs
not subject to
depreciation1,2 |
| | | Total | |
At January 1, 2016 | | | | | | | | | | | | | | | | |
Net of accumulated depreciation | | | $ 4,684 | | | | $ 7,300 | | | | $ 2,450 | | | | $ 14,434 | |
Additions4 | | | 71 | | | | 272 | | | | 933 | | | | 1,276 | |
Disposals | | | (80) | | | | - | | | | (37) | | | | (117) | |
Depreciation | | | (794) | | | | (995) | | | | - | | | | (1,789) | |
Impairment reversals | | | 217 | | | | 79 | | | | 3 | | | | 299 | |
Transfers5 | | | 458 | | | | 538 | | | | (996) | | | | - | |
At December 31, 2016 | | | $ 4,556 | | | | $ 7,194 | | | | $ 2,353 | | | | $ 14,103 | |
| | | | |
At December 31, 2016 | | | | | | | | | | | | | | | | |
Cost | | | $ 14,111 | | | | $ 20,778 | | | | $ 14,634 | | | | $ 49,523 | |
Accumulated depreciation and impairments | | | (9,555) | | | | (13,584) | | | | (12,281) | | | | (35,420) | |
Net carrying amount - December 31, 2016 | | | $ 4,556 | | | | $ 7,194 | | | | $ 2,353 | | | | $ 14,103 | |
| | | | |
| | |
| Buildings,
plant and
equipment |
| |
| Mining property costs
subject to
depreciation1,3 |
| |
| Mining property costs
not subject to
depreciation1,2 |
| | | Total | |
At January 1, 2015 | | | | | | | | | | | | | | | | |
Cost | | | $ 15,273 | | | | $ 21,803 | | | | $ 16,060 | | | | $ 53,136 | |
Accumulated depreciation and impairments | | | (8,590) | | | | (13,539) | | | | (11,814) | | | | (33,943) | |
Net carrying amount - January 1, 2015 | | | $ 6,683 | | | | $ 8,264 | | | | $ 4,246 | | | | $ 19,193 | |
Additions4 | | | (20) | | | | 225 | | | | 1,048 | | | | 1,253 | |
Capitalized interest | | | - | | | | 17 | | | | - | | | | 17 | |
Disposals | | | (904) | | | | (734) | | | | (55) | | | | (1,693) | |
Depreciation | | | (1,030) | | | | (954) | | | | - | | | | (1,984) | |
Impairment charges | | | (1,041) | | | | (236) | | | | (470) | | | | (1,747) | |
Transfers5 | | | 1,203 | | | | 1,062 | | | | (2,265) | | | | - | |
Assets held for sale | | | (207) | | | | (344) | | | | (54) | | | | (605) | |
At December 31, 2015 | | | $ 4,684 | | | | $ 7,300 | | | | $ 2,450 | | | | $ 14,434 | |
| | | | |
At December 31, 2015 | | | | | | | | | | | | | | | | |
| | | | |
Cost | | | $ 13,782 | | | | $ 19,968 | | | | $ 14,734 | | | | $ 48,484 | |
| | | | |
Accumulated depreciation and impairments | | | (9,098) | | | | (12,668) | | | | (12,284) | | | | (34,050) | |
Net carrying amount - December 31, 2015 | | | $ 4,684 | | | | $ 7,300 | | | | $ 2,450 | | | | $ 14,434 | |
| 1 | Includes capitalized reserve acquisition costs, capitalized development costs and capitalized exploration and evaluation costs other than exploration license costs included in intangible assets. |
| 2 | Assets not subject to depreciation includes construction-in-progress, projects and acquired mineral resources and exploration potential at operating mine sites and development projects. |
| 3 | Assets subject to depreciation includes the following items for production stage properties: acquired mineral reserves and resources, capitalized mine development costs, capitalized stripping and capitalized exploration and evaluation costs. |
| 4 | Additions include revisions to the capitalized cost of closure and rehabilitation activities. |
| 5 | Primarily relates to long-lived assets that are transferred to PP&E once they are placed into service. |
| | | | |
| BARRICK YEAR-END 2016 | | 133 | | NOTES TO FINANCIAL STATEMENTS |
A Mineral Property Costs Not Subject to Depreciation
| | | | | | | | |
| | | Carrying amount at
Dec. 31, 2016 | | | Carrying amount at
Dec. 31, 2015 | |
Construction-in-progress1 | | | $ 466 | | | | $ 529 | |
| | |
Acquired mineral resources and exploration potential | | | 24 | | | | 42 | |
Projects | | | | | | | | |
Pascua-Lama | | | 1,263 | | | | 1,287 | |
Cerro Casale2 | | | 444 | | | | 444 | |
Donlin Gold | | | 156 | | | | 148 | |
| | | | $ 2,353 | | | | $ 2,450 | |
| 1 | Represents assets under construction at our operating mine sites. |
| 2 | Amounts are presented on a 100% basis and include our partner’s non-controlling interest. |
B Changes in Gold and Copper Mineral Life of Mine Plan
As part of our annual business cycle, we prepare updated estimates of proven and probable gold and copper mineral reserves and the portion of resources considered probable of economic extraction for each
mineral property. This forms the basis for our LOM plans. We prospectively revise calculations of amortization expense for property, plant and equipment amortized using the UOP method, where the denominator is our LOM ounces. The effect of changes in our LOM on amortization expense for 2016 was a $67 million decrease (2015: $94 million decrease).
C Capital Commitments and Operating Leases
In addition to entering into various operational commitments in the normal course of business, we had commitments of approximately $103 million at December 31, 2016 (2015: $120 million) for construction activities at our sites and projects.
Operating leases are recognized as an operating cost in the consolidated statements of income on a straight-line basis over the lease term. At December 31, 2016, we have operating lease commitments totaling $73 million, of which $17 million is expected to be paid within a year, $48 million is expected to be paid within two to five years and the remaining amount to be paid beyond five years.
20 > GOODWILL AND OTHER INTANGIBLE ASSETS
A Intangible Assets
| | | | | | | | | | | | | | | | | | | | |
| | | Water rights1 | | | Technology2 | | | Supply contracts3 | | | Exploration potential4 | | | Total | |
| | | | | |
Opening balance January 1, 2015 | | | $116 | | | | $14 | | | | $17 | | | | $161 | | | | $308 | |
Disposals | | | (29) | | | | - | | | | - | | | | (5) | | | | (34) | |
Amortization | | | - | | | | (2) | | | | (1) | | | | - | | | | (3) | |
Closing balance December 31, 2015 | | | $87 | | | | $12 | | | | $16 | | | | $156 | | | | $271 | |
Additions | | | - | | | | - | | | | - | | | | 4 | | | | 4 | |
Amortization | | | - | | | | (1) | | | | (2) | | | | - | | | | (3) | |
Closing balance December 31, 2016 | | | $87 | | | | $11 | | | | $14 | | | | $160 | | | | $272 | |
Cost | | | $87 | | | | $17 | | | | $39 | | | | $282 | | | | $425 | |
Accumulated amortization and impairment losses | | | - | | | | (6) | | | | (25) | | | | (122) | | | | (153) | |
| | | | | |
Net carrying amount December 31, 2016 | | | $87 | | | | $11 | | | | $14 | | | | $160 | | | | $272 | |
| 1 | Relates to water rights in South America, and will be amortized through cost of sales when we begin using these in the future. |
| 2 | The amount is amortized through cost of sales using the UOP method over LOM ounces of the Pueblo Viejo mine, with no assumed residual value. |
| 3 | Relates to a supply agreement with Michelin North America Inc. to secure a supply of tires and is amortized over the effective term of the contract through cost of sales. |
| 4 | Exploration potential consists of the estimated fair value attributable to exploration licenses acquired as a result of a business combination or asset acquisition. The carrying value of the licenses will be transferred to PP&E when the development of attributable mineral resources commences (note 2n(i)). See note 21 for details of impairment charges recorded against exploration assets. |
| | | | |
| BARRICK YEAR-END 2016 | | 134 | | NOTES TO FINANCIAL STATEMENTS |
B Goodwill
| | | | | | | | | | | | | | | | | | | | |
| | | Opening balance
January 1, 2015 | | | Impairments | | | Disposals | | | Closing balance
December 31, 2015 | | | Closing balance
December 31, 2016 | |
Goldstrike | | | $ 730 | | | | $ (730) | | | | $ - | | | | $ - | | | | $ - | |
Cortez | | | 869 | | | | (355) | | | | - | | | | 514 | | | | 514 | |
Pueblo Viejo | | | 412 | | | | (412) | | | | - | | | | - | | | | - | |
Lagunas Norte | | | 247 | | | | (247) | | | | - | | | | - | | | | - | |
Veladero | | | 195 | | | | - | | | | - | | | | 195 | | | | 195 | |
Turquoise Ridge | | | 528 | | | | - | | | | - | | | | 528 | | | | 528 | |
Hemlo | | | 63 | | | | - | | | | - | | | | 63 | | | | 63 | |
Kalgoorlie | | | 71 | | | | - | | | | - | | | | 71 | | | | 71 | |
Cowal | | | 64 | | | | - | | | | (64) | | | | - | | | | - | |
Porgera | | | 71 | | | | - | | | | (71) | | | | - | | | | - | |
Zaldívar | | | 1,176 | | | | (427) | | | | (749) | | | | - | | | | - | |
Total | | | $ 4,426 | | | | $ (2,171) | | | | $ (884) | | | | $ 1,371 | | | | $ 1,371 | |
On a total basis, the gross amount and accumulated impairment losses are as follows:
| | | | |
Cost | | $ | 8,659 | |
Accumulated impairment losses January 1, 2015 | | | (5,117 | ) |
Impairment losses 2015 | | | (2,171 | ) |
Accumulated impairment losses December 31, 2016 | | | (7,288 | ) |
Net carrying amount December 31, 2016 | | $ | 1,371 | |
| | | | |
| BARRICK YEAR-END 2016 | | 135 | | NOTES TO FINANCIAL STATEMENTS |
21 > IMPAIRMENT OF GOODWILL AND IMPAIRMENT
AND REVERSAL OF NON-CURRENT ASSETS
Summary of impairments (reversals)
For the year ended December 31, 2016, we recorded net impairment reversals of $250 million (2015: impairment of $1.7 billion) for non-current assets and $nil (2015: impairment of $2.2 billion) for goodwill, as summarized in the following table:
| | | | | | | | |
For the years ended December 31 | | | 2016 | | | | 2015 | |
Veladero | | $ | (275) | | | $ | - | |
Lagunas Norte | | | (28) | | | | 36 | |
Zaldívar | | | 49 | | | | - | |
Pueblo Viejo | | | - | | | | 1,112 | |
Pascua-Lama | | | - | | | | 399 | |
Bald Mountain/Round Mountain1 | | | - | | | | 81 | |
Buzwagi | | | - | | | | 37 | |
Oil Royalty | | | - | | | | 36 | |
Cortez | | | - | | | | 2 | |
Other | | | 4 | | | | 23 | |
Total non-current asset impairment losses (reversals) | | $ | (250) | | | $ | 1,726 | |
Goldstrike | | $ | - | | | $ | 730 | |
Zaldívar | | | - | | | | 427 | |
Pueblo Viejo | | | - | | | | 412 | |
Cortez | | | - | | | | 355 | |
Lagunas Norte | | | - | | | | 247 | |
Total goodwill impairment losses | | $ | - | | | $ | 2,171 | |
Total impairment losses (reversals) | | $ | (250) | | | $ | 3,897 | |
| 1 | As discussed in note 4b, we have disposed of Bald Mountain and Round Mountain in a single transaction. Accordingly, the impairment loss was calculated together. |
2016 Indicators of Impairment/Reversal
Fourth Quarter 2016
In the fourth quarter 2016, as per our policy, we performed our annual goodwill impairment test. No impairments were identified. Also in the fourth quarter, we reviewed the updated LOM plans for our other operating mine sites for indicators of impairment or reversal. We noted no indicators of impairment, but did note three indicators of potential impairment reversal.
As a result of improvements in the cost structure at our Veladero mine in Argentina, we have expanded the open pit in our Life of Mine (“LOM”) plan, increasing our expected production and the number of years in our plan. These changes increased Veladero’s Fair Value Less Costs of Disposal (“FVLCD”) which has resulted in a full reversal of the non-current asset impairment loss recorded in 2013.
After reflecting the amount of depreciation that would have been taken on the impaired assets, an amount of $275 million was recorded as an impairment reversal in the fourth quarter of 2016. The recoverable amount based on the mine’s FVLCD, was $1.6 billion.
Also as a result of cost improvements, we have observed an increase in the FVLCD of our Lagunas Norte mine in Peru that has resulted in a full reversal of the non-current asset impairment loss recorded in the fourth quarter of 2015. After reflecting the amount of depreciation that would have been taken on the impaired assets, an amount of $28 million was recorded as an impairment reversal in the fourth quarter of 2016. The recoverable amount, based on the mine’s FVLCD, was $630 million.
In the fourth quarter of 2016, our Lumwana copper mine in Zambia completed a new LOM plan incorporating a lower cost structure. We determined this was an indicator of potential reversal of the 2014 impairments recorded on our Lumwana mine. Based on the level of uncertainty surrounding some of the assumptions in our FVLCD calculation, we determined there existed significant uncertainty as to whether or not a change in FVLCD existed that warranted a reversal in the previously recorded impairment.
Third Quarter 2016
As noted in note 4C, in the third quarter 2016 we agreed to an adjustment of the purchase price for the 50% interest in our Zaldívar mine. This adjustment resulted in a non-current asset impairment loss of $49 million. This is in addition to the goodwill impairment loss of $427 million we recognized in third quarter 2015, as detailed below. The recoverable amount after the impairment, based on the FVLCD of our 50% equity interest, was $950 million.
Second Quarter 2016
In June 2016, the Zambian government passed legislation to amend the royalty tax for mining operations to a variable rate based on the prevailing copper price effective June 1, 2016. These rates are 4% at copper prices below $2.04 per pound; 5% at copper prices between $2.04 per pound and $2.72 per pound; and 6% at copper prices of $2.72 per pound and above. Legislation was also passed to remove the 15% variable profit tax on income from mining companies. We determined this was an indicator of potential reversal of the 2014 impairments recorded on our Lumwana copper mine and we determined the FVLCD was not in excess of the carrying value and therefore no reversal was recorded.
| | | | |
| BARRICK YEAR-END 2016 | | 136 | | NOTES TO FINANCIAL STATEMENTS |
2015 Indicators of Impairment/Reversal
Fourth Quarter 2015
In the fourth quarter 2015, as per our policy, we performed our annual goodwill impairment test. Primarily as a result of the lower gold price assumptions used in the test, which were consistent with market conditions, we identified that the carrying values of our Pueblo Viejo, Goldstrike, Cortez and Lagunas Norte mines exceeded their FVLCD. At Pueblo Viejo, a goodwill impairment loss of $412 million and a non-current asset impairment loss of $1,101 million were recorded and the recoverable amount after the impairment, based on the mine’s FVLCD, was $3.2 billion (100% basis). At Goldstrike, a goodwill impairment loss of $730 million was recorded and the recoverable amount after the impairment, based on the mine’s FVLCD, was $2.7 billion. At Cortez, a goodwill impairment loss of $355 million was recorded and the recoverable amount after the impairment, based on the mine’s FVLCD, was $3.4 billion. At Lagunas Norte, a goodwill impairment loss of $247 million and a non-current asset impairment loss of $36 million was recorded and the recoverable amount after the impairment, based on the mine’s FVLCD, was $480 million. Refer to note 20 for our remaining goodwill balances.
As at December 31, 2015, all of the assets and liabilities of Bald Mountain and Round Mountain were classified as held-for-sale. As the agreed selling price was lower than previously recognized carrying values, we recorded a non-current asset impairment loss of $81 million.
Throughout the fourth quarter 2015, the trading price of the Company’s shares declined such that the carrying value of our net assets exceeded our market capitalization. We determined that this was an indicator of impairment and tested the remaining assets that were not included in the annual goodwill impairment test. As a result, we determined two additional impairments. At our Pascua-Lama project, we recorded an impairment loss of $404 million (net of a $46 million reversal related to a specific PP&E asset). The recoverable amount after the impairment, based on the project’s FVLCD, was $810 million. At our Buzwagi mine in Tanzania (part of our Acacia subsidiary), we recorded a non-current asset impairment loss of $37 million. The recoverable amount after the impairment, based on the mine’s FVLCD, was $81 million (100% basis).
We evaluated the FVLCD of an oil royalty that we received as part of the consideration for one of the Barrick Energy dispositions in 2013 and concluded that due to the significant decline in current oil prices in the fourth quarter 2015 and the corresponding constraints on capital investment in the oil industry, its carrying value was not
recoverable. We recorded an impairment of $36 million and reduced its carrying value to nil.
In the second quarter 2015, we determined that we expected to sell the Monte Rio power asset at our Pueblo Viejo mine. Power supply to Pueblo Viejo was not impacted by this disposition. In the third quarter 2015, we entered into an agreement to sell the asset and recorded a partial reversal of this impairment based on the agreed upon sales price. For the year ended December 31, 2015, we recorded an impairment loss of $11 million to reduce its carrying value down to its net realizable value.
Third Quarter 2015
In July 2015, the Zambian government passed legislation that amended the country’s mining tax regime. This was an indicator of potential reversal of previous impairments recorded on our Lumwana mine in the fourth quarter 2014. In the third quarter 2015, we evaluated the FVLCD and concluded that, based on the current mine plan, lower short-term copper prices and a higher observable discount rate offset the lower royalty rate. Therefore no reversal of impairment was required at that time.
As at September 30, 2015, all of the assets and liabilities of Zaldívar were classified as held-for-sale as the transaction will result in a loss of control. The agreed selling price was lower than our previous assessment of FVLCD due to lower short-term copper prices, the impact of 10 months’ worth of production on the fair value and an increase in observable discount rates. For the year ended December 31, 2015 we recorded a goodwill impairment loss of $427 million as a result of this transaction. The recoverable amount after this impairment, based on the FVLCD of our 50% equity interest, was $1,010 million.
Also, in the third quarter 2015, a net reversal of non-current asset impairment of $16 million was recognized relating to the termination of contracts of certain leased assets at Pascua-Lama that had previously been impaired. They are now carried at their expected realizable value.
Key assumptions
The recoverable amount has been determined based on its estimated FVLCD, which has been determined to be greater than the VIU amounts. The key assumptions and estimates used in determining the FVLCD are related to commodity prices, discount rates, NAV multiples for gold assets, operating costs, exchange rates, capital expenditures, the LOM production profile, continued license to operate, evidence of value from current year disposals and for our projects the expected start of production. In addition, assumptions are related to observable market evaluation metrics, including identification of comparable entities, and
| | | | |
| BARRICK YEAR-END 2016 | | 137 | | NOTES TO FINANCIAL STATEMENTS |
associated market values per ounce and per pound of reserves and/or resources, as well as the valuation of resources beyond what is included in LOM plans.
Gold
For the gold segments where a recoverable amount was required to be determined, FVLCD was determined by calculating the net present value (“NPV”) of the future cash flows expected to be generated by the mines and projects within the segments (level 3 of the fair value hierarchy). The estimates of future cash flows were derived from the most recent LOM plans and, where the LOM plans excludes a material portion of total reserves and resources, we assign value to reserves and resources not considered in these models. Based on observable market or publicly available data, including forward prices and equity sell-side analyst forecasts, we make an assumption of future gold and silver prices to estimate future revenues. The future cash flows for each gold mine are discounted using a real weighted average cost of capital (“WACC”), which reflects specific market risk factors for each mine. Some gold companies trade at a market capitalization greater than the NPV of their expected cash flows. Market participants describe this as a “NAV multiple”, which represents the multiple applied to the NPV to arrive at the trading price. The NAV multiple is generally understood to take account of a variety of additional value factors such as the exploration potential of the mineral property, namely the ability to find and produce more metal than what is currently included in the LOM plan or reserve and resource estimates, and the benefit of gold price optionality. As a result, we applied a specific NAV multiple to the NPV of each CGU within each gold segment based on the NAV multiples observed in the market in recent periods and that we judged to be appropriate to the CGU.
Copper
For our copper operating segments, the FVLCD for each of the CGUs was determined based on the NPV of future cash flows expected to be generated using the most recent LOM plans (level 3 of the fair value hierarchy). Based on observable market or publicly available data including spot and forward prices and equity sell-side analyst consensus, we make an assumption of future copper prices to estimate future revenues. The future cash flows for each copper mine are discounted using a WACC depending on the location and market risk factors for each mine.
Assumptions
Our gold price assumptions used in our 2016 impairment testing are 2017: $1,050 and 2018+: $1,200. Our gold price assumptions used in our 2015 impairment testing are 2016: $1,000, 2017: $1,100 and 2018+: $1,200. The other key
assumptions used in our impairment testing are summarized in the table below:
| | | | | | | | | | |
| | | | | 2016 | | | 2015 | |
| | Copper price per lb (long-term) | | | $2.75 | | | | $3.00 | |
| | WACC – gold (range) | | | 3%-6% | | | | 3% - 8% | |
| | WACC – gold (avg) | | | 4% | | | | 4% | |
| | WACC – copper | | | 9% | | | | 7% | |
| | NAV multiple – gold (avg) | | | 1.2 | | | | 1.1 | |
| | | LOM years – gold (avg) | | | 15 | | | | 18 | |
Sensitivities
Should there be a significant decline in commodity prices, we would take actions to assess the implications on our life of mine plans, including the determination of reserves and resources, and the appropriate cost structure for the operating segments. The recoverable amount of the CGUs would be affected by these changes and also be impacted by other market factors such as changes in net asset value multiples and the value per ounce/pound of comparable market entities.
We performed a sensitivity analysis on the gold and copper prices and the WACC, which are the most significant assumptions that impact the impairment calculations. We first assumed a +/- $100 per ounce change in our gold price assumptions or a +/- $0.25 per pound change in copper price assumptions, while holding all other assumptions constant. We then assumed a +/- 1% change in our WACC, independent from the change in gold or copper prices, while holding all other assumptions constant. These sensitivities help to determine the theoretical impairment losses or impairment reversals that would be recorded with these changes in gold or copper prices and WACC. As the non-current asset impairment reversal recorded for Veladero represents a full reversal, none of the sensitivity analysis performed impacted the amount of the reversal. The full reversal of the non-current asset impairment reversal recorded for Lagunas Norte would not be recognized if the gold price per ounce was decreased by $100 and was otherwise not affected by the sensitivity analysis. Other results of the sensitivity analysis are as follows:
A $0.25 per pound increase in the copper price would cause a partial reversal of $443 million of the non-current asset impairment recorded in 2013 at Lumwana. A $0.25 per pound decrease in the copper price would result in a non-current asset impairment at Lumwana of $253 million.
| | | | |
| BARRICK YEAR-END 2016 | | 138 | | NOTES TO FINANCIAL STATEMENTS |
The carrying value of the CGUs that are most sensitive to changes in the key assumptions used in the FVLCD calculation are:
| | | | |
| As at December 31, 2016 | | Carrying value | |
Pueblo Viejo1 | | | $3,081 | |
Pascua-Lama2 | | | 581 | |
Cerro Casale2 | | | 516 | |
Lagunas Norte | | | 453 | |
Lumwana | | | 452 | |
| 1 | This CGU had an impairment loss in 2015. As there have been no indicators of impairment or impairment reversal in 2016, the carrying value would remain sensitive to the key assumptions in the FVLCD model from 2015. |
| 2 | These CGUs are most sensitive to changes to the value per ounce/pound of comparable market entities. |
22 > OTHER ASSETS
| | | | | | | | |
| | | As at Dec.
31, 2016 | | | As at Dec.
31, 2015 | |
Derivative assets (note 25f) | | | $1 | | | | $1 | |
Goods and services taxes recoverable1 | | | 303 | | | | 397 | |
Notes receivable2 | | | 274 | | | | 291 | |
Restricted cash3 | | | 118 | | | | 91 | |
Prepayments | | | 51 | | | | 60 | |
Other investments | | | 18 | | | | 8 | |
Other | | | 181 | | | | 175 | |
| | | | $946 | | | | $1,023 | |
| 1 | Includes VAT and fuel tax receivables of $255 million in Argentina, $8 million in Tanzania and $40 million in Chile (Dec. 31, 2015: $308 million, $52 million and $37 million, respectively). The VAT in Argentina is recoverable once Pascua-Lama enters production. |
| 2 | Primarily represents the interest bearing promissory note due from NovaGold and the non-interest bearing shareholder loan due from the Jabal Sayid JV as a result of the divestment of 50 percent interest in Jabal Sayid. |
| 3 | Represents cash balance at Pueblo Viejo that is contractually restricted to the disbursements for environmental rehabilitation that are expected to occur near the end of Pueblo Viejo’s mine life. |
23 > ACCOUNTS PAYABLE
| | | | | | | | |
| | | As at Dec.
31, 2016 | | | As at Dec.
31, 2015 | |
Accounts payable | | | $749 | | | | $736 | |
Accruals | | | 335 | | | | 422 | |
| | | | $1,084 | | | | $1,158 | |
24 > OTHER CURRENT LIABILITIES
| | | | | | | | |
| | | As at Dec.
31, 2016 | | | As at Dec.
31, 2015 | |
Provision for environmental rehabilitation (note 27b) | | | $67 | | | | $62 | |
| | |
Derivative liabilities (note 25f) | | | 50 | | | | 160 | |
Deposit on Pueblo Viejo gold and silver streaming agreement | | | 77 | | | | 36 | |
| | |
Share-based payments (note 34b) | | | 53 | | | | 21 | |
Deposit on Pascua-Lama silver sale agreement | | | 26 | | | | 22 | |
Other | | | 36 | | | | 36 | |
| | | | $309 | | | | $337 | |
| | | | |
| BARRICK YEAR-END 2016 | | 139 | | NOTES TO FINANCIAL STATEMENTS |
25 > FINANCIAL INSTRUMENTS
Financial instruments include cash; evidence of ownership in an entity; or a contract that imposes an obligation on one party and conveys a right to a second entity to deliver/receive cash or another financial instrument. Information on certain types of financial instruments is included elsewhere in these consolidated financial statements as follows: accounts receivable (note 18); investments (note 16); restricted share units (note 34b).
A Cash and Equivalents
Cash and equivalents include cash, term deposits, treasury bills and money market investments with original maturities of less than 90 days.
| | | | | | | | |
| | | As at Dec. 31, 2016 | | | As at Dec. 31, 2015 | |
Cash deposits | | | $ 1,009 | | | | $ 1,370 | |
Term deposits | | | 654 | | | | 313 | |
Money market investments | | | 726 | | | | 772 | |
| | | | $ 2,389 | | | | $ 2,455 | |
Of total cash and cash equivalents as of December 31, 2016, $943 million (2015: $621 million) was held in subsidiaries which have regulatory regulations, contractual restrictions or operate in countries where exchange controls and other legal restrictions apply and are therefore not available for general use by the Company. In addition, $nil million (2015: $62 million) of cash and equivalents is held in subsidiaries where we have determined the cash is reinvested for the foreseeable future for the calculation of deferred income tax. This cash can be repatriated; however, there would be a tax cost of doing so, which has not yet been recognized in these financial statements.
B Debt and Interest1
| | | | | | | | | | | | | | | | | | | | |
| | | Closing balance
December 31, 2015 | | | Proceeds | | | Repayments | | | Amortization
and other2 | | | Closing balance
December 31, 2016 | |
4.4%/5.7% notes3,9 | | | $ 2,182 | | | | $ - | | | | $ (721 | ) | | | $ 6 | | | | $ 1,467 | |
3.85%/5.25% notes | | | 1,077 | | | | - | | | | - | | | | 1 | | | | 1,078 | |
5.80% notes4,9 | | | 395 | | | | - | | | | - | | | | - | | | | 395 | |
6.35% notes5,9 | | | 592 | | | | - | | | | - | | | | 1 | | | | 593 | |
Other fixed rate notes6,9 | | | 2,451 | | | | - | | | | (848) | | | | 4 | | | | 1,607 | |
Project financing | | | 646 | | | | - | | | | (254) | | | | 8 | | | | 400 | |
Capital leases7 | | | 153 | | | | 2 | | | | (41) | | | | - | | | | 114 | |
Other debt obligations | | | 654 | | | | 3 | | | | (46) | | | | (2) | | | | 609 | |
2.5%/4.10%/5.75% notes8,9 | | | 1,690 | | | | - | | | | (123) | | | | 2 | | | | 1,569 | |
Acacia Credit Facility10 | | | 128 | | | | - | | | | (29) | | | | - | | | | 99 | |
| | | $ 9,968 | | | | $ 5 | | | | $ (2,062) | | | | $ 20 | | | | $ 7,931 | |
Less: current portion11 | | | (203) | | | | - | | | | - | | | | - | | | | (143) | |
| | | | $ 9,765 | | | | $ 5 | | | | $ (2,062) | | | | $ 20 | | | | $ 7,788 | |
| | | | |
| BARRICK YEAR-END 2016 | | 140 | | NOTES TO FINANCIAL STATEMENTS |
| | | | | | | | | | | | | | | | | | | | |
| | | Closing balance
December 31,��2014 | | | Proceeds | | | Repayments | | | Amortization
and other2 | | | Closing balance
December 31, 2015 | |
2.9%/4.4%/5.7% notes3,9 | | | $ 2,409 | | | | $ - | | | | $ (229) | | | | $ 2 | | | | $ 2,182 | |
3.85%/5.25% notes | | | 1,983 | | | | - | | | | (913) | | | | 7 | | | | 1,077 | |
5.80% notes4,9 | | | 395 | | | | - | | | | - | | | | - | | | | 395 | |
5.75%/6.35% notes5,9 | | | 855 | | | | - | | | | (264) | | | | 1 | | | | 592 | |
Other fixed rate notes6,9 | | | 2,720 | | | | - | | | | (275) | | | | 6 | | | | 2,451 | |
Project financing | | | 850 | | | | - | | | | (211) | | | | 7 | | | | 646 | |
Capital leases7 | | | 354 | | | | - | | | | (189) | | | | (12) | | | | 153 | |
Other debt obligations | | | 794 | | | | 9 | | | | (149) | | | | - | | | | 654 | |
2.5%/4.10%/5.75% notes8,9 | | | 2,579 | | | | - | | | | (898) | | | | 9 | | | | 1,690 | |
Acacia Credit Facility10 | | | 142 | | | | - | | | | (14) | | | | - | | | | 128 | |
| | | $ 13,081 | | | | $ 9 | | | | $ (3,142) | | | | $ 20 | | | | $ 9,968 | |
Less: current portion11 | | | (333) | | | | - | | | | - | | | | - | | | | (203) | |
| | | | $ 12,748 | | | | $ 9 | | | | $ (3,142) | | | | $ 20 | | | | $ 9,765 | |
| 1 | The agreements that govern our long-term debt each contain various provisions which are not summarized herein. These provisions allow Barrick, at its option, to redeem indebtedness prior to maturity at specified prices and also may permit redemption of debt by Barrick upon the occurrence of certain specified changes in tax legislation. |
| 2 | Amortization of debt premium/discount and increases (decreases) in capital leases. |
| 3 | Consists of $1.5 billion (2015: $2.2 billion) in conjunction with our wholly-owned subsidiary Barrick North America Finance LLC (“BNAF”). This consists of $629 million (2015: $1.35 billion) of BNAF notes due 2021 and $850 million of BNAF notes due 2041. |
| 4 | Consists of $400 million of 5.80% notes which mature in 2034. |
| 5 | Consists of $600 million of 6.35% notes which mature in 2036. |
| 6 | Consists of $1.6 billion (2015: $2.5 billion) in conjunction with our wholly-owned subsidiary Barrick North America Finance LLC (“BNAF”) and our wholly-owned subsidiary Barrick (PD) Australia Finance Pty Ltd. (“BPDAF”). This consists of $279 million (2015: $475 million) of BGC notes due 2019, $248 million (2015: $400 million) of BPDAF notes due 2020, $250 million of BNAF notes due 2038 and $850 million of BPDAF notes due 2039. |
| 7 | Consists primarily of capital leases at Pascua-Lama, $50 million and Lagunas Norte, $56 million (2015: $57 million and $88 million, respectively). |
| 8 | Consists of $1.6 billion (2015: $1.7 billion) in conjunction with our wholly-owned subsidiary Barrick North America Finance LLC (“BNAF”). This consists of $731 million of BGC notes due 2023 and $850 million of BNAF notes due 2043. |
| 9 | We provide an unconditional and irrevocable guarantee on all Barrick North America Finance LLC (“BNAF”), Barrick (PD) Australia Finance Pty Ltd. (“BPDAF”), Barrick Gold Finance Company (“BGFC”), and Barrick (HMC) Mining (“BHMC”) notes and generally provide such guarantees on all BNAF, BPDAF, BGFC, and BHMC notes issued, which will rank equally with our other unsecured and unsubordinated obligations. |
| 10 | Consists of an export credit backed term loan facility. |
| 11 | The current portion of long-term debt consists of project financing ($72 million; 2015: $89 million), other debt obligations ($5 million; 2015: $45 million), capital leases ($38 million; 2015: $41 million) and Acacia credit facility ($28 million; 2015: $28 million). |
1.75%/2.9%/4.4%/5.7% notes
In June 2011, Barrick, and our wholly-owned subsidiary Barrick North America Finance LLC (“BNAF”), issued an aggregate of $4.0 billion in debt securities comprised of: $700 million of 1.75% notes that had an original maturity date in 2014 and $1.1 billion of 2.90% notes that had an original maturity date in 2016 issued by Barrick (collectively, the “Barrick Notes”) as well as $1.35 billion of 4.40% notes that mature in 2021 and $850 million of 5.70% notes that mature in 2041 issued by BNAF (collectively, the “BNAF Notes”). Barrick provides an unconditional and irrevocable guarantee of the BNAF Notes. The Barrick Notes and the guarantee in respect of the BNAF Notes will rank equally with Barrick’s other unsecured and unsubordinated obligations.
During 2013, the entire balance ($700 million) of the 1.75% notes was repaid along with $871 million of the $1.1 billion of 2.9% notes. During 2015, the remainder ($229 million) of
the $1.1 billion of 2.9% notes was repaid. During 2016, $721 million of the $1.35 billion of 4.4% notes was repaid.
3.85% and 5.25% Notes
On April 3, 2012, we issued an aggregate of $2 billion in debt securities comprised of $1.25 billion of 3.85% notes that mature in 2022 and $750 million of 5.25% notes that mature in 2042. During 2015, $913 million of the 3.85% notes was repaid.
Other Fixed Rate Notes
On October 16, 2009, we issued two tranches of debentures totaling $1.25 billion through our wholly-owned indirect subsidiary Barrick (PD) Australia Finance Pty Ltd. (“BPDAF”) consisting of $850 million of 30-year notes with a coupon rate of 5.95%, and $400 million of 10-year notes with a coupon rate of 4.95%. We also provide an unconditional and irrevocable guarantee of these payments, which rank equally with our other unsecured and
| | | | |
| BARRICK YEAR-END 2016 | | 141 | | NOTES TO FINANCIAL STATEMENTS |
unsubordinated obligations. During 2016, $152 million of the $400 million of 4.95% notes was repaid.
On March 19, 2009, we issued an aggregate of $750 million of 10-year notes with a coupon rate of 6.95% for general corporate purposes. The notes are unsecured, unsubordinated obligations and rank equally with our other unsecured, unsubordinated obligations. During 2015, $275 million was repaid. During 2016, an additional $196 million was repaid.
In September 2008, we issued an aggregate of $1.25 billion of notes through our wholly-owned indirect subsidiaries Barrick North America Finance LLC and Barrick Gold Financeco LLC (collectively, the “LLCs”) consisting of $500 million of 5-year notes with a coupon rate of 6.125%, $500 million of 10-year notes with a coupon rate of 6.8%, and $250 million of 30-year notes with a coupon rate of 7.5%. We also provide an unconditional and irrevocable guarantee of these payments, which rank equally with our other unsecured and unsubordinated obligations.
During 2013, the entire balance ($500 million) of the 5-year notes with a coupon rate of 6.125% that was due in September 2013 was repaid. During 2016, the entire balance ($500 million) of the 10-year notes with a coupon rate of 6.8% was repaid.
Pueblo Viejo Project Financing Agreement
In April 2010, Barrick and Goldcorp finalized terms for $1.035 billion (100% basis) in project financing for Pueblo Viejo. The project financing was non-recourse subject to guarantees provided by Barrick and Goldcorp for their proportionate share which would terminate upon Pueblo Viejo meeting certain operating completion tests and are subject to an exclusion for certain political risk events. On February 17, 2015, we received notification that the completion tests had been met, resulting in termination of the guarantees. The lending syndicate is comprised of international financial institutions including export development agencies and commercial banks. The amount was divided into three tranches of $400 million, $375 million and $260 million with tenors of 15, 15 and 12 years, respectively. The $400 million tranche bears a coupon of LIBOR+3.25% pre-completion and scales gradually to LIBOR+5.10% (inclusive of political risk insurance premium) for years 13-15. The $375 million tranche bears a fixed coupon of 3.86% for the entire 15 years. The $260 million tranche bears a coupon of LIBOR+3.25% pre-completion and scales gradually to LIBOR+4.85% (inclusive of political risk insurance premium) for years 11-12.
We have drawn the entire $1.035 billion to date. During the year, $254 million of the financing was repaid. The remaining principal balance under the Pueblo Viejo Financing Agreement is $423 million.
Refinancing of the Credit Facility
In January 2012, we finalized a credit and guarantee agreement (the “Credit Facility”, previously referred to as the “2012 Credit Facility”) with certain Lenders, which requires such Lenders to make available to us a credit facility of $4.0 billion or the equivalent amount in Canadian dollars. The Credit Facility, which is unsecured, currently has an interest rate of LIBOR plus 2.00% on drawn amounts, and a commitment rate of 0.35% on undrawn amounts. In November 2016, $3.66 billion of the $4 billion credit facility was agreed to be extended from January 2021 to January 2022. The remaining $340 million currently terminates in January 2020. The Credit Facility is undrawn as at December 31, 2016.
2.50%/4.10%/5.75% notes
On May 2, 2013, we issued an aggregate of $3 billion in notes through Barrick and our wholly-owned indirect subsidiary Barrick North America Finance LLC consisting of $650 million of 2.50% notes that mature in 2018, $1.5 billion of 4.10% notes that mature in 2023 and $850 million of 5.75% notes issued by BNAF that mature in 2043. $2.0 billion of the net proceeds from this offering were used to repay existing indebtedness under our $4 billion revolving credit facility. We provided an unconditional and irrevocable guarantee on the $850 million of 5.75% notes issued by BNAF, which will rank equally with our other unsecured and unsubordinated obligations.
During 2013, $398 million of the $650 million 2.50% notes were repaid. During 2015, $769 million of 4.1% notes and $129 million of 2.5% notes were repaid. During 2016, the remainder ($123 million) of the $650 million of 2.5% notes was repaid.
Acacia Credit Facility
In January 2013, Acacia concluded negotiations with a group of commercial banks for the provision of an export credit backed term loan facility (the “Facility”) for the amount of US$142 million. The Facility was put in place to fund a substantial portion of the construction costs of the CIL circuit at the process plant at the Bulyanhulu Project (the “Project”). The Facility is collateralized by the Project, has a term of seven years and, when drawn, the spread over LIBOR will be 250 basis points. The Facility is repayable in equal installments over the term of the Facility, after a two-year repayment holiday period. The interest rate has been fixed at an effective rate of 3.6%
| | | | |
| BARRICK YEAR-END 2016 | | 142 | | NOTES TO FINANCIAL STATEMENTS |
through the use of an interest rate swap. At December 31, 2014, the full value of the Facility was drawn. During 2015, $14 million was repaid. During 2016, $29 million was repaid.
| | | | | | | | | | | | | | | | |
| | | 2016 | | | | | | 2015 | |
| | | | |
For the years ended December 31 | | | Interest cost | | | | Effective rate | 1 | | | Interest cost | | | | Effective rate | 1 |
2.9%/4.4%/5.7% notes | | | $ 104 | | | | 5.09% | | | | $ 120 | | | | 5.12% | |
3.85%/5.25% notes | | | 53 | | | | 4.87% | | | | 86 | | | | 4.65% | |
5.80% notes | | | 23 | | | | 5.85% | | | | 23 | | | | 5.87% | |
5.75%/6.35% notes | | | 38 | | | | 6.41% | | | | 66 | | | | 8.73% | |
Other fixed rate notes | | | 128 | | | | 6.75% | | | | 177 | | | | 6.59% | |
Project financing | | | 33 | | | | 6.23% | | | | 41 | | | | 5.46% | |
Capital leases | | | 5 | | | | 4.02% | | | | 11 | | | | 4.45% | |
Other debt obligations | | | 36 | | | | 6.09% | | | | 44 | | | | 6.08% | |
2.5%/4.10%/5.75% notes | | | 82 | | | | 4.98% | | | | 118 | | | | 4.73% | |
Acacia credit facility | | | 7 | | | | 3.59% | | | | 5 | | | | 3.59% | |
Deposits on Pascua-Lama silver sale agreement (note 29) | | | 63 | | | | 8.37% | | | | 61 | | | | 8.40% | |
Deposits on Pueblo Viejo gold and silver streaming agreement | | | | | | | | | | | | | | | | |
(note 29) | | | 37 | | | | 6.34% | | | | 9 | | | | 6.15% | |
| | | $ 609 | | | | | | | | $ 761 | | | | | |
Less: interest capitalized | | | - | | | | | | | | (17) | | | | | |
| | | | $ 609 | | | | | | | | $ 744 | | | | | |
| 1 | The effective rate includes the stated interest rate under the debt agreement, amortization of debt issue costs and debt discount/premium and the impact of interest rate contracts designated in a hedging relationship with debt. |
| | | | |
| BARRICK YEAR-END 2016 | �� | 143 | | NOTES TO FINANCIAL STATEMENTS |
Scheduled Debt Repayments1
| | | | | | | | | | | | | | | | | | | | | | | | | | | | | | | | | | | | |
| | | | Issuer | | |
| Maturity
Year |
| | | 2017 | | | | 2018 | | | | 2019 | | | | 2020 | | | | 2021 | | |
| 2022 and
thereafter |
| | | Total | |
6.95% notes3 | | | BGC | | | | 2019 | | | | $- | | | | $- | | | | $279 | | | | $- | | | | $- | | | | $- | | | | $279 | |
4.95% notes3 | | | BPDAF | | | | 2020 | | | | - | | | | - | | | | - | | | | 248 | | | | - | | | | - | | | | 248 | |
7.31% notes2 | | | BGC | | | | 2021 | | | | - | | | | - | | | | - | | | | - | | | | 7 | | | | - | | | | 7 | |
4.40% notes | | | BNAF | | | | 2021 | | | | - | | | | - | | | | - | | | | - | | | | 629 | | | | - | | | | 629 | |
3.85% notes | | | BGC | | | | 2022 | | | | - | | | | - | | | | - | | | | - | | | | - | | | | 337 | | | | 337 | |
4.10% notes | | | BGC | | | | 2023 | | | | - | | | | - | | | | - | | | | - | | | | - | | | | 731 | | | | 731 | |
7.73% notes2 | | | BGC | | | | 2025 | | | | - | | | | - | | | | - | | | | - | | | | - | | | | 7 | | | | 7 | |
7.70% notes2 | | | BGC | | | | 2025 | | | | - | | | | - | | | | - | | | | - | | | | - | | | | 5 | | | | 5 | |
7.37% notes2 | | | BGC | | | | 2026 | | | | - | | | | - | | | | - | | | | - | | | | - | | | | 32 | | | | 32 | |
8.05% notes2 | | | BGC | | | | 2026 | | | | - | | | | - | | | | - | | | | - | | | | - | | | | 15 | | | | 15 | |
6.38% notes2 | | | BGC | | | | 2033 | | | | - | | | | - | | | | - | | | | - | | | | - | | | | 200 | | | | 200 | |
5.80% notes | | | BGC | | | | 2034 | | | | - | | | | - | | | | - | | | | - | | | | - | | | | 200 | | | | 200 | |
5.80% notes | | | BGFC | | | | 2034 | | | | - | | | | - | | | | - | | | | - | | | | - | | | | 200 | | | | 200 | |
6.45% notes2 | | | BGC | | | | 2035 | | | | - | | | | - | | | | - | | | | - | | | | - | | | | 300 | | | | 300 | |
6.35% notes | | | BHMC | | | | 2036 | | | | - | | | | - | | | | - | | | | - | | | | - | | | | 600 | | | | 600 | |
7.50% notes3 | | | BNAF | | | | 2038 | | | | - | | | | - | | | | - | | | | - | | | | - | | | | 250 | | | | 250 | |
5.95% notes3 | | | BPDAF | | | | 2039 | | | | - | | | | - | | | | - | | | | - | | | | - | | | | 850 | | | | 850 | |
5.70% notes | | | BNAF | | | | 2041 | | | | - | | | | - | | | | - | | | | - | | | | - | | | | 850 | | | | 850 | |
5.25% notes | | | BGC | | | | 2042 | | | | - | | | | - | | | | - | | | | - | | | | - | | | | 750 | | | | 750 | |
5.75% notes | | | BNAF | | | | 2043 | | | | - | | | | - | | | | - | | | | - | | | | - | | | | 850 | | | | 850 | |
Other debt obligations2 | | | | | | | | | | | 4 | | | | 5 | | | | 4 | | | | - | | | | - | | | | - | | | | 13 | |
Project financing | | | | | | | | | | | 72 | | | | 72 | | | | 70 | | | | 42 | | | | 42 | | | | 125 | | | | 423 | |
Acacia credit facility | | | | | | | | | | | 29 | | | | 28 | | | | 28 | | | | 14 | | | | - | | | | - | | | | 99 | |
| | | | | | | | | | | | $105 | | | | $105 | | | | $381 | | | | $304 | | | | $678 | | | | $6,302 | | | | $7,875 | |
Minimum annual payments under capital leases | | | | | | | | | | | $38 | | | | $31 | | | | $16 | | | | $9 | | | | $6 | | | | $14 | | | | $114 | |
| 1 | This table illustrates the contractual undiscounted cash flows, and may not agree with the amounts disclosed in the consolidated balance sheet. |
| 2 | Included in Other debt obligations in the Long-Term Debt table. |
| 3 | Included in Other fixed rate notes in the Long-Term Debt table. |
| | | | |
| BARRICK YEAR-END 2016 | | 144 | | NOTES TO FINANCIAL STATEMENTS |
C Derivative Instruments (“Derivatives”)
In the normal course of business, our assets, liabilities and forecasted transactions, as reported in US dollars, are impacted by various market risks including, but not limited to:
| | |
Item | | Impacted by |
| | |
● Sales | | ● Prices of gold, silver and copper |
| | |
o By-product credits | | o Prices of silver, copper and gold |
| | |
● Cost of sales | | |
| | |
o Consumption of diesel fuel, propane, natural gas, and electricity | | o Prices of diesel fuel, propane, natural gas, and electricity |
| | |
o Non-US dollar expenditures | | o Currency exchange rates - US dollar versus A$, ARS, C$, CLP, DOP, EUR, PGK, TZS, ZAR, and ZMW |
| | |
● General and administration, exploration and evaluation costs | | ● Currency exchange rates - US dollar versus A$, ARS, C$, CLP, DOP, GBP, PGK, TZS, ZAR, and ZMW |
| | |
● Capital expenditures | | |
| | |
o Non-US dollar capital expenditures | | o Currency exchange rates - US dollar versus A$, ARS, C$, CLP, DOP, EUR, GBP, PGK, and ZAR |
| | |
o Consumption of steel | | o Price of steel |
| | |
● Interest earned on cash and equivalents | | ● US dollar interest rates |
| | |
● Interest paid on fixed-rate borrowings | | ● US dollar interest rates |
The time frame and manner in which we manage those risks varies for each item based upon our assessment of the risk and available alternatives for mitigating risk. For these particular risks, we believe that derivatives are an appropriate way of managing the risk.
We use derivatives as part of our risk management program to mitigate variability associated with changing market values related to the hedged item. Many of the derivatives we use meet the hedge effectiveness criteria and are designated in a hedge accounting relationship.
Certain derivatives are designated as either hedges of the fair value of recognized assets or liabilities or of firm commitments (“fair value hedges”) or hedges of highly probable forecasted transactions (“cash flow hedges”), collectively known as “accounting hedges”. Hedges that are expected to be highly effective in achieving offsetting changes in fair value or cash flows are assessed on an ongoing basis to determine that they actually have been highly effective throughout the financial reporting periods for which they were designated. Some of the derivative instruments we use are effective in achieving our risk management objectives, but they do not meet the strict hedge accounting criteria. These derivatives are considered to be “non-hedge derivatives”.
| | | | |
| BARRICK YEAR-END 2016 | | 145 | | NOTES TO FINANCIAL STATEMENTS |
D Summary of Derivatives at December 31, 2016
| | | | | | | | | | | | | | | | | | | | | | | | | | | | |
| | | Notional Amount by Term to Maturity | | | Accounting Classification by
Notional Amount | |
| | |
| Within 1
year |
| |
| 2 to 3
years |
| |
| 4 to 5
years |
| | | Total | | |
| Cash flow
hedge |
| | | Non-Hedge | | |
| Fair value
(USD) |
|
US dollar interest rate contracts (US$millions) | | | | | | | | | | | | | | | | | | | | | | | | | | | | |
Total receive - float swap positions | | | $28 | | | | $57 | | | | $14 | | | | $99 | | | | $99 | | | | $- | | | | $1 | |
Currency contracts | | | | | | | | | | | | | | | | | | | | | | | | | | | | |
A$:US$ contracts (A$ millions) | | | 23 | | | | - | | | | - | | | | 23 | | | | - | | | | 23 | | | | - | |
PGK:US$ contracts (PGK millions) | | | 21 | | | | - | | | | - | | | | 21 | | | | - | | | | 21 | | | | - | |
Commodity contracts | | | | | | | | | | | | | | | | | | | | | | | | | | | | |
Gold collar sell contracts (thousands of ounces) | | | 43 | | | | - | | | | - | | | | 43 | | | | - | | | | 43 | | | | 1 | |
Copper bought floor contracts (millions of pounds) | | | 78 | | | | - | | | | - | | | | 78 | | | | 65 | | | | 13 | | | | - | |
Fuel contracts (thousands of barrels)1 | | | 2,214 | | | | 1,207 | | | | - | | | | 3,421 | | | | 2,790 | | | | 631 | | | | (78 | ) |
1 Fuel contracts represent a combination of WTI swaps and BRENT options. These derivatives hedge physical supply contracts based on the price of fuel across our operating mine sites plus a spread. WTI represents West Texas Intermediate and BRENT represents Brent Crude Oil.
Fair Values of Derivative Instruments
| | | | | | | | | | | | | | | | | | | | | | | | |
| | | | Asset Derivatives | | | | Liability Derivatives | |
| | |
| Balance Sheet
Classification |
| |
| Fair Value
as at Dec.
31, 2016 |
| |
| Fair Value
as at Dec.
31, 2015 |
| |
| Balance Sheet
Classification |
| |
| Fair Value
as at Dec.
31, 2016 |
| |
| Fair Value
as at Dec.
31, 2015 |
|
| Derivatives designated as hedging instruments | | | | | | | | | | | | | | | | | | | | | | | | |
US dollar interest rate contracts | | | Other assets | | | | $1 | | | | $1 | | | | Other liabilities | | | | $- | | | | $- | |
Currency contracts | | | Other assets | | | | - | | | | - | | | | Other liabilities | | | | - | | | | 16 | |
Commodity contracts1 | | | Other assets | | | | - | | | | - | | | | Other liabilities | | | | 71 | | | | 190 | |
| Total derivatives classified as hedging instruments | | | | | | | $1 | | | | $1 | | | | | | | | $71 | | | | $206 | |
| Derivatives not designated as hedging instruments | | | | | | | | | | | | | | | | | | | | | | | | |
Currency contracts | | | Other assets | | | | $- | | | | $- | | | | Other liabilities | | | | $- | | | | $20 | |
Commodity contracts | | | Other assets | | | | 1 | | | | - | | | | Other liabilities | | | | 7 | | | | 38 | |
| Total derivatives not designated as hedging instruments | | | | | | | $1 | | | | $- | | | | | | | | $7 | | | | $58 | |
Total derivatives | | | | | | | $2 | | | | $1 | | | | | | | | $78 | | | | $264 | |
| 1 | The majority of our fuel contracts are now being designated as hedging instruments as a result of adoption of IFRS 9. These contracts did not qualify for hedge accounting prior to January 1, 2015. |
| | | | |
| BARRICK YEAR-END 2016 | | 146 | | NOTES TO FINANCIAL STATEMENTS |
As of December 31, 2016, we had 17 counterparties to our derivative positions. We proactively manage our exposure to individual counterparties in order to mitigate both credit and liquidity risks. We have four counterparties with which we hold a net asset position of $1 million, and 13 counterparties with which we are in a net liability position, for a total net liability of $77 million. On an ongoing basis, we monitor our exposures and ensure that none of the counterparties with which we hold outstanding contracts has declared insolvency.
US Dollar Interest Rate Contracts
Cash Flow Hedges
At December 31, 2016, Acacia has $99 million of pay-fixed receive-float interest rate swaps to hedge the floating rate debt associated with the Bulyanhulu plant expansion. These contracts, designated as cash flow hedges, convert the floating rate debt as it is drawn against the Financing agreement.
Currency Contracts
Cash Flow Hedges
During the year, no currency contracts have been designated against forecasted non-US dollar denominated expenditures. As at December 31, 2016, there are no outstanding currency contracts designated as cash flow hedges of our anticipated operating, administrative and sustaining capital spend.
During 2013, we sold back and effectively closed out approximately A$990 million of our Australian dollar forward contracts as a loss mitigation strategy. No cash settlement occurred and payments will net at maturity (2014-2016). During the year, losses of $14 million were recognized in the consolidated statement of income based on the original hedge contract maturity dates. No losses remain crystallized in OCI at December 31, 2016.
Commodity Contracts
Diesel/Propane/Electricity/Natural Gas
Cash Flow Hedges
During 2015, 8,040 thousand barrels of WTI contracts designated against forecasted fuel consumption at our mines were designated as hedging instruments as a result of adopting IFRS 9 and did not qualify for hedge accounting prior to January 1, 2015. As at December 31, 2016, we have 2,790 thousand barrels of WTI designated as cash flow hedges at an average rate of $80 per barrel of our exposure to forecasted fuel purchases at our mines.
Non-hedge Derivatives
During the year, we entered into a contract to purchase 248 thousand barrels of Brent to economically hedge our exposure to forecasted fuel purchases for expected consumption at our mines. In total, on a combined basis we have 421 thousand barrels of Brent swaps outstanding that economically hedge our exposure to forecasted fuel purchases at our mines.
Metals Contracts
Cash Flow Hedges
During 2016, we purchased 65 million pounds of copper collars that will mature evenly throughout the first half of 2017. These contracts contained purchased put and sold call options with weighted average strike prices of $2.20/lb and $2.82/lb, respectively. These contracts are designated as cash flow hedges, with the effective portion and the changes in time value of the hedge recognized in OCI and the ineffective portion recognized in non-hedge derivative gains (losses).
During 2013, we early terminated 65 million ounces of silver hedges. We realized net cash proceeds of approximately $190 million with $9 million remaining crystallized in OCI at December 31, 2016, to be recognized in revenue as the exposure occurs. Any unrealized changes and realized gains/losses on ineffective amounts or time value have been recognized in the consolidated statements of income as gains on non-hedge derivatives.
Non-Hedge Derivatives
We enter into purchased and written contracts with the primary objective of increasing the realized price on some of our gold and copper sales. During the year, we purchased gold put and sold call options of 199 thousand ounces and purchased copper put and sold call options of 13 million pounds. As a result of these activities, we recorded approximately $2 million in the consolidated statement of income as gains on non-hedge derivatives. There are 43 thousand ounces of gold positions and 13 million pounds of copper positions outstanding at December 31, 2016.
| | | | |
| BARRICK YEAR-END 2016 | | 147 | | NOTES TO FINANCIAL STATEMENTS |
Cash Flow Hedge Gains (Losses) in Accumulated Other Comprehensive Income (“AOCI”)
| | | | | | | | | | | | | | | | | | | | | | | | | | | | | | | | |
| | | Commodity price hedges | | | Currency hedges | | | Interest rate
hedges | |
| | | Gold/Silver | | | Copper | | | Fuel | | | Operating
costs | | | General and administrative
costs | | | Capital
expenditures | | | Long-term debt | | | Total | |
| | | | | | | | |
At January 1, 2015 | | | $ 18 | | | | $ - | | | | $ - | | | | $ (79) | | | | $ (3) | | | | $ - | | | | $(25) | | | | $ (89) | |
Impact of adopting IFRS 9 on | | | | | | | | | | | | | | | | | | | | | | | | | | | | | | | | |
January 1, 2015 | | | - | | | | - | | | | - | | | | (5) | | | | - | | | | - | | | | - | | | | (5) | |
Effective portion of change in fair value of hedging instruments | | | - | | | | - | | | | (135) | | | | (27) | | | | (14) | | | | (2) | | | | 1 | | | | (177) | |
| | | | | | | | |
Transfers to earnings: | | | | | | | | | | | | | | | | | | | | | | | | | | | | | | | | |
On recording hedged items in earnings/PP&E1 | | | (4) | | | | - | | | | 19 | | | | 70 | | | | 17 | | | | 2 | | | | 2 | | | | 106 | |
Hedge ineffectiveness due to changes in original forecasted transaction | | | - | | | | - | | | | 14 | | | | 11 | | | | - | | | | - | | | | - | | | | 25 | |
| | | | | | | | |
At December 31, 2015 | | | $ 14 | | | | $ - | | | | $ (102) | | | | $ (30) | | | | $ - | | | | $ - | | | | $(22) | | | | $ (140) | |
Effective portion of change in fair value of hedging instruments | | | - | | | | - | | | | 23 | | | | 2 | | | | - | | | | - | | | | - | | | | 25 | |
Transfers to earnings: | | | | | | | | | | | | | | | | | | | | | | | | | | | | | | | | |
On recording hedged items in earnings/PP&E1 | | | (5) | | | | | | | | 47 | | | | 28 | | | | - | | | | - | | | | 2 | | | | 72 | |
| | | | | | | | |
At December 31, 2016 | | | $ 9 | | | | $ - | | | | $ (32) | | | | $ - | | | | $ - | | | | $ - | | | | $ (20) | | | | $ (43) | |
| | | | | | | | |
Hedge gains/losses classified within | |
| Gold/Silver
sales |
| |
| Copper
sales |
| |
| Cost of
sales |
| |
| Cost of
sales |
| |
| General and
administrative
costs |
| |
| Property,
plant, and
equipment |
| | | Interest expense | | | | Total | |
Portion of hedge gain (loss)expected to affect 2017 earnings2 | | | $ 7 | | | | $ - | | | | $ (19) | | | | $ - | | | | $ - | | | | $ - | | | | $ (3) | | | | $ (15) | |
| 1 | Realized gains (losses) on qualifying currency hedges of capital expenditures are transferred from OCI to PP&E on settlement. |
| 2 | Based on the fair value of hedge contracts at December 31, 2016. |
| | | | |
| BARRICK YEAR-END 2016 | | 148 | | NOTES TO FINANCIAL STATEMENTS |
Cash Flow Hedge Gains (Losses) at December 31
| | | | | | | | | | | | | | | | | | | | | | | | | | | | |
Derivatives in cash flow hedging relationships | | Amount of gain (loss)
recognized in OCI | | | Location of gain (loss)
transferred from OCI into
income/PP&E (effective
portion) | | Amount of gain (loss)
transferred from OCI into income (effective
portion) | | | Location of gain (loss)
recognized in income
(ineffective portion and amount excluded from
effectiveness testing) | | Amount of gain (loss)
recognized in income
(ineffective portion and
amount excluded from
effectiveness testing) | |
| | | | 2016 | | | | 2015 | | | | | | 2016 | | | | 2015 | | | | | | 2016 | | | | 2015 | |
| | | | | | | | |
Interest rate contracts | | | $ – | | | | $ 1 | | | Finance income/finance costs | | | $ (2) | | | | $ (2) | | | Gain (loss) on non-hedge derivatives | | | $ - | | | | $ - | |
| | | | | | | | |
Foreign exchange contracts | | | 2 | | | | (43) | | | Cost of sales/general and administrative costs/PP&E | | | (28) | | | | (89) | | | Gain (loss) on non-hedge derivatives | | | - | | | | (11) | |
| | | | | | | | |
Commodity contracts | | | 23 | | | | (135) | | | Revenue/cost of sales | | | (42) | | | | (15) | | | Gain (loss) on non-hedge derivatives | | | - | | | | (14) | |
Total | | | $ 25 | | | | $ (177) | | | | | | $ (72) | | | | $ (106) | | | | | | $ - | | | | $ (25) | |
E Gains (Losses) on Non-hedge Derivatives
| | | | | | | | |
| For the years ended December 31 | | 2016 | | | 2015 | |
| | |
Commodity contracts | | | | | | | | |
Gold | | | $ 2 | | | | $ - | |
Silver1 | | | 6 | | | | 5 | |
Fuel | | | 5 | | | | (10 | ) |
Currency contracts | | | (1 | ) | | | (8 | ) |
| | | | $ 12 | | | | $ (13 | ) |
| | |
Hedge ineffectiveness | | | - | | | | (25 | ) |
| | | | $ - | | | | $ (25 | ) |
| | | | $ 12 | | | | $ (38 | ) |
| 1 | Relates to the amortization of crystallized OCI. |
F Derivative Assets and Liabilities
| | | | | | | | |
| | | 2016 | | | 2015 | |
At January 1 | | | $ (263 | ) | | | $ (278 | ) |
Derivatives cash (inflow) outflow | | | | | | | | |
Operating activities | | | 156 | | | | 211 | |
Change in fair value of: | | | | | | | | |
Non-hedge derivatives | | | 6 | | | | (13 | ) |
Cash flow hedges: | | | | | | | | |
Effective portion | | | 25 | | | | (177 | ) |
Ineffective portion | | | - | | | | 25 | |
Excluded from effectiveness changes | | | - | | | | (31 | ) |
At December 31 | | | $ (76 | ) | | | $ (263 | ) |
Classification: | | | | | | | | |
Other current assets | | | $ 1 | | | | $ - | |
Other long-term assets | | | 1 | | | | 1 | |
Other current liabilities | | | (50 | ) | | | (160 | ) |
Other long-term obligations | | | (28 | ) | | | (104 | ) |
| | | | $ (76 | ) | | | $ (263 | ) |
| | | | |
| BARRICK YEAR-END 2016 | | 149 | | NOTES TO FINANCIAL STATEMENTS |
26 > FAIR VALUE MEASUREMENTS
Fair value is the price that would be received to sell an asset or paid to transfer a liability in an orderly transaction between market participants at the measurement date. The fair value hierarchy establishes three levels to classify the inputs to valuation techniques used to measure fair value. Level 1 inputs are quoted prices (unadjusted) in active markets for identical assets or liabilities. Level 2 inputs are quoted prices in markets that are not active, quoted prices for similar assets or liabilities in active markets, inputs other than quoted prices that are
observable for the asset or liability (for example, interest rate and yield curves observable at commonly quoted intervals, forward pricing curves used to value currency and commodity contracts and volatility measurements used to value option contracts), or inputs that are derived principally from or corroborated by observable market data or other means. Level 3 inputs are unobservable (supported by little or no market activity). The fair value hierarchy gives the highest priority to Level 1 inputs and the lowest priority to Level 3 inputs.
A Assets and Liabilities Measured at Fair Value on a Recurring Basis
| | | | | | | | | | |
| Fair Value Measurements | | | | | | | | | | |
| At December 31, 2016 | | Quoted Prices in Active Markets for Identical Assets (Level 1) | | Significant Other Observable Inputs (Level 2) | | Significant Unobservable Inputs (Level 3) | |
| Aggregate Fair
Value |
|
| Cash and equivalents | | $ 2,389 | | $ - | | $ - | | | $ 2,389 | |
| Other investments | | 18 | | - | | - | | | 18 | |
| Derivatives | | - | | (76) | | - | | | (76 | ) |
| Receivables from provisional copper and gold sales | | - | | 110 | | - | | | 110 | |
| | | $ 2,407 | | $ 34 | | $ - | | | $ 2,441 | |
| | | | | | | | | | | |
| Fair Value Measurements | | | | | | | | | | |
| At December 31, 2015 | | Quoted Prices in Active Markets for Identical Assets (Level 1) | | Significant Other Observable Inputs (Level 2) | | Significant Unobservable Inputs (Level 3) | |
| Aggregate Fair
Value |
|
| Cash and equivalents | | $ 2,455 | | $ - | | $ - | | | $ 2,455 | |
| Other investments | | 8 | | - | | - | | | 8 | |
| Derivatives | | - | | (263) | | - | | | (263 | ) |
| Receivables from provisional copper and gold sales | | - | | 76 | | - | | | 76 | |
| | | $ 2,463 | | $ (187) | | $ - | | | $ 2,276 | |
| | | | |
| BARRICK YEAR-END 2016 | | 150 | | NOTES TO FINANCIAL STATEMENTS |
B Fair Values of Financial Assets and Liabilities
| | | | | | | | | | | | | | | | |
| | | At Dec. 31, 2016 | | | At Dec. 31, 2015 | |
| | | | |
| | | Carrying amount | | | Estimated fair value | | | Carrying amount | | | Estimated fair value | |
Financial assets | | | | | | | | | | | | | | | | |
Other assets1 | | | $ 399 | | | | $ 399 | | | | $ 365 | | | | $ 365 | |
Other investments2 | | | 18 | | | | 18 | | | | 8 | | | | 8 | |
Derivative assets | | | 2 | | | | 2 | | | | 1 | | | | 1 | |
| | | | $ 419 | | | | $ 419 | | | | $ 374 | | | | $ 374 | |
Financial liabilities | | | | | | | | | | | | | | | | |
Debt3 | | | $ 7,931 | | | | $ 8,279 | | | | $ 9,968 | | | | $ 8,516 | |
Derivative liabilities | | | 78 | | | | 78 | | | | 264 | | | | 264 | |
Other liabilities | | | 216 | | | | 216 | | | | 223 | | | | 223 | |
| | | | $ 8,225 | | | | $ 8,573 | | | | $ 10,455 | | | | $ 9,003 | |
| 1 | Includes restricted cash and amounts due from our partners. |
| 2 | Recorded at fair value. Quoted market prices are used to determine fair value. |
| 3 | Debt is generally recorded at amortized cost except for obligations that are designated in a fair-value hedge relationship, in which case the carrying amount is adjusted for changes in fair value of the hedging instrument in periods when a hedge relationship exists. The fair value of debt is primarily determined using quoted market prices. Balance includes both current and long-term portions of debt. |
We do not offset financial assets with financial liabilities.
C Assets Measured at Fair Value on aNon-Recurring Basis
| | | | | | | | | | | | | | | | |
| | | Quoted prices in active
markets for identical assets | | | Significant other
observable inputs | | | Significant
unobservable inputs | | | | |
| | | (Level 1) | | | (Level 2) | | | (Level 3) | | | Aggregate fair value | |
Other assets1 | | | $ - | | | | $ - | | | | $ 974 | | | | $ 974 | |
Property, plant and equipment2 | | | - | | | | - | | | | 1,470 | | | | 1,470 | |
| 1 | Other assets were written down by $49 million in the third quarter 2016, which was included in earnings in this period. Refer to note 4c. |
| 2 | Property, plant and equipment were written up by $299 million, which was included in earnings in this period, reflecting the historical impairment loss taken on these assets. |
Valuation Techniques
Cash Equivalents
The fair value of our cash equivalents is classified within Level 1 of the fair value hierarchy because they are valued using quoted market prices in active markets. Our cash equivalents are comprised of U.S. Treasury bills and money market securities that are invested primarily in U.S. Treasury bills.
Other Investments
The fair value of other investments is determined based on the closing price of each security at the balance sheet date. The closing price is a quoted market price obtained from the exchange that is the principal active market for the particular security, and therefore other investments are classified within Level 1 of the fair value hierarchy.
Derivative Instruments
The fair value of derivative instruments is determined using either present value techniques or option pricing models that utilize a variety of inputs that are a combination of quoted prices and market-corroborated inputs. The fair value of all our derivative contracts includes an adjustment for credit risk. For counterparties in a net asset position, credit risk is based upon the observed credit default swap spread for each particular counterparty, as appropriate. For counterparties in a net liability position, credit risk is based upon Barrick’s observed credit default swap spread. The fair value of US dollar interest rate and currency swap contracts is determined by discounting contracted cash flows using a discount rate derived from observed LIBOR and swap rate curves and CDS rates. In the case of currency contracts, we convertnon-US dollar cash flows into US dollars using an exchange rate derived from currency swap curves and CDS rates. The fair value of
| | | | |
| BARRICK YEAR-END 2016 | | 151 | | NOTES TO FINANCIAL STATEMENTS |
commodity forward contracts is determined by discounting contractual cash flows using a discount rate derived from observed LIBOR and swap rate curves and CDS rates. Contractual cash flows are calculated using a forward pricing curve derived from observed forward prices for each commodity. Derivative instruments are classified within Level 2 of the fair value hierarchy.
Receivables from Provisional Copper and Gold Sales
The fair value of receivables arising from copper and gold sales contracts that contain provisional pricing mechanisms is determined using the appropriate quoted forward price from the exchange that is the principal active market for the particular metal. As such, these receivables, which meet the definition of an embedded derivative, are classified within Level 2 of the fair value hierarchy.
Other Long-Term Assets
The fair value of property, plant and equipment, goodwill, intangibles and other assets is determined primarily using an income approach based on unobservable cash flows and a market multiples approach where applicable, and as a result is classified within Level 3 of the fair value hierarchy. Refer to note 21 for disclosure of inputs used to develop these measures.
27 > PROVISIONS
A Provisions
| | | | | | | | |
| | | As at Dec. 31, | | | As at Dec. 31, | |
| | | 2016 | | | 2015 | |
Environmental rehabilitation (“PER”) | | | $ 2,179 | | | | $ 1,920 | |
Post-retirement benefits | | | 72 | | | | 86 | |
Share-based payments | | | 34 | | | | 25 | |
Other employee benefits | | | 45 | | | | 46 | |
Other | | | 33 | | | | 25 | |
| | |
| | | | $ 2,363 | | | | $ 2,102 | |
B Environmental Rehabilitation
| | | | | | | | |
| | | 2016 | | | 2015 | |
At January 1 | | $ | 1,982 | | | $ | 2,484 | |
PERs divested during the year | | | - | | | | (170) | |
Closed Sites | | | | | | | | |
Impact of revisions to expected cash flows recorded in earnings | | | 146 | | | | 38 | |
Settlements | | | | | | | | |
Cash payments | | | (28) | | | | (78) | |
Settlement gains | | | (1) | | | | (5) | |
Accretion | | | 10 | | | | 19 | |
Operating Sites | | | | | | | | |
PERs arising (decreasing) in the year | | | 134 | | | | (229) | |
Settlements | | | | | | | | |
Cash payments | | | (34) | | | | (11) | |
Settlement gains | | | (3) | | | | (1) | |
Accretion | | | 40 | | | | 44 | |
Assets held for sale | | | - | | | | (109) | |
At December 31 | | $ | 2,246 | | | $ | 1,982 | |
Current portion (note 24) | | | (67) | | | | (62) | |
| | | $ | 2,179 | | | $ | 1,920 | |
The eventual settlement of all PERs is expected to take place between 2017 and 2057.
The PER has increased in the fourth quarter 2016 by $32 million primarily due to changes in cost estimates at our Grants, Pierina and McLaughlin properties, partially offset by changes in discount rates. For the year ended December 31, 2016, our PER balance increased by $264 million as a result of various impacts at our mine sites including new requirements related to water treatment, expanded footprints of our operations and updated estimates for reclamation activities. A 1% increase in the discount rate would result in a decrease in PER by $300 million and a 1% decrease in the discount rate would result in an increase in PER by $264 million, while holding the other assumptions constant.
| | | | |
| BARRICK YEAR-END 2016 | | 152 | | NOTES TO FINANCIAL STATEMENTS |
28 > FINANCIAL RISK MANAGEMENT
Our financial instruments are comprised of financial liabilities and financial assets. Our principal financial liabilities, other than derivatives, comprise accounts payable and debt. The main purpose of these financial instruments is to manage short-term cash flow and raise funds for our capital expenditure program. Our principal financial assets, other than derivative instruments, are cash and equivalents and accounts receivable, which arise directly from our operations. In the normal course of business, we use derivative instruments to mitigate exposure to various financial risks.
We manage our exposure to key financial risks in accordance with our financial risk management policy. The objective of the policy is to support the delivery of our financial targets while protecting future financial security. The main risks that could adversely affect our financial assets, liabilities or future cash flows are as follows:
| a) | Market risk, including commodity price risk, foreign currency and interest rate risk; |
| d) | Capital risk management. |
Management designs strategies for managing each of these risks, which are summarized below. Our senior management oversees the management of financial risks. Our senior management ensures that our financial risk-taking activities are governed by policies and procedures and that financial risks are identified, measured and managed in accordance with our policies and our risk appetite. All derivative activities for risk management purposes are carried out by the appropriate functions.
a) Market Risk
Market risk is the risk that changes in market factors, such as commodity prices, foreign exchange rates or interest rates, will affect the value of our financial instruments. We manage market risk by either accepting it or mitigating it through the use of derivatives and other economic hedging strategies.
Commodity Price Risk
Gold and Copper
We sell our gold and copper production in the world market. The market prices of gold and copper are the primary drivers of our profitability and ability to generate both operating and free cash flow. Our corporate treasury function implements hedging strategies on an opportunistic basis to protect us from downside price risk on our gold and
copper production. We have 43 thousand ounces of gold and 78 million pounds of copper positions outstanding at December 31, 2016. Our remaining gold and copper production is subject to market prices.
Fuel
On average we consume approximately 4 million barrels of diesel fuel annually across all our mines. Diesel fuel is refined from crude oil and is therefore subject to the same price volatility affecting crude oil prices. Therefore, volatility in crude oil prices has a significant direct and indirect impact on our production costs. To mitigate this volatility, we employ a strategy of using financial contracts to hedge our exposure to oil prices.
Foreign Currency Risk
The functional and reporting currency for all of our operating segments is the US dollar and we report our results using the US dollar. The majority of our operating and capital expenditures are denominated and settled in US dollars. We have exposure to the Australian dollar and Canadian dollar through a combination of mine operating costs and general and administrative costs; and to the Papua New Guinea kina, Peruvian sol, Chilean peso, Argentinean peso, Dominican Republic peso and Zambian kwacha through mine operating costs. Consequently, fluctuations in the US dollar exchange rate against these currencies increase the volatility of cost of sales, general and administrative costs and overall net earnings, when translated into US dollars.
Interest Rate Risk
Interest rate risk refers to the risk that the value of a financial instrument or cash flows associated with the instruments will fluctuate due to changes in market interest rates. Currently, our interest rate exposure mainly relates to interest receipts on our cash balances ($2.4 billion at the end of the year); themark-to-market value of derivative instruments; the fair value and ongoing payments under US dollar interest-rate swaps; and to the interest payments on our variable-rate debt ($0.4 billion at December 31, 2016).
The effect on net earnings and equity of a 1% change in interest rate of our financial assets and liabilities as at December 31 is approximately $13 million (2015: $13 million).
b) Credit Risk
Credit risk is the risk that a third party might fail to fulfill its performance obligations under the terms of a financial
| | | | |
| BARRICK YEAR-END 2016 | | 153 | | NOTES TO FINANCIAL STATEMENTS |
instrument. Credit risk arises from cash and equivalents, trade and other receivables as well as derivative assets. For cash and equivalents and trade and other receivables, credit risk exposure equals the carrying amount on the balance sheet, net of any overdraft positions. To mitigate our inherent exposure to credit risk we maintain policies to limit the concentration of credit risk, review counterparty creditworthiness on a monthly basis, and ensure liquidity of available funds. We also invest our cash and equivalents in highly rated financial institutions, primarily within the United States and other investment grade countries1. Furthermore, we sell our gold and copper production into the world market and to private customers with strong credit ratings. Historically customer defaults have not had a significant impact on our operating results or financial position.
For derivatives with a positive fair value, we are exposed to credit risk equal to the carrying value. When the fair value of a derivative is negative, we assume no credit risk. We mitigate credit risk on derivatives by:
| ● | | Entering into derivatives with high credit-quality counterparties; |
| ● | | Limiting the amount of net exposure with each counterparty; and |
| ● | | Monitoring the financial condition of counterparties on a regular basis. |
The Company’s maximum exposure to credit risk at the reporting date is the carrying value of each of the financial assets disclosed as follows:
| | | | | | | | |
| | | As at Dec. 31, | | | As at Dec. 31, | |
| | | 2016 | | | 2015 | |
Cash and equivalents | | | $ 2,389 | | | | $ 2,455 | |
| | |
Accounts receivable | | | 249 | | | | 275 | |
Net derivative assets by counterparty | | | 1 | | | | - | |
| | | | $ 2,639 | | | | $ 2,730 | |
| 1 | Investment grade countries include Canada, Chile, Australia, and Peru. Investment grade countries are defined as being ratedBBB- or higher by S&P. |
c) Liquidity Risk
Liquidity risk is the risk of loss from not having access to sufficient funds to meet both expected and unexpected cash demands. We manage our exposure to liquidity risk by maintaining cash reserves, access to undrawn credit facilities and access to public debt markets, by staggering the maturities of outstanding debt instruments to mitigate
refinancing risk and by monitoring of forecasted and actual cash flows. Details of the undrawn credit facility are included in note 25.
Our capital structure comprises a mix of debt and shareholders’ equity. As at December 31, 2016, our total debt was $7.9 billion (debt net of cash and equivalents was $5.5 billion) compared to total debt as at December 31, 2015 of $10 billion (debt net of cash and equivalents was $7.5 billion).
As part of our capital allocation strategy, we are constantly evaluating our capital expenditures and making reductions where the risk-adjusted returns do not justify the investment. Our primary source of liquidity is our operating cash flow. Other options to enhance liquidity include drawing the $4.0 billion available under our Credit Facility (subject to compliance with covenants and the making of certain representations and warranties, this facility is available for drawdown as a source of financing), further asset sales and issuances of debt or equity securities in the public markets or to private investors, which could be undertaken for liquidity enhancement and/or in connection with establishing a strategic partnership. Many factors, including, but not limited to, general market conditions and then prevailing metals prices could impact our ability to issue securities on acceptable terms, as could our credit ratings. Moody’s and S&P rate our long-term debt Baa3 andBBB-, respectively. Changes in our ratings could affect the trading prices of our securities and our cost of capital. If we were to borrow under our Credit Facility, the applicable interest rate on the amounts borrowed would be based, in part, on our credit ratings at the time. The key financial covenant, which was amended in the fourth quarter 2015, in the Credit Facility (undrawn as at December 31, 2016) requires Barrick to maintain a net debt to total capitalization ratio, as defined in the agreement, of 0.60:1 or lower (Barrick’s net debt to total capitalization ratio was 0.35:1 as at December 31, 2016).
The following table outlines the expected maturity of our significant financial assets and liabilities into relevant maturity groupings based on the remaining period from the balance sheet date to the contractual maturity date. As the amounts disclosed in the table are the contractual undiscounted cash flows, these balances may not agree with the amounts disclosed in the balance sheet.
| | | | |
| BARRICK YEAR-END 2016 | | 154 | | NOTES TO FINANCIAL STATEMENTS |
| | | | | | | | | | | | | | | | | | | | |
As at December 31, 2016 | | | | | | | | | | | | | | | | | | | | |
(in $ millions) | | Less than 1 year | | | 1 to 3 years | | | 3 to 5 years | | | Over 5 years | | | Total | |
Cash and equivalents | | | $ 2,389 | | | | $ - | | | | $ - | | | | $ - | | | | $ 2,389 | |
Accounts receivable | | | 249 | | | | - | | | | - | | | | - | | | | 249 | |
Derivative assets | | | 1 | | | | 1 | | | | - | | | | - | | | | 2 | |
Trade and other payables | | | 1,084 | | | | - | | | | - | | | | - | | | | 1,084 | |
Debt | | | 143 | | | | 533 | | | | 997 | | | | 6,316 | | | | 7,989 | |
Derivative liabilities | | | 51 | | | | 27 | | | | - | | | | - | | | | 78 | |
Other liabilities | | | 42 | | | | 51 | | | | 3 | | | | 120 | | | | 216 | |
| | | | | |
As at December 31, 2015 | | | | | | | | | | | | | | | | | | | | |
(in $ millions) | | Less than 1 year | | | 1 to 3 years | | | 3 to 5 years | | | Over 5 years | | | Total | |
Cash and equivalents | | | $ 2,455 | | | | $ - | | | | $ - | | | | $ - | | | | $ 2,455 | |
Accounts receivable | | | 275 | | | | - | | | | - | | | | - | | | | 275 | |
Derivative assets | | | - | | | | 1 | | | | - | | | | - | | | | 1 | |
Trade and other payables | | | 1,158 | | | | - | | | | - | | | | - | | | | 1,158 | |
Debt | | | 203 | | | | 934 | | | | 1,122 | | | | 7,786 | | | | 10,045 | |
Derivative liabilities | | | 160 | | | | 102 | | | | 2 | | | | - | | | | 264 | |
Other liabilities | | | 40 | | | | 44 | | | | 17 | | | | 122 | | | | 223 | |
| | | | |
| BARRICK YEAR-END 2016 | | 155 | | NOTES TO FINANCIAL STATEMENTS |
d) Capital Risk Management
Our objective when managing capital is to provide value for shareholders by maintaining an optimal short-term and long-term capital structure in order to reduce the overall cost of capital while preserving our ability to continue as a going concern. Our capital management objectives are to safeguard our ability to support our operating requirements on an ongoing basis, continue the development and exploration of our mineral properties and support any expansion plans. Our objectives are also to ensure that we maintain a strong balance sheet and optimize the use of debt and equity to support our business and provide financial flexibility in order to maximize shareholder value. We define capital as total debt less cash and equivalents and it is managed by management subject to approved policies and limits by the Board of Directors. We have no significant financial covenants or capital requirements with our lenders or other parties other than what is discussed under liquidity risk in note 28.
29 > OTHERNON-CURRENT LIABILITIES
| | | | | | | | |
| | | As at Dec. 31, 2016 | | | As at Dec. 31, 2015 | |
Deposit on Pascua-Lama silver sale agreement | | | $ 749 | | | | $ 716 | |
Deposit on Pueblo Viejo gold and silver streaming agreement | | | 499 | | | | 565 | |
Derivative liabilities (note 25f) | | | 28 | | | | 104 | |
Provision for offsite remediation | | | 48 | | | | 55 | |
Other | | | 137 | | | | 146 | |
| | | | $ 1,461 | | | | $ 1,586 | |
Silver Sale Agreement
Our silver sale agreement with Silver Wheaton Corp. (“Silver Wheaton”) requires us to deliver 25 percent of the life of mine silver production from the Pascua-Lama project and 100 percent of silver production from the Lagunas Norte, Pierina and Veladero mines (“South American mines”) until March 31, 2018. In return, we were entitled to an upfront cash payment of $625 million payable over three years from the date of the agreement, as well as ongoing payments in cash of the lesser of $3.90 (subject to an annual inflation adjustment of 1 percent starting three years after project completion at Pascua-Lama) and the prevailing market price for each ounce of silver delivered under the agreement.
An imputed interest expense is being recorded on the liability at the rate implicit in the agreement. The liability plus imputed interest will be amortized based on the difference between the effective contract price for silver
and the amount of the ongoing cash payment per ounce of silver delivered under the agreement.
Gold and Silver Streaming Agreement
On September 29, 2015, we closed a gold and silver streaming transaction with Royal Gold, Inc. (“Royal Gold”) for production linked to Barrick’s 60 percent interest in the Pueblo Viejo mine. Royal Gold made an upfront cash payment of $610 million and will continue to make cash payments for gold and silver delivered under the agreement. The $610 million upfront payment is not repayable and Barrick is obligated to deliver gold and silver based on Pueblo Viejo’s production. We have accounted for the upfront payment as deferred revenue and will recognize it in earnings, along with the ongoing cash payments, as the gold and silver is delivered to Royal Gold. We will also be recording accretion expense on the deferred revenue balance as the time value of the upfront deposit represents a significant component of the transaction.
Under the terms of the agreement, Barrick will sell gold and silver to Royal Gold equivalent to:
| ● | | 7.5 percent of Barrick’s interest in the gold produced at Pueblo Viejo until 990,000 ounces of gold have been delivered, and 3.75 percent thereafter. |
| ● | | 75 percent of Barrick’s interest in the silver produced at Pueblo Viejo until 50 million ounces have been delivered, and 37.5 percent thereafter. Silver will be delivered based on a fixed recovery rate of 70 percent. Silver above this recovery rate is not subject to the stream. |
Barrick will receive ongoing cash payments from Royal Gold equivalent to 30 percent of the prevailing spot prices for the first 550,000 ounces of gold and 23.1 million ounces of silver delivered. Thereafter payments will double to 60 percent of prevailing spot prices for each subsequent ounce of gold and silver delivered. Ongoing cash payments to Barrick are tied to prevailing spot prices rather than fixed in advance, maintaining exposure to higher gold and silver prices in the future.
| | | | |
| BARRICK YEAR-END 2016 | | 156 | | NOTES TO FINANCIAL STATEMENTS |
30 > DEFERRED INCOME TAXES
Recognition and Measurement
We record deferred income tax assets and liabilities where temporary differences exist between the carrying amounts of assets and liabilities in our balance sheet and their tax bases. The measurement and recognition of deferred income tax assets and liabilities takes into account: substantively enacted rates that will apply when temporary differences reverse; interpretations of relevant tax legislation; estimates of the tax bases of assets and liabilities; and the deductibility of expenditures for income tax purposes. In addition, the measurement and recognition of deferred tax assets takes into account tax planning strategies. We recognize the effect of changes in our assessment of these estimates and factors when they occur. Changes in deferred income tax assets and liabilities are allocated between net income, other comprehensive income, and goodwill based on the source of the change.
Current income taxes of $89 million have been provided on the undistributed earnings of certain foreign subsidiaries. Deferred income taxes have not been provided on the undistributed earnings of all other foreign subsidiaries for which we are able to control the timing of the remittance, and it is probable that there will be no remittance in the foreseeable future. These undistributed earnings amounted to $4,507 million as at December 31, 2016.
Sources of Deferred Income Tax Assets and Liabilities
| | | | | | | | |
| | | As at Dec. 31,
2016 | | | As at Dec. 31,
2015 | |
Deferred tax assets | | | | | | | | |
Tax loss carry forwards | | | $ 503 | | | | $ 475 | |
Alternative minimum tax (“AMT”) credits | | | - | | | | 22 | |
Environmental rehabilitation | | | 639 | | | | 560 | |
Property, plant and equipment | | | 273 | | | | 320 | |
Post-retirement benefit obligations and other employee benefits | | | 47 | | | | 42 | |
Accrued interest payable | | | 75 | | | | 61 | |
Other working capital | | | 54 | | | | 52 | |
Derivative instruments | | | 89 | | | | 106 | |
Other | | | 41 | | | | - | |
| | | $ 1,721 | | | | $ 1,638 | |
Deferred tax liabilities | | | | | | | | |
Property, plant and equipment | | | (1,731 | ) | | | (1,713 | ) |
Inventory | | | (533 | ) | | | (438 | ) |
| | | | $ (543 | ) | | | $ (513 | ) |
Classification: | | | | | | | | |
Non-current assets | | | $ 977 | | | | $ 1,040 | |
Non-current liabilities | | | (1,520 | ) | | | (1,553 | ) |
| | | | $ (543 | ) | | | $ (513 | ) |
The deferred tax asset of $977 million includes $832 million expected to be realized in more than one year. The deferred tax liability of $1,520 million includes $1,470 million expected to be realized in more than one year.
Expiry Dates of Tax Losses and AMT
| | | | | | | | | | | | | | | | | | | | | | | | | | | | |
| | | 2017 | | | 2018 | | | 2019 | | | 2020 | | | 2021+ | | | No
expiry
date | | | Total | |
Non-capital tax losses1 | | | | | | | | | | | | | | | | | | | | | | | | | | | | |
Canada | | | $ - | | | | $ - | | | | $ - | | | | $ - | | | | $ 1,650 | | | | $ - | | | | $ 1,650 | |
Argentina | | | - | | | | - | | | | - | | | | - | | | | 301 | | | | - | | | | 301 | |
Barbados | | | 148 | | | | 4,751 | | | | 926 | | | | 218 | | | | 566 | | | | - | | | | 6,609 | |
Chile | | | - | | | | - | | | | - | | | | - | | | | - | | | | 914 | | | | 914 | |
Tanzania | | | - | | | | - | | | | - | | | | - | | | | - | | | | 177 | | | | 177 | |
Zambia | | | - | | | | 176 | | | | - | | | | - | | | | 416 | | | | - | | | | 592 | |
Other | | | 5 | | | | 7 | | | | - | | | | - | | | | - | | | | 524 | | | | 536 | |
| | | | $153 | | | | $4,934 | | | | $926 | | | | $218 | | | | $2,933 | | | | $1,615 | | | | $10,779 | |
AMT credits2 | | | | | | | | | | | | | | | | | | | | | | | $113 | | | | $113 | |
| 1 | Represents the gross amount of tax loss carry forwards translated at closing exchange rates at December 31, 2016. |
| 2 | Represents the amounts deductible against future taxes payable in years when taxes payable exceed “minimum tax” as defined by United States tax legislation. |
Thenon-capital tax losses include $8,880 million of losses which are not recognized in deferred tax assets. Of these, $148 million expire in 2017, $4,927 million expire in 2018, $926 million expire in 2019, $218 million expire in 2020, $1,512 million expire in 2021 or later, and $1,149 million have no expiry date.
The AMT credits include $113 million which are not recognized in deferred tax assets.
Recognition of Deferred Tax Assets
We recognize deferred tax assets taking into account the effects of local tax law. Deferred tax assets are fully recognized when we conclude that sufficient positive evidence exists to demonstrate that it is probable that a deferred tax asset will be realized. The main factors considered are:
| ● | | Historic and expected future levels of taxable income; |
| ● | | Tax plans that affect whether tax assets can be realized; and |
| ● | | The nature, amount and expected timing of reversal of taxable temporary differences. |
| | | | |
| BARRICK YEAR-END 2016 | | 157 | | NOTES TO FINANCIAL STATEMENTS |
Levels of future income are mainly affected by: market gold, copper and silver prices; forecasted future costs and expenses to produce gold and copper reserves; quantities of proven and probable gold and copper reserves; market interest rates; and foreign currency exchange rates. If these factors or other circumstances change, we record an adjustment to the recognition of deferred assets to reflect our latest assessment of the amount of deferred tax assets that is probable will be realized.
A deferred income tax asset totaling $569 million (December 31, 2015: $558 million) has been recorded in Canada. This deferred tax asset primarily arose from derivative realized losses, finance costs, and general and administrative expenses. A deferred tax asset totaling $126 million (December 31, 2015: $116 million) has been recorded in a foreign subsidiary. This deferred tax asset primarily arose from a realized loss on internal restructuring of subsidiary corporations. Projections of various sources of income support the conclusion that the realizability of these deferred tax assets is probable and consequently, we have fully recognized these deferred tax assets.
Deferred Tax Assets Not Recognized
| | | | | | | | |
| | | As at December 31, 2016 | | | As at December 31, 2015 | |
Australia and Papua New Guinea | | | $ 162 | | | | $ 383 | |
Canada | | | 377 | | | | 374 | |
US | | | 115 | | | | 113 | |
Dominican Republic | | | - | | | | 18 | |
Chile | | | 890 | | | | 787 | |
Argentina | | | 599 | | | | 647 | |
Barbados | | | 66 | | | | 72 | |
Tanzania | | | 183 | | | | 131 | |
Zambia | | | 151 | | | | 190 | |
Saudi Arabia | | | 70 | | | | 70 | |
| | | | $ 2,613 | | | | $ 2,785 | |
Deferred Tax Assets Not Recognized relate to:non-capital loss carry forwards of $638 million (2015: $516 million), capital loss carry forwards with no expiry date of $440 million (2015: $602 million), US AMT credits of $113 million (2015: $112 million) and other deductible temporary differences with no expiry date of $1,422 million (2015: $1,555 million).
| | | | | | | | |
| Source of Changes in Deferred Tax Balances | |
| For the years ended December 31 | | 2016 | | | 2015 | |
Temporary differences | | | | | | | | |
Property, plant and equipment | | | $ (65) | | | | $ 741 | |
Environmental rehabilitation | | | 79 | | | | (25) | |
Tax loss carry forwards | | | 27 | | | | 106 | |
Inventory | | | (94) | | | | (34) | |
Derivatives | | | (16) | | | | 74 | |
Other | | | 39 | | | | (13) | |
| | | | $ (30) | | | | $ 849 | |
| | |
Intraperiod allocation to: | | | | | | | | |
(Income)/loss from continuing operations before income taxes | | | $ (8) | | | | $ 436 | |
| | |
Zaldívar disposition | | | - | | | | 388 | |
Cowal disposition | | | - | | | | 7 | |
OCI | | | (22) | | | | 20 | |
Other | | | - | | | | (2) | |
| | | | $ (30) | | | | $ 849 | |
|
Income Tax Related Contingent Liabilities | |
| | | | 2016 | | | | 2015 | |
At January 1 | | | $ 61 | | | | $ 49 | |
Net additions based on uncertain tax positions related to prior years | | | 70 | | | | - | |
Additions based on tax positions related to the current year | | | - | | | | 13 | |
| | |
Reductions for tax positions of prior years | | | (3) | | | | (1) | |
| | |
At December 311 | | | $ 128 | | | | $ 61 | |
1If reversed, the total amount of $128 million would be recognized as a benefit to income taxes on the income statement, and therefore would impact the reported effective tax rate.
We anticipate that it is reasonably possible for the amount of income tax related contingent liabilities to decrease within 12 months of the reporting date by the full amount of $128 million through a potential settlement with tax authorities that may result in a reduction of available tax pools.
| | | | |
Tax Years Still Under Examination | | | | |
Canada | | | 2013-2016 | |
United States | | | 2016 | |
Dominican Republic | | | 2013-2016 | |
Peru | | | 2009, 2011-2016 | |
Chile | | | 2013-2016 | |
Argentina | | | 2009-2016 | |
Australia | | | 2012-2016 | |
Papua New Guinea | | | 2006-2016 | |
Saudi Arabia | | | 2007-2016 | |
Tanzania | | | All years open | |
Zambia | | | 2010-2016 | |
| | | | |
| BARRICK YEAR-END 2016 | | 158 | | NOTES TO FINANCIAL STATEMENTS |
31 > CAPITAL STOCK
Authorized Capital Stock
Our authorized capital stock includes an unlimited number of common shares (issued 1,165,574,071 common shares); an unlimited number of first preferred shares issuable in series (the first series is designated as the “First Preferred Shares, Series A” and consists of 10,000,000 first preferred shares (issued nil); the second series is designated as the “First Preference Shares, Series B” and consists of 10,000,000 first preferred shares (issued nil); and the third series is designated as the “First Preferred Shares, Series C Special Voting Share” and consists of 1 Special Voting Share (issued nil)); and an unlimited number
of second preferred shares issuable in series (the first series is designated as the “Second Preferred Shares, Series A” and consists of 15,000,000 second preferred shares (issued nil)). Our common shares have no par value.
Dividends
In 2016, we declared and paid dividends in US dollars totaling $86 million (2015: $160 million).
The Company’s dividend reinvestment plan resulted in $8 million (2015: $3 million) reinvested into the Company.
32 >NON-CONTROLLING INTERESTS
A)NON-CONTROLLING INTERESTS CONTINUITY
| | | | | | | | | | | | | | | | | | | | |
| | | Pueblo Viejo | | | Acacia | | | Cerro Casale | | | Other | | | Total | |
NCI in subsidiary at December 31, 2016 | | | 40% | | | | 36.1% | | | | 25% | | | | Various | | | | | |
At January 1, 2015 | | | $ 1,521 | | | | $ 758 | | | | $ 319 | | | | $ 17 | | | | $ 2,615 | |
Share of loss | | | (199) | | | | (69) | | | | (3) | | | | (4) | | | | (275) | |
Cash contributed | | | - | | | | - | | | | 2 | | | | 39 | | | | 41 | |
Disbursements | | | (90) | | | | (12) | | | | - | | | | (2) | | | | (104) | |
At December 31, 2015 | | | $ 1,232 | | | | $ 677 | | | | $ 318 | | | | $ 50 | | | | $ 2,277 | |
Share of income (loss) | | | 174 | | | | 34 | | | | (1) | | | | (1) | | | | 206 | |
Cash contributed | | | - | | | | - | | | | 2 | | | | 68 | | | | 70 | |
Disbursements | | | (95) | | | | (7) | | | | - | | | | (73) | | | | (175) | |
At December 31, 2016 | | | $ 1,311 | | | | $ 704 | | | | $ 319 | | | | $ 44 | | | | $ 2,378 | |
| | | | |
| BARRICK YEAR-END 2016 | | 159 | | NOTES TO FINANCIAL STATEMENTS |
B) SUMMARIZED FINANCIAL INFORMATION ON SUBSIDIARIES WITH MATERIALNON-CONTROLLING INTERESTS
Summarized Balance Sheets
| | | | | | | | | | | | | | | | | | | | | | | | |
| | | Pueblo Viejo | | | Acacia | | | Cerro Casale | |
| | | As at Dec. 31, | | | As at Dec. 31, | | | As at Dec. 31, | | | As at Dec. 31, | | | As at Dec. 31, | | | As at Dec. 31, | |
| | | 2016 | | | 2015 | | | 2016 | | | 2015 | | | 2016 | | | 2015 | |
Current assets | | $ | 833 | | | $ | 667 | | | $ | 673 | | | $ | 528 | | | $ | 1 | | | $ | - | |
Non-current assets | | | 3,703 | | | | 3,540 | | | | 1,725 | | | | 1,699 | | | | 560 | | | | 557 | |
Total assets | | $ | 4,536 | | | $ | 4,207 | | | $ | 2,398 | | | $ | 2,227 | | | $ | 561 | | | $ | 557 | |
Current liabilities | | | 1,357 | | | | 1,767 | | | | 71 | | | | 15 | | | | 318 | | | | 313 | |
Non-current liabilities | | | 603 | | | | 499 | | | | 381 | | | | 340 | | | | 42 | | | | 42 | |
Total liabilities | | $ | 1,960 | | | $ | 2,266 | | | $ | 452 | | | $ | 355 | | | $ | 360 | | | $ | 355 | |
Summarized Statements of Income
| | | | | | | | | | | | | | | | | | | | | | | | |
| | | Pueblo Viejo | | | Acacia | | | Cerro Casale | |
| For the years ended December 31 | | 2016 | | | 2015 | | | 2016 | | | 2015 | | | 2016 | | | 2015 | |
Revenue | | $ | 1,548 | | | $ | 1,332 | | | $ | 1,045 | | | $ | 860 | | | $ | - | | | $ | - | |
Income (loss) from continuing operations after tax | | | 810 | | | | (902) | | | | 81 | | | | (206) | | | | (3) | | | | (6) | |
Other comprehensive income (loss) | | | - | | | | - | | | | - | | | | - | | | | - | | | | - | |
Total comprehensive income (loss) | | $ | 810 | | | $ | (902) | | | $ | 81 | | | $ | (206) | | | $ | (3) | | | $ | (6) | |
Dividends paid to NCI | | $ | - | | | $ | - | | | $ | 7 | | | $ | 6 | | | $ | - | | | $ | - | |
| | | | | | | | | | | | | | | | | | | | | | | | |
| Summarized Statements of Cash Flows | | | | | | | | | | | | | | | | | | | | | | | | |
| | | Pueblo Viejo | | | Acacia | | | Cerro Casale | |
| For the years ended December 31 | | 2016 | | | 2015 | | | 2016 | | | 2015 | | | 2016 | | | 2015 | |
Net cash provided by (used in) operating activities | | $ | 602 | | | $ | 471 | | | $ | 324 | | | $ | 165 | | | $ | (1) | | | $ | (5) | |
Net cash used in investing activities | | | (54) | | | | (100) | | | | (190) | | | | (189) | | | | - | | | | - | |
Net cash provided by (used in) financing activities | | | (350) | | | | (301) | | | | (49) | | | | (37) | | | | 2 | | | | 2 | |
Net increase (decrease) in cash and cash equivalents | | $ | 198 | | | $ | 70 | | | $ | 85 | | | $ | (61) | | | $ | 1 | | | $ | (3) | |
Under the terms of Pueblo Viejo’s project financing agreement described in note 25b, Pueblo Viejo Dominicana Corporation is restricted from making cash payments to Barrick and Goldcorp in the form of dividends, distributions or certain shareholder loan interest and principal payments. Pueblo Viejo Dominicana Corporation is permitted to make such restricted payments twice per year upon satisfaction of certain conditions.
The project financing agreement contains covenants which limit certain activities by Pueblo Viejo Dominicana Corporation, including Pueblo Viejo’s ability to sell assets and incur debt. Furthermore, Pueblo Viejo’s material tangible and intangible assets, including the proceeds from metal sales, are segregated and pledged for the benefit of the project lenders, thus restricting our access to those assets and our ability to use those assets to settle our liabilities to third parties.
| | | | |
| BARRICK YEAR-END 2016 | | 160 | | NOTES TO FINANCIAL STATEMENTS |
33 > REMUNERATION OF KEY MANAGEMENT PERSONNEL
Key management personnel include the members of the Board of Directors and the Executive leadership team. Compensation for key management personnel (including Directors) was as follows:
| | | | | | | | |
| For the years ended December 31 | | 2016 | | | 2015 | |
Salaries and short-term employee benefits1 | | | $ 19 | | | | $ 31 | |
Post-employment benefits2 | | | 2 | | | | 2 | |
Share-based payments and other3 | | | 17 | | | | 6 | |
| | | | $ 38 | | | | $ 39 | |
1 Includes annual salary and annual short-term incentives/other bonuses earned in the year.
2 Represents Company contributions to retirement savings plans.
3 Relates to stock option, RSU, PGSU and PRSU grants and other compensation.
34 > STOCK-BASED COMPENSATION
A Global Employee Share Plan (GESP)
In 2016, Barrick launched a Global Employee Share Plan. This is a plan awarded to all eligible employees. During 2016, Barrick contributed and expensed $3 million to this plan.
B Restricted Share Units (RSUs) and Deferred Share Units (DSUs)
Under our RSU plan, selected employees are granted RSUs where each RSU has a value equal to one Barrick common share. RSUs generally vest fromtwo-and-a-half years to three years and are settled in cash upon vesting. Additional RSUs are credited to reflect dividends paid on Barrick common shares over the vesting period.
Compensation expense for RSUs incorporates an expected forfeiture rate. The expected forfeiture rate is estimated based on historical forfeiture rates and expectations of future forfeiture rates. We make adjustments if the actual forfeiture rate differs from the expected rate. At December 31, 2016, the weighted average remaining contractual life of RSUs was 1.09 years (2015: 1.37 years).
Compensation expense for RSUs was a $60 million charge to earnings in 2016 (2015: $16 million) and is presented as a component of corporate administration and operating segment administration, consistent with the classification of other elements of compensation expense for those employees who had RSUs.
Under our DSU plan, Directors must receive a specified portion of their basic annual retainer in the form of DSUs, with the option to elect to receive 100% of such retainer in DSUs. Officers may also elect to receive a portion or all of their incentive compensation in the form of DSUs. Each DSU has the same value as one Barrick common share. DSUs must be retained until the Director or officer leaves the Board or Barrick, at which time the cash value of the
DSUs will be paid out. Additional DSUs are credited to reflect dividends paid on Barrick common shares. DSUs are recorded at fair value on the grant date and are adjusted for changes in fair value. The fair value of amounts granted each period together with changes in fair value are expensed.
DSU and RSU Activity
| | | | | | | | | | | | | | | | |
| | | DSUs | | | Fair value | | | RSUs | | | Fair value | |
| | | (thousands) | | | ($ millions) | | | (thousands) | | | ($ millions) | |
At January 1, 2015 | | | 261 | | | | $ 2.8 | | | | 3,605 | | | | $ 19.8 | |
Settled for cash | | | (34) | | | | (0.2) | | | | (1,492) | | | | (11.1) | |
Forfeited | | | - | | | | - | | | | (54) | | | | (0.6) | |
Granted | | | 238 | | | | 2.0 | | | | 4,458 | | | | 48.9 | |
Credits for dividends | | | - | | | | - | | | | 110 | | | | 1.0 | |
Change in value | | | - | | | | (1.1) | | | | - | | | | (33.4) | |
At December 31, 2015 | | | 465 | | | | $ 3.5 | | | | 6,627 | | | | $ 24.6 | |
Settled for cash | | | (26) | | | | (0.4) | | | | (1,102) | | | | (22.7) | |
Forfeited | | | - | | | | - | | | | (2,952) | | | | (46.3) | |
Granted | | | 134 | | | | 2.2 | | | | 3,836 | | | | 55.0 | |
Credits for dividends | | | - | | | | - | | | | 43 | | | | 0.7 | |
Change in value | | | - | | | | 3.8 | | | | - | | | | 47.3 | |
At December 31, 2016 | | | 573 | | | | $ 9.2 | | | | 6,452 | | | | $ 58.6 | |
At December 31, 2016, Acacia Mining plc had $1 million of DSUs outstanding (2015: $1 million) and $3 million of RSUs outstanding (2015: $2 million).
| | | | |
| BARRICK YEAR-END 2016 | | 161 | | NOTES TO FINANCIAL STATEMENTS |
C Performance Restricted Share Units (PRSUs)
In 2008, Barrick launched a PRSU plan. Under this plan, selected employees are granted PRSUs, where each PRSU has a value equal to one Barrick common share. At December 31, 2016, 489 thousand units were outstanding at a fair value of $6 million (2015: 1,169 thousand units, fair value $5 million).
At December 31, 2016, Acacia Mining plc had $8 million of PRSUs outstanding (2015: $12 million).
D Performance Granted Share Units (PGSUs)
In 2014, Barrick launched a PGSU plan. Under this plan, selected employees are granted PGSUs, where each PGSU has a value equal to one Barrick common share. At December 31, 2016, 1,536 thousand units had been granted at a fair value of $11 million (2015: 589 thousand units at a value of $1 million).
E Employee Share Purchase Plan (ESPP)
In 2008, Barrick launched an Employee Share Purchase Plan. This plan enables Barrick employees to purchase Company shares through payroll deduction. During 2016, Barrick contributed and expensed $0.3 million to this plan (2015: $0.4 million).
F Stock Options
Under Barrick’s stock option plan, certain officers and key employees of the Corporation may purchase common shares at an exercise price that is equal to the closing share price on the day before the grant of the option. The grant date is the date when the details of the award, including the number of options granted by individual and the exercise price, are approved. Stock options vest evenly over four years, beginning in the year after granting. Options are exercisable over seven years. At December 31, 2016, 2.1 million (2015: 2.9 million) common shares were available for granting options.
Compensation expense for stock options was $nil million in 2016 (2015: $2 million recovery), and is presented as a component of corporate administration and operating segment administration, consistent with the classification of other elements of compensation expense for those employees who had stock options. The recognition of compensation expense for stock options had no impact on earnings per share for 2016 and 2015.
Total intrinsic value relating to options exercised in 2016 was $nil (2015: $nil).
Employee Stock Option Activity (Number of Shares in Millions)
| | | | | | | | | | | | | | | | |
| | | 2016 | | | 2015 | |
| | | | |
| | | Shares | | | Average Price | | | Shares | | | Average Price | |
C$ options | | | | | | | | | | | | | | | | |
At January 1 | | | 0.3 | | | | $ 13 | | | | 0.2 | | | | $ 19 | |
Granted | | | - | | | | - | | | | 0.2 | | | | 10 | |
Cancelled/expired | | | - | | | | - | | | | (0.1) | | | | 20 | |
At December 31 | | | 0.3 | | | | $ 13 | | | | 0.3 | | | | $ 13 | |
US$ options | | | | | | | | | | | | | | | | |
At January 1 | | | 2.6 | | | | $ 42 | | | | 5.2 | | | | $ 41 | |
Forfeited | | | (0.4) | | | | 45 | | | | (0.3) | | | | 46 | |
Cancelled/expired | | | (0.4) | | | | 39 | | | | (2.3) | | | | 40 | |
At December 31 | | | 1.8 | | | | $ 42 | | | | 2.6 | | | | $ 42 | |
| | | | |
| BARRICK YEAR-END 2016 | | 162 | | NOTES TO FINANCIAL STATEMENTS |
Stock Options Outstanding (Number of Shares in Millions)
| | | | | | | | | | | | | | | | | | | | | | | | | | | | | | | | |
| | | Outstanding | | | | | | Exercisable | |
| Range of exercise prices | | Shares | | | Average
price | | | Average life
(years) | | | Intrinsic
value1
($ millions) | | | | | | Shares | | | Average price | | | Intrinsic value1
($ millions) | |
C$ options | | | | | | | | | | | | | | | | | | | | | | | | | | | | | | | | |
$9 - $17 | | | 0.2 | | | | $ 10 | | | | 5.6 | | | | $ 2 | | | | | | | | 0.1 | | | | $ 10 | | | | $ 1 | |
$18 - $21 | | | 0.1 | | | | 18 | | | | 3.6 | | | | 1 | | | | | | | | 0.1 | | | | 18 | | | | - | |
| | | | 0.3 | | | | $ 13 | | | | 4.9 | | | | $ 3 | | | | | | | | 0.2 | | | | $ 14 | | | | $ 1 | |
US$ options | | | | | | | | | | | | | | | | | | | | | | | | | | | | | | | | |
$32 - $41 | | | 0.9 | | | | $ 33 | | | | 2.9 | | | | $ (16) | | | | | | | | 0.9 | | | | $ 33 | | | | $ (15) | |
$42 - $55 | | | 0.9 | | | | 51 | | | | 1.6 | | | | (31) | | | | | | | | 0.8 | | | | 51 | | | | (30) | |
| | | | 1.8 | | | | $ 42 | | | | 2.3 | | | | $ (47) | | | | | | | | 1.7 | | | | $ 42 | | | | $ (45) | |
1 Based on the closing market share price on December 31, 2016 of C $21.49 and US $15.98 .
As at December 31, 2016, there was $0.1 million (2015: $1 million) of total unrecognized compensation cost relating to unvested stock options. We expect to recognize this cost over a weighted average period of 1 year (2015: 1 year).
35 > POST-RETIREMENT BENEFITS
Barrick operates various post-employment plans, including both defined benefit and defined contribution pension plans and other post-retirement plans. The table below outlines where the Company’s post-employment amounts and activity are included in the financial statements:
| | | | | | | | |
| For the years ended December 31 | | 2016 | | | 2015 | |
Balance sheet obligations for: | | | | | | | | |
Defined pension benefits | | | $ 66 | | | | $ 80 | |
Other post-retirement benefits | | | 6 | | | | 6 | |
Liability in the balance sheet | | | $ 72 | | | | $ 86 | |
| | |
Income statement charge included income statement for: | | | | | | | | |
Defined pension benefits | | | $ 4 | | | | $ 3 | |
Other post-retirement benefits | | | - | | | | - | |
| | | | $ 4 | | | | $ 3 | |
| | |
Measurements for: | | | | | | | | |
Defined pension benefits | | | $ 11 | | | | $ 7 | |
Other post-retirement benefits | | | - | | | | 1 | |
| | | | $ 11 | | | | $ 8 | |
The amounts recognized in the balance sheet are determined as follows:
| | | | | | | | |
| For the years ended December 31 | | 2016 | | | 2015 | |
Present value of funded obligations | | | $ 198 | | | | $ 219 | |
Fair value of plan assets | | | (191) | | | | (201) | |
Deficit of funded plans | | | $7 | | | | $ 18 | |
Present value of unfunded obligations | | | 59 | | | | 62 | |
Total deficit of defined benefit pension plans | | | $ 66 | | | | $ 80 | |
Impact of minimum funding requirement/asset ceiling | | | - | | | | - | |
Liability in the balance sheet | | | $ 66 | | | | $ 80 | |
A Defined Benefit Pension Plans
We have qualified defined benefit pension plans that cover certain of our former United States and Canadian employees and provide benefits based on an employee’s years of service. The plans operate under similar regulatory frameworks and generally face similar risks. The majority of benefit payments are from trustee-administered funds; however, there are also a number of unfunded plans where the Company meets the benefit payment obligation as it falls due. Plan assets held in trust are governed by local regulations and practice in each country. Responsibility for governance of the plans - overseeing all aspects of the plans including investment decisions and contribution schedules - lies with the Company. We have set up pension committees to assist in the management of the plans and have also appointed experienced independent professional experts such as actuaries, custodians and trustees.
| | | | |
| BARRICK YEAR-END 2016 | | 163 | | NOTES TO FINANCIAL STATEMENTS |
The significant actuarial assumptions were as follows:
| | | | | | | | | | | | | | | | |
| As at December 31 | | Pension Plans 2016 | | | Other Post-Retirement Benefits 2016 | | | Pension Plans 2015 | | | Other Post-Retirement Benefits 2015 | |
Discount rate | | | 2.10-3.90% | | | | 3.70% | | | | 2.10 - 4.25% | | | | 3.85% | |
B Other Post-Retirement Benefits
We provide post-retirement medical, dental, and life insurance benefits to certain employees in the US. All of these plans are unfunded.
The weighted average duration of the defined benefit obligation is 10 years (2015: 11 years).
| | | | | | | | | | | | | | | | | | | | |
| | | Less than a year | | | Between 1-2 years | | | Between 2-5 years | | | Over 5 years | | | Total | |
Pension benefits | | | $ 19 | | | | $ 19 | | | | $ 56 | | | | $ 364 | | | | $ 458 | |
Other post-retirement benefits | | | 1 | | | | 1 | | | | 2 | | | | 6 | | | | 10 | |
At December 31, 2015 | | | $ 20 | | | | $ 20 | | | | $ 58 | | | | $ 370 | | | | $ 468 | |
Pension benefits | | | 18 | | | | 19 | | | | 54 | | | | 313 | | | | 404 | |
Other post-retirement benefits | | | 1 | | | | 1 | | | | 2 | | | | 6 | | | | 10 | |
At December 31, 2016 | | | $ 19 | | | | $ 20 | | | | $ 56 | | | | $ 319 | | | | $ 414 | |
C Defined Contribution Pension Plans
Certain employees take part in defined contribution employee benefit plans and we also have a retirement plan for certain officers of the Company. Our share of contributions to these plans, which is expensed in the year it is earned by the employee, was $32 million in 2016 (2015: $38 million).
| | | | |
| BARRICK YEAR-END 2016 | | 164 | | NOTES TO FINANCIAL STATEMENTS |
36 > CONTINGENCIES
Certain conditions may exist as of the date the financial statements are issued that may result in a loss to the Company, but which will only be resolved when one or more future events occur or fail to occur. The impact of any resulting loss from such matters affecting these financial statements and noted below may be material.
Litigation and Claims
In assessing loss contingencies related to legal proceedings that are pending against us or unasserted claims that may result in such proceedings, the Company with assistance from its legal counsel evaluate the perceived merits of any legal proceedings or unasserted claims as well as the perceived merits of the amount of relief sought or expected to be sought.
U.S. Shareholder Class Action
On December 6, 2013, lead counsel and plaintiffs in the securities class action filed a consolidated amended complaint (the “Complaint”) in the U.S. District Court for the Southern District of New York (the “Court”), on behalf of anyone who purchased the common stock of the Company between May 7, 2009, and November 1, 2013. The Complaint asserted claims against the Company and individual defendants Jamie Sokalsky, Aaron Regent, Ammar Al-Joundi, Igor Gonzales, Peter Kinver, George Potter and Sybil Veenman (collectively, the “Defendants”). The Complaint alleged that the Defendants made false and misleading statements to the investing public relating (among other things) to the cost of the Pascua-Lama project (the “Project”), the amount of time it would take before production commenced at the Project, and the environmental risks of the Project, as well as alleged internal control failures. The Complaint sought an unspecified amount of damages.
The Complaint largely tracked the legal theories advanced in three prior complaints filed on June 5, 2013, June 14, 2013 and August 2, 2013. The Court consolidated those complaints and appointed lead counsel and lead plaintiffs for the resulting consolidated action in September 2013.
On April 1, 2015, the Court issued its ruling on the Defendants’ motion to dismiss. The Court dismissed the plaintiffs’ claims relating to the cost and scheduling of the Project. However, the Court allowed the plaintiffs’ claims relating to the environmental risks of the Project and alleged internal control failures to go forward. The Court denied Barrick’s motion for reconsideration of certain aspects of that ruling on June 2, 2015.
On May 31, 2016, the Company confirmed that it had reached a $140 million settlement in this matter. The settlement was approved by the Court on December 2, 2016. The amount of the settlement is insured. The Company continues to believe that the allegations by the lead plaintiffs in this matter are unfounded, and under the terms of the settlement agreement, the Company has not accepted any allegations of wrongdoing or liability.
Proposed Canadian Securities Class Actions
Between April and September 2014, eight proposed class actions were commenced against the Company in Canada in connection with the Pascua-Lama project. Four of the proceedings were commenced in Ontario, two were commenced in Alberta, one was commenced in Saskatchewan, and one was commenced in Quebec. The allegations in each of the eight Canadian proceedings are substantially similar to those in the Complaint filed by lead counsel and plaintiffs in the U.S. shareholder class action (see “U.S. Shareholder Class Action” above).
The first Ontario and Alberta actions were commenced by Statement of Claim on April 15 and 17, 2014, respectively. The same law firm acts for the plaintiffs in these two proceedings, and the Statements of Claim are largely identical. Aaron Regent, Jamie Sokalsky and Ammar Al-Joundi were also named as defendants in the two actions. Both actions purported to be on behalf of anyone who, during the period from May 7, 2009 to May 23, 2013, purchased Barrick securities in Canada. Both actions sought $4.3 billion in general damages and $350 million in special damages for alleged misrepresentations in the Company’s public disclosure. The first Ontario action was subsequently consolidated with the fourth Ontario action, as discussed below. The first Alberta action was discontinued by plaintiffs’ counsel on June 26, 2015.
The second Ontario action was commenced on April 24, 2014. Aaron Regent, Jamie Sokalsky, Ammar Al-Joundi and Peter Kinver were also named as defendants. Following a September 8, 2014 amendment to the Statement of Claim, this action purported to be on behalf of anyone who acquired Barrick securities during the period from October 29, 2010 to October 30, 2013, and sought $3 billion in damages for alleged misrepresentations in the Company’s public disclosure. As a result of the outcome of the carriage motion and appeals described below, the second Ontario action has now been stayed. The amended claim also reflects the addition of a law firm that previously acted as counsel in a third Ontario action, which was commenced by Notice of Action on April 28, 2014 and included similar allegations but was never served or pursued.
| | | | |
| BARRICK YEAR-END 2016 | | 165 | | NOTES TO FINANCIAL STATEMENTS |
The Quebec action was commenced on April 30, 2014. Aaron Regent, Jamie Sokalsky, Ammar Al-Joundi and Peter Kinver are also named as defendants. This action purports to be on behalf of any person who resides in Quebec and acquired Barrick securities during the period from May 7, 2009 to November 1, 2013. The action seeks unspecified damages for alleged misrepresentations in the Company’s public disclosure.
The second Alberta action was commenced on May 23, 2014. Aaron Regent, Jamie Sokalsky, Ammar Al-Joundi and Peter Kinver are also named as defendants. This action purports to be on behalf of any person who acquired Barrick securities during the period from May 7, 2009 to November 1, 2013, and seeks $6 billion in damages for alleged misrepresentations in the Company’s public disclosure.
The Saskatchewan action was commenced by Statement of Claim on May 26, 2014. Aaron Regent, Jamie Sokalsky, Ammar Al-Joundi and Peter Kinver were also named as defendants. This action purported to be on behalf of any person who acquired Barrick securities during the period from May 7, 2009 to November 1, 2013, and sought $6 billion in damages for alleged misrepresentations in the Company’s public disclosure. The action was discontinued by plaintiffs’ counsel on December 19, 2016.
The fourth Ontario action was commenced on September 5, 2014. Aaron Regent, Jamie Sokalsky, Ammar Al-Joundi and Peter Kinver are also named as defendants. This action purports to be on behalf of any person who acquired Barrick securities during the period from May 7, 2009 to November 1, 2013 in Canada, and seeks $3 billion in damages plus an unspecified amount for alleged misrepresentations in the Company’s public disclosure. The Statement of Claim was amended on October 20, 2014, to include two additional law firms, one of which is acting as counsel in the first Ontario action referred to above.
In November 2014, an Ontario court heard a motion to determine which of the competing counsel groups will take the lead in the Ontario litigation. The court issued a decision in December 2014 in favor of the counsel group that commenced the first and fourth Ontario actions, which have been consolidated in a single action. The lower court’s decision was subsequently affirmed by the Divisional Court in May 2015 and the Court of Appeal for Ontario in July 2016 following appeals by the losing counsel group. The losing counsel group sought leave to appeal to the Supreme Court of Canada but later discontinued the application after reaching an agreement with the counsel group that commenced the first and fourth Ontario actions.
The Company intends to vigorously defend all of the proposed Canadian securities class actions. No amounts have been recorded for any potential liability arising from any of the proposed class actions, as the Company cannot reasonably predict the outcome.
Pascua-Lama – SMA Regulatory Sanctions
In May 2013, Compañía Minera Nevada (“CMN”), Barrick’s Chilean subsidiary that holds the Chilean portion of the Pascua-Lama project (the “Project”), received a Resolution (the “Resolution”) from Chile’s environmental regulator (the Superintendencia del Medio Ambiente, or “SMA”) that requires the company to complete the water management system for the Project in accordance with the Project’s environmental permit before resuming construction activities in Chile. The Resolution also required CMN to pay an administrative fine of approximately $16 million for deviations from certain requirements of the Project’s Chilean environmental approval, including a series of reporting requirements and instances ofnon-compliance related to the Project’s water management system. CMN paid the administrative fine in May 2013.
In June 2013, CMN began engineering studies to review the Project’s water management system in accordance with the Resolution. The studies were suspended in the second half of 2015 as a result of CMN’s decision to file a temporary and partial closure plan for the Project (for more information about this plan, see “Pascua-Lama – Constitutional Protection Action” below). The review of the Project’s water management system may require a new environmental approval and the construction of additional water management facilities.
In June 2013, a group of local farmers and indigenous communities challenged the Resolution. The challenge, which was brought in the Environmental Court of Santiago, Chile (the “Environmental Court”), claims that the fine was inadequate and requests more severe sanctions against CMN including the revocation of the Project’s environmental permit. The SMA presented its defense of the Resolution in July 2013. On August 2, 2013, CMN joined as a party to this proceeding and vigorously defended the Resolution. On March 3, 2014, the Environmental Court annulled the Resolution and remanded the matter back to the SMA for further consideration in accordance with its decision (the “Environmental Court Decision”). In particular, the Environmental Court ordered the SMA to issue a new administrative decision that recalculates the amount of the fine to be paid by CMN using a different methodology and addresses certain other errors it identified in the Resolution. A new resolution from the SMA could include more severe sanctions against CMN such as a
| | | | |
| BARRICK YEAR-END 2016 | | 166 | | NOTES TO FINANCIAL STATEMENTS |
material increase in the amount of the fine above the approximately $16 million imposed by the SMA in May 2013 and/or the revocation of the Project’s environmental permit. The Environmental Court did not annul the portion of the SMA Resolution that required the Company to halt construction on the Chilean side of the project until the water management system is completed in accordance with the project’s environmental permit. On December 30, 2014, the Chilean Supreme Court declined to consider CMN’s appeal of the Environmental Court Decision on procedural grounds. As a result of the Supreme Court’s ruling, on April 22, 2015, the SMA reopened the administrative proceeding against CMN in accordance with the Environmental Court Decision.
On April 22, 2015, CMN was notified that the SMA has initiated a new administrative proceeding for alleged deviations from certain requirements of the Project’s environmental approval, including with respect to the Project’s environmental impact and a series of monitoring requirements. In May 2015, CMN submitted a compliance program to address certain of the allegations and presented its defense to the remainder of the alleged deviations. The SMA rejected CMN’s proposed compliance program on June 24, 2015, and denied CMN’s administrative appeal of that decision on July 31, 2015. On December 30, 2016, the Environmental Court rejected CMN’s appeal and CMN declined to challenge this decision. The decision of the SMA with respect to CMN’s defense to the remainder of the alleged deviations is still pending.
On June 8, 2016, the SMA consolidated the two administrative proceedings against CMN into a single proceeding encompassing both the reconsideration of the 2013 Resolution in accordance with the decision of the Environmental Court and the alleged deviations from the Project’s environmental approval notified by the SMA in April 2015. A final resolution from the SMA with respect to these matters is pending and could result in additional sanctions including new administrative fines and/or the revocation of the Project’s environmental permit.
The Company has recorded an estimated amount for the potential liability arising from administrative fines in these matters. In the Company’s view, it would be prejudicial to disclose the amount of that estimate as the proceedings are ongoing and the SMA has not issued any additional proposed administrative fines.
Pascua-Lama – Constitutional Protection Action
CMN filed a temporary and partial closure plan for the Pascua-Lama project (the “Temporary Closure Plan”) with the Chilean mining authority (Sernageomin) on August 31,
2015. Sernageomin approved the Temporary Closure Plan on September 29, 2015, and issued a resolution requiring CMN to comply with certain closure-related maintenance and monitoring obligations for a period of two years. The Temporary Closure Plan does not address certain facilities, including the Project’s water management system, which remain subject to the requirements of the Project’s original environmental approval and other regulations.
On December 4, 2015, a constitutional protection action was filed in the Court of Appeals of Santiago, Chile by a group of local farmers and other individuals against CMN and Sernageomin in order to challenge the Temporary Closure Plan and the resolution that approved it. The plaintiffs assert that the Temporary Closure Plan cannot be approved until the water management system for the Project has been completed in accordance with the Project’s environmental permit. On August 12, 2016, the court ruled in favor of CMN and Sernageomin, rejecting the plaintiffs’ challenges to the Temporary and Partial Closure Plan for the Pascua-Lama project. On August 19, 2016, the plaintiffs appealed the court’s decision to the Chilean Supreme Court. A decision of the Supreme Court is pending. No amounts have been recorded for any potential liability arising from this matter, as the Company cannot reasonably predict the outcome.
Pascua-Lama – Water Quality Review
CMN initiated a review of the baseline water quality of the Rio Estrecho in August 2013 as required by a July 15, 2013 decision of the Court of Appeals of Copiapo, Chile. The purpose of the review was to establish whether the water quality baseline has changed since the Pascua-Lama project received its environmental approval in February 2006 and, if so, to require CMN to adopt the appropriate corrective measures. As a result of that study, CMN requested certain modifications to its environmental permit water quality requirements. On June 6, 2016, the responsible agency approved a partial amendment of the environmental permit to better reflect the water quality baseline from 2009. That approval was appealed by certain water users and indigenous residents of the Huasco Valley. On October 19, 2016, the Chilean Committee of Ministers for the Environment, which has jurisdiction over claims of this nature, voted to uphold the permit amendments. On January 27, 2017, the Environmental Court agreed to consider an appeal of the Chilean Committee’s decision brought by CMN and the water users and indigenous residents. No amounts have been recorded for any potential liability arising from this matter, as the Company cannot reasonably predict any potential losses.
| | | | |
| BARRICK YEAR-END 2016 | | 167 | | NOTES TO FINANCIAL STATEMENTS |
Veladero – Release of Cyanide-Bearing Process Solution
San Juan Provincial Regulatory Sanction Proceeding
On September 13, 2015, a valve on a leach pad pipeline at the Company’s Veladero mine in San Juan Province, Argentina failed, resulting in a release of cyanide-bearing process solution into a nearby waterway through a diversion channel gate that was open at the time of the incident. Minera Argentina Gold SRL (“MAG”) (formerly, Minera Argentina Gold S.A. or MAGSA), Barrick’s Argentine subsidiary that operates the Veladero mine, notified regulatory authorities of the situation. Environmental monitoring was conducted by MAG and independent third parties following the incident. The Company believes this monitoring demonstrates that the incident posed no risk to human health at downstream communities. A temporary restriction on the addition of new cyanide to the mine’s processing circuit was lifted on September 24, 2015, and mine operations have returned to normal. Monitoring and inspection of the mine site will continue in accordance with a court order.
On October 9, 2015, the San Juan mining authority initiated an administrative sanction process against MAG for alleged violations of the mining code relating to the valve failure and release of cyanide-bearing process solution. MAG submitted its response to these allegations in October 2015 and provided additional information in January 2016.
On March 11, 2016, the San Juan Provincial mining authority announced its intention to impose an administrative fine against MAG in connection with the solution release. MAG was formally notified of this decision on March 15, 2016. On April 6, 2016, MAG sought reconsideration of certain aspects of the decision but did not challenge the amount of the administrative fine. On April 14, 2016, in accordance with local requirements, MAG paid the administrative fine of approximately $10 million (at the then-applicable Argentine peso/$ exchange rate) while the request for reconsideration is pending. On December 29, 2016, the request for reconsideration was rejected by the Provincial mining authority. MAG is considering whether to continue challenging certain aspects of the decision. MAG is implementing a remedial action plan at Veladero in response to the incident as required by the San Juan mining authority. Certain construction-related activities in the Valley Fill Leach Facility (the “VLF”) are still pending.
Criminal Matters
On March 11, 2016, a San Juan Provincial court laid criminal charges based on alleged negligence against nine current and former MAG employees in connection with the solution
release (the “Provincial Action”). The individual defendants have appealed the indictment.
In addition, a federal criminal investigation was initiated by a Buenos Aires federal court based on the alleged failure of certain current and former federal and provincial government officials and individual directors of MAG to prevent the solution release (the “Federal Investigation”). The federal judge overseeing the Federal Investigation admitted a local group in San Juan Province as a party. In March 2016, this group requested an injunction against the operations of the Veladero mine. The federal judge ordered technical studies to assess the solution release and its impact and appointed a committee to conduct a site visit, which occurred in late April 2016.
On May 5, 2016, the National Supreme Court of Argentina limited the scope of the Federal Investigation to the potential criminal liability of the federal government officials, ruling that the Buenos Aires federal court does not have jurisdiction to investigate the solution release. As a result of this decision, the investigation into the incident will continue to be conducted by the San Juan Provincial judge in the Provincial Action. To date, no charges have been laid against any specific individuals in connection with the Federal Investigation, consistent with its more limited scope.
MAG is not a party to either the Provincial Action or the Federal Investigation. No amounts have been recorded for any potential liability arising from these matters, as the Company cannot reasonably predict any potential losses.
Veladero – Release of Crushed Ore Saturated with Process Solution
Temporary Suspension of Operations and Regulatory Infringement Proceeding
On September 8, 2016, ice rolling down the slope of the leach pad at the Veladero mine damaged a pipe carrying process solution, causing some material to leave the leach pad. This material, primarily crushed ore saturated with process solution, was contained on the mine site and returned to the leach pad. Extensive water monitoring in the area conducted by MAG has confirmed that the incident did not result in any environmental impacts. A temporary suspension of operations at the Veladero mine was ordered by the San Juan Provincial mining authority and a San Juan Provincial court on September 15, 2016 and September 22, 2016, respectively, as a result of this incident. On October 4, 2016, following, among other matters, the completion of certain urgent works required by the San Juan Provincial
| | | | |
| BARRICK YEAR-END 2016 | | 168 | | NOTES TO FINANCIAL STATEMENTS |
mining authority and a judicial inspection of the mine, the San Juan Provincial court lifted the suspension of operations and ordered that mining activities be resumed.
On September 14, 2016, the San Juan Provincial mining authority commenced an administrative proceeding in connection with this incident that included, in addition to the issue of the suspension order, an infringement proceeding against MAG. On December 2, 2016, the San Juan Provincial mining authority notified MAG of two charges under the infringement proceeding for alleged violations of the Mining Code. A new criminal judicial investigation has also been commenced by the Provincial prosecutor’s office in the same San Juan Provincial court that is hearing the Provincial Action. The court in this proceeding issued the orders suspending and resuming the operations at the Veladero mine described above. No amounts have been recorded for any potential liability arising from these matters, as the Company cannot reasonably predict the outcome.
Veladero Cyanide Leaching Process – Civil Action
On December 15, 2016, MAG was served notice of a lawsuit by certain persons who claim to be living in Jachal, Argentina and to be affected by the Veladero mine and, in particular, the VLF. In the lawsuit, which was filed in the San Juan Provincial court, the plaintiffs have requested a court order that MAG cease leaching metals with cyanide solutions, mercury and other similar substances at the Veladero mine and replace that process with one that is free of hazardous substances, that MAG implement a closure and remediation plan for the VLF and surrounding areas, and create a committee to monitor this process. The lawsuit is proceeding as an ordinary civil action. The company expects to reply to the lawsuit inmid-February 2017, and the case will then proceed to the evidentiary stage. The Company intends to defend this matter vigorously. No amounts have been recorded for any potential liability or asset impairment under this matter, as the Company cannot reasonably predict the outcome.
Argentine Glacier Legislation and Constitutional Litigation
On September 30, 2010, the National Law on Minimum Requirements for the Protection of Glaciers was enacted in Argentina, and came into force in early November 2010. The federal law bans new mining exploration and exploitation activities on glaciers and in the “peri-glacial” environment, and subjects ongoing mining activities to an environmental audit. If such audit identifies significant impacts on glaciers and peri-glacial environment, the relevant authority is empowered to take action, which according to the legislation could include the suspension or
relocation of the activity. In the case of the Veladero mine and the Pascua-Lama project, the competent authority is the Province of San Juan. In late January 2013, the Province announced that it had completed the required environmental audit, which concluded that Veladero and Pascua-Lama do not impact glaciers or peri-glaciers. On October 3, 2016, federal authorities published a partial national inventory of glaciers, which includes the area where the Veladero mine and Pascua Lama Project are located. The Company has analyzed the national inventory in the area where Veladero and Pascua-Lama are located and has concluded that this inventory is consistent with the provincial inventory that the Province of San Juan used in connection with its January 2013 environmental audit.
The constitutionality of the federal glacier law is the subject of a challenge before the National Supreme Court of Argentina, which has not yet ruled on the issue. On October 27, 2014, the Company submitted its response to a motion by the federal government to dismiss the constitutional challenge to the federal glacier law on standing grounds. A decision on the motion is pending. If the federal government’s arguments with respect to standing are accepted then the case will be dismissed. If they are not accepted then the National Supreme Court of Argentina will proceed to hear evidence on the merits. No amounts have been recorded for any potential liability or asset impairment under this matter, as the Company cannot reasonably predict the outcome and in any event the provincial audit concluded that the Company’s activities do not impact glaciers or peri-glaciers.
Pueblo Viejo – Amparo Action
In October 2014, Pueblo Viejo Dominicana Corporation (“PVDC”) received a copy of an action filed in an administrative court (the “Administrative Court”) in the Dominican Republic by Rafael Guillen Beltre (the “Petitioner”), who claims to be affiliated with the Dominican Christian Peace Organization. The action alleges that environmental contamination in the vicinity of the Pueblo Viejo mine has caused illness and affected water quality in violation of the Petitioner’s fundamental rights under the Dominican Constitution and other laws. The primary relief sought in the action, which is styled as an “Amparo” remedy, is the suspension of operations at the Pueblo Viejo mine as well as other mining projects in the area until an investigation into the alleged environmental contamination has been completed by the relevant governmental authorities. On November 21, 2014, the Administrative Court granted PVDC’s motion to remand the matter to a trial court in the Municipality of Cotuí (the “Trial Court”) on procedural grounds. On June 25, 2015, the Trial Court rejected the Petitioner’s amparo action, finding that the
| | | | |
| BARRICK YEAR-END 2016 | | 169 | | NOTES TO FINANCIAL STATEMENTS |
Petitioner failed to produce evidence to support his allegations. The Petitioner appealed the Trial Court’s decision to the Constitutional Court on July 21, 2015. On July 28, 2015, PVDC filed a motion to challenge the timeliness of this appeal as it was submitted after the expiration of the applicable filing deadline. The Company intends to vigorously defend this matter. No amounts have been recorded for any potential liability or asset impairment arising from this matter, as the Company cannot reasonably predict any potential losses.
Perilla Complaint
In 2009, Barrick Gold Inc. and Placer Dome Inc. were purportedly served in Ontario with a complaint filed in November 2008 in the Regional Trial Court of Boac (the “Court”), on the Philippine island of Marinduque, on behalf of two named individuals and purportedly on behalf of the approximately 200,000 residents of Marinduque. The complaint alleges injury to the economy and the ecology of Marinduque as a result of the discharge of mine tailings from the Marcopper mine into Calancan Bay, the Boac River, and the Mogpog River. The plaintiffs are claiming for abatement of a public nuisance allegedly caused by the tailings discharge and for nominal damages for an alleged violation of their constitutional right to a balanced and healthful ecology. In June 2010, Barrick Gold Inc. and Placer Dome Inc. filed a motion to have the Court resolve their unresolved motions to dismiss before considering the plaintiffs’ motion to admit an amended complaint and also filed an opposition to the plaintiffs’ motion to admit on the same basis. It is not known when these motions or the outstanding motions to dismiss will be decided by the Court. The Company intends to defend the action vigorously. No amounts have been recorded for any potential liability under this complaint, as the Company cannot reasonably predict the outcome.
Writ of Kalikasan
In February 2011, a Petition for the Issuance of a Writ of Kalikasan with Prayer for Temporary Environmental Protection Order was filed in the Supreme Court of the Republic of the Philippines (the “Supreme Court”) in Eliza M. Hernandez, Mamerto M. Lanete and Godofredo L. Manoy versus Placer Dome Inc. and Barrick Gold Corporation (the “Petition”). In March 2011, the Supreme Court issued an En Banc Resolution and Writ of Kalikasan, directed service of summons on Placer Dome Inc. and the Company, ordered Placer Dome Inc. and the Company to make a verified return of the Writ with ten (10) days of service and referred the case to the Court of Appeal for hearing. The Petition alleges that Placer Dome Inc. violated the petitioners’ constitutional right to a balanced and healthful ecology as a result of, among other things, the discharge of tailings into
Calancan Bay, the 1993 Maguila-Guila dam break, the 1996 Boac River tailings spill and failure of Marcopper to properly decommission the Marcopper mine. The petitioners have pleaded that the Company is liable for the alleged actions and omissions of Placer Dome Inc., which was a minority indirect shareholder of Marcopper at all relevant times, and is seeking orders requiring the Company to environmentally remediate the areas in and around the mine site that are alleged to have sustained environmental impacts. The petitioners purported to serve the Company in March 2011, following which the Company filed an Urgent Motion For Ruling on Jurisdiction with the Supreme Court challenging the constitutionality of the Rules of Procedure in Environmental Cases (the “Environmental Rules”) pursuant to which the Petition was filed, as well as the jurisdiction of the Supreme Court over the Company. In November 2011, two local governments, or “baranguays” (Baranguay San Antonio and Baranguay Lobo) filed a motion with the Supreme Court seeking intervenor status with the intention of seeking a dismissal of the proceedings. No decision has as yet been issued with respect to the Urgent Motion for Ruling on Jurisdiction, the motion for intervention, or certain other matters before the Supreme Court. The Company intends to continue to defend the action vigorously. No amounts have been recorded for any potential liability under this matter, as the Company cannot reasonably predict the outcome.
Cerro Casale
One of the environmental permits related to the open pit and water management system at the Company’s 75 percent-owned Cerro Casale project in Chile is subject to an environmental regulation (the “Regulation”) that, if applied as written, would have required the Company to begin construction of the project by January 26, 2015 or risk cancellation of the environmental permit. The Company sought relief from the Regulation as construction was not feasible and did not begin by that date. On October 15, 2015, the Chilean environmental authority issued a resolution confirming that initial project activities were timely commenced as required by the environmental permit and the matter is now closed. Permits required for the majority of the project’s proposed operations were obtained under a second environmental approval (the “Cerro Casale environmental permit”) that is subject to a January 2018 construction deadline. On August 10, 2016, the Company filed documentation and supporting materials related to initial activities at the Cerro Casale project and expects to obtain relief from this deadline through the procedure outlined above.
The Cerro Casale environmental permit was challenged in 2013 by local and indigenous community members for
| | | | |
| BARRICK YEAR-END 2016 | | 170 | | NOTES TO FINANCIAL STATEMENTS |
alleged procedural deficiencies in the community consultation process and other aspects of the evaluation of the project by the Chilean environmental authority. The challenge was brought before the Chilean Committee of Ministers for the Environment, which has jurisdiction over procedural claims of this nature. On January 19, 2015, the Committee of Ministers for the Environment rejected the majority of claims made against the Cerro Casale environmental permit while also imposing new limitations on the volume of groundwater that the project may extract for mining operations. The Company appealed this decision to the Environmental Court, which held a hearing on August 27, 2015. A decision of the Environmental Court is pending in this matter. The Company intends to defend the action vigorously. No amounts have been recorded for any potential liability or asset impairment arising from this matter, as the Company cannot reasonably predict the outcome.
Acacia Mining plc - Tanzanian Revenue Authority Assessments
In January 2016, The Tanzanian Revenue Authority (“TRA”) issued an assessment to Acacia Mining plc (“Acacia”) in the amount of $41.3 million for withholding tax on certain historic offshore dividend payments paid by Acacia to its shareholders. Acacia is appealing this assessment on the substantive grounds that, as an English incorporated company, it is not resident in Tanzania for taxation purposes. The appeal is currently pending at the Court of Appeal and the substantive grounds of appeal will be filed on receipt of the record of appeal required from the lower tribunals.
Further TRA assessments were issued to Acacia in January 2016 in the amount of $500.7 million, based on an allegation that Acacia is resident in Tanzania for corporate and dividend withholding tax purposes. The corporate tax assessments have been levied on certain of Acacia’s net profits before tax. Acacia is in the process of appealing these assessments at the TRA Board level. Acacia’s substantive grounds of appeal are based on the correct interpretation of Tanzanian permanent establishment principles and law, relevant to a non-resident English incorporated company. Accordingly no amounts have been recorded for any potential liability and Acacia intends to continue to defend these actions vigorously.
| | | | |
| BARRICK YEAR-END 2016 | | 171 | | NOTES TO FINANCIAL STATEMENTS |
| | |
HEAD OFFICE | | TRANSFER AGENTS AND REGISTRARS |
| |
Barrick Gold Corporation | | CST Trust Company |
Brookfield Place TD Canada Trust Tower 161 Bay Street, Suite 3700 Toronto, Ontario M5J 2S1 Telephone: +1 416 861-9911 Toll-free: 1-800-720-7415 Fax: +1 416 861-2492 Email:investor@barrick.com Website:www.barrick.com | | P.O. Box 700, Postal Station B Montreal, Quebec H3B 3K3 or American Stock Transfer & Trust Company, LLC 6201 – 15 Avenue Brooklyn, New York 11219 Telephone: 1-800-387-0825 Fax: 1-888-249-6189 Email:inquiries@canstockta.com Website:www.canstockta.com |
| |
| |
| |
| |
| |
| |
| |
| |
| |
SHARES LISTED | | |
|
ABX – The New York Stock Exchange |
| The Toronto Stock Exchange |
| |
INVESTOR CONTACT | | MEDIA CONTACT |
| |
Daniel Oh | | Andy Lloyd |
| Senior Vice President | | Senior Vice President |
| Investor Engagement and Governance | | Communications |
| Telephone: +1 416 307-7474 | | Telephone: +1 416 307-7414 |
| Email:doh@barrick.com | | Email:alloyd@barrick.com |
CAUTIONARY STATEMENT ON FORWARD-LOOKING INFORMATION
Certain information contained or incorporated by reference in this Fourth Quarter and Year-End Report 2016, including any information as to our strategy, projects, plans, or future financial or operating performance, constitutes “forward-looking statements”. All statements, other than statements of historical fact, are forward-looking statements. The words “believe”, “expect”, “anticipate”, “contemplate”, “target”, “plan”, “objective” “aspiration”, “aim”, “intend”, “project”, “goal”, “continue”, “budget”, “estimate”, “potential”, “may”, “will”, “can”, “should”, “could”, “would”, and similar expressions identify forward-looking statements. In particular, this Fourth Quarter and Year-End Report 2016 contains forward-looking statements including, without limitation, with respect to: (i) Barrick's forward-looking production guidance; (ii) estimates of future cost of sales per ounce for gold and per pound for copper, all-in-sustaining costs per ounce/pound, cash costs per ounce, and C1 cash costs per pound; (iii) cash flow forecasts; (iv) projected capital, operating, and exploration expenditures; (v) targeted debt and cost reductions; (vi) mine life and production rates; (vii) potential mineralization and metal or mineral recoveries; (viii) Barrick’s Best-in-Class program (including potential improvements to financial and operating performance that may result from certain Best-in-Class initiatives); (ix) the Lama starter project and the potential for phased-in development of the Pascua-Lama project; (x) the potential to identify new reserves and resources; (xi) our pipeline of high confidence projects at or near existing operations; (xii) the extension of mine life at Lagunas Norte; (xiii) the benefits of integrating the Cortez and Goldstrike operations; (xiv) the potential impact and benefits of Barrick’s digital transformation; (xv) asset sales, joint ventures, and partnerships; and (xvi) expectations regarding future price assumptions, financial performance, and other outlook or guidance.
Forward-looking statements are necessarily based upon a number of estimates and assumptions that, while considered reasonable by the Company as at the date of this press release in light of management’s experience and perception of current conditions and expected developments, are inherently subject to significant business, economic and competitive uncertainties and contingencies. Known and unknown factors could cause actual results to differ materially from those projected in the forward-looking statements, and undue reliance should not be placed on such statements and information. Such factors include, but are not limited to: fluctuations in the spot and forward price of gold, copper, or certain other commodities (such as silver, diesel fuel, natural gas, and electricity); the speculative nature of mineral exploration and development; changes in mineral production performance, exploitation, and exploration successes; risks associated with the fact that certain Best-in-Class initiatives are still in the early stages of evaluation, and additional engineering and other analysis is required to fully assess their impact; risks associated with the implementation of Barrick’s digital transformation initiative, and the ability of the projects under this initiative to meet the Company’s capital allocation objectives; diminishing quantities or grades of reserves; increased costs, delays, suspensions, and technical challenges associated with the construction of capital projects; operating or technical difficulties in connection with mining or development activities, including geotechnical challenges, and disruptions in the maintenance or provision of required infrastructure and information technology systems; failure to comply with environmental and health and safety laws and regulations; timing of receipt of, or failure to comply with, necessary permits and approvals; uncertainty whether some or all of the Best-in-Class initiatives and targeted investments will meet the Company’s capital allocation objectives; the impact of global liquidity and credit availability on the timing of cash flows and
the values of assets and liabilities based on projected future cash flows; adverse changes in our credit ratings; the impact of inflation; fluctuations in the currency markets; changes in U.S. dollar interest rates; risks arising from holding derivative instruments; changes in national and local government legislation, taxation, controls or regulations, and/or changes in the administration of laws, policies, and practices, expropriation or nationalization of property and political or economic developments in Canada, the United States, and other jurisdictions in which the Company does or may carry on business in the future; lack of certainty with respect to foreign legal systems, corruption, and other factors that are inconsistent with the rule of law; damage to the Company’s reputation due to the actual or perceived occurrence of any number of events, including negative publicity with respect to the Company’s handling of environmental matters or dealings with community groups, whether true or not; risk of loss due to acts of war, terrorism, sabotage, and civil disturbances; litigation; contests over title to properties, particularly title to undeveloped properties, or over access to water, power and other required infrastructure; business opportunities that may be presented to, or pursued by, the Company; our ability to successfully integrate acquisitions or complete divestitures; risks associated with working with partners in jointly controlled assets; employee relations including loss of key employees; increased costs and physical risks, including extreme weather events and resource shortage, related to climate change; availability and increased costs associated with mining inputs and labor; and the organization of our previously held African gold operations and properties under a separate listed Company. In addition, there are risks and hazards associated with the business of mineral exploration, development and mining, including environmental hazards, industrial accidents, unusual or unexpected formations, pressures, cave-ins, flooding and gold bullion, copper cathode or gold or copper concentrate losses (and the risk of inadequate insurance, or inability to obtain insurance, to cover these risks).
Many of these uncertainties and contingencies can affect our actual results and could cause actual results to differ materially from those expressed or implied in any forward-looking statements made by, or on behalf of, us. Readers are cautioned that forward-looking statements are not guarantees of future performance. All of the forward-looking statements made in this Fourth Quarter and Year-End Report 2016 are qualified by these cautionary statements. Specific reference is made to the most recent Form 40-F/Annual Information Form on file with the SEC and Canadian provincial securities regulatory authorities for a more detailed discussion of some of the factors underlying forward-looking statements and the risks that may affect Barrick’s ability to achieve the expectations set forth in the forward-looking statements contained in this press release.
The Company disclaims any intention or obligation to update or revise any forward-looking statements whether as a result of new information, future events or otherwise, except as required by applicable law.