MANAGEMENT’S DISCUSSION AND ANALYSIS (“MD&A”)
Management’s Discussion and Analysis (“MD&A”) is intended to help the reader understand Barrick Gold Corporation (“Barrick”, “we”, “our” or the “Company”), our operations, financial performance and the present and future business environment. This MD&A, which has been prepared as of February 14, 2018, should be read in conjunction with our audited consolidated financial statements (“Financial Statements”) for the year ended December 31, 2017. Unless otherwise indicated, all amounts are presented in U.S. dollars.
For the purposes of preparing our MD&A, we consider the materiality of information. Information is considered material if: (i) such information results in, or would reasonably be expected to result in, a significant change in the market price or value of our shares; (ii) there is a
substantial likelihood that a reasonable investor would consider it important in making an investment decision; or (iii) it would significantly alter the total mix of information available to investors. We evaluate materiality with reference to all relevant circumstances, including potential market sensitivity.
Continuous disclosure materials, including our most recentForm 40-F/Annual Information Form, annual MD&A, audited consolidated financial statements, and Notice of Annual Meeting of Shareholders and Proxy Circular will be available on our website at www.barrick.com, on SEDAR at www.sedar.com and on EDGAR at www.sec.gov. For an explanation of terminology unique to the mining industry, readers should refer to the glossary on page 86.
CAUTIONARY STATEMENT ON FORWARD-LOOKING INFORMATION
Certain information contained or incorporated by reference in this MD&A, including any information as to our strategy, projects, plans or future financial or operating performance, constitutes “forward-looking statements”. All statements, other than statements of historical fact, are forward-looking statements. The words “believe”, “expect”, “anticipate”, “target”, “plan”, “objective”, “assume”, “intend”, “intention”, “project”, “goal”, “continue”, “budget”, “estimate”, “potential”, “may”, “will”, “can”, “could”, “would” and similar expressions identify forward-looking statements. In particular, this MD&A contains forward-looking statements including, without limitation, with respect to: (i) Barrick’s forward-looking production guidance; (ii) estimates of future cost of sales per ounce for gold and per pound for copper, cash costs per ounce and C1 cash costs per pound, andall-in-sustaining costs per ounce/pound; (iii) cash flow forecasts; (iv) projected capital, operating and exploration expenditures; (v) Barrick’s expectations regarding the potential benefits resulting from a new partnership between Acacia Mining plc (“Acacia”) and the Government of Tanzania; (vi) targeted debt and cost reductions; (vii) mine life and production rates; (viii) potential mineralization and metal or mineral recoveries; (ix) savings from our improved capital management program; (x) Barrick’sBest-in-Class program (including potential improvements to financial and operating performance that may result from certainBest-in-Class initiatives); (xi) the timing and results of the prefeasibility study at Pascua-Lama; (xii) our pipeline of high confidence projects at or near existing operations; (xiii) the benefits of unifying the Cortez and Goldstrike operations; (xiv) the potential impact and benefits of Barrick’s ongoing digital transformation; (xv) our ability to convert resources into reserves; (xvi) asset sales, joint
ventures and partnerships; and (xvii) expectations regarding future price assumptions, financial performance and other outlook or guidance.
Forward-looking statements are necessarily based upon a number of estimates and assumptions including material estimates and assumptions related to the factors set forth below that, while considered reasonable by the Company as at the date of this MD&A in light of management’s experience and perception of current conditions and expected developments, are inherently subject to significant business, economic and competitive uncertainties and contingencies. Known and unknown factors could cause actual results to differ materially from those projected in the forward-looking statements and undue reliance should not be placed on such statements and information. Such factors include, but are not limited to: fluctuations in the spot and forward price of gold, copper or certain other commodities (such as silver, diesel fuel, natural gas and electricity); the speculative nature of mineral exploration and development; changes in mineral production performance, exploitation and exploration successes; risks associated with the fact that certainBest-in-Class initiatives are still in the early stages of evaluation and additional engineering and other analysis is required to fully assess their impact; the duration of the Tanzanian ban on mineral concentrate exports; the ultimate terms of any definitive agreement between Acacia and the Government of Tanzania to resolve a dispute relating to the imposition of the concentrate export ban and allegations by the Government of Tanzania that Acacia under-declared the metal content of concentrate exports from Tanzania; the status of certain tax reassessments by the Tanzanian government; the manner in which amendments to the
| | | | |
BARRICK YEAR-END 2017 | | 22 | | MANAGEMENT’S DISCUSSION AND ANALYSIS |
2010 Mining Act (Tanzania) increasing the royalty rate applicable to metallic minerals such as gold, copper and silver to 6% (from 4%), the new Finance Act (Tanzania) imposing a 1% clearing fee on the value of all minerals exported from Tanzania from July 1, 2017 and the new Mining Regulations announced by the Government of Tanzania in January 2018 will be implemented and the impact of these and other legislative changes on Acacia; whether Acacia will approve the terms of any final agreement reached between Barrick and the Government of Tanzania with respect to the dispute between Acacia and the Government of Tanzania; the benefits expected from recent transactions being realized; diminishing quantities or grades of reserves; increased costs, delays, suspensions and technical challenges associated with the construction of capital projects; operating or technical difficulties in connection with mining or development activities, including geotechnical challenges and disruptions in the maintenance or provision of required infrastructure and information technology systems; failure to comply with environmental and health and safety laws and regulations; timing of receipt of, or failure to comply with, necessary permits and approvals; uncertainty whether some or all of theBest-in-Class initiatives, targeted investments and projects will meet the Company’s capital allocation objectives and internal hurdle rate; the impact of global liquidity and credit availability on the timing of cash flows and the values of assets and liabilities based on projected future cash flows; adverse changes in our credit ratings; the impact of inflation; fluctuations in the currency markets; changes in U.S. dollar interest rates; risks arising from holding derivative instruments; changes in national and local government legislation, taxation, controls or regulations and/or changes in the administration of laws, policies and practices; expropriation or nationalization of property and political or economic developments in Canada, the United States and other jurisdictions in which the Company or its affiliates do or may carry on business in the future; lack of certainty with respect to foreign legal systems, corruption and other factors that are inconsistent with the rule of law; the outcome of the appeal of the decision of Chile’s Superintendencia del Medio Ambiente; damage to the Company’s reputation due to the actual or perceived occurrence of any number of events, including negative publicity with respect to the Company’s handling of environmental matters or dealings with community groups, whether true or not; the possibility that future exploration results will not be consistent with the Company’s expectations; risks that exploration data may be incomplete and considerable additional work may be required to complete further evaluation, including but not limited to drilling, engineering and socioeconomic studies and investment; risk of loss due to acts of war, terrorism, sabotage and civil disturbances; litigation; contests over title to properties, particularly title to undeveloped properties, or over access to water, power and other required infrastructure; business opportunities that may be presented to, or pursued by, the Company; risks
associated with the fact that certain of the initiatives described in this MD&A are still in the early stages and may not materialize; our ability to successfully integrate acquisitions or complete divestitures; risks associated with working with partners in jointly controlled assets; employee relations including loss of key employees; increased costs and physical risks, including extreme weather events and resource shortages, related to climate change; availability and increased costs associated with mining inputs and labor; and the organization of our previously held African gold operations and properties under a separate listed Company. In addition, there are risks and hazards associated with the business of mineral exploration, development and mining, including environmental hazards, industrial accidents, unusual or unexpected formations, pressures,cave-ins, flooding and gold bullion, copper cathode or gold or copper concentrate losses (and the risk of inadequate insurance, or inability to obtain insurance, to cover these risks).
Many of these uncertainties and contingencies can affect our actual results and could cause actual results to differ materially from those expressed or implied in any forward-looking statements made by, or on behalf of, us. Readers are cautioned that forward-looking statements are not guarantees of future performance. All of the forward-looking statements made in this MD&A are qualified by these cautionary statements. Specific reference is made to the most recent Form40-F/Annual Information Form on file with the SEC and Canadian provincial securities regulatory authorities for a more detailed discussion of some of the factors underlying forward-looking statements and the risks that may affect Barrick’s ability to achieve the expectations set forth in the forward-looking statements contained in this MD&A. We disclaim any intention or obligation to update or revise any forward-looking statements whether as a result of new information, future events or otherwise, except as required by applicable law.
| | | | |
BARRICK YEAR-END 2017 | | 23 | | MANAGEMENT’S DISCUSSION AND ANALYSIS |
USE OFNON-GAAP FINANCIAL PERFORMANCE MEASURES
We use the followingnon-GAAP financial performance measures in our MD&A:
| | ● | “C1 cash costs per pound” |
| | ● | “all-in sustaining costs per ounce/pound” |
| | ● | “all-in costs per ounce” and |
For a detailed description of each of thenon-GAAP measures used in this MD&A and a detailed reconciliation to the most directly comparable measure under International Financial Reporting Standards (“IFRS”), please refer to theNon-GAAP Financial Performance Measures section of this MD&A on pages 69 to 84. Eachnon-GAAP financial performance measure has been annotated with a reference to an endnote on page 85. Thenon-GAAP financial performance measures set out in this MD&A are intended to provide additional information to investors and do not have any standardized meaning under IFRS, and therefore may not be comparable to other issuers, and should not be considered in isolation or as a substitute for measures of performance prepared in accordance with IFRS.
Changes in presentation ofnon-GAAP financial performance measures
Adjusted EBITDA
Starting in the second quarter 2017 MD&A, we began including additional adjusting items in the Adjusted EBITDA reconciliation to provide a greater level of consistency with the adjusting items included in our Adjusted Net Earnings reconciliation. These new items include: acquisition/disposition gains/losses; foreign currency translation gains/losses; other expense adjustments; and unrealized gains onnon-hedge derivative instruments. These amounts are adjusted to remove any impact on finance costs/income, income tax expense and/or depreciation as they do not affect EBITDA. The prior periods have been restated to reflect the change in presentation. We believe this additional information will assist analysts, investors and other stakeholders of Barrick in better understanding our ability to generate liquidity from operating cash flow, by excluding these amounts from the calculation as they are not indicative of the performance of our core mining business and not necessarily reflective of the underlying operating results for the periods presented.
| | | | | | | | |
| INDEX | | page | | | | |
| | | |
Overview | | | | | | | | |
| | | |
Our Vision | | | 25 | | | | | |
Our Business | | | 25 | | | | | |
Our Strategy | | | 25 | | | | | |
Full Year Financial and Operating Highlights | | | 26 | | | | | |
Outlook for 2018 | | | 33 | | | | | |
Risks and Risk Management | | | 37 | | | | | |
Market Overview | | | 39 | | | | | |
| | | |
Review of Annual Financial Results | | | 42 | | | | | |
| | | |
Revenue | | | 42 | | | | | |
Production Costs | | | 42 | | | | | |
Capital Expenditures | | | 43 | | | | | |
General and Administrative Expenses | | | 44 | | | | | |
Exploration, Evaluation and Project Costs | | | 44 | | | | | |
Finance Costs, Net | | | 44 | | | | | |
Additional Significant Statement of Income Items | | | 45 | | | | | |
Income Tax Expense | | | 45 | | | | | |
| | | |
Financial Condition Review | | | 47 | | | | | |
| | | |
Balance Sheet Review | | | 47 | | | | | |
Shareholders’ Equity | | | 47 | | | | | |
Financial Position and Liquidity | | | 47 | | | | | |
Summary of Cash Inflow (Outflow) | | | 48 | | | | | |
Summary of Financial Instruments | | | 49 | | | | | |
| | | |
Operating Segments Performance | | | 49 | | | | | |
| | | |
Barrick Nevada | | | 50 | | | | | |
Pueblo Viejo | | | 52 | | | | | |
Lagunas Norte | | | 54 | | | | | |
Veladero | | | 56 | | | | | |
Turquoise Ridge | | | 60 | | | | | |
Acacia Mining plc | | | 62 | | | | | |
Pascua-Lama | | | 65 | | | | | |
| | | |
| Commitments and Contingencies | | | 66 | | | | | |
| | | |
| Review of Quarterly Results | | | 67 | | | | | |
| | | |
| Internal Control over Financial Reporting and Disclosure Controls and Procedures | | | 68 | | | | | |
| | | |
| IFRS Critical Accounting Policies and Accounting Estimates | | | 69 | | | | | |
| | | |
| Non-GAAP Financial Performance Measures | | | 69 | | | | | |
| | | |
| Technical Information | | | 85 | | | | | |
| | | |
| Endnotes | | | 85 | | | | | |
| | | |
| Glossary of Technical Terms | | | 86 | | | | | |
| | | | |
BARRICK YEAR-END 2017 | | 24 | | MANAGEMENT’S DISCUSSION AND ANALYSIS |
OVERVIEW
Our Vision
Our Vision is the generation of wealth through responsible mining - wealth for our owners, our people, and the countries and communities with which we partner.
We aim to be the leading mining company focused on gold, growing our cash flow per share by developing and operating high-quality assets through disciplined allocation of human and financial capital and operational excellence.
Our Business
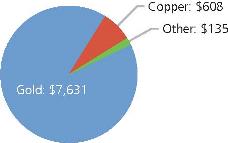
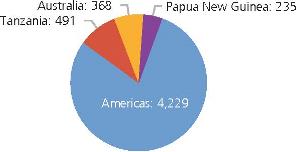
Barrick is one of the world’s leading gold mining companies with annual gold production and gold reserves that are among the largest in the industry. We are principally engaged in the production and sale of gold and copper, as well as related activities such as exploration and mine development. We hold interests in nine producing gold mines, which are located in Argentina, Australia, Canada, the Dominican Republic, Papua New Guinea, Peru and the United States. We also hold a 63.9% equity interest in Acacia Mining plc (“Acacia”), a company listed on the London Stock Exchange (“LSE”) that owns gold mines and exploration properties in Africa. More than 75% of our gold production comes from the Americas region. Our copper business contains a wholly-owned copper mine in Zambia and 50% interests in copper mines in Chile and Saudi Arabia. We also have projects located throughout the Americas. We sell our production in the world market through the following distribution channels: gold bullion is sold in the gold spot market; and gold and copper concentrate is sold to independent smelting companies. Barrick’s shares trade on the New York Stock Exchange (“NYSE”) and the Toronto Stock Exchange under the symbol ABX.
2017 Revenue ($ millions)
2017 Gold Production (thousands of ounces)
Our Strategy
Our strategy remains consistent. We are focused on growing free cash flow per share over the long term by: maintaining and growing industry-leading margins, driven by operational excellence, investments in digital technology and innovation; managing our portfolio and allocating capital with discipline and rigor; and leveraging our talent and distinctive partnership culture as a competitive advantage.
Operational Excellence and Innovation
We seek to maximize revenue and expand margins by continuously optimizing existing operations, pushing technical limits to achievebest-in-class performance, improving the returns of existing assets and strengthening the feasibility and economics of undeveloped assets. We will make targeted investments in innovation and accelerate our digital transformation in an effort to drive step changes in current performance and redefine what is possible over the long term. We will continue to refine our decentralized operating model, in which our head office is focused on doing a small number of tasks exceptionally well: setting strategy, allocating capital and managing talent. Our leaders in the field will operate as business owners, focused on optimizing free cash flow, alongside managing risk and creating long-term value.
Exploration and Project Development
Growing free cash flow per share means continually replenishing and improving the quality of our reserves and resources. The quality of our asset base means we have significant opportunities to replace and grow reserves throughlow-risk brownfield and minex drilling, balanced with greenfield exploration, and emerging discoveries that have the potential to become profitable mines. In addition to organic projects, we are continuously evaluating external opportunities. We take a highly disciplined approach to all investments, including acquisitions, and will only pursue those that have the
| | | | |
BARRICK YEAR-END 2017 | | 25 | | MANAGEMENT’S DISCUSSION AND ANALYSIS |
potential to generate clear value for our shareholders, while aligning with our strategic focus.
Partnerships
We believe a core part of our business is that of partnering with host governments and communities to transform their natural resources into sustainable benefits and mutual prosperity. These partnerships must be built on a foundation of transparency and mutual respect that
moves beyond an emphasis on maximizing short-term financial returns and transactional relationships. By doing so, our intent is to strengthen our social license to operate, reduce operational disruptions and develop stronger and more durable partnerships with our host governments and communities.
FULL YEAR FINANCIAL AND OPERATING HIGHLIGHTS
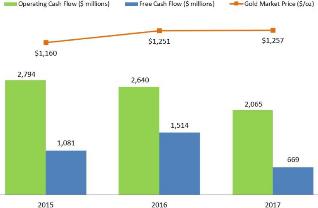
Operating Cash Flow and Free Cash Flow1
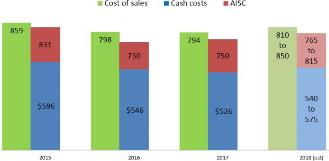
Cost of Sales, Cash Costs1 and
Al-in Sustaining Costs1
($ per ounce)
Gold Production
(000s ounces)
Debt
($ millions)
| | | | |
BARRICK YEAR-END 2017 | | 26 | | MANAGEMENT’S DISCUSSION AND ANALYSIS |
| | | | | | | | | | | | | | | | | | | | |
| ($ millions, except per share amounts in dollars) | | | | | For the years ended December 31 | | | For the three months ended December 31 | |
| | | 2017 | | | 2016 | | | 2015 | | | 2017 | | | 2016 | |
Net earnings (loss) attributable to equity holders of the Company | | | $1,438 | | | | $655 | | | | ($2,838 | ) | | | ($314 | ) | | | $425 | |
Per share (dollars)1 | | | 1.23 | | | | 0.56 | | | | (2.44 | ) | | | (0.27 | ) | | | 0.36 | |
Adjusted net earnings2 | | | 876 | | | | 818 | | | | 344 | | | | 253 | | | | 255 | |
Per share (dollars)1,2 | | | 0.75 | | | | 0.70 | | | | 0.30 | | | | 0.22 | | | | 0.22 | |
Operating cash flow | | | 2,065 | | | | 2,640 | | | | 2,794 | | | | 590 | | | | 711 | |
Free cash flow2 | | | $669 | | | | $1,514 | | | | $1,081 | | | | $240 | | | | $385 | |
| | 1 | Calculated using weighted average number of shares outstanding under the basic method of earnings per share of 1,166 million shares in 2017 (2016: 1,165 million shares; 2015: 1,165 million shares). |
| | 2 | Adjusted net earnings and free cash flow arenon-GAAP financial performance measures with no standardized meaning under IFRS and therefore may not be comparable to similar measures of performance presented by other issuers. For further information and a detailed reconciliation of thenon-GAAP measures used in this section of the MD&A to the most directly comparable IFRS measure, please see pages 69 to 84 of this MD&A. |
In 2017, we generated net cash flow provided by operating activities (“operating cash flow”) of $2.1 billion and free cash flow1 of $669 million for the year. We reduced our cost of sales applicable to gold by $4 per ounce to $794 per ounce, while ourall-in sustaining costs1(“AISC”) increased by 3% to $750 per ounce, reflecting higher capital expenditures as we increased investments in the future of our business. At the same time, we continued to strengthen our balance sheet by exceeding our debt reduction target.
In 2017, we divested 50% and 25% interests in our Veladero mine and Cerro Casale project, respectively. The successful formation of these new partnerships helped us strengthen our balance sheet,de-risk our portfolio and provide a renewed impetus to how we approach these assets. These two transactions resulted in proceeds of $990 million and combined impairment reversals and gains on disposition of $2,031 million. In addition, we recognized $259 million of impairment reversals at Lumwana due to an increase in reserves. This was offset by an impairment of $740 million(pre-tax, 100%) taken at Acacia’s Bulyanhulu mine related to the continued challenges experienced in the operating environment in Tanzania; and an impairment of $429 million at Pascua-Lama, mainly attributable to the reclassification ofopen-pit reserves to resources after receiving a closure order from the Chilean regulators.
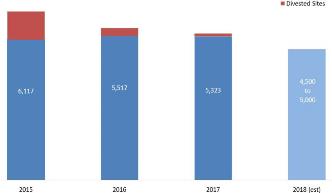
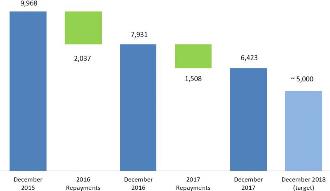
Balance Sheet and Liquidity
In 2017, we reduced our total debt by $1.51 billion, or 19%, from $7.93 billion to $6.42 billion, exceeding our original target of $1.45 billion. Since the beginning of
2015, we have reduced our debt by a total of $6.66 billion, which will reducepre-tax interest payments by approximately $300 million on an annualized basis. Approximately $5 billion of our $6.4 billion in outstanding debt matures after 2032. Since the beginning of December 2015, the average tenor on our outstanding public debt has increased from approximately 14 years to approximately 17 years. Our liquidity position is strong and continues to improve, with robust cash flow generation, modest near-term debt repayment obligations, a $4 billion undrawn credit facility and a consolidated cash balance of approximately $2.2 billion3. Our goal remains to reduce our total debt to around $5 billion by the end of 2018. We plan to achieve this primarily by using cash flow from operations and cash on hand, and potentially through further portfolio optimization. Barrick will continue to pursue debt reduction with discipline, taking only those actions that make sense for the business, on terms we consider favorable to our shareholders.
Cost Performance
In 2017, we continued our focus on drivingBest-in-Class productivity and efficiency improvements across our portfolio. Cost of sales per ounce4 in 2017 decreased by $4 per ounce to $794 per ounce, reflecting a decrease in direct mining costs combined with a positive sales mix, partially offset by higher depreciation expense. Ourall-in sustaining costs1 for 2017 increased by 3% to $750 per ounce, compared to the prior year primarily reflecting the 17% increase in minesite sustaining capital expenditures attributed to the future investment in our business.
| | | | |
BARRICK YEAR-END 2017 | | 27 | | MANAGEMENT’S DISCUSSION AND ANALYSIS |
Net Earnings (Loss), Adjusted Net Earnings1, Operating Cash Flow and Free Cash Flow1
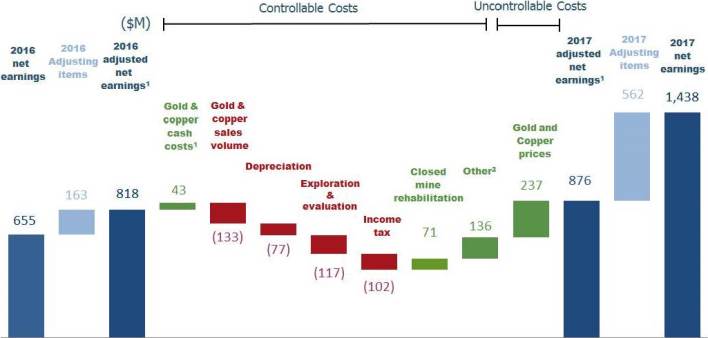
Factors affecting Net Earnings and Adjusted Net Earnings1
| 1 | These arenon-GAAP financial performance measures with no standardized meaning under IFRS and therefore may not be comparable to similar measures of performance presented by other issuers. For further information and a detailed reconciliation of thenon-GAAP measures used in this section of the MD&A to the most directly comparable IFRS measure, please see pages 69 to 84 of this MD&A. |
| 2 | Primarily consists of higher earnings from equity investees (~$56 million) and a reduction in finance costs (~$34 million). |
Net earnings attributable to equity holders of Barrick (“net earnings”) for 2017 was $1,438 million compared with $655 million in the prior year. This significant improvement in net earnings was primarily due to $2,031 million ($1,425 million net of tax andnon-controlling interest) in impairment reversals and gains on sale in 2017 related to our successful formation of joint operations at the Veladero mine and Cerro Casale project. This was partially offset by net impairment charges of $908 million ($511 million net of tax andnon-controlling interest) mainly relating to impairment charges at Acacia’s Bulyanhulu mine and the Pascua-Lama project, coupled with an impairment reversal at Lumwana. After adjusting for items that are not indicative of future operating earnings, adjusted net earnings1 of $876 million in 2017 were 7% higher than the prior year primarily as a result of an increase in gold and copper prices, as well as lower direct mining costs driven by higher capitalized waste stripping costs at Barrick Nevada and Veladero, a positive change in our sales mix with lower relative sales volume from our higher cost Acacia mines and lower inventory write-downs than the prior year. This was offset by an increase in exploration and evaluation costs primarily due to an increased investment in the Pascua-Lama project, global exploration and innovation initiatives combined with lower sales volume. The increase in adjusted net earnings1 was further offset by higher income tax expense associated with our higher net earnings and higher depreciation expense as a result of a depreciation adjustment at Pueblo Viejo, partially offset by lower depreciation at Barrick Nevada associated with the South Arturo pit.
Significant adjusting items to net earnings(pre-tax andnon-controlling interest effects) in 2017 include:
| • | | $718 million ($714 million net of tax) gain relating to the sale of a 50% interest in the Veladero mine (for further details, refer to note 4 to the Financial Statements); |
| • | | $193 million ($192 million net of tax) gain related to the sale of a 25% interest in the Cerro Casale project (for further details, refer to note 4 to the Financial Statements); |
| • | | $212 million ($7 million net of tax andnon-controlling interest) net impairment charges, primarily on Acacia’s Bulyanhulu mine of $740 million ($350 million net of tax andnon-controlling interest) and on the Pascua-Lama project of $407 million ($407 million net of tax), partially offset by impairment reversals as a result of the indicative fair value of the Cerro Casale project related to our divestment of 25% of $1,120 million ($518 million net of tax andnon-controlling interest) and on Lumwana of $259 million ($259 million net of tax); partially offset by |
| • | | $244 million significant tax adjustments primarily relating to dividend withholding tax expense and a tax provision relating to the impact of the proposed framework for Acacia operations in Tanzania, partially offset by the anticipated impact of the U.S tax reform; |
| • | | $178 million other expense adjustments, mainly relating to losses on debt extinguishment and reduced operations program costs at Acacia’s Bulyanhulu mine; and |
| • | | $72 million foreign currency translation losses, primarily related to the devaluation of the Argentinean peso on VAT receivables. |
Refer to page 70 for a full list of reconciling items between net earnings and adjusted net earnings for the current and prior year.
| | | | |
BARRICK YEAR-END 2017 | | 28 | | MANAGEMENT’S DISCUSSION AND ANALYSIS |
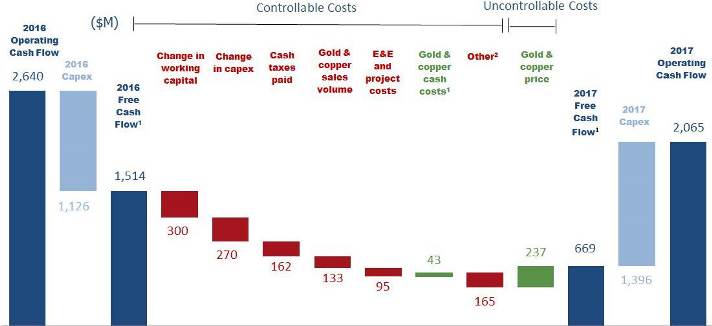
Factors affecting Operating Cash Flow and Free Cash Flow1
| 1 | These arenon-GAAP financial performance measures with no standardized meaning under IFRS and therefore may not be comparable to similar measures of performance presented by other issuers. For further information and a detailed reconciliation of thenon-GAAP measures used in this section of the MD&A to the most directly comparable IFRS measure, please see pages 69 to 84 of this MD&A. |
| 2 | Other primarily includes the negative impact on free cash flow attributable tonon-controlling interests (~$100 million) combined with an increase in legal costs (~$20 million) and in reclamation payments (~$10 million). |
In 2017, we generated $2,065 million in operating cash flow, compared to $2,640 million of operating cash flow in the prior year. The decrease of $575 million was due to lower gold sales as a result of the divestment of 50% of the Veladero mine on June 30, 2017, lower gold sales volume at Pueblo Viejo, Hemlo, Turquoise Ridge, Lagunas Norte and Acacia, partially offset by higher sales at Barrick Nevada attributed to higher grades andBest-in-Class initiatives positively impacting throughput. This was further impacted by working capital outflows reflecting the buildup of metals inventory at Pueblo Viejo, Lagunas Norte and Acacia combined with an increase in exploration, evaluation and project expenses. Operating cash flow was also affected by lower cash flows attributed tonon-controlling interest, combined with higher cash taxes paid. These outflows were partially offset by higher gold and copper prices as well as lower direct mining costs.
Free cash flow1 for 2017 was $669 million, compared to $1,514 million in the prior year, reflecting lower operating cash flows combined with higher capital expenditures. In 2017, capital expenditures on a cash basis were $1,396 million compared to $1,126 million in 2016 as we reinvested more into our business. The increase of $270 million is due to a $109 million increase in project capital expenditures, primarily at Barrick Nevada relating to the development of Crossroads and Cortez Hills Lower Zone, and Goldrush project drilling, partially offset by a decrease inpre-production stripping at the South Arturo pit, which entered commercial production in August 2016. In addition, minesite sustaining capital expenditures increased by $161 million primarily reflecting an increase in sustaining capital at Barrick Nevada relating to higher capitalized stripping costs at Goldstrike and the timing of a greater number of minesite sustaining projects in the current year, combined with increased spending relating to phases 4B and 5B of the leach pad expansion and additional equipment purchases at Veladero. These increases were partially offset by a decrease in sustaining capital at Acacia as a result of reduced operations at Bulyanhulu combined with lower capitalized stripping at North Mara relating to Nyabirama Stage 3 and 4.
The free cash flow1 generated in 2017 was combined with the $990 million in proceeds from the sale of a 50% interest in Veladero in the second quarter of 2017 and existing cash balances to repay $1.51 billion in debt in the current year, which allowed us to exceed our 2017 debt reduction target of $1.45 billion.
| | | | |
BARRICK YEAR-END 2017 | | 29 | | MANAGEMENT’S DISCUSSION AND ANALYSIS |
Safety
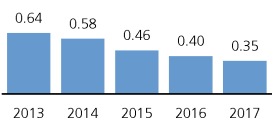
Nothing is more important to Barrick than the safety, health and well-being of our workers and their families. Our safety vision is “Every person going home safe and healthy every day.” In 2017, we continued our trend of improving our total reportable injury frequency rate5(“TRIFR”) and since 2009, there has been a 71% improvement in the TRIFR from 1.20 to 0.35.
The foundation underpinning Barrick’s safety improvement continues to be our Courage to Care program, designed to help Barrick make the next step in safety performance through building a strong team-based culture. In addition, we continue to focus on compliance with Barrick’s “Safety and Health Management System”.
On a weekly basis, the global leadership team, including the Executive Committee and representatives from each of Barrick’s country offices, mine sites and corporate functions, participate in a Business Plan Review (“BPR”) meeting. This forum provides us with the opportunity to stress the importance of safety, recall the lessons learned from past fatal incidents, review our current safety performance against targets and share best practices across our business.
Although we are pleased with these trends, this performance was overshadowed by two fatalities in 2017. As previously reported, in February of 2017 a contract worker at Pascua-Lama was involved in a fatal incident while performing scheduled maintenance work. In November of 2017 a surveyor at Hemlo was fatally struck underground by a piece of heavy machinery. Barrick is fully committed to zero fatalities and is implementing Critical Control Management across all sites and exploration activities. Critical Control Management is specifically focused on fatality prevention and is based upon guidance published by the International Council on Mining and Metals (“ICMM”) in 2015. Significant progress has been made in the development of digital technologies that significantly reduce risks of fatalities at our mines, including the development of autonomous vehicles.
Total Reportable Injury Frequency
Environment
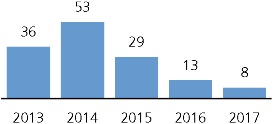
Barrick is focused on rebuilding our reputation for environmental excellence and being the preferred partner of host governments and communities. In 2017, our operations worked on adapting the ICMM Critical Control Management guidance to our environmental operations. In addition, each site developed anin-depth improvement plan with a focus on water management. The results of this are demonstrated in a 72% reduction in reportable environmental incidents between 2015 and 2017.
Despite these achievements, in March 2017 the monitoring system at the Veladero mine detected a rupture of a pipe carrying gold-bearing process solution on the leach pad. Although the solution was contained within the operating site and no solution reached any diversion channels or watercourses, it was the third cyanide-related incident in the past three years at this site. Barrick along with Shandong Gold, our new joint venture partner at Veladero, made modifications to the leach pad as agreed with San Juan provincial authorities to reduce the risk of this happening again.
Reportable Environmental Incidents
Climate Change
Climate change, including shifts in temperature and precipitation and more frequent severe weather events, will affect the mining industry in a range of possible ways. Volatile climatic conditions can affect the stability and effectiveness of infrastructure and equipment; potentially impact environmental protection and site closure practices; lead to changes in the regulatory environment, including increased carbon tax regimes; and potentially impact the stability and cost of water and energy supplies. We therefore view climate change as a company, community, and global concern. In 2017, we developed a climate change strategy aligned with our overall business strategy to grow free cash flow per share through safe and responsible mining.
Barrick’s climate change strategy has three pillars: understand and mitigate the risks associated with climate change; reduce our impacts on climate change; and improve our disclosure on climate change. Action taken on each pillar in 2017 is described below.
Understand and mitigate the risks associated with climate change: In 2017, we performed a climate change risk
| | | | |
BARRICK YEAR-END 2017 | | 30 | | MANAGEMENT’S DISCUSSION AND ANALYSIS |
assessment, using our standard risk management framework. We assessed risks and opportunities across both potential transition (e.g., regulatory, policy, reputational) and physical (e.g., extreme climate events) aspects of climate change. We have identified the top three climate-related risks and opportunities for our business: an increase in extended duration extreme precipitation events; an increase in climate change regulations to limit greenhouse gas (“GHG”) emissions; and increased global investment in innovation and low carbon technologies. The assessment also included a review of the current mitigation and controls associated with each risk and identified areas which may need further strengthening to reduce risk.
Reduce the Company’s impact on climate change: Over the course of 2017, we analyzed our current and forecasted GHG emissions to develop an ambitious but realistic goal to reduce Barrick’s GHG emissions. Mining is an energy-intensive business, and we understand the important link between energy use and GHG emissions. By effectively managing our energy use, we can reduce our draw from local energy grids, reduce our GHG emissions, achieve more efficient production, and save direct mining costs. Barrick has set a goal to keep its current GHG emissions flat in the short term and is targeting a 30 percent reduction in GHG emissions by 2030, from a 2016 baseline of 3.5 MT CO2e emitted. This target is also closely aligned with the national targets set by many of our host governments.
Improve our disclosure on climate change: In 2017, we committed to supporting the voluntary recommendations of theindustry-led Financial Stability Board Task Force on Climate-related Financial Disclosures (“TCFD”). The TCFD recommendations are considered the new benchmark for disclosure of climate-related risks and opportunities, and Barrick was the only Canadian mining company to make this public commitment. We will implement the full recommendations over the next two years.
Governance over climate-related risks and opportunities is provided at both the Board and management level. The Board’s Corporate Responsibility Committee meets at least quarterly and is responsible for overseeing Barrick’s policies, programs, and performance relating to the environment, including climate change. The Risk Committee assists the Board in overseeing the Company’s management of enterprise risks as well as the implementation of policies and standards for monitoring and mitigating such risks. Climate change is built into our formal risk management process, outputs of which are reviewed by the Risk Committee. The Audit Committee reviews the Company’s approach to climate change in the context of Barrick’s disclosures.
At the management level, our Climate Change Committee, comprised of senior members of our
management team, provides strategic oversight and governance over key decisions related to Barrick’s Climate Change Strategy, such as overseeing climate change risk and opportunity assessments, monitoring progress against GHG emissions targets, and providing guidance on external disclosures.
Further to the specific focus of the Climate Change Committee, the weekly BPR allows for the discussion of opportunities and risks that may help or hinder the Company from achieving its objectives, including climate-related risks (e.g., spring snow melts, hurricanes, flooding, and mud slides).
Climate change activities initiated in 2017 will continue into 2018 and beyond. Site-level climate-related risks and mitigation plans will be reviewed in the context of the company-wide risk assessment, and site-level plans to reduce energy and GHG emissions will be strengthened. We will continue to enhance our climate-related disclosure according to the TCFD recommendations. Overall, based on the groundwork completed in 2017, Barrick is building resilience to withstand the potential impacts of climate change and leverage potential opportunities as the global economy transitions to alow-carbon future.
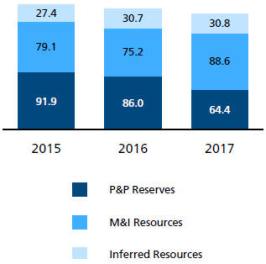
Reserves and Resources
Our 2017 reserves were calculated using a gold price assumption of $1,200 per ounce. As of December 31, 2017, Barrick’s proven and probable gold reserves were 64.4 million ounces6, compared to 86.0 million ounces at the end of 2016. This decline primarily reflects the divestment of approximately 9.2 million ounces associated with Veladero and Cerro Casale, and the reclassification of approximately 14.0 million ounces of Pascua-Lama proven and probable gold reserves as measured and indicated resources.
Barrick added 8.0 million ounces of proven and probable gold reserves at existing operations (as well as the Goldrush project) through drilling, more than replacing the 6.2 million ounces depleted through processing last year. This success reflects increased investment in mine exploration drilling in 2017. Significant additions included 2.1 million ounces at Turquoise Ridge, 1.4 million ounces at Cortez, 1.3 million ounces at Goldstrike, 397,000 ounces at Hemlo, and 392,000 ounces at Lagunas Norte. We also declared an initial reserve of 1.5 million ounces at the Goldrush project. In addition, Barrick’s 63.9 percent share of reserves at Acacia’s North Mara mine increased by 504,000 ounces. The average grade of Barrick’s reserves also increased by 17 percent, from 1.33 grams per tonne, to 1.55 grams per tonne.
In 2017, measured, indicated, and inferred gold resources were calculated using a gold price assumption of $1,500 per ounce, consistent with 2016. Measured and indicated
| | | | |
BARRICK YEAR-END 2017 | | 31 | | MANAGEMENT’S DISCUSSION AND ANALYSIS |
gold resources increased to 88.6 million ounces6 at the end of 2017, compared to 75.2 million ounces at the end of 2016. Roughly 9.1 million ounces of measured and indicated gold resources were added as a result of the formation of the Norte Abierto joint venture (which includes the Cerro Casale and Caspiche deposits), net of resources divested at Cerro Casale and Veladero. Roughly 14.0 million ounces of measured and indicated resources were added as a result of the reclassification of Pascua-Lama reserves to resources, and 5.8 million ounces were added through drilling, including 1.5 million ounces at Goldstrike, 1.2 million ounces at Cortez, and 535,000 ounces at Hemlo.
Inferred gold resources decreased to 30.8 million ounces6at the end of 2017, compared to 30.7 million ounces at the end of 2016.
Gold Reserves and Resources
(millions of ounces)
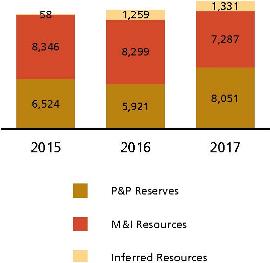
Proven and probable copper reserves were calculated using a copper price of $2.75 per pound, consistent with the long-price assumption we used in 2016. Copper reserves, including copper within gold reserves, increased to 11.2 billion pounds6 at the end of 2017, compared to 11.1 billion pounds at the end of 2016. The Lumwana mine added approximately 2.6 billion pounds to its reserves as a result of successful cost reduction efforts. Approximately 1.4 billion pounds of copper reserves were divested with the sale of 25% of Cerro Casale, 554 million pounds were processed, and 505 million pounds of copper contained within gold reserves were reclassified as copper contained within gold resources.
In 2017, measured, indicated, and inferred copper resources were calculated using a copper price assumption of $3.50 per pound, consistent with 2016. Measured and indicated copper resources, including copper within measured and indicated gold resources, increased to 11.7 billion pounds6, compared to 9.7 billion pounds at the end of 2016. Approximately 2.6 billion pounds of measured and indicated copper resources were upgraded to copper reserves, 2.6 billion pounds were added through the inclusion of the Caspiche deposit, and 1.6 billion pounds were added through drilling. Inferred copper resources were 3.0 billion pounds5, compared to 3.1 billion pounds at the end of 2016.
Copper Reserves and Resources
(millions of pounds)
| | | | |
BARRICK YEAR-END 2017 | | 32 | | MANAGEMENT’S DISCUSSION AND ANALYSIS |
Outlook for 2018
Operating Unit Guidance
Our 2017 gold and copper production, cost of sales, cash costs1,all-in sustaining costs1 and 2018 forecast gold and copper production, cost of sales, cash costs1 andall-in sustaining costs1 ranges by operating unit are as follows:
| | | | | | | | | | | | | | | | |
Operating Unit | | 2017 production (000s ozs) | | 2017 cost of sales ($/oz) | | 2017 cash costs1 ($/oz) | | 2017all-in sustaining costs1 ($/oz) | | 2018 forecast production (000s ozs) | | 2018 forecast cost of sales ($/oz) | | 2018 forecast
cash costs1 ($/oz) | | 2018 forecast all-in sustaining costs1 ($/oz) |
Gold | | | | | | | | | | | | | | | | |
| | | | | | | | |
Barrick Nevada | | 2,312 | | $792 | | $455 | | $624 | | 2,000 -2,255 | | 760 -810 | | 470 -530 | | 610 - 660 |
| | | | | | | | |
Pueblo Viejo (60%) | | 650 | | 699 | | 405 | | 525 | | 585 - 615 | | 720 - 750 | | 425 - 450 | | 590 - 620 |
| | | | | | | | |
Lagunas Norte | | 387 | | 617 | | 405 | | 483 | | 230 - 270 | | 780 - 910 | | 420 - 490 | | 670 - 780 |
| | | | | | | | |
Veladero (50%)2 | | 432 | | 897 | | 598 | | 987 | | 275 - 330 | | 970 - 1,110 | | 560 - 620 | | 960 - 1,100 |
| | | | | | | | |
Turquoise Ridge (75%) | | 211 | | 715 | | 589 | | 733 | | 240 - 270 | | 670 - 720 | | 580 - 620 | | 650 - 730 |
| | | | | | | | |
Porgera (47.5%) | | 235 | | 944 | | 781 | | 993 | | 230 - 255 | | 950 - 1,000 | | 780 - 830 | | 950 - 1,000 |
| | | | | | | | |
Kalgoorlie (50%) | | 368 | | 806 | | 642 | | 729 | | 390 - 440 | | 720 - 820 | | 580 - 630 | | 695 - 745 |
| | | | | | | | |
Acacia (63.9%) | | 491 | | 791 | | 587 | | 875 | | 275 - 305 | | 970 - 1,020 | | 690 - 720 | | 935 - 985 |
| | | | | | | | |
Hemlo | | 196 | | 986 | | 841 | | 1,092 | | 200 - 220 | | 860 - 920 | | 740 - 790 | | 975 - 1,075 |
| | | | | | | | |
Golden Sunlight | | 41 | | 1,334 | | 1,265 | | 1,329 | | 35 - 50 | | 1,100 -1,200 | | 1,130 -1,230 | | 1,290 -1,460 |
Total Continuing Operations | | 5,323 | | $793 | | $522 | | $703 | | 4,500 -5,000 | | 810 - 850 | | 540 - 575 | | 765 - 815 |
Total Consolidated Barrick3,4,5 | | 5,323 | | $794 | | $526 | | $750 | | 4,500 -5,000 | | 810 - 850 | | 540 - 575 | | 765 - 815 |
| | | | | | | | | | | | | | | | | |
| | | 2017 production (millions lbs) | | 2017 cost of sales ($/lb) | | 2017 cash costs1
($/lb) | | 2017all-in sustaining costs1 ($/lb) | | 2018 forecast
production (millions lbs) | | 2018 forecast cost of sales ($/lb) | | 2018 forecast C1 cash costs1 ($/lb) | | 2018
forecast all-in sustaining costs1 ($/lb) |
Copper | | | | | | | | | | | | | | | | |
| | | | | | | | |
Zaldívar (50%) | | 114 | | $2.15 | | $1.66 | | $2.21 | | 115 - 130 | | 2.30 - 2.50 | | ~ 1.70 | | 2.05 - 2.25 |
| | | | | | | | |
Lumwana | | 256 | | 1.57 | | 1.66 | | 2.35 | | 230 - 265 | | 1.65 - 1.90 | | 1.65 - 1.90 | | 2.50 - 2.80 |
| | | | | | | | |
Jabal Sayid (50%) | | 43 | | 1.90 | | 1.70 | | 2.30 | | 40 - 55 | | 1.85 - 2.50 | | 1.40 - 1.80 | | 1.70 - 2.30 |
Total Copper | | 413 | | $1.77 | | $1.66 | | $2.34 | | 385 - 450 | | 1.80 - 2.10 | | 1.55 - 1.75 | | 2.30 - 2.60 |
| | 1 | Cash costs,all-in sustaining costs and C1 cash costs arenon-GAAP financial performance measures with no standardized meaning under IFRS and therefore may not be comparable to similar measures of performance presented by other issuers. For further information and a detailed reconciliation of thenon-GAAP measures used in this section of the MD&A to the most directly comparable IFRS measure, please see pages 69 to 84 of this MD&A. |
| | 2 | We sold 50% of Veladero on June 30, 2017; therefore these measures represent results on a 100% basis from January 1 to June 30, 2017 and on a 50% basis from July 1, 2017 onwards. |
| | 3 | Total gold cash costs andall-in sustaining costs per ounce include the impact of hedges and/or costs allocated tonon-operating sites. |
| | 4 | Operating unit guidance ranges reflect expectations at each individual operating unit, and may not add up to the company-wide guidance range total. The company-wide 2017 results and guidance ranges exclude Pierina which is mining incidental ounces as it enters closure. |
| | 5 | Total Consolidated Barrickall-in sustaining costs include corporate administration costs. |
| | | | |
BARRICK YEAR-END 2017 | | 33 | | MANAGEMENT’S DISCUSSION AND ANALYSIS |
Operating Unit, Consolidated Expense and Capital Guidance
Our 2017 gold and copper production, cost of sales, cash costs1,all-in sustaining costs1, consolidated expenses and capital expenditures and forecast gold and copper production, cost of sales, cash costs1,all-in sustaining costs1, consolidated expenses and capital expenditures for 2018 are as follows:
| | | | | | | | | | | | | | | | |
($ millions, except per ounce/pound data) | | 2017 Original Guidance | | | Q3 2017 Guidance | | | 2017 Actual | | | 2018 Guidance | |
Gold production and costs | | | | | | | | | | | | | | | | |
| | | | |
Production (millions of ounces) | | | 5.60 - 5.90 | | | | 5.30 - 5.50 | | | | 5.32 | | | | 4.50 - 5.00 | |
| | | | |
Gold unit production costs | | | | | | | | | | | | | | | | |
| | | | |
Cost of sales - gold ($ per oz) | | | 780 - 820 | | | | 790 - 810 | | | | 794 | | | | 810 - 850 | |
| | | | |
Cash costs ($ per oz)1 | | | 510 - 535 | | | | 520 - 535 | | | | 526 | | | | 540 - 575 | |
| | | | |
Depreciation ($ per oz) | | | 245 - 265 | | | | 245 - 265 | | | | 254 | | | | 240 - 260 | |
| | | | |
All-in sustaining costs ($ per oz)1 | | | 720 -770 | | | | 740 - 770 | | | | 750 | | | | 765 - 815 | |
Copper production and costs | | | | | | | | | | | | | | | | |
| | | | |
Production (millions of pounds) | | | 400 - 450 | | | | 420 - 440 | | | | 413 | | | | 385 - 450 | |
| | | | |
Copper unit production costs | | | | | | | | | | | | | | | | |
| | | | |
Cost of sales - copper ($ per lb) | | | 1.50 - 1.70 | | | | 1.70 - 1.85 | | | | 1.77 | | | | 1.80 - 2.10 | |
| | | | |
C1 cash costs ($ per lb)1 | | | 1.40 - 1.60 | | | | 1.60 - 1.75 | | | | 1.66 | | | | 1.55 - 1.75 | |
| | | | |
Depreciation ($ per lb) | | | 0.30 - 0.40 | | | | 0.30 - 0.40 | | | | 0.38 | | | | 0.40 - 0.50 | |
| | | | |
Copperall-in sustaining costs ($ per lb)1 | | | 2.10 - 2.40 | | | | 2.20 - 2.40 | | | | 2.34 | | | | 2.30 - 2.60 | |
Exploration and project expenses | | | 415 - 495 | | | | 415 - 495 | | | | 354 | | | | 325 - 405 | |
| | | | |
Exploration and evaluation | | | 185 - 225 | | | | 185 - 225 | | | | 173 | | | | 185 - 225 | |
| | | | |
Project expenses | | | 230 - 270 | | | | 230 - 270 | | | | 181 | | | | 140 -180 | |
| | | | |
General and administrative expenses | | | ~ 285 | | | | ~ 260 | | | | 248 | | | | ~ 340 | |
| | | | |
Corporate administration | | | ~ 200 | | | | ~ 200 | | | | 201 | | | | ~ 275 | |
| | | | |
Stock-based compensation2 | | | ~ 40 | | | | ~ 40 | | | | 26 | | | | ~ 30 | |
| | | | |
Acacia3 | | | ~ 45 | | | | ~ 20 | | | | 21 | | | | ~ 35 | |
| | | | |
Other expense (income)4 | | | 25 - 45 | | | | 25 - 45 | | | | (799 | ) | | | 80 - 100 | |
| | | | |
Finance costs5 | | | 600 - 650 | | | | 600 - 650 | | | | 705 | | | | 500 - 550 | |
| | | | |
Attributable capital expenditures: | | | | | | | | | | | | | | | | |
| | | | |
Attributable minesite sustaining | | | 1,050 - 1,200 | | | | 1,100 - 1,200 | | | | 1,095 | | | | 950 - 1,100 | |
| | | | |
Attributable project | | | 250 - 300 | | | | 250 - 300 | | | | 269 | | | | 450 - 550 | |
| | | | |
Total attributable capital expenditures6 | | | 1,300 - 1,500 | | | | 1,350 - 1,500 | | | | 1,364 | | | | 1,400 - 1,600 | |
| | 1 | Cash costs,all-in sustaining costs and C1 cash costs arenon-GAAP financial performance measures with no standardized meaning under IFRS and therefore may not be comparable to similar measures of performance presented by other issuers. For further information and a detailed reconciliation of thenon-GAAP measures used in this section of the MD&A to the most directly comparable IFRS measure, please see pages 69 to 84 of this MD&A. |
| | 2 | 2017 actual based on US$14.47 and 2018 guidance based on a three month trailing average ending December 31, 2017 of US$14.50 per share and excludes Acacia. |
| | 3 | 2017 actual includes $8 million in stock-based compensation recovery. 2018 guidance is substantially comprised of stock-based compensation. |
| | 4 | 2017 actual includes gain on sale ofnon-current assets of $911 million. |
| | 5 | 2017 actual includes a net loss on debt extinguishment of $127 million. |
| | 6 | Attributable capital expenditures are presented on the same basis as guidance, which includes our 60% share of Pueblo Viejo and South Arturo, our 63.9% share of Acacia and our 50% share of Zaldívar and Jabal Sayid. |
2018 Guidance Analysis
Estimates of future production, cost of sales, and cash costs1 presented in this MD&A are based on mine plans that reflect the expected method by which we will mine reserves at each site. Actual gold and copper production and associated costs may vary from these estimates due to a number of operational andnon-operational risk factors (see the “Cautionary Statement on Forward-Looking Information” on page 22 of this MD&A for a description of certain risk factors that could cause actual results to differ materially from these estimates).
Production
We expect 2018 gold production to be in the range of 4.5 to 5.0 million ounces. 2018 gold production is expected to be lower than 2017, primarily as a result of decreases at Barrick Nevada, Pueblo Viejo and Veladero. We expect first quarter production of around one million ounces at costs that will be proportionately higher than those anticipated for the remainder of the year, largely due to lower grades at Barrick Nevada, and the timing of planned maintenance at Pueblo Viejo.
Lower production is expected at Barrick Nevada as its Cortez Hills open pit and Cortez Hills underground moves from purely oxide ore to a mix of oxide, refractory, and
| | | | |
BARRICK YEAR-END 2017 | | 34 | | MANAGEMENT’S DISCUSSION AND ANALYSIS |
transitional ores. Grade is expected to be lower as production progresses deeper in the mine. This is partially offset by increased throughput at the oxide mill, increased grades at Goldstrike open pit from processing the third northwest layback, and higher grades at Goldstrike underground. Throughput initiatives at the autoclave are expected to more than offset lower autoclave recovery as we transition from an all acid blend to an alkaline/acid blend.
Production at Pueblo Viejo in 2018 is expected to be lower than 2017 production levels, driven by reduced gold grade, partially offset by increased autoclave throughput resulting from improved maintenance strategies.
Lower production for Veladero is expected as a result of the divestment of 50% of the Veladero mine as at June 30, 2017. This, combined with an increased proportion of ore tonnage mined at lower grade, will be offset by a higher inventory drawdown due to improved management of the leach pad.
Cost of Sales
On a per ounce basis, cost of sales attributable to gold4, after removing the portion related tonon-controlling interests, is expected to be in the range of $810 to $850 per ounce, higher than the prior year. The projected increase is mainly due to higher assumed energy and consumables costs. We are planning to offset those rising costs with a continued focus on lowering our other direct mining costs throughBest-in-Class initiatives, which should improve operating efficiencies and lower labor and contractor costs.
Cash Costs per ounce
Cash costs1 are expected to be in the range of $540 to $575 per ounce, slightly higher than the prior year due to increases at Barrick Nevada, Pueblo Viejo and Lagunas Norte, partially offset by a decrease at Veladero.
We expect Barrick Nevada to have higher cash costs1 than 2017 due to lower sold ounces. At Pueblo Viejo and Lagunas Norte we expect higher cash costs1 than 2017 primarily due to a reduction in total ounces produced and sold and higher fuel prices.
We expect lower cash costs1 at Veladero in 2018 compared to the prior year due to lower direct operating costs partly offset by the impact of higher charges from the production inventory movements.
All-In Sustaining Costs per ounce
All-in sustaining costs1 are expected to be in the range of $765 to $815 per ounce for gold, higher than the $750 per ounce in 2017 driven primarily by the higher expected cash costs as well as an increase in minesite sustaining capital expenditures on a per ounce basis. In 2018, we expect to incur increased corporate administration
expense. We will also continue to focus onBest-in-Class initiatives to reduce mining costs.
Exploration and Project Expenses
We expect to incur approximately $185 to $225 million of exploration and evaluation (“E&E”) expenditures in 2018 with approximately 80 percent allocated to the Americas. Our exploration programs balance high-quality brownfield projects, greenfield exploration, and emerging discoveries that we believe have the potential to become profitable mines. We continue to take advantage of existing infrastructure and advance key growth projects in Barrick Nevada. At our Hemlo mine we are building on the expansion potential of our underground, and at the Lagunas Norte mine in Peru we continue to advance a project to extend the life of the mine by potentially exploiting existing oxide stockpiles and then transitioning to mining the refractory material below the oxide ore body in the current open pit.
Highlights of our greenfield exploration program for 2018 include the Fourmile target, adjacent to our Goldrush discovery in Nevada, and the Frontera District on the border of Argentina and Chile.
We expect to incur approximately $140 to $180 million of project expenses in 2018, compared to $181 million in 2017. In 2018, project expenses include the Pascua-Lama study and ongoing site costs, there-scoping study of our Donlin Gold Project, costs associated with regional digital projects and Norte Abierto (our joint venture with Goldcorp containing Cerro Casale and Caspiche) projects. The Pascua-Lama study spend relates to the cost of ongoing work to evaluate and permit the development of an underground mine at Pascua-Lama, accessed from the Argentinean side of the project. Pascua-Lama’s ongoing site expenses include the cost of care and maintenance and does not anticipate the impact of the Superintendencia del Medio Ambiente (“SMA”) sanction received on January 17, 2018. The Company has appealed the SMA sanction on Pascua in Chile and the full impacts are still being evaluated.
General and Administrative Expenses
In 2018, we expect corporate administration costs to be approximately $275 million, an increase of $74 million compared to 2017. This reflects additional investments including improving our enterprise-wide processes and systems - the Barrick Data Fabric; accelerating the implementation of digital technology; and driving step-change innovations.
Finance Costs
Finance costs of $500 to $550 million primarily represent interest expense on long-term debt,non-cash interest expense relating to gold and silver streaming agreements, and accretion, net of finance income. We expect finance costs in 2018 to be lower than 2017 finance costs of $705 million primarily due to lower interest expense in 2017
| | | | |
BARRICK YEAR-END 2017 | | 35 | | MANAGEMENT’S DISCUSSION AND ANALYSIS |
following $1.5 billion of debt repayments in 2017. The impact of any further debt reductions accomplished in 2018 has not been reflected in our guidance on interest expense or extinguishment losses. 2017 finance costs included a $127 million net loss on the extinguishment of debt, and further debt repurchases could lead to additional losses on extinguishment that could cause an increase to forecasted finance costs.
Capital Expenditures
Total attributable capital expenditures for 2018 are expected to be in the range of $1.40 to $1.60 billion. Investing in project capital is a priority in 2018 for Barrick, and we expect attributable project capital expenditures to increase to a range of $450 to $550 million, an increase over our 2017 project capital expenditure of $269 million. In contrast, attributable minesite sustaining capital expenditures are expected to be in the range of $950 to $1,100 million, compared to our 2017 minesite sustaining capital expenditure of $1,095 million.
Project capital expenditures reflect capital expenditures at new projects and existing operations that are related to discrete expansion projects intended to increase production and will not benefit production for at least 12 months. Project capital expenditures also include capital expenditures related to the initial construction of a project and include all of the expenditures required to bring the project into operation and achieve commercial production levels.
The budgeted increase in project capital expenditures in 2018 is primarily due to increased spending on the Lower Zone underground expansion and Crossroads project at Cortez, associated with the underground declines at Cortez Hills underground and Goldrush, an increase at Zaldívar associated with a planned plant expansion, and increases at Norte Abierto and Pascua-Lama.
Minesite sustaining capital expenditures reflect the capital spending required to support current planned production levels and those which do not meet our definition of project capital. This includes capitalized production phase stripping costs at our open pit mines, underground mine development, minesite E&E expenditures, and routine plant, equipment and maintenance spend that meet our criteria for capitalization.
Attributable minesite sustaining capital expenditures are expected to be in the range of $950 to $1,100 million compared to $1,095 in 2017. We expect reduced capitalized stripping at Barrick Nevada, Porgera and
Acacia, in addition to a reduction in processing and minesite sustaining capital at Barrick Nevada and Veladero. These are partially offset by an increase in capitalized stripping and equipment rebuilds at Lumwana, an increase in tailings and process facility upgrades at Pueblo Viejo and an increase in capital associated with environmental obligations at Lagunas Norte. These decreases in sustaining capital are the result of our continued focus on our asset optimization and capital discipline processes.
At Barrick Nevada in 2018, sustaining capital expenditures are expected to decrease primarily due to a reduction in capitalized stripping as the Goldstrike open pit transitions from stripping both the 3rd and 4th northwest laybacks to only stripping the 4th northwest layback until the fourth quarter of 2018. In addition, Goldstrike’s cooling and ventilation and dewatering projects to allow mining below a3,600-foot elevation will near completionmid-2018. The autoclave thiosulfate water treatment plant conversion was completed in 2017, which significantly improved water balances and the consumption of fresh reagent.
At Porgera, sustaining capital expenditures are expected to decrease in 2018 primarily due to a planned reduction in capitalized stripping as the site focuses on an underground expansion plan.
At Veladero, a reduction in sustaining capital is expected in 2018, mainly associated with the completion of the Phase 6 VFLF leach pad expansion and process facility upgrades along with a reduction in overall attributable capital spend due to 2018 being our first full year at our 50/50 equity ownership with our joint venture partner, Shandong Gold.
At Lumwana, the 2018 increase in sustaining capital is related to increased stripping of the Chimi deposit and purchase of major maintenance components and the electric conversion of the PC8000 shovel.
At Pueblo Viejo, the increase in sustaining capital in 2018 is related to initiatives to improve the plant’s operational efficiency, process facility upgrades and continued tailings expansion capital.
Effective Income Tax Rate
At current spot gold prices, our expected effective tax rate range for 2018 is 41% to 43%.
| | | | |
BARRICK YEAR-END 2017 | | 36 | | MANAGEMENT’S DISCUSSION AND ANALYSIS |
Outlook Assumptions and Economic Sensitivity Analysis
| | | | | | | | | | |
| | | 2018 Guidance Assumption | | Hypothetical Change | | Impact on Revenue (millions) | | Impact on Cost of Sales (millions) | | Impact on All-in Sustaining Costs1 |
Gold revenue, net of royalties2 | | $1,200/oz | | +/- $100/oz | | +/- $468 | | +/- $14 | | +/- $3/oz |
| | | | | |
Copper revenue, net of royalties3 | | $2.75/lb | | + $0.50/lb | | + $205 | | + $13 | | + $0.03/lb |
Copper revenue, net of royalties3 | | $2.75/lb | | - $0.50/lb | | - $180 | | - $12 | | - $0.03/lb |
Goldall-in sustaining costs | | | | | | | | | | |
| | | | | |
WTI crude oil price2 | | $55/bbl | | +/- $10/bbl | | n/a | | +/-
$26 | | +/- $5 /oz |
| | | | | |
Australian dollar exchange rate | | 0.75 : 1 | | +/- 10% | | n/a | | +/-
$31 | | +/- $7 /oz |
| | | | | |
Argentinean peso exchange rate | | 18.35 : 1 | | +/- 10% | | n/a | | +/- $7 | | +/- $2 /oz |
| | | | | |
Canadian dollar exchange rate | | 1.25 : 1 | | +/- 10% | | n/a | | +/-
$35 | | +/- $7 /oz |
| Copperall-in sustaining costs | | | | | | | | | | |
| | | | | |
WTI crude oil price2 | | $55/bbl | | +/- $10/bbl | | n/a | | +/- $5 | | +/- $0.06/lb |
| | | | | |
Chilean peso exchange rate | | 650 : 1 | | +/- 10% | | n/a | | +/-$10 | | +/- $0.02/lb |
| | 1 | All-in sustaining costs is anon-GAAP financial performance measure with no standardized definition under IFRS. For further information and a detailed reconciliation, please see pages 69 to 84 of this MD&A. |
| | 2 | Due to our hedging activities, which are reflected in these sensitivities, we are partially protected against changes in these factors. |
| | 3 | Utilizing option collar strategies, the Company has protected the downside of a portion of its expected 2018 copper production at an average floor price of $2.83 per pound and can participate on the same amount up to an average price of $3.25 per pound. Our remaining copper production is subject to market prices. |
Risks and Risk Management
Overview
The ability to deliver on our vision, strategic objectives and operating guidance depends on our ability to understand and appropriately respond to the uncertainties or “risks” we face that may prevent us from achieving our objectives. In order to achieve this we:
| | • | | Maintain a framework that ensures we manage risk effectively and in a manner that creates the greatest value; |
| | • | | Integrate a process for managing risk into all our important decision-making processes so that we reduce the effect of uncertainty on achieving our objectives; |
| | • | | Ensure that the key controls we rely on to achieve the Company’s objectives are actively monitored so that they remain in place and are effective at all times; and |
| | • | | Provide assurance to the executives and relevant Committees of the Board of Directors on the effectiveness of key control activities. |
Board and Committee Oversight
We maintain strong risk oversight practices, with responsibilities outlined in the Board’s and related committees’ mandates. The Board’s mandate makes clear its responsibility for reviewing and discussing with management the processes used to assess and manage risk, including the identification by management of the principal risks of the business, and the implementation of appropriate systems to deal with such risks.
The Risk Committee of the Board of Directors assists the Board in overseeing the Company’s management of principal risks as well as the implementation of policies and standards for monitoring and modifying such risks, and monitoring and reviewing the Company’s financial position and financial risk management programs generally. The Audit Committee and Corporate Responsibility Committee also provide oversight focusing on financial and operational (e.g., environmental, health and safety, corporate social responsibility, security and human rights) risk exposures, respectively.
Management Oversight
On a weekly basis, the global leadership team, including the Executive Committee and representatives from each of Barrick’s country offices, mine sites and corporate functions, participate in the BPR meeting. This forum allows for the timely identification of key risks that may prevent the Company from achieving its objectives. It also fosters a culture of transparent, real-time risk management as a collective and enables a learning organization. At regularly scheduled meetings, the Board and the Risk Committee are provided with updates on issues identified by management at these weekly sessions.
Principal Risks
The following subsections describe some of our key sources of uncertainty and most important risk modification activities. The risks described below are not the only ones facing Barrick. Our business is subject to inherent risks in financial, regulatory, strategic and operational areas. For a more comprehensive discussion of those inherent risks, see “Risk Factors” in our most recent Form40-F/Annual Information Form on file with
| | | | |
BARRICK YEAR-END 2017 | | 37 | | MANAGEMENT’S DISCUSSION AND ANALYSIS |
the SEC and Canadian provincial securities regulatory authorities. Also see the “Cautionary Statement on Forward-Looking Information” on page 22 of this MD&A.
Financial position and liquidity
Our liquidity profile, level of indebtedness and credit ratings are all factors in our ability to meet short- and long-term financial demands. Barrick’s outstanding debt balances impact liquidity through scheduled interest and principal repayments and the results of leverage ratio calculations, which could influence our investment grade credit ratings and ability to access capital markets. In addition, the Company’s ability to draw on our credit facility is subject to meeting its covenants. Our primary source of liquidity is our operating cash flow, which is dependent on the ability of our operations to deliver projected future cash flows. The ability of our operations to deliver projected future cash flows, as well as future changes in gold and copper market prices, either favorable or unfavorable, will continue to have a material impact on our cash flow and liquidity.
Key risk modification activities:
| | • | | Reduced notional and lengthened average tenor of our outstanding debt through liability management activities; |
| | • | | Continued focus on generating positive free cash flow by improving the underlying cost structures of our operations in a sustainable manner; |
| | • | | Disciplined capital allocation criteria for all investments, and regular Investment Committee meetings to ensure a high degree of consistency and rigor is applied to all capital allocation decisions based on a comprehensive understanding of risk and reward; |
| | • | | Preparation of budgets and forecasts to understand the impact of different price scenarios on liquidity, and formulate appropriate strategies; and |
| | • | | Other options available to the Company to enhance liquidity include drawing on our $4.0 billion undrawn credit facility, asset sales, joint ventures, or issuance of debt or equity securities. |
Improving free cash flow1 and costs
Our ability to improve productivity, drive down operating costs and reduce working capital remains a focus in 2018 and is subject to several sources of uncertainty. This includes our ability to achieve and maintain industry-leading margins by improving the productivity and efficiency of our operations through ourBest-in-Class, Asset Integrity and digital transformation programs.
Key risk modification activities:
| | • | | Formal project management protocols are established around these business transformation programs. The status of these projects is reviewed on a weekly basis during the |
| | | BPR meetings to ensure the timely identification of key risk exposures that may affect their successful delivery; |
| | • | | Ongoing implementation of a digitization program including a Cisco partnership to unlock the potential of digital mining; and |
| | • | | Ongoing implementation of aBest-in-Class program to unleash the full potential of our mines and encompassing: |
| | ° | A standardized, performance-oriented measurement scorecard linking top operational and economic measures; |
| | ° | Monthly optimization forums as a way to communicate and review theBest-in-Class projects and performance to targets; |
| | ° | Innovation and digitization program focused on driving value across the business; and |
| | ° | Asset Integrity program to improve availability of critical infrastructure. |
Social license to operate
At Barrick, we are committed to building, operating, and closing our mines in a safe and responsible manner. To do this, we seek to develop long-term and mutually-beneficial relationships with host governments and communities while working to minimize the social and environmental impacts of our activities. Geopolitical risks such as resource nationalism and incidents of corruption are inherent for a company operating globally. Past environmental incidents in the extractive industry highlight the hazards (e.g., water management, tailings storage facilities, etc.) and the potential consequences to both the environment and community health and safety. Barrick also recognizes climate change as an area of risk requiring specific focus. Our ability to maintain compliance with regulatory and community obligations in order to protect the environment and our host communities alike remains one of our top priorities.
Key risk modification activities:
| | • | | Our external Corporate Social Responsibility Advisory Board was formed in 2012 and provides expert advice to the Company on a range of corporate social responsibility matters, including community relations, sustainable development, water, energy, climate change, security and human rights; |
| | • | | Our obligations, expectations and intentions are codified in our Vision and Values and the Code of Business Conduct and Ethics, and they are reinforced regularly at all levels of the Company; |
| | • | | Barrick’s community relations, environment, safety and health, security and compliance management systems set expectations, define performance standards and provide the necessary tools to modify the related risks; |
| | • | | We take a partnership approach with our home and host governments. This means we work to |
| | | | |
BARRICK YEAR-END 2017 | | 38 | | MANAGEMENT’S DISCUSSION AND ANALYSIS |
| | balance our own interests and priorities with those of our government partners, working to ensure that everyone derives real value from our operations; |
| | • | | We open our social and environmental performance to third-party scrutiny, including through the ISO 14001re-certification process, International Cyanide Management Code audits, annual human rights impact assessments, and an annual assurance against the International Council on Mining and Metal’s Sustainable Development Framework; |
| | • | | We participate in the annual CDP Climate Change and Water Disclosure process, providing investors and other interested partners with detailed information on our water and energy use and emissions data; |
| | • | | Under the direction of the Climate Change committee, we performed a climate change risk assessment. Refer to page 30 for details; and |
| | • | | We continually review and update our closure plans and cost estimates to plan for environmentally responsible closure and monitoring of operations. |
Resources and reserves and production outlook
Like any mining company, we face the risk that we are unable to discover or acquire new resources or that we do not convert resources into production. As we move into 2018 and beyond, our overriding objective of growing free cash flow per share is underpinned by a strong pipeline of organic projects and minesite expansion opportunities in our core regions. Uncertainty related to these and other opportunities exists (potentially both favorable and unfavorable) due to the speculative nature of mineral exploration and development as well as the potential for increased costs, delays, suspensions and technical challenges associated with the construction of capital projects.
Key risk modification activities:
| | • | | Focus on responsible Mineral Resource Management and continuously improved orebody knowledge, adding to and upgrading reserves and resources (organically and inorganically); |
| | • | | Develop and advance a balanced pipeline of high-return projects and seek to exit those that do not meet expectations; |
| | • | | Pursue high-return growth options with a mindset of innovation, cost control, and risk mitigation; |
| | • | | Enhance project design to stagger capital outlay and optimize timing of cash flows; and |
| | • | | Exploration activities including minesite exploration and global programs. |
Market Overview
The market prices of gold, and, to a lesser extent, copper are the primary drivers of our profitability and our ability to generate free cash flow for our shareholders.
Gold
The price of gold is subject to volatile price movements over short periods of time and is affected by numerous industry and macroeconomic factors. During the year, the gold price ranged from $1,146 per ounce to $1,358 per ounce. The average market price for the year of $1,257 per ounce represented an increase of 0.5% versus 2016.
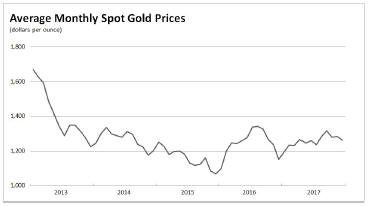
The price of gold generally rose over the course of 2017, experiencing its low in early January and ending the year near $1,300/oz. Over the year, the gold price was positively influenced by a weakening of the trade-weighted US dollar to lows not seen since early 2015. In addition, geopolitical tensions, highlighted by concerns regarding North Korea, fluctuations in long-term US interest rates, and investor interest in gold as a safe haven asset and hedge against record high levels in U.S. equity indices were all supportive factors for gold.
Copper
During 2017, London Metal Exchange (“LME”) copper prices traded in a range of $2.47 to $3.32 per pound, averaged $2.80 per pound, and closed the year at $3.25 per pound. Copper prices are significantly influenced by physical demand from emerging markets, especially China.
The price of copper traded higher over the course of 2017, reaching a3-year high near the end of the year and averaging 27% above the previous year. Copper prices benefited from a weakening of the trade-weighted U.S. dollar, positive economic and copper usage data from China, an increase in the price of othernon-precious metal mined commodities, and positive investor sentiment. A dearth of new projects scheduled to enter production later in the decade could positively impact prices in the coming years should physical demand continue to grow.
| | | | |
BARRICK YEAR-END 2017 | | 39 | | MANAGEMENT’S DISCUSSION AND ANALYSIS |
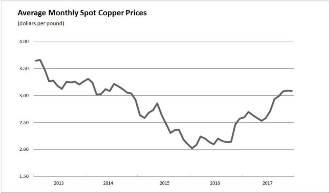
Utilizing option collar strategies, we have protected the downside on approximately 60 million pounds (~15%) of expected copper production for the first half of 2018 at an average floor price of $2.83 per pound and can participate up to an average price of $3.25 per pound. These positions expire evenly over the first six months of the year. Our remaining copper production is subject to market prices.
We have provisionally priced copper sales for which final price determination versus the relevant copper index is outstanding at the balance sheet date. As at December 31, 2017, we recorded 40 million pounds of copper sales subject to final settlement at an average provisional price of $3.29 per pound. The impact to net income before taxation of a 10% movement in the market price of copper would be approximately $13 million, holding all other variables constant.
Silver
Silver traded in a range of $15.19 to $18.65 per ounce in 2017, with an average market price of $17.05 per ounce and closed the year at $16.87 per ounce. The silver price is driven by factors similar to those influencing investment demand for gold.
Silver prices do not significantly impact our current operating earnings, cash flows, or gold cash costs. Silver prices, however, will have a significant impact on the overall economics for our Pascua-Lama project.
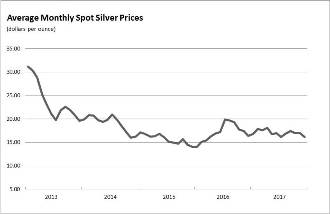
Currency Exchange Rates
The results of our mining operations outside of the United States are affected by US dollar exchange rates withnon-US denominated currencies comprising approximately 30% of our operating and capital cost exposures. Although we have made dispositions, we continue to have exposure to the Australian and Canadian dollars through a combination of mine operating and corporate administration costs, as well as exposure to the Chilean peso through expected future capital and operating costs at our Pascua-Lama project and mine operating costs at Zaldívar. We also have exposure to the Argentinean peso through operating costs at our Veladero mine, peso denominated VAT receivable balances and expected future capital and operating costs at our Pascua-Lama project. In addition, we have exposure to the Papua New Guinea kina, Peruvian sol, Zambian kwacha, Tanzanian shilling and Dominican peso through mine operating and capital costs.
Fluctuations in the US dollar increase the volatility of our costs reported in US dollars, subject to positions put in place through our currency hedging program. During 2017, we did not have any currency hedge positions. In 2017, the Australian dollar traded in a range of $0.72 to $0.81 against the US dollar, while the US dollar against the Canadian dollar, Chilean peso and Argentinean peso ranged from $1.21 to $1.38, CLP613 to CLP682 and ARS 15.01 to ARS 19.20, respectively.
We are unhedged against foreign exchange exposures as at December 31, 2017.
Fuel
For 2017, the price of West Texas Intermediate (“WTI”) crude oil traded in a wide range between $42 and $61 per barrel, with an average market price of $51 per barrel and closed the year at $60 per barrel. During 2017, the price of crude oil rose significantly over the second half of the year, reaching the highest levels sincemid-2015 toward the end of the year. Reduced supply and increasing demand have helped towards balancing the physical market, and an agreement reportedly being adhered to by major producing nations to cap production has improved overall market sentiment towards crude oil.
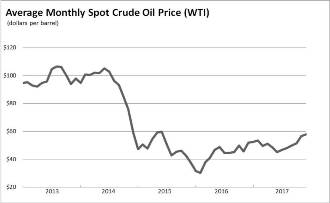
| | | | |
BARRICK YEAR-END 2017 | | 40 | | MANAGEMENT’S DISCUSSION AND ANALYSIS |
In 2017, we recorded hedge losses in earnings of $32 million on our fuel hedge positions (2016: $47 million loss and 2015: $19 million loss). Assuming December 31, 2017 market forward curves andyear-end spot prices, we expect to realize fuel hedge losses of approximately $21 million in 2018. A significant portion of these losses has already been recorded in the consolidated statements of income as an unrealized loss onnon-hedge derivatives. Beginning in January 2015, upon early adoption of IFRS 9, Barrick’s fuel hedges qualified for hedge accounting and unrealized gains and losses began being recorded in Other Comprehensive Income.
Financial Fuel Hedge Summary
| | | | | | | | | | | | | | | | |
| | | Barrels (thousands) | | | Average price | | | % of total expected exposure | | | Impact of $10 change on pre-tax earnings (USD millions)1 | |
2018 | | | 1,244 | | | | 78 | | | | 28% | | | | 31 | |
| 1 | Includes the impact of hedges currently in place. |
US Dollar Interest Rates
Beginning in 2008, in response to the contraction of global credit markets and in an effort to spur economic activity and avoid potential deflation, the US Federal Reserve reduced the range for its benchmark rate to between 0% and 0.25%. The benchmark was kept at this level until December 2015, when the range was increased by 25 basis points. The range was raised by an additional 25 basis points in December 2016 and an additional 75 basis points over the course of 2017. As economic conditions in the US continue to normalize, we expect incremental increases to short-term rates to continue in 2018.
At present, our interest rate exposure mainly relates to interest receipts on our cash balances ($2.2 billion at December 31, 2017); themark-to-market value of derivative instruments; the fair value of and ongoing payments under US dollar interest-rate swaps; the carrying value of certain long-lived assets and liabilities; and to the interest payments on our variable-rate debt ($0.1 billion at December 31, 2017). Currently, the amount of interest expense recorded in our consolidated statement of income is not materially impacted by changes in interest rates, because the majority of debt was issued at fixed interest rates. The relative amounts of variable-rate financial assets and liabilities may change in the future, depending on the amount of operating cash flow we generate, as well as the level of capital expenditures and our ability to borrow on favorable terms using fixed rate debt instruments. Changes in interest rates affect the accretion expense recorded on our provision for environmental rehabilitation and therefore would affect our net earnings.
| | | | |
BARRICK YEAR-END 2017 | | 41 | | MANAGEMENT’S DISCUSSION AND ANALYSIS |
REVIEW OF ANNUAL FINANCIAL RESULTS
Revenue
| | | | | | | | | | | | |
($ millions, except per ounce/pound data in dollars) | | | For the years ended December 31 | |
| | | 2017 | | | 2016 | | | 2015 | |
Gold | | | | | | | | | | | | |
| | | |
000s oz sold1 | | | 5,302 | | | | 5,503 | | | | 6,083 | |
| | | |
000s oz produced1 | | | 5,323 | | | | 5,517 | | | | 6,117 | |
| | | |
Revenue | | | $7,631 | | | | $7,908 | | | | $7,813 | |
| | | |
Market price2 | | | 1,257 | | | | 1,251 | | | | 1,160 | |
| | | |
Realized price2,3 | | | $1,258 | | | | $1,248 | | | | $1,157 | |
| | | |
Copper | | | | | | | | | | | | |
| | | |
millions lbs sold1 | | | 405 | | | | 405 | | | | 510 | |
| | | |
millions lbs produced1 | | | 413 | | | | 415 | | | | 511 | |
| | | |
Revenue | | | $608 | | | | $466 | | | | $1,002 | |
| | | |
Market price2 | | | 2.80 | | | | 2.21 | | | | 2.49 | |
| | | |
Realized price2,3 | | | 2.95 | | | | 2.29 | | | | 2.37 | |
| | | |
Other sales | | | $135 | | | | $184 | | | | $214 | |
| | | |
Total revenue | | | $8,374 | | | | $8,558 | | | | $9,029 | |
| | 1 | Includes our equity share of gold ounces from Acacia and Pueblo Viejo and copper pounds from Zaldívar and Jabal Sayid. |
| | 2 | Per ounce/pound weighted average. |
| | 3 | Realized price is anon-GAAP financial performance measure with no standardized meaning under IFRS and therefore may not be comparable to similar measures of performance presented by other issuers. For further information and a detailed reconciliation of eachnon-GAAP measure used in this section of the MD&A to the most directly comparable IFRS measure, please see pages 69 to 84 of this MD&A. |
In 2017, gold revenues were down 4% compared to the prior year primarily due to a decrease in gold sales volume, partially offset by higher realized gold prices1. The average realized gold price1 for 2017 was up $10 per ounce compared to the prior year reflecting the higher market gold prices in 2017, which averaged $6 per ounce higher than 2016.
In 2017, gold production was 194 thousand ounces or 4% lower than the prior year, primarily as a result of the divestment of 50% of the Veladero mine on June 30, 2017. Excluding the impact of the Veladero divestment, gold production decreased by 1% or 48 thousand ounces due to lower grade and recovery at Turquoise Ridge, lower grade at Pueblo Viejo and Hemlo, lower recovery at Lagunas Norte and lower throughput at Acacia as a result of reduced operations at Bulyanhulu. These decreases were partially offset by higher production at Barrick Nevada and Veladero attributed to higher throughput and grade.
Copper revenues for 2017 were up 30% compared to the prior year due to a higher realized copper price1. In 2017, the realized copper price was up $0.66 per pound compared to 2016, due to the 27% increase in market copper prices over the prior year.
Copper production for 2017 was 2 million pounds lower than the prior year as lower production at Lumwana by 15 million pounds due to lower grades and recoveries was partially offset by increased production at Jabal Sayid of 13 million pounds, related to a full year of production in 2017 after it achieved of commercial production in July 2016.
Production Costs
| | | | | | | | | | | | |
($ millions, except per ounce/pound data in dollars) | | | | | | | |
| For the years ended December 31 | |
| | | 2017 | | | 2016 | | | 2015 | |
Gold | | | | | | | | | | | | |
| | | |
Direct mining costs | | | $3,063 | | | | $3,215 | | | | $4,006 | |
| | | |
Depreciation | | | 1,529 | | | | 1,504 | | | | 1,615 | |
| | | |
Royalty expense | | | 206 | | | | 224 | | | | 235 | |
| | | |
Community relations | | | 38 | | | | 37 | | | | 50 | |
| | | |
Cost of sales | | | $4,836 | | | | $4,980 | | | | $5,906 | |
| | | |
Cost of sales (per oz)1 | | | 794 | | | | 798 | | | | 859 | |
| | | |
Cash costs2,3 | | | 526 | | | | 546 | | | | 596 | |
| | | |
All-in sustaining costs2,3 | | | 750 | | | | 730 | | | | 831 | |
| | | |
Copper | | | | | | | | | | | | |
| | | |
Cost of sales | | | $399 | | | | $319 | | | | $814 | |
| | | |
Cost of sales (per lb)1 | | | 1.77 | | | | 1.41 | | | | 1.65 | |
| | | |
C1 cash costs2,3 | | | 1.66 | | | | 1.49 | | | | 1.73 | |
| | | |
All-in sustaining costs2,3 | | | $2.34 | | | | $2.05 | | | | $2.33 | |
| | 1 | Cost of sales related to gold per ounce is calculated using cost of sales related to gold on an attributable basis (removing thenon-controlling interest of 40% Pueblo Viejo and 36.1% Acacia from cost of sales), divided by attributable gold ounces. Cost of sales related to copper per pound is calculated using cost of sales related to copper including our proportionate share of cost of sales attributable to equity method investments (Zaldívar and Jabal Sayid), divided by consolidated copper pounds (including our proportionate share of copper pounds from our equity method investments). |
| | 2 | Per ounce/pound weighted average. |
| | 3 | Cash costs,all-in sustaining costs and C1 cash costs arenon-GAAP financial performance measures with no standardized meaning under IFRS and therefore may not be comparable to similar measures of performance presented by other issuers. For further information and a detailed reconciliation of eachnon-GAAP measure used in this section of the MD&A to the most directly comparable IFRS measure, please see pages 69 to 84 of this MD&A. |
In 2017, cost of sales applicable to gold was 3% lower than the prior year primarily due to lower sales volume, which has contributed to a decrease in direct mining costs and royalty expense. This was partially offset by an increase in depreciation expense, as discussed below. On a per ounce basis, cost of sales applicable to gold4 after removing the portion related tonon-controlling interests, was 1% lower than the prior year primarily due to a decrease in direct mining costs combined with a positive change in our sales mix with lower relative sales volume from our higher cost Acacia mines. Direct mining costs expense also decreased as a result of higher capitalized waste stripping activity at Barrick Nevada and Veladero
| | | | |
BARRICK YEAR-END 2017 | | 42 | | MANAGEMENT’S DISCUSSION AND ANALYSIS |
combined with lower inventory write-downs than the prior year and higher equipment rental costs in the prior year as a result of the oxygen plant motor failure at Pueblo Viejo in the fourth quarter of 2015. These decreases were partially offset by higher fuel prices and consulting costs associated withBest-in-Class initiatives. Direct mining costs in 2016 had also benefited from the receipt of insurance proceeds relating to the 2015 oxygen plant motor failure at Pueblo Viejo. Higher depreciation expense is mainly a result of higher depreciation at Pueblo Viejo relating to a tailings storage facility depreciation adjustment, partially offset by lower depreciation at Barrick Nevada associated with the South Arturo pit.
In 2017, goldall-in sustaining costs1 were up $20 per ounce or 3% compared to the prior year primarily due to a planned increase in minesite sustaining capital expenditures, partially offset by lower cost of sales per ounce4.
In 2017, cost of sales applicable to copper was 25% higher than the prior year as a result of higher power, fuel, consumables and contractor costs combined with higher depreciation expense at Lumwana. On a per pound basis, cost of sales applicable to copper4, after including our proportionate share of cost of sales at our equity method investees, increased 26% compared to the prior year primarily due to higher direct mining costs combined with higher depreciation expense at Lumwana as discussed above, partially offset by the positive sales mix impact of lower sales volume at Lumwana compared to the prior year. This was further impacted by higher direct mining costs at Zaldívar primarily related to higher fuel and labor costs combined with higher depreciation expense.
Copperall-in sustaining costs1, which have been adjusted to include our proportionate share of equity method investments, were 14% higher than the prior year primarily reflecting the higher cost of sales applicable to copper combined with higher minesite sustaining capital expenditures at Lumwana and Jabal Sayid.
Capital Expenditures1
| | | | | | | | | | | | |
| ($ millions) | | For the years ended December 31 | |
| | | 2017 | | | 2016 | | | 2015 | |
Minesite sustaining2 | | | $1,109 | | | | $944 | | | | $1,359 | |
Project capital expenditures3,4 | | | 273 | | | | 175 | | | | 133 | |
Capitalized interest | | | — | | | | — | | | | 17 | |
Total consolidated capital expenditures | | | $1,382 | | | | $1,119 | | | | $1,509 | |
Attributable consolidated capital expenditures5 | | | $1,364 | | | | $1,053 | | | | $1,414 | |
| | 1 | These amounts are presented on a 100% accrued basis, except for attributable consolidated capital expenditures. |
| | 2 | Includes both minesite sustaining and mine development. |
| | 3 | Project capital expenditures are included in our calculation ofall-in costs, but not included in our calculation ofall-in sustaining costs. |
| | 4 | Includes both minesite expansion and projects. |
| | 5 | These amounts are presented on the same basis as our guidance, which include our 60% share of Pueblo Viejo and South Arturo, our 63.9% share of Acacia and our 50% share of Zaldívar and Jabal Sayid. |
In 2017, total consolidated capital expenditures increased 24% compared to the prior year primarily due to an increase in minesite sustaining capital expenditures combined with an increase in project capital expenditures.
The 17% increase in minesite sustaining capital expenditures reflects a $143 million increase in sustaining capital at Barrick Nevada relating to higher capitalized stripping costs at Goldstrike open pit and a greater number of minesite sustaining projects compared to 2016, combined with increased spending of $78 million relating to phases 4B and 5B of the leach pad expansion and additional equipment purchases at Veladero. These increases were partially offset by a $53 million decrease in sustaining capital at Acacia as a result of reduced operations at Bulyanhulu combined with lower capitalized stripping at North Mara relating to Nyabirama Stage 3 and 4.
Project capital expenditures increased by $98 million primarily as a result of greater spending incurred at Barrick Nevada relating to development of Crossroads and Cortez Hills Lower Zone, and Goldrush project drilling, partially offset by lower spending at South Arturo, which entered commercial production in August 2016.
| | | | |
BARRICK YEAR-END 2017 | | 43 | | MANAGEMENT’S DISCUSSION AND ANALYSIS |
General and Administrative Expenses
| | | | | | | | | | | | |
| ($ millions) | | For the years ended December 31 | |
| | | 2017 | | | 2016 | | | 2015 | |
Corporate administration1 | | | $201 | | | | $159 | | | | $183 | |
Stock-based compensation2 | | | 26 | | | | 42 | | | | 8 | |
Acacia | | | 21 | | | | 55 | | | | 42 | |
General & administrative expenses | | | $248 | | | | $256 | | | | $233 | |
| | 1 | For the year ended December 31, 2017, corporate administration costs include approximately $3 million of severance costs (2016: $9 million; 2015: $29 million). |
| | 2 | Based on US$14.47 share price as at December 31, 2017 (2016: US$15.98; 2015: US$7.38) and excludes Acacia. |
General and administrative expenses were $8 million lower than the prior year primarily related to lower stock-based compensation expense due to decreases in Barrick’s and Acacia’s share prices. These were partially offset by higher corporate administration expenses, in line with expectation, mainly relating to increased spending on digital initiatives and upgrading IT systems.
Exploration, Evaluation and Project Costs
| | | | | | | | |
| ($ millions) | | For the years ended
December 31 | |
| | | 2017 | | 2016 | | 2015 |
Minesite exploration and evaluation | | $47 | | $44 | | | $47 | |
Global exploration and evaluation | | 126 | | 88 | | | 116 | |
Advanced project costs: | | | | | | | | |
Pascua-Lama | | 122 | | 59 | | | 119 | |
Other | | 14 | | 17 | | | 12 | |
Corporate development | | 13 | | 14 | | | 42 | |
Business improvement and innovation | | 32 | | 15 | | | 19 | |
Global exploration and evaluation and project expense | | $307 | | $193 | | | $308 | |
Total exploration, evaluation and project expenses | | $354 | | $237 | | | $355 | |
Exploration, evaluation and project costs for 2017 increased $117 million compared to the prior year. The increase is primarily due to a $63 million increase in project costs at Pascua-Lama including study costs. The increase was further impacted by a $38 million increase in global exploration expenses, including Alturas, and variousearn-in projects combined with a $17 million increase in business improvement and innovation, primarily related to innovation projects.
Finance Costs, Net
| | | | | | | | | | | | |
| ($ millions) | | For the years ended December 31 | |
| | | 2017 | | | 2016 | | | 2015 | |
Interest expense1 | | | $511 | | | | $591 | | | | $737 | |
Accretion | | | 67 | | | | 50 | | | | 63 | |
Loss (gain) on debt extinguishment | | | 127 | | | | 129 | | | | (68 | ) |
Other finance costs | | | — | | | | 18 | | | | 7 | |
Finance income | | | (14 | ) | | | (13 | ) | | | (13 | ) |
Finance costs, net | | | $691 | | | | $775 | | | | $726 | |
| | 1 | For the year ended December 31, 2017, interest expense includes approximately $101 million ofnon-cash interest expense relating to the gold and silver streaming agreements with Wheaton Precious Metals Corp. and Royal Gold, Inc. (2016: $100 million; 2015: $61 million). |
In 2017, net finance costs were $84 million lower than the prior year primarily due to an $80 million reduction in interest expense attributed to debt reductions combined with a decrease in other finance costs relating to amortization of debt issue costs and higher gains on interest rate hedges. These were partially offset by an increase in accretion expense. We also recorded $127 million and $129 million in losses on debt extinguishment in 2017 and 2016, respectively, as we have been actively reducing our outstanding debt balances in recent years.
| | | | |
BARRICK YEAR-END 2017 | | 44 | | MANAGEMENT’S DISCUSSION AND ANALYSIS |
Additional Significant Statement of Income Items
| | | | | | | | | | | | |
| ($ millions) | | For the years ended December 31 | |
| | | 2017 | | | 2016 | | | 2015 | |
Impairment charges (reversals) | | | ($212 | ) | | | ($250 | ) | | | $3,897 | |
Loss (income) on currency translation | | | $72 | | | | $ 199 | | | | $120 | |
Other expense/(income) | | | ($799 | ) | | | $60 | | | | ($113 | ) |
| |
Impairment Charges (Reversals) | | | | | |
| ($ millions) | | For the years ended December 31 | |
| | | 2017 | | | 2016 | | | 2015 | |
| | | Post-tax (our share) | | | Post-tax (our share) | | | Post-tax (our share) | |
Asset impairments (reversals) | | | | | |
Cerro Casale | | | $ (518 | ) | | | $ — | | | | $ — | |
Bulyanhulu | | | 350 | | | | — | | | | — | |
Lumwana | | | (259 | ) | | | — | | | | — | |
Pascua-Lama | | | 407 | | | | 1 | | | | 399 | |
Lagunas Norte | | | 2 | | | | (20 | ) | | | 26 | |
Golden Sunlight | | | 2 | | | | — | | | | — | |
Veladero | | | — | | | | (179 | ) | | | — | |
Equity method investments | | | — | | | | 49 | | | | — | |
Pueblo Viejo | | | — | | | | — | | | | 386 | |
Buzwagi | | | — | | | | — | | | | 30 | |
Round Mountain/Bald Mountain | | | — | | | | — | | | | 53 | |
Exploration sites | | | 8 | | | | — | | | | — | |
Other | | | 1 | | | | 3 | | | | 53 | |
Total asset impairment charges (reversals) | | | $ (7 | ) | | | $ (146 | ) | | | $ 947 | |
Goodwill | | | | | | | | | | | | |
Goldstrike | | | $ — | | | | $ — | | | | $730 | |
Zaldívar | | | — | | | | — | | | | 427 | |
Pueblo Viejo | | | — | | | | — | | | | 412 | |
Cortez | | | — | | | | — | | | | 355 | |
Lagunas Norte | | | — | | | | — | | | | 247 | |
| Total goodwill impairment charges | | | $ — | | | | $ — | | | | $ 2,171 | |
Tax effects and NCI | | | (205 | ) | | | (104 | ) | | | 779 | |
| Total impairment charges (reversals) (100%) | | | $ (212 | ) | | | $ (250 | ) | | | $ 3,897 | |
In 2017, we recognized $7 million (net of tax andnon-controlling interests) of net impairment reversals fornon-current assets. This was primarily as a result of impairment reversals at the Cerro Casale project upon reclassification of the project’s net assets asheld-for-sale as at March 31, 2017, combined with impairment reversals at Lumwana due to an increase in reserves. These were partially offset by an impairment taken at Acacia’s Bulyanhulu mine related to the continued challenges experienced in the operating environment in Tanzania and net impairments taken at Pascua-Lama, mainly attributable to the
reclassification ofopen-pit reserves to resources after receiving a closure order from the Chilean regulators. This compares tonon-current asset impairment reversals of $146 million (net of tax andnon-controlling interests) in the prior year primarily relating to net impairment reversals at Veladero and Lagunas Norte as a result of improvements in the cost structure, partially offset by a $49 million write-down of our equity method investment in Zaldívar due to the final purchase price adjustments. Refer to note 21 to the Financial Statements for a full description of impairment charges, includingpre-tax amounts and sensitivity analysis.
Loss (Income) on Currency Translation
Loss on currency translation for 2017 decreased $127 million compared to the prior year primarily due to $81 million of currency translation losses recognized during the first quarter of 2016 as a result of the disposal and reorganization of certain Australian entities. This was further impacted by lower unrealized foreign currency translation losses relating to the Argentinean peso, which did not depreciate as quickly in the current year.
Other Expense (Income)
Other income was $799 million in 2017 compared to an expense of $60 million in the prior year. The increase primarily relates to 2017 gains of $718 million connected to the sale of a 50% interest in the Veladero mine and $193 million on the gain related to the sale of a 25% interest in the Cerro Casale project. This was partially offset by an increase at Acacia relating to Bulyanhulu reduced operations program costs combined with higher litigation expense. This compares to a $42 million loss, primarily relating to Zaldívar, as a result of the final purchase price adjustments recorded in 2016. For a further breakdown of other expense (income), refer to note 9 to the Financial Statements.
Income Tax Expense
Income tax expense was $1,231 million in 2017. The underlying effective tax rate for ordinary income in 2017 was 44% after adjusting for the net impact of foreign currency translation losses on deferred tax balances; the impact of impairment (reversals) charges; the impact of debt extinguishment costs; the impact of asset sales andnon-hedge derivatives; the impact ofnon-deductible foreign exchange losses; the impact of United States tax reform; the impact of the proposed framework for Acacia operations; and the impact of US withholding taxes. The unadjusted tax rate for income in 2017 was 45% of the income before income taxes.
We record deferred tax charges or credits if changes in facts or circumstances affect the estimated tax basis of assets and therefore the amount of deferred tax assets or liabilities to reflect changing expectations in our ability to realize deferred tax assets. The interpretation of tax regulations and legislation and their application to our business is complex and subject to change. We have
| | | | |
BARRICK YEAR-END 2017 | | 45 | | MANAGEMENT’S DISCUSSION AND ANALYSIS |
significant amounts of deferred tax assets, including tax loss carry forwards, and also deferred tax liabilities. Potential changes of any of these amounts, as well as our ability to realize deferred tax assets, could significantly affect net income or cash flow in future periods.
| | | | | | | | |
| Reconciliation to Canadian Statutory Rate | |
| For the years ended December 31 | | 2017 | | | 2016 | |
At 26.5% statutory rate | | $ | 728 | | | $ | 471 | |
Increase (decrease) due to: | | | | | | | | |
Allowances and special tax deductions1 | | | (96 | ) | | | (134 | ) |
Impact of foreign tax rates2 | | | 215 | | | | 113 | |
Expenses not tax deductible | | | 24 | | | | 54 | |
Non-taxable gains on sales of long-lived assets | | | (241 | ) | | | — | |
Impairment charges not recognized in deferred tax assets | | | 66 | | | | — | |
Net currency translation losses on deferred tax balances | | | 10 | | | | 23 | |
Tax impact of profits from equity accounted investments | | | (7 | ) | | | (5 | ) |
Current year tax losses not recognized in deferred tax assets | | | 21 | | | | 35 | |
United States tax reform | | | (203 | ) | | | — | |
Non-recognition of US AMT credits | | | — | | | | 13 | |
Adjustments in respect of prior years | | | (6 | ) | | | (4 | ) |
Increase to income tax related contingent liabilities | | | 172 | | | | 70 | |
Impact of tax rate changes | | | — | | | | (13 | ) |
United States withholding taxes | | | 252 | | | | — | |
Other withholding taxes | | | 18 | | | | 11 | |
Mining taxes | | | 266 | | | | 267 | |
Other items | | | 12 | | | | 16 | |
| Income tax expense | | $ | 1,231 | | | $ | 917 | |
| 1 | We are able to claim certain allowances and tax deductions unique to extractive industries that result in a lower effective tax rate. |
| 2 | We operate in multiple foreign tax jurisdictions that have tax rates different than the Canadian statutory rate. |
The more significant items impacting income tax expense in 2017 and 2016 include the following:
Currency Translation
Deferred tax balances are subject to remeasurement for changes in currency exchange rates each period. The most significant balances are Argentinean deferred tax liabilities. In 2017 and 2016, tax expense of $10 million and $23 million, respectively, primarily arose from translation losses due to the weakening of the Argentinean peso against the US dollar. These losses are included within deferred tax expense/recovery.
United States Tax Reform
On December 22, 2017 Tax Reform was enacted in the United States. The significant changes include: (i) a reduction from 35% to 21% in the corporate income tax rate effective January 1, 2018, which resulted in a deferred tax recovery of $343 million on our net deferred tax liability in the US, (ii) a repeal of the corporate Alternative Minimum Tax (AMT) effective January 1, 2018, (iii) the mandatory repatriation of earnings and
profits of specified foreign corporations effective December 31, 2017, which resulted in an estimated onetime 2017 toll charge of $228 million, offset by (iv) the recognition of our previously unrecognized deferred tax asset on AMT credits in the amount of $88 million, which can be used to offset theone-time toll charge. The netone-time 2017 toll charge payable amount of $140 million is payable over 8 years. $129 million of this amount has been recorded in othernon-current liabilities (refer to note 29 to the Financial Statements). The impact of the United States Tax Reform may differ from this estimate due to changes in interpretations and assumptions we have made and guidance that may be issued.
Proposed Framework for Acacia Operations in Tanzania and the Increase to Income Tax Related Contingent Liabilities in Tanzania
The terms of the Proposed Framework for Acacia Mining Operations in Tanzania were announced on October 19, 2017. The Proposed Framework indicates that in support of ongoing efforts to resolve outstanding tax claims, Acacia would make a payment of $300 million to the Government of Tanzania, on terms to be settled by a working group. A tax provision of $128 million had been recorded prior to December 31, 2016 in respect of tax disputes related to Acacia. Of this amount, $70 million was recorded in 2016. In the third quarter of 2017, an additional amount of $172 million was recorded as current tax expense. Refer to note 36 to the Financial Statements for further information with respect to these matters.
United States Withholding Taxes
Prior to fourth quarter 2017, we had not previously recorded withholding tax related to the undistributed earnings of our United States subsidiaries because our intention was to reinvest our current and future undistributed earnings of our United States subsidiaries indefinitely. During fourth quarter 2017, we reassessed our intentions regarding those undistributed earnings. As a result of our reassessment, we concluded that it was no longer our intent to indefinitely reinvest our current and future undistributed earnings of our United States subsidiaries, and therefore in fourth quarter 2017, we recognized an increase in our income tax provision in the amount of $252 million, representing withholding tax on the undistributed United States earnings. $150 million was recorded in the tax charge for the year, and $102 million was recorded as deferred tax expense. Of the $150 million, $130 million has been recorded in othernon-current liabilities (refer to note 29 to the Financial Statements).
| | | | |
BARRICK YEAR-END 2017 | | 46 | | MANAGEMENT’S DISCUSSION AND ANALYSIS |
FINANCIAL CONDITION REVIEW
| | | | | | | | | | | | |
| Summary Balance Sheet and Key Financial Ratios | |
($ millions, except ratios and share amounts) | | As at December 31, 2017 | | | As at December 31, 2016 | | | As at December 31, 2015 | |
Total cash and equivalents | | | $2,234 | | | | $2,389 | | | | $2,455 | |
Current assets | | | 2,450 | | | | 2,485 | | | | 3,013 | |
Non-current assets | | | 20,624 | | | | 20,390 | | | | 20,840 | |
Total Assets | | | $25,308 | | | | $25,264 | | | | $26,308 | |
Current liabilities excluding short-term debt | | | $1,688 | | | | $1,676 | | | | $1,644 | |
Non-current liabilities excluding long-term debt1 | | | 6,130 | | | | 5,344 | | | | 5,241 | |
Debt (current and long-term) | | | 6,423 | | | | 7,931 | | | | 9,968 | |
Total Liabilities | | | $14,241 | | | | $14,951 | | | | $16,853 | |
Total shareholders’ equity | | | 9,286 | | | | 7,935 | | | | 7,178 | |
Non-controlling interests | | | 1,781 | | | | 2,378 | | | | 2,277 | |
Total Equity | | | $11,067 | | | | $10,313 | | | | $9,455 | |
Total common shares outstanding (millions of shares)2 | | | 1,167 | | | | 1,166 | | | | 1,165 | |
Key Financial Ratios: | | | | | | | | | | | | |
Current ratio3 | | | 2.68:1 | | | | 2.68:1 | | | | 2.77:1 | |
Debt-to-equity4 | | | 0.58:1 | | | | 0.77:1 | | | | 1.05:1 | |
| | 1 | Non-current financial liabilities as at December 31, 2017 were $6,844 million (2016: $8,002 million; 2015: $10,068 million). |
| | 2 | Total common shares outstanding do not include 1.0 million stock options. |
| | 3 | Represents current assets (excluding assetsheld-for-sale) divided by current liabilities (including short-term debt and excluding liabilitiesheld-for-sale) as at December 31, 2017, December 31, 2016 and December 31, 2015. |
| | 4 | Represents debt divided by total shareholders’ equity (including minority interest) as at December 31, 2017 and December 31, 2016. |
Balance Sheet Review
Total assets were $25.3 billion at December 31, 2017, in line with the balance at December 31, 2016, as the sale of 50% percent of our Veladero mine in Argentina and 25% of the Cerro Casale project in Chile, combined with impairment charges at Acacia’s Bulyanhulu mine and our Pascua-Lama project, were offset by the remeasurement of our remaining interest in the Veladero mine and the Cerro Casale project, combined with asset impairment reversals, mainly at Lumwana. The proceeds from the Veladero transaction were a primary source of funding for debt repayments, and were combined with a portion of our existing cash balance, which further reduced total assets. Our asset base is primarily comprised ofnon-current assets such as property, plant and equipment and goodwill, reflecting the capital-intensive nature of the mining business and our history of growth through acquisitions. Other significant assets include production inventories, indirect taxes recoverable and receivable, concentrate sales receivables, other government transaction and joint venture related receivables, and cash and equivalents. Total liabilities at December 31, 2017 totaled $14.2 billion, approximately $0.7 billion lower than at December 31, 2016, reflecting $1.5 billion of debt repayments made during the year, partially offset by increases in our provisions for environmental rehabilitation of $0.8 billion.
| | | | |
| Shareholders’ Equity | | | |
| As at February 6, 2018 | | Number of shares | |
Common shares | | | 1,166,577,478 | |
Stock options | | | 999,467 | |
Financial Position and Liquidity
Total cash and cash equivalents as at December 31, 2017 was $2.2 billion3. Our capital structure comprises a mix of debt and shareholders’ equity. As at December 31, 2017, our total debt was $6.4 billion (debt net of cash and equivalents was $4.2 billion) and ourdebt-to-equity ratio was 0.58:1. This compares to debt as at December 31, 2016 of $7.9 billion (debt net of cash and equivalents was $5.5 billion), and adebt-to-equity ratio of 0.77:1.
At the beginning of 2017, we set a target to reduce our total debt by $2.9 billion, to around $5 billion, by the end of 2018 – half of which was targeted in 2017. We exceeded our 2017 target, reducing total debt by $1.5 billion in 2017. We currently have less than $100 million2in debt due before 2020, and approximately $5 billion of our outstanding debt matures after 2032.
In 2018, we have capital commitments of $79 million and expect to incur attributable sustaining and project capital expenditures of approximately $1,400 to $1,600 million in 2018 based on our guidance range on page 33. In 2018, we have contractual obligations and commitments of $ 548 million in purchase obligations for supplies and consumables and $30 million in derivative liabilities which will form part of operating costs. In addition, we have
| | | | |
BARRICK YEAR-END 2017 | | 47 | | MANAGEMENT’S DISCUSSION AND ANALYSIS |
$362 million in interest payments and other amounts as detailed in the table on page 66. We expect to fund these commitments through operating cash flow, which is our primary source of liquidity, as well as existing cash balances.
Our operating cash flow is dependent on the ability of our operations to deliver projected future cash flows. The market prices of gold and, to a lesser extent, copper are the primary drivers of our operating cash flow. Other options to enhance liquidity include further portfolio optimization and the creation of new joint ventures and partnerships; issuance of debt or equity securities in the public markets or to private investors, which could be undertaken for liquidity enhancement and/or in connection with establishing a strategic partnership; and drawing the $4.0 billion available under our undrawn credit facility (subject to compliance with covenants and the making of certain representations and warranties, this facility is available for drawdown as a source of financing).
Many factors, including but not limited to general market conditions and then prevailing metals prices, could impact our ability to issue securities on acceptable terms, as could our credit ratings. Moody’s and S&P currently rate our long-term debt as investment grade, with ratings of Baa3 andBBB-, respectively. In August 2016, S&P affirmed the Company’sBBB- rating and raised its outlook to positive from stable. Also in August 2016, Moody’s affirmed the Company’s Baa3 rating and revised its outlook to stable from negative. In September 2017, Moody’s and S&P each released reports affirming their existing ratings and outlooks. Further changes in our ratings could affect the trading prices of our securities and our cost of capital. If we were to borrow under our credit facility, the applicable interest rate on the amounts borrowed would be based, in part, on our credit ratings at the time. The key financial covenant in our undrawn credit facility requires Barrick to maintain a net debt to total capitalization ratio of less than 0.60:1. Barrick’s net debt to total capitalization ratio was 0.27:1 as at December 31, 2017 (0.35:1 as at December 31, 2016).
Summary of Cash Inflow (Outflow)
| | | | | | | | |
| ($ millions) | | For the years ended December 31 | |
| | | 2017 | | | 2016 | |
Net cash provided by operating activities | | | $2,065 | | | | $2,640 | |
Investing activities | | | | | | | | |
Capital expenditures | | | ($1,396 | ) | | | ($1,126 | ) |
Divestitures | | | 990 | | | | 588 | |
Other | | | 69 | | | | 126 | |
Total investing inflows/(outflows) | | | ($337 | ) | | | ($412 | ) |
Financing activities | | | | | | | | |
Net change in debt1 | | | ($1,533 | ) | | | ($2,057 | ) |
Dividends2 | | | (125 | ) | | | (86 | ) |
Other | | | (228 | ) | | | (154 | ) |
Total financing inflows/(outflows) | | | ($1,886 | ) | | | ($2,297 | ) |
Effect of exchange rate | | | 3 | | | | 3 | |
Increase/(decrease) in cash and equivalents | | | ($155 | ) | | | ($66 | ) |
| 1 | The difference between the net change in debt on a cash basis and the net change on the balance sheet is due to changes innon-cash charges, specifically the unwinding of discounts and amortization of debt issue costs. |
| 2 | In 2017 we declared and paid dividends in US dollars totaling $0.12 per share (2016: $0.08 per share; 2015: $0.14 per share). |
In 2017, we generated $2,065 million in operating cash flow, compared to $2,640 million of operating cash flow in the prior year. The decrease of $575 million was due to lower gold sales as a result of the divestment of 50% of the Veladero mine on June 30, 2017, lower gold sales volume at Pueblo Viejo, Hemlo, Turquoise Ridge, Lagunas Norte and Acacia, partially offset by higher sales at Barrick Nevada attributed to higher grades andBest-in-Class initiatives positively impacting throughput. This was further impacted by working capital outflows reflecting the buildup of metals inventory at Pueblo Viejo, Lagunas Norte and Acacia combined with an increase in exploration, evaluation and project expenses. Operating cash flow was also affected by lower cash flows attributed tonon-controlling interest, combined with higher cash taxes paid. These outflows were partially offset by higher gold and copper prices as well as lower direct mining costs.
The ability of our operations to deliver projected future cash flows within the parameters of a reduced production profile, as well as future changes in gold and copper market prices, either favorable or unfavorable, will continue to have a material impact on our cash flow and liquidity.
Cash outflows from investing activities in 2017 amounted to $337 million compared to $412 million of cash inflows in the prior year. The decrease of $75 million compared to 2016 is primarily due to $402 million of additional proceeds from the divestitures in the current year relating to $990 million from the divestiture of a 50% interest in Veladero in 2017 compared to $588 million of proceeds
| | | | |
BARRICK YEAR-END 2017 | | 48 | | MANAGEMENT’S DISCUSSION AND ANALYSIS |
from the sale of Bald Mountain and our 50% interest in Round Mountain in 2016. This was partially offset by a planned increase in capital expenditures on a cash basis of $270 million in the current period.
Net financing cash outflows for 2017 amounted to $1,886 million, compared to $2,297 million in the prior year. The net financing cash outflows in 2017 and 2016
primarily consist of net debt repayments includingnon-cash items of $1,533 million and $2,057 million, respectively, as we achieved our debt reduction goals. This was combined with higher outflows associated withnon-controlling interests and dividends, partially offset by a reduction in debt extinguishment costs.
Summary of Financial Instruments1
| | | | | | | | | | | | |
| As at December 31, 2017 | | | | | | | |
| Financial Instrument | | Principal/Notional Amount | | | | | Associated Risks |
| | | | | | | | | | | | ● Interest rate |
Cash and equivalents | | | | | | | $2,234 | | | million | | ● Credit |
| | | | | | | | | | | | ● Credit |
Accounts receivable | | | | | | | $239 | | | million | | ● Market |
| | | | | | | | | | | | ● Market |
Other investments | | | | | | | $33 | | | million | | ● Liquidity |
Accounts payable | | | | | | | $1,059 | | | million | | ● Liquidity |
Debt | | | | | | | $6,456 | | | million | | ● Interest rate |
Restricted share units | | | | | | | $41 | | | million | | ● Market |
Deferred share units | | | | | | | $12 | | | million | | ● Market |
Derivative instruments - currency contracts | | | AUD | | | | 21 | | | million | | ● Market/liquidity |
| | | CAD | | | | 8 | | | million | | |
| | | | PGK | | | | 32 | | | million | | |
Derivative instruments - gold contracts | | | | | | | 105 | | | thousand oz | | ● Market/liquidity |
Derivative instruments - copper contracts | | | | | | | 60 | | | million lbs | | ● Credit |
| | | | | | | | | | | | | ● Interest rate |
Derivative instruments - energy contracts | | | Diesel | | | | 1 | | | million bbls | | ● Market/liquidity |
| | | | | | | | | | | | ● Credit |
| | | | | | | | | | | | | ● Interest rate |
Derivative instruments - interest rate contracts | |
| Receive float interest
rate swaps |
| | | $71 | | | million | | ● Market/liquidity |
| | 1 | Refer to note 25 to the Financial Statements for more information regarding financial instruments. |
OPERATING SEGMENTS PERFORMANCE
Review of Operating Segments Performance
In the first quarter of 2017, we unified the management and the operation of our Cortez and Goldstrike minesites, now referred to as Barrick Nevada. Barrick’s business is now organized into eleven individual minesites, one grouping of two minesites, one publicly traded company and one project. Barrick’s Chief Operating Decision Maker, the President, reviews the operating results, assesses performance and makes capital allocation decisions at the minesite, grouping, Company and/or project level. Therefore, each individual minesite, with the exception of Barrick Nevada, Acacia and the Pascua-Lama project, is an operating segment for financial reporting purposes. Our updated presentation of our reportable
operating segments is now four individual gold mines (Pueblo Viejo, Lagunas Norte, Veladero and Turquoise Ridge), Barrick Nevada, Acacia and our Pascua-Lama project. The remaining operating segments, our remaining gold and copper mines, have been grouped into an “other” category and will not be reported on individually. The prior periods have been restated to reflect the change in presentation. Segment performance is evaluated based on a number of measures including operating income before tax, production levels and unit production costs. Certain costs are managed on a consolidated basis and are therefore not reflected in segment income.
| | | | |
BARRICK YEAR-END 2017 | | 49 | | MANAGEMENT’S DISCUSSION AND ANALYSIS |
Barrick Nevada1, Nevada USA
| | | | | | | | | | | | | | | | |
| Summary of Operating and Financial Data | | | | | | | | For the years ended December 31 | |
| | | 2017 | | | 2016 | | | % Change | | | 2015 | |
Total tonnes mined (000s) | | | 211,090 | | | | 192,753 | | | | 10 % | | | | 223,661 | |
Open pit | | | 208,240 | | | | 189,941 | | | | 10 % | | | | 221,501 | |
Underground | | | 2,850 | | | | 2,812 | | | | 1 % | | | | 2,160 | |
Average grade (grams/tonne) | | | | | | | | | | | | | | | | |
Open pit mined | | | 2.73 | | | | 1.74 | | | | 57 % | | | | 1.87 | |
Underground mined | | | 10.58 | | | | 11.39 | | | | (7)% | | | | 13.40 | |
Processed | | | 3.50 | | | | 2.62 | | | | 34 % | | | | 2.72 | |
Ore tonnes processed (000s) | | | 23,894 | | | | 32,473 | | | | (26)% | | | | 29,158 | |
Oxide mill | | | 4,562 | | | | 4,197 | | | | 9 % | | | | 3,476 | |
Roaster | | | 4,902 | | | | 4,789 | | | | 2 % | | | | 5,050 | |
Autoclave | | | 4,258 | | | | 3,503 | | | | 22 % | | | | 2,605 | |
Heap leach | | | 10,172 | | | | 19,984 | | | | (49)% | | | | 18,027 | |
Gold produced (000s/oz) | | | 2,312 | | | | 2,155 | | | | 7 % | | | | 2,052 | |
Oxide mill | | | 957 | | | | 569 | | | | 68 % | | | | 530 | |
Roaster | | | 929 | | | | 1,115 | | | | (17)% | | | | 1,177 | |
Autoclave | | | 248 | | | | 242 | | | | 2 % | | | | 204 | |
Heap leach | | | 178 | | | | 229 | | | | (22)% | | | | 141 | |
Gold sold (000s/oz) | | | 2,357 | | | | 2,162 | | | | 9 % | | | | 1,981 | |
Segment revenue ($ millions) | | | $2,961 | | | | $2,703 | | | | 10 % | | | | $2,272 | |
Cost of sales ($ millions) | | | 1,869 | | | | 1,896 | | | | (1)% | | | | 1,551 | |
Segment income ($ millions) | | | 1,052 | | | | 771 | | | | 36 % | | | | 678 | |
Segment EBITDA ($ millions)2 | | | 1,845 | | | | 1,578 | | | | 17 % | | | | 1,215 | |
Capital expenditures ($ millions)3 | | | 584 | | | | 328 | | | | 78 % | | | | 339 | |
Minesite sustaining | | | 360 | | | | 217 | | | | 66 % | | | | 211 | |
Project | | | 224 | | | | 111 | | | | 102 % | | | | 128 | |
Cost of sales (per oz) | | | 792 | | | | 876 | | | | (10)% | | | | 782 | |
Cash costs (per oz)2 | | | 455 | | | | 502 | | | | (9)% | | | | 504 | |
All-in sustaining costs (per oz)2 | | | 624 | | | | 618 | | | | 1 % | | | | 631 | |
All-in costs (per oz)2 | | | $722 | | | | $678 | | | | 6 % | | | | $715 | |
| | 1 | Includes our 60% share of South Arturo. |
| | 2 | These arenon-GAAP financial performance measures with no standardized meaning under IFRS and therefore may not be comparable to similar measures presented by other issuers. For further information and a detailed reconciliation of eachnon-GAAP measure used in this section of the MD&A to the most directly comparable IFRS measure, please see pages 69 to 84 of this MD&A. |
| | 3 | 2015 figures exclude capitalized interest. |
Financial Results
Barrick Nevada’s segment income for 2017 was 36% higher than the prior year primarily due to an increase in sales volume combined with higher realized gold prices1and a decrease in cost of sales.
Segment Income and Segment EBITDA1
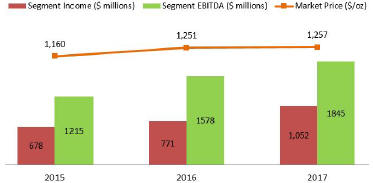
In 2017, gold production was 7% higher than the prior year primarily due to higher grades mined and processed from Cortez Hills open pit (“CHOP”) coupled with higher throughput at the oxide mill as a result ofBest-in-Class process improvements and an increased permit limit. These improvements resulted in the highest annual throughput level ever achieved at the oxide mill. This was partially offset by lower Goldstrike open pit stockpile grades available for processing at the roaster compared to higher stockpile grades in the prior year, fewer Goldstrike underground ounces processed due to a decrease in long-hole stoping and available stopes to mine, and fewer leach tonnes mined and placed in the current year at Cortez. Lower grades at Cortez Hills underground (“CHUG”) as it advances deeper into the mine were partially offset by higher mining rates as a result of digitization initiatives such as short interval control and automation. For 2017, gold sales were higher
| | | | |
BARRICK YEAR-END 2017 | | 50 | | MANAGEMENT’S DISCUSSION AND ANALYSIS |
than production due to a drawdown of work in process inventory in the current year as a result ofBest-in-Class process improvements.
Production
(000s ounces)
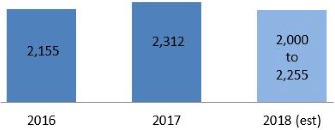
Cost of sales per ounce4 for 2017 was $84 per ounce lower than the prior year primarily due to the impact of higher sales volume on unit production costs combined with higher capitalized waste stripping activity at Crossroads and lower depreciation associated with South Arturo as mining ended in July 2017 and which had a high depreciation per ounce impact due to the short mine life. These decreases in cost of sales per ounce4 were partially offset by lower grades mined and processed from CHUG, Goldstrike underground and Goldstrike open pit, as well as higher autoclave production in the current year, which is the highest cost per tonne processing facility for Barrick Nevada. This was further impacted by inventory write-downs in the prior year which were not experienced in the current year.
All-in sustaining costs1 increased by $6 per ounce from the prior year primarily due to higher minesite sustaining capital expenditures, partially offset by lower direct mining costs combined with a higher sales volume. Lower direct mining costs were mainly due to higher capitalized waste stripping at Crossroads, which is classified as project capital expenditures.
Cost of Sales, Cash Costs1 and AISC1
($ per ounce)

In 2017, capital expenditures increased by 78% from the prior year due to higher minesite sustaining capital combined with higher project expenditures. Higher minesite sustaining capital is attributed to higher capitalized stripping relating to the 3rd and 4th northwest laybacks at the Goldstrike open pit; underground cooling and ventilation project to allow mining below 3,600 feet at the Goldstrike underground; tailings expansions; the
autoclave thiosulfate water treatment plant conversion which significantly improved water balances and the consumption of fresh reagent; the roaster oxygen plant upgrade to increase plant availability; and digitization initiatives to enhance productivity and efficiency. Investment in digitization initiatives resulted in a significant increase in mining rates at CHUG and increased oxide mill performance. Project capital expenditures in 2017 increased compared to the prior year as a result of capitalized stripping and dewatering at Crossroads combined with underground development at Cortez Hills Lower Zone, the range front declines, and Goldrush project drilling. These were partially offset by a decrease inpre-production stripping at the South Arturo pit, which entered commercial production in August 2016.
Outlook
At Barrick Nevada we expect gold production to be in the range of 2,000 to 2,255 thousand ounces, which is lower than 2017 production levels. Lower production is expected at CHOP and CHUG. At Cortez Hills open pit, mining will transition from purely oxide ore to a mix of oxide, refractory, and transitional ores. Grade mined from Cortez Hills underground is expected to be lower as we progress deeper in the mine. This is partially offset by increased throughput at the oxide mill, increased grades at Goldstrike open pit from processing the 3rd northwest layback compared to stockpile processing in the prior year, and higher grades at Goldstrike underground. Throughput initiatives at the autoclave are expected to more than offset lower autoclave recovery as we transition primarily from an all acid blend to an alkaline/acid blend.
In 2018, we expect cost of sales per ounce4 to remain in the range of $760 to $810 per ounce as lower production is offset by lower CHOP depreciation. We expect cash costs1 to be in the range of $470 to $530, which is higher than 2017 due to lower ounces sold. CHUG is expected to exceed its increased mining rates achieved in the fourth quarter of 2017 driven by digital initiatives such as short interval control and automation, and continued transition to bulk mining, which is significantly lowering its overall expected cost per tonne in 2018. This is offset by an increase in Goldstrike open pit’s expected cost per tonne as we mine ore at the bottom of the pit and continue to strip the 4th northwest layback, increased CHOP dewatering costs, and major roaster maintenance plannedmid-2018.All-in sustaining costs1 are expected to remain in the range of $610 to $660 per ounce as lower production is offset by lower sustaining capital expenditures for tailings expansions, process improvements, and Goldstrike underground projects to enable mining deeper in the mine.
| | | | |
BARRICK YEAR-END 2017 | | 51 | | MANAGEMENT’S DISCUSSION AND ANALYSIS |
Pueblo Viejo (60% basis)1, Dominican Republic
| | | | | | | | | | | | | | | | |
Summary of Operating and Financial Data | | | | | | | | For the years ended December 31 | |
| | | 2017 | | | 2016 | | | % Change | | | 2015 | |
Open pit tonnes mined (000s) | | | 23,430 | | | | 23,278 | | | | 1 % | | | | 22,736 | |
Average grade (grams/tonne) | | | | | | | | | | | | | | | | |
Open pit mined | | | 3.07 | | | | 3.13 | | | | (2) % | | | | 3.35 | |
Processed | | | 4.57 | | | | 5.29 | | | | (14) % | | | | 4.94 | |
Autoclave ore tonnes processed (000s) | | | 4,791 | | | | 4,527 | | | | 6 % | | | | 4,150 | |
Gold produced (000s/oz) | | | 650 | | | | 700 | | | | (7) % | | | | 572 | |
Gold sold (000s/oz) | | | 637 | | | | 700 | | | | (9) % | | | | 597 | |
Segment revenue ($ millions) | | | $850 | | | | $925 | | | | (8) % | | | | $757 | |
Cost of sales ($ millions) | | | 445 | | | | 395 | | | | 13 % | | | | 525 | |
Segment income ($ millions) | | | 395 | | | | 528 | | | | (25) % | | | | 230 | |
Segment EBITDA ($ millions)2 | | | 538 | | | | 621 | | | | (13) % | | | | 390 | |
Capital expenditures ($ millions) | | | 69 | | | | 61 | | | | 13 % | | | | 61 | |
Minesite sustaining | | | 69 | | | | 61 | | | | 13 % | | | | 61 | |
Project | | | — | | | | — | | | | — % | | | | — | |
Cost of sales (per oz) | | | 699 | | | | 564 | | | | 24 % | | | | 881 | |
Cash costs (per oz)2 | | | 405 | | | | 395 | | | | 3 % | | | | 467 | |
All-in sustaining costs (per oz)2 | | | 525 | | | | 490 | | | | 7 % | | | | 597 | |
All-in costs (per oz)2 | | | $525 | | | | $490 | | | | 7 % | | | | $597 | |
| | 1 | Pueblo Viejo is accounted for as a subsidiary with a 40%non-controlling interest. The results in the table and the discussion that follows are based on our 60% share only. |
| | 2 | These arenon-GAAP financial performance measures with no standardized meaning under IFRS and therefore may not be comparable to similar measures presented by other issuers. For further information and a detailed reconciliation of eachnon-GAAP measure used in this section of the MD&A to the most directly comparable IFRS measure, please see pages 69 to 84 of this MD&A. |
Financial Results
Pueblo Viejo’s segment income for 2017 was 25% lower than the prior year primarily due to a decrease in sales volumes attributed to lower ore grades combined with higher cost of sales, partially offset by higher gold prices.
Segment Income and Segment EBITDA1
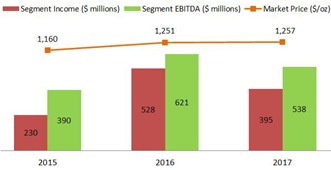
In 2017, gold production was 7% lower than the prior year primarily due to lower ore grades processed in the current year as compared to higher grades processed from the Moore pit in the prior year, partially offset by higher recovery rates. Improvements in carbon management and reagent cyanide addition have improved recoveries compared to the prior year. Higher throughput for 2017 was due to optimization of autoclave operations and fewer descaling shutdowns as a result ofBest-in-Class initiatives.
Production
(000s ounces)
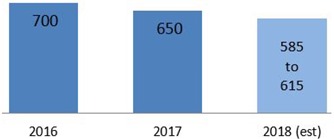
Cost of Sales, Cash Costs1 and AISC1
($ per ounce)
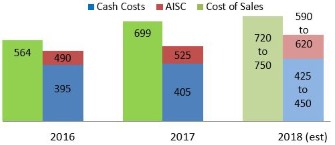
Cost of sales per ounce4 in 2017 was $135 per ounce higher than the prior year primarily due to the impact of lower sales volume on unit production costs combined with higher depreciation expense relating to a tailings storage facility depreciation adjustment and higher fuel prices. 2016 cost of sales per ounce4 was also lower due
| | | | |
BARRICK YEAR-END 2017 | | 52 | | MANAGEMENT’S DISCUSSION AND ANALYSIS |
toone-time insurance proceeds recorded in the third quarter of 2016 relating to the 2015 oxygen plant motor failure. This was partially offset by higher equipment rental costs in the prior year as a result of the oxygen plant motor failure.
In 2017,all-in sustaining costs1 increased by $35 per ounce compared to the prior year due to higher minesite sustaining capital expenditures combined with the higher cost of sales per ounce4.All-in sustaining costs1 were not impacted by the aforementioned insurance proceeds and depreciation adjustment as the insurance benefit was excluded from our calculation and depreciation does not form part ofall-in sustaining costs1.
In 2017, capital expenditures increased by 13% compared to the prior year primarily attributed to the timing of mining equipment replacements, increased capitalization of costs related to the process plant and construction of the Bonao III power substation. This was partially offset by a decrease in capitalized stripping costs as a result of planned mine plan sequencing.
Outlook
At Pueblo Viejo, we expect our equity share of 2018 gold production to be in the range of 585 to 615 thousand ounces, below 2017 production levels, driven by reduced gold head grade, partially offset by increased autoclave throughput resulting from improved maintenance strategies and small-scalepre-oxidation and flotation concentratepre-processing expansions.
In 2018, we expect cost of sales per ounce4 to be in the range of $720 to $750 per ounce, cash costs1 to be $425 to $450 per ounce andall-in-sustaining costs1 to be $590 to $620 per ounce. All three measures are expected to be higher than 2017 primarily due to a reduction in total ounces produced and sold, higher fuel prices and higher sustaining capital expenditures related mainly to increased capitalized waste stripping, tailings dam construction, Quisqueya power station gas conversion and Bonaosub-station construction capital projects. Byproduct credits are expected to be higher than 2017, reflecting increased metal prices, ore grades and recoveries for both silver and copper.
| | | | |
BARRICK YEAR-END 2017 | | 53 | | MANAGEMENT’S DISCUSSION AND ANALYSIS |
Lagunas Norte, Peru
| | | | | | | | | | | | | | | | |
Summary of Operating and Financial Data | | | | | | | | For the years ended December 31 | |
| | | 2017 | | | 2016 | | | % Change | | | 2015 | |
Open pit tonnes mined (000s) | | | 32,859 | | | | 40,847 | | | | (20)% | | | | 49,126 | |
Average grade (grams/tonne) | | | | | | | | | | | | | | | | |
Open pit mined | | | 1.41 | | | | 1.18 | | | | 19% | | | | 1.10 | |
Processed | | | 1.05 | | | | 1.12 | | | | (6)% | | | | 1.02 | |
Heap leach ore tonnes processed (000s) | | | 17,874 | | | | 17,253 | | | | 4% | | | | 21,880 | |
Gold produced (000s/oz) | | | 387 | | | | 435 | | | | (11)% | | | | 560 | |
Gold sold (000s/oz) | | | 397 | | | | 425 | | | | (7)% | | | | 565 | |
Segment revenue ($ millions) | | | $514 | | | | $548 | | | | (6)% | | | | $673 | |
Cost of sales ($ millions) | | | 245 | | | | 276 | | | | (11)% | | | | 378 | |
Segment income ($ millions) | | | 259 | | | | 260 | | | | — % | | | | 285 | |
Segment EBITDA ($ millions)1 | | | 327 | | | | 356 | | | | (8)% | | | | 454 | |
Capital expenditures ($ millions) | | | 25 | | | | 56 | | | | (55)% | | | | 67 | |
Minesite sustaining | | | 20 | | | | 51 | | | | (61)% | | | | 67 | |
Project | | | 5 | | | | 5 | | | | — % | | | | — | |
Cost of sales (per oz) | | | 617 | | | | 651 | | | | (5)% | | | | 669 | |
Cash costs (per oz)1 | | | 405 | | | | 383 | | | | 6 % | | | | 329 | |
All-in sustaining costs (per oz)1 | | | 483 | | | | 529 | | | | (9)% | | | | 509 | |
All-in costs (per oz)1 | | | $497 | | | | $540 | | | | (8)% | | | | $509 | |
| | 1 | These arenon-GAAP financial performance measures with no standardized meaning under IFRS and therefore may not be comparable to similar measures presented by other issuers. For further information and a detailed reconciliation of eachnon-GAAP measure used in this section of the MD&A to the most directly comparable IFRS measure, please see pages 69 to 84 of this MD&A. |
Financial Results
Lagunas Norte’s segment income for 2017 was in line with the prior year primarily due to lower sales volumes, offset by higher realized gold prices1 combined with lower depreciation expense.
Segment Income and Segment EBITDA1
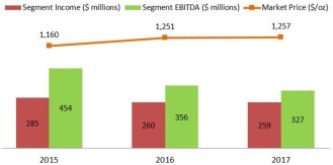
In 2017, gold production was 11% lower than the prior year as a result of processing harder material with lower grades and slower recovery rates combined with a higher percentage of older stock material, in line with expectations as the mine matures. Productivity for 2017 was further impacted by heavy rains causing road closures and power outages early in the year combined with lower efficiency with the loading and hauling equipment.
Production
(000s ounces)
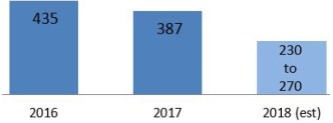
Cost of Sales, Cash Costs1 and AISC1
($ per ounce)
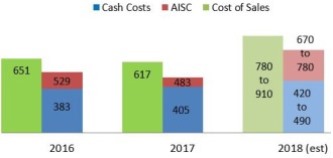
Cost of sales per ounce4 for 2017 was $34 per ounce lower than the prior year mainly due to lower depreciation expense and realized cost savings from theBest-in-Class program, such as initiatives to improve efficiencies in the carbon in column circuit, implementation of short interval control and improvements in planned maintenance. These were partially offset by the impact of lower sales
| | | | |
BARRICK YEAR-END 2017 | | 54 | | MANAGEMENT’S DISCUSSION AND ANALYSIS |
volume and higher direct mining costs, resulting from lower capitalized waste stripping and higher processing costs driven by higher tonnage processed and increased supplies consumption given the treatment of different ore types in the mine plan. In 2017,all-in sustaining costs1decreased by $46 per ounce compared to the prior year primarily due to the decrease in minesite sustaining capital expenditures, partially offset by higher direct mining costs.
In 2017, capital expenditures decreased by 55% compared to the prior year due to lower minesite sustaining capital relating to the construction of phase 6 of the leach pad, which was completed in the prior year period, combined with lower capitalized stripping. Project expenditures relate to ongoing studies for the sequencedlife-of-mine extension which involves the potential construction of a grinding andcarbon-in-leach processing circuit to treat carbonaceous oxides ore which may be expanded later with flotation and pressure oxidation circuits to treat refractory material.
Outlook
At Lagunas Norte we expect 2018 production to be in the range of 230 to 270 thousand ounces, lower than 2017 production levels, as a result of the progressive depletion of oxide ores, which are being replaced with harder ore material with lower kinetics and recoveries.
We expect cost of sales per ounce4 to be in the range of $780 to $910 per ounce. This increase, in comparison with 2017, is mainly driven by the impact of lower gold sales combined with an increase in depreciation expense and higher corporate social responsibility expenses. We expect cash costs1 to be in the range of $420 to $490 per ounce andall-in sustaining costs1 to be in the range of $670 to $780 per ounce. The increase inall-in sustaining costs1 in comparison with 2017 is driven mainly by the decrease in production and increase in sustaining capital expenditures in 2018. Operational costs are expected to decrease aligned to the reduced mine production plan compared to 2017.Best-in-Class operational initiatives for 2018 will be focused on getting gold ounces from injection wells and slag processing.
| | | | |
BARRICK YEAR-END 2017 | | 55 | | MANAGEMENT’S DISCUSSION AND ANALYSIS |
Veladero, Argentina1
| | | | | | | | | | | | | | | | |
Summary of Operating and Financial Data | | | | | | | | For the years ended December 31 | |
| | | 2017 | | | 2016 | | | % Change | | | 2015 | |
Open pit tonnes mined (000s) | | | 48,376 | | | | 62,227 | | | | (22)% | | | | 83,409 | |
Average grade (grams/tonne) | | | | | | | | | | | | | | | | |
Open pit mined | | | 1.00 | | | | 0.82 | | | | 22 % | | | | 0.81 | |
Processed | | | 1.02 | | | | 0.82 | | | | 24 % | | | | 0.82 | |
Heap leach ore tonnes processed (000s) | | | 21,190 | | | | 28,028 | | | | (24)% | | | | 28,385 | |
Gold produced (000s/oz) | | | 432 | | | | 544 | | | | (21)% | | | | 602 | |
Gold sold (000s/oz) | | | 458 | | | | 532 | | | | (14)% | | | | 629 | |
Segment revenue ($ millions) | | | $591 | | | | $685 | | | | (14)% | | | | $720 | |
Cost of sales ($ millions) | | | 410 | | | | 464 | | | | (12)% | | | | 499 | |
Segment income ($ millions) | | | 173 | | | | 220 | | | | (21)% | | | | 216 | |
Segment EBITDA ($ millions)2 | | | 292 | | | | 338 | | | | (14)% | | | | 324 | |
Capital expenditures ($ millions) | | | 173 | | | | 95 | | | | 82 % | | | | 242 | |
Minesite sustaining | | | 173 | | | | 95 | | | | 82 % | | | | 242 | |
Project | | | — | | | | — | | | | — % | | | | — | |
Cost of sales (per oz) | | | 897 | | | | 872 | | | | 3 % | | | | 792 | |
Cash costs (per oz)2 | | | 598 | | | | 582 | | | | 3 % | | | | 552 | |
All-in sustaining costs (per oz)2 | | | 987 | | | | 769 | | | | 28 % | | | | 946 | |
All-in costs (per oz)2 | | | $987 | | | | $769 | | | | 28 % | | | | $946 | |
| | 1 | We sold 50% of Veladero on June 30, 2017; therefore these represent results on a 100% basis from January 1 to June 30, 2017 and on a 50% basis from July 1, 2017 onwards. |
| | 2 | These arenon-GAAP financial performance measures with no standardized meaning under IFRS and therefore may not be comparable to similar measures presented by other issuers. For further information and a detailed reconciliation of eachnon-GAAP measure used in this section of the MD&A to the most directly comparable IFRS measure, please see pages 69 to 84 of this MD&A. |
Financial Results
Veladero’s segment income for 2017 was 21% lower than the prior year primarily due to the impact of the divestment of 50% of the Veladero mine as at June 30, 2017, partly offset by higher realized gold prices1. This was further impacted by an increase in depreciation expense as a result of the fair value increments applied to our remaining 50% interest, which was required to be fair valued because of the change in control.
Segment Income and Segment EBITDA1
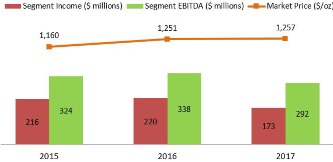
In 2017, gold production was 21% lower compared to the prior year due to the divestment of 50% of the mine as at June 30, 2017. Excluding the impact of the divestment, gold production increased 18% in the current year primarily as a result of higher grades processed combined with higher tonnes placed on the leach pad, partially offset by lower recovery reflecting the impact of the temporary restriction due to the March 28,
2017 incident with the leach pumping system. The prior year was negatively impacted by the temporary suspension of operations late in the third quarter of 2016 combined with severe weather conditions.
Production
(000s ounces)
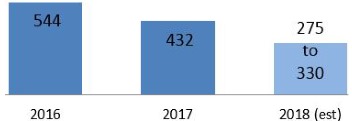
Cost of sales per ounce4 in 2017 was $25 per ounce higher than the prior year primarily due to the impact of higher direct mining costs combined with higher depreciation expense as a result of the impact of the fair value increments relating to the revaluation of our remaining 50% of the Veladero mine, partially offset by a lack of depreciation in the second quarter of 2017 as Veladero was classified asheld-for-sale pending the close of the sale on June 30, 2017. The increase in direct mining costs primarily related to consulting services, camp costs, mining costs due to additional fleet, maintenance and labor and contractors due to the impact of inflation in Argentina. These increases were partially offset by higher
| | | | |
BARRICK YEAR-END 2017 | | 56 | | MANAGEMENT’S DISCUSSION AND ANALYSIS |
capitalized waste stripping costs in the current year as there was no capitalized waste stripping in the third quarter of 2016 as a result of severe weather conditions. In 2017,all-in sustaining costs1 increased by $218 per ounce compared to the prior year primarily due to an increase in minesite sustaining capital expenditures combined with an increase in cost of sales per ounce4.
Cost of Sales, Cash Costs1 and AISC1
($ per ounce)
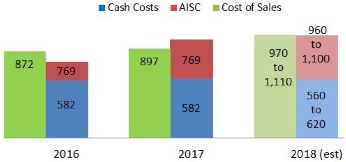
In 2017, capital expenditures increased by 82% compared to the prior year primarily due to higher minesite sustaining capital expenditures relating to the construction of phases 4B and 5B of the leach pad expansion, leach pad improvements and equipment purchases combined with higher capitalized stripping costs.
On April 6, 2017, we announced the sale to Shandong Gold of a 50% interest in the Veladero mine, which reflects the first step in our strategic partnership with Shandong. The transaction closed on June 30, 2017 and we received total cash consideration of $990 million, which reflected working capital adjustments of $30 million in the fourth quarter of 2017. Refer to note 4 to the Financial Statements for more information.
On December 30, 2016, the San Juan provincial mining authority approved the fifth update to the Veladero mine’s environmental impact study (“EIS”), which as submitted by the Company had included a request for approval of the leach pad expansion for Phases 6 to 9. Environmental approval for Phases 6 to 9 of the leach pad expansion was confirmed on May 19, 2017 by the San Juan Mining Minister.
March 2017 Release of Gold-bearing Process Solution
On March 28, 2017, the monitoring system at the Company’s Veladero mine detected a rupture of a pipe carrying gold-bearing process solution on the leach pad. This solution was contained within the operating site; no solution reached any diversion channels or watercourses. All affected soil was promptly excavated and placed on the leach pad. The Company notified regulatory authorities of the situation, and San Juan provincial authorities inspected the site on March 29, 2017.
On March 29, 2017, the San Juan provincial mining authority issued a violation notice against Minera Argentina Gold SRL (“MAG”) (formerly, Minera Argentina Gold S.A. or MAGSA) in connection with the incident and ordered a temporary restriction on the addition of new cyanide to the leach pad until corrective actions on the system were completed. The mining authority lifted the suspension on June 15, 2017, following inspection of corrective actions.
On March 30, 2017, the San Juan Mining Minister ordered the commencement of a regulatory infringement proceeding against MAG as well as a comprehensive evaluation of the mine’s operations to be conducted by representatives of the Company and the San Juan provincial authorities. The Company filed its defense to the regulatory infringement proceeding on April 5, 2017. On September 14, 2017, the San Juan Provincial mining authority consolidated this administrative proceeding into a single proceeding against MAG encompassing both the September 2016 incident and the March 2017 incident. On October 10, 2017, the San Juan Provincial mining authority notified MAG of two charges under the infringement proceeding for alleged violations of the Mining Code in connection with the March 2017 incident.
On December 27, 2017, MAG received notice of a resolution from the San Juan Provincial mining authority requiring payment of an administrative fine of approximately $5.6 million (calculated at the prevailing exchange rate on December 31, 2017) encompassing both the September 2016 incident and the March 2017 incident. On January 23, 2018, in accordance with local requirements, MAG paid the administrative fine and filed a request for reconsideration with the San Juan Provincial mining authority, which remains pending. Refer to note 36 to the Financial Statements for more information regarding this matter.
ProvincialAmparoAction
On March 30, 2017, MAG was served notice of a lawsuit, called an “amparo” protection action, filed in the Jachal First Instance Court (the “Jachal Court”) by individuals who claimed to be living in Jachal, Argentina, seeking the cessation of all activities at the Veladero mine. The plaintiffs sought an injunction as part of the lawsuit, requesting, among other things, the cessation of all activities at the Veladero mine or, alternatively, a suspension of the leaching process at the mine. On March 30, 2017, the Jachal Court rejected the request for an injunction to cease all activities at the Veladero mine, but ordered, among other things, the suspension of the leaching process at the Veladero mine and for MAG and the San Juan Provincial mining authority to provide additional information to the Jachal Court in connection with the incident.
The Company filed a defense to the provincialamparoaction on April 7, 2017. The Jachal Court lifted the
| | | | |
BARRICK YEAR-END 2017 | | 57 | | MANAGEMENT’S DISCUSSION AND ANALYSIS |
suspension on June 15, 2017, after the San Juan Provincial mining authority provided the required information and a hydraulic assessment of the leach pad and process plant was implemented. Further developments in this case are pending a decision by the Argentine Supreme Court as to whether the Federal Court or Provincial Court has jurisdiction to assess the merits of theamparo remedy. Refer to note 36 to the Financial Statements for more information regarding this matter.
Federal Amparo Action
On April 4, 2017, the National Minister of Environment of Argentina filed a lawsuit in the Buenos Aires federal court (the “Federal Court”) in connection with the March 2017 incident. Theamparo protection action sought a court order requiring the cessation and/or suspension of activities at the Veladero mine. MAG submitted extensive information to the Federal Court about the incident, the then-existing administrative and provincial judicial suspensions, the remedial actions taken by the Company and the lifting of the suspensions as described above. MAG also challenged the jurisdiction of the Federal Court and the standing of the National Minister of Environment of Argentina and requested that the matter be remanded to the Jachal Court. The Province of San Juan also challenged the jurisdiction of the Federal Court in this matter. On June 23, 2017, the Federal Court decided that it was competent to hear the case, and referred the case to the Court of Appeals to determine whether the Federal Court or Provincial Court in the case described above has the authority to assess the merits of theamparo remedy. On July 5, 2017, the Provincial Court issued a request for the Supreme Court of Argentina to resolve the jurisdictional dispute. On July 30, 2017, the Court of Appeals referred the jurisdictional dispute to the Supreme Court and a decision on the matter is pending. Refer to note 36 to the Financial Statements for more information regarding this matter.
Veladero experienced operational incidents in 2015 and 2016 which also resulted in regulatory and legal proceedings as summarized below.
September 2015 Release of Cyanide-bearing Process Solution
On March 11, 2016, the San Juan Provincial mining authority announced its intention to impose an administrative fine against MAG in connection with the solution release. MAG was formally notified of this decision on March 15, 2016. On April 6, 2016, MAG sought reconsideration of certain aspects of the decision but did not challenge the amount of the administrative fine. On April 14, 2016, in accordance with local requirements, MAG paid the administrative fine of approximately $10 million (at the then-applicable Argentinean peso/$ exchange rate) while the request for reconsideration was pending. On December 29, 2016, the request for reconsideration was rejected by the Provincial mining authority. On July 11, 2017, the San
Juan government rejected MAG’s final administrative appeal of this decision. On September 5, 2017, the Company commenced a legal action to continue challenging certain aspects of the decision before the San Juan courts. MAG has implemented a remedial action plan at Veladero in response to the incident as required by the San Juan mining authority. Refer to note 36 to the Financial Statements for more information regarding this matter.
September 2016 Release of Crushed Ore Saturated with Process Solution
Temporary Suspension of Operations and Regulatory Infringement Proceeding
On September 8, 2016, ice rolling down the slope of the leach pad at the Veladero mine damaged a pipe carrying process solution, causing some material to leave the leach pad. This material, primarily crushed ore saturated with process solution, was contained on the mine site and returned to the leach pad. Extensive water monitoring in the area conducted by MAG has confirmed that the incident did not result in any environmental impacts. A temporary suspension of operations at the Veladero mine was ordered by the San Juan Provincial mining authority and a San Juan Provincial court on September 15, 2016 and September 22, 2016, respectively, as a result of this incident. On October 4, 2016, following, among other matters, the completion of certain urgent works required by the San Juan Provincial mining authority and a judicial inspection of the mine, the San Juan Provincial court lifted the suspension of operations and ordered that mining activities be resumed.
On September 14, 2016, the San Juan Provincial mining authority commenced an administrative proceeding in connection with this incident that included, in addition to the issue of the suspension order, an infringement proceeding against MAG. On December 2, 2016, the San Juan Provincial mining authority notified MAG of two charges under the infringement proceeding for alleged violations of the Mining Code. A new criminal judicial investigation has also been commenced by the Provincial prosecutor’s office in the same San Juan Provincial court that is hearing the Provincial Action. The court in this proceeding issued the orders suspending and resuming the operations at the Veladero mine described above.
On September 14, 2017, the San Juan Provincial mining authority consolidated the administrative proceeding into a single proceeding against MAG encompassing both the September 2016 incident and the March 2017 incident.
On December 27, 2017, MAG received notice of a resolution from the San Juan Provincial mining authority requiring payment of an administrative fine of approximately $5.6 million (calculated at the prevailing exchange rate on December 31, 2017) encompassing both the September 2016 incident and the March 2017 incident. On January 23, 2018, in accordance with local
| | | | |
BARRICK YEAR-END 2017 | | 58 | | MANAGEMENT’S DISCUSSION AND ANALYSIS |
requirements, MAG paid the administrative fine and filed a request for reconsideration with the San Juan Provincial mining authority, which remains pending. Refer to note 36 to the Financial Statements for more information regarding this matter.
Cyanide Leaching Process – Civil Action
On December 15, 2016, MAG was served notice of a lawsuit by certain persons who claim to be living in Jachal, Argentina and to be affected by the Veladero mine and, in particular, the valley leach facility (“VLF”). In the lawsuit, which was filed in the San Juan Provincial court, the plaintiffs have requested a court order that MAG cease leaching metals with cyanide solutions, mercury and other similar substances at the Veladero mine and replace that process with one that is free of hazardous substances, that MAG implement a closure and remediation plan for the VLF and surrounding areas, and create a committee to monitor this process. The lawsuit is proceeding as an ordinary civil action. MAG replied to the lawsuit on February 20, 2017. On March 31, 2017, the plaintiffs supplemented their original complaint to allege that the risk of environmental damage had increased as a result of the March 28, 2017 release of gold-bearing process solution incident described above. The Company responded to the new allegations and intends to continue defending this matter vigorously. Refer to note 36 to the Financial Statements for more information regarding this matter.
Outlook
At Veladero we expect 2018 production to be in the range of 275 to 330 thousand ounces (Barrick’s share), lower than 2017 production levels. The decrease is a result of the divestment of 50% of the Veladero mine as at June 30, 2017. This is combined with slightly lower ore grade to the leach pad in 2018, offset by ongoing soluble inventory drawdown with improved solution management.
Cost of sales per ounce4 is expected to be in the range of $970 to $1,110 per ounce which is higher than 2017, mainly due to higher depreciation expense reflecting the effect of the fair value increments applied to our remaining 50% interest. We expect cash costs1 in 2018 to be in the range of $560 to $620 per ounce, lower than 2017 levels mainly due to lower direct operating costs, partly offset by the impact of higher charges from the production inventory movements.All-in sustaining costs1are expected to be between $960 and $1,100 per ounce, aligned with 2017 as lower cash costs1 are offset by higher capitalized waste stripping. Operating costs at Veladero are also highly sensitive to local inflation and fluctuations in foreign exchange rates. We have assumed an average ARS:USD exchange rate of ARS18.3: $1.00 and a local inflation rate of 15% for the purposes of preparing our cash costs1 andall-in sustaining costs1 guidance for 2018.
| | | | |
BARRICK YEAR-END 2017 | | 59 | | MANAGEMENT’S DISCUSSION AND ANALYSIS |
Turquoise Ridge (75% basis), Nevada USA
| | | | | | | | | | | | | | | | |
Summary of Operating and Financial Data | | | | | | | | For the years ended December 31 | |
| | | 2017 | | | 2016 | | | % Change | | | 2015 |
Underground tonnes mined (000s) | | | 643 | | | | 598 | | | | 8 % | | | | 349 | |
Average grade (grams/tonne) | | | | | | | | | | | | | | | | |
Underground mined | | | 15.45 | | | | 16.85 | | | | (8)% | | | | 18.34 | |
Gold produced (000s/oz) | | | 211 | | | | 266 | | | | (21)% | | | | 217 | |
Gold sold (000s/oz) | | | 222 | | | | 257 | | | | (14)% | | | | 202 | |
Segment revenue ($ millions) | | | $280 | | | | $322 | | | | (13)% | | | | $235 | |
Cost of sales ($ millions) | | | 159 | | | | 155 | | | | 3 % | | | | 141 | |
Segment income ($ millions) | | | 119 | | | | 166 | | | | (28)% | | | | 92 | |
Segment EBITDA ($ millions)1 | | | 147 | | | | 193 | | | | (24)% | | | | 115 | |
Capital expenditures ($ millions) | | | 36 | | | | 32 | | | | 13 % | | | | 32 | |
Minesite sustaining | | | 32 | | | | 32 | | | | — % | | | | 32 | |
Project | | | 4 | | | | — | | | | 100 % | | | | — | |
Cost of sales (per oz) | | | 715 | | | | 603 | | | | 19 % | | | | 697 | |
Cash costs (per oz)1 | | | 589 | | | | 498 | | | | 18 % | | | | 581 | |
All-in sustaining costs (per oz)1 | | | 733 | | | | 625 | | | | 17 % | | | | 742 | |
All-in costs (per oz)1 | | | $753 | | | | $625 | | | | 20 % | | | | $742 | |
| | 1 | These arenon-GAAP financial performance measures with no standardized meaning under IFRS and therefore may not be comparable to similar measures presented by other issuers. For further information and a detailed reconciliation of eachnon-GAAP measure used in this section of the MD&A to the most directly comparable IFRS measure, please see pages 69 to 84 of this MD&A. |
Financial Results
Turquoise Ridge’s segment income for 2017 was 28% lower than the prior year primarily due to a decrease in sales volume combined with higher cost of sales, partially offset by higher realized gold prices1.
Segment Income and Segment EBITDA1
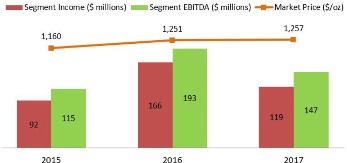
In 2017, gold production was 21% lower than the prior year primarily due to lower grades combined with issues related to higher organic carbon content and the subsequent decision to process 17 thousand ounces at Barrick Nevada, which was recognized as Barrick Nevada production. Lower grades in the current year were due to the planned mining of the south zone to control organic carbon content in the ore. This was partially offset by higher tonnes mined resulting fromBest-in-Class initiatives driving increased equipment availability combined with improved mine engineering to take advantage of the larger ore geometry. These activities resulted in a 22% increase in tonnes mined per employee from the prior year.
Production
(000s ounces)
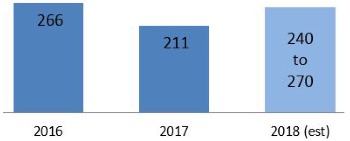
Cost of sales per ounce4in 2017 was $112 per ounce higher than the prior year mainly reflecting the impact of lower sales volume on unit production costs combined with higher processing costs associated with processing lower grade ore and higher organic carbon content ore. In 2017,all-in sustaining costs1 increased by $108 per ounce compared to the prior year primarily reflecting the impact of higher cost of sales per ounce4.
Cost of Sales, Cash Costs1 and AISC1
($ per ounce)
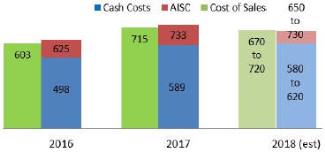
| | | | |
BARRICK YEAR-END 2017 | | 60 | | MANAGEMENT’S DISCUSSION AND ANALYSIS |
In 2017, capital expenditures increased by 13% compared to the prior year as a result of higher project capital expenditures relating to the construction of the third shaft. Minesite sustaining capital expenditures were in line with the prior year as higher expenditures relating to the timing of spending combined with the construction of the water treatment plant, were offset by lower capitalized underground development costs.
Outlook
At Turquoise Ridge we expect 2018 production to be in the range of 240 to 270 thousand ounces (Barrick’s share), exceeding 2017 production levels, as mine productivity continues to improve. Turquoise Ridge has completely transitioned to standardized equipment allowing for greater mining flexibility, increased reliability, and a reduced truck fleet and we continue to incorporate mechanical cutting as a mining method and short interval control. Capital and waste development requirements are in line with 2017 mining rates.
The cost of sales per ounce4 is expected to be in the range of $670 to $720 per ounce which is in line with 2017. We expect cash costs1 in 2018 to be in the range of $580 to $620 per ounce, consistent with 2017, andall-in sustaining costs1 to be in the range of $650 to $730 per ounce.All-in sustaining costs1 in 2018 are expected to be lower than 2017 due to a reduction in sustaining capital as the construction of the third shaft is included in project capital.
In February 2018, Barrick and Newmont Mining Corporation (“Newmont”) reached a new, seven-year toll milling agreement for the processing of Turquoise Ridge ore at Newmont’s Twin Creeks facility. The agreement supports plans to expand production and unlock the full potential of Turquoise Ridge by increasing processing capacity. It provides for throughput of 850,000 tons per year in 2018 and 2019, rising to 1.2 million tons per year between 2020 and 2024. Processing costs are in line with market rates, and are reflected in our guidance for Turquoise Ridge.
| | | | |
BARRICK YEAR-END 2017 | | 61 | | MANAGEMENT’S DISCUSSION AND ANALYSIS |
Acacia Mining plc (100% basis), Africa
| | | | | | | | | | | | | | | | |
| Summary of Operating and Financial Data | | | | | | | | For the years ended December 31 | |
| | | 2017 | | | 2016 | | | % Change | | | 2015 | |
Total tonnes mined (000s) | | | 31,917 | | | | 38,491 | | | | (17)% | | | | 41,390 | |
Open pit | | | 30,666 | | | | 37,141 | | | | (17)% | | | | 40,099 | |
Underground | | | 1,251 | | | | 1,350 | | | | (7)% | | | | 1,291 | |
Average grade (grams/tonne) | | | | | | | | | | | | | | | | |
Open pit mined | | | 1.45 | | | | 1.48 | | | | (2)% | | | | 1.65 | |
Underground mined | | | 8.32 | | | | 9.62 | | | | (14)% | | | | 9.02 | |
Processed1 | | | 3.00 | | | | 3.00 | | | | — % | | | | 2.80 | |
Ore tonnes processed (000s) | | | 8,719 | | | | 9,818 | | | | (11)% | | | | 9,268 | |
Gold produced (000s/oz) | | | 768 | | | | 830 | | | | (7)% | | | | 732 | |
Gold sold (000s/oz) | | | 593 | | | | 817 | | | | (27)% | | | | 721 | |
Segment revenue ($ millions) | | | $751 | | | | $1,045 | | | | (28)% | | | | $860 | |
Cost of sales ($ millions) | | | 469 | | | | 719 | | | | (35)% | | | | 837 | |
Segment income ($ millions) | | | 191 | | | | 299 | | | | (36)% | | | | (1) | |
Segment EBITDA ($ millions)2 | | | 298 | | | | 465 | | | | (36)% | | | | 142 | |
Capital expenditures ($ millions) | | | 148 | | | | 191 | | | | (23)% | | | | 177 | |
Minesite sustaining | | | 137 | | | | 190 | | | | (28)% | | | | 178 | |
Project | | | 11 | | | | 1 | | | | (1,000)% | | | | (1) | |
Cost of sales (per oz) | | | 791 | | | | 880 | | | | (10)% | | | | 1,161 | |
Cash costs (per oz)2 | | | 587 | | | | 640 | | | | (8)% | | | | 772 | |
All-in sustaining costs (per oz)2 | | | 875 | | | | 958 | | | | (9)% | | | | 1,112 | |
All-in costs (per oz)2 | | | $894 | | | | $960 | | | | (7)% | | | | $1,111 | |
| | 1 | Includes processing of tailings retreatment. |
| | 2 | These arenon-GAAP financial performance measures with no standardized meaning under IFRS and therefore may not be comparable to similar measures presented by other issuers. For further information and a detailed reconciliation of eachnon-GAAP measure used in this section of the MD&A to the most directly comparable IFRS measure, please see pages 69 to 84 of this MD&A. |
Barrick holds a 63.9 percent equity interest in Acacia Mining plc, a publicly traded company listed on the London Stock Exchange that is operated independently of Barrick.
Financial Results
Acacia’s segment income for 2017 was 36% lower than the prior year primarily due to lower sales volume as a result of the concentrate export ban, affecting sales from Bulyanhulu and Buzwagi combined with higher costs related to the Bulyanhulu reduced operations, partially offset by higher realized gold prices1 and lower cost of sales.
Segment Income and Segment EBITDA1
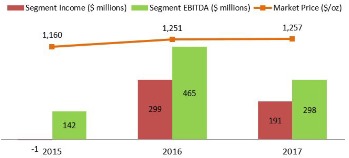
In 2017, gold production was 7% lower than the prior year primarily caused by a decrease at Bulyanhulu due to the decision to transition to reduced operations in the third quarter of 2017 and droughts experienced in the Kahama district combined with lower production from North Mara as a result of lower grades at the Gokona underground mine and Nyabirama pit. These were partially offset by an increase at Buzwagi as a result of higher grade ore from the main ore zone at the bottom of the open pit and higher ore tonnes mined. Gold ounces sold were lower than ounces produced primarily as a result of the ban on concentrate exports, as described below.
Production (100%)
(000s ounces)
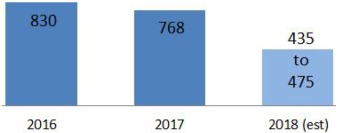
Cost of sales per ounce4 in 2017 was 10% lower than the prior year primarily reflecting the impact of the
| | | | |
BARRICK YEAR-END 2017 | | 62 | | MANAGEMENT’S DISCUSSION AND ANALYSIS |
buildup in inventory due to the ban on concentrate exports combined with lower depreciation expense. These decreases were partially offset by lower capitalized underground development costs at Bulyanhulu and lower waste stripping at North Mara’s Nyabirama pit combined with the impact of lower sales volume on unit production costs.All-in sustaining costs1 were 9% lower than the prior year due to lower cost of sales per ounce4 combined with lower stock-based compensation expense and a decrease in minesite sustaining capital expenditures.
Cost of Sales, Cash Costs1 and AISC1
($ per ounce)
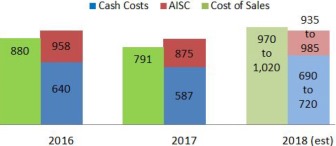
In 2017, capital expenditures decreased by 23% compared to the prior year due mostly to a reduction in minesite sustaining capital expenditures primarily at Bulyanhulu attributed to reduced operations combined with lower capitalized waste stripping at North Mara relating to Nyabirama Stage 4. This was partially offset by an increase in project capital expenditures mainly relating to capitalized drilling at North Mara’s Gokona underground.
Concentrate Export Ban and Related Disputes with the Government of Tanzania
On March 3, 2017, the Tanzanian Government announced a general ban on the export of metallic mineral concentrates (“Ban”) following a directive made by the President to promote the creation of a domestic smelting industry. Following the directive, Acacia ceased all exports of its gold/copper concentrate (“concentrate”) including containers previously approved for export prior to the ban which are located in Dar es Salaam.
The prevention of exports impacts Bulyanhulu and Buzwagi which produce gold in both doré and in concentrate form due to the mineralogy of the ore. North Mara is unaffected due to 100% of its production being doré. Since the export ban was imposed, impacting approximately 25% of 2017 production, Acacia has seen a buildup of approximately $264 million of concentrate inventory in Tanzania, based on current prices, with approximately 186 thousand ounces of gold, 12.1 million pounds of copper and 159 thousand ounces of silver contained in the unsold concentrate. As a result of the transition to a reduced operations program at Bulyanhulu, and the changes to the process flowsheet at Buzwagi, all of Acacia’s mines are now solely producing
doré and, as such, will no longer see a further buildup of concentrate.
During the second quarter of 2017, investigations were conducted on behalf of the Tanzanian Government by two Tanzanian Government Presidential Committees, which have resulted in allegations of historical undeclared revenue and unpaid taxes being made against Acacia and its predecessor companies. Acacia considers these findings to be implausible and has fully refuted the findings of both Presidential Committees. Acacia has requested copies of the reports issued by the two Presidential Committees and called for independent verification of the findings, but has not yet received a response to these requests.
On July 4, 2017, Acacia’s subsidiaries, Bulyanhulu Gold Mine Limited (“BGML”), the owner of the Bulyanhulu mine, and Pangea Minerals Limited (“PML”), the owner of the Buzwagi mine, each commenced international arbitrations against the Government of Tanzania in accordance with the dispute resolution processes agreed by the Government of Tanzania in the Mineral Development Agreements (“MDAs”) with BGML and PML. These arbitrations remain ongoing.
In July 2017, Acacia received adjusted assessments for the tax years 2000-2017 from the Tanzania Revenue Authority (the “TRA”) for a total amount of approximately $190 billion for alleged unpaid taxes, interest and penalties, apparently issued in respect of alleged and disputed under-declared export revenues, and appearing to follow on from the announced findings of the First and Second Presidential Committees. These assessments are being disputed and the underlying allegations are included in the matters that have been referred to international arbitration.
In addition, following the end of the third quarter, Acacia was served with notices of conflicting adjusted corporate income tax and withholding tax assessments for tax years 2005 to 2011 with respect to Acacia’s former Tulawaka joint venture, and demands for payment, for a total amount of approximately $3 billion. Interest and penalties represent the vast majority of the new assessments. The TRA has not provided Acacia with any explanations or reasons for the adjusted assessments, or with the TRA’s position on how the assessments have been calculated or why they have been issued. Acacia disputes these assessments and has requested supporting calculations, which have not yet been received. Acacia is objecting to these assessments and defending this matter through the Tanzanian tax appeals process.
In addition to the Ban, new and amended legislation was passed in Tanzania in early July 2017, including various amendments to the 2010 Mining Act and a new Finance Act. The amendments to the 2010 Mining Act increased the royalty rate applicable to metallic minerals such as
| | | | |
BARRICK YEAR-END 2017 | | 63 | | MANAGEMENT’S DISCUSSION AND ANALYSIS |
gold, copper and silver to 6% (from 4%), and the new Finance Act imposes a 1% clearing fee on the value of all minerals exported from Tanzania from July 1, 2017. In January 2018, new Mining Regulations were announced by the Tanzanian Government introducing, among other things, local content requirements, export regulations and mineral rights regulations, the scope and effect of which remain under review by Acacia. Acacia continues to monitor the impact of all new legislation in light of its MDAs with the Government of Tanzania. However, to minimize further disruptions to its operations Acacia will, in the interim, satisfy the requirements imposed as regards the increased royalty rate in addition to the recently imposed 1% clearing fee on exports. Acacia is making these payments under protest, without prejudice to its legal rights under its MDAs.
Acacia has been looking to address all issues in respect of the Ban along with other ongoing disputes through dialogue with the Tanzanian Government. Acacia remains of the view that a negotiated resolution is the preferable outcome to the current disputes and Acacia will continue to work to achieve this. During the third quarter of 2017, Barrick and the Government of Tanzania engaged in discussions for the potential resolution of the disputes. Acacia did not participate directly in these discussions as the Government of Tanzania had informed Barrick that it wished to continue dialogue solely with Barrick.
On October 19, 2017, Barrick announced that it had agreed with the Government of Tanzania on a proposed framework for a new partnership between Acacia and the Government of Tanzania. Barrick and the Government of Tanzania also agreed to form a working group that will focus on the resolution of outstanding tax claims against Acacia. Key terms of the proposed framework announced by Barrick and the Government of Tanzania include (i) the creation of a new Tanzanian company to manage Acacia’s Bulyanhulu, Buzwagi and North Mara mines and all future operations in the country with key officers located in Tanzania and Tanzanian representation on the board of directors; (ii) maximization
of local employment of Tanzanians and procurement of goods and services within Tanzania; (iii) economic benefits from Bulyanhulu, Buzwagi and North Mara to be shared on a 50/50 basis, with the Government’s share delivered in the form of royalties, taxes and a 16% free carry interest in Acacia’s Tanzanian operations; and (iv) in support of the working group’s ongoing efforts to resolve outstanding tax claims, Acacia would make a payment of $300 million to the Government of Tanzania, staged over time, on terms to be settled by the working group. Barrick and the Government of Tanzania are also reviewing the conditions for the lifting of the Ban. Negotiations concerning the proposed framework remain ongoing and the definitive terms of any final proposal for the implementation of the framework remain outstanding. Barrick is targeting completion of discussions aimed at agreeing to and documenting the details of the announced framework by the first half of 2018. Such terms would be subject to review and approval by Acacia.
Outlook
Acacia successfully managed through a challenging environment to deliver a year of resilient performance in 2017. As a result of Bulyanhulu’s transition to reduced operations and the planned transition of Buzwagi to a stockpile processing operation in 2018, we expect to see a decrease in production from 2017 levels to 275 to 305 thousand ounces (Barrick’s share).
We expect cost of sales per ounce4 to be in the range of $970 to $1,020 per ounce, cash costs1 of $690 to $720 per ounce andall-in sustaining costs1 of $935 to $985 per ounce. The increase in all three measures from 2017 is mainly due to the negative impact of approximately $50 per ounce due to increased inventory costs at Buzwagi as Acacia processes ore stockpiles previously classified as ore inventory. We expect production to be broadly stable through the year, although due to the roll-over of cost from the movement to reduced operations in the first quarter of 2018, we expect increased cash flow in the second half of the year. All gold produced in 2018 is expected to be in doré form.
| | | | |
BARRICK YEAR-END 2017 | | 64 | | MANAGEMENT’S DISCUSSION AND ANALYSIS |
Pascua-Lama, Argentina/Chile
The Pascua-Lama project, located on the border between Chile and Argentina, contains 21.3 million ounces of measured and indicated gold resources.
As described below, in January 2018 we received a resolution of closure of existing infrastructure on the Chilean side of the Pascua-Lama project from Chile’s environmental regulator (the Superintendencia del Medio Ambiente, or “SMA”). The resolution does not affect the Company’s ongoing evaluation of an underground, block-caving operation at Pascua-Lama, which would require additional permitting and regulatory approvals in both Argentina and Chile, unconnected to the recent SMA decision. In any underground scenario, Barrick would also close site facilities and surface disturbance in Chile not necessary for an underground mine. As a result, we have increased our provision for environmental remediation at Pascua-Lama by $644 million in the fourth quarter of 2017.
In light of the order to close surface facilities in Chile, and current plans to evaluate an underground mine, Barrick is reclassifying Pascua-Lama’s proven and probable gold reserves of approximately 14 million ounces6, which are based on an open pit mine plan, as measured and indicated resources. As a result, we have recorded an impairment of $429 million at Pascua-Lama in the fourth quarter of 2017.
We have formed a working group with Shandong Gold to study a potential partnership at Pascua-Lama, building on our existing joint venture at the nearby Veladero mine. Our Investment Committee will continue to scrutinize the project as it advances, applying a high degree of consistency and rigor — as we do for all capital allocation decisions at the Company — before further review by the Executive Committee and the Board at each stage of advancement.
SMA Regulatory Sanctions
On June 8, 2016, the SMA consolidated the two administrative proceedings against Compańía Minera Nevada (“CMN”) into a single proceeding encompassing both the reconsideration of the original resolution issued by the SMA in May 2013 in accordance with the decision of the Environmental Court and the alleged deviations from the Project’s environmental approval notified by the SMA in April 2015.
On January 17, 2018, CMN received the revised resolution (the “Revised Resolution”) from the SMA, in which the environmental regulator reduced the original administrative fine from approximately $16 million to $11.5 million and ordered the closure of existing surface facilities on the Chilean side of the Project in addition to certain monitoring activities. The Revised Resolution does not revoke the Project’s environmental approval. CMN filed an appeal of the Revised Resolution on February 3,
2018. Refer to note 36 to the Financial Statements for more information regarding this matter.
Constitutional Protection Action
On August 12, 2016, the court ruled in favor of CMN and Sernageomin, rejecting the plaintiffs’ challenges to the Temporary Closure Plan for the Pascua-Lama project. The plaintiffs appealed the court’s decision to the Chilean Supreme Court and on March 13, 2017, the Supreme Court vacated the Temporary Closure Plan, ruling that additional information regarding the SMA regulatory sanction process was required from the environmental regulator, and ordering Sernageomin to issue a new resolution on the Temporary Closure Plan after receiving such information. On August 29, 2017, Sernageomin issued a new resolution in which it reapproved the Temporary Closure Plan as originally issued. This approval is valid through September 2019. Refer to note 36 to the Financial Statements for more information regarding this matter.
Water Quality Review
CMN initiated a review of the baseline water quality of the Rio Estrecho in August 2013 as required by a July 15, 2013 decision of the Court of Appeals of Copiapo, Chile. The purpose of the review was to establish whether the water quality baseline has changed since the Pascua-Lama project received its environmental approval in February 2006 and, if so, to require CMN to adopt the appropriate corrective measures. As a result of that study, CMN requested certain modifications to its environmental permit water quality requirements. On June 6, 2016, the responsible agency approved a partial amendment of the environmental permit to better reflect the water quality baseline from 2009. That approval was appealed by certain water users and indigenous residents of the Huasco Valley. On October 19, 2016, the Chilean Committee of Ministers for the Environment, which has jurisdiction over claims of this nature, voted to uphold the permit amendments. On January 27, 2017, the Environmental Court agreed to consider an appeal of the Chilean Committee’s decision brought by CMN and the water users and indigenous residents. A hearing took place on July 25, 2017. On December 12, 2017, the water users withdrew their appeal. The Environmental Court dismissed that appeal on January 5, 2018. A decision of the Environmental Court on the remaining appeals is still pending. Refer to note 36 to the Financial Statements for more information regarding this matter.
Water Treatment Plant
The water treatment plant on the Chilean side of the Pascua-Lama project was damaged during the second quarter of 2016 as a result of heavy snowfall. The water treatment plant consists of two main components, the high density sludge unit followed by the reverse osmosis unit. In June 2017, repairs were completed and the water treatment plant resumed normal operations. CMN has reviewed its contingency plan with Chilean regulatory authorities.
| | | | |
BARRICK YEAR-END 2017 | | 65 | | MANAGEMENT’S DISCUSSION AND ANALYSIS |
COMMITMENTS AND CONTINGENCIES
Litigation and Claims
We are currently subject to various litigation proceedings as disclosed in note 36 to the Financial Statements, and we may be involved in disputes with other parties in the future that may result in litigation. If we are unable to resolve these disputes favorably, it may have a material adverse impact on our financial condition, cash flow and results of operations.
Contractual Obligations and Commitments
In the normal course of business, we enter into contracts that give rise to commitments for future minimum payments. The following table summarizes the remaining contractual maturities of our financial liabilities and operating and capital commitments shown on an undiscounted basis:
| | | | | | | | | | | | | | | | | | | | | | | | | | | | |
| | | | | | | | | Payments due | | | | | | | |
| ($ millions) | | | | | | | | as at December 31, 2017 | | | | | | | |
| | | | | | | | | | | | | | | | | | 2023 | | | | |
| | | 2018 | | | 2019 | | | 2020 | | | 2021 | | | 2022 | | | and thereafter | | | Total | |
Debt1 | | | | | | | | | | | | | | | | | | | | | | | | | | | | |
Repayment of principal | | | $32 | | | | $33 | | | | $263 | | | | $636 | | | | $337 | | | | $5,109 | | | | $6,410 | |
Capital leases | | | 27 | | | | 11 | | | | 4 | | | | 1 | | | | 1 | | | | 2 | | | | 46 | |
Interest | | | 362 | | | | 360 | | | | 356 | | | | 331 | | | | 311 | | | | 5,042 | | | | 6,762 | |
Provisions for environmental rehabilitation2 | | | 141 | | | | 145 | | | | 212 | | | | 262 | | | | 228 | | | | 2,812 | | | | 3,800 | |
Operating leases | | | 21 | | | | 19 | | | | 11 | | | | 8 | | | | 8 | | | | 1 | | | | 68 | |
Restricted share units | | | 9 | | | | 27 | | | | 5 | | | | — | | | | — | | | | — | | | | 41 | |
Pension benefits and other post-retirement benefits | | | 15 | | | | 15 | | | | 14 | | | | 14 | | | | 13 | | | | 205 | | | | 276 | |
Derivative liabilities3 | | | 30 | | | | 2 | | | | — | | | | — | | | | — | | | | — | | | | 32 | |
Purchase obligations for supplies and consumables4 | | | 548 | | | | 305 | | | | 181 | | | | 109 | | | | 4 | | | | — | | | | 1,147 | |
Capital commitments5 | | | 79 | | | | 5 | | | | 4 | | | | 4 | | | | 4 | | | | 22 | | | | 118 | |
Social development costs6 | | | 7 | | | | 11 | | | | 3 | | | | 1 | | | | 1 | | | | 204 | | | | 227 | |
Total | | | $1,271 | | | | $933 | | | | $1,053 | | | | $1,366 | | | | $907 | | | | $13,397 | | | | $18,927 | |
| | 1 | Debt and Interest - Our debt obligations do not include any subjective acceleration clauses or other clauses that enable the holder of the debt to call for early repayment, except in the event that we breach any of the terms and conditions of the debt or for other customary events of default. We are not required to post any collateral under any debt obligations. Projected interest payments on variable rate debt were based on interest rates in effect at December 31, 2017. Interest is calculated on our long-term debt obligations using both fixed and variable rates. |
| | 2 | Provisions for Environmental Rehabilitation - Amounts presented in the table represent the undiscounted uninflated future payments for the expected cost of provisions for environmental rehabilitation. |
| | 3 | Derivative Liabilities - Amounts presented in the table relate to derivative contracts disclosed under note 25C to the Financial Statements. Payments related to derivative contracts may be subject to change given variable market conditions. |
| | 4 | Purchase Obligations for Supplies and Consumables - Includes commitments related to new purchase obligations to secure a supply of acid, tires and cyanide for our production process. |
| | 5 | Capital Commitments - Purchase obligations for capital expenditures include only those items where binding commitments have been entered into. |
| | 6 | Social Development Costs – Includes a commitment of $157 million related to the potential funding of a power transmission line in Argentina, the majority of which is not expected to be paid prior to 2023. |
| | | | |
BARRICK YEAR-END 2017 | | 66 | | MANAGEMENT’S DISCUSSION AND ANALYSIS |
REVIEW OF QUARTERLY RESULTS
Quarterly Information1
| | | | | | | | | | | | | | | | | | | | | | | | | | | | | | | | |
| | | 2017 | | | 2016 | |
($ millions, except where indicated) | | Q4 | | | Q3 | | | Q2 | | | Q1 | | | Q4 | | | Q3 | | | Q2 | | | Q1 | |
Revenues | | | $2,228 | | | | $1,993 | | | | $2,160 | | | | $1,993 | | | | $2,319 | | | | $2,297 | | | | $2,012 | | | | $1,930 | |
Realized price per ounce – gold2 | | | 1,280 | | | | 1,274 | | | | 1,258 | | | | 1,220 | | | | 1,217 | | | | 1,333 | | | | 1,259 | | | | 1,181 | |
Realized price per pound – copper2 | | | 3.34 | | | | 3.05 | | | | 2.60 | | | | 2.76 | | | | 2.62 | | | | 2.18 | | | | 2.14 | | | | 2.18 | |
Cost of sales | | | 1,411 | | | | 1,270 | | | | 1,277 | | | | 1,342 | | | | 1,454 | | | | 1,291 | | | | 1,336 | | | | 1,324 | |
Net earnings (loss) | | | (314 | ) | | | (11 | ) | | | 1,084 | | | | 679 | | | | 425 | | | | 175 | | | | 138 | | | | (83 | ) |
Per share (dollars)3 | | | (0.27 | ) | | | (0.01 | ) | | | 0.93 | | | | 0.58 | | | | 0.36 | | | | 0.15 | | | | 0.12 | | | | (0.07 | ) |
Adjusted net earnings2 | | | 253 | | | | 200 | | | | 261 | | | | 162 | | | | 255 | | | | 278 | | | | 158 | | | | 127 | |
Per share (dollars)2,3 | | | 0.22 | | | | 0.17 | | | | 0.22 | | | | 0.14 | | | | 0.22 | | | | 0.24 | | | | 0.14 | | | | 0.11 | |
Operating cash flow | | | 590 | | | | 532 | | | | 448 | | | | 495 | | | | 711 | | | | 951 | | | | 527 | | | | 451 | |
Cash capital expenditures | | | 350 | | | | 307 | | | | 405 | | | | 334 | | | | 326 | | | | 277 | | | | 253 | | | | 270 | |
Free cash flow2 | | | $240 | | | | $225 | | | | $43 | | | | $161 | | | | $385 | | | | $674 | | | | $274 | | | | $181 | |
| | 1 | Sum of all the quarters may not add up to the annual total due to rounding. |
| | 2 | Realized price, adjusted net earnings, adjusted net earnings per share and free cash flow arenon-GAAP financial performance measures with no standardized meaning under IFRS and therefore may not be comparable to similar measures of performance presented by other issuers. For further information and a detailed reconciliation of eachnon-GAAP measure used in this section of the MD&A to the most directly comparable IFRS measure, please see pages 69 to 84 of this MD&A. |
| | 3 | Calculated using weighted average number of shares outstanding under the basic method of earnings per share. |
Our recent financial results reflect our emphasis on cost control and growing operating cash flow and free cash flow. While gold prices have fluctuated around $1,200 per ounce, we are consistently generating positive free cash flow1. This free cash flow, combined with the proceeds from various divestitures, have allowed us to strengthen our balance sheet over the past two years. In the fourth quarter of 2017, we recorded $521 million (net of tax effects andnon-controlling interest) of net asset impairments primarily relating to impairments at the Pascua-Lama project and Acacia’s Bulyanhulu mine, partially offset by an impairment reversal at Lumwana. In the third quarter of 2017, we recognized a $172 million tax provision relating to the impact of the proposed framework for Acacia operations in Tanzania. In the second quarter of 2017, we recorded $858 million (net of tax effects) of gains on the disposition of 50% of the Veladero mine and a 25% interest in the Cerro Casale project. In the first quarter of 2017, we recorded a net asset impairment reversal of $522 million (net of tax effects andnon-controlling interest) primarily relating to impairment reversals at the Cerro Casale project. In the fourth quarter of 2016, we recorded a net asset impairment reversal of $199 million (net of tax effects) primarily relating to impairment reversals at Veladero and Lagunas Norte.
Fourth Quarter Results
In the fourth quarter of 2017, we reported a net loss of $314 million and adjusted net earnings1 of $253 million, compared to net earnings of $425 million and adjusted net earnings1 of $255 million in the fourth quarter of 2016. The net loss in the fourth quarter of 2017 reflects the recording of $521 million (net of tax effects andnon-controlling interests) in net impairment charges
compared to net impairment reversals of $199 million (net of tax effects) recorded in the fourth quarter of 2016. The lower net earnings in the fourth quarter of 2017 primarily reflects the recognition of impairment charges rather than impairment reversals in the prior year period combined with lower gold sales volumes, partially offset by an increase in realized gold and copper prices1. The decrease in adjusted net earnings1 primarily reflects higher income tax expense combined with a decrease in gold sales volume, partially offset by higher realized gold and copper prices1 compared to the fourth quarter of 2016.
In the fourth quarter of 2017, gold and copper sales were 1.37 million ounces and 107 million pounds, respectively, compared to 1.52 million ounces (1.42 million ounces excluding the impact of divestments) and 107 million pounds, respectively, in the fourth quarter of 2016. The decrease in gold sales was primarily due to lower grades at Barrick Nevada combined with lower sales at Acacia due to reduced operations at Acacia’s Bulyanhulu mine, partially offset by higher sales at Porgera and Lagunas Norte. Revenues in the fourth quarter of 2017 were lower than the same prior year period, reflecting lower gold sales volumes, partially offset by higher market prices for gold and copper.
In the fourth quarter of 2017, cost of sales was $1.4 billion, a decrease of $43 million compared to the same prior year period, primarily due to lower sales volume, which have contributed to a decrease in direct mining costs and royalty expense. This was partially offset by an increase in depreciation expense, as discussed below. Cost of sales per ounce4 was $801 per ounce, an increase of $17 per ounce, primarily due to higher direct mining
| | | | |
BARRICK YEAR-END 2017 | | 67 | | MANAGEMENT’S DISCUSSION AND ANALYSIS |
costs mainly due to higher consumables and power at Pueblo Viejo, partially offset by higher capitalized waste stripping activity at Barrick Nevada and higher depreciation expense mainly as a result of higher depreciation at Pueblo Viejo relating to a tailings storage facility depreciation adjustment, partially offset by lower depreciation at Barrick Nevada associated with the South Arturo pit. The increase was further partially offset by a positive change in our sales mix with lower relative sales volume from the higher cost Bulyanhulu mine at Acacia. Cost of sales per pound4 was $1.79, an increase of $0.36 per pound from the same prior year period due to higher direct mining costs combined with higher depreciation expense at Lumwana, partially offset by a positive sales mix impact of lower sales volume at Lumwana compared to the same prior year period. This was further impacted by higher direct mining costs at Zaldívar primarily related to higher fuel and labor costs.
In the fourth quarter of 2017, operating cash flow was $590 million, compared to $711 million in the same prior year period. The decrease in operating cash flow primarily
reflects lower gold sales volume combined with unfavorable working capital movements mainly related to the timing of accounts receivable balances, partially offset by higher realized gold and copper prices, a decrease in income tax payments and a decrease in interest paid.
In the fourth quarter of 2017, free cash flow1 was $240 million, lower than the $385 million in the same prior year period. The decrease was caused by lower operating cash flow generated in the fourth quarter of 2017 compared to the same prior year period combined with slightly higher cash capital expenditures of $350 million, compared to $326 million in the fourth quarter of 2016. The higher cash capital expenditures were primarily a result of higher project capital expenditures, partially offset by a reduction in capitalized development primarily at Acacia’s Bulyanhulu and North Mara mines.
INTERNAL CONTROL OVER FINANCIAL REPORTING AND DISCLOSURE CONTROLS AND PROCEDURES
Management is responsible for establishing and maintaining adequate internal control over financial reporting and disclosure controls and procedures. Internal control over financial reporting is a framework designed to provide reasonable assurance regarding the reliability of financial reporting and the preparation of financial statements for external purposes in accordance with IFRS. The Company’s internal control over financial reporting framework includes those policies and procedures that (i) pertain to the maintenance of records that, in reasonable detail, accurately and fairly reflect the transactions and dispositions of the assets of the Company; (ii) provide reasonable assurance that transactions are recorded as necessary to permit preparation of financial statements in accordance with IFRS, and that receipts and expenditures of the Company are being made only in accordance with authorizations of management and directors of the Company; and (iii) provide reasonable assurance regarding prevention or timely detection of unauthorized acquisition, use or disposition of the Company’s assets that could have a material effect on the Company’s consolidated financial statements.
Disclosure controls and procedures form a broader framework designed to provide reasonable assurance that other financial information disclosed publicly fairly presents in all material respects the financial condition, results of operations and cash flows of the Company for the periods presented in this MD&A and Barrick’s Annual Report. The Company’s disclosure controls and procedures framework includes processes designed to ensure that material information relating to the Company, including its consolidated subsidiaries, is made known to management by others within those entities to allow timely decisions regarding required disclosure.
Together, the internal control over financial reporting and disclosure controls and procedures frameworks provide internal control over financial reporting and disclosure. Due to its inherent limitations, internal control over financial reporting and disclosure may not prevent or detect all misstatements. Further, the effectiveness of internal control is subject to the risk that controls may become inadequate because of changes in conditions, or that the degree of compliance with policies or procedures may change.
The management of Barrick, at the direction of our President and Chief Financial Officer, evaluated the effectiveness of the design and operation of internal control over financial reporting as of the end of the period covered by this report based on the framework and criteria established in Internal Control – Integrated Framework (2013) as issued by the Committee of Sponsoring Organizations of the Treadway Commission (COSO). Based on that evaluation, management concluded that the Company’s internal control over financial reporting was effective as at December 31, 2017.
There were no changes in the Company’s internal control over financial reporting during the fourth quarter of 2017 that have materially affected, or are reasonably likely to materially affect, the Company’s internal control over financial reporting.
Barrick’s annual management report on internal control over financial reporting and the integrated audit report of Barrick’s auditors for the year ended December 31, 2017 will be included in Barrick’s 2017 Annual Report and its 2017 Form40-F/Annual Information Form on file with the US Securities and Exchange Commission and Canadian provincial securities regulatory authorities.
| | | | |
BARRICK YEAR-END 2017 | | 68 | | MANAGEMENT’S DISCUSSION AND ANALYSIS |
IFRS CRITICAL ACCOUNTING POLICIES AND ACCOUNTING ESTIMATES
Management has discussed the development and selection of our critical accounting estimates with the Audit Committee of the Board of Directors, and the Audit Committee has reviewed the disclosure relating to such estimates in conjunction with its review of this MD&A. The accounting policies and methods we utilize determine how we report our financial condition and results of operations, and they may require management to make estimates or rely on assumptions about matters that are inherently uncertain. The consolidated financial statements have been prepared in accordance with IFRS as issued by the International Accounting Standards Board (“IASB”) under the historical cost convention, as modified by revaluation of certain financial assets, derivative contracts and post-retirement assets. Our significant accounting policies are disclosed in note 2 of the Financial Statements, including a summary of current and future changes in accounting policies.
Critical Accounting Estimates and Judgments
Certain accounting estimates have been identified as being “critical” to the presentation of our financial condition and results of operations because they require us to make subjective and/or complex judgments about matters that are inherently uncertain; or there is a reasonable likelihood that materially different amounts could be reported under different conditions or using different assumptions and estimates. Our significant accounting judgments, estimates and assumptions are disclosed in note 3 of the accompanying Financial Statements.
NON-GAAP FINANCIAL PERFORMANCE MEASURES
Adjusted Net Earnings and Adjusted Net Earnings per Share
Adjusted net earnings is anon-GAAP financial measure which excludes the following from net earnings:
| | ● | Impairment charges (reversals) related to intangibles, goodwill, property, plant and equipment, and investments; |
| | ● | Acquisition/disposition gains/losses; |
| | ● | Foreign currency translation gains/losses; |
| | ● | Significant tax adjustments; |
| | ● | Unrealized gains/losses onnon-hedge derivative instruments; and |
| | ● | Tax effect andnon-controlling interest of the above items. |
Management uses this measure internally to evaluate our underlying operating performance for the reporting periods presented and to assist with the planning and forecasting of future operating results. Management believes that adjusted net earnings is a useful measure of our performance because impairment charges, acquisition/disposition gains/losses and significant tax adjustments do not reflect the underlying operating performance of our core mining business and are not necessarily indicative of future operating results. Furthermore, foreign currency translation gains/losses and unrealized gains/losses fromnon-hedge derivatives are not necessarily reflective of the underlying operating results for the reporting periods presented. The tax effect andnon-controlling interest of the adjusting items are also excluded to reconcile the amounts to Barrick’s share on apost-tax basis, consistent with net earnings.
As noted, we use this measure for internal purposes. Management’s internal budgets and forecasts and public guidance do not reflect the types of items we adjust for. Consequently, the presentation of adjusted net earnings enables investors and analysts to better understand the underlying operating performance of our core mining business through the eyes of management. Management periodically evaluates the components of adjusted net earnings based on an internal assessment of performance measures that are useful for evaluating the operating performance of our business segments and a review of thenon-GAAP measures used by mining industry analysts and other mining companies.
Adjusted net earnings is intended to provide additional information only and does not have any standardized definition under IFRS and should not be considered in isolation or as a substitute for measures of performance prepared in accordance with IFRS. The measures are not necessarily indicative of operating profit or cash flow from operations as determined under IFRS. Other companies may calculate these measures differently. The following table reconciles thesenon-GAAP measures to the most directly comparable IFRS measure.
| | | | |
BARRICK YEAR-END 2017 | | 69 | | MANAGEMENT’S DISCUSSION AND ANALYSIS |
Reconciliation of Net Earnings to Net Earnings per Share, Adjusted Net Earnings and Adjusted Net Earnings per Share
| | | | | | | | | | | | | | | | | | | | |
| | | | | | | | | | | | For the three months ended | |
| ($ millions, except per share amounts in dollars) | | For the years ended December 31 | | | December 31 | |
| | | 2017 | | | 2016 | | | 2015 | | | 2017 | | | 2016 | |
Net earnings (loss) attributable to equity holders of the Company | | | $1,438 | | | | $655 | | | | ($2,838 | ) | | | ($314 | ) | | | $425 | |
Impairment charges (reversals) related to long-lived assets1 | | | (212 | ) | | | (250 | ) | | | 3,897 | | | | 916 | | | | (304 | ) |
Acquisition/disposition (gains)/losses2 | | | (911 | ) | | | 42 | | | | (187 | ) | | | (29 | ) | | | 7 | |
Foreign currency translation (gains)/losses | | | 72 | | | | 199 | | | | 120 | | | | 12 | | | | 18 | |
Significant tax adjustments3 | | | 244 | | | | 43 | | | | 134 | | | | 61 | | | | (16 | ) |
Other expense adjustments4 | | | 178 | | | | 114 | | | | 135 | | | | 17 | | | | 39 | |
Unrealized gains onnon-hedge derivative instruments | | | (1 | ) | | | (32 | ) | | | 11 | | | | 5 | | | | (9 | ) |
Tax effect andnon-controlling interest5 | | | 68 | | | | 47 | | | | (928 | ) | | | (415 | ) | | | 95 | |
Adjusted net earnings | | | $876 | | | | $818 | | | | $344 | | | | $253 | | | | $255 | |
Net earnings (loss) per share6 | | | 1.23 | | | | 0.56 | | | | (2.44 | ) | | | (0.27 | ) | | | 0.36 | |
Adjusted net earnings per share6 | | | 0.75 | | | | 0.70 | | | | 0.30 | | | | 0.22 | | | | 0.22 | |
| | 1 | Net impairment reversals for the current year primarily relate to impairment reversals at the Cerro Casale project upon reclassification of the project’s net assets asheld-for-sale as at March 31, 2017 and impairment reversals at Lumwana during the fourth quarter of 2017, partially offset by net impairments at Acacia’s Bulyanhulu mine and the Pascua-Lama project during the fourth quarter of 2017. |
| | 2 | Disposition gains for the current year primarily relate to the sale of a 50% interest in the Veladero mine and the gain related to the sale of a 25% interest in the Cerro Casale project. |
| | 3 | Significant tax adjustments for the current year primarily relate to dividend withholding tax expense and a tax provision relating to the impact of the proposed framework for Acacia operations in Tanzania, partially offset by the anticipated impact of the U.S tax reform. |
| | 4 | Other expense adjustments for the current year primarily relate to losses on debt extinguishment and reduced operations program costs at Acacia’s Bulyanhulu mine. |
| | 5 | Tax effect andnon-controlling interest for the current year primarily relates to the impairment reversals at the Cerro Casale project, tax provision at Acacia and Pueblo Viejo depreciation adjustment discussed above. |
| | 6 | Calculated using weighted average number of shares outstanding under the basic method of earnings per share. |
Free Cash Flow
Free cash flow is a measure that excludes capital expenditures from net cash provided by operating activities. Management believes this to be a useful indicator of our ability to operate without reliance on additional borrowing or usage of existing cash.
Free cash flow is intended to provide additional information only and does not have any standardized definition under IFRS, and should not be considered in
isolation or as a substitute for measures of performance prepared in accordance with IFRS. The measure is not necessarily indicative of operating profit or cash flow from operations as determined under IFRS. Other companies may calculate this measure differently. The following table reconciles thisnon-GAAP measure to the most directly comparable IFRS measure.
Reconciliation of Net Cash Provided by Operating Activities to Free Cash Flow
| | | | | | | | | | | | | | | | | | | | |
| ($ millions) | | | | | For the years ended December 31 | | | For the three months ended December 31 | |
| | | 2017 | | | 2016 | | | 2015 | | | 2017 | | | 2016 | |
Net cash provided by operating activities | | | $2,065 | | | | $2,640 | | | | $2,794 | | | | $590 | | | | $711 | |
Capital expenditures | | | (1,396 | ) | | | (1,126 | ) | | | (1,713 | ) | | | (350 | ) | | | (326 | ) |
Free cash flow | | | $669 | | | | $1,514 | | | | $1,081 | | | | $240 | | | | $385 | |
| | | | |
BARRICK YEAR-END 2017 | | 70 | | MANAGEMENT’S DISCUSSION AND ANALYSIS |
Cash costs per ounce,All-in sustaining costs per ounce,All-in costs per ounce, C1 cash costs per pound andAll-in sustaining costs per pound
Cash costs per ounce,all-in sustaining costs per ounce andall-in costs per ounce arenon-GAAP financial measures which are calculated based on the definition published by the World Gold Council (“WGC”) (a market development organization for the gold industry comprised of and funded by 23 gold mining companies from around the world, including Barrick). The WGC is not a regulatory organization. Management uses these measures to monitor the performance of our gold mining operations and its ability to generate positive cash flow, both on an individual site basis and an overall company basis.
Cash costs start with our cost of sales related to gold production and removes depreciation, thenon-controlling interest of cost of sales and includes byproduct credits.All-in sustaining costs start with cash costs and include sustaining capital expenditures, general and administrative costs, minesite exploration and evaluation costs and reclamation cost accretion and amortization. These additional costs reflect the expenditures made to maintain current production levels.
All-in costs starts withall-in sustaining costs and adds additional costs that reflect the varying costs of producing gold over the life-cycle of a mine, including: project capital expenditures (capital expenditures at new projects and discrete projects at existing operations intended to increase production capacity and will not benefit production for at least 12 months) and othernon-sustaining costs (primarily exploration and evaluation costs, community relations costs and general and administrative costs that are not associated with current operations). These definitions recognize that there are different costs associated with the life-cycle of a mine, and that it is therefore appropriate to distinguish between sustaining andnon-sustaining costs.
We believe that our use of cash costs,all-in sustaining costs andall-in costs will assist analysts, investors and other stakeholders of Barrick in understanding the costs associated with producing gold, understanding the economics of gold mining, assessing our operating performance and also our ability to generate free cash flow from current operations and to generate free cash flow on an overall company basis. Due to the capital-intensive nature of the industry and the long useful lives over which these items are depreciated, there can be a significant timing difference between net earnings calculated in accordance with IFRS and the amount of free cash flow that is being generated by a mine and therefore we believe these measures are useful non-
GAAP operating metrics and supplement our IFRS disclosures. These measures are not representative of all of our cash expenditures as they do not include income tax payments, interest costs or dividend payments. These measures do not include depreciation or amortization.
Cash costs per ounce,all-in sustaining costs andall-in costs are intended to provide additional information only and do not have standardized definitions under IFRS, and should not be considered in isolation or as a substitute for measures of performance prepared in accordance with IFRS. These measures are not equivalent to net income or cash flow from operations as determined under IFRS. Although the WGC has published a standardized definition, other companies may calculate these measures differently.
In addition to presenting these metrics on aby-product basis, we have calculated these metrics on aco-product basis. Ourco-product metrics remove the impact of other metal sales that are produced as aby-product of our gold production from cost per ounce calculations, but does not reflect a reduction in costs for costs associated with other metal sales.
C1 cash costs per pound andall-in sustaining costs per pound arenon-GAAP financial measures related to our copper mine operations. We believe that C1 cash costs per pound enables investors to better understand the performance of our copper operations in comparison to other copper producers who present results on a similar basis. C1 cash costs per pound excludes royalties andnon-routine charges as they are not direct production costs.All-in sustaining costs per pound is similar to the goldall-in sustaining costs metric and management uses this to better evaluate the costs of copper production. We believe this measure enables investors to better understand the operating performance of our copper mines as this measure reflects all of the sustaining expenditures incurred in order to produce copper.All-in sustaining costs per pound includes C1 cash costs, corporate general and administrative costs, minesite exploration and evaluation costs, royalties, environmental rehabilitation costs and write-downs taken on inventory to net realizable value.
| | | | |
BARRICK YEAR-END 2017 | | 71 | | MANAGEMENT’S DISCUSSION AND ANALYSIS |
Reconciliation of Gold Cost of Sales to Cash costs,All-in sustaining costs andAll-in costs, including on a per ounce basis
| | | | | | | | | | | | | | | | | | | | | | | | |
| ($ millions, except per ounce information in dollars) | | | | | For the years ended December 31 | | | For the three months
ended December 31 | |
| | | Footnote | | | 2017 | | | 2016 | | | 2015 | | | 2017 | | | 2016 | |
Cost of sales related to gold production | | | | | | | $4,836 | | | | $4,980 | | | | $5,906 | | | | $1,292 | | | | $1,347 | |
Depreciation | | | | | | | (1,529) | | | | (1,504) | | | | (1,615) | | | | (404) | | | | (396) | |
By-product credits | | | 1 | | | | (135) | | | | (184) | | | | (214) | | | | (30) | | | | (41) | |
Realized (gains)/losses on hedge andnon-hedge derivatives | | | 2 | | | | 23 | | | | 89 | | | | 128 | | | | 4 | | | | 18 | |
Non-recurring items | | | 3 | | | | — | | | | 24 | | | | (210) | | | | — | | | | — | |
Other | | | 4 | | | | (106) | | | | (44) | | | | 25 | | | | (35) | | | | (20) | |
Non-controlling interests (Pueblo Viejo and Acacia) | | | 5 | | | | (299) | | | | (358) | | | | (394) | | | | (81) | | | | (91) | |
Cash costs | | | | | | | $2,790 | | | | $3,003 | | | | $3,626 | | | | $746 | | | | $817 | |
General & administrative costs | | | | | | | 248 | | | | 256 | | | | 233 | | | | 62 | | | | 39 | |
Minesite exploration and evaluation costs | | | 6 | | | | 47 | | | | 44 | | | | 47 | | | | 8 | | | | 18 | |
Minesite sustaining capital expenditures | | | 7 | | | | 1,109 | | | | 944 | | | | 1,359 | | | | 279 | | | | 298 | |
Rehabilitation - accretion and amortization (operating sites) | | | 8 | | | | 64 | | | | 59 | | | | 145 | | | | 13 | | | | 18 | |
Non-controlling interest, copper operations and other | | | 9 | | | | (273) | | | | (287) | | | | (362) | | | | (74) | | | | (78) | |
All-in sustaining costs | | | | | | | $3,985 | | | | $4,019 | | | | $5,048 | | | | $1,034 | | | | $1,112 | |
Project exploration and evaluation and project costs | | | 6 | | | | 307 | | | | 193 | | | | 308 | | | | 90 | | | | 64 | |
Community relations costs not related to current operations | | | | | | | 4 | | | | 8 | | | | 12 | | | | 1 | | | | 2 | |
Project capital expenditures | | | 7 | | | | 273 | | | | 175 | | | | 133 | | | | 81 | | | | 51 | |
Rehabilitation - accretion and amortization(non-operating sites) | | | 8 | | | | 20 | | | | 11 | | | | 12 | | | | 4 | | | | 4 | |
Non-controlling interest and copper operations | | | 9 | | | | (21) | | | | (42) | | | | (43) | | | | (9) | | | | (4) | |
All-in costs | | | | | | | $4,568 | | | | $4,364 | | | | $5,470 | | | | $1,201 | | | | $1,229 | |
Ounces sold - equity basis (000s ounces) | | | 10 | | | | 5,302 | | | | 5,503 | | | | 6,083 | | | | 1,372 | | | | 1,519 | |
Cost of sales per ounce | | | 11,12 | | | | $794 | | | | $798 | | | | $859 | | | | $801 | | | | $784 | |
Cash costs per ounce | | | 12 | | | | $526 | | | | $546 | | | | $596 | | | | $545 | | | | $540 | |
Cash costs per ounce (on aco-product basis) | | | 12,13 | | | | $544 | | | | $569 | | | | $619 | | | | $561 | | | | $557 | |
All-in sustaining costs per ounce | | | 12 | | | | $750 | | | | $730 | | | | $831 | | | | $756 | | | | $732 | |
All-in sustaining costs per ounce (on aco-product basis) | | | 12,13 | | | | $768 | | | | $753 | | | | $854 | | | | $772 | | | | $749 | |
All-in costs per ounce | | | 12 | | | | $860 | | | | $792 | | | | $900 | | | | $882 | | | | $809 | |
All-in costs per ounce (on aco-product basis) | | | 12,13 | | | | $878 | | | | $815 | | | | $923 | | | | $898 | | | | $826 | |
Revenues include the sale ofby-products for our gold and copper mines for the three months ended December 31, 2017 of $30 million (2016: $41 million) and the year ended December 31, 2017 of $135 million (2016: $151 million; 2015: $140 million) and energy sales from the Monte Rio power plant at our Pueblo Viejo mine for the three months ended December 31, 2017 of $nil (2016: $nil) and the year ended December 31, 2017 of $nil (2016: $33 million; 2015: $74 million) up until its disposition on August 18, 2016.
| | 2 | Realized (gains)/losses on hedge andnon-hedge derivatives |
Includes realized hedge losses of $5 million and $27 million for the three months and year ended December 31, 2017, respectively (2016: $14 million and $73 million, respectively; 2015: $106 million), and realizednon-hedge gains of $1 million and $4 million for the three months and year ended December 31, 2017, respectively (2016: $4 million and $16 million losses, respectively; 2015: $22 million losses). Refer to Note 5 of the Financial Statements for further information.
These gains/costs are not indicative of our cost of production and have been excluded from the calculation of cash costs.
Other adjustments include adding the net margins related to power sales at Pueblo Viejo of $nil and $nil, respectively, for the three months and year ended December 31, 2017 (2016: $nil and $5 million, respectively; 2015: $12 million) and adding the cost of treatment and refining charges of $nil and $1 million, respectively, for the three months and year ended December 31, 2017 (2016: $4 million and $16 million, respectively; 2015: $14 million). 2016 and 2017 includes the removal of cash costs associated with our Pierina mine, which is mining incidental ounces as it enters closure, of $35 million and $108 million for the three months and year ended December 31, 2017, respectively (2016: $24 million and $66 million, respectively).
| | | | |
BARRICK YEAR-END 2017 | | 72 | | MANAGEMENT’S DISCUSSION AND ANALYSIS |
| | 5 | Non-controlling interests (Pueblo Viejo and Acacia) |
Non-controlling interests includenon-controlling interests related to gold production of $137 million and $454 million, respectively, for the three months and year ended December 31, 2017 (2016: $127 million and $508 million, respectively; 2015: $681 million). Refer to Note 5 of the Financial Statements for further information.
| | 6 | Exploration and evaluation costs |
Exploration, evaluation and project expenses are presented as minesite if it supports current mine operations and project if it relates to future projects. Refer to page 44 of this MD&A.
Capital expenditures are related to our gold sites only and are presented on a 100% accrued basis. They are split between minesite sustaining and project capital expenditures. Project capital expenditures are distinct projects designed to increase the net present value of the mine and are not related to current production. Significant projects in the current year are Crossroads, Cortez Hills Lower Zone, Range Front Declines and Goldrush. Refer to page 43 of this MD&A.
| | 8 | Rehabilitation - accretion and amortization |
Includes depreciation on the assets related to rehabilitation provisions of our gold operations and accretion on the rehabilitation provisions of our gold operations, split between operating andnon-operating sites.
| | 9 | Non-controlling interest and copper operations |
Removes general & administrative costs related tonon-controlling interests and copper based on a percentage allocation of revenue. Also removes exploration, evaluation and project costs, rehabilitation costs and capital expenditures incurred by our copper sites and thenon-controlling interest of our Acacia and Pueblo Viejo operating segment and South Arturo. In 2016 and 2017, figures remove the impact of Pierina, which is mining incidental ounces as it enters closure. The impact is summarized as the following:
| | | | | | | | | | | | | | | | | | | | |
| ($ millions) | | For the years ended December 31 | | | For the three months
ended December 31 | |
Non-controlling interest, copper operations and other | | | 2017 | | | | 2016 | | | | 2015 | | | | 2017 | | | | 2016 | |
General & administrative costs | | | ($21 | ) | | | ($36 | ) | | | ($53 | ) | | | ($8 | ) | | | ($5 | ) |
Minesite exploration and evaluation costs | | | (12 | ) | | | (9 | ) | | | (8 | ) | | | 1 | | | | (3 | ) |
Rehabilitation - accretion and amortization (operating sites) | | | (10 | ) | | | (9 | ) | | | (13 | ) | | | (2 | ) | | | (4 | ) |
Minesite sustaining capital expenditures | | | (230 | ) | | | (233 | ) | | | (288 | ) | | | (65 | ) | | | (66 | ) |
All-in sustaining costs total | | | ($273 | ) | | | ($287 | ) | | | ($362 | ) | | | ($74 | ) | | | ($78 | ) |
Project exploration and evaluation and project costs | | | (17 | ) | | | (12 | ) | | | (11 | ) | | | (8 | ) | | | (4 | ) |
Project capital expenditures | | | (4 | ) | | | (30 | ) | | | (32 | ) | | | (1 | ) | | | — | |
All-in costs total | | | ($21 | ) | | | ($42 | ) | | | ($43 | ) | | | ($9 | ) | | | ($4 | ) |
| | 10 | Ounces sold - equity basis |
In 2016 and 2017, figures remove the impact of Pierina, which is mining incidental ounces as it enters closure.
| | 11 | Cost of sales per ounce |
In 2016 and 2017, figures remove the cost of sales impact of Pierina of $55 million and $174 million, respectively, for the three months and year ended December 31, 2017 (2016: $30 million and $82 million, respectively), which is mining incidental ounces as it enters closure. Cost of sales per ounce excludesnon-controlling interest related to gold production. Cost of sales related to gold per ounce is calculated using cost of sales on an attributable basis (removing thenon-controlling interest of 40% Pueblo Viejo and 36.1% Acacia from cost of sales), divided by attributable gold ounces.
Cost of sales per ounce, cash costs per ounce,all-in sustaining costs per ounce andall-in costs per ounce may not calculate based on amounts presented in this table due to rounding.
| | 13 | Co-product costs per ounce |
Cash costs per ounce,all-in sustaining costs per ounce andall-in costs per ounce presented on aco-product basis remove the impact ofby-product credits of our gold production (net ofnon-controlling interest) calculated as:
| | | | | | | | | | | | | | | | | | | | |
| ($ millions) | | | | | For the years ended December 31 | | | For the three months
ended December 31 | |
| | | | 2017 | | | | 2016 | | | | 2015 | | | | 2017 | | | | 2016 | |
By-product credits | | | $135 | | | | $184 | | | | $214 | | | | $30 | | | | $41 | |
Non-controlling interest | | | (30 | ) | | | (53 | ) | | | (62 | ) | | | (6 | ) | | | (13 | ) |
By-product credits (net ofnon-controlling interest) | | | $105 | | | | $131 | | | | $152 | | | | $24 | | | | $28 | |
| | | | |
BARRICK YEAR-END 2017 | | 73 | | MANAGEMENT’S DISCUSSION AND ANALYSIS |
Reconciliation of Gold Cost of Sales to Cash costs,All-in sustaining costs andAll-in costs, including on a per ounce basis, by operating segment
| | | | | | | | | | | | | | | | | | | | | | | | | | | | | | | | | | | | | | | | | | |
| ($ millions, except per ounce information in dollars) | | | For the three months ended December 31, 2017 | |
| | | Footnote | | Barrick
Nevada | | | Pueblo
Viejo | | | Lagunas
Norte | | | Veladero | | | Turquoise
Ridge | | | Acacia | | | Hemlo | | | Golden
Sunlight | | | Porgera | | | Kalgoorlie | |
Cost of sales related to gold production | | | | | $428 | | | | $241 | | | | $75 | | | | $108 | | | | $55 | | | | $114 | | | | $53 | | | | $14 | | | | $69 | | | | $79 | |
Depreciation | | | | | (155 | ) | | | (107 | ) | | | (18 | ) | | | (33 | ) | | | (10 | ) | | | (25 | ) | | | (8 | ) | | | — | | | | (12 | ) | | | (16 | ) |
By-product credits | | 1 | | | (1 | ) | | | (14 | ) | | | (4 | ) | | | (5 | ) | | | — | | | | — | | | | — | | | | — | | | | (1 | ) | | | — | |
Non-recurring items | | 2 | | | — | | | | — | | | | — | | | | — | | | | — | | | | — | | | | — | | | | — | | | | — | | | | — | |
Other | | 3 | | | — | | | | — | | | | — | | | | — | | | | — | | | | 1 | | | | — | | | | — | | | | — | | | | — | |
Non-controlling interests | | | | | (1 | ) | | | (49 | ) | | | — | | | | — | | | | — | | | | (31 | ) | | | — | | | | — | | | | — | | | | — | |
| Cash costs | | | | | $271 | | | | $71 | | | | $53 | | | | $70 | | | | $45 | | | | $59 | | | | $45 | | | | $14 | | | | $56 | | | | $63 | |
General & administrative costs | | | | | — | | | | — | | | | — | | | | — | | | | — | | | | 9 | | | | — | | | | — | | | | — | | | | — | |
Minesite exploration and evaluation costs | | 4 | | | 4 | | | | — | | | | — | | | | — | | | | — | | | | — | | | | — | | | | — | | | | 1 | | | | 3 | |
Minesite sustaining capital expenditures | | 5 | | | 94 | | | | 30 | | | | 8 | | | | 39 | | | | 8 | | | | 18 | | | | 10 | | | | — | | | | 16 | | | | 8 | |
Rehabilitation - accretion and amortization (operating sites) | | 6 | | | 4 | | | | 3 | | | | 1 | | | | — | | | | — | | | | 1 | | | | 1 | | | | — | | | | (1 | ) | | | — | |
Non-controlling interests | | | | | — | | | | (13 | ) | | | — | | | | — | | | | — | | | | (12 | ) | | | — | | | | — | | | | — | | | | — | |
| All-in sustaining costs | | | | | $373 | | | | $91 | | | | $62 | | | | $109 | | | | $53 | | | | $75 | | | | $56 | | | | $14 | | | | $72 | | | | $74 | |
Project exploration and evaluation and project costs | | 4 | | | 4 | | | | — | | | | — | | | | — | | | | — | | | | — | | | | — | | | | — | | | | — | | | | — | |
Project capital expenditures | | 5 | | | 63 | | | | — | | | | — | | | | — | | | | 4 | | | | 3 | | | | — | | | | — | | | | — | | | | — | |
Non-controlling interests | | | | | — | | | | — | | | | — | | | | — | | | | — | | | | (1 | ) | | | — | | | | — | | | | — | | | | — | |
| All-in costs | | | | | $440 | | | | $91 | | | | $62 | | | | $109 | | | | $57 | | | | $77 | | | | $56 | | | | $14 | | | | $72 | | | | $74 | |
Ounces sold - equity basis (000s ounces) | | | | | 539 | | | | 182 | | | | 114 | | | | 114 | | | | 81 | | | | 94 | | | | 64 | | | | 11 | | | | 80 | | | | 93 | |
| Cost of sales per ounce | | 7,8 | | | $794 | | | | $795 | | | | $659 | | | | $953 | | | | $672 | | | | $774 | | | | $831 | | | | 1,221 | | | | 864 | | | | 850 | |
| Cash costs per ounce | | 8 | | | $506 | | | | $388 | | | | $461 | | | | $609 | | | | $550 | | | | $581 | | | | $690 | | | | $1,218 | | | | $705 | | | | $675 | |
Cash costs per ounce (on a co-product basis) | | 8,9 | | | $507 | | | | $490 | | | | $508 | | | | $618 | | | | $550 | | | | $587 | | | | $695 | | | | $1,228 | | | | $715 | | | | $680 | |
All-in sustaining costs per ounce | | 8 | | | $696 | | | | $498 | | | | $547 | | | | $950 | | | | $638 | | | | $779 | | | | $864 | | | | $1,262 | | | | $897 | | | | $796 | |
All-in sustaining costs per ounce (on aco-product basis) | | 8,9 | | | $697 | | | | $600 | | | | $594 | | | | $959 | | | | $638 | | | | $785 | | | | $869 | | | | $1,272 | | | | $907 | | | | $801 | |
| All-in costs per ounce | | 8 | | | $818 | | | | $498 | | | | $553 | | | | $950 | | | | $692 | | | | $803 | | | | $878 | | | | $1,267 | | | | $897 | | | | $796 | |
All-in costs per ounce (on a co-product basis) | | 8,9 | | | $819 | | | | $600 | | | | $600 | | | | $959 | | | | $692 | | | | $809 | | | | $883 | | | | $1,277 | | | | $907 | | | | $801 | |
| | | | |
BARRICK YEAR-END 2017 | | 74 | | MANAGEMENT’S DISCUSSION AND ANALYSIS |
| | | | | | | | | | | | | | | | | | | | | | | | | | | | | | | | | | | | | | | | | | |
| ($ millions, except per ounce information in dollars) | | | | | | | | | | | | | | | | | For the three months ended December 31, 2016 | |
| | | Footnote | | Barrick
Nevada | | | Pueblo
Viejo | | | Lagunas
Norte | | | Veladero | | | Turquoise
Ridge | | | Acacia | | | Hemlo | | | Golden
Sunlight | | | Porgera | | | Kalgoorlie | |
Cost of sales related to gold production | | | | | $504 | | | | $144 | | | | $60 | | | | $173 | | | | $41 | | | | $195 | | | | $53 | | | | $17 | | | | $54 | | | | $76 | |
Depreciation | | | | | (224 | ) | | | (21 | ) | | | (19 | ) | | | (42 | ) | | | (8 | ) | | | (44 | ) | | | (7 | ) | | | (2 | ) | | | (9 | ) | | | (15 | ) |
By-product credits | | 1 | | | (1 | ) | | | (17 | ) | | | (4 | ) | | | (7 | ) | | | — | | | | (10 | ) | | | — | | | | — | | | | — | | | | — | |
Non-recurring items | | 2 | | | — | | | | — | | | | — | | | | — | | | | — | | | | — | | | | — | | | | — | | | | — | | | | — | |
Other | | 3 | | | — | | | | 1 | | | | — | | | | — | | | | — | | | | 1 | | | | — | | | | — | | | | — | | | | 2 | |
Non-controlling interests | | | | | — | | | | (39 | ) | | | — | | | | — | | | | — | | | | (52 | ) | | | — | | | | — | | | | — | | | | — | |
Cash costs | | | | | $279 | | | | $68 | | | | $37 | | | | $124 | | | | $33 | | | | $90 | | | | $46 | | | | $15 | | | | $45 | | | | $63 | |
General & administrative costs | | | | | — | | | | — | | | | — | | | | — | | | | — | | | | (1 | ) | | | — | | | | — | | | | — | | | | — | |
Minesite exploration and evaluation costs | | 4 | | | 8 | | | | — | | | | — | | | | 1 | | | | — | | | | 1 | | | | — | | | | — | | | | 1 | | | | 2 | |
Minesite sustaining capital expenditures | | 5 | | | 74 | | | | 32 | | | | 3 | | | | 49 | | | | 9 | | | | 56 | | | | 14 | | | | 1 | | | | 13 | | | | 6 | |
Rehabilitation - accretion and amortization (operating sites) | | 6 | | | 9 | | | | 2 | | | | 2 | | | | 1 | | | | — | | | | 2 | | | | — | | | | — | | | | — | | | | 1 | |
Non-controlling interests | | | | | (4 | ) | | | (13 | ) | | | — | | | | — | | | | — | | | | (21 | ) | | | — | | | | — | | | | — | | | | — | |
All-in sustaining costs | | | | | $366 | | | | $89 | | | | $42 | | | | $175 | | | | $42 | | | | $127 | | | | $60 | | | | $16 | | | | $59 | | | | $72 | |
Project exploration and evaluation and project costs | | 4 | | | 6 | | | | — | | | | — | | | | — | | | | — | | | | — | | | | — | | | | — | | | | — | | | | — | |
Project capital expenditures | | 5 | | | 34 | | | | — | | | | 1 | | | | — | | | | — | | | | — | | | | — | | | | — | | | | — | | | | — | |
Non-controlling interests | | | | | — | | | | — | | | | — | | | | — | | | | — | | | | — | | | | — | | | | — | | | | — | | | | — | |
All-in costs | | | | | $406 | | | | $89 | | | | $43 | | | | $175 | | | | $42 | | | | $127 | | | | $60 | | | | $16 | | | | $59 | | | | $72 | |
Ounces sold - equity basis (000s ounces) | | | | | 582 | | | | 198 | | | | 98 | | | | 194 | | | | 69 | | | | 134 | | | | 74 | | | | 13 | | | | 59 | | | | 99 | |
Cost of sales per ounce | | 7,8 | | | $864 | | | | $450 | | | | $612 | | | | $892 | | | | $595 | | | | $935 | | | | $728 | | | | $1,264 | | | | $912 | | | | $772 | |
Cash costs per ounce | | 8 | | | $478 | | | | $341 | | | | $379 | | | | $642 | | | | $484 | | | | $679 | | | | $625 | | | | $1,162 | | | | $765 | | | | $638 | |
Cash costs per ounce (on a co-product basis) | | 8,9 | | | $479 | | | | $471 | | | | $418 | | | | $716 | | | | $484 | | | | $713 | | | | $630 | | | | $1,173 | | | | $775 | | | | $631 | |
All-in sustaining costs per ounce | | 8 | | | $630 | | | | $443 | | | | $436 | | | | $905 | | | | $610 | | | | $952 | | | | $822 | | | | $1,245 | | | | $981 | | | | $731 | |
All-in sustaining costs per ounce (on aco-product basis) | | 8,9 | | | $631 | | | | $573 | | | | $475 | | | | $979 | | | | $610 | | | | $986 | | | | $827 | | | | $1,256 | | | | $991 | | | | $724 | |
All-in costs per ounce | | 8 | | | $696 | | | | $443 | | | | $447 | | | | $905 | | | | $610 | | | | $953 | | | | $822 | | | | $1,245 | | | | $981 | | | | $731 | |
All-in costs per ounce (on a co-product basis) | | 8,9 | | | $697 | | | | $573 | | | | $486 | | | | $979 | | | | $610 | | | | $987 | | | | $827 | | | | $1,256 | | | | $991 | | | | $724 | |
| | | | |
BARRICK YEAR-END 2017 | | 75 | | MANAGEMENT’S DISCUSSION AND ANALYSIS |
| | | | | | | | | | | | | | | | | | | | | | | | | | | | | | | | | | | | | | | | | | |
| ($ millions, except per ounce information in dollars) | | | | | | | | | For the year ended December 31, 2017 | |
| | | Footnote | | Barrick
Nevada | | | Pueblo
Viejo | | | Lagunas
Norte | | | Veladero | | | Turquoise
Ridge | | | Acacia | | | Hemlo | | | Golden
Sunlight | | | Porgera | | | Kalgoorlie | |
Cost of sales related to gold production | | | | | $1,869 | | | | $730 | | | | $245 | | | | $410 | | | | $159 | | | | $469 | | | | $193 | | | | $55 | | | | $239 | | | | $292 | |
| | | | | | | | | | | |
Depreciation | | | | | (793 | ) | | | (229 | ) | | | (68 | ) | | | (119 | ) | | | (28 | ) | | | (107 | ) | | | (27 | ) | | | (3 | ) | | | (39 | ) | | | (58 | ) |
| | | | | | | | | | | |
By-product credits | | 1 | | | (3 | ) | | | (72 | ) | | | (16 | ) | | | (17 | ) | | | — | | | | (7 | ) | | | (1 | ) | | | — | | | | (3 | ) | | | (2 | ) |
| | | | | | | | | | | |
Non-recurring items | | 2 | | | — | | | | — | | | | — | | | | — | | | | — | | | | — | | | | — | | | | — | | | | — | | | | — | |
| | | | | | | | | | | |
Other | | 3 | | | — | | | | — | | | | — | | | | — | | | | — | | | | 1 | | | | — | | | | — | | | | — | | | | — | |
| | | | | | | | | | | |
Non-controlling interests | | | | | (1 | ) | | | (171 | ) | | | — | | | | — | | | | — | | | | (127 | ) | | | — | | | | — | | | | — | | | | — | |
Cash costs | | | | | $1,072 | | | | $258 | | | | $161 | | | | $274 | | | | $131 | | | | $229 | | | | $165 | | | | $52 | | | | $197 | | | | $232 | |
General & administrative costs | | | | | — | | | | — | | | | — | | | | — | | | | — | | | | 21 | | | | — | | | | — | | | | — | | | | — | |
| | | | | | | | | | | |
Minesite exploration and evaluation costs | | 4 | | | 16 | | | | — | | | | 4 | | | | 3 | | | | — | | | | — | | | | — | | | | — | | | | 1 | | | | 9 | |
| | | | | | | | | | | |
Minesite sustaining capital expenditures | | 5 | | | 360 | | | | 114 | | | | 20 | | | | 173 | | | | 32 | | | | 137 | | | | 44 | | | | — | | | | 55 | | | | 20 | |
| | | | | | | | | | | |
Rehabilitation - accretion and amortization (operating sites) | | 6 | | | 25 | | | | 13 | | | | 7 | | | | 2 | | | | 1 | | | | 6 | | | | 5 | | | | 2 | | | | (2 | ) | | | 3 | |
| | | | | | | | | | | |
Non-controlling interests | | | | | (3 | ) | | | (51 | ) | | | — | | | | — | | | | — | | | | (61 | ) | | | — | | | | — | | | | — | | | | — | |
All-in sustaining costs | | | | | $1,470 | | | | $334 | | | | $192 | | | | $452 | | | | $164 | | | | $332 | | | | $214 | | | | $54 | | | | $251 | | | | $264 | |
Project exploration and evaluation and project costs | | 4 | | | 8 | | | | — | | | | — | | | | — | | | | — | | | | — | | | | — | | | | — | | | | — | | | | — | |
| | | | | | | | | | | |
Project capital expenditures | | 5 | | | 224 | | | | — | | | | 5 | | | | — | | | | 4 | | | | 11 | | | | 5 | | | | 1 | | | | — | | | | — | |
| | | | | | | | | | | |
Non-controlling interests | | | | | — | | | | — | | | | — | | | | — | | | | — | | | | (4 | ) | | | — | | | | — | | | | — | | | | — | |
All-in costs | | | | | $1,702 | | | | $334 | | | | $197 | | | | $452 | | | | $168 | | | | $339 | | | | $219 | | | | $55 | | | | $251 | | | | $264 | |
Ounces sold - equity basis (000s ounces) | | | | | 2,357 | | | | 637 | | | | 397 | | | | 458 | | | | 222 | | | | 379 | | | | 196 | | | | 41 | | | | 253 | | | | 362 | |
Cost of sales per ounce | | 7,8 | | | $792 | | | | $699 | | | | $617 | | | | $897 | | | | $715 | | | | $791 | | | | $986 | | | | $1,334 | | | | $944 | | | | $806 | |
Cash costs per ounce | | 8 | | | $455 | | | | $405 | | | | $405 | | | | $598 | | | | $589 | | | | $587 | | | | $841 | | | | $1,265 | | | | $781 | | | | $642 | |
| | | | | | | | | | | |
Cash costs per ounce (on aco-product basis) | | 8,9 | | | $456 | | | | $475 | | | | 446 | | | | $636 | | | | $589 | | | | $598 | | | | $846 | | | | $1,270 | | | | $791 | | | | $647 | |
All-in sustaining costs per ounce | | 8 | | | $624 | | | | $525 | | | | $483 | | | | $987 | | | | $733 | | | | $875 | | | | $1,092 | | | | $1,329 | | | | $993 | | | | $729 | |
| | | | | | | | | | | |
All-in sustaining costs per ounce (on a co- product basis) | | 8,9 | | | $625 | | | | $595 | | | | $524 | | | | $1,025 | | | | $733 | | | | $886 | | | | $1,097 | | | | $1,334 | | | | $1,003 | | | | $734 | |
All-in costs per ounce | | 8 | | | $722 | | | | $525 | | | | $497 | | | | $987 | | | | $753 | | | | $894 | | | | $1,119 | | | | $1,349 | | | | $993 | | | | $729 | |
| | | | | | | | | | | |
All-in costs per ounce (on aco-product basis) | | 8,9 | | | $723 | | | | $595 | | | | $538 | | | | $1,025 | | | | $753 | | | | $905 | | | | $1,124 | | | | $1,354 | | | | $1,003 | | | | $734 | |
| | | | |
BARRICK YEAR-END 2017 | | 76 | | MANAGEMENT’S DISCUSSION AND ANALYSIS |
| | | | | | | | | | | | | | | | | | | | | | | | | | | | | | | | | | | | | | | | | | |
| ($ millions, except per ounce information in dollars) | | | | | | | | | For the year ended December 31, 2016 | |
| | | Footnote | | Barrick
Nevada | | | Pueblo
Viejo | | | Lagunas Norte | | | Veladero | | | Turquoise
Ridge | | | Acacia | | | Hemlo | | | Golden
Sunlight | | | Porgera | | | Kalgoorlie | |
Cost of sales related to
gold production | | | | | $1,896 | | | | $644 | | | | $276 | | | | $464 | | | | $155 | | | | $719 | | | | $188 | | | | $54 | | | | $203 | | | | $289 | |
| | | | | | | | | | | |
Depreciation | | | | | (807 | ) | | | (147 | ) | | | (96 | ) | | | (118 | ) | | | (27 | ) | | | (166 | ) | | | (26 | ) | | | (5 | ) | | | (34 | ) | | | (56 | ) |
| | | | | | | | | | | |
By-product credits | | 1 | | | (2 | ) | | | (90 | ) | | | (17 | ) | | | (27 | ) | | | — | | | | (39 | ) | | | (1 | ) | | | — | | | | (2 | ) | | | (2 | ) |
| | | | | | | | | | | |
Non-recurring items | | 2 | | | — | | | | 34 | | | | — | | | | (10 | ) | | | — | | | | — | | | | — | | | | — | | | | — | | | | — | |
| | | | | | | | | | | |
Other | | 3 | | | — | | | | 5 | | | | — | | | | — | | | | — | | | | 8 | | | | — | | | | — | | | | — | | | | 7 | |
| | | | | | | | | | | |
Non-controlling interests | | | | | — | | | | (170 | ) | | | — | | | | — | | | | — | | | | (188 | ) | | | — | | | | — | | | | — | | | | — | |
Cash costs | | | | | $1,087 | | | | $276 | | | | $163 | | | | $309 | | | | $128 | | | | $334 | | | | $161 | | | | $49 | | | | $167 | | | | $238 | |
General & administrative costs | | | | | — | | | | — | | | | — | | | | — | | | | — | | | | 55 | | | | — | | | | — | | | | — | | | | — | |
| | | | | | | | | | | |
Minesite exploration and evaluation costs | | 4 | | | 10 | | | | — | | | | 2 | | | | 1 | | | | — | | | | 3 | | | | — | | | | — | | | | 1 | | | | 5 | |
| | | | | | | | | | | |
Minesite sustaining capital expenditures | | 5 | | | 217 | | | | 101 | | | | 51 | | | | 95 | | | | 32 | | | | 190 | | | | 37 | | | | 2 | | | | 43 | | | | 21 | |
| | | | | | | | | | | |
Rehabilitation - accretion and amortization (operating sites) | | 6 | | | 26 | | | | 10 | | | | 8 | | | | 4 | | | | 1 | | | | 6 | | | | 1 | | | | 2 | | | | (2 | ) | | | 4 | |
| | | | | | | | | | | |
Non-controlling interests | | | | | (4 | ) | | | (44 | ) | | | — | | | | — | | | | — | | | | (88 | ) | | | — | | | | — | | | | — | | | | — | |
All-in sustaining costs | | | | | $1,336 | | | | $343 | | | | $224 | | | | $409 | | | | $161 | | | | $500 | | | | $199 | | | | $53 | | | | $209 | | | | $268 | |
Project exploration and evaluation and project costs | | 4 | | | 19 | | | | — | | | | — | | | | — | | | | — | | | | — | | | | — | | | | — | | | | — | | | | — | |
| | | | | | | | | | | |
Project capital expenditures | | 5 | | | 141 | | | | — | | | | 5 | | | | — | | | | — | | | | 1 | | | | — | | | | — | | | | — | | | | — | |
| | | | | | | | | | | |
Non-controlling interests | | | | | (30 | ) | | | — | | | | — | | | | — | | | | — | | | | — | | | | — | | | | — | | | | — | | | | — | |
All-in costs | | | | | $1,466 | | | | $343 | | | | $229 | | | | $409 | | | | $161 | | | | $501 | | | | $199 | | | | $53 | | | | $209 | | | | $268 | |
Ounces sold - equity basis (000s ounces) | | | | | 2,162 | | | | 700 | | | | 425 | | | | 532 | | | | 257 | | | | 522 | | | | 237 | | | | 36 | | | | 243 | | | | 380 | |
Cost of sales per ounce | | 7,8 | | | $876 | | | | $564 | | | | $651 | | | | $872 | | | | $603 | | | | $880 | | | | $795 | | | | $1,512 | | | | $836 | | | | $762 | |
Cash costs per ounce | | 8 | | | $502 | | | | $395 | | | | $383 | | | | $582 | | | | $498 | | | | $640 | | | | $679 | | | | $1,376 | | | | $689 | | | | $627 | |
| | | | | | | | | | | |
Cash costs per ounce
(on a co- product basis) | | 8,9 | | | $503 | | | | $473 | | | | $423 | | | | $632 | | | | $498 | | | | $677 | | | | $683 | | | | $1,385 | | | | $697 | | | | $615 | |
All-in sustaining costs per ounce | | 8 | | | $618 | | | | $490 | | | | $529 | | | | $769 | | | | $625 | | | | $958 | | | | $839 | | | | $1,493 | | | | $858 | | | | $706 | |
| | | | | | | | | | | |
All-in sustaining costs per ounce (on aco-product basis) | | 8,9 | | | $619 | | | | $568 | | | | $569 | | | | $819 | | | | $625 | | | | $995 | | | | $843 | | | | $1,502 | | | | $866 | | | | $694 | |
All-in costs per ounce | | 8 | | | $678 | | | | $490 | | | | $540 | | | | $769 | | | | $625 | | | | $960 | | | | $839 | | | | $1,493 | | | | $858 | | | | $706 | |
| | | | | | | | | | | |
All-in costs per ounce
(on a co-product basis) | | 8,9 | | | $679 | | | | $568 | | | | $580 | | | | $819 | | | | $625 | | | | $997 | | | | $843 | | | | $1,502 | | | | $866 | | | | $694 | |
| | | | |
BARRICK YEAR-END 2017 | | 77 | | MANAGEMENT’S DISCUSSION AND ANALYSIS |
| | | | | | | | | | | | | | | | | | | | | | | | | | | | | | | | | | | | | | | | | | |
| ($ millions, except per ounce information in dollars) | | | | | | | | | | | | For the year ended December 31, 2015 | |
| | | | | Barrick | | | Pueblo | | | Lagunas | | | | | | Turquoise | | | | | | | | | Golden | | | | | | |
| | | Footnote | | Nevada | | | Viejo | | | Norte | | | Veladero | | | Ridge | | | Acacia | | | Hemlo | | | Sunlight | | | Porgera | | | Kalgoorlie |
Cost of sales related to gold production | | | | | $1,551 | | | | $904 | | | | $378 | | | | $499 | | | | $141 | | | | $837 | | | | $192 | | | | $134 | | | | $375 | | | | $306 | |
| | | | | | | | | | | |
Depreciation | | | | | (537 | ) | | | (277 | ) | | | (169 | ) | | | (108 | ) | | | (23 | ) | | | (143 | ) | | | (38 | ) | | | (38 | ) | | | (37 | ) | | | (74 | ) |
By-product credits | | 1 | | | (2 | ) | | | (120 | ) | | | (18 | ) | | | (22 | ) | | | — | | | | (36 | ) | | | (1 | ) | | | (2 | ) | | | (1 | ) | | | (1 | ) |
Non-recurring items | | 2 | | | (12 | ) | | | (47 | ) | | | (5 | ) | | | (21 | ) | | | (1 | ) | | | (109 | ) | | | — | | | | (11 | ) | | | — | | | | — | |
Other | | 3 | | | — | | | | 13 | | | | — | | | | — | | | | — | | | | 8 | | | | — | | | | — | | | | — | | | | 6 | |
| | | | | | | | | | | |
Non-controlling interests | | | | | — | | | | (194 | ) | | | — | | | | — | | | | — | | | | (200 | ) | | | — | | | | — | | | | — | | | | — | |
Cash costs | | | | | $1,000 | | | | $279 | | | | $186 | | | | $348 | | | | $117 | | | | $357 | | | | $153 | | | | $83 | | | | $337 | | | | $237 | |
General & administrative costs | | | | | — | | | | — | | | | — | | | | — | | | | — | | | | 42 | | | | — | | | | — | | | | — | | | | — | |
| | | | | | | | | | | |
Minesite exploration and evaluation costs | | 4 | | | 12 | | | | 1 | | | | 3 | | | | 2 | | | | — | | | | 2 | | | | 1 | | | | 2 | | | | 2 | | | | 2 | |
| | | | | | | | | | | |
Minesite sustaining capital expenditures | | 5 | | | 211 | | | | 102 | | | | 67 | | | | 242 | | | | 32 | | | | 178 | | | | 38 | | | | 7 | | | | 93 | | | | 34 | |
| | | | | | | | | | | |
Rehabilitation - accretion and amortization (operating sites) | | 6 | | | 27 | | | | 25 | | | | 32 | | | | 4 | | | | 1 | | | | 9 | | | | 1 | | | | 13 | | | | 2 | | | | 7 | |
| | | | | | | | | | | |
Non-controlling interests | | | | | — | | | | (51 | ) | | | — | | | | — | | | | — | | | | (75 | ) | | | — | | | | — | | | | — | | | | — | |
All-in sustaining costs | | | | | $1,250 | | | | $356 | | | | $288 | | | | $596 | | | | $150 | | | | $513 | | | | $193 | | | | $105 | | | | $434 | | | | $280 | |
Project exploration and evaluation and project costs | | 4 | | | 40 | | | | — | | | | — | | | | — | | | | — | | | | — | | | | — | | | | — | | | | — | | | | — | |
| | | | | | | | | | | |
Project capital expenditures | | 5 | | | 159 | | | | — | | | | — | | | | — | | | | — | | | | (1 | ) | | | 39 | | | | — | | | | — | | | | — | |
Non-controlling interests | | | | | (31 | ) | | | — | | | | — | | | | — | | | | — | | | | — | | | | — | | | | — | | | | — | | | | — | |
All-in costs | | | | | $1,418 | | | | $356 | | | | $288 | | | | $596 | | | | $150 | | | | $512 | | | | $232 | | | | $105 | | | | $434 | | | | $280 | |
Ounces sold - equity basis (000s ounces) | | | | | 1,981 | | | | 597 | | | | 565 | | | | 629 | | | | 202 | | | | 461 | | | | 216 | | | | 76 | | | | 426 | | | | 315 | |
Cost of sales per ounce | | 7,8 | | | $782 | | | | $881 | | | | $669 | | | | $792 | | | | $697 | | | | $1,161 | | | | $887 | | | | $1,768 | | | | $881 | | | | $973 | |
Cash costs per ounce | | 8 | | | $504 | | | | $467 | | | | $329 | | | | $552 | | | | $581 | | | | $772 | | | | $708 | | | | $1,098 | | | | $791 | | | | $752 | |
| | | | | | | | | | | |
Cash costs per ounce (on aco-product basis) | | 8,9 | | | $505 | | | | $595 | | | | $361 | | | | $587 | | | | $581 | | | | $810 | | | | $711 | | | | $1,121 | | | | $794 | | | | $738 | |
All-in sustaining costs per ounce | | 8 | | | $631 | | | | $597 | | | | $509 | | | | $946 | | | | $742 | | | | $1,112 | | | | $895 | | | | $1,379 | | | | $1,018 | | | | $886 | |
| | | | | | | | | | | |
All-in sustaining costs per ounce (on aco-product basis) | | 8,9 | | | $632 | | | | $725 | | | | $541 | | | | $981 | | | | $742 | | | | $1,150 | | | | $898 | | | | $1,402 | | | | $1,021 | | | | $872 | |
All-in costs per ounce | | 8 | | | $715 | | | | $597 | | | | $509 | | | | $946 | | | | $742 | | | | $1,111 | | | | $1,075 | | | | $1,379 | | | | $1,018 | | | | $886 | |
| | | | | | | | | | | |
All-in costs per ounce (on aco-product basis) | | 8,9 | | | $716 | | | | $725 | | | | $541 | | | | $981 | | | | $742 | | | | $1,149 | | | | $1,078 | | | | $1,402 | | | | $1,021 | | | | $872 | |
Revenues include the sale ofby-products for our gold mines and energy sales from the Monte Rio power plant at our Pueblo Viejo mine for the three months ended December 31, 2017 of $nil (2016: $nil) and the year ended December 31, 2017 of $nil (2016: $33 million; 2015: $74 million) up until its disposition on August 18, 2016.
These gains/costs are not indicative of our cost of production and have been excluded from the calculation of cash costs.
Other adjustments include adding the net margins related to power sales at Pueblo Viejo of $nil and $nil, respectively, for the three months and year ended December 31, 2017 (2016: $nil and $5 million, respectively; 2015: $12 million) and adding the cost of treatment and refining charges of $1 million and $1 million, respectively, for the three months and year ended December 31, 2017 (2016: $2 million and $9 million, respectively; 2015: $8 million).
| | 4 | Exploration and evaluation costs |
Exploration, evaluation and project expenses are presented as minesite if it supports current mine operations and project if it relates to future projects. Refer to page 44 of this MD&A.
Capital expenditures are related to our gold sites only and are presented on a 100% accrued basis. They are split between minesite sustaining and project capital expenditures. Project capital expenditures are distinct projects designed to increase the net present value of the mine and are not related to current production. Significant projects in the current year are Crossroads, Cortez Hills Lower Zone, Range Front Declines and Goldrush. Refer to page 43 of this MD&A.
| | 6 | Rehabilitation - accretion and amortization |
Includes depreciation on the assets related to rehabilitation provisions of our gold operations and accretion on the rehabilitation provisions of our gold operations, split between operating andnon-operating sites.
| | | | |
BARRICK YEAR-END 2017 | | 78 | | MANAGEMENT’S DISCUSSION AND ANALYSIS |
Cost of sales related to gold per ounce is calculated using cost of sales on an attributable basis (removing thenon-controlling interest of 40% Pueblo Viejo and 36.1% Acacia from cost of sales), divided by attributable gold ounces.
Cost of sales per ounce, cash costs per ounce,all-in sustaining costs per ounce andall-in costs per ounce may not calculate based on amounts presented in this table due to rounding.
| | 9 | Co-product costs per ounce |
Cost of sales per ounce, cash costs per ounce,all-in sustaining costs per ounce andall-in costs per ounce may not calculate based on amounts presented in this table due to rounding.
| | | | | | | | | | | | | | | | | | | | | | | | | | | | | | | | | | | | | | | | |
| ($ millions) | | | | | | | | | | | | | | | | | For the three months ended December 31, 2017 | |
| | | Barrick | | | Pueblo | | | Lagunas | | | | | | Turquoise | | | | | | | | | Golden | | | | | | | |
| | | Nevada | | | Viejo | | | Norte | | | Veladero | | | Ridge | | | Acacia | | | Hemlo | | | Sunlight | | | Porgera | | | Kalgoorlie | |
| By-product credits | | $ | 1 | | | $ | 14 | | | $ | 4 | | | $ | 5 | | | $ | — | | | $ | — | | | $ | — | | | $ | — | | | $ | 1 | | | $ | — | |
| Non-controlling interest | | | — | | | | (6 | ) | | | — | | | | — | | | | — | | | | — | | | | — | | | | — | | | | — | | | | — | |
By-product credits (net of non-controlling interest) | | $ | 1 | | | $ | 8 | | | $ | 4 | | | $ | 5 | | | $ | — | | | $ | — | | | $ | — | | | $ | — | | | $ | 1 | | | $ | — | |
| | | | | | | | | | | | | | | | | | For the three months ended December 31, 2016 | |
| | | Barrick | | | Pueblo | | | Lagunas | | | | | | Turquoise | | | | | | | | | Golden | | | | | | | |
| | | Nevada | | | Viejo | | | Norte | | | Veladero | | | Ridge | | | Acacia | | | Hemlo | | | Sunlight | | | Porgera | | | Kalgoorlie | |
| By-product credits | | $ | 1 | | | $ | 17 | | | $ | 4 | | | $ | 7 | | | $ | — | | | $ | 10 | | | $ | — | | | $ | — | | | $ | — | | | $ | — | |
| Non-controlling interest | | | — | | | | (9 | ) | | | — | | | | — | | | | — | | | | (4 | ) | | | — | | | | — | | | | — | | | | — | |
By-product credits (net of non-controlling interest) | | $ | 1 | | | $ | 8 | | | $ | 4 | | | $ | 7 | | | $ | — | | | $ | 6 | | | $ | — | | | $ | — | | | $ | — | | | $ | — | |
| | | | | | | | | | | | | | | | | | | | | For the year ended December 31, 2017 | |
| | | Barrick | | | Pueblo | | | Lagunas | | | | | | Turquoise | | | | | | | | | Golden | | | | | | | |
| | | Nevada | | | Viejo | | | Norte | | | Veladero | | | Ridge | | | Acacia | | | Hemlo | | | Sunlight | | | Porgera | | | Kalgoorlie | |
| By-product credits | | $ | 3 | | | $ | 72 | | | $ | 16 | | | $ | 17 | | | $ | — | | | $ | 7 | | | $ | 1 | | | $ | — | | | $ | 3 | | | $ | 2 | |
| Non-controlling interest | | | — | | | | (28 | ) | | | — | | | | — | | | | — | | | | (3 | ) | | | — | | | | — | | | | — | | | | — | |
By-product credits (net of non-controlling interest) | | $ | 3 | | | $ | 44 | | | $ | 16 | | | $ | 17 | | | $ | — | | | $ | 4 | | | $ | 1 | | | $ | — | | | $ | 3 | | | $ | 2 | |
| | | | | | | | | | | | | | | | | | | | | For the year ended December 31, 2016 | |
| | | Barrick | | | Pueblo | | | Lagunas | | | | | | Turquoise | | | | | | | | | Golden | | | | | | | |
| | | Nevada | | | Viejo | | | Norte | | | Veladero | | | Ridge | | | Acacia | | | Hemlo | | | Sunlight | | | Porgera | | | Kalgoorlie | |
| By-product credits | | $ | 2 | | | $ | 90 | | | $ | 17 | | | $ | 27 | | | $ | — | | | $ | 39 | | | $ | 1 | | | $ | — | | | $ | 2 | | | $ | 2 | |
| Non-controlling interest | | | — | | | | (39 | ) | | | — | | | | — | | | | — | | | | (14 | ) | | | — | | | | — | | | | — | | | | — | |
By-product credits (net of non-controlling interest) | | $ | 2 | | | $ | 51 | | | $ | 17 | | | $ | 27 | | | $ | — | | | $ | 25 | | | $ | 1 | | | $ | — | | | $ | 2 | | | $ | 2 | |
| | | | | | | | | | | | | | | | | | | | | For the year ended December 31, 2015 | |
| | | Barrick | | | Pueblo | | | Lagunas | | | | | | Turquoise | | | | | | | | | Golden | | | | | | | |
| | | Nevada | | | Viejo | | | Norte | | | Veladero | | | Ridge | | | Acacia | | | Hemlo | | | Sunlight | | | Porgera | | | Kalgoorlie | |
| By-product credits | | $ | 2 | | | $ | 120 | | | $ | 18 | | | $ | 22 | | | $ | — | | | $ | 36 | | | $ | 1 | | | $ | 2 | | | $ | 1 | | | $ | 1 | |
| Non-controlling interest | | | — | | | | (49 | ) | | | — | | | | — | | | | — | | | | (13 | ) | | | — | | | | — | | | | — | | | | — | |
By-product credits (net of non-controlling interest) | | $ | 2 | | | $ | 71 | | | $ | 18 | | | $ | 22 | | | $ | — | | | $ | 23 | | | $ | 1 | | | $ | 2 | | | $ | 1 | | | $ | 1 | |
| | | | |
BARRICK YEAR-END 2017 | | 79 | | MANAGEMENT’S DISCUSSION AND ANALYSIS |
Reconciliation of Copper Cost of Sales to C1 cash costs andAll-in sustaining costs, including on a per pound basis
| | | | | | | | | | | | | | | | | | | | |
| ($ millions, except per pound information in dollars) | | For the years ended December 31 | | | For the three months ended December 31 | |
| | | 2017 | | | 2016 | | | 2015 | | | 2017 | | | 2016 | |
Cost of sales | | | $399 | | | | $319 | | | | $814 | | | | $107 | | | | $84 | |
Depreciation/amortization | | | (83 | ) | | | (45 | ) | | | (104 | ) | | | (24 | ) | | | (15 | ) |
Treatment and refinement charges | | | 157 | | | | 167 | | | | 178 | | | | 41 | | | | 43 | |
Cash cost of sales applicable to equity method investments | | | 245 | | | | 203 | | | | 23 | | | | 75 | | | | 53 | |
Less: royalties | | | (38 | ) | | | (41 | ) | | | (101 | ) | | | (11 | ) | | | (9 | ) |
By-product credits | | | (5 | ) | | | — | | | | (1 | ) | | | (1 | ) | | | — | |
Other | | | — | | | | — | | | | 72 | | | | — | | | | — | |
C1 cash cost of sales | | | $675 | | | | $603 | | | | $881 | | | | $187 | | | | $156 | |
General & administrative costs | | | 12 | | | | 14 | | | | 21 | | | | 3 | | | | 3 | |
Rehabilitation - accretion and amortization | | | 12 | | | | 7 | | | | 6 | | | | 3 | | | | 2 | |
Royalties | | | 38 | | | | 41 | | | | 101 | | | | 11 | | | | 9 | |
Minesite exploration and evaluation costs | | | 6 | | | | — | | | | — | | | | 1 | | | | — | |
Minesite sustaining capital expenditures | | | 204 | | | | 169 | | | | 177 | | | | 67 | | | | 48 | |
All-in sustaining costs | | | $947 | | | | $834 | | | | $1,186 | | | | $272 | | | | $218 | |
Pounds sold - consolidated basis (millions pounds) | | | 405 | | | | 405 | | | | 510 | | | | 107 | | | | 107 | |
Cost of sales per pound1,2 | | | $1.77 | | | | $1.41 | | | | $1.65 | | | | $1.79 | | | | $1.43 | |
C1 cash cost per pound1 | | | $1.66 | | | | $1.49 | | | | $1.73 | | | | $1.72 | | | | $1.47 | |
All-in sustaining costs per pound1 | | | $2.34 | | | | $2.05 | | | | $2.33 | | | | $2.51 | | | | $2.04 | |
| | 1 | Cost of sales per pound, C1 cash costs per pound andall-in sustaining costs per pound may not calculate based on amounts presented in this table due to rounding. |
| | 2 | Cost of sales per pound related to copper is calculated using cost of sales including our proportionate share of cost of sales attributable to equity method investments (Zaldívar and Jabal Sayid), divided by consolidated copper pounds (including our proportionate share of copper pounds from our equity method investments). |
| | | | |
BARRICK YEAR-END 2017 | | 80 | | MANAGEMENT’S DISCUSSION AND ANALYSIS |
Reconciliation of Copper Cost of Sales to C1 cash costs andAll-in sustaining costs, including on a per pound basis, by operating site
| | | | | | | | | | | | | | | | | | | | | | | | |
| ($ millions, except per pound information in dollars) | | | For the three months ended December 31 | |
| | | 2017 | | | | | | | | | 2016 | | | | |
| | | Zaldívar | | | Lumwana | | | Jabal Sayid | | | Zaldívar | | | Lumwana | | | Jabal Sayid | |
Cost of sales | | | 73 | | | | 104 | | | | 23 | | | | 59 | | | | 84 | | | | 11 | |
Depreciation/amortization | | | (16 | ) | | | (24 | ) | | | (5 | ) | | | (13 | ) | | | (15 | ) | | | (3 | ) |
Treatment and refinement charges | | | — | | | | 37 | | | | 4 | | | | — | | | | 41 | | | | 2 | |
Less: royalties | | | — | | | | (11 | ) | | | — | | | | — | | | | (9 | ) | | | — | |
By-product credits | | | — | | | | — | | | | — | | | | — | | | | — | | | | — | |
C1 cash cost of sales | | | 57 | | | | 106 | | | | 22 | | | | 46 | | | | 101 | | | | 10 | |
Rehabilitation - accretion and amortization | | | — | | | | 3 | | | | — | | | | — | | | | 3 | | | | — | |
Royalties | | | — | | | | 11 | | | | — | | | | — | | | | 9 | | | | — | |
Minesite exploration and evaluation costs | | | 1 | | | | — | | | | — | | | | — | | | | — | | | | — | |
Minesite sustaining capital expenditures | | | 21 | | | | 43 | | | | 3 | | | | 16 | | | | 27 | | | | 6 | |
All-in sustaining costs | | | 79 | | | | 163 | | | | 25 | | | | 62 | | | | 140 | | | | 16 | |
Pounds sold - consolidated basis (millions pounds) | | | 32 | | | | 65 | | | | 10 | | | | 31 | | | | 70 | | | | 6 | |
Cost of sales per pound1,2 | | | 2.29 | | | | 1.60 | | | | 2.15 | | | | 1.87 | | | | 1.20 | | | | 1.89 | |
C1 cash cost per pound1 | | | 1.78 | | | | 1.63 | | | | 2.05 | | | | 1.46 | | | | 1.45 | | | | 1.79 | |
All-in sustaining costs per pound1 | | | 2.45 | | | | 2.52 | | | | 2.41 | | | | 1.97 | | | | 1.99 | | | | 2.73 | |
| | | | | | | | | | | | | | | | | | | | | | | | | | | | | | | | | | | | |
| ($ millions, except per pound information in dollars) | | | | | | | | | | | | | | | For the years ended December 31 | |
| | | | | | 2017 | | | | | | | | | 2016 | | | | | | | | | 2015 | | | | |
| | | Zaldívar | | | Lumwana | | | Jabal
Sayid | | | Zaldívar | | | Lumwana | | | Jabal
Sayid | | | Zaldívar | | | Lumwana | | | Jabal
Sayid | |
Cost of sales | | $ | 243 | | | $ | 396 | | | $ | 75 | | | $ | 221 | | | $ | 319 | | | $ | 33 | | | $ | 424 | | | $ | 418 | | | $ | — | |
Depreciation/amortization | | | (55 | ) | | | (83 | ) | | | (17 | ) | | | (44 | ) | | | (45 | ) | | | (6 | ) | | | (50 | ) | | | (59 | ) | | | — | |
Treatment and refinement charges | | | — | | | | 144 | | | | 14 | | | | — | | | | 161 | | | | 6 | | | | — | | | | 178 | | | | — | |
Less: royalties | | | — | | | | (38 | ) | | | — | | | | — | | | | (41 | ) | | | — | | | | — | | | | (101 | ) | | | — | |
By-product credits | | | — | | | | — | | | | (5 | ) | | | — | | | | — | | | | — | | | | (1 | ) | | | — | | | | — | |
Other | | | — | | | | — | | | | — | | | | — | | | | — | | | | — | | | | — | | | | 72 | | | | — | |
C1 cash cost of sales | | $ | 188 | | | $ | 419 | | | $ | 67 | | | $ | 177 | | | $ | 394 | | | $ | 33 | | | $ | 373 | | | $ | 508 | | | $ | — | |
Rehabilitation - accretion and amortization | | | — | | | | 12 | | | | — | | | | — | | | | 7 | | | | — | | | | 1 | | | | 5 | | | | — | |
Royalties | | | — | | | | 38 | | | | — | | | | — | | | | 41 | | | | — | | | | — | | | | 101 | | | | — | |
Minesite exploration and evaluation costs | | | 4 | | | | 2 | | | | — | | | | — | | | | — | | | | — | | | | — | | | | — | | | | — | |
Minesite sustaining capital expenditures | | | 58 | | | | 123 | | | | 23 | | | | 56 | | | | 96 | | | | 17 | | | | 78 | | | | 99 | | | | — | |
All-in sustaining costs | | $ | 250 | | | $ | 594 | | | $ | 90 | | | $ | 233 | | | $ | 538 | | | $ | 50 | | | $ | 452 | | | $ | 713 | | | $ | — | |
Pounds sold - consolidated basis (millions pounds) | | | 113 | | | | 253 | | | | 39 | | | | 114 | | | | 274 | | | | 17 | | | | 215 | | | | 295 | | | | — | |
Cost of sales per pound1,2 | | $ | 2.15 | | | $ | 1.57 | | | $ | 1.90 | | | $ | 1.93 | | | $ | 1.16 | | | $ | 1.98 | | | $ | 1.97 | | | $ | 1.42 | | | $ | — | |
C1 cash cost per pound1 | | $ | 1.66 | | | $ | 1.66 | | | $ | 1.70 | | | $ | 1.55 | | | $ | 1.44 | | | $ | 1.97 | | | $ | 1.74 | | | $ | 1.72 | | | $ | — | |
All-in sustaining costs per pound1 | | $ | 2.21 | | | $ | 2.35 | | | $ | 2.30 | | | $ | 2.05 | | | $ | 1.97 | | | $ | 2.98 | | | $ | 2.11 | | | $ | 2.42 | | | $ | — | |
| 1 | Cost of sales per pound, C1 cash costs per pound andall-in sustaining costs per pound may not calculate based on amounts presented in this table due to rounding. |
| 2 | Cost of sales per pound applicable to copper is calculated using cost of sales including our proportionate share of cost of sales attributable to equity method investments (Zaldívar and Jabal Sayid), divided by consolidated copper pounds (including our proportionate share of copper pounds from our equity method investments). |
| | | | |
BARRICK YEAR-END 2017 | | 81 | | MANAGEMENT’S DISCUSSION AND ANALYSIS |
EBITDA and Adjusted EBITDA
EBITDA is anon-GAAP financial measure, which excludes the following from net earnings:
Management believes that EBITDA is a valuable indicator of our ability to generate liquidity by producing operating cash flow to fund working capital needs, service debt obligations, and fund capital expenditures. Management uses EBITDA for this purpose. EBITDA is also frequently used by investors and analysts for valuation purposes whereby EBITDA is multiplied by a factor or “EBITDA multiple” that is based on an observed or inferred relationship between EBITDA and market values to determine the approximate total enterprise value of a company.
Adjusted EBITDA removes the effect of “impairment charges” and starting in the second quarter 2017 MD&A, we began including additional adjusting items in the Adjusted EBITDA reconciliation to provide a greater level of consistency with the adjusting items included in our Adjusted Net Earnings reconciliation. These new items include: acquisition/disposition gains/losses; foreign
currency translation gains/losses; other expense adjustments; and unrealized gains onnon-hedge derivative instruments. These amounts are adjusted to remove any impact on finance costs/income, income tax expense and/or depreciation as they do not affect EBITDA. The prior periods have been restated to reflect the change in presentation. We believe this additional information will assist analysts, investors and other stakeholders of Barrick in better understanding our ability to generate liquidity from operating cash flow, by excluding these amounts from the calculation as they are not indicative of the performance of our core mining business and not necessarily reflective of the underlying operating results for the periods presented.
EBITDA and adjusted EBITDA are intended to provide additional information to investors and analysts and do not have any standardized definition under IFRS, and should not be considered in isolation or as a substitute for measures of performance prepared in accordance with IFRS. EBITDA and adjusted EBITDA exclude the impact of cash costs of financing activities and taxes, and the effects of changes in operating working capital balances, and therefore are not necessarily indicative of operating profit or cash flow from operations as determined under IFRS. Other companies may calculate EBITDA and adjusted EBITDA differently.
Reconciliation of Net Earnings to EBITDA and Adjusted EBITDA
| | | | | | | | | | | | | | | | | | | | |
| ($ millions) | | | | | For the years ended December 31 | | | For the three months ended December 31 | |
| | | 2017 | | | 2016 | | | 2015 | | | 2017 | | | 2016 | |
Net earnings (loss) | | | $1,516 | | | | $861 | | | | ($3,113 | ) | | | ($467 | ) | | | $512 | |
Income tax expense | | | 1,231 | | | | 917 | | | | (31 | ) | | | 51 | | | | 223 | |
Finance costs, net1 | | | 624 | | | | 725 | | | | 663 | | | | 115 | | | | 200 | |
Depreciation | | | 1,647 | | | | 1,574 | | | | 1,771 | | | | 434 | | | | 418 | |
EBITDA | | | $5,018 | | | | $4,077 | | | | ($710 | ) | | | $133 | | | | $1,353 | |
Impairment charges (reversals) of long-lived assets2 | | | (212 | ) | | | (250 | ) | | | 3,897 | | | | 916 | | | | (304 | ) |
Acquisition/disposition (gains)/losses3 | | | (911 | ) | | | 42 | | | | (187 | ) | | | (29 | ) | | | 7 | |
Foreign currency translation (gains)/losses | | | 72 | | | | 199 | | | | 120 | | | | 12 | | | | 18 | |
Other expense adjustments4 | | | 51 | | | | (15 | ) | | | 203 | | | | 17 | | | | (20 | ) |
Unrealized gains onnon-hedge derivative instruments | | | (1 | ) | | | (32 | ) | | | 11 | | | | 5 | | | | (9 | ) |
Adjusted EBITDA | | | $4,017 | | | | $4,021 | | | | $3,334 | | | | $1,054 | | | | $1,045 | |
| | 1 | Finance costs exclude accretion. |
| | 2 | Net impairment reversals for the current year primarily relate to impairment reversals at the Cerro Casale project upon reclassification of the project’s net assets asheld-for-sale as at March 31, 2017 and impairment reversals at Lumwana during the fourth quarter of 2017, partially offset by net impairments at Acacia’s Bulyanhulu mine and the Pascua-Lama project during the fourth quarter of 2017. |
| | 3 | Disposition gains for the current year primarily relate to the sale of a 50% interest in the Veladero mine and the gain related to the sale of a 25% interest in the Cerro Casale project. |
| | 4 | Other expense adjustments primarily consist of reduced operations program costs at Acacia’s Bulyanhulu mine. |
| | | | |
BARRICK YEAR-END 2017 | | 82 | | MANAGEMENT’S DISCUSSION AND ANALYSIS |
Reconciliation of Segment Income to Segment EBITDA
| | | | | | | | | | | | | | | | |
($ millions) | | | | | | | | | For the year ended December 31, 2017 | |
| | | Barrick Nevada | | Pueblo Viejo (60%) | | | Lagunas Norte | | Veladero | | Turquoise Ridge | | Acacia (100%) | |
Segment Income | | $1,052 | | | $ 395 | | | $ 259 | | $ 173 | | $ 119 | | | $ 191 | |
Depreciation | | 793 | | | 143 | | | 68 | | 119 | | 28 | | | 107 | |
Segment EBITDA | | $ 1,845 | | | $ 538 | | | $ 327 | | $ 292 | | $ 147 | | | $ 298 | |
| | | | | | | | | | For the year ended December 31, 2016 | |
| | | Barrick Nevada | | Pueblo Viejo
(60%) | | | Lagunas Norte | | Veladero | | Turquoise Ridge | | Acacia
(100%) | |
Segment Income | | $771 | | | $528 | | | $260 | | $220 | | $166 | | | $299 | |
Depreciation | | 807 | | | 93 | | | 96 | | 118 | | 27 | | | 166 | |
Segment EBITDA | | $1,578 | | | $621 | | | $356 | | $338 | | $193 | | | $465 | |
| | | | | | | | | | For the year ended December 31, 2015 | |
| | | Barrick Nevada | | Pueblo Viejo
(60%) | | | Lagunas Norte | | Veladero | | Turquoise Ridge | | Acacia
(100%) | |
Segment Income | | $678 | | | $230 | | | $285 | | $216 | | $92 | | | ($1 | ) |
Depreciation | | 537 | | | 160 | | | 169 | | 108 | | 23 | | | 143 | |
Segment EBITDA | | $1,215 | | | $390 | | | $454 | | $324 | | $115 | | | $142 | |
| | | | |
BARRICK YEAR-END 2017 | | 83 | | MANAGEMENT’S DISCUSSION AND ANALYSIS |
Realized Price
Realized price is anon-GAAP financial measure which excludes from sales:
| | ● | Unrealized gains and losses onnon-hedge derivative contracts; |
| | ● | Unrealizedmark-to-market gains and losses on provisional pricing from copper and gold sales contracts; |
| | ● | Sales attributable to ore purchase arrangements; |
| | ● | Treatment and refining charges; and |
This measure is intended to enable Management to better understand the price realized in each reporting period for gold and copper sales because unrealizedmark-to-market values ofnon-hedge gold and copper derivatives are subject to change each period due to changes in market factors such as market and forward gold and copper prices, so that prices ultimately realized may differ from those recorded. The exclusion of such unrealizedmark-to-market gains and losses from the presentation of this performance measure enables investors to understand performance based on the realized proceeds of selling gold and copper production.
The gains and losses onnon-hedge derivatives and receivable balances relate to instruments/balances that
mature in future periods, at which time the gains and losses will become realized. The amounts of these gains and losses reflect fair values based on market valuation assumptions at the end of each period and do not necessarily represent the amounts that will become realized on maturity. We also exclude export duties that are paid upon sale and netted against revenues as well as treatment and refining charges that are paid to the refiner on gold and copper concentrate sales that are netted against revenues. We believe this provides investors and analysts with a more accurate measure with which to compare to market gold prices and to assess our gold sales performance. For those reasons, management believes that this measure provides a more accurate reflection of our Company’s past performance and is a better indicator of its expected performance in future periods.
The realized price measure is intended to provide additional information, and does not have any standardized definition under IFRS and should not be considered in isolation or as a substitute for measures of performance prepared in accordance with IFRS. The measure is not necessarily indicative of sales as determined under IFRS. Other companies may calculate this measure differently. The following table reconciles realized prices to the most directly comparable IFRS measure.
Reconciliation of Sales to Realized Price per ounce/pound
| | | | | | | | | | | | | | | | | | | | | | | | |
| For the years ended December 31 | |
| ($ millions, except per ounce/pound information in dollars) | | | | | Gold | | | | | | | | | Copper | | | | |
| | | 2017 | | | 2016 | | | 2015 | | | 2017 | | | 2016 | | | 2015 | |
Sales | | | $7,631 | | | | $7,908 | | | | $7,813 | | | | $608 | | | | $466 | | | | $1,002 | |
Sales applicable tonon-controlling interests | | | (810 | ) | | | (948 | ) | | | (826 | ) | | | — | | | | — | | | | — | |
Sales applicable to equity method investments1,2 | | | — | | | | — | | | | — | | | | 427 | | | | 293 | | | | 26 | |
Realizednon-hedge gold/copper derivative (losses) gains | | | 3 | | | | (2 | ) | | | — | | | | — | | | | — | | | | — | |
Sales applicable to Pierina3 | | | (153 | ) | | | (112 | ) | | | — | | | | — | | | | — | | | | — | |
Treatment and refinement charges | | | 1 | | | | 16 | | | | 14 | | | | 157 | | | | 167 | | | | 178 | |
Export duties | | | — | | | | 2 | | | | 34 | | | | — | | | | — | | | | — | |
Revenues - as adjusted | | | $6,672 | | | | $6,864 | | | | $7,035 | | | | $1,192 | | | | $926 | | | | $1,206 | |
Ounces/pounds sold (000s ounces/millions pounds)3 | | | 5,302 | | | | 5,503 | | | | 6,083 | | | | 405 | | | | 405 | | | | 510 | |
Realized gold/copper price per ounce/pound4 | | | $1,258 | | | | $1,248 | | | | $1,157 | | | | $2.95 | | | | $2.29 | | | | $2.37 | |
| | 1 | Represents sales of $325 million for the year ended December 31, 2017 (2016: $259 million; 2015: $26 million) applicable to our 50% equity method investment in Zaldívar and $116 million (2016: $40 million; 2015: $nil) applicable to our 50% equity method investment in Jabal Sayid. |
| | 2 | Sales applicable to equity method investments are net of treatment and refinement charges. |
| | 3 | Figures exclude Pierina from the calculation of realized price per ounce, which is mining incidental ounces as it enters closure. |
| | 4 | Realized price per ounce/pound may not calculate based on amounts presented in this table due to rounding. |
| | | | |
BARRICK YEAR-END 2017 | | 84 | | MANAGEMENT’S DISCUSSION AND ANALYSIS |
TECHNICAL INFORMATION
The scientific and technical information contained in this MD&A has been reviewed and approved by Steven Haggarty, P. Eng., Senior Director, Metallurgy of Barrick; Rick Sims, Registered Member SME, Vice President, Reserves and Resources of Barrick; and Patrick Garretson, Registered Member SME, Senior Director, Life of Mine Planning of Barrick who are each a “Qualified Person” as defined in National Instrument43-101 -Standards of Disclosure for Mineral Projects.
ENDNOTES
| 1 | These arenon-GAAP financial performance measures with no standardized meaning under IFRS and therefore may not be comparable to similar measures presented by other issuers. For further information and a detailed reconciliation of eachnon-GAAP measure to the most directly comparable IFRS measure, please see pages 69 to 84 of this MD&A. |
| 2 | Amount excludes capital leases and includes Acacia (100% basis). |
| 3 | Includes $87 million cash primarily held at Acacia, which may not be readily deployed. |
| 4 | Cost of sales related to gold per ounce is calculated using cost of sales related to gold on an attributable basis (removing thenon-controlling interest of 40% Pueblo Viejo and 36.1% Acacia from cost of sales), divided by attributable gold ounces. Cost of sales related to copper per pound is calculated using cost of sales related to copper including our proportionate share of cost of sales attributable to equity method investments (Zaldívar and Jabal Sayid), divided by consolidated copper pounds (including our proportionate share of copper pounds from our equity method investments). |
| 5 | Total reportable incident frequency rate (TRIFR) is a ratio calculated as follows: number of reportable injuries x 200,000 hours divided by the total number of hours worked. Reportable injuries include fatalities, lost time injuries, restricted duty injuries, and medically treated injuries. |
| 6 | Estimated in accordance with National Instrument43-101 as required by Canadian securities regulatory authorities. Estimates are as of December 31, 2017, unless otherwise noted. Proven reserves of 398.2 million tonnes grading 1.91 g/t, representing 24.4 million ounces of gold, and 170.7 million tonnes grading 0.556%, representing 2.095 billion pounds of copper. Probable reserves of 0.9 billion tonnes grading 1.39 g/t, representing 40.0 million ounces of gold, and 456.7 million tonnes grading 0.592%, representing 5.956 billion pounds of copper. Measured resources of 400.0 million tonnes grading 0.92 g/t, representing 11.8 million ounces of gold, and 90.9 million tonnes grading 0.401%, representing 803.1 million pounds of copper. Indicated resources of 1.6 billion tonnes grading 1.54 g/t, representing 76.8 million ounces of gold, and 581.2 million tonnes grading 0.506%, representing 6.484 billion pounds of copper. Inferred resources of 795.4 million tonnes grading 1.21 g/t, representing 30.8 million ounces of gold, and 125.4 million tonnes grading 0.482%, representing 1.331 billion pounds of copper. Pascua-Lama measured resources of 42.8 million tonnes grading 1.86 g/t representing 2.6 ounces of gold, and indicated resources of 391.7 tonnes grading 1.49 g/t, representing 18.8 ounces of gold. Goldrush probable reserves of 5.7 tonnes grading 8.12 g/t, representing 1.5 ounces of gold. Norte Abierto (formerly known as the Cerro Casale project, comprised of the Cerro Casale, Caspiche and Luciano deposits) proven reserves of 114.9 million tonnes grading 0.65 g/t (50 percent basis) representing 2.4 million ounces of gold (50 percent basis), and probable reserves of 484.0 million tonnes grading 0.59 g/t (50 percent basis), representing 9.2 million ounces of gold (50 percent basis). Norte Abierto measured resources of 310.1 million tonnes grading 0.57 g/t (50 percent basis) representing 5.7 million ounces of gold (50 percent basis, indicated resources of 391.8 million tonnes grading 0.47 g/t (50 percent basis) representing 6.0 million ounces of gold (50 percent basis), and inferred resources of 99.1 million tonnes grading 0.29 g/t (50 percent basis) representing 0.9 million ounces of gold (50 percent basis). Complete mineral reserve and mineral resource data for all mines and projects referenced in this MD&A, including tonnes, grades, and ounces, can be found on pages87-92 of Barrick’s Fourth Quarter andYear-End 2017 Report. |
| | | | |
BARRICK YEAR-END 2017 | | 85 | | MANAGEMENT’S DISCUSSION AND ANALYSIS |
GLOSSARY OF TECHNICAL TERMS
ALL-IN SUSTAINING COSTS: A measure of cost per ounce/pound for gold/copper. Refer to page 72 of this MD&A for further information and a reconciliation of the measure.
AUTOCLAVE: Oxidation process in which high temperatures and pressures are applied to convert refractory sulfide mineralization into amenable oxide ore.
BY-PRODUCT: A secondary metal or mineral product recovered in the milling process such as silver.
C1 CASH COSTS: A measure of cost per pound for copper. Refer to page 80 of this MD&A for further information and a reconciliation of the measure.
CASH COSTS: A measure of cost per ounce for gold. Refer to page 72 of this MD&A for further information and a reconciliation of the measure.
CONCENTRATE: A very fine, powder-like product containing the valuable ore mineral from which most of the waste mineral has been eliminated.
CONTAINED OUNCES: Represents ounces in the ground before reduction of ounces not able to be recovered by the applicable metallurgical process.
DEVELOPMENT: Work carried out for the purpose of opening up a mineral deposit. In an underground mine this includes shaft sinking, crosscutting, drifting and raising. In an open pit mine, development includes the removal of overburden.
DILUTION: The effect of waste orlow-grade ore which is unavoidably included in the mined ore, lowering the recovered grade.
DORÉ: Unrefined gold and silver bullion bars usually consisting of approximately 90 percent precious metals that will be further refined to almost pure metal.
DRILLING:
Core: drilling with a hollow bit with a diamond cutting rim to produce a cylindrical core that is used for geological study and assays. Used in mineral exploration.
In-fill: any method of drilling intervals between existing holes, used to provide greater geological detail and to help establish reserve estimates.
EXPLORATION: Prospecting, sampling, mapping, diamond-drilling and other work involved in searching for ore.
FREE CASH FLOW: A measure that reflects our ability to generate cash flow. Refer to page 70 of this MD&A for a definition.
GRADE: The amount of metal in each tonne of ore, expressed as troy ounces per ton or grams per tonne for precious metals and as a percentage for most other metals.
Cut-off grade: the minimum metal grade at which an ore body can be economically mined (used in the calculation of ore reserves).
Mill-head grade: metal content of mined ore going into a mill for processing.
Recovered grade: actual metal content of ore determined after processing.
Reserve grade: estimated metal content of an ore body, based on reserve calculations.
HEAP LEACHING: A process whereby gold/copper is extracted by “heaping” broken ore on sloping impermeable pads and continually applying to the heaps a weak cyanide solution/sulfuric acid which dissolves the contained gold/copper. The gold/copper-laden solution is then collected for gold/copper recovery.
HEAP LEACH PAD: A large impermeable foundation or pad used as a base for ore during heap leaching.
MERRILL-CROWE PROCESS: A separation technique for removing gold from a cyanide solution.
MILL: A processing facility where ore is finely ground and thereafter undergoes physical or chemical treatment to extract the valuable metals.
MINERAL RESERVE: See pages 87 to 92 – Summary Gold/Copper Mineral Reserves and Mineral Resources.
MINERAL RESOURCE: See pages 87 to 92 – Summary Gold/Copper Mineral Reserves and Mineral Resources.
MINING RATE: Tonnes of ore mined per day or even specified time period.
OPEN PIT: A mine where the minerals are mined entirely from the surface.
ORE: Rock, generally containing metallic ornon-metallic minerals, which can be mined and processed at a profit.
ORE BODY: A sufficiently large amount of ore that can be mined economically.
OUNCES: Troy ounces of a fineness of 999.9 parts per 1,000 parts.
RECLAMATION: The process by which lands disturbed as a result of mining activity are modified to support beneficial land use. Reclamation activity may include the removal of buildings, equipment, machinery and other physical remnants of mining, closure of tailings storage facilities, leach pads and other mine features, and contouring, covering andre-vegetation of waste rock and other disturbed areas.
RECOVERY RATE: A term used in process metallurgy to indicate the proportion of valuable material physically recovered in the processing of ore. It is generally stated as a percentage of the material recovered compared to the total material originally present.
REFINING: The final stage of metal production in which impurities are removed from the molten metal.
STRIPPING: Removal of overburden or waste rock overlying an ore body in preparation for mining by open pit methods. Expressed as the total number of tonnes mined or to be mined for each ounce of gold or pound of copper.
TAILINGS: The material that remains after all economically and technically recoverable precious metals have been removed from the ore during processing.
| | | | |
BARRICK YEAR-END 2017 | | 86 | | MANAGEMENT’S DISCUSSION AND ANALYSIS |
Mineral Reserves and Mineral Resources
GOLD MINERAL RESERVES(1,2)
| | | | | | | | | | | | | | | | | | | | | | | | | | | | | | | | | | | | | | | | |
| As at December 31, 2017 | | PROVEN | | | | | | | | PROBABLE | | | | | | | | TOTAL | | | | |
| | | Tonnes | | | Grade | | | Contained ozs | | | | | Tonnes | | | Grade | | | Contained ozs | | | | | Tonnes | | | Grade | | | Contained ozs | |
Based on attributable ounces | | (000’s) | | | (gm/t) | | | (000’s) | | | | | (000’s) | | | (gm/t) | | | (000’s) | | | | | (000’s) | | | (gm/t) | | | (000’s) | |
NORTH AMERICA | | | | | | | | | | | | | | | | | | | | | | | | | | | | | | | | | | | | | | | | |
Goldstrike Open Pit | | | 50,013 | | | | 2.82 | | | | 4,537 | | | | | | 9,198 | | | | 3.78 | | | | 1,117 | | | | | | 59,211 | | | | 2.97 | | | | 5,654 | |
Goldstrike Underground | | | 3,982 | | | | 11.49 | | | | 1,471 | | | | | | 4,599 | | | | 8.75 | | | | 1,294 | | | | | | 8,581 | | | | 10.02 | | | | 2,765 | |
Goldstrike Property Total | | | 53,995 | | | | 3.46 | | | | 6,008 | | | | | | 13,797 | | | | 5.44 | | | | 2,411 | | | | | | 67,792 | | | | 3.86 | | | | 8,419 | |
Pueblo Viejo (60.00%) | | | 62,137 | | | | 2.67 | | | | 5,335 | | | | | | 19,222 | | | | 3.06 | | | | 1,889 | | | | | | 81,359 | | | | 2.76 | | | | 7,224 | |
Cortez | | | 19,145 | | | | 1.46 | | | | 898 | | | | | | 148,775 | | | | 1.92 | | | | 9,188 | | | | | | 167,920 | | | | 1.87 | | | | 10,086 | |
Goldrush | | | — | | | | — | | | | — | | | | | | 5,671 | | | | 8.12 | | | | 1,481 | | | | | | 5,671 | | | | 8.12 | | | | 1,481 | |
Turquoise Ridge (75.00%) | | | 7,082 | | | | 15.56 | | | | 3,544 | | | | | | 4,689 | | | | 15.48 | | | | 2,334 | | | | | | 11,771 | | | | 15.53 | | | | 5,878 | |
South Arturo (60.00%) | | | 2,267 | | | | 3.28 | | | | 239 | | | | | | 1,557 | | | | 2.52 | | | | 126 | | | | | | 3,824 | | | | 2.97 | | | | 365 | |
Hemlo | | | 935 | | | | 3.66 | | | | 110 | | | | | | 23,993 | | | | 2.16 | | | | 1,664 | | | | | | 24,928 | | | | 2.21 | | | | 1,774 | |
Golden Sunlight | | | 270 | | | | 1.15 | | | | 10 | | | | | | 182 | | | | 3.42 | | | | 20 | | | | | | 452 | | | | 2.06 | | | | 30 | |
SOUTH AMERICA | | | | | | | | | | | | | | | | | | | | | | | | | | | | | | | | | | | | | | | | |
Cerro Casale (50.00%)(3) | | | 114,851 | | | | 0.65 | | | | 2,391 | | | | | | 483,950 | | | | 0.59 | | | | 9,232 | | | | | | 598,801 | | | | 0.60 | | | | 11,623 | |
Veladero (50.00%)(4) | | | 14,198 | | | | 0.72 | | | | 330 | | | | | | 99,716 | | | | 0.78 | | | | 2,486 | | | | | | 113,914 | | | | 0.77 | | | | 2,816 | |
Lagunas Norte | | | 25,719 | | | | 2.23 | | | | 1,840 | | | | | | 29,711 | | | | 2.27 | | | | 2,165 | | | | | | 55,430 | | | | 2.25 | | | | 4,005 | |
AUSTRALIA PACIFIC | | | | | | | | | | | | | | | | | | | | | | | | | | | | | | | | | | | | | | | | |
Porgera (47.50%) | | | 635 | | | | 9.21 | | | | 188 | | | | | | 12,620 | | | | 4.56 | | | | 1,850 | | | | | | 13,255 | | | | 4.78 | | | | 2,038 | |
Kalgoorlie (50.00%) | | | 75,145 | | | | 0.89 | | | | 2,161 | | | | | | 23,915 | | | | 2.21 | | | | 1,697 | | | | | | 99,060 | | | | 1.21 | | | | 3,858 | |
AFRICA | | | | | | | | | | | | | | | | | | | | | | | | | | | | | | | | | | | | | | | | |
Bulyanhulu (63.90%) | | | 1,864 | | | | 10.66 | | | | 639 | | | | | | 10,716 | | | | 6.86 | | | | 2,362 | | | | | | 12,580 | | | | 7.42 | | | | 3,001 | |
North Mara (63.90%) | | | 5,298 | | | | 2.40 | | | | 408 | | | | | | 11,628 | | | | 2.89 | | | | 1,080 | | | | | | 16,926 | | | | 2.73 | | | | 1,488 | |
Buzwagi (63.90%) | | | 9,108 | | | | 0.92 | | | | 269 | | | | | | — | | | | — | | | | — | | | | | | 9,108 | | | | 0.92 | | | | 269 | |
OTHER | | | 5,556 | | | | 0.21 | | | | 38 | | | | | | 6,282 | | | | 0.25 | | | | 51 | | | | | | 11,838 | | | | 0.23 | | | | 89 | |
TOTAL | | | 398,205 | | | | 1.91 | | | | 24,408 | | | | | | 896,424 | | | | 1.39 | | | | 40,036 | | | | | | 1,294,629 | | | | 1.55 | | | | 64,444 | |
COPPER MINERAL RESERVES(1) | | | | | | | | | | | | | | | | | | | |
| As at December 31, 2017 | | PROVEN | | | | | | | | PROBABLE | | | | | | | | TOTAL | | | | |
| | | Tonnes | | | Grade | | | Contained lbs | | | | | Tonnes | | | Grade | | | Contained lbs | | | | | Tonnes | | | Grade | | | Contained lbs | |
Based on attributable pounds | | (000’s) | | | (%) | | | (millions) | | | | | (000’s) | | | (%) | | | (millions) | | | | | (000’s) | | | (%) | | | (millions) | |
Zaldívar (50.00%) | | | 132,477 | | | | 0.493 | | | | 1,440.3 | | | | | | 81,757 | | | | 0.538 | | | | 970.4 | | | | | | 214,234 | | | | 0.510 | | | | 2,410.7 | |
Lumwana | | | 32,711 | | | | 0.503 | | | | 362.9 | | | | | | 368,685 | | | | 0.572 | | | | 4,651.1 | | | | | | 401,396 | | | | 0.567 | | | | 5,014.0 | |
Jabal Sayid (50.00%) | | | 5,556 | | | | 2.380 | | | | 291.5 | | | | | | 6,282 | | | | 2.418 | | | | 334.9 | | | | | | 11,838 | | | | 2.400 | | | | 626.4 | |
TOTAL | | | 170,744 | | | | 0.556 | | | | 2,094.7 | | | | | | 456,724 | | | | 0.592 | | | | 5,956.4 | | | | | | 627,468 | | | | 0.582 | | | | 8,051.1 | |
| (1) | See accompanying endnote #1. |
| (2) | See accompanying endnote #2. |
| (3) | See accompanying endnote #3. |
| (4) | See accompanying endnote #4. |
| | | | |
BARRICK YEAR-END 2017 | | 87 | | RESERVES AND RESOURCES |
GOLD MINERAL RESOURCES(1,2)
| | | | | | | | | | | | | | | | | | | | | | | | | | | | | | | | | | | | | | | | | | | | | | |
| As at December 31, 2017 | | MEASURED (M) | | | | | INDICATED (I) | | | | | (M) + (I) | | | | | INFERRED | |
| | | Tonnes | | | Grade | | | Contained ozs | | | | | Tonnes | | | Grade | | | Contained ozs | | | | | Contained ozs | | | | | Tonnes | | | Grade | | | Contained ozs | |
Based on attributable ounces | | (000’s) | | | (gm/t) | | | (000’s) | | | | | (000’s) | | | (gm/t) | | | (000’s) | | | | | (000’s) | | | | | (000’s) | | | (gm/t) | | | (000’s) | |
NORTH AMERICA | | | | | | | | | | | | | | | | | | | | | | | | | | | | | | | | | | | | | | | | | | | | | | |
Goldstrike Open Pit | | | 1,764 | | | | 2.61 | | | | 148 | | | | | | 3,840 | | | | 2.89 | | | | 357 | | | | | | 505 | | | | | | 267 | | | | 2.80 | | | | 24 | |
Goldstrike Underground | | | 1,519 | | | | 9.91 | | | | 484 | | | | | | 2,379 | | | | 7.75 | | | | 593 | | | | | | 1,077 | | | | | | 1,192 | | | | 9.37 | | | | 359 | |
Goldstrike Property Total | | | 3,283 | | | | 5.99 | | | | 632 | | | | | | 6,219 | | | | 4.75 | | | | 950 | | | | | | 1,582 | | | | | | 1,459 | | | | 8.16 | | | | 383 | |
Pueblo Viejo (60.00%) | | | 7,773 | | | | 2.39 | | | | 598 | | | | | | 93,913 | | | | 2.47 | | | | 7,456 | | | | | | 8,054 | | | | | | 27,637 | | | | 2.43 | | | | 2,155 | |
Cortez | | | 2,586 | | | | 1.88 | | | | 156 | | | | | | 28,837 | | | | 1.85 | | | | 1,712 | | | | | | 1,868 | | | | | | 9,874 | | | | 2.01 | | | | 638 | |
Goldrush | | | 140 | | | | 10.44 | | | | 47 | | | | | | 31,379 | | | | 9.27 | | | | 9,351 | | | | | | 9,398 | | | | | | 8,817 | | | | 8.24 | | | | 2,335 | |
Turquoise Ridge (75.00%) | | | 2,944 | | | | 9.03 | | | | 855 | | | | | | 2,162 | | | | 9.37 | | | | 651 | | | | | | 1,506 | | | | | | 1,697 | | | | 13.03 | | | | 711 | |
South Arturo (60.00%) | | | 2,927 | | | | 1.19 | | | | 111.6 | | | | | | 8,365 | | | | 1.12 | | | | 301 | | | | | | 412.6 | | | | | | 749 | | | | 0.46 | | | | 11 | |
Hemlo | | | 1,107 | | | | 2.67 | | | | 95 | | | | | | 40,232 | | | | 1.36 | | | | 1,763 | | | | | | 1,858 | | | | | | 4,949 | | | | 2.78 | | | | 442 | |
Golden Sunlight | | | 121 | | | | 1.54 | | | | 6 | | | | | | 3,013 | | | | 1.79 | | | | 173 | | | | | | 179 | | | | | | 2,442 | | | | 2.17 | | | | 170 | |
Donlin Gold (50.00%) | | | 3,865 | | | | 2.52 | | | | 313 | | | | | | 266,803 | | | | 2.24 | | | | 19,190 | | | | | | 19,503 | | | | | | 46,108 | | | | 2.02 | | | | 2,997 | |
SOUTH AMERICA | | | | | | | | | | | | | | | | | | | | | | | | | | | | | | | | | | | | | | | | | | | | | | |
Cerro Casale (50.00%)(3) | | | 11,478 | | | | 0.30 | | | | 112 | | | | | | 136,846 | | | | 0.36 | | | | 1,574 | | | | | | 1,686 | | | | | | 247,720 | | | | 0.38 | | | | 2,995 | |
Caspiche (50.00%)(3) | | | 310,050 | | | | 0.57 | | | | 5,655 | | | | | | 391,750 | | | | 0.47 | | | | 5,965 | | | | | | 11,620 | | | | | | 99,050 | | | | 0.29 | | | | 921 | |
Pascua-Lama(4) | | | 42,809 | | | | 1.86 | | | | 2,564 | | | | | | 391,734 | | | | 1.49 | | | | 18,783 | | | | | | 21,347 | | | | | | 15,400 | | | | 1.74 | | | | 863 | |
Veladero (50.00%)(5) | | | 3,324 | | | | 0.48 | | | | 51 | | | | | | 66,771 | | | | 0.57 | | | | 1,225 | | | | | | 1,276 | | | | | | 33,486 | | | | 0.43 | | | | 464 | |
Lagunas Norte | | | 1,925 | | | | 0.87 | | | | 54 | | | | | | 29,017 | | | | 0.96 | | | | 896 | | | | | | 950 | | | | | | 1,857 | | | | 0.92 | | | | 55 | |
Alturas | | | — | | | | — | | | | — | | | | | | — | | | | — | | | | — | | | | | | — | | | | | | 210,965 | | | | 1.00 | | | | 6,793 | |
AUSTRALIA PACIFIC | | | | | | | | | | | | | | | | | | | | | | | | | | | | | | | | | | | | | | | | | | | | | | |
Porgera (47.50%) | | | 149 | | | | 5.22 | | | | 25 | | | | | | 12,316 | | | | 4.62 | | | | 1,828 | | | | | | 1,853 | | | | | | 11,879 | | | | 4.15 | | | | 1,584 | |
Kalgoorlie (50.00%) | | | 3,166 | | | | 0.96 | | | | 98 | | | | | | 12,120 | | | | 1.21 | | | | 473 | | | | | | 571 | | | | | | 1,252 | | | | 2.48 | | | | 100 | |
AFRICA | | | | | | | | | | | | | | | | | | | | | | | | | | | | | | | | | | | | | | | | | | | | | | |
Bulyanhulu (63.90%) | | | 874 | | | | 11.53 | | | | 324 | | | | | | 8,334 | | | | 8.78 | | | | 2,352 | | | | | | 2,676 | | | | | | 15,469 | | | | 9.75 | | | | 4,848 | |
North Mara (63.90%) | | | 1,291 | | | | 2.63 | | | | 109 | | | | | | 6,522 | | | | 2.77 | | | | 581 | | | | | | 690 | | | | | | 4,112 | | | | 4.15 | | | | 548 | |
Buzwagi (63.90%) | | | 13 | | | | 2.39 | | | | 1 | | | | | | 2,878 | | | | 1.04 | | | | 96 | | | | | | 97 | | | | | | 31,898 | | | | 0.77 | | | | 790 | |
Nyanzaga (57.51%) | | | — | | | | — | | | | — | | | | | | 12,520 | | | | 3.45 | | | | 1,389 | | | | | | 1,389 | | | | | | 2,933 | | | | 3.49 | | | | 329 | |
Tankoro (31.95%) | | | — | | | | — | | | | — | | | | | | — | | | | — | | | | — | | | | | | — | | | | | | 13,739 | | | | 1.52 | | | | 671 | |
OTHER | | | 216 | | | | 0.29 | | | | 2 | | | | | | 2,404 | | | | 0.61 | | | | 47 | | | | | | 49 | | | | | | 1,860 | | | | 0.25 | | | | 15 | |
TOTAL | | | 400,041 | | | | 0.92 | | | | 11,809 | | | | | | 1,554,135 | | | | 1.54 | | | | 76,756 | | | | | | 88,565 | | | | | | 795,352 | | | | 1.21 | | | | 30,818 | |
COPPER MINERAL RESOURCES(1,2) | | | | | | | | | | | | | | | | | | |
| As at December 31, 2017 | | MEASURED (M) | | | | | INDICATED (I) | | | | | (M) + (I) | | | | | INFERRED | |
| | | Tonnes | | | Grade | | | Contained lbs | | | | | Tonnes | | | Grade | | | Contained lbs | | | | | Contained lbs | | | | | Tonnes | | | Grade | | | Contained lbs | |
Based on attributable pounds | | (000’s) | | | (%) | | | (millions) | | | | | (000’s) | | | (%) | | | (millions) | | | | | (millions) | | | | | (000’s) | | | (%) | | | (millions) | |
Zaldívar (50.00%) | | | 62,629 | | | | 0.402 | | | | 555.5 | | | | | | 25,248 | | | | 0.389 | | | | 216.4 | | | | | | 771.9 | | | | | | 4,408 | | | | 0.511 | | | | 49.7 | |
Lumwana | | | 28,041 | | | | 0.388 | | | | 239.9 | | | | | | 553,524 | | | | 0.505 | | | | 6,161.3 | | | | | | 6,401.2 | | | | | | 119,094 | | | | 0.452 | | | | 1,187.4 | |
Jabal Sayid (50.00%) | | | 216 | | | | 1.617 | | | | 7.7 | | | | | | 2,404 | | | | 2.004 | | | | 106.2 | | | | | | 113.9 | | | | | | 1,860 | | | | 2.300 | | | | 94.3 | |
TOTAL | | | 90,886 | | | | 0.401 | | | | 803.1 | | | | | | 581,176 | | | | 0.506 | | | | 6,483.9 | | | | | | 7,287.0 | | | | | | 125,362 | | | | 0.482 | | | | 1,331.4 | |
| (1) | Resources which are not reserves do not have demonstrated economic viability. |
| (2) | See accompanying endnote #1. |
| (3) | See accompanying endnote #3. |
| (4) | See accompanying endnote #5. |
| (5) | See accompanying endnote #4. |
| | | | |
BARRICK YEAR-END 2017 | | 88 | | RESERVES AND RESOURCES |
SUMMARY GOLD MINERAL RESERVES AND MINERAL RESOURCES(1,2,3,4)
| | | | | | | | | | | | | | | | | | | | | | | | | | |
| For the years ended December 31 | | | | | | | 2017 | | | | | | | | | 2016 | | | | |
| Based on attributable ounces | | | | Tonnes
(000 ’s) | | | Grade
(gm/t) | | | Ounces
(000 ’s) | | | Tonnes
(000 ’s) | | | Grade
(gm/t) | | | Ounces
(000 ’s) | |
NORTH AMERICA | | | | | | | | | | | | | | | | | | | | | | | | | | |
Goldstrike Open Pit | | (proven and probable) | | | 59,211 | | | | 2.97 | | | | 5,654 | | | | 65,000 | | | | 3.00 | | | | 6,271 | |
| | | (mineral resource) | | | 5,604 | | | | 2.80 | | | | 505 | | | | 5,225 | | | | 2.66 | | | | 447 | |
Goldstrike Underground | | (proven and probable) | | | 8,581 | | | | 10.02 | | | | 2,765 | | | | 5,685 | | | | 9.88 | | | | 1,806 | |
| | | (mineral resource) | | | 3,898 | | | | 8.59 | | | | 1,077 | | | | 3,006 | | | | 10.44 | | | | 1,009 | |
Goldstrike Property Total | | (proven and probable) | | | 67,792 | | | | 3.86 | | | | 8,419 | | | | 70,685 | | | | 3.55 | | | | 8,077 | |
| | | (mineral resource) | | | 9,502 | | | | 5.18 | | | | 1,582 | | | | 8,231 | | | | 5.50 | | | | 1,456 | |
Pueblo Viejo (60.00%) | | (proven and probable) | | | 81,359 | | | | 2.76 | | | | 7,224 | | | | 85,821 | | | | 2.93 | | | | 8,087 | |
| | | (mineral resource) | | | 101,686 | | | | 2.46 | | | | 8,054 | | | | 105,642 | | | | 2.33 | | | | 7,910 | |
Cortez | | (proven and probable) | | | 167,920 | | | | 1.87 | | | | 10,086 | | | | 151,002 | | | | 2.11 | | | | 10,220 | |
| | | (mineral resource) | | | 31,423 | | | | 1.85 | | | | 1,868 | | | | 31,336 | | | | 2.13 | | | | 2,143 | |
Goldrush | | (proven and probable) | | | 5,671 | | | | 8.12 | | | | 1,481 | | | | — | | | | — | | | | — | |
| | | (mineral resource) | | | 31,519 | | | | 9.27 | | | | 9,398 | | | | 30,998 | | | | 9.61 | | | | 9,576 | |
Turquoise Ridge (75.00%) | | (proven and probable) | | | 11,771 | | | | 15.53 | | | | 5,878 | | | | 8,291 | | | | 15.11 | | | | 4,029 | |
| | | (mineral resource) | | | 5,106 | | | | 9.17 | | | | 1,506 | | | | 50,790 | | | | 5.81 | | | | 9,485 | |
South Arturo (60.00%) | | (proven and probable) | | | 3,824 | | | | 2.97 | | | | 365 | | | | 980 | | | | 3.87 | | | | 122 | |
| | | (mineral resource) | | | 11,292 | | | | 1.14 | | | | 413 | | | | 29 | | | | 1.07 | | | | 1 | |
Hemlo | | (proven and probable) | | | 24,928 | | | | 2.21 | | | | 1,774 | | | | 25,782 | | | | 1.92 | | | | 1,588 | |
| | | (mineral resource) | | | 41,339 | | | | 1.40 | | | | 1,858 | | | | 58,897 | | | | 0.91 | | | | 1,720 | |
Golden Sunlight | | (proven and probable) | | | 452 | | | | 2.06 | | | | 30 | | | | 827 | | | | 2.67 | | | | 71 | |
| | | (mineral resource) | | | 3,134 | | | | 1.78 | | | | 179 | | | | 15,145 | | | | 1.38 | | | | 671 | |
Donlin Gold (50.00%) | | (proven and probable) | | | — | | | | — | | | | — | | | | — | | | | — | | | | — | |
| | | (mineral resource) | | | 270,668 | | | | 2.24 | | | | 19,503 | | | | 270,668 | | | | 2.24 | | | | 19,503 | |
SOUTH AMERICA | | | | | | | | | | | | | | | | | | | | | | | | | | |
Cerro Casale (50.00%)(5) | | (proven and probable) | | | 598,801 | | | | 0.60 | | | | 11,623 | | | | 898,202 | | | | 0.60 | | | | 17,434 | |
| | | (mineral resource) | | | 148,324 | | | | 0.35 | | | | 1,686 | | | | 222,485 | | | | 0.35 | | | | 2,529 | |
Caspiche (50.00%)(5) | | (proven and probable) | | | — | | | | — | | | | — | | | | — | | | | — | | | | — | |
| | | (mineral resource) | | | 701,800 | | | | 0.51 | | | | 11,620 | | | | — | | | | — | | | | — | |
Pascua-Lama(6) | | (proven and probable) | | | — | | | | — | | | | — | | | | 277,870 | | | | 1.57 | | | | 14,050 | |
| | | (mineral resource) | | | 434,543 | | | | 1.53 | | | | 21,347 | | | | 156,673 | | | | 1.45 | | | | 7,297 | |
Veladero (50.00%)(7) | | (proven and probable) | | | 113,914 | | | | 0.77 | | | | 2,816 | | | | 252,125 | | | | 0.83 | | | | 6,749 | |
| | | (mineral resource) | | | 70,095 | | | | 0.57 | | | | 1,276 | | | | 212,335 | | | | 0.48 | | | | 3,303 | |
Lagunas Norte | | (proven and probable) | | | 55,430 | | | | 2.25 | | | | 4,005 | | | | 70,670 | | | | 1.86 | | | | 4,218 | |
| | | (mineral resource) | | | 30,942 | | | | 0.95 | | | | 950 | | | | 57,445 | | | | 0.63 | | | | 1,168 | |
AUSTRALIA PACIFIC | | | | | | | | | | | | | | | | | | | | | | | | | | |
Porgera (47.50%) | | (proven and probable) | | | 13,255 | | | | 4.78 | | | | 2,038 | | | | 14,455 | | | | 4.75 | | | | 2,207 | |
| | | (mineral resource) | �� | | 12,465 | | | | 4.62 | | | | 1,853 | | | | 13,775 | | | | 4.07 | | | | 1,802 | |
Kalgoorlie (50.00%) | | (proven and probable) | | | 99,060 | | | | 1.21 | | | | 3,858 | | | | 100,073 | | | | 1.29 | | | | 4,140 | |
| | | (mineral resource) | | | 15,286 | | | | 1.16 | | | | 571 | | | | 14,114 | | | | 0.89 | | | | 402 | |
AFRICA | | | | | | | | | | | | | | | | | | | | | | | | | | |
Bulyanhulu (63.90%) | | (proven and probable) | | | 12,580 | | | | 7.42 | | | | 3,001 | | | | 13,958 | | | | 7.29 | | | | 3,271 | |
| | | (mineral resource) | | | 9,208 | | | | 9.04 | | | | 2,676 | | | | 8,885 | | | | 8.91 | | | | 2,544 | |
North Mara (63.90%) | | (proven and probable) | | | 16,926 | | | | 2.73 | | | | 1,488 | | | | 15,202 | | | | 2.47 | | | | 1,209 | |
| | | (mineral resource) | | | 7,813 | | | | 2.75 | | | | 690 | | | | 12,888 | | | | 2.36 | | | | 979 | |
Buzwagi (63.90%) | | (proven and probable) | | | 9,108 | | | | 0.92 | | | | 269 | | | | 9,624 | | | | 1.27 | | | | 392 | |
| | | (mineral resource) | | | 2,891 | | | | 1.04 | | | | 97 | | | | 16,532 | | | | 1.23 | | | | 654 | |
Nyanzaga (57.51%) | | (proven and probable) | | | — | | | | — | | | | — | | | | — | | | | — | | | | — | |
| | | (mineral resource) | | | 12,520 | | | | 3.45 | | | | 1,389 | | | | 14,205 | | | | 3.49 | | | | 1,594 | |
Golden Ridge (63.90%) | | (proven and probable) | | | — | | | | — | | | | — | | | | — | | | | — | | | | — | |
| | | (mineral resource) | | | — | | | | — | | | | — | | | | 5,076 | | | | 2.78 | | | | 454 | |
OTHER | | (proven and probable) | | | 11,838 | | | | 0.23 | | | | 89 | | | | 11,331 | | | | 0.24 | | | | 86 | |
| | | (mineral resource) | | | 2,620 | | | | 0.58 | | | | 49 | | | | 2,621 | | | | 0.52 | | | | 44 | |
TOTAL | | (proven and probable) | | | 1,294,629 | | | | 1.55 | | | | 64,444 | | | | 2,006,898 | | | | 1.33 | | | | 85,950 | |
| | | (mineral resource) | | | 1,954,176 | | | | 1.41 | | | | 88,565 | | | | 1,308,770 | | | | 1.79 | | | | 75,235 | |
| (1) | Resources which are not reserves do not have demonstrated economic viability. |
| (2) | See accompanying endnote #1. |
| (3) | Measured plus indicated resources. |
| (4) | See accompanying endnote #2. |
| (5) | See accompanying endnote #3. |
| (6) | See accompanying endnote #5. |
| (7) | See accompanying endnote #4. |
| | | | |
BARRICK YEAR-END 2017 | | 89 | | RESERVES AND RESOURCES |
CONTAINED SILVER WITHIN REPORTED GOLD RESERVES(1)
| | | | | | | | | | | | | | | | | | | | | | | | | | | | | | | | | | | | | | | | | | | | |
| For the year ended Dec. 31, 2017 | | IN PROVEN GOLD RESERVES | | | | | IN PROBABLE GOLD RESERVES | | | | | TOTAL | |
| | | | | | | | | Contained | | | | | | | | | | | Contained | | | | | | | | | | | Contained | | | Process | |
| | | Tonnes | | | Grade | | | ozs | | | | | Tonnes | | | Grade | | | ozs | | | | | Tonnes | | | Grade | | | ozs | | | recovery % | |
| | | | | | | | | | | | |
| Based on attributable ounces | | (000s) | | | (gm/t) | | | (000s) | | | | | (000s) | | | (gm/t) | | | (000s) | | | | | (000s) | | | (gm/t) | | | (000s) | | | | |
NORTH AMERICA | | | | | | | | | | | | | | | | | | | | | | | | | | | | | | | | | | | | | | | | | | | | |
Pueblo Viejo (60.00%) | | | 62,137 | | | | 17.97 | | | | 35,909 | | | | | | 19,222 | | | | 15.55 | | | | 9,612 | | | | | | 81,359 | | | | 17.40 | | | | 45,521 | | | | 77.8 | % |
SOUTH AMERICA | | | | | | | | | | | | | | | | | | | | | | | | | | | | | | | | | | | | | | | | | | | | |
Cerro Casale (50.00%)(2) | | | 114,851 | | | | 1.91 | | | | 7,043 | | | | | | 483,950 | | | | 1.43 | | | | 22,300 | | | | | | 598,801 | | | | 1.52 | | | | 29,343 | | | | 69.0 | % |
Lagunas Norte | | | 24,648 | | | | 4.36 | | | | 3,455 | | | | | | 29,711 | | | | 5.94 | | | | 5,670 | | | | | | 54,359 | | | | 5.22 | | | | 9,125 | | | | 37.7 | % |
Veladero (50.00%)(3) | | | 7,466 | | | | 12.69 | | | | 3,047 | | | | | | 99,716 | | | | 14.77 | | | | 47,359 | | | | | | 107,182 | | | | 14.63 | | | | 50,406 | | | | 10.0 | % |
AFRICA | | | | | | | | | | | | | | | | | | | | | | | | | | | | | | | | | | | | | | | | | | | | |
Bulyanhulu (63.90%)(4) | | | 1,864 | | | | 5.59 | | | | 335 | | | | | | 7,402 | | | | 8.44 | | | | 2,009 | | | | | | 9,266 | | | | 7.87 | | | | 2,344 | | | | 65.0 | % |
TOTAL | | | 210,966 | | | | 7.34 | | | | 49,789 | | | | | | 640,001 | | | | 4.23 | | | | 86,950 | | | | | | 850,967 | | | | 5.00 | | | | 136,739 | | | | 48.0 | % |
| (1) | Silver is accounted for as aby-product credit against reported or projected gold production costs. |
| (2) | See accompanying endnote #3. |
| (3) | See accompanying endnote #4. |
| (4) | See accompanying endnote #6. |
CONTAINED COPPER WITHIN REPORTED GOLD RESERVES(1)
| | | | | | | | | | | | | | | | | | | | | | | | | | | | | | | | | | | | | | | | | | | | |
| For the year ended Dec. 31, 2017 | | IN PROVEN GOLD RESERVES | | | | | IN PROBABLE GOLD RESERVES | | | | | TOTAL | |
| | | | | | | | | Contained | | | | | | | | | | | Contained | | | | | | | | | | | Contained | | | Process | |
| | | Tonnes | | | Grade | | | lbs | | | | | Tonnes | | | Grade | | | lbs | | | | | Tonnes | | | Grade | | | lbs | | | recovery % | |
| | | | | | | | | | | | |
| Based on attributable pounds | | (000s) | | | (%) | | | (millions) | | | | | (000s) | | | (%) | | | (millions) | | | | | (000s) | | | (%) | | | (millions) | | | | |
NORTH AMERICA | | | | | | | | | | | | | | | | | | | | | | | | | | | | | | | | | | | | | | | | | | | | |
Pueblo Viejo (60.00%) | | | 62,137 | | | | 0.097 | | | | 132.3 | | | | | | 19,222 | | | | 0.100 | | | | 42.5 | | | | | | 81,359 | | | | 0.097 | | | | 174.8 | | | | 47.9 | % |
SOUTH AMERICA | | | | | | | | | | | | | | | | | | | | | | | | | | | | | | | | | | | | | | | | | | | | |
Cerro Casale (50.00%)(2) | | | 114,851 | | | | 0.190 | | | | 480.9 | | | | | | 483,950 | | | | 0.226 | | | | 2,408.8 | | | | | | 598,801 | | | | 0.219 | | | | 2,889.7 | | | | 87.4 | % |
AFRICA | | | | | | | | | | | | | | | | | | | | | | | | | | | | | | | | | | | | | | | | | | | | |
Bulyanhulu (63.90%)(3) | | | 1,864 | | | | 0.436 | | | | 17.9 | | | | | | 7,402 | | | | 0.567 | | | | 92.5 | | | | | | 9,266 | | | | 0.540 | | | | 110.4 | | | | 90.0 | % |
Buzwagi (63.90%) | | | — | | | | — | | | | — | | | | | | — | | | | — | | | | — | | | | | | — | | | | — | | | | — | | | | — | % |
TOTAL | | | 178,852 | | | | 0.160 | | | | 631.1 | | | | | | 510,574 | | | | 0.226 | | | | 2,543.8 | | | | | | 689,426 | | | | 0.209 | | | | 3,174.9 | | | | 85.4 | % |
| (1) | Copper is accounted for as aby-product credit against reported or projected gold production costs. |
| (2) | See accompanying endnote #3. |
| (3) | See accompanying endnote #6. |
| | | | |
BARRICK YEAR-END 2017 | | 90 | | RESERVES AND RESOURCES |
CONTAINED SILVER WITHIN REPORTED GOLD RESOURCES(1)
| | | | | | | | | | | | | | | | | | | | | | | | | | | | | | | | | | | | | | | | | | | | | | | | | | | | |
| For the year ended Dec. 31, 2017 | | MEASURED (M) | | | | | | INDICATED (I) | | | | | | (M) + (I) | | | | | | INFERRED | |
| Based on attributable ounces | | Tonnes (000 ’s) | | | Grade (gm/t) | | | Contained
ozs (000 ’s) | | | | | | Tonnes (000 ’s) | | | Grade (gm/t) | | | Contained
ozs (000 ’s) | | | | | | Ounces (000 ’s) | | | | | | Tonnes (000 ’s) | | | Grade (gm/t) | | | Contained ozs (000 ’s) | |
NORTH AMERICA | | | | | | | | | | | | | | | | | | | | | | | | | | | | | | | | | | | | | | | | | | | | | | | | | | | | |
Pueblo Viejo (60.00%) | | | 7,773 | | | | 14.25 | | | | 3,561 | | | | | | | | 93,913 | | | | 13.61 | | | | 41,095 | | | | | | | | 44,656 | | | | | | | | 27,637 | | | | 10.81 | | | | 9,605 | |
SOUTH AMERICA | | | | | | | | | | | | | | | | | | | | | | | | | | | | | | | | | | | | | | | | | | | | | | | | | | | | |
Cerro Casale (50.00%)(2) | | | 11,478 | | | | 1.20 | | | | 441 | | | | | | | | 136,846 | | | | 1.06 | | | | 4,656 | | | | | | | | 5,097 | | | | | | | | 247,720 | | | | 1.04 | | | | 8,253 | |
Caspiche (50.00%)(2) | | | 310,050 | | | | 1.20 | | | | 11,976 | | | | | | | | 391,750 | | | | 1.20 | | | | 15,147 | | | | | | | | 27,123 | | | | | | | | 99,050 | | | | 0.91 | | | | 2,909 | |
Pascua-Lama(3) | | | 42,809 | | | | 57.21 | | | | 78,747 | | | | | | | | 391,734 | | | | 52.22 | | | | 657,718 | | | | | | | | 736,465 | | | | | | | | 15,400 | | | | 17.83 | | | | 8,830 | |
Lagunas Norte | | | 1,925 | | | | 2.71 | | | | 168 | | | | | | | | 29,017 | | | | 2.83 | | | | 2,642 | | | | | | | | 2,810 | | | | | | | | 1,857 | | | | 3.35 | | | | 200 | |
Veladero (50.00%)(4) | | | 3,324 | | | | 8.95 | | | | 956 | | | | | | | | 66,771 | | | | 12.25 | | | | 26,287 | | | | | | | | 27,243 | | | | | | | | 33,486 | | | | 10.99 | | | | 11,830 | |
AFRICA | | | | | | | | | | | | | | | | | | | | | | | | | | | | | | | | | | | | | | | | | | | | | | | | | | | | |
Bulyanhulu (63.90%) | | | 874 | | | | 7.15 | | | | 201 | | | | | | | | 8,334 | | | | 6.55 | | | | 1,755 | | | | | | | | 1,956 | | | | | | | | 15,469 | | | | 6.96 | | | | 3,461 | |
TOTAL | | | 378,233 | | | | 7.90 | | | | 96,050 | | | | | | | | 1,118,365 | | | | 20.84 | | | | 749,300 | | | | | | | | 845,350 | | | | | | | | 440,619 | | | | 3.18 | | | | 45,088 | |
(1) Resources which are not reserves do not have demonstrated economic viability.
(2) See accompanying endnote #3.
(3) See accompanying endnote #5.
(4) See accompanying endnote #4.
CONTAINED COPPER WITHIN REPORTED GOLD RESOURCES(1)
��
| | | | | | | | | | | | | | | | | | | | | | | | | | | | | | | | | | | | | | | | | | | | | | |
| For the year ended Dec. 31, 2017 | | IN MEASURED (M) GOLD
RESOURCES | | | | | IN INDICATED (I) GOLD
RESOURCES | | | | | (M) + (I) | | | | | INFERRED | |
| Based on attributable pounds | | Tonnes (000 ’s) | | | Grade (%) | | | Contained lbs (millions) | | | | | Tonnes (000 ’s) | | | Grade (%) | | | Contained lbs (millions) | | | | | Contained lbs (millions) | | | | | Tonnes (000 ’s) | | | Grade (%) | | | Contained lbs (millions) | |
NORTH AMERICA | | | | | | | | | | | | | | | | | | | | | | | | | | | | | | | | | | | | | | | | | | | | | | |
Pueblo Viejo (60.00%) | | | 7,773 | | | | 0.067 | | | | 11.5 | | | | | | 93,913 | | | | 0.081 | | | | 167.6 | | | | | | 179.1 | | | | | | 27,637 | | | | 0.086 | | | | 52.3 | |
SOUTH AMERICA | | | | | | | | | | | | | | | | | | | | | | | | | | | | | | | | | | | | | | | | | | | | | | |
Cerro Casale (50.00%)(2) | | | 11,478 | | | | 0.132 | | | | 33.4 | | | | | | 136,846 | | | | 0.164 | | | | 495.9 | | | | | | 529.3 | | | | | | 247,720 | | | | 0.192 | | | | 1,046.8 | |
Caspiche (50.00%)(2) | | | 277,100 | | | | 0.230 | | | | 1,405.1 | | | | | | 363,950 | | | | 0.180 | | | | 1,444.3 | | | | | | 2,849.4 | | | | | | 97,800 | | | | 0.120 | | | | 258.7 | |
Pascua-Lama(3) | | | 42,809 | | | | 0.101 | | | | 95.7 | | | | | | 391,734 | | | | 0.082 | | | | 704.6 | | | | | | 800.3 | | | | | | 15,400 | | | | 0.049 | | | | 16.5 | |
AFRICA | | | | | | | | | | | | | | | | | | | | | | | | | | | | | | | | | | | | | | | | | | | | | | |
Bulyanhulu (63.90%) | | | 874 | | | | 0.405 | | | | 7.8 | | | | | | 8,334 | | | | 0.441 | | | | 81.0 | | | | | | 88.8 | | | | | | 15,469 | | | | 0.632 | | | | 215.5 | |
Buzwagi (63.90%) | | | 13 | | | | 0.349 | | | | 0.1 | | | | | | 2,878 | | | | 0.109 | | | | 6.9 | | | | | | 7.0 | | | | | | 31,898 | | | | 0.081 | | | | 56.9 | |
TOTAL | | | 340,047 | | | | 0.207 | | | | 1,553.6 | | | | | | 997,655 | | | | 0.132 | | | | 2,900.3 | | | | | | 4,453.9 | | | | | | 435,924 | | | | 0.171 | | | | 1,646.7 | |
(1) Resources which are not reserves do not have demonstrated economic viability.
(2) See accompanying endnote #3.
(3) See accompanying endnote #5.
NICKEL MINERAL RESOURCES(1)
| | | | | | | | | | | | | | | | | | | | | | | | | | | | | | | | | | | | | | | | | | | | | | | | | | | | |
| For the year ended Dec. 31, 2017 | | MEASURED (M) | | | | | | INDICATED (I) | | | | | | (M) + (I) | | | | | | INFERRED | |
| Based on attributable pounds | | Tonnes (000 ’s) | | | Grade (%) | | | Contained lbs (millions) | | | | | | Tonnes (000 ’s) | | | Grade (%) | | | Contained lbs (millions) | | | | | | Contained lbs (millions) | | | | | | Tonnes (000 ’s) | | | Grade (%) | | | Contained lbs (millions) | |
AFRICA | | | | | | | | | | | | | | | | | | | | | | | | | | | | | | | | | | | | | | | | | | | | | | | | | | | | |
Kabanga (50.00%) | | | 6,905 | | | | 2.490 | | | | 379.0 | | | | | | | | 11,705 | | | | 2.720 | | | | 701.9 | | | | | | | | 1,080.9 | | | | | | | | 10,400 | | | | 2.600 | | | | 596.1 | |
| (1) | Resources which are not reserves do not have demonstrated economic viability. |
| | | | |
BARRICK YEAR-END 2017 | | 91 | | RESERVES AND RESOURCES |
Mineral Reserves and Resources Endnotes
| | 1. | Mineral reserves (“reserves”) and mineral resources (“resources”) have been estimated as at December 31, 2017 in accordance with National Instrument43-101 as required by Canadian securities regulatory authorities. For United States reporting purposes, Industry Guide 7 under the Securities and Exchange Act of 1934 (as interpreted by Staff of the SEC), applies different standards in order to classify mineralization as a reserve. In addition, while the terms “measured”, “indicated” and “inferred” mineral resources are required pursuant to National Instrument43-101, the U.S. Securities and Exchange Commission does not recognize such terms. Canadian standards differ significantly from the requirements of the U.S. Securities and Exchange Commission, and mineral resource information contained herein is not comparable to similar information regarding mineral reserves disclosed in accordance with the requirements of the U.S. Securities and Exchange Commission. U.S. investors should understand that “inferred” mineral resources have a great amount of uncertainty as to their existence and great uncertainty as to their economic and legal feasibility. In addition, U.S. investors are cautioned not to assume that any part or all of Barrick’s mineral resources constitute or will be converted into reserves. Calculations have been prepared by employees of Barrick, its joint venture partners or its joint venture operating companies, as applicable, under the supervision of Rick Sims, Vice President, Resources and Reserves, of Barrick, Steven Haggarty, Senior Director, Metallurgy, of Barrick and Patrick Garretson, Senior Director, Life of Mine Planning, of Barrick. Except as noted below, reserves have been estimated based on an assumed gold price of US$1,200 per ounce, an assumed silver price of US$16.50 per ounce, and an assumed copper price of US$2.75 per pound and long-term average exchange rates of 1.25 CAD/US$ and 0.75 US$/AUD. Reserves at Kalgoorlie assumed a gold price of AUD$1,600 and Bulyanhulu, North Mara and Buzwagi assumed a gold price of US$1,100. Reserve estimates incorporate current and/or expected mine plans and cost levels at each property.Varying cut-off grades have been used depending on the mine and type of ore contained in the reserves. Barrick’s normal data verification procedures have been employed in connection with the calculations. Verification procedures include industry-standard quality control practices. Resources as at December 31, 2017 have been estimated usingvarying cut-off grades, depending on both the type of mine or project, its maturity and ore types at each property. For a breakdown of reserves and resources by category and for a more detailed description of the key assumptions, parameters, and methods used in estimating Barrick’s reserves and resources, see Barrick’s most recent Annual InformationForm/Form 40-F on file with Canadian provincial securities regulatory authorities and the U.S. Securities and Exchange Commission. |
| | 2. | In confirming our annual reserves for each of our mineral properties, projects, and operations, we conduct a reserve test on December 31 of each year to verify that the future undiscounted cash flow from reserves is positive. The cash flow ignores all sunk costs and only considers future operating and closure expenses as well as any future capital costs. |
| | 3. | On June 9, 2017, the Company sold 25% of its interest in Cerro Casale to Goldcorp Inc. (“Goldcorp”). Goldcorp concurrently purchased Kinross Gold Corporation’s 25% interest in Cerro Casale, resulting in Barrick and Goldcorp each holding a 50% interest in the joint operation. In connection with this transaction, Goldcorp also acquired the Caspiche Project from Exeter Resource Corporation, which was also contributed to the joint operation. Moving forward, the joint venture will be referred to as Norte Abierto, which includes the Cerro Casale, Caspiche and Luciano deposits. For additional information, see page 116 of Barrick’s Fourth Quarter andYear-End Report 2017. |
| | 4. | On June 30, 2017, the Company sold 50 percent of its interest in the Veladero mine to Shandong Gold Group Co., Ltd. For additional information regarding this matter, see page 116 of Barrick’s Fourth Quarter and Year-End Report 2017. |
| | 5. | On January 17, 2018, Chile’s Superintendencia del Medio Ambiente (SMA) ordered the closure of existing infrastructure on the Chilean side of the Pascua-Lama project. As a result, the Company has reclassified Pascua- Lama’s proven and probable gold reserves as measured and indicated resources. For additional information, see page 158 of Barrick’s Fourth Quarter andYear-End Report 2017. |
| | 6. | Silver and copper probable reserve tonnage at the Bulyanhulu mine is less than the gold probable reserve tonnage because the gold reserve includes 3.3 million tonnes of tailings material which are being separately reprocessed for recovery of gold only. |
| | | | |
BARRICK YEAR-END 2017 | | 92 | | RESERVES AND RESOURCES |