Exhibit 99.1
FIRST QUARTER REPORT 2018
All amounts expressed in U.S. dollars unless otherwise indicated
Barrick Reports First Quarter 2018 Results
• | Barrick reported first quarter net earnings attributable to equity holders (“net earnings”) of $158 million ($0.14 per share), and adjusted net earnings1of $170 million ($0.15 per share). |
• | The Company reported first quarter revenues of $1.79 billion, net cash provided by operating activities (“operating cash flow”) of $507 million, and free cash flow2of $181 million. |
• | Gold production in the first quarter was 1.05 million ounces, at a cost of sales applicable to gold3 of $878 per ounce,all-in sustaining costs4of $804 per ounce, and cash costs4of $573 per ounce. |
• | Copper production was 85 million pounds, at a cost of sales applicable to copper3of $2.07 per pound,all-in sustaining costs5of $2.61 per pound, and C1 cash costs5of $1.88 per pound. |
• | We continue to expect full-year gold production of4.5-5.0 million ounces, at a cost of sales3of$810-$850 per ounce,all-in sustaining costs4of$765-$815 per ounce, and cash costs4of$540-$575 per ounce. |
• | Full-year copper production guidance remains385-450 million pounds, at a cost of sales3of$1.80-$2.10 per pound,all-in sustaining costs5of$2.30-$2.60 per pound, and C1 cash costs5of$1.55-$1.75 per pound. |
• | During the first quarter, S&P Global Ratings and Moody’s Investors Service upgraded Barrick’s credit rating, citing significant improvements in free cash flow generation and liquidity, supported by the Company’slow-cost portfolio and favorable geopolitical risk profile. |
• | The Company does not intend to sell additional assets for purposes of debt reduction, and will use cash on hand and cash flow from operations for future debt repayments. Proceeds from any future portfolio optimization will be used to enhance our project pipeline, or returned to shareholders. |
• | Nevada growth projects remain on schedule and within budget. The Fourmile exploration program in the Cortez district is progressing well, with encouraging initial assay results. |
TORONTO, April 23, 2018— Barrick Gold Corporation (NYSE:ABX)(TSX:ABX) (“Barrick” or the “Company”) today reported first quarter results for the period ending March 31, 2018. Gold production and costs for the quarter were in line with expectations, with higher production and lower costs expected in the second half of 2018 driven by the timing of capital expenditures, higher throughput, and improved grades. Despite lower production levels, adjusted net earnings, operating cash flow, and free cash flow all increased compared to the prior-year period, primarily driven by higher gold prices.
Our priorities for 2018 are focused on positioning Barrick to grow free cash flow per share over the long term from a portfolio of high-quality, long-life gold assets in the Americas, with an increasing focus on organic growth in Nevada and the Dominican Republic. At our existing operations, our goal is to maintain industry-leading
margins through a continuous cycle of optimization, pushing our mines to achieve greater levels of safety, efficiency, and productivity, while working to mitigate increasing costs associated with more complex ore types and a shift to more underground mining. In addition, we are making investments in digital technology and innovation that will allow us to identify and accelerate further operational improvements across our portfolio.
OUTLOOK
We continue to expect full-year gold production of4.5-5.0 million ounces, at a cost of sales3 of$810-$850 per ounce, andall-in sustaining costs4 of$765-$815 per ounce. As previously reported, the power plant that supplies electricity to the Porgera Joint Venture mine was damaged during an earthquake that struck Papua New Guinea on February 26, 2018. The mine’s processing plant is currently operating at approximately 25 percent capacity, supported by an existingon-site diesel power station, as well as portable generators. At this time, the operation expects to increase processing capacity in stages, with full capacity anticipated by the fourth quarter. While the impact of this event to production at Porgera remains under evaluation, the Company’s consolidated 2018 gold production guidance remains unchanged. Business interruption insurance is expected to mitigate a significant portion of earnings lost as a result of this event.
We expect gold production in the second quarter to be roughly in line with the first quarter at around one million ounces, mainly due to the impact of a scheduled maintenance shutdown at the Barrick Nevada roaster.
Sustaining capital expenditures are expected to be higher in the second quarter relative to the first quarter as the North American construction season ramps up for major sustaining projects such as tailings dam raises. Capitalized stripping at Barrick Nevada, Pueblo Viejo, and Veladero, and increased underground development at Barrick Nevada, are also expected to be higher in the second quarter.
The completion of development work, stripping, and maintenance in the second quarter, along with access to higher grades in the second half of the year, is expected to drive stronger production in the third and fourth quarters, at lower costs compared to the first half of 2018. In particular, we expect higher production from Barrick Nevada and Pueblo Viejo in the second half of the year, driven by higher grades and throughput.
We continue to expect full-year copper production of385-450 million pounds, at a cost of sales3 of$1.80-$2.10 per pound, andall-in sustaining costs5 of$2.30-$2.60 per pound. Lower realized grades in the first quarter at the Lumwana mine are expected to steadily improve over the course of 2018.
Total attributable capital expenditure guidance6 for 2018 remains unchanged at$1.40-$1.60 billion, including mine site sustaining capital7 of$0.95-$1.10 billion, and project capital expenditures8 of$450-$550 million.
FINANCIAL HIGHLIGHTS
The Company reported net earnings of $158 million ($0.14 per share) for the first quarter, compared to net earnings of $679 million ($0.58 per share) in the prior-year period. Lower net earnings are primarily the result of a net impairment reversal of $1.13 billion ($522 million net of tax andnon-controlling interest) recorded in the first quarter of 2017, in connection with our divestment of 25 percent of the Cerro Casale project (Norte Abierto).
Adjusted net earnings1 for the first quarter rose by five percent to $170 million ($0.15 per share), compared to $162 million ($0.14 per share) in the first quarter of 2017. The increase in adjusted net earnings was primarily due to higher realized gold prices9 and lower depreciation.
BARRICK FIRST QUARTER 2018 | 2 | PRESS RELEASE |
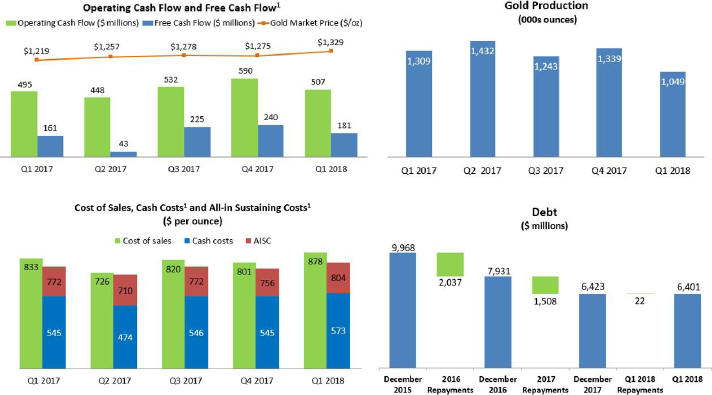
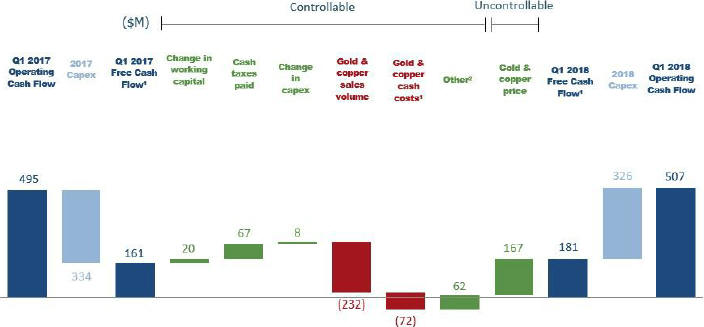
Operating cash flow for the first quarter was $507 million, compared to $495 million in the prior-year period. Higher operating cash flow was driven by higher realized gold prices9, lower cash taxes and interest paid, and lower general and administrative expenses related to stock-based compensation compared to the first quarter of 2017.
Free cash flow2 for the first quarter was $181 million, compared to $161 million in the prior-year period, reflecting slightly higher operating cash flows, combined with slightly lower capital expenditures. In the first quarter of 2018, capital expenditures on a cash basis were $326 million, compared to $334 million in the prior-year period.
BALANCE SHEET UPDATE
Over the past three years, we have reduced our total debt by more than 50 percent, from $13.1 billion at the end of 2014, to $6.4 billion by the end of 2017. In the first quarter of 2018, both S&P Global Ratings and Moody’s Investors Service upgraded Barrick’s credit rating, citing significant improvements in free cash flow generation and liquidity, supported by the Company’slow-cost portfolio and favorable geopolitical risk profile.
Our goal remains to reduce our total debt from $6.4 billion at present, to around $5 billion by the end of 2018. To achieve this, we will use cash flow from operations, and cash on hand. Having materially strengthened the balance sheet, Barrick does not intend to sell further assets for the purposes of debt repayment. Any proceeds resulting from additional portfolio optimization will be reinvested back into the business to enhance our project pipeline, or returned to shareholders.
At the end of the first quarter, Barrick had a consolidated cash balance of approximately $2.4 billion.10 The Company has less than $100 million in debt due before 2020.11 More than three-quarters of our outstanding total debt of $6.4 billion does not mature until after 2032.
OPERATING HIGHLIGHTS
Barrick produced 1.05 million ounces of gold in the first quarter of 2018 at a cost of sales3 of $878 per ounce, andall-in sustaining costs4 of $804 per ounce, in line with expectations. This compares to gold production of 1.31 million ounces in the first quarter of 2017, at a cost of sales3 of $833 per ounce, andall-in sustaining costs4 of $772 per ounce.
Lower gold production compared with the prior-year period was expected as a result of the sale of 50 percent of the Veladero mine on June 30, 2017, lower throughput at Acacia as a result of reduced operations at Bulyanhulu, lower grades processed through the oxide mill and roaster at Barrick Nevada, and lower throughput and grade at Hemlo and Lagunas Norte. An earthquake that damaged power infrastructure in Papua New Guinea also impacted production at Porgera during the quarter.
On a per ounce basis, cost of sales was five percent higher than the prior-year period due to the impact of fewer ounces sold, and higher royalty expenses as a result of an increase in realized gold prices.9 Cost of sales was also impacted by higher direct mining costs, primarily due to inflation in fuel, labor, and maintenance costs, partially offset byBest-in-Class operational and efficiency improvements. Higherall-in sustaining costs4 primarily reflect a planned increase in mine site sustaining capital expenditures on a per ounce basis, combined with higher direct mining costs.
The Company produced 85 million pounds of copper in the first quarter, at a cost of sales3 of $2.07 per pound, andall-in sustaining costs5 of $2.61 per pound. This compares to 95 million pounds, at a cost of sales of $1.73 per pound, andall-in sustaining costs5 of $2.19 per pound, in the first quarter of 2017.
BARRICK FIRST QUARTER 2018 | 3 | PRESS RELEASE |
Copper production for the first quarter of 2018 was 11 percent lower than the prior-year period, primarily due to lower production at Lumwana as a result of mill shutdowns and lower grades, and at Zaldívar due to fewer tonnes placed on the leach pad. This was partially offset by higher production at Jabal Sayid, driven by higher grade, throughput, and recoveries.
On a per pound basis, cost of sales applicable to copper3 increased as a result of higher processing and maintenance costs at Lumwana, and higher unit production costs at Zaldívar, partially offset by lower production costs at Jabal Sayid. Copperall-in sustaining costs5 were higher than the prior-year period, reflecting higher cost of sales combined with higher mine site sustaining capital expenditures at Zaldívar and Lumwana.
Please see page 41 of Barrick’s first quarter MD&A for individual operating segment performance details. Detailed mine site guidance information can be found in Appendix 1 of this press release.
Gold | First Quarter 2018 | 2018 Guidance | ||||||
Production12(000s of ounces) | 1,049 | 4,500 - 5,000 | ||||||
Cost of sales applicable to gold3($ per ounce) | 878 | 810 - 850 | ||||||
Cash costs4($ per ounce) | 573 | 540 - 575 | ||||||
All-in sustaining costs4($ per ounce) | 804 | 765 - 815 | ||||||
Copper | ||||||||
Production12(millions of pounds) | 85 | 385 - 450 | ||||||
Cost of sales applicable to copper3($ per pound) | 2.07 | 1.80 - 2.10 | ||||||
C1 cash costs5($ per pound) | 1.88 | 1.55 - 1.75 | ||||||
All-in sustaining costs5($ per pound) | 2.61 | 2.30 - 2.60 | ||||||
Total Attributable Capital Expenditures6($ millions) | 326 | 1,400 - 1,600 |
EXPLORATION AND GROWTH
Nevada remains the focus of our 2018 exploration programs and project development activities. Our strategy is focused on growing free cash flow from this core district over the long term through organic project development, growing our gold resource base through exploration, and optimizing the processing of existing stockpiles.
Nevada growth projects at Turquoise Ridge, Goldrush, and Cortez Deep South are now in execution, and are expected to begin contributing to production from 2021. Our mine exploration programs are focused on replacing gold reserves and identifying new resources which, in many cases, can be quickly incorporated into mine plans, driving near-term improvements in production and cash flow. In addition, Barrick Nevada currently has approximately 4.8 million ounces of proven gold reserves in existing stockpiles. To unlock the full potential of our Nevada asset base, the Company is evaluating an increase in processing capacity that would accommodate new production from organic projects, and bring forward production from stockpiles, increasing overall production levels from Nevada.
BARRICK FIRST QUARTER 2018 | 4 | PRESS RELEASE |
NEVADA, U.S.A.
Turquoise Ridge (75 percent Barrick)13 - Shaft sinking preparation underway
Barrick is constructing a third shaft at Turquoise Ridge, which will allow the mine to roughly double annual production to more than 500,000 ounces per year (100 percent basis), at an average cost of sales of around $720 per ounce, and averageall-in sustaining costs4 of roughly $630 per ounce. The contract for shaft sinking was awarded to Thyssen Mining during the first quarter, and mobilization planning is now underway. Procurement of long-lead-time items has begun, with major components such as the shaft hoist now ordered. Construction during the first quarter centered on well drilling activities, electrical distribution, and mine site utility construction and activation. The capital cost for this project is estimated to be$300-$325 million (100 percent basis). Initial production from the new shaft is expected to begin in 2022, with sustained production from 2023. At 15.56 grams per tonne, Turquoise Ridge has the highest average reserve grade in the Company’s operating portfolio, and among the highest in the gold industry.
Goldrush - Portal pad construction completed, decline development underway
When in full operation, the Goldrush underground project is expected to produce approximately 500,000 ounces of gold per year, at a cost of sales3 of roughly $750 per ounce, andall-in sustaining costs4 of approximately $640 per ounce. Portal pad construction for twin declines was completed in the first quarter of 2018, with decline construction now underway. Decline construction, detailed engineering, and permitting are expected to take place between 2018 and 2021, with construction and initial production expected between 2021 and 2022, and sustained production expected from 2023. The exploration twin declines will provide access to the orebody at depth, which will enable further exploration drilling, as well as the conversion of existing resources to reserves. These declines can be converted into production declines in the future. Goldrush currently has proven and probable gold reserves of 1.5 million ounces14, and measured and indicated gold resources of 9.4 million ounces14, with significant potential to identify additional resources once underground access to drill the deposit is established. Ongoing surface drilling in the Red Hill zone of the deposit in 2018 is also expected to support additional resource conversion.
Cortez Deep South15 - Rangefront east decline completed, infrastructure under construction
The Deep South project is expected to contribute approximately 300,000 ounces of annual gold production when fully ramped up between 2024 and 2028, at a cost of sales3 of $650 per ounce, andall-in sustaining costs4 of $580 per ounce. Deep South will utilize infrastructure which has already been approved under current plans to expand mining in the Lower Zone of the Cortez underground mine, including the new Rangefront twin declines and other underground infrastructure already under construction. The east decline is now complete, breaking through to the underground mine approximately two weeks ahead of schedule on March 18. The west decline is 38 percent complete and advancing according to schedule. Permitting for Deep South was initiated in 2016 with the submission of an amendment to the current Mine Plan of Operations to the Bureau of Land Management. A record of decision on an Environmental Impact Statement is expected in the second half of 2019, followed by two years of construction, with initial production from Deep South in 2022.
Fourmile - More high grade drill results increase confidence
The Fourmile exploration project is located one to three kilometers north of the Goldrush deposit, and is the focus of our 2018 greenfield exploration program in Nevada. Drilling to date has intersected mineralization well above the average grade of the measured and indicated resources at Goldrush. We are increasingly confident that Fourmile and Goldrush form part of a seven-kilometer-long mineralized system, similar in length to the mineralization at Goldstrike. In 2018, we plan to drill 24 holes at Fourmile—with five holes now completed, and four in progress. Assay results completed in 2018 include a hole with 9.1 meters grading 40.9 grams per tonne of gold. Please see endnote 16 for a significant intercepts table including recent Fourmile drilling.
BARRICK FIRST QUARTER 2018 | 5 | PRESS RELEASE |
ARGENTINA/CHILE
Pascua-Lama
Over the past year, Barrick has been studying the optimization of the Pascua-Lama project. Work to date on the prefeasibility study for a potential underground project indicates that while the concept may be feasible from a technical standpoint, it does not meet Barrick’s investment criteria. Based on this, and taking into consideration other risk factors, the Company has suspended work on the prefeasibility study, and will focus on adjusting the project closure plan for surface infrastructure on the Chilean side of the project, in line with legal requirements. Barrick will continue to evaluate opportunities tode-risk the project while maintaining Pascua-Lama as an option for development in the future if economics improve, and related risks can be mitigated.
ACACIA MINING PLC UPDATE
Discussions between the Government of Tanzania and Barrick concerning the proposed framework agreement for Acacia Mining plc’s operations in Tanzania have been constructive and continue to progress. Detailed legal agreements concerning the implementation of the conceptual framework are now being drafted. Barrick has continued to engage with independent directors of Acacia during this process, and Acacia is supporting Barrick in its ongoing discussions. We continue to target the first half of 2018 for the completion of a detailed proposal for review by Acacia. Under the proposed framework agreement, economic benefits generated by Acacia’s operations would be split with the Government of Tanzania on a 50/50 basis. The Government’s portion would be delivered primarily in the form of royalties, taxes, and a 16 percent free carried interest in Acacia’s Tanzanian operations, in line with the country’s new mining law.
TECHNICAL INFORMATION
The scientific and technical information contained in this press release has been reviewed and approved by: Steven Haggarty, P. Eng., Senior Director, Metallurgy of Barrick; Rick Sims, Registered Member SME, Vice President, Reserves and Resources of Barrick; and Robert Krcmarov, FAusIMM, Executive Vice President, Exploration and Growth of Barrick—each a “Qualified Person” as defined in National Instrument43-101 -Standards of Disclosure for Mineral Projects.
BARRICK FIRST QUARTER 2018 | 6 | PRESS RELEASE |
Appendix 1
2018 Operating and Capital Expenditure Guidance
GOLD PRODUCTION AND COSTS
Production (000s ounces) | Cost of sales3 ($ per ounce) | All-in sustaining costs4 ($ per ounce) | Cash costs4 ($ per ounce) | |||||
Barrick Nevada | 2,000 - 2,255 | 760 - 810 | 610 - 660 | 470 - 530 | ||||
Turquoise Ridge (75%) | 240 - 270 | 670 - 720 | 650 - 730 | 580 - 620 | ||||
Pueblo Viejo (60%) | 585 - 615 | 720 - 750 | 590 - 620 | 425 - 450 | ||||
Veladero (50%) | 275 - 330 | 970 - 1,110 | 960 - 1,100 | 560 - 620 | ||||
Lagunas Norte | 230 - 270 | 780 - 910 | 670 - 780 | 420 - 490 | ||||
Porgera (47.5%) | 230 - 255 | 950 - 1,000 | 950 - 1,000 | 780 - 830 | ||||
Kalgoorlie (50%) | 350 - 400 | 775 - 825 | 750 - 800 | 640 - 690 | ||||
Acacia (63.9%) | 275 - 305 | 970 - 1,020 | 935 - 985 | 690 - 720 | ||||
Hemlo | 200 - 220 | 860 - 920 | 975 - 1,075 | 740 - 790 | ||||
Golden Sunlight | 35 - 50 | 1,100 - 1,200 | 1,290 - 1,460 | 1,130 - 1,230 | ||||
Total Gold | 4,500 - 5,00017 | 810 - 850 | 765 - 815 | 540 - 575 |
COPPER PRODUCTION AND COSTS
Production (millions of pounds) | Cost of sales3 ($ per pound) | All-in sustaining costs5 ($ per pound) | C1 cash costs5 ($ per pound) | |||||
Zaldívar (50%) | 115 - 130 | 2.30 - 2.50 | 2.05 - 2.25 | ~1.70 | ||||
Lumwana | 230 - 265 | 1.65 - 1.90 | 2.50 - 2.80 | 1.65 - 1.90 | ||||
Jabal Sayid (50%) | 40 - 55 | 1.85 - 2.50 | 1.70 - 2.30 | 1.40 - 1.80 | ||||
Total Copper | 385 - 45017 | 1.80 - 2.10 | 2.30 - 2.60 | 1.55 - 1.75 |
CAPITAL EXPENDITURES
($ millions) | ||
Mine site sustaining | 950 - 1,100 | |
Project | 450 - 550 | |
Total Attributable Capital Expenditures6 | 1,400 - 1,600 |
BARRICK FIRST QUARTER 2018 | 7 | PRESS RELEASE |
Appendix 2
2018 Outlook Assumptions and Economic Sensitivity Analysis
2018 Guidance Assumption | Hypothetical Change | Impact on Revenue (millions) | Impact on Cost of sales3 (millions) | Impact on All-in sustaining costs4,5 | ||||||
Gold revenue, net of royalties | $1,200/oz | +/- $100/oz | +/- $363 | +/- $ 10 | +/- $3/oz | |||||
Copper revenue, net of royalties18 | $2.75/lb | + $0.50/lb | + $163 | + $12 | + $0.04/lb | |||||
Copper revenue, net of royalties18 | $2.75/lb | - $0.50/lb | - $137 | - $10 | - $0.03/lb | |||||
Goldall-in sustaining costs4 | ||||||||||
WTI crude oil price19 | $55/bbl | +/- $10/bbl | n/a | +/- $ 20 | +/- $5/oz | |||||
Australian dollar exchange rate | 0.75 : 1 | +/- 10% | n/a | +/- $ 22 | +/- $6/oz | |||||
Argentine peso exchange rate | 18.35 : 1 | +/- 10% | n/a | +/- $ 11 | +/- $3/oz | |||||
Canadian dollar exchange rate | 1.25 : 1 | +/- 10% | n/a | +/- $ 26 | +/- $7/oz | |||||
Copperall-in sustaining costs5 | ||||||||||
WTI crude oil price19 | $55/bbl | +/- $10/bbl | n/a | +/- $3 | +/- $0.06/lb | |||||
Chilean peso exchange rate | 650 : 1 | +/- 10% | n/a | +/- $7 | +/- $0.02/lb |
BARRICK FIRST QUARTER 2018 | 8 | PRESS RELEASE |
Endnotes
ENDNOTE 1
“Adjusted net earnings” and “adjusted net earnings per share” arenon-GAAP financial performance measures. Adjusted net earnings excludes the following from net earnings: certain impairment charges (reversals) related to intangibles, goodwill, property, plant and equipment, and investments; gains (losses) and otherone-time costs relating to acquisitions or dispositions; foreign currency translation gains (losses); significant tax adjustments not related to current period earnings; unrealized gains (losses) onnon-hedge derivative instruments; and the tax effect andnon-controlling interest of these items. The Company uses this measure internally to evaluate our underlying operating performance for the reporting periods presented and to assist with the planning and forecasting of future operating results. Barrick believes that adjusted net earnings is a useful measure of our performance because these adjusting items do not reflect the underlying operating performance of our core mining business and are not necessarily indicative of future operating results. Adjusted net earnings and adjusted net earnings per share are intended to provide additional information only and do not have any standardized meaning under IFRS and may not be comparable to similar measures of performance presented by other companies. They should not be considered in isolation or as a substitute for measures of performance prepared in accordance with IFRS. Further details on thesenon-GAAP measures are provided in the MD&A accompanying Barrick’s financial statements filed from time to time on SEDAR at www.sedar.com and on EDGAR at www.sec.gov.
Reconciliation of Net Earnings to Net Earnings per Share, Adjusted Net Earnings and Adjusted Net Earnings per Share
($ millions, except per share amounts in dollars) | For the three months ended March 31 | |||||||
2018 | 2017 | |||||||
Net earnings attributable to equity holders of the Company | $158 | $679 | ||||||
Impairment charges related to intangibles, goodwill, property, plant and equipment, and investments1 | 2 | (1,125 | ) | |||||
Acquisition/disposition (gains)/losses2 | (46 | ) | 3 | |||||
Foreign currency translation losses | 15 | 3 | ||||||
Significant tax adjustments3 | 46 | (3 | ) | |||||
Other expense adjustments | (6 | ) | 6 | |||||
Unrealized gains onnon-hedge derivative instruments | — | 3 | ||||||
Tax effect andnon-controlling interest | 1 | 596 | ||||||
Adjusted net earnings | $170 | $162 | ||||||
Net earnings per share4 | 0.14 | 0.58 | ||||||
Adjusted net earnings per share4 | 0.15 | 0.14 |
1 | Net impairment reversals for the three months ended March 31, 2017 primarily relate to impairment reversals at the Cerro Casale project upon reclassification of the project’s net assets asheld-for-sale as at March 31, 2017. |
2 | Disposition gains for the three months ended March 31, 2018 primarily relate to the gain on the sale of anon-core royalty asset at Acacia. |
3 | Significant tax adjustments for the three months ended March 31, 2018 primarily relate to a tax audit of Pueblo Viejo in the Dominican Republic. |
4 | Calculated using weighted average number of shares outstanding under the basic method of earnings per share. |
ENDNOTE 2
“Free cash flow” is anon-GAAP financial performance measure which deducts capital expenditures from net cash provided by operating activities. Barrick believes this to be a useful indicator of our ability to operate without reliance on additional borrowing or usage of existing cash. Free cash flow is intended to provide additional information only and does not have any standardized meaning under IFRS and may not be comparable to similar measures of performance presented by other companies. Free cash flow should not be considered in isolation or as a substitute for measures of performance prepared in accordance with IFRS. Further details on thesenon-GAAP measures are provided in the MD&A accompanying Barrick’s financial statements filed from time to time on SEDAR at www.sedar.com and on EDGAR at www.sec.gov.
Reconciliation of Net Cash Provided by Operating Activities to Free Cash Flow
($ millions) | For the three months ended March 31 | |||||||
2018 | 2017 | |||||||
Net cash provided by operating activities | $507 | $495 | ||||||
Capital expenditures | (326 | ) | (334 | ) | ||||
Free cash flow | $181 | $161 |
BARRICK FIRST QUARTER 2018 | 9 | PRESS RELEASE |
ENDNOTE 3
Cost of sales applicable to gold per ounce is calculated using cost of sales applicable to gold on an attributable basis (removing thenon-controlling interest of 40% Pueblo Viejo and 36.1% Acacia from cost of sales), divided by attributable gold ounces. Cost of sales applicable to copper per pound is calculated using cost of sales applicable to copper including our proportionate share of cost of sales attributable to equity method investments (Zaldívar and Jabal Sayid), divided by consolidated copper pounds (including our proportionate share of copper pounds from our equity method investments).
ENDNOTE 4
“Cash costs” per ounce and“All-in sustaining costs” per ounce arenon-GAAP financial performance measures. “Cash costs” per ounce starts with cost of sales applicable to gold production, but excludes the impact of depreciation, thenon-controlling interest of cost of sales, and includesby-product credits.“All-in sustaining costs” per ounce begin with “Cash costs” per ounce and add further costs which reflect the additional costs of operating a mine, primarily sustaining capital expenditures, general & administrative costs, minesite exploration and evaluation costs, and reclamation cost accretion and amortization. Barrick believes that the use of “cash costs” per ounce and“all-in sustaining costs” per ounce will assist investors, analysts and other stakeholders in understanding the costs associated with producing gold, understanding the economics of gold mining, assessing our operating performance and also our ability to generate free cash flow from current operations and to generate free cash flow on an overall Company basis. “Cash costs” per ounce and“All-in sustaining costs” per ounce are intended to provide additional information only and do not have any standardized meaning under IFRS. Although a standardized definition ofall-in sustaining costs was published in 2013 by the World Gold Council (a market development organization for the gold industry comprised of and funded by 25 gold mining companies from around the world, including Barrick), it is not a regulatory organization, and other companies may calculate this measure differently. These measures should not be considered in isolation or as a substitute for measures prepared in accordance with IFRS. Further details on thesenon-GAAP measures are provided in the MD&A accompanying Barrick’s financial statements filed from time to time on SEDAR at www.sedar.com and on EDGAR at www.sec.gov.
BARRICK FIRST QUARTER 2018 | 10 | PRESS RELEASE |
Reconciliation of Gold Cost of Sales to Cash costs,All-in sustaining costs andAll-in costs, including on a per ounce basis
($ millions, except per ounce information in dollars) | For the three months ended March 31 | |||||||||
Footnote | 2018 | 2017 | ||||||||
Cost of sales applicable to gold production | $1,046 | $1,238 | ||||||||
Depreciation | (298 | ) | (385 | ) | ||||||
By-product credits | (36 | ) | (41 | ) | ||||||
Realized (gains)/losses on hedge andnon-hedge derivatives | 1 | — | — | |||||||
Non-recurring items | 2 | (7 | ) | — | ||||||
Other | 3 | (21 | ) | (20 | ) | |||||
Non-controlling interests (Pueblo Viejo and Acacia) | 4 | (72 | ) | (81 | ) | |||||
Cash costs | $612 | $711 | ||||||||
General & administrative costs | 48 | 72 | ||||||||
Minesite exploration and evaluation costs | 5 | 6 | 7 | |||||||
Minesite sustaining capital expenditures | 6 | 231 | 262 | |||||||
Rehabilitation - accretion and amortization (operating sites) | 7 | 19 | 17 | |||||||
Non-controlling interest, copper operations and other | 8 | (55 | ) | (61 | ) | |||||
All-in sustaining costs | $861 | $1,008 | ||||||||
Project exploration and evaluation and project costs | 5 | 67 | 68 | |||||||
Community relations costs not related to current operations | 1 | 1 | ||||||||
Project capital expenditures | 6 | 100 | 56 | |||||||
Rehabilitation - accretion and amortization(non-operating sites) | 7 | 8 | 3 | |||||||
Non-controlling interest and copper operations | 8 | (5 | ) | (7 | ) | |||||
All-in costs | $1,032 | $1,129 | ||||||||
Ounces sold - equity basis (000s ounces) | 9 | 1,071 | 1,305 | |||||||
Cost of sales per ounce | 10,11 | $878 | $833 | |||||||
Cash costs per ounce | 11 | $573 | $545 | |||||||
Cash costs per ounce (on aco-product basis) | 11,12 | $596 | $568 | |||||||
All-in sustaining costs per ounce | 11 | $804 | $772 | |||||||
All-in sustaining costs per ounce (on aco-product basis) | 11,12 | $827 | $795 | |||||||
All-in costs per ounce | 11 | $963 | $865 | |||||||
All-in costs per ounce (on aco-product basis) | 11,12 | $986 | $888 |
1 | Realized (gains)/losses on hedge andnon-hedge derivatives |
Includes realized hedge losses of $1 million for the three months ended March 31, 2018 (2017: $6 million), and realizednon-hedge gains of $1 million for the three months ended March 31, 2018 (2017: $6 million). Refer to Note 5 to the quarterly Financial Statements for further information.
2 | Non-recurring items |
Non-recurring items in 2018 relate to abnormal costs at Porgera as a result of the February 2018 earthquake in Papua New Guinea. These costs are not indicative of our cost of production and have been excluded from the calculation of cash costs.
3 | Other |
Other adjustments for the three months ended March 31, 2018 include adding the cost of treatment and refining charges of $nil (2017: $1 million) and the removal of cash costs andby-product credits associated with our Pierina mine, which is mining incidental ounces as it enters closure, of $21 million (2017: $21 million).
4 | Non-controlling interests (Pueblo Viejo and Acacia) |
Non-controlling interests includenon-controlling interests related to gold production of $106 million for the three months ended March 31, 2018 (2017: $116 million). Refer to Note 5 to the quarterly Financial Statements for further information.
5 | Exploration and evaluation costs |
Exploration, evaluation and project expenses are presented as minesite sustaining if it supports current mine operations and project if it relates to future projects. Refer to page 28 of Barrick’s first quarter MD&A.
6 | Capital expenditures |
Capital expenditures are related to our gold sites only and are presented on a 100% accrued basis. They are split between minesite sustaining and project capital expenditures. Project capital expenditures are distinct projects designed to increase the net present value of the mine and are not related to current production. Significant projects in the current year are stripping at Cortez Crossroads, the Range Front declines, the Goldrush exploration declines and construction of the third shaft at Turquoise Ridge). Refer to page 27 of Barrick’s first quarter MD&A.
BARRICK FIRST QUARTER 2018 | 11 | PRESS RELEASE |
7 | Rehabilitation—accretion and amortization |
Includes depreciation on the assets related to rehabilitation provisions of our gold operations and accretion on the rehabilitation provision of our gold operations, split between operating andnon-operating sites.
8 | Non-controlling interest and copper operations |
Removes general & administrative costs related tonon-controlling interests and copper based on a percentage allocation of revenue. Also removes exploration, evaluation and project expenses, rehabilitation costs and capital expenditures incurred by our copper sites and thenon-controlling interest of our Acacia and Pueblo Viejo operating segments and South Arturo. Figures remove the impact of Pierina. The impact is summarized as the following:
($ millions) | For the three months ended March 31 | |||||||
Non-controlling interest, copper operations and other | 2018 | 2017 | ||||||
General & administrative costs | ($7 | ) | ($9 | ) | ||||
Minesite exploration and evaluation expenses | — | (1 | ) | |||||
Rehabilitation - accretion and amortization (operating sites) | (1 | ) | (3 | ) | ||||
Minesite sustaining capital expenditures | (47 | ) | (48 | ) | ||||
All-in sustaining costs total | ($55 | ) | ($61 | ) | ||||
Project exploration and evaluation and project costs | (3 | ) | (6 | ) | ||||
Project capital expenditures | (2 | ) | (1 | ) | ||||
All-in costs total | ($5 | ) | ($7 | ) |
9 | Ounces sold - equity basis |
Figures remove the impact of Pierina as the mine is currently going through closure.
10 | Cost of sales per ounce |
Figures remove the cost of sales impact of Pierina of $32 million for the three month periods ended March 31, 2018 (2017: $34 million), as the mine is currently going through closure. Cost of sales per ounce excludesnon-controlling interest related to gold production. Cost of sales applicable to gold per ounce is calculated using cost of sales on an attributable basis (removing thenon-controlling interest of 40% Pueblo Viejo and 36.1% Acacia from cost of sales), divided by attributable gold ounces.
11 | Per ounce figures |
Cost of sales per ounce, cash costs per ounce,all-in sustaining costs per ounce andall-in costs per ounce may not calculate based on amounts presented in this table due to rounding.
12 | Co-product costs per ounce |
Cash costs per ounce,all-in sustaining costs per ounce andall-in costs per ounce presented on aco-product basis removes the impact ofby-product credits of our gold production (net ofnon-controlling interest) calculated as:
($ millions) | For the three months ended March 31 | |||||||
2018 | 2017 | |||||||
By-product credits | $36 | $41 | ||||||
Non-controlling interest | (11 | ) | (8 | ) | ||||
By-product credits (net ofnon-controlling interest) | $25 | $33 |
ENDNOTE 5
“C1 cash costs” per pound and“All-in sustaining costs” per pound arenon-GAAP financial performance measures. “C1 cash costs” per pound is based on cost of sales but excludes the impact of depreciation and royalties and includes treatment and refinement charges.“All-in sustaining costs” per pound begins with “C1 cash costs” per pound and adds further costs which reflect the additional costs of operating a mine, primarily sustaining capital expenditures, general & administrative costs and royalties. Barrick believes that the use of “C1 cash costs” per pound and“all-in sustaining costs” per pound will assist investors, analysts, and other stakeholders in understanding the costs associated with producing copper, understanding the economics of copper mining, assessing our operating performance, and also our ability to generate free cash flow from current operations and to generate free cash flow on an overall Company basis. “C1 cash costs” per pound and“All-in sustaining costs” per pound are intended to provide additional information only, do not have any standardized meaning under IFRS, and may not be comparable to similar measures of performance presented by other companies. These measures should not be considered in isolation or as a substitute for measures of performance prepared in accordance with IFRS. Further details on thesenon-GAAP measures are provided in the MD&A accompanying Barrick’s financial statements filed from time to time on SEDAR at www.sedar.com and on EDGAR at www.sec.gov.
BARRICK FIRST QUARTER 2018 | 12 | PRESS RELEASE |
Reconciliation of Copper Cost of Sales to C1 cash costs andAll-in sustaining costs, including on a per pound basis
($ millions, except per pound information in dollars) | For the three months ended March 31 | |||||||
2018 | 2017 | |||||||
Cost of sales | $96 | $82 | ||||||
Depreciation/amortization | (19 | ) | (14 | ) | ||||
Treatment and refinement charges | 31 | 32 | ||||||
Cash cost of sales applicable to equity method investments | 63 | 61 | ||||||
Less: royalties and production taxes1 | (10 | ) | (7 | ) | ||||
By-product credits | (2 | ) | — | |||||
C1 cash cost of sales | $159 | $154 | ||||||
General & administrative costs | 5 | 3 | ||||||
Rehabilitation - accretion and amortization | 5 | 2 | ||||||
Royalties and production taxes1 | 10 | 7 | ||||||
Minesite exploration and evaluation costs | — | — | ||||||
Minesite sustaining capital expenditures | 42 | 37 | ||||||
All-in sustaining costs | $221 | $203 | ||||||
Pounds sold - consolidated basis (millions pounds) | 85 | 93 | ||||||
Cost of sales per pound2,3 | $2.07 | $1.73 | ||||||
C1 cash cost per pound2 | $1.88 | $1.65 | ||||||
All-in sustaining costs per pound2 | $2.61 | $2.19 |
1 | Royalties and production taxes include royalties of $9 million (2017: $7 million). |
2 | Cost of sales per pound, C1 cash costs per pound andall-in sustaining costs per pound may not calculate based on amounts presented in this table due to rounding. |
3 | Cost of sales applicable to copper per pound is calculated using cost of sales including our proportionate share of cost of sales attributable to equity method investments (Zaldívar and Jabal Sayid), divided by consolidated copper pounds (including our proportionate share of copper pounds from our equity method investments). |
ENDNOTE 6
These amounts are presented on the same basis as our guidance and include our 60% share of Pueblo Viejo and South Arturo, our 63.9% share of Acacia and our 50% share of Zaldívar and Jabal Sayid.
ENDNOTE 7
Includes both minesite sustaining and mine development.
ENDNOTE 8
Project capital expenditures are included in our calculation ofall-in costs, but not included in our calculation ofall-in sustaining costs.
ENDNOTE 9
This is anon-GAAP financial performance measure with no standardized meaning under IFRS and therefore may not be comparable to similar measures presented by other issuers. For further information and a detailed reconciliation of eachnon-GAAP measure to the most directly comparable IFRS measure, please see pages 44 to 55 of Barrick’s first quarter MD&A.
ENDNOTE 10
Includes $112 million of cash, primarily held at Acacia, which may not be readily deployed.
ENDNOTE 11
Amount excludes capital leases and includes Acacia (100% basis).
ENDNOTE 12
Barrick’s share.
ENDNOTE 13
For additional detail regarding Turquoise Ridge, see the Technical Report on the Turquoise Ridge Mine, State of Nevada, U.S.A., dated March 19, 2018, and filed on SEDAR at www.sedar.com and EDGAR at www.sec.gov on March 23, 2018.
BARRICK FIRST QUARTER 2018 | 13 | PRESS RELEASE |
ENDNOTE 14
Estimated in accordance with National Instrument43-101 as required by Canadian securities regulatory authorities. Estimates are as of December 31, 2017, unless otherwise noted. Goldrush probable reserves of 5.7 million tonnes grading 8.12 g/t, representing 1.5 million ounces of gold. Goldrush measured resources of 140,000 tonnes grading 10.44 g/t, representing 47,000 ounces of gold, and indicated resources 31.4 million tonnes grading 9.27 g/t, representing 9.4 million ounces of gold. Complete mineral reserve and mineral resource data for all mines and projects referenced in this press release, including tonnes, grades, and ounces, can be found on pages29-39 of Barrick’s Annual Information Form for the year ended December 31, 2017.
ENDNOTE 15
For additional detail regarding Cortez, see the Technical Report on the Cortez Joint Venture Operations, Lander and Eureka Counties, State of Nevada, U.S.A., dated March 21, 2016, and filed on SEDAR at www.sedar.com and EDGAR at www.sec.gov on March 28, 2016.
BARRICK FIRST QUARTER 2018 | 14 | PRESS RELEASE |
ENDNOTE 16
Fourmile Significant Intercepts1
Core Drill Hole2 | Azimuth | Dip | Interval (m) | Width (m)3 | Au (g/t) | |||||
666.9-672.7 | 5.8 | 10.9 | ||||||||
GRC-0427D | NA | -90 | 695.3-709.6 | 14.3 | 31.8 | |||||
921.4-927.2 | 5.8 | 49.6 | ||||||||
GRC-0435D | NA | -90 | 702.2-707.4 | 5.2 | 14.4 | |||||
FM16-01D | NA | -90 | no significant intercept | |||||||
FM16-04D | NA | -90 | 609.9-611.4 616-617.5 | 1.5 1.5 | 5.95 5.6 | |||||
FM16-05D | NA | -90 | 705.6-714.0 | 8.4 | 30.6 | |||||
FM16-10D | 357 | -77 | 730.6-733.6 | 3 | 5.7 | |||||
FM17-01D | 275 | -87 | 866.9-870.5 | 3.6 | 6.1 | |||||
FM17-01DW1 | 300 | -86 | 867.1-868.8 870.4-871.4 | 1.7 1 | 25.0 55.4 | |||||
FM17-02W1 | 66 | -77 | no significant intercept | |||||||
FM17-03D | 70 | -88 | 1178.6-1183.5 | 4.9 | 11.46 | |||||
FM17-04D | 282 | -83 | no significant intercept | |||||||
FM17-05D | 278 | -80 | 1132.4-1135.9 | 3.5 | 17.6 | |||||
FM17-06AW1 | 96 | -84 | 996.1-996.9 | 0.8 | 37 | |||||
FM17-07D | 90 | -85 | 684.2-687.9 | 3.7 | 10.3 | |||||
FM17-11D | 82 | -82 | 696.4-730.1 | 33.7 | 13.3 | |||||
FM17-12W1 | 5 | -81 | 736.8-741.4 856.8-862.6 | 4.6 5.8 | 19.9 10.9 | |||||
FM17-13D | 324 | -82 | 652.9-660.8 662.2-664.6 | 7.9 2.4 | 12.4 9.8 | |||||
FM17-14D | 49 | -79 | 812.1-821.9 870.5-873.6 | 9.8 3.1 | 16.6 9.97 | |||||
FM17-15D | 21 | -82 | 689.9-692.5 | 2.6 | 15.7 | |||||
FM17-16D | 92 | -82 | no significant intercept | |||||||
FM17-17D | 133 | -81 | 706.8-709.3 | 2.4 | 18.25 | |||||
FM17-18D | 267 | -84 | no significant intercept | |||||||
FM18-11D | 6 | -81 | no significant intercept | |||||||
FM18-15D | 0 | -78 | 878.1-887-2 | 9.1 | 40.9 | |||||
FM18-21D | 173 | -82 | 712.6-714.1 | 1.52 | 13.45 |
1 All significant intercepts calculated using a 5.0 g/t Au cutoff and are uncapped; internal dilution is less than 20% total width.
2 Nomenclature for drillholes (i.e., FM18-021D) is described by FM (i.e., Fourmile) followed by the year (i.e., 18 for 2018).
3 True width of intercepts are uncertain at this stage.
The drilling results for the Fourmile property contained in this press release have been prepared in accordance with National Instrument43-101 –Standards of Disclosure for Mineral Projects. All drill hole assay information has been manually reviewed and approved by staff geologists andre-checked by the project manager. Sample preparation and analyses are conducted by an independent laboratory. Procedures are employed to ensure security of samples during their delivery from the drill rig to the laboratory. The quality assurance procedures, data verification and assay protocols used in connection with drilling and sampling on the Fourmile property conform to industry accepted quality control methods.
BARRICK FIRST QUARTER 2018 | 15 | PRESS RELEASE |
ENDNOTE 17
Operating unit guidance ranges for production reflect expectations at each individual operating unit, but do not necessarily add up to the corporate-wide guidance range total.
ENDNOTE 18
As at March 31, 2018, utilizing option collar strategies, the Company has protected the downside on approximately 30 million pounds of expected copper production for the second quarter of 2018 at an average floor price of $2.83 per pound and can participate in the upside on the same amount up to an average of $3.25 per pound. Our remaining copper production is subject to market prices.
ENDNOTE 19
Due to our hedging activities, which are reflected in these sensitivities, we are partially protected against changes in these factors.
BARRICK FIRST QUARTER 2018 | 16 | PRESS RELEASE |
Key Statistics
Barrick Gold Corporation | ||||||||
(in United States dollars) | Three months ended March 31, | |||||||
| 2018 | 2017 | ||||||
Financial Results(millions) | ||||||||
Revenues | $1,790 | $1,993 | ||||||
Cost of sales | 1,152 | 1,342 | ||||||
Net earnings1 | 158 | 679 | ||||||
Adjusted net earnings2 | 170 | 162 | ||||||
Adjusted EBITDA2 | 796 | 919 | ||||||
Total capital expenditures - sustaining3 | 231 | 262 | ||||||
Total project capital expenditures3 | 100 | 56 | ||||||
Net cash provided by operating activities | 507 | 495 | ||||||
Free cash flow2 | 181 | 161 | ||||||
Per share data (dollars) | ||||||||
Net earnings (basic and diluted) | 0.14 | 0.58 | ||||||
Adjusted net earnings (basic)2 | $0.15 | $0.14 | ||||||
Weighted average diluted common shares (millions) | 1,167 | 1,166 | ||||||
Operating Results | ||||||||
Gold production (thousands of ounces)4 | 1,049 | 1,309 | ||||||
Gold sold (thousands of ounces)4 | 1,071 | 1,305 | ||||||
Per ounce data | ||||||||
Average spot gold price | $1,329 | $1,219 | ||||||
Average realized gold price2,4 | 1,332 | 1,220 | ||||||
Cost of sales (Barrick’s share)4,5 | 878 | 833 | ||||||
All-in sustaining costs2,4 | 804 | 772 | ||||||
Cash costs2,4 | $573 | $545 | ||||||
Copper production (millions of pounds)6 | 85 | 95 | ||||||
Copper sold (millions of pounds)6 | 85 | 93 | ||||||
Per pound data | ||||||||
Average spot copper price | $3.16 | $2.65 | ||||||
Average realized copper price2,6 | 2.98 | 2.76 | ||||||
Cost of sales (Barrick’s share)6,7 | 2.07 | 1.73 | ||||||
C1 cash costs2,6 | 1.88 | 1.65 | ||||||
All-in sustaining costs2,6 | $2.61 | $2.19 | ||||||
|
As at March 31, |
| As at December 31, | |||||
2018 | 2017 | |||||||
Financial Position(millions) | ||||||||
Cash and equivalents | $2,384 | $2,234 | ||||||
Working capital (excluding cash) | $1,158 | $1,184 |
1 | Net earnings represents net earnings attributable to the equity holders of the Company. |
2 | Adjusted net earnings, adjusted EBITDA, free cash flow, adjusted net earnings per share, realized gold price,all-in sustaining costs, cash costs and realized copper price arenon-GAAP financial performance measures with no standardized meaning under IFRS and therefore may not be comparable to similar measures presented by other issuers. For further information and a detailed reconciliation of eachnon-GAAP measure to the most directly comparable IFRS measure, please see pages 44 to 55 of this MD&A. |
3 | Amounts presented on a consolidated accrued basis. Project capital expenditures are included in our calculation ofall-in costs, but not included in our calculation ofall-in sustaining costs. |
4 | Includes Acacia on a 63.9% basis, Pueblo Viejo on a 60% basis, South Arturo on a 60% basis, and Veladero on a 50% basis from July 1, 2017 onwards, which reflects our equity share of production and sales. |
5 | Cost of sales per ounce (Barrick’s share) is calculated as cost of sales - gold on an attributable basis excluding Pierina divided by gold ounces sold. |
6 | Amounts reflect production and sales from Jabal Sayid and Zaldívar on a 50% basis, which reflects our equity share of production, and Lumwana. |
7 | Cost of sales per pound (Barrick’s share) is calculated as cost of sales - copper plus our equity share of cost of sales attributable to Zaldívar and Jabal Sayid divided by copper pounds sold. |
BARRICK FIRST QUARTER 2018 | 17 | SUMMARY INFORMATION |
Production and Cost Summary
Production | ||||||
Three months ended March 31, | ||||||
2018 | 2017 | |||||
Gold (equity ounces (000s)) | ||||||
Barrick Nevada1 | 471 | 521 | ||||
Turquoise Ridge | 46 | 55 | ||||
Pueblo Viejo2 | 141 | 143 | ||||
Veladero3 | 74 | 151 | ||||
Lagunas Norte | 66 | 88 | ||||
Acacia4 | 77 | 140 | ||||
Other Mines - Gold5 | 174 | 211 | ||||
Total | 1,049 | 1,309 | ||||
Copper (equity pounds (millions))6 | 85 | 95 | ||||
Cost of Sales per unit (Barrick’s share) | ||||||
Three months ended March 31, | ||||||
2018 | 2017 | |||||
Gold Cost of Sales per ounce ($/oz)7 | ||||||
Barrick Nevada | $844 | $916 | ||||
Turquoise Ridge | 720 | 680 | ||||
Pueblo Viejo | 683 | 694 | ||||
Veladero | 1,036 | 846 | ||||
Lagunas Norte | 542 | 573 | ||||
Acacia | 941 | 816 | ||||
Total | $878 | $833 | ||||
Copper Cost of Sales per pound ($/lb)8 | $2.07 | $1.73 | ||||
All-in sustaining costs9 | ||||||
Three months ended March 31, | ||||||
2018 | 2017 | |||||
GoldAll-in Sustaining Costs ($/oz) | ||||||
Barrick Nevada1 | $690 | $694 | ||||
Turquoise Ridge | 709 | 714 | ||||
Pueblo Viejo2 | 571 | 541 | ||||
Veladero3 | 1,008 | 890 | ||||
Lagunas Norte | 496 | 428 | ||||
Acacia4 | 976 | 934 | ||||
Total | $804 | $772 | ||||
CopperAll-in Sustaining Costs ($/lb)6 | $2.61 | $2.19 |
1 | Reflects production and sales from Goldstrike, Cortez, and South Arturo on a 60% basis, which reflects our equity share. |
2 | Reflects production and sales from Pueblo Viejo on a 60% basis, which reflects our equity share. |
3 | Reflects production and sales from Veladero on a 50% basis from July 1, 2017 onwards, which reflects our equity share. |
4 | Reflects production and sales from Acacia on a 63.9% basis, which reflects our equity share. |
5 | Other Mines - Gold includes Golden Sunlight, Hemlo, Porgera on a 47.5% basis and Kalgoorlie on a 50% basis. |
6 | Reflects production and sales from Lumwana, and Jabal Sayid and Zaldívar on a 50% basis, which reflects our equity share. |
7 | Cost of sales per ounce (Barrick’s share) is calculated as cost of sales - gold on an attributable basis excluding Pierina divided by gold equity ounces sold. |
8 | Cost of sales per pound (Barrick’s share) is calculated as cost of sales - copper plus our equity share of cost of sales attributable to Zaldívar and Jabal Sayid divided by copper pounds sold. |
9 | All-in sustaining costs is anon-GAAP financial performance measure with no standardized meaning under IFRS and therefore may not be comparable to similar measures presented by other issuers. For further information and a detailed reconciliation of thisnon-GAAP measure to the most directly comparable IFRS measure, please see pages 44 to 55 of our first quarter MD&A. |
BARRICK FIRST QUARTER 2018 | 18 | SUMMARY INFORMATION |
MANAGEMENT’S DISCUSSION AND ANALYSIS (“MD&A”)
This portion of the Quarterly Report provides management’s discussion and analysis (“MD&A”) of the financial condition and results of operations, to enable a reader to assess material changes in financial condition and results of operations as at, and for the three month period ended March 31, 2018, in comparison to the corresponding prior-year period. The MD&A is intended to help the reader understand Barrick Gold Corporation (“Barrick”, “we”, “our” or the “Company”), our operations, financial performance and present and future business environment. This MD&A, which has been prepared as of April 23, 2018, is intended to supplement and complement the condensed unaudited interim consolidated financial statements and notes thereto, prepared in accordance with International Accounting Standard 34 Interim Financial Reporting (“IAS 34”) as issued by the International Accounting Standards Board (“IASB”), for the three month period ended March 31, 2018 (collectively, the “Financial Statements”), which are included in this Quarterly Report on pages 56 to 70. You are encouraged to review the Financial Statements in conjunction with your review of this MD&A. This MD&A should be read in conjunction with both the annual audited consolidated financial statements for the two years ended December 31, 2017, the related annual MD&A included in the 2017 Annual Report, and the most
recent Form 40–F/Annual Information Form on file with the U.S. Securities and Exchange Commission (“SEC”) and Canadian provincial securities regulatory authorities. These documents and additional information relating to the Company are available on SEDAR at www.sedar.com and EDGAR at www.sec.gov. Certain notes to the Financial Statements are specifically referred to in this MD&A and such notes are incorporated by reference herein. All dollar amounts in this MD&A are in millions of United States dollars (“$” or “US$”), unless otherwise specified.
For the purposes of preparing our MD&A, we consider the materiality of information. Information is considered material if: (i) such information results in, or would reasonably be expected to result in, a significant change in the market price or value of our shares; or (ii) there is a substantial likelihood that a reasonable investor would consider it important in making an investment decision; or (iii) it would significantly alter the total mix of information available to investors. We evaluate materiality with reference to all relevant circumstances, including potential market sensitivity.
CAUTIONARY STATEMENT ON FORWARD-LOOKING INFORMATION
Certain information contained or incorporated by reference in this MD&A, including any information as to our strategy, projects, plans or future financial or operating performance, constitutes “forward-looking statements”. All statements, other than statements of historical fact, are forward-looking statements. The words “believe”, “expect”, “anticipate”, “target”, “plan”, “objective”, “assume”, “intend”, “project”, “goal”, “continue”, “budget”, “estimate”, “potential”, “may”, “will”, “can”, “could”, “would” and similar expressions identify forward-looking statements. In particular, this MD&A contains forward-looking statements including, without limitation, with respect to: (i) Barrick’s forward-looking production guidance; (ii) estimates of future cost of sales per ounce for gold and per pound for copper, cash costs per ounce and C1 cash costs per pound, andall-in-sustaining costs per ounce/pound; (iii) cash flow forecasts; (iv) projected capital, operating and exploration expenditures; (v) Barrick’s ability to successfully negotiate a new partnership between Acacia Mining plc (“Acacia”) and the Government of Tanzania, and the timing for completion of such negotiations; (vi) targeted debt and cost reductions; (vii) mine life and production rates; (viii) estimated timing for construction of, and production
from, new projects; (ix) the ability of investments in infrastructure and mine exploration drilling to strengthen the quality of Barrick’s production profile; (x) our pipeline of high confidence projects at or near existing operations; (xi) potential mineralization and metal or mineral recoveries; (xii) the timing to restore the Porgera mine to full capacity following the 7.5 magnitude earthquake that struck Papua New Guinea on February 26, 2018; (xiii) the adjustment of Barrick’s closure plan for surface infrastructure on the Chilean side of the Pascua-Lama project and continued evaluation ofde-risking opportunities; (xiv) Barrick’sBest-in-Class program (including potential improvements to financial and operating performance that may result from certainBest-in-Class initiatives); (xv) the benefits of unifying the Cortez and Goldstrike operations; (xvi) our ability to convert resources into reserves; (xvii) asset sales, joint ventures and partnerships; and (xviii) expectations regarding future price assumptions, financial performance and other outlook or guidance.
Forward-looking statements are necessarily based upon a number of estimates and assumptions including material estimates and assumptions related to the factors
BARRICK FIRST QUARTER 2018 | 19 | MANAGEMENT’S DISCUSSION AND ANALYSIS |
set forth below that, while considered reasonable by the Company as at the date of this MD&A in light of management’s experience and perception of current conditions and expected developments, are inherently subject to significant business, economic and competitive uncertainties and contingencies. Known and unknown factors could cause actual results to differ materially from those projected in the forward-looking statements and undue reliance should not be placed on such statements and information. Such factors include, but are not limited to: fluctuations in the spot and forward price of gold, copper or certain other commodities (such as silver, diesel fuel, natural gas and electricity); the speculative nature of mineral exploration and development; changes in mineral production performance, exploitation and exploration successes; risks associated with the fact that certainBest-in-Class initiatives are still in the early stages of evaluation and additional engineering and other analysis is required to fully assess their impact; the duration of the Tanzanian ban on mineral concentrate exports; the ultimate terms of any definitive agreement between Acacia and the Government of Tanzania to resolve a dispute relating to the imposition of the concentrate export ban and allegations by the Government of Tanzania that Acacia under-declared the metal content of concentrate exports from Tanzania; the status of certain taxre-assessments by the Tanzanian government; the manner in which amendments to the 2010 Mining Act (Tanzania) increasing the royalty rate applicable to metallic minerals such as gold, copper and silver to 6% (from 4%), and the new Finance Act (Tanzania) imposing a 1% clearing fee on the value of all minerals exported from Tanzania from July 1, 2017 will be implemented and the impact of these and other legislative changes on Acacia; whether Acacia will approve the terms of any final agreement reached between Barrick and the Government of Tanzania with respect to the dispute between Acacia and the Government of Tanzania; the benefits expected from recent transactions being realized; diminishing quantities or grades of reserves; increased costs, delays, suspensions and technical challenges associated with the construction of capital projects; operating or technical difficulties in connection with mining or development activities, including geotechnical challenges and disruptions in the maintenance or provision of required infrastructure and information technology systems; failure to comply with environmental and health and safety laws and regulations; timing of receipt of, or failure to comply with, necessary permits and approvals; uncertainty whether some or all of theBest-in-Class initiatives, targeted investments and projects will meet the Company’s capital allocation objectives; the impact of global liquidity and credit availability on the timing of cash flows and the values of assets and liabilities based on projected future cash flows; adverse changes in our credit ratings; the impact of inflation; fluctuations in the currency markets; changes in U.S. dollar interest rates; risks arising from holding derivative instruments; changes in national and
local government legislation, taxation, controls or regulations and/or changes in the administration of laws, policies and practices, expropriation or nationalization of property and political or economic developments in Canada, the United States and other jurisdictions in which the Company or its affiliates do or may carry on business in the future; lack of certainty with respect to foreign legal systems, corruption and other factors that are inconsistent with the rule of law; damage to the Company’s reputation due to the actual or perceived occurrence of any number of events, including negative publicity with respect to the Company’s handling of environmental matters or dealings with community groups, whether true or not; risk of loss due to acts of war, terrorism, sabotage and civil disturbances; litigation and legal and administrative proceedings; contests over title to properties, particularly title to undeveloped properties, or over access to water, power and other required infrastructure; business opportunities that may be presented to, or pursued by, the Company; our ability to successfully integrate acquisitions or complete divestitures; risks associated with working with partners in jointly controlled assets; employee relations including loss of key employees; increased costs and physical risks, including extreme weather events and resource shortages, related to climate change; availability and increased costs associated with mining inputs and labor; and the organization of our previously held African gold operations and properties under a separate listed Company. In addition, there are risks and hazards associated with the business of mineral exploration, development and mining, including environmental hazards, industrial accidents, unusual or unexpected formations, pressures,cave-ins, flooding and gold bullion, copper cathode or gold or copper concentrate losses (and the risk of inadequate insurance, or inability to obtain insurance, to cover these risks).
Many of these uncertainties and contingencies can affect our actual results and could cause actual results to differ materially from those expressed or implied in any forward-looking statements made by, or on behalf of, us. Readers are cautioned that forward-looking statements are not guarantees of future performance. All of the forward-looking statements made in this MD&A are qualified by these cautionary statements. Specific reference is made to the most recent Form40-F/Annual Information Form on file with the SEC and Canadian provincial securities regulatory authorities for a more detailed discussion of some of the factors underlying forward-looking statements and the risks that may affect Barrick’s ability to achieve the expectations set forth in the forward-looking statements contained in this MD&A. We disclaim any intention or obligation to update or revise any forward-looking statements whether as a result of new information, future events or otherwise, except as required by applicable law.
BARRICK FIRST QUARTER 2018 | 20 | MANAGEMENT’S DISCUSSION AND ANALYSIS |
USE OFNON-GAAP FINANCIAL PERFORMANCE MEASURES
We use the followingnon-GAAP financial performance measures in our MD&A:
• | “adjusted net earnings” |
• | “free cash flow” |
• | “EBITDA” |
• | “adjusted EBITDA” |
• | “cash costs per ounce” |
• | “C1 cash costs per pound” |
• | “all-in sustaining costs per ounce/pound” |
• | “all-in costs per ounce” and |
• | “realized price” |
For a detailed description of each of thenon-GAAP measures used in this MD&A and a detailed reconciliation to the most directly comparable measure under International Financial Reporting Standards (“IFRS”), please refer to theNon-GAAP Financial Performance Measures section of this MD&A on pages 44 to 55. Eachnon-GAAP financial performance measure has been annotated with a reference to an endnote on page 55. Thenon-GAAP financial performance measures set out in this MD&A are intended to provide additional information to investors and do not have any standardized meaning under IFRS, and therefore may not be comparable to other issuers, and should not be considered in isolation or as a substitute for measures of performance prepared in accordance with IFRS.
INDEX | page | |||||
Overview | ||||||
Financial and Operating Highlights | 22 | |||||
Full Year 2018 Outlook | 25 | |||||
Review of Financial Results | 26 | |||||
Revenue | 26 | |||||
Production Costs | 27 | |||||
Capital Expenditures | 27 | |||||
General and Administrative Expenses | 28 | |||||
Exploration, Evaluation and Project Expenses | 28 | |||||
Finance Costs, Net | 28 | |||||
Additional Significant Statement of Income Items | 28 | |||||
Income Tax Expense | 29 | |||||
Financial Condition Review | 30 | |||||
Balance Sheet Review | 30 | |||||
Shareholders’ Equity | 30 | |||||
Financial Position and Liquidity | 30 | |||||
Summary of Cash Inflow (Outflow) | 31 | |||||
Operating Segments Performance | 31 | |||||
Barrick Nevada | 32 | |||||
Turquoise Ridge | 34 | |||||
Pueblo Viejo | 35 | |||||
Veladero | 36 | |||||
Lagunas Norte | 38 | |||||
Acacia Mining plc | 39 | |||||
Pascua-Lama | 41 | |||||
Commitments and Contingencies | 42 | |||||
Review of Quarterly Results | 43 | |||||
Internal Control over Financial Reporting and Disclosure Controls and Procedures | 43 | |||||
IFRS Critical Accounting Policies and Accounting Estimates | 44 | |||||
Non-GAAP Financial Performance Measures | 44 | |||||
Technical Information | 55 | |||||
Endnotes
| 55 |
BARRICK FIRST QUARTER 2018 | 21 | MANAGEMENT’S DISCUSSION AND ANALYSIS |
OVERVIEW
Financial and Operating Highlights
1 | These arenon-GAAP financial performance measures with no standardized meaning under IFRS and therefore may not be comparable to similar measures presented by other issuers. For further information and a detailed reconciliation of eachnon-GAAP measure to the most directly comparable IFRS measure, please see pages 44 to 55 of this MD&A. |
($ millions, except per share amounts in dollars)
| For the three months ended March 31
| |||||||
| 2018
|
|
| 2017
|
| |||
Net earnings attributable to equity holders of the Company | $158 | $679 | ||||||
Per share (dollars)1 | 0.14 | 0.58 | ||||||
Adjusted net earnings2 | 170 | 162 | ||||||
Per share (dollars)1,2 | 0.15 | 0.14 | ||||||
Operating cash flow | 507 | 495 | ||||||
Free cash flow2
|
| $181
|
|
| $161
|
|
1 | Calculated using weighted average number of shares outstanding under the basic method of earnings per share of 1,167 million shares for the three months ended March 31, 2018 (2017: 1,166 million shares). |
2 | Adjusted net earnings and free cash flow arenon-GAAP financial performance measures with no standardized meaning under IFRS and therefore may not be comparable to similar measures of performance presented by other issuers. For further information and a detailed reconciliation of thenon-GAAP measures used in this section of the MD&A to the most directly comparable IFRS measure, please see pages 44 to 55 of this MD&A. |
BARRICK FIRST QUARTER 2018 | 22 | MANAGEMENT’S DISCUSSION AND ANALYSIS |
Factors affecting net earnings and adjusted net earnings1 - three months ended March 31, 2018
1 | These arenon-GAAP financial performance measures with no standardized meaning under IFRS and therefore may not be comparable to similar measures of performance presented by other issuers. For further information and a detailed reconciliation of thenon-GAAP measures used in this section of the MD&A to the most directly comparable IFRS measure, please see pages 44 to 55 of this MD&A. |
2 | Primarily consists of general and administrative expenses and an $18 million decrease in interest expense. |
3 | Estimated impact of foreign exchange. |
Net earnings attributable to equity holders of Barrick (“net earnings”) for the first quarter of 2018 were $158 million compared with $679 million in the same prior year period. The significant decrease was primarily due to $1,125 million of net impairment reversals ($522 million net of tax andnon-controlling interest) recorded in the first quarter of 2017 as a result of the indicative fair value of the Cerro Casale project related to our divestment of 25% of the project. After adjusting for items that are not indicative of future operating earnings, adjusted net earnings1 of $170 million in the first quarter of 2018 were 5% higher than the same prior year period. The increase in adjusted net earnings was primarily due to higher realized gold prices1 and lower depreciation as a result of a decrease in sales volumes, partially offset by lower gold sales. Gold sales were 234 thousand ounces lower as a result of the 50% divestment in the Veladero mine on June 30, 2017; lower throughput at Acacia as a result of reduced operations at Bulyanhulu; lower grade through the oxide mill and roaster at Barrick Nevada; lower throughput and grade at Hemlo and Lagunas Norte; and the earthquake experienced at Porgera. Adjusted net earnings were also impacted by higher royalty expense as a result of higher realized gold prices1, and higher direct mining costs primarily due to inflation in fuel costs, labor costs and maintenance costs. The effect of lower grades and increasing cost pressures have been partially offset by the realization of operational improvements driven by ourBest-in-Class program at Barrick Nevada, Pueblo Viejo, and Veladero.
BARRICK FIRST QUARTER 2018 | 23 | MANAGEMENT’S DISCUSSION AND ANALYSIS |
Factors affecting Operating Cash Flow and Free Cash Flow1 - three months ended March 31, 2018
1 | These arenon-GAAP financial performance measures with no standardized meaning under IFRS and therefore may not be comparable to similar measures of performance presented by other issuers. For further information and a detailed reconciliation of thenon-GAAP measures used in this section of the MD&A to the most directly comparable IFRS measure, please see pages 44 to 55 of this MD&A. |
2 | Primarily consists of general and administrative expenses and cash interest paid. |
In the first quarter of 2018, we generated $507 million in operating cash flow, compared to $495 million in the same prior year period. The increase of $12 million is primarily due to higher realized gold prices1, a decrease in cash taxes paid, general and administrative cash outflows and cash interest paid. This was partially offset by lower sales volume as a result of the 50% divestment in the Veladero mine on June 30, 2017; lower throughput at Acacia as a result of reduced operations at Bulyanhulu; lower grade through the oxide mill and roaster at Barrick Nevada; lower throughput and grade at Hemlo and Lagunas Norte; and the earthquake experienced at Porgera. Operating cash flow was also impacted by higher royalty expense as a result of higher realized gold prices1, and higher direct mining costs primarily due to inflation in fuel costs, labor costs and maintenance costs. The effect of lower grades and increasing cost pressures have been partially offset by the realization of operational improvements driven by ourBest-in-Class program at Barrick Nevada, Pueblo Viejo, and Veladero.
Free cash flow1 for the first quarter of 2018 was $181 million, compared to $161 million in the same prior year period, reflecting slightly higher operating cash flows combined with slightly lower capital expenditures. In the first quarter of 2018, capital expenditures on a cash basis were $326 million compared to $334 million in the same prior year period primarily as a result of the timing of cash flows.
BARRICK FIRST QUARTER 2018 | 24 | MANAGEMENT’S DISCUSSION AND ANALYSIS |
Full Year 2018 Outlook
We continue to expect full-year gold production of4.5-5.0 million ounces, at a cost of sales4 of$810-$850 per ounce, andall-in sustaining costs1 of$765-$815 per ounce. As previously reported, the power plant that supplies electricity to the Porgera Joint Venture mine was damaged during an earthquake that struck Papua New Guinea on February 26, 2018. The mine’s processing plant is currently operating at approximately 25 percent capacity, supported by an existingon-site diesel power station, as well as portable generators. At this time, the operation expects to increase processing capacity in stages, with full capacity anticipated by the fourth quarter. While the impact of this event to production at Porgera remains under evaluation, the Company’s consolidated 2018 gold production guidance remains unchanged. Business interruption insurance is expected to mitigate a significant portion of earnings lost as a result of this event.
We expect gold production in the second quarter to be roughly in line with the first quarter at around one million ounces, mainly due to the impact of a scheduled maintenance shutdown at the Barrick Nevada roaster.
Sustaining capital expenditures are expected to be higher in the second quarter relative to the first quarter as the North American construction season ramps up for major sustaining projects such as tailings dam raises. Capitalized stripping at Barrick Nevada, Pueblo Viejo, and Veladero, and increased underground development at Barrick Nevada, are also expected to be higher in the second quarter.
The completion of development work, stripping, and maintenance in the second quarter, along with access to higher grades in the second half of the year, is expected to drive stronger production in the third and fourth quarters, at lower costs compared to the first half of 2018. In particular, we expect higher production from Barrick Nevada and Pueblo Viejo in the second half of the year, driven by higher grades and throughput.
We continue to expect full-year copper production of385-450 million pounds, at a cost of sales4 of$1.80-$2.10 per pound, andall-in sustaining costs1 of$2.30-$2.60 per pound. Lower realized grades in the first quarter at the Lumwana mine are expected to steadily improve over the course of 2018.
Total attributable capital expenditure guidance for 2018 remains unchanged at$1.40-$1.60 billion, including mine site sustaining capital of $950 million to $1.1 billion, and project capital expenditures of$450-$550 million.
Financial Fuel Hedge Summary | ||||||||||||||||
Barrels (thousands) | Average price | % of total expected exposure | Impact of $10 (USD millions)1 | |||||||||||||
2018 | 934 | 78 | 29% | $23 |
1 | Includes the impact of hedges currently in place. |
Outlook ($ millions, except per ounce/pound data) | 2018 Estimate | |||
Gold production (millions of ounces) | 4.50 - 5.00 | |||
Gold unit production costs | ||||
Cost of sales - gold ($ per oz) | 810 - 850 | |||
Cash costs ($ per oz)1 | 540 - 575 | |||
Depreciation ($ per oz) | 240 - 260 | |||
All-in sustaining costs ($ per oz)1 | 765 - 815 | |||
Copper production (millions of pounds) | 385 - 450 | |||
Copper unit production costs | ||||
Cost of sales - copper ($ per lb) | 1.80 - 2.10 | |||
C1 cash costs ($ per lb)1 | 1.55 - 1.75 | |||
Depreciation ($ per lb) | 0.40 - 0.50 | |||
Copperall-in sustaining costs ($ per lb)1 | 2.30 - 2.60 | |||
Exploration and project expenses | 325 - 405 | |||
Exploration and evaluation | 185 - 225 | |||
Project expenses | 140 - 180 | |||
General and administrative expenses | ~340 | |||
Corporate administration | ~275 | |||
Stock-based compensation2 | ~30 | |||
Acacia3 | ~35 | |||
Other expense | 80 - 100 | |||
Finance costs | 500 - 550 | |||
Attributable capital expenditures: | ||||
Attributable minesite sustaining | 950 - 1,100 | |||
Attributable project | 450 - 550 | |||
Total attributable capital expenditures4 | 1,400 - 1,600 | |||
Effective income tax rate5 | 41% - 43% | |||
Key Assumptions | ||||
Gold Price ($/ounce) | $1,200 | |||
Copper Price ($/pound) | $2.75 | |||
Oil Price ($/barrel) | $55 | |||
AUD Exchange Rate | $0.75 | |||
ARS Exchange Rate | 18.35 | |||
CAD Exchange Rate | $1.25 | |||
CLP Exchange Rate | 650 |
1 | Cash costs, C1 cash costs andall-in sustaining costs arenon-GAAP financial performance measures with no standardized meaning under IFRS and therefore may not be comparable to similar measures of performance presented by other issuers. For further information and a detailed reconciliation of thenon-GAAP measures used in this section of the MD&A to the most directly comparable IFRS measure, please see pages 44 to 55 of this MD&A. |
2 | Based on US$14.50 share price and excludes Acacia. |
3 | Includes stock-based compensation based on £1.90 share price or ~US$2.50 share price. |
4 | 2018 Guidance includes our 60% share of Pueblo Viejo and South Arturo, our 63.9% share of Acacia, our 50% share of Zaldívar and Jabal Sayid and our share of joint operations. |
5 | Based on spot gold price as at March 31, 2018. |
Copper Contracts | ||||||||||||||||
Pounds (millions) | Average floor rate | Average cap rate | % of total expected exposure | |||||||||||||
2018 | 30 | 2.83 | 3.25 | 9% |
BARRICK FIRST QUARTER 2018 | 25 | MANAGEMENT’S DISCUSSION AND ANALYSIS |
REVIEW OF FINANCIAL RESULTS
Revenue
($ millions, except per ounce/pound data in dollars) | For the three months ended March 31 | |||||||
2018 | 2017 | |||||||
Gold | ||||||||
000s oz sold1 | 1,071 | 1,305 | ||||||
000s oz produced1 | 1,049 | 1,309 | ||||||
Revenue | $1,643 | $1,827 | ||||||
Market price2 | 1,329 | 1,219 | ||||||
Realized price2,3 | $1,332 | $1,220 | ||||||
Copper | ||||||||
millions lbs sold1 | 85 | 93 | ||||||
millions lbs produced1 | 85 | 95 | ||||||
Revenue | $111 | $125 | ||||||
Market price2 | 3.16 | 2.65 | ||||||
Realized price2,3 | 2.98 | 2.76 | ||||||
Other sales | 36 | 41 | ||||||
Total revenue | $1,790 | $1,993 |
1 | Includes our equity share of gold ounces from Acacia and Pueblo Viejo and copper pounds from Zaldívar and Jabal Sayid. |
2 | Per ounce/pound weighted average. |
3 | Realized price is anon-GAAP financial performance measure with no standardized meaning under IFRS and therefore may not be comparable to similar measures of performance presented by other issuers. For further information and a detailed reconciliation of eachnon-GAAP measure used in this section of the MD&A to the most directly comparable IFRS measure, please see pages 44 to 55 of this MD&A. |
In the first quarter of 2018, gold revenues were down 10% compared to the same prior year period primarily due to lower gold sales, partially offset by higher realized gold prices1. The average market price of $1,329 per ounce for the three month period ended March 31, 2018 represented an increase of 9% versus the same prior year period. During the first quarter of 2018, the gold price ranged from $1,302 per ounce to $1,366 per ounce and closed at $1,324 per ounce on March 31, 2018. Gold prices in the quarter were influenced by global political uncertainty, including concerns regarding potential trade disputes, a weakening of the trade-weighted US dollar to 2014 lows before a modest recovery, fluctuations in US long term interest rates, and investor interest in gold as a safe haven asset and a hedge against volatility in US equity indices.
In the first quarter of 2018, gold production was 260 thousand ounces or 20% lower than the same prior year period. Excluding the impact of the 50% divestment in the Veladero mine on June 30, 2017, gold production decreased by 185 thousand ounces or 15% due to lower throughput at Acacia as a result of reduced operations at Bulyanhulu, lower grade through the oxide mill and roaster at Barrick Nevada and lower throughput and grade at Hemlo and Lagunas Norte. Production was also negatively impacted at Porgera as a result of the February 2018 earthquake.
Copper revenues for the first quarter of 2018 were down 11% compared to the same prior year period primarily due to a decline in copper sales volume as a result of lower production as discussed below, partially offset by higher realized copper price1. In the first quarter of 2018, the realized copper price1 was up $0.22 per pound compared to the first quarter of 2017, due to the 19% increase in market copper prices versus the same prior year period. The realized copper price1 was lower than the market copper price as a result of the impact of negative provisional pricing adjustments recorded in the first quarter of 2018. During the first quarter of 2018, the copper price ranged from $2.96 per pound to $3.30 per pound and closed at $3.03 per pound on March 31, 2018, however it generally trended downwards from the December 31, 2017 price of $3.25 per pound. As at March 31, 2018, using option collar strategies, the Company has protected the downside on approximately 30 million pounds of expected copper production for the second quarter of 2018 at an average floor price of $2.83 per pound and can participate in the upside on the same amount up to an average of $3.25 per pound. Our remaining copper production is subject to market prices.
Copper production for the first quarter of 2018 decreased by 10 million pounds or 11% compared to the same prior year period primarily due to lower production at Lumwana as a result of mill shutdowns and lower grades and at Zaldívar due to fewer tonnes placed on the leach pad, partially offset by higher production at Jabal Sayid as a result of higher grade, throughput and recoveries.
BARRICK FIRST QUARTER 2018 | 26 | MANAGEMENT’S DISCUSSION AND ANALYSIS |
Production Costs
($ millions, except per ounce/ pound data in dollars) | For the three months ended March 31 | |||||||
2018 | 2017 | |||||||
Gold | ||||||||
Direct mining costs | $690 | $794 | ||||||
Depreciation | 298 | 385 | ||||||
Royalty expense | 50 | 51 | ||||||
Community relations | 8 | 8 | ||||||
Cost of sales | $1,046 | $1,238 | ||||||
Cost of sales (per oz)1 | 878 | 833 | ||||||
Cash costs2,3 | 573 | 545 | ||||||
All-in sustaining costs2,3 | 804 | 772 | ||||||
Copper | ||||||||
Cost of sales | $96 | $82 | ||||||
Cost of sales (per lb)1 | 2.07 | 1.73 | ||||||
C1 cash costs2,3 | 1.88 | 1.65 | ||||||
All-in sustaining costs2,3 | $2.61 | $2.19 |
1 | Cost of sales applicable to gold per ounce is calculated using cost of sales applicable to gold on an attributable basis (removing thenon-controlling interest of 40% Pueblo Viejo and 36.1% Acacia from cost of sales), divided by attributable gold ounces. Cost of sales applicable to copper per pound is calculated using cost of sales applicable to copper including our proportionate share of cost of sales attributable to equity method investments (Zaldívar and Jabal Sayid), divided by consolidated copper pounds (including our proportionate share of copper pounds from our equity method investments). |
2 | Per ounce/pound weighted average. |
3 | Cash costs, C1 cash costs andall-in sustaining costs arenon-GAAP financial performance measures with no standardized meaning under IFRS and therefore may not be comparable to similar measures of performance presented by other issuers. For further information and a detailed reconciliation of eachnon-GAAP measure used in this section of the MD&A to the most directly comparable IFRS measure, please see pages 44 to 55 of this MD&A. |
In the first quarter of 2018, cost of sales applicable to gold was 16% lower than the same prior year period primarily due to a decrease in sales volume driving lower direct mining costs and depreciation expense. On a per ounce basis, cost of sales applicable to gold4 was 5% higher than the same prior year period as a result of the impact of fewer ounces sold on direct mining costs on a per ounce basis and higher royalty expenses as a result of an increase in realized gold prices1. It was also impacted by higher direct mining costs primarily due to inflation in fuel costs, labor costs and maintenance costs. The effect of lower grades and increasing cost pressures have been partially offset by the realization of operational improvements driven by ourBest-in-Class program at Barrick Nevada, Pueblo Viejo, and Veladero.
In the first quarter of 2018, goldall-in sustaining costs1 were up $32 per ounce or 4% compared to the same prior year period primarily due to an increase in minesite sustaining capital expenditures on a per ounce basis combined with higher direct mining costs.
Cost of sales applicable to copper was 17% higher than the same prior year period primarily due to higher
processing and mining costs relating to fuel, power, contractors, consumables and maintenance costs at Lumwana. Our 50% interests in Zaldívar and Jabal Sayid are equity accounted for and therefore we do not include their cost of sales in our consolidated copper cost of sales. On a per pound basis, cost of sales applicable to copper4, after including our proportionate share of cost of sales at our equity method investees, increased by 20% compared to the same prior year period primarily due to higher processing and maintenance costs at Lumwana and higher unit production costs as a result of lower sales volume at Zaldívar, partially offset by lower production costs as a result of higher sales volume at Jabal Sayid.
Copperall-in sustaining costs1, which have been adjusted to include our proportionate share of equity method investments, were 19% higher than the same prior year period primarily reflecting the higher cost of sales applicable to copper combined with higher minesite sustaining capital expenditures at Zaldívar and Lumwana.
Capital Expenditures1
($ millions) | For the three months ended March 31 | |||||||
2018 | 2017 | |||||||
Minesite sustaining2 | $231 | $262 | ||||||
Project capital expenditures3 | 100 | 56 | ||||||
Total consolidated capital expenditures | $331 | $318 | ||||||
Attributable consolidated capital expenditures4 | $326 | $310 |
1 | These amounts are presented on a 100% accrued basis, except for attributable consolidated capital expenditures. |
2 | Includes both minesite sustaining and mine development. |
3 | Project capital expenditures are included in our calculation ofall-in costs, but not included in our calculation ofall-in sustaining costs. |
4 | These amounts are presented on the same basis as our guidance and include our 60% share of Pueblo Viejo and South Arturo, our 63.9% share of Acacia and our 50% share of Zaldívar and Jabal Sayid. |
In the first quarter of 2018, total consolidated capital expenditures on an accrued basis increased by 4% compared to the same prior year period. The increase is primarily due to a 79% increase in project capital expenditures as a result of greater spending incurred at Barrick Nevada (including Crossroads initial stripping, Cortez Range Front declines, the Goldrush exploration declines and the Deep South Expansion) and construction of the third shaft at Turquoise Ridge. This was partially offset by a decrease in minesite sustaining capital expenditures by 12% mainly due to the impact of the divestment of 50% of the Veladero mine as at June 30, 2017.
BARRICK FIRST QUARTER 2018 | 27 | MANAGEMENT’S DISCUSSION AND ANALYSIS |
General and Administrative Expenses
($ millions) | For the three months ended March 31 | |||||||
2018 | 2017 | |||||||
Corporate administration1 | $39 | $35 | ||||||
Stock-based compensation2 | 4 | 20 | ||||||
Acacia | 5 | 17 | ||||||
General & administrative expenses | $48 | $72 |
1 | For the three months ended March 31, 2018, corporate administration costs include approximately $3 million of severance costs (2017: $2 million). |
2 | Based on US$12.45 share price as at March 31, 2018 (2017: US$18.99) and excludes Acacia. |
General and administrative expenses for the first quarter of 2018 were $24 million lower than the same prior year period primarily due to lower stock-based compensation combined with lower expenses at Acacia, which also relates to stock-based compensation. This is a result of decreases in the share prices of both Barrick and Acacia during the first quarter of 2018.
Exploration, Evaluation and Project Expenses
($ millions) | For the three months ended March 31 | |||||||
2018 | 2017 | |||||||
Global exploration and evaluation | $30 | $29 | ||||||
Advanced project costs: | ||||||||
Pascua-Lama | 23 | 22 | ||||||
Other | 4 | 6 | ||||||
Corporate development | 5 | 4 | ||||||
Business improvement and innovation | 5 | 7 | ||||||
Global exploration and evaluation and project expense | $67 | $68 | ||||||
Minesite exploration and evaluation | 6 | 7 | ||||||
Total exploration, evaluation and project expenses | $73 | $75 |
Exploration, evaluation and project expenses for the first quarter of 2018 were in line with the same prior year period. Approximately half of our global exploration and evaluation expenses in the first quarter of 2018 is focused on our core regions of the Americas and includes the Alturas District in Chile and Argentina, and Fourmile in Nevada.
Finance Costs, Net
($ millions) | For the three months ended March 31 | |||||||
2018 | 2017 | |||||||
Interest expense1 | $117 | $135 | ||||||
Accretion | 20 | 16 | ||||||
Other finance costs | 1 | 3 | ||||||
Finance income | (5 | ) | (4 | ) | ||||
Finance costs, net | $133 | $150 |
1 | For the three months ended March 31, 2018, interest expense includes approximately $24 million ofnon-cash interest expense relating to the gold and silver streaming agreements with Wheaton Precious Metals Corp. and Royal Gold, Inc. (2017: $25 million, respectively). |
In the first quarter of 2018, net finance costs were $17 million lower than the same prior year period primarily due to an $18 million reduction in interest expense as a result of debt reductions made over the past year.
Additional Significant Statement of Income Items
($ millions) | For the three months ended March 31 | |||||||
2018 | 2017 | |||||||
Impairment charges (reversals) | $2 | ($1,125 | ) | |||||
Loss on currency translation | 15 | 3 | ||||||
Other expense (income) | $1 | $2 |
Impairment Charges (Reversals)
In the first quarter of 2018, impairment charges were $2 million compared to net impairment reversals of $1,125 million in the same prior year period. In the first quarter of 2017, we recognized an impairment reversal of $1,120 million at the Cerro Casale project upon reclassification of the project’s net assets asheld-for-sale as at March 31, 2017. In 2018, we recorded no significant impairment charges or reversals.
Loss on Currency Translation
Loss on currency translation for the first quarter of 2018 increased by $12 million compared to the same prior year period. The increase is primarily due to unrealized foreign currency translation losses relating to the Argentinean peso, which depreciated in the current year period compared to appreciation in the same prior year period.
Other Expense (Income)
In the first quarter of 2018, other expense was in line with the same prior year period. Other expense for the first quarter of 2018 includes a $45 million gain on the sale of anon-core royalty asset at Acacia, offset by litigation expenses and Bulyanhulu reduced operations program costs. For a further breakdown of other expense (income), refer to note 9 to the Financial Statements.
BARRICK FIRST QUARTER 2018 | 28 | MANAGEMENT’S DISCUSSION AND ANALYSIS |
Income Tax Expense
Income tax expense was $201 million in the first quarter of 2018. The underlying effective tax rate for ordinary income in the first quarter of 2018 was 42% after adjusting for the impact of the Dominican Republic tax audit; the net impact of foreign currency translation losses on deferred tax balances; the impact of impairment (reversals) charges; the impact of asset sales andnon-hedge derivatives; and the impact ofnon-deductible foreign exchange losses. The unadjusted tax rate for income in the first quarter of 2018 was 51% of the income before income taxes.
We record deferred tax charges or credits if changes in facts or circumstances affect the estimated tax basis of assets and therefore the amount of deferred tax assets or liabilities to reflect changing expectations in our ability to realize deferred tax assets. The interpretation of tax regulations and legislation and their application to our business is complex and subject to change. We have significant amounts of deferred tax assets, including tax loss carry forwards, and also deferred tax liabilities. Potential changes of any of these amounts, as well as our ability to realize deferred tax assets, could significantly affect net income or cash flow in future periods.
BARRICK FIRST QUARTER 2018 | 29 | MANAGEMENT’S DISCUSSION AND ANALYSIS |
FINANCIAL CONDITION REVIEW
Summary Balance Sheet and Key Financial Ratios
($ millions, except ratios and share amounts) | As at March 31, 2018 | As at December 31, 2017 | ||||||
Total cash and equivalents | $2,384 | $2,234 | ||||||
Current assets | 2,412 | 2,450 | ||||||
Non-current assets | 20,600 | 20,624 | ||||||
Total Assets | $25,396 | $25,308 | ||||||
Current liabilities excluding short-term debt | $1,641 | $1,688 | ||||||
Non-current liabilities excluding long-term debt1 | 6,088 | 6,130 | ||||||
Debt (current and long-term) | 6,401 | 6,423 | ||||||
Total Liabilities | $14,130 | $14,241 | ||||||
Total shareholders’ equity | 9,479 | 9,286 | ||||||
Non-controlling interests | 1,787 | 1,781 | ||||||
Total Equity | $11,266 | $11,067 | ||||||
Total common shares outstanding (millions of shares)2 | 1,167 | 1,167 | ||||||
Key Financial Ratios: | ||||||||
Current ratio3 | 2.82:1 | 2.68:1 | ||||||
Debt-to-equity4 | 0.57:1 | 0.58:1 |
1 | Non-current financial liabilities as at March 31, 2018 were $6,835 million (December 31, 2017: $6,844 million). |
2 | Total common shares outstanding do not include 1.0 million stock options. |
3 | Represents current assets divided by current liabilities (including short-term debt) as at March 31, 2018 and December 31, 2017. |
4 | Represents debt divided by total shareholders’ equity (including minority interest) as at March 31, 2018 and December 31, 2017. |
Balance Sheet Review
Total assets were $25.4 billion at March 31, 2018, in line with total assets at December 31, 2017. Our asset base is primarily comprised ofnon-current assets such as property, plant and equipment and goodwill, reflecting the capital-intensive nature of the mining business and our history of growing through acquisitions. Other significant assets include production inventories, indirect taxes recoverable and receivable, concentrate sales receivable and other government transaction and joint venture related receivables, and cash and equivalents.
Total liabilities at March 31, 2018 totaled $14.1 billion; also consistent with total liabilities at December 31, 2017. Our liabilities are primarily comprised of debt, othernon-current liabilities such as provisions and deferred income tax liabilities, and accounts payable.
Shareholders’ Equity
As at April 17, 2018 | Number of shares | |||
Common shares | 1,166,892,835 | |||
Stock options | 999,467 |
Financial Position and Liquidity
Total cash and cash equivalents as at March 31, 2018 were $2.4 billion3. Our capital structure comprises a mix of debt and shareholders’ equity. As at March 31, 2018, our total debt was $6.4 billion (debt net of cash and equivalents was $4.0 billion) and ourdebt-to-equity ratio was 0.57:1. This compares to debt as at December 31, 2017 of $6.4 billion (debt net of cash and equivalents was $4.2 billion), and adebt-to-equity ratio of 0.58:1.
Our goal remains to reduce our total debt from $6.4 billion at present, to around $5 billion by the end of 2018. To achieve this, we will use cash flow from operations and cash on hand. Having materially strengthened the balance sheet, Barrick does not intend to sell further assets for the purposes of debt repayment. Any proceeds resulting from further portfolio optimization will be reinvested back into our business to enhance our project pipeline, or returned to shareholders.
Uses of cash for the remainder of 2018 includes capital commitments of $101 million and we expect to incur attributable sustaining and project capital expenditures of approximately $1,100 to $1,300 million during the final nine months of the year, based on our guidance range on page 25. For the remainder of 2018 we have contractual obligations and commitments of $470 million in purchase obligations for supplies and consumables and $12 million in derivative liabilities which will form part of operating costs. In addition, we have $336 million in interest payments and other amounts as detailed in the table on page 42. We expect to fund these commitments through operating cash flow, which is our primary source of liquidity, as well as existing cash balances.
Our operating cash flow is dependent on the ability of our operations to deliver projected future cash flows. The market prices of gold, and to a lesser extent copper, are the primary drivers of our operating cash flow. Other options to enhance liquidity include further portfolio optimization and the creation of new joint ventures and partnerships; issuance of debt or equity securities in the public markets or to private investors, which could be undertaken for liquidity enhancement and/or in
BARRICK FIRST QUARTER 2018 | 30 | MANAGEMENT’S DISCUSSION AND ANALYSIS |
connection with establishing a strategic partnership; and drawing the $4.0 billion available under our undrawn credit facility (subject to compliance with covenants and the making of certain representations and warranties, this facility is available for drawdown as a source of financing).
Many factors, including but not limited to general market conditions and then prevailing metals prices, could impact our ability to issue securities on acceptable terms, as could our credit ratings. In March 2018, Moody’s and S&P each upgraded their ratings on our long-term debt, from Baa3 to Baa2 and fromBBB- to BBB, respectively. Further changes in our ratings could affect the trading prices of our securities and our cost of capital. If we were to borrow under our credit facility, the applicable interest rate on the amounts borrowed would be based, in part, on our credit ratings at the time. The key financial covenant in our undrawn credit facility requires Barrick to maintain a net debt to total capitalization ratio of less than 0.60:1. Barrick’s net debt to total capitalization ratio was 0.26:1 as at March 31, 2018 (0.27:1 as at December 31, 2017).
Summary of Cash Inflow (Outflow)
($ millions) | For the three months ended March 31 | |||||||
2018 | 2017 | |||||||
Net cash provided by operating activities | $507 | $495 | ||||||
Investing activities | ||||||||
Capital expenditures | ($326 | ) | ($334 | ) | ||||
Other | 42 | 3 | ||||||
Total investing inflows/(outflows) | ($284 | ) | ($331 | ) | ||||
Financing activities | ||||||||
Net change in debt1 | ($23 | ) | ($180 | ) | ||||
Dividends | (31 | ) | (31 | ) | ||||
Other | (18 | ) | (67 | ) | ||||
Total financing inflows/(outflows) | ($72 | ) | ($278 | ) | ||||
Effect of exchange rate | (1 | ) | 2 | |||||
Increase/(decrease) in cash and equivalents | $150 | ($112 | ) |
1 | The difference between the net change in debt on a cash basis and the net change on the balance sheet is due to changes innon-cash charges, specifically the unwinding of discounts and amortization of debt issue costs. |
OPERATING SEGMENTS PERFORMANCE
Review of Operating Segments Performance
Barrick’s business is organized into eleven individual minesites, one grouping of two minesites, one publicly traded company and one project. Barrick’s Chief Operating Decision Maker, the President, reviews the operating results, assesses performance and makes capital allocation decisions at the minesite, grouping, Company and/or project level. Therefore, each individual minesite, with the exception of Barrick Nevada, Acacia and the Pascua-Lama project are operating segments for financial reporting purposes. Our presentation of our reportable operating segments is four individual gold
In the first quarter of 2018, we generated $507 million in operating cash flow, compared to $495 million in the same prior year period. The increase of $12 million was primarily due to higher realized gold prices1, a decrease in cash taxes paid, general and administrative cash flow related to stock-based compensation paid, and cash interest paid. This was partially offset by lower gold sales due to the impact of the 50% divestment in the Veladero mine on June 30, 2017; lower throughput at Acacia as a result of reduced operations at Bulyanhulu; lower grade through the oxide mill and roaster at Barrick Nevada; lower throughput and grade at Hemlo and Lagunas Norte; and the earthquake experienced at Porgera.
Cash outflows from investing activities in the first quarter of 2018 were $284 million compared to cash outflows of $331 million in the same prior year period. The decrease of $47 million is primarily due to the sale of anon-core royalty asset at Acacia combined with slightly lower capital expenditures.
Net financing cash outflows for the first quarter of 2018 amounted to $72 million, compared to $278 million of cash outflows in the same prior year period. The lower outflows primarily relate to lower debt repayments in the first quarter of 2018 of $23 million compared to $180 million in the same prior year period combined with lower disbursements tonon-controlling interests.
mines (Pueblo Viejo, Lagunas Norte, Veladero and Turquoise Ridge), Barrick Nevada, Acacia and our Pascua-Lama project. The remaining operating segments, our remaining gold and copper mines, have been grouped into an “other” category and will not be reported on individually. Segment performance is evaluated based on a number of measures including operating income before tax, production levels and unit production costs. Certain costs are managed on a consolidated basis and are therefore not reflected in segment income.
BARRICK FIRST QUARTER 2018 | 31 | MANAGEMENT’S DISCUSSION AND ANALYSIS |
Barrick Nevada1, Nevada USA
Summary of Operating and Financial Data | For the three months ended March 31 | |||||||||||
2018 | 2017 | % Change | ||||||||||
Total tonnes mined (000s) | 52,730 | 48,432 | 9 | % | ||||||||
Open pit | 52,011 | 47,706 | 9 | % | ||||||||
Underground | 719 | 726 | (1 | )% | ||||||||
Average grade (grams/tonne) | ||||||||||||
Open pit mined | 2.13 | 2.29 | (7 | )% | ||||||||
Underground mined | 9.82 | 10.48 | (6 | )% | ||||||||
Processed | 3.24 | 2.81 | 15 | % | ||||||||
Ore tonnes processed (000s) | 5,342 | 6,872 | (22 | )% | ||||||||
Oxide mill | 1,062 | 1,054 | 1 | % | ||||||||
Roaster | 1,225 | 1,152 | 6 | % | ||||||||
Autoclave | 1,055 | 1,032 | 2 | % | ||||||||
Heap leach | 2,000 | 3,634 | (45 | )% | ||||||||
Gold produced (000s oz) | 471 | 521 | (10 | )% | ||||||||
Oxide mill | 168 | 201 | (16 | )% | ||||||||
Roaster | 207 | 219 | (5 | )% | ||||||||
Autoclave | 54 | 59 | (8 | )% | ||||||||
Heap leach | 42 | 42 | — | % | ||||||||
Gold sold (000s oz) | 462 | 531 | (13 | )% | ||||||||
Segment revenue ($ millions) | $614 | $646 | (5 | )% | ||||||||
Cost of sales ($ millions) | 391 | 487 | (20 | )% | ||||||||
Segment income ($ millions) | �� | 220 | 148 | 49 | % | |||||||
Segment EBITDA ($ millions)2 | 368 | 355 | 4 | % | ||||||||
Capital expenditures ($ millions) | 146 | 130 | 12 | % | ||||||||
Minesite sustaining | 73 | 81 | (10 | )% | ||||||||
Project | 73 | 49 | 49 | % | ||||||||
Cost of sales (per oz) | 844 | 916 | (8 | )% | ||||||||
Cash costs (per oz)2 | 523 | 525 | — | % | ||||||||
All-in sustaining costs (per oz)2 | 690 | 694 | (1 | )% | ||||||||
All-in costs (per oz)2 | $849 | $790 | 7 | % |
1 | Includes our 60% share of South Arturo. |
2 | These arenon-GAAP financial performance measures with no standardized meaning under IFRS and therefore may not be comparable to similar measures presented by other issuers. For further information and a detailed reconciliation of eachnon-GAAP measure used in this section of the MD&A to the most directly comparable IFRS measure, please see pages 44 to 55 of this MD&A. |
Financial Results
Barrick Nevada’s segment income for the first quarter of 2018 was 49% higher than the same prior year period primarily due to higher realized gold prices1 and lower cost of sales, partially offset by a decrease in sales volume.
In the first quarter of 2018, gold production was 10% lower than the same prior year period. Throughput at all three processing facilities has improved over the same prior year period, but was offset primarily by lower grades through the oxide mill and roaster. At the oxide mill, lower grades came from the Cortez Hills open pit (“CHOP”), which is transitioning from primarily oxide material to a mix of refractory and oxide ore as mining advances deeper into the pit. At the roaster facility, lower grades processed from Goldstrike open pit, Cortez Hills underground (“CHUG”), and Goldstrike underground were due to mine sequencing. At the autoclave, lower
recoveries were due to the available stockpile ore that was processed. Leach tonnes placed are down significantly in the current period due to mine sequencing from CHOP, however ounces produced have not changed over the same prior year period due to leach cycle timing.
Cost of sales per ounce4 in the first quarter of 2018 was $72 per ounce lower than the same prior year period mainly due to lower depreciation resulting from a significant decrease in CHOP ounces sold, which have relatively higher depreciation associated with them. Improvements at the autoclave, roaster, and oxide mill were driven byBest-in-Class plant optimization improvements, advanced processing controls, and processing optimal blends which resulted in lower costs per tonne. In addition, CHUG’s mining cost per tonne has decreased due to improvements from digitization
BARRICK FIRST QUARTER 2018 | 32 | MANAGEMENT’S DISCUSSION AND ANALYSIS |
initiatives combined with an increase in bulk mining. Operational improvements were largely offset by the effect of lower sales volume and higher labor costs, but should have a positive impact on costs as sales volumes increase in the second half of 2018. In the first quarter of 2018,all-in sustaining costs1 decreased by $4 per ounce compared to the same prior year period primarily reflecting lower minesite sustaining capital expenditures.
In the first quarter of 2018, capital expenditures increased by 12% compared to the same prior year period due to higher project expenditures, partially offset by lower minesite sustaining capital expenditures. Higher project capital expenditures are attributed to higher capitalized stripping at Crossroads, the Cortez Range Front declines, the Goldrush exploration declines, and the Deep South Expansion. This was partially offset by lower underground development at Cortez Hills Lower Zone. Minesite sustaining capital expenditures are lower in the first quarter of 2018 primarily as a result of the autoclave thiosulfate water treatment plant conversion which occurred in the same prior year period.
Outlook
We continue to expect 2018 production to be in the range of 2,000 to 2,255 thousand ounces and cost of sales per ounce4 to be in the range of $760 to $810. We continue to expect cash costs1 per ounce to be in the range of $470 to $530 andall-in sustaining costs1 to be between $610 to $660 per ounce.
We expect sustaining capital to be higher in the second quarter as the North American construction season ramps up, including higher stripping at Goldstrike open pit, and increased underground development at both CHUG and Goldstrike. A scheduled maintenance shutdown at the Barrick Nevada roaster in the second quarter will also impact first half production. We expect higher open pit and underground production from Barrick Nevada in the second half of the year, driven by higher sales and throughput.
The completion of capitalized development work, stripping, and maintenance in the second quarter, along with access to higher grades in the second half of the year, is expected to drive stronger production in the third and fourth quarters, at lower costs compared to the first half of 2018.
BARRICK FIRST QUARTER 2018 | 33 | MANAGEMENT’S DISCUSSION AND ANALYSIS |
Turquoise Ridge (75% basis), Nevada USA
Summary of Operating and Financial Data | For the three months ended March 31 | |||||||
2018 | 2017 | % Change | ||||||
Underground tonnes mined (000s) | 157 | 151 | 4 % | |||||
Average grade (grams/tonne) | ||||||||
Underground mined | 14.99 | 15.80 | (5)% | |||||
Gold produced (000s oz) | 46 | 55 | (16)% | |||||
Gold sold (000s oz) | 63 | 54 | 17 % | |||||
Segment revenue ($ millions) | $84 | $67 | 25 % | |||||
Cost of sales ($ millions) | 45 | 37 | 22 % | |||||
Segment income ($ millions) | 39 | 30 | 30 % | |||||
Segment EBITDA ($ millions)1 | 46 | 37 | 24 % | |||||
Capital expenditures ($ millions) | 13 | 9 | 44 % | |||||
Minesite sustaining | 6 | 9 | (33)% | |||||
Project | 7 | — | 100 % | |||||
Cost of sales (per oz) | 720 | 680 | 6 % | |||||
Cash costs (per oz)1 | 601 | 553 | 9 % | |||||
All-in sustaining costs (per oz)1 | 709 | 714 | (1)% | |||||
All-in costs (per oz)1 | $821 | $714 | 15 % |
1 | These arenon-GAAP financial performance measures with no standardized meaning under IFRS and therefore may not be comparable to similar measures presented by other issuers. For further information and a detailed reconciliation of eachnon-GAAP measure used in this section of the MD&A to the most directly comparable IFRS measure, please see pages 44 to 55 of this MD&A. |
Financial Results
Turquoise Ridge’s segment income for the first quarter of 2018 was 30% higher than the same prior year period primarily due to an increase in sales volume combined with higher realized gold prices1. This was partially offset by an increase in cost of sales as a result of higher mined volumes and higher processing unit costs.
In the first quarter of 2018, gold production was 16% lower than the same prior year period primarily due to lower grades mined than the previous year and the timing of shipments for processing. Gold sales were 17% higher than the same prior year period as we recognized the sales of the additional material shipped towards the end of the fourth quarter of 2017.
Cost of sales per ounce4 in the first quarter of 2018 was $40 per ounce higher than the same prior year period mainly reflecting an increase in processing costs attributed to the new toll milling agreement for the processing of ore at Newmont’s Twin Creeks facility. In the first quarter of 2018,all-in sustaining costs1 decreased by $5 per ounce compared to the same prior year period primarily reflecting lower minesite sustaining capital expenditures, partially offset by higher processing unit costs.
In the first quarter of 2018, capital expenditures increased by 44% compared to the same prior year period. The increase was primarily due to higher project capital expenditures relating to the construction of the third shaft. This was partially offset by a decrease in minesite sustaining capital expenditures due to lower capitalized underground development costs.
Outlook
We continue to expect 2018 production to be in the range of 240 to 270 thousand ounces (Barrick’s share) and cost of sales per ounce4 to be in the range of $670 to $720 per ounce. We continue to expect cash costs1 per ounce to be in the range of $580 to $620 andall-in sustaining costs1 to be in the range of $650 to $730 per ounce.
BARRICK FIRST QUARTER 2018 | 34 | MANAGEMENT’S DISCUSSION AND ANALYSIS |
Pueblo Viejo (60% basis)1, Dominican Republic
Summary of Operating and Financial Data | For the three months ended March 31 | |||||||
2018 | 2017 | % Change | ||||||
Open pit tonnes mined (000s) | 4,947 | 5,153 | (4)% | |||||
Average grade (grams/tonne) | ||||||||
Open pit mined | 2.39 | 2.97 | (20)% | |||||
Processed | 3.75 | 4.50 | (17)% | |||||
Autoclave ore tonnes processed (000s) | 1,272 | 1,095 | 16 % | |||||
Gold produced (000s oz) | 141 | 143 | (1)% | |||||
Gold sold (000s oz) | 148 | 143 | 3 % | |||||
Segment revenue ($ millions) | $218 | $186 | 17% | |||||
Cost of sales ($ millions) | 101 | 99 | 2 % | |||||
Segment income ($ millions) | 115 | 87 | 32 % | |||||
Segment EBITDA ($ millions)2 | 140 | 113 | 24 % | |||||
Capital expenditures ($ millions) | 23 | 13 | 77 % | |||||
Minesite sustaining | 23 | 13 | 77 % | |||||
Project | — | — | — % | |||||
Cost of sales (per oz) | 683 | 694 | (2)% | |||||
Cash costs (per oz)2 | 409 | 437 | (6)% | |||||
All-in sustaining costs (per oz)2 | 571 | 541 | 6 % | |||||
All-in costs (per oz)2 | $571 | $541 | 6 % |
1 | Pueblo Viejo is accounted for as a subsidiary with a 40%non-controlling interest. The results in the table and the discussion that follows are based on our 60% share only. |
2 | These arenon-GAAP financial performance measures with no standardized meaning under IFRS and therefore may not be comparable to similar measures presented by other issuers. For further information and a detailed reconciliation of eachnon-GAAP measure used in this section of the MD&A to the most directly comparable IFRS measure, please see pages 44 to 55 of this MD&A. |
Financial Results
Pueblo Viejo’s segment income for the first quarter of 2018 was 32% higher than the same prior year period primarily due to higher realized gold prices1 combined with an increase in sales volume.
In the first quarter of 2018, gold production was in line with the same prior year period. Lower planned ore grades processed during the quarter were offset by higher throughput due to improved autoclave efficiencies as a result ofBest-in-Class initiatives, the deferral of autoclave shutdowns to the second quarter of 2018, and higher recovery from improvements in carbon management, cyanide addition and regeneration kiln control.
Cost of sales per ounce4 in the first quarter of 2018 was $11 per ounce lower than the same prior year period mainly due to the impact of higher sales volume on unit production costs and lower contractor services. This was partially offset by higher royalties expense due to higher realized gold prices1, and higher fuel costs. In the first quarter of 2018,all-in sustaining costs1 increased by $30 per ounce compared to the same prior year period primarily due to higher minesite sustaining capital expenditures.
In the first quarter of 2018, capital expenditures increased by 77% compared to the same prior year period. Higher capital expenditures, as expected, were predominately related to the ongoing construction of the El Llagal tailings
storage facility and capitalized stripping costs associated with commencing Moore Pit phases 5 and 6.
Outlook
We continue to expect our equity share of 2018 gold production to be in the range of 585 to 615 thousand ounces and cost of sales per ounce4 to be in the range of $720 to $750 per ounce. We continue to expect cash costs1 per ounce to be in the range of $425 to $450 andall-in sustaining costs1 to be in the range of $590 to $620 per ounce.
Second quarter production will be impacted by scheduled autoclave maintenance shutdowns that commenced at the beginning of the quarter. Ore grades mined and processed are anticipated to increase in the following quarters as mining progresses into higher grade zones in Moore Pit phases 5 and 6. We expect a continuation of elevated capital expenditure levels in the following quarters related to the ongoing construction of the El Llagal tailings storage facility, capitalized stripping and a number of value enhancing projects such as the Quisqueya power plant conversion to natural gas and Bonao III substation construction.
BARRICK FIRST QUARTER 2018 | 35 | MANAGEMENT’S DISCUSSION AND ANALYSIS |
Veladero, Argentina1
Summary of Operating and Financial Data | For the three months ended March 31 | |||||||||
2018 | 2017 | % Change | ||||||||
Open pit tonnes mined (000s) | 10,102 | 18,705 | (46)% | |||||||
Average grade (grams/tonne) | ||||||||||
Open pit mined | 1.01 | 0.98 | 3% | |||||||
Processed | 1.04 | 1.04 | —% | |||||||
Heap leach ore tonnes processed (000s) | 3,960 | 7,256 | (45)% | |||||||
Gold produced (000s oz) | 74 | 151 | (51)% | |||||||
Gold sold (000s oz) | 74 | 165 | (55)% | |||||||
Segment revenue ($ millions) | $101 | $210 | (52)% | |||||||
Cost of sales ($ millions) | 76 | 140 | (46)% | |||||||
Segment income ($ millions) | 25 | 70 | (64)% | |||||||
Segment EBITDA ($ millions)2 | 56 | 108 | (48)% | |||||||
Capital expenditures ($ millions) | 31 | 50 | (38)% | |||||||
Minesite sustaining | 31 | 50 | (38)% | |||||||
Project | — | — | —% | |||||||
Cost of sales (per oz) | 1,036 | 846 | 22% | |||||||
Cash costs (per oz)2 | 576 | 580 | (1)% | |||||||
All-in sustaining costs (per oz)2 | 1,008 | 890 | 13% | |||||||
All-in costs (per oz)2 | $1,008 | $890 | 13% |
1 | We sold 50% of Veladero on June 30, 2017; therefore these represent results on a 100% basis from January 1 to June 30, 2017 and on a 50% basis from July 1, 2017 onwards. |
2 | These arenon-GAAP financial performance measures with no standardized meaning under IFRS and therefore may not be comparable to similar measures presented by other issuers. For further information and a detailed reconciliation of eachnon-GAAP measure used in this section of the MD&A to the most directly comparable IFRS measure, please see pages 44 to 55 of this MD&A. |
Financial Results
Veladero’s segment income for the first quarter of 2018 was 64% lower than the same prior year period primarily due to the impact of the divestment of 50% of the Veladero mine as at June 30, 2017. This was further impacted by an increase in depreciation expense as a result of the fair value increments applied to our remaining 50% interest, which was required to be fair valued as a result of the transaction.
In the first quarter of 2018, gold production was 51% lower than the same prior year period mainly due to the divestment of 50% of the Veladero mine as at June 30, 2017. Excluding the impact of the divestment, gold production decreased by 3% for the three months ended March 31, 2018 compared to the same prior year period due to a scheduled process plant stoppage in February, leading to a buildup of ounces on the leach pad. Additionally, higher stacking of the leach pad resulted in decreased optimization of heap permeability, partially compensated for by improved solution management.
Cost of sales per ounce4 in the first quarter of 2018 was $190 per ounce higher than the same prior year period primarily due to higher depreciation expense as a result of the impact of the fair value increments relating to the revaluation of our remaining 50% of the Veladero mine. The increase in cost of sales per ounce4 was further impacted by an increase in fuel prices, and the impact of lower sales volume on unit production costs. This was partially offset by a decrease in direct mining costs primarily due to consulting services occurring in the same
prior year period relating toBest-in-Class initiatives. As a result of these initiatives, we have experienced lower costs associated with maintenance parts and supplies during the first quarter of 2018. In the first quarter of 2018,all-in sustaining costs1 increased by $118 per ounce compared to the same prior year period primarily reflecting higher minesite sustaining capital expenditures and the impact of lower sales volume on unit costs.
In the first quarter of 2018, capital expenditures decreased by 38% compared to the same prior year period mainly due to the impact of the divestment of 50% of the Veladero mine as at June 30, 2017. Excluding the impact of the divestment, capital expenditures increased by 25% for the three months ended March 31, 2018 compared to the same prior year period due to higher capitalized stripping expenditures as a result of the development of phase 5 of the open pit. This was partly offset by the completion of the construction of phases 4B and 5B of the leach pad expansion and lower purchases of components and mine equipment.
Outlook
We continue to expect 2018 production to be in the range of 275 to 330 thousand ounces (Barrick’s share) and cost of sales per ounce4 to be in the range of $970 to $1,110. We continue to expect cash costs1 per ounce to be in the range of $560 to $620 andall-in sustaining costs1 to be in the range of $960 to $1,100 per ounce.
BARRICK FIRST QUARTER 2018 | 36 | MANAGEMENT’S DISCUSSION AND ANALYSIS |
Releases of Gold-bearing Process Solution
On March 28, 2017, the monitoring system at the Company’s Veladero mine detected a rupture of a pipe carrying gold-bearing process solution on the leach pad. This solution was contained within the operating site; no solution reached any diversion channels or watercourses. All affected soil was promptly excavated and placed on the leach pad.
On March 29, 2017, the San Juan provincial mining authority issued a violation notice against Minera Argentina Gold SRL (“MAG”) (formerly, Minera Argentina Gold S.A. or MAGSA) in connection with the incident and ordered a temporary restriction on the addition of new cyanide to the leach pad until corrective actions on the system were completed. The mining authority lifted the suspension on June 15, 2017, following inspection of corrective actions.
On October 10, 2017, the San Juan Provincial mining authority notified MAG of two charges under the infringement proceeding for alleged violations of the Mining Code in connection with the March 2017 incident.
On December 27, 2017, in connection with consolidated regulatory infringement proceedings brought against MAG relating to the March 27 incident and a September 2016 incident in which ice rolling down the slope of the leach pad at the Veladero mine damaged a pipe carrying process solution, causing some material (primarily crushed ore saturated with process solution) to leave the leach pad, MAG received notice of a resolution from the San Juan Provincial mining authority requiring payment of an administrative fine of approximately $5.6 million (calculated at the prevailing exchange rate on December 31, 2017) in respect of both the March 2017 and September 2016 incidents. This fine was in addition to the administrative fine of approximately $10 million (at the then applicable Argentinean peso/$ exchange rate) paid by MAG in connection with a process solution release that occurred in connection with a valve failure in September 2015. On January 23, 2018, in accordance with local requirements, MAG paid the administrative fine and filed a request for reconsideration with the San Juan Provincial mining authority. On March 28, 2018, MAG was notified that the San Juan Provincial mining authority had rejected the request for reconsideration. A further appeal will be heard and decided by the Governor of San Juan. Refer to note 17 to the Financial Statements for more information regarding this matter.
Federal Amparo Action
On April 4, 2017, the National Minister of Environment of Argentina filed a lawsuit in the Buenos Aires federal court (the “Federal Court”) in connection with the March 2017 incident. Theamparo protection action sought a court order requiring the cessation and/or suspension of activities at the Veladero mine. MAG submitted extensive
information to the Federal Court about the incident, the then-existing administrative and provincial judicial suspensions, the remedial actions taken by the Company and the lifting of the suspensions as described above. MAG also challenged the jurisdiction of the Federal Court and the standing of the National Minister of Environment of Argentina and requested that the matter be remanded to the Jachal Court. The Province of San Juan also challenged the jurisdiction of the Federal Court in this matter. On June 23, 2017, the Federal Court decided that it was competent to hear the case, and referred the case to the Court of Appeals to determine whether the Federal Court or Provincial Court in the case described above has the authority to assess the merits of theamparo remedy. On July 5, 2017, the Provincial Court issued a request for the Supreme Court of Argentina to resolve the jurisdictional dispute. On July 30, 2017, the Court of Appeals referred the jurisdictional dispute to the Supreme Court and a decision on the matter is pending. Refer to note 17 to the Financial Statements for more information regarding this matter.
Cyanide Leaching Process – Civil Action
On December 15, 2016, MAG was served notice of a lawsuit by certain persons who claim to be living in Jachal, Argentina (located approximately 150 kilometers away from the Veladero mine) and who claim to be affected by the Veladero mine and, in particular, the valley leach facility (“VLF”). In the lawsuit, which was filed in the San Juan Provincial court, the plaintiffs have requested a court order that MAG cease leaching metals with cyanide solutions, mercury and other similar substances at the Veladero mine and replace that process with one that is free of hazardous substances, that MAG implement a closure and remediation plan for the VLF and surrounding areas, and create a committee to monitor this process. The lawsuit is proceeding as an ordinary civil action. MAG replied to the lawsuit on February 20, 2017. On March 31, 2017, the plaintiffs supplemented their original complaint to allege that the risk of environmental damage had increased as a result of the March 28, 2017 release of gold-bearing process solution incident described above. The Company responded to the new allegations and intends to continue defending this matter vigorously. Refer to note 17 to the Financial Statements for more information regarding this matter.
BARRICK FIRST QUARTER 2018 | 37 | MANAGEMENT’S DISCUSSION AND ANALYSIS |
Lagunas Norte, Peru
Summary of Operating and Financial Data | For the three months ended March 31 | |||||||||
2018 | 2017 | % Change | ||||||||
Open pit tonnes mined tonnes mined (000s) | 7,407 | 8,762 | (15)% | |||||||
Average grade (grams/tonne) | ||||||||||
Open pit mined | 1.32 | 1.26 | 5 % | |||||||
Processed | 0.95 | 1.09 | (13)% | |||||||
Heap leach ore tonnes processed (000s) | 2,408 | 4,073 | (41)% | |||||||
Gold produced (000s oz) | 66 | 88 | (25)% | |||||||
Gold sold (000s oz) | 69 | 91 | (24)% | |||||||
Segment revenue ($ millions) | $96 | $115 | (17)% | |||||||
Cost of sales ($ millions) | 38 | 53 | (28)% | |||||||
Segment income ($ millions) | 56 | 59 | (5)% | |||||||
Segment EBITDA ($ millions)1 | 67 | 75 | (11)% | |||||||
Capital expenditures ($ millions) | 3 | 5 | (40)% | |||||||
Minesite sustaining | 2 | 4 | (50)% | |||||||
Project | 1 | 1 | — % | |||||||
Cost of sales (per oz) | 542 | 573 | (5)% | |||||||
Cash costs (per oz)1 | 330 | 356 | (7)% | |||||||
All-in sustaining costs (per oz)1 | 496 | 428 | 16 % | |||||||
All-in costs (per oz)1 | $507 | $437 | 16 % |
1 | These arenon-GAAP financial performance measures with no standardized meaning under IFRS and therefore may not be comparable to similar measures presented by other issuers. For further information and a detailed reconciliation of eachnon-GAAP measure used in this section of the MD&A to the most directly comparable IFRS measure, please see pages 44 to 55 of this MD&A. |
Financial Results
Lagunas Norte’s segment income for the first quarter of 2018 was 5% lower than the same prior year period primarily due the decrease in sales volume, partially offset by higher realized gold prices1 and lower cost of sales.
In the first quarter of 2018, gold production was 25% lower than the same prior year period primarily due to planned maintenance shutdowns at the crushing plant and lower ore tonnage mined, in line with expectations as the mine matures. This was further impacted by a decrease in mechanical availability of the loading and hauling equipment as a result of planned maintenance work.
Cost of sales per ounce4 in the first quarter of 2018 was $31 per ounce lower than the same prior year period due to lower labor costs, higher silverby-product credits and lower depreciation expense. This was partially offset by the impact of lower sales volume combined with higher direct mining costs attributed toBest-in-Class initiatives, such as the leach pad solution injection project, and maintenance works in the crushing plant and on loading and hauling equipment. In the first quarter of 2018,all-in sustaining costs1 increased by $68 per ounce compared
to the same prior year period primarily reflecting higher rehabilitation accretion and amortization, as the provision for environmental rehabilitation was increased at the end of 2017, partially offset by lower cost of sales and lower minesite sustaining capital expenditures.
In the first quarter of 2018, capital expenditures decreased by 40% compared to the same prior year period due to lower minesite sustaining capital expenditures and no capitalized stripping expenditures as the pit is in its final planned year of mining. This was partially offset by capitalized drilling targeting new open pit oxides opportunities. Project expenditures relate to ongoing studies for the mine life extension project.
Outlook
We continue to expect 2018 production to be in the range of 230 to 270 thousand ounces and cost of sales per ounce4 to be in the range of $780 to $910 per ounce. We continue to expect cash costs1 per ounce to be in the range of $420 to $490 andall-in sustaining costs1 to be in the range of $670 to $780 per ounce.
BARRICK FIRST QUARTER 2018 | 38 | MANAGEMENT’S DISCUSSION AND ANALYSIS |
Acacia Mining plc (100% basis), Africa
Summary of Operating and Financial Data | For the three months ended March 31 | |||||||||
2018 | 2017 | % Change | ||||||||
Total tonnes mined (000s) | 4,027 | 9,481 | (58)% | |||||||
Open pit | 3,840 | 9,122 | (58)% | |||||||
Underground | 187 | 359 | (48)% | |||||||
Average grade (grams/tonne) | ||||||||||
Open pit mined | 1.70 | 1.75 | (3)% | |||||||
Underground mined | 7.80 | 9.64 | (19)% | |||||||
Processed1 | 2.00 | 3.10 | (35)% | |||||||
Ore tonnes processed (000s) | 2,159 | 2,420 | (11)% | |||||||
Gold produced (000s oz) | 121 | 220 | (45)% | |||||||
Gold sold (000s oz) | 117 | 185 | (37)% | |||||||
Segment revenue ($ millions) | $157 | $232 | (32)% | |||||||
Cost of sales ($ millions) | 110 | 151 | (27)% | |||||||
Segment income ($ millions) | 71 | 75 | (5)% | |||||||
Segment EBITDA ($ millions)2 | 95 | 110 | (14)% | |||||||
Capital expenditures ($ millions) | 26 | 46 | (43)% | |||||||
Minesite sustaining | 24 | 46 | (48)% | |||||||
Project | 2 | — | —% | |||||||
Cost of sales (per oz) | 941 | 816 | 15% | |||||||
Cash costs (per oz)2 | 715 | 577 | 24% | |||||||
All-in sustaining costs (per oz)2 | 976 | 934 | 4% | |||||||
All-in costs (per oz)2 | $991 | $937 | 6% |
1 | Includes processing of tailings retreatment. |
2 | These arenon-GAAP financial performance measures with no standardized meaning under IFRS and therefore may not be comparable to similar measures presented by other issuers. For further information and a detailed reconciliation of eachnon-GAAP measure used in this section of the MD&A to the most directly comparable IFRS measure, please see pages 44 to 55 of this MD&A. |
Barrick holds a 63.9 percent equity interest in Acacia Mining plc, a publicly traded company listed on the London Stock Exchange that is operated independently of Barrick.
Financial Results
Acacia’ssegment income for the first quarter of 2018 was 5% lower than the same prior year period primarily due to lower sales volume, partially offset by higher realized gold prices1 and the recognition of the sale of anon-core royalty asset.
In the first quarter of 2018, gold production was 45% lower than the same prior year period primarily due to Bulyanhulu being transitioned to reduced operations in late 2017, production being sourced from primarily ore stockpiles at Buzwagi, and lower grades at the Gokona underground mine at North Mara.
Cost of sales per ounce4 in the first quarter of 2018 was 15% higher than the same prior year period primarily reflecting the impact of lower sales volume on unit production costs and increased drawdown of ore stockpiles at Buzwagi. This was partially offset by lower direct mining costs at Buzwagi and Bulyanhulu as a result of ceased mining activities.All-in sustaining costs1 were 4% higher than the same prior year period due to higher cost of sales per ounce4, partially offset by a decrease in minesite sustaining capital expenditures.
In the first quarter of 2018, capital expenditures decreased by 43% compared to the same prior year period primarily due to the reduced operations at Bulyanhulu.
Outlook
We continue to expect 2018 production to be in the range of 275 to 305 thousand ounces (Barrick’s share) and cost of sales per ounce4 to be in the range of $970 to $1,020 per ounce. We continue to expect cash costs1 per ounce to be in the range of $690 to $720 andall-in sustaining costs1 to be in the range of $935 to $985 per ounce.
Concentrate Export Ban and Related Disputes with the Government of Tanzania
On March 3, 2017, the Tanzanian Government announced a general ban on the export of metallic mineral concentrates (the “Ban”) following a directive made by the President to promote the creation of a domestic smelting industry. Following the directive, Acacia ceased all exports of its gold/copper concentrate (“concentrate”) including containers previously approved for export prior to the Ban which are located in Dar es Salaam.
The prevention of exports impacts Bulyanhulu and Buzwagi which produce gold in both doré and in concentrate form due to the mineralogy of the ore. North Mara is unaffected due to 100% of its production being doré. Since the Ban was imposed, Acacia has seen a buildup of approximately 186,000 ounces of gold, 12.1 million
BARRICK FIRST QUARTER 2018 | 39 | MANAGEMENT’S DISCUSSION AND ANALYSIS |
pounds of copper and 159,000 ounces of silver contained in the unsold concentrate. As a result of the transition to a reduced operations program at Bulyanhulu, and the changes to the process flowsheet at Buzwagi, all of Acacia’smines are now solely producing doré, and as such will no longer see a further build up of concentrate.
During the second quarter of 2017, investigations were conducted on behalf of the Tanzanian Government by two Tanzanian Government Presidential Committees, which have resulted in allegations of historical undeclared revenue and unpaid taxes being made against Acacia and its predecessor companies. Acacia considers these findings to be implausible and has fully refuted the findings of both Presidential Committees. Acacia has requested copies of the reports issued by the two Presidential Committees and called for independent verification of the findings, but has not yet received a response to these requests.
On July 4, 2017, Acacia’s subsidiaries, Bulyanhulu Gold Mine Limited (“BGML”), the owner of the Bulyanhulu mine, and Pangea Minerals Limited (“PML”), the owner of the Buzwagi mine, each commenced international arbitrations against the Government of Tanzania in accordance with the dispute resolution processes agreed by the Government of Tanzania in the Mineral Development Agreements (“MDAs”) with BGML and PML. These arbitrations remain ongoing.
In July 2017, Acacia received adjusted assessments for the tax years 2000-2017 from the Tanzania Revenue Authority (the “TRA”) for a total amount of approximately $190 billion for alleged unpaid taxes, interest and penalties, apparently issued in respect of alleged and disputed under-declared export revenues, and appearing to follow on from the announced findings of the First and Second Presidential Committees. These assessments are being disputed and the underlying allegations are included in the matters that have been referred to international arbitration.
In addition, following the end of the third quarter, Acacia was served with notices of conflicting adjusted corporate income tax and withholding tax assessments for tax years 2005 to 2011 with respect to Acacia’s former Tulawaka joint venture, and demands for payment, for a total amount of approximately $3 billion. Interest and penalties represent the vast majority of the new assessments. The TRA has not provided Acacia with any explanations or reasons for the adjusted assessments, or with the TRA’s position on how the assessments have been calculated or why they have been issued. Acacia disputes these assessments and has requested supporting calculations, which have not yet been received. Acacia is objecting to these assessments and defending this matter through the Tanzanian tax appeals process.
In addition to the Ban, new and amended legislation was passed in Tanzania in early July 2017, including various amendments to the 2010 Mining Act and a new Finance Act. The amendments to the 2010 Mining Act increased the royalty rate applicable to metallic minerals such as gold, copper and silver to 6% (from 4%), and the new Finance Act imposes a 1% clearing fee on the value of all
minerals exported from Tanzania from July 1, 2017. In January 2018, new Mining Regulations were announced by the Tanzanian Government introducing, among other things, local content requirements, export regulations and mineral rights regulations, the scope and effect of which remain under review by Acacia. Acacia continues to monitor the impact of all new legislation in light of its MDAs with the Government of Tanzania. However, to minimize further disruptions to its operations Acacia will, in the interim, satisfy the requirements imposed as regards the increased royalty rate in addition to the recently imposed 1% clearing fee on exports. Acacia is making these payments under protest, without prejudice to its legal rights under its MDAs.
Acacia has been looking to address all issues in respect of the Ban along with other ongoing disputes through dialogue with the Tanzanian Government. Acacia remains of the view that a negotiated resolution is the preferable outcome to the current disputes and Acacia will continue to work to achieve this. During the third quarter of 2017, Barrick and the Government of Tanzania engaged in discussions for the potential resolution of the disputes. Acacia did not participate directly in these discussions as the Government of Tanzania had informed Barrick that it wished to continue dialogue solely with Barrick.
On October 19, 2017, Barrick announced that it had agreed with the Government of Tanzania on a proposed framework for a new partnership between Acacia and the Government of Tanzania. Barrick and the Government of Tanzania also agreed to form a working group that will focus on the resolution of outstanding tax claims against Acacia. Key terms of the proposed framework announced by Barrick and the Government of Tanzania include (i) the creation of a new Tanzanian company to manage Acacia’s Bulyanhulu, Buzwagi and North Mara mines and all future operations in the country with key officers located in Tanzania and Tanzanian representation on the board of directors; (ii) maximization of local employment of Tanzanians and procurement of goods and services within Tanzania; (iii) economic benefits from Bulyanhulu, Buzwagi and North Mara to be shared on a 50/50 basis, with the Government’s share delivered in the form of royalties, taxes and a 16% free carry interest in Acacia’s Tanzanian operations; and (iv) in support of the working group’s ongoing efforts to resolve outstanding tax claims, Acacia would make a payment of $300 million to the Government of Tanzania, staged over time, on terms to be settled by the working group. Barrick and the Government of Tanzania are also reviewing the conditions for the lifting of the Ban. Negotiations concerning the proposed framework remain ongoing and the definitive terms of any final proposal for the implementation of the framework remain outstanding. We continue to target the first half of 2018 for the completion of a detailed proposal for review by Acacia. Such terms would be subject to review and approval by Acacia.
Refer to note 17 to the Financial Statements for more information regarding this matter.
BARRICK FIRST QUARTER 2018 | 40 | MANAGEMENT’S DISCUSSION AND ANALYSIS |
Pascua-Lama, Argentina/Chile
The Pascua-Lama project, located on the border between Chile and Argentina, contains 21.3 million ounces of measured and indicated gold resources.
Over the past year, Barrick has been studying the optimization of the Pascua-Lama project. Work to date on the prefeasibility study for a potential underground project indicates that while the concept may be feasible from a technical standpoint, it does not meet Barrick’s investment criteria. Based on this, and taking into consideration other risk factors, the Company has suspended work on the prefeasibility study, and will focus on adjusting the project closure plan for surface infrastructure on the Chilean side of the project, in line with legal requirements. Barrick will continue to evaluate opportunities tode-risk the project while maintaining Pascua-Lama as an option for development in the future if economics improve, and related risks can be mitigated.
SMA Regulatory Sanctions
On January 17, 2018, Compañía Minera Nevada (“CMN”), Barrick’s Chilean subsidiary that holds the Chilean portion of the Pascua-Lama project, received a resolution of closure of existing infrastructure on the Chilean side of the Pascua-Lama project (the “Resolution”) from Chile’s environmental regulator (the Superintendencia del Medio Ambiente, or the “SMA”). The Resolution also reduced the original administrative fine from approximately $16 million to $11.5 million and ordered certain monitoring activities. The Resolution does not revoke the Project’s environmental approval. CMN filed an appeal of the Resolution on February 3, 2018. Refer to note 17 to the Financial Statements for more information regarding this matter.
Water Quality Review
CMN initiated a review of the baseline water quality of the Rio Estrecho in August 2013 as required by a July 15, 2013 decision of the Court of Appeals of Copiapo, Chile. The purpose of the review was to establish whether the water quality baseline has changed since the Pascua-Lama project received its environmental approval in February 2006 and, if so, to require CMN to adopt the appropriate corrective measures. As a result of that study, CMN requested certain modifications to its environmental permit water quality requirements. On June 6, 2016, the responsible agency approved a partial amendment of the environmental permit to better reflect the water quality baseline from 2009. That approval was appealed by certain water users and indigenous residents of the Huasco Valley. On October 19, 2016, the Chilean Committee of Ministers for the Environment, which has jurisdiction over claims of this nature, voted to uphold the permit amendments. On January 27, 2017, the Environmental Court agreed to consider an appeal of the Chilean Committee’s decision brought by CMN and the water users and indigenous residents. A hearing took place on July 25, 2017. On December 12, 2017, the water users withdrew their appeal. The Environmental Court dismissed that appeal on January 5, 2018. A decision of the Environmental Court on the remaining appeals is still pending. Refer to note 17 to the Financial Statements for more information regarding this matter.
BARRICK FIRST QUARTER 2018 | 41 | MANAGEMENT’S DISCUSSION AND ANALYSIS |
COMMITMENTS AND CONTINGENCIES
Litigation and Claims
We are currently subject to various litigation proceedings as disclosed in note 17 to the Financial Statements, and we may be involved in disputes with other parties in the future that may result in litigation. If we are unable to resolve these disputes favorably, it may have a material adverse impact on our financial condition, cash flow and results of operations.
Contractual Obligations and Commitments
In the normal course of business, we enter into contracts that give rise to commitments for future minimum payments. The following table summarizes the remaining contractual maturities of our financial liabilities and operating and capital commitments shown on an undiscounted basis:
($ millions) | Payments due as at March 31, 2018 | |||||||||||||||||||||||||||
2018 | 2019 | 2020 | 2021 | 2022 | | 2023 and thereafter | | Total | ||||||||||||||||||||
Debt1 | ||||||||||||||||||||||||||||
Repayment of principal | $17 | $33 | $263 | $636 | $337 | $5,109 | $6,395 | |||||||||||||||||||||
Capital leases | 19 | 11 | 4 | 1 | 1 | 2 | 38 | |||||||||||||||||||||
Interest | 336 | 360 | 356 | 331 | 311 | 5,042 | 6,736 | |||||||||||||||||||||
Provisions for environmental rehabilitation2 | 140 | 144 | 211 | 262 | 230 | 2,859 | 3,846 | |||||||||||||||||||||
Operating leases | 19 | 16 | 11 | 10 | 9 | 11 | 76 | |||||||||||||||||||||
Restricted share units | 4 | 27 | 5 | — | — | — | 36 | |||||||||||||||||||||
Pension benefits and other post-retirement benefits | 11 | 15 | 14 | 14 | 13 | 206 | 273 | |||||||||||||||||||||
Derivative liabilities3 | 12 | 2 | — | — | — | — | 14 | |||||||||||||||||||||
Purchase obligations for supplies and consumables4 | 470 | 276 | 216 | 122 | 4 | — | 1,088 | |||||||||||||||||||||
Capital commitments5 | 101 | 4 | 4 | 3 | — | 22 | 134 | |||||||||||||||||||||
Social development costs6 | 7 | 11 | 3 | 1 | 1 | 225 | 248 | |||||||||||||||||||||
Total | $1,136 | $899 | $1,087 | $1,380 | $906 | $13,476 | $18,884 |
1 | Debt and Interest - Our debt obligations do not include any subjective acceleration clauses or other clauses that enable the holder of the debt to call for early repayment, except in the event that we breach any of the terms and conditions of the debt or for other customary events of default. We are not required to post any collateral under any debt obligations. Projected interest payments on variable rate debt were based on interest rates in effect at March 31, 2018. Interest is calculated on our long-term debt obligations using both fixed and variable rates. |
2 | Provisions for environmental rehabilitation - Amounts presented in the table represent the undiscounted uninflated future payments for the expected cost of provisions for environmental rehabilitation. |
3 | Derivative liabilities - Amounts presented in the table relate to derivative contracts disclosed under note 25C to the 2017 Annual Report. Payments related to derivative contracts may be subject to change given variable market conditions. |
4 | Purchase obligations for supplies and consumables - Includes commitments related to new purchase obligations to secure a supply of acid, tires and cyanide for our production process. |
5 | Capital commitments - Purchase obligations for capital expenditures include only those items where binding commitments have been entered into. |
6 | Social development costs - Includes a commitment of $180 million related to the potential funding of a power transmission line in Argentina, the majority of which is not expected to be paid prior to 2023. |
BARRICK FIRST QUARTER 2018 | 42 | MANAGEMENT’S DISCUSSION AND ANALYSIS |
REVIEW OF QUARTERLY RESULTS
Quarterly Information1
($ millions, except where indicated) | 2018 | 2017 | 2016 | |||||||||||||||||||||||||||||
Q1 | Q4 | Q3 | Q2 | Q1 | Q4 | Q3 | Q2 | |||||||||||||||||||||||||
Revenues | $1,790 | $2,228 | $1,993 | $2,160 | $1,993 | $2,319 | $2,297 | $2,012 | ||||||||||||||||||||||||
Realized price per ounce – gold2 | 1,332 | 1,280 | 1,274 | 1,258 | 1,220 | 1,217 | 1,333 | 1,259 | ||||||||||||||||||||||||
Realized price per pound – copper2 | 2.98 | 3.34 | 3.05 | 2.60 | 2.76 | 2.62 | 2.18 | 2.14 | ||||||||||||||||||||||||
Cost of sales | 1,152 | 1,411 | 1,270 | 1,277 | 1,342 | 1,454 | 1,291 | 1,336 | ||||||||||||||||||||||||
Net earnings (loss) | 158 | (314 | ) | (11 | ) | 1,084 | 679 | 425 | 175 | 138 | ||||||||||||||||||||||
Per share (dollars)3 | 0.14 | (0.27 | ) | (0.01 | ) | 0.93 | 0.58 | 0.36 | 0.15 | 0.12 | ||||||||||||||||||||||
Adjusted net earnings2 | 170 | 253 | 200 | 261 | 162 | 255 | 278 | 158 | ||||||||||||||||||||||||
Per share (dollars)2,3 | 0.15 | 0.22 | 0.17 | 0.22 | 0.14 | 0.22 | 0.24 | 0.14 | ||||||||||||||||||||||||
Operating cash flow | 507 | 590 | 532 | 448 | 495 | 711 | 951 | 527 | ||||||||||||||||||||||||
Cash capital expenditures | 326 | 350 | 307 | 405 | 334 | 326 | 277 | 253 | ||||||||||||||||||||||||
Free cash flow2 | $181 | $240 | $225 | $43 | $161 | $385 | $674 | $274 |
1 | Sum of all the quarters may not add up to the annual total due to rounding. |
2 | Realized price, adjusted net earnings, adjusted net earnings per share and free cash flow arenon-GAAP financial performance measures with no standardized meaning under IFRS and therefore may not be comparable to similar measures of performance presented by other issuers. For further information and a detailed reconciliation of eachnon-GAAP measure used in this section of the MD&A to the most directly comparable IFRS measure, please see pages 44 to 55 of this MD&A. |
3 | Calculated using weighted average number of shares outstanding under the basic method of earnings per share. |
Our recent financial results reflect our emphasis on cost control and growing operating cash flow and free cash flow. Gold prices have fluctuated around $1,200 - $1,300 per ounce over the past two years and we are consistently generating positive free cash flow1. This free cash flow, combined with the proceeds from various divestitures, have allowed us to strengthen our balance sheet over the past two years. In the fourth quarter of 2017, we recorded $521 million (net of tax effects andnon-controlling interest) of net asset impairments primarily relating to impairments at the Pascua-Lama project and Acacia’s Bulyanhulu mine, partially offset by an impairment reversal at Lumwana. In the third quarter of 2017, we recognized a $172 million tax provision relating to the
impact of the proposed framework for Acacia operations in Tanzania. In the second quarter of 2017, we recorded $858 million (net of tax effects) of gains on the disposition of 50% of the Veladero mine and a 25% interest in the Cerro Casale project. In the first quarter of 2017, we recorded a net asset impairment reversal of $522 million (net of tax effects and non-controlling interest) primarily relating to impairment reversals at the Cerro Casale project. In the fourth quarter of 2016, we recorded a net asset impairment reversal of $199 million (net of tax effects) primarily relating to impairment reversals at Veladero and Lagunas Norte.
INTERNAL CONTROL OVER FINANCIAL REPORTING AND DISCLOSURE CONTROLS AND PROCEDURES
Management is responsible for establishing and maintaining adequate internal control over financial reporting and disclosure controls and procedures as defined in our 2017 annual MD&A.
Together, the internal control frameworks provide internal control over financial reporting and disclosure. Due to its inherent limitations, internal control over financial reporting and disclosure may not prevent or detect all misstatements. Further, the effectiveness of internal control is subject to the risk that controls may become inadequate because of changes in conditions, or that the degree of compliance with policies or procedures may change.
There were no changes in the Company’s internal control over financial reporting during the first quarter of 2018 that have materially affected, or are reasonably likely to materially affect, the Company’s internal control over financial reporting.
Management will continue to monitor the effectiveness of its internal control over financial reporting and disclosure controls and procedures and may make modifications from time to time as considered necessary.
BARRICK FIRST QUARTER 2018 | 43 | MANAGEMENT’S DISCUSSION AND ANALYSIS |
IFRS CRITICAL ACCOUNTING POLICIES AND ACCOUNTING ESTIMATES
Management has discussed the development and selection of our critical accounting estimates with the Audit Committee of the Board of Directors, and the Audit Committee has reviewed the disclosure relating to such estimates in conjunction with its review of this MD&A. The accounting policies and methods we utilize determine how we report our financial condition and results of operations, and they may require Management to make estimates or rely on assumptions about matters that are inherently uncertain. The consolidated financial statements have been prepared in accordance with International Financial Reporting Standards (“IFRS”) as issued by the International Accounting Standards Board (“IASB”) under the historical cost convention, as modified by revaluation of certain financial assets, derivative contracts and post-retirement assets. Our significant accounting policies are disclosed in note 2 of the Financial
Statements, including a summary of current and future changes in accounting policies.
Critical Accounting Estimates and Judgments
Certain accounting estimates have been identified as being “critical” to the presentation of our financial condition and results of operations because they require us to make subjective and/or complex judgments about matters that are inherently uncertain; or there is a reasonable likelihood that materially different amounts could be reported under different conditions or using different assumptions and estimates. Our significant accounting judgments, estimates and assumptions are disclosed in note 3 of the accompanying Financial Statements.
NON-GAAP FINANCIAL PERFORMANCE MEASURES
Adjusted Net Earnings and Adjusted Net Earnings per Share
Adjusted net earnings is anon-GAAP financial measure which excludes the following from net earnings:
• | Impairment charges (reversals) related to intangibles, goodwill, property, plant and equipment, and investments; |
• | Acquisition/disposition gains/losses; |
• | Foreign currency translation gains/losses; |
• | Significant tax adjustments; |
• | Unrealized gains/losses onnon-hedge derivative instruments; and |
• | Tax effect andnon-controlling interest of the above items. |
Management uses this measure internally to evaluate our underlying operating performance for the reporting periods presented and to assist with the planning and forecasting of future operating results. Management believes that adjusted net earnings is a useful measure of our performance because impairment charges, acquisition/disposition gains/losses and significant tax adjustments do not reflect the underlying operating performance of our core mining business and are not necessarily indicative of future operating results. Furthermore, foreign currency translation gains/losses and unrealized gains/losses fromnon-hedge derivatives are not necessarily reflective of the underlying operating results for the reporting periods presented. The tax effect andnon-controlling interest of the adjusting items are also excluded to reconcile the amounts to Barrick’s share on apost-tax basis, consistent with net earnings.
As noted, we use this measure for internal purposes. Management’s internal budgets and forecasts and public guidance do not reflect the types of items we adjust for. Consequently, the presentation of adjusted net earnings enables investors and analysts to better understand the underlying operating performance of our core mining business through the eyes of management. Management periodically evaluates the components of adjusted net earnings based on an internal assessment of performance measures that are useful for evaluating the operating performance of our business segments and a review of thenon-GAAP measures used by mining industry analysts and other mining companies.
Adjusted net earnings is intended to provide additional information only and does not have any standardized definition under IFRS and should not be considered in isolation or as a substitute for measures of performance prepared in accordance with IFRS. The measures are not necessarily indicative of operating profit or cash flow from operations as determined under IFRS. Other companies may calculate these measures differently. The following table reconciles thesenon-GAAP measures to the most directly comparable IFRS measure.
BARRICK FIRST QUARTER 2018 | 44 | MANAGEMENT’S DISCUSSION AND ANALYSIS |
Reconciliation of Net Earnings to Net Earnings per Share, Adjusted Net Earnings and Adjusted Net Earnings per Share
($ millions, except per share amounts in dollars) | For the three months ended March 31 | |||||||
2018 | 2017 | |||||||
Net earnings attributable to equity holders of the Company | $158 | $679 | ||||||
Impairment charges related to intangibles, goodwill, property, plant and equipment, and investments1 | 2 | (1,125 | ) | |||||
Acquisition/disposition (gains)/losses2 | (46 | ) | 3 | |||||
Foreign currency translation losses | 15 | 3 | ||||||
Significant tax adjustments3 | 46 | (3 | ) | |||||
Other expense adjustments | (6 | ) | 6 | |||||
Unrealized gains onnon-hedge derivative instruments | — | 3 | ||||||
Tax effect andnon-controlling interest | 1 | 596 | ||||||
Adjusted net earnings | $170 | $162 | ||||||
Net earnings per share4 | 0.14 | 0.58 | ||||||
Adjusted net earnings per share4 | 0.15 | 0.14 |
1 | Net impairment reversals for the three months ended March 31, 2017 primarily relate to impairment reversals at the Cerro Casale project upon reclassification of the project’s net assets asheld-for-sale as at March 31, 2017. |
2 | Disposition gains for the three months ended March 31, 2018 primarily relate to the gain on the sale of anon-core royalty asset at Acacia. |
3 | Significant tax adjustments for the three months ended March 31, 2018 primarily relate to a tax audit of Pueblo Viejo in the Dominican Republic. |
4 | Calculated using weighted average number of shares outstanding under the basic method of earnings per share. |
Free Cash Flow
Free cash flow is a measure that deducts capital expenditures from net cash provided by operating activities. Management believes this to be a useful indicator of our ability to operate without reliance on additional borrowing or usage of existing cash.
Free cash flow is intended to provide additional information only and does not have any standardized definition under IFRS, and should not be considered in isolation or as a substitute for measures of performance prepared in accordance with IFRS. The measure is not
necessarily indicative of operating profit or cash flow from operations as determined under IFRS. Other companies may calculate this measure differently. The following table reconciles thisnon-GAAP measure to the most directly comparable IFRS measure.
Reconciliation of Net Cash Provided by Operating Activities to Free Cash Flow
($ millions) | For the three months ended March 31 | |||||||
2018 | 2017 | |||||||
Net cash provided by operating activities | $507 | $495 | ||||||
Capital expenditures | (326 | ) | (334 | ) | ||||
Free cash flow | $181 | $161 |
BARRICK FIRST QUARTER 2018 | 45 | MANAGEMENT’S DISCUSSION AND ANALYSIS |
Cash costs per ounce,All-in sustaining costs per ounce,All-in costs per ounce, C1 cash costs per pound andAll-in sustaining costs per pound
Cash costs per ounce,all-in sustaining costs per ounce andall-in costs per ounce arenon-GAAP financial measures which are calculated based on the definition published by the World Gold Council (“WGC”) (a market development organization for the gold industry comprised of and funded by 25 gold mining companies from around the world, including Barrick). The WGC is not a regulatory organization. Management uses these measures to monitor the performance of our gold mining operations and its ability to generate positive cash flow, both on an individual site basis and an overall company basis.
Cash costs start with our cost of sales related to gold production and removes depreciation, thenon-controlling interest of cost of sales and includes by product credits.All-in sustaining costs start with cash costs and include sustaining capital expenditures, general and administrative costs, minesite exploration and evaluation costs and reclamation cost accretion and amortization. These additional costs reflect the expenditures made to maintain current production levels.
All-in costs starts withall-in sustaining costs and adds additional costs that reflect the varying costs of producing gold over the life-cycle of a mine, including: project capital expenditures (capital expenditures at new projects and discrete projects at existing operations intended to increase production capacity and will not benefit production for at least 12 months) and othernon-sustaining costs (primarily exploration and evaluation costs, community relations costs and general and administrative costs that are not associated with current operations). These definitions recognize that there are different costs associated with the life-cycle of a mine, and that it is therefore appropriate to distinguish between sustaining andnon-sustaining costs.
We believe that our use of cash costs,all-in sustaining costs andall-in costs will assist analysts, investors and other stakeholders of Barrick in understanding the costs associated with producing gold, understanding the economics of gold mining, assessing our operating performance and also our ability to generate free cash flow from current operations and to generate free cash flow on an overall company basis. Due to the capital-intensive nature of the industry and the long useful lives over which these items are depreciated, there can be a significant timing difference between net earnings calculated in accordance with IFRS and the amount of free cash flow that is being generated by a mine and therefore we believe these measures are usefulnon-GAAP operating metrics and supplement our IFRS disclosures. These measures are not representative of all of our cash expenditures as they do not include income
tax payments, interest costs or dividend payments. These measures do not include depreciation or amortization.
Cash costs per ounce,all-in sustaining costs andall-in costs are intended to provide additional information only and do not have standardized definitions under IFRS, and should not be considered in isolation or as a substitute for measures of performance prepared in accordance with IFRS. These measures are not equivalent to net income or cash flow from operations as determined under IFRS. Although the WGC has published a standardized definition, other companies may calculate these measures differently.
In addition to presenting these metrics on aby-product basis, we have calculated these metrics on aco-product basis. Ourco-product metrics remove the impact of other metal sales that are produced as aby-product of our gold production from cost per ounce calculations, but does not reflect a reduction in costs for costs associated with other metal sales.
C1 cash costs per pound andall-in sustaining costs per pound arenon-GAAP financial measures related to our copper mine operations. We believe that C1 cash costs per pound enables investors to better understand the performance of our copper operations in comparison to other copper producers who present results on a similar basis. C1 cash costs per pound excludes royalties andnon-routine charges as they are not direct production costs.All-in sustaining costs per pound is similar to the goldall-in sustaining costs metric and management uses this to better evaluate the costs of copper production. We believe this measure enables investors to better understand the operating performance of our copper mines as this measure reflects all of the sustaining expenditures incurred in order to produce copper.All-in sustaining costs per pound includes C1 cash costs, corporate general and administrative costs, minesite exploration and evaluation costs, royalties, environmental rehabilitation costs and write-downs taken on inventory to net realizable value.
BARRICK FIRST QUARTER 2018 | 46 | MANAGEMENT’S DISCUSSION AND ANALYSIS |
Reconciliation of Gold Cost of Sales to Cash costs,All-in sustaining costs andAll-in costs, including on a per ounce basis
($ millions, except per ounce information in dollars) | For the three months ended March 31 | |||||||||||
Footnote | 2018 | 2017 | ||||||||||
Cost of sales applicable to gold production | $1,046 | $1,238 | ||||||||||
Depreciation | (298 | ) | (385 | ) | ||||||||
By-product credits | (36 | ) | (41 | ) | ||||||||
Realized (gains)/losses on hedge andnon-hedge derivatives | 1 | — | — | |||||||||
Non-recurring items | 2 | (7 | ) | — | ||||||||
Other | 3 | (21 | ) | (20 | ) | |||||||
Non-controlling interests (Pueblo Viejo and Acacia) | 4 | (72 | ) | (81 | ) | |||||||
Cash costs | $612 | $711 | ||||||||||
General & administrative costs | 48 | 72 | ||||||||||
Minesite exploration and evaluation costs | 5 | 6 | 7 | |||||||||
Minesite sustaining capital expenditures | 6 | 231 | 262 | |||||||||
Rehabilitation - accretion and amortization (operating sites) | 7 | 19 | 17 | |||||||||
Non-controlling interest, copper operations and other | 8 | (55 | ) | (61 | ) | |||||||
All-in sustaining costs | $861 | $1,008 | ||||||||||
Project exploration and evaluation and project costs | 5 | 67 | 68 | |||||||||
Community relations costs not related to current operations | 1 | 1 | ||||||||||
Project capital expenditures | 6 | 100 | 56 | |||||||||
Rehabilitation - accretion and amortization(non-operating sites) | 7 | 8 | 3 | |||||||||
Non-controlling interest and copper operations | 8 | (5 | ) | (7 | ) | |||||||
All-in costs | $1,032 | $1,129 | ||||||||||
Ounces sold - equity basis (000s ounces) | 9 | 1,071 | 1,305 | |||||||||
Cost of sales per ounce | 10,11 | $878 | $833 | |||||||||
Cash costs per ounce | 11 | $573 | $545 | |||||||||
Cash costs per ounce (on aco-product basis) | 11,12 | $596 | $568 | |||||||||
All-in sustaining costs per ounce | 11 | $804 | $772 | |||||||||
All-in sustaining costs per ounce (on aco-product basis) | 11,12 | $827 | $795 | |||||||||
All-in costs per ounce | 11 | $963 | $865 | |||||||||
All-in costs per ounce (on aco-product basis) | 11,12 | $986 | $888 |
1 | Realized (gains)/losses on hedge andnon-hedge derivatives |
Includes realized hedge losses of $1 million for the three months ended March 31, 2018 (2017: $6 million), and realizednon-hedge gains of $1 million for the three months ended March 31, 2018 (2017: $6 million). Refer to Note 5 to the Financial Statements for further information.
2 | Non-recurring items |
Non-recurring items in 2018 relate to abnormal costs at Porgera as a result of the February 2018 earthquake in Papua New Guinea. These costs are not indicative of our cost of production and have been excluded from the calculation of cash costs.
3 | Other |
Other adjustments for the three months ended March 31, 2018 include adding the cost of treatment and refining charges of $nil (2017: $1 million) and the removal of cash costs andby-product credits associated with our Pierina mine, which is mining incidental ounces as it enters closure, of $21 million (2017: $21 million).
4 | Non-controlling interests (Pueblo Viejo and Acacia) |
Non-controlling interests includenon-controlling interests related to gold production of $106 million for the three months ended March 31, 2018 (2017: $116 million). Refer to Note 5 to the Financial Statements for further information.
5 | Exploration and evaluation costs |
Exploration, evaluation and project expenses are presented as minesite sustaining if it supports current mine operations and project if it relates to future projects. Refer to page 28 of this MD&A.
6 | Capital expenditures |
Capital expenditures are related to our gold sites only and are presented on a 100% accrued basis. They are split between minesite sustaining and project capital expenditures. Project capital expenditures are distinct projects designed to increase the net present value of the mine and are not related to current production. Significant projects in the current year are stripping at Cortez Crossroads, the Range Front declines, the Goldrush exploration declines and construction of the third shaft at Turquoise Ridge). Refer to page 27 of this MD&A.
BARRICK FIRST QUARTER 2018 | 47 | MANAGEMENT'S DISCUSSION AND ANALYSIS |
7 | Rehabilitation—accretion and amortization |
Includes depreciation on the assets related to rehabilitation provisions of our gold operations and accretion on the rehabilitation provision of our gold operations, split between operating andnon-operating sites.
8 | Non-controlling interest and copper operations |
Removes general & administrative costs related tonon-controlling interests and copper based on a percentage allocation of revenue. Also removes exploration, evaluation and project expenses, rehabilitation costs and capital expenditures incurred by our copper sites and thenon-controlling interest of our Acacia and Pueblo Viejo operating segments and South Arturo. Figures remove the impact of Pierina. The impact is summarized as the following:
($ millions) | For the three months ended March 31 | |||||||
Non-controlling interest, copper operations and other | 2018 | 2017 | ||||||
General & administrative costs | ($7 | ) | ($9 | ) | ||||
Minesite exploration and evaluation expenses | — | (1 | ) | |||||
Rehabilitation - accretion and amortization (operating sites) | (1 | ) | (3 | ) | ||||
Minesite sustaining capital expenditures | (47 | ) | (48 | ) | ||||
All-in sustaining costs total | ($55 | ) | ($61 | ) | ||||
Project exploration and evaluation and project costs | (3 | ) | (6 | ) | ||||
Project capital expenditures | (2 | ) | (1 | ) | ||||
All-in costs total | ($5 | ) | ($7 | ) |
9 | Ounces sold - equity basis |
Figures remove the impact of Pierina as the mine is currently going through closure.
10 | Cost of sales per ounce |
Figures remove the cost of sales impact of Pierina of $32 million for the three month periods ended March 31, 2018 (2017: $34 million), as the mine is currently going through closure. Cost of sales per ounce excludesnon-controlling interest related to gold production. Cost of sales applicable to gold per ounce is calculated using cost of sales on an attributable basis (removing thenon-controlling interest of 40% Pueblo Viejo and 36.1% Acacia from cost of sales), divided by attributable gold ounces.
11 | Per ounce figures |
Cost of sales per ounce, cash costs per ounce,all-in sustaining costs per ounce andall-in costs per ounce may not calculate based on amounts presented in this table due to rounding.
12 | Co-product costs per ounce |
Cash costs per ounce,all-in sustaining costs per ounce andall-in costs per ounce presented on aco-product basis removes the impact ofby-product credits of our gold production (net ofnon-controlling interest) calculated as:
($ millions) | For the three months ended March 31 | |||||||
2018 | 2017 | |||||||
By-product credits | $36 | $41 | ||||||
Non-controlling interest | (11 | ) | (8 | ) | ||||
By-product credits (net ofnon-controlling interest) | $25 | $33 |
BARRICK FIRST QUARTER 2018 | 48 | MANAGEMENT’S DISCUSSION AND ANALYSIS |
Reconciliation of Gold Cost of Sales to Cash costs,All-in sustaining costs andAll-in costs, including on a per ounce basis, by operating site
($ millions, except per ounce information in dollars) | For the three months ended March 31, 2018 | |||||||||||||||||||||||||||||||||||||||||
Footnote | Barrick Nevada | Turquoise Ridge | Pueblo Viejo | Veladero | Lagunas Norte | Acacia | Hemlo | Golden Sunlight | Porgera | Kalgoorlie | ||||||||||||||||||||||||||||||||
Cost of sales applicable to gold production | $391 | $45 | $167 | $76 | $38 | $110 | $52 | $13 | $51 | $72 | ||||||||||||||||||||||||||||||||
Depreciation | (148 | ) | (7 | ) | (41 | ) | (31 | ) | (11 | ) | (24 | ) | (4 | ) | — | (8 | ) | (14 | ) | |||||||||||||||||||||||
By-product credits | (1 | ) | — | (25 | ) | (1 | ) | (4 | ) | (1 | ) | — | — | — | — | |||||||||||||||||||||||||||
Non-recurring items | 1 | — | — | — | — | — | — | — | — | (7 | ) | — | ||||||||||||||||||||||||||||||
Other | 2 | — | — | — | — | — | — | — | — | — | ||||||||||||||||||||||||||||||||
Non-controlling interests | — | — | (41 | ) | — | — | (31 | ) | — | — | — | — | ||||||||||||||||||||||||||||||
Cash costs | $242 | $38 | $60 | $44 | $23 | $54 | $48 | $13 | $36 | $58 | ||||||||||||||||||||||||||||||||
General & administrative costs | — | — | — | — | — | — | — | — | — | — | ||||||||||||||||||||||||||||||||
Minesite exploration and evaluation costs | 3 | 1 | — | — | — | 1 | — | — | — | — | 3 | |||||||||||||||||||||||||||||||
Minesite sustaining capital expenditures | 4 | 73 | 6 | 38 | 31 | 2 | 24 | 7 | — | 14 | 8 | |||||||||||||||||||||||||||||||
Rehabilitation - accretion and amortization (operating sites) | 5 | 4 | — | 2 | — | 9 | 1 | 1 | 1 | — | 1 | |||||||||||||||||||||||||||||||
Non-controlling interests | — | — | (16 | ) | — | — | (9 | ) | — | — | — | — | ||||||||||||||||||||||||||||||
All-in sustaining costs | $320 | $44 | $84 | $75 | $35 | $70 | $56 | $14 | $50 | $70 | ||||||||||||||||||||||||||||||||
Project exploration and evaluation and project costs | 3 | — | — | — | — | — | — | — | — | — | — | |||||||||||||||||||||||||||||||
Project capital expenditures | 4 | 73 | 7 | — | — | 1 | 2 | — | — | — | — | |||||||||||||||||||||||||||||||
Non-controlling interests | — | — | — | — | — | (1 | ) | — | — | — | — | |||||||||||||||||||||||||||||||
All-in costs | $393 | $51 | $84 | $75 | $36 | $71 | $56 | $14 | $50 | $70 | ||||||||||||||||||||||||||||||||
Ounces sold - equity basis (000s ounces) | 462 | 63 | 148 | 74 | 69 | 75 | 44 | 8 | 45 | 83 | ||||||||||||||||||||||||||||||||
Cost of sales per ounce | 6,7 | $844 | $720 | $683 | $1,036 | $542 | $941 | $1,189 | $1,484 | $1,138 | $865 | |||||||||||||||||||||||||||||||
Cash costs per ounce | 7 | $523 | $601 | $409 | $576 | $330 | $715 | $1,095 | $1,525 | $801 | $690 | |||||||||||||||||||||||||||||||
Cash costs per ounce (on aco-product basis) | 7,8 | $524 | $601 | $512 | $595 | $389 | $722 | $1,100 | $1,530 | $809 | $693 | |||||||||||||||||||||||||||||||
All-in sustaining costs per ounce | 7 | $690 | $709 | $571 | $1,008 | $496 | $976 | $1,271 | $1,658 | $1,111 | $836 | |||||||||||||||||||||||||||||||
All-in sustaining costs per ounce (on aco-product basis) | 7,8 | $691 | $709 | $674 | $1,027 | $555 | $983 | $1,276 | $1,663 | $1,119 | $839 | |||||||||||||||||||||||||||||||
All-in costs per ounce | 7 | $849 | $821 | $571 | $1,008 | $507 | $991 | $1,277 | $1,658 | $1,111 | $836 | |||||||||||||||||||||||||||||||
All-in costs per ounce (on aco-product basis) | 7,8 | $850 | $821 | $674 | $1,027 | $566 | $998 | $1,282 | $1,663 | $1,119 | $839 |
BARRICK FIRST QUARTER 2018 | 49 | MANAGEMENT’S DISCUSSION AND ANALYSIS |
($ millions, except per ounce information in dollars) | For the three months ended March 31, 2017 | |||||||||||||||||||||||||||||||||||||||||
Footnote | Barrick Nevada | Turquoise Ridge | Pueblo Viejo | Veladero | Lagunas Norte | Acacia | Hemlo | Golden Sunlight | Porgera | Kalgoorlie | ||||||||||||||||||||||||||||||||
Cost of sales applicable to gold production | $487 | $37 | $160 | $140 | $53 | $151 | $46 | $12 | $52 | $66 | ||||||||||||||||||||||||||||||||
Depreciation | (207 | ) | (7 | ) | (40 | ) | (38 | ) | (16 | ) | (35 | ) | (7 | ) | (1 | ) | (9 | ) | (16 | ) | ||||||||||||||||||||||
By-product credits | (1 | ) | — | (16 | ) | (6 | ) | (4 | ) | (8 | ) | — | — | — | — | |||||||||||||||||||||||||||
Non-recurring items | 1 | — | — | — | — | — | — | — | — | — | — | |||||||||||||||||||||||||||||||
Other | 2 | — | — | — | — | — | — | — | — | — | — | |||||||||||||||||||||||||||||||
Non-controlling interests | — | — | (42 | ) | — | — | (39 | ) | — | — | — | — | ||||||||||||||||||||||||||||||
Cash costs | $279 | $30 | $62 | $96 | $33 | $69 | $39 | $11 | $43 | $50 | ||||||||||||||||||||||||||||||||
General & administrative costs | — | — | — | — | — | 17 | — | — | — | — | ||||||||||||||||||||||||||||||||
Minesite exploration and evaluation costs | 3 | 3 | — | — | — | 1 | — | — | — | — | 1 | |||||||||||||||||||||||||||||||
Minesite sustaining capital expenditures | 4 | 81 | 9 | 21 | 50 | 4 | 46 | 9 | — | 11 | 4 | |||||||||||||||||||||||||||||||
Rehabilitation - accretion and amortization (operating sites) | 5 | 6 | — | 4 | 1 | 1 | 2 | 1 | 1 | — | 1 | |||||||||||||||||||||||||||||||
Non-controlling interests | (1 | ) | — | (10 | ) | — | — | (23 | ) | — | — | — | — | |||||||||||||||||||||||||||||
All-in sustaining costs | $368 | $39 | $77 | $147 | $39 | $111 | $49 | $12 | $54 | $56 | ||||||||||||||||||||||||||||||||
Project exploration and evaluation and project costs | 3 | 2 | — | — | — | — | — | — | — | — | — | |||||||||||||||||||||||||||||||
Project capital expenditures | 4 | 49 | — | — | — | 1 | — | 1 | — | — | — | |||||||||||||||||||||||||||||||
Non-controlling interests | — | — | — | — | — | — | — | — | — | — | ||||||||||||||||||||||||||||||||
All-in costs | $419 | $39 | $77 | $147 | $40 | $111 | $50 | $12 | $54 | $56 | ||||||||||||||||||||||||||||||||
Ounces sold - equity basis (000s ounces) | 531 | 54 | 143 | 165 | 91 | 118 | 51 | 9 | 59 | 83 | ||||||||||||||||||||||||||||||||
Cost of sales per ounce | 6,7 | $916 | $680 | $694 | $846 | $573 | $816 | $894 | $1,464 | $881 | $791 | |||||||||||||||||||||||||||||||
Cash costs per ounce | 7 | $525 | $553 | $437 | $580 | $356 | $577 | $753 | $1,360 | $724 | $596 | |||||||||||||||||||||||||||||||
Cash costs per ounce (on a co-product basis) | 7,8 | $527 | $553 | $514 | $618 | $399 | $614 | $759 | $1,363 | $732 | $601 | |||||||||||||||||||||||||||||||
All-in sustaining costs per ounce | 7 | $694 | $714 | $541 | $890 | $428 | $934 | $961 | $1,453 | $910 | $668 | |||||||||||||||||||||||||||||||
All-in sustaining costs per ounce (on aco-product basis) | 7,8 | $696 | $714 | $618 | $928 | $471 | $971 | $967 | $1,456 | $918 | $673 | |||||||||||||||||||||||||||||||
All-in costs per ounce | 7 | $790 | $714 | $541 | $890 | $437 | $937 | $981 | $1,463 | $910 | $668 | |||||||||||||||||||||||||||||||
All-in costs per ounce (on a co-product basis) | 7,8 | $792 | $714 | $618 | $928 | $480 | $974 | $987 | $1,466 | $918 | $673 |
1 | Non-recurring items |
Non-recurring items in 2018 relate to abnormal costs at Porgera as a result of the February 2018 earthquake in Papua New Guinea. These costs are not indicative of our cost of production and have been excluded from the calculation of cash costs.
2 | Other |
Other adjustments for the three months ended March 31, 2018 include adding the cost of treatment and refining charges of $nil (2017: $nil).
3 | Exploration and evaluation costs |
Exploration, evaluation and project expenses are presented as minesite sustaining if it supports current mine operations and project if it relates to future projects. Refer to page 28 of this MD&A.
4 | Capital expenditures |
Capital expenditures are related to our gold sites only and are presented on a 100% accrued basis. They are split between minesite sustaining and project capital expenditures. Project capital expenditures are distinct projects designed to increase the net present value of the mine and are not related to current production. Significant projects in the current year are stripping at Cortez Crossroads, the Range Front declines, the Goldrush exploration declines and construction of the third shaft at Turquoise Ridge). Refer to page 27 of this MD&A.
5 | Rehabilitation - accretion and amortization |
Includes depreciation on the assets related to rehabilitation provisions of our gold operations and accretion on the rehabilitation provision of our gold operations, split between operating andnon-operating sites.
6 | Cost of sales per ounce |
Cost of sales applicable to gold per ounce is calculated using cost of sales on an attributable basis (removing thenon-controlling interest of 40% Pueblo Viejo and 36.1% Acacia from cost of sales), divided by attributable gold ounces.
BARRICK FIRST QUARTER 2018 | 50 | MANAGEMENT’S DISCUSSION AND ANALYSIS |
7 | Per ounce figures |
Cost of sales per ounce, cash costs per ounce,all-in sustaining costs per ounce andall-in costs per ounce may not calculate based on amounts presented in this table due to rounding.
8 | Co-product costs per ounce |
Cash costs per ounce,all-in sustaining costs per ounce andall-in costs per ounce presented on aco-product basis removes the impact ofby-product credits of our gold production (net ofnon-controlling interest) calculated as:
($ millions) | For the three months ended March 31, 2018 | |||||||||||||||||||||||||||||||||||||||
Barrick Nevada | Turquoise Ridge | Pueblo Viejo | Veladero | Lagunas Norte | Acacia | Hemlo | Golden Sunlight | Porgera | Kalgoorlie | |||||||||||||||||||||||||||||||
By-product credits | $1 | $— | $25 | $1 | $4 | $1 | $— | $— | $— | $— | ||||||||||||||||||||||||||||||
Non-controlling interest | — | — | (10 | ) | — | — | — | — | — | — | — | |||||||||||||||||||||||||||||
By-product credits (net ofnon-controlling interest) | $1 | $— | $15 | $1 | $4 | $1 | $— | $— | $— | $— | ||||||||||||||||||||||||||||||
($ millions) | For the three months ended March 31, 2017 | |||||||||||||||||||||||||||||||||||||||
Barrick Nevada | Turquoise Ridge | Pueblo Viejo | Veladero | Lagunas Norte | Acacia | Hemlo | Golden Sunlight | Porgera | Kalgoorlie | |||||||||||||||||||||||||||||||
By-product credits | $1 | $— | $16 | $6 | $4 | $8 | $— | $— | $— | $— | ||||||||||||||||||||||||||||||
Non-controlling interest | — | — | (5 | ) | — | — | (3 | ) | — | — | — | — | ||||||||||||||||||||||||||||
By-product credits (net ofnon-controlling interest) | $1 | $— | $11 | $6 | $4 | $5 | $— | $— | $— | $— |
BARRICK FIRST QUARTER 2018 | 51 | MANAGEMENT’S DISCUSSION AND ANALYSIS |
Reconciliation of Copper Cost of Sales to C1 cash costs andAll-in sustaining costs, including on a per pound basis
($ millions, except per pound information in dollars) | For the three months ended March 31 | |||||||
2018 | 2017 | |||||||
Cost of sales | $96 | $82 | ||||||
Depreciation/amortization | (19 | ) | (14 | ) | ||||
Treatment and refinement charges | 31 | 32 | ||||||
Cash cost of sales applicable to equity method investments | 63 | 61 | ||||||
Less: royalties and production taxes1 | (10 | ) | (7 | ) | ||||
By-product credits | (2 | ) | — | |||||
C1 cash cost of sales | $159 | $154 | ||||||
General & administrative costs | 5 | 3 | ||||||
Rehabilitation - accretion and amortization | 5 | 2 | ||||||
Royalties and production taxes1 | 10 | 7 | ||||||
Minesite exploration and evaluation costs | — | — | ||||||
Minesite sustaining capital expenditures | 42 | 37 | ||||||
All-in sustaining costs | $221 | $203 | ||||||
Pounds sold - consolidated basis (millions pounds) | 85 | 93 | ||||||
Cost of sales per pound2,3 | $2.07 | $1.73 | ||||||
C1 cash cost per pound2 | $1.88 | $1.65 | ||||||
All-in sustaining costs per pound2 | $2.61 | $2.19 |
1 | Royalties and production taxes include royalties of $9 million (2017: $7 million). |
2 | Cost of sales per pound, C1 cash costs per pound andall-in sustaining costs per pound may not calculate based on amounts presented in this table due to rounding. |
3 | Cost of sales applicable to copper per pound is calculated using cost of sales including our proportionate share of cost of sales attributable to equity method investments (Zaldívar and Jabal Sayid), divided by consolidated copper pounds (including our proportionate share of copper pounds from our equity method investments). |
Reconciliation of Copper Cost of Sales to C1 cash costs andAll-in sustaining costs, including on a per pound basis, by operating site
($ millions, except per pound information in dollars) | For the three months ended March 31 | |||||||||||||||||||||||
2018 | 2017 | |||||||||||||||||||||||
Zaldívar | Lumwana | Jabal Sayid | Zaldívar | Lumwana | Jabal Sayid | |||||||||||||||||||
Cost of sales | $56 | $96 | $25 | $59 | $82 | $16 | ||||||||||||||||||
Depreciation/amortization | (13 | ) | (19 | ) | (5 | ) | (13 | ) | (14 | ) | (4 | ) | ||||||||||||
Treatment and refinement charges | — | 27 | 4 | — | 32 | 3 | ||||||||||||||||||
Less: royalties and production taxes1 | — | (9 | ) | (1 | ) | — | (7 | ) | — | |||||||||||||||
By-product credits | — | — | (2 | ) | — | — | — | |||||||||||||||||
C1 cash cost of sales | $43 | $95 | $21 | $46 | $93 | $15 | ||||||||||||||||||
Rehabilitation - accretion and amortization | — | 5 | — | — | 2 | — | ||||||||||||||||||
Royalties and production taxes1 | — | 9 | 1 | — | 7 | — | ||||||||||||||||||
Minesite exploration and evaluation costs | — | — | — | — | — | — | ||||||||||||||||||
Minesite sustaining capital expenditures | 16 | 21 | 5 | 8 | 20 | 9 | ||||||||||||||||||
All-in sustaining costs | $59 | $130 | $27 | $54 | $122 | $24 | ||||||||||||||||||
Pounds sold - consolidated basis (millions pounds) | 24 | 47 | 14 | 29 | 56 | 8 | ||||||||||||||||||
Cost of sales per pound2,3 | $2.37 | $2.02 | $1.79 | $2.08 | $1.45 | $2.02 | ||||||||||||||||||
C1 cash cost per pound2 | $1.84 | $2.00 | $1.55 | $1.60 | $1.64 | $1.85 | ||||||||||||||||||
All-in sustaining costs per pound2 | $2.50 | $2.73 | $1.97 | $1.88 | $2.18 | $2.99 |
1 | Royalties and production taxes include royalties of $9 million (2017: $7 million). |
2 | Cost of sales per pound, C1 cash costs per pound andall-in sustaining costs per pound may not calculate based on amounts presented in this table due to rounding. |
3 | Cost of sales applicable to copper per pound is calculated using cost of sales including our proportionate share of cost of sales attributable to equity method investments (Zaldívar and Jabal Sayid), divided by consolidated copper pounds (including our proportionate share of copper pounds from our equity method investments). |
BARRICK FIRST QUARTER 2018 | 52 | MANAGEMENT’S DISCUSSION AND ANALYSIS |
EBITDA and Adjusted EBITDA
EBITDA is anon-GAAP financial measure, which excludes the following from net earnings:
• | Income tax expense; |
• | Finance costs; |
• | Finance income; and |
• | Depreciation. |
Management believes that EBITDA is a valuable indicator of our ability to generate liquidity by producing operating cash flow to fund working capital needs, service debt obligations, and fund capital expenditures. Management uses EBITDA for this purpose. EBITDA is also frequently used by investors and analysts for valuation purposes whereby EBITDA is multiplied by a factor or “EBITDA multiple” that is based on an observed or inferred relationship between EBITDA and market values to determine the approximate total enterprise value of a company.
Adjusted EBITDA removes the effect of impairment charges; acquisition/disposition gains/losses; foreign currency translation gains/losses; other expense adjustments; and unrealized gains onnon-hedge derivative instruments. We believe these items provide a greater level of consistency with the adjusting items included in our Adjusted Net Earnings reconciliation, with
the exception that these amounts are adjusted to remove any impact on finance costs/income, income tax expense and/or depreciation as they do not affect EBITDA. We believe this additional information will assist analysts, investors and other stakeholders of Barrick in better understanding our ability to generate liquidity from operating cash flow, by excluding these amounts from the calculation as they are not indicative of the performance of our core mining business and not necessarily reflective of the underlying operating results for the periods presented.
EBITDA and adjusted EBITDA are intended to provide additional information to investors and analysts and do not have any standardized definition under IFRS, and should not be considered in isolation or as a substitute for measures of performance prepared in accordance with IFRS. EBITDA and adjusted EBITDA exclude the impact of cash costs of financing activities and taxes, and the effects of changes in operating working capital balances, and therefore are not necessarily indicative of operating profit or cash flow from operations as determined under IFRS. Other companies may calculate EBITDA and adjusted EBITDA differently.
Reconciliation of Net Earnings to EBITDA and Adjusted EBITDA
($ millions) | For the three months ended March 31 | |||||||
2018 | 2017 | |||||||
Net earnings | $192 | $889 | ||||||
Income tax expense | 201 | 592 | ||||||
Finance costs, net1 | 113 | 134 | ||||||
Depreciation | 325 | 414 | ||||||
EBITDA | $831 | $2,029 | ||||||
Impairment charges related to intangibles, goodwill, property, plant and equipment, and investments2 | 2 | (1,125 | ) | |||||
Acquisition/disposition (gains)/losses3 | (46 | ) | 3 | |||||
Foreign currency translation losses | 15 | 3 | ||||||
Other expense adjustments | (6 | ) | 6 | |||||
Unrealized gains onnon-hedge derivative instruments | — | 3 | ||||||
Adjusted EBITDA | $796 | $919 |
1 | Finance costs exclude accretion. |
2 | Net impairment reversals for the three months ended March 31, 2017 primarily relate to impairment reversals at the Cerro Casale project upon reclassification of the project’s net assets asheld-for-sale as at March 31, 2017. |
3 | Disposition gains for the three months ended March 31, 2018 primarily relates to the gain related to the sale of anon-core royalty asset at Acacia. |
BARRICK FIRST QUARTER 2018 | 53 | MANAGEMENT’S DISCUSSION AND ANALYSIS |
Reconciliation of Segment Income to Segment EBITDA
($ millions) | For the three months ended March 31, 2018 | |||||||||||||||||||||||
| Barrick Nevada |
| | Turquoise Ridge |
| | Pueblo Viejo (60%) |
| Veladero | Lagunas Norte | Acacia | |||||||||||||
Segment Income | $220 | $39 | $115 | $25 | $56 | $71 | ||||||||||||||||||
Depreciation | 148 | 7 | 25 | 31 | 11 | 24 | ||||||||||||||||||
Segment EBITDA | $368 | $46 | $140 | $56 | $67 | $95 | ||||||||||||||||||
($ millions) | For the three months ended March 31, 2017 | |||||||||||||||||||||||
Barrick Nevada | Turquoise Ridge | | Pueblo Viejo (60%) | | Veladero | Lagunas Norte | Acacia | |||||||||||||||||
Segment Income | $148 | $30 | $87 | $70 | $59 | $75 | ||||||||||||||||||
Depreciation | 207 | 7 | 26 | 38 | 16 | 35 | ||||||||||||||||||
Segment EBITDA | $355 | $37 | $113 | $108 | $75 | $110 |
Realized Price
Realized price is anon-GAAP financial measure which excludes from sales:
• | Unrealized gains and losses onnon-hedge derivative contracts; |
• | Unrealizedmark-to-market gains and losses on provisional pricing from copper and gold sales contracts; |
• | Sales attributable to ore purchase arrangements; |
• | Treatment and refining charges; and |
• | Export duties. |
This measure is intended to enable Management to better understand the price realized in each reporting period for gold and copper sales because unrealizedmark-to-market values ofnon-hedge gold and copper derivatives are subject to change each period due to changes in market factors such as market and forward gold and copper prices, so that prices ultimately realized may differ from those recorded. The exclusion of such unrealizedmark-to-market gains and losses from the presentation of this performance measure enables investors to understand performance based on the realized proceeds of selling gold and copper production.
The gains and losses onnon-hedge derivatives and receivable balances relate to instruments/balances that mature in future periods, at which time the gains and losses will become realized. The amounts of these gains and losses reflect fair values based on market valuation assumptions at the end of each period and do not necessarily represent the amounts that will become realized on maturity. We also exclude export duties that are paid upon sale and netted against revenues as well as treatment and refining charges that are paid to the refiner on gold and copper concentrate sales that are netted against revenues. We believe this provides investors and analysts with a more accurate measure with which to compare to market gold prices and to assess our gold sales performance. For those reasons, management
believes that this measure provides a more accurate reflection of our Company’s past performance and is a better indicator of its expected performance in future periods.
The realized price measure is intended to provide additional information, and does not have any standardized definition under IFRS and should not be considered in isolation or as a substitute for measures of performance prepared in accordance with IFRS. The measure is not necessarily indicative of sales as determined under IFRS. Other companies may calculate this measure differently. The following table reconciles realized prices to the most directly comparable IFRS measure.
BARRICK FIRST QUARTER 2018 | 54 | MANAGEMENT’S DISCUSSION AND ANALYSIS |
Reconciliation of Sales to Realized Price per ounce/pound
For the three months ended March 31 | ||||||||||||||||
($ millions, except per ounce/pound information in dollars) | Gold | Copper | ||||||||||||||
2018 | 2017 | 2018 | 2017 | |||||||||||||
Sales | $1,643 | $1,827 | $111 | $125 | ||||||||||||
Sales applicable tonon-controlling interests | (187 | ) | (198 | ) | — | — | ||||||||||
Sales applicable to equity method investments1,2 | — | — | 113 | 99 | ||||||||||||
Realizednon-hedge gold/copper derivative (losses) gains | — | — | — | — | ||||||||||||
Sales applicable to Pierina3 | (29 | ) | (38 | ) | — | — | ||||||||||
Treatment and refinement charges | — | 1 | 31 | 32 | ||||||||||||
Export duties | — | — | — | — | ||||||||||||
Revenues – as adjusted | $1,427 | $1,592 | $255 | $256 | ||||||||||||
Ounces/pounds sold (000s ounces/millions pounds)3 | 1,071 | 1,305 | 85 | 93 | ||||||||||||
Realized gold/copper price per ounce/pound4 | $1,332 | $1,220 | $2.98 | $2.76 |
1 | Represents sales of $72 million for the three months ended March 31, 2018 (2017: $77 million) applicable to our 50% equity method investment in Zaldívar and $41 million (2017: $22 million) applicable to our 50% equity method investment in Jabal Sayid. |
2 | Sales applicable to equity method investments are net of treatment and refinement charges. |
3 | Figures exclude Pierina from the calculation of realized price per ounce as the mine is currently going through closure. |
4 | Realized price per ounce/pound may not calculate based on amounts presented in this table due to rounding. |
TECHNICAL INFORMATION
The scientific and technical information contained in this MD&A has been reviewed and approved by Steven Haggarty, P. Eng., Senior Director, Metallurgy of Barrick who is a “Qualified Person” as defined in National Instrument43-101 –Standards of Disclosure for Mineral Projects.
ENDNOTES
1 | These arenon-GAAP financial performance measures with no standardized meaning under IFRS and therefore may not be comparable to similar measures presented by other issuers. For further information and a detailed reconciliation of eachnon-GAAP measure to the most directly comparable IFRS measure, please see pages 44 to 55 of this MD&A. |
2 | Amount excludes capital leases and includes Acacia (100% basis). |
3 | Includes $112 million of cash, primarily held at Acacia, which may not be readily deployed. |
4 | Cost of sales applicable to gold per ounce is calculated using cost of sales applicable to gold on an attributable basis (removing thenon-controlling interest of 40% Pueblo Viejo and 36.1% Acacia from cost of sales), divided by attributable gold ounces. Cost of sales applicable to copper per pound is calculated using cost of sales applicable to copper including our proportionate share of cost of sales attributable to equity method investments (Zaldívar and Jabal Sayid), divided by consolidated copper pounds (including our proportionate share of copper pounds from our equity method investments). |
BARRICK FIRST QUARTER 2018 | 55 | MANAGEMENT’S DISCUSSION AND ANALYSIS |
Consolidated Statements of Income
Barrick Gold Corporation (in millions of United States dollars, except per share data) (Unaudited) | Three months ended March 31, | |||||||
2018 | 2017 | |||||||
Revenue (notes 5 and 6) | $1,790 | $1,993 | ||||||
Costs and expenses (income) | ||||||||
Cost of sales (notes 5 and 7) | 1,152 | 1,342 | ||||||
General and administrative expenses | 48 | 72 | ||||||
Exploration, evaluation and project expenses | 73 | 75 | ||||||
Impairment (reversals) charges (notes 9B and 13) | 2 | (1,125 | ) | |||||
Loss on currency translation (note 9C) | 15 | 3 | ||||||
Closed mine rehabilitation | (9 | ) | 8 | |||||
Income from equity investees (note 12) | (16 | ) | (11 | ) | ||||
Gain onnon-hedge derivatives | (2 | ) | (4 | ) | ||||
Other expense (note 9A) | 1 | 2 | ||||||
Income before finance costs and income taxes | $526 | $1,631 | ||||||
Finance costs, net | (133 | ) | (150 | ) | ||||
Income before income taxes | $393 | $1,481 | ||||||
Income tax expense (note 10) | (201 | ) | (592 | ) | ||||
Net income | $192 | $889 | ||||||
Attributable to: | ||||||||
Equity holders of Barrick Gold Corporation | $158 | $679 | ||||||
Non-controlling interests | $34 | $210 | ||||||
Earnings per share data attributable to the equity holders of Barrick Gold Corporation (note 8) | ||||||||
Net income | ||||||||
Basic | $0.14 | $0.58 | ||||||
Diluted | $0.14 | $0.58 |
The accompanying notes are an integral part of these condensed interim consolidated financial statements.
BARRICK FIRST QUARTER 2018 | 56 | FINANCIAL STATEMENTS (UNAUDITED) |
Consolidated Statements of Comprehensive Income
Barrick Gold Corporation (in millions of United States dollars) (Unaudited) | Three months ended March 31, | |||||||
2018 | 2017 | |||||||
Net income | $192 | $889 | ||||||
Other comprehensive income (loss), net of taxes | ||||||||
Movement in equity investments fair value reserve: | ||||||||
Net unrealized change on equity investments, net of tax $nil and $nil | (4 | ) | 1 | |||||
Items that may be reclassified subsequently to profit or loss: | ||||||||
Unrealized gains (losses) on derivatives designated as cash flow hedges, net of tax ($3) and $nil | 6 | (12 | ) | |||||
Realized losses on derivatives designated as cash flow hedges, net of tax $nil and $nil | — | 1 | ||||||
Currency translation adjustments, net of tax $nil and $nil | — | 11 | ||||||
Total other comprehensive income | 2 | 1 | ||||||
Total comprehensive income | $194 | $890 | ||||||
Attributable to: | ||||||||
Equity holders of Barrick Gold Corporation | $160 | $680 | ||||||
Non-controlling interests | $34 | $210 |
The accompanying notes are an integral part of these condensed interim consolidated financial statements.
BARRICK FIRST QUARTER 2018 | 57 | FINANCIAL STATEMENTS (UNAUDITED) |
Consolidated Statements of Cash Flow
Barrick Gold Corporation (in millions of United States dollars) (Unaudited) | Three months ended March 31, | |||||||
2018 | 2017 | |||||||
OPERATING ACTIVITIES | ||||||||
Net income | $192 | $889 | ||||||
Adjustments for the following items: | ||||||||
Depreciation | 325 | 414 | ||||||
Finance costs | 138 | 153 | ||||||
Impairment (reversals) charges (note 13) | 2 | (1,125 | ) | |||||
Income tax expense (note 10) | 201 | 592 | ||||||
(Gain) loss on sale ofnon-current assets/investments | (46 | ) | 3 | |||||
Currency translation losses | 15 | 3 | ||||||
Change in working capital (note 11) | (176 | ) | (196 | ) | ||||
Other operating activities (note 11) | (64 | ) | (84 | ) | ||||
Operating cash flows before interest and income taxes | 587 | 649 | ||||||
Interest paid | (28 | ) | (35 | ) | ||||
Income taxes paid | (52 | ) | (119 | ) | ||||
Net cash provided by operating activities | 507 | 495 | ||||||
INVESTING ACTIVITIES | ||||||||
Property, plant and equipment | ||||||||
Capital expenditures (note 5) | (326 | ) | (334 | ) | ||||
Sales proceeds | 2 | 7 | ||||||
Investment purchases | (1 | ) | — | |||||
Sale of mineral royalty | 45 | — | ||||||
Funding of equity method investments | (4 | ) | (4 | ) | ||||
Net cash used in investing activities | (284 | ) | (331 | ) | ||||
FINANCING ACTIVITIES | ||||||||
Debt | ||||||||
Repayments | (23 | ) | (180 | ) | ||||
Dividends | (31 | ) | (31 | ) | ||||
Funding fromnon-controlling interests | 8 | — | ||||||
Disbursements tonon-controlling interests | (26 | ) | (67 | ) | ||||
Net cash used in financing activities | (72 | ) | (278 | ) | ||||
Effect of exchange rate changes on cash and equivalents | (1 | ) | 2 | |||||
Net increase (decrease) in cash and equivalents | 150 | (112 | ) | |||||
Cash and equivalents at the beginning of period | 2,234 | 2,389 | ||||||
Cash and equivalents at the end of period | $2,384 | $2,277 |
The accompanying notes are an integral part of these condensed interim consolidated financial statements.
BARRICK FIRST QUARTER 2018 | 58 | FINANCIAL STATEMENTS (UNAUDITED) |
Consolidated Balance Sheets
Barrick Gold Corporation (in millions of United States dollars) (Unaudited) | As at March 31, | As at December 31, | ||||||
2018 | 2017 | |||||||
ASSETS | ||||||||
Current assets | ||||||||
Cash and equivalents (note 14A) | $2,384 | $2,234 | ||||||
Accounts receivable | 173 | 239 | ||||||
Inventories | 1,887 | 1,890 | ||||||
Other current assets | 352 | 321 | ||||||
Total current assets | $4,796 | $4,684 | ||||||
Non-current assets | ||||||||
Equity in investees (note 12) | 1,233 | 1,213 | ||||||
Property, plant and equipment | 13,755 | 13,806 | ||||||
Goodwill | 1,330 | 1,330 | ||||||
Intangible assets | 255 | 255 | ||||||
Deferred income tax assets | 1,071 | 1,069 | ||||||
Non-current portion of inventory | 1,711 | 1,681 | ||||||
Other assets | 1,245 | 1,270 | ||||||
Total assets | $25,396 | $25,308 | ||||||
LIABILITIES AND EQUITY | ||||||||
Current liabilities | ||||||||
Accounts payable | $1,046 | $1,059 | ||||||
Debt (note 14B) | 57 | 59 | ||||||
Current income tax liabilities | 340 | 298 | ||||||
Other current liabilities | 255 | 331 | ||||||
Total current liabilities | $1,698 | $1,747 | ||||||
Non-current liabilities | ||||||||
Debt (note 14B) | 6,344 | 6,364 | ||||||
Provisions | 3,078 | 3,141 | ||||||
Deferred income tax liabilities | 1,319 | 1,245 | ||||||
Other liabilities | 1,691 | 1,744 | ||||||
Total liabilities | $14,130 | $14,241 | ||||||
Equity | ||||||||
Capital stock (note 16) | $20,897 | $20,893 | ||||||
Deficit | (11,572 | ) | (11,759 | ) | ||||
Accumulated other comprehensive loss | (167 | ) | (169 | ) | ||||
Other | 321 | 321 | ||||||
Total equity attributable to Barrick Gold Corporation shareholders | $9,479 | $9,286 | ||||||
Non-controlling interests | 1,787 | 1,781 | ||||||
Total equity | $11,266 | $11,067 | ||||||
Contingencies and commitments (notes 5 and 17) | ||||||||
Total liabilities and equity | $25,396 | $25,308 |
The accompanying notes are an integral part of these condensed interim consolidated financial statements.
BARRICK FIRST QUARTER 2018 | 59 | FINANCIAL STATEMENTS (UNAUDITED) |
Consolidated Statements of Changes in Equity
Barrick Gold Corporation | Attributable to equity holders of the company | |||||||||||||||||||||||||||||||
(in millions of United States dollars) (Unaudited) | | Common Shares (in thousands) | | | Capital stock | | | Retained deficit | | | Accumulated other comprehensive income (loss)1 | | Other2 | | Total equity attributable to shareholders | | | Non- controlling interests | | Total equity | | |||||||||||
At December 31, 2017 | 1,166,577 | $20,893 | ($11,759 | ) | ($169 | ) | $321 | $9,286 | $1,781 | $11,067 | ||||||||||||||||||||||
Impact of adopting IFRS 15 on January 1, 2018 (note 2B) | — | — | 64 | — | — | 64 | — | 64 | ||||||||||||||||||||||||
At January 1, 2018 (restated) | 1,166,577 | $20,893 | ($11,695 | ) | ($169 | ) | $321 | $9,350 | $1,781 | $11,131 | ||||||||||||||||||||||
Net income | — | — | 158 | — | — | 158 | 34 | 192 | ||||||||||||||||||||||||
Total other comprehensive income | — | — | — | 2 | — | 2 | — | 2 | ||||||||||||||||||||||||
Total comprehensive income | — | — | 158 | 2 | — | 160 | 34 | 194 | ||||||||||||||||||||||||
Transactions with owners | ||||||||||||||||||||||||||||||||
Dividends | — | — | (31 | ) | — | — | (31 | ) | — | (31 | ) | |||||||||||||||||||||
Funding fromnon-controlling interests | — | — | — | — | — | — | 8 | 8 | ||||||||||||||||||||||||
Other decrease in non-controlling interest | — | — | — | — | — | — | (36 | ) | (36 | ) | ||||||||||||||||||||||
Dividend reinvestment plan (note 16) | 316 | 4 | (4 | ) | — | — | — | — | — | |||||||||||||||||||||||
Total transactions with owners | 316 | 4 | (35 | ) | — | — | (31 | ) | (28 | ) | (59 | ) | ||||||||||||||||||||
At March 31, 2018 | 1,166,893 | $20,897 | ($11,572 | ) | ($167 | ) | $321 | $9,479 | $1,787 | $11,266 | ||||||||||||||||||||||
At January 1, 2017 | 1,165,574 | $20,877 | ($13,074 | ) | ($189 | ) | $321 | $7,935 | $2,378 | $10,313 | ||||||||||||||||||||||
Net income | — | — | 679 | — | — | 679 | 210 | 889 | ||||||||||||||||||||||||
Total other comprehensive income | — | — | — | 1 | — | 1 | — | 1 | ||||||||||||||||||||||||
Total comprehensive income | — | — | 679 | 1 | — | 680 | 210 | 890 | ||||||||||||||||||||||||
Transactions with owners | ||||||||||||||||||||||||||||||||
Dividends | — | — | (31 | ) | — | — | (31 | ) | — | (31 | ) | |||||||||||||||||||||
Funding fromnon-controlling interests | — | — | — | — | — | — | — | — | ||||||||||||||||||||||||
Other decrease in non-controlling interests | — | — | — | — | — | — | (90 | ) | (90 | ) | ||||||||||||||||||||||
Dividend reinvestment plan | 201 | 4 | (4 | ) | — | — | — | — | — | |||||||||||||||||||||||
Total transactions with owners | 201 | 4 | (35 | ) | — | — | (31 | ) | (90 | ) | (121 | ) | ||||||||||||||||||||
At March 31, 2017 | 1,165,775 | $20,881 | ($12,430 | ) | ($188 | ) | $321 | $8,584 | $2,498 | $11,082 |
1 | Includes cumulative translation losses at March 31, 2018: $73 million (March 31, 2017: $71 million). |
2 | Includes additionalpaid-in capital as at March 31, 2018: $283 million (December 31, 2017: $283 million; March 31, 2017: $283 million) and convertible borrowings - equity component as at March 31, 2018: $38 million (December 31, 2017: $38 million; March 31, 2017: $38 million). |
The accompanying notes are an integral part of these condensed interim consolidated financial statements.
BARRICK FIRST QUARTER 2018 | 60 | FINANCIAL STATEMENTS (UNAUDITED) |
NOTES TO CONSOLIDATED FINANCIAL STATEMENTS
Barrick Gold Corporation. Tabular dollar amounts in millions of United States dollars, unless otherwise shown.
1 > CORPORATE INFORMATION
Barrick Gold Corporation (“Barrick”, “we” or the “Company”) is a corporation governed by the Business Corporations Act (Ontario). The Company’s head and registered office is located at Brookfield Place, TD Canada Trust Tower, 161 Bay Street, Suite 3700, Toronto, Ontario, M5J 2S1. We are principally engaged in the production and sale of gold and copper, as well as related activities such as exploration and mine development. Our producing gold mines are located in Canada, the United States, Peru and the Dominican Republic and our producing copper mine is in Zambia. We hold a 50% interest in Veladero, a gold mine located in Argentina, a 50% interest in KCGM, a gold mine located in Australia and hold a 50% equity interest in Barrick Niugini Limited (“BNL”), which owns a 95% interest in Porgera, a gold mine located in Papua New Guinea. We also hold a 63.9% equity interest in Acacia Mining plc (“Acacia”), a company listed on the London Stock Exchange that owns gold mines and exploration properties in Africa. We have a 50% interest in Zaldívar, a copper mine located in Chile and a 50% interest in Jabal Sayid, a copper mine located in Saudi Arabia. We also have various gold projects located in South America and North America. We sell our gold and copper production into the world market.
2 > SIGNIFICANT ACCOUNTING POLICIES
A) | Statement of Compliance |
These condensed interim consolidated financial statements have been prepared in accordance with International Accounting Standard 34 Interim Financial Reporting (“IAS 34”) as issued by the International Accounting Standards Board (“IASB”). These interim financial statements should be read in conjunction with Barrick’s most recently issued Annual Report which includes information necessary or useful to understanding the Company’s business and financial statement presentation. In particular, the Company’s significant accounting policies were presented in Note 2 of the Annual Consolidated Financial Statements for the year ended December 31, 2017 (“2017 Annual Financial Statements”), and have been consistently applied in the preparation of these interim financial statements, except as otherwise noted in Note 2(b). These condensed interim consolidated financial statements were authorized for issuance by the Board of Directors on April 23, 2018.
B) | New Accounting Standards Effective in 2018 |
Impact of Adoption of IFRS 15 Revenue from Contracts with Customers
We have adopted the requirements of IFRS 15 Revenue from Contracts with Customers (“IFRS 15”) as of January 1, 2018. IFRS 15 covers principles that an entity shall apply to report useful information to users of financial statements about the nature, amount, timing, and uncertainty of revenue and cash flows arising from a contract with a customer. We elected to apply IFRS 15 using a modified retroactive approach by recognizing the cumulative effect of initially adopting IFRS 15 as an adjustment to the opening balance sheet through equity at January 1, 2018. Therefore, the comparative information has not been restated and continues to be reported under IAS 18 Revenue (“IAS 18”). The details of accounting policy changes and the quantitative impact of these changes are described below.
Gold Bullion Sales
IFRS 15 requires that revenue from contracts with customers be recognized upon the transfer of control over goods or services to the customer. The recognition of revenue upon transfer of control to the customer is consistent with our revenue recognition policy as set out in Note 2(f) of the 2017 Annual Financial Statements, as the condition is generally satisfied when title transfers to the customer. As such, upon adoption, this requirement under IFRS 15 resulted in no impact to our financial statements as the timing of revenue recognition on our gold bullion sales is unchanged.
Concentrate Sales
We assessed all of our existing concentrate sales agreements and determined that there is no change in the timing of revenue recognition, as control transfers to the smelting companies at the time of shipment, consistent with our current accounting policy as set out in Note 2(f) of the 2017 Annual Financial Statements. Although IFRS 15 identifies the shipping component associated with concentrate sales as a separate performance obligation, requiring a portion of the revenue to be deferred and only recognized once the shipment has reached the destination port, we have determined that the deferred revenue would be insignificant and thus, have not accounted for the shipping component as a separate performance obligation. IFRS 15 does not consider provisional price adjustments associated with concentrate sales to be revenue from contracts with customers as they arise from changes in market gold and copper prices between the shipment date and settlement date. As such, we have separately presented provisional price adjustments in Note 6 of these condensed interim consolidated financial statements in line with the requirements of IFRS 15.
BARRICK FIRST QUARTER 2018 | 61 | NOTES TO FINANCIAL STATEMENTS (UNAUDITED) |
Streaming Agreements
IFRS 15 requires that for contracts containing variable consideration, the transaction price be continually updated andre-allocated to the transferred goods and services. As a result, we have updated our accounting policy for revenue earned on streaming agreements such that we will treat the deferred revenue component as variable, requiring an adjustment to the transaction price per unit each time there is a change in the underlying production profile of a mine (typically in the fourth quarter of each year). The change in the transaction price per unit results in a retroactive adjustment to revenue in the period in which the change is made, reflecting the new production profile expected to be delivered under the streaming agreement. A corresponding retroactive adjustment is made to accretion expense, reflecting the impact of the change in the deferred revenue balance. The impact of the initial adoption of this change in accounting policy was an adjustment to reduce the opening deficit on January 1, 2018 of $64 million with a corresponding adjustment to reduce the deferred revenue balance. There was no impact to net income for the period.
If in the first quarter of 2018 we had continued to recognize revenue on streaming agreements in accordance with IAS 18, the amounts recognized for revenue, deferred revenue and interest expense would have been insignificantly different from those recognized in accordance with IFRS 15.
C) New Accounting Standards Issued But Not Yet Effective
IFRS 16 Leases
In January 2016, the IASB issued IFRS 16 Leases, which requires lessees to recognize assets and liabilities for most leases. Application of the standard is mandatory for annual reporting periods beginning on or after January 1, 2019, with earlier application permitted, provided the new revenue standard, IFRS 15 Revenue from Contracts with Customers, has been applied or is applied at the same date as IFRS 16. We are not early adopting IFRS 16. We expect that IFRS 16 will result in an increase in assets and liabilities as fewer leases will be expensed as payments are made. We expect an increase in depreciation and accretion expenses and also an increase in cash flow from operating activities as these lease payments will be recorded as financing outflows in our cash flow statement. We have developed a full implementation plan to determine the impact on our financial statements and internal controls. In the fourth quarter of 2017, we formed an IFRS 16 working group and began the process of compiling all of our existing operating leases and service contracts. In the first quarter of 2018, we began reviewing the relevant agreements to identify which of the operating leases and service contracts are in scope for IFRS 16. We will provide further updates in our subsequent interim financial statements.
3 > SIGNIFICANT JUDGMENTS, ESTIMATES, ASSUMPTIONS AND RISKS
The judgments, estimates, assumptions and risks discussed here reflect updates from the 2017 Annual Financial Statements. For judgments, estimates, assumptions and risks related to other areas not discussed in these interim consolidated financial statements, please refer to Notes 3 and 28 of the 2017 Annual Financial Statements.
A) Provision for Environmental Rehabilitation (“PER”)
Provisions are updated each reporting period for changes to expected cash flows and for the effect of changes in the discount rate and foreign exchange rate, and the change in estimate is added or deducted from the related asset and depreciated over the expected economic life of the operation to which it relates. We recorded a decrease of $106 million (2017: $55 million increase) to the PER at our minesites for the three months ended March 31, 2018, primarily due to an increase in the discount rate.
Adjustments to the estimated amount and timing of future closure and rehabilitation cash flows are a normal occurrence in light of the significant judgments and estimates involved. Rehabilitation provisions are adjusted as a result of changes in estimates and assumptions and are accounted for prospectively. In the fourth quarter of each year, our life of mine plans are updated and that typically results in an update to the rehabilitation provision.
Under the Comprehensive Environmental Response, Compensation, and Liability Act of 1980 (“CERCLA”) and its state law equivalents, present or past owners of a property may be held jointly and severally liable for cleanup costs or forced to undertake remedial actions in response to unpermitted releases of hazardous substances at such property, in addition to, among other potential consequences, potential liability to governmental entities for the cost of damages to natural resources, which may be substantial. These subject properties are referred to as “superfund” sites. There is a chance that our current or legacy operations in the U.S. could be designated as a superfund site in the future, exposing Barrick to potential liability under CERCLA. The U.S. Environmental Protection Agency recently announced it is considering listing on the CERCLA National Priorities List a 322 square mile site in the San Mateo basin in New Mexico (“San Mateo Site”) due to alleged surface and ground water contamination from past uranium mining. The San Mateo Site includes legacy operations of Homestake Mining Company of California.
B) | Pascua-Lama |
The Pascua-Lama project received $499 million as at March 31, 2018 (December 31, 2017: $484 million) in value added tax (“VAT”) refunds in Chile relating to the
BARRICK FIRST QUARTER 2018 | 62 | NOTES TO FINANCIAL STATEMENTS (UNAUDITED) |
development of the Chilean side of the project. Under the current arrangement this amount plus interest of $333 million (December 31, 2017: $313 million) must be repaid if the project does not evidence exports for an amount of $3,538 million within a term that expires on December 31, 2026. The terms of the current VAT arrangement in Chile are applicable to either an open pit or an underground mine design. We have recorded $206 million in VAT recoverable in Argentina as at March 31, 2018 (December 31, 2017: $221 million) relating to the development of the Argentine side of the project. These amounts may not be recoverable if the project does not enter into production and are subject to devaluation risk as the amounts are recoverable in Argentinean pesos.
C) Contingencies
Contingencies can be either possible assets or possible liabilities arising from past events which, by their nature, will be resolved only when one or more future events, not wholly within our control, occur or fail to occur. The assessment of such contingencies inherently involves the exercise of significant judgment and estimates of the
4 > DIVESTITURES
A) Sale of 25% of Cerro Casale
On March 28, 2017, we announced an agreement with Goldcorp Inc. (“Goldcorp”) to form a new partnership at the Cerro Casale Project in Chile. The transaction closed on June 9, 2017. Under the terms of the agreement, Goldcorp agreed to purchase a 25 percent interest in Cerro Casale from Barrick. This transaction, coupled with the concurrent purchase by Goldcorp of Kinross Gold Corporation’s (“Kinross”) 25 percent interest in Cerro Casale, resulted in Barrick and Goldcorp each holding a 50 percent interest in the joint operation.
outcome of future events. Refer to note 17 for further details on contingencies.
D) Streaming Transactions
As discussed in Note 2(b) of these condensed interim consolidated financial statements, the deferred revenue component of our streaming agreements is considered variable and is subject to retroactive adjustment when there is a change in the timing of the delivery of ounces or in the underlying production profile of the relevant mine. The impact of such a change in the timing or quantity of ounces to be delivered under a streaming agreement will result in retroactive adjustments to both the deferred revenue recognized as at and the accretion recorded prior to the date of the change. The adjustments will be calculated based upon the revised production profile. There were no retroactive adjustments recorded in the first quarter of 2018, with the exception of the adjustment recorded to reflect the initial adoption of IFRS 15 as outlined in Note 2(b).
The total consideration received by Barrick and Kinross implies a fair value of $1.2 billion for 100 percent of Cerro Casale, which resulted in a reversal of impairment of $1.12 billion in the first quarter of 2017.
This joint venture is now referred to as Norte Abierto and includes the Cerro Casale, Caspiche and Luciano deposits.
5 > SEGMENT INFORMATION
Barrick’s business is organized into eleven individual minesites, one grouping of two minesites, one publicly traded company and one project. Barrick’s Chief Operating Decision Maker (“CODM”), the President, reviews the operating results, assesses performance and makes capital allocation decisions at the minesite, grouping, Company and/or project level. Therefore, each individual minesite, with the exception of Barrick Nevada, Acacia and the Pascua-Lama project are operating segments for financial reporting purposes. Our presentation of our reportable operating segments is four individual gold mines (Pueblo Viejo, Lagunas Norte, Veladero and Turquoise Ridge), Barrick Nevada, Acacia and our Pascua-Lama project. The remaining operating segments, our remaining gold and copper mines, have been grouped into an “other” category and will not be reported on individually. Segment performance is evaluated based on a number of measures including operating income before tax, production levels and unit production costs. Certain costs are managed on a consolidated basis and are therefore not reflected in segment income.
BARRICK FIRST QUARTER 2018 | 63 | NOTES TO FINANCIAL STATEMENTS (UNAUDITED) |
Consolidated Statement of Income Information
| ||||||||||||||||||||||
Cost of Sales | ||||||||||||||||||||||
For the three months ended March 31, 2018 | Revenue | Direct mining, royalties and community relations | Depreciation | Exploration, evaluation and project expenses | Other expenses (income)1 | Segment income (loss) | ||||||||||||||||
Barrick Nevada | $614 | $243 | $148 | $2 | $1 | $220 | ||||||||||||||||
Turquoise Ridge | 84 | 38 | 7 | — | — | 39 | ||||||||||||||||
Pueblo Viejo2 | 356 | 126 | 41 | 4 | — | 185 | ||||||||||||||||
Veladero | 101 | 45 | 31 | — | — | 25 | ||||||||||||||||
Lagunas Norte | 96 | 27 | 11 | — | 2 | 56 | ||||||||||||||||
Acacia2 | 157 | 86 | 24 | — | (24) | 71 | ||||||||||||||||
Pascua-Lama | — | — | 2 | 23 | 5 | (30) | ||||||||||||||||
Other Mines3,4 | 382 | 260 | 55 | 3 | 20 | 44 | ||||||||||||||||
$1,790 | $825 | $319 | $32 | $4 | $610 | |||||||||||||||||
Consolidated Statement of Income Information
| ||||||||||||||||||||||
Cost of Sales | ||||||||||||||||||||||
For the three months ended March 31, 2017 | Revenue | Direct mining, royalties and community relations | Depreciation | Exploration, evaluation and project expenses | Other expenses (income)1 | Segment income (loss) | ||||||||||||||||
Barrick Nevada | $646 | $280 | $207 | $4 | $7 | $148 | ||||||||||||||||
Turquoise Ridge | 67 | 30 | 7 | — | — | 30 | ||||||||||||||||
Pueblo Viejo2 | 307 | 120 | 40 | — | — | 147 | ||||||||||||||||
Veladero | 210 | 102 | 38 | — | — | 70 | ||||||||||||||||
Lagunas Norte | 115 | 37 | 16 | 1 | 2 | 59 | ||||||||||||||||
Acacia2 | 232 | 116 | 35 | — | 6 | 75 | ||||||||||||||||
Pascua-Lama | — | — | 2 | 22 | (5) | (19) | ||||||||||||||||
Other Mines3,4 | 416 | 236 | 56 | 3 | 7 | 114 | ||||||||||||||||
$1,993 | $921 | $401 | $30 | $17 | $624 |
1 | Includes accretion expense, which is included within finance costs in the consolidated statement of income. For the three months ended March 31, 2018, accretion expense was $17 million (2017: $14 million). |
2 | Includesnon-controlling interest portion of revenues, cost of sales and segment income for the three months ended March 31, 2018 for Pueblo Viejo of $138 million, $66 million, $70 million (2017: $121 million, $61 million, $60 million) and Acacia of $57 million, $40 million, $26 million (2017: $84 million, $55 million, $27 million). |
3 | Includes cost of sales of Pierina for the three months ended March 31, 2018 of $32 million (2017: $34 million). |
4 | Includes provisional pricing adjustments for the three months ended March 31, 2018 of $23 million losses (2017: $8 million losses). |
Reconciliation of Segment Income to Income Before Income Taxes
For the three months ended March 31 | ||||||
2018 | 2017 | |||||
Segment income | $610 | $624 | ||||
Other cost of sales/amortization1 | (8) | (20) | ||||
Exploration, evaluation and project expenses not attributable to segments | (41) | (45) | ||||
General and administrative expenses | (48) | (72) | ||||
Other income (expense) not attributable to segments | (14) | 1 | ||||
Impairment reversals (charges) not attributable to segments | (2) | 1,125 | ||||
Loss on currency translation | (15) | (3) | ||||
Closed mine rehabilitation | 9 | (8) | ||||
Income from equity investees | 16 | 11 | ||||
Finance costs, net (includesnon-segment accretion) | (116) | (136) | ||||
Gain onnon-hedge derivatives2 | 2 | 4 | ||||
Income before income taxes | $393 | $1,481 |
1 | Includes all realized hedge gains and losses for the three months ended March 31, 2018 of $1 million losses (2017: $6 million losses). |
2 | Includes unrealizednon-hedge gains and losses for the three months ended March 31, 2018 of $nil losses (2017: $3 million losses). |
BARRICK FIRST QUARTER 2018 | 64 | NOTES TO FINANCIAL STATEMENTS (UNAUDITED) |
Capital Expenditures Information
Segment capital expenditures1 | ||||||
For the three months ended March 31 | ||||||
2018 | 2017 | |||||
Barrick Nevada | $146 | $130 | ||||
Turquoise Ridge | 13 | 9 | ||||
Pueblo Viejo | 38 | 21 | ||||
Veladero | 31 | 50 | ||||
Lagunas Norte | 3 | 5 | ||||
Acacia | 26 | 46 | ||||
Pascua-Lama | 9 | 3 | ||||
Other Mines | 52 | 48 | ||||
Segment total | $318 | $312 | ||||
Other items not allocated to segments | 13 | 6 | ||||
Total | $331 | $318 |
1 | Segment capital expenditures are presented for internal management reporting purposes on an accrual basis. Capital expenditures in the Consolidated Statements of Cash Flow are presented on a cash basis. For the three months ended March 31, 2018, cash expenditures were $326 million (2017: $334 million) and the increase in accrued expenditures was $5 million (2017: $16 million decrease). |
Purchase Commitments
At March 31, 2018, we had purchase obligations for supplies and consumables of $1,088 million (December 31, 2017: $1,147 million).
Capital Commitments
In addition to entering into various operational commitments in the normal course of business, we had capital commitments of $134 million at March 31, 2018 (December 31, 2017: $118 million).
6 > REVENUE
For the three months ended March 31 | ||||||||||||
2018 | 2017 | |||||||||||
Gold sales | ||||||||||||
Spot market sales | $1,640 | $1,780 | ||||||||||
Concentrate sales | 3 | 46 | ||||||||||
Provisional pricing adjustments | — | 1 | ||||||||||
$1,643 | $1,827 | |||||||||||
Copper sales | ||||||||||||
Copper concentrate sales | $134 | $134 | ||||||||||
Provisional pricing adjustments | (23 | ) | (9 | ) | ||||||||
$111 | $125 | |||||||||||
Other sales1 | $36 | $41 | ||||||||||
Total | $1,790 | $1,993 |
1 | Reveneues include the sale ofby-products for our gold and copper mines. |
7 > COST OF SALES
Gold | Copper | Pascua-Lama/Other3 | Total | |||||||||||||
For the three months ended March 31 | 2018 | 2017 | 2018 | 2017 | 2018 | 2017 | 2018 | 2017 | ||||||||
Direct mining cost1,2 | $690 | $794 | $66 | $60 | $2 | $7 | $758 | $861 | ||||||||
Depreciation | 298 | 385 | 19 | 14 | 8 | 15 | 325 | 414 | ||||||||
Royalty expense | 50 | 51 | 9 | 7 | — | — | 59 | 58 | ||||||||
Community relations | 8 | 8 | 2 | 1 | — | — | 10 | 9 | ||||||||
$1,046 | $1,238 | $96 | $82 | $10 | $22 | $1,152 | $1,342 |
1 | Direct mining cost includes charges to reduce the cost of inventory to net realizable value as follows: $3 million for the three months ended March 31, 2018 (2017: $3 million). |
2 | Direct mining cost includes the costs of extractingby-products. |
3 | Other includes all realized hedge gains and losses and corporate amortization. |
BARRICK FIRST QUARTER 2018 | 65 | NOTES TO FINANCIAL STATEMENTS (UNAUDITED) |
8 > EARNINGS PER SHARE
For the three months ended March 31 | ||||||||||||||||
2018 | 2017 | |||||||||||||||
Basic | Diluted | Basic | Diluted | |||||||||||||
Net income | $192 | $192 | $889 | $889 | ||||||||||||
Net income attributable tonon-controlling interests | (34) | (34) | (210) | (210) | ||||||||||||
Net income attributable to equity holders of Barrick Gold Corporation | $158 | $158 | $679 | $679 | ||||||||||||
Weighted average shares outstanding | 1,167 | 1,167 | 1,166 | 1,166 | ||||||||||||
Earnings per share data attributable to the equity holders of Barrick Gold Corporation | ||||||||||||||||
Net income | $0.14 | $0.14 | $0.58 | $0.58 |
9 > OTHER EXPENSE
A) Other Expense (Income)
For the three months ended March 31 | ||||||||
2018 | 2017 | |||||||
Other expense: | ||||||||
Bank charges | $7 | $5 | ||||||
Bulyanhulu reduced operations program cost1 | 8 | — | ||||||
Litigation | 27 | 2 | ||||||
Other | 13 | 1 | ||||||
Total other expense | $55 | $8 | ||||||
Other income: | ||||||||
(Gain)/loss on sale of long-lived assets2 | ($46 | ) | $3 | |||||
Other | (8 | ) | (9 | ) | ||||
Total other income | ($54 | ) | ($6 | ) | ||||
Total | $1 | $2 |
1 | Primarily consists of severance, contractor and inventory write-down costs. |
2 | Primarily consists of a gain related to the sale of anon-core royalty asset at Acacia. |
B) Impairment (Reversals) Charges
|
| |||||||
For the three months ended March 31 | ||||||||
2018 | 2017 | |||||||
Impairment (reversals) ofnon-current assets | $2 | ($1,125 | ) | |||||
Total | $2 | ($1,125 | ) | |||||
C) Loss on Currency Translation
|
| |||||||
For the three months ended March 31 | ||||||||
2018 | 2017 | |||||||
Currency translation losses released as a result of the disposal and reorganization of entities | $— | $11 | ||||||
Foreign currency translation losses (gains) | 15 | (8 | ) | |||||
Total | $15 | $3 |
10 > INCOME TAX EXPENSE | ||||||||
For the three months ended March 31 | ||||||||
2018 | 2017 | |||||||
Current | $133 | $140 | ||||||
Deferred | 68 | 452 | ||||||
$201 | $592 |
Income tax expense was $201 million for the three months ended March 31, 2018. The underlying effective tax rate for ordinary income for the three months ended March 31, 2018 was 42% after adjusting for the impact of the Dominican Republic tax audit; the net impact of foreign currency translation losses on deferred tax balances; the impact of impairment (reversals) charges; the impact of asset sales andnon-hedge derivatives; and the impact ofnon-deductible foreign exchange losses. The unadjusted tax rate for income for the three months ended March 31, 2018, was 51% of the income before income taxes.
Currency Translation
Deferred tax balances are subject to remeasurement for changes in currency exchange rates each period. The most significant balances are Argentine net deferred tax liabilities. In the three months ended March 31, 2018 and 2017, tax expense of $4 million and tax recovery of $3 million, respectively, primarily arose from translation losses/gains on tax balances in Argentina, due to the weakening of the Argentine peso against the U.S. dollar. These translation losses/gains are included within deferred income tax expense/recovery.
Dominican Republic Tax Audit
In the first quarter of 2018, current tax expense of $5 million and deferred tax expense of $37 million were recorded, resulting from a tax audit of Pueblo Viejo in the Dominican Republic. The deferred tax expense relates to additional tax deductions included in the audit that reduced deferred tax assets, but did not reduce tax expense due to the application of annual minimum tax (AMT) in certain taxation years.
BARRICK FIRST QUARTER 2018 | 66 | NOTES TO FINANCIAL STATEMENTS (UNAUDITED) |
11 > CASH FLOW – OTHER ITEMS
Operating Cash Flows – Other Items | For the three months ended March 31 | |||||||
2018 | 2017 | |||||||
Adjustments fornon-cash income statement items: | ||||||||
Gain onnon-hedge derivatives | ($2 | ) | ($4 | ) | ||||
Stock-based compensation expense | 2 | 25 | ||||||
Income from investment in equity investees | (16 | ) | (11 | ) | ||||
Change in estimate of rehabilitation costs at closed mines | (9 | ) | 8 | |||||
Net inventory impairment charges | 3 | 3 | ||||||
Change in other assets and liabilities | (26 | ) | (96 | ) | ||||
Settlement of rehabilitation obligations | (16 | ) | (9 | ) | ||||
Other operating activities | ($64 | ) | ($84 | ) | ||||
Cash flow arising from changes in: | ||||||||
Accounts receivable | $66 | $16 | ||||||
Inventory | (76 | ) | (77 | ) | ||||
Other current assets | (62 | ) | (44 | ) | ||||
Accounts payable | (106 | ) | (51 | ) | ||||
Other current liabilities | 2 | (40 | ) | |||||
Change in working capital | ($176 | ) | ($196 | ) |
12 > EQUITY ACCOUNTING METHOD INVESTMENT CONTINUITY
Kabanga | Jabal Sayid | Zaldívar | GNX | Total | ||||||||||||||||
At January 1, 2017 | $30 | $180 | $974 | $1 | $1,185 | |||||||||||||||
Funds invested | 1 | — | — | 11 | 12 | |||||||||||||||
Dividend | — | — | (60 | ) | — | (60 | ) | |||||||||||||
Equitypick-up (loss) from equity investees | (1 | ) | 26 | 61 | (10 | ) | 76 | |||||||||||||
At December 31, 2017 | $30 | $206 | $975 | $2 | $1,213 | |||||||||||||||
Funds invested | — | — | — | 4 | 4 | |||||||||||||||
Equitypick-up (loss) from equity investees | — | 12 | 10 | (6 | ) | 16 | ||||||||||||||
At March 31, 2018 | $30 | $218 | $985 | $— | $1,233 |
13 > IMPAIRMENT OF GOODWILL AND OTHER
ASSETS
In accordance with our accounting policy, goodwill is tested for impairment in the fourth quarter and also when there is an indicator of impairment.Non-current assets are tested for impairment or impairment reversals when events or changes in circumstances suggest that the carrying amount may not be recoverable. Refer to note 21 of the 2017 Annual Financial Statements for further information.
For the three months ended March 31, 2018, we recorded impairments of $2 million (2017: $1,125 million impairment reversals) fornon-current assets, as summarized in the following table:
Summary of impairments (reversals)
For the three months ended March 31 | ||||||||
2018 | 2017 | |||||||
Cerro Casale | $— | ($1,120 | ) | |||||
Pascua-Lama | (1 | ) | (6 | ) | ||||
Other | 3 | 1 | ||||||
Total | $2 | ($1,125 | ) |
BARRICK FIRST QUARTER 2018 | 67 | NOTES TO FINANCIAL STATEMENTS (UNAUDITED) |
Indicators of impairment
Cerro Casale - First Quarter 2017
As noted in note 4(a), on March 28, 2017, we announced the sale of a 25% interest in the Cerro Casale Project in Chile, which would result in Barrick retaining a 50% interest in the Project and this was deemed to be an indicator of impairment reversal in the first quarter of 2017. As such, in first quarter 2017, we recognized a partial reversal of thenon-current asset impairment
recorded in the fourth quarter of 2014 in the amount of $1.12 billion. The recoverable amount, based on the fair value less cost to dispose as implied by the transaction price, was $1.2 billion.
14 > FINANCIAL INSTRUMENTS
Financial instruments include cash; evidence of ownership in an entity; or a contract that imposes an obligation on one party and conveys a right to a second party to deliver/receive cash or another financial instrument.
A) Cash and Equivalents
Cash and equivalents include cash, term deposits, treasury bills and money market funds with original maturities of less than 90 days. Cash and equivalents also include $378 million cash that is held in subsidiaries that have regulatory regulations or contractual restrictions, or operate in countries where exchange controls and other legal restrictions apply and are therefore not available for general use by the Company.
B) Debt1 |
As at March 31, 2018 | As at December 31, 2017 | |||||||
4.4%/5.7% notes2,9 | $1,468 | $1,468 | ||||||
3.85%/5.25% notes | 1,079 | 1,079 | ||||||
5.80% notes3,9 | 395 | 395 | ||||||
6.35% notes4,9 | 594 | 593 | ||||||
Other fixed-rate notes5,9 | 1,326 | 1,326 | ||||||
Capital leases6 | 38 | 46 | ||||||
Other debt obligations | 602 | 603 | ||||||
5.75% notes7,9 | 842 | 842 | ||||||
Acacia credit facility8 | 57 | 71 | ||||||
$6,401 | $6,423 | |||||||
Less: current portion10 | (57) | (59) | ||||||
$6,344 | $6,364 |
1 | The agreements that govern our long-term debt each contain various provisions which are not summarized herein. These provisions allow Barrick to, at its option, redeem indebtedness prior to maturity at specified prices and also may permit redemption of debt by Barrick upon the occurrence of certain specified changes in tax legislation. |
2 | Consists of $1.5 billion in conjunction with our wholly owned subsidiary Barrick North America Finance LLC (“BNAF”). This consists of $629 million of BNAF notes due 2021 and $850 million of BNAF notes due 2041. |
3 | Consists of $400 million of 5.80% notes which mature in 2034. |
4 | Consists of $600 million of 6.35% notes which mature in 2036. |
5 | Consists of $1.3 billion in conjunction with our wholly owned subsidiary BNAF and our wholly-owned subsidiary Barrick (PD) Australia Finance Pty Ltd. (“BPDAF”). This consists of $248 million of BPDAF notes due 2020, $250 million of BNAF notes due 2038 and $850 million of BPDAF notes due 2039. |
6 | Consists primarily of capital leases at Pascua-Lama of $12 million, and Lagunas Norte of $21 million (2017: $13 million and $27 million, respectively). |
7 | Consists of $850 million in conjunction with our wholly owned subsidiary BNAF. |
8 | Consists of an export credit backed term loan facility. |
9 | We provide an unconditional and irrevocable guarantee on all BNAF, BPDAF, Barrick Gold Finance Company (“BGFC”) and Barrick (HMC) Mining (“BHMC”) notes and generally provide such guarantees on all BNAF, BPDAF, BGFC and BHMC notes issued, which will rank equally with our other unsecured and unsubordinated obligations. |
10 | The current portion of long-term debt consists of other debt obligations of $4 million (2017: $4 million), capital leases of $25 million (2017: $27 million) and Acacia credit facility of $28 million (2017: $28 million). |
BARRICK FIRST QUARTER 2018 | 68 | NOTES TO FINANCIAL STATEMENTS (UNAUDITED) |
15 > FAIR VALUE MEASUREMENTS
A) Assets and Liabilities Measured at Fair Value on
a Recurring Basis
As at March 31, 2018 | Quoted
(Level 1) | Significant
(Level 2) | Significant unobservable
| Aggregate fair value
| ||||||||||||
Cash and equivalents | $2,384 | $— | $— | $2,384 | ||||||||||||
Other investments | 30 | — | — | 30 | ||||||||||||
Derivatives | — | (11 | ) | — | (11 | ) | ||||||||||
Receivables from provisional copper and gold sales | — | 60 | — | 60 | ||||||||||||
$2,414 | $49 | $— | $2,463 |
B) Fair Values of Financial Assets and Liabilities
As at March 31, 2018 | As at December 31, 2017 | |||||||||||||||
Carrying amount | Estimated fair value | Carrying amount | Estimated fair value | |||||||||||||
Financial assets | ||||||||||||||||
Other assets1 | $570 | $570 | $572 | $572 | ||||||||||||
Other investments2 | 30 | 30 | 33 | 33 | ||||||||||||
Derivative assets | 3 | 3 | 3 | 3 | ||||||||||||
$603 | $603 | $608 | $608 | |||||||||||||
Financial liabilities |
| |||||||||||||||
Debt3 | $6,401 | $7,296 | $6,423 | $7,715 | ||||||||||||
Derivative liabilities | 14 | 14 | 32 | 32 | ||||||||||||
Other liabilities | 526 | 526 | 252 | 252 | ||||||||||||
$6,941 | $7,836 | $6,707 | $7,999 |
1 | Includes restricted cash and amounts due from our partners. |
2 | Recorded at fair value. Quoted market prices are used to determine fair value. |
3 | Debt is generally recorded at amortized cost. The fair value of debt is primarily determined using quoted market prices. Balance includes both current and long-term portions of debt. |
We do not offset financial assets with financial liabilities.
The Company’s valuation techniques were presented in Note 26 of the 2017 Annual Financial Statements, and have been consistently applied in these interim financial statements.
16 > CAPITAL STOCK
A) Authorized Capital Stock
Our authorized capital stock includes an unlimited number of common shares (issued 1,166,892,835 common shares); an unlimited number of first preferred shares issuable in series (the first series is designated as the “First Preferred Shares, Series A” and consists of 10,000,000 first preferred shares (issued nil); the second series is designated as the “First Preferred Shares, Series B” and consists of 10,000,000 first preferred shares (issued nil); and the third series is designated as the “ First Preferred Share, Series C Special Voting Share” and consists of 1 Special Voting Share (issued nil)); and an unlimited number of second preferred shares issuable in series (the first series is designated as the “Second Preferred Shares, Series A” and consists of 15,000,000 second preferred shares (issued nil)). Our common shares have no par value.
B) Dividends
The Company’s practice has been to declare dividends after a quarter in the announcement of the results for the quarter. Dividends declared are paid in the same quarter.
The Company’s dividend reinvestment plan resulted in 315,357 common shares issued to shareholders for the three months ended March 31, 2018.
BARRICK FIRST QUARTER 2018 | 69 | NOTES TO FINANCIAL STATEMENTS (UNAUDITED) |
17 > CONTINGENCIES
Certain conditions may exist as of the date the financial statements are issued that may result in a loss to the Company, but which will only be resolved when one or more future events occur or fail to occur. The impact of any resulting loss from such matters affecting these financial statements and noted below may be material.
Except as noted below, no material changes have occurred with respect to the matters disclosed in Note 36 “Contingencies” to the 2017 Annual Financial Statements, and no new contingencies have occurred that are material to the Company since the issuance of the 2017 Annual Financial Statements.
The description set out below should be read in conjunction with Note 36 “Contingencies” to the 2017 Annual Financial Statements.
Litigation and Claims Update
US Shareholder Class Action
Briefing on the motion to dismiss was completed on April 18, 2018.
Veladero - September 2015 Release of Cyanide-Bearing Process Solution
Criminal Matters
On March 5, 2018, the Court of Appeals confirmed the indictment against the four former federal officials in relation to the enforcement of the national glacier legislation. On April 11, 2018, the federal judge indicted two additional former federal officials and confirmed a second charge against one of the former federal officials originally indicted on November 27, 2017, alleging breach of duty in connection with their actions and omissions related to the failure to maintain adequate environmental controls. In total, six former federal officials have now been indicted under these proceedings (one of whom has been indicted on two separate charges).
Veladero - September 2016 Release of Crushed Ore Saturated with Process Solution
Temporary Suspension of Operations and Regulatory Infringement Proceeding
On March 28, 2018, MAG was notified that the San Juan Provincial mining authority had rejected the request for reconsideration. A further appeal will be heard and decided by the Governor of San Juan.
Veladero - March 2017 Release of Gold-bearing Process Solution
Regulatory Infringement Proceeding and Temporary Suspension of Addition of Cyanide
On March 28, 2018, MAG was notified that the San Juan Provincial mining authority had rejected the request for reconsideration. A further appeal will be heard and decided by the Governor of San Juan.
BARRICK FIRST QUARTER 2018 | 70 | NOTES TO FINANCIAL STATEMENTS (UNAUDITED) |
HEAD OFFICE
Barrick Gold Corporation
Brookfield Place
TD Canada Trust Tower
161 Bay Street, Suite 3700
Toronto, Ontario M5J 2S1
Telephone: +1 416861-9911
Toll-free:1-800-720-7415
Fax: +1 416861-2492
Email: investor@barrick.com
Website: www.barrick.com
SHARES LISTED
ABX The New York Stock Exchange
The Toronto Stock Exchange
INVESTOR CONTACT
Deni Nicoski
Senior Vice President
Investor Relations
Telephone: +1 416307-7474
Email: dnicoski@barrick.com
TRANSFER AGENTS AND REGISTRARS
AST Trust Company (Canada)
P.O. Box 700, Postal Station B
Montreal, Quebec H3B 3K3
or
American Stock Transfer & Trust Company, LLC
6201 – 15 Avenue
Brooklyn, New York 11219
Telephone:1-800-387-0825
Fax:1-888-249-6189
Email: inquiries@astfinancial.com
Website: www.astfinancial.com
MEDIA CONTACT
Andy Lloyd
Senior Vice President
Communications
Telephone: +1 416307-7414
Email: alloyd@barrick.com
Cautionary Statement on Forward-Looking Information
Certain information contained or incorporated by reference in this press release, including any information as to our strategy, projects, plans, or future financial or operating performance, constitutes “forward-looking statements”. All statements, other than statements of historical fact, are forward-looking statements. The words “believe”, “expect”, “anticipate”, “target”, “plan”, “objective”, “assume”, “aspire”, “intend”, “project”, “pursue”, “goal”, “continue”, “budget”, “estimate”, “potential”, “may”, “will”, “can”, “should”, “could”, “would” and similar expressions identify forward-looking statements. In particular, this press release contains forward-looking statements including, without limitation, with respect to: (i) Barrick’s forward-looking production guidance; (ii) estimates of future cost of sales per ounce for gold and per pound for copper,all-in-sustaining costs per ounce/pound, cash costs per ounce, and C1 cash costs per pound; (iii) our ability to continue to grow free cash flow; (iv) projected capital, operating, and exploration expenditures; (v) the timing required to negotiate and develop a detailed proposal with the Government of Tanzania related to the operations of Acacia Mining plc (“Acacia”) in Tanzania for review by Acacia; (vi) the estimated timing for permitting and a record of decision at Cortez Deep South; (vii) the timing for construction, engineering and permitting at Goldrush; (viii) the adjustment of Barrick’s closure plan for surface infrastructure on the Chilean side of the Pascua-Lama project and continued evaluation ofde-risking opportunities; (ix) targeted debt and cost reductions; (x) mine life and production rates; (xi) potential mineralization and metal or mineral recoveries; (xii) our pipeline of high confidence projects at or near existing operations; (xiii) the potential impact and benefits of Barrick’s ongoing digital transformation; (xiv) the potential to identify new reserves and resources, and our ability to convert resources into reserves; (xv) asset sales, joint ventures, and partnerships; and (xvi) expectations regarding future price assumptions, financial performance, and other outlook or guidance.
Forward-looking statements are necessarily based upon a number of estimates and assumptions including material estimates and assumptions related to the factors set forth below that, while considered reasonable by the Company as at the date of this press release in light of management’s experience and perception of current conditions and expected developments, are inherently subject to significant business, economic and competitive uncertainties and contingencies. Known and unknown factors could cause actual results to differ materially from those projected in the forward-looking statements, and undue reliance should not be placed on such statements and information. Such factors include, but are not limited to: fluctuations in the spot and forward price of gold, copper, or certain other commodities (such as silver, diesel fuel, natural gas, and electricity); the speculative nature of mineral exploration and development; changes in mineral production performance, exploitation, and exploration successes; risks associated with the fact that certainBest-in-Class initiatives are still in the early stages of evaluation, and additional engineering and other analysis is required to fully assess their impact; risks associated with the ongoing implementation of Barrick’s digital transformation initiative, and the ability of the projects under this initiative to meet the Company’s capital allocation objectives; the duration of the Tanzanian ban on mineral concentrate exports; the ultimate terms of any definitive agreement between Acacia and the Government of Tanzania to resolve a dispute relating to the imposition of the concentrate export ban and allegations by the Government of Tanzania that Acacia under-declared the metal content of concentrate exports from Tanzania; the status of certain taxre-assessments by the Tanzanian government; the manner in which amendments to the 2010 Mining Act (Tanzania) increasing the royalty rate applicable to metallic minerals such as gold, copper and silver to 6% (from 4%), the new Finance Act (Tanzania) imposing a 1% clearing fee on the value of all minerals exported from Tanzania from July 1, 2017 and the new Mining Regulations announced by Government of Tanzania in January 2018 will be implemented and the impact of these and other legislative changes on Acacia; whether Acacia will approve the terms of any final agreement reached between Barrick and the Government of Tanzania with respect to the dispute between Acacia and the Government of Tanzania; the benefits expected from recent transactions being realized; diminishing quantities or grades of reserves; increased costs, delays, suspensions and technical challenges associated with the construction of capital projects; operating or technical difficulties in connection with mining or development activities, including geotechnical challenges
and disruptions in the maintenance or provision of required infrastructure and information technology systems; failure to comply with environmental and health and safety laws and regulations; timing of receipt of, or failure to comply with, necessary permits and approvals; uncertainty whether some or all of theBest-in-Class initiatives, targeted investments and projects will meet the Company’s capital allocation objectives and internal hurdle rate; the impact of global liquidity and credit availability on the timing of cash flows and the values of assets and liabilities based on projected future cash flows; adverse changes in our credit ratings; the impact of inflation; fluctuations in the currency markets; changes in U.S. dollar interest rates; risks arising from holding derivative instruments; changes in national and local government legislation, taxation, controls or regulations and/ or changes in the administration of laws, policies and practices, expropriation or nationalization of property and political or economic developments in Canada, the United States, and other jurisdictions in which the Company or its affiliates do or may carry on business in the future; lack of certainty with respect to foreign legal systems, corruption and other factors that are inconsistent with the rule of law; damage to the Company’s reputation due to the actual or perceived occurrence of any number of events, including negative publicity with respect to the Company’s handling of environmental matters or dealings with community groups, whether true or not; the possibility that future exploration results will not be consistent with the Company’s expectations; risks that exploration data may be incomplete and considerable additional work may be required to complete further evaluation, including but not limited to drilling, engineering and socioeconomic studies and investment; risk of loss due to acts of war, terrorism, sabotage and civil disturbances; litigation and legal and administrative proceedings; contests over title to properties, particularly title to undeveloped properties, or over access to water, power and other required infrastructure; business opportunities that may be presented to, or pursued by, the Company; risks associated with the fact that certain of the initiatives described in this press release are still in the early stages and may not materialize; our ability to successfully integrate acquisitions or complete divestitures; risks associated with working with partners in jointly controlled assets; employee relations including loss of key employees; increased costs and physical risks, including extreme weather events and resource shortages, related to climate change; availability and increased costs associated with mining inputs and labor; and the organization of our previously held African gold operations and properties under a separate listed Company. In addition, there are risks and hazards associated with the business of mineral exploration, development and mining, including environmental hazards, industrial accidents, unusual or unexpected formations, pressures,cave-ins, flooding and gold bullion, copper cathode or gold or copper concentrate losses (and the risk of inadequate insurance, or inability to obtain insurance, to cover these risks).
Many of these uncertainties and contingencies can affect our actual results and could cause actual results to differ materially from those expressed or implied in any forward-looking statements made by, or on behalf of, us. Readers are cautioned that forward-looking statements are not guarantees of future performance. All of the forward-looking statements made in this press release are qualified by these cautionary statements. Specific reference is made to the most recent Form40- F/Annual Information Form on file with the SEC and Canadian provincial securities regulatory authorities for a more detailed discussion of some of the factors underlying forward-looking statements and the risks that may affect Barrick’s ability to achieve the expectations set forth in the forward-looking statements contained in this press release.
The Company disclaims any intention or obligation to update or revise any forward-looking statements whether as a result of new information, future events or otherwise, except as required by applicable law.