A new champion for long-term value creation in the gold industry Exhibit 99.24
Disclaimer THIS PRESENTATION AND ITS CONTENTS ARE NOT FOR RELEASE, PUBLICATION OR DISTRIBUTION, IN WHOLE OR IN PART, DIRECTLY OR INDIRECTLY, IN OR INTO OR FROM ANY JURISDICTION WHERE SUCH DISTRIBUTION IS UNLAWFUL. This presentation has been prepared solely for information and for use in connection with the merger (the “Merger”) of Randgold Resources Limited (“Randgold”) by Barrick Gold Corporation (“Barrick”) and does not purport to contain all the information that may be necessary or desirable to fully and accurately evaluate Barrick, Randgold or the business prospects of the Merger. For the purposes of this notice, "presentation" includes this document, any oral presentation, any question and answer session and any written or oral material discussed or distributed by Barrick or Randgold during any such presentation. By attending this presentation and/or accepting, reading or accessing a copy of this document, you agree to be bound by the limitations, terms and conditions set out below and, in particular, will be taken to have represented, warranted and undertaken that you have read and agree to comply with the contents of this notice. As a consequence of legal restrictions, the release, publication or distribution of this presentation in certain jurisdictions or to certain persons may be restricted or unlawful. All persons resident or located outside Canada, Jersey, the United States and the United Kingdom must first satisfy themselves that they are not subject to any local requirements that prohibit or restrict them from attending, reading or otherwise accessing this presentation and should inform themselves of, and observe, any applicable legal or regulatory requirements applicable in their jurisdiction. The information set out in this presentation is not intended to form the basis of any contract. No shares are being offered to the public by means of this presentation. This presentation does not constitute or form part of, and should not be construed as, any offer, invitation or recommendation to purchase, sell or subscribe for any securities or the solicitation of any vote for approval in any jurisdiction and neither the issue of the information nor anything contained herein shall form the basis of or be relied upon in connection with, or act as an inducement to enter into, any investment activity, or the making of any investment decision. This presentation does not purport to contain all of the information that may be required to evaluate the Merger or any investment in Barrick or Randgold or any of their securities. Any investment decision should be made solely on the basis of approved formal offer-related documentation that has been or will be released in connection with the Merger. Any person considering making an investment decision in relation to Barrick, Randgold or the Merger is advised to obtain independent advice as to the legal, tax, accounting, financial, credit and other related advice prior to making an investment. This presentation has not been independently verified and none of Barrick, Randgold, their shareholders, subsidiaries, affiliates, associates, or their respective directors, officers, partners, employees, representatives and advisers makes any representation or warranty, express or implied, as to the accuracy or completeness of the information contained in this presentation, or otherwise made available, nor as to the reasonableness of any assumption contained herein or therein, and any liability therefor (including in respect of direct, indirect, consequential loss or damage) is expressly disclaimed and no liability is assumed by any such persons for any information, opinions, errors or omissions in this presentation. Nothing contained herein or therein is, or shall be relied upon as, a promise or representation, whether as to the past or the future and no reliance, in whole or in part, should be placed on the fairness, accuracy, completeness or correctness of the information contained herein or therein. Further, nothing in this presentation should be construed as constituting legal, business, tax or financial advice. Other than in accordance with their respective legal or regulatory obligations, Barrick and Randgold are not under any obligation, and they expressly disclaim any intention or obligation, to amend, correct or update this presentation or to provide the recipient with access to any additional information that may arise in connection with it. All information presented or contained in this presentation is subject to verification, correction, completion and change without notice. No statement in this presentation is intended as a profit forecast or estimate for any period and no statement in this presentation should be interpreted to mean that earnings or earnings per share (or other metrics) for the current or future financial years would necessarily match or exceed the historical published earnings or earnings per share (or other metrics). This presentation contains industry, market and competitive position data which have come from third party sources. Third party industry publications, studies and surveys generally state that the data contained therein have been obtained from sources believed to be reliable, but that there is no guarantee of the accuracy or completeness of such data. While Barrick and Randgold believe that each of these publications, studies and surveys has been prepared by a reputable source, neither Barrick nor Randgold has independently verified the data contained therein. Accordingly, undue reliance should not be placed on any of the industry, market or competitive position data contained in this presentation.
Disclaimer Forward looking statements This presentation (including information incorporated by reference in this presentation), oral statements made regarding the Merger, and other information published by Barrick and Randgold contain statements which are, or may be deemed to be, “forward-looking statements” (or “forward-looking information”), under applicable securities laws including for the purposes of the US Private Securities Litigation Reform Act of 1995. Forward-looking statements are prospective in nature and are not based on historical facts, but rather on current expectations and projections of the management of Barrick and Randgold about future events, and are therefore subject to risks and uncertainties which could cause actual results to differ materially from the future results expressed or implied by the forward-looking statements. The forward-looking statements contained in this presentation include statements relating to the expected effects of the Merger on Barrick and Randgold, the expected timing and scope of the Merger and other statements other than historical facts. Often, but not always, forward-looking statements can be identified by the use of forward-looking words such as “plans”, “expects” or “does not expect”, “is expected”, “is subject to”, “budget”, “scheduled”, “estimates”, “forecasts”, “intends”, “anticipates” or “does not anticipate”, or “believes”, or variations of such words and phrases or statements that certain actions, events or results “may”, “could”, “should”, “would”, “might” or “will” be taken, occur or be achieved. Although Barrick and Randgold believe that the expectations reflected in such forward-looking statements are reasonable, Barrick and Randgold can give no assurance that such expectations will prove to be correct. By their nature, forward-looking statements involve risk and uncertainty because they relate to events and depend on circumstances that will occur in the future. There are a number of factors that could cause actual results and developments to differ materially from those expressed or implied by such forward-looking statements. These factors include: risks relating to the Barrick Group’s and the Randgold Group’s credit rating; local and global political and economic conditions; the Barrick Group’s and the Randgold Group’s economic model and liquidity risks; fluctuations in the spot and forward price of gold, copper, or certain other commodities (such as silver, diesel fuel, natural gas, and electricity); financial services risk; the risks associated with Barrick’s and Randgold’s brand, reputation and trust; environmental risks; safety and technology risks; the ability to realise the anticipated benefits of the Merger or implementing the business plan for the New Barrick Group, including as a result of a delay in completing the Merger or difficulty in integrating the businesses of the companies involved (including the retention of key employees); changes in or enforcement of national and local government legislation, taxation, controls or regulations and/or changes in the administration of laws, policies and practices, expropriation or nationalization of property and political or economic developments in Canada, the United States, the Democratic Republic of Congo, Mali and other jurisdictions in which the Barrick Group and Randgold Group carry on business or in which the New Barrick Group may carry on business in the future; lack of certainty with respect to foreign legal systems, corruption and other factors that are inconsistent with the rule of law; legal or regulatory developments and changes; the outcome of any litigation, arbitration or other dispute proceeding; the impact of any acquisitions or similar transactions; competition and market risks; the impact of foreign exchange rates; pricing pressures; the possibility that future exploration results will not be consistent with expectations; risks that exploration data may be incomplete and considerable additional work may be required to complete further evaluation, including but not limited to drilling, engineering and socioeconomic studies and investment; risk of loss due to acts of war, terrorism, sabotage and civil disturbances; contests over title to properties, particularly title to undeveloped properties, or over access to water, power and other required infrastructure; and business continuity and crisis management. Other unknown or unpredictable factors could cause actual results to differ materially from those in the forward-looking statements. Such forward-looking statements should therefore be construed in the light of such factors. Neither Barrick nor Randgold, nor any of their respective associates or directors, officers or advisers, provides any representation, assurance or guarantee that the occurrence of the events expressed or implied in any forward-looking statements in this presentation will actually occur. You are cautioned not to place undue reliance on these forward-looking statements. Other than in accordance with their legal or regulatory obligations (including under the Listing Rules and the Disclosure and Transparency Rules of the FCA), neither Barrick nor Randgold is under any obligation, and Barrick and Randgold expressly disclaim any intention or obligation, to update or revise any forward-looking statements, whether as a result of new information, future events or otherwise.
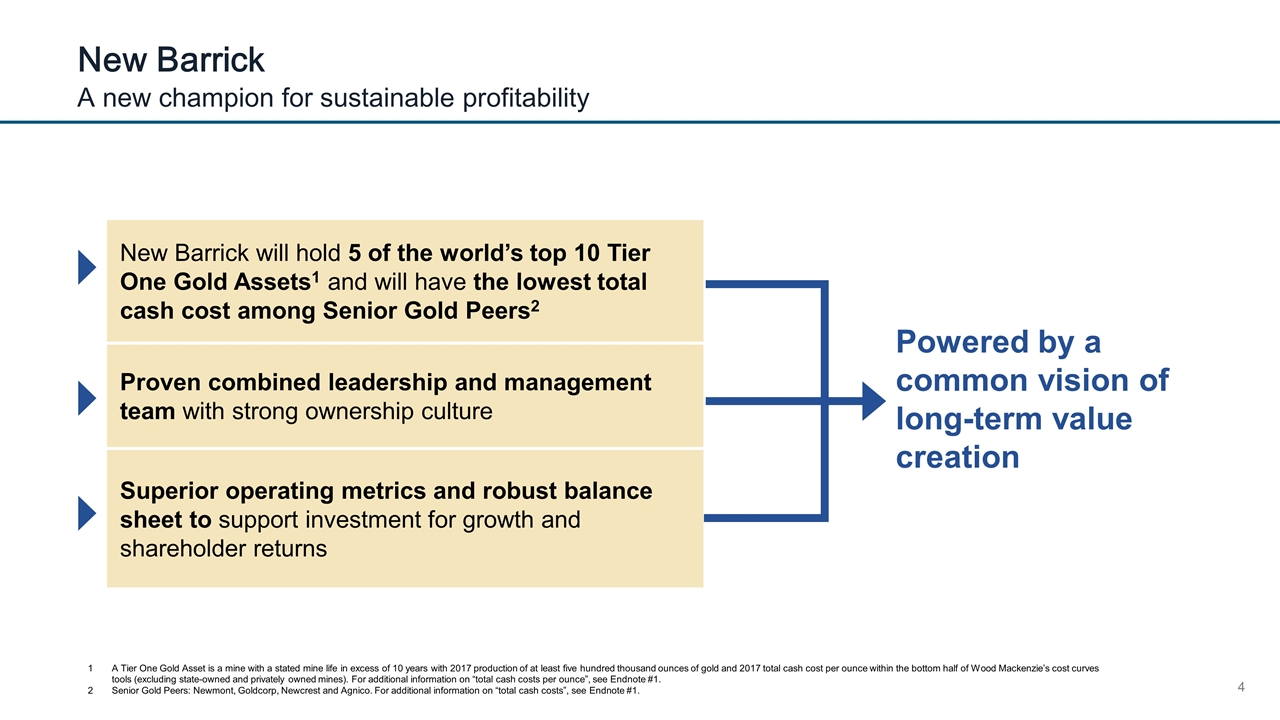
A new champion for sustainable profitability New Barrick New Barrick will hold 5 of the world’s top 10 Tier One Gold Assets1 and will have the lowest total cash cost among Senior Gold Peers2 Proven combined leadership and management team with strong ownership culture Superior operating metrics and robust balance sheet to support investment for growth and shareholder returns A Tier One Gold Asset is a mine with a stated mine life in excess of 10 years with 2017 production of at least five hundred thousand ounces of gold and 2017 total cash cost per ounce within the bottom half of Wood Mackenzie’s cost curves tools (excluding state-owned and privately owned mines). For additional information on “total cash costs per ounce”, see Endnote #1. Senior Gold Peers: Newmont, Goldcorp, Newcrest and Agnico. For additional information on “total cash costs”, see Endnote #1. Powered by a common vision of long-term value creation
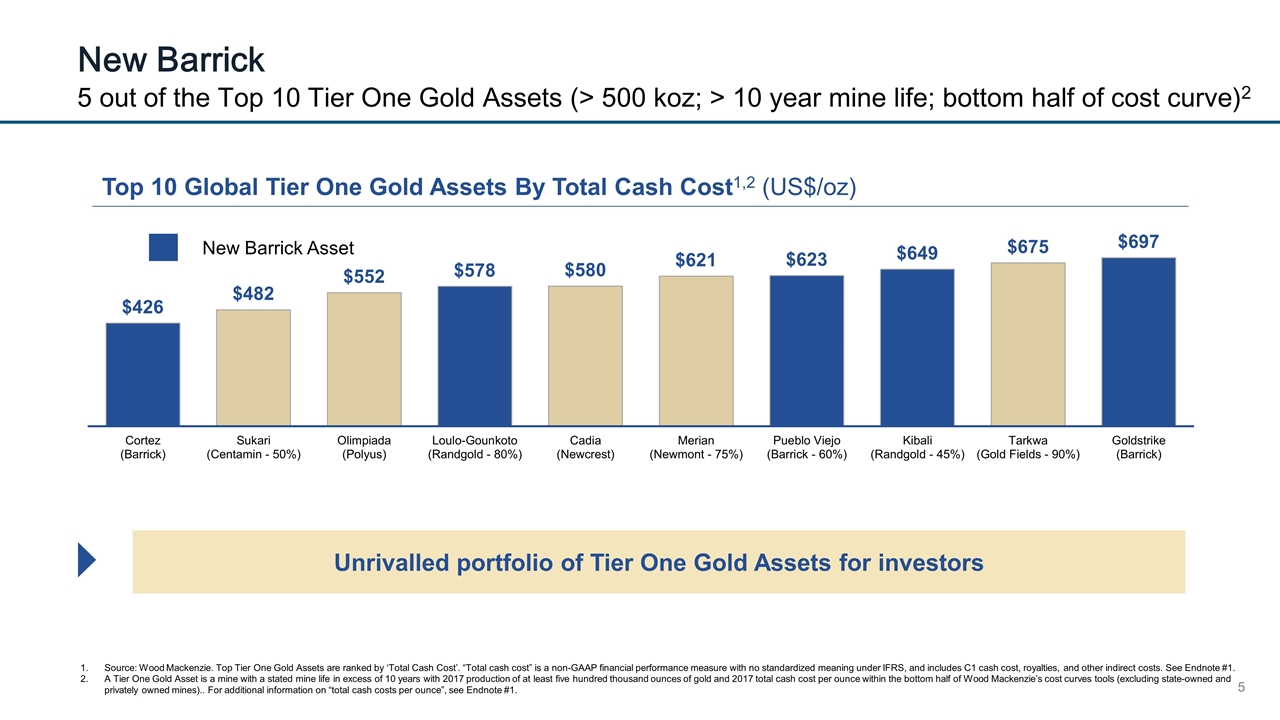
5 out of the Top 10 Tier One Gold Assets (> 500 koz; > 10 year mine life; bottom half of cost curve)2 New Barrick Source: Wood Mackenzie. Top Tier One Gold Assets are ranked by ‘Total Cash Cost’. “Total cash cost” is a non-GAAP financial performance measure with no standardized meaning under IFRS, and includes C1 cash cost, royalties, and other indirect costs. See Endnote #1. A Tier One Gold Asset is a mine with a stated mine life in excess of 10 years with 2017 production of at least five hundred thousand ounces of gold and 2017 total cash cost per ounce within the bottom half of Wood Mackenzie’s cost curves tools (excluding state-owned and privately owned mines).. For additional information on “total cash costs per ounce”, see Endnote #1. New Barrick Asset Top 10 Global Tier One Gold Assets By Total Cash Cost1,2 (US$/oz) Unrivalled portfolio of Tier One Gold Assets for investors
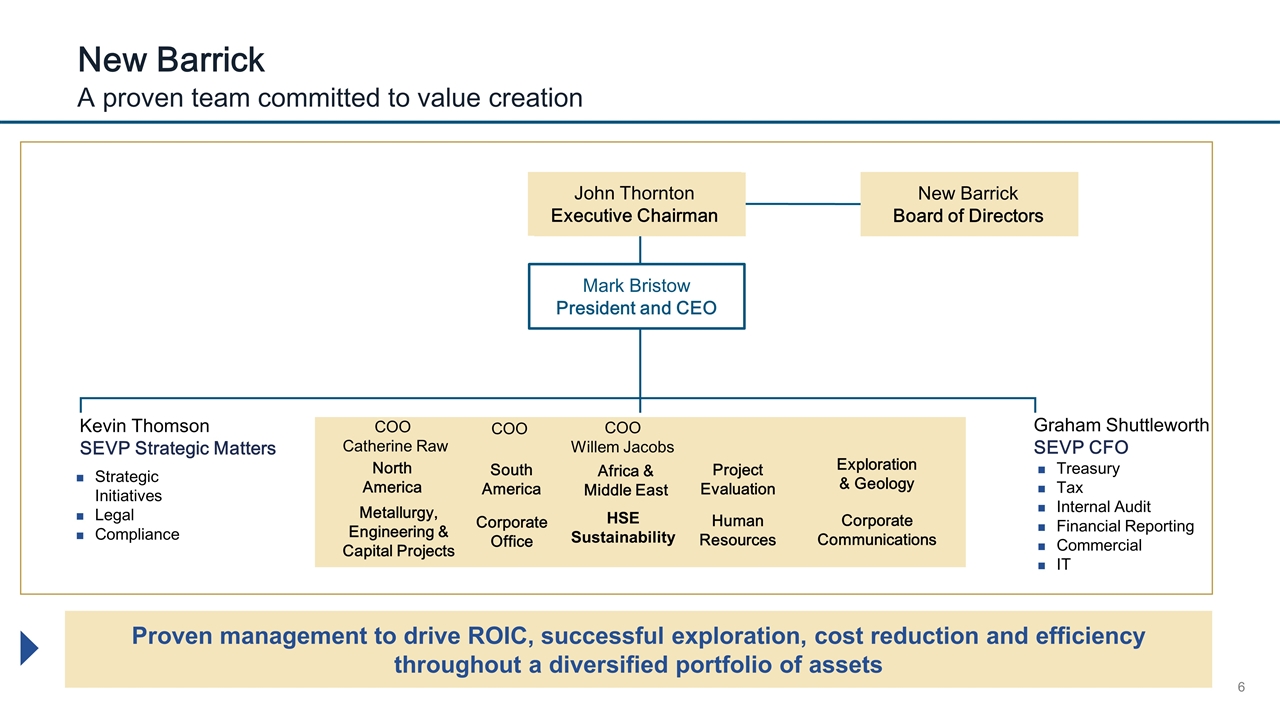
A proven team committed to value creation New Barrick Proven management to drive ROIC, successful exploration, cost reduction and efficiency throughout a diversified portfolio of assets Graham Shuttleworth SEVP CFO Treasury Tax Internal Audit Financial Reporting Commercial IT Kevin Thomson SEVP Strategic Matters North America Africa & Middle East South America Project Evaluation Exploration & Geology Human Resources Metallurgy, Engineering & Capital Projects Corporate Communications Corporate Office Strategic Initiatives Legal Compliance John Thornton Executive Chairman New Barrick Board of Directors Mark Bristow President and CEO COO Catherine Raw COO COO Willem Jacobs HSE Sustainability
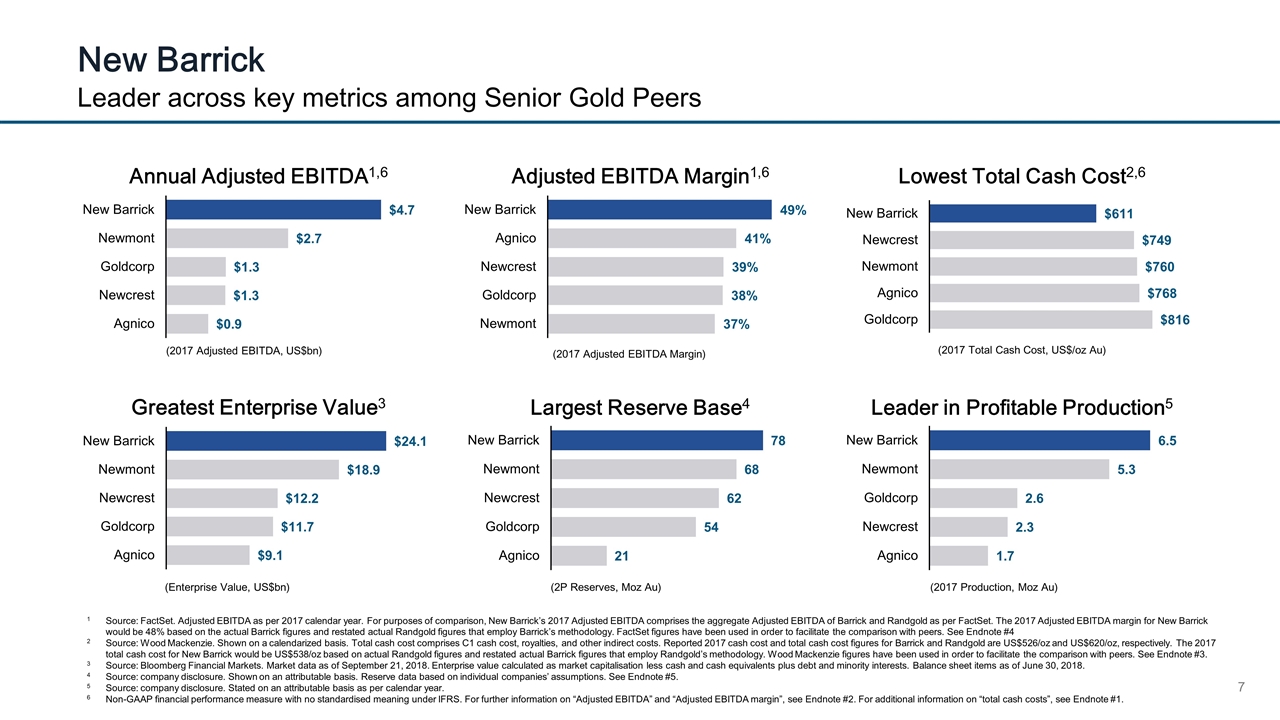
Greatest Enterprise Value3 Leader across key metrics among Senior Gold Peers New Barrick (2017 Production, Moz Au) (2017 Adjusted EBITDA, US$bn) (2017 Adjusted EBITDA Margin) (2017 Total Cash Cost, US$/oz Au) (Enterprise Value, US$bn) (2P Reserves, Moz Au) Annual Adjusted EBITDA1,6 Adjusted EBITDA Margin1,6 Largest Reserve Base4 Lowest Total Cash Cost2,6 Leader in Profitable Production5 1Source: FactSet. Adjusted EBITDA as per 2017 calendar year. For purposes of comparison, New Barrick’s 2017 Adjusted EBITDA comprises the aggregate Adjusted EBITDA of Barrick and Randgold as per FactSet. The 2017 Adjusted EBITDA margin for New Barrick would be 48% based on the actual Barrick figures and restated actual Randgold figures that employ Barrick’s methodology. FactSet figures have been used in order to facilitate the comparison with peers. See Endnote #4 2Source: Wood Mackenzie. Shown on a calendarized basis. Total cash cost comprises C1 cash cost, royalties, and other indirect costs. Reported 2017 cash cost and total cash cost figures for Barrick and Randgold are US$526/oz and US$620/oz, respectively. The 2017 total cash cost for New Barrick would be US$538/oz based on actual Randgold figures and restated actual Barrick figures that employ Randgold’s methodology. Wood Mackenzie figures have been used in order to facilitate the comparison with peers. See Endnote #3. 3Source: Bloomberg Financial Markets. Market data as of September 21, 2018. Enterprise value calculated as market capitalisation less cash and cash equivalents plus debt and minority interests. Balance sheet items as of June 30, 2018. 4Source: company disclosure. Shown on an attributable basis. Reserve data based on individual companies’ assumptions. See Endnote #5. 5 Source: company disclosure. Stated on an attributable basis as per calendar year. 6Non-GAAP financial performance measure with no standardised meaning under IFRS. For further information on “Adjusted EBITDA” and “Adjusted EBITDA margin”, see Endnote #2. For additional information on “total cash costs”, see Endnote #1.
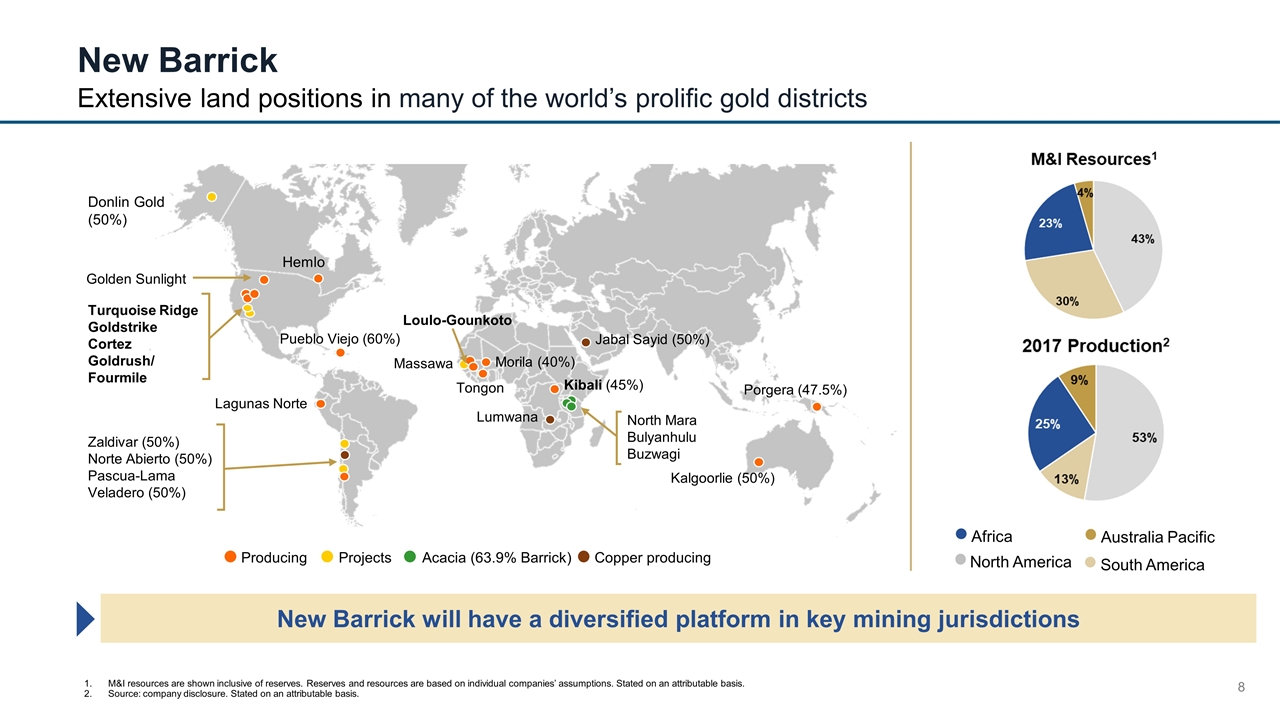
Extensive land positions in many of the world’s prolific gold districts New Barrick Golden Sunlight Turquoise Ridge Goldstrike Cortez Goldrush/ Fourmile Hemlo Pueblo Viejo (60%) Lagunas Norte Massawa Kibali (45%) Kalgoorlie (50%) Porgera (47.5%) Donlin Gold (50%) Jabal Sayid (50%) Producing Projects Acacia (63.9% Barrick) Copper producing New Barrick will have a diversified platform in key mining jurisdictions Zaldivar (50%) Norte Abierto (50%) Pascua-Lama Veladero (50%) Lumwana Loulo-Gounkoto Morila (40%) Tongon North Mara Bulyanhulu Buzwagi North America South America Africa Australia Pacific M&I resources are shown inclusive of reserves. Reserves and resources are based on individual companies’ assumptions. Stated on an attributable basis. Source: company disclosure. Stated on an attributable basis.
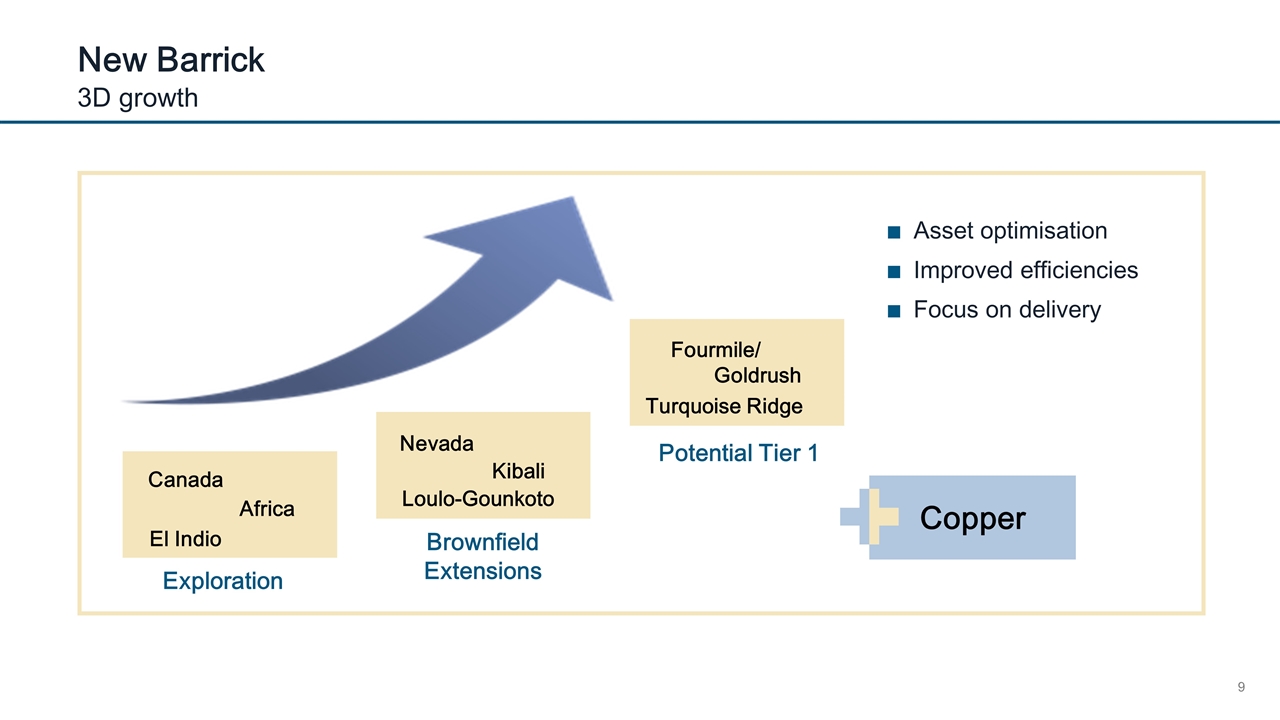
Copper 3D growth New Barrick Fourmile/ Goldrush Turquoise Ridge Nevada Kibali Loulo-Gounkoto Canada Africa El Indio Potential Tier 1 Brownfield Extensions Exploration Asset optimisation Improved efficiencies Focus on delivery
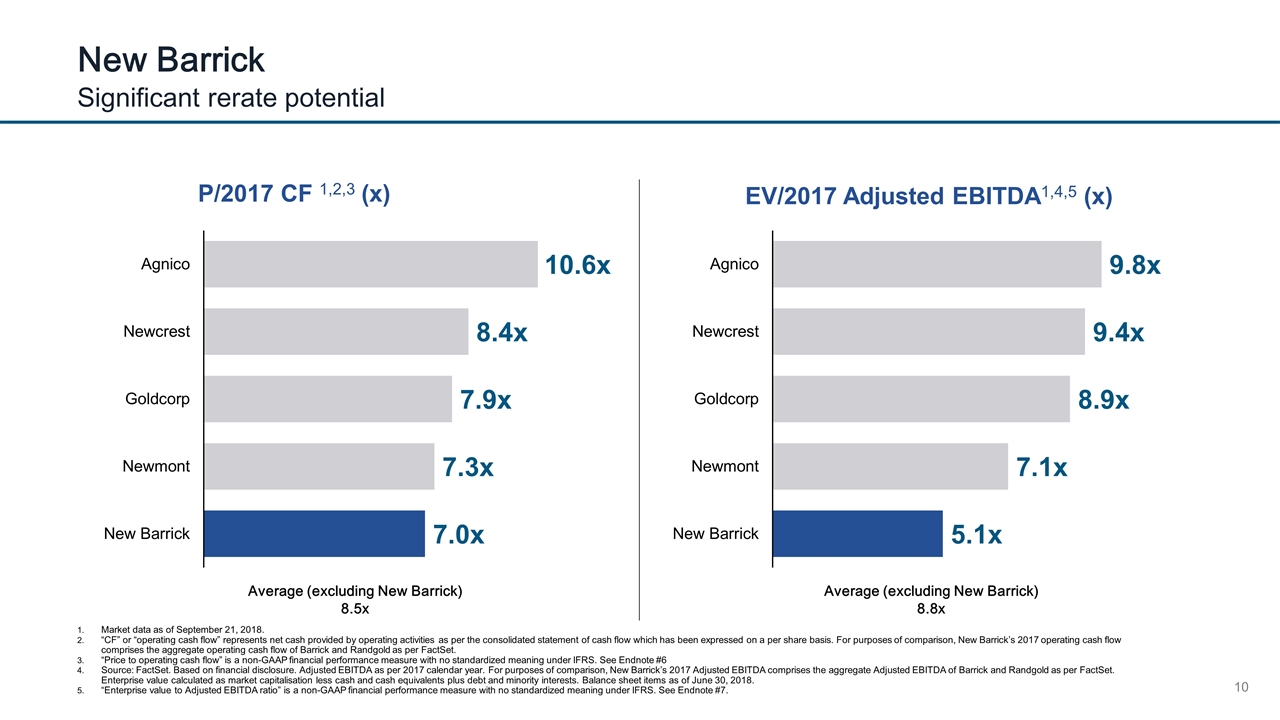
Average (excluding New Barrick) 8.8x Average (excluding New Barrick) 8.5x Significant rerate potential New Barrick Market data as of September 21, 2018. “CF” or “operating cash flow” represents net cash provided by operating activities as per the consolidated statement of cash flow which has been expressed on a per share basis. For purposes of comparison, New Barrick’s 2017 operating cash flow comprises the aggregate operating cash flow of Barrick and Randgold as per FactSet. “Price to operating cash flow” is a non-GAAP financial performance measure with no standardized meaning under IFRS. See Endnote #6 Source: FactSet. Based on financial disclosure. Adjusted EBITDA as per 2017 calendar year. For purposes of comparison, New Barrick’s 2017 Adjusted EBITDA comprises the aggregate Adjusted EBITDA of Barrick and Randgold as per FactSet. Enterprise value calculated as market capitalisation less cash and cash equivalents plus debt and minority interests. Balance sheet items as of June 30, 2018. “Enterprise value to Adjusted EBITDA ratio” is a non-GAAP financial performance measure with no standardized meaning under IFRS. See Endnote #7. P/2017 CF 1,2,3 (x) EV/2017 Adjusted EBITDA1,4,5 (x)
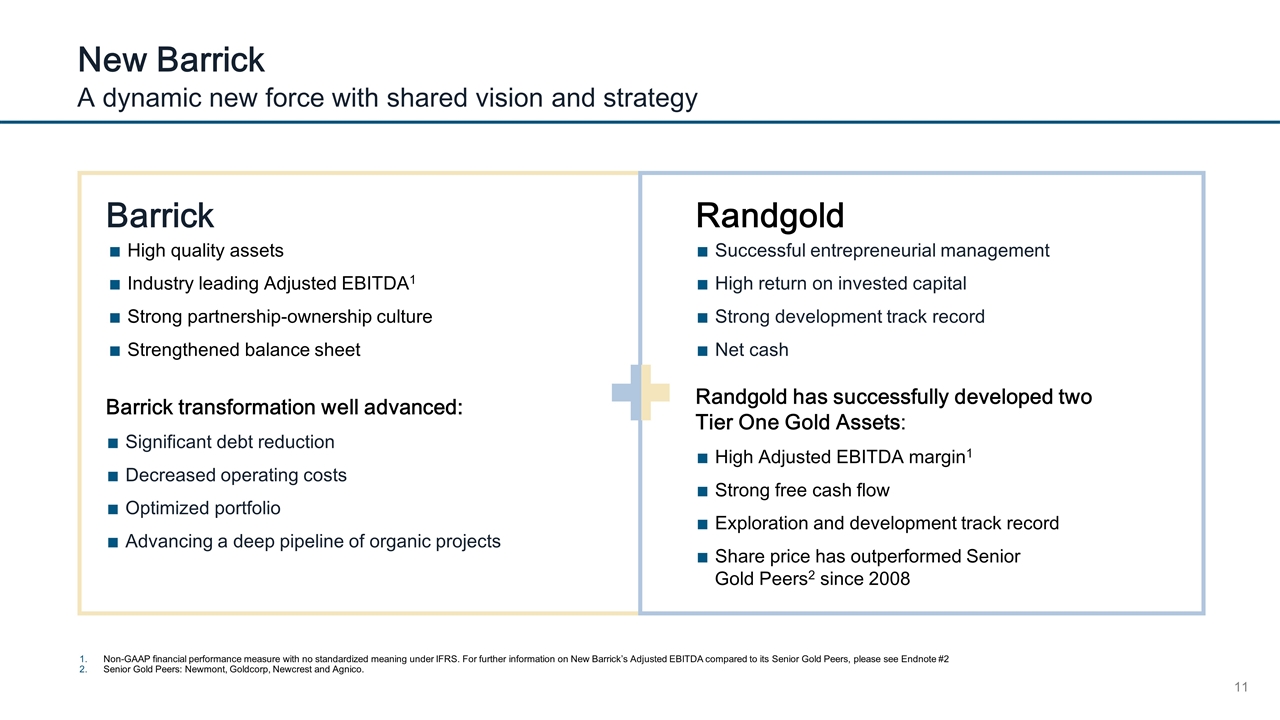
A dynamic new force with shared vision and strategy New Barrick Randgold Barrick transformation well advanced: Significant debt reduction Decreased operating costs Optimized portfolio Advancing a deep pipeline of organic projects Randgold has successfully developed two Tier One Gold Assets: High Adjusted EBITDA margin1 Strong free cash flow Exploration and development track record Share price has outperformed Senior Gold Peers2 since 2008 High quality assets Industry leading Adjusted EBITDA1 Strong partnership-ownership culture Strengthened balance sheet Successful entrepreneurial management High return on invested capital Strong development track record Net cash Barrick Non-GAAP financial performance measure with no standardized meaning under IFRS. For further information on New Barrick’s Adjusted EBITDA compared to its Senior Gold Peers, please see Endnote #2 Senior Gold Peers: Newmont, Goldcorp, Newcrest and Agnico.

Powered by an ambition to deliver sustainable profitability and growth New Barrick New Barrick will seek to leverage the combined strengths of Barrick and Randgold to become the leading gold investment vehicle and deliver long-term value to shareholders Tier One Gold Assets and strategic assets Sell non-core assets Diversified portfolio with extensive land positions in some of the world’s most prolific gold districts Fully implement decentralized management ethos and ownership culture Streamline management and operations to eliminate non-essential costs Leverage innovation and technology to accelerate operational improvement Strive for zero harm workplaces Disciplined approach to growth, leveraging partnership strategy Returns to shareholders driven by ROIC, IRR and FCF per share growth Superior Assets World-Class Management Team Financial Discipline and Investment
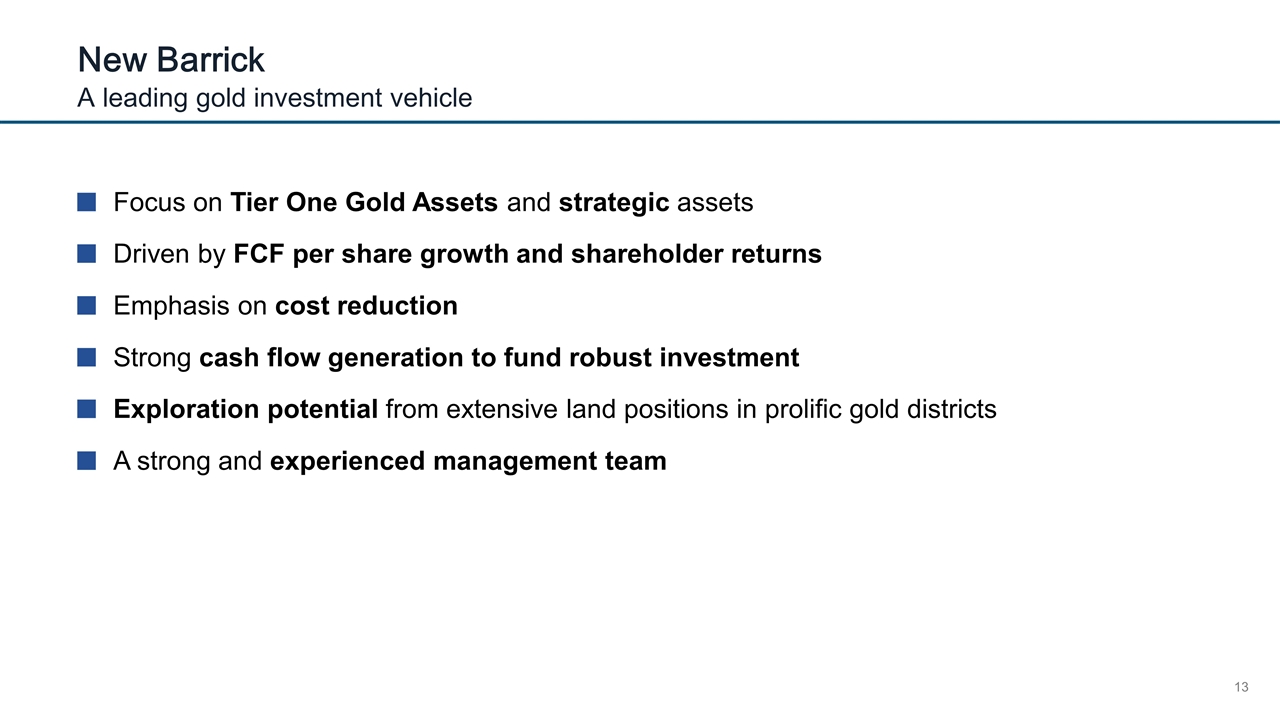
A leading gold investment vehicle New Barrick Focus on Tier One Gold Assets and strategic assets Driven by FCF per share growth and shareholder returns Emphasis on cost reduction Strong cash flow generation to fund robust investment Exploration potential from extensive land positions in prolific gold districts A strong and experienced management team
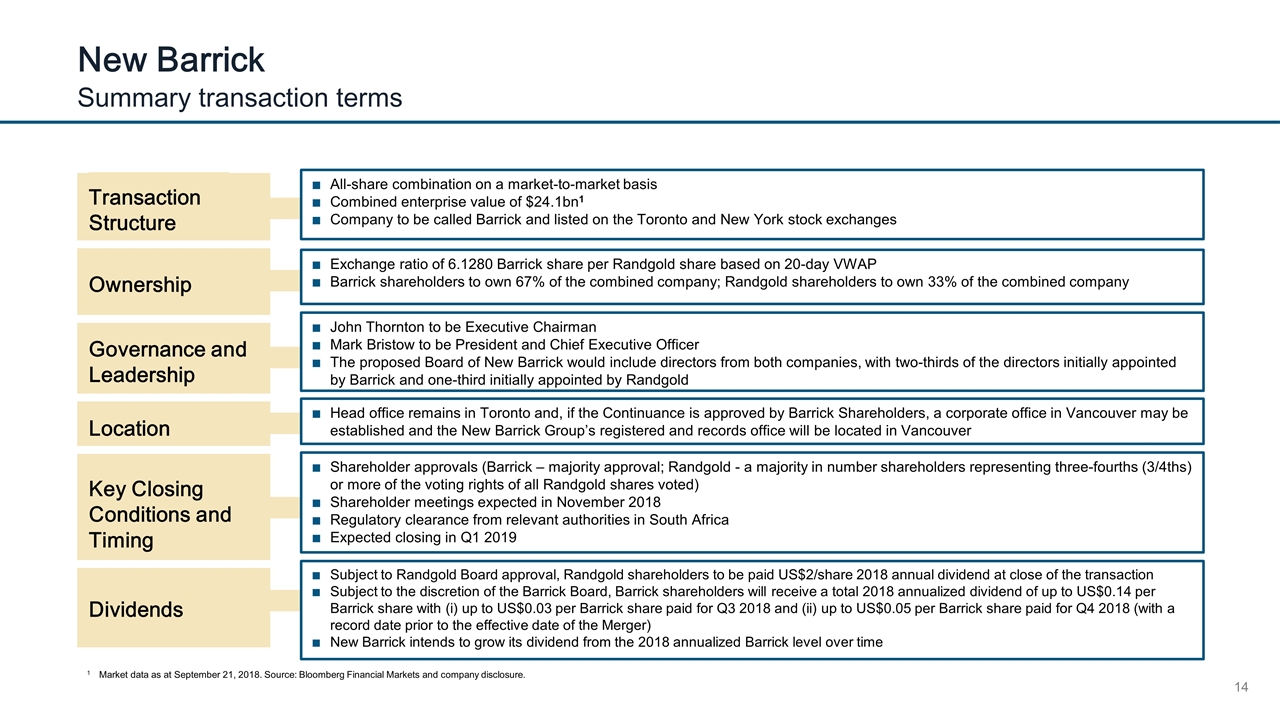
Summary transaction terms New Barrick 1 Market data as at September 21, 2018. Source: Bloomberg Financial Markets and company disclosure. Transaction Structure Ownership Governance and Leadership Location Key Closing Conditions and Timing Dividends All-share combination on a market-to-market basis Combined enterprise value of $24.1bn1 Company to be called Barrick and listed on the Toronto and New York stock exchanges Exchange ratio of 6.1280 Barrick share per Randgold share based on 20-day VWAP Barrick shareholders to own 67% of the combined company; Randgold shareholders to own 33% of the combined company John Thornton to be Executive Chairman Mark Bristow to be President and Chief Executive Officer The proposed Board of New Barrick would include directors from both companies, with two-thirds of the directors initially appointed by Barrick and one-third initially appointed by Randgold Head office remains in Toronto and, if the Continuance is approved by Barrick Shareholders, a corporate office in Vancouver may be established and the New Barrick Group’s registered and records office will be located in Vancouver Shareholder approvals (Barrick – majority approval; Randgold - a majority in number shareholders representing three-fourths (3/4ths) or more of the voting rights of all Randgold shares voted) Shareholder meetings expected in November 2018 Regulatory clearance from relevant authorities in South Africa Expected closing in Q1 2019 Subject to Randgold Board approval, Randgold shareholders to be paid US$2/share 2018 annual dividend at close of the transaction Subject to the discretion of the Barrick Board, Barrick shareholders will receive a total 2018 annualized dividend of up to US$0.14 per Barrick share with (i) up to US$0.03 per Barrick share paid for Q3 2018 and (ii) up to US$0.05 per Barrick share paid for Q4 2018 (with a record date prior to the effective date of the Merger) New Barrick intends to grow its dividend from the 2018 annualized Barrick level over time
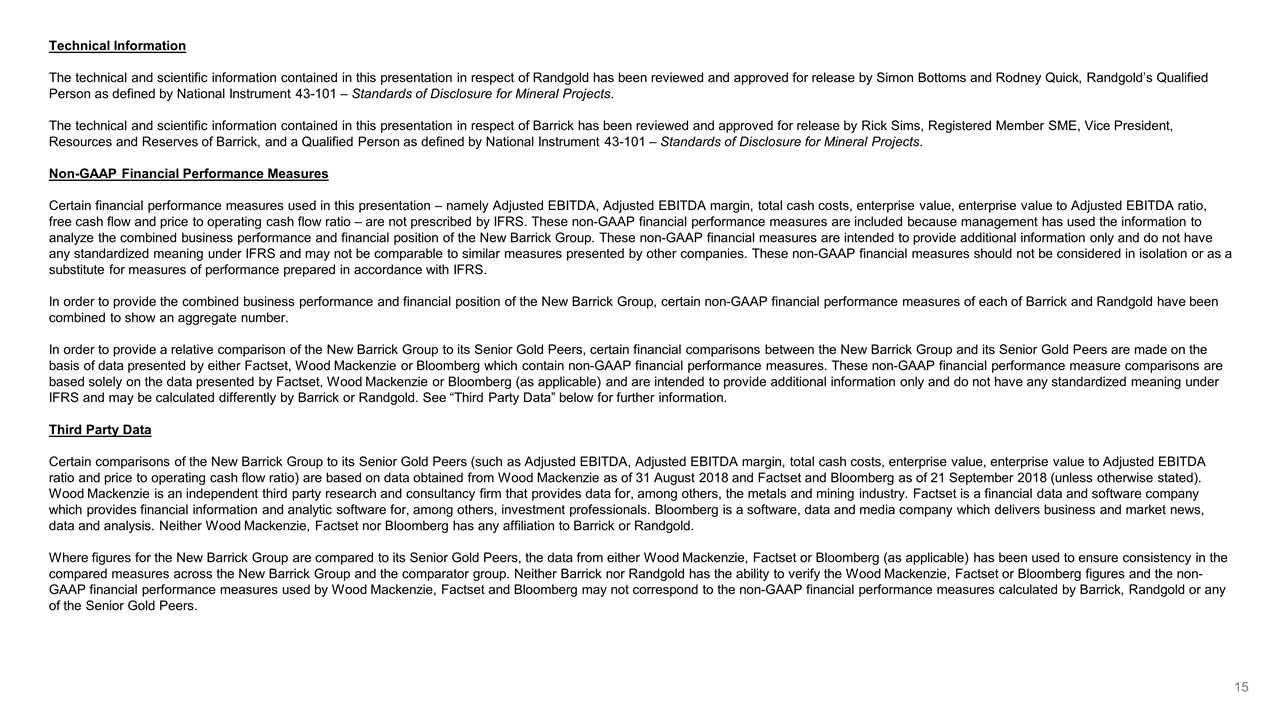
Technical Information The technical and scientific information contained in this presentation in respect of Randgold has been reviewed and approved for release by Simon Bottoms and Rodney Quick, Randgold’s Qualified Person as defined by National Instrument 43-101 – Standards of Disclosure for Mineral Projects. The technical and scientific information contained in this presentation in respect of Barrick has been reviewed and approved for release by Rick Sims, Registered Member SME, Vice President, Resources and Reserves of Barrick, and a Qualified Person as defined by National Instrument 43-101 – Standards of Disclosure for Mineral Projects. Non-GAAP Financial Performance Measures Certain financial performance measures used in this presentation – namely Adjusted EBITDA, Adjusted EBITDA margin, total cash costs, enterprise value, enterprise value to Adjusted EBITDA ratio, free cash flow and price to operating cash flow ratio – are not prescribed by IFRS. These non-GAAP financial performance measures are included because management has used the information to analyze the combined business performance and financial position of the New Barrick Group. These non-GAAP financial measures are intended to provide additional information only and do not have any standardized meaning under IFRS and may not be comparable to similar measures presented by other companies. These non-GAAP financial measures should not be considered in isolation or as a substitute for measures of performance prepared in accordance with IFRS. In order to provide the combined business performance and financial position of the New Barrick Group, certain non-GAAP financial performance measures of each of Barrick and Randgold have been combined to show an aggregate number. In order to provide a relative comparison of the New Barrick Group to its Senior Gold Peers, certain financial comparisons between the New Barrick Group and its Senior Gold Peers are made on the basis of data presented by either Factset, Wood Mackenzie or Bloomberg which contain non-GAAP financial performance measures. These non-GAAP financial performance measure comparisons are based solely on the data presented by Factset, Wood Mackenzie or Bloomberg (as applicable) and are intended to provide additional information only and do not have any standardized meaning under IFRS and may be calculated differently by Barrick or Randgold. See “Third Party Data” below for further information. Third Party Data Certain comparisons of the New Barrick Group to its Senior Gold Peers (such as Adjusted EBITDA, Adjusted EBITDA margin, total cash costs, enterprise value, enterprise value to Adjusted EBITDA ratio and price to operating cash flow ratio) are based on data obtained from Wood Mackenzie as of 31 August 2018 and Factset and Bloomberg as of 21 September 2018 (unless otherwise stated). Wood Mackenzie is an independent third party research and consultancy firm that provides data for, among others, the metals and mining industry. Factset is a financial data and software company which provides financial information and analytic software for, among others, investment professionals. Bloomberg is a software, data and media company which delivers business and market news, data and analysis. Neither Wood Mackenzie, Factset nor Bloomberg has any affiliation to Barrick or Randgold. Where figures for the New Barrick Group are compared to its Senior Gold Peers, the data from either Wood Mackenzie, Factset or Bloomberg (as applicable) has been used to ensure consistency in the compared measures across the New Barrick Group and the comparator group. Neither Barrick nor Randgold has the ability to verify the Wood Mackenzie, Factset or Bloomberg figures and the non-GAAP financial performance measures used by Wood Mackenzie, Factset and Bloomberg may not correspond to the non-GAAP financial performance measures calculated by Barrick, Randgold or any of the Senior Gold Peers.
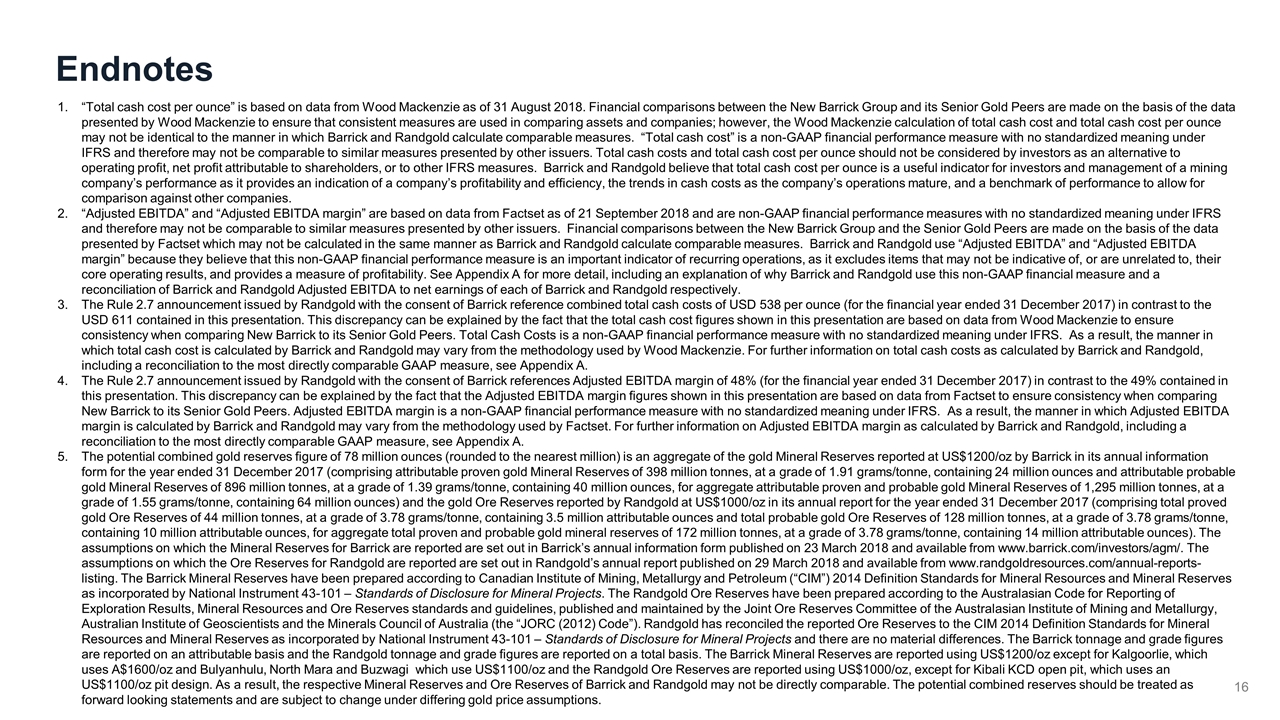
Endnotes “Total cash cost per ounce” is based on data from Wood Mackenzie as of 31 August 2018. Financial comparisons between the New Barrick Group and its Senior Gold Peers are made on the basis of the data presented by Wood Mackenzie to ensure that consistent measures are used in comparing assets and companies; however, the Wood Mackenzie calculation of total cash cost and total cash cost per ounce may not be identical to the manner in which Barrick and Randgold calculate comparable measures. “Total cash cost” is a non-GAAP financial performance measure with no standardized meaning under IFRS and therefore may not be comparable to similar measures presented by other issuers. Total cash costs and total cash cost per ounce should not be considered by investors as an alternative to operating profit, net profit attributable to shareholders, or to other IFRS measures. Barrick and Randgold believe that total cash cost per ounce is a useful indicator for investors and management of a mining company’s performance as it provides an indication of a company’s profitability and efficiency, the trends in cash costs as the company’s operations mature, and a benchmark of performance to allow for comparison against other companies. “Adjusted EBITDA” and “Adjusted EBITDA margin” are based on data from Factset as of 21 September 2018 and are non-GAAP financial performance measures with no standardized meaning under IFRS and therefore may not be comparable to similar measures presented by other issuers. Financial comparisons between the New Barrick Group and the Senior Gold Peers are made on the basis of the data presented by Factset which may not be calculated in the same manner as Barrick and Randgold calculate comparable measures. Barrick and Randgold use “Adjusted EBITDA” and “Adjusted EBITDA margin” because they believe that this non-GAAP financial performance measure is an important indicator of recurring operations, as it excludes items that may not be indicative of, or are unrelated to, their core operating results, and provides a measure of profitability. See Appendix A for more detail, including an explanation of why Barrick and Randgold use this non-GAAP financial measure and a reconciliation of Barrick and Randgold Adjusted EBITDA to net earnings of each of Barrick and Randgold respectively. The Rule 2.7 announcement issued by Randgold with the consent of Barrick reference combined total cash costs of USD 538 per ounce (for the financial year ended 31 December 2017) in contrast to the USD 611 contained in this presentation. This discrepancy can be explained by the fact that the total cash cost figures shown in this presentation are based on data from Wood Mackenzie to ensure consistency when comparing New Barrick to its Senior Gold Peers. Total Cash Costs is a non-GAAP financial performance measure with no standardized meaning under IFRS. As a result, the manner in which total cash cost is calculated by Barrick and Randgold may vary from the methodology used by Wood Mackenzie. For further information on total cash costs as calculated by Barrick and Randgold, including a reconciliation to the most directly comparable GAAP measure, see Appendix A. The Rule 2.7 announcement issued by Randgold with the consent of Barrick references Adjusted EBITDA margin of 48% (for the financial year ended 31 December 2017) in contrast to the 49% contained in this presentation. This discrepancy can be explained by the fact that the Adjusted EBITDA margin figures shown in this presentation are based on data from Factset to ensure consistency when comparing New Barrick to its Senior Gold Peers. Adjusted EBITDA margin is a non-GAAP financial performance measure with no standardized meaning under IFRS. As a result, the manner in which Adjusted EBITDA margin is calculated by Barrick and Randgold may vary from the methodology used by Factset. For further information on Adjusted EBITDA margin as calculated by Barrick and Randgold, including a reconciliation to the most directly comparable GAAP measure, see Appendix A. The potential combined gold reserves figure of 78 million ounces (rounded to the nearest million) is an aggregate of the gold Mineral Reserves reported at US$1200/oz by Barrick in its annual information form for the year ended 31 December 2017 (comprising attributable proven gold Mineral Reserves of 398 million tonnes, at a grade of 1.91 grams/tonne, containing 24 million ounces and attributable probable gold Mineral Reserves of 896 million tonnes, at a grade of 1.39 grams/tonne, containing 40 million ounces, for aggregate attributable proven and probable gold Mineral Reserves of 1,295 million tonnes, at a grade of 1.55 grams/tonne, containing 64 million ounces) and the gold Ore Reserves reported by Randgold at US$1000/oz in its annual report for the year ended 31 December 2017 (comprising total proved gold Ore Reserves of 44 million tonnes, at a grade of 3.78 grams/tonne, containing 3.5 million attributable ounces and total probable gold Ore Reserves of 128 million tonnes, at a grade of 3.78 grams/tonne, containing 10 million attributable ounces, for aggregate total proven and probable gold mineral reserves of 172 million tonnes, at a grade of 3.78 grams/tonne, containing 14 million attributable ounces). The assumptions on which the Mineral Reserves for Barrick are reported are set out in Barrick’s annual information form published on 23 March 2018 and available from www.barrick.com/investors/agm/. The assumptions on which the Ore Reserves for Randgold are reported are set out in Randgold’s annual report published on 29 March 2018 and available from www.randgoldresources.com/annual-reports-listing. The Barrick Mineral Reserves have been prepared according to Canadian Institute of Mining, Metallurgy and Petroleum (“CIM”) 2014 Definition Standards for Mineral Resources and Mineral Reserves as incorporated by National Instrument 43-101 – Standards of Disclosure for Mineral Projects. The Randgold Ore Reserves have been prepared according to the Australasian Code for Reporting of Exploration Results, Mineral Resources and Ore Reserves standards and guidelines, published and maintained by the Joint Ore Reserves Committee of the Australasian Institute of Mining and Metallurgy, Australian Institute of Geoscientists and the Minerals Council of Australia (the “JORC (2012) Code”). Randgold has reconciled the reported Ore Reserves to the CIM 2014 Definition Standards for Mineral Resources and Mineral Reserves as incorporated by National Instrument 43-101 – Standards of Disclosure for Mineral Projects and there are no material differences. The Barrick tonnage and grade figures are reported on an attributable basis and the Randgold tonnage and grade figures are reported on a total basis. The Barrick Mineral Reserves are reported using US$1200/oz except for Kalgoorlie, which uses A$1600/oz and Bulyanhulu, North Mara and Buzwagi which use US$1100/oz and the Randgold Ore Reserves are reported using US$1000/oz, except for Kibali KCD open pit, which uses an US$1100/oz pit design. As a result, the respective Mineral Reserves and Ore Reserves of Barrick and Randgold may not be directly comparable. The potential combined reserves should be treated as forward looking statements and are subject to change under differing gold price assumptions.
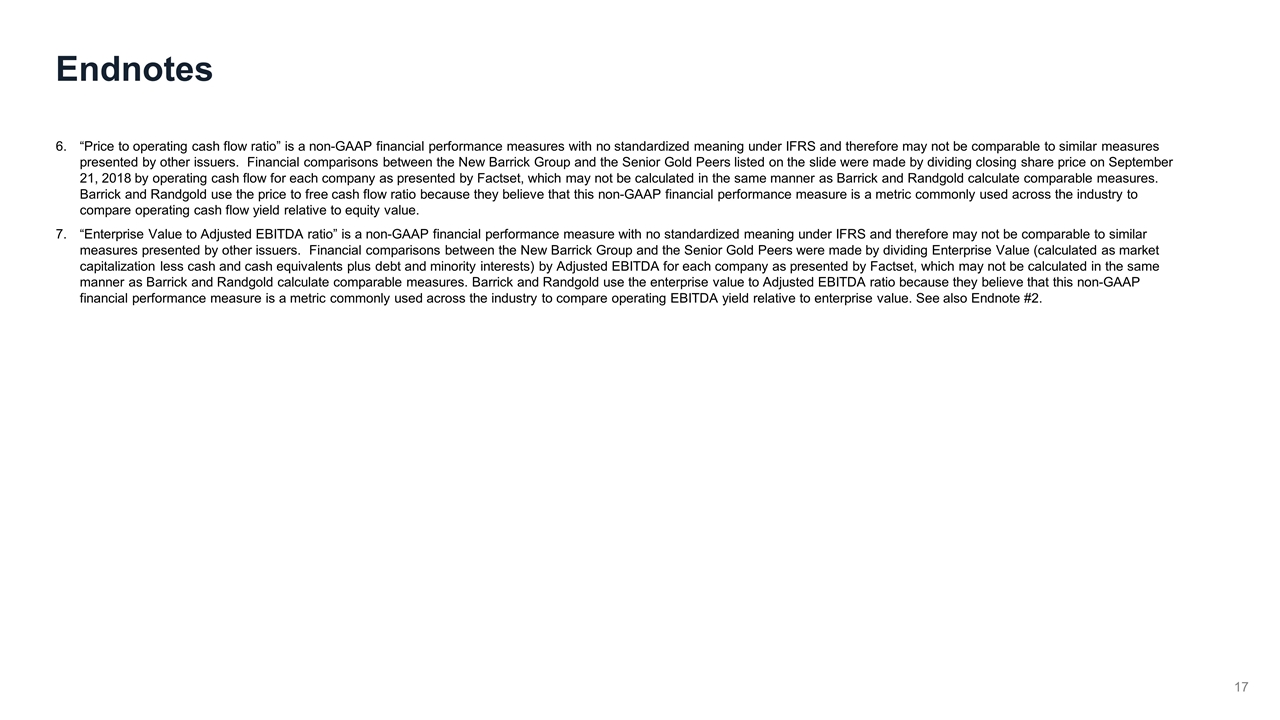
“Price to operating cash flow ratio” is a non-GAAP financial performance measures with no standardized meaning under IFRS and therefore may not be comparable to similar measures presented by other issuers. Financial comparisons between the New Barrick Group and the Senior Gold Peers listed on the slide were made by dividing closing share price on September 21, 2018 by operating cash flow for each company as presented by Factset, which may not be calculated in the same manner as Barrick and Randgold calculate comparable measures. Barrick and Randgold use the price to free cash flow ratio because they believe that this non-GAAP financial performance measure is a metric commonly used across the industry to compare operating cash flow yield relative to equity value. “Enterprise Value to Adjusted EBITDA ratio” is a non-GAAP financial performance measure with no standardized meaning under IFRS and therefore may not be comparable to similar measures presented by other issuers. Financial comparisons between the New Barrick Group and the Senior Gold Peers were made by dividing Enterprise Value (calculated as market capitalization less cash and cash equivalents plus debt and minority interests) by Adjusted EBITDA for each company as presented by Factset, which may not be calculated in the same manner as Barrick and Randgold calculate comparable measures. Barrick and Randgold use the enterprise value to Adjusted EBITDA ratio because they believe that this non-GAAP financial performance measure is a metric commonly used across the industry to compare operating EBITDA yield relative to enterprise value. See also Endnote #2. Endnotes
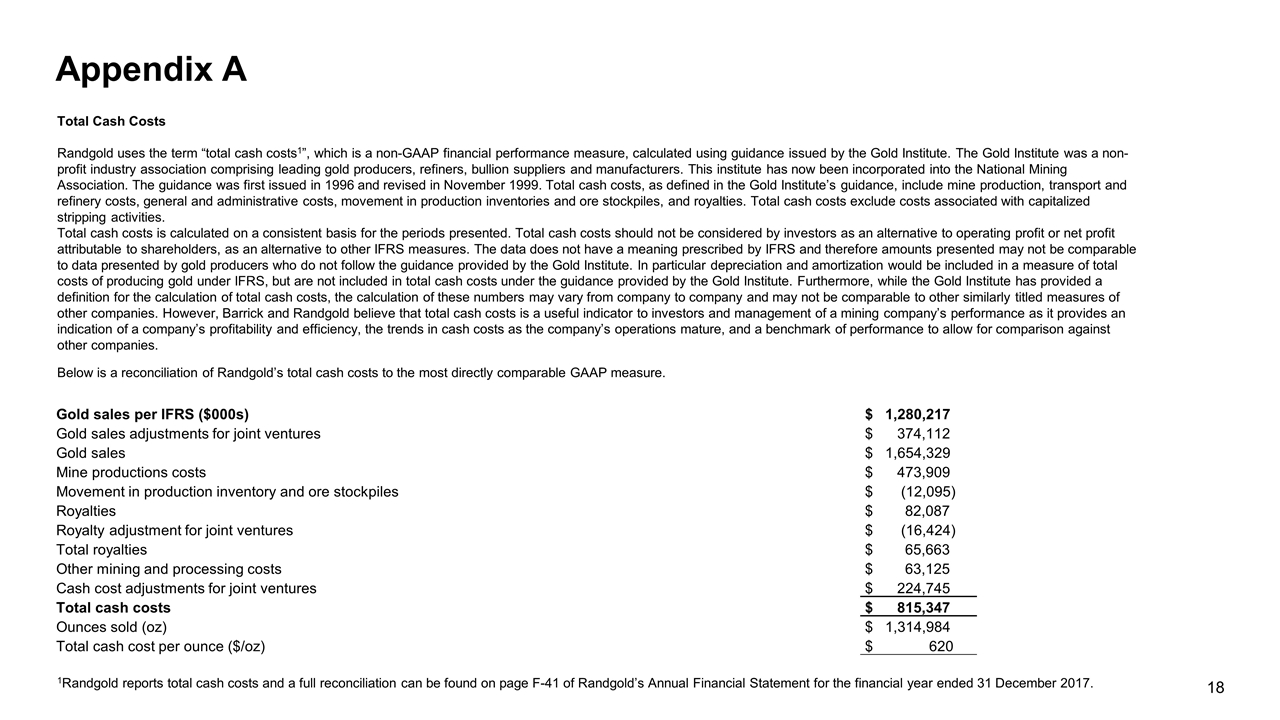
Total Cash Costs Randgold uses the term “total cash costs1”, which is a non-GAAP financial performance measure, calculated using guidance issued by the Gold Institute. The Gold Institute was a non-profit industry association comprising leading gold producers, refiners, bullion suppliers and manufacturers. This institute has now been incorporated into the National Mining Association. The guidance was first issued in 1996 and revised in November 1999. Total cash costs, as defined in the Gold Institute’s guidance, include mine production, transport and refinery costs, general and administrative costs, movement in production inventories and ore stockpiles, and royalties. Total cash costs exclude costs associated with capitalized stripping activities. Total cash costs is calculated on a consistent basis for the periods presented. Total cash costs should not be considered by investors as an alternative to operating profit or net profit attributable to shareholders, as an alternative to other IFRS measures. The data does not have a meaning prescribed by IFRS and therefore amounts presented may not be comparable to data presented by gold producers who do not follow the guidance provided by the Gold Institute. In particular depreciation and amortization would be included in a measure of total costs of producing gold under IFRS, but are not included in total cash costs under the guidance provided by the Gold Institute. Furthermore, while the Gold Institute has provided a definition for the calculation of total cash costs, the calculation of these numbers may vary from company to company and may not be comparable to other similarly titled measures of other companies. However, Barrick and Randgold believe that total cash costs is a useful indicator to investors and management of a mining company’s performance as it provides an indication of a company’s profitability and efficiency, the trends in cash costs as the company’s operations mature, and a benchmark of performance to allow for comparison against other companies. Appendix A Below is a reconciliation of Randgold’s total cash costs to the most directly comparable GAAP measure. Gold sales per IFRS ($000s) $ 1,280,217 Gold sales adjustments for joint ventures $ 374,112 Gold sales $ 1,654,329 Mine productions costs $ 473,909 Movement in production inventory and ore stockpiles $ (12,095) Royalties $ 82,087 Royalty adjustment for joint ventures $ (16,424) Total royalties $ 65,663 Other mining and processing costs $ 63,125 Cash cost adjustments for joint ventures $ 224,745 Total cash costs $ 815,347 Ounces sold (oz) $ 1,314,984 Total cash cost per ounce ($/oz) $ 620 1Randgold reports total cash costs and a full reconciliation can be found on page F-41 of Randgold’s Annual Financial Statement for the financial year ended 31 December 2017.
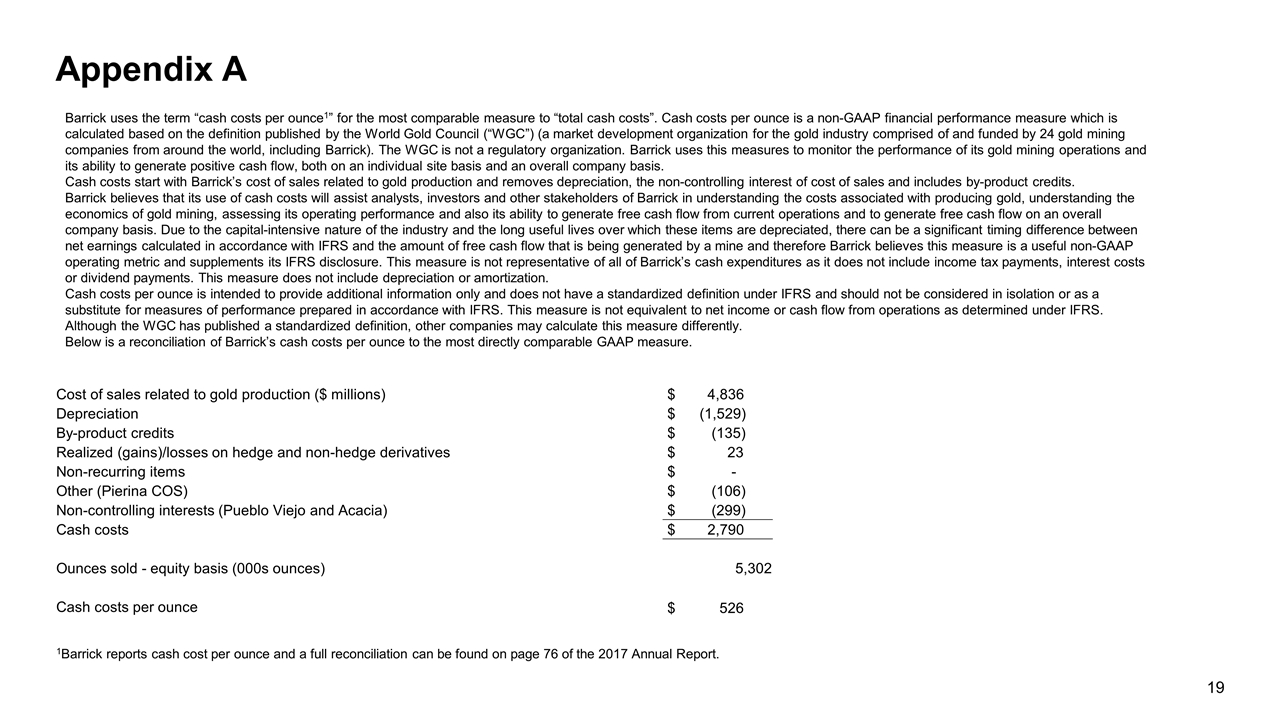
Barrick uses the term “cash costs per ounce1” for the most comparable measure to “total cash costs”. Cash costs per ounce is a non-GAAP financial performance measure which is calculated based on the definition published by the World Gold Council (“WGC”) (a market development organization for the gold industry comprised of and funded by 24 gold mining companies from around the world, including Barrick). The WGC is not a regulatory organization. Barrick uses this measures to monitor the performance of its gold mining operations and its ability to generate positive cash flow, both on an individual site basis and an overall company basis. Cash costs start with Barrick’s cost of sales related to gold production and removes depreciation, the non-controlling interest of cost of sales and includes by-product credits. Barrick believes that its use of cash costs will assist analysts, investors and other stakeholders of Barrick in understanding the costs associated with producing gold, understanding the economics of gold mining, assessing its operating performance and also its ability to generate free cash flow from current operations and to generate free cash flow on an overall company basis. Due to the capital-intensive nature of the industry and the long useful lives over which these items are depreciated, there can be a significant timing difference between net earnings calculated in accordance with IFRS and the amount of free cash flow that is being generated by a mine and therefore Barrick believes this measure is a useful non-GAAP operating metric and supplements its IFRS disclosure. This measure is not representative of all of Barrick’s cash expenditures as it does not include income tax payments, interest costs or dividend payments. This measure does not include depreciation or amortization. Cash costs per ounce is intended to provide additional information only and does not have a standardized definition under IFRS and should not be considered in isolation or as a substitute for measures of performance prepared in accordance with IFRS. This measure is not equivalent to net income or cash flow from operations as determined under IFRS. Although the WGC has published a standardized definition, other companies may calculate this measure differently. Below is a reconciliation of Barrick’s cash costs per ounce to the most directly comparable GAAP measure. Cost of sales related to gold production ($ millions) $ 4,836 Depreciation $ (1,529) By-product credits $ (135) Realized (gains)/losses on hedge and non-hedge derivatives $ 23 Non-recurring items $ - Other (Pierina COS) $ (106) Non-controlling interests (Pueblo Viejo and Acacia) $ (299) Cash costs $ 2,790 Ounces sold - equity basis (000s ounces) 5,302 Cash costs per ounce $ 526 Appendix A 1Barrick reports cash cost per ounce and a full reconciliation can be found on page 76 of the 2017 Annual Report.
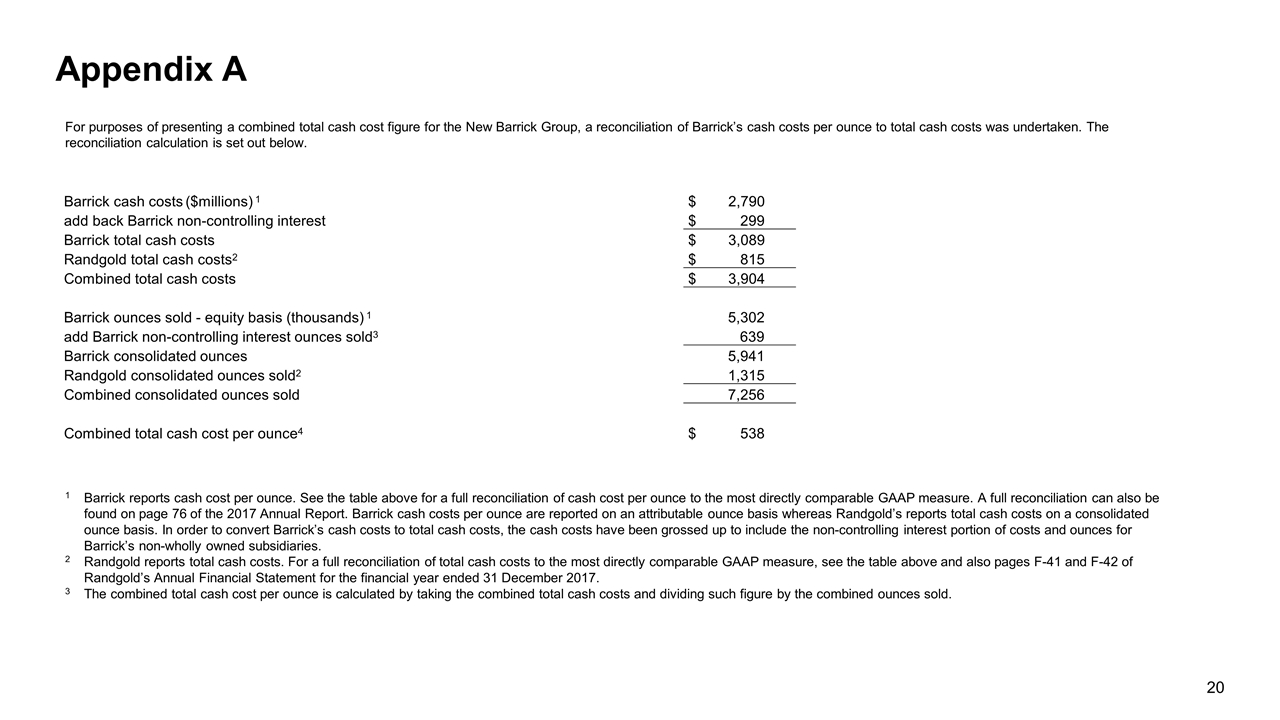
For purposes of presenting a combined total cash cost figure for the New Barrick Group, a reconciliation of Barrick’s cash costs per ounce to total cash costs was undertaken. The reconciliation calculation is set out below. Barrick cash costs ($millions) 1 $ 2,790 add back Barrick non-controlling interest $ 299 Barrick total cash costs $ 3,089 Randgold total cash costs2 $ 815 Combined total cash costs $ 3,904 Barrick ounces sold - equity basis (thousands) 1 5,302 add Barrick non-controlling interest ounces sold3 639 Barrick consolidated ounces 5,941 Randgold consolidated ounces sold2 1,315 Combined consolidated ounces sold 7,256 Combined total cash cost per ounce4 $ 538 Appendix A 1 Barrick reports cash cost per ounce. See the table above for a full reconciliation of cash cost per ounce to the most directly comparable GAAP measure. A full reconciliation can also be found on page 76 of the 2017 Annual Report. Barrick cash costs per ounce are reported on an attributable ounce basis whereas Randgold’s reports total cash costs on a consolidated ounce basis. In order to convert Barrick’s cash costs to total cash costs, the cash costs have been grossed up to include the non-controlling interest portion of costs and ounces for Barrick’s non-wholly owned subsidiaries. 2 Randgold reports total cash costs. For a full reconciliation of total cash costs to the most directly comparable GAAP measure, see the table above and also pages F-41 and F-42 of Randgold’s Annual Financial Statement for the financial year ended 31 December 2017. 3 The combined total cash cost per ounce is calculated by taking the combined total cash costs and dividing such figure by the combined ounces sold.

Adjusted EBITDA “EBITDA” is a non-GAAP financial performance measure, which excludes the following from net earnings: (i) income tax expense; (ii) finance costs; (iii) finance income; and (iv) depreciation. Barrick and Randgold believe that EBITDA is a valuable indicator of their ability to generate liquidity by producing operating cash flow to fund working capital needs, service debt obligations, and fund capital expenditures. Barrick and Randgold use EBITDA for this purpose. EBITDA is also frequently used by investors and analysts for valuation purposes whereby EBITDA is multiplied by a factor or “EBITDA multiple” that is based on an observed or inferred relationship between EBITDA and market values to determine the approximate total enterprise value of a company. Barrick also reports “Adjusted EBITDA” which removes the effect of impairment charges; acquisition/disposition gains/losses; foreign currency translation gains/losses; other expense adjustments; and unrealized gains on non-hedge derivative instruments. Barrick believes these items provide a greater level of consistency with the adjusting items included in Barrick’s Adjusted Net Earnings reconciliation, with the exception that these amounts are adjusted to remove any impact on finance costs/income, income tax expense and/or depreciation as they do not affect EBITDA. Barrick and Randgold believe this additional information will assist analysts, investors and other stakeholders in better understanding the New Barrick Group’s ability to generate liquidity from operating cash flow, by excluding these amounts from the calculation as they are not indicative of the performance of its core mining business and not necessarily reflective of the underlying operating results for the periods presented. EBITDA and Adjusted EBITDA are intended to provide additional information to investors and analysts and do not have any standardized definition under IFRS and should not be considered in isolation or as a substitute for measures of performance prepared in accordance with IFRS. EBITDA and Adjusted EBITDA exclude the impact of cash costs of financing activities and taxes, and the effects of changes in operating working capital balances, and therefore is not necessarily indicative of operating profit or cash flow from operations as determined under IFRS. Other companies may calculate EBITDA and Adjusted EBITDA differently. Below is a reconciliation of Barrick’s and Randgold’s Adjusted EBITDA to the most directly comparable GAAP measure. 1 Barrick EBITDA and Adjusted EBITDA figures can be found on page 82 of the MD&A accompanying the Barrick financial statements for the year ended 31 December 2017. 2 Randgold EBITDA and Adjusted EBITDA figures are calculated using figures from the Consolidated Statement of Comprehensive Income on page F-10 and note 20 on page F-41 of Randgold’s Annual Financial Statement for the financial year ended 31 December 2017. The Randgold foreign currency translation gain is set out on page 3 of the Randgold report for the fourth quarter and year ended 31 December 2017. Appendix A For the year ended 31 December 2017 ($ millions) Barrick1 Randgold2 Combined Net earnings (loss) $ 1,516 $ 335 $ 1,851 Income tax expense 1,231 146 1,377 Finance costs, net 624 (3) 621 Depreciation 1,647 183 1,830 EBITDA $ 5,018 $ 661 $ 5,679 Impairment charges (reversals) of long-lived assets (212) - (212) Acquisition/disposition (gains)/losses (911) - (911) Foreign currency translation (gains)/losses 72 (10) 62 Other expense adjustments 51 - 51 Unrealized gains on non-hedge derivative instruments (1) - (1) Adjusted EBITDA $ 4,017 $ 651 $ 4,668
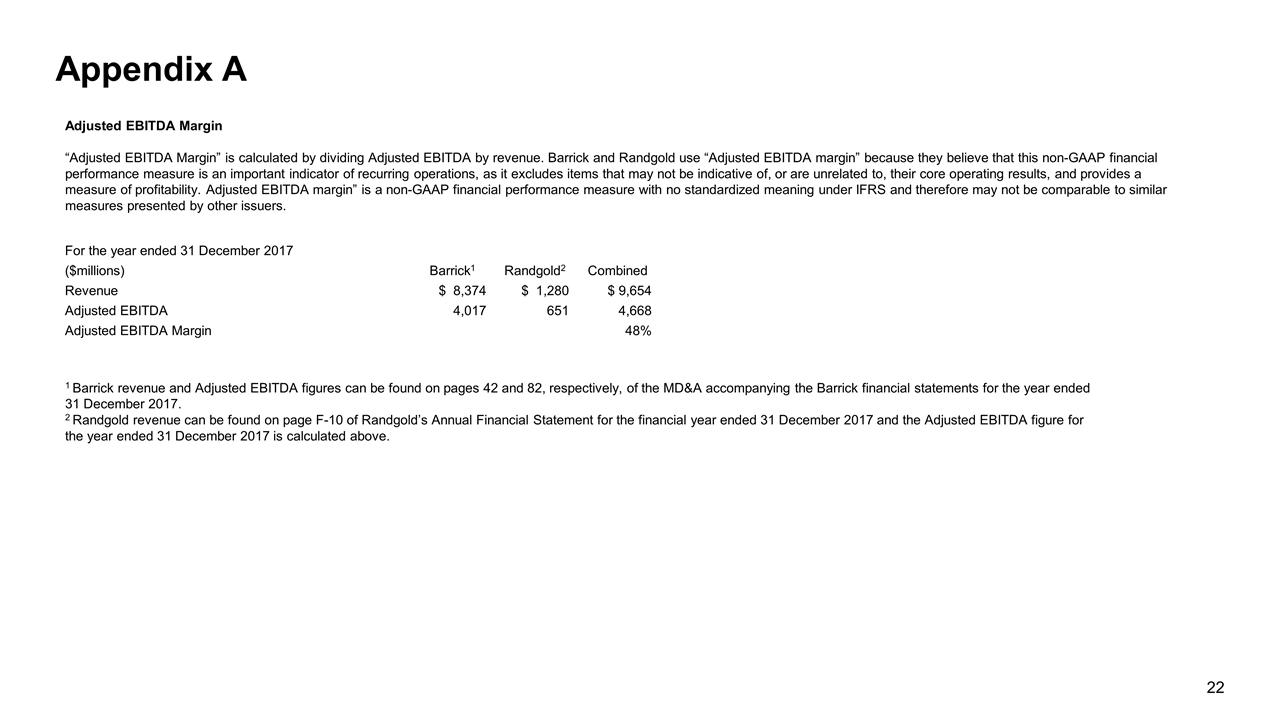
Appendix A Adjusted EBITDA Margin “Adjusted EBITDA Margin” is calculated by dividing Adjusted EBITDA by revenue. Barrick and Randgold use “Adjusted EBITDA margin” because they believe that this non-GAAP financial performance measure is an important indicator of recurring operations, as it excludes items that may not be indicative of, or are unrelated to, their core operating results, and provides a measure of profitability. Adjusted EBITDA margin” is a non-GAAP financial performance measure with no standardized meaning under IFRS and therefore may not be comparable to similar measures presented by other issuers. For the year ended 31 December 2017 ($millions) Barrick1 Randgold2 Combined Revenue $ 8,374 $ 1,280 $ 9,654 Adjusted EBITDA 4,017 651 4,668 Adjusted EBITDA Margin 48% 1 Barrick revenue and Adjusted EBITDA figures can be found on pages 42 and 82, respectively, of the MD&A accompanying the Barrick financial statements for the year ended 31 December 2017. 2 Randgold revenue can be found on page F-10 of Randgold’s Annual Financial Statement for the financial year ended 31 December 2017 and the Adjusted EBITDA figure for the year ended 31 December 2017 is calculated above.


