Exhibit 99.2

Technical Report on the Loulo-Gounkoto
Gold Mine Complex, Mali
Report for NI43-101
Randgold Resources Limited
| | |
| | 3rdFloor Unity Chambers 28 Halkett Street |

| | St Helier Jersey OJE2 |
|
| |
| | 18thSeptember 2018 |
| |
| | Effective Date: 31stDecember 2017 |
Qualified Persons:
Mr. Rodney B. Quick MSc, Pr. Sci.Nat
Mr. Simon P. Bottoms, CGeol, MGeol, FGS, MAusIMM
Mr. Richard Quarmby, BSc, Pr Eng & C Eng, MSAIChE, MIoMMM, MBA
Mr. Derek Holm, BSc, FSAIMM
Mr. Graham E. Trusler, MSc, Pr Eng, MSAIChE
| | | | |
 | | Loulo-Gounkoto Gold Mine Complex NI 43-101 Technical Report | |  |
Table of Contents
| | | | | | | | |
1 | | Executive Summary | | | 1 | |
| | | |
| | 1.1 | | Property Description and Location | | | 1 | |
| | | |
| | 1.2 | | Mineral Rights and Land Ownership | | | 2 | |
| | | |
| | 1.3 | | History | | | 3 | |
| | | |
| | 1.4 | | Geology and Mineralisation | | | 4 | |
| | | |
| | 1.5 | | Exploration | | | 6 | |
| | | |
| | 1.6 | | Mineral Resources | | | 7 | |
| | | |
| | 1.7 | | Ore Reserves | | | 9 | |
| | | |
| | 1.8 | | Mining Method | | | 11 | |
| | | |
| | 1.9 | | Mineral Processing | | | 14 | |
| | | |
| | 1.10 | | Project Infrastructure | | | 16 | |
| | | |
| | 1.11 | | Market Studies | | | 17 | |
| | | |
| | 1.12 | | Environmental, Permitting and Social Considerations | | | 18 | |
| | | |
| | 1.13 | | Capital Costs | | | 19 | |
| | | |
| | 1.14 | | Operating Costs | | | 20 | |
| | | |
| | 1.15 | | Economic Analysis | | | 20 | |
| | | |
| | 1.16 | | Interpretation and Conclusions | | | 21 | |
| | | |
| | 1.17 | | Risks | | | 24 | |
| | | |
| | 1.18 | | Recommendations | | | 29 | |
| | |
2 | | Introduction | | | 30 | |
| | | |
| | 2.1 | | Introduction | | | 30 | |
| | | |
| | 2.2 | | Effective Date | | | 30 | |
| | | |
| | 2.3 | | Sources of Information | | | 31 | |
| | | |
| | 2.4 | | List of Abbreviations | | | 32 | |
| | | |
| | 2.5 | | Units | | | 34 | |
| | |
3 | | Reliance on Other Experts | | | 35 | |
| | |
4 | | Property Description and Location | | | 36 | |
| | | |
| | 4.1 | | Project Location | | | 36 | |
| | | |
| | 4.2 | | Mineral Rights and Land Ownership | | | 38 | |
| | | |
| | 4.3 | | Surface Rights | | | 40 | |
| | | |
| | 4.4 | | Ownership, Royalties and Lease Obligations | | | 41 | |
| | |
5 | | Accessibility, Climate, Local Resources, Infrastructure and Physiography | | | 42 | |
| | | |
| | 5.1 | | Accessibility | | | 42 | |
| | | |
| | 5.2 | | Climate | | | 42 | |
| | | |
| | 5.3 | | Physiography | | | 43 | |
| | |
| 18th September 2018 | | Page ii |
| | | | |
| | Loulo-Gounkoto Gold Mine Complex NI 43-101 Technical Report | | |
| | | | | | | | |
| | 5.4 | | Local Resources | | | 43 | |
| | | |
| | 5.5 | | Infrastructure | | | 44 | |
| | |
6 | | History | | | 47 | |
| | | |
| | 6.1 | | Historical Exploration and Development | | | 47 | |
| | | |
| | 6.2 | | Randgold Project Milestones and Development | | | 48 | |
| | | |
| | 6.3 | | Historical Resource and Reserve Estimates | | | 50 | |
| | | |
| | 6.4 | | Resource and Reserve Evolution | | | 50 | |
| | | |
| | 6.5 | | Past Production | | | 52 | |
| | |
7 | | Geological Setting and Mineralisation | | | 53 | |
| | | |
| | 7.1 | | Regional Geology | | | 53 | |
| | | |
| | 7.2 | | Local Geology | | | 54 | |
| | | |
| | 7.3 | | Permit Geology | | | 54 | |
| | | |
| | 7.4 | | Loulo Permit Geology and Mineralisation | | | 56 | |
| | | |
| | 7.5 | | Gounkoto Permit Geology and Mineralisation | | | 64 | |
| | | |
| | 7.6 | | Discussion | | | 68 | |
| | |
8 | | Deposit Types | | | 69 | |
| | |
9 | | Exploration | | | 70 | |
| | | |
| | 9.1 | | Exploration Concept | | | 70 | |
| | | |
| | 9.2 | | Loulo | | | 71 | |
| | | |
| | 9.3 | | Gounkoto | | | 72 | |
| | | |
| | 9.4 | | Discussion | | | 72 | |
| | |
10 | | Drilling | | | 73 | |
| | | |
| | 10.1 | | Drill Hole Summary | | | 73 | |
| | | |
| | 10.2 | | Survey Grids | | | 74 | |
| | | |
| | 10.3 | | Drill Planning and Site Preparation | | | 74 | |
| | | |
| | 10.4 | | Downhole Surveying | | | 75 | |
| | | |
| | 10.5 | | Collar Surveys | | | 75 | |
| | | |
| | 10.6 | | Diamond Drilling | | | 75 | |
| | | |
| | 10.7 | | Reverse Circulation Drilling | | | 76 | |
| | | |
| | 10.8 | | Trenching | | | 78 | |
| | | |
| | 10.9 | | Other Sampling Methods | | | 78 | |
| | | |
| | 10.10 | | Drill Twinning Studies | | | 78 | |
| | | |
| | 10.11 | | Discussion | | | 79 | |
| | |
11 | | Sample Preparation, Analyses and Security | | | 80 | |
| | | |
| | 11.1 | | Sample Selection | | | 80 | |
| | | |
| | 11.2 | | Sample Preparation | | | 80 | |
| | | |
| | 11.3 | | Sample Analysis | | | 84 | |
| | |
| 18th September 2018 | | Page iii |
| | | | |
| | Loulo-Gounkoto Gold Mine Complex NI 43-101 Technical Report | | |
| | | | | | | | |
| | | |
| | 11.4 | | Quality Assurance and Quality Control | | | 86 | |
| | | |
| | 11.5 | | Sample Security | | | 101 | |
| | | |
| | 11.6 | | Independent Audit | | | 102 | |
| | | |
| | 11.7 | | Discussion | | | 103 | |
| | |
12 | | Data Verification | | | 104 | |
| | | |
| | 12.1 | | Independent Audits | | | 105 | |
| | |
13 | | Mineral Processing and Metallurgical Testing | | | 106 | |
| | | |
| | 13.1 | | Summary | | | 106 | |
| | | |
| | 13.2 | | Gounkoto Testwork | | | 106 | |
| | | |
| | 13.3 | | Sampling and Sample Representativity | | | 109 | |
| | | |
| | 13.4 | | Loulo Metallurgical Testwork | | | 109 | |
| | | |
| | 13.5 | | Recovery | | | 110 | |
| | | |
| | 13.6 | | Deleterious Elements | | | 113 | |
| | |
14 | | Mineral Resource Estimates | | | 116 | |
| | | |
| | 14.1 | | Loulo Summary | | | 116 | |
| | | |
| | 14.2 | | Gounkoto Summary | | | 118 | |
| | | |
| | 14.3 | | Resource Database | | | 119 | |
| | | |
| | 14.4 | | Geological Modelling | | | 120 | |
| | | |
| | 14.5 | | Topography | | | 129 | |
| | | |
| | 14.6 | | Bulk Density | | | 129 | |
| | | |
| | 14.7 | | Compositing | | | 134 | |
| | | |
| | 14.8 | | Treatment of High Grades (Top Cutting) | | | 138 | |
| | | |
| | 14.9 | | Variography | | | 142 | |
| | | |
| | 14.10 | | Block Model Estimation and Quantitative Kriging Neighbourhood Analysis | | | 152 | |
| | | |
| | 14.11 | | Block Models | | | 158 | |
| | | |
| | 14.12 | | Resource Classification | | | 169 | |
| | | |
| | 14.13 | | Block Model Depletion | | | 174 | |
| | | |
| | 14.14 | | Block Model Validation | | | 174 | |
| | | |
| | 14.15 | | ResourceCut-Off Grades | | | 180 | |
| | | |
| | 14.16 | | Other Minor Satellites | | | 182 | |
| | | |
| | 14.17 | | Mineral Resources Reporting | | | 183 | |
| | | |
| | 14.18 | | Comparison to Previous Models | | | 188 | |
| | | |
| | 14.19 | | Reconciliation | | | 193 | |
| | | |
| | 14.20 | | External Audits | | | 194 | |
| | | |
| | 14.21 | | Discussion | | | 195 | |
| | |
15 | | Ore Reserve Estimate | | | 197 | |
| | | |
| | 15.1 | | Introduction | | | 199 | |
| | |
| 18th September 2018 | | Page iv |
| | | | |
| | Loulo-Gounkoto Gold Mine Complex NI 43-101 Technical Report | | |
| | | | | | | | |
| | 15.2 | | Loulo Open Pit Ore Reserve | | | 200 | |
| | | |
| | 15.3 | | Gounkoto Open Pit Ore Reserve | | | 202 | |
| | | |
| | 15.4 | | Loulo Underground Ore Reserve | | | 202 | |
| | | |
| | 15.5 | | Gounkoto Underground Ore Reserve | | | 203 | |
| | | |
| | 15.6 | | Reserves Estimation Process | | | 203 | |
| | | |
| | 15.7 | | Geotechnical Parameters | | | 204 | |
| | | |
| | 15.8 | | Parameters Affected by Groundwater Control | | | 208 | |
| | | |
| | 15.9 | | Dilution and Mining Recovery | | | 210 | |
| | | |
| | 15.10 | | Economic Parameters | | | 214 | |
| | | |
| | 15.11 | | Pit Optimisations | | | 219 | |
| | | |
| | 15.12 | | Mine Design | | | 225 | |
| | | |
| | 15.13 | | Ore Reserve Comparisons | | | 231 | |
| | | |
| | 15.14 | | External Audits | | | 232 | |
| | |
16 | | Mining Methods | | | 234 | |
| | | |
| | 16.1 | | Loulo Open Pits | | | 234 | |
| | | |
| | 16.2 | | Gounkoto Open Pit Operations | | | 237 | |
| | | |
| | 16.3 | | Loulo Underground Mining Operations | | | 242 | |
| | | |
| | 16.4 | | Gounkoto Underground Operations | | | 252 | |
| | | |
| | 16.5 | | Loulo-Gounkoto Life of Mine Plan | | | 263 | |
| | |
17 | | Recovery Methods | | | 266 | |
| | | |
| | 17.1 | | Processing Plant | | | 266 | |
| | | |
| | 17.2 | | Production History | | | 271 | |
| | | |
| | 17.3 | | Capital Projects and Plant Upgrades | | | 273 | |
| | | |
| | 17.4 | | Metallurgical Recovery | | | 273 | |
| | | |
| | 17.5 | | Processing Costs | | | 273 | |
| | |
18 | | Project Infrastructure | | | 275 | |
| | | |
| | 18.1 | | Mine Roads | | | 276 | |
| | | |
| | 18.2 | | Supply Chain | | | 276 | |
| | | |
| | 18.3 | | Surface Water Management | | | 277 | |
| | | |
| | 18.4 | | Water Supply | | | 278 | |
| | | |
| | 18.5 | | Tailings Facilities | | | 278 | |
| | | |
| | 18.6 | | Power Supply | | | 280 | |
| | | |
| | 18.7 | | Site Infrastructure | | | 282 | |
| | | |
| | 18.8 | | Communication and Information Technology | | | 283 | |
| | | |
| | 18.9 | | Security | | | 284 | |
| | |
19 | | Market Studies and Contracts | | | 285 | |
| | | |
| | 19.1 | | Revenue, Tax and Royalty | | | 285 | |
| | |
| 18th September 2018 | | Page v |
| | | | |
| | Loulo-Gounkoto Gold Mine Complex NI 43-101 Technical Report | | |
| | | | | | | | |
| | 19.2 | | Markets | | | 285 | |
| | | |
| | 19.3 | | Contracts | | | 285 | |
| | |
20 | | Environmental Studies, Permitting, And Social or Community Impact | | | 287 | |
| | | |
| | 20.1 | | Environmental Considerations | | | 287 | |
| | | |
| | 20.2 | | Social Considerations | | | 290 | |
| | |
21 | | Capital and Operating Costs | | | 293 | |
| | | |
| | 21.1 | | Capital Costs | | | 293 | |
| | | |
| | 21.2 | | Operating Costs | | | 296 | |
| | |
22 | | Economic Analysis | | | 298 | |
| | |
23 | | Adjacent Properties | | | 299 | |
| | | |
| | 23.1 | | Tabakoto Gold Mine | | | 299 | |
| | | |
| | 23.2 | | Kofi Exploration Project | | | 299 | |
| | |
24 | | Other Relevant Data and Information | | | 300 | |
| | | |
| | 24.1 | | Country Risk | | | 300 | |
| | |
25 | | Interpretation and Conclusions | | | 302 | |
| | | |
| | 25.1 | | Geology and Mineral Resources | | | 302 | |
| | | |
| | 25.2 | | Mining and Ore Reserves | | | 303 | |
| | | |
| | 25.3 | | Processing | | | 304 | |
| | | |
| | 25.4 | | Environment and Social | | | 304 | |
| | | |
| | 25.5 | | Ownership | | | 305 | |
| | | |
| | 25.6 | | Infrastructure | | | 305 | |
| | | |
| | 25.7 | | Risks | | | 305 | |
| | |
26 | | Recommendations | | | 310 | |
| | |
27 | | References | | | 311 | |
| | |
28 | | Date and Signature Page | | | 314 | |
| | |
29 | | Certificate of Qualified Persons | | | 315 | |
| | | |
| | 29.1 | | Simon P. Bottoms, CGeol, MGeol, FGS, MAusIMM | | | 315 | |
| | | |
| | 29.2 | | Rodney B. Quick MSc, Pr. Sci.Nat | | | 316 | |
| | | |
| | 29.3 | | Richard Quarmby, BSc, Pr Eng, C Eng, MSAIChE, MIoMMM, MBA | | | 317 | |
| | | |
| | 29.4 | | Derek Holm, BSc, FSAIMM | | | 318 | |
| | | |
| | 29.5 | | Graham E. Trusler, MSc Pr Eng, MIChE, MSAIChE | | | 319 | |
| | |
30 | | Appendix | | | 320 | |
| | | |
| | 30.1 | | Appendix 1 – JORC 2012 Edition – Table 1 | | | 320 | |
| | |
| 18th September 2018 | | Page vi |
| | | | |
| | Loulo-Gounkoto Gold Mine Complex NI 43-101 Technical Report | | |
List of Tables
| | | | |
Table1-1 Mineral Resource Statement for the Loulo Gold Mine as of 31stDecember 2017 | | | 8 | |
| |
Table1-2 Mineral Resource Statement for the Gounkoto Gold Mine as of 31stDecember 2017 | | | 9 | |
| |
Table1-3 Ore Reserve Statement for the Loulo as of 31stDecember 2017 | | | 10 | |
| |
Table1-4 Ore Reserve Statement for Gounkoto as of 31stDecember 2017 | | | 11 | |
| |
Table1-5 Actual Process and Plant Engineering Operating Costs for 2016 and 2017 | | | 16 | |
| |
Table1-6 LOM Capital Expenditure | | | 20 | |
| |
Table1-7 LOM Operating Costs for Loulo and Gounkoto | | | 20 | |
| |
Table1-8 Loulo Risk Rating | | | 26 | |
| |
Table1-9 Gounkoto Risk Rating | | | 28 | |
| |
Table4-1 Loulo and Gounkoto Permit Coordinates | | | 39 | |
| |
Table5-1 Monthly Records of Precipitation and Potential Evaporation | | | 43 | |
| |
Table6-1 Past Production Records for Loulo-Gounkoto | | | 52 | |
| |
Table10-1 Loulo Drilling Summary | | | 73 | |
| |
Table10-2 Gounkoto Drilling Summary | | | 74 | |
| |
Table11-1 Summary of Certified Reference Materials Used at Yalea and Gara | | | 84 | |
| |
Table11-2 Summary of Certified Reference Materials Used at Yalea and Gara | | | 84 | |
| |
Table11-3 Summary of Certified Reference Materials Used at Yalea and Gara | | | 88 | |
| |
| Table11-4 Bivariate Statistics of Gara and Yalea CRM’s Assayed by SGS Loulo During the Period | | | 88 | |
| |
Table11-5 Summary of Gounkoto Certified Reference Materials Used During the Period | | | 91 | |
| |
Table11-6 Bivariate Statistics for Gounkoto CRMs Assayed by SGS Loulo | | | 91 | |
| |
Table11-7 Loulo Blank Results Returned During Reporting Period | | | 93 | |
| |
Table11-8 Gounkoto Blank Results Returned During Reporting Period | | | 93 | |
| |
| Table11-9 Bivariate Statistics for Log Scatter of Gara and Yalea Course Crush Rejects Duplicate Assayed by SGS Loulo During the Period | | | 94 | |
| |
Table11-10 Bivariate Statistics for SGS Loulo Correlational Plot of Gounkoto Field Duplicates | | | 97 | |
| |
Table11-11 Loulo Umpire Sample Summary | | | 98 | |
| |
Table11-12 Bivariate Statistics for Loulo Umpire Assays | | | 98 | |
| |
Table11-13 Loulo Umpire Sample Summary | | | 101 | |
| |
Table13-1 Metallurgical Optimum Recoveries by Domain 2016 | | | 107 | |
| |
Table13-2 Gounkoto Testwork | | | 108 | |
| |
Table13-3 Summary of Testwork Reports Prior to First Feasibility Study | | | 110 | |
| |
Table13-4 Loulo Processing Plant Overall Gold Recovery in 2016 and 2017 by Month | | | 112 | |
| |
Table14-1 Loulo Gold Mine Mineral Resource Statement as of 31stDecember 2017 | | | 116 | |
| |
Table14-2 Summary of Loulo Deposit and Model Date | | | 117 | |
| | |
| 18th September 2018 | | Page vii |
| | | | |
| | Loulo-Gounkoto Gold Mine Complex NI 43-101 Technical Report | | |
| | | | |
Table14-3 Gounkoto Gold Mine Mineral Resource Statement as of 31stDecember 2017 | | | 118 | |
| |
Table14-4 Summary of Gounkoto Deposit and Model Date | | | 119 | |
| |
Table14-5 Loulo Mineral Resource Dataset | | | 120 | |
| |
Table14-6 Gounkoto Mineral Resource Dataset | | | 120 | |
| |
Table14-7 Yalea Density Data | | | 130 | |
| |
Table14-8 Gara and Gara West Density Data | | | 130 | |
| |
Table14-9 Loulo 3 Density Data | | | 130 | |
| |
Table14-10 Baboto Density Data | | | 131 | |
| |
Table14-11 Densities Applied Gounkoto for 2017 Resources | | | 133 | |
| |
Table14-12 Densities Applied Faraba for 2017 Resources | | | 133 | |
| |
Table14-13 Yalea Total Model 2 m Composite Dataset | | | 134 | |
| |
Table14-14 Gara Total Model 2 m Composite Dataset | | | 135 | |
| |
Table14-15 Loulo 3 Total Model 1 m Composite Dataset | | | 135 | |
| |
Table14-16 Baboto South and Centre 1 m Composite Dataset | | | 136 | |
| |
Table14-17 Gara West Total Model 1 m Composite Dataset | | | 136 | |
| |
Table14-18 Gounkoto 2 m Compositing Data | | | 137 | |
| |
Table14-19 Faraba Composite Sample Analysis | | | 137 | |
| |
Table14-20 Yalea Top Cutting Values Applied to Composites | | | 138 | |
| |
Table14-21 Gara Top Cutting Values Applied to Composites | | | 139 | |
| |
Table14-22 Loulo Top Cutting Values Applied to Composites | | | 140 | |
| |
Table14-23 Baboto Top Cutting Values Applied to Composites | | | 140 | |
| |
Table14-24 Gara West Top Cutting Values Applied to Composites | | | 140 | |
| |
Table14-25 Gounkoto Top Cutting | | | 141 | |
| |
Table14-26 Top Cutting Values Applied to Composites | | | 142 | |
| |
Table14-27 QKNA Parameters from Yalea | | | 154 | |
| |
Table14-28 QKNA Parameters from Gara | | | 155 | |
| |
Table14-29 QKNA Parameters from Loulo 3 | | | 155 | |
| |
Table14-30 QKNA Parameters from Baboto | | | 155 | |
| |
Table14-31 QKNA Parameters from Gara West | | | 156 | |
| |
Table14-32 QKNA & Kriging Parameters for Gounkoto | | | 157 | |
| |
Table14-33 Summary of QKNA for Faraba Domains | | | 158 | |
| |
Table14-34 Yalea Block Model Variables | | | 158 | |
| |
Table14-35 Yalea Block Model Extents | | | 161 | |
| |
Table14-36 Yalea Estimation Domain Orientation | | | 161 | |
| |
Table14-37 Gara Block Model Extents | | | 163 | |
| |
Table14-38 Gara Estimation Domain Orientation | | | 163 | |
| |
Table14-39 Loulo 3 Block Model Extents | | | 164 | |
| |
Table14-40 Loulo 3 Search Ellipse Orientations and HG Constraining | | | 164 | |
| | |
| 18th September 2018 | | Page viii |
| | | | |
| | Loulo-Gounkoto Gold Mine Complex NI 43-101 Technical Report | | |
| | | | |
Table14-41 Baboto South and Centre Block Model Extents | | | 165 | |
| |
Table14-42 Baboto South and Centre Estimation Domains | | | 166 | |
| |
Table14-43 Gara West Block Model Extents | | | 166 | |
| |
Table14-44 Gara West Sub Domain Ellipse Orientations | | | 167 | |
| |
Table14-45 Gounkoto Block Model Extents | | | 168 | |
| |
Table14-46 Summary of the Gounkoto Orientations and HG Constraint | | | 168 | |
| |
Table14-47 Faraba Block Model Extents | | | 169 | |
| |
Table14-48 Modelled Semi-Variogram Parameters for Faraba | | | 169 | |
| |
Table14-49 Loulo Classification Criteria | | | 170 | |
| |
Table14-50 Gounkoto Classification Criteria | | | 173 | |
| |
Table14-51 Gara and Yalea Volume Reconciliation | | | 175 | |
| |
Table14-52 Gounkoto Volume Reconciliation | | | 176 | |
| |
Table14-53 Gounkoto Open Pit Data Comparison | | | 177 | |
| |
Table14-54 2017 Loulo Open PitCut-Off Grade Calculations | | | 180 | |
| |
Table14-55 2017 Loulo UndergroundCut-Off Grade Calculations | | | 181 | |
| |
Table14-56 Gounkoto Open Pit 2017Cut-Off Grade Calculations | | | 181 | |
| |
Table14-57 Gounkoto Underground 2017Cut-Off Grade Calculations | | | 182 | |
| |
Table14-58 Loulo Total Declared Resources as of 31stDecember 2017 | | | 186 | |
| |
Table14-59 Gounkoto Total Declared Resources as of 31stDecember 2017 | | | 187 | |
| |
Table14-60 Yalea 2017/2016 Mineral Resource Comparison | | | 188 | |
| |
Table14-61 Gara 2017/2016 Mineral Resource Comparison | | | 189 | |
| |
Table14-62 Loulo 3 2017/2016 Mineral Resource Comparison | | | 189 | |
| |
Table14-63 Baboto 2017/2016 Mineral Resource Comparison | | | 190 | |
| |
Table14-64 Gara West 2017/2016 Mineral Resource Comparison | | | 190 | |
| |
Table14-65 Gounkoto Open Pit 2017/2016 Mineral Resource Comparison | | | 191 | |
| |
Table14-66 Gounkoto Underground 2017/2016 Mineral Resource Comparison | | | 192 | |
| |
Table14-67 Faraba 2017/2016 Mineral Resource Comparison | | | 192 | |
| |
| Table14-68 Loulo Gounkoto MCF 2017 EOY Reconciliation (Old assign density LEFT and new estimated density + domain assign RIGHT) | | | 193 | |
| |
Table15-1 Loulo Gold Mine Ore Reserve Statement as of 31stDecember 2017 | | | 198 | |
| |
Table15-2 Gounkoto Gold Mine Ore Reserve Statement as of 31stDecember 2017 | | | 199 | |
| |
Table15-3 Loulo Open Pit Ore Reserve as of 31stDecember 2017 | | | 201 | |
| |
Table15-4 Loulo Surface Stockpile Ore Reserve as of 31stDecember 2017 | | | 201 | |
| |
Table15-5 Gounkoto Open Pit Ore Reserve as of 31stDecember 2017 | | | 202 | |
| |
Table15-6 Loulo Underground Ore Reserves as of 31stDecember 2017 | | | 203 | |
| |
| Table15-7 Gounkoto Underground Project – Total Ore Reserve by Category as of 31st December 2017 | | | 203 | |
| |
Table15-8 Baboto – Loulo 3 - Gara West - Slope Parameters | | | 205 | |
| | |
| 18th September 2018 | | Page ix |
| | | | |
| | Loulo-Gounkoto Gold Mine Complex NI 43-101 Technical Report | | |
| | | | |
Table15-9 Geotechnical Slope Requirements | | | 206 | |
| |
Table15-10 Basic Geotechnical Parameters for Yalea and Gara | | | 207 | |
| |
Table15-11 Basic Geotechnical Parameters for Gounkoto | | | 208 | |
| |
Table15-12 Summary of Actual 2017 Loulo Underground Mining Dilution | | | 211 | |
| |
Table15-13 Summary of Loulo Underground Ore Reserve Estimate Dilution | | | 212 | |
| |
Table15-14 Summary of Loulo Underground Ore Reserve Estimate Dilution | | | 212 | |
| |
Table15-15 Summary of Loulo Underground Ore Reserve Estimate Dilution | | | 212 | |
| |
Table15-16 Gounkoto Underground Mining Dilution and Losses | | | 213 | |
| |
Table15-17: Loulo Open Pit Economic Parameters | | | 214 | |
| |
Table15-18: Gounkoto Open Pit Economic Parameters | | | 216 | |
| |
Table15-19 Yalea and Gara Underground Mine –Cut-Off Grade Calculation | | | 218 | |
| |
Table15-20 Gounkoto Underground Mine –Cut-Off Grade Calculation | | | 219 | |
| |
Table15-21 Whittle Optimisation Results for Loulo 3 | | | 220 | |
| |
Table15-22 Whittle Optimisation Results for Baboto | | | 221 | |
| |
Table15-23 Pit by Pit Graph of Whittle Optimisation Results for Gara West | | | 222 | |
| |
Table15-24 Whittle Optimisation results for Gounkoto | | | 224 | |
| |
Table15-25 Whittle Optimisation Results for Faraba | | | 224 | |
| |
Table15-26 Open Pit Design Characteristics | | | 225 | |
| |
Table15-27 MSO Parameters for MSO Run | | | 230 | |
| |
Table15-28 Loulo Open Pits Ore Reserve Reconciliation | | | 232 | |
| |
Table15-29: Gounkoto Open Pit Ore Reserve Sources Reconciliation | | | 232 | |
| |
Table16-1 Baboto Main Mining Equipment | | | 234 | |
| |
Table16-2 Loulo Open Pit Life of Mine Plan | | | 237 | |
| |
Table16-3 Gounkoto Mining Fleet as of 31stDecember 2017 | | | 239 | |
| |
Table16-4 Life of Mine Production Plan for the Gounkoto Pit | | | 241 | |
| |
Table16-5 Yalea and Gara Mining Fleet as of 31st December 2017 | | | 243 | |
| |
Table16-6 Yalea Life of Mine Production Schedule | | | 250 | |
| |
Table16-7 Gara Life of Mine Production Schedule | | | 251 | |
| |
Table16-8 Productivity Rate | | | 260 | |
| |
Table16-9 Time Rates for Activities | | | 261 | |
| |
Table16-10 Gounkoto Production Schedule and Key Mine Physicals | | | 261 | |
| |
Table16-11 Loulo-Gounkoto Life of Mine Plan | | | 264 | |
| |
Table17-1 Processing Plant Production Statistics | | | 267 | |
| |
Table17-2 Loulo Processing Plant Production History | | | 272 | |
| |
Table17-3 Actual Process and Plant Engineering Operating Costs for 2016 and 2017 | | | 274 | |
| |
Table21-1 LOM Capital Expenditure | | | 293 | |
| |
Table21-2 Loulo Capital Cost | | | 295 | |
| |
Table21-3 Gounkoto Capital Cost | | | 295 | |
| | |
| 18th September 2018 | | Page x |
| | | | |
| | Loulo-Gounkoto Gold Mine Complex NI 43-101 Technical Report | | |
| | | | |
Table21-4 LOM Operating Unit Costs for Loulo and Gounkoto | | | 296 | |
| |
Table21-5 LOM Operating Total Costs for Loulo and Gounkoto | | | 297 | |
| |
Table25-1 Loulo Risk Rating | | | 307 | |
| |
Table25-2 Gounkoto Risk Rating | | | 309 | |
| | |
| 18th September 2018 | | Page xi |
| | | | |
| | Loulo-Gounkoto Gold Mine Complex NI 43-101 Technical Report | | |
List of Figures
| | | | |
Figure1-1 Simplified Flow Sheet | | | 14 | |
| |
Figure1-2 Loulo-Gounkoto Processing Milled Tonnes by Ore Source | | | 15 | |
| |
Figure4-1 Location of Loulo-Gounkoto within Mali | | | 37 | |
| |
Figure4-2 Loulo and Gounkoto Permit Areas | | | 40 | |
| |
Figure5-1 Loulo Mine Site Layout | | | 45 | |
| |
Figure5-2 Gounkoto Mine Site Layout | | | 46 | |
| |
Figure6-1 Loulo Mineral Resource and Ore Reserve Evolution | | | 51 | |
| |
Figure6-2 Gounkoto Mineral Resource and Ore Reserve Evolution | | | 51 | |
| |
Figure7-1 Location of the Kedougou-Kenieba-Inlier in the West African Craton | | | 53 | |
| |
Figure7-2 Loulo Gounkoto Regional Interpreted Geology | | | 55 | |
| |
Figure7-3 Loulo-Gounkoto Permit Targets and Geology | | | 57 | |
| |
Figure7-4 Yalea Simplified Geology Cross Section | | | 58 | |
| |
Figure7-5 Early pink Albite ± Carbonate Alteration. B. Early Light Brown Albite±-Carbonate | | | | |
| |
Alteration and Narrow Bands of Sericite ±Chlorite | | | 58 | |
| |
Figure7-6 Long Section Looking West Showing Structural Model for Yalea Deposit | | | 60 | |
| |
Figure7-7 Cross Section of Gara Fold Structures | | | 61 | |
| |
| Figure7-8 Typical Plan View and West-East Cross Section across Gounkoto MZ1, MZ2 and MZ3 | | | 65 | |
| |
| Figure 11- 1 Summary of Diamond Core Sample Preparation Flowchart - Exploration and Grade Control | | | 81 | |
| |
| Figure11-2 Summary of RC, Channel, and Trench Sample Preparation Flowchart - Exploration and Grade Control | | | 82 | |
| |
Figure11-3 SGS Loulo Laboratory – Summary of Sample Preparation Procedure | | | 83 | |
| |
Figure11-4 SGS Loulo Laboratory – Summary of Fire Assay (FAA505) Procedure | | | 85 | |
| |
Figure11-5 Tram Line of Gara CRM’s Assayed by SGS Loulo During the Reporting Period | | | 89 | |
| |
Figure11-6 Tram Line of Yalea CRM’s Assayed by SGS Loulo During the Reporting Period | | | 90 | |
| |
Figure11-7 Tram line Plot of all Gounkoto CRMs Assayed by SGS Loulo | | | 92 | |
| |
| Figure11-8 Log Scatter Plot of Gara Course Crush Rejects Duplicate Assayed by SGS Loulo During the Reporting Period | | | 95 | |
| |
| Figure11-9 HARD Plot of Gara Course Crush Rejects Duplicate Assayed by SGS Loulo During the Reporting Period | | | 95 | |
| |
| Figure11-10 Log Scatter Plot of Yalea Course Crush Rejects Duplicate Assayed by SGS Loulo During the Reporting Period | | | 96 | |
| |
| Figure11-11 HARD Plot of Yalea Course Crush Rejects Duplicate Assayed by SGS Loulo During the Reporting Period | | | 96 | |
| |
Figure11-12 Log Correlational Plot of Gounkoto Field Duplicate Assayed by SGS Loulo | | | 97 | |
| | |
| 18th September 2018 | | Page xii |
| | | | |
| | Loulo-Gounkoto Gold Mine Complex NI43-101 Technical Report | | |
| | | | |
| |
Figure11-13 HARD Plot of Gounkoto Field Duplicates Assayed by SGS Loulo | | | 98 | |
| |
Figure11-14 Log Scatter Plot of Yalea Umpire Assays | | | 99 | |
| |
Figure11-15 Log Scatter Plot of Gara Umpire Assays | | | 100 | |
| |
Figure11-16 Log Scatter Plot of Baboto Umpire Assays | | | 100 | |
| |
Figure11-17 Log Scatter Plot of Gounkoto Umpire Assays | | | 101 | |
| |
Figure12-1 The Normalised Assay Structure Utilised by DataShed | | | 105 | |
| |
Figure13-1 Gounkoto Cyanidation Sample Locations | | | 109 | |
| |
Figure13-2 Yalea Copper Estimation within 2017 Resource Model Looking East | | | 111 | |
| |
Figure13-3 Yalea Arsenic Estimation within 2017 Resource Model Looking East | | | 111 | |
| |
Figure13-4 Process Recovery Estimated into Yalea Block Model | | | 112 | |
| |
Figure13-5 Loulo Processing Plant Overall Recovery in 2016 and 2017 | | | 113 | |
| |
Figure13-6 Treatment Regime in the Intermediate Plant | | | 114 | |
| |
Figure13-7 Effective Reduction in Tenor | | | 115 | |
| |
| Figure14-1 Yalea Model Geological Domains (Looking East). A Portion of 9007 is Also Referred to as Yalea South HG Plunge | | | 121 | |
| |
Figure14-2 ‘Purple Patch’ Boundary Update Long Section | | | 122 | |
| |
Figure14-3 Gara Model and Geological Domains | | | 123 | |
| |
Figure14-4 Loulo 3 Model Geological Domains | | | 124 | |
| |
Figure14-5 Baboto Model Geological Domains | | | 125 | |
| |
Figure14-6 Gara West Model Geological Domains | | | 126 | |
| |
Figure14-7 Gounkoto Model Geological Domains | | | 127 | |
| |
Figure14-8 Faraba Model Geological Domains | | | 128 | |
| |
Figure14-9 Yalea 2017 ‘Purple Patch’ Density Distribution | | | 131 | |
| |
| Figure14-10 Yalea 2017 ‘Purple Patch’ Model and Density Data Spatial Distribution Highlighting Lower Domain Contact | | | 132 | |
| |
Figure14-11 Yalea 2017 Mineral Resource Block Model Densities | | | 132 | |
| |
Figure14-12 Yalea 9001 Grade Distribution (Left: Log Histogram & Right: Log Probability) | | | 139 | |
| |
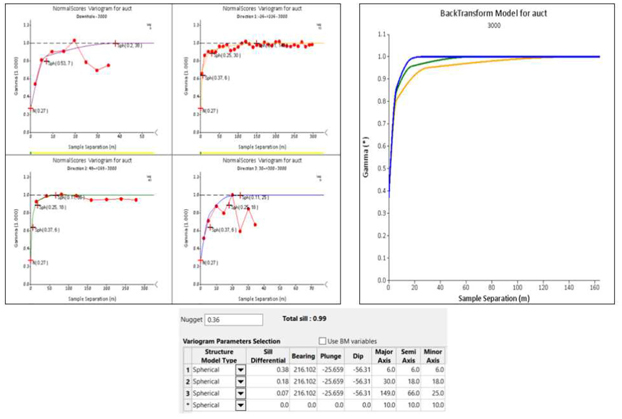
Figure14-13 Yalea South Variogram Including 9001 and 9002 Domains | | | 143 | |
| |
| Figure14-14 Gara Variogram for the 3000 Domain which was Applied to All Domains with the Bearing, Plunge and Dip Changing Based on Domain Orientation | | | 144 | |
| |
Figure14-15 Loulo 3 Main Zone 2 Individual Structure Normal Score Variogram Models | | | 145 | |
| |
Figure14-16 Loulo 3 Main Zone 2 Nested Back Transformed Variogram Model | | | 146 | |
| |
Figure14-17 Baboto South Variogram | | | 147 | |
| |
Figure14-18 Baboto South 2017 Nested Back Transformed Variogram Model | | | 147 | |
| |
Figure14-19 Gara West Domain 20000 Individual Structure Normal Score Variogram Models | | | 148 | |
| |
Figure14-20 Gara West Domain 20000 Nested Back Transformed Variogram Model | | | 149 | |
| |
Figure14-21 Modelled Semi-Variograms for Gounkoto MZ1 Domain 1000 (East Dipping) | | | 150 | |
| | |
| 18th September 2018 | | Page xiii |
| | | | |
| | Loulo-Gounkoto Gold Mine Complex NI43-101 Technical Report | | |
| | | | |
| |
Figure14-22 Gounkoto MZ1 Domain 1000 Nested Back Transformed Variogram Model | | | 150 | |
| |
Figure14-23 Faraba Domain 1000 Modelled Semi-Variograms | | | 151 | |
| |
Figure14-24 Faraba Domain 1000 Nested Back Transformed Variogram Model | | | 151 | |
| |
Figure14-25 QKNA Results for Gounkoto MZ1 East Dipping Grade Control Area | | | 152 | |
| |
Figure14-26 Yalea 2017 Drill hole Density Sub Domains | | | 160 | |
| |
Figure14-27 Gara 2017 Estimation Domains | | | 162 | |
| |
Figure14-28 Baboto Estimation Domains Looking WNW | | | 165 | |
| |
Figure14-29 Gara West EstimationSub-Domains | | | 167 | |
| |
Figure14-30 Yalea Mineral Resources Classification with Estimation Composites | | | 171 | |
| |
Figure14-31 Gara Mineral Resources Classification with Estimation Composites | | | 171 | |
| |
Figure14-32 Loulo 3 Mineral Resource Classification with Estimation Composites | | | 172 | |
| |
Figure14-33 Baboto 2017 Mineral Resource Classification Surfaces with Estimation Composites | | | 172 | |
| |
Figure14-34 Gara West 2017 Mineral Resource Classification Surfaces with Estimation Composites | | | 172 | |
| |
Figure14-35 Gounkoto July 2017 MZ1 Classification | | | 173 | |
| |
Figure14-36 Faraba Classification Within Pit | | | 174 | |
| |
Figure14-37 Swath Plot of Yalea Grade Control Area of 9006 | | | 178 | |
| |
Figure14-38 Swath Plot Along Y Axis of 3101 (3000 GC Area) | | | 178 | |
| |
| Figure14-39 Yalea 2017 Resource Model Looking East Regularised for Presentation Purposed and Composite Samples Overlain onto Display Relative Accuracy of the Estimate | | | 179 | |
| |
| Figure14-40 Gara 2017 Resource Model Looking East Regularised for Presentation Purposed and Composite Samples Overlain onto Display Relative Accuracy of the Estimate | | | 179 | |
| |
Figure15-1 Sketch of Baboto Dewatering Arrangement | | | 209 | |
| |
Figure15-2 Pit by Pit Graph of Whittle Optimisation Results for Loulo 3 | | | 220 | |
| |
Figure15-3 Pit by Pit Graph of Whittle Optimisation Results for Baboto | | | 221 | |
| |
Figure15-4 Whittle Optimisation Results for Gara West | | | 222 | |
| |
Figure15-5 Gounkoto Pit Design Oblique View looking upwards from underneath, with Gain in Ore Tonnes | | | 223 | |
| |
Figure15-6 Whittle Optimisation Results for Gounkoto | | | 223 | |
| |
Figure 15-7 Whittle Optimisation Results for Faraba | | | 224 | |
| |
Figure15-8 Baboto Pit and Waste Dump Design | | | 226 | |
| |
Figure15-9 Gara West Pit And Waste Dump Design | | | 227 | |
| |
Figure15-10 Loulo 3 Pit Design | | | 227 | |
| |
Figure15-11 Yalea Mine Design with Ore Classification | | | 229 | |
| |
Figure15-12 Gara Mine Design with Ore Classification | | | 229 | |
| |
| Figure15-13 Longitudinal Projection Looking West showing Results of MSO Run on Northern End of the Resource Model | | | 231 | |
| | |
| 18th September 2018 | | Page xiv |
| | | | |
| | Loulo-Gounkoto Gold Mine Complex NI43-101 Technical Report | | |
| | | | |
| |
Figure16-1 Baboto Mine Design | | | 235 | |
| |
Figure16-2 Baboto Haul Road | | | 236 | |
| |
Figure16-3 Yalea Life of Mine Plan Development Long Section (Looking East) | | | 244 | |
| |
Figure16-4 Gara Life of Mine Plan Development Long Section (Looking West) | | | 244 | |
| |
Figure16-5 Yalea Stoping Method Long Section | | | 245 | |
| |
Figure16-6 Gara Stoping Method Long Section | | | 245 | |
| |
| Figure16-7 Stoping Under Rock Fill (SURF) Development Layout at Top of Mining Area (85 Level), Showing Waste Tipping Points | | | 246 | |
| |
Figure16-8: Stoping Under Rock Fill (SURF) Development Layout of Production Level (185 Level) | | | 247 | |
| |
Figure16-9 Isometric View of Underground Design in Relation to Super Pit Design | | | 252 | |
| |
Figure16-10: Longitudinal Projection Looking East Showing Decline and Level Development | | | 253 | |
| |
Figure16-11 View Looking East of Typical Level Designs Showing Variation in Position of Level | | | 254 | |
| |
Figure16-12 Plan View of Typical Level Layout | | | 254 | |
| |
Figure16-13 Longitudinal Projection Looking East Showing Stopes at an Average Au Grade | | | 256 | |
| |
Figure16-14 Longitudinal Projection Looking East Showing Stope Blocks by Mining Type | | | 256 | |
| |
Figure16-15 Longitudinal Projection Looking West Showing Stope Blocks and Stope Types | | | 257 | |
| |
Figure16-16 Longitudinal Projection of Transverse Stope Layout | | | 258 | |
| |
Figure16-17 Longitudinal Projection of Longitudinal Longhole Stoping | | | 259 | |
| |
Figure16-18 Development Coloured by Year | | | 262 | |
| |
Figure16-19 Stoping Coloured by Year | | | 262 | |
| |
Figure17-1 Simplified Metallurgical Flowsheet | | | 266 | |
| |
Figure17-2 Loulo-Gounkoto Processing Milled Tonnes by Ore Source | | | 272 | |
| |
Figure18-1 Loulo Major Infrastructure Locations | | | 275 | |
| |
Figure18-2 Starter Wall Built on East Side of TSF | | | 279 | |
| | |
| 18th September 2018 | | Page xv |
| | | | |
| | Loulo-Gounkoto Gold Mine Complex NI43-101 Technical Report | | |
The purpose of this report is to support the public disclosure of the year end 2017 Mineral Resource and Ore Reserve estimates at the Loulo-Gounkoto Gold Mine Complex (Loulo-Gounkoto, the Mine or the Project), consisting of the Loulo Gold Mine (Loulo) and the Gounkoto Gold Mine (Gounkoto) located in western Mali. This Technical Report conforms to National Instrument43-101- Standards of Disclosure for Mineral Projects (NI43-101). All currency in this report is US dollars ($) unless otherwise noted.
Société des Mines de Loulo SA is an exploration and mining company and the owner of the Loulo mine, which is held 80% by Randgold Resources Limited, (Randgold) and 20% by the state of Mali.
Société des Mines de Gounkoto SA is an exploration and mining company and the owner of the Gounkoto mine which is held 80% by Randgold and 20% by the state of Mali.
Randgold is the operator of Loulo and Gounkoto. Randgold is developing, and operating gold mines in West and East Africa. The most notable of these are the following:
| | ● | | Morila Gold Mine in Mali. |
| | ● | | Tongon Gold Mine in Côte d’Ivoire. |
| | ● | | Kibali Project in Democratic Republic of Congo (DRC). |
| | ● | | Massawa Exploration Project in Senegal. |
The Project is an operating mine site comprising two underground mines (Yalea and Gara) at Loulo, the Gounkoto open pit mine, satellite deposits, and a processing plant (4.8 Mtpa capacity), together with other associated mine operation and regional exploration infrastructure. The plant produces gold doré bars.
Total mine production from underground and open pits in 2017 was 4.9 Mt at a head grade of 5.0 g/t Au for a total of 730 koz of gold (92.7% recovery).
Total production since mining commenced in 2005 to year end 2017 is 391 Mt (53 Mt ore) for 5.6 Moz of gold
(90.2% recovery).
The effective date of this report is 31st December 2017.
| 1.1 | Property Description and Location |
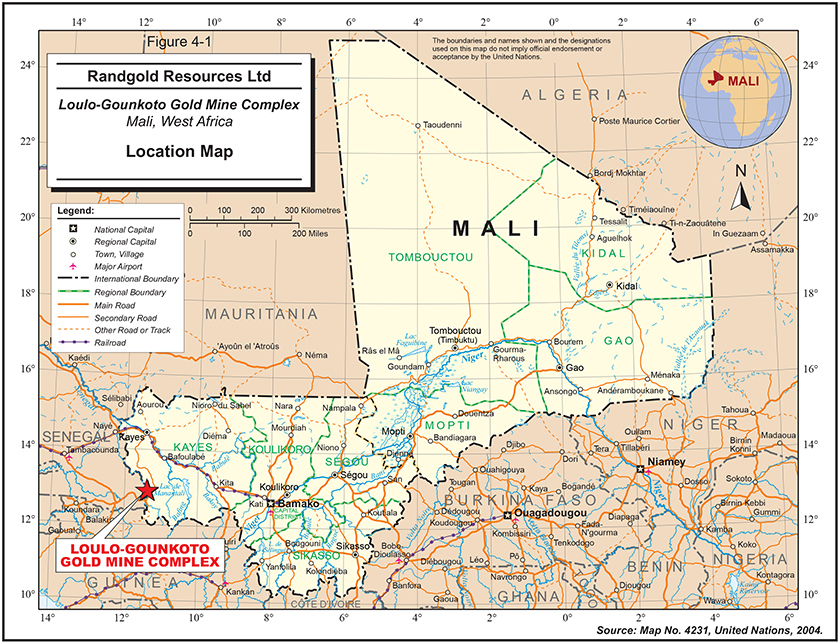
Loulo-Gounkoto is situated in western Mali adjacent to the Falémé River which forms the international boundary with Senegal. The Republic of Mali is a landlocked country and is bordered by Guinea, Senegal, Mauritania, Algeria, Niger, Burkina Faso, and the Cote d’Ivoire.
| | |
| 18th September 2018 | | Page 1 |
| | | | |
| | Loulo-Gounkoto Gold Mine Complex NI 43-101 Technical Report | | |
The Project area is located 350 km west of the capital city of Bamako, 220 km south of Kayes and to the NW of the nearest town Kenieba. It falls within the Central Arrondissement of the Kenieba District which is one of the 10 districts of the Kayes Region.
The Dakar to Bamako Millennium highway crosses the Loulo-Gounkoto haul road, approximately 6 km north of the Gounkoto pit. This highway serves as the primary access point for the mine and provide excellent road transport links with the rest of the country as well as to Senegal for which the border is within 3 km of the mine.
A 1.5 km laterite airstrip is present within the Loulo Permit which can accommodate small to medium sized aircraft and has been awarded full certification by the transport authorities in Mali. Charter flights are arranged from the site to the capital Bamako, which is served daily by commercial flights from European cities.
The Loulo and Gounkoto areas are currently 261.23 km2 and 99.95 km2 respectively, for a total area of 361.18 km2. The Project falls within the Central Arrondissement of the Kenieba District which is one of the 10 districts of the Kayes Region.
Loulo consists of multiple mineral deposits including; Yalea, Gara, Loulo 3, Baboto, Gara West, P129, P125L3, P129QT, Loulo 1, Loulo 2 andL2-L3 Gap, P125L3, and PQ10.
Gounkoto consist of multiple mineral deposits including; Gounkoto and Faraba.
| 1.2 | Mineral Rights and Land Ownership |
The Loulo mine is within the Loulo Exploitation Permit (Loulo Permit). The original Loulo Permit was granted by Decret No.96-048/PM-RM 9, on the 14th February 1996 and covered an area of 48 km2. This Permit was amended by Decret No.99-193/PM-RM dated 15th July 1999 and extended the size of the Loulo Permit to 372 km2. The Loulo Permit was amended by DecretNo. 2012-311/P-RM on 21st June 2012 which reduced the size of the Lolo Permit as the portion surrounding the Gounkoto Mine was transferred to a new Exploitation Permit. The Loulo Permit, that covers the Gara and Yalea underground Ore Reserves and the Baboto, Gara West and Loulo 3 open pit Ore Reserves, remains in force for a period of 30 years after which it is renewable if production is still taking place.
In 2010, Randgold applied and was granted the new Gounkoto Exploitation Permit (Gounkoto Permit), which was split from the Loulo Permit, to form a separate entity, Société des Mines de Gounkoto SA (Gounkoto) under DecretNo.2012-431/PM-RM DU dated 3rd August 2012. The Gounkoto Permit, that incorporates the Gounkoto and Faraba Reserves, is valid for 30 years.
In 2017, the Baboto North deposit was purchased by Endeavour Mining Corporation. This resulted in a minor change to the Loulo Permit. An updated Decret number has not yet been generated by the Malian Government, but it should be created imminently.
The Loulo-Gounkoto Establishment Convention regulates the fiscal conditions under which the Loulo and Gounkoto mined operates and is based on the1991 Mining Code. A 6% royalty is
| | |
| 18th September 2018 | | Page 2 |
| | | | |
| | Loulo-Gounkoto Gold Mine Complex NI 43-101 Technical Report | | |
payable to the Malian government based upon production together with a corporate tax rate on profits at 305 and a minimum of 0.75% on gross revenues if a loss is made. Loulo received a received a five year tax holiday from first commercial gold production in October 2005. Gounkoto received a two year tax holiday from first gold production in 2013 and has since received governmental approval for use of 50% corporate tax reduction for the next four years to support its development of a super pit. The convention includes exoneration on fuel duties for the life of the project and on import duties for three years from the start of first gold.
In the Qualified person’s opinion, all appropriate permits have been acquired and obtained to conduct the work proposed for the property.
The Qualified Person is not aware of any risks that could result in the loss of ownership of the deposits or loss of the permits, in part or in whole.
The Qualified Person is not aware of any other significant factors and risks that may affect access, title, or the right of ability to perform work on the property.
Gold potential was first recognised by Syndicat Or joint venture between the Malian Direction Nationale de la Géologie et des Mines and the French Bureau de Recherches Géologiques et Minières (BRGM). The Gara gold deposit was discovered in 1981 by the Syndicat Or joint venture. In 1992, BHP Minerals Mali entered into an agreement with Société des Mines de Loulo for a joint venture that developed the Gara deposit into a Mineral Resource that was deemedsub-economic at the time.
During 1996, Randgold acquired BHP Minerals Mali and undertook additional regional exploration which resulted in the discovery of Yalea, the second of two deposits that make up the Loulo Mine, in 1997. In 2003, a feasibility study was undertaken at Loulo on a 12 Mt at 3.60 g/t Au for 1.4 Moz Ore Reserve which led to the construction of an open pit mine in 2004. The Loulo underground mine passed through feasibility study stage in 2005, with development beginning in 2006 and first gold being produced in 2005. The first gold from Gara underground was produced in 2011. Someopen-pit near surface oxide mining of soft material was undertaken at some of the minor satellite deposits at various times to feed the plant as required.
Gounkoto was discovered through regional exploration in 2009 with first gold being produced at the Gounkoto open pit in 2011. As a result of the discovery of Gounkoto, in 2010 Randgold applied for and was granted the formation of a new exploitation licence that covered the southern half of the former Loulo permit and included the Gounkoto and Faraba deposits. During 2016, an independent undergroundpre-feasibility study was completed as well as a newopen-pit design for the Gounkoto‘Super-Pit’ which incorporated significant push backs and deepening that converted some underground resources and reserves intoopen-pit resources and reserves.
| | |
| 18th September 2018 | | Page 3 |
| | | | |
| | Loulo-Gounkoto Gold Mine Complex NI 43-101 Technical Report | | |
| 1.4 | Geology and Mineralisation |
Loulo-Gounkoto is located within the Kedougou-Kenieba erosional inlier. The inlier is unconformably overlain by Upper Proterozoic sandstones towards the east and further south. The Kenieba inlier contains several significant gold deposits including Sadiola, Yalea, Segala, Tabakoto, and Gounkoto deposits in Mali, and Sabodala in Senegal. The Senegal-Mali shear marks a major break in the geology from shelf carbonates with the Falémé ironstone unit in the west to the sedimentary sequences of the Kofi formation in the east. Loulo-Gounkoto is predominately underlain by the Kofi formation consisting of greywacke, sandstone, argillaceous sandstone, calcareous sandstone and tourmalinised sandstone, sheared greenstone units. This geological setting is the primary host of mines in Burkina Faso, Ghana, Mali, Niger, and Senegal. These deposits tend to have significant strike and depth potential, with exploration concentrating on delineating strike and depth extent, followed by infill drilling within the zones of better continuity and grade.
At Yalea, the main mineralised body is a hosted by the Yalea Shear, where it is intercepted by the Yalea Structure. The Yalea Shear is a brittle-ductile, north-south striking, mineralised fault that transects the Yalea Structure, which is a complex, north to NNE striking shear zones. The Yalea mineralisation is predominantly hosted in hydrothermally brecciated argillaceous pink quartzites situated. A higher grade ‘Purple Patch’ zone is observed in a dilatational strain transfer zone formed as the western dip of the upper mineralised system steepens, forming hydraulic breccias. Economic levels of gold mineralisation are almost exclusively associated with paragenetically late sulphide veins, breccias and zones of massive sulphides. Higher grade material commonly contains sulphide veins which cut the various generations of albite ± carbonate alteration. There is a strong correlation between sulphide intensity and gold mineralisation with the dominant sulphide phases consisting of pyrite (abundant), arsenopyrite and minor chalcopyrite. The sulphides can be disseminated or massive along fabric.
Yalea mineralisation, remains open at depth and to the south with potential for significant high-grade extensions. To the south of the ‘Purple Patch’ zone the Yalea Shear forms asub-horizontally plunging transfer zone where the competency contrast of the footwall argillaceous quartzites (SQR) contact causes a transfer of strain associated with normal movement. Consequently, this transfer creates dilatational hydraulic breccias with the potential to host significant high-grade extensions.
Gara (previously known as Loulo 0) is hosted within an intensely tourmaline greywacke unit which outcrops on surface due to its high resistance to weathering. The geometry of the mineralisation is subjugated by the strike slip shearing on Senegal-Mali shear. This shearing has resulted in folding, fracturing, brecciation, and subsequent development of a quartz-carbonate vein stockworks within the brittle-ductile tourmaline altered greywacke forming what has been termed quartz tourmaline (QT) unit. On a regional scale the Gara deposit spans the hinge of a broad open fold with a gently-plunging north-south trending axis. On the deposit scale the upper limb of this fold dips has a westerly dip, whereas the lower limb dips east.
| | |
| 18th September 2018 | | Page 4 |
| | | | |
| | Loulo-Gounkoto Gold Mine Complex NI 43-101 Technical Report | | |
The distribution of gold grade in long section reflects the varying degrees of fracturing, brecciation, and subsequent development of a quartz-carbonate vein stockworks from multiple generations of folding. Gold mineralisation is strata-bound and hosted predominantly within the quartz-tourmaline stockwork veins, which are enveloped within footwall greywackes and hanging wall sandstone. Higher gold grades values typically occur where the intensity of tourmalisation and stockwork veining are strongest. The sulphide assemblages predominantly consists of disseminated auriferous pyrite with minor chalcopyrite, scheelite, and nickeliferous sulphides.
In the open pit area, the high-grade mineralisation is concentrated along thesub-horizontal fold hinge axes, whereas within the underground area, high-grade mineralisation plunges shallowly southward, parallel to the large scale open warp fold axis . These differential orientations of mineralisation are a result of the earlier, deposit scale warping locally influencing the geometry of the superimposed “S folds” during their formation.
Baboto is a shear hosted deposit situated along a north-south striking shear structure located approximately 14 km NNE from the Yalea deposit. Baboto is dominated by a thick sequence of metasediments and structural breccias. The main shear zones are vertical to steeply west dipping at Baboto South and sub vertical in Baboto Centre. Gold mineralisation is mainly associated with the finely disseminated pyrite occurring in the brittle-ductile shear breccias, which generally have a lensoidal shape defined by a series ofsub-parallelN-S shears that follow key lithological contacts.
Loulo 3 is located 4 km NNE of the Yalea mine. Loulo 3 consists of three mineralised zones: a NNW trending main zone (MZ1) which is situated on the Loulo 3 structure and is transected by the NNE striking main zone (MZ2), which is situated on the Yalea structure, and the third small sub parallel NW striking footwall zone. Mineralisation consists of a mixture of quartz and hematite veinlets hosted in a zone of silica-carbonate alteration within local tourmaline alteration in the south. The distribution of high-grade zones is controlled by the narrowing of the host stratigraphy package, which focusses strain and fluid flow, causing the hematite rich Yalea Structure to interact with the silica-carbonate Loulo 3 Structure particularly within MZ2. Gold bearing sulphides predominantly consist of pyrite and arsenopyrite, with chalcopyrite occurring as a latenon-gold bearing phase. Gara West is located 200 m west of the pit at Gara and is characterised by predominantly shear and breccia hosted mineralisation within a medium to coarse grained sandstone unit that is variably altered with tourmaline, chlorite, and silica-carbonate. The sandstone hosts four mineralised lodes striking NNE and dipping moderately westward. The gold mineralisation is strata bound as it has been preferentially altered with tourmaline (and silica-albite), due to the increased porosity of the protolith, relative to the bounding limestone in both the hanging wall and footwall.
Other minor satellite deposits are present within the Loulo Permit, these exhibit similar geological characteristics to the other major deposits outlined above.
Gounkoto is a large NNW trending shear zone, with a complex assemblage of ductile shear breccias, shears, and faults characterised by a stepped geometry, with wider zones of mineralisation generally seen on the NW trending structures and narrower zones on the north-south trending structures. This is believed to be related to dilation across these structures in a
| | |
| 18th September 2018 | | Page 5 |
| | | | |
| | Loulo-Gounkoto Gold Mine Complex NI 43-101 Technical Report | | |
strong sinistral strain environment. The mineralisation is generally hosted in a siliceous ‘Rose Quartzite’ (QR) unit. The mineralisation is subdivided based on the structural and lithological characteristics. From north to south, these are:
| | ● | | Northern Zone: a narrow package of limestone-hosted mineralisation between hanging wall and footwall shear zones striking NNE and dipping steeply to the east. Mineralisation is of intermediate thickness and grade relative to the rest of the deposit. |
| | ● | | Jog Zone: a broad assemblage of repeated stacked gritty QR units, structurally offset from one another creating a stepped geometry, generally striking NNW. Upright flower structures have created an apparent thickening of units, forming wide mineralised zones of high-grade. |
| | ● | | Pinch Zone: a narrow package ofQR-hosted mineralisation between hanging wall and footwall shear zones striking NS and dipping steeply east close to the surface but shallows in dip at depth. The mineralisation is generally narrow andlow-grade. |
| | ● | | Wrench Zone: a broad package ofQR-hosted strongly mineralised lodes between hanging wall and footwall shear zones striking NW and dipping 40° to 50° east. |
| | ● | | Southern Zone: a narrow package ofQR-hosted mineralisation between hanging wall and footwall shear zones striking NS and dipping steeply east. The mineralisation is generally narrower and lower grade than the Northern and Wrench Zones. |
The Faraba deposit strikes NNW and is comprised of several zones of gold mineralisation hosted within and along the contacts of north-south striking, coarse grained, gritty sandstone units (lithic wackes) in a package of sheared argillaceous sediments. Lithologic layering (transposed bedding) dips steeply westward; however, the mineralised zones dip steeply to the east. The mineralisation terminates where the Faraba Structure meets the argillite units on either side of the sandstones. The resulting mineralisation occurs as numerous silica-carbonate and secondary iron oxide altered sub vertical panels with narrow east-west dimension, each containingsub-horizontal to shallow plunging zones of higher grade. Gold mineralisation is dominantly hosted by pyrite, with local magnetite, chalcopyrite, arsenopyrite and pyrrhotite.
The Project has been explored by Syndicat Or and the BRGM and more recently by BHP. Since Randgold’s acquisition of the Permit in 1996, significant exploration has been undertaken to develop both brownfields and greenfields targets. Sampling has primarily been undertaken through reverse circulation (RC) drilling, along with diamond drilling and trenching. Rotary air blasted (RAB) drilling has also been undertaken on some early stage exploration targets, although RAB drilling is not included in the Mineral Resource estimate.
Since 1993 the following sampling has been undertaken at Loulo:
| | ● | | Diamond Drilling – 3,035 drill holes for 647,663 m |
| | ● | | RC – 10,461 drill holes for 414,012 m |
| | ● | | RAB – 4,438 drill holes for 103,720 m |
| | ● | | Trenches – 931 cuts for 49,241 m |
| | ● | | Underground Channels – 5,067 channels for 35,825 m |
| | |
| 18th September 2018 | | Page 6 |
| | | | |
| | Loulo-Gounkoto Gold Mine Complex NI 43-101 Technical Report | | |
| | ○ | | Total Sampling – 1,250,460 m |
Exploration at Loulo-Gounkoto is focussed on advancing both brownfields and greenfields targets. Brownfields exploration involves testing underground and open pit extensions of the current Mineral Resources for high-grade mineralisation based on the structural model. The current exploration concept has been proven to be effective, with both the discovery of Gounkoto and the successful replenishment of depleted Mineral Resources and Ore Reserves at both mines.
The Mineral Resource estimates have been prepared according to the guidelines of the Australasian Code for Reporting of Exploration Results, Mineral Resources and Ore Reserves standards and guidelines published and maintained by the Joint Ore Reserves Committee of the Australasian Institute of Mining and Metallurgy and the Australian Institute of Geoscientists and Minerals Council of Australia (the JORC (2012) Code). Randgold has reconciled the Mineral Resources and Ore Reserves to Canadian Institute of Mining, Metallurgy and Petroleum (CIM) 2014 Definition Standards for Mineral Resources and Mineral Reserves dated May 10, 2014 (CIM (2014) Standards) as incorporated with NI43-101 and there are no material differences.
Quality assurance and quality control (QA/QC) has been undertaken across the life of exploration to minimise errors. A standard operating procedure (SOP) outlines Randgold’s approach to QA/QC which meets industry best practice. The results from the 2017 QA/QC program show that the performance of the SGS Loulo laboratory is meeting industry standards and the resulting data is suitable for use within a Mineral Resource estimate.
Thecut-off grade selected for limiting each of the Mineral Resources corresponds to the insitu marginalcut-off grade using a gold price of $1,500/oz.
For the open pit Mineral Resources, the pit shell selected for limiting of each of the Mineral Resources corresponds to a gold price of $1,500/oz. As a result of the optimisation process, this pit shell selection will result in the highest undiscounted net present value of the deposit, at $1,500/oz.
Underground panels were reviewed and those that were deemed as having a reasonable prospect of eventual economic extraction were included in the reported Mineral Resource.
The Qualified Person is not aware of any environmental, permitting, legal, title, socioeconomic, marketing, fiscal, metallurgical, or other relevant factors, which could materially affect the Mineral Resource estimate.
Loulo
For the year end 2017 Mineral Resource update the Yalea and Gara underground resource models have been updated due to a significant quantity of new data from grade control and surface drilling. Additionally, open pit resources of Baboto open pit designs have been updated,
| | |
| 18th September 2018 | | Page 7 |
| | | | |
| | Loulo-Gounkoto Gold Mine Complex NI 43-101 Technical Report | | |
with new geological models and review of estimation methodology based on additional drilling. There has been no change to other satellite projects such as Loulo 3 and Gara West since the Mineral Resources declared in year end 2016.
As of 31st December 2017 (100% basis) the Measured and Indicated Mineral Resources for the Loulo Gold Mine are estimated to be 53 Mt at 4.64 g/t Au for 7.9 Moz of gold, with an additional Inferred Mineral Resource of 12 Mt at 3.9 g/t Au for 1.6 Moz of gold (Table1-1). These Mineral Resources have been depleted to 31stDecember 2017 using themined-out surfaces and voids.
Table1-1 Mineral Resource Statement for the Loulo Gold Mine as of 31st December 2017
| | | | | | | | | | |
| Source | | Mineral Resource | | Tonnes (Mt) | | Grade (g/t) | | Ounces (Moz) | | *Attributable Gold (Moz) |
| Stockpiles | | Measured | | 1.7 | | 1.60 | | 0.086 | | 0.068 |
Open Pit | | Measured | | 1.9 | | 2.67 | | 0.17 | | 0.13 |
| | Indicated | | 6.9 | | 3.08 | | 0.69 | | 0.55 |
| | Inferred | | 2.5 | | 3.3 | | 0.27 | | 0.21 |
Underground | | Measured | | 17 | | 4.99 | | 2.7 | | 2.1 |
| | Indicated | | 26 | | 5.18 | | 4.3 | | 3.4 |
| | Inferred | | 9.8 | | 4.1 | | 1.3 | | 1.0 |
Total | | Measured | | 20 | | 4.49 | | 2.9 | | 2.3 |
| | Indicated | | 33 | | 4.73 | | 5.0 | | 4.0 |
| | Measured + Indicated | | 53 | | 4.64 | | 7.9 | | 6.3 |
| | Inferred | | 12 | | 3.9 | | 1.6 | | 1.3 |
*Attributable gold (Moz) refers to the quantity attributable to Randgold based on Randgold’s 80% interest in Loulo Gold Mine.
Mineral Resources are reported on an 100% and attributable basis.
The Mineral Resource estimate has been prepared according to JORC (2012) Code. Randgold has reconciled the Mineral Resources to CIM (2014) Standards, and there are no material differences.
All Mineral Resource tabulations are reported inclusive of that material which is then modified to form Ore Reserves.
Open pit Mineral Resources are those within a $1,500/oz pit shell at an averagecut-off grade of 0.7 g/t Au.
Underground resources are those below the $1,500/oz pit shell at acut-off grade of 1.89 g/t Au at Gara and 2.04 g/t Au at Yalea.
Mineral Resources for Loulo were generated by Mr Simon Bottoms, CGeol, an officer of the company and Qualified Person.
Numbers may not add due to rounding.
Resource definition drilling in Gara Far South extension to the south of the Gara Far South underground resource, has converted previously Inferred Resources to Indicated classification. Additional resource drilling in Yalea South has also upgraded previously Inferred Resources to Indicated classification.
Gounkoto
For the year end 2017 Mineral Resource update the Gounkoto open pit and underground models have been updated due to a significant quantity of new data from grade control and surface drilling. There has been no change to the Faraba open pit resource as no additional exploration was undertaken on the deposit.
As of 31st December 2017 (100% basis) Gounkoto Measured and Indicated Mineral Resources are estimated to be 28 Mt at 4.15 g/t Au for 3.7 Moz, with an additional 4.0 Mt at 3.1 g/t Au for 0.4 Moz of Inferred material (Table1-2). The Mineral Resources consist of Gounkoto open pit and underground Mineral Resources, surface stockpiles, and Faraba open pit. These Mineral Resources have been depleted to 31st December 2017 using themined-out surfaces and voids.
| | |
| 18th September 2018 | | Page 8 |
| | | | |
| | Loulo-Gounkoto Gold Mine Complex NI 43-101 Technical Report | | |
Table1-2 Mineral Resource Statement for the Gounkoto Gold Mine as of 31st December 2017
| | | | | | | | | | |
| Source | | Mineral Resource | | Tonnes (Mt) | | Grade (g/t) | | Ounces (Moz) | | *Attributable Gold (Moz) |
Stockpiles | | Measured | | 1.8 | | 1.96 | | 0.11 | | 0.089 |
Open Pit | | Measured | | 5.4 | | 4.33 | | 0.75 | | 0.60 |
| | Indicated | | 18 | | 4.04 | | 2.3 | | 1.9 |
| | Inferred | | 1.4 | | 2.3 | | 0.11 | | 0.08 |
Underground | | Indicated | | 3.0 | | 5.74 | | 0.56 | | 0.45 |
| | Inferred | | 2.6 | | 3.5 | | 0.29 | | 0.23 |
Total | | Measured | | 7.1 | | 3.75 | | 0.86 | | 0.69 |
| | Indicated | | 21 | | 4.28 | | 2.9 | | 2.3 |
| | Measured + Indicated | | 28 | | 4.15 | | 3.7 | | 3.0 |
| | Inferred | | 4.0 | | 3.1 | | 0.40 | | 0.32 |
*Attributable gold (Moz) refers to the quantity attributable to Randgold based on Randgold’s 80% interest in Gounkoto Gold Mine. Mineral Resources are reported on an 100% and attributable basis.
The Mineral Resource estimate has been prepared according to JORC (2012) Code. Randgold has reconciled the Mineral Resources to CIM (2014) Standards, and there are no material differences.
All Mineral Resource tabulations are reported inclusive of that material which is then modified to form Ore Reserves.
Open pit Mineral Resources are those within a $1,500/oz pit shell at an averagecut-off grade of 0.8 g/t Au.
Underground Mineral Resources are those below the $1,500/oz pit shell at acut-off grade of 2.0 g/t Au.
Mineral Resources for Gounkoto were generated by Mr Simon Bottoms, CGeol, an officer of the company and Qualified Person.
Numbers may not add due to rounding.
A decrease of approximately 200 koz resources from the year end 2016 Mineral Resource estimate to the 2017 Resource Estimate is directly attributable to the 2017 open pit mining depletion which was partially replenished through positive model changes defined by grade control drilling in 2017.
The Ore Reserve estimates have been prepared according to the guidelines of the Australasian Code for Reporting of Exploration Results, Mineral Resources and Ore Reserves standards and guidelines published and maintained by the Joint Ore Reserves Committee of the Australasian Institute of Mining and Metallurgy and the Australian Institute of Geoscientists and Minerals Council of Australia (the JORC (2012) Code). Randgold has reconciled the Mineral Resources and Ore Reserves to Canadian Institute of Mining, Metallurgy and Petroleum (CIM) 2014 Definition Standards for Mineral Resources and Mineral Reserves dated May 10, 2014 (CIM (2014) Standards) as incorporated with NI43-101 and there are no material differences.
The Ore Reserve estimates use updated economic factors, the latest resource and geological models, geotechnical inputs, and the latest metallurgical updates. Some inputs were shared across all the operations during the preparation of the Ore Reserve estimates. Ore Reserves were based on the development of appropriately detailed and engineered life of mine (LOM) plans. All design and scheduling work was undertaken to a suitable level of detail by experienced engineers using mine planning software. The planning process incorporated appropriate modifying factors and the use ofcut-off grades and other technical-economic investigations. Ore Reserves are stated:
| | ● | | As of 31st December 2017 |
| | ● | | At a gold price of $1,000/oz |
| | ● | | AsRun-of-Mine (ROM) grades and tonnage as delivered to the fully diluted and delivered to the plant |
| | |
| 18th September 2018 | | Page 9 |
| | | | |
| | Loulo-Gounkoto Gold Mine Complex NI 43-101 Technical Report | | |
| | ● | | Including only Measured and Indicated Mineral Resources. |
The average dilution for the underground deposits ranged from 10% to 25%, with mining losses estimated at 4% to 8%. The average dilution for the open pit deposits was 10% with mining losses estimated at 3% to 4%.
The Qualified Person has performed an independent verification of the block model tonnes and grade, and in their opinion, the process has been carried out to industry standards.
The Qualified Person is not aware of any environmental, legal, title, socioeconomic, marketing, mining, metallurgical, fiscal, infrastructure, permitting, that could materially affect the Ore Reserve estimate.
Loulo
The year end 2017 (100% basis) Loulo total Proved and Probable Ore Reserves are estimated to be 36 Mt at 4.51 g/t Au containing 5.2 Moz of gold of which 4.1 Moz are attributable to Randgold.
The Ore Reserves estimate for Loulo as of 31st December 2017 are detailed in Table1-3.
Table1-3 Ore Reserve Statement for the Loulo as of 31st December 2017
| | | | | | | | | | |
| Source | | Ore Reserve | | Tonnes
(Mt) | | Grade g/t | | Gold
(Moz) | | *Attributable
Gold (Moz)* |
Stockpiles | | Proved | | 1.7 | | 1.60 | | 0.086 | | 0.068 |
Open Pit | | Proved | | 1.5 | | 2.43 | | 0.12 | | 0.093 |
| | Probable | | 3.9 | | 3.87 | | 0.48 | | 0.39 |
| | Proved + Probable | | 5.4 | | 3.47 | | 0.60 | | 0.48 |
Underground | | Proved | | 8.8 | | 4.97 | | 1.4 | | 1.1 |
| | Probable | | 20 | | 4.82 | | 3.1 | | 2.5 |
| | Proved + Probable | | 29 | | 4.87 | | 4.5 | | 3.6 |
Total | | Proved | | 12 | | 4.18 | | 1.6 | | 1.3 |
| | Probable | | 24 | | 4.67 | | 3.6 | | 2.9 |
| | Proved + Probable | | 36 | | 4.51 | | 5.2 | | 4.1 |
*Attributable gold (Moz) refers to the quantity attributable to Randgold based on Randgold’s 80% interest in the Loulo Gold Mine. Ore Reserves are reported on a 100% and attributable basis.
The Ore Reserve estimate has been prepared according to JORC (2012) Code. Randgold has reconciled the Ore Reserves to CIM (2014) Standards, and there are no material differences.
Open pit Ore Reserves are reported at a gold price of $1,000/oz and an averagecut-off grade of 1.1 g/t Au including dilution and ore loss factors.
Underground Ore Reserves are reported at a gold price of $1,000/oz and acut-off grade of 2.69 g/t Au for Yalea and 2.4 g/t Au for Gara including dilution and ore loss factors.
Open pit and underground Ore Reserves were estimated by Mr. Derek Holm, FSAIMM, an external consultant and Qualified Person.
Numbers may not add due to rounding.
Loulo year end 2017 Ore Reserve estimate shows a net reduction of 85 koz when compared to the estimate for year end 2016. This is entirely attributed to the sale of Baboto North. The 0.54 Moz annual depletion for the year was replenished through:
| | ● | | 0.18 Moz increase in the Yalea South Ore Reserves with resource conversion drilling which has resulted in the extension of the Yalea South decline to-620 mRL; |
| | ● | | 0.39 Moz increase in the Gara Ore Reserve from the conversion drilling to the south of Gara (Gara Far South Extended). |
| | |
| 18th September 2018 | | Page 10 |
| | | | |
| | Loulo-Gounkoto Gold Mine Complex NI 43-101 Technical Report | | |
Gounkoto
The year end 2017 (100% basis) Gounkoto Proved and Probable Ore Reserves are estimated to be 20 Mt at 4.58 g/t Au containing 3.0 Moz of gold, of which 4.1 Moz are attributable to Randgold.
The Ore Reserves estimate for Gounkoto as of 31st December 2017 is presented in Table1-4.
Table1-4 Ore Reserve Statement for Gounkoto as of 31st December 2017
| | | | | | | | | | |
| Source | | Ore Reserve | | Tonnes
(Mt) | | Grade g/t | | Gold
(Moz) | | Attributable
Gold (Moz)* |
Stockpiles | | Proved | | 1.8 | | 1.96 | | 0.11 | | 0.099 |
Open Pit | | Proved | | 4.4 | | 4.75 | | 0.66 | | 0.53 |
| | Probable | | 12 | | 4.63 | | 1.8 | | 1.4 |
| | Proved + Probable | | 16 | | 4.66 | | 2.4 | | 1.9 |
Underground | | Proved | | - | | - | | - | | - |
| | Probable | | 2.2 | | 6.09 | | 0.42 | | 0.34 |
| | Proved + Probable | | 2.2 | | 6.09 | | 0.42 | | 0.34 |
Total | | Proved | | 6.1 | | 3.95 | | 0.78 | | 0.62 |
| | Probable | | 14 | | 4.85 | | 2.2 | | 1.7 |
| | Proved + Probable | | 20 | | 4.58 | | 3.0 | | 2.4 |
*Attributable gold (Moz) refers to the quantity attributable to Randgold based on Randgold’s 80% interest in the Gounkoto Gold Mine. Ore Reserves are reported on a 100% and attributable basis.
The Ore Reserve estimate has been prepared according to JORC (2012) Code. Randgold has reconciled the Ore Reserves to CIM (2014) Standards, and there are no material differences.
Open pit Ore Reserves are reported at a gold price of $1,000/oz and an averagecut-off grade of 1.1 g/t Au including dilution and ore loss factors.
Underground Ore Reserves are reported at a gold price of $1,000/oz and acut-off grade 3.0 g/t Au including dilution and ore loss factors.
Open pit Ore and underground Reserves were estimated by Mr. Derek Holm, FSAIMM, an external consultant and Qualified Person.
Numbers may not add due to rounding.
The 2017 Gounkoto complex Ore Reserve estimate is 175 koz lower than estimated in 2016 as, although there was annual depletion in 2017 of 336 koz (including stockpiles), this was partially offset by positive model changes defined by infill grade control drilling.
Over the LOM of Loulo-Gounkoto, a total of 52 Mt of ore at 4.73 g/t Au is expected to be produced over 15 years up to 2032. Ore supplied to the plant during this period, including stockpile changes, will be 56 Mt at an average grade of 4.55 g/t Au resulting in 7.5 Moz recovered at an average processing recovery of 92%.
The Yalea underground operation will continue until 2030 and the Gara operation until 2032, with the Loulo open pits mined from 2024 through to 2027. The Gounkoto open pit, also referred to as the ‘Super Pit’, will be mined out in 2024 with the Faraba open pit starting in 2022 and ending in 2024. The Gounkoto underground operation will commence in 2025 and will continue until 2030.
A total of 28.6 Mt of ore will be mined from the Yalea and Gara underground operations with a further 5.4 Mt mined from the Loulo 3, Baboto, and Gara West open pits, at the Loulo Operations. The Gounkoto Operations will contribute 16 Mt mined ore tonnes from the Gounkoto and Faraba open pits with the Gounkoto Underground Operation adding 2.1 Mt.
| | |
| 18th September 2018 | | Page 11 |
| | | | |
| | Loulo-Gounkoto Gold Mine Complex NI 43-101 Technical Report | | |
Both the Loulo and Gounkoto share similar mining methods across their underground and open pit operations.
In the Qualified Person’s opinion, the parameters used in the Mineral Resource to Ore Reserve conversion process are reasonable.
Open Pits
The Loulo Permit are comprised of the Baboto open pit, Loulo 3 open pit, and the Gara West open pit. Baboto oxide and free dig transition ore is scheduled to be mined in 2018, however the rest of the Baboto open pit fresh ore and the other pits will be mined from 2024 onwards, after the larger Gounkoto open pit is depleted. The production from these pits has not been extensively detailed. Randgold intends to use the same contractor that has already mined part of the Baboto open pit, so the fleet requirement is known. The Loulo 3 open pit was mined previously in 2013 and the eastern push back forms the remaining Ore Reserve. Both Loulo 3 and Gara West open pits will use the same equipment as they are timed to be mined consecutively.
Gounkoto is anon-going operation that applies selective mining. Ore is classified as either Full Grade Ore (FGO), delivered to primary crushers, or Marginal Ore (MO), which is stockpiled close to the primary crushers, and blended with the FGO to provide a consistent feed grade. The Gounkoto mining plan has been sequenced in such a way that the south pit will be mined out in advance of the north pit. This will allow the waste mined from the north pit to be backfilled into the south pit resulting in a shorter haul than the conventional route of tramming out of the pit and onto a waste dump. This, however, means excess ore must be mined in 2019 and stockpiled to ensure the plant feed requirements are maintained during the waste pushback mining in years 2020 to 2022.
Open pit mining is conducted by the contractor Gounkoto Mining Services (GMS), a local subsidiary of DTP Terrassement, using eitherfree-dig or conventional drill, blast, load, and haul methods.
The mining equipment is jointly owned by a subsidiary of Randgold and the contractor’s parent, which also operates at Randgold’s Kibali Mine in the DRC and Tongon Mine in Côte d’Ivoire.
The potential ingress of groundwater are investigated prior to mining and continually updated during the mining activities. Prior to commencement of mining, dewatering well systems are installed for all pits to lower the groundwater level and a system of dewatering trenches is established, preventing the inflow of any surface water to the active mining areas.
The upper levels of the open pits are usually in weathered material, which typically is free digging material. Once fresh (unweathered) rock is encountered, drilling and blasting is required. Emulsion explosives are supplied as adown-the-hole service by Maxam.
Free digging in the upper levels is carried out using 5 m high benches, with 10 m benches used for drilling and blasting operations. The 10 m benches containing ore are excavated in three flitches of equal height.
| | |
| 18th September 2018 | | Page 12 |
| | | | |
| | Loulo-Gounkoto Gold Mine Complex NI 43-101 Technical Report | | |
Opportunities exist to upgrade and convert the Inferred Mineral Resources within the current pits to Ore Reserves with drilling, but any Inferred Resources within pit designs are not reported as Ore Reserves.
Underground
The Yalea and Gara underground mines are currently operating and are accessed via portals located in open pits and a box cut. The declines were originally developed as twin declines. One decline containing a conveyor and the second decline is used for mobile equipment access. The lower part of the mines has been developed as single declines with truck haulage up to crushers which feed ore and waste onto the conveyors.
Three mining methods are used at the Yalea and Gara underground mines. They are long hole transverse open stoping; long hole longitudinal retreat open stoping; and stoping under rock fill (SURF). SURF mining is planned to be introduced in the weathered areas of Yalea South Upper.
Previous longitudinal stoping in the upper areas of the mines uses a panel and pillar method, where approximately 10 m long pillars were left between 50 m long panels. In 2014 paste fill plants were commissioned at both mines. The paste fill plants at each of the mines produce a mixed paste / aggregate fill. With the introduction of paste fill the lower areas of the mines are being mined using an underhand (top down) long hole stoping method which retreats to central accesses in an echelon format. Panels are 50 m long, mined as single level stopes (25 m high) and filled with cemented paste fill. The paste fill is exposed by the mining of both the panel below and the next panel on the same level. Transverse long hole open stoping is used in the wider (>15 m wide) parts of Yalea North. Transverse stopes are 15 m to 30 m along strike and mined from hanging wall to footwall.
The SURF method is planned for the portion of Yalea South Upper that has weathered transition or saprolite present in the mineralised zone, or the immediate hanging wall. The method will be used is expected to provide a more consistent production in the less competent ground.
From an operational perspective SURF is very similar to longitudinal sub level caving (SLC). The exception is that in SURF waste rock is tipped into the stope to fill mined voids and prevent caving of the hanging wall. In contrast SLC works by the hanging wall caving to fill the mined void.
A diesel trackless fleet is used for production comprising of 11 LHD’s and trucks, in addition to production drills and development drills.
Gounkoto underground is at apre-feasibility level of study. The proposed mining method for Gounkoto underground consists of longhole bench stoping with backfill. Due to the relatively small reserve tonnage of Gounkoto underground, all attempts to reduce the capital outlay have been adopted. The ore handling method is designed to be decline trucking without underground crushing. This alleviates the need for any capital excavation and underground engineering. Thein-pit portal position reduces the amount of decline development required and pushes the required start date of the decline out to 2025. Utilisation of the pit alleviates the need for a separate box cut development.
| | |
| 18th September 2018 | | Page 13 |
| | | | |
| | Loulo-Gounkoto Gold Mine Complex NI 43-101 Technical Report | | |
The MZ3 mineralisation located on the footwall of the Fault Gouge fault has been removed from the undergroundpre-feasibility schedule due to the poor ground conditions modelled in the area. This has simplified the stoping method, removing the requirement for cut and fill with only longitudinal and transverse benching methods being used depending on the thickness of the ore.
The mine design consists of four mining panels, each consisting of between three to five, 20 m inter- levels. The first level of each panel will consist of 100% high strength cemented aggregate fill (CAF) that will form a backfill sill pillar. Mining stopes are scheduled to mine bottom up from each backfill pillar level, allowing mining from multiple levels at the same time. Backfill sill pillars have been positioned at the base of high-grade areas of the geological grade model to allow for an optimal mining grade profile.
The Loulo processing plant uses a carbon in leach (CIL) gold extraction process with a throughput capacity of 4.8 Mtpa. The Loulo process plant process ore from both Loulo and Gounkoto operations. A simplified flowsheet is seen in Figure1-1, which depicts a standard processing circuit for free-milling ores including conventional circuits for comminution, milling, gravity, classification, and CIL.
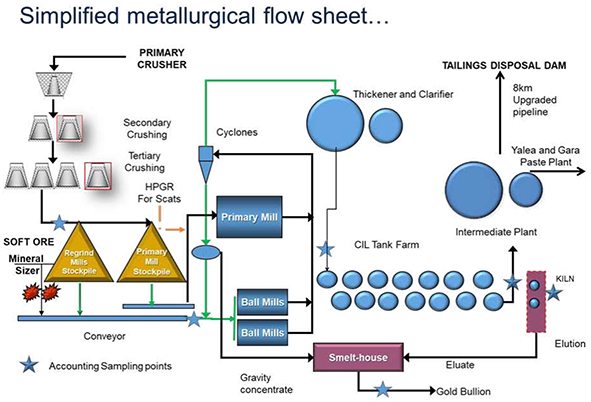
Figure1-1 Simplified Flow Sheet
Forecasted gold processing recovery is based on both testwork and operational history. The Yalea and Gara metallurgical recoveries for remaining LOM have been estimated at 84.5% and 94.5% respectively. The Gounkoto Super Pit testwork and historical operations data has
| | |
| 18th September 2018 | | Page 14 |
| | | | |
| | Loulo-Gounkoto Gold Mine Complex NI 43-101 Technical Report | | |
indicated an estimated recovery of 92.5%. Yalea recovery is impacted by the presence of arsenic and copper which reduce recovery by impacting the process of adsorption of the gold onto the CIL tanks. Arsenic and copper impurities also increase cyanide and oxygen consumption. Consequently, arsenic and copper estimations are completed as part of the Mineral Resource update in order to identify potentially low recovery areas. Gold recovery is maintained above 90% by blending the various ore sources (Yalea / Gara/ Gounkoto) to control copper and arsenic grades in the mill feed.
The current LOM has an average recovery life of mine of 92.3%. The average gold recovery in 2017 was 92.7%, an improvement from 2016 (Figure1-2).
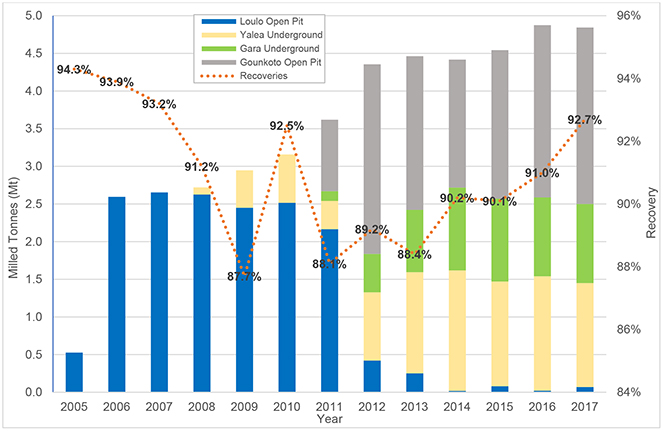
Figure1-2 Loulo-Gounkoto Processing Milled Tonnes by Ore Source
Operating costs for the process plant and plant engineering disciplines are denoted in Table1-5. The total average annual unit cost process cost for Loulo-Gounkoto in 2017 is $17.21 per processed ore tonne.
| | |
| 18th September 2018 | | Page 15 |
| | | | |
| | Loulo-Gounkoto Gold Mine Complex NI 43-101 Technical Report | | |
Table1-5 Actual Process and Plant Engineering Operating Costs for 2016 and 2017
| | | | | | |
Cost | | Units | | 2016 Actual | | 2017 Actual |
Fixed Cost |
Consultants | | $ ‘000 | | 166 | | 153 |
Contractors - Assays | | $ ‘000 | | 742 | | 798 |
Contractors - Other | | $ ‘000 | | 1,217 | | 1,358 |
Contractors - Oxygen | | $ ‘000 | | 2,312 | | 2,680 |
Equipment Hire | | $ ‘000 | | 2,537 | | 2,523 |
General Costs | | $ ‘000 | | 1,142 | | 1,520 |
Gold Refining | | $ ‘000 | | 1,564 | | 1,646 |
Labour | | $ ‘000 | | 2,831 | | 3,653 |
Stores - Electrical & Mechanical | | $ ‘000 | | 1,666 | | 1,626 |
Stores - Other | | $ ‘000 | | 5,536 | | 5,366 |
Total Fixed Cost | | $ ‘000 | | 19,712 | | 21,323 |
Tonnes Processed | | 1000 | | 4,875 | | 4,918 |
Total Fixed Cost | | $/t | | 4.04 | | 4.34 |
Variable Cost |
Power | | $/t | | 5.49 | | 6.21 |
Reagents - Cyanide | | $/t | | 1.63 | | 1.26 |
Reagents - Lime | | $/t | | 0.77 | | 0.62 |
Good Issues - Caustic Soda | | $/t | | 0.11 | | 0.15 |
Good Issues - Activated Carbon | | $/t | | 0.16 | | 0.13 |
Reagents - Other | | $/t | | 0.33 | | 0.34 |
Stores - Grinding Media | | $/t | | 1.93 | | 1.92 |
Stores - Screens & Panels | | $/t | | 0.04 | | 0.04 |
Total Variable Costs | | $/t | | 10.46 | | 10.67 |
| |
Total Process Cost | | $/t | | 14.50 | | 15.01 |
|
Plant Engineering | | $/t | | 2.19 | | 2.20 |
| |
Combined Plant & Engineering | | $/t | | 16.69 | | 17.21 |
Loulo-Gounkoto has demonstrated successful operation both in terms of processing throughput and in particular with gold recovery. In the opinion of the Qualified Person, no fatal flaws have been identified with this facility and it is expected to deliver an average of 4.75 Mtpa over the LOM as per the forecast.
| 1.10 | Project Infrastructure |
Primary access for staff and plant to Loulo-Gounkoto is via the recently constructed (2011) Millennium highway that runs from Dakar, Senegal to Bamako, Mali, which acts as the primary supply chain route. The Millennium Highway crosses the Loulo to Gounkoto haul road approximately 6 km north of Gounkoto and provides excellent road connections in comparison to much of the country.
Daily flights with international air carriers are available from Dakar and Bamako. Charter flights between Bamako and the (unsealed) airstrip at the mine are available, when required. The landing strip at Loulo is approximately 1.5 km long and built from laterite material. It can accommodate moderate sized aircraft and has been awarded full certification by the transport authorities in Mali.
The climate at Loulo-Gounkoto is strongly influenced by the north and southward movement of the Inter Tropical Convergence Zone (ITCZ) which creates distinctive wet and dry seasons.
| | |
| 18th September 2018 | | Page 16 |
| | | | |
| | Loulo-Gounkoto Gold Mine Complex NI 43-101 Technical Report | | |
Although the annual evaporation thereby exceeds the annual rainfall, an excess of water is available during the peak of the wet season (July to September) to generate surface water runoff. Water is sourced for the Project from the Gara and Falémé rivers which run through the Project site. Climatic conditions do not materially affect either exploration, development, or mining operations.
The Loulo-Gounkoto mine site is an operating mine site comprising open pit and underground mines, a processing plant, satellite deposits and associated infrastructure. Previously mined open pits remain open and are used to access the underground mine. Waste dumps are situated adjacent to the open pits. The plant and offices and accommodation village are located east of the Gara pit.
The Tailings Storage Facility (TSF) is located 8 km to the east of the plant in an area with a number of natural ridges. It has been designed to maintain a minimum freeboard of 1.5 m to provide sufficient storage to contain a 1 in 50 year rainfall event over a72-hour period.
Power is generated on site using light and heavy fuel generators. Installed thermal capacity is 64 MVA with a power draw that is variable but in the region of 42 MW. Substantial infrastructure already exists at Loulo-Gounkoto as a result of the long-established open pit mining operation. This includes ore processing and tailings facilities, workshops offices, and camps. Mobile telephone services are available across the mine.
Financial evaluation of all Ore Reserves uses a gold price of $1,000/oz and all open pit reserves are estimated within pit designs based on a gold price of $1,000/oz. This is in line with Randgold corporate guidelines. Gold price sensitivities were run for all the pits.
Financial evaluation andcut-off grade calculation for the Loulo and Gounkoto underground Ore Reserves has been based on a gold price of $1,000/oz. This is the same value used for all previous underground Ore Reserves estimates from 31st December 2011 onwards.
Royalties payable to the Malian government remain unchanged from completion of the feasibility in 2012. A total royalty payable to the Malian government of 6% of gold was used for the open pit and underground Ore Reserve estimates.
Loulo-Gounkoto pay income tax at a rate of 30% to the Malian government.
Gold doré produced at the mine site is shipped from site under secured conditions and sold under agreement to a refinery. Under the agreement, Randgold receives the ruling gold price on the day after dispatch, less refining and freight costs, for the gold content of the doré gold. Randgold has an agreement to sell all gold production to only one customer. The “customer” is chosen periodically on a tender basis from a selected pool of accredited refineries and international banks to ensure competitive refining and freight costs. Gold mines do not compete to sell their product given that the price is not controlled by the producers.
| | |
| 18th September 2018 | | Page 17 |
| | | | |
| | Loulo-Gounkoto Gold Mine Complex NI 43-101 Technical Report | | |
| 1.12 | Environmental, Permitting and Social Considerations |
Investigation of environmental and social aspects of open pit and underground mining operations at Loulo and Gounkoto has been undertaken. The Environmental Impact Assessments (EIAs) concluded that no significant impacts were identified which will impact the physical, biological, or social environment. The continuing operations beyond the original life of mine contribute to extending employment of local Malians and growth of the Malian economy.
An environmental management plan (EMP) is in place, the Loulo operations are ISO 14001 compliant and independently audited to continuously improve environmental management. All environmental permits are in place for the Loulo processing plant and the Yalea / Gara underground mines and the Gounkoto Super Pit. The site is also audited against the requirements of the International Cyanide Management Code.
Waste rock is generated from the open pit and underground operations; the waste rock dump at Gounkoto is close to the Falémé River which forms the border with Senegal. The waste dump has been carefully designed to minimise seepage and a collection system is in place. Waste rock will also be disposed of into the southern portion of the Gounkoto Super Pit to minimise surface disposal.
Waste rock geochemistry has been studied and revealed potential acid rock drainage (ARD) generation and metals leaching from specific lithologies. However, this is closely monitored and no significant ARD issues have occurred.
Tailings are generated from the Loulo plant and disposed of in the tailings storage facility (TSF) some 8 km east of the plant. The relevant Environmental and Social Impact Assessment (ESIA) and Management Plan for permitting requirements are underway for the expansion of the current TSF.
Routine environmental monitoring takes place across the site, including dust deposition, noise, arsenic, and weak-acid dissociated (WAD) cyanide sampling, TSF seepage water and tails streams as well as sample collection of drinking water, ground water, surface water and the TSF borehole water.
Environmental incidents are noted in a register which forms part of the Environmental Management System (EMS); the causes and responses are identified, and once completed, the incident is closed out.
A water balance model has been developed for Loulo which models flows, inputs and losses, including the open pits and underground workings, plant, TSF, water management structures, offices, camp, and treatment facilities.
Mine closure costs are updated each year, with increases or decreases in disturbed areas noted and costed; the current cost for rehabilitation and closure of the mine according to the calculation model is $29.4 M for Loulo and an additional $9.7 M for Gounkoto.
| | |
| 18th September 2018 | | Page 18 |
| | | | |
| | Loulo-Gounkoto Gold Mine Complex NI 43-101 Technical Report | | |
Randgold continually engages with local communities and focuses on potable water supplies, primary school education, health care and education. The mine is a significant employer to members of the local communities. The underground mining operations contribute to extended life of mine, employment of local Malians and the growth of the Malian economy. Randgold’s policy is to promote nationals to manage the Project. Unskilled labour is typically sourced from the local area while more skilled posts are filled by staff from elsewhere in Mali, including Bamako.
Local procurement is also promoted and is a requirement of contractors as well as Randgold. Where possible, goods and services are procured locally. This includes produce from an agribusiness started by Randgold which is purchased for use in the mine canteens.
Stakeholder engagement activities, community development projects and local economic development initiatives contribute to the maintenance and strengthening of the Loulo-Gounkoto Social License to Operate (SLTO). A grievance mechanism is in place. No grievances were received in 2017; the last grievance was recorded in 2015. Through the stakeholder engagement process, concerns are raised by the community.
There is a significant ongoing presence of artisanal miners (orpailleurs) operating within the Loulo Permit area, particularly along the haul road. Artisanal miners or small-scale miners (ASM) represent a significant portion of local households’ livelihood. The government of Mali, as part owners of the operations, provide security in the form of Gendarmes who intervene on request if ASM activities interfere with the operation of the mine. The mining industry in Mali has established a committee to deal with the issue at the highest level of the Government.
The Qualified Persons consider the extent of all environmental liabilities to which the property is subject to have been appropriately met.
Loulo-Gounkoto is anon-going combined open pit and underground mining operation with the necessary facilities, equipment, and manpower in place to produce gold.
The open pit and underground LOM and capital and operating cost estimates have been completed in sufficient detail to be satisfied that economic extraction of the Proved and Probable Ore Reserves is justified.
The majority of the capital cost estimates contained in this report are based on quantities generated from the open pit and underground development requirements and data provided by Randgold.
Capital expenditure over the remaining LOM is estimated to be $598M. A breakdown of the expenditure is detailed in Table1-6.
| | |
| 18th September 2018 | | Page 19 |
| | | | |
| | Loulo-Gounkoto Gold Mine Complex NI 43-101 Technical Report | | |
Table1-6 LOM Capital Expenditure
| | |
| Capital Expenditure | | Cost ($ M) |
Construction and Project Capital | | 1.4 |
Ongoing Capital | | 107 |
Underground Capital Development and Drilling | | 311 |
Pre-Production Capitalised | | 137 |
Exploration Capitalised | | 2.9 |
Rehabilitation/Mine Closure | | 39 |
Total | | 598 |
Loulo-Gounkoto maintains detailed operating cost records that provides a foundation for estimating future operating costs. Costs used for the open pit optimisations were derived from the Mining Contractor’s pricing of the open pit LOM schedule.
Labour costs for national employees were based on actual costs. Local labour laws regarding hours of work, employment conditions were also considered, and overtime costs included.
During 2017 costs for processing and general and administration (G&A) were updated based on actuals adjusted with the latest forward estimates, production profiles and manning levels.
Customs duties, taxes, charges, and logistical costs have been included.
The LOM combined open pit and underground operating cost for Loulo is estimated to be $68.90/t milled and for Gounkoto it is estimated to be $68.49/t. Unit costs used to estimate LOM operating costs are summarised in Table1-7.
Table1-7 LOM Operating Costs for Loulo and Gounkoto
| | | | | | |
| Activity | | Units | | Loulo | | Gounkoto |
Open Pit Mining | | $/t mined | | 2.69 | | 2.64 |
Open Pit Mining | | $/ore t mined | | 34.10 | | 36.95 |
Underground Mining | | $/t mined | | 45.65 | | 57.99 |
Underground Mining | | $/ore t mined | | 46.35 | | 82.40 |
Stockpile Movement | | $/t milled | | -3.63 | | 3.81 |
Processing | | $/t milled | | 18.22 | | 17.03 |
Trucking & Hauling | | $/t milled | | 0.03 | | 5.20 |
G&A | | $/t milled | | 8.30 | | 7.73 |
Mining Total | | $/t milled | | 42.35 | | 38.53 |
Total LOM Net OPEX | | $/t milled | | 68.90 | | 68.49 |
This section is not required as the property is currently in production, Randgold is a producing issuer, and there is no material expansion of current production. RPA has verified the economic viability of the Ore Reserves via cash flow modelling, using the inputs discussed in this report.
| | |
| 18th September 2018 | | Page 20 |
| | | | |
| | Loulo-Gounkoto Gold Mine Complex NI 43-101 Technical Report | | |
| 1.16 | Interpretation and Conclusions |
Geology and Mineral Resources
The Loulo and Gounkoto operation has documented standard procedures for the drilling, logging, and sampling processes which meet industry standards. The geological and mineralisation modelling at Loulo and Gounkoto is based on visibly identifiable geological contacts, which ensure a geologically robust interpretation.
The Loulo and Gounkoto has a quality control program in place to ensure the accuracy and precision of the assay results from the analytical laboratory. Checks conducted on the quality control database indicated that the results are of acceptable precision and accuracy. In the Qualified Person’s opinion, the sample selection, preparation, and analysis are suitable for use within a Mineral Resource estimate.
Geological models and subsequent Mineral Resource estimations have evolved and improved with each successive model update. Significant grade control drill programs and mapping of exposures within mine developments have been completed to increase the confidence in the Mineral Resource and Ore Reserve estimates. During the last three years, significant resource extension drilling has been undertaken at both Yalea and Gara. This has led to the addition of new extensions Yalea Far South, Gara Far South, and Gara Far South Extended, making a major impact towards the replenishment of 2016 and 2017 depletion.
In the Qualified Person’s opinion, both the Loulo Mineral Resources and Gounkoto Mineral Resources top cutting, domaining and estimation approach are appropriate and use industry accepted methods. The Qualified Person’s consider the Mineral Resources at Loulo and Gounkoto are appropriately estimated and classified.
The Qualified Person is not aware of any environmental, permitting, legal, title, socioeconomic, marketing, fiscal, metallurgical, or other relevant factors, which could materially affect the Mineral Resource estimate.
Exploration at Loulo-Gounkoto is focussed on advancing both brownfields and greenfields targets. Brownfields exploration involves testing underground and open pit extensions of the current Mineral Resources for high-grade mineralisation based on the structural model. During 2017, an updated tectonostratigraphy of the Kofi Series rocks at Loulo-Gounkoto has been developed, to improve the model of regional geologic architecture and understanding of key controls of gold deposit formation. This has subsequently driven are-assessment of greenfields exploration targets. The current exploration concept has been proven to be effective, with both the discovery of Gounkoto and the successful replenishment of depleted Mineral Resources and Ore Reserves at both mines.
Mining and Ore Reserves
The open pit operations at Loulo-Gounkoto consists of multiple open pits. The open pits are operated by a mining contractor and adown-the-hole blasting service is provided by an
| | |
| 18th September 2018 | | Page 21 |
| | | | |
| | Loulo-Gounkoto Gold Mine Complex NI 43-101 Technical Report | | |
appropriate blasting contractor. Opportunities exist to upgrade and convert Inferred Mineral Resource within the current pit shells to Ore Reserves with drilling. The open pit operations provide a source of flexibility to supplement the plant feed when required. The Gounkoto open pit mining will be completed in 2024 with the Faraba Pit starting in 2022 and ending in 2024.
The Loulo underground mines are mature operations designed to extract the Yalea and Gara orebodies. The Loulo underground mines use three primary mining methods consisting of long hole transverse open stoping; long hole longitudinal retreat open stoping; and stoping under rock fill (SURF). The Yalea LOM extends to 2028 and Gara to 2032. Yalea and Gara sustain production rates of approximately 1.45 Mtpa and Gara 1.25 Mtpa, respectively.
Gounkoto underground is atpre-feasibility level. The proposed mining method for Gounkoto underground consists of longhole bench stoping with backfill. Due to the relatively small reserve tonnage of Gounkoto underground, all attempts to reduce the capital outlay have been adopted. The MZ3 mineralisation located on the footwall of the Fault Gouge fault has been removed from the schedule due to the poor ground conditions modelled in the area. Construction of the Gounkoto underground operation is currently scheduled to start construction at the end of the open pit mine life in 2024, achieve first production in 2025, and continue until 2030. This is currently expected to be reviewed during 2018. The Gounkoto underground operation will commence in 2025 and will continue until 2030.
Randgold has significant experience in other mining operations within West Africa and the production rates, modification factors, and costs are benchmarked against other West African operations.
The current Ore Reserves for Loulo-Gounkoto support a total mine life of 15 years, mining a total of 52.2 Mt of ore at 4.73 g/t Au until the year 2032. During this15-year period the total plant ore feed tonnage will amount to 56 Mt, including current stockpiles, at an average feed grade of 4.55 g/t Au resulting in 7.5 Moz recovered at an average processing recovery of 92%.
The Qualified Person considers the parameters used in the Mineral Resource to Ore Reserve conversion process to be appropriate.
The Qualified Person is not aware of any environmental, legal, title, socioeconomic, marketing, mining, metallurgical, fiscal, infrastructure, permitting, that could materially affect the Ore Reserve estimate.
Processing
Based upon metallurgical testwork and actual operational data, the Qualified Person is satisfied that Loulo-Gounkoto is able to maintain production, gold recovery and reagent consumptions as forecasted.
The Loulo-Gounkoto has demonstrated successful operation both in terms of processing throughput and in particular with gold recovery. The average gold recovery in 2017 was 92.7%, an improvement over 2016.
| | |
| 18th September 2018 | | Page 22 |
| | | | |
| | Loulo-Gounkoto Gold Mine Complex NI 43-101 Technical Report | | |
Gold recovery from Yalea ore is impacted by the presence of arsenic and copper. Arsenic and copper estimations are completed as part of the Mineral Resource update in order to identify potentially low recovery areas gold recovery.
The current LOM has an average recovery life of mine of 92%. Above 90% recovery is achieved by blending the various ore sources (Yalea / Gara/ Gounkoto) to control copper and arsenic grades in the mill feed.
The Qualified Person considers the modelled recoveries for all ore sources and the process plant and engineering unit costs applied to the Mineral Resource and Ore Reserve process to be acceptable.
Environment and Social
Loulo-Gounkoto has a mature environmental and social management plan and an accredited ISO14001 Environmental Management System in place which addresses current operational needs and can readily be adapted to meet future activities. Mine closure costs are reviewed and revised annually in line with good industry practice.
All permits are in place, and an annual Environmental and Social report compiled in a format aligned with GRI (Global Reporting Initiative) requirements is submitted to the Malian authorities.
Stakeholder engagement is ongoing, and all senior management are involved in regular meetings with the community. The mine prioritises local employment and in 2017 achieved 96% Malian employment across Randgold and contractor workforces.
Randgold continues to invest in community development initiatives, focussing on potable water supplies, primary school education, health care education, investment in medical clinics and local economic development projects, and livelihood projects, such as the program to improve the agricultural yield of the area. The mine is a significant employer to members of the local communities. The mining operations contribute to extendedlife-of-mine, employment of local Malians and the growth of the Malian economy. Randgold’s policy is to promote nationals to manage the Project.
The ongoing presence of artisanal miners (orpailleurs) operating within the Loulo Permit area, has the potential to cause unrest. The government of Mali provides security in the form of Gendarmes who intervene on request if ASM activities interfere with the operation of the mine. The risk of incursion into exploration or operations areas remains, because of the increasing number of people in the largely illegal activity. Dedicated orpaillage corridors have been proposed by the Mine but are still to be created for artisanal and small-scale mining. In the meantime, the Mine is reinforcing its relationships with the community to deal with the issue.
The Qualified Person considers the extent of all environmental liabilities, to which the property is subject, to have been appropriately met.
| | |
| 18th September 2018 | | Page 23 |
| | | | |
| | Loulo-Gounkoto Gold Mine Complex NI 43-101 Technical Report | | |
Ownership
All Permit fees, surface rights fees, and taxes relating to Loulo-Gounkoto exploration and mining rights have been paid to date, and reporting requirements conformed to, accordingly the concession is in good standing At the time of compiling this report, the Qualified Person is not aware of any risks that could result in the loss of ownership of the deposits or loss of the permits, in part or in whole.
Infrastructure
As a result of the long-established open pit mining operation at the Project, substantial infrastructure exists at Loulo-Gounkoto to support theon-going mining and processing operations.
The recently constructed Millennium Highway crosses the Loulo to Gounkoto haul road approximately 6 km north of Gounkoto Road providing access for staff and materials.
There is sufficient power supply capacity available from theon-site light and heavy fuel oil generators to meet the power demands of the operations.
An adequate water supply is available for the operation, sourced from the Gara and Falémé rivers which run through the Project site.
Randgold has undertaken analysis of the Project risks. Table1-8 and Table1-9 summarises the Project risks and the Qualified Person’s assessment of the risk degrees and consequences, as well as ongoing/required mitigation measures. The Qualified Persons, however, note that the degree of risk refers to our subjective assessment as to how the identified risk could affect the achievement of the Project objectives.
Loulo underground has been in production for 11 years and is a mature operation. Gounkoto open pit has been in production for over seven years and is a mature operation. Apre-feasibility study has been completed on Gounkoto Underground.
In the Qualified Persons opinion, there are no significant risks and uncertainties that could reasonably be expected to affect the reliability or confidence in the exploration information, Mineral Resource or Ore Reserve estimates.
Risk Analysis Definitions
The following definitions have been employed by the Qualified Persons in assigning risk factors to the various aspects and components of the Project:
| | ● | | Low– Risks that are considered to be average or typical for a deposit of this nature and could have a relatively insignificant impact on the economics. These generally can be |
| | |
| 18th September 2018 | | Page 24 |
| | | | |
| | Loulo-Gounkoto Gold Mine Complex NI 43-101 Technical Report | | |
| | mitigated by normal management processes combined with minor cost adjustments or schedule allowances. |
| | ● | | Minor – Risks that have a measurable impact on the quality of the estimate but not sufficient to have a significant impact on the economics. These generally can be mitigated by normal management processes combined with minor cost adjustments or schedule allowances. |
| | ● | | Moderate – Risks that are considered to be average or typical for a deposit of this nature but could have a more significant impact on the economics. These risks are generally recognisable and, through good planning and technical practices, can be minimised so that the impact on the deposit or its economics is manageable. |
| | ● | | Major – Risks that have a definite, significant, and measurable impact on the economics. This may include basic errors or substandard quality in the basis of estimate studies or project definition. These risks can be mitigated through further study and expenditure that may be significant. Included in this category may be environmental/socialnon-compliance, particularly in regard to Equator Principles and IFC Performance Standards. |
| | ● | | High – Risks that are largely uncontrollable, unpredictable, unusual, or are considered not to be typical for a deposit of a particular type. Good technical practices and quality planning are no guarantee of successful exploitation. These risks can have a major impact on the economics of the deposit including significant disruption of schedule, significant cost increases, and degradation of physical performance. These risks cannot likely be mitigated through further study or expenditure. |
In addition to assigning risk factors, the QPs provided opinion on the probability of the risk occurring during the LOM. The following definitions have been employed by the QPs in assigning probability of the risk occurring:
| | ● | | Rare– The risk is very unlikely to occur during the Project life. |
| | ● | | Unlikely – The risk is more likely not to occur than occur during the Project life. |
| | ● | | Possible – There is an increased probability that the risk will occur during the Project life. |
| | ● | | Likely – The risk is likely to occur during the Project life. |
| | ● | | Almost Certain – The risk is expected to occur during the Project life. |
| | |
| 18th September 2018 | | Page 25 |
| | | | |
| | Loulo-Gounkoto Gold Mine Complex NI 43-101 Technical Report | | |
Table1-8 Loulo Risk Rating
| | | | | | | | |
| Issue | | Likelihood | | Consequence
Rating | | Risk Rating | | Mitigation |
| | | | | |
Geology andMineralResources
– Confidence
in Mineral Resource Models | | Unlikely | | Minor | | Low | | Additional scheduled infill drilling. Resource model updated on a regular basis using production reconciliation results. |
| | | | | |
Mining and Ore
Reserves
– Open Pit Slope Stability | | Unlikely | | Minor | | Minor | | Continuedin-pit monitoring, geotechnical drilling, instrumentation, and continued updating of geotechnical models. |
| | | | | |
Mining and Ore
Reserves
– Underground Recovery and Dilution | | Possible | | Moderate | | Low | | Extensive production drilling for stope design, including geotechnical features. Predictive modelling of dilution. |
| | | | | |
Processing – Process Water Management with Mine in Water-Positive Mode | | Possible | | Moderate | | Moderate | | Water balance investigations Processing to reduce high usage of fresh water I-plant water treatment has reduced deleterious elements |
| | | | | |
Processing - Baboto oxide effect on paste fill | | Unlikely | | Moderate | | Low | | Several test trials campaigns already successfully completed, which has identified the maximum content of Baboto ore that can accompany a plant feed. Plant trials have demonstrated that blending of oxides, provided that threshold contents are not exceeded, will not compromise the paste plant operation. |
| | | | | |
| | | | | | | | | Temporary holding of supernatant in redundant pits. |
| | | | | |
| | | | | | | | | Expansion of TSF. |
| | | | | |
Environmental – TSF Failure | | Possible | | Moderate | | Moderate | | Plant Water balance being addressed. Pool management and removal of excess water off the dam Continuing monitoring and external or third-party audits. |
| | | | | |
Environmental – Groundwater
contamination (As) | | Possible | | Moderate | | Moderate | | Manage As levels of underground and TSF discharge through appropriate dilution techniques. Recycle contaminated water Continuing monitoring and external or third-party audits. |
| | |
| 18th September 2018 | | Page 26 |
| | | | |
| | Loulo-Gounkoto Gold Mine Complex NI 43-101 Technical Report | | |
| | | | | | | | |
Issue | | Likelihood | | Consequence Rating | | Risk Rating | | Mitigation |
| | | | | |
Social – Social License to Operate | | Possible | | Moderate | | Low | | Regular community and union engagement by company social and sustainability representatives. |
| | | | | |
Social – Artisanal Miners | | Likely | | Moderate | | Moderate | | Engagement with Malian Government.to agree an ASM strategy. Gendarmes securing Permit area. |
| | | | | |
Country & Political – Security – Governmental | | Possible | | Major | | Low | | Dedicated government liaison team in Bamako. Government participation/ownership. |
| | | | | |
Capital and
Operating Costs | | Possible | | Minor | | Low | | Continue to track actual costs and LOM forecast costs, including considerations for inflation and foreign exchange. Owner/Operator for underground mining. |
| | | | | |
| Fiscal Stability | | Possible | | Moderate | | Moderate | | Dedicated government liaison team in Bamako. Government participation/ownership |
| | |
| 18th September 2018 | | Page 27 |
| | | | |
| | Loulo-Gounkoto Gold Mine Complex NI 43-101 Technical Report | | |
Table1-9 Gounkoto Risk Rating
| | | | | | | | |
Issue | | Likelihood | | Consequence
Rating | | Risk Rating | | Mitigation |
Geology and Mineral Resources – Confidence in Mineral Resource Models | | Unlikely | | Minor | | Low | | Additional scheduled infill drilling. Resource model updated on a regular basis using production reconciliation results. |
| | | | | |
Mining and Ore Reserves – Open Pit Slope Stability | | Unlikely | | Major | | Moderate | | Improved blast hole control. Continued in-pit monitoring. |
| | | | | |
Mining and Ore Reserves – Underground Recovery and Dilution | | Possible | | Moderate | | Moderate | | Further studies as part of the Feasibility Study. |
| | | | | |
Environmental – Air Quality (Dust) | | Likely | | Minor | | Moderate | | Dedicated dust suppression on haulage roads. |
| | | | | |
Social – Social License to Operate | | Possible | | Moderate | | Low | | Regular community and union engagement by company social and sustainability representatives. |
| | | | | |
Social – Artisanal Miners | | Likely | | Moderate | | Moderate | | Engagement with Malian Government.to agree an ASM strategy. Gendarmes securing Permit area. |
| | | | | |
Country & Political – Security – Governmental | | Possible | | Major | | Low | | Dedicated government liaison team in Bamako. Government participation/ownership. |
| | | | | |
Capital and
Operating Costs | | Possible | | Minor | | Low | | Continue to track actual costs and LOM forecast costs, including considerations for inflation and foreign exchange. |
| | | | | |
| Fiscal Stability | | Possible | | Moderate | | Moderate | | Dedicated government liaison team in Bamako. Government participation/ownership |
| | |
| 18th September 2018 | | Page 28 |
| | | | |
| | Loulo-Gounkoto Gold Mine Complex NI 43-101 Technical Report | | |
The Qualified Persons make the following recommendations:
| | ● | | To extend the Loulo-Gounkoto life and replace depleted reserves, the current exploration strategy of targeting extensions of existing brownfields targets should be continued. |
| | ● | | A digital logging and data capture system should be implemented in the near future to minimise manual data capture. |
| | ● | | To reduce the complexity ofsub-domaining and improve the quality of local estimation, dynamic anisotropy should be tested and applied to folded bodies in future Mineral Resource updates. |
| | ● | | The application of a variablecut-off grade at Gara should be reviewed to avoid to the inclusion of large tonnages of lower grade material from the deeper levels of the mine impacting the profitability of the Gara operation. |
| | ● | | The Gara Dilution Rating System (DRS) model should be compared to production actuals, in order to establish if it could be directly applied to the Ore Reserve. |
| | ● | | To minimise the possibility of increased mining induced stresses affecting pillar and stope stability, a geotechnical review (including numerical modelling if appropriate) of the current Loulo underground mine plan and stoping sequence should be completed. |
| | ● | | The costs being used to calculate thecut-off grade for Gounkoto underground needs to be updated with the current underground costs and thecut-off grade applied to the next Mineral Resource and Ore Reserve estimates. |
| | ● | | It is recommended that a Qualified Person development programme be implemented at the Loulo-Gounkoto for resource geologists, mining engineers, and metallurgists. |
| | ● | | Loulo-Gounkoto is reliant on its own power generation through thermal energy sources. It is recommended that trials of alternative energy solutions continue to be sought as a potential reduction in power costs could have a material impact on the operating costs and mine life. |
| | ● | | An ASM strategy should be sought with the Malian government, and dedicated ASM corridors defined and managed. |
| | |
| 18th September 2018 | | Page 29 |
| | | | |
| | Loulo-Gounkoto Gold Mine Complex NI 43-101 Technical Report | | |
The purpose of this report is to support the public disclosure of the year end 2017 Mineral Resource and Ore Reserve estimates at the Loulo-Gounkoto Gold Mine Complex (Loulo-Gounkoto, the Mine or the Project), consisting of the Loulo Gold Mine (Loulo) and the Gounkoto Gold Mine (Gounkoto) located in western Mali. This Technical Report conforms to National Instrument43-101- Standards of Disclosure for Mineral Projects (NI43-101). All currency in this report is US dollars ($) unless otherwise noted.
Société des Mines de Loulo SA is an exploration and mining company and the owner of the Loulo mine, which is held 80% by Randgold Resources Limited, (Randgold) and 20% by the state of Mali.
Société des Mines de Gounkoto SA is an exploration and mining company and the owner of the Gounkoto mine which is held 80% by Randgold and 20% by the state of Mali.
Randgold is the operator of Loulo and Gounkoto. Randgold is developing, and operating gold mines in West and East Africa. The most notable of these are the following:
| | ☐ | Morila Gold Mine in Mali. |
| | ☐ | Tongon Gold Mine in Côte d’Ivoire. |
| | ☐ | Kibali Project in Democratic Republic of Congo (DRC). |
| | ☐ | Massawa Exploration Project in Senegal. |
The Project is an operating mine site comprising two underground mines (Yalea and Gara) at Loulo, the Gounkoto open pit mine, satellite deposits, and a processing plant (4.8 Mtpa capacity), together with other associated mine operation and regional exploration infrastructure. The plant produces gold doré bars.
Total mine production from underground and open pits in 2017 was 4.9 Mt at a head grade of 5.0 g/t Au for a total of 730 koz of gold (92.7% recovery).
Total production since mining commenced to year end 2017 is 391 Mt (53 Mt ore) for 5.6 Moz of gold (90.2% recovery).
The effective date of this report is 31st December 2017.
| | |
| 18th September 2018 | | Page 30 |
| | | | |
| | Loulo-Gounkoto Gold Mine Complex NI 43-101 Technical Report | | |
| 2.3 | Sources of Information |
This Technical Report was prepared by Randgold and incorporates the work of Roscoe Postle Associates Ltd (RPA) and Digby Wells and Associates Pty Ltd. (Digby Wells) (QPs). The dates of personal inspections of Loulo-Gounkoto by the QPs are provided in Section 29 of this Technical Report.
The QPs and their responsibilities for this Technical Report are listed in Section 29 Certificate of QP.
| | ● | | Mr. Simon Bottoms, CGeol, MGeol, FGS, MAusIMM (Randgold), is responsible for the preparation of sections 2 to 12, 14, and 23 to 24 of this Technical Report and shares responsibility with hisco-authors for sections 1, 25, 26, and 27. |
| | ● | | Mr. Rodney B. Quick MSc, Pr. Sci.Nat (Randgold), is responsible for the preparation of sections 19, and 22 of this Technical Report and shares responsibility with hisco-authors for sections 1, 21, 25, 26, and 27. |
| | ● | | Mr. Richard Quarmby, BSc, Pr Eng & C Eng, MSAIChE, MIoMMM, MBA (Randgold), is responsible for the preparation of sections 13, 17, and 18 of this Technical Report and shares responsibility with hisco-authors for sections 1, 21, 25, 26, and 27. |
| | ● | | Mr. Derek Holm, BSc, FSAIMM, (RPA) is responsible for the preparation of sections 15 and 16 of this Technical Report, shares responsibility with hisco-authors for sections 1, 25, 26, and 27. |
| | ● | | Mr. Graham E. Trusler, Pr Eng, MIChE, MSAIChE (Digby Wells), is responsible for the preparation of section 20 of this Technical Report and shares responsibility with his coauthors for sections 1, 25, 26, and 27. |
The documentation reviewed, and other sources of information, are listed at the end of this report in Section 27 References.
| | |
| 18th September 2018 | | Page 31 |
| | | | |
| | Loulo-Gounkoto Gold Mine Complex NI 43-101 Technical Report | | |
| | |
| AARL | | Anglo American Research Laboratory |
|
| ACACIA Knelson Concentrates Circuit |
|
| AGC/AdvGC Advance Grade Control |
| |
| ALS | | ALS Laboratories |
|
| AMTEL AMTEL Laboratory, Canada |
| |
| ARD | | Acid Rock Drainage |
| |
| ASM | | Artisanal and Small-Scale Mining |
| |
| BHP | | BHP Minerals |
| |
| BM | | Block Model |
| |
| BRGM | | Bureau de Recherches Géologiques et Minières |
| |
| BRT | | Bottle Roll Test |
| |
| CA | | Confidentiality Agreement |
| |
| CAF | | Cemented Aggregate Fill |
|
| CAPEX Capital Expenditure |
| |
| CIL | | Carbon in Leach |
| |
| CIM | | Canadian Institute of Mining, Metallurgy and Petroleum |
| |
| CIP | | Carbon in Pulp |
| |
| CRF | | Cemented Rock Fill |
| |
| CRM | | Certified Reference Material |
| |
| CSTT | | CSTT AO GROUP |
| |
| CV | | Coefficient of Variation |
| |
| DCS | | Distributed Control System |
|
| DD/DDH Diamond Drill Hole |
| |
| DGPS | | Differential Global Positioning System |
| |
| DL | | Detection Limit |
| |
| DO | | Dissolved Oxygen |
| |
| DRC | | Democratic Republic of the Congo |
| |
| DRS | | Dilution Rating System |
| |
| DTM | | Digital Terrain Model |
| |
| DTP | | DTP Company, subsidiary of Bouygues |
| |
| EDA | | Estimation Data Analysis |
| |
| EGL | | Effective Grinding Length |
| |
| EIA | | Environmental Impact Assessment |
|
| EKATO Supplier of Agitators |
| |
| EMP | | Environmental or Emergency Management Plan |
| |
| EMS | | Environmental Management System |
| | |
| EOM | | End of Month |
| |
| EOY | | End of Year |
| |
| EPS | | Datamine Enhanced Production Scheduler Software |
| |
| ESIA | | Environmental and Social Impact Assessment |
| |
| EW | | Electro-Winning |
| |
| FGO | | Full Grade Ore |
| |
| FW | | Footwall |
| |
| FWFE | | Footwall Far East |
| |
| FWNE | | Footwall North East |
| |
| GC | | Grade Control |
| |
| GFSE | | Gara Far South Extension |
| |
| GM | | General Manager |
| |
| GPS | | Global Positioning System |
| |
| GRI | | Global Reporting Initiative |
| |
| HDPE | | High Density Polyethylene |
| |
| HFO | | Heavy Fuel Oil |
| |
| HPGR | | High Pressure Grinding Rolls |
| |
| HQ | | Barrel Size (63.3 mm) |
| |
| HV | | High Voltage |
| |
| HW | | Hanging Wall |
| |
| ICMC | | International Cyanide Management |
| |
| ID | | Inverse Distance |
| |
| IFC | | International Finance Corporation |
| |
| IMIU | | International Mining Industry Underwriters |
| |
| ITCZ | | Inter Tropical Convergence Zone |
| |
| JORC | | Joint Ore Reserves Committee |
| |
| KC | | Knelson Concentrator |
| |
| KE | | Kriging Efficiency |
| |
| LFO | | Light Fuel Oil |
| |
| LHOS | | Long Hole Stope Mining |
| |
| LIDAR | | Light Detection and Ranging |
| |
| LIMS | | Laboratory Information Management System |
| |
| LOM | | Life of Mine |
| |
| MASL | | Metres Above (Mean) Sea Level |
| |
| MBA | | Master of Business Administration |
| | |
| 18th September 2018 | | Page 32 |
| | | | |
| | Loulo-Gounkoto Gold Mine Complex NI 43-101 Technical Report | | |
| | |
| MCC | | Motor Control Centre |
| |
| MCF | | Mine Call Factor |
| |
| MMD | | MMD Group of Companies |
| |
| MO | | Marginal Ore |
| |
| MRM | | Mineral Resource Management |
| |
| MRMM | | Mining Rock Mass Model |
| |
| MSO | | Minable Stope Optimiser |
| |
| MVA | | Mega Volt Amp |
| |
| MW | | Megawatt |
| |
| MZ | | Main Zone |
| |
| NPV | | Net Present Value |
| |
| NQ | | Core Size (47.6 mm) |
| |
| NSR | | Net Smelter Royalty |
| |
| OC | | Open Cast |
| |
| ODBC | | Open Database Connectivity |
| |
| OEM | | Original Equipment Supplier |
|
| OHSAS Occupational Health and Safety Assessment Series |
| |
| OK | | Ordinary Kriging |
| |
| OMC | | Orway Mineral Consultants |
| |
| OP | | Open Pit |
| |
| OPEX | | Operating Costs |
|
| OREAS ORE Research & Exploration Pty Ltd CRM Manufacture |
| |
| PFS | | Prefeasibility Study |
| |
| PP | | Purple Patch |
| |
| PQ | | Core Size (85.0 mm) |
| |
| PSA | | Pressure Swing Adsorption |
| |
| QA/QC | | Quality Assurance/Quality Control |
| |
| QG | | QG Australia Ltd |
|
| QKNA/KNA Quantitative Kriging Neighbourhood Analysis |
| |
| QP | | Qualified Person |
| |
| QQ | | Quantile-Quantile |
| |
| QT | | Quartz-Tourmaline Unit |
| |
| RAB | | Rotary Air Blasted |
| |
| RAP | | Resettlement Action Plan |
| | |
| RC | | Reverse Circulation |
| |
| RES | | Resource Domain |
| |
| RL | | Elevation (m) |
|
| RMR/MRMR Rock Mass Rating (Mean) |
| |
| ROM | | Run of Mine |
| |
| SAG | | Semi-Autogenous |
| |
| SAP | | Saprolite or German Company |
|
| SCADA Supervisory Control And Data Acquisition |
| |
| SCN | | Sodium Cyanide |
| |
| SD | | Standard Deviation |
|
| SENET Engineering Company |
| |
| SG | | Specific Gravity |
| |
| SGS | | SGS Laboratories |
| |
| SLC | | Sub Level Caving |
| |
| SLTO | | Social License to Operate |
|
| SOMILO Société des Mines de Loulo |
| |
| SOP | | Standard Operating Procedure |
| |
| SQL | | Structured Query Language Database |
| |
| SQR | | Argillaceous Quartzites |
| |
| SR | | Slope of Regression |
| |
| SRK | | Steffen Roberts and Kirsten, Engineering Company |
| |
| SURF | | Stoping Under Rock Fill |
| |
| SWZ | | Southwest Zone |
| |
| SZ | | Southern Zone |
| |
| TDS | | Total Dissolved Solids |
| |
| TL | | Tolerance Limit |
| |
| TSF | | Tailings Storage Facility |
| |
| UG | | Underground |
| |
| UTM | | Universal Transverse Mercator |
| |
| VHF | | Very High Frequency |
| |
| VOC | | Volatile Organic Compounds |
| |
| VSAT | | VSAT Internet Connection |
| |
| WAD | | Weak Acid Dissociated |
| |
| WRD | | Waste Rock Dump |
|
| ZADRA Type of elution circuit |
| | |
| 18th September 2018 | | Page 33 |
| | | | |
| | Loulo-Gounkoto Gold Mine Complex NI 43-101 Technical Report | | |
| | |
| cm | | Centimetre |
| |
| ekW | | Generator Output Rating in kW |
| |
| g | | Grammes |
| |
| Ga | | Billion years |
| |
| g/cm3 | | Grammes per Cubic Centimetre |
| |
| g/t | | Grammes per Metric Tonne |
| |
| Ha | | Hectare |
| |
| Kbar | | Kilobar of pressure |
| |
| kg | | Kilogram |
| |
| km | | Kilometre |
| |
| km2 | | Square kilometre |
| |
| koz | | Thousand ounces |
| |
| kt | | Thousand metric tonnes |
| |
| ktpa | | Thousand metric tonnes per annum |
| |
| ktpm | | Thousand tonnes per month |
| |
| kW | | Kilo Watts |
| |
| m | | Metre |
| |
| m² | | Square meter |
| |
| m3 | | Cubic meter |
| |
| Mm3 | | Million Cubic Metres |
| |
| Ml | | Million litres |
| |
| Moz | | Million fine troy Ounces |
| |
| Mt | | Million Metric tonnes |
| | | | | | |
| Mtpa | | Million tonnes per annum |
| |
| MVA | | Mega Volt Amps |
| |
| MW | | Mega Watts |
| |
| oz | | Fine troy ounce equalling 31.10348 |
| | | | | | grams |
| |
| ppm | | Parts per million |
| | | |
| t | | | | | | Metric tonne |
| |
| tm-3 | | Density measured as metric tonnes |
| | | | | | per cubic metre |
| | |
| ° | | | | Degrees |
| | | |
| | ‘ | | | | Minutes |
| |
| % | | Percentage |
| |
| %w/v | | Percentage Weight by Volume |
| |
| µm | | Microns |
| | |
| Ø | | | | Diameter |
| | |
| # | | | | Mesh |
| | |
| $ | | | | United States Dollar |
| | |
| $ | | ‘000 | | Thousand United States Dollars |
| | |
| $ | | M | | Million United States Dollars |
|
| $/oz United States Dollar per ounce |
|
| $/t United States Dollars per Metric Tonne |
| | |
| 18th September 2018 | | Page 34 |
| | | | |
| | Loulo-Gounkoto Gold Mine Complex NI 43-101 Technical Report | | |
| 3 | Reliance on Other Experts |
This report has been prepared by Randgold. For the purpose of this report, the QPs have relied upon information provided by Randgold’s Legal Counsel regarding the validity of exploitation permits; this opinion has been relied upon on in Section 4 (Property Description and Location) and in the summary of this report.
| | |
| 18th September 2018 | | Page 35 |
| | | | |
| | Loulo-Gounkoto Gold Mine Complex NI 43-101 Technical Report | | |
| 4 | Property Description and Location |
Loulo-Gounkoto is situated in Western Mali adjacent to the Falémé River which forms the international boundary with Senegal. The Republic of Mali is a landlocked country and is bordered by Guinea, Senegal, Mauritania, Algeria, Niger, Burkina Faso, and the Cote d’Ivoire.
The Project area is located 350 km west of the capital city of Bamako, 220 km south of the town of Kayes, and NW of the nearest town Kenieba (Figure4-1). It falls within the Central Arrondissement of the Kenieba District which is one of the 10 districts of the Kayes Region.
| | |
| 18th September 2018 | | Page 36 |
| | |
| 18th September 2018 | | Page 37 |
| | | | |
| | Loulo-Gounkoto Gold Mine Complex NI 43-101 Technical Report | | |
| 4.2 | Mineral Rights and Land Ownership |
The Loulo mine is within the Loulo Exploitation Permit (Loulo Permit). The original Loulo Permit was granted by Decret No.96-048/PM-RM 9, on the 14th February 1996 and covered an area of 48 km2. This Permit was amended by Decret No.99-193/PM-RM dated 15th July 1999 and extended the size of the Loulo Permit to 372 km2. The Loulo Permit was amended by DecretNo. 2012-311/P-RM on 21st June 2012 which reduced the size of the Lolo Permit as the portion surrounding the Gounkoto Mine was transferred to a new Exploitation Permit. The Loulo Permit remains in force for a period of 30 years after which is renewable if production is still taking place.
In 2010 Randgold applied and was granted the formation of the new Gounkoto Exploitation Permit (Gounkoto Permit), which was split from the Loulo Permit, to form a separate entity, Société des Mines de Gounkoto SA (Gounkoto) under DecretNo.2012-431/PM-RM DU dated 3rd August 2012. The Gounkoto Permit incorporates the Gounkoto and Faraba Reserves and is valid for 30 years.
In 2017, the Baboto North deposit was purchased by Endeavour Mining Corporation. This resulted in a minor change to the Loulo Permit. An updated Decret number has not yet been generated by the Malian Government, but it should be created imminently. Figure4-2 illustrates the current Loulo and Gounkoto Permit boundaries. Table4-1 details the coordinates of the current Loulo and Gounkoto Permits. The Loulo and Gounkoto Permits areas are currently 261.23 km2 and 99.95 km2 respectively, for a total area of 361.18 km2.
| | |
| 18th September 2018 | | Page 38 |
| | | | |
| | Loulo-Gounkoto Gold Mine Complex NI 43-101 Technical Report | | |
Table4-1 Loulo and Gounkoto Permit Coordinates
| | | | | | | | | | | | | | |
| Permit | | Point | | Longitude | | Latitude | | Permit | | Point | | Longitude | | Latitude |
| | | A | | 11° 19’ 00” | | 13° 10’ 00” | | Loulo | | AF | | 11° 26’ 00” | | 13° 10’ 00” |
| | | B | | 11° 19’ 00” | | 12° 56’ 33” | | AG | | 11° 22’ 57” | | 13° 10’ 00” |
| | | C | | 11° 20’ 50” | | 12° 56’ 33” | | AH | | 11° 22’ 57” | | 13° 09’ 51” |
| | | D | | 11° 20’ 50” | | 12° 57’ 24” | | AI | | 11° 21’ 59” | | 13° 09’ 51” |
| | | E | | 11° 21’ 25” | | 12° 57’ 24” | | AJ | | 11° 21’ 59” | | 13° 09’ 41” |
| | | F | | 11° 21’ 25” | | 12° 59’ 37” | | AK | | 11° 21’ 00” | | 13° 09’ 41” |
| | | G | | 11° 22’ 59” | | 12° 59’ 37” | | AL | | 11° 21’ 00” | | 13° 10’ 00” |
| | | H | | 11° 22’ 59” | | 12° 58’ 06” | | Gounkoto | | A | | 11° 19’ 00” | | 12° 56’ 33” |
| | | I | | 11° 23’ 37” | | 12° 58’ 06” | | B | | 11° 19’ 00” | | 12° 50’ 00” |
| | | J | | 11° 23’ 37” | | 12° 58’ 28” | | C | | 11° 23’ 38” | | 12° 50’ 00” |
| | | K | | 11° 24’ 26” | | 12° 58’ 28” | | D | | 11° 23’ 38” | | 12° 49’ 39” |
| | | L | | 11° 24’ 26” | | 12° 59’ 26” | | E | | 11° 24’ 11” | | 12° 49’ 39” |
| | | M | | 11° 24’ 49” | | 12° 59’ 26” | | F | | 11° 24’ 11” | | 12° 50’ 39” |
| | | N | | 11° 24’ 49” | | 13° 00’ 08” | | G | | 11° 24’ 32” | | 12° 50’ 39” |
| | | O | | 11° 23’ 44” | | 13° 00’ 08” | | H | | 11° 24’ 32” | | 12° 51’ 00” |
Loulo | | P | | 11° 23’ 44” | | 13° 01’ 07” | | I | | 11° 23’ 45” | | 12° 51’ 00” |
| | | Q | | 11° 24’ 35” | | 13° 01’ 07” | | J | | 11° 23’ 45” | | 12° 52’ 09” |
| | | R | | 11° 24’ 35” | | 13° 02’ 25” | | K | | 11° 24’ 03” | | 12° 52’ 09” |
| | | S | | 11° 25’ 11” | | 13° 02’ 25” | | L | | 11° 24’ 03” | | 12° 53’ 30” |
| | | T | | 11° 25’ 11” | | 13° 03’ 14” | | M | | 11° 23’ 43” | | 12° 53’ 30” |
| | | U | | 11° 25’ 54” | | 13° 03’ 14” | | N | | 11° 23’ 43” | | 12° 53’ 50” |
| | | V | | 11° 25’ 54” | | 13° 04’ 00” | | O | | 11° 23’ 14” | | 12° 53’ 50” |
| | | W | | 11° 25’ 29” | | 13° 04’ 00” | | P | | 11° 23’ 14” | | 12° 54’ 42” |
| | | X | | 11° 25’ 29” | | 13° 05’ 23” | | Q | | 11° 23’ 59” | | 12° 54’ 42” |
| | | Y | | 11° 26’ 08” | | 13° 05’ 23” | | R | | 11° 23’ 59” | | 12° 55’ 43” |
| | | Z | | 11° 26’ 08” | | 13° 05’ 52” | | S | | 11° 23’ 33” | | 12° 55’ 43” |
| | | AA | | 11° 28’ 28” | | 13° 05’ 52” | | T | | 11° 23’ 33” | | 12° 55’ 27” |
| | | AB | | 11° 28’ 28” | | 13° 06’ 13” | | U | | 11° 22’ 26” | | 12° 55’ 27” |
| | | AC | | 11° 28’ 42” | | 13° 06’ 13” | | V | | 11° 22’ 26” | | 12° 55’ 45” |
| | | AD | | 11° 28’ 42” | | 13° 07’ 00” | | W | | 11° 20’ 50” | | 12° 55’ 45” |
| | | AE | | 11° 26’ 00” | | 13° 07’ 00” | | X | | 11° 20’ 50” | | 12° 56’ 33” |
| | |
| 18th September 2018 | | Page 39 |
| | | | |
| | Loulo-Gounkoto Gold Mine Complex NI 43-101 Technical Report | | |
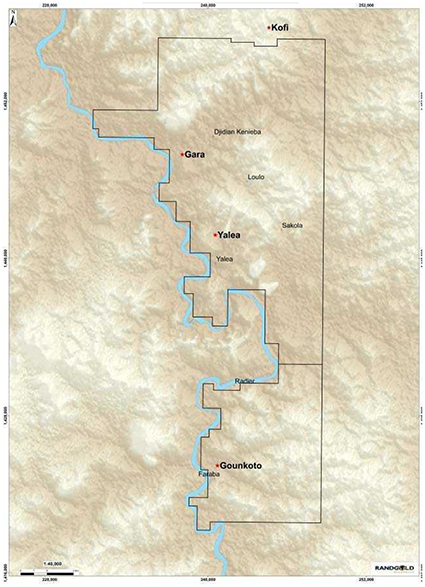
Figure4-2 Loulo and Gounkoto Permit Areas
The holder of the Permit may freely carry out exploration and mining activities within this area provided that there is compliance with government regulations including those of safety and the environment. The Permit allows the holder to fully utilise the surface for the implementation of such infrastructure as required for the mining operation. All the taxes relating to Loulo and Gounkoto Mining Rights have been paid to date and the concession is in good standing. There are no exclusion zones on the Permit.
The QP is not aware of any other significant factors and risks that may affect access, title, or the right of ability to perform work on the property.
| | |
| 18th September 2018 | | Page 40 |
| | | | |
| | Loulo-Gounkoto Gold Mine Complex NI 43-101 Technical Report | | |
| 4.4 | Ownership, Royalties and Lease Obligations |
The Loulo Permit is owned by Société des Mines de Loulo SA which is held 80% by Randgold and 20% by the state of Mali.
The Gounkoto Permit is owned by Société des Mines de Gounkoto SA which is held 80% by Randgold and 20% by the state of Mali.
The Loulo-Gounkoto Establishment Convention regulates the fiscal conditions under which the Loulo and Gounkoto mine operates and is based on the1991 Mining Code. A 6% royalty is payable to the Malian government based upon production together with a corporate tax rate on profits at 30% and a minimum of 0.75% on gross revenues if a loss is made. Loulo received a five year tax holiday from first commercial gold production in October 2005. Gounkoto received a two year tax holiday from first gold production in 2013 and has since received governmental approval for use of 50% corporate tax reduction for the next four years to support its development of a super pit. The convention includes exoneration on fuel duties for the life of the project and on import duties for three years from the start of first gold.
Other than the ownership status, royalty on the revenues from mineral production, there are no other royalties,back-in rights, payments, or other agreements and encumbrances to which the property is subject.
There are no known environmental, permitting, legal, title, fiscal, socio-economic, marketing, and political or other issues known at this time that could materially affect the Mineral Resource declared.
The QP is not aware of any risks that could result in the loss of ownership of the deposits or loss of the permits, in part or in whole.
| | |
| 18th September 2018 | | Page 41 |
| | | | |
| | Loulo-Gounkoto Gold Mine Complex NI 43-101 Technical Report | | |
| 5 | Accessibility, Climate, Local Resources, Infrastructure and Physiography |
Primary access for staff and consumables to Loulo-Gounkoto is via the recently constructed (2011) Millennium highway that runs from Dakar, Senegal to Bamako, Mali. The Millennium Highway crosses the Loulo to Gounkoto haul road approximately 6 km north of Gounkoto and provides excellent road connections in comparison to much of the country.
Daily flights with international air carriers are available from Dakar and Bamako. Charter flights between Bamako and the (unsealed) airstrip at the mine are regularly used. The landing strip at Loulo is approximately 1.5 km long and built from laterite material. It can accommodate moderate sized aircraft and has been awarded full certification by the transport authorities in Mali.
The climate at Loulo-Gounkoto is strongly influenced by the north and southward movement of the Inter Tropical Convergence Zone (ITCZ) which creates distinctive wet and dry seasons. The site is in the Sahelian Transition Zone between the Sahara Desert in the north and the tropical climate in the south. The low altitude of the site (90 m to 120 m above mean sea level) and the absence of any intervening mountains mean that the humidity is directly conveyed to the site when the wind blows in that direction.
summarises the monthly rainfall as measured at the Gounkoto and the Loulo stations. Using the average values for all the years on record, it shows a strongly unimodal rainfall distribution, with 87% of rain falling between the months of June and September. The mean annual precipitation amounts to 1,091 mm.
Based on regional data (Kenieba), the potential evaporation is estimated to range between 105 mm and 200 mm per month. In total, this amounts to an annual potential evaporation of 1,749 mm. Although the annual evaporation thereby exceeds the annual rainfall, an excess of water is available during the peak of the wet season (July to September).
The site is situated within close proximity of the Sahelian Transition Zone between the Sahara Desert in the north and the tropical climate in the south. Temperatures range between approximately 13°C and 43°C (average 28°C) with the hottest months between March and June.
Climatic conditions do not materially affect either exploration, development, or mining operations.
| | |
| 18th September 2018 | | Page 42 |
| | | | |
| | Loulo-Gounkoto Gold Mine Complex NI 43-101 Technical Report | | |
Table5-1 Monthly Records of Precipitation and Potential Evaporation
| | | | | | | | | | | | | | | | | | | | | | | | | | | | | | | | | | | | | | | | | | | | | | | | | | | | |
| Month | | Jan | | | Feb | | | Mar | | | Apr | | | May | | | Jun | | | Jul | | | Aug | | | Sep | | | Oct | | | Nov | | | Dec | | | Total | |
| Statistic | | (mm) | | | (mm) | | | (mm) | | | (mm) | | | (mm) | | | (mm) | | | (mm) | | | (mm) | | | (mm) | | | (mm) | | | (mm) | | | (mm) | | | (mm) | |
Average
Rainfall | | | 2 | | | | 3 | | | | 6 | | | | 4 | | | | 42 | | | | 142 | | | | 217 | | | | 325 | | | | 263 | | | | 69 | | | | 14 | | | | 6 | | | | 1,091 | |
Kenieba -
Average Potential Evaporation | | | 167 | | | | 174 | | | | 200 | | | | 188 | | | | 83 | | | | 142 | | | | 119 | | | | 105 | | | | 111 | | | | 120 | | | | 110 | | | | 130 | | | | 1,749 | |
Topography of the Gounkoto area is generally flat with elevations ranging from 100 m above sea level to a maximum of 200 m above sea level. Laterite or iron cap development is a common feature throughout the area. The Project lies in a low seismic rated area.
Within the Project area the landscape is characterised by scrubland and brush vegetation.
The local population are essentially subsistence farmers who supplement their income through artisanal gold mining. Bread and small quantities of vegetables may be sourced locally but most supplies are obtained from Kayes or Bamako. As part of Randgold’s strategy through the provision of correct training it has been possible to employ local people who make up almost all of the labour requirement at the Project.
Local infrastructure around Gounkoto is limited to small rural settlements connected by gravel roads and paths. Social and economic baseline studies identified that the inhabitants within the villages are mostly Malinké but include other ethnic groups who have arrived later such as Peul, Bambara, and Bozo. The main economic activities are agriculture and artisanal mining. Other activities include livestock, fishing, and trade. All the houses are traditional round huts covered with thatch. Forty-seven boreholes and four water supply systems have been constructed in the host communities in total, 16 schools have been built which has increased student enrolment to more than 4,764 from a base of 500 prior to the mine being built. Randgold has a target of a school in each village which has been achieved in Loulo.
Local food chains have been improved through the donation and the building of infrastructure such as dams and roads along with the launch and support of an Agribusiness hub in the region. A number of local entrepreneurs have utilised these such opportunities and increased economic activity in the region.
Health facilities have been improved with a health centre being built and two other centres being rehabilitated. A partnership with anon-government organisation is in place which targets the spread of human immunodeficiency virus (HIV). Malaria infections have also been targeted in local communities.
Randgold’s policy promotes local employment. Figures for national employment in 2017 were 2,820 out of a total of 2,975 (95%) employee and contractor posts at Loulo and 1,175 out of 1,209
| | |
| 18th September 2018 | | Page 43 |
| | | | |
| | Loulo-Gounkoto Gold Mine Complex NI 43-101 Technical Report | | |
(97%) employee and contractor posts at Gounkoto. Unskilled labour is typically sourced from the local area while more skilled posts are filled by staff from elsewhere in Mali, including Bamako.
The supply route for Loulo-Gounkoto runs from the port of Dakar in Senegal. The border with Senegal is within 3 km of the mine and the road crossing for goods is approximately 40 km along an all weather laterite surfaced road to Loulo and 10 km to Gounkoto. Local infrastructure is limited to small rural settlements connected by gravel roads and paths. The Dakar to Bamako Millennium highway runs approximately 6 km north of the Project.
The Loulo mine is an operating mine site comprising open pit and underground mines, a processing plant, satellite deposits and associated infrastructure. Previously mined open pits remain open and are used to access the underground mine. Waste dumps are situated adjacent to the open pits. The plant and offices and accommodation village are located east of the Gara pit. The TSF is located 8 km to the east of the plant. The Loulo and Gounkoto mine site layouts are shown in Figure5-1 and Figure5-2.
Water is sourced for the Project from the Gara and Falémé rivers which run through the Project site and from water generated underground. A monthly report is generated to monitor this.
Power is generated on site using light and heavy fuel generators. Substantial infrastructure has been built at Loulo-Gounkoto as a result of the long-established open pit mining operation. This includes ore processing and tailings facilities, workshops offices, and camps. Mobile telephone services are available across the mine.
| | |
| 18th September 2018 | | Page 44 |
| | | | |
| | Loulo-Gounkoto Gold Mine Complex NI 43-101 Technical Report | | |
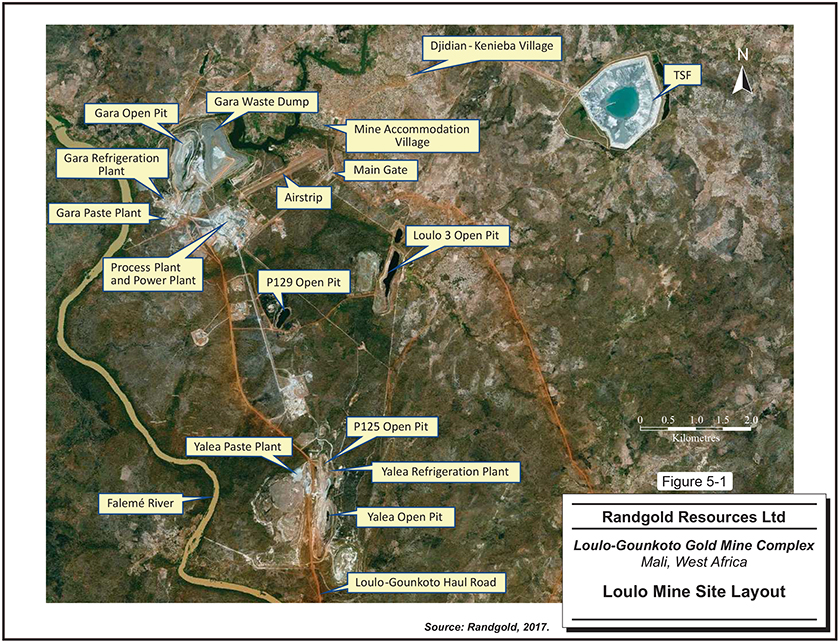
| | |
| 18th September 2018 | | Page 45 |
| | | | |
| | Loulo-Gounkoto Gold Mine Complex NI 43-101 Technical Report | | |
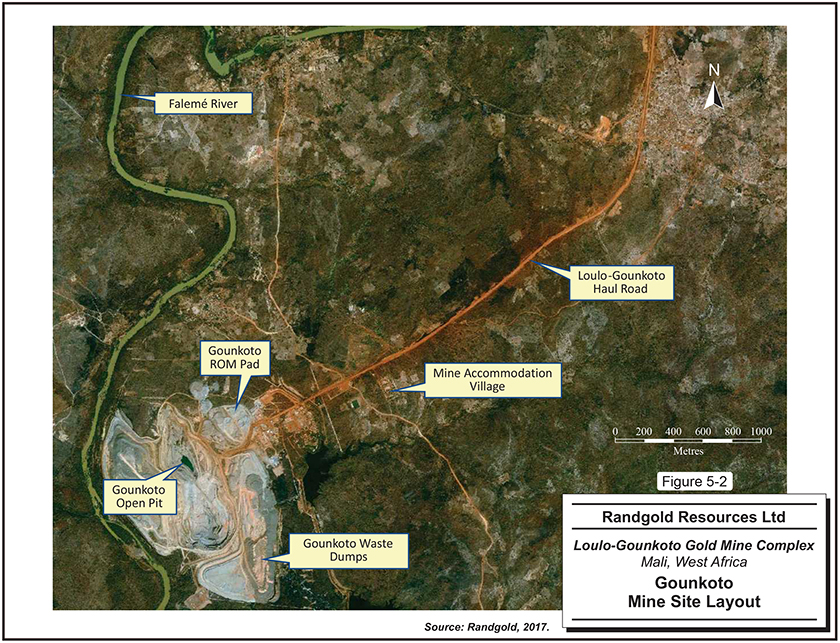
| | |
| 18th September 2018 | | Page 46 |
| | | | |
| | Loulo-Gounkoto Gold Mine Complex NI 43-101 Technical Report | | |
| 6.1 | Historical Exploration and Development |
Gold potential in the Loulo area was recognised by the Syndicat Or joint venture between the Malian Direction Nationale de la Géologie et des Mines and the French Bureau de Recherches Géologiques et Minières (BRGM). As a result of exploration work undertaken by the Syndicat Or joint venture, the Loulo 0 gold deposit (more recently renamed to Gara) was discovered in 1981. Syndicat Or continued with exploration until 1989, concluding with apre-feasibility study indicating that the Loulo 0 deposit (Gara) on its own wassub-economic.
In 1992, after an evaluation of the available data, BHP Minerals Mali (BHP) entered into an Option Share purchase, and work commitment agreement with SOMILO (Société des Mines de Loulo) to purchase a 20% share of the joint venture wholly-owned by the Republic of Mali and SEREM (a 100% subsidiary of BRGM). This was later increased to 51% on the completion of a feasibility study.
BHP completed the following work:
| | ● | | 20,158 m of core drilling, including 16,085 m at Loulo 0 (Gara). |
| | ● | | Two regional soil sampling programmes covering the mining and exploration concessions. |
| | ● | | Metallurgical testwork on the Loulo 0 core and additional bulk samples. |
| | ● | | Preliminary open pit and underground mine designs. |
Work focused on Loulo 0 (Gara) and BHP produced separate resource estimates for mineralisation that is potentially mineable from surface, mineralisation that must be mined underground, and mineralisation from satellite deposits.
As a result of this work BHP delineated an open pit Indicated Mineral Resource of 3.48 Mt at an insitu grade of 4.42 g/t Au, an underground Indicated Mineral Resource of 0.87 Mt at a grade of 9.7 g/t Au and an Inferred Mineral Resource of 1.00 Mt at a grade of 10 g/t Au. Reconnaissance drilling identified other Inferred Mineral Resources in outlying satellite deposits of 1.42 Mt at 4.6 g/t Au.
The conclusion from the feasibility work carried out by BHP was that the Loulo 0 (Gara) deposit by itself was too small to be economic and that an additional satellite deposit of at least 500 koz was required for an economically viable project. By spending $4.62 M on this work, BHP increased its share in Somilo to 20%.
Following the discovery of the Yalea deposit a series of feasibility studies were undertaken.
| | |
| 18th September 2018 | | Page 47 |
| | | | |
| | Loulo-Gounkoto Gold Mine Complex NI 43-101 Technical Report | | |
| 6.2 | Randgold Project Milestones and Development |
A history of the key dates in Randgold’s involvement in Loulo-Gounkoto is presented below:
1996
| | ● | | Randgold acquired BHP Minerals Mali in October 1996 and changed its name to Randgold Resources Mali. |
1997
| | ● | | Randgold increased its share of SOMILO to 51% in October 1997. At this stage, as a result of a corporate agreement, La Source (a joint venture between the BRGM and Normandy Limited) replaced BRGM in SOMILO. |
| | ● | | Discovery of Yalea deposit |
| | ● | | Listing of Randgold Resources on London Stock Exchange and initial public offering (IPO) raises $83 M used to fund Morila feasibility study and increase share in SOMILO to 51%. |
2001
| | ● | | Randgold acquired La Source’s 29% holding in SOMILO in April 2001. |
2003
| | ● | | An updated Loulo feasibility study was generated with total reserves of 1.38 Moz. |
2004
| | ● | | Construction begins on Loulo Mine. |
2005
| | ● | | Loulo mine opens with Yalea and Gara open pit mining. |
| | ● | | Loulo underground feasibility study approved. |
2006
| | ● | | Development of Yalea underground starts. |
2008
| | ● | | Yalea underground produces first gold. |
2009
| | ● | | Discovery of Gounkoto deposit. |
2010
| | ● | | Gara underground mine commences. |
| | |
| 18th September 2018 | | Page 48 |
| | | | |
| | Loulo-Gounkoto Gold Mine Complex NI 43-101 Technical Report | | |
2011
| | ● | | First gold produced from Gounkoto open pit. |
| | ● | | First gold produced from Gara underground. |
2012
| | ● | | Loulo processing plant ramped up to over 4 Mt per annum. |
| | ● | | Mining of ‘Purple Patch’ at Yalea started. |
| | ● | | ISO 14001 achieved at Gounkoto. |
| | ● | | OHSAS 18001 safety accreditation achieved at Loulo. |
2013
| | ● | | Gara underground conveyor installed. |
| | ● | | Additional four CIL tanks installed and commissioned. |
| | ● | | Grinding and crushing upgraded to eliminate scats. |
| | ● | | Successful conversion of generators to Heavy Fuel Oil. |
| | ● | | MZ4 lode discovered at Gounkoto. |
2014
| | ● | | Gounkoto underground Ore Reserve defined. |
| | ● | | Production exceeded 600 koz gold. |
| | ● | | Loulo paste backfill plant installed. |
| | ● | | Primary vent shafts at Yalea and Gara installed. |
| | ● | | Secondary crushing plant upgraded. |
2015
| | ● | | Loulo underground transition to owner operator mining. |
| | ● | | Carbon regeneration kiln installed. |
2016
| | ● | | Production totalled 707 koz gold. |
| | ● | | Gounkoto ‘Super Pit’ slope designs completed. |
| | ● | | Gounkoto ‘Super Pit’ versus undergroundtrade-off study completed. |
| | ● | | Gounkoto undergroundpre-feasibility study published. |
| | ● | | Upgraded elution circuit. |
| | ● | | Completed underground refrigeration project. |
2017
| | ● | | Production increased to 730 koz gold. |
| | |
| 18th September 2018 | | Page 49 |
| | | | |
| | Loulo-Gounkoto Gold Mine Complex NI 43-101 Technical Report | | |
| | ● | | Increased plant throughout to over 4.9 Mt. |
| | ● | | Increased plant recoveries to 92%. |
| | ● | | Commissioned new Yalea underground crusher. |
| | ● | | Started Gounkoto ‘Super Pit’ stripping. |
| | ● | | Sale of Baboto North to Endeavour Mining Corporation. |
| 6.3 | Historical Resource and Reserve Estimates |
These estimates are considered to be historical in nature and should not be relied upon. A QP has not completed sufficient work to classify the historical estimate as a current Mineral Resource or Ore Reserve and Randgold is not treating the historical estimates as current Mineral Resources or Ore Reserves. These have been superseded by the Mineral Resource estimates reported and described in this report.
Loulo
BHP Minerals Mali delineated a Mineral Resource on the Loulo 0 (Gara) deposit prior to Randgold’s acquisition. The Mineral Resource estimate contained 3.5 Mt at 4.43 g/t Au of Open Pit Indicated material, 0.87 Mt at 9.7 g/t Au of underground Indicated material and 1.0 Mt at 10.0 g/t Au of Inferred material. An additional 1.4 Mt at 4.6 g/t Au of Inferred material was identified at outlying satellite deposits.
Gounkoto
Gounkoto was a greenfields discovery by Randgold and therefore there are no historical Mineral Resource estimates available.
| 6.4 | Resource and Reserve Evolution |
Figure6-1 and Figure6-2 present the evolution of cumulative Mineral Resources and Ore Reserves from the initial acquisition of Loulo and Randgold’s discovery of Gounkoto.
| | |
| 18th September 2018 | | Page 50 |
| | | | |
| | Loulo-Gounkoto Gold Mine Complex NI 43-101 Technical Report | | |
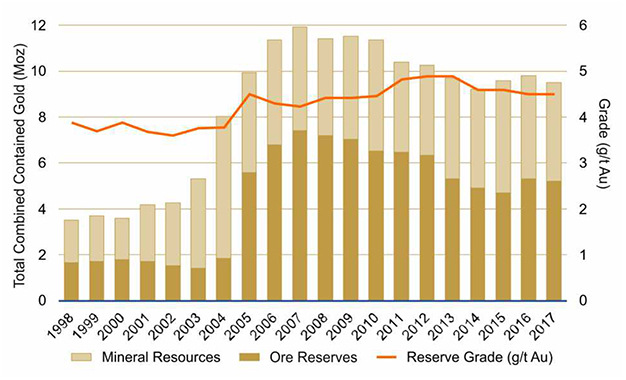
Figure6-1 Loulo Mineral Resource and Ore Reserve Evolution
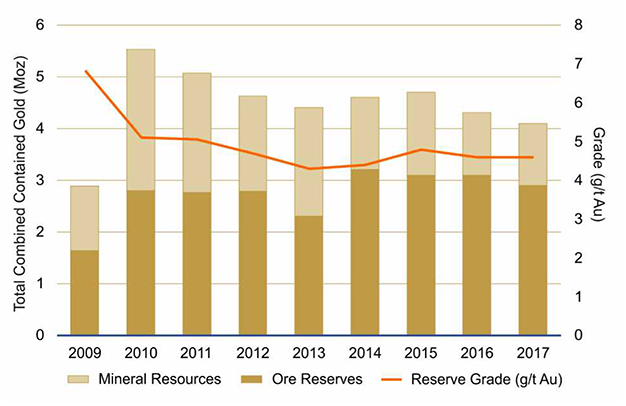
Figure6-2 Gounkoto Mineral Resource and Ore Reserve Evolution
| | |
| 18th September 2018 | | Page 51 |
| | | | |
| | Loulo-Gounkoto Gold Mine Complex NI 43-101 Technical Report | | |
Since commencing mining operations in 2005 and the end of 2017, a total of 391 Mt (53 Mt ore) have been mined from the various orebodies at Loulo-Gounkoto.
Table6-1 details the past production from Loulo-Gounkoto since 2005.
Table6-1 Past Production Records for Loulo-Gounkoto
| | | | | | | | |
| Year | | Tonnes Milled (kt) | | Head Grade (g/t) | | Gold Produced (oz) | | Recovery (%) |
2005 | | 551 | | 4.1 | | 67,984 | | 94.3 |
2006 | | 2,600 | | 3.2 | | 241,575 | | 93.9 |
2007 | | 2,700 | | 3.3 | | 264,647 | | 93.2 |
2008 | | 2,720 | | 3.2 | | 258,095 | | 91.2 |
2009 | | 2,947 | | 4.2 | | 351,591 | | 87.7 |
2010 | | 3,158 | | 3.4 | | 316,539 | | 92.5 |
2011 | | 3,619 | | 3.4 | | 346,179 | | 88.1 |
2012 | | 4,354 | | 4.0 | | 503,224 | | 89.2 |
2013 | | 4,463 | | 4.6 | | 580,364 | | 88.4 |
2014 | | 4,396 | | 5.0 | | 639,219 | | 90.2 |
2015 | | 4,543 | | 4.8 | | 630,167 | | 90.1 |
2016 | | 4,875 | | 5.0 | | 707,116 | | 91.0 |
2017 | | 4,918 | | 5.0 | | 730,372 | | 92.7 |
Total | | 45,598 | | 4.2 | | 5,637,072 | | 90.2 |
| | |
| 18th September 2018 | | Page 52 |
| | | | |
| | Loulo-Gounkoto Gold Mine Complex NI 43-101 Technical Report | | |
| 7 | Geological Setting and Mineralisation |
The West African Craton can be divided into three main regions exposed beneath Phanerozoic cover. In the north, the Reguibat Rise extends over Mauritania; in the west Algeria and consists of an Achaean terrain and the Proterozoic Birimian terrain is situated in the east. The southern Leo Rise covers a large area over southern Mali, Côte d’Ivoire, Burkina Faso, Niger, Ghana, and Guinea; and is separated from the Reguibat Rise by the Late Proterozoic to Phanerozoic sedimentary Taoudeni Basin. The western Achaean portion known as the Man Shield is separated from the eastern Birimian formation of the Baoule Mossi domain by the Sassandra fault.
Loulo-Gounkoto is located within the Kedougou-Kenieba erosional inlier (Figure7-1) which is underlain by Lower Proterozoic (2.1 Ga) Birimian meta-sedimentary-volcanic sequences.
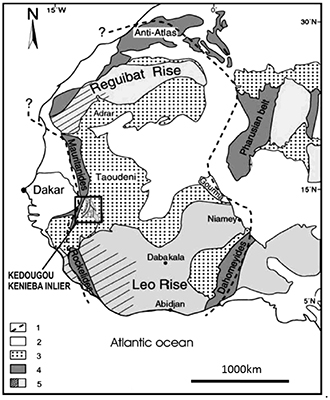
Figure7-1 Location of the Kedougou-Kenieba-Inlier in the West African Craton
Volcanic and sedimentary rocks of the Birimian Supergroup form a substantial portion of the West African Craton. These rocks and associated intrusives of the Eburnean tectonic-thermal event represent a major Paleoproterozoic, juvenile crust forming event that took place during the time interval 2.25 Ga to 2.09 Ga. It is believed that the Birimian crust formed through the closure of an oceanic basin between two Achaean Cratons, involving the progressive accretion of island arcs and oceanic plateau to a growing continental mass. Subsequent thickening associated with the intrusion of kinetically late basin-type granitoids and compressional deformation, facilitated the formation of structurally controlled mesothermal type lode gold deposits.
| | |
| 18th September 2018 | | Page 53 |
| | | | |
| | Loulo-Gounkoto Gold Mine Complex NI 43-101 Technical Report | | |
The Permits are located within the Kedougou-Kenieba erosional inlier. The inlier is unconformably overlain by Upper Proterozoic sandstones towards the east and further south. The Kenieba inlier contains several significant gold deposits including Sadiola, Yalea, Segala, Tabakoto, and Gounkoto deposits in Mali, and Sabodala in Senegal (Figure7-2). The regional setting of each of these deposits is characterised by its close proximity to a major structure
The area is extensively laterised and covered by regolith material, with only about 6% outcrop. Three formations are present in the region including:
| | ● | | Kofi (shelf to deep marine sediments): consisting of greywacke, sandstone, argillaceous sandstone, calcareous sandstone, limestone, and tourmalinised sandstone units. |
| | ● | | Saboussire (andesitic volcanic arc with shelf sedimentary setting): andesite, basalt, volcanic breccia, and tuff. |
| | ● | | Keniebandi volcanic and sedimentary units. |
The Senegal-Mali shear marks a major break in the geology from shelf carbonates with the Falémé ironstone unit in the west to the sedimentary sequences of the Kofi formation in the east.
The aero magnetics survey has highlighted the major tectonic fabrics, the Moussala granite, Falémé ironstone, the dolerite dyke, and a major circular feature. This circular structure is coincident with a zone of intense structure deformation (WNW and NE fabrics) and multiple quartz tourmaline units. The Gara and Yalea deposits and a large number of additional gold targets are located within this circular feature.
The Loulo and Gounkoto permits are predominately underlain by the Kofi formation consisting of greywacke, sandstone, argillaceous sandstone, calcareous sandstone and tourmalinised sandstone units. The lithologies present are interpreted to represent a forearc environment with a sequence of older deep-water argillite and greywacke to the east of the permit area, and limestone and carbonated clastic sediments towards the west, representing a shallow shelf setting. This broad classification is complicated by a series of thrusts which have caused stacking and repetition of the sedimentary package. Regional structures which transgress lower order structures, rheologically contrasting lithologies and intrusive bodies have a strong spatial relationship with the occurrence of gold deposits. These regional structures strike for
| | |
| 18th September 2018 | | Page 54 |
| | | | |
| | Loulo-Gounkoto Gold Mine Complex NI 43-101 Technical Report | | |
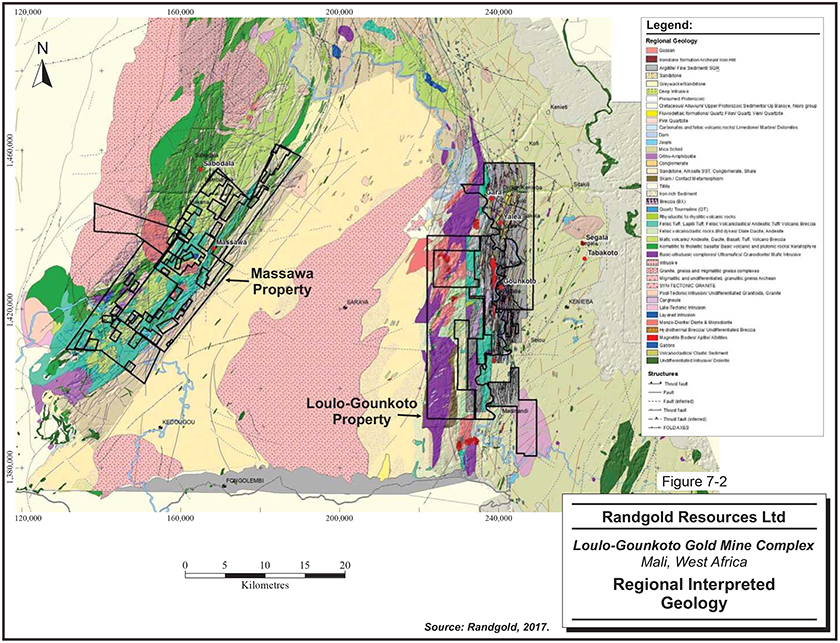
| | |
| 18th September 2018 | | Page 55 |
| | | | |
| | Loulo-Gounkoto Gold Mine Complex NI 43-101 Technical Report | | |
over 50 km north to NE across the permit area. The Permit area is transgressed by several regional linear structures which include:
| | ● | | 1st order Senegal – Mali Shear Zone. |
| | ● | | 2nd order north to NNE trending Farandi and Yalea structures. The first mineralising phase was introduced during this event. |
| | ● | | 3rd order NE to ENE trending reverse faults and north trendingre-activated shear zones. These cross and reactivated structures are present at all the major deposits and mineralised sites and have been responsible for focusing gold mineralisation. |
Work to date indicates an overall compressional tectonic regime with oblique compression on the NE structures and reactivation of older NNE structures. Figure7-3 illustrates the position of the Loulo and Gounkoto targets in relation to the other targets and deposits on the Loulo and Gounkoto Permits.
| 7.4 | Loulo Permit Geology and Mineralisation |
The Loulo project area is characterised by a sequence of sandstone, limestones and greywackes which are truncated by three major north to NE trending shear zones. Two major mineralised bodies have been discovered within the Project area, Gara and Yalea. Several other satellite deposits are also present.
Yalea
Yalea is located in a north-south striking, steeply dipping package of metasedimentary rocks. Host lithologies at Yalea (from west to east) comprise of quartzite/grey in the hanging wall, with tectonic breccias in the north. Immediately above the main body of mineralisation is thin (0 m to 5 m) sequence of banded schistose greyish limestone, with alternating white and grey calcitic layers and dark grey to black phyllite units. The main mineralised body is a hydrothermally brecciated argillaceous pink quartzite that becomes more argillaceous (and less altered) towards the footwall. A higher grade ‘Purple Patch’ zone is observed in a dilatational strain transfer zone formed as the dip of the mineralised package steepens forming hydraulic breccias. The footwall package is a thick sequence of argillaceous quartzite and black sandstone. This sedimentary package is intruded locally by thin (0.1 m to 2 m) acid intrusives of mostly granitic composition. The country rocks are also cross cut by a late EW dolerite dyke that is generallysub-horizontal, with a gentle southward plunge (Figure7-4).
| | |
| 18th September 2018 | | Page 56 |
| | | | |
| | Loulo-Gounkoto Gold Mine Complex NI 43-101 Technical Report | | |
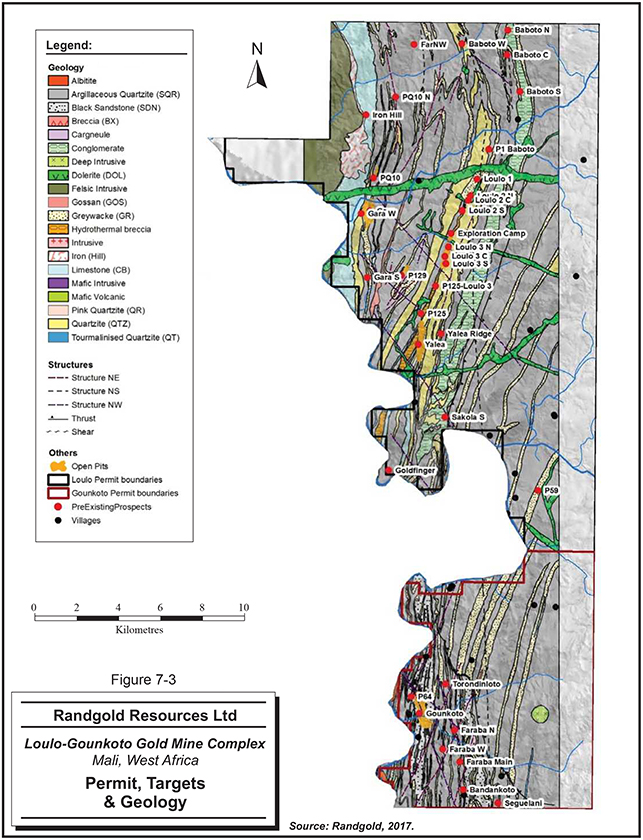
| | |
| 18th September 2018 | | Page 57 |
| | | | |
| | Loulo-Gounkoto Gold Mine Complex NI 43-101 Technical Report | | |
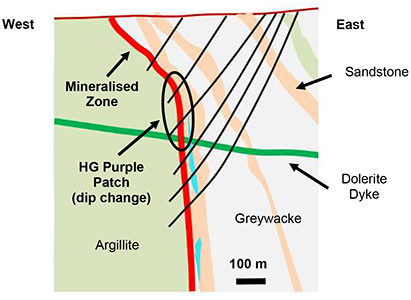
Figure7-4 Yalea Simplified Geology Cross Section
Alteration
Alteration in the Yalea deposit is characterised by intense carbonate alteration, albitisation, silicification, sericitisation and chloritisation. Alteration is invariably associated with sulphide but also forms a halo within the footwall and the hanging wall units. The alteration can be identified by the localisation of coarse-grained aggregates of carbonate, quartz, and albite, whereas the mineralisation is associated with chloritisation-sericitisation and ferrous carbonate.
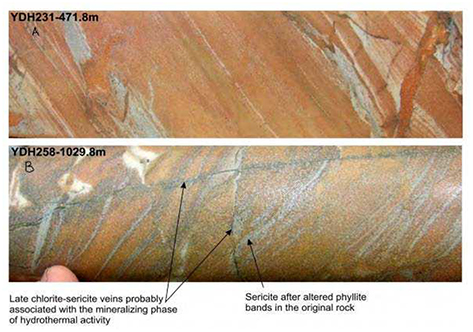
Figure7-5 Early pink Albite ± Carbonate Alteration. B. Early Light Brown Albite±-Carbonate Alteration
and Narrow Bands of Sericite ±Chlorite
| | |
| 18th September 2018 | | Page 58 |
| | | | |
| | Loulo-Gounkoto Gold Mine Complex NI 43-101 Technical Report | | |
Weathering at Yalea extends up to 300 m below surface due to the strong carbonate alteration associated with the mineralised structure. Four main weathering types have been characterised in the rock, saprolite, transition, fresh, and high-grade fresh.
Structure
At Yalea, the main mineralised body is a hosted by the north-striking Yalea Shear, where it is intercepted by the Yalea Structure. The Yalea Shear is a brittle-ductile, north-south striking, mineralised fault that transects the Yalea Structure, which is a complex, of north to NNE striking shear zones.
Both major structures include variety of deformed and altered rocks, even where they are unmineralised. Much of the deformation, brecciation and barren alteration along both structures may have occurred during the regional-scale shortening and upending of the Birimian rocks prior wrench-style deformation associated with mineralisation. Both structures appear to have been a focus for hydrothermal activity over an extended period, culminating in the episode of hydrothermal activity associated with gold mineralisation. Gold mineralisation is situated between a hanging wall and footwall shear within the reactivated 2 km portion of the predominant Yalea – Baboto structure. The mineralisation dips to the west at 65° for the initial 200 m to 300 m vertically after which the structure steepens and becomes sub vertical.
Mineralisation
Economic levels of gold mineralisation are almost exclusively associated with paragenetically late sulphide veins, breccias and zones of massive sulphides. Higher grade material commonly contains sulphide veins which cut the various generations of albite ± carbonate alteration. There is a strong correlation between sulphide intensity and gold mineralisation with the dominant sulphide phases consisting of pyrite (abundant), arsenopyrite and minor chalcopyrite. The sulphides can be disseminated or massive along fabric.
Yalea mineralisation, remains open at depth and to the south with potential for significant high-grade extensions. To the south of the ‘Purple Patch’ zone the Yalea Shear forms asub-horizontally plunging transfer zone where the competency contrast of the footwall argillaceous quartzites (SQR) contact causes a transfer of strain associated with normal movement. Consequently, this transfer creates dilatational hydraulic breccias with the potential to host significant high-grade extensions (Figure7-6).
| | |
| 18th September 2018 | | Page 59 |
| | | | |
| | Loulo-Gounkoto Gold Mine Complex NI 43-101 Technical Report | | |
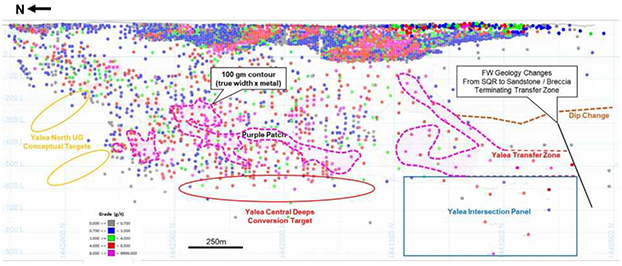
Figure7-6 Long Section Looking West Showing Structural Model for Yalea Deposit
Gara
Gara is located 6 km NNW of the Yalea deposit and is hosted within 800 m long tourmaline sandstone/greywacke unit which outcrops on surface as black quartzite forming small (10 m) topographic highs. The host lithologies are (from west to east): chemical (limestone or carbonate altered) sediments and alternating argillitic and quarzitic bands (argillaceous quartzite or SQR) in the hanging wall, mineralised quartz tourmaline (QT) ranging from 5 m to 20 m thick (average 15 m) and a coarse to medium grained greywacke unit in the footwall. The sedimentary package is also cross cut by three unmineralised late EW doleritesub-horizontal dykes that plunge shallowly from north to south.
Structure
The geometry of the deposit is dominated by the strike slip shearing on Senegal-Mali shear and the development of associated conjugate sets of antithetic structures. This shearing has resulted in folding, fracturing, brecciation, and development of a quartz vein stockworks within the QT which behaved in a more brittle manner during deformation.
The deposit as a whole, spans the hinge of a broad open fold with a gently-plunging north-south trending axis. The upper limb of this fold dips moderately to steeply west, whereas the lower limb dips moderately to steeply east. A second generation of younger smaller-scale southwest plunging, distinctlynon-cylindrical folds are developed in the upper part of the deposit. The distribution of gold grade in long section reflects the varying degrees of fracturing, brecciation, and subsequent development of a quartz-carbonate vein stockworks from multiple generations of folding. Figure7-7 illustrates the shape of the mineralised quartz-tourmaline altered host unit.
| | |
| 18th September 2018 | | Page 60 |
| | | | |
| | Loulo-Gounkoto Gold Mine Complex NI 43-101 Technical Report | | |
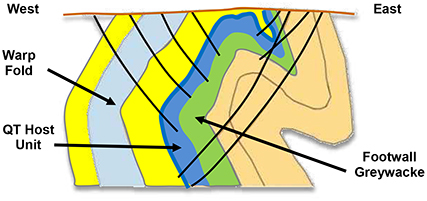
Figure7-7 Cross Section of Gara Fold Structures
Gold mineralisation is strata-bound and hosted predominantly within the quartz-tourmaline stockwork veins, which are enveloped within footwall greywackes and hanging wall sandstone. Higher gold grades values typically occur where the intensity of tourmalisation and stockwork veining are strongest. The sulphide assemblage predominantly consists of disseminated auriferous pyrite with minor chalcopyrite, scheelite, and nickeliferous sulphides.
In the open pit area, the high-grade mineralisation is concentrated along thesub-horizontal fold hinge axes, whereas within the underground area, high-grade mineralisation plunges shallowly southward, parallel to the large scale open warp fold axis . These differential orientations of mineralisation are a result of the earlier, deposit scale warping locally influencing the geometry of the superimposed “S folds” during their formation.
Alteration
Gara is characterised by intense tourmaline alteration. This tourmalisation appears gradational from hanging wall contact to the footwall, its intensity varies from strong to weak. It is also associated with carbonate and silica alteration (veining). Chloritisation is mainly observed in the hanging wall. The sulphides are mainly pyrite (abundant), however arsenopyrite and chalcopyrite have been observed rarely. There is also a correlation between the intensity of tourmalisation, sulphide intensity, silica-carbonate veins, brecciation and gold mineralisation.
Very little saprolite material generated from limited weathering is present at Gara, and as a result the deposit is split into oxide and sulphide.
Mineralisation
Gold mineralisation is strata bound and hosted predominantly within the quartz-tourmaline sandstone unit which is enveloped within footwall greywackes and hanging wall schistose sandstone. Higher gold grades typically occur where the veining is most intense and the range of vein orientation more complex and are mostly in association with carbonate-pyrite. Mineralised veins also contain minor chalcopyrite, scheelite, rare earth element phosphates and nickeliferous sulphides.
| | |
| 18th September 2018 | | Page 61 |
| | | | |
| | Loulo-Gounkoto Gold Mine Complex NI 43-101 Technical Report | | |
Baboto
Baboto is a shear hosted deposit situated along a north-south striking shear structure located approximately 14 km NNE from the Yalea deposit. This 5 km long structure contains the Baboto South, Centre and extends to Baboto North on a neighbouring permit.
Baboto is dominated by a thick sequence of metasediments consisting of siltstone, quartzite, greywacke, polymictic conglomerate, and structural breccias with intercalated, strongly sheared argillite. Late cross-cutting mafic intrusives transgress all lithological units.
Structure
The strike of the bedding varies from NNE to WNW and the dip varies from steeply east to steeply west. The main shear zones are vertical to steeply west dipping at Baboto South and sub vertical in Baboto Centre.
Alteration
A very weak tourmaline alteration affecting the medium and coarse-grained greywacke is observed in the extreme NW and east of the target.
Mineralisation
Gold mineralisation is mainly associated with the finely disseminated pyrite occurring in the brittle-ductile shear breccias. These zones generally have a lensoidal shape defined by a series ofsub-parallelN-S shears that follow the lithological contacts between the conglomerate, quartzite, and greywacke. The tabular pyrite or arsenopyrite does not correlate with gold mineralisation, while the fine acicular arsenopyrite is often associated with the mineralised zones. The hanging wall and footwall to the mineralisation are in general strongly foliated rock. The geological model consists of multiple sub parallel dilation structures hosting mineralised zones, which have a lensoidal shape.
Thelow-grade envelope is probably related to the dilation created by the 202° to 220° early sinistral shear. High-grade (4.4 g/t Au to 12.2 g/t Au) en-echelon quartz veins (oriented 240° and dipping 40° to 85° NW and bounded withinN-S trending shears) might be explained by the reactivation of the early 202° to 220° sinistral shear by the later dextral movement.
Loulo 3
Loulo 3 is located 4 km NNE of the Yalea mine. Loulo 3 consists of three mineralised zones: a NNW trending main zone (MZ1) which is situated on the Loulo 3 structure and is transected by the NNE striking main zone (MZ2), which is situated on the Yalea structure, and the third small sub parallel NW striking footwall (FW) zone. The MZ2 mineralisation has an overall strike length of 1.8 km, ranges in thickness between 6 m to 12 m. Both MZ1 and the FW zone have smaller dimensions, being 580 m in strike, 5 m to 7 m thick and 200 m in strike, with 5 m thickness, respectively.
| | |
| 18th September 2018 | | Page 62 |
| | | | |
| | Loulo-Gounkoto Gold Mine Complex NI 43-101 Technical Report | | |
Mineralisation consists of a mixture of quartz and hematite veinlets hosted in a zone of silica-carbonate alteration within local tourmaline alteration in the south.
The host stratigraphy comprises an eastwardly younging metasedimentary sequence of quartzite, argillaceous quartzite, and greywacke. The hanging wall contains a 2 m thick, dark green fine-grained quartzite is associated with the mineralisation and is consistently exposed in exploration trenches and is used as a marker unit within the open pit. Footwall rocks are comparatively less competent, with a 10 m thick argillite in contact with a tourmaline greywacke towards the west.
Structure
The host sequence and mineralisation are intruded andcross-cut by two sets ofsub-vertical mafic dykes, striking north and NNE. The NNE trending mafic intrusive has exploited asub-vertical late fault, which has displaced the mineralisation by uplifting the eastern block by between 5 m and 10 m, suggesting a component of shortening. Subparallel NW trending pods of mineralisation are found on a left-hand jog which has dilated due to sinistral movement.
Alteration
Local weak to moderate tourmaline alteration generally decreases in intensity southward along strike. Strong iron oxide alteration and hematite veinlets are seen within the mineralised zone, which increase in intensity proximal to box work veins and fractures.
Mineralisation
Paragenetic studies show Loulo 3 mineralisation contains numerous sulphide phases, with chalcopyrite occurring late in the mineralisation history. which is situated on the Yalea structure, and the third small sub parallel NW striking footwall zone. Mineralisation consists of a mixture of quartz and hematite veinlets hosted in a zone of silica-carbonate alteration within local tourmaline alteration in the south.
The distribution of high-grade zones is controlled by the narrowing of the host stratigraphy package, which focusses strain and fluid flow, causing the hematite rich Yalea Structure to interact with the silica-carbonate Loulo 3 Structure particularly within MZ2. Gold bearing sulphides predominantly consist of pyrite and arsenopyrite, with chalcopyrite occurring as a latenon-gold bearing phase.
Gara West
Gara West is located in the hanging wall sequence approximately 400 m west of the Gara pit and is characterised by predominantly shear and breccia hosted mineralisation within a medium to coarse grained sandstone unit that is variably altered with tourmaline, chlorite, and silica-carbonate. The sandstone hosts four mineralised lodes striking NNE and dipping moderately westward. All mineralised zones aresub-parallel, striking NNE and dipping steeply westward.
| | |
| 18th September 2018 | | Page 63 |
| | | | |
| | Loulo-Gounkoto Gold Mine Complex NI 43-101 Technical Report | | |
The host sequence at Gara West forms part of the same folded stratigraphy in which the Gara deposit is developed, and largely consists of sandstones, limestones, argillaceous quartzites, pink quartzite, and a distinctive heterolithic breccia.
Structure
Bedding is generally oriented NS, dipping 50° west however sinistral folding can produce changes in strike and dips that locally aresub-vertical.
Alteration
The medium to coarse grained sandstone has been preferentially altered with tourmaline (and silica-albite) due to the increased porosity of the protolith, relative to the bounding limestone in both the hanging wall and footwall.
Mineralisation
The gold mineralisation is strata bound and hosted in strongly developed quartz carbonate vein arrays as well as associated disseminations and hydrothermal breccias within pink quartzite. The mineralisation exhibits a pinch and swell geometry at the scale of the deposit and have greater continuity along strike than at depth. Higher grades are associated with increasing intensity of quartz-carbonate vein development, carbonate-hematite-goethite alteration, and intensity of brecciation.
| 7.5 | Gounkoto Permit Geology and Mineralisation |
Gounkoto
Gounkoto is a shearzone-hosted deposit consisting of an east-dipping mineralised package of fine-grained sedimentary sandstone units termed QR (after the French term “quartz rosé” meaning pink quartzite), with rare limestones. It is bound in the hanging wall by black sandstone and the footwall by west dipping sediment. The deposit is characterised by a stepped geometry, with wider zones of mineralisation generally seen on the NW trending structures and narrower zones on the north-south trending structures. This is believed to be related to dilation across these structures in a strong sinistral strain environment.
The hanging wall of the deposit is characterised by a thick sequence of fine grained ‘black sandstone’ with or without narrow units of limestone and QR (Figure7-8). The mineralisation is generally hosted in a siliceous QR unit and the footwall consists of argillaceous quartzites (SQR) and/or greywacke with narrow mafic intrusives including micro diorites.
| | |
| 18th September 2018 | | Page 64 |
| | | | |
| | Loulo-Gounkoto Gold Mine Complex NI 43-101 Technical Report | | |
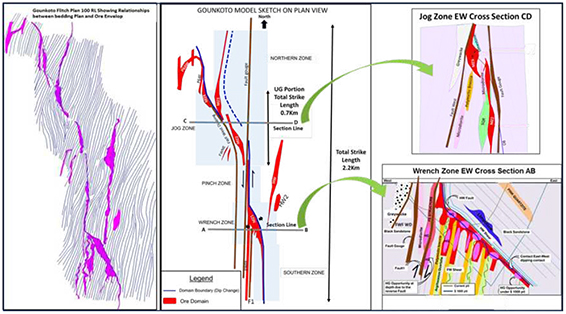
Figure7-8 Typical Plan View and West-East Cross Section across Gounkoto MZ1, MZ2 and MZ3
The Gounkoto system is characterised by strong foliation and shear fabrics with different orientations. Foliation in the hanging wall black sandstone is parallel to bedding and strikes NNE and dips 50° to 60° SE. This fabric intensifies to a shear in the immediate hanging wall of the deposit. Fabrics in theQR- or limestone-hosted mineralisation are generally vertical to steep west-dipping. Black sandstone, SQR and greywacke in the footwall exhibit moderately to steeply west-dipping foliation.
There are six main lithologies present at Gounkoto:
| | ● | | SQR – ‘Schistose Rose Quartzite’. A host of lower grade gold mineralisation comprising finely interbedded calcareous silts and shales with siliceous material. |
| | ● | | Limestone – fine grained sedimentary dolomitic limestones (or more accurately meta-dolomites due to regional metamorphism). |
| | ● | | QR – ‘Rose Quartzite’. Pink quartzite is the main host to mineralisation at Gounkoto. Fine grained variously silty/shaley arkose grits with variable carbonate contents have been altered (albitic and limonitic) during several events to give the pink colour. |
| | ● | | HWQR – Hanging wall QR. Differs from QR in its lack of first stage chlorite-magnetite alteration and secondary hydration/oxidation events. |
| | ● | | Greywacke – fine to medium grained, strongly pelitic feldspathic arkoses. Generally darker due to strong chlorite and tourmaline alteration. |
| | ● | | Intrusives – Intermediate composition cross-cutting dykes. |
Structure
Gounkoto is a large NNW trending shear zone, with a complex assemblage of ductile shear breccias, shears, and faults characterised by a stepped geometry, with wider zones of mineralisation generally seen on the NW trending structures and narrower zones on the north-south trending structures. This is believed to be related to dilation across these structures in a strong sinistral strain environment. The mineralisation is generally hosted in a siliceous ‘Rose
| | |
| 18th September 2018 | | Page 65 |
| | | | |
| | Loulo-Gounkoto Gold Mine Complex NI 43-101 Technical Report | | |
Quartzite’ (QR) unit. The mineralisation is subdivided based on the structural and lithological characteristics. From north to south, these are:
| | ● | | Northern Zone: a narrow package of limestone-hosted mineralisation between hanging wall and footwall shear zones striking NNE and dipping steeply to the east. Mineralisation is of intermediate thickness and grade relative to the rest of the deposit. |
| | ● | | Jog Zone: a broad assemblage of repeated stacked gritty QR units, structurally offset from one another creating a stepped geometry, generally striking NNW. Upright flower structures have created an apparent thickening of units, forming wide mineralised zones of high-grade. |
| | ● | | Pinch Zone: a narrow package ofQR-hosted mineralisation between hanging wall and footwall shear zones striking NS and dipping steeply east close to the surface but shallows in dip at depth. The mineralisation is generally narrow andlow-grade. |
| | ● | | Wrench Zone: a broad package ofQR-hosted strongly mineralised lodes between hanging wall and footwall shear zones striking NW and dipping 40° to 50° east. |
| | ● | | Southern Zone: a narrow package ofQR-hosted mineralisation between hanging wall and footwall shear zones striking NS and dipping steeply east. The mineralisation is generally narrower and lower grade than the Northern and Wrench Zones. |
At a deposit scale the interaction between older NNE structures and a NNW structure in wrench zone and between the older NNE and NS in north is evident. It appears that the interaction between those structures is responsible for the low angle NE plunging zones of high-grade mineralisation recognised at Gounkoto. These NW structures are either steep strike-slip faults which may have tapped deep fluids, or they are related to a more regional thrusting event. The NS structures are thought to be related to the movement on the Senegal-Malian shear structure during early accretion. The NNE structures are related to the bedding, which has been exploited by the shearing.
Alteration
Several phases of alteration are evident at Gounkoto. Initial greenschist facies regional metamorphism resulted in sericitisation and chloritisation. This was followed by a strong oxidation and hydration event which particularly affected pelitic and fine-grained units, marked by the introduction of limonite into the system. Subsequent phases of hydrothermal activity introduced a pink-orange silica-albite alteration which affected more permeable siliceous QR and SQR units.
Several phases of oxidation occurring at various stages relative to gold mineralisation resulted in iron mineralisation, producing characteristic zones of purple and red oxidised hematite alteration.
Mineralisation
Gold is strongly associated with sulphide mineralisation, dominantly pyrite. Magnetite, chalcopyrite, arsenopyrite and pyrrhotite are also present locally and have a strong association with gold. Gold is also commonly found in gangue in zones of strong silica-carbonate alteration, suggesting that remobilisation also played a role in gold (re)distribution at Gounkoto.
The initial stage of mineralisation involved the deposition of euhedral and equant grains of magnetite in stringer networks, veinlets, and aggregates, and accompanied by chlorite mineralisation. This magnetite mineralisation was subsequently subjected to a strong oxidisation
| | |
| 18th September 2018 | | Page 66 |
| | | | |
| | Loulo-Gounkoto Gold Mine Complex NI 43-101 Technical Report | | |
and hydration event resulting in almost total replacement of magnetite to haematite and annealing of the stringer network together to form aggregate almost massive bodies of haematite, leaving magnetite as small relict grains within haematite.
The onset of the second stage of mineralisation at Gounkoto was synchronous with the oxidation of magnetite and growth of haematite, occurring initially as pyrite (with minor gold and chalcopyrite) which are locally included within the aggregate bodies of haematite. The pyrite mineralisation event was pervasive in nature and was accompanied by strong silica-carbonate alteration, creating the dominant silica-carbonate-pyrite mineral assemblage at Gounkoto. This early pyrite is typically surrounded and enveloped by later stage pyrite with a more cellular and filamentous habit with which gold is commonly associated.
Faraba
The Faraba deposit strikes NNW and is comprised of several zones of gold mineralisation hosted within and along the contacts of north-south striking, coarse grained, gritty sandstone units (lithic wackes) in a package of sheared argillaceous sediments. The host sandstones for mineralisation are arkosic grits comprised of plagioclase and quartz grains in a matrix containing dolomite and clay minerals. Lithologic layering (transposed bedding) dips steeply westward; however, the mineralised zones dip steeply to the east.
The mineralisation terminates where the Faraba Structure meets the argillite units on either side of the sandstones. The resulting mineralisation occurs as numerous silica-carbonate and secondary iron oxide altered sub vertical panels with narrow east-west dimension, each containingsub-horizontal to shallow plunging zones of higher grade.
Structure
The structural model involves theNNW-striking Faraba Structure intersecting favourable (competent) coarse grained sandstone units. The resulting mineralisation occurs as numerous upright, north-south striking panels with narrow east-west dimension, intermediate vertical dimension with a maximum dimension along strike, each containingsub-horizontal to shallow southward plunging zones of higher grade. A consequence of this geometry is that mineralisation cannot be projected down dip on either shear structures or host lithologic layers, which reduces the continuity of mineralisation in cross section. The plunge control on higher grade mineralisation is the result of the intersection between individual shears of the Faraba System and sandstone units within the local stratigraphy. When these structural elements aresub-parallel in strike,sub-horizontal shoots are produced.
As the discordance in strike orientation between the shears and sandstone increases, the higher grade shoots adopt a general southward plunge (up to 25°), although northward plunges are also observed in the system locally. These reversals in plunge are produced by the anastomosing geometry of the shear structures intersecting the planar stratigraphy, which creates intersection lineations that are curvilinear (and locally north plunging).
At depth, aNNW-striking, 60° W dipping fault, with a surface trace located to the east of the Faraba System, truncates the resource at depth with an unknown offset.
| | |
| 18th September 2018 | | Page 67 |
| | | | |
| | Loulo-Gounkoto Gold Mine Complex NI 43-101 Technical Report | | |
Alteration
Hydrothermal alteration is multi-phase, with early silica alteration and barren arsenopyrite. Later phases of fluid flow introduced silica-carbonate with subordinate iron alteration (magnetite) associated with pyrite and gold.
Mineralisation
During mineralisation, interpretedNW-directed shearing has produced an array of mineralised east-dipping veins and breccias in the more competent sandstone host rocks. Gold mineralisation is dominantly hosted by pyrite, with local magnetite, chalcopyrite, arsenopyrite and pyrrhotite. Gold is also commonly found in gangue in zones of strong silica-carbonate alteration, suggesting that remobilisation also played a role in gold (re)distribution at Gounkoto.
An independent external audit by QG Consulting (QG) that was completed in early 2015 identified that the broad geological setting at Yalea and Gara is well understood and that they are predictable for the mine geologists.
QG also commented that the mineralisation is easy to define in the underground faces, drill core as the alteration and veining makes the mineralised contact easy to define. QG concluded that at Loulo, the conversion of geological understanding into wireframes supports the Mineral Resource estimation process.
QG found that at Gounkoto, the geology is more complex and that there is still a relatively high degree of uncertainty in the interpretations when compared to Yalea and Gara. QG commented that as the pit gets deeper and the mining transitions to underground, the interpretation carries a greater risk for increasedore-loss and dilution. Randgold has taken steps to counteract this risk at Gounkoto through additional drilling, interpretation modifications and, most significantly, the expansion of the pit to include more material that was previously part of the underground resource.
The QP is confident that Loulo-Gounkoto teams have a clear understanding of the geology and mineralisation so that geologically valid interpretations and wireframes can be created to prepare the Mineral Resource models.
| | |
| 18th September 2018 | | Page 68 |
| | | | |
| | Loulo-Gounkoto Gold Mine Complex NI 43-101 Technical Report | | |
Paleoproterozoic meta-volcanic and metasedimentary rocks, and associated intrusive rocks are collectively referred to as Birimian and are the primary source of gold deposits across West Africa. The Birimian mineralisation occurs primarily along the edges of volcanic belts along faults that cut through and near the host greenstone rocks. The Loulo and Gounkoto deposits can be classified as a typical shear hosted Birimian style mesothermal gold deposits.
The Birimian turbiditic sedimentary rocks have been intruded with multiple sills and dykes of varying composition. The package of Birimian rocks has been influenced the Eburnean orogeny which has subjected the rocks to deformation and metamorphism. These deformation events have resulted in the shearing which hosts multiple gold deposits across the region. Gold mineralisation is associated with shears and intrusions. It is found:
| | ● | | Either bound between shears, |
| | ● | | Occurring adjacent to a shear, |
| | ● | | Within a favourable lithology that has been structurally prepared by shearing. |
The mineralisation is hosted within the volcaniclastic and sedimentary package. These deposits tend to have significant strike and depth potential, with exploration concentrating on delineating strike and depth extent, followed by infill drilling within the zones of better continuity and grade.
Tourmalised greywacke outcrops are used to potentially locate Gara style mineralisation. Structural analysis is used to locate zones of possible dilation that can result in Yalea style mineralisation.
The airborne electromagnetic survey integrated with structural and surface geochemical data has been used to identify resistive and conductive zones which are indicative of mineralisation.
| | |
| 18th September 2018 | | Page 69 |
| | | | |
| | Loulo-Gounkoto Gold Mine Complex NI 43-101 Technical Report | | |
Immediately after acquisition of the Loulo Project Randgold completed:
| | ● | | 13,155 m core and 8,996 m RC drilling which led to the discovery of Yalea. |
| | ● | | Validation and infill drilling at Gara with 15 drill holes. |
| | ● | | Sterilisation drilling at proposed mine infrastructure sites. |
| | ● | | Regional exploration programs with remote sensing, geological and regolith mapping, details soil grids along with pitting and trenching. |
| | ● | | Re-interpretation of the BHP soil data. |
Since then, Randgold has undertaken numerous RAB, RC and diamond drilling programs along with trenching to target: Gara, Yalea, Loulo 3, Loulo 2, Baboto, Gara West, P129, Faraba, and Gounkoto. Exploration continues at Loulo-Gounkoto to replenish resources that have been depleted from mining.
As the knowledge base grows through continual geological documentation during mining, brownfields exploration is undertaken adjacent to the known mineralisation, in an attempt to locate further extensions. Successful targeting through the reinterpretation and integration of the exploration strategy is demonstrated with the discovery of Gounkoto.
Exploration at Loulo-Gounkoto is focussed on advancing both brownfields and greenfields targets. Brownfields exploration involves testing underground and open pit targets for high-grade mineralisation based on the structural model. This program of drilling aims to discover additional potentially economic resources at step out distances greater than 400 m from the current limits of the resource block models. Recent geophysical surveys have been integrated with updated geological maps to develop a tectonostratigraphy of the Kofi Series rocks at Loulo-Gounkoto, to improve the understanding of the controls to gold mineralisation and the regional geologic architecture. This Project-wide geologic framework is driving are-assessment of exploration work to date as part of greenfields target generation.
The Loulo district is extremely prospective for gold mineralisation and the tactic is to locate suitable dilatational traps on, or adjacent to the main gold bearing structures that can host significant economic mineralisation. Going forward, fieldwork will include mapping, lithological sampling and trenching to develop and test geologic models for these targets to advance them through the resource triangle on a results driven basis.
The current exploration concept has been proven to be effective, with both the discovery of Gounkoto and the successful replenishment of depleted Mineral Resources and Ore Reserves at both mines.
| | |
| 18th September 2018 | | Page 70 |
| | | | |
| | Loulo-Gounkoto Gold Mine Complex NI 43-101 Technical Report | | |
2017 Loulo Exploration
A Project wide integrated target map at Loulo has been completed incorporating field mapping, satellite imagery, DTM data, soil geochemistry, and regolith interpretation in an integratedre-ranking of targets.
At Yalea, surface resource definition drilling within the Yalea Transfer Zone is designed to test previously observed high-grade intersections returned strong intercepts.
At Gara, drilling continued to target Gara Far South Extended for the purposes of defining an Indicated Mineral Resource and better defining the position of the cataclastic fault with associated hydrothermal albitite that offsets the mineralisation.
At Loulo 3, diamond drilling was used to test the MZ1 and MZ2 strands of the Loulo 3 structure to expand the defined mineralisation.
A structural review of Gara West was completed in 2017 which has significantly upgraded the existing resource by identifying higher grade shear and breccia mineralisation hosted in a tourmaline and albite altered sandstone unit. This mineralisation ranged from 0.8 m to 13.4 m thick and averaged 4.0 m thick across the 68 intersecting holes.
Greenfield field mapping and trenching was completed to provide additional information for the integrated target map.
Planned 2018 Loulo Exploration
The key aims of the 2018 Loulo exploration programme are to replace 2018 depletion and discover a stand-alone resource or significant satellite to increase Mineral Resources and LOM of Loulo-Gounkoto.
Surface resource definition of Yalea Transfer Zone and Yalea Central Deeps that commenced in 2017 is planned to continue into 2018. Further exploration drilling is planned to target the Yalea intersections panel immediately below the Yalea South Transfer Zone target.
Follow up drilling will be used to target potential extensions to the additional Gara West mineralisation intersected in 2017, as the system appears open at depth and along strike to the south.
Loulo 3 drilling is designed to target plunge extensions of MZ2 shoot at near surface and at depth and to test the variability in the mineralisation thickness and grades across at a range of drill spacings.
A structural review will be completed on the entire Gara West system to determine the potential of higher grade mineralisation remains open at depth and along strike.
| | |
| 18th September 2018 | | Page 71 |
| | | | |
| | Loulo-Gounkoto Gold Mine Complex NI 43-101 Technical Report | | |
2017 Gounkoto Exploration
As at Loulo, a Project-wide integrated target map encompassing field mapping, satellite As at Loulo, a Project -wide integrated target map encompassing field mapping, satellite imagery, DTM data, soil geochemistry, and regolith interpretation map was drafted tore-rank targets for exploration.
Exploration focussed on structural modelling and drill design to test for potential extensions to the mineralisation in MZ4, MZ3 Main, and P64E, as well as in the footwall of MZ1 in order to reduce the strip ratio of the current ‘Super Pit’ shell design.
Re-logging and sectional interpretations of the Iron Structure within Gounkoto deposit has validated high-grade mineralisation hosted on three individual shears to establish the potential viability of extending the Gounkoto pit to include this mineralisation.
Several greenfield targets located along major prospective structures (domain boundary and Faraba Structure) are also being advanced for additional satellite resource potential.
Planned 2018 Gounkoto Exploration
In the same manner as Loulo, the Gounkoto exploration is focused on the primary objective of replacing 2018 depletion and discovering additional resources to increase the inventory of Loulo-Gounkoto.
During 2018, exploration will complete afollow-up RC drilling programme on Faraba North target to define potential extension of the Faraba system. Additionally, the potential extension of a hematite structure, in the eastern portion of the Faraba Main open pit will also be tested.
A gap analysis across the entire Gounkoto System has identified opportunities along a 250 m strike length of the Domain Boundary. A twin diamond drill hole has been approved to better understand how the interpreted footwall-finger style mineralisation relates to the HW Domain Boundary in Faraba. Additional drilling will target the domain boundary plunge.
Loulo and Gounkoto have a detailed Standard Operating Procedure (SOP) Manual for Exploration and Drilling Practices that provides standardisation and consistency for all field technical personnel to ensure the collection of quality data. The Exploration Manager and Mineral Resource Manager are very experienced in the region and deposit style.
The 2018 planned exploration targets both potential extensions of mineralisation will provide crucial information to further geological knowledge across the complex. The integrated target map update andre-ranking of targets within Loulo and Gounkoto permits that was undertaken in late 2017 is a crucial study that should provide an effective plan for long term regeneration of depleted Mineral Resources.
| | |
| 18th September 2018 | | Page 72 |
| | | | |
| | Loulo-Gounkoto Gold Mine Complex NI 43-101 Technical Report | | |
RAB, RC, and diamond drilling have been used at Loulo and Gounkoto, although RAB drilling is not used for Mineral Resource estimation. Outcrop, soil, and trench samples are also used for early stage exploration. Selected trench data is used for resource estimation, and the sampling parameters are the same as utilised for RC drilling.
An example of the drilling density for each deposit is presented in section 14.12 Resource Classification.
A February 2015 Independent Mineral Resource audit by QG deemed that the data collection procedures follow industry standard practices.
All soil sampling, mapping, trenching, and geological supervision of drilling has been conducted by Randgold geologists. Table10-1 and Table10-2 presents the known drilling by year, company, and type at Loulo and Gounkoto Permits. An example of the drill density by deposit is detailed in Section 14.14Block Model Validation.
Table10-1 Loulo Drilling Summary
| | | | | | | | | | | | | | | | | | | | | | | | | | |
| Year | | Company | | Diamond | | RC | | RAB | | Trench | | Channel | | Total |
| | Hole
Count | | Meters | | Hole
Count | | Meters | | Hole
Count | | Meters | | Hole
Count | | Meters | | Hole
Count | | Meters | | Hole
Count | | Meters |
1993 | | BRGM | | 125 | | 15,057 | | — | | — | | — | | — | | — | | — | | — | | — | | 125 | | 15,057 |
1994 | | BRGM | | 30 | | 1,790 | | — | | — | | — | | — | | 4 | | 86 | | — | | — | | 34 | | 1,876 |
1994 | | BHP | | 50 | | 6,634 | | — | | — | | — | | — | | — | | — | | — | | — | | 50 | | 6,634 |
1996 | | BHP | | 5 | | 620 | | — | | — | | — | | — | | — | | — | | — | | — | | 5 | | 620 |
1997 | | BHP | | 15 | | 2,335 | | — | | — | | — | | — | | — | | — | | — | | — | | 15 | | 2,335 |
1997 | | Randgold | | 95 | | 15,358 | | — | | — | | 915 | | 17,916 | | — | | — | | — | | — | | 1,010 | | 33,274 |
1998 | | Randgold | | 37 | | 4,803 | | — | | — | | 267 | | 4,929 | | — | | — | | — | | — | | 304 | | 9,732 |
2000 | | Randgold | | 21 | | 3,640 | | — | | — | | — | | — | | — | | — | | — | | — | | 21 | | 3,640 |
2001 | | Randgold | | 16 | | 1,270 | | — | | — | | 255 | | 6,855 | | 16 | | 667 | | — | | — | | 287 | | 8,792 |
2002 | | Randgold | | — | | — | | — | | — | | — | | — | | 49 | | 988 | | — | | — | | 49 | | 988 |
2003 | | Randgold | | 84 | | 18,244 | | — | | — | | — | | — | | 317 | | 14,101 | | — | | — | | 401 | | 32,345 |
2004 | | Randgold | | 84 | | 31,962 | | 77 | | 6,131 | | 719 | | 22,409 | | 25 | | 1,342 | | — | | — | | 905 | | 61,844 |
2005 | | Randgold | | 124 | | 63,565 | | 135 | | 7,752 | | 145 | | 5,332 | | 83 | | 3,753 | | — | | — | | 487 | | 80,402 |
2006 | | Randgold | | 35 | | 17,606 | | 884 | | 31,456 | | 371 | | 7,442 | | 1 | | 182 | | — | | — | | 1,291 | | 56,686 |
2007 | | Randgold | | 52 | | 26,677 | | 1,283 | | 44,395 | | 1,652 | | 38,751 | | 27 | | 1,205 | | — | | — | | 3,014 | | 111,028 |
2008 | | Randgold | | 88 | | 8,092 | | 763 | | 25,548 | | — | | — | | 104 | | 4,950 | | 127 | | 1,745 | | 1,082 | | 40,335 |
2009 | | Randgold | | 97 | | 11,677 | | 3,474 | | 131,213 | | — | | — | | — | | — | | 167 | | 1,618 | | 3,738 | | 144,508 |
2010 | | Randgold | | 138 | | 13,255 | | 834 | | 33,203 | | 4 | | 86 | | 62 | | 3,287 | | 165 | | 1,601 | | 1,203 | | 51,432 |
2011 | | Randgold | | 245 | | 35,748 | | 346 | | 19,882 | | — | | — | | — | | — | | 431 | | 3,279 | | 1,022 | | 58,909 |
2012 | | Randgold | | 206 | | 29,772 | | 733 | | 31,301 | | — | | — | | 1 | | 22 | | 519 | | 3,278 | | 1,459 | | 64,373 |
2013 | | Randgold | | 145 | | 26,718 | | 42 | | 3,838 | | — | | — | | 33 | | 2,028 | | 757 | | 5,093 | | 977 | | 37,677 |
2014 | | Randgold | | 319 | | 65,644 | | 2 | | 228 | | — | | — | | 77 | | 6,566 | | 526 | | 4,090 | | 924 | | 76,528 |
2015 | | Randgold | | 209 | | 58,185 | | 81 | | 5,061 | | — | | — | | 63 | | 4,635 | | 790 | | 5,352 | | 1,143 | | 73,233 |
2016 | | Randgold | | 365 | | 90,219 | | 1,644 | | 64,511 | | — | | — | | 28 | | 2,113 | | 752 | | 4,547 | | 2,789 | | 161,390 |
2017 | | Randgold | | 450 | | 98,792 | | 163 | | 9,493 | | — | | — | | 41 | | 3,316 | | 833 | | 5,222 | | 1,487 | | 116,823 |
Total | | 3,035 | | 647,663 | | 10,461 | | 414,012 | | 4,328 | | 103,720 | | 931 | | 49,241 | | 5,067 | | 35,825 | | 23,822 | | 1,250,460 |
| | |
| 18th September 2018 | | Page 73 |
| | | | |
| | Loulo-Gounkoto Gold Mine Complex NI 43-101 Technical Report | | |
Table10-2 Gounkoto Drilling Summary
| | | | | | | | | | | | | | | | | | | | | | |
Year | | Company | | Diamond | | RC | | RAB | | Trench | | Total |
| | Hole Count | | Meters | | Hole Count | | Meters | | Hole Count | | Meters | | Hole Count | | Meters | | Hole Count | | Meters |
| 1993 | | BRGM | | 15 | | 1,290 | | 15 | | 852 | | — | | — | | — | | — | | 30 | | 2,142 |
| 2000 | | Randgold | | — | | — | | 2 | | 200 | | — | | — | | — | | — | | 2 | | 200 |
| 2005 | | Randgold | | — | | — | | 31 | | 3,943 | | 165 | | 6,813 | | 26 | | 1,836 | | 222 | | 12,592 |
| 2006 | | Randgold | | 8 | | 2,000 | | 36 | | 3,092 | | 2 | | 60 | | 54 | | 3,499 | | 100 | | 8,651 |
| 2007 | | Randgold | | 15 | | 3,694 | | — | | — | | 346 | | 10,152 | | 2 | | 65 | | 363 | | 13,911 |
| 2008 | | Randgold | | 11 | | 2,992 | | — | | — | | 398 | | 10,432 | | — | | — | | 409 | | 13,424 |
| 2009 | | Randgold | | 79 | | 16,733 | | 32 | | 2,921 | | 175 | | 4,953 | | 12 | | 594 | | 298 | | 25,201 |
| 2010 | | Randgold | | 140 | | 46,941 | | 627 | | 53,380 | | — | | — | | 17 | | 816 | | 784 | | 101,137 |
| 2011 | | Randgold | | 70 | | 34,925 | | 222 | | 18,097 | | — | | — | | 105 | | 8,721 | | 397 | | 61,743 |
| 2012 | | Randgold | | 12 | | 6,990 | | 1,345 | | 39,775 | | — | | — | | 7 | | 458 | | 1,364 | | 47,223 |
| 2013 | | Randgold | | 62 | | 22,999 | | 930 | | 57,366 | | — | | — | | 22 | | 1,682 | | 1,014 | | 82,047 |
| 2014 | | Randgold | | 34 | | 14,884 | | 448 | | 35,064 | | — | | — | | 47 | | 3,097 | | 529 | | 53,045 |
| 2015 | | Randgold | | 17 | | 6,108 | | 1,061 | | 58,300 | | — | | — | | 4 | | 238 | | 1,082 | | 64,646 |
| 2016 | | Randgold | | 45 | | 14,993 | | 1,050 | | 59,079 | | — | | — | | 15 | | 1,012 | | 1,110 | | 75,084 |
| 2017 | | Randgold | | 17 | | 4,364 | | 965 | | 52,210 | | — | | — | | 48 | | 4,148 | | 1,030 | | 60,722 |
Total | | 525 | | 178,913 | | 6,764 | | 384,279 | | 1,086 | | 32,410 | | 359 | | 26,166 | | 8,734 | | 621,768 |
Loulo-Gounkoto uses UTM WSG84 Zone 29 grid for all surveys.
| 10.3 | Drill Planning and Site Preparation |
Drill holes are planned in Vulcan and Micromine software. Consideration is given to the orientation of the drilling in relation to the geological structures, to provide for unbiased sampling. Surface drill holes are principally planned to intersect the mineralisation perpendicular to the main body of mineralisation. The planned collar location is marked by the Mine Surveyor using a differential GPS (DGPS). If required, the drill pad is cleared around the collar marker to ensure sufficient room is available for the drill rig, auxiliary vehicles, and sample collection.
Underground drill collars, as well as back sights and foresights, are surveyed using total station underground survey instruments, and marked on the drift walls, by the Loulo Mine surveyors.
If the drill hole is to be completed using diamond drilling, then a sump is dug in one corner of the pad to collect the drilling returns. The sump is fenced off with a temporary barrier and security tape.
The Senior Geologists, Drill Contractor, Mine Planner, Mine Surveyor and Mineral Resource Manager all sign off on the drill hole plan prior to initiating drilling.
There are three categories of drilling at Loulo-Gounkoto:
| | • | | Exploration Drilling – wide spaced exploratory and resource definition drilling. This category will include diamond drilling with RCpre-collars (RC_DDH). |
| | • | | Advanced Grade Control Drilling – consists of wider spaced drilling to position underground Footwall (FW) drives and for Mineral Resource upgrades in the open pits. |
| | • | | Infill Grade Control Drilling – used for final production definition for Measured Mineral Resources / Proved Ore Reserves. Generally, Loulo-Gounkoto inventory of Infill Grade Control Drilling is some three to six months inventory for open pit and approximately 18 months for underground. |
| | |
| 18th September 2018 | | Page 74 |
| | | | |
| | Loulo-Gounkoto Gold Mine Complex NI 43-101 Technical Report | | |
All drill holes are surveyed down-hole using a multi shot Reflex EZ-Trac or a conventional Gyro surveying tool which measures the azimuth and dip every 25 m down hole. Drill holes are also surveyed as drilling is ongoing using a single shot measurement to ensure the hole is progressing as planned. The Gyro is used in any zones with magnetic interference. Some drill holes that were drilled for the underground feasibility study were measured with the Gyro on 5 m intervals. During 2018, the EZ-Trac will be replaced with anon-magnetic north seeking Reflex Gyro.
The survey measurements are manually entered into the database. With the planned upgrade to theEZ-Gyro tool the surveys will be stored on a handheld Panasonic controller which will connect to the Reflex Hub Management software and upload the surveys directly to the Datashed database, thereby removing any potential human errors during transcription.
The Reflex down hole survey tools are returned to the manufacturer for calibration on an annual basis. A known survey tool test stand has been erected at the Project so that the tools can be checked weekly.
Once a drill hole, or surface trench, is completed and all machinery has moved away from the site, the drill hole is surveyed using a DGPS for surface drilling and by total station underground by Randgold Surveyors.
The drill collar is plugged, and a concrete collar surround is placed which is labelled with the HoleID and survey date. The sumps are backfilled, and the drill site is remediated. Trenches are surveyed by DGPS starting at the collar (initial cut) and then additional point measurements are taken every 2 m.
Randgold primarily uses Boart Longyear Canada for underground and surface drilling. Initial drilling at Loulo was completed by West African Drilling Services. Some minor Gounkoto grade control drilling is completed by a local contractor, DCS Mali SARL. Core sizes are HQ (63.3 mm core diameter) in saprolite (oxides) and NQ (47.6 mm core diameter) in the unweathered rock. On completion of drilling, all diamond holes are photographed.
Core recoveries are generally good, with an average of 97.4% recovery in the unweathered rock, 84.6% recovery in the transitional zone and 76.0% in the saprolite zone. Average recovery in the mineralised zones was 97.6% with a range of between 80% and 100%.
Drilling Procedure
A project geologist must be on site prior to drilling commencing and ensure that the drill rig is lined up as per the drill plan as well as supervising drilling, core orientation and down hole surveying. Once each drilling run is complete, the drill core is removed from the drill rod and
| | |
| 18th September 2018 | | Page 75 |
| | | | |
| | Loulo-Gounkoto Gold Mine Complex NI 43-101 Technical Report | | |
placed in an angle iron rack to mark up an orientation line with red chinagraph pencil or crayon from the data received from a Reflex ACT II Core Orientation Tool (ACT). The apex of the structure is marked on the core in a chinagraph pencil or crayon by the core technician. If the orientation and apex lines are overlapping, then the apex line is offset by 5 mm.
Diamond core is transferred to the core trays and a plastic down hole depth marker is placed at the beginning and end of each core run with the depth marked on it. All areas of core loss are identified, and the core is marked up for core recovery. Each drill core box is marked with the Hole ID, top and bottom depth of the core and the box number. The core is then transferred to the core yard facility by Randgold staff for logging and sampling.
Core Logging
Diamond drill core is logged geologically including, weathering, mineralisation, alteration, structure, lithology, and redox. Core recovery is measured both in the field and during detailed logging. All structural data including alpha and beta angles of any structures are also recorded at this stage. Logging is completed on to paper logs by the geologist which are transcribed to the central database after verification.
All diamond drill core is oriented and where determining orientation is not possible the core is assembled with previous runs, where possible, to try and extend the orientation line, such that structural directions in the form of alpha and beta angles are documented.
Geotechnical logging is only performed on holes specifically drilled for geotechnical assessment. Diamond core is photographed both wet and dry to provide a safeguard for core loss and to aid geological interpretation.
Sampling
Diamond drill half core samples are taken between 0.8 and 1.2 m long and split at boundaries between geological units. The drill core is split using a diamond saw with fresh water. Half core is submitted for assay wherever possible, quarter core was historically only used when there is a need for further assays or other analysis to be completed which need to be completed on the same interval. Metallurgical sampling is generally only undertaken on either dedicated metallurgical drill holes or on coarse crush duplicates.
Diamond core is photographed both wet and dry before being halved with a diamond saw. One half is submitted for assay analysis whilst the other half is stored for future reference.
| 10.7 | Reverse Circulation Drilling |
RC drilling has been used historically in the open pit but is no longer used at Yalea and Gara underground operations. RC drilling is still used at other open pit operations and brownfield exploration. RC drilling is used at Gounkoto for grade control and exploration/resource development.
| | |
| 18th September 2018 | | Page 76 |
| | | | |
| | Loulo-Gounkoto Gold Mine Complex NI 43-101 Technical Report | | |
RC drill holes to date have been drilled at a 5.5 inch / 140 mm diameter which produces approximately 25 kg of material per 1 m sample interval. The RC drill rods are 3 m in length.
Drilling Procedures
Most RC samples are passed directly through a Gilson splitter. Alternatively, a cone splitter is used on some rigs which are utilised less frequently. RC samples are collected onone-meter intervals. RC chips are sieved and logged by the geologist before being placed in chip boxes for storage.
A Project geologist is present during all RC drilling. Prior to commencement of any drilling he/she will print out cross sections for all planned holes, indicating the expected geology and mineralisation to be intersected and ensure that prepared and labelled sample bags are present. The geologist is responsible for the site layout to ensure that, where possible, the drilling and sampling operations will not interfere with each other and that the sampling is not taking place down wind of the drilling.
A 6 m PVC casing is used to collar the hole to help prevent drill hole collapse and sample contamination. Once the drill hole has been collared the geologist ensures that the drill hole is cleaned to remove any material that may have ingressed during collaring before drilling is resumed.
If the drill hole intersects the water table an auxiliary booster(s) is used to ensure that the samples are dry. After each rod change air is blown down the hole prior to recommencing drilling to dry it out.
If the sample is moist or damp, the bulk sample is weighed and recorded as a “wet sample weight”. The moist or damp samples are transported to the sampling area and dried. Once dry the sample isre-weighed and the dry weight recorded in addition to the previously recorded wet weight. This is rarely an issue due to mine Permit dewatering infrastructure.
Reverse Circulation Logging
All RC samples are logged on 1 m intervals as per the sample length received from the RC rig. time. For each drill hole lithology, visible mineralisation, vein intensity, alteration, oxidisation, and depth of water table are logged as a minimum.
RC sample recovery is measured by weighting the total weight of sample collected over eachone-meter interval and comparing this to the theoretical expected weight for the lithological unit and weathering type.
Sampling and Splitting Procedure
A 12.5 kg split sample is produced from the initial 25 kg RC sample through the primary Gilson splitter. This 12.5 kg samples are then passed through a second Gilson splitter to produce a 3 kg to 4 kg sample which can be submitted for analysis.
| | |
| 18th September 2018 | | Page 77 |
| | | | |
| | Loulo-Gounkoto Gold Mine Complex NI 43-101 Technical Report | | |
After splitting the sample, both the primary sample and rejects are weighed and recorded. A small amount of material is taken from the sample rejects and placed in a slotted plastic rock chip sample tray, which arepre-labelled with the drill hole ID and sequence numbered drill hole intervals in each sample slot. RC sample recovery is measured by weighing the total weight of sample collected overone-meter sample and comparing this to the theoretical expected weight for the lithological unit and weathering type.
The RC samples are believed to be representative of mineralisation present at all Loulo and Gounkoto Mineral Resources. The QP considers the quality of RC drilling to be at an industry accepted standard.
Most of the trenches were excavated perpendicular to strike of the known mineralisation. The trenches are excavated through all transported material until at least 50 cm of insitu saprolite is exposed at the base of the trench. All trenches were geologically mapped in detail by a geologist on both walls. As part of the mapping the lithology, alteration, mineralogy, and orientation of any visible structures are recorded.
The standard sampling procedure was such that a shallow cut, approximately 15 cm to 20 cm wide channel is excavated at the bottom of the trench and sampled on geological and mineralisation contacts. The dimensions of the channel are kept constant through the entire sample length.
The sample is split onsite using a Gilson splitter and a 3 kg representative sample placed in cloth sample bags with a sample ticket and sent to the laboratory.
| 10.9 | Other Sampling Methods |
RAB and pitting has been used at Loulo-Gounkoto for exploration purposes however it is not used for resource estimation purposes.
| 10.10 | Drill Twinning Studies |
Twin drilling studies have been undertaken at Yalea and Gara as part of the original feasibility studies prior to construction of underground mine development. These comparisons have shown that although there can be variations in grade, as expected, the broad intercepts and relative grade of the intersections are comparable across the twins.
Twin drilling has also been undertaken at the Gounkoto MZ and hanging wall. The results of have shown that, although there are local significant grade variations, the broad intercepts and relative grades are generally relatively comparable across the twin intercepts. The FW finger zone, however, has shown dramatic variations on very closely spaced (less than 5 m) drill holes.
The variation in the drill twinning studies has been used to feed the classification criteria for the Mineral Resources. The FW finger zone at Gounkoto, which has the dramatic short scale
| | |
| 18th September 2018 | | Page 78 |
| | | | |
| | Loulo-Gounkoto Gold Mine Complex NI 43-101 Technical Report | | |
variations in grade, has a much tighter drill spacing for Measured Resources (6 m by 6 m) when compared to the remainder of Gounkoto (12.5 m by 12.5 m).
Resource infill and grade control drilling is resulting in local changes to the geological interpretation and modelled grade.
In the QP’s opinion, the drilling and sampling procedures at Loulo-Gounkoto are robust, suitable for the style of mineralisation and are at or above industry standard practices. Regular reviews, external audits and training are undertaken to ensure that this remains so.
The average drill core recovery is 97.4% in the unweathered rock, 84.6% in the transitional zone and 76.0% in saprolite zone. The average recovery in the mineralisation was 97.6% with a range of between 80% and 100%. There are no drilling, sampling or recovery factors that could materially impact the accuracy and reliability of the results.
| | |
| 18th September 2018 | | Page 79 |
| | | | |
| | Loulo-Gounkoto Gold Mine Complex NI 43-101 Technical Report | | |
| 11 | Sample Preparation, Analyses and Security |
The sample boundaries of drill core are determined based on geology and alteration and most often varies from 0.8 m to 1.2 m. Half core is used whenever possible. Historically, quarter core was only used when there is a requirement for a duplicate assay or if another analysis type was required for the same interval. More recently metallurgical samples are taken from dedicated metallurgical drill holes or from coarse reject material.
RC samples are collected on the rig inone-meter intervals and passed through two Gilson splitters to create 2 kg to 3 kg samples. Wet samples are dried before being split.
All samples submitted for analysis are prepared and analysed at the independent SGS Loulo laboratory, which is managed and self-certified by SGS and located on the Loulo mine site.
Grade control and exploration drill samples are prepared in the same manner. Once the samples are received by SGS Loulo, the sample is weighted and entered into a LIMS tracking system. Samples are dried in an oven at 105°C. Channel and trench samples are disaggregated to remove dry lumps. Dried samples are crushed to ensure that 75% of the sample is below 2 mm.
The crushed sample is then passed through a riffle splitter and the reject material is retained. The 1.5 kg split sample is pulverised in an LM2 pulveriser until 85% passes through a75-micron (200 mesh) screen and a 200 g is split removed and placed in a packet. The LM2 pulveriser is cleaned with an air hose every sample, and with blank material every 6th sample. SGS Loulo undertakes regular screen sieve tests on the crushing and pulverising. The coarse (6 mm) reject and the pulp (75 micron) reject material are returned to Randgold for storage at the mine site and futurere-analysis if required.
An external audit completed by QG in February 2015 concluded that the sample preparation procedures followed standard industry practices.
The QP concludes that the sample preparation procedures are regularly checked and follow industry standard practices.
| | |
| 18th September 2018 | | Page 80 |
| | | | |
| | Loulo-Gounkoto Gold Mine Complex NI 43-101 Technical Report | | |
Figure11-1 outlines the flowsheet for diamond drill core sample preparation.
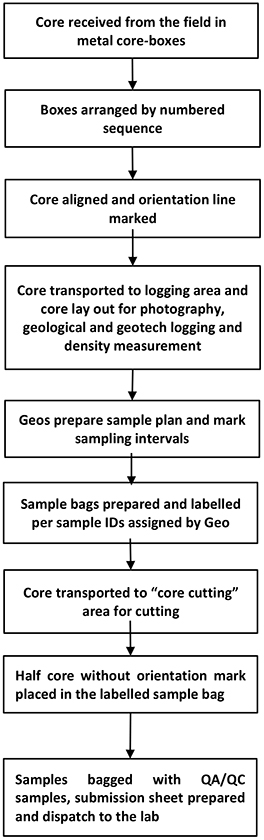
Figure11-1 Summary of Diamond Core Sample Preparation Flowchart - Exploration and Grade Control
| | |
| 18th September 2018 | | Page 81 |
| | | | |
| | Loulo-Gounkoto Gold Mine Complex NI 43-101 Technical Report | | |
Figure11-2 outlines the flowsheet for RC, channel, and trench sample preparation.
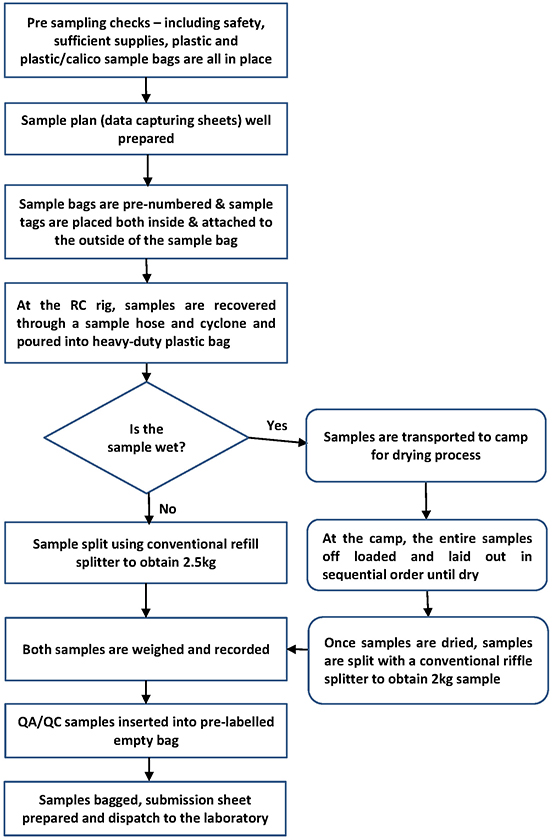
Figure11-2 Summary of RC, Channel, and Trench Sample Preparation Flowchart - Exploration and Grade Control
| | |
| 18th September 2018 | | Page 82 |
| | | | |
| | Loulo-Gounkoto Gold Mine Complex NI 43-101 Technical Report | | |
Figure11-3 outlines the flowsheet for sample preparation at SGS Loulo.
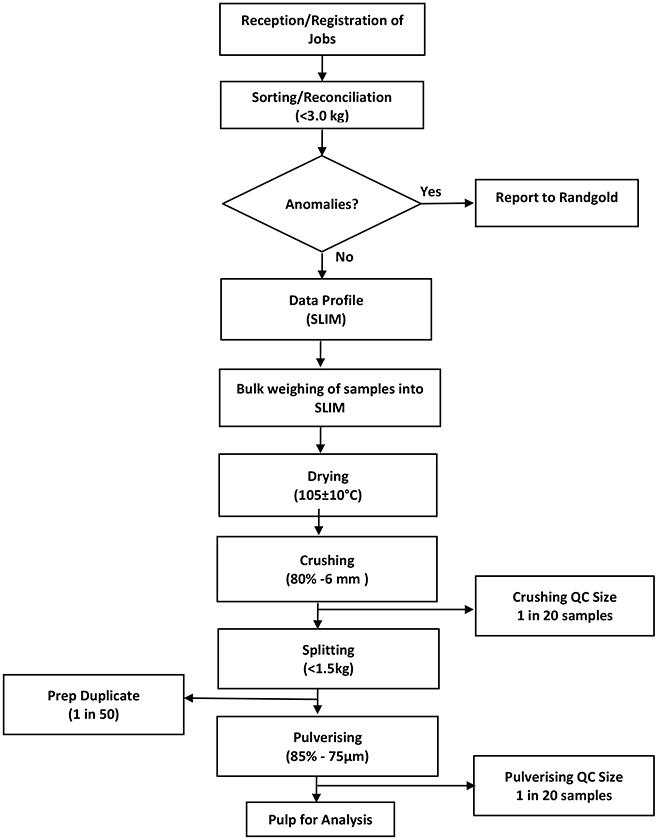
Figure11-3 SGS Loulo Laboratory – Summary of Sample Preparation Procedure
| | |
| 18th September 2018 | | Page 83 |
| | | | |
| | Loulo-Gounkoto Gold Mine Complex NI 43-101 Technical Report | | |
All Samples for Loulo-Gounkoto are analysed at the SGS Loulo laboratory located on the mine site. SGS Bamako is used for sample overflow and analysis that could not be completed at SGS Loulo. Both laboratories are operated independently and self-certified by SGS.
All samples are analysed by fire assay (FAA550) with atomic absorption finish which has a detection range of 0.01 g/t Au to 100 g/t Au. A 50 g sample is split from the pulp and fire assayed. Figure11-4 outlines the flow chart for analysis of samples at SGS Loulo.
In 2017, a total of 40,690 samples were analysed at SGS Loulo from the Loulo Permit (Table11-1), and 61,639 samples were analysed at SGS Loulo from Gounkoto Permit (Table11-2).
Table11-1 Summary of Certified Reference Materials Used at Yalea and Gara
| | | | |
| Loulo |
| Sample Type | | Number of Samples | | Percentage |
DDH | | 17,197 | | 42% |
RC | | 10,391 | | 26% |
Trench/Channel | | 7,601 | | 19% |
Subtotal | | 35,189 | | 86% |
Standards | | 2,474 | | 6% |
Blanks | | 2,271 | | 6% |
Duplicates | | 756 | | 2% |
Subtotal | | 5,501 | | 14% |
Total | | 40,690 | | 100% |
Table11-2 Summary of Certified Reference Materials Used at Yalea and Gara
| | | | |
| Gounkoto |
| Sample Type | | Number of Samples | | Percentage |
DDH | | 3,366 | | 5% |
RC | | 47,978 | | 78% |
Trench | | 1,950 | | 3% |
Subtotal | | 53,294 | | 86% |
Standards | | 3,531 | | 6% |
Blanks | | 3,360 | | 5% |
Duplicates | | 1,454 | | 2% |
Subtotal | | 8,345 | | 14% |
Total | | 61,639 | | 100% |
| | |
| 18th September 2018 | | Page 84 |
| | | | |
| | Loulo-Gounkoto Gold Mine Complex NI 43-101 Technical Report | | |
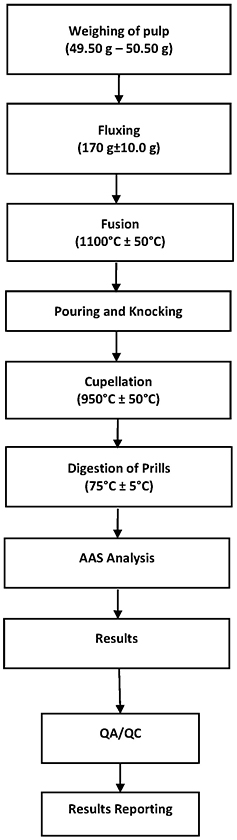
Figure11-4 SGS Loulo Laboratory – Summary of Fire Assay (FAA505) Procedure
| | |
| 18th September 2018 | | Page 85 |
| | | | |
| | Loulo-Gounkoto Gold Mine Complex NI 43-101 Technical Report | | |
| 11.4 | Quality Assurance and Quality Control |
To ensure that the assay results are reliable, Loulo-Gounkoto has a robust quality assurance and quality control (QA/QC) system in place to minimise errors at each stage and procedures to be followed when errors are identified.
Quality Assurance (QA) is to demonstrate that the sampling and analytical protocols are appropriate and optimal for the deposit in question. It should entail orientation sampling studies and statistical analysis so that appropriate systems and standards can be tailored to achieve quality results throughout all the stages of collecting and analysing data. Ideally, orientation studies are performed at the beginning of or early stages of project evaluation. Setting up systems and standards to ensure quality throughout all of the stages used to collect and analyse data
Quality Control (QC) is a real-time monitoring and analysis to ensure the protocols developed in QA are being adhered to and are returning precise and accurate results. Entails additional sampling and analysis and statistical examination (such as scatter plots, QQ plots etc.).
The insertion rates for all QA/QC samples is set at 5%, apart from field duplicates which are inserted at 2.8%. The field duplicate to normal sample ratio will be reviewed with an intention to increase the insertion rate to match that of other QA/QC samples in 2018. Generally, blanks and field duplicates are only inserted into the sample stream only within mineralised zones in accordance with Randgold’s standard operating procedure (SOP). SGS Loulo also insert their own QA/QC samples into the samples stream as an internal test.
General QA/QC performance improved in 2017 due to strict adherence to sampling procedure and increased supervision at all levels. Certified reference materials (CRM) sourced from ORE Research & Exploration Pty Ltd (OREAS) improved testing of laboratory accuracy as the samples werepre-packaged in 50 g samples ready for insertion.
The level of performance shows that the SGS Loulo laboratory meets industry standards.
All laboratories undertake their own internal QA/QC which includes blanks, duplicates, and CRMs, which are reported to Randgold along side the field sample results. These results of the laboratory internal QA/QC is reviewed separately by Randgold but are not reported below.
Loulo
This report covers QA/QC results from 1st January to 21st November 2017 for Gara; 1st January to 20th October 2017 for Yalea, and 1st January to 31st May 2017 for Baboto which covers all new data used within the Gara, Yalea and Baboto 2017 resource model updates. The other deposits at Loulo were not sampled during the review period, however, all sampling and analysis at Loulo follow the same parameters. Previous QA/QC reporting periods have not been observed to contain any significant sources of error or bias which would have a material effect on the Mineral Resource.
Screen tests for both Gara, Yalea and Baboto samples indicates that over 90% of all samples analysed during the period attain 75 microns.
| | |
| 18th September 2018 | | Page 86 |
| | | | |
| | Loulo-Gounkoto Gold Mine Complex NI 43-101 Technical Report | | |
QA/QC sample ratio was reviewed during the period. The review saw CRM sample insertion at 1 in 18 (5.6%), blank sample insertion at 1 in 18 (5.6%) and field duplicate sample insertion at 1 in 36 (2.7%). At Loulo, 370 pulp duplicate samples of normal samples from SGS Loulo were submitted to AMTEL laboratory, Canada, for umpire laboratory analysis.
Gounkoto
This section covers the QA/QC program from 31st August 2016, to 14th July 2017, which includes all new data used within the year end 2017 resource model. Faraba was not sampled during the review period, however, all sampling and analysis at Gounkoto follow the same parameters. Previous QA/QC reporting periods have not been observed to contain any significant sources of error or bias which would have a material effect on the Mineral Resource.
The QA/QC sample ratio during the reporting period showed CRM sample insertion at 1 in 18 (5.6%), blank sample insertion at 1 in 18 (5.6%) and field duplicate sample insertion at 1 in 36 (2.8%). The field duplicate to normal sample ratio will be reviewed with an intention to increase the insertion rate to match that of other QA/QC samples in 2018. At Gounkoto, 261 pulps duplicate samples of normal samples from SGS Loulo were submitted to AMTEL laboratory, Canada, for umpire laboratory analysis.
Certified Reference Materials
Certified Reference Materials (CRM’s) are inserted into batches at a frequency of 1 in 18 representing 5.6% samples to validate results reported by the laboratory and monitor the control and calibration of the instruments used by the laboratory.
All CRMs used in the review period are sourced from Ore Research and Exploration Pty Ltd, Australia, and are oxide or sulphide type with a matrix of feldspar minerals, basalt, and iron pyrites. CRMs are purchased inpre-packaged 50 g samples that require no preparation before being submitted to the laboratory. Asub-set of the total CRMs available are used and are rotated on a quarterly basis to prevent laboratory identification.
CRM results are monitored and classified as a failure if one sample point falls outside of three standard deviations from the certified mean, or three consecutive samples fall outside of two standard deviations (on the same side) of the mean.
CRM results that have a failure outside of three standard deviations are checked for possible CRM swaps. This is investigated by comparing the returned assay grade to the list of known CRM grades values. The CRM samples are supplied by OREAS with CRM ID printed on the bag. This printed ID is photographed during CRM insertion and then removed prior to submission of the CRM to the laboratory. This CRM photograph is used to help identify CRM swaps. A normal sample swap is also investigated to check if a normal drill sample has been labelled as CRM.
In addition to the CRM photographs, swaps can be investigated the technician’s sampling plan document, verifying used sample numbers, reviewing the sample booklet, and comparing against the other CRMs in the batch.
| | |
| 18th September 2018 | | Page 87 |
| | | | |
| | Loulo-Gounkoto Gold Mine Complex NI 43-101 Technical Report | | |
When all the above investigations are complete, and it has been established that a failure has occurred, the following actions are initiated:
| | ● | | When two or more CRMs failed in batch and the failure is as result of sample swap, the entire batch is called forre-assay. |
| | ● | | When one or more CRM failed in batch and the failure is not as result of sample swap, the entire batch is called forre-assay. |
Based on the above controls when a batch isre-assayed and fails again, the samples are flagged but committed into the database whilst new samples are prepared forre-analysis. If a CRM is observed as repeatedly failed over a period of time, then it is removed from storage and is no longer inserted into the samples stream
Loulo
A total of 731 CRMs consisting of 12 different types of certified reference materials were used within the period. Table11-3 and Table11-3 outline the CRMs analysed for Gara and Yalea during the QA/QC reporting period. Figure11-5 and Figure11-6 present tram lines plots for Gara and Yalea which illustrate that no CRMs returned values outside of three standard deviations of the mean during the reporting period.
The bivariate statistics for Gara and Yalea CRM samples analysed at SGS Loulo during the reporting period show that there is a very high correlation between the assay pairs and the expected grades (Table11-4).
Table11-3 Summary of Certified Reference Materials Used at Yalea and Gara
| | | | | | | | | | | | | | | | | | |
| OREAS CRM ID | | Certified
Au Value
(g/t) | | +3SD
(g/t) | | -3SD
(g/t) | | Yalea | | Gara |
| | Min
Assay
(g/t) | | Max
Assay
(g/t) | | Quantity | | Min
Assay
(g/t) | | Max
Assay
(g/t) | | Quantity |
OREAS 202 | | 0.752 | | 0.83 | | 0.674 | | 0.72 | | 0.82 | | 75 | | 0.74 | | 0.78 | | 45 |
OREAS 203 | | 0.871 | | 0.961 | | 0.781 | | 0.84 | | 0.9 | | 21 | | 0.84 | | 0.9 | | 32 |
OREAS 205 | | 1.244 | | 1.403 | | 1.085 | | 1.22 | | 1.28 | | 40 | | 1.22 | | 1.29 | | 19 |
OREAS 206 | | 2.197 | | 2.44 | | 1.954 | | 2.18 | | 2.32 | | 20 | | 2.18 | | 2.3 | | 29 |
OREAS 208 | | 9.248 | | 10.562 | | 7.934 | | 9.22 | | 9.4 | | 46 | | |
OREAS 210 | | 5.49 | | 5.946 | | 5.034 | | 5.43 | | 5.66 | | 25 | | 5.44 | | 5.62 | | 22 |
OREAS 215 | | 3.54 | | 3.831 | | 3.249 | | 3.42 | | 3.64 | | 96 | | 3.42 | | 3.6 | | 41 |
OREAS 216 | | 6.66 | | 7.125 | | 6.195 | | 6.5 | | 6.74 | | 53 | | 6.48 | | 6.7 | | 34 |
OREAS 221 | | 1.06 | | 1.168 | | 0.952 | | 1 | | 1.1 | | 23 | | 1 | | 1.1 | | 15 |
OREAS 222 | | 1.22 | | 1.319 | | 1.121 | | 1.18 | | 1.28 | | 40 | | 1.2 | | 1.28 | | 30 |
OREAS 228 | | 8.73 | | 9.567 | | 7.893 | | | | 8.54 | | 8.72 | | 11 |
OREAS 229 | | 12.11 | | 12.728 | | 11.492 | | | | 12 | | 12.3 | | 14 |
Total | | | | | | 439 | | | | | | 292 |
Table11-4 Bivariate Statistics of Gara and Yalea CRM’s Assayed by SGS Loulo During the Period
| | | | |
| Summary Bivariate Statistics | | Gara | | Yalea |
Correlation | | 99.99% | | 99.99% |
Slope | | 99.84% | | 99.70% |
R2 | | 99.98% | | 99.98% |
Y Intercept (g/t Au) | | 0.0064 | | 0.0092 |
| | |
| 18th September 2018 | | Page 88 |
| | | | |
| | Loulo-Gounkoto Gold Mine Complex NI 43-101 Technical Report | | |
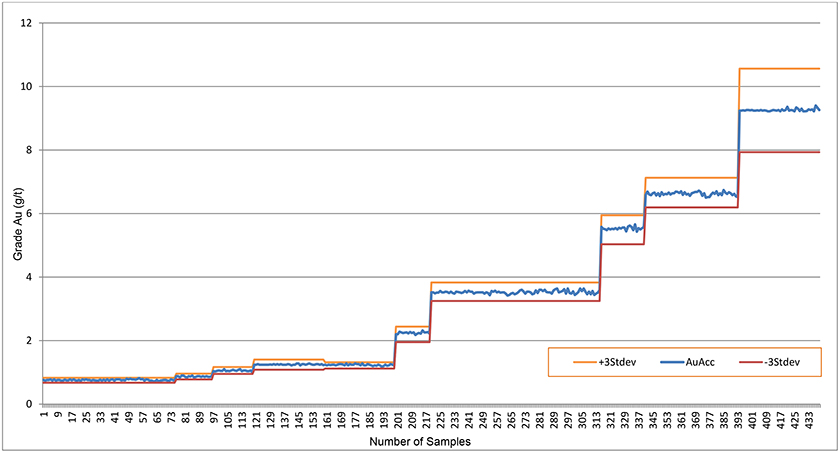
Figure11-5 Tram Line of Gara CRM’s Assayed by SGS Loulo During the Reporting Period
| | |
| 18th September 2018 | | Page 89 |
| | | | |
| | Loulo-Gounkoto Gold Mine Complex NI 43-101 Technical Report | | |
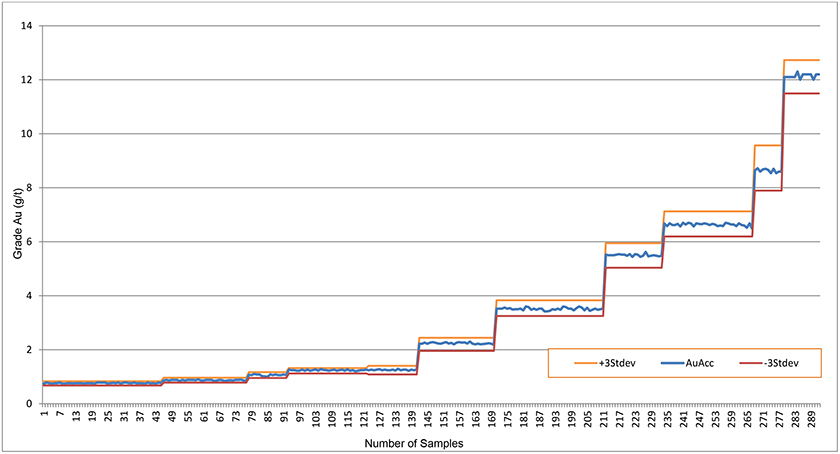
Figure11-6 Tram Line of Yalea CRM’s Assayed by SGS Loulo During the Reporting Period
| | |
| 18th September 2018 | | Page 90 |
| | | | |
| | Loulo-Gounkoto Gold Mine Complex NI 43-101 Technical Report | | |
Gounkoto
A total of 2,172 CRMs, consisting of 10 different types of standards, submitted to SGS Loulo during the review period(Table 11-5).Table 11-6 andFigure 11-7 indicate that the CRMs performed well during the review period.
Table11-5 Summary of Gounkoto Certified Reference Materials Used During the Period
| | | | | | | | | | | | |
| OREAS CRM ID | | Certified Au Value (g/t) | | +3SD (g/t) | | -3SD (g/t) | | Gounkoto |
| | Min Assay
(g/t) | | Max Assay
(g/t) | | Quantity |
OREAS 202 | | 0.752 | | 0.83 | | 0.674 | | 0.72 | | 0.78 | | 45 |
OREAS 203 | | 0.871 | | 0.961 | | 0.781 | | 0.84 | | 0.93 | | 512 |
OREAS 205 | | 1.244 | | 1.403 | | 1.085 | | 1.07 | | 1.3 | | 430 |
OREAS 206 | | 2.197 | | 2.44 | | 1.954 | | 2.16 | | 2.38 | | 427 |
OREAS 208 | | 9.248 | | 10.562 | | 7.934 | | 9.14 | | 9.6 | | 514 |
OREAS 210 | | 5.49 | | 5.946 | | 5.034 | | 5.38 | | 5.7 | | 56 |
OREAS 215 | | 3.54 | | 3.831 | | 3.249 | | 3.4 | | 3.61 | | 43 |
OREAS 216 | | 6.66 | | 7.125 | | 6.195 | | 6.64 | | 6.98 | | 65 |
OREAS 221 | | 1.06 | | 1.168 | | 0.952 | | 1.0 | | 1.1 | | 38 |
OREAS 229 | | 12.11 | | 12.728 | | 11.492 | | 12 | | 12.4 | | 42 |
Total | | | | | | | | | | | | 2,172 |
Table11-6 Bivariate Statistics for Gounkoto CRMs Assayed by SGS Loulo
| | |
| Summary Bivariate Statistics | | Value |
Correlation | | 99.99% |
Slope | | 100.06% |
R2 | | 99.99% |
Y Intercept (g/t Au) | | 0.0104 |
| | |
| 18th September 2018 | | Page 91 |
| | | | |
| | Loulo-Gounkoto Gold Mine Complex NI 43-101 Technical Report | | |
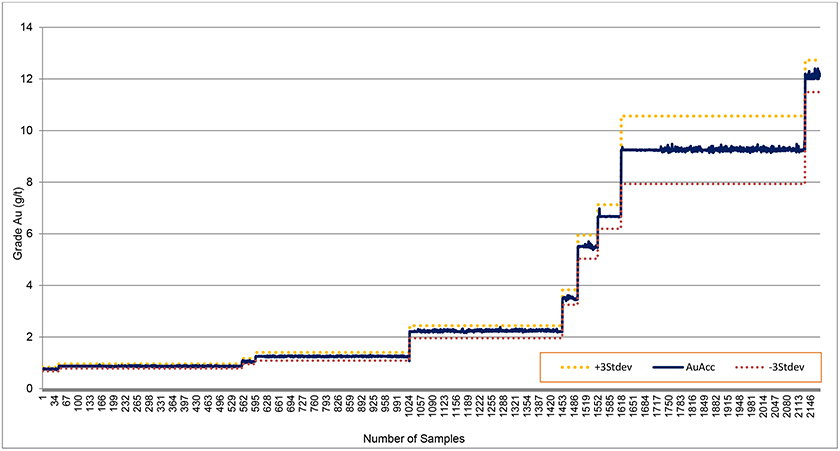
Figure11-7 Tram line Plot of all Gounkoto CRMs Assayed by SGS Loulo
| | |
| 18th September 2018 | | Page 92 |
| | | | |
| | Loulo-Gounkoto Gold Mine Complex NI 43-101 Technical Report | | |
Blanks
Blank samples are free media(Au-free for these analyses) assayed to help ensure no false-positives are obtained from the laboratories and to check for contamination. These samples return gold assay below the analytical detection limit (i.e. <0.01 g/t Au). Previously blanks used for the Project were prepared onsite from barren sandstone material that was sourced approximately 20 km from Gounkoto. Since 2016, commercially sourced OREAS certified coarse blanks have been used.
During the collection of samples, blank sample materials were inserted into sample stream at a rate of approximately 1:18 representing 5.6% of the total sample. These samples undergo the same sample preparation as the drill samples and used to detect inter-contamination due to poor cleaning of sample preparation equipment throughout the varioussub-sampling processes.
Loulo
A total of 730 blank samples were used during the period. All samples were submitted to SGS Loulo. 439 blank samples were analysed for Gara and 291 were analysed for Yalea.
All blanks were evaluated against five time the detection limit as the failure limit. The overall performance shows a 100% pass rate of blank samples assayed (Table11-7).
In the QP’s opinion, the blank samples are performance very good.
Table11-7 Loulo Blank Results Returned During Reporting Period
| | | | | | | | | | | | | | | | |
| Type | | Min Assay (g/t) | | Max Assay (g/t) | | N°
Samples | | Above 5x
Detection
Limit | | Between
DL and
TL | | Below
DL | | % Pass | | % Fail |
| Yalea | | 0.005 | | 0.02 | | 291 | | 0 | | 1
(0.34%) | | 290 (99.66%) | | 291 (100%) | | 0 |
| Gara | | 0.005 | | 0.02 | | 439 | | 0 | | 7
(1.59%) | | 432 (98.41%) | | 439 (100%) | | 0 |
Gounkoto
A total of 2,170 Gounkoto blanks were submitted to SGS Loulo. All blanks were evaluated against five times the detection as the failure limit. The overall performance shows that 99.95% of the blanks assayed within failure limits (Table11-8). Generally, this level of performance is deemed as good.
Table11-8 Gounkoto Blank Results Returned During Reporting Period
| | | | | | | | | | | | | | | | |
| Type | | Min
Assay
(g/t) | | Max
Assay
(g/t) | | N°
Samples | | Above 5x
Detection
Limit | | Between
DL and
TL | | Below
DL | | % Pass | | % Fail |
| Blank | | 0.005 | | 0.06 | | 2,170 | | 1
(0.05%) | | 14 (0.65%) | | 2155 (99.30%) | | 2169 (99.95%) | | 1
(0.05%) |
| | |
| 18th September 2018 | | Page 93 |
| | | | |
| | Loulo-Gounkoto Gold Mine Complex NI 43-101 Technical Report | | |
Duplicates
Duplicate samples are used to check the homogeneity of the samples prior to sample splitting along with the accuracy and repeatability of sampling, splitting, and assaying At Loulo-Gounkoto, field duplicates are currently inserted every 36 samples. The field duplicate to normal sample ratio will be reviewed with an intention to increase the insertion rate to match that of other QA/QC samples in 2018.
Duplicate samples can be obtained from three sources
| | ● | | Field Duplicates are obtained from the initial splitting of the RC sample during sampling at the rig |
| | ● | | Coarse (Reject) Duplicates are obtained from the coarse reject sample that is returned from the laboratory after the initial crush to 6 mm. of the entire half core sample. |
| | ● | | Pulp Duplicates are obtained from the pulverised75-micron sample that is returned from the laboratory after the pulp is removed for analysis. |
Field duplicates are not undertaken on diamond drill samples as the variance between the two half of core, due to the nuggety nature of gold mineralisation.
Loulo
A total of 281 samples werere-sampled from course crush reject material and were analysed by SGS Loulo during the period. 155 samples were analysed from Gara, while 126 samples were analysed from Yalea.
Duplicate results from the laboratory show a good correlation between original samples at both Gara and Yalea, such that it can be concluded that there is little or no bias in the results (Table11-9).
Table11-9 Bivariate Statistics for Log Scatter of Gara and Yalea Course Crush Rejects Duplicate Assayed by
SGS Loulo During the Period
| | | | |
Summary Bivariate Statistics | | Gara | | Yalea |
Correlation | | 94.13% | | 98.26% |
Slope | | 0.92 | | 1.07 |
R2 | | 0.89 | | 0.97 |
Y Intercept (g/t Au) | | 0.0325 | | -0.0212 |
Figure11-8 and Figure11-9 illustrate a log scatterplot and a duplicate HARD plot of the coarse crush reject duplicates from Gara analysed at SGS Loulo.
| | |
| 18th September 2018 | | Page 94 |
| | | | |
| | Loulo-Gounkoto Gold Mine Complex NI 43-101 Technical Report | | |
Figure11-8 Log Scatter Plot of Gara Course Crush Rejects Duplicate Assayed by SGS Loulo During the Reporting Period
Figure11-9 HARD Plot of Gara Course Crush Rejects Duplicate Assayed by SGS Loulo During the Reporting Period
| | |
| 18th September 2018 | | Page 95 |
| | | | |
| | Loulo-Gounkoto Gold Mine Complex NI 43-101 Technical Report | | |
Figure11-10 and Figure11-11 illustrate a log scatterplot and a duplicate HARD plot of the coarse crush reject duplicates from Yalea analysed at SGS Loulo.
Figure11-10 Log Scatter Plot of Yalea Course Crush Rejects Duplicate Assayed by SGS Loulo During the Reporting Period
Figure11-11 HARD Plot of Yalea Course Crush Rejects Duplicate Assayed by SGS Loulo During the Reporting Period
| | |
| 18th September 2018 | | Page 96 |
| | | | |
| | Loulo-Gounkoto Gold Mine Complex NI 43-101 Technical Report | | |
Gounkoto
A total of 994 field duplicates samples were analysed for Gounkoto by SGS Loulo during this period. Field Duplicate results from the laboratory show a good correlation between original samples, such that it can be concluded that there is little or no bias in the results (Figure11-12, Figure11-13 and Table11-10). Overall the results returned are acceptable, however they can still be improved with implementation of stringent sampling procedures such as intensifying supervision at all levels and laboratory protocols.
The HARD plot illustrated Figure11-13 in shows good precision between duplicate/original samples assayed. However, this still needs improvement and measures such as sampling supervision and adhering to stringent sampling procedure have been intensified.
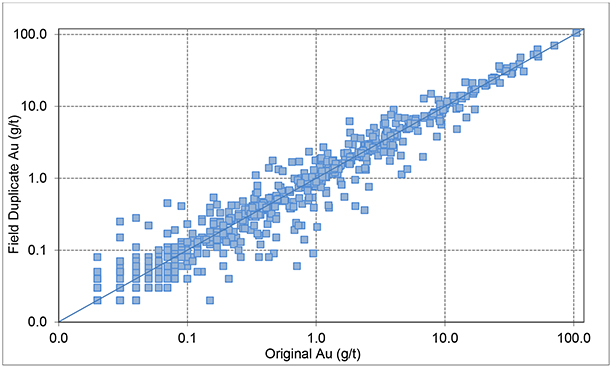
Figure11-12 Log Correlational Plot of Gounkoto Field Duplicate Assayed by SGS Loulo
Table11-10 Bivariate Statistics for SGS Loulo Correlational Plot of Gounkoto Field Duplicates
| | |
| Summary Bivariate Statistics | | Value |
| Correlation | | 98.73% |
| Slope | | 1.01 |
| R2 | | 0.97 |
| Y Intercept (g/t Au) | | -0.0018 |
| | |
| 18th September 2018 | | Page 97 |
| | | | |
| | Loulo-Gounkoto Gold Mine Complex NI 43-101 Technical Report | | |
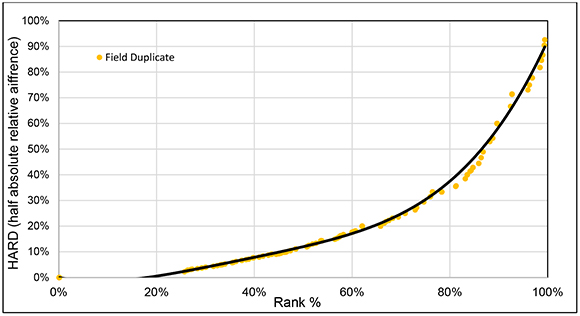
Figure11-13 HARD Plot of Gounkoto Field Duplicates Assayed by SGS Loulo
Umpire Assays
Pulp duplicate samples are routinely submitted biannually to an external independent laboratory for umpire analysis. The AMTEL laboratory based in Canada is used as the independent umpire laboratory and samples are submitted biannually from Loulo-Gounkoto site. CRM samples are submitted along with umpire samples to check for bias at the umpire laboratory.
Loulo
A total of 388 pulps duplicates from SGS Loulo were submitted to AMTEL for umpire analysis. This comprises of 370 field samples and 18 CRMs. The combined correlation for all of the field samples was 94.14% (Table11-11).
Sample LU084458 which AMTEL returned as 418 g/t Au and SGS Loulo returned 27.5 g/t Au. This sample has been excluded from the statistics for the purpose of scaling. The bivariate statistics for the Loulo umpire samples is presented in Table11-12. Logarithmic scatterplots of the Yalea, Gara and Baboto Umpire samples are presented in Figure11-14 to Figure11-16.
Table11-11 Loulo Umpire Sample Summary
| | | | |
Dataset | | Number of Samples | | Correlation (%) |
Baboto | | 125 | | 98.35 |
Gara | | 126 | | 94.28 |
Yalea | | 119 | | 89.78 |
All | | 370 | | 94.14 |
Table11-12 Bivariate Statistics for Loulo Umpire Assays
| | | | | | |
Summary Bivariate Statistics | | Yalea | | Gara | | Baboto |
Correlation | | 89.78% | | 94.28% | | 98.35% |
Slope | | 1.39 | | 1.13 | | 0.99 |
R2 | | 0.81 | | 0.89 | | 0.97 |
Y Intercept (g/t Au) | | 0.2831 | | 0.3913 | | 0.1071 |
| | |
| 18th September 2018 | | Page 98 |
| | | | |
| | Loulo-Gounkoto Gold Mine Complex NI 43-101 Technical Report | | |
The umpire results returned for Yalea indicate that there is an apparent bias on samples over 8 g/t Au. Two relatively high grade (6.66 g/t Au) OREAS216 CRM samples were submitted alongside the umpire samples with both CRMs returning values at two standard deviations above the certified mean. Results from the 53 OREAS216 CRMs submitted during routine analysis at SGS Loulo returned 98.1% of results within one standard deviation, and 100% within two standard deviations. Additionally, the 46 high-grade (9.25 g/t Au) OREAS208 results from SGS Loulo all returned values within one standard deviation of the mean. This indicates that potentially AMTEL is over-reporting high-grade samples, however there is insufficient high-grade CRMs analysed at AMTEL to validate this. Additional high-grade CRMs will be analysed at AMTEL during 2018 to test their high-grade response. In the QP’s opinion, this high-grade bias does not have a material impact on the assay grades and will not materially impact the Mineral Resource estimate.
The Gara umpire samples appear to show little bias however, a slight apparent bias towards AMTEL could be identified in the high-grade samples over 10 g/t Au, although to a lesser extent than the Yalea umpire samples. In the QP’s opinion, this is not considered as having a material impact on the relative accuracy of the Mineral Resource.
The Baboto umpire samples shows no significant bias.
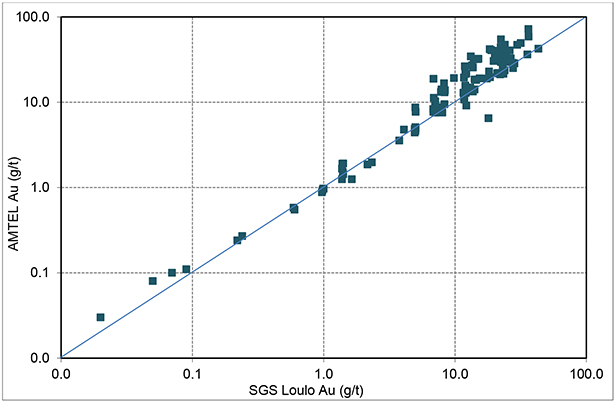
Figure11-14 Log Scatter Plot of Yalea Umpire Assays
| | |
| 18th September 2018 | | Page 99 |
| | | | |
| | Loulo-Gounkoto Gold Mine Complex NI 43-101 Technical Report | | |
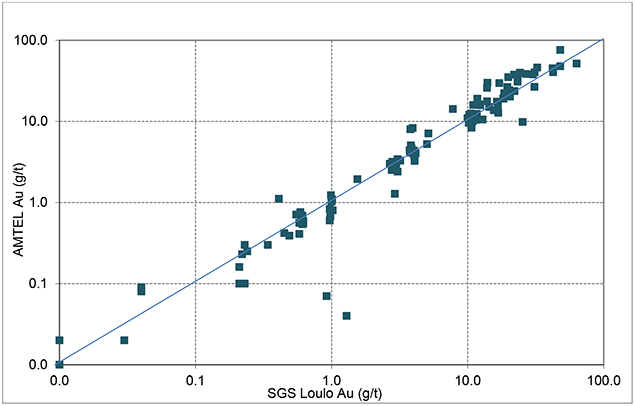
Figure11-15 Log Scatter Plot of Gara Umpire Assays
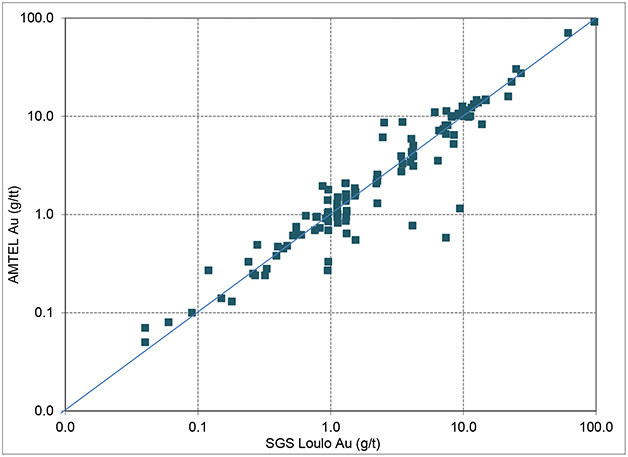
Figure11-16 Log Scatter Plot of Baboto Umpire Assays
| | |
| 18th September 2018 | | Page 100 |
| | | | |
| | Loulo-Gounkoto Gold Mine Complex NI 43-101 Technical Report | | |
Gounkoto
A total of 272 pulp duplicates were sent from SGS Loulo to AMTEL laboratory, Canada for umpire analysis. This compromises of 261 field samples and 11 CRMs. The umpire samples returned an overall correlation of 97.23% (Table11-13). A log scatterplot of the Gounkoto umpire results is presented in Figure11-17.
The umpire results from Gounkoto indicate that there is no significant bias is observed in the SGS Loulo laboratory. CRMs were submitted along with the umpire samples to test the accuracy of the AMTEL laboratory. No issues were observed with the returned grades.
Table11-13 Loulo Umpire Sample Summary
| | |
Summary Bivariate Statistics | | Gounkoto |
Correlation | | 97.23% |
Slope | | 1.07 |
R2 | | 0.95 |
Y Intercept (g/t Au) | | 0.1896 |
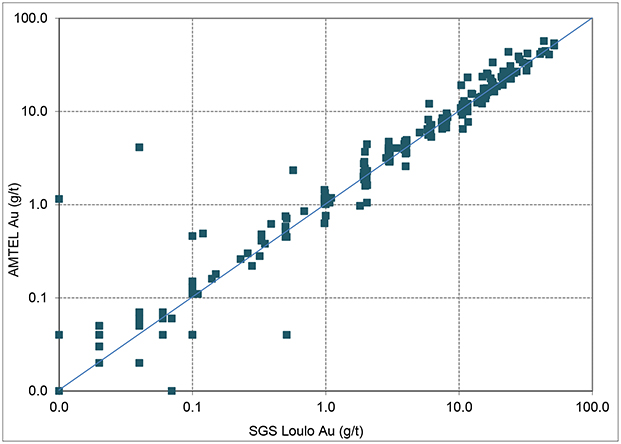
Figure11-17 Log Scatter Plot of Gounkoto Umpire Assays
RC samples taken on the rigs are bagged and tied with custom Loulo tags as well as being weighed and documented. RC and diamond core are transported by Randgold personnel from the rig to the core yard or a secure storage facility.
| | |
| 18th September 2018 | | Page 101 |
| | | | |
| | Loulo-Gounkoto Gold Mine Complex NI 43-101 Technical Report | | |
Labelled samples are placed into large bags and these are sealed. The samples are placed in a crate which are transported to the SGS Loulo laboratory located within the Mine site. Samples which are to be prepared or analysed outside of SGS Loulo are transported by SGS staff.
All laboratory sample backlogs are actively monitored on a weekly basis and if the backlog becomes excessive, samples are dispatched to SGS Bamako. All samples are contained onsite in a secure sampling facility until they can be dispatched.
Results from all laboratories are emailed to a select group of Project individuals and are later imported into the database by the Database Administrator. A paper certificate is mailed at a later date.
All Project data has been migrated and secured in industry standard Maxwell Geoservices (Maxwell) Datashed SQL database for optimal validation through constraints, library tables, triggers, and stored procedures. All site software application databases will be set up to link back to the main database for information retrieval via an Open Database Connectivity (ODBC) link.
During the migration to the SQL database, initially all assay data was migrated from the Microsoft Access database. Subsequently, all assay data has beenre-imported directly from assay certificates from the laboratory and ranked such that they will have a higher priority than the MS Access imported data.
QG completed an audit of the Mineral Resource estimation process, including sample preparation and analysis along with QA/QC. QG observed no issues that required immediate rectification and provided some recommendations of future improvements. QG noted that the laboratory and splitters, with one exception, as clean. An issue with a sample pulveriser that was not left in a clean state between uses was identified. This was immediately rectified and Randgold geologists undertake regular unannounced visits to ensure the procedures are being followed.
QG provided the following QA/QC recommendations all of which have since been implemented by Randgold:
| | ● | | Too many CRMs (standards) are being used at once. By using a smaller number of standards at any one time, will increase the number of results per standard and give a better feel for performance. |
| | ● | | The recording of dates for CRMs, blanks and duplicates needs standardising to a single format that can be interrogated properly. |
| | ● | | Ideally, a longer period than nine months should be analysed to ensure no trends are occurring. |
| | |
| 18th September 2018 | | Page 102 |
| | | | |
| | Loulo-Gounkoto Gold Mine Complex NI 43-101 Technical Report | | |
In the QP’s opinion, the sample preparation is well documented and appropriate for the drilling undertaken. The sample security protocols are good as most samples do not leave the mine site as they are prepared and analysed at SGS Loulo.
The actual insertion rates of QA/QC samples are at or above the insertion rates outlined in Randgold’s SOP. The SOP is deemed to be in line with industry best practices.
The duplicate analysis for both Loulo and Gounkoto has shown there to be little to no bias in the reported results. Blank samples returned no failures at Loulo (100% pass rate), and only one failure at Gounkoto (99.95% pass rate). The blank pass rate can be deemed as good.
The CRM results and the umpire sampling are deemed as good, with no areas of concern being identified.
Overall the QA/QC results returned are acceptable, however they can be improved with implementation of stringent laboratory protocols and procedures, such as a full implementation of a LIMS sample submission and results reporting system to complement the existing LIMS tracking system.
In the QP’s opinion, there are no issues outlined in the sample preparation and analysis, and that the resulting data is suitable for use within a Mineral Resource estimate.
The field duplicate to normal sample ratio will be reviewed with an intention to increase the insertion rate to match that of other QA/QC samples in 2018.
| | |
| 18th September 2018 | | Page 103 |
| | | | |
| | Loulo-Gounkoto Gold Mine Complex NI 43-101 Technical Report | | |
Geological logging is completed on hard copy and then entered into the database. Diamond drill hole samples are based on lithological unit and most often vary from 0.8 m to 1.2 m whereas RC down hole sample spacing was conducted at 1 m lengths.
All point samples, drill holes and all geological databases are managed on site and stored in a central SQL database, which stores all forms of geological data including collar, assay, surveys, and other geological variables including lithology, alteration, structural observations, and bulk density data.
The primary Gemcom and Access databases were fully migrated to a Maxwell DataShed SQL database in 2015 by Maxwell Geoservices (Maxwell). The database is administered by the site database administrator and overseen by the Loulo Regional database administrator.
The Maxwell DataShed SQL database is configured for optimal validation through constraints, library tables, triggers, and stored procedures. Data that fails these rules on import are rejected or stored in buffer tables until corrected.
Assay certificates are provided in digital form from the laboratory in the prescribed format. These assay files are imported directly in to the DataShed database. This can only be completed by Database Manager and authorised network users that have undergone Maxwell Datashed Administrator training. The assay files include detailed information about the batch, methods, units, detection limits, and elements assayed. The file also includes all QA/QC data in the sequence of analysis.
The assay data is stored in the SQL database in a normalised format to ensure all required information is stored for each sample, and that multiple assay results can be stored for each sample. Upon import a series of validations takes place to check that the data being imported conforms to the expected and required inputs. This includes detection limit, analysis method, reporting units (ppm, g/t, %) etc. The DataShed assay management system merges all the sampling data into one table and is loaded with the assay result. This system also ensures that the sample numbers cannot be duplicated which reduces the chance of having sample numbermix-ups. Ranking of different assay methods is performed automatically such that only one assay result per element is displayed in the master assay table (tblVWDHAssays). The ranking of different analysis methods in held within a lookup table (tblSYSAssMethod) and any changes to this ranking and must be approved by the onsite Database Manager.
The primary SQL database has an MS Access front end application which links to the main database for data entry, reporting and viewing via ODBC. Other MS Access databases used on site are link to the main database to retrieve information for use in various end user applications software via an ODBC link.
A diagrammatical representation of the DataShed normalised assay structure is shown Figure12-1.
| | |
| 18th September 2018 | | Page 104 |
| | | | |
| | Loulo-Gounkoto Gold Mine Complex NI 43-101 Technical Report | | |
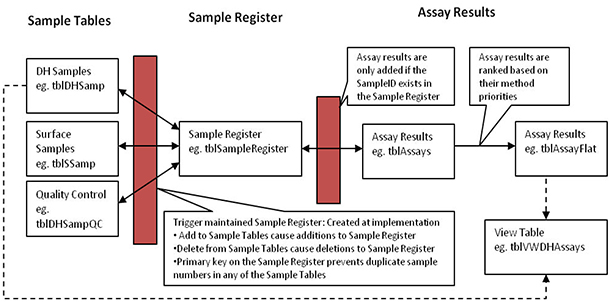
Figure12-1 The Normalised Assay Structure Utilised by DataShed
The use of a normalised assay management system, whereby only authorised and fully trained network users can upload laboratory data from digital files meets industry current best practice.
Daily and weekly backups are made and stored on site. Copies of monthlyback-ups are sent to Bamako and quarterly backups are sent to Johannesburg and London.
An independent external database audit was completed by Maxwell in February 2016. Maxwell identified that the majority of resource data within the SQL database was in good order and only minor data issues were identified.
Issues outlined by Maxwell included, assays that were unranked, nine QC records with unmatched drill records, and mismatched drill dates between tables. All data that was flagged as having minor issues was quarantined and corrected before being released from the quarantine table by Randgold.
Continued training and mentoring are ongoing for the database administrators as was recommended by Maxwell.
Following the external audit of the Loulo-Gounkoto database, a JORC (2012) Code compliance certificate was issued by Maxwell.
| | |
| 18th September 2018 | | Page 105 |
| | | | |
| | Loulo-Gounkoto Gold Mine Complex NI 43-101 Technical Report | | |
| 13 | Mineral Processing and Metallurgical Testing |
The Loulo processing plant uses a carbon in leach (CIL) gold extraction process with a throughput capacity of 4.8 Mtpa. Yalea process plant recovery for the remaining life of mine has been estimated at 84.5% based on historical and current testwork; similarly, Gara is estimated as 94.5%. Yalea recovery is impacted by the presence of arsenic and copper. Arsenic and copper impurities also increase cyanide and oxygen consumption. Gounkoto 2016 Super Pit sampling achieved a recovery of 93%. Gold recovery is maintained above 90% by blending the various ore sources (Yalea / Gara/Other Gounkoto) to control copper and arsenic grades in the mill feed.
The current LOM plan has an average recovery of 92.3%. The average gold recovery in 2017 was 92.7%, an improvement from 2016 (91.0%).
Metallurgy and process plant initial scoping and prefeasibility testwork completed on oxide, transition, and fresh Gounkoto samples indicated that plus 90% recovery would be achievable through gravity followed by cyanide leaching of the gravity tails. Further work completed during the 2010 feasibility study and 2016 Super Pit feasibility study which confirmed these initial results and the predicted recovery has been confirmed based on recoveries achieved in the plant. Extensive work was carried out consisting of detailed comminution, variability run of mine (ROM) leach and gravity recoverability work, and variability leach work on gravity tails. Comminution testwork defined the material to be hard, with high abrasive properties. Cyanide detox testwork, carried out on slurries were successful in significantly reducing cyanide levels. Further testwork was carried out in 2015 and 2016 to ensure representative coverage of the Super Pit ore. Recovery curves have been generated for the expected recoveries based on all testwork to date.
| | ● | | Oxide LOM recovery is estimated to be 96%. |
| | ● | | Transition: linear relationship with recovery capped at 96% for over 6 g/t Au (1.4041*Au+87.542) |
| | ● | | Fresh: lognormal relationship with recovery capped at 96% for over 25 g/t Au(0.974* ln (Au)+91.56) |
| | ● | | Average LOM recovery of Gounkoto is estimated to be 92.3%. |
| | ● | | Back calculated recoveries for Gounkoto based on the tonnes of ore fed since 2010 also confirm 92.5% recovery has been achieved from Gounkoto ore. |
Table13-2 is a summary of the Gounkoto testwork.
A total of 565 samples were testedon-site andoff-site for recovery determination throughout Gounkoto phases up to the 2016 campaign for the expansion of current pit to the Super Pit. These campaigns have concluded that the samples were highly amenable to cyanide leaching
| | |
| 18th September 2018 | | Page 106 |
| | | | |
| | Loulo-Gounkoto Gold Mine Complex NI 43-101 Technical Report | | |
and the most recent Super Pit sampling area achieved recovery results of 92.5% on 478 samples (Table13-1).
Table13-1 Metallurgical Optimum Recoveries by Domain 2016
| | |
| Domain | | Optimum
% Recovery |
MZ1 | | 95 |
MZ2 | | 92 |
MZ3 | | 92 |
MZ3 | | 94 |
HW | | 93 |
P64 | | 92 |
Gounkoto Metallurgical Summation
The following is a summary of the metallurgical testwork:
| | ● | | Samples collected and tested are spatially representative of the mineralisation mined in the Super Pit. |
| | ● | | Sufficient data deemed available for comminution, hydrometallurgy, and ore characteristics. |
| | ● | | Sampling campaign and testwork program returned results consistent with previous campaigns. |
| | ● | | Sampling and recoveries results from Loulo UG operations, plotted on long-section, demonstrate a full spatial coverage. |
| | ● | | Recovery of plus 90% is achievable on 2016-campaign sampling area. |
| | ● | | LOM overall recovery of 92.5% is recommended based on recoveries obtained to date |
| | ● | | Plant and other infrastructure deemed in suitable condition to achieve the above recovery. |
| | ● | | Operating cost of $18.23/t remains in line with LOM Gounkoto operating cost for 2017. |
| | |
| 18th September 2018 | | Page 107 |
| | | | |
| | Loulo-Gounkoto Gold Mine Complex NI 43-101 Technical Report | | |
Table 13-2 Gounkoto Testwork
| | | | | | | | | | | | | | | | | | | | | | | | | | | | | | | | | | | | |
Campaign | | Objectives | | Ore Zone | | ID Series | | Sample Received | | Met Series Composite | | Sample Type | | Testing &
Assays | | Metal | | Cyanide
Addition
(g/t) | | SCN
Recovery | | CIL
Recovery | | Average | | Reagents
Consumption
(kg/t) | | Note on
Cyanidation
Conditions |
| | Au (g/t) | | As (wt %) | | Cu (g/t) | | Fe (wt %) | | Recovery (%) | | NaCN | | Lime |
0_2009 | | Pre- feasibility | | MZ1 | | GK00_series | | 3 | | Individual | | DDH | | Loulo Met Lab | | | | | | | | | | 500 | | 95.70 | | 96.90 | | 96.30 | | NA | | NA | | Optimal leach conditions |
| | 001…003 | | | | | | | | | | 5,000 | | 95.10 | | 95.70 | | 95.40 | | Excess leach conditions |
1_2009 | | Scoping study : On site | | MZ1,2,3 | | Met_CND_series 001..0030 | | 30 | | LG MG HG | | DDH, RC | | Loulo Met Lab | | 12.19 | | | | | | | | 1,000 | | 94.58 | | 95.22 | | 94.90 | | 0.6 | | 1.12 | | Excess leach conditions |
2_2010 | | Scoping review | | Enter deposit Strike Depth | | Ox_ | | 10 | | Composite | | Trench RC DDH | | SENET SGS KC Africa | | 8.53 | | 0.02 | | 50.00 | | 5.14 | | 500 | | | | 92.98 | | 96.00 | | 0.36 | | 0.86 | | 24hr BRT at natural DO |
| | Pre- feasibility | | MZ1,2,3 and HW | | Tran_ | | 10 | | Composite | | 9.86 | | 0.03 | | 41.00 | | 5.66 | | 500 | | | | 90.82 | | 94.00 | | 0.36 | | 2.44 | | 24hr BRT at natural DO |
| | Plant design | | | | 10x Sulf_ | | 10 | | Composite | | 7.82 | | 0.03 | | 32.91 | | 4.88 | | 500 | | | | 90.01 | | 91.00 | | 0.34 | | 0.32 | | 24hr BRT at excess DO |
5_2010 | | Feasibility confirmation | | Enter deposit Strike_ Depth MZ1,2,3 and HW | | Var Samples series 01 .10 (Sulphides) | | 20 | | Series 40,000 | | DDH | | SGS SA KC Africa | | | | | | | | | | 1,000 | | | | | | | | | | | | Excess leach conditions |
6_2010/2011 | | Petrographic Studies and Met campaign | | MZ1,2, and HW | | GKMET_PHA SE6series_01 12 | | 12 | | GKDH series | | DDH | | Micro- search refer to Lawrence | | 13.39 | | 0.39 | | 135.92 | | 9.16 | | 500 | | | | | | 90.17 | | 0.33 | | 0.71 | | Optimal leach conditions |
| | | | | | | | | | 1,000 | | | | | | 92.56 | | 0.73 | | 0.62 | | Excess leach conditions |
7_2011 | | Scoping study : HEAP LEACH | | M3 | | GKMET_PHA SE7_GOUNK OTseries | | 6 | | GKDH217 (6x) | | Core | | 12.19 | | | | | | | | | | | | | | | | | | | | |
9_2012 | | Feasibility Polysius AG ; HPGR | | MZ1,2,3 | | Polysius AG | | 10 | | GKPQ Met ID not found | | DDH | | Polysius ? | | | | | | | | | | | | | | | | | | | | | | |
2014_Camp refer as Campaign 15 | | Gounkoto OC extension to UG Feasibility study | | MZ3_UG and UG_Extension MZ2_UG | | GKMet_MZ3D DH 0001 | | 66 | | | | DDH Core | | Loulo Met Lab | | 21 | | 2860 | | 95 | | 8.1 | | 400 | | | | | | 95.24 | | 0.79 | | 2.35 | | Optimal leach conditions |
| | GKMet_MZ3D DH 0002 | | 3.92 | | 540 | | 39.8 | | 4.99 | | 400 | | | | | | 92.32 | | 0.63 | | 1.55 | | Optimal leach conditions |
| | GKMet_MZ3D DH 0003 | | 2.3 | | 490 | | 22 | | 4.099 | | 400 | | | | | | 91.55 | | 0.63 | | 1.47 | | Optimal leach conditions |
| | GKMet_MZ2D DH 0001 | | 6.2 | | 0.95 | | 151 | | 8.24 | | 400 | | | | | | 91.63 | | 0.83 | | 1.82 | | Optimal leach conditions |
| | GKMet_MZ2D DH0002 | | 6.96 | | 0.61 | | 101.4 | | 4.14 | | 400 | | | | | | 91.79 | | 0.83 | | 1.71 | | Optimal leach conditions |
| | GKMet_MZ2D DH 0003 | | 4.3 | | 0.39 | | 34.5 | | 2.38 | | 400 | | | | | | 91.28 | | 0.66 | | 1.35 | | Optimal leach conditions |
| | Gounkoto 44651 UG | | 16 | | AMTEL 2013 | | 11.62 | | 0.47 | | 550 | | | | 400 | | | | | | 90.00 | | | | | | Optimal leach conditions |
| | | | 54 | | ALS 2014 | | | | | | | | | | Varied | | | | | | | | | | | | Variability leach test |
2016_Camp | | Gounkoto OC extension to a Super Pit Feasibility Study | | MZ3 | | GKMet_MZ3D DH series | | 40 | | | | | | DDH | | 4.26 | | | | | | | | 400 | | | | | | 88.12 | | 2.14 | | 0.67 | | Optimal leach conditions |
| | 4.26 | | | | | | | | 1,000 | | | | | | 90.02 | | 2.07 | | 1.01 | | Excess leach conditions |
| | HW | | GS_series | | 15 | | | | | | DDH | | 1.99 | | | | | | | | 400 | | | | | | 94.15 | | 1.34 | | 0.60 | | Excess leach conditions |
| | 1.99 | | | | | | | | 1,000 | | | | | | 93.87 | | 1.23 | | 0.93 | | Excess leach conditions |
| | |
| 18th September 2018 | | Page 108 |
| | | | |
| | Loulo-Gounkoto Gold Mine Complex NI 43-101 Technical Report | | |
| 13.3 | Sampling and Sample Representativity |
Extensive testwork campaigns have been undertaken on all Loulo related orebodies, e.g. Gara and Yalea, and more recently on Gounkoto plus the satellite bodies of P129, P125, Loulo 3, and Baboto since thepre-feasibility stage, from 1985 up until the present time, incorporating both major and minor pits including the underground deeper orebodies. In all cases, special care has been taken to ensure full representivity in terms of:
| | ● | | Spatial representivity. |
| | ● | | Redox and weathering representivity. |
| | ● | | Lithological representivity. |
An example of this is seen for the Gounkoto Super Pit in Figure13-1. This theme is echoed and available for most of the campaigns undertaken to date.
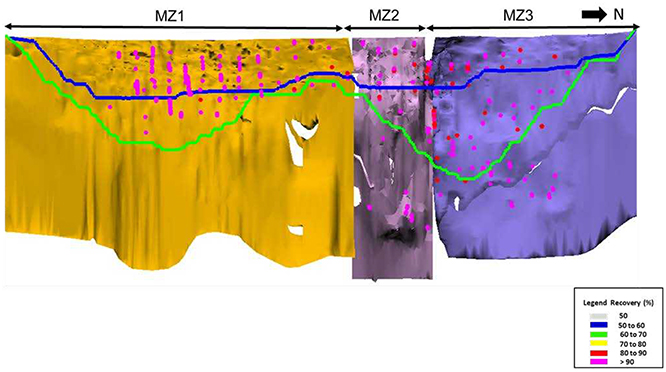
Figure13-1 Gounkoto Cyanidation Sample Locations
| 13.4 | Loulo Metallurgical Testwork |
A total of sixteen testwork reports, prior to issue of the first full Loulo feasibility study in 2003, were generated, of which four focused on Heap Leach processing and the balance related to Grind/CIL techniques, pertinent to the adopted process route. Details on the locations of the samples, as well as the nature of the testwork is detailed in the reports. A list of these test reports is presented in Table13-3. The location of the core samples used in the metallurgical testwork is detailed within these reports.
| | |
| 18th September 2018 | | Page 109 |
| | | | |
| | Loulo-Gounkoto Gold Mine Complex NI 43-101 Technical Report | | |
Table13-3 Summary of Testwork Reports Prior to First Feasibility Study
| | | | | | |
| Report No. | | Laboratory | | Process Type | | Year |
84-RDM-067-MIN | | BRGM | | Grind/CIL | | 1984 |
85-DAM-032-MIN | | BRGM | | Heap Leach | | 1985 |
86-MLI-066-MIN | | BRGM | | Heap Leach | | 1986 |
Progress No. 4 | | BHP | | Grind/CIL | | 1995 |
ARMC 8481 | | A R MacPherson | | Grind/CIL | | 1995 |
MRGE | | Microsearch | | Mineralogical | | 1997 |
S72517 | | AARL | | Grind/CIL | | 1997 |
S72653 | | AARL | | Grind/CIL | | 1997 |
S72681 | | AARL | | Grind/CIL | | 1997 |
37105 | | OMC/Amtel | | Grind/CIL | | 1997 |
F1711-2.MPC | | Eimco | | Grind/CIL | | 1997 |
S72706 | | AARL | | Grind/CIL | | 1997 |
S72731/1 | | AARL | | Heap Leach | | 1998 |
S72731/2 | | AARL | | Heap Leach | | 1998 |
MET 01/D81 | | Lakefield Research | | Grind/CIL | | 2002 |
(None) | | Mintek | | Grind/CIL | | 2002 |
Subsequent to the feasibility study, there have been numerous other test campaigns focussing on the deeper orebodies pertaining to the underground developments, satellite pits, as well as targeted areas within the larger orebodies, such as the ‘Purple Patch’.
Gold recovery is based on testwork and operational history. Yalea process plant recovery for the remaining life of mine has been estimated at 84.5%, Gara is estimated at 94.4%, Gounkoto is estimated at 92.5 %, and Baboto satellite pits at 94.0%.
Yalea recovery is impacted by the presence of arsenic and copper which reduces recovery by impacting the process of adsorption of the gold onto the CIL tanks. Arsenic and copper impurities also increase cyanide and oxygen consumption. Oxygen consumption is increased due to oxidising the associated sulphides.
All underground diamond drill grade control samples at Yalea are assayed for copper and arsenic. Both copper and arsenic are estimated as deleterious elements into the Mineral Resource model (Figure13-2 and Figure13-3) and are not reported as part of the Mineral Resource inventory. This estimation enables the Loulo mine complex mine plan, and subsequent feed blend, to be optimised to ensure that their concentrations do not reach levels which would cause a reduction in recovery (above 300 ppm Cu and above 4,600 ppm As).
| | |
| 18th September 2018 | | Page 110 |
| | | | |
| | Loulo-Gounkoto Gold Mine Complex NI 43-101 Technical Report | | |
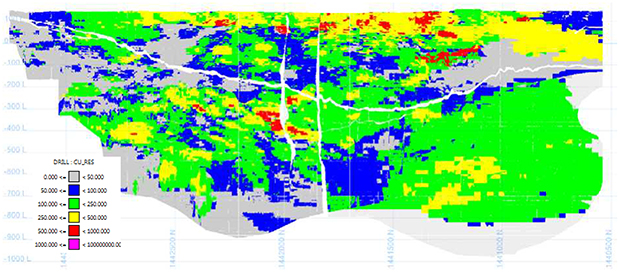
Figure 13-2 Yalea Copper Estimation within 2017 Resource Model Looking East
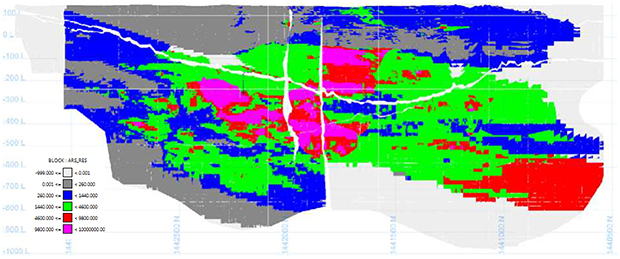
Figure13-3 Yalea Arsenic Estimation within 2017 Resource Model Looking East
The operating philosophy is to maintain process plant gold recovery above 90% by blending the various ore sources (Yalea / Gara/ Gounkoto) to control copper and arsenic grades in the mill feed. This blending process is anticipated to adequately manage copper and arsenic issues over the LOM.
As an analogy of the interaction, both copper and arsenic estimations are included in the block model as a recovery percentage (Figure13-4), using all bottle roll testwork data across the resource. Bottle roll tests are also completed on a composite of every grade control hole drilled as part of the standard underground grade control procedure. The recovery estimation is completed as a single pass ID2 (Inverse Distance squared). For the purpose of the estimation, the primary geological domain of Yalea ‘Purple Patch’ is hard bounded from the rest of the data as it is known to have a lower recovery than the rest of Yalea ore due to the high abundance of arsenopyrite. After a single pass estimate allun-estimated blocks are then coded with the background recoveries of 82.5% for Yalea ‘Purple Patch’ and 84% for Yalea North and South.
| | |
| 18th September 2018 | | Page 111 |
| | | | |
| | Loulo-Gounkoto Gold Mine Complex NI 43-101 Technical Report | | |
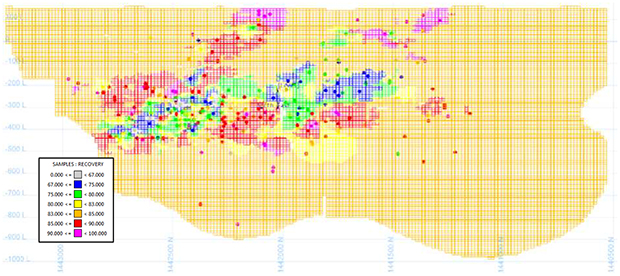
Figure13-4 Process Recovery Estimated into Yalea Block Model
The increase in overall recovery (i.e. above pure theoretical prediction) observed in Figure13-5 and Table13-4 can be explained by an improvement in management practices; improved understanding of ore mineralogy, blending and improved oxygen dispersion.
Table13-4 Loulo Processing Plant Overall Gold Recovery in 2016 and 2017 by Month
| | | | | | | | | | | | |
| Month | | Yalea Open Pit (%) | | Gara Open Pit (%) | | Yalea UG (%) | | Gara UG (%) | | Gounkoto (%) | | Overall Recovery (%) |
Jan-16 | | 0 | | 0 | | 30 | | 22 | | 48 | | 91.16 |
Feb-16 | | 0 | | 0 | | 30 | | 25 | | 46 | | 91.61 |
Mar-16 | | 0 | | 0 | | 30 | | 17 | | 53 | | 90.02 |
Apr-16 | | 0 | | 0 | | 30 | | 23 | | 47 | | 89.78 |
May-16 | | 0 | | 0 | | 29 | | 23 | | 48 | | 92.03 |
Jun-16 | | 0 | | 0 | | 29 | | 19 | | 52 | | 91.12 |
Jul-16 | | 0 | | 0 | | 35 | | 17 | | 48 | | 91.20 |
Aug-16 | | 0 | | 0 | | 29 | | 24 | | 46 | | 91.50 |
Sep-16 | | 0 | | 3 | | 30 | | 24 | | 43 | | 90.25 |
Oct-16 | | 0 | | 4 | | 24 | | 24 | | 48 | | 90.52 |
Nov-16 | | 0 | | 14 | | 28 | | 17 | | 41 | | 91.47 |
Dec-16 | | 0 | | 5 | | 32 | | 19 | | 44 | | 91.50 |
Jan-17 | | 0 | | 0 | | 29 | | 19 | | 51 | | 92.51 |
Feb-17 | | 0 | | 0 | | 28 | | 21 | | 52 | | 92.06 |
Mar-17 | | 0 | | 0 | | 30 | | 24 | | 46 | | 92.65 |
Apr-17 | | 0 | | 0 | | 29 | | 24 | | 47 | | 92.62 |
May-17 | | 0 | | 0 | | 27 | | 23 | | 50 | | 92.33 |
Jun-17 | | 0 | | 0 | | 29 | | 22 | | 49 | | 91.95 |
Jul-17 | | 0 | | 0 | | 29 | | 22 | | 49 | | 91.66 |
Aug-17 | | 0 | | 0 | | 35 | | 24 | | 41 | | 91.72 |
Sep-17 | | 0 | | 2 | | 24 | | 23 | | 50 | | 93.23 |
Oct-17 | | 0 | | 6 | | 26 | | 21 | | 47 | | 94.35 |
Nov-17 | | 0 | | 0 | | 28 | | 19 | | 52 | | 93.61 |
Dec-17 | | 0 | | 0 | | 33 | | 26 | | 41 | | 93.48 |
| | |
| 18th September 2018 | | Page 112 |
| | | | |
| | Loulo-Gounkoto Gold Mine Complex NI 43-101 Technical Report | | |
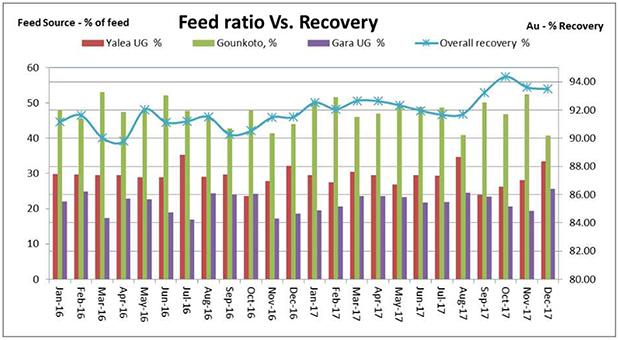
Figure13-5 Loulo Processing Plant Overall Recovery in 2016 and 2017
The initial implementation at Loulo called for an unlined tailings storage facility. During the life of mine, an increase in the arsenic content of the deeper underground ores has been observed. This coupled with the subsequently erected paste plants, which require benign slurry streams, has led to Loulo implementing an enhanced mitigation strategy for the deleterious elements present there.
Arsenic and copper are the deleterious elements of note, and the strategy of mitigation is ore blending to ensure their concentrations do not reach levels that could adversely affect recovery or tailings respectively. It is noted that with the TSF being unlined, it is preferred to keep the supernatant pool as small as possible so as to restrict the effect of a resultant plume having an increased driving force to expand. This has not always been possible to achieve with the effects of wet seasons coupled with plant restrictions to accepting recycled process water.
All of the above issues have been addressed with a formal action plan in place to permanently reduce the size of the supernatant pool, but also to implement a direct mitigation treatment regime of the residue stream prior to it leaving the process plant for the TSF. Thus arsenic, copper, and cyanide tenors are to a large extent eradicated before they have the chance of entering the environment either by controlled discharge or seepage. Environmental borehole monitoring attest to the fact that none of this risk has been manifested to date.
Mitigation occurs inside the plant domain at an area known as the Intermediate Plant orI-Plant, which comprises a series of tanks, thickeners, and ponds used specifically to direct water flows, as needed, for the rest of the mine. This is a technical requirement for the underground paste plants which must use a detoxified coarse tailings as backfill material to fill the stopes. The Intermediate Plant has cyanide destruction together with arsenic fixing andtwo-stage cycloning
| | |
| 18th September 2018 | | Page 113 |
| | | | |
| | Loulo-Gounkoto Gold Mine Complex NI 43-101 Technical Report | | |
to remove clay and fines (if present) and discharges the coarse fraction into a tank. Plant tails also report to this area prior to being pumped to the TSF.
Specific remedial measures include the following:
| | · | | Caro’s acid – A proprietary installation sourced from CyPlus used for both the destruction of cyanide species to ensure a (weak acid dissociated (WAD) cyanide tenor of no greater than 50 ppm at the supernatant pond at the TSF. This same Caro’s acid, supplemented as necessary with hydrogen peroxide, acts as an oxidant for a further mechanism described below. |
| | · | | Ferrous sulphate addition – is oxidised so that the iron is in the ferric state. Arsenic (III) in solution is also oxidised to arsenic (V) state whereupon it links with the iron to form a stable ferric arsenate precipitate which then settles out on the TSF. |
| | · | | A final note in terms of cyanide remediation is that, although Randgold is not a signatory to the cyanide code, it readily chooses to abide by the principles of the code in all operations. |
The above regime has proved successful in reducing the tenors of these deleterious elements, often by more than 80%. Further mitigation lies in the blending of the ore feed to the plant to ensure that inherent or initial arsenic levels remain relatively low in the process plant. Figure13-6 depicts the treatment regime at theI-Plant whereas Figure13-7 shows the effective reduction in tenor.
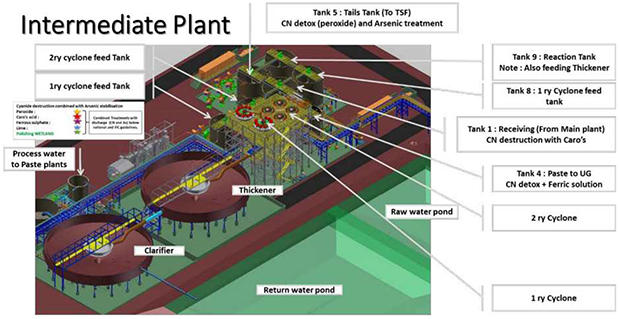
Figure13-6 Treatment Regime in the Intermediate Plant
| | |
| 18th September 2018 | | Page 114 |
| | | | |
| | Loulo-Gounkoto Gold Mine Complex NI 43-101 Technical Report | | |
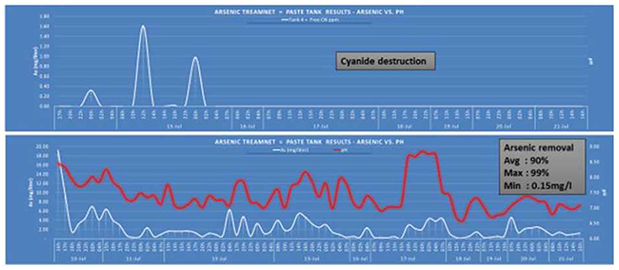
Figure13-7 Effective Reduction in Tenor
| | |
| 18th September 2018 | | Page 115 |
| | | | |
| | Loulo-Gounkoto Gold Mine Complex NI 43-101 Technical Report | | |
| 14 | Mineral Resource Estimates |
The Mineral Resource estimates have been prepared according to the guidelines of the Australasian Code for Reporting of Exploration Results, Mineral Resources and Ore Reserves standards and guidelines published and maintained by the Joint Ore Reserves Committee of the Australasian Institute of Mining and Metallurgy and the Australian Institute of Geoscientists and Minerals Council of Australia (the JORC (2012) Code). Randgold has reconciled the Mineral Resources and Ore Reserves to Canadian Institute of Mining, Metallurgy and Petroleum (CIM) 2014 Definition Standards for Mineral Resources and Mineral Reserves dated May 10, 2014 (CIM (2014) Standards) as incorporated with NI43-101 and there are no material differences.
Definitions for resource categories used in this report are consistent with those defined by CIM (2014) and adopted by NI43-101. In the CIM classification, a Mineral Resource is defined as “a concentration or occurrence of solid material of economic interest in or on the Earth’s crust in such form, grade or quality and quantity that there are reasonable prospects for eventual economic extraction”. Mineral Resources are classified into Measured, Indicated, and Inferred categories. Loulo and Gounkoto Mineral Resources are declared separately.
Geological interpretations and Mineral Resource estimation were completed at Loulo by Randgold with an effective date of 31st December 2017. Table14-1 summarises the Loulo Mineral Resource estimate as of 31st December 2017.
Table14-1 Loulo Gold Mine Mineral Resource Statement as of 31st December 2017
| | | | | | | | | | |
| Source | | Mineral Resource | | Tonnes (Mt) | | Grade (g/t) | | Ounces (Moz) | | *Attributable Gold (Moz) |
Stockpiles | | Measured | | 1.7 | | 1.60 | | 0.086 | | 0.068 |
Open Pit | | Measured | | 1.9 | | 2.67 | | 0.17 | | 0.13 |
| | Indicated | | 6.9 | | 3.08 | | 0.69 | | 0.55 |
| | Inferred | | 2.5 | | 3.3 | | 0.27 | | 0.21 |
Underground | | Measured | | 17 | | 4.99 | | 2.7 | | 2.1 |
| | Indicated | | 26 | | 5.18 | | 4.3 | | 3.4 |
| | Inferred | | 9.8 | | 4.1 | | 1.3 | | 1.0 |
Total | | Measured | | 20 | | 4.49 | | 2.9 | | 2.3 |
| | Indicated | | 33 | | 4.73 | | 5.0 | | 4.0 |
| | Measured +
Indicated | | 53 | | 4.64 | | 7.9 | | 6.3 |
| | Inferred | | 12 | | 3.9 | | 1.6 | | 1.3 |
*Attributable gold (Moz) refers to the quantity attributable to Randgold based on Randgold’s 80% interest in Loulo Gold Mine. Mineral Resources are reported on a 100% and attributable basis.
The Mineral Resource estimate has been prepared according to JORC (2012) Code. Randgold has reconciled the Mineral Resources to CIM (2014) Standards, and there are no material differences.
All Mineral Resource tabulations are reported inclusive of that material which is then modified to form Ore Reserves.
Open pit Mineral Resources are those within a $1,500/oz pit shell at an averagecut-off grade of 0.7 g/t Au.
Underground Mineral Resources are those below the $1,500/oz pit shell at acut-off grade of 1.89 g/t Au at Gara and 2.04 g/t Au at Yalea.
Mineral Resources for Loulo were generated by Mr Simon Bottoms, CGeol, an officer of the company and Qualified Person. Numbers may not add due to rounding.
| | |
| 18th September 2018 | | Page 116 |
| | | | |
| | Loulo-Gounkoto Gold Mine Complex NI 43-101 Technical Report | | |
Loulo year end 2017 Measured and Indicated Mineral Resources are estimated at 53 Mt at 4.64 g/t Au containing 6.3 Moz of gold and there is an Inferred Mineral Resource of 12 Mt at 3.9 g/t Au containing 1.6 Moz gold. The Mineral Resources consist of Loulo open pit and underground Mineral Resources and surface stockpiles.
The Loulo Gold Mine resources consist of the Gara and Yalea underground resources and the Baboto, Loulo 3 and Gara West open pit resources. There are six additional minor satellite deposits with previously declared resources, P129, P125L3, P129QT, Loulo 1, Loulo 2 and L2L3Gap, and PQ10. These minor satellite deposits combined make up approximately 1% of the declared Mineral Resources, have not been updated using current practices, are not the target of recent exploration, and do not contain Ore Reserves.
Gara, Yalea and Baboto Mineral Resources have been updated in 2017 by additional drilling and mapping providing further information to improve the geological model for resources estimation. No new data has been added to Loulo 3 and Gara West since the previous model update, and the models remain the same as declared in year end 2016 resources.
Both the Gara and Yalea models incorporate data from the open pit and underground grade control infill drilling as well as exploration diamond drill holes. Thecut-off date for data used to create the models is the 20th October 2017 for Yalea and the 20th November 2017 for Gara. For the Baboto satellite, the datacut-off was 1st December 2017, for Loulo 3 the datacut-off was 12th November 2015, and for Gara West the datacut-off was December 2007. No drilling that would make a material impact on the Mineral Resource was completed between thecut-off date and the effective date of the Mineral Resource (31st December 2017). Open pit and underground scans are completed monthly and annually on 31st December to quantify all mining depletion and the block models are depleted with these during reporting.
All Mineral Resources updates since 2014 at Loulo used Maptek Vulcan. Some minor satellite deposits were created in Gemcom prior to this and have not been updated. Table14-2 summarises the effective model date for the major deposits at Loulo and details if they are currently in production.
Table14-2 Summary of Loulo Deposit and Model Date
| | | | |
| Deposit | | Producing Status | | Model Date |
Yalea Underground | | Active | | 31/12/2017 |
Gara Underground | | Active | | 31/12/2017 |
Baboto | | Unmined | | 31/12/2017 |
Loulo 3 | | Partially Mined | | 31/12/2017 |
Gara West | | Unmined | | 31/1/2015 |
P129 | | Partially Mined | | 31/12/2009 |
P125L3 | | Unmined | | 31/12/2011 |
P129QT | | Partially Mined | | 31/12/2006 |
Loulo 1 | | Unmined | | 31/12/2011 |
Loulo 2 and L2L3Gap | | Unmined | | 31/12/2011 |
PQ10 | | Unmined | | 31/12/2010 |
| | |
| 18th September 2018 | | Page 117 |
| | | | |
| | Loulo-Gounkoto Gold Mine Complex NI 43-101 Technical Report | | |
Thecut-off grade selected for limiting each of the Mineral Resources corresponds to the insitumarginalcut-off grade using a gold price of $1,500/oz.
For the open pit Mineral Resources, the pit shell selected for limiting each of the Mineral Resources corresponds to a gold price of $1,500/oz. As a result of the optimisation process, this pit shell selection will result in the highest undiscounted net present value of the deposit, at $1,500/oz.
Underground panels were reviewed and those that were deemed as having a reasonable prospect of eventual economic extraction were included in the reported Mineral Resource.
In the QP’s opinion there are no environmental, permitting, legal, title, fiscal, socioeconomic, marketing, fiscal, or other relevant factors which could materially impact the Loulo Mineral Resources.
Geological interpretations and Mineral Resource estimation were completed at Gounkoto by Randgold with an effective date of 31st December 2017. Table14-3 summarises the Gounkoto Mineral Resource estimate as of 31st December 2017.
Table14-3 Gounkoto Gold Mine Mineral Resource Statement as of 31st December 2017
| | | | | | | | | | |
| Source | | Mineral Resource | | Tonnes (Mt) | | Grade (g/t) | | Ounces (Moz) | | *Attributable Gold (Moz) |
Stockpiles | | Measured | | 1.8 | | 1.96 | | 0.11 | | 0.089 |
Open Pit | | Measured | | 5.4 | | 4.33 | | 0.75 | | 0.60 |
| | Indicated | | 18 | | 4.04 | | 2.3 | | 1.9 |
| | Inferred | | 1.4 | | 2.3 | | 0.11 | | 0.08 |
Underground | | Indicated | | 3.0 | | 5.74 | | 0.56 | | 0.45 |
| | Inferred | | 2.6 | | 3.51 | | 0.29 | | 0.23 |
Total | | Measured | | 7.1 | | 3.75 | | 0.86 | | 0.69 |
| | Indicated | | 21 | | 4.28 | | 2.9 | | 2.3 |
| | Measured +
Indicated | | 28 | | 4.15 | | 3.7 | | 3.0 |
| | Inferred | | 4.0 | | 3.1 | | 0.40 | | 0.32 |
*Attributable gold (Moz) refers to the quantity attributable to Randgold based on Randgold’s 80% interest in Gounkoto Gold Mine. Mineral Resources are reported on a 100% and attributable basis.
The Mineral Resource estimate has been prepared according to JORC (2012) Code. Randgold has reconciled the Mineral Resources to CIM (2014) Standards, and there are no material differences.
All Mineral Resource tabulations are reported inclusive of that material which is then modified to form Ore Reserves.
Open pit Mineral Resources are those within a $1,500/oz pit shell at an averagecut-off grade of 0.8 g/t Au.
Underground Mineral Resources are those below the $1,500/oz pit shell at acut-off grade of 2.0 g/t Au.
Mineral Resources for Gounkoto were generated by Mr Simon Bottoms, CGeol, an officer of the company and Qualified Person.
Numbers may not add due to rounding. Gounkoto year end 2017 Measured and Indicated Mineral Resources are estimated to be 28 Mt at 4.1 g/t Au containing 3.7 Moz gold and Inferred Resources are estimated to be 4 Mt at 3.1 g/t Au containing 0.32 Moz.
Gounkoto Mineral Resources consist of three primary sources: Gounkoto open pit and underground, and Faraba open pit. Gounkoto open pit and underground models were updated in 2017 because of depletion at Gounkoto open pit along with new drilling and model changes for both open pit and underground. Faraba model remains the same as 2016 as no additional work has been undertaken on the deposit.
| | |
| 18th September 2018 | | Page 118 |
| | | | |
| | Loulo-Gounkoto Gold Mine Complex NI 43-101 Technical Report | | |
Thecut-off date for data used in the Gounkoto update is 14th July 2017 and 31st December 2011 for the Faraba model. No drilling that would make a material impact on the Mineral Resource was completed between thecut-off date and the effective date of the Mineral Resource (31st December 2017). Open pit scans are completed on 31st December 2017, to capture all completed mining and the block models are depleted with these during reporting.
All Mineral Resource models for Gounkoto have been created using Maptek Vulcan. Table14-4 summarises the effective model date for each deposit in Loulo and if it is currently in production.
Table14-4 Summary of Gounkoto Deposit and Model Date
| | | | |
| Deposit | | Producing Status | | Model Date |
Gounkoto Open Pit | | Active | | 31/12/2017 |
Gounkoto Underground | | Unmined | | 31/12/3017 |
Faraba | | Unmined | | 31/12/2015 |
Thecut-off grade selected for limiting each of the Mineral Resources corresponds to the insitumarginalcut-off grade using a gold price of $1,500/oz.
For the open pit Mineral Resources, the pit shell selected for limiting of each of the Mineral Resources corresponds to a gold price of $1,500/oz. As a result of the optimisation process, this pit shell selection will result in the highest undiscounted net present value of the deposit, at $1,500/oz.
Underground panels were reviewed and those that were deemed as having a reasonable prospect of eventual economic extraction were included in the reported Mineral Resource.
In the QP’s opinion there are no environmental, permitting, legal, title, fiscal, socioeconomic, marketing, or other relevant factors which could materially impact the Gounkoto Mineral Resources.
Loulo
Thecut-off date for data used to create the models is the 20th October 2017 for Yalea and the 20th November 2017 for Gara. For the Baboto satellite, the datacut-off was 31st May 2017, for Loulo 3 the datacut-off was 12th November 2015, and for Gara West thecut-off was December 2007. No drilling that would make a material impact on the Mineral Resource was completed between thecut-off date and the effective date of the Mineral Resource (31st December 2017).
The complete resource databases used for the 2017 model updates are detailed in Table14-5. Diamond drill holes (DD) and reverse circulation drill holes (RC) were combined with trench samples to create and estimate the Mineral Resources. Underground channel samples were used at Gara only as due to the vein stockwork nature of this deposit, a cross face channel sample represented a true representation of the mineralisation.
| | |
| 18th September 2018 | | Page 119 |
| | | | |
| | Loulo-Gounkoto Gold Mine Complex NI 43-101 Technical Report | | |
Table14-5 Loulo Mineral Resource Dataset
| | | | | | | | | | | | | | | | | | | | |
Hole Type | | Yalea | | Gara | | Baboto | | Loulo 3 | | Gara West |
| | Hole Count | | Meters | | Hole Count | | Metres | | Hole Count | | Metres | | Hole Count | | Metres | | Hole Count | | Metres |
DDH | | 1,142 | | 243,720 | | 442 | | 177,264 | | 61 | | 7,873 | | 1,112 | | 1,709 | | 34 | | 8,952 |
RC | | 2,229 | | 77,346 | | 2,454 | | 85,875 | | 2,515 | | 93,526 | | 679 | | 24,730 | | 96 | | 7,121 |
Channel | | | | | | 303 | | 1,710 | | | | | | | | | | | | |
Trench | | 331 | | 17,872 | | 21 | | 1,717 | | 95 | | 7,688 | | 4 | | 12,705 | | | | |
Total | | 3,702 | | 338,937 | | 3,220 | | 266,565 | | 2,671 | | 109,087 | | 1,795 | | 39,144 | | 130 | | 16,073 |
Gounkoto
Thecut-off date for date used in the Gounkoto update is 14th July 2017 and 31st December 2011 for the Faraba model. No drilling that would make a material impact on the Mineral Resource was completed between thecut-off date and the effective date of the Mineral Resource (31st December 2017).
The complete resource database that was used to report the 2017 Mineral Resource is summarised in Table14-6.
Table14-6 Gounkoto Mineral Resource Dataset
| | | | | | | | |
Hole Type | | Gounkoto | | Faraba |
| | Hole Count | | Metres | | Hole Count | | Metres |
DDH | | 719 | | 160,791 | | 17 | | 4,385 |
RC | | 5,681 | | 293,040 | | 75 | | 8,424 |
Total | | 6,400 | | 453,831 | | 92 | | 12,809 |
Loulo
Yalea
The geology model wireframes were generated in Vulcan on 10 m spaced vertical sections. Wireframe strings are generated on these sections based on trenches, RC, and diamond drill holes, including underground infill grade control drilling, and the hanging wall and footwall shears as bounding structures. There is generally a sharp contact between the mineralisation and waste material with a strong correlation between the grade change and that of the alteration and structure deformation.
The Yalea solid is comprised of Yalea South, Yalea North, P125 Zone, and a high-grade domain referred to as ‘Purple Patch’. These solids were cropped against a basal surface. The basal surface for each deposit was generated at the limit of geological continuity, which is above that of the deepest drill hole intersects. The mineralised model has also been updated to follow the Yalea Shear.
The domain solids have been separated into weathering domains and structural orientation sub-domains (Figure14-1). ‘Purple Patch’ (domain 9006) is located predominantly in the northern portion of the mineralisation and has been domained as a separate high-grade zone due to the
| | |
| 18th September 2018 | | Page 120 |
| | | | |
| | Loulo-Gounkoto Gold Mine Complex NI 43-101 Technical Report | | |
very high sulphide content within this zone which gives it a higher density (average 3.1 g/cm3) This domain is observed in drill core and underground as visually different from the other fresh domains and is observed to have different density and grade characteristics, and therefore can further support it is estimated with a hard boundary.
A completere-log of all the existing drill core from within the ‘Purple Patch’ concluded that ‘Purple Patch’ style mineralisation only occurred in areas where at least two of the three phases of alteration were present (Figure14-2). The application of the thin zone sub domain wireframes within the ‘Purple Patch’ has also enabled the minimum wireframe thickness to be set to 1.5 m and thus minimising the amount of waste samples added to the domain.
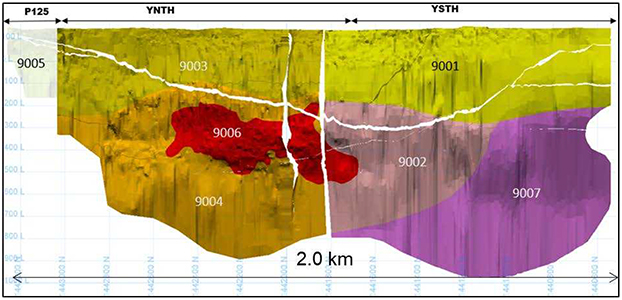
Figure14-1 Yalea Model Geological Domains (Looking East). A Portion of 9007 is Also Referred to as Yalea South HG Plunge
During 2017 step out resource definition drilling to the south of the main Yalea resource defined a significant extension to the Yalea South Mineral Resources (9007).
All Yalea South Extension domains remain as unclassified or conceptual within the 2017 resource models as further resource definition and exploration drilling is planned to potentially convert this into a Mineral Resource during 2018.
| | |
| 18th September 2018 | | Page 121 |
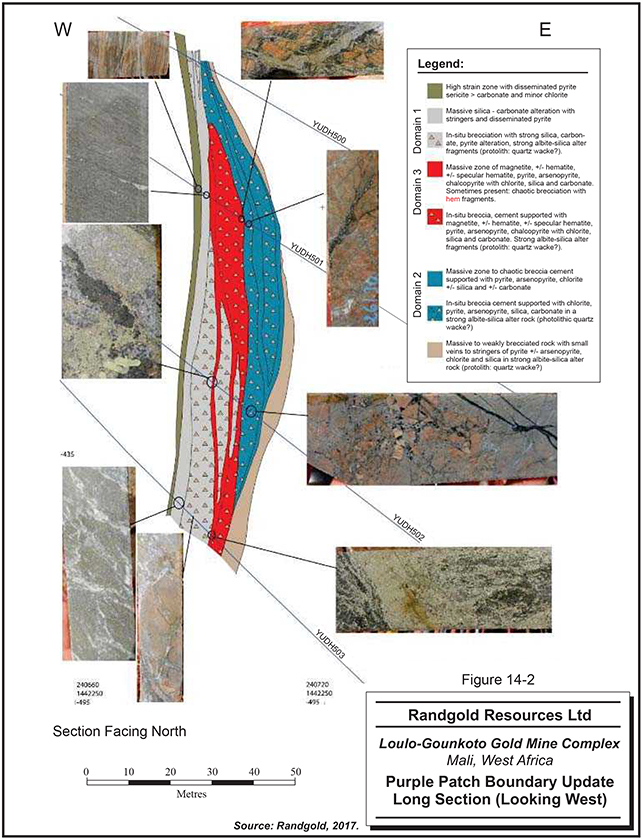
| | |
| 18th September 2018 | | Page 122 |
| | | | |
| | Loulo-Gounkoto Gold Mine Complex NI 43-101 Technical Report | | |
Gara
The Gara geological domain solid model was generated in Vulcan modelling software from 10 m spaced vertical section strings. Wireframe strings were created on these using trenches, advanced RC, grade control RC, and diamond drill holes, including underground drilling, and mapping information. There is generally a sharp shear contact between the mineralisation and hanging wall waste material. The footwall contact is more complex due to the gradational reduction in the degree of tourmalinisation. Due to the folded nature of the body the solids have beensub-divided into separate structural orientation domains (Figure14-3). The mineralisation domains have a strong correlation between the grade and theSi-Ca fracture vein intensity as a function ofsyn-mineralisation deformation.
Continued drilling in 2017 following on from exploration conversion drilling during 2016 defined southerly extensions of the mineralisation. These have been classed under the Gara Far South and Gara Far South Extension and coded as domains 76059600, 4605 and 9605. Domains 4600, 4605 and 8400 are all excluded from underground mineral resource reporting due to being deemed to not have reasonable prospect of eventual economic extraction.
Each geological domain is attributed a single code for the estimation. The homoclinal limb of the fold is coded as geological domains 3000 and 4000 which corresponds to Zone 1 in historic model terminology.
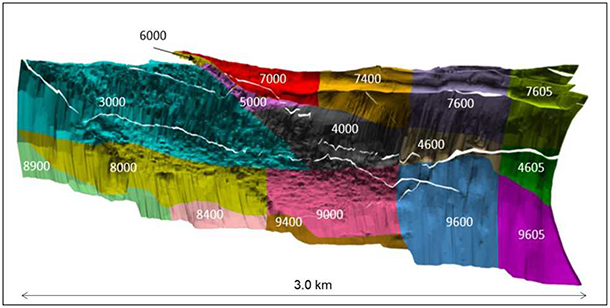
Figure 14-3 Gara Model and Geological Domains
Loulo 3
The mineralisation wireframes and geological solids were generated in Gemcom in January 2012, using a combination of 25 m spaced vertical sections and closer spaced grade control spacing. The interpretation uses trenches, RC and diamond drill holes that intersect the mineralisation. The models are cropped against a basal surface which was constructed at half of the average down dip drill hole spacing below the deepest drill holes.
| | |
| 18th September 2018 | | Page 123 |
| | | | |
| | Loulo-Gounkoto Gold Mine Complex NI 43-101 Technical Report | | |
Loulo 3 is separated into three zones: namely MZ2 striking 020°, which is cross cut by subparallel MZ1 NW trending mineralisation and the southern FW zone striking 350°.
A NNE trending,sub-vertical mafic intrusive (5 m to 7 m thick) has intruded along a late fault which cross cuts the mineralisation and separates the southern zone and the SW zones. This has displaced the mineralisation by uplifting the eastern block by between 5 m and 10 m (Figure14-4).
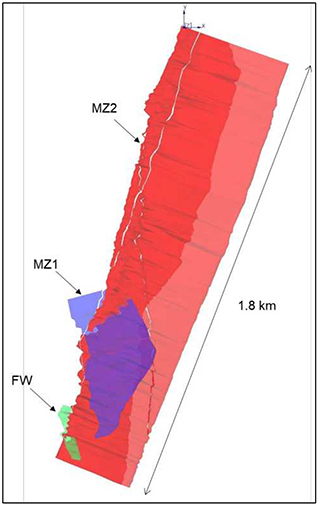
Figure14-4 Loulo 3 Model Geological Domains
| | |
| 18th September 2018 | | Page 124 |
| | | | |
| | Loulo-Gounkoto Gold Mine Complex NI 43-101 Technical Report | | |
Baboto
The domain solids were generated in Vulcan using vertical sections with 10 m separations for Baboto South and Baboto Centre. The interpretation used trenches, RC and diamond drill holes that intersect the mineralisation, which dips steeply to the west.
The models are cropped against a basal surface which was constructed at half of the average down dip drill hole spacing below the deepest drill holes. The model was cut by dolerite dykes. Baboto South is separated into a GC and explorationsub-domains, whilst all other zones are split by weathering profiles and cut by overlying transported cover. Figure14-5 illustrate the Baboto domains.
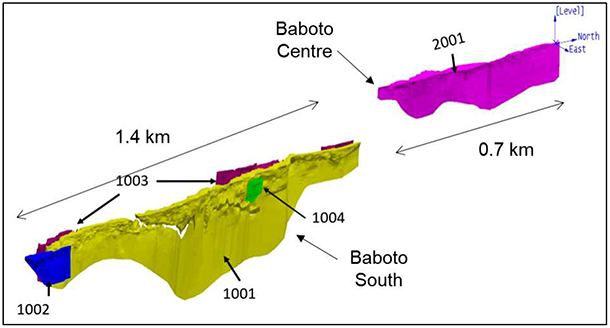
Figure14-5 Baboto Model Geological Domains
Gara West
The domain wireframes and geological solids were generated in Maptek Vulcan during November 2015 using a combination of 20 m spaced vertical sections. The interpretation used RC and diamond drill holes that intersect the mineralisation, which dips steeply to the west and are generallylow-grade (Figure14-6).
The November 2015 update of Gara West added two additional lodes outside of the previous 2012 wireframes. Consequently, the model now contains four individual, parallel mineralised lenses striking NNE and steeply dipping west.
| | |
| 18th September 2018 | | Page 125 |
| | | | |
| | Loulo-Gounkoto Gold Mine Complex NI 43-101 Technical Report | | |
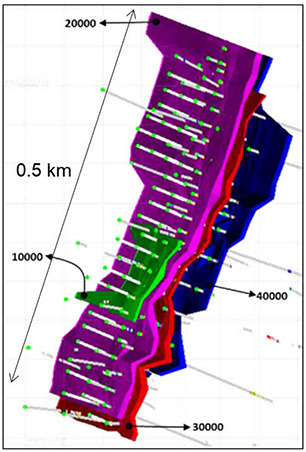
Figure14-6 Gara West Model Geological Domains
Gounkoto
The Gounkoto wireframes were created in Vulcan on 6.25 m and 12.5 m spaced sections depending on the drill spacing. Interpretation strings were created using lithological, alteration, mineralisation, structure measurement logging together with assay data from the surface and pit mapping, the trench, RC, and DD hole data. The strings were connected to form three-dimensional wireframes.
Due to the structural controls that dictate the 3D geometric shape, the alteration type and mineralisation style, Gounkoto has beensub-divided into eight geological domains. There are four main zones (MZ1to MZ4), eleven footwall iron structure NS zones (FWFE), five footwall NE zones (FWNE), four hanging wall zones (HW) and one original satellite (sub divided into P64W and P64E) which is now included into the ‘Super Pit’ (Figure14-7).
| | |
| 18th September 2018 | | Page 126 |
| | | | |
| | Loulo-Gounkoto Gold Mine Complex NI 43-101 Technical Report | | |
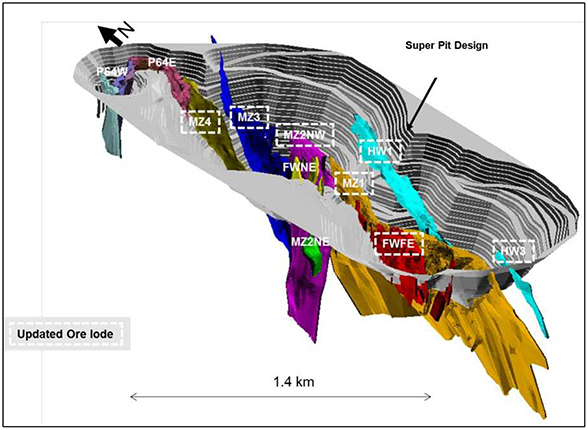
Figure14-7 Gounkoto Model Geological Domains
Faraba
The wireframes were generated by drawing 20 m vertical sections perpendicular to the broadlyN-S strike of the deposit in Vulcan geological modelling software. Geologists constructed an interpretation on printouts of the sections, using the drilling, lithological, alteration, mineralisation, and structural measurements. From these interpretations, strings representing the outlines of the domains were digitised (Figure14-8).
| | |
| 18th September 2018 | | Page 127 |
| | | | |
| | Loulo-Gounkoto Gold Mine Complex NI 43-101 Technical Report | | |
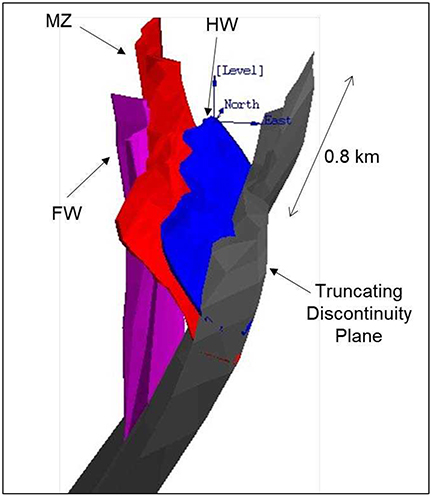
Figure14-8 Faraba Model Geological Domains
The main mineralisation is striking generally NS to NNW and dips between 50° and 70°. To the east the mineralisation is truncated by a black sandstone discordance. Faraba mineralisation has beensub-divided into three geological domains:
| | · | | Main Zone:Located between two NE faults identified on section 53 to the north and sections 38, 39, 40 and 42 to the south. The faults are characterised by pervasive haematite and strong brecciation. |
| | · | | Hanging Wall: Weak mineralisation identified mainly in the fine greywacke saprolite material with a weak oxidation from section 36 to 48 (580 m). |
| | · | | Footwall: Broad mineralisation intersected to the northern part of the structure. Hosted in coarse sediments with weak silica and carbonise alteration with local shearing. Generally, steeply dipping. |
| | |
| 18th September 2018 | | Page 128 |
| | | | |
| | Loulo-Gounkoto Gold Mine Complex NI 43-101 Technical Report | | |
Topography has been depicted using a digital terrain model (DTM) LIDAR 5 m resolution surface for all deposits in the Loulo and Gounkoto Permits (clipped from the regional DTM completed by Randgold in October 2010). This topography includes historical artisanal pits.
The topography surface covers the entire Project area as required for mine design purposes. Where surface mining has occurred, updated LIDAR surveys have been completed on a monthly and annual basis. The surface was visually checked against drill hole collar elevations for the Project, and an acceptable match was found.
Bulk density measurements were carried out on the mineralised and waste material. Distributions of each group were studied with outliers being excluded before the mean value was calculated for each rock type which was then hard coded into model.
Fresh, transition and saprolite core was obtained from the diamond drilling and the bulk density was calculated using Archimedes principles (water immersion method). Drill core was cut 10 cm for HQ core and 15 cm for NQ core lengths before being measured in air and again in water. Where needed, core was wrapped prior to weighing to prevent water ingress. The mass measurements are accurate to 0.1g and the scale is equipped with a hook and basket for weighing the sample in water. The dry mass and submerged mass of each sample were recorded, and the following formula utilised to calculate the density of the sample:
| | |
| Density = | | mass(air) |
| | [mass(air) – mass(water) |
The scale used to weigh the samples (below) is calibrated using calibration weights from the onsite SGS laboratory.
Density measurements were carried out on the mineralisation and waste material. Distributions of each group were studied with outliers being excluded before mean value was calculated.
Loulo
The assigned density values are based upon the mean or median of the density dataset for each domain/rock type (Table 14-7 to Table 14-10). A single density value is hard coded to the block model for each rock type.
| | |
| 18th September 2018 | | Page 129 |
| | | | |
| | Loulo-Gounkoto Gold Mine Complex NI 43-101 Technical Report | | |
Table 14-7 Yalea Density Data
| | |
| Rock Type | | SG (g/cm3) |
Sulphide | | 2.79 (9005) |
| | 2.86 (9001,9002, 9003, 9004) |
| | 2.94 (9146) |
| | 9006 –ID2 estimate & 3.1 background assign |
Transition | | 2.1 (9001, 9003) |
| | 2.47 (9005) |
Oxide | | 1.83 |
HW Fresh | | 2.75 |
HW Transition | | 2.17 |
HW Saprolite | | 2.10 |
FW Fresh | | 2.76 |
FW Transition | | 2.37 |
FW Saprolite | | 2.10 |
Dolerite Fresh | | 2.60 |
Dolerite Transition | | 2.5 |
Dolerite Saprolite | | 2.30 |
Table 14-8 Gara and Gara West Density Data
| | |
| Rock Type | | SG (g/cm3) |
Sulphide | | 2.82 |
Transition | | 2.48 |
Oxide | | 2.48 |
HW Fresh | | 2.75 |
HW Transition | | 2.17 |
HW Saprolite | | 1.69 |
FW Fresh | | 2.76 |
FW Transition | | 2.23 |
FW Saprolite | | 1.90 |
Dolerite Fresh | | 2.96 |
Dolerite Transition | | 2.30 |
Dolerite Saprolite | | 2.30 |
Table 14-9 Loulo 3 Density Data
| | |
| Rock Type | | SG (g/cm3) |
Sulphide | | 2.82 (Main) |
| | 2.77 (South) |
| | 2.75 (SW) |
Transition | | 2.26 (Main) |
| | 2.01 (South) |
| | 2.26 (SW) |
Oxide | | 1.68 (Main) |
| | 1.77 |
| | (South) |
| | 1.68 (SW) |
HW Fresh | | 2.72 |
HW Transition | | 2.37 |
HW Saprolite | | 2.10 |
FW Fresh | | 2.76 |
FW Transition | | 2.17 |
FW Saprolite | | 2.10 |
Dolerite Fresh | | 2.96 |
Dolerite Transition | | 2.50 |
Dolerite Saprolite | | 2.30 |
Porphyry Fresh | | 2.83 |
Porphyry Transition | | 2.50 |
Porphyry Saprolite | | 2.30 |
| | |
| 18th September 2018 | | Page 130 |
| | | | |
| | Loulo-Gounkoto Gold Mine Complex NI 43-101 Technical Report | | |
Table 14-10 Baboto Density Data
| | |
| Rock Type | | SG (g/cm3) |
Sulphide | | 2.72 |
Transition | | 2.33 |
Oxide | | 1.95 |
Transported Cover | | 1.34 |
Quartzite / SQR Fresh | | 2.74 |
Quartzite / SQR Transition | | 2.34 |
Quartzite / SQR SAP | | 1.34 |
Dolerite Fresh | | 2.96 |
Dolerite Transition | | 2.50 |
Dolerite Saprolite | | 2.30 |
Yalea ‘Purple Patch’ Density Study
Due to the presence of a consistent tonnage bias within the 2017 Loulo mine reconciliation (refer to Section 14.19 Reconciliation) a review of all Yalea density data was undertaken. This confirmed all other Yalea geological domain densities but highlighted significant variability within the ‘Purple Patch’ density distribution (Figure 14-9).
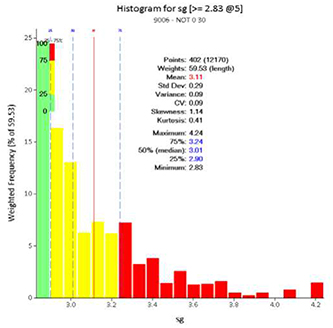
Figure 14-9 Yalea 2017 ‘Purple Patch’ Density Distribution
Previously the ‘Purple Patch’ density had been assigned at 3.1 g/cm3 as the mean of the domain distribution. However, when reviewed spatially it was apparent that the lower ‘fringe’ portions of the ‘Purple Patch’ were a different density to the main portion of the ‘Purple Patch’ (Figure 14-10).
| | |
| 18th September 2018 | | Page 131 |
| | | | |
| | Loulo-Gounkoto Gold Mine Complex NI 43-101 Technical Report | | |
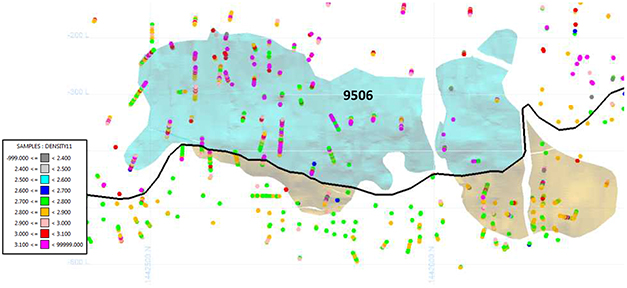
Figure 14-10 Yalea 2017 ‘Purple Patch’ Model and Density Data Spatial Distribution Highlighting Lower Domain Contact
The distributions of the separated 9506 and ‘Fringe’ domains show significantly different distributions. The resultant sub domain distributions still show a much larger interquartile range than other domains within Yalea. Consequently, a single pass ID2 (Inverse Distance squared) estimate was complete within each of the two sub domains which were hard bounded from one another for estimation.
Different estimation methods were tested and ID2 estimation was selected as the appropriate estimation method for density estimation within the 2017 Yalea resource model as this applies slightly less weighting to local outliers relative to ID3 (Inverse distance cubed). After a single pass estimation, the mean density for each sub domain was then assigned to the un-estimated portion. The resultant 2017 density for Yalea Mineral Resource is shown below in Figure 14-11.
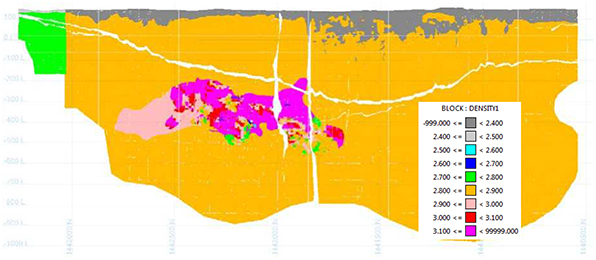
Figure 14-11 Yalea 2017 Mineral Resource Block Model Densities
| | |
| 18th September 2018 | | Page 132 |
| | | | |
| | Loulo-Gounkoto Gold Mine Complex NI 43-101 Technical Report | | |
The resultant impact of the density estimate was a reduction of 264 kt of rock, but a 5% improvement on the mine call factor ounce reconciliation for 2017 (refer to Section 14.19 Reconciliation)
Gounkoto
A single density was applied for each mineralised domain within the Gounkoto Mineral Resource. As there is no trenching on the Gounkoto deposit, transitional and saprolite material was assigned density values of 2.40 g/cm3 and 1.83 g/cm3 respectively, based on the limited data available and this was verified against other similar Mineral Resources in the Loulo Permit. This represents a low risk to the Mineral Resource estimate because with the exception of P64, all oxide and transition material within the Gounkoto Mineral Resource has been depleted.
The waste domains have been split into hanging wall and footwall sub-domains due to structural dipping and differences in complexity. Outliers are removed from the density values prior to calculations.
Table 14-11 summarises the densities used in the Gounkoto 2017 Resource update.
Table 14-11 Densities Applied Gounkoto for 2017 Resources
| | | | | | | | | | | | | | | | | | | | |
| Material | | Unit | | MZ1 | | MZ2NW, MZ2NW, MZ2NWFW | | MZ3 | | MZ4, MZ4FW | | HW1 to 4, MZ3HW | | FWFE1 to 11, FWNE1 to 5 | | P64W, P64E | | HW Waste | | FW Waste |
Sap | | g/cm3 | | 1.83 | | 1.83 | | 1.83 | | 1.83 | | 1.83 | | 1.83 | | 1.83 | | 1.68 | | 1.86 |
Trans | | g/cm3 | | 2.4 | | 2.4 | | 2.4 | | 2.4 | | 2.4 | | 2.4 | | 2.4 | | 2.4 | | 2.56 |
Fresh | | g/cm3 | | 2.81 | | 2.98 | | 2.86 | | 2.81 | | 2.79 | | 2.81 | | 2.81 | | 2.74 | | 2.76 |
MZ 2 has a significantly higher fresh rock density than the other zones due to a significant increase in the iron carbonate and haematite alteration.
Faraba
At Faraba, single density values were applied to each lithology sub split into weathering sub domains as outlined in Table 14-12. Any lithologies that had insufficient samples to ascertain a density used the equivalent density obtained for Gounkoto.
Table 14-12 Densities Applied Faraba for 2017 Resources
| | | | | | | | | | | | | | | | |
| Material | | Unit | | Sandstone (100) | | Greywacke (200) | | SQR (300) | | QR (400) | | Limestone (500) | | Intrusive (600) |
Ore | | Saprolite | | g/cm3 | | 1.89 | | 1.88 | | 2.35 | | 2.35 | | 1.36 | | 2.30 |
| | Trans | | g/cm3 | | 2.57 | | 2.36 | | 2.50 | | 2.59 | | 1.91 | | 2.50 |
| | Fresh | | g/cm3 | | 2.84 | | 2.72 | | 2.78 | | 2.78 | | 2.89 | | 2.76 |
Waste | | Saprolite | | g/cm3 | | 1.88 | | 1.88 | | 2.35 | | 2.35 | | 1.36 | | 2.30 |
| | Trans | | g/cm3 | | 2.57 | | 2.36 | | 2.50 | | 2.59 | | 1.91 | | 2.50 |
| | Fresh | | g/cm3 | | 2.72 | | 2.72 | | 2.78 | | 2.78 | | 2.77 | | 2.78 |
| | |
| 18th September 2018 | | Page 133 |
| | | | |
| | Loulo-Gounkoto Gold Mine Complex NI 43-101 Technical Report | | |
Drill hole data is composited prior to top cutting. The aim of compositing drill holes is to eliminate grade bias due to sample length during interpolation. Prior to selection of the final composite length, the data is visually analysed using a histogram of sample length to identify the mode of the length. The coefficient of variation (CV), standard deviation (SD) and mean plots were produced with several composite lengths to ensure that the mean, CV, and SD are stable and do not increase with composting.
All drill hole information within the mineralised zones is composited, with a minimum sample length applied so that any sample below this is removed and thus not used during estimation. This also allows compositing of up to the composite length + minimum sample length (e.g. 2.0 m + 0.5 m = 2.5 m sample length) at the edge of mineralisation. The non-composited residuals (those below minimum sample length) are analysed for each estimation domain to ensure that the discarded points do not bias the remaining data populations.
The composite samples are flagged using the mineralised domains. Missing sample intervals are ignored during compositing, although the sources of missing samples are investigated to ensure that there is no bias.
Loulo
Yalea
Data within the estimation domains has been composited to 2.0 m using Vulcan. The compositing method applied attempted to create a maximum sample composite length of 3.0 m and a minimum length of 1.0 m. Most composite lengths are 2.0 m.
Drill holes samples with missing values of -999 have been omitted from the compositing. Composites with length 1.0 m or less are reset to an absent value, in Vulcan this is set to -999 and ignored in the estimate, a total of 54 samples with a maximum grade of 16.5 g/t Au and an average grade of 2.75 g/t Au were impacted. The resultant composite database samples for the underground area are presented in Table 14-13.
Table 14-13 Yalea Total Model 2 m Composite Dataset
| | | | | | | | | | | | | | |
| Domain | | 9001 | | 9002 | | 9003 | | 9004 | | 9005 | | 9006 | | 9007 |
Number of Points | | 625 | | 408 | | 2,279 | | 2,387 | | 820 | | 1,659 | | 69 |
Min Au Grade (g/t) | | 0.01 | | 0.01 | | 0.01 | | 0.01 | | 0.01 | | 0.09 | | 0.01 |
Uncapped Max Au Grade (g/t) | | 53.65 | | 44.40 | | 40.56 | | 124.75 | | 117.85 | | 116.65 | | 98.80 |
Uncapped Mean Au Grade (g/t) | | 3.10 | | 5.70 | | 3.27 | | 4.19 | | 2.98 | | 9.32 | | 9.35 |
CV | | 1.55 | | 1.08 | | 1.09 | | 1.78 | | 2.22 | | 0.93 | | 1.64 |
| | |
| 18th September 2018 | | Page 134 |
| | | | |
| | Loulo-Gounkoto Gold Mine Complex NI 43-101 Technical Report | | |
Gara
Data within the estimation domains has been composited to 2.0 m using Vulcan. The compositing method applied attempted to create a maximum sample composite length of 3.0 m and a minimum length of 1.0 m. Most composite lengths are 2.0 m.
Residuals of less than 1.0 m in length are reset to an absent value, in Vulcan this is set to -999 and ignored in the estimate, a total of 82 samples with a maximum grade of 32.74 g/t Au and an average grade of 2.59 g/t Au were impacted. No hard boundaries are applied to the Gara estimation. The resultant composite database samples for the entire underground area is presented in Table 14-14:
Table 14-14 Gara Total Model 2 m Composite Dataset
| | |
| Domain | | 9001 |
Number of Points | | 8,820 |
Min Au Grade (g/t) | | 0.01 |
Max Au Grade (uncapped g/t) | | 322.10 |
Mean Au Grade (uncapped g/t) | | 4.13 |
CV | | 1.85 |
Loulo 3
A 1.0 m composite is applied with a minimum sample length of 0.5 m. This creates a maximum sample composite length of 1.5 m and a minimum length of 0.5 m. Over 95% of the composites are at 1.0 m length. This method minimises the impact of residuals and so any remaining residuals of less than 0.5 m in length are reset to an absent value and these samples are subsequently ignored (treated as non-existent). For Loulo 3 estimation dataset, a total of with 338 residuals less than 0.5 m in length had values reset to -999. The resultant composite database samples are presented in Table 14-15.
Table 14-15 Loulo 3 Total Model 1 m Composite Dataset
| | | | | | | | |
| Domain | | MZ 1000 | | SZ 2000 | | SWZ 3000 | | Total |
Number of Points | | 6,036 | | 2,822 | | 407 | | 9,265 |
Min Au Grade (g/t) | | 0.01 | | 0.01 | | 0.01 | | 0.01 |
Uncapped Max Au Grade (g/t) | | 138.87 | | 116.53 | | 98.9 | | 138.87 |
Uncapped Mean Au Grade (g/t) | | 2.77 | | 4.02 | | 3.24 | | 3.13 |
CV | | 2.31 | | 2.49 | | 2.28 | | 2.43 |
Baboto
A 1.0 m composite is applied with a 0.5 minimum sample length. This creates a maximum sample composite length of 1.5 m and a minimum length of 0.5 m but retains >95% of the composites at 1.0 m length. This method minimises the impact of residuals and so any remaining residuals of less than 0.5 m in length are reset to an absent value and these samples are subsequently ignored (treated as non-existent). The resultant composite database samples are tabulated in Table 14-16.
| | |
| 18th September 2018 | | Page 135 |
| | | | |
| | Loulo-Gounkoto Gold Mine Complex NI 43-101 Technical Report | | |
Table 14-16 Baboto South and Centre 1 m Composite Dataset
| | | | | | | | | | |
| Domain | | 1001 | | 1002 | | 1003 | | 1004 | | 2001 |
Number of Points | | 24,871 | | 1,938 | | 2,202 | | 106 | | 3,325 |
Min Au Grade (g/t) | | 0.005 | | 0.005 | | 0.005 | | 0.005 | | 0.005 |
Uncapped Max Au Grade (g/t) | | 45 | | 45 | | 45 | | 31 | | 11.56 |
Uncapped Mean Au Grade (g/t) | | 1.97 | | 1.53 | | 1.71 | | 1.36 | | 0.97 |
CV | | 1.77 | | 1.82 | | 2.31 | | 2.79 | | 1.73 |
Gara West
A 1.0 m composite is applied with a 0.5 minimum sample length. This creates a maximum sample composite length of 1.5 m and a minimum length of 0.5 m but retains >95% of the composites at 1.0 m length. This method minimises the impact of residuals and so any remaining residuals of less than 0.5 m in length are reset to an absent value and these samples are subsequently ignored (treated as non-existent). The resultant composite database samples are tabulated in Table 14-17.
Table 14-17 Gara West Total Model 1 m Composite Dataset
| | | | | | | | | | |
| Domain | | 1000 | | 2000 | | 3000 | | 4000 | | Total |
Number of Points | | 57 | | 552 | | 504 | | 385 | | 1,498 |
Min Au Grade (g/t) | | 0.04 | | 0.01 | | 0.01 | | 0.01 | | 0.01 |
Uncapped Max Au Grade (g/t) | | 6.67 | | 83.33 | | 38.88 | | 23.60 | | 83.33 |
Uncapped Mean Au Grade (g/t) | | 1.37 | | 3.01 | | 2.18 | | 1.84 | | 2.37 |
CV | | 1.03 | | 2.41 | | 1.61 | | 1.73 | | 2.18 |
Gounkoto
Gounkoto
A 2.0 m composite with a minimum 1.0 m composite length was applied to the Gounkoto data. This resulted in a maximum composite sample length of 3.0 m and a minimum of 1.5 m. Table 14-18 outlines the data checks undertaken to ensure that the compositing process does not result in grade bias. The contained metal for the total raw interval data and composite data match closely.
Composite samples below one metre in length are removed from the composite table. Residual analysis was undertaken to ensure that this did not significantly impact the grades. Overall the proportion of the residuals sample within the domains is 4% which is deemed acceptable.
| | |
| 18th September 2018 | | Page 136 |
| | | | |
| | Loulo-Gounkoto Gold Mine Complex NI 43-101 Technical Report | | |
Table 14-18 Gounkoto 2 m Compositing Data
| | | | | | | | | | | | |
| Domain | | Raw Data | | 2 m Composite Data | | % Difference |
| | Total Interval
(m) | | Length x Grade
(gm) | | Total Interval
(m) | | Length x Grade
(gm) | | Total
Interval | | Metal
Content |
1001 | | 53,888 | | 253,235 | | 53,887 | | 253,233 | | 0 | | -2 |
1002 | | 8,419 | | 54,406 | | 8,419 | | 54,379 | | 0 | | -27 |
10022 | | 104 | | 555 | | 104 | | 555 | | 0 | | 0 |
10023 | | 40 | | 87 | | 40 | | 87 | | 0 | | 0 |
1003 | | 13,402 | | 55,468 | | 13,399 | | 55,467 | | -3 | | -1 |
10032 | | 397 | | 366 | | 397 | | 366 | | 0 | | 0 |
1004 | | 2,671 | | 8,762 | | 2,671 | | 8,762 | | 0 | | 0 |
10042 | | 93 | | 141 | | 93 | | 141 | | 0 | | 0 |
1005 | | 2,946 | | 4,162 | | 2,944 | | 4,157 | | -2 | | -5 |
10051 | | 3,919 | | 5,506 | | 3,919 | | 5,506 | | 0 | | 0 |
10052 | | 404 | | 262 | | 404 | | 262 | | 0 | | 0 |
1006 | | 3,589 | | 8,590 | | 3,589 | | 8,590 | | 0 | | 0 |
1007 | | 1,101 | | 1,720 | | 1,101 | | 1,720 | | 0 | | 0 |
1008 | | 16 | | 37 | | 16 | | 37 | | 0 | | 0 |
1009 | | 6 | | 15 | | 6 | | 15 | | 0 | | 0 |
2001 | | 13,636 | | 19,932 | | 13,636 | | 19,932 | | 0 | | 0 |
2002 | | 166 | | 250 | | 166 | | 250 | | 0 | | 0 |
2003 | | 391 | | 328 | | 391 | | 328 | | 0 | | 0 |
2004 | | 246 | | 532 | | 246 | | 532 | | 0 | | 0 |
3001 | | 1,688 | | 2,990 | | 1,688 | | 2,990 | | 0 | | 0 |
3002 | | 288 | | 377 | | 288 | | 377 | | 0 | | 0 |
3003 | | 5,080 | | 14,120 | | 5,079 | | 14,120 | | -1 | | 0 |
3004 | | 1,699 | | 5,015 | | 1,697 | | 5,015 | | -2 | | 0 |
3005 | | 245 | | 282 | | 245 | | 282 | | 0 | | 0 |
3006 | | 24 | | 47 | | 24 | | 47 | | 0 | | 0 |
3007 | | 169 | | 266 | | 169 | | 266 | | 0 | | 0 |
3008 | | 35 | | 120 | | 35 | | 120 | | 0 | | 0 |
3009 | | 34 | | 44 | | 34 | | 44 | | 0 | | 0 |
3010 | | 33 | | 27 | | 33 | | 27 | | 0 | | 0 |
3011 | | 65 | | 132 | | 65 | | 132 | | 0 | | 0 |
4001 | | 68 | | 63 | | 68 | | 63 | | 0 | | 0 |
4002 | | 50 | | 64 | | 50 | | 64 | | 0 | | 0 |
4003 | | 95 | | 144 | | 95 | | 144 | | 0 | | 0 |
4004 | | 134 | | 191 | | 134 | | 191 | | 0 | | 0 |
4005 | | 145 | | 166 | | 145 | | 166 | | 0 | | 0 |
Waste | | 260,532 | | 42,402 | | 260,540 | | 42,439 | | 8 | | 37 |
Total | | 375,814 | | 480,805 | | 375,814 | | 480,808 | | 0 | | 2 |
Faraba
At Faraba 1.0 m composites were chosen as this is the same as the raw sample interval (RC drilling), therefore more than 80% of the samples already have a 1.0 m length. When compositing to 2.0 m, more than half of the data points were reduced. Table 14-19 illustrates differences in samples and mean grade.
Table 14-19 Faraba Composite Sample Analysis
| | | | | | | | | | |
| Description | | Raw | | 1 m
Composites | | 2 m
Composites | | 1 m Mean
Diff (%) | | 2 m Mean
Diff (%) |
Count | | 2658 | | 2545 | | 1303 | | -4% | | -51% |
Length Weighted Mean | | 1.54 | | 1.54 | | 1.54 | | 0% | | 0% |
CV | | 2.19 | | 2.05 | | 1.65 | | -6% | | -25% |
| | |
| 18th September 2018 | | Page 137 |
| | | | |
| | Loulo-Gounkoto Gold Mine Complex NI 43-101 Technical Report | | |
| 14.8 | Treatment of High Grades (Top Cutting) |
Multifactor data analysis was completed on each separate geological domain with the aim of identifying any grade outliers and choose an optimum top cap value for each of the orientation domains. The multifactor analysis tools applied to this are:
| | · | | Disintegration analysis. |
| | · | | Mean and CV curve to look for the stability point. |
Loulo
Yalea
The top cap analysis results for Yalea are in Table 14-20. Domains 9002 and 9003 were not top capped as no outliers were identified. Another constraint was put in place to limit high value outliers with the ‘Purple Patch’ (domain 9006) which was enforced during the estimation process based on the next significant disintegration. An example of the histograms and log probability plots for Yalea domain 9001 is presented in Figure 14-12.
Table 14-20 Yalea Top Cutting Values Applied to Composites
| | | | | | | | | | | | | | | | |
| Data Source | | Domain | | Top
Cap
(g/t) | | Raw
Mean
Grade
(g/t) | | Capped
Mean Grade
(g/t) | | Mean
Decrease | | Raw
CV | | Capped
CV | | CV
Decrease |
Yalea Underground | | 9001 | | 70 | | 4.61 | | 4.59 | | 0.43% | | 1.46 | | 1.36 | | 6.85% |
| | 9002 | | No Top Cap Applied |
| | 9003 | | No Top Cap Applied |
| | 9004 | | 65 | | 4.10 | | 4.00 | | 2.44% | | 1.81 | | 1.57 | | 13.26% |
| | 9005 | | 80 | | 3.60 | | 3.58 | | 0.56% | | 1.95 | | 1.85 | | 5.13% |
| | 9006 | | 60 | | 9.44 | | 9.37 | | 0.74% | | 0.93 | | 0.88 | | 5.38% |
| | |
| 18th September 2018 | | Page 138 |
| | | | |
| | Loulo-Gounkoto Gold Mine Complex NI 43-101 Technical Report | | |
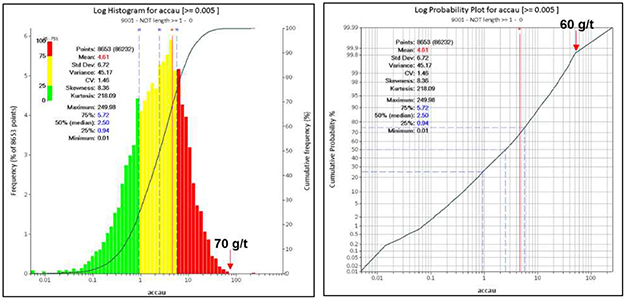
Figure 14-12 Yalea 9001 Grade Distribution (Left: Log Histogram & Right: Log Probability)
Gara
A high-grade top cap has been applied to all geological domains at 70.18 g/t Au with the exception of some of the domains mentioned below in Table 14-21. This transforms the distribution to a lognormal distribution with a good skewness and CV appropriate for ordinary kriging.
Table 14-21 Gara Top Cutting Values Applied to Composites
| | | | | | | | | | | | | | | | |
| Data Source | | Domain | | Top Cap (g/t) | | Raw Mean Grade (g/t) | | Capped Mean Grade (g/t) | | Mean Decrease | | Raw CV | | Capped CV | | CV Decrease |
Gara Underground | | 3000 4000 5000 6000 7000 8000 8400 8900 9000 9400 10000 | | 70.18 | | 3.75 | | 3.72 | | 0.99% | | 1.76 | | 1.54 | | 12.53% |
Gara Far South and Gara Far South Extension | | 9600 9605 4600 4605 | | 23.00 | | 5.15 | | 4.66 | | 9.47% | | 1.57 | | 1.12 | | 28.67% |
Gara OP | | 7400 7600 7605 | | 20.00 | | 2.85 | | 2.71 | | 4.85% | | 1.58 | | 1.37 | | 13.32% |
Loulo 3
Loulo 3 contains 3 discrete domains; the main zone striking 020°, which is cross cut by two subparallel pods of mineralisation on a left-hand jog which are the southern zone and the SW zone. In addition, a NNE trending, sub-vertical mafic intrusive (5 m to 7 m thick) has intruded along a late fault which separates and offsets the southern zone and the SW zones.
Due to the cross-cutting relationships and the implications on relative timing the grade distribution of each domain is assessed independently to identify if any high-grade outliers that are not spatially correlated exist and as such top caps are applied as detailed in Table 14-22.
| | |
| 18th September 2018 | | Page 139 |
| | | | |
| | Loulo-Gounkoto Gold Mine Complex NI 43-101 Technical Report | | |
Table 14-22 Loulo Top Cutting Values Applied to Composites
| | | | | | | | | | | | | | | | |
Data Source | | Domain | | Top Cap (g/t) | | Raw Mean Grade (g/t) | | Capped Mean Grade (g/t) | | Mean Decrease | | Raw CV | | Capped CV | | CV Decrease |
Main Zone | | 1000 | | 64.00 | | 2.77 | | 2.74 | | 1.08% | | 2.31 | | 2.22 | | 3.90% |
South Zone | | 2000 | | 75.19 | | 4.02 | | 3.94 | | 1.99% | | 2.49 | | 2.36 | | 5.22% |
South West Zone | | 3000 | | 45.50 | | 3.24 | | 3.14 | | 3.09% | | 2.28 | | 2.07 | | 9.21% |
Baboto
Baboto contains two geographically separate zones: Baboto South, and Baboto Centre. The Baboto dataset is heavily clustered in the Centre areas due to the influence of grade control drilling, however, the Baboto South the declustering is negligible. Consequently, a cell declustering of 15 m by 20 m by 15 m is applied to the Baboto Centre estimation domains and combined with top cutting, results in a decrease in mean grade.
Due to the cross-cutting relationships and the implications on relative timing the grade distribution of each domain is assessed independently to identify if any high-grade outliers that are not spatially correlated exist and as such top caps are applied as detailed in the Table 14-23.
Table 14-23 Baboto Top Cutting Values Applied to Composites
| | | | | | | | | | | | | | | | |
| Data Source | | Domain | | Top Cap (g/t) | | Raw Mean Grade (g/t) | | Capped Mean Grade (g/t) | | Mean Decrease | | Raw CV | | Capped CV | | CV Decrease |
Baboto South | | 1001 | | 45.00 | | 2.02 | | 1.97 | | 2.48% | | 2.39 | | 1.77 | | 25.94% |
| | 1002 | | 45.00 | | 1.58 | | 1.53 | | 3.16% | | 2.40 | | 1.82 | | 24.17% |
| | 1003 | | 45.00 | | 2.00 | | 1.71 | | 14.50% | | 5.57 | | 2.31 | | 58.53% |
| | 1004 | | 45.00 | | 1.99 | | 1.99 | | 0.00% | | 2.711 | | 2.711 | | 0.00% |
Baboto Central | | 2001 | | 11.56 | | 1.05 | | 0.97 | | 7.62% | | 2.29 | | 1.73 | | 24.45% |
Gara West
Gara West contains four discrete lodes all striking 020° and west dipping (50° to 70°) with small to moderate changes of direction and dip. However, there is not a clear folding within the lodes. Due to the physical separation, for each of the lodes the grade distribution is assessed independently. The top caps are applied as detailed in Table 14-24.
Table 14-24 Gara West Top Cutting Values Applied to Composites
| | | | | | | | | | | | | | | | |
Data Source | | Domain | | Top Cap (g/t) | | Raw Mean Grade (g/t) | | Capped Mean Grade (g/t) | | Mean Decrease | | Raw CV | | Capped CV | | CV Decrease |
Gara West | | 10000 | | 45.00 | | 1.60 | | 1.60 | | 0.00% | | 1.09 | | 1.09 | | 0.00% |
| | 20000 | | 45.00 | | 3.00 | | 2.81 | | 6.33% | | 2.31 | | 1.87 | | 19.05% |
| | 30000 | | 45.00 | | 2.07 | | 2.05 | | 0.97% | | 1.63 | | 1.55 | | 4.91% |
| | 40000 | | 45.00 | | 1.96 | | 1.94 | | 1.02% | | 1.64 | | 1.6 | | 2.44% |
| | |
| 18th September 2018 | | Page 140 |
| | | | |
| | Loulo-Gounkoto Gold Mine Complex NI 43-101 Technical Report | | |
Gounkoto
Due to the structural complexity which controls the 3D geometry and the data distribution, the Gounkoto deposit has been split into 47 orientation domains within the mineralisation wireframe, including one waste domain which is not constrained by a boundary.
In total 19 estimation domains were top-cut at values between 1.73 g/t Au and 87.5 g/t Au, while a high restriction has been applied in 28 estimation domains (Table 14-25).
Table 14-25 Gounkoto Top Cutting
| | | | | | | | |
Block Model Domain Code | | Estimation
Domain
Code | | Estimation Domain Name | | Top Cut Grade (g/t Au) | | HG Constraint (g/t Au) |
1001 | | 1 | | MZ1 East dipping (domain1) | | - | | 3.42 |
| | 2 | | MZ1 East dipping (domain2) | | - | | 96.43 |
| | 6 | | MZ1 Central west dipping (domain6) | | - | | 129.00 |
| | 9 | | MZ1 Central west dipping (domain9) | | - | | 5.00 |
| | 3 | | MZ1 west dipping (domain3) | | - | | 70.00 |
| | 4 | | MZ1 East dipping (domain4) | | - | | 70.00 |
| | 5 | | MZ1 East dipping (domain5) | | - | | 37.35 |
1002 | | - | | MZ2 NW OP (above -80RL) | | - | | 59.43 |
| | MZ2 NW UG (below -80RL) | | - | | 42.00 |
10022 | | - | | MZ2 NE | | - | | 32.00 |
10023 | | - | | MZ2NW FW | | - | | 10.11 |
1003 | | 7 | | MZ3 NNW OP | | - | | 79.00 |
| | 7 | | MZ3 NNW UG | | - | | 58.84 |
| | 8 | | MZ3 NNE OP | | | | 25.00 |
| | 8 | | MZ3 NNE UG | | | | 6.66 |
| | 13 | | MZ3 High-Grade Zone | | 87.50 | | - |
10032 | | - | | MZ3 HW | | - | | - |
1004 | | - | | MZ4 | | - | | 43.00 |
10042 | | - | | MZ4 FW | | - | | 3.00 |
1005 | | - | | P64W1 | | - | | 31.00 |
1006 | | - | | P64W2 | | - | | 25.00 |
1007 | | - | | P64W3 | | - | | 14.00 |
1008 | | - | | P64WHW1 | | 2.00 | | - |
1009 | | - | | P64WHW2 | | 1.73 | | - |
10051 | | 10 | | P64E1 south | | - | | 13.00 |
| | 11 | | P64E1 north | | - | | 17.00 |
10052 | | 12 | | P64E2 | | - | | 2.40 |
2001 | | - | | HW1 | | - | | 26.00 |
2002 | | - | | HW2 | | - | | 6.50 |
2003 | | - | | HW3 | | | | 4.65 |
2004 | | - | | HW4 | | | | 8.00 |
3001 | | - | | FWFE1 | | 24.00 | | - |
3002 | | - | | FWFE2 | | 6.00 | | - |
3003 | | - | | FWFE3 | | 36.00 | | - |
3004 | | - | | FWFE4 | | 44.00 | | - |
3005 | | - | | FWFE5 | | 4.00 | | - |
3006 | | - | | FWFE6 | | 2.70 | | - |
3007 | | - | | FWFE7 | | 10.50 | | - |
3008 | | - | | FWFE8 | | 9.00 | | - |
3009 | | - | | FWFE9 | | 3.00 | | - |
3010 | | - | | FWFE10 | | 1.43 | | - |
3011 | | - | | FWFE11 | | 5.00 | | - |
4001 | | - | | FWNE1 | | 3.00 | | - |
4002 | | - | | FWNE2 | | 5.00 | | - |
4003 | | - | | FWNE3 | | 6.50 | | - |
| | |
| 18th September 2018 | | Page 141 |
| | | | |
| | Loulo-Gounkoto Gold Mine Complex NI 43-101 Technical Report | | |
| | | | | | | | |
Block Model Domain Code | | Estimation Domain Code | | Estimation Domain Name | | Top Cut Grade (g/t Au) | | HG Constraint (g/t Au) |
4004 | | - | | FWNE4 | | 9.00 | | - |
4005 | | - | | FWNE5 | | 4.50 | | - |
9999 (Waste) | | - | | Waste (HW/FW) | | - | | 8 |
Faraba
The top cutting applied to the 2016 Faraba resource is presented in Table 14-26. This shows that the three zones were capped at values of 8.65 g/t Au, 13.36 g/t Au, and 20.79 g/t Au.
Table 14-26 Top Cutting Values Applied to Composites
| | | | | | | | | | | | | | | | |
Data
Source | | Domain | | Top Cap (g/t) | | Raw Mean Grade (g/t) | | Capped Mean Grade (g/t) | | Mean Decrease | | Raw CV | | Capped CV | | CV Decrease |
Faraba | | MZ (1000) | | 20.79 | | 1.67 | | 1.61 | | 3.59% | | 2.02 | | 1.72 | | 14.85% |
| | HW (2000) | | 13.36 | | 0.80 | | 0.76 | | 5.00% | | 2.63 | | 2.31 | | 12.17% |
| | FW (3000) | | 8.65 | | 0.86 | | 0.81 | | 5.81% | | 2.03 | | 1.59 | | 21.67% |
Exploratory data analysis (EDA) and variography was conducted by Randgold using Snowden Supervisor v8 statistical software on declustered data. The declustered composites are used for spatial analysis and as well to compare with block grade, during the validation process.
Variography was used to analyse the spatial continuity and relation within each of the main domains to determine appropriate search strategies and estimation. The variogram modelling process followed involved the following steps:
| | · | | A normal score transform was applied to all data prior to undertaking variography on the two metre, top capped, declustered composite dataset; |
| | · | | Calculate and model the omni-directional or down hole variogram to characterise the nugget effect; |
| | · | | Systematically calculate orientated variogram in three dimensions to identify the plane of greatest continuity; |
| | · | | Calculate a variogram fan within the plane of greatest continuity to identify the direction of maximum continuity within this plane. |
| | · | | Model experimental variogram in the direction of maximum continuity and the orthogonal directions. |
| | · | | Apply a back transform to all variogram models to obtain the appropriate variogram models for interpolation of raw composite data. |
Where an individual domain has insufficient samples to undertake variography, the variography parameters from a comparative domain with a similar trend was used and the orientation adjusted to match the domain with insufficient data.
| | |
| 18th September 2018 | | Page 142 |
| | | | |
| | Loulo-Gounkoto Gold Mine Complex NI 43-101 Technical Report | | |
Variogram Validation
Prior to interpolation runs, each semi-variogram model is cross validated to ensure that any bias in estimated grades compared to the actual sample grades are minimal. This was checked by estimating a grade value at each composite sample point, which ignored said sample point. The resulting grade is compared to the actual sample grade in the same location and is plotted on a scatter plot to establish a possible trend or bias and relative standard error. In most cases, there is level of smoothing in an estimated grade compared to the actual sample grade, but overall, estimated grades and sample grades match well and conditional bias is minimal.
Loulo
Yalea
The total Yalea solid is comprised of seven separated solids that are split into the South, North, P125 Zones, and a high-grade domain referred to as the ‘Purple Patch’ (PP). Cell declustering was completed on the data for some domains prior to the variogram modelling.
Within all the domains from Yalea relative nugget effects ranged between 15% and 25% indicating a relatively low to moderate grade variability. There has been little change from the previous model, except for a small plunge change in Yalea South where it was previously flat. Figure 14-13 illustrates an example of the Yalea South variogram model and back transformed model.
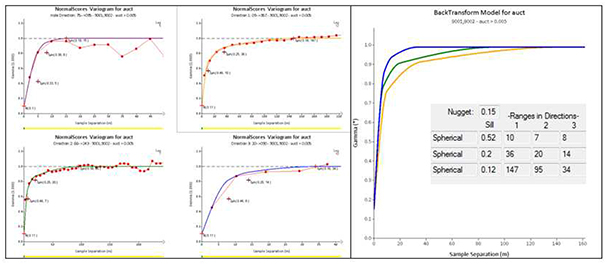
Figure 14-13 Yalea South Variogram Including 9001 and 9002 Domains
| | |
| 18th September 2018 | | Page 143 |
| | | | |
| | Loulo-Gounkoto Gold Mine Complex NI 43-101 Technical Report | | |
Gara
Gara does not contain any discrete domains which are separated due to differences in the geological characteristics or due to the grade distribution. The only domain splits that are applied to Gara are to account for data density and different physical orientations (changes in dip and strike). Consequently, all data density and orientation domains use soft boundaries for estimation purposes. Cell declustering was completed on the data for some domains prior to the variogram modelling.
Due to the complexity of the folding and subsequent impact on the spatial continuity, the variogram model is based exclusively on data from the orientation sub-domain 3000, which is the largest single monoclonal limb domains and contains over 50% of the total data.
The 3000 domain variogram was modelled (Figure 14-14), and the results re-orientated and applied to the rest of the geological domains.
Figure 14-14 Gara Variogram for the 3000 Domain which was Applied to All Domains with the Bearing, Plunge and Dip Changing Based on Domain Orientation
The nugget for Gara is 36% which is typical for a veining and complex folding deposit such as Gara.
| | |
| 18th September 2018 | | Page 144 |
| | | | |
| | Loulo-Gounkoto Gold Mine Complex NI 43-101 Technical Report | | |
Loulo 3
Due to the cross-cutting relationships and the implications on relative timing, individual variogram models are derived for each of the geological domains. Cell declustering was completed on the data for some domains prior to the variogram modelling. The Main Zone and South Zone in Loulo 3 have nugget effects ranging between 11% and 26%, indicating a relatively low to moderate of grade variability. An example of MZ2 domain variogram model and back transformed model are presented in Figure 14-15 and Figure 14-16.
The FW Zone variogram has quite a high nugget effect of 35% which in conjunction with a relatively high CV indicates that there are potentially mixed populations in the grade distribution. Therefore, further geological sub-domaining may be required within future updates if justified by geological modelling or by added data.
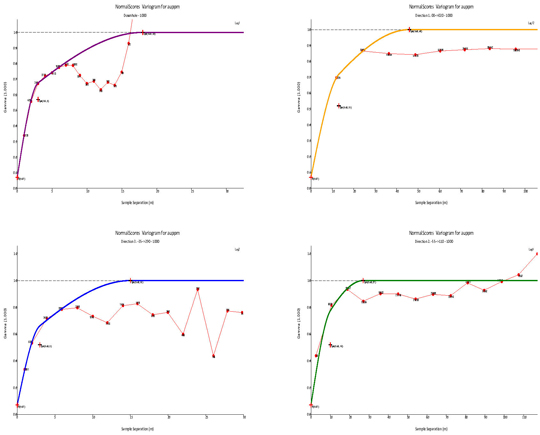
Figure 14-15 Loulo 3 Main Zone 2 Individual Structure Normal Score Variogram Models
| | |
| 18th September 2018 | | Page 145 |
| | | | |
| | Loulo-Gounkoto Gold Mine Complex NI 43-101 Technical Report | | |
Figure 14-16 Loulo 3 Main Zone 2 Nested Back Transformed Variogram Model
Baboto
Due to the cross-cutting relationships and the implications on relative timing the grade distribution individual variogram models are derived for Baboto Centre and Baboto South. Cell declustering was completed on the data for some domains prior to the variogram modelling. Baboto Centre has a nugget effects ranging of 17% indicating a relatively low to moderate of grade variability. Figure 14-17 and Figure 14-18 illustrate the variogram model and back transformed model for Baboto South.
| | |
| 18th September 2018 | | Page 146 |
| | | | |
| | Loulo-Gounkoto Gold Mine Complex NI 43-101 Technical Report | | |
Figure 14-17 Baboto South Variogram
Figure 14-18 Baboto South 2017 Nested Back Transformed Variogram Model
| | |
| 18th September 2018 | | Page 147 |
| | | | |
| | Loulo-Gounkoto Gold Mine Complex NI 43-101 Technical Report | | |
Gara West
The total combined data variogram continuity range is around 37 m where as for the other individual domains the maximum continuity is above 50 m, indicating that for Gara West individual variograms per lode give better continuity to the estimate instead of mixing all data. Cell declustering was completed on the data for some domains prior to the variogram modelling.
Consequently, individual variogram models are derived for domains 20000, 30000 and 40000. However, due to the low number of samples within domain 10000, robust variogram models could not be constructed. Consequently, the variography from all data combined is applied to domain 10000.
An example of the Gara West domain 20000 variogram model and back transformed model are presented in Figure 14-19 and Figure 14-20.
Figure 14-19 Gara West Domain 20000 Individual Structure Normal Score Variogram Models
| | |
| 18th September 2018 | | Page 148 |
| | | | |
| | Loulo-Gounkoto Gold Mine Complex NI 43-101 Technical Report | | |

Figure 14-20 Gara West Domain 20000 Nested Back Transformed Variogram Model
Gounkoto
Nine orientation domains (MZ1 east dipping, MZ1 west dipping, MZ1 central west dipping, MZ2NW, MZ3, MZ4, P64W1, P64W2 and HW1) were selected for variography studies. Cell declustering was completed on the data for some domains prior to the variogram modelling.
Where some domains lacked sufficient data points to support variogram modelling, variography parameters of similar (geologically and spatially) domains were applied. Due to the positively skewed data distribution, a normal score variogram has been chosen to reduce the impact of the extreme outliers and to have a robust back-transformation for estimation.
The directional variogram has been calculated using a normal score transformation on the data. An example of the analysis of the gold grades modelled semi-variograms and resulting estimation input parameters for MZ1 east dipping are summarised in Figure 14-21 and Figure 14-22.
| | |
| 18th September 2018 | | Page 149 |
| | | | |
| | Loulo-Gounkoto Gold Mine Complex NI 43-101 Technical Report | | |
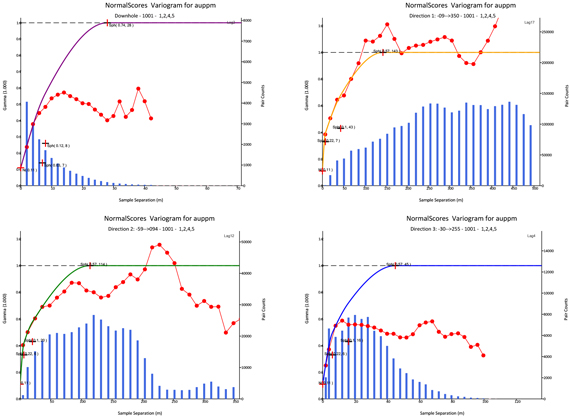
Figure 14-21 Modelled Semi-Variograms for Gounkoto MZ1 Domain 1000 (East Dipping)
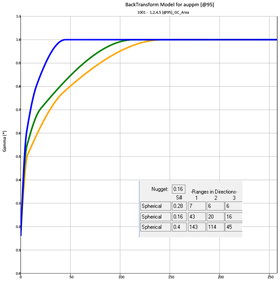
Figure 14-22 Gounkoto MZ1 Domain 1000 Nested Back Transformed Variogram Model
| | |
| 18th September 2018 | | Page 150 |
| | | | |
| | Loulo-Gounkoto Gold Mine Complex NI 43-101 Technical Report | | |
Faraba
At Faraba, as at Gounkoto, the data is positively skewed, therefore a normal score variogram has been chosen to reduce the impact of the extreme outliers and to have a robust back-transformation for estimation. An example of the Faraba domain 1000 variogram model and back transformed model are presented in (Figure 14-23 and Figure 14-24).
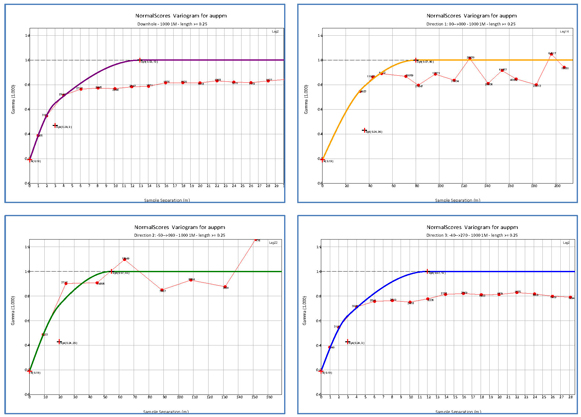
Figure 14-23 Faraba Domain 1000 Modelled Semi-Variograms
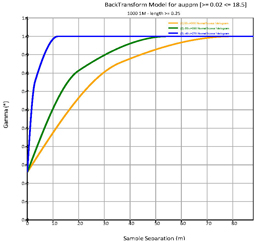
Figure 14-24 Faraba Domain 1000 Nested Back Transformed Variogram Model
| | |
| 18th September 2018 | | Page 151 |
| | | | |
| | Loulo-Gounkoto Gold Mine Complex NI 43-101 Technical Report | | |
| 14.10 | Block Model Estimation and Quantitative Kriging Neighbourhood Analysis |
All models are sub-domained by data density such that shorter search ranges could be achieved within the grade control sub-domains. Thus, smaller more localised searches could be applied to the estimation of the grade control domains relative to wider space exploration domains.
When selecting the appropriate block size consideration is given for selectivity during mine design and planning relative to the geology, spatial variability and drill spacing. The Mineral Resources are generated with the multiple block size using different sub sizes.
Each estimation domain has been attributed its own estimation parameters defined from a set of quantitative kriging neighbourhood analysis (QKNA). The QKNA is utilised to optimise the block size, search ranges, sample numbers and discretisation. Optimisations look at Kriging Efficiency (KE) and Slope of Regression (SR) to minimise negative kriging weights.
Figure 14-25 illustrates an example of the QKNA analysis results for Gounkoto MZ1 East Dipping Grade Control Area. The quantitative kriging neighbourhood analysis (QKNA) has been completed in each variogram domain with the first pass of estimation.
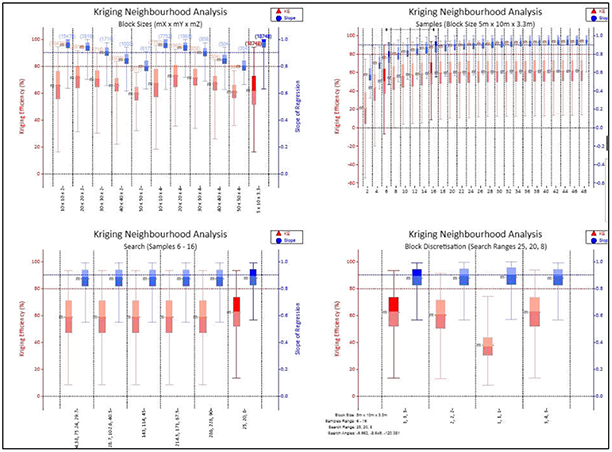
Figure 14-25 QKNA Results for Gounkoto MZ1 East Dipping Grade Control Area
| | |
| 18th September 2018 | | Page 152 |
| | | | |
| | Loulo-Gounkoto Gold Mine Complex NI 43-101 Technical Report | | |
Loulo
Yalea
In Yalea there are three different areas with different drill hole density. There is a grade control area (average drilling spacing 10 m to 30 m), an advanced grade control area (average drilling spacing 30 m to 80 m) and an exploration area (greater than 80 m). The block size was selected considering the size and shape of the mineralisation, the mining selectivity, the spacing of the drilling grid, and an optimisation exercise using each variogram domain.
The same exercise was applied to optimise the sample number where the minimum and maximum samples were selected based on the drilling spacing in the domain and the stability of the result (KE and SR).
Table 14-27 summarises the parameters from QKNA for Yalea grade control, advance grade control and exploration domains. The block model name for Yalea is “20171020_yalea_uggc_model.bmf” and is a sub cell model generated from Vulcan.
| | |
| 18th September 2018 | | Page 153 |
| | | | |
| | Loulo-Gounkoto Gold Mine Complex NI 43-101 Technical Report | | |
Table14-27 QKNA Parameters from Yalea
| | | | | | | | | | | | | | | | | | | | | | | | |
| Domain | | Block Size (m) | | Run | | Search Radius (m) | | No. Samples | | Discretisation |
| | X | | Y | | Z | | Y | | X | | Z | | Min | | Max | | X | | Y | | Z |
9103 | | 5 | | 15 | | 10 | | 1 | | 45 | | 21 | | 6 | | 8 | | 16 | | 3 | | 5 | | 4 |
| | 2 | | 90 | | 42 | | 12 | | 6 | | 14 |
| | 3 | | 180 | | 84 | | 24 | | 4 | | 10 |
| | 4 | | 360 | | 168 | | 48 | | 4 | | 10 |
9104 | | 5 | | 15 | | 10 | | 1 | | 45 | | 21 | | 6 | | 8 | | 16 | | 3 | | 5 | | 4 |
| | 2 | | 90 | | 42 | | 12 | | 6 | | 14 |
| | 3 | | 180 | | 84 | | 24 | | 4 | | 12 |
| | 4 | | 360 | | 168 | | 48 | | 4 | | 10 |
9204 | | 8 | | 24 | | 16 | | 1 | | 90 | | 42 | | 12 | | 12 | | 24 | | 3 | | 5 | | 4 |
| | 2 | | 180 | | 84 | | 24 | | 10 | | 20 |
| | 3 | | 360 | | 168 | | 48 | | 8 | | 18 |
| | 4 | | 720 | | 336 | | 96 | | 8 | | 16 |
9146 | | 5 | | 15 | | 10 | | 1 | | 45 | | 21 | | 6 | | 6 | | 18 | | 3 | | 5 | | 4 |
| | 2 | | 90 | | 42 | | 12 | | 4 | | 16 |
| | 3 | | 180 | | 84 | | 24 | | 4 | | 14 |
| | 4 | | 360 | | 168 | | 48 | | 4 | | 14 |
9101 | | 5 | | 15 | | 10 | | 1 | | 74 | | 20 | | 7 | | 8 | | 16 | | 3 | | 5 | | 4 |
| | 2 | | 147 | | 40 | | 14 | | 6 | | 14 |
| | 3 | | 294 | | 80 | | 28 | | 4 | | 12 |
9201 | | 8 | | 24 | | 16 | | 1 | | 147 | | 40 | | 14 | | 8 | | 16 | | 3 | | 5 | | 4 |
| | 2 | | 294 | | 80 | | 28 | | 6 | | 14 |
| | 3 | | 588 | | 160 | | 56 | | 4 | | 12 |
| | 4 | | 117 | | 320 | | 112 | | 4 | | 10 |
9301 | | 10 | | 30 | | 20 | | 1 | | 147 | | 40 | | 14 | | 8 | | 16 | | 3 | | 5 | | 4 |
| | 2 | | 294 | | 80 | | 28 | | 6 | | 14 |
| | 3 | | 588 | | 160 | | 56 | | 4 | | 10 |
| | 4 | | 117 | | 320 | | 112 | | 4 | | 10 |
9102 | | 5 | | 15 | | 10 | | 1 | | 74 | | 20 | | 7 | | 8 | | 16 | | 3 | | 5 | | 4 |
| | 2 | | 147 | | 40 | | 14 | | 6 | | 14 |
| | 3 | | 294 | | 80 | | 28 | | 4 | | 12 |
9202 | | 8 | | 24 | | 16 | | 1 | | 147 | | 40 | | 14 | | 8 | | 16 | | 3 | | 5 | | 4 |
| | 2 | | 294 | | 80 | | 28 | | 6 | | 14 |
| | 3 | | 588 | | 160 | | 56 | | 4 | | 12 |
9302 | | 10 | | 30 | | 20 | | 1 | | 147 | | 40 | | 14 | | 8 | | 20 | | 3 | | 5 | | 4 |
| | 2 | | 294 | | 80 | | 28 | | 6 | | 18 |
| | 3 | | 588 | | 160 | | 56 | | 6 | | 16 |
| | 4 | | 117 | | 320 | | 112 | | 4 | | 14 |
9005 | | 5 | | 15 | | 10 | | 1 | | 37 | | 9 | | 6 | | 8 | | 18 | | 3 | | 5 | | 4 |
| | 2 | | 56 | | 14 | | 9 | | 8 | | 16 |
| | 3 | | 83 | | 20 | | 14 | | 6 | | 14 |
| | 4 | | 125 | | 30 | | 20 | | 4 | | 12 |
| | 5 | | 187 | | 46 | | 30 | | 4 | | 10 |
| | 6 | | 281 | | 68 | | 46 | | 3 | | 8 |
9106 & 9156 | | 5 | | 15 | | 10 | | 1 | | 45 | | 21 | | 6 | | 8 | | 18 | | 3 | | 5 | | 4 |
| | 2 | | 90 | | 42 | | 12 | | 6 | | 16 |
| | 3 | | 180 | | 84 | | 24 | | 4 | | 14 |
9206 | | 8 | | 24 | | 16 | | 1 | | 75 | | 34 | | 9 | | 12 | | 24 | | 3 | | 5 | | 4 |
| | 2 | | 150 | | 68 | | 18 | | 10 | | 20 |
| | 3 | | 300 | | 136 | | 36 | | 8 | | 18 |
Gara
After the geological domaining, estimations domains have been defined and parameters optimised for each domain and ordinary kriging was used to estimate the blocks.
The Gara block size optimisation was run in domain 3000 where there are two different data density areas as a result of the grade control and exploration areas. Table14-28 details the QKNA results for Gara.
| | |
| 18th September 2018 | | Page 154 |
| | | | |
| | Loulo-Gounkoto Gold Mine Complex NI 43-101 Technical Report | | |
Table14-28 QKNA Parameters from Gara
| | | | | | | | | | | | | | | | | | | | | | | | |
| Domain | | Block Size (m) | | Run | | Search Radius (m) | | No. Samples | | Discretisation |
| | X | | Y | | Z | | Y | | X | | Z | | Min | | Max | | X | | Y | | Z |
OP Grade Control | | 5 | | 20 | | 10 | | 1 | | 32.5 | | 15 | | 10 | | 12 | | 34 | | 2 | | 5 | | 4 |
| | 2 | | 65 | | 29 | | 13 | | 10 | | 26 |
| | 3 | | 130 | | 58 | | 26 | | 8 | | 18 |
UG Grade Control | | 5 | | 20 | | 10 | | 1 | | 65 | | 29 | | 13 | | 16 | | 36 | | 2 | | 5 | | 4 |
| | 2 | | 130 | | 58 | | 26 | | 14 | | 32 |
| | 3 | | 260 | | 126 | | 52 | | 12 | | 28 |
Exploration | | 7.5 | | 30 | | 15 | | 1 | | 120 | | 30 | | 10 | | 16 | | 34 | | 2 | | 5 | | 4 |
| | 2 | | 240 | | 60 | | 20 | | 14 | | 30 |
| | 3 | | 580 | | 120 | | 40 | | 12 | | 26 |
Loulo 3
The block size was optimised using QKNA in both exploration and grade controlsub-domains as shown in Table14-29.
Table14-29 QKNA Parameters from Loulo 3
| | | | | | | | | | | | | | | | | | | | | | | | | | | | |
| Domain | | Block Size (m) | | Run | | Search Radius
(m) | | No.
Samples | | Discretisation | | High-
Grade
Constraint
(g/t) | | Constraint
Search Range
(m) |
| | X | | Y | | Z | | Y | | X | | Z | | Min | | Max | | X | | Y | | Z |
MZ2 GC | | 10 | | 5 | | 5 | | 1 | | 15 | | 10 | | 5 | | 6 | | 15 | | 5 | | 5 | | 5 | | | | |
| | 2 | | 30 | | 20 | | 10 | | 8 | | 15 | | | | |
| | 3 | | 50 | | 30 | | 15 | | 3 | | 20 | | | | |
MZ2 Res | | 20 | | 10 | | 5 | | 1 | | 50 | | 30 | | 15 | | 12 | | 20 | | 5 | | 5 | | 5 | | | | |
| | 2 | | 100 | | 60 | | 30 | | 10 | | 24 | | | | |
| | 3 | | 500 | | 300 | | 150 | | 8 | | 24 | | 12 | | 50 by 50 by 10 |
MZ1 GC | | 10 | | 5 | | 5 | | 1 | | 15 | | 10 | | 5 | | 8 | | 15 | | 5 | | 5 | | 5 | | | | |
| | 2 | | 30 | | 20 | | 10 | | 6 | | 15 | | | | |
| | 3 | | 50 | | 30 | | 15 | | 3 | | 20 | | | | |
MZ1 Res | | 20 | | 10 | | 5 | | 1 | | 50 | | 30 | | 15 | | 12 | | 20 | | 5 | | 5 | | 5 | | | | |
| | 2 | | 100 | | 60 | | 30 | | 10 | | 24 | | | | |
| | 3 | | 500 | | 300 | | 150 | | 8 | | 24 | | 12 | | 30 by 20 by 10 |
FW GC | | 10 | | 5 | | 5 | | 1 | | 15 | | 10 | | 10 | | 12 | | 20 | | 5 | | 5 | | 5 | | | | |
| | 2 | | 40 | | 20 | | 10 | | 10 | | 22 | | | | |
| | 3 | | 80 | | 40 | | 20 | | 8 | | 24 | | | | |
Baboto
The search ellipsoid of Baboto is configured to have the same attitude as the variogram. However, in some areas the dip and bearing change to follow the mineralisation. The bearing and dip are setup in the block model as variables, when the plunge is according to the variogram. Table14-30 details the QKNA parameters for Baboto South GC domains.
Table14-30 QKNA Parameters from Baboto
| | | | | | | | | | | | | | | | | | | | | | | | |
| Domain | | Block Size (m) | | Run | | Search Radius (m) | | No. Samples | | Discretisation |
| | X | | Y | | Z | | Y | | X | | Z | | Min | | Max | | X | | Y | | Z |
Baboto GC | | 3 | | 6 | | 2.5 | | 1 | | 20 | | 18 | | 10 | | 8 | | 16 | | 2 | | 3 | | 2 |
| | 2 | | 40 | | 36 | | 19 | | 6 | | 14 |
| | 3 | | 80 | | 72 | | 38 | | 4 | | 12 |
| | |
| 18th September 2018 | | Page 155 |
| | | | |
| | Loulo-Gounkoto Gold Mine Complex NI 43-101 Technical Report | | |
Gara West
Table14-31 present the QKNA from Gara West.
Table14-31 QKNA Parameters from Gara West
| | | | | | | | | | | | | | | | | | | | | | | | | | | | |
Domain | | Block Size
(m) | | Run | | Search Radius
(m) | | No.
Samples | | Discretisation | | High-Grade Restriction (g/t) | | Restriction |
| | X | | Y | | Z | | Y | | X | | Z | | Min | | Max | | X | | Y | | Z |
10000 | | 20 | | 10 | | 5 | | 1 | | 37 | | 32 | | 7 | | 15 | | 25 | | 5 | | 5 | | 5 | | | | |
| | 2 | | 74 | | 64 | | 14 | | 15 | | 30 | | | | |
| | 3 | | 185 | | 160 | | 35 | | 10 | | 50 | | | | |
20000 | | 20 | | 10 | | 5 | | 1 | | 70 | | 35 | | 5 | | 15 | | 25 | | 5 | | 5 | | 5 | | | | |
| | 2 | | 140 | | 70 | | 10 | | 10 | | 30 | | | | |
| | 3 | | 350 | | 175 | | 25 | | 10 | | 50 | | 8 | | 70 by 35
by 5 |
|
30000 | | 20 | | 10 | | 5 | | 1 | | 53 | | 47 | | 6 | | 15 | | 25 | | 5 | | 5 | | 5 | | | | |
| | 2 | | 106 | | 94 | | 12 | | 15 | | 30 | | | | |
| | 3 | | 265 | | 235 | | 30 | | 10 | | 50 | | 5 | | 53 by 47
by 6 |
|
40000 | | 20 | | 10 | | 5 | | 1 | | 81 | | 32 | | 6 | | 15 | | 25 | | 5 | | 5 | | 5 | | | | |
| | 2 | | 162 | | 64 | | 12 | | 15 | | 30 | | | | |
| | 3 | | 405 | | 160 | | 30 | | 10 | | 50 | | | | |
Gounkoto
The QKNA is used to optimise the block size, number of samples, searches applied and discretisation. Nine orientation domains (MZ1 east dipping, MZ1 west dipping, MZ1 central west dipping, MZ2NW, MZ3, MZ4, P64W1, P64W2 and HW1) were selected for variography studies. A subset of results from QKNA are detailed in Table14-32.
| | |
| 18th September 2018 | | Page 156 |
| | | | |
| | Loulo-Gounkoto Gold Mine Complex NI 43-101 Technical Report | | |
Table14-32 QKNA & Kriging Parameters for Gounkoto
| | | | | | | | | | | | | | | | | | | | | | | | | | | | | | | | | | | | | | | | | | | | |
Block Model
Domain/Code | | Estimation
Domain
Code | | Drill
Spacing
Domain | | Block Size (m) | | Run | | Search Radius (m) | | No.
Samples | | Discretisation | | High-Grade
Constraint
(g/t) | | Constraint Search Range (m) | | Firm Boundary Range Boundary D2/D3/D6 | | Comment |
| | X | | Y | | Z | | Y | | X | | Z | | Min | | Max | | X | | Y | | Z | | Y | | X | | Z | | Y | | X | | Z |
| MZ1 east dipping - 1001 | | 1 | | GC | | 5 | | 10 | | 3.3 | | 1 | | 25 | | 10 | | 8 | | 6 | | 16 | | 3 | | 3 | | 3 | | 3.42 | | 7 | | 6 | | 6 | | 10 | | 8 | | 3 | | 1/3 of
variogram |
| | 2 | | 158 | | 63 | | 50 | | 6 | | 16 | | 3 | | 3 | | 3 | | - | | - | | - |
| | AdvGC | | 7.5 | | 15 | | 4.95 | | 1 | | 50 | | 40 | | 16 | | 8 | | 18 | | 3 | | 3 | | 3 | | 20 | | 16 | | 6 |
| | 2 | | 315 | | 252 | | 101 | | 6 | | 16 | | 3 | | 3 | | 3 | | - | | - | | - |
| | Expl | | 15 | | 30 | | 9.9 | | 1 | | 100 | | 80 | | 31 | | 12 | | 24 | | 3 | | 3 | | 3 | | 40 | | 32 | | 12 |
| | 2 | | 630 | | 504 | | 195 | | 10 | | 22 | | 3 | | 3 | | 3 | | - | | - | | - |
| | 3 | | 945 | | 756 | | 293 | | 8 | | 20 | | 3 | | 3 | | 3 | | - | | - | | - |
| | 2 | | GC | | 5 | | 10 | | 3.3 | | 1 | | 25 | | 10 | | 8 | | 6 | | 16 | | 3 | | 3 | | 3 | | 96.43 | | 7 | | 6 | | 6 | | 10 | | 8 | | 3 | | 1/3 of
variogram |
| | 2 | | 158 | | 63 | | 50 | | 6 | | 16 | | 3 | | 3 | | 3 | | - | | - | | - |
| | AdvGC | | 7.5 | | 15 | | 4.95 | | 1 | | 50 | | 40 | | 16 | | 8 | | 18 | | 3 | | 3 | | 3 | | 20 | | 16 | | 6 |
| | 2 | | 315 | | 252 | | 101 | | 6 | | 16 | | 3 | | 3 | | 3 | | - | | - | | - |
| | Expl | | 15 | | 30 | | 9.9 | | 1 | | 100 | | 80 | | 31 | | 12 | | 24 | | 3 | | 3 | | 3 | | 40 | | 32 | | 12 |
| | 2 | | 630 | | 504 | | 195 | | 10 | | 22 | | 3 | | 3 | | 3 | | - | | - | | - |
| | 3 | | 945 | | 756 | | 293 | | 8 | | 20 | | 3 | | 3 | | 3 | | - | | - | | - |
| | 4 | | GC | | 5 | | 10 | | 3.3 | | 1 | | 25 | | 10 | | 8 | | 6 | | 16 | | 3 | | 3 | | 3 | | 70.00 | | 7 | | 6 | | 6 | | 10 | | 8 | | 3 | | 1/3 of
variogram |
| | 2 | | 158 | | 63 | | 50 | | 6 | | 16 | | 3 | | 3 | | 3 | | - | | - | | - |
| | AdvGC | | 7.5 | | 15 | | 4.95 | | 1 | | 50 | | 40 | | 16 | | 8 | | 18 | | 3 | | 3 | | 3 | | 20 | | 16 | | 6 |
| | 2 | | 315 | | 252 | | 101 | | 6 | | 16 | | 3 | | 3 | | 3 | | - | | - | | - |
| | Expl | | 15 | | 30 | | 9.9 | | 1 | | 100 | | 80 | | 31 | | 12 | | 24 | | 3 | | 3 | | 3 | | 40 | | 32 | | 12 |
| | 2 | | 630 | | 504 | | 195 | | 10 | | 22 | | 3 | | 3 | | 3 | | - | | - | | - |
| | 3 | | 945 | | 756 | | 293 | | 8 | | 20 | | 3 | | 3 | | 3 | | - | | - | | - |
| | 5 | | GC | | 5 | | 10 | | 3.3 | | 1 | | 25 | | 10 | | 8 | | 6 | | 16 | | 3 | | 3 | | 3 | | 37.35 | | 7 | | 6 | | 6 | | 10 | | 8 | | 3 | | 1/3 of
variogram |
| | 2 | | 158 | | 63 | | 50 | | 6 | | 16 | | 3 | | 3 | | 3 | | - | | - | | - |
| | AdvGC | | 7.5 | | 15 | | 4.95 | | 1 | | 50 | | 40 | | 16 | | 8 | | 18 | | 3 | | 3 | | 3 | | 20 | | 16 | | 6 |
| | 2 | | 315 | | 252 | | 101 | | 6 | | 16 | | 3 | | 3 | | 3 | | - | | - | | - |
| | Expl | | 15 | | 30 | | 9.9 | | 1 | | 100 | | 80 | | 31 | | 12 | | 24 | | 3 | | 3 | | 3 | | 40 | | 32 | | 12 |
| | 2 | | 630 | | 504 | | 195 | | 10 | | 22 | | 3 | | 3 | | 3 | | - | | - | | - |
| | 3 | | 945 | | 756 | | 293 | | 8 | | 20 | | 3 | | 3 | | 3 | | - | | - | | - |
MZ1 central west dipping - 1001 | | 6 | | GC | | 5 | | 10 | | 3.3 | | 1 | | 20 | | 17 | | 5 | | 8 | | 16 | | 3 | | 3 | | 3 | | 129.00 | | 6 | | 5 | | 5 | | 8 | | 7 | | 2 | | 1/3 of
variogram |
| | 2 | | 84 | | 71 | | 21 | | 6 | | 14 | | 3 | | 3 | | 3 | | - | | - | | - |
| | AdvGC | | 7.5 | | 15 | | 4.95 | | 1 | | 40 | | 33 | | 10 | | 8 | | 16 | | 3 | | 3 | | 3 | | 16 | | 13 | | 4 |
| | 2 | | 168 | | 139 | | 42 | | 6 | | 14 | | 3 | | 3 | | 3 | | - | | - | | - |
| | Expl | | 15 | | 30 | | 9.9 | | 1 | | 80 | | 67 | | 22 | | 12 | | 24 | | 3 | | 3 | | 3 | | 32 | | 27 | | 8 |
| | 2 | | 336 | | 281 | | 84 | | 10 | | 22 | | 3 | | 3 | | 3 | | - | | - | | - |
| | 3 | | GC | | 5 | | 10 | | 3.3 | | 1 | | 20 | | 13 | | 10 | | 6 | | 14 | | 3 | | 3 | | 3 | | 70.00 | | 7 | | 4 | | 2 | | 8 | | 5 | | 4 | | 1/3 of
variogram |
| | 2 | | 126 | | 82 | | 63 | | 4 | | 12 | | 3 | | 3 | | 3 | | 16 | | 10 | | 8 |
| | 3 | | 504 | | 328 | | 252 | | 2 | | 10 | | 3 | | 3 | | 3 | | 32 | | 20 | | 16 |
| | 4 | | 1008 | | 655 | | 504 | | 2 | | 8 | | 3 | | 3 | | 3 | | 64 | | 40 | | 32 |
| | AdvGC | | 7.5 | | 15 | | 4.95 | | 1 | | 40 | | 26 | | 20 | | 8 | | 18 | | 3 | | 3 | | 3 | | 16 | | 10 | | 8 |
| | 2 | | 252 | | 164 | | 126 | | 6 | | 16 | | 3 | | 3 | | 3 | | 32 | | 10 | | 16 |
| | Expl | | 15 | | 30 | | 9.9 | | 1 | | 80 | | 53 | | 39 | | 8 | | 18 | | 3 | | 3 | | 3 | | - | | - | | - |
| | 2 | | 504 | | 334 | | 246 | | 6 | | 16 | | 3 | | 3 | | 3 | | - | | - | | - |
| | |
| 18th September 2018 | | Page 157 |
| | | | |
| | Loulo-Gounkoto Gold Mine Complex NI 43-101 Technical Report | | |
Faraba
The QKNA has been completed on each variogram domain with the first pass of estimation, this analysis has been conducted to select an optimal estimation parameters with an aim to obtain an estimate grade comparable to the raw grade in term of the distribution and the similarity of the value (Table14-33).
Table14-33 Summary of QKNA for Faraba Domains
| | | | | | | | | | | | | | | | | | | | | | | | | | | | |
| Domain | | Block Size (m) | | Run | | Search Radius (m) | | No. Samples | | Discretisation | | High- Grade Constraint (g/t) | | Constraint Search Range (m) |
| | X | | Y | | Z | | Y | | X | | Z | | Min | | Max | | X | | Y | | Z |
Main Zone (1000) | | 20 | | 20 | | 10 | | 1 | | 80 | | 55 | | 15 | | 24 | | 44 | | 5 | | 5 | | 5 | | | | |
| | 2 | | 160 | | 110 | | 30 | | 22 | | 44 | | 2.7 | | 80 by 55 by 15 |
| | 3 | | 320 | | 220 | | 60 | | 20 | | 44 | | 2.7 | | 80 by 55 by 15 |
Hanging Wall (2000) | | 20 | | 20 | | 10 | | 1 | | 80 | | 55 | | 15 | | 24 | | 44 | | 5 | | 5 | | 5 | | | | |
| | 2 | | 160 | | 110 | | 30 | | 22 | | 44 | | 2.0 | | 80 by 55 by 15 |
| | 3 | | 320 | | 220 | | 60 | | 20 | | 44 | | 2.0 | | 80 by 55 by 15 |
Footwall (3000) | | 20 | | 20 | | 10 | | 1 | | 80 | | 55 | | 15 | | 24 | | 44 | | 5 | | 5 | | 5 | | | | |
| | 2 | | 160 | | 110 | | 30 | | 22 | | 44 | | 2.0 | | 80 by 55 by 15 |
14.11 Block Models
Setup
Table14-34 details the typical block model variables and attributes that were coded to each block model either prior to, or during each interpolation run for OK models. These variables are typical of all the block models created at the Project.
Table14-34 Yalea Block Model Variables
| | | | | | |
| Variables | | Data Type | | Default Value | | Description |
domain | | Integer (Integer * 4) | | 2000 | | 9001=ysth, 9003=ynth, 9006= pp, 9005=p125, 9002=ysth2, 9004=ynth4, 9007=ysth3, 2000=waste, 1000=dyk |
au_ok | | Double (Real * 8) | | 0 | | estimated grade from kriging |
density | | Double (Real * 8) | | 0 | | density |
sr | | Float (Real * 4) | | 0 | | slope of regression |
ns | | Integer (Integer * 4) | | 0 | | number of sample used in estimation |
kv | | Float (Real * 4) | | 0 | | kriging variance |
bv | | Float (Real * 4) | | 0 | | Block variance = average sample variance - block sample variance |
ke | | Float (Real * 4) | | 0 | | Kriging efficiency |
lm | | Float (Real * 4) | | 0 | | Lagrange multiplier |
dist_ans | | Float (Real * 4) | | 0 | | Anisotropic distance to nearest sample |
dist_cat | | Float (Real * 4) | | 0 | | Cartesian distance to closest Sample |
no_hole | | Integer (Integer * 4) | | 0 | | number of holes in estimation |
no_pass | | Integer (Integer * 4) | | 0 | | no of estimation run |
wt_sum | | Float (Real * 4) | | 0 | | Sum of weights |
wt_mean | | Float (Real * 4) | | 0 | | Weight of the mean |
oxidation | | Integer (Integer * 4) | | 0 | | oxidation 0=air 30= fresh 20= transition 10= oxide |
rescat | | Integer (Integer * 4) | | 4 | | resource classification 0=AIR, 1=Measured, 2=Indicated 3=Inferred 4 = unclass |
depletion | | Integer (Integer * 4) | | 0 | | depletion on model 100 = Open Pit depleted 200 = UG |
lith | | Integer (Integer * 4) | | 2000 | | 9000=ore, 2000=fw waste, 2500=hw waste, 1000=dyk, 0=AIR |
redox | | Integer (Integer * 4) | | 0 | | redox front 1= oxidised 2 = reduce |
au_orig | | Float (Real * 4) | | 0 | | original estimated grade before depletion |
mined_date | | Integer (Integer * 4) | | 0 | | mined zone YYMMDD = Year and Month e.g. (121001) |
gd_ans | | Float (Real * 4) | | 0 | | grade of the closest sample (anisotropic) |
gd_cat | | Float (Real * 4) | | 0 | | grade of the closest sample (cartesian) |
| | |
| 18th September 2018 | | Page 158 |
| | | | |
| | Loulo-Gounkoto Gold Mine Complex NI 43-101 Technical Report | | |
| | | | | | |
| Variables | | Data Type | | Default Value | | Description |
nw_sum | | Float (Real * 4) | | 0 | | sum of negative weights |
pw_sum | | Float (Real * 4) | | 0 | | sum of positive weights |
kw_min | | Float (Real * 4) | | 0 | | Minimum Kriging weight |
kw_max | | Float (Real * 4) | | 0 | | Maximum Kriging Weight |
avd_ans | | Float (Real * 4) | | 0 | | average anisotropic distance to sample derived from search ellipsoid |
wvd_ans | | Float (Real * 4) | | 0 | | weighted average anisotropic distance to sample derived from search ellipsoid |
avd_cat | | Float (Real * 4) | | 0 | | cartesian average distance to samples |
wvd_cat | | Float (Real * 4) | | 0 | | weighted cartesian average distance to samples |
flag_ore | | Integer (Integer * 4) | | 0 | | Flag = 1 when block contains ore |
cu_ok | | Double (Real * 8) | | 0 | | estimated cu grade from kriging |
sr_cu | | Double (Real * 8) | | 0 | | slope of regression cu |
ns_cu | | Integer (Integer * 4) | | 0 | | number of cu sample used in estimation |
kv_cu | | Double (Real * 8) | | 0 | | kriging variance |
ke_cu | | Float (Real * 4) | | 0 | | Kriging efficiency |
dist_ans_cu | | Float (Real * 4) | | 0 | | Anisotropic distance to nearest sample |
dist_cat_cu | | Float (Real * 4) | | 0 | | Cartesian distance to closest Sample |
no_hole_cu | | Integer (Integer * 4) | | 0 | | number of holes in cu estimation |
no_pass_cu | | Integer (Integer * 4) | | 0 | | no of estimation run |
gd_ans_cu | | Float (Real * 4) | | 0 | | cu grade of the closest sample (anisotropic) |
gd_cat_cu | | Float (Real * 4) | | 0 | | cu grade of the closest sample (cartesian) |
cu_orig_cu | | Float (Real * 4) | | 0 | | original estimated cu grade before depletion |
nw_sum_cu | | Float (Real * 4) | | 0 | | sum of negative weights |
avd_ans_cu | | Float (Real * 4) | | 0 | | average anisotropic distance to sample derived from search ellipsoid |
wvd_ans_cu | | Float (Real * 4) | | 0 | | weighted average anisotropic distance to sample derived from search ellipsoid |
avd_cat_cu | | Float (Real * 4) | | 0 | | cartesian average distance to samples |
wvd_cat_cu | | Float (Real * 4) | | 0 | | weighted cartesian average distance to samples |
flag_ore_cu | | Float (Real * 4) | | 0 | | Flag = 1 when block contains cu |
ars_ok | | Double (Real * 8) | | 0 | | estimated as grade from kriging |
sr_ars | | Double (Real * 8) | | 0 | | slope of regression ars |
ns_ars | | Integer (Integer * 4) | | 0 | | number of ars sample used in estimation |
kv_ars | | Double (Real * 8) | | 0 | | kriging variance |
ke_ars | | Float (Real * 4) | | 0 | | Kriging efficiency |
dist_ans_ars | | Float (Real * 4) | | 0 | | Anisotropic distance to nearest sample |
dist_cat_ars | | Float (Real * 4) | | 0 | | Cartesian distance to closest Sample |
no_hole_ars | | Integer (Integer * 4) | | 0 | | number of holes in ars estimation |
no_pass_ars | | Integer (Integer * 4) | | 0 | | no of estimation run |
gd_ans_ars | | Float (Real * 4) | | 0 | | ars grade of the closest sample (anisotropic) |
gd_cat_ars | | Float (Real * 4) | | 0 | | ars grade of the closest sample (cartesian) |
cu_orig_ars | | Float (Real * 4) | | 0 | | original estimated cu grade before depletion |
wvd_cat_ars | | Float (Real * 4) | | 0 | | weighted cartesian average distance to samples |
flag_ore_ars | | Float (Real * 4) | | 0 | | Flag = 1 when block contains ars |
nw_sum_ars | | Float (Real * 4) | | 0 | | sum of negative weights |
wvd_ans_ars | | Float (Real * 4) | | 0 | | weighted average anisotropic distance to sample derived from search ellipsoid |
avd_cat_ars | | Float (Real * 4) | | 0 | | cartesian average distance to samples |
avd_ans_rec | | Float (Real * 4) | | 0 | | recovery cartesian anisotropic distance to samples |
wvd_cat_rec | | Float (Real * 4) | | 0 | | weighted cartesian average distance to samples |
avd_cat_rec | | Float (Real * 4) | | 0 | | recovery cartesian average distance to samples |
flag_rec | | Float (Real * 4) | | 0 | | recovery flag |
dist_ans_rec | | Double (Real * 8) | | 0 | | recovery anisotropic distance to nearest sample |
dist_cat_rec | | Double (Real * 8) | | 0 | | recovery Cartesian distance to closest Sample |
no_pass_rec | | Float (Real * 4) | | 1 | | recovery number off estimation run |
gd_ans_rec | | Double (Real * 8) | | 0 | | recovery of the closest sample (anisotropic) |
gd_cat_rec | | Double (Real * 8) | | 0 | | recovery of the closest sample (cartesian) |
no_hole_rec | | Double (Real * 8) | | 0 | | recovery number of hole |
ns_rec | | Double (Real * 8) | | 0 | | recovery number of sample |
recovery | | Double (Real * 8) | | 0 | | process recovery % |
contained_oz | | Double (Real * 8) | | 0 | | Block contained ounces = block volume * density * gold grade |
recoverable_oz | | Double (Real * 8) | | 0 | | Block recoverable ounces = block contained ounces * process recovery |
| | |
| 18th September 2018 | | Page 159 |
| | | | |
| | Loulo-Gounkoto Gold Mine Complex NI 43-101 Technical Report | | |
Loulo
Yalea
Different block sizes are used based on the data density and from that different estimation subdomains were derived.
The GC sub domains refers to the area where the drilling spacing is between 10 m to 30 m i.e. grade control drilled areas. These are labelled using a value of in 100 in the domain code e.g. 9102. The Advanced GC sub domains refer to the area where the drilling spacing is between 30 m to 80 m spacing. This comprises the wider spaced areas which are mainly exploration drilled areas with some underground grade control area. These are labelled with a value of a 200 in the domain code. e.g. 9202.
The exploration sub domains are exploration areas with drill spacing greater than 80 m which is either classified as Inferred or unclassified. These sub domains are coded with a 300 in the domain code e.g. 9302.The broad drill hole density classifications are then further split into the estimation domains based upon a combination of geological, orientation and drill spacing sub domains (Figure14-26).
The Yalea block model name is “20171020_yalea_uggc_model.bmf” and is a sub cell model generated from Vulcan. The block model extents variables are presented in Table14-35. Table14-36 outlines the Yalea search orientations andsub-domain nomenclature.
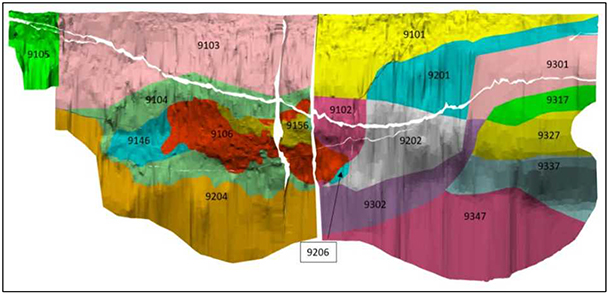
Figure14-26 Yalea 2017 Drill hole Density Sub Domains
| | |
| 18th September 2018 | | Page 160 |
| | | | |
| | Loulo-Gounkoto Gold Mine Complex NI 43-101 Technical Report | | |
Table14-35 Yalea Block Model Extents
| | | | | | | | |
| Block Extents | | Easting(X) | | Northing(Y) | | Elevation(Z) |
Minimum Coordinates | | 240160 | | 1440320 | | -1000 |
Maximum Coordinates | | 241110 | | 1443590 | | 240 |
Parent Block Size (m) | | 10 | | 30 | | 20 |
Sub Cell Size (m) | | 0.5 | | 1.5 | | 1 |
GC Domain Block Size (m) | | 5 | | 15 | | 10 |
Adv GC Domain Block Size (m) | | 8 | | 24 | | 16 |
Rotation | | Bearing (°) | | 90 |
| | Plunge (°) | | 0 |
| | Dip (°) | | 0 |
Table14-36 Yalea Estimation Domain Orientation
| | | | | | | | | | |
| Geological Domain | | Estimation Domains | | Domain | | Domain Orientation |
| | Bearing (°) | | Plunge (°) | | Dip (°) |
9001 (Yalea South) | | 9101 | | GC | | 357 | | 9 | | 117 |
| | 9201 | | AdvGC | | 357 | | 9 | | 117 |
| | 9301 | | Exp | | 357 | | 9 | | 117 |
9002 (Yalea South) | | 9102 | | GC | | 0 | | 9 | | -80 |
| | 9202 | | AdvGC | | 5 | | 9 | | -90 |
| | 9302 | | Exp | | 5 | | 9 | | -90 |
9007 (Yalea South) unclassified | | 9317 | | | | 0 | | 9 | | 110 |
| | 9327 | | | | 0 | | 9 | | 90 |
| | 9337 | | | | 10 | | 9 | | 60 |
| | 9347 | | | | 10 | | 9 | | 90 |
9003 (Yalea North) | | 9103 | | GC | | 4.577 | | -8.901 | | 117.356 |
9004 (Yalea North) | | 9104 | | GC | | 0 | | -8.901 | | -85 |
| | 9204 | | AdvGC | | 0 | | -8.901 | | -85 |
9005 (P125) | | 9105 | | GC | | 3 | | 0 | | -75 |
9006 (‘Purple Patch’) | | 9106 | | GC | | 183 | | -15 | | 90 |
| | 9156 | | GC | | 183 | | -15 | | 90 |
| | 9206 | | AdvGC | | 183 | | -15 | | 90 |
Gara
At Gara the same approach is used by sub domaining and domain nomenclature to account for the variation in drill spacing from 10 m to 120 m. The grade control area is sub split into the open pit grade control where the drill spacing is approximately 10 m and the underground drill spacing area where the drill spacing is less than or equal to 30 m. The area where the drilling is between 30 m to 90 m is defined as the resource exploration area.
These broad domains are then further split into the estimation domains based upon a combination of geological, orientation and drill spacing sub domains. These estimation domains are used to define the estimation parameters are displayed in Figure14-27. The Gara block model name is “20171120_gara_uggc_model_EXT_SOUTH.bmf” and is a sub cell model generated from Vulcan. Table14-37 outlines the Gara block model extents. Table14-38 outlines the Yalea search orientations andsub-domain nomenclature.
| | |
| 18th September 2018 | | Page 161 |
| | | | |
| | Loulo-Gounkoto Gold Mine Complex NI 43-101 Technical Report | | |
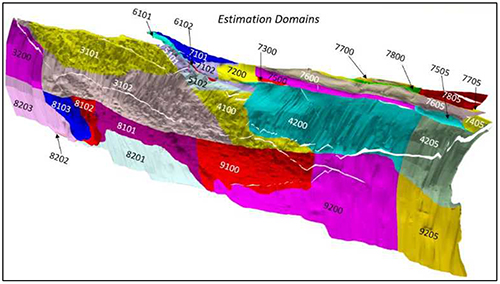
Figure14-27 Gara 2017 Estimation Domains
| | |
| 18th September 2018 | | Page 162 |
| | | | |
| | Loulo-Gounkoto Gold Mine Complex NI 43-101 Technical Report | | |
Table14-37 Gara Block Model Extents
| | | | | | | | |
| Block Extents | | Easting(X) | | Northing(Y) | | Elevation(Z) |
Minimum Coordinates | | 237400 | | 1445500 | | -850 |
Maximum Coordinates | | 238502.5 | | 1448710 | | 185 |
Parent Block Size (m) | | 7.5 | | 30 | | 15 |
Sub Cell Size (m) | | 0.5 | | 2 | | 1 |
GC Domain Block Size (m) | | 5 | | 20 | | 10 |
Rotation | | Bearing (°) | | 90 |
| | Plunge (°) | | 0 |
| | Dip (°) | | 0 |
Table14-38 Gara Estimation Domain Orientation
| | | | | | | | | | |
Geological Domain | | Estimation Domains | | Comment | | Domain Orientation |
| | Bearing (°) | | Plunge (°) | | Dip (°) |
3000 | | 3101 | | Open pit GC | | 216.102 | | -25.659 | | -56.31 |
| | 3102 | | UG GC | | 212.102 | | -25.659 | | -56.31 |
| | 3200 | | Exploration | | 210.102 | | -25.659 | | -76.31 |
4000 | | 4100 | | UG GC | | 195 | | -20.705 | | 139.107 |
| | 4200 | | Exploration | | 210 | | -20.705 | | 134 |
| | 4205 | | Exploration South extension | | 202 | | -20.705 | | 124 |
4605 |
5000 | | 5101 | | Open pit GC | | 295 | | 0 | | -150 |
| | 5102 | | UG GC | | 300 | | 0 | | -150 |
6000 | | 6101 | | Open pit GC | | 38.539 | | 13.566 | | 115.769 |
| | 6102 | | UG GC | | 26.539 | | 13.566 | | 125.769 |
7000 | | 7101 | | Open pit GC | | 30.703 | | 18.829 | | 105.055 |
| | 7102 | | UG GC | | 26.703 | | 18.829 | | 105.055 |
| | 7200 | | OP Exploration | | 10 | | 0 | | -60 |
7400 & 7600 | | 7300 | | OP Exploration | | 8 | | 0 | | -40 |
| | 7400 | | 10.703 | | 0 | | 7 |
| | 7500 | | 8 | | 0 | | -60 |
| | 7600 | | 15 | | 10 | | 35 |
| | 7700 | | 7 | | 1 | | 10 |
| | 7800 | | 2 | | 1 | | 90 |
7605 | | 4205 | | Exploration South extension | | 202 | | -20.705 | | 124 |
| | 7405 | | OP Exploration | | 10.703 | | 10 | | 7 |
| | 7505 | | 5 | | 10 | | 90 |
| | 7605 | | 15 | | 18.829 | | 35 |
| | 7705 | | 7 | | 12 | | 10 |
| | 7805 | | -5 | | 1 | | 60 |
8000 | | 8101 | | UG GC | | 20 | | 18 | | 110 |
| | 8102 | | UG GC | | 355 | | 18 | | 80 |
| | 8103 | | UG GC | | 20 | | 18 | | 110 |
8000 & 8400 | | 8201 | | Exploration | | 10 | | 18 | | 115 |
8000 & 8900 | | 8202 | | Exploration | | 355 | | 18 | | 160 |
8000 | | 8203 | | Exploration | | 20 | | 18 | | 115 |
9000 | | 9100 | | UG GC | | 5 | | 18.783 | | 100.3 |
| | 9200 | | Exploration | | 5 | | 18.783 | | 100.3 |
9400 & 9600 |
9605 | | 9205 | | Exploration South extension | | 12 | | 18.783 | | 90.3 |
10000 | | 10100 | | UG GC | | 5 | | 18.783 | | 100.3 |
| | |
| 18th September 2018 | | Page 163 |
| | | | |
| | Loulo-Gounkoto Gold Mine Complex NI 43-101 Technical Report | | |
Loulo 3
All Loulo 3 block sizes are optimised to be approximately half of the relevant along strike drill spacing in each domain. Subsequently, block sizes have smaller X axis relative to Y axis due to the elongate thin nature of the mineralisation in areas.
The Main Zone and South Zone are bothsub-domained into two sub domains: exploration or grade control based on drill spacing. This approach enables application of different search ranges and use of different block sizes within each sub domain (Table14-39). Allsub-domains use soft boundaries as there is no geological reason to constrain the resource estimate from using sample support from the other domains. Table14-40 details the search ellipsoid orientation and high-grade constraining applied.
The block model name for Loulo 3 is “150101_LOULO 3_RESCAT.bmf” which is a sub cell model generated from Vulcan.
Table14-39 Loulo 3 Block Model Extents
| | | | | | | | |
| Block Extents | | Easting(X) | | Northing(Y) | | Elevation(Z) |
Minimum Coordinates | | 240975 | | 1445200 | | -450 |
Maximum Coordinates | | 242075 | | 1447700 | | 200 |
Parent Block Size (m) | | 10 | | 20 | | 5 |
Sub Cell Size (m) | | 2.5 | | 2.5 | | 0.625 |
GC Domain Block Size (m) | | 5 | | 10 | | 5 |
Rotation | | Bearing (°) | | | | 100 | | |
| | Plunge (°) | | | | 0 | | |
| | Dip (°) | | | | 0 | | |
Table14-40 Loulo 3 Search Ellipse Orientations and HG Constraining
| | | | | | | | | | |
| Domain | | Sub-Domain | | Pass Number | | Search Ellipsoid |
| | Azi (°) | | Plunge (°) | | Dip (°) |
MZ2 | | GC | | 1 | | 20 | | 0 | | -50 |
| | 2 | | 20 | | 0 | | -50 |
| | 3 | | 20 | | 0 | | -50 |
| | RES | | 1 | | 20 | | 0 | | -50 |
| | 2 | | 20 | | 0 | | -50 |
| | 3 | | 20 | | 0 | | -50 |
MZ1 | | GC | | 1 | | 350 | | 0 | | -50 |
| | 2 | | 350 | | 0 | | -50 |
| | 3 | | 350 | | 0 | | -50 |
| | RES | | 1 | | 350 | | 0 | | -50 |
| | 2 | | 350 | | 0 | | -50 |
| | 3 | | 350 | | 0 | | -50 |
| | 350 | | 0 | | -50 |
| | 350 | | 0 | | -50 |
FW | | GC | | 1 | | 350 | | 0 | | -50 |
| | 2 | | 350 | | 0 | | -50 |
| | 3 | | 350 | | 0 | | -50 |
Baboto
The Baboto 2017 block sizes have small X axis relative to Y axis due to the elongated thin nature of the mineralisation in areas. The block model name for Baboto resource model is “BB_GC_170514_v2.bmf” which is a sub cell model generated from Vulcan. The extents of the block model Table14-41.
| | |
| 18th September 2018 | | Page 164 |
| | | | |
| | Loulo-Gounkoto Gold Mine Complex NI 43-101 Technical Report | | |
Baboto South and Centre aresub-domained into two sub domains of exploration and grade control based on drill spacing (Figure14-28). This approach enables application of different search ranges and use of different block sizes within each sub domain (Table14-42). All subdomains will use soft boundaries as there is no geological reason to constrain the resource estimate from using sample support from other domains.
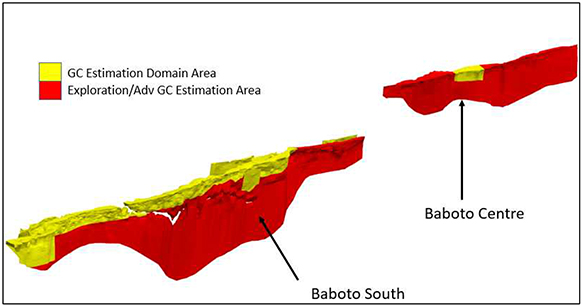
Figure14-28 Baboto Estimation Domains Looking WNW
Table14-41 Baboto South and Centre Block Model Extents
| | | | | | | | |
| Block Extents | | Easting(X) | | Northing(Y) | | Elevation(Z) |
Minimum Coordinates | | 244030 | | 1452985 | | -200 |
Maximum Coordinates | | 245510 | | 1457285 | | 310 |
Parent Block Size (m) | | 5 | | 15 | | 10 |
Sub Cell Size (m) | | 0.25 | | 0.5 | | 0.25 |
GC Domain Block Size (m) | | 3 | | 6 | | 2.5 |
Rotation | | Bearing (°) | | | | 90 | | |
| | Plunge (°) | | | | 0 | | |
| | Dip (°) | | | | 0 | | |
| | |
| 18th September 2018 | | Page 165 |
| | | | |
| | Loulo-Gounkoto Gold Mine Complex NI 43-101 Technical Report | | |
Table14-42 Baboto South and Centre Estimation Domains
| | | | | | | | | | | | |
| Model | | Lith in BM | | Domain in BM | | Estimation Domain | | Search Ellipsoid |
| | Azimuth (°) | | Plunge (°) | | Dip (°) |
Baboto South Main | | 1001 | | GC | | 1111 | | 344 | | 0 | | 84 |
| | 1121 | | 357 | | 0 | | 82 |
| | 1131 | | 340 | | 0 | | 81 |
| | 1141 | | 356 | | 0 | | 83 |
| | Expl | | 1211 | | 344 | | 0 | | 84 |
| | 1221 | | 357 | | 0 | | 82 |
| | 1231 | | 340 | | 0 | | 81 |
| | 1241 | | 356 | | 0 | | 83 |
Baboto South East | | 1002 | | GC | | 11021 | | 344 | | 0 | | 89 |
| | 11022 | | 346 | | 0 | | 88 |
| | 11023 | | 360 | | 0 | | 77 |
| | 11024 | | 359 | | 0 | | 76 |
| | 11025 | | 356 | | 0 | | 79 |
| | 11026 | | 359 | | 0 | | 84 |
| | 11027 | | 347 | | 0 | | 74 |
| | 11028 | | 349 | | 0 | | 89 |
| | Expl | | 12021 | | 344 | | 0 | | 84 |
| | 12022 | | 357 | | 0 | | 82 |
Baboto South HW | | 1003 | | GC | | 1103 | | 340 | | 0 | | 81 |
| | Expl | | 1203 | | 356 | | 0 | | 83 |
Baboto South FW | | 1004 | | GC | | 1104 | | 347 | | 0 | | 74 |
| | Expl | | 1204 | | 347 | | 0 | | 74 |
Baboto Central | | 2001 | | GC/Expl | | 2001 | | 3 | | -9 | | -100 |
Gara West
The Gara West block sizes are optimised to be approximately half of the relevant along strike drill spacing. The Gara West is mostly drilled on regular spacings across all domains, therefore all domains have the same block size. The extents of the Gara West block model are detailed in Table14-43.
There are four domains modelled at Gara West, however, there is significant small to medium variations in the strike and dip in each individual domain and as such, each domain has beensub-domained (Figure14-29). This approach enables application of different search orientations within each sub domain (Table14-45). Allsub-domains will use soft boundaries as there is no geological reason to constrain the resource estimate from using sample support from other domains.
Table14-43 Gara West Block Model Extents
| | | | | | | | |
| Block Extents | | Easting(X) | | Northing(Y) | | Elevation (Z) |
| Minimum Coordinates | | 237400 | | 1446100 | | -850 |
| Maximum Coordinates | | 238510 | | 1448710 | | 185 |
| Parent Block Size (m) | | 10 | | 20 | | 5 |
| Sub Cell Size (m) | | 1 | | 2 | | 0.5 |
| Rotation | | Bearing (°) | | | | 90 | | |
| | Plunge (°) | | | | 0 | | |
| | Dip (°) | | | | 0 | | |
| | |
| 18th September 2018 | | Page 166 |
| | | | |
| | Loulo-Gounkoto Gold Mine Complex NI 43-101 Technical Report | | |
Table14-44 Gara West Sub Domain Ellipse Orientations
| | | | | | | | |
| Domain | | Estimation Domain | | Search Ellipsoid |
| | Azimuth (°) | | Plunge (°) | | Dip (°) |
10000 | | 1 | | 24 | | 0 | | 67 |
| | 2 | | 26 | | 0 | | 60 |
20000 | | 1 | | 14 | | 0 | | 64 |
| | 2 | | 27 | | 0 | | 68 |
| | 3 | | 26 | | 0 | | 68 |
| | 4 | | 13 | | 0 | | 58 |
| | 5 | | 15 | | 0 | | 59 |
| | 6 | | 15 | | 0 | | 53 |
30000 | | 1 | | 16 | | 0 | | 65 |
| | 2 | | 22 | | 0 | | 71 |
| | 3 | | 18 | | 0 | | 59 |
40000 | | 1 | | 44 | | 0 | | 69 |
| | 2 | | 24 | | 0 | | 69 |
| | 3 | | 20 | | 0 | | 57 |
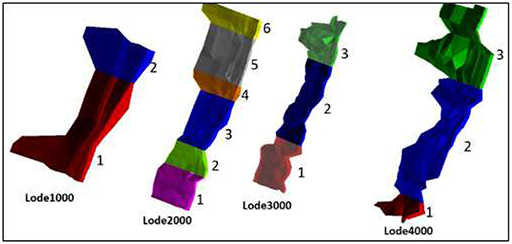
Figure14-29 Gara West EstimationSub-Domains
The block model name for Gara West is ‘150101_GARAWEST_RESCAT.bmf’ which is a sub cell model generated from Vulcan.
Gounkoto
The plunge in the primary east dipping domains is much shallower (9°) than the plunge within west and central west dipping mineralisation as a function of the plunge of FW fingers within the west dipping domains. The changing strike and dip of the Gounkoto Main Zone structure required that estimation domains weresub-domained to separate the east and west dipping mineralisation foliation. Estimation parameters were optimised on the parent domains and the resulting optimisations were applied to the sub domains. The search ellipse was orientated individually for each sub domain where necessary. The Gounkoto block model extents are detailed in Table14-45.
| | |
| 18th September 2018 | | Page 167 |
| | | | |
| | Loulo-Gounkoto Gold Mine Complex NI 43-101 Technical Report | | |
Table14-45 Gounkoto Block Model Extents
| | | | | | | | |
| Block Extents | | Easting(X) | | Northing(Y) | | Elevation(Z) |
| Minimum Coordinates | | 239595 | | 1422840 | | -675 |
| Maximum Coordinates | | 241545 | | 1425930 | | 176.4 |
| Parent Block Size (m) | | 15 | | 30 | | 9.9 |
| Sub Cell Size (m) | | 1.25 | | 2.5 | | 0.825 |
| Advance GC Block Size (m) | | 7.5 | | 15 | | 4.95 |
| GC Block Size (m) | | 5 | | 10 | | 3.3 |
| Rotation | | Bearing (°) | | | | 90 | | |
| | Plunge (°) | | | | 0 | | |
| | Dip (°) | | | | 0 | | |
A summary of the Gounkoto search ellipse parameters and the high-grade constraints applied to some domains is detailed in Table14-46.
Table14-46 Summary of the Gounkoto Orientations and HG Constraint
| | | | | | | | |
Block Model Domain Code | | Estimation Domain Code | | Search Ellipse Orientation |
| | Strike
(°) | | Dip
(°) | | Plunge
(°) |
MZ1 east dipping - 1001 | | 1 | | 360 | | 110 | | -9 |
| | 2 | | 345 | | 125 | | -9 |
| | 9 | | 360 | | 105 | | 0 |
| | 4 | | 360 | | 110 | | -9 |
| | 5 | | 345 | | 120 | | -9 |
MZ1 central west dipping - 1001 | | 3 | | 10 | | 80 | | 0 |
| | 6 | | 345 | | 120 | | 0 |
MZ2NW - 1002 | | OP | | 350 | | 70 | | 0 |
| | UG | | 350 | | 70 | | 0 |
MZ2NW - 10022 | | - | | 30 | | 120 | | -9 |
10023 | | - | | 360 | | 100 | | -9 |
MZ3 - 1003 | | 7 OP | | 350 | | 110 | | -8 |
| | 7 UG | | 350 | | 110 | | -8 |
| | 8 OP | | 20 | | 120 | | -8 |
| | 8 UG | | 20 | | 120 | | -8 |
| | 13 | | 350 | | 110 | | -8 |
ID - 10032 | | - | | 10 | | 110 | | 0 |
MZ4 - 1004 | | - | | 350 | | 80 | | 0 |
10042 | | - | | 360 | | 100 | | 0 |
P64W1 (P64WNS) - 1005 | | - | | 4 | | 90 | | 0 |
P64W2 (P64WNE) - 1006 | | - | | 40 | | 80 | | 0 |
P64W3 (P64WNS) - 1007 | | - | | 6 | | 80 | | 0 |
P64W1 (P64WNS) - 1008 | | P64W HW1 |
P64W1 (P64WNS) - 1009 | | P64W HW2 |
P64EW1 (P64WNS) - 10051 | | 10 | | 4 | | 90 | | 0 |
| | 11 | | 310 | | 90 | | 0 |
P64EW1 (P64WNS) - 10052 | | 12 | | 310 | | 90 | | 0 |
HW1 - 2001 | | - | | 5 | | 120 | | 0 |
HW1 - 2002 | | - | | 5 | | 120 | | 0 |
HW1 - 2003 | | - | | 5 | | 120 | | 0 |
HW1 - 2004 | | - | | 5 | | 120 | | 0 |
MZ1 West Dipping - 3001 3002 3003 3004 3005 3006 | | - | | 360 | | 90 | | 0 |
3007 3008 3009 3010 3011 | | | | | | | | |
MZ1 West Dipping - 4001 4002 4003 4004 4005 | | - | | 15 | | 80 | | 0 |
Waste (9999) | | - | | 360 | | 120 | | 0 |
The east and west dipping domain boundary has been modelled using a surface which is interpreted to follow the dip change in MZ1 with all the data available (from pit mapping and from diamond hole). The domain that is situated between these structural domains has been created
| | |
| 18th September 2018 | | Page 168 |
| | | | |
| | Loulo-Gounkoto Gold Mine Complex NI 43-101 Technical Report | | |
using evidence from the drill holes where the original fabrics are dipping away from each other in a highly altered zone.
Faraba
The three domains at Faraba (Main Zone 1000, Hanging Wall 2000, and Footwall 3000) were not sub domained. The search ellipsoid was orientated individually for each domain. The block model extents for Faraba are presented in Table14-47.
Table14-47 Faraba Block Model Extents
| | | | | | | | |
| Block Extents | | Easting(X) | | Northing(Y) | | Elevation(Z) |
Minimum Coordinates | | 241930 | | 1421290 | | -350 |
Maximum Coordinates | | 242730 | | 142550 | | -250 |
Parent Block Size (m) | | 20 | | 20 | | 10 |
Rotation | | Bearing (°) | | | | 90 | | |
| | Plunge (°) | | | | 0 | | |
| | Dip (°) | | | | 0 | | |
Table14-48 summarises the azimuth, dip and plunge along with the high-grade constrains applied to each domain during ordinary kriging.
Table14-48 Modelled Semi-Variogram Parameters for Faraba
| | | | | | | | |
| Domain | | Estimation Domain | | Search Ellipsoid |
| | Azi (°) | | Dip (°) | | Plunge (°) |
| Main Zone (1000) | | 1 | | 358 | | -57 | | 0 |
| | 2 | | 349 | | -55 | | 0 |
| | 3a | | 301 | | -64 | | 0 |
| | 3b | | 301 | | -83 | | 0 |
| | 4a | | 359 | | -64 | | 0 |
| | 4b | | 359 | | -83 | | 0 |
| | 5a | | 304 | | -64 | | 0 |
| | 5b | | 304 | | -83 | | 0 |
| | 6a | | 4 | | -64 | | 0 |
| | 6b | | 4 | | -83 | | 0 |
| Hanging Wall (2000) | | 1a | | 359 | | -55 | | 0 |
| | 1b | | 359 | | -71 | | 0 |
| | 2 | | 351 | | -53 | | 0 |
| Footwall (3000) | | 1 | | 356 | | 88 | | 0 |
| | 2 | | 326 | | -86 | | 0 |
| | 3 | | 345 | | -88 | | 0 |
| | 4 | | 293 | | -88 | | 0 |
| | 5 | | 360 | | -77 | | 0 |
| | 6 | | 360 | | 81 | | 0 |
14.12 Resource Classification
Under the CIM definitions (CIM (2014) Standards on Mineral Resources and Reserves Definitions and Guidelines, August 2000), and the JORC (2012) Code, Measured Mineral Resources require that “quantity, grade, density, shape, and physical characteristics need to be established with confidence sufficient to allow the appropriate application of technical and economic parameters” such that production planning and the evaluation of the economic viability of the deposit is possible.
| | |
| 18th September 2018 | | Page 169 |
| | | | |
| | Loulo-Gounkoto Gold Mine Complex NI 43-101 Technical Report | | |
In the case of Measured and Indicated Resources, the level of confidence should be sufficient to allow for the application of appropriate technical and economic parameters, mine planning, and economic evaluation.
Resource Classification applied to Loulo-Gounkoto Mineral Resources has taken this into consideration and the classifications are based on a combination of geological continuity, data density, variogram range continuity as well as estimation quality in form of slope of regression (SR) and kriging efficiency (KE). This was carried out by displaying the estimated blocks (SR and KE) together with the supporting data as guide.
To increase the continuity of the Mineral Resource, classification shapes are built using the criteria that reflects the confidence in the estimation for Measured, Indicated, and Inferred classification. These shapes are used flag the block model. Blocks that do not meet these criteria are flagged as unclassified and used for exploration and resources conversion evaluation purpose.
Loulo
The criteria for determining the classification of each deposit is outlined in Table14-49.
Table14-49 Loulo Classification Criteria
| | | | | | | | | | | | |
| Class | | Criteria | | Yalea | | Gara | | Loulo 3 | | Baboto | | Gara West |
Measured | | Maximum Drill Spacing (m) | | 30 | | 30 | | 5 by 10 | | 5 by 10 | | N/A |
| | Geological Continuity | | 6
Sections | | 6
Sections | | 6
Sections | | 6
Sections |
|
| | Min Samples | | 8 | | 8 | | 8 | | 8 |
| | Minimum Slop of Regression | | 0.8 | | 0.8 | | 0.8 | | 0.8 |
Indicated | | Maximum Drill Spacing (m) | | 30 to 80 | | 40 to 80 | | 20 to 80 | | 20 to 60 | | 10 to 40 |
| | Sections of Geological Continuity | | Good | | Good | | Good | | Good | | Good |
|
| | Min Samples | | 6 | | 6 | | 6 | | 6 | | 6 |
| | Minimum Slop of Regression | | 0.6 | | 0.6 | | 0.6 | | 0.6 | | 0.6 |
Inferred | | Maximum Drill Spacing (m) | | Over 80 | | Over 80 | | Over 80 | | Over 80 | | Over 40 |
| | Sections of Geological Continuity | | - | | - | | - | | - | | - |
|
| | Min Samples | | 4 | | 4 | | 4 | | 4 | | 4 |
| | Minimum Slop of Regression | | - | | - | | - | | - | | - |
| | |
| 18th September 2018 | | Page 170 |
| | | | |
| | Loulo-Gounkoto Gold Mine Complex NI 43-101 Technical Report | | |
Yalea
Figure14-30 illustrates the Yalea Mineral Resources classification.
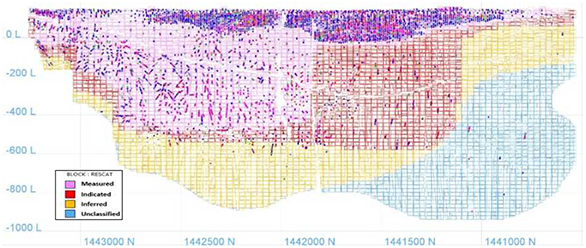
Figure14-30 Yalea Mineral Resources Classification with Estimation Composites
Gara
Figure14-31 shows the Gara Mineral Resources classification.
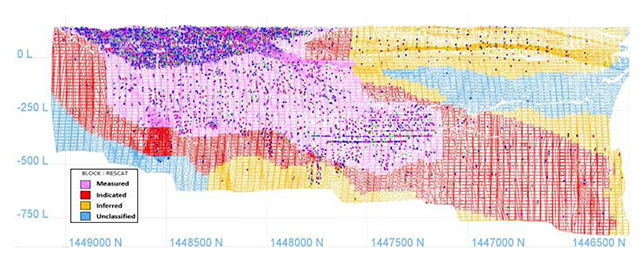
Figure14-31 Gara Mineral Resources Classification with Estimation Composites
Loulo 3
Figure14-32 shows the Loulo 3 Mineral Resources classification.
| | |
| 18th September 2018 | | Page 171 |
| | | | |
| | Loulo-Gounkoto Gold Mine Complex NI 43-101 Technical Report | | |
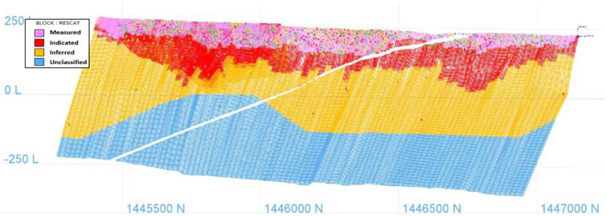
Figure14-32 Loulo 3 Mineral Resource Classification with Estimation Composites
Baboto
Figure14-33 displays the Baboto South and Central Mineral Resources classification.
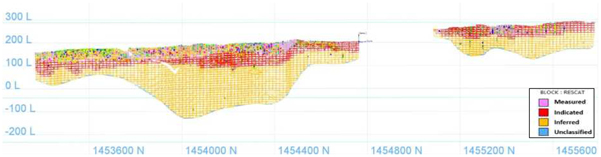
Figure14-33 Baboto 2017 Mineral Resource Classification Surfaces with Estimation Composites
Gara West
Figure14-34 shows the Gara West Mineral Resources classification.
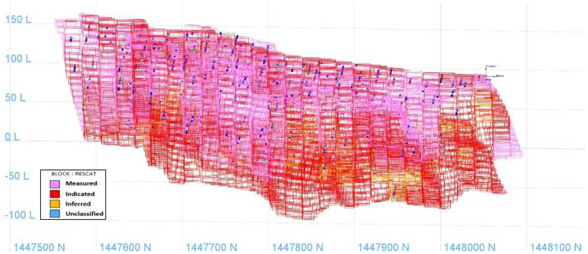
Figure14-34 Gara West 2017 Mineral Resource Classification Surfaces with Estimation Composites
| | |
| 18th September 2018 | | Page 172 |
| | | | |
| | Loulo-Gounkoto Gold Mine Complex NI 43-101 Technical Report | | |
Gounkoto
The criteria for determining the classification of each deposit is outlined in Table14-50. Slope of regression plots, the variogram range and geological continuity were also used.
Table14-50 Gounkoto Classification Criteria
| | | | | | | | |
| Class | | Criteria | | Gounkoto Open Pit | | Gounkoto Underground | | Faraba |
Measured | | Maximum Drill Spacing (m) | | 12.5 by 12.5 (6 b 6 Finger Zone) | | N/A | | 12.5 by 12.5 |
| | Geological Continuity | | | | |
| | Minimum Slope of Regression | | 0.7 | | |
Indicated | | Maximum Drill Spacing (m) | | 30 | | 40 by 30 | | 30 |
| | Sections of Geological Continuity | | | | | | |
| | Minimum Slope of Regression | | 0.5 | | 0.5 | | 0.5 |
Inferred | | Maximum Drill Spacing (m) | | <100 | | <100 | | <100 |
| | Sections of Geological Continuity | | | | | | |
Figure14-35 illustrates an example of the detailed classification on MZ1.
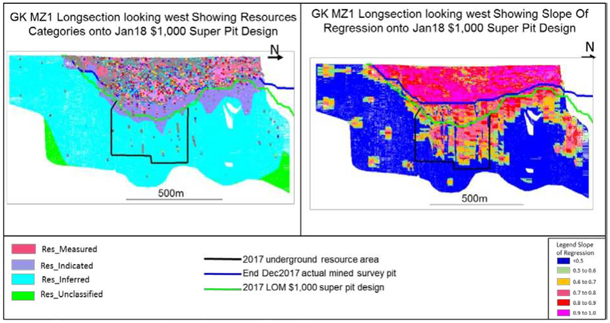
Figure14-35 Gounkoto July 2017 MZ1 Classification
| | |
| 18th September 2018 | | Page 173 |
| | | | |
| | Loulo-Gounkoto Gold Mine Complex NI 43-101 Technical Report | | |
Faraba
Figure14-36 illustrates the Mineral Resource classification at Faraba.
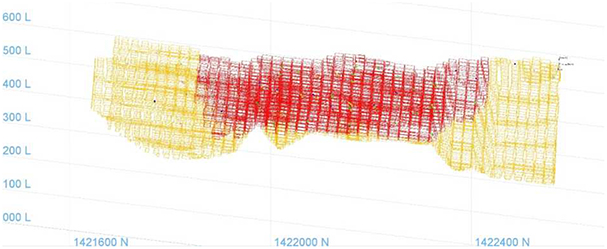
Figure14-36 Faraba Classification Within Pit
14.13 Block Model Depletion
Every block model was depleted against the 5 m Regional LIDAR DTM surface that was completed by Randgold in 2010. Where surface mining has occurred, updated LIDAR surveys have been completed on an annual basis.
Underground stope scans are used to report depletion from the block models which is then applied to the Mineral Resource reporting.
14.14 Block Model Validation
Once the block model has been classified, checks were undertaken to ensure the block models and estimated grades which can be used to indicate any major errors during the estimation process as well as testing the precision, accuracy, and any bias of the estimated grade.
The block model was validated using the following steps.
Volume Reconciliation
A volume reconciliation between the block model estimation domains and related wireframes is undertaken. Table14-51 summarises the variances between the wireframe and block model volumes across all Yalea and Gara.
| | |
| 18th September 2018 | | Page 174 |
| | | | |
| | Loulo-Gounkoto Gold Mine Complex NI 43-101 Technical Report | | |
Table14-52 summarised the volume reconciliation for Gounkoto. The overall variance is shown to be excellent (<1%).
Table14-51 Gara and Yalea Volume Reconciliation
| | | | | | | | | | |
| Model | | Zone | | BM Volume (m3) | | WF Volume (m3) | | Variance (m3) | | Variance |
Yalea | | 9001 | | 2,281,297 | | 2,280,033 | | 1,264 | | -0.10% |
| | 9002 | | 2,353,633 | | 2,353,566 | | 67 | | 0.00% |
| | 9003 | | 2,974,154 | | 2,975,444 | | -1,290 | | 0.00% |
| | 9004 | | 2,984,667 | | 2,985,095 | | -428 | | 0.00% |
| | 9005 | | 593,775 | | 590,372 | | 3,403 | | -0.60% |
| | 9006 | | 1,948,751 | | 1,948,528 | | 223 | | 0.00% |
| | Total | | 13,136,278 | | 13,133,038 | | 3,240 | | 0.00% |
Gara | | UG_3000 | | 3,029,424 | | 3,029,454 | | -30 | | 0.00% |
| | UG_4000 | | 942,758 | | 943,007 | | -249 | | -0.03% |
| | UG_5000 | | 179,827 | | 179,780 | | 47 | | 0.03% |
| | UG_6000 | | 96,365 | | 96,430 | | -65 | | -0.07% |
| | UG_7000 | | 367,738 | | 367,499 | | 239 | | 0.06% |
| | UG_8000 | | 3,460,869 | | 3464507 | | -3,638 | | -0.11% |
| | UG_9000 | | 1,410,918 | | 1,410,905 | | 13 | | 0.00% |
| | UG_9600 | | 1,785,589 | | 1,785,719 | | -130 | | -0.01% |
| | UG_4600 | | 329,480 | | 329,448 | | 32 | | 0.01% |
| | UG_4605 | | 456,657 | | 456,607 | | 50 | | 0.01% |
| | UG_7400 | | 661,336 | | 661,768 | | -432 | | -0.07% |
| | UG_7600 | | 850,408 | | 850,939 | | -531 | | -0.06% |
| | UG_7605 | | 520,549 | | 521,205 | | -656 | | -0.13% |
| | UG_8400 | | 680,790 | | 680,678 | | 112 | | 0.02% |
| | UG_8900 | | 955,465 | | 955,506 | | -41 | | 0.00% |
| | UG_9400 | | 246,830 | | 246,899 | | -69 | | -0.03% |
| | UG_9605 | | 1,528,520 | | 1,528,884 | | -364 | | -0.02% |
| | Total | | 17,503,523 | | 17,509,236 | | -5,713 | | -0.03% |
| | |
| 18th September 2018 | | Page 175 |
| | | | |
| | Loulo-Gounkoto Gold Mine Complex NI 43-101 Technical Report | | |
Table14-52 Gounkoto Volume Reconciliation
| | | | | | | | |
| Zone | | WF Volume (m3) | | BM Volume (m3) | | Variance (m3) | | Variance |
| 1001 | | 9,832,409 | | 9,830,777 | | -1,631 | | -0.02% |
| 1002 | | 2,148,367 | | 2,151,708 | | 3,341 | | 0.16% |
| 1003 | | 5,067,423 | | 5,068,942 | | 1,519 | | 0.03% |
| 1004 | | 366,963 | | 367,388 | | 425 | | 0.12% |
| 1005 | | 520,817 | | 520,833 | | 15 | | 0.00% |
| 1006 | | 453,990 | | 453,920 | | -70 | | -0.02% |
| 1007 | | 86,280 | | 86,292 | | 12 | | 0.01% |
| 1008 | | 18,629 | | 18,459 | | -169 | | -0.91% |
| 1009 | | 9,400 | | 9,444 | | 44 | | 0.47% |
| 2001 | | 6,018,477 | | 6,015,921 | | -2,556 | | -0.04% |
| 2002 | | 19,634 | | 19,645 | | 11 | | 0.06% |
| 2003 | | 241,036 | | 241,142 | | 106 | | 0.04% |
| 2004 | | 21,434 | | 21,816 | | 382 | | 1.78% |
| 3001 | | 370,057 | | 370,497 | | 440 | | 0.12% |
| 3002 | | 78,526 | | 78,501 | | -25 | | -0.03% |
| 3003 | | 962,899 | | 960,831 | | -2,068 | | -0.21% |
| 3004 | | 278,669 | | 278,363 | | -306 | | -0.11% |
| 3005 | | 73,960 | | 73,474 | | -487 | | -0.66% |
| 3006 | | 14,161 | | 14,064 | | -97 | | -0.68% |
| 3007 | | 51,591 | | 51,044 | | -547 | | -1.06% |
| 3008 | | 2,020 | | 1,892 | | -128 | | -6.34% |
| 3009 | | 75,902 | | 76,859 | | 957 | | 1.26% |
| 3010 | | 56,260 | | 55,876 | | -384 | | -0.68% |
| 3011 | | 22,933 | | 22,512 | | -421 | | -1.84% |
| 4001 | | 31,425 | | 31,443 | | 18 | | 0.06% |
| 4002 | | 17,674 | | 17,699 | | 25 | | 0.14% |
| 4003 | | 49,242 | | 49,273 | | 32 | | 0.06% |
| 4004 | | 54,831 | | 54,757 | | -74 | | -0.13% |
| 4005 | | 175,925 | | 175,944 | | 19 | | 0.01% |
| 10022 | | 124,454 | | 124,895 | | 441 | | 0.35% |
| 10023 | | 3,865 | | 3,836 | | -29 | | -0.75% |
| 10032 | | 9,505,192 | | 9,502,481 | | -2,710 | | -0.03% |
| 10042 | | 13,474 | | 13,961 | | 486 | | 3.61% |
| 10051 | | 849,080 | | 850,516 | | 1,435 | | 0.17% |
| 10052 | | 16,413 | | 16,258 | | -155 | | -0.94% |
| Total | | 37,633,413 | | 37,631,264 | | -2,149 | | -0.01% |
Negative Kriging Weight Check
A check of the number of the blocks estimated using the negative kriging weight is completed. If blocks are observed to have a material impact as a result of negative kriging weights, the block grade is reset to that of the anisotropic nearest block grade. At Gounkoto, 50 blocks in MZ2, MZ3, and P64E1 grade control area were estimated using negative kriging weight and therefore reset to the nearest anisotropic block grade.
Data Comparison
A comparison between the data minimum, maximum, mean and the estimation mean for each of the domains (within the open pit or underground reporting areas) is created. This is completed to check for possible over or under estimation. An example of the composite and block model grade comparison for Gounkoto Open Pit is presented in Table14-53.
| | |
| 18th September 2018 | | Page 176 |
| | | | |
| | Loulo-Gounkoto Gold Mine Complex NI 43-101 Technical Report | | |
Table14-53 Gounkoto Open Pit Data Comparison
| | | | | | | | | | | | |
| Zone | | Min Au (g/t) | | Max Au (g/t) | | Mean Au (g/t) |
| | Comp | | BM | | Comp | | BM | | Comp | | BM |
MZ1 | | 0.005 | | 0.009 | | 156.96 | | 74.72 | | 5.13 | | 5.66 |
MZ2 | | 0.005 | | 0.027 | | 73.25 | | 48.86 | | 7.65 | | 5.74 |
MZ3 | | 0.005 | | 0.020 | | 98.30 | | 34.97 | | 5.78 | | 5.62 |
MZ3HW | | 0.031 | | 0.112 | | 1.56 | | 0.69 | | 0.30 | | 0.35 |
MZ4 | | 0.005 | | 0.064 | | 51.77 | | 25.22 | | 3.56 | | 3.13 |
MZ4FW | | 0.290 | | 0.648 | | 1.39 | | 2.11 | | 0.79 | | 0.88 |
HW (1 to 4) | | 0.005 | | 0.007 | | 63.80 | | 26.31 | | 1.75 | | 1.98 |
FWFE (1 to 11) | | 0.005 | | 0.042 | | 65.22 | | 19.11 | | 2.71 | | 2.71 |
FWNE (1 to 5) | | 0.005 | | 0.439 | | 6.76 | | 2.11 | | 1.46 | | 1.24 |
P64W (1 to 3) +P64HW (1 to2) | | 0.005 | | 0.076 | | 98.21 | | 21.21 | | 1.93 | | 1.98 |
P64E (1 to2) | | 0.005 | | 0.023 | | 14.27 | | 8.48 | | 1.45 | | 1.53 |
Total | | 0.005 | | 0.007 | | 156.96 | | 74.72 | | 4.06 | | 3.91 |
The Highest variance between the block and sample in MZ2, but after declustering the data the sample mean become 5.88 g/t Au which is close to the block mean grade. MZ3HW high variance is link to the wide space drilling that is why this zone is classified as Inferred, MZ4 high variance is driven by the 100 m extension in the south with wide spacing drilling, this extension is classified as Inferred Resources.
Swath Plots
Swath plots are created for each geological domain to validate the estimated grade variability compared to the composite along the Y axis which is along strike of the mineralisation The X and Z directions are also reviewed. This is to check that the model estimate follows the trends seen in the data and that there is no bias with over or under estimation. An example of the swath plots is presented in Figure14-37 which illustrates swath plot of the Y axis for 9106 of the ‘Purple Patch’ and Figure14-38 illustrates a swath plot of the Y axis for Gara 3000.
| | |
| 18th September 2018 | | Page 177 |
| | | | |
| | Loulo-Gounkoto Gold Mine Complex NI 43-101 Technical Report | | |
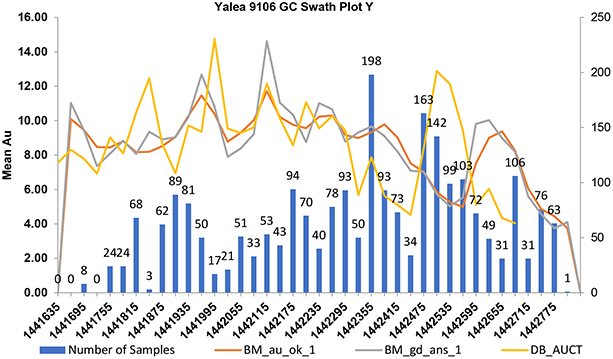
Figure14-37 Swath Plot of Yalea Grade Control Area of 9006
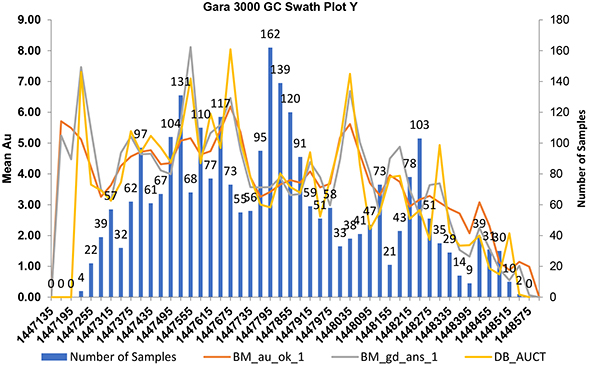
Figure14-38 Swath Plot Along Y Axis of 3101 (3000 GC Area)
| | |
| 18th September 2018 | | Page 178 |
| | | | |
| | Loulo-Gounkoto Gold Mine Complex NI 43-101 Technical Report | | |
Alternative Estimations
Block models are also estimated using nearest neighbour analysis as a check estimate against OK. Resource reports are generated, and visual checks are undertaken to compare them to the OK models.
Visual Checks
A comprehensive visual check is undertaken comparing the data to the block estimates to check for an acceptable correlation, including checking on local high-grade trends on the block estimated is supported by data as well as to compare previous block model iterations to the new block model. An example of the Yalea and Gara visual checks are illustrated in Figure14-39 and Figure14-40.
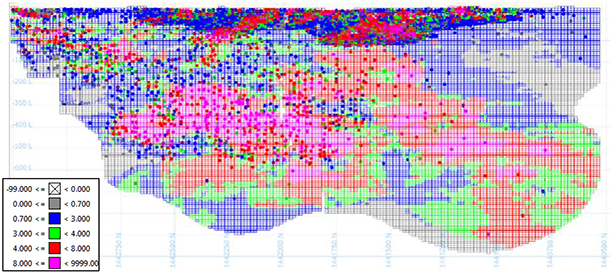
Figure14-39 Yalea 2017 Resource Model Looking East Regularised for Presentation Purposed and
Composite Samples Overlain onto Display Relative Accuracy of the Estimate

Figure14-40 Gara 2017 Resource Model Looking East Regularised for Presentation Purposed and
Composite Samples Overlain onto Display Relative Accuracy of the Estimate
| | |
| 18th September 2018 | | Page 179 |
| | | | |
| | Loulo-Gounkoto Gold Mine Complex NI 43-101 Technical Report | | |
14.15 ResourceCut-Off Grades
Loulo
Thecut-off grade calculations for the Loulo open pit and underground operations are presented in Table14-54 and Table14-55.
Table14-54 2017 Loulo Open PitCut-Off Grade Calculations
| | | | | | | | | | |
| Parameter | | Unit | | Symbol | | Loulo 3 | | Baboto | | Gara West |
| Gold Price | | $/oz. | | Gp | | 1500 | | 1500 | | 1500 |
| Royalty | | % | | R | | 6% | | 6% | | 6% |
| Selling cost | | % | | S | | 0% | | 0% | | 0% |
| Net Gold Price | | $/oz. | | Ng | | 1410 | | 1410 | | 1410 |
| | | | | | | | | | | |
| Met Recovery | | % | | Rec | | 92% | | 93% | | 89% |
| Dilution | | % | | Dil | | 10% | | 10% | | 10% |
| Ore Loss | | % | | Loss | | 3% | | 3% | | 3% |
| | | | | | | | | | | |
| Mining Cost - Contractor | | $/t mined | | MCC | | 3.59 | | 3.18 | | 3.64 |
| Mining Cost - Owner’s | | $/t mined | | MCO | | 0.06 | | 0.06 | | 0.06 |
| Mining Cost - GC | | $/t mined | | MCGC | | 0.07 | | 0.07 | | 0.2 |
| Total Mining Cost | | $/t mined | | TMC | | 3.72 | | 3.31 | | 3.9 |
| Strip Ratio | | Waste/Ore | | SR | | 20.56 | | 4.24 | | 7.44 |
| G&A | | $/t milled | | G_A | | 8.8 | | 7.8 | | 8.8 |
| Ore Crushing & hauling | | $/t milled | | rd | | 0 | | 3.63 | | 0 |
| Mining | | $/t milled | | Cr | | 80.12 | | 17.33 | | 32.89 |
| Process Plant | | $/t milled | | Cp | | 20.6 | | 15.2 | | 20.6 |
| Maintenance/Engineering | | $/t milled | | Mp | | 0 | | 0 | | 0 |
| | | | | | | | | | | |
| Total Operating Costs | | $ | | | | 109.52 | | 43.96 | | 62.29 |
| Full GradeCut-off | | g/t | | | | 2.71 | | 1.07 | | 1.59 |
| MarginalCut-off Grade | | g/t | | | | 0.73 | | | | 0.75 |
| | |
| 18th September 2018 | | Page 180 |
| | | | |
| | Loulo-Gounkoto Gold Mine Complex NI 43-101 Technical Report | | |
Table14-55 2017 Loulo UndergroundCut-Off Grade Calculations
| | | | | | |
| Parameter | | Unit | | Yalea | | Gara |
| Production |
Life of Mine Production 1 | | Mt | | 14.09 | | 13.83 |
Capital Cost 2 | | $M | | 108.03 | | 114.13 |
| Revenue Adjustment |
NSR Royalty (Royal Gold: NSR)3 | | of total oz produced | | 6.00% | | 6.00% |
Refining and Selling Expense4 | | $/Ounce | | $- | | $- |
| Admin & Processing Costs |
Metallurgical Recovery5 | | % | | 84.47% | | 94.20% |
Direct Processing6 | | $/Ton | | $17.80 | | $18.20 |
Tailings Disposal | | $/Ton | | $- | | $- |
Ore Haulage | | $/Ton | | $- | | $- |
Administration and Overhead7 | | $/Ton | | $7.80 | | $7.70 |
| Total Other Cost | | $/Ton | | $25.60 | | $25.90 |
| Mining Costs |
Dilution | | % | | 11.50% | | 15.60% |
Mining ore loss | | % | | 2.00% | | 4.00% |
OPEX Development8 | | $/Ton | | $5.00 | | $3.29 |
OPEX Stoping9 | | $/Ton | | $12.15 | | $11.79 |
Backfill10 | | $/Ton | | $11.58 | | $10.51 |
Fixed Cost11 | | $/Ton | | $13.98 | | $14.63 |
Grade control12 | | $/Ton | | $3.38 | | $3.40 |
Total Mine Operating Cost | | $/Ton | | $46.09 | | $43.63 |
Mine Sustaining Capital | | $/Ton | | $7.67 | | $8.25 |
All in Cost | | $/Ton | | $53.76 | | $51.88 |
| BreakevenIn-situCut-off Grade | | g/t | | 2.36 | | 2.19 |
| Breakeven Mined Cut-off Grade | | g/t | | 2.07 | | 1.82 |
| MarginalIn-situCut-off Grade | | g/t | | 2.04 | | 1.89 |
| Marginal MinedCut-off Grade | | g/t | | 1.74 | | 1.55 |
Gounkoto
The Gounkoto and Farabacut-off grade calculations for open pit are presented in Table14-56.
Table14-56 Gounkoto Open Pit 2017Cut-Off Grade Calculations
| | | | | | | | |
| Parameter | | Unit | | Symbol | | Gounkoto | | Faraba |
Gold Price | | $/oz. | | Gp | | 1500 | | 1,500 |
Royalty | | % | | R | | 6% | | 6% |
Selling cost | | % | | S | | 0% | | 0% |
Net Gold Price | | $/oz. | | Ng | | 1410 | | 1,410 |
| | | | | | | | | |
Met Recovery | | % | | Rec | | 92% | | 91% |
Dilution | | % | | Dil | | 10% | | 10% |
Ore Loss | | % | | Loss | | 2% | | 3% |
| | | | | | | | | |
Mining Cost - Contractor | | $/t mined | | MCC | | 2.95 | | 3.52 |
Mining Cost - Owner’s | | $/t mined | | MCO | | 0.06 | | 0.06 |
Mining Cost - GC | | $/t mined | | MCGC | | 0.07 | | 0.14 |
Total Mining Cost | | $/t mined | | TMC | | 3.08 | | 3.72 |
Strip Ratio | | Waste/Ore | | SR | | 13.62 | | 3.46 |
G&A | | $/t milled | | G_A | | 7.7 | | 8.8 |
Ore Crushing & hauling | | $/t milled | | rd | | 5.89 | | 5.9 |
Mining | | $/t milled | | Cr | | 44.98 | | 16.57 |
Process Plant | | $/t milled | | Cp | | 19 | | 20.6 |
Maintenance/Engineering | | $/t milled | | Mp | | 0 | | 0 |
| | | | | | | | | |
Total Operating Costs | | $ | | | | 77.57 | | 51.87 |
Full GradeCut-off | | g/t | | | | 1.9 | | 1.29 |
MarginalCut-off Grade | | g/t | | | | 0.8 | | 0.88 |
| | |
| 18th September 2018 | | Page 181 |
| | | | |
| | Loulo-Gounkoto Gold Mine Complex NI 43-101 Technical Report | | |
The Gounkoto undergroundcut-off grade calculations are presented in Table14-57.
Table14-57 Gounkoto Underground 2017Cut-Off Grade Calculations
| | | | |
| Parameter | | Unit | | Gounkoto |
Production |
Life of Mine Production | | Mt | | 13.82 |
Capital Cost | | $M | | 112.42 |
Revenue Adjustment |
NSR Royalty (Royal Gold: NSR) | | of total oz produced | | 6% |
Refining and Selling Expense | | $/Ounce | | - |
Admin & Processing Costs |
Metallurgical Recovery | | % | | 94.2 |
Direct Processing | | $/Ton | | 17.8 |
Tailings Disposal | | $/Ton | | - |
Ore Haulage | | $/Ton | | - |
Administration and Overhead | | $/Ton | | 7.80 |
Total Other Cost | | $/Ton | | 25.60 |
Mining Costs |
Dilution | | % | | 13.4% |
Mining ore loss | | % | | 4.0% |
OPEX Development | | $/Ton | | 6.62 |
OPEX Stoping | | $/Ton | | 10.64 |
Backfill | | $/Ton | | 14.31 |
Fixed Cost | | $/Ton | | 14.34 |
Grade control | | $/Ton | | 3.38 |
Total Mine Operating Cost | | $/Ton | | 49.3 |
Mine Sustaining Capital | | $/Ton | | 8.14 |
All in Cost | | $/Ton | | 57.43 |
BreakevenIn-situCut-off Grade | | g/t | | 2.30 |
Breakeven Mined Cut-off Grade | | g/t | | 1.94 |
MarginalIn-situCut-off Grade | | g/t | | 1.89 |
Marginal MinedCut-off Grade | | g/t | | 1.60 |
14.16 Other Minor Satellites
At Loulo, there are additional small satellite deposits with historic Mineral Resources declared on them by Randgold. These deposits have not had exploration or Mineral Resource updates undertaken on them recently and constitute approximately 1% of the total contained gold ounces. Some of the minor satellite deposits have been partially mined at the surface for the soft oxide material. This was depleted from the Mineral Resources. These satellites are:
These satellite deposits were sampled with a mixture of RC, diamond drilling, and trenching. Vertical sections were generated in Gemcom software on 12.5 m to 25 m spacing depending on the extents of the deposit and the drilling density. Hanging wall and footwall intersections were marked on the sections and the resultant strings were used to generate 3D mineralisation solids.
| | |
| 18th September 2018 | | Page 182 |
| | | | |
| | Loulo-Gounkoto Gold Mine Complex NI 43-101 Technical Report | | |
The mineralisation solids were clipped to the topographic surface and, where required, clipped to a basal surface that was generated at a distance below the bottom drill hole intercept. Weathering data obtained from drill sample logging was used to create surfaces tosub-domain the mineralisation solids into saprolite, transitional and fresh rock. Un-mineralised dykes were logged at some of the deposits, which were wireframes independently and used tocookie-cut the mineralisation wireframes.
Mineralised drill hole intercepts within the domain wireframes were composited, typically on1.0 m or 2.0 m lengths dependent on the Project. Composite sample datasets were reviewed to determine outliers fortop-cutting purposes. These analyses included histograms, log probability plots, and mean and variance plots. Where a dataset was observed to warranttop-cutting then this was applied to the composites. Not all datasets requiredtop-cutting.
Density measurements for each deposit were applied separately for the saprolite, transitional and fresh material. Where density measurements had not been collected for an individual deposit, the values obtained from another proximal deposit were applied.
Block models were generated using block sizes appropriate to the dimensions of the deposit and the drill hole spacing. Block models were interpolated primarily using OK, although some limited inverse distance weighting was used. Several passes of the search ellipsoids were used to ensure that every block was interpolated. Each subsequent run typically had a larger search volume and/or lower minimum sample number criteria.
The resultant block models were typically classified as Inferred Mineral Resources as a result of the low drill density and geological continuity. P129 and P125L3 contained sufficient drill densities to have kriging efficiencies and slope of regression values that would support an Indicated classification. In these areas, Indicated classification wireframes were generated to constrain the higher confidence material to improve continuity.
All minor satellite Mineral Resources were reported within a $1,500/oz pit shell at a 0.5 g/t Aucut-off.
The QP has confidence that these Mineral Resources were estimated with an appropriate level of accuracy and that the input data is valid and supports a Mineral Resource estimate. These minor satellite deposits do not have Ore Reserves declared on them. These deposits remain as suitable targets for expansion in future exploration.
14.17 Mineral Resources Reporting
The Mineral Resource estimates have been prepared according to the guidelines of the Australasian Code for Reporting of Exploration Results, Mineral Resources and Ore Reserves standards and guidelines published and maintained by the Joint Ore Reserves Committee of the Australasian Institute of Mining and Metallurgy and the Australian Institute of Geoscientists and Minerals Council of Australia (the JORC (2012) Code). Randgold has reconciled the Mineral Resources and Ore Reserves to Canadian Institute of Mining, Metallurgy and Petroleum (CIM)
| | |
| 18th September 2018 | | Page 183 |
| | | | |
| | Loulo-Gounkoto Gold Mine Complex NI 43-101 Technical Report | | |
2014 Definition Standards for Mineral Resources and Mineral Reserves dated May 10, 2014 (CIM (2014) Standards) as incorporated with NI43-101 and there are no material differences.
The block model domains are filtered prior to reporting the Mineral Resource, to exclude anylow-grade areas that are unlikely to meet the criteria of having a reasonable prospect of eventual economic extraction.
All block model reports are generated using the “au_ok” field and are combined with other attributes flagged within the model depending on the purpose of the report.
The resource model was depleted using end of month 31st December 2017 surveyed surfaces before reporting the 2017 declared Mineral Resources.
Thecut-off grade selected for limiting each of the Mineral Resources corresponds to the insitu marginalcut-off grade using a gold price of $1,500/oz.
For the open pit Mineral Resources, the pit shell selected for limiting of each of the Mineral Resources corresponds to a gold price of $1,500/oz. As a result of the optimisation process, this pit shell selection will result in the highest undiscounted net present value of the deposit, at $1,500/oz.
Underground panels were reviewed and those that were deemed as having a reasonable prospect of eventual economic extraction were included in the reported Mineral Resource.
The QP is not aware of any environmental, permitting, legal, title, socioeconomic, marketing, fiscal, metallurgical, or other relevant factors, which could materially affect the Mineral Resource estimate.
Loulo
Table14-58 provides a detailed breakdown of the Loulo Mineral Resources including satellite deposits. The resource model was depleted using end of month 31st December 2017 surveyed surfaces before reporting the 2017 declared Mineral Resources.
As of 31st December 2017, the open pit Measured and Indicated Mineral Resources are 10.5 Mt at 2.8 g/t Au for 0.94 Moz.
The total underground Measured and Indicated Mineral are 43 Mt at 5.1g/t Au for 6.9 Moz.
Gounkoto
Table14-59 provides a detailed breakdown of the Gounkoto Mineral Resources including Faraba. The resource model was depleted using end of month 31st December 2017 surveyed surfaces before reporting the 2017 declared Mineral Resources.
As of 31st December 2017, the total Measured and Indicated Mineral Resources within the open pit and stockpiles are 25 Mt at 4.0 g/t Au giving 3.2 Mo Au.
| | |
| 18th September 2018 | | Page 184 |
| | | | |
| | Loulo-Gounkoto Gold Mine Complex NI 43-101 Technical Report | | |
The underground Measured and Indicated Mineral Resources are 3.0 Mt at 5.7 g/t Au giving 0.56 Moz Au.
In the QP’s opinion there are no environmental, permitting, legal, title, fiscal, socioeconomic, marketing, or other relevant factors which could materially impact the Gounkoto Mineral Resources.
| | |
| 18th September 2018 | | Page 185 |
| | | | |
| | Loulo-Gounkoto Gold Mine Complex NI 43-101 Technical Report | | |
Table14-58 Loulo Total Declared Resources as of 31st December 2017
| | | | | | | | | | | | | | | | | | | | | | | | | | |
Mineral Resource | | Cut-off Grade (g/t Au) | | Measured | | Indicated | | Measured + Indicated | | Inferred |
| | Tonnes
(Mt) | | Grade
g/t | | Gold
(Moz) | | Tonnes
(Mt) | | Grade
g/t | | Gold
(Moz) | | Tonnes
(Mt) | | Grade
g/t | | Gold
(Moz) | | Tonnes
(Mt) | | Grade
g/t | | Gold (Moz) |
Open Pit |
Stockpiles | | 0.00 | | 1.7 | | 1.60 | | 0.086 | | | | | | | | 1.7 | | 1.60 | | 0.086 | | | | | | |
Loulo 3 | | 0.73 | | 0.31 | | 3.82 | | 0.038 | | 2.5 | | 4.30 | | 0.34 | | 2.8 | | 4.25 | | 0.38 | | 0.77 | | 5.2 | | 0.13 |
Baboto | | 0.65 | | 1.6 | | 2.45 | | 0.13 | | 1.5 | | 2.34 | | 0.11 | | 3.1 | | 2.40 | | 0.24 | | 0.14 | | 2.4 | | 0.011 |
Gara West | | 0.75 | | | | | | | | 2.6 | | 2.35 | | 0.20 | | 2.6 | | 2.35 | | 0.20 | | 0.32 | | 2.6 | | 0.026 |
P129 | | 0.50 | | | | | | | | 0.14 | | 3.42 | | 0.016 | | 0.14 | | 3.42 | | 0.016 | | 0.19 | | 2.8 | | 0.017 |
P125L3 | | 0.50 | | | | | | | | 0.16 | | 2.51 | | 0.013 | | 0.16 | | 2.51 | | 0.013 | | 0.045 | | 2.4 | | 0.0036 |
P129QT | | 0.50 | | | | | | | | | | | | | | | | | | | | 0.11 | | 2.6 | | 0.0091 |
Loulo 1 | | 0.50 | | | | | | | | | | | | | | | | | | | | 0.45 | | 2.4 | | 0.035 |
Loulo 2 and L2L3Gap | | 0.50 | | | | | | | | | | | | | | | | | | | | 0.45 | | 1.8 | | 0.027 |
| | | | | | | | | | | | | | | | | | |
PQ10 | | 0.50 | | | | | | | | | | | | | | | | | | | | 0.056 | | 3.9 | | 0.0071 |
Loulo OP Total | | 3.6 | | 2.18 | | 0.25 | | 6.9 | | 3.08 | | 0.69 | | 11 | | 2.77 | | 0.94 | | 2.5 | | 3.3 | | 0.27 |
Underground |
Gara | | 1.89 | | 9.3 | | 4.60 | | 1.4 | | 14 | | 4.42 | | 2.0 | | 23 | | 4.49 | | 3.4 | | 2.4 | | 3.9 | | 0.30 |
Yalea | | 2.04 | | 7.3 | | 5.48 | | 1.3 | | 12 | | 6.06 | | 2.3 | | 19 | | 5.84 | | 3.6 | | 7.4 | | 4.2 | | 1.0 |
Loulo UG Total | | 17 | | 4.99 | | 2.7 | | 26 | | 5.18 | | 4.3 | | 43 | | 5.10 | | 7.0 | | 9.8 | | 4.1 | | 1.3 |
Open + Underground |
Total Resources | | 20 | | 4.49 | | 2.9 | | 33 | | 4.73 | | 5.0 | | 53 | | 4.64 | | 7.9 | | 12 | | 3.9 | | 1.6 |
Mineral Resources are reported on an 100% basis.
The Mineral Resource estimate has been prepared according to JORC (2012) Code. Randgold has reconciled the Mineral Resources to CIM (2014) Standards, and there are no material differences.
All Mineral Resource tabulations are reported inclusive of that material which is then modified to form Ore Reserves.
Open pit Mineral Resources are those within a $1,500/oz pit shell.
Underground Mineral Resources are those below the $1,500/oz pit shell.
Mineral Resources for Gounkoto were generated by Mr Simon Bottoms, CGeol, an officer of the company and Qualified Person.
Numbers may not add due to rounding.
| | |
| 18th September 2018 | | Page 186 |
| | | | |
| | Loulo-Gounkoto Gold Mine Complex NI 43-101 Technical Report | | |
Table14-59 Gounkoto Total Declared Resources as of 31st December 2017.
| | | | | | | | | | | | | | | | | | | | | | | | | | |
Mineral
Resource | | Cut-Off Grade (g/t) | | Measured | | Indicated | | Measured + Indicated | | Inferred |
| | Tonnes
(Mt) | | Grade g/t | | Gold
(Moz) | | Tonnes
(Mt) | | Grade g/t | | Gold
(Moz) | | Tonnes
(Mt) | | Grade g/t | | Gold
(Moz) | | Tonnes
(Mt) | | Grade g/t | | Gold
(Moz) |
Open Pit |
Stockpiles | | 0.00 | | 1.8 | | 1.96 | | 0.11 | | | | | | | | 1.8 | | 1.96 | | 0.11 | | | | | | |
Gounkoto | | 0.80 | | 5.4 | | 4.33 | | 0.75 | | 14 | | 4.64 | | 2.0 | | 19 | | 4.55 | | 2.8 | | 1.2 | | 2.32 | | 0.09 |
Faraba | | 0.88 | | | | | | | | 4.3 | | 2.14 | | 0.29 | | 4.3 | | 2.14 | | 0.29 | | 0.2 | | 2.35 | | 0.01 |
| Gounkoto OP Total | | | | 7.1 | | 3.75 | | 0.86 | | 18 | | 4.04 | | 2.3 | | 25 | | 3.96 | | 3.2 | | 1.4 | | 2.32 | | 0.11 |
Underground |
Gounkoto | | 2.00 | | | | | | | | 3.0 | | 5.74 | | 0.56 | | 3.0 | | 5.74 | | 0.56 | | 2.6 | | 3.51 | | 0.29 |
| Gounkoto UG Total | | | | | | | | | | 3.0 | | 5.74 | | 0.56 | | 3.0 | | 5.74 | | 0.56 | | 2.6 | | 3.51 | | 0.29 |
Open + Underground |
Total Resources | | | | 7.1 | | 3.75 | | 0.86 | | 21 | | 4.28 | | 2.9 | | 28 | | 4.15 | | 3.7 | | 4.0 | | 3.09 | | 0.40 |
The Mineral Resource estimate has been prepared according to JORC (2012) Code. Randgold has reconciled the Mineral Resources to CIM (2014) Standards, and there are no material differences.
Mineral Resources are reported on a 100% basis.
All Mineral Resources tabulations are reported inclusive of that material which is then modified to form Ore Reserves.
Open pit Mineral Resources are the insitu Mineral Resources falling within the $1,500/oz pit shells reported at a 0.80 g/t Aucut-off at Gounkoto and 0.88 g/t Aucut-off at Faraba.
Underground Mineral Resources are those insitu Mineral Resources within the ‘Jog Zone’ below the $1,500/oz pit shell reported at 2.0 g/t Aucut-off.
Mineral Resources for Gounkoto were generated by Simon Bottoms, CGeol, an officer of the company and Qualified Person.
| | |
| 18th September 2018 | | Page 187 |
| | | | |
| | Loulo-Gounkoto Gold Mine Complex NI 43-101 Technical Report | | |
14.18 Comparison to Previous Models
Annual comparisons are completed to review the changes in the reported Mineral Resources due to model, depletion, andcut-off grade, where a 2017 model calculation using the previously declared resource is compared to the actual declared 2017 Mineral Resources.
Loulo
Yalea
Table14-60 shows the comparison between the 2017 declared Mineral Resource and the 2016 declared Mineral Resource.
Table14-60 Yalea 2017/2016 Mineral Resource Comparison
| | | | | | |
| Change | | Tonnes | | Au Grade (g/t) | | Au Ounces |
2016 Declared Resource | | 26,789,377 | | 5.62 | | 4,836,579 |
| | | | | | | |
2017 Depletion | | 1,502,269 | | 8.18 | | 395,020 |
Changes Due to Model | | 1,426,638 | | 3.93 | | 180,395 |
Changes Due toCut-off Grade | | 0 | | 0.00 | | 0 |
2017 Model Calculation | | 26,713,746 | | 5.38 | | 4,621,954 |
| | | | | | | |
2017 EOY Projected Resources | | 26,713,746 | | 5.38 | | 4,621,954 |
| | | | | | | |
Model Calculation vs Declared Resource Variance | | 0 | | 0 | | 0 |
2016 vs 2017 Resources | | 0% | | -4% | | -4% |
The 180 koz Au increase can be broken up into:
| | ● | | +432 koz gain in Yalea South from conversion drilling at higher grades defining inner edge of Yalea Southhigh-grade plunge and upgrading Inferred resources to Indicated. |
| | ● | | +90 koz gain in Yalea North from wider GC intersections than previously modelled. |
| | ● | | -100 koz loss at ‘Purple Patch’ because of relatively lower grade data added (added data mean of 7.64 g/t Au). |
| | ● | | -62.5 koz loss in ‘Purple Patch’ from density estimation and sub domaining of high- andlow-density domains |
| | ● | | -176 koz loss from Yalea North Central Deep Inferred with estimation and variogram update to prevent smearing of high-grade at depth. |
| | |
| 18th September 2018 | | Page 188 |
| | | | |
| | Loulo-Gounkoto Gold Mine Complex NI 43-101 Technical Report | | |
Gara
Table14-61 shows the comparison between the 2016 declared Mineral Resource and the 2017 declared Mineral Resource.
Table14-61 Gara 2017/2016 Mineral Resource Comparison
| | | | | | | | | | |
| Change | | Tonnes | | Au Grade (g/t) | | | Au Ounces | |
2016 Declared Resource | | 25,695,030 | | | 4.29 | | | | 3,546,201 | |
| | | | | | | | | | | |
2017 Depletion | | 1,181,286 | | | 3.75 | | | | 142,315 | |
Changes Due to the Model | | 1,153,457 | | | 6.86 | | | | 254,478 | |
Changes Due toCut-off Grade | | 0 | | | - | | | | 0 | |
2017 Model Calculation | | 25,667,201 | | | 4.43 | | | | 3,658,365 | |
| | | | | | | | | | | |
2017 EOY Projected Resources | | 25,667,201 | | | 4.43 | | | | 3,658,365 | |
| | | | | | | | | | | |
Model Calculation vs Declared Resource Variance | | 0.00% | | | 0.00% | | | | 0.00% | |
2016 vs 2017 Resources | | 0.00% | | | 3% | | | | 3% | |
The 180 koz gain Is the result of:
| | ● | | +174 koz gain from GFSE conversion drilling (domain 9605) converting previously Inferred resources to Indicated. |
| | ● | | +80.5 koz gain in from wider GC intersections than previously modelled (including 36 koz gain within fold nose area of domain 8000). |
Loulo 3
At Loulo 3 there were no model updates during 2017 or 2016, therefore the Mineral Resource remains the same as declared in 2016. Table14-62 shows the insitu resource comparison between the 2016 and 2017 declarations.
Table14-62 Loulo 3 2017/2016 Mineral Resource Comparison
| | | | | | | | |
| Change | | Tonnes | | Au Grade (g/t) | | Au Ounces | |
2016 Declared Resource | | 3,572,626 | | 4.46 | | | 512,411 | |
| | | | | | | | | |
2017 Depletion | | - | | - | | | - | |
Changes Due to the Model | | - | | - | | | - | |
Changes Due toCut-off Grade | | 0 | | - | | | 0 | |
2017 Model Calculation | | 3,572,626 | | 4.46 | | | 512,411 | |
| | | | | | | | | |
2017 EOY Projected Resources | | 3,572,626 | | 4.46 | | | 512,411 | |
| | | | | | | | | |
Model Calculation vs Declared Resource Variance | | 0.00% | | 0.00% | | | 0.00% | |
2016 vs 2017 Resources | | 0.00% | | 3% | | | 3% | |
| | |
| 18th September 2018 | | Page 189 |
| | | | |
| | Loulo-Gounkoto Gold Mine Complex NI 43-101 Technical Report | | |
Baboto
Since the 2016 Mineral Resource declaration, Baboto North was transferred to Endeavour Mining Corporation. Table14-63 details shows the insitu resource comparison between 2016 and 2017 declaration.
Table14-63 Baboto 2017/2016 Mineral Resource Comparison
| | | | | | |
| Change | | Tonnes | | Au Grade (g/t) | | Au Ounces |
2016 Declared Resource | | 5,825,615 | | 2.13 | | 399,421 |
| | | | | | | |
2017 Depletion | | 0 | | - | | 0 |
Changes Due to the Removal of Baboto North | | -1,924,096 | | 1.62 | | -100,173 |
Changes Due to Model | | -387,594 | | 1.75 | | -21,865 |
Changes Due toCut-off Grade | | 97,113 | | 0.69 | | 2,165 |
Changes Due to Density | | -334,013 | | 2.52 | | -27,039 |
2017 Model Calculation | | 3,277,025 | | 2.40 | | 252,509 |
| | | | | | | |
2017 EOY Projected Resources | | 3,277,025 | | 2.40 | | 252,613 |
| | | | | | | |
Model Calculation vs Declared Resource Variance | | 0.00% | | 0.04% | | 0.04% |
2016 vs 2017 Resources | | -44% | | 12% | | -37% |
A total reduction of 146,808 koz Au is attributable to:
| | ● | | -100 koz from sale of Baboto North to Endeavour Mining |
| | ● | | -22 koz due to changes in the modelling of the mineralisation which had the affect of increasing the grade slightly |
| | ● | | +2 koz increase reduction ofcut-off grade from 0.73 g/t Au to 0.65 g/t Au as result of processing cost decreases |
| | ● | | -27 koz from reduction in density values of saprolite and transition from 1.95 g/cm3 to 1.62 g/cm3 and 2.34 g/cm3 to 2.19 g/cm3 as a result of additional drilling to target density coverage |
Gara West
There were no model updates or depletion during 2017, so the Mineral Resource remains the same as declared in 2016 (Table14-64).
Table14-64 Gara West 2017/2016 Mineral Resource Comparison
| | | | | | |
| Change | | Tonnes | | Au Grade (g/t) | | Au Ounces |
2016 Declared Resource | | 2,954,753 | | 2.37 | | 225,608 |
| | | | | | | |
2017 Depletion | | - | | - | | - |
Changes Due to the Model | | - | | - | | - |
Changes Due toCut-off Grade | | 0 | | - | | 0 |
2017 Model Calculation | | 2,954,753 | | 2.37 | | 225,608 |
| | | | | | | |
2017 EOY Projected Resources | | 2,954,753 | | 2.37 | | 225,608 |
| | | | | | | |
Model Calculation vs Declared Resource Variance | | 0.00% | | 0.00% | | 0.00% |
2016 vs 2017 Resources | | 0.00% | | 3% | | 3% |
| | |
| 18th September 2018 | | Page 190 |
| | | | |
| | Loulo-Gounkoto Gold Mine Complex NI 43-101 Technical Report | | |
Gounkoto
Gounkoto Open Pit
Table14-65 shows the changes from the 2016 Gounkoto open pit resources and the 2017 declared resources.
Table14-65 Gounkoto Open Pit 2017/2016 Mineral Resource Comparison
| | | | | | |
| Change | | Tonnes | | Grade (g/t) | | Au Ounces |
| Stockpile as of 31stDecember 2016 | | 1,744,285 | | 2.2 | | 123,547 |
| Gounkoto Main 2016 Insitu Resources | | 21,617,371 | | 4.36 | | 3,029,450 |
| Faraba 2016 Insitu Resources | | 4,453,286 | | 2.15 | | 307,700 |
| OP 2016 Declared Insitu Total Gounkoto Resources | | 27,814,941 | | 3.87 | | 3,460,697 |
| | | | | | | |
| Gounkoto Main Depletion (Jan 17 to Dec 17) | | 2,409,894 | | 4.47 | | 346,476 |
| Total Model Change | | 930,793 | | 5.94 | | 177,648 |
| Density Change | | 0 | | 0 | | 0 |
| Economic Change | | 0 | | 0 | | 0 |
| Pit Change | | 0 | | 0 | | 0 |
| | | | | | | |
| 2017 Model Calculation | | 20,138,270 | | 4.42 | | 2,860,623 |
| Stockpile as of 31stDecember 2017 | | 1,761,603 | | 1.96 | | 111,212 |
| Gounkoto Main 2017 Insitu Resources | | 20,177,638 | | 4.41 | | 2,863,320 |
| Faraba 2017 Insitu Resources | | 4,453,286 | | 2.15 | | 307,700 |
| OP 2017 Declared Insitu Gounkoto Resources | | 26,392,527 | | 3.87 | | 3,282,232 |
| | | | | | | |
| Model Calculation vs Declared Resource Variance | | 0.20% | | -0.10% | | 0.10% |
| 2016 vs 2017 Resources | | -5.11% | | -0.05% | | -5.16% |
A total reduction of 178 koz of gold is attributable to:
| | ● | 65% of the model change gain is from MZ1 due to the higher grades returned from 2017 infill grade control drilling in the dilation zone. |
| | ● | MZ3 ounces gain as a result of the thinning of the mineralisation and higher than previously estimated grades returned by the deep diamond drilling targeting the high-grade zone seat at the bottom of the Super Pit. |
| | ● | HW tonnes and ounces gain due to the GC drilling which widened HW1 as well as three new branches being added to the model |
| | ● | MZ4 tonnes and ounces gain due to the extension of the domains over 100 m toward the south. |
| | |
| 18th September 2018 | | Page 191 |
| | | | |
| | Loulo-Gounkoto Gold Mine Complex NI 43-101 Technical Report | | |
Gounkoto Underground
Table14-66 outlines the comparison between the 2016 and 2017 Gounkoto underground estimates.
Table14-66 Gounkoto Underground 2017/2016 Mineral Resource Comparison
| | | | | | |
| Change | | Tonnes | | Grade (g/t) | | Au Ounces |
Gounkoto UG Resource 2016 | | 5,683,872 | | 4.78 | | 872,909 |
| | | | | | | |
Depletion | | 0 | | 0 | | 0 |
Total Model Change | | -47,500 | | 10.44 | | -15,936 |
Density Change | | 0 | | 0 | | 0 |
Economic Change | | 0 | | 0 | | 0 |
Underground Area Change | | -45,738 | | 6.77 | | -9,959 |
| | | | | | | |
2017 Model Calculation | | 5,590,635 | | 4.71 | | 847,014 |
UG 2017 Declared Insitu Gounkoto Resources | | 5,590,635 | | 4.71 | | 847,014 |
| | | | | | | |
2017In-situ Mineral Resources vs 2016 DeclaredIn-situ Mineral Resources | | -1.60% | | -1.30% | | -3.00% |
The change between the estimates is a result of:
| | ● | | Deepening of Life of Mine open pit which converted underground resources to open pit. |
| | ● | | Changes to MZ3 thickness from new data |
Faraba
No model changes or depletion has been undertaken in 2017, therefore, the Mineral Resources are the same as declared in (Table14-67).
Table14-67 Faraba 2017/2016 Mineral Resource Comparison
| | | | | | |
| Change | | Tonnes | | Grade (g/t) | | Au Ounces |
Faraba OP Resource 2016 | | 4,453,286 | | 2.15 | | 307,700 |
| | | | | | | |
Depletion | | 0 | | 0 | | 0 |
Total Model Change | | 0 | | 0 | | 0 |
Density Change | | 0 | | 0 | | 0 |
Cut-Off Grade Change | | 0 | | 0 | | 0 |
| | | | | | | |
2017 Model Calculation | | 4,453,286 | | 2.15 | | 307,700 |
OP 2017 Declared Insitu Faraba Resources | | 4,453,286 | | 2.15 | | 307,700 |
| | | | | | | |
2017In-situ Mineral Resources vs 2016 DeclaredIn-situ Mineral Resources | | 0% | | 0% | | 0% |
| | |
| 18th September 2018 | | Page 192 |
| | | | |
| | Loulo-Gounkoto Gold Mine Complex NI 43-101 Technical Report | | |
14.19 Reconciliation
Randgold has a standard weekly, end of month (EOM) and end of quarter (EQ) production measurement system that reports and provides reconciliation between grade control and the monthly mine production.
The Loulo and Gounkoto measurement system tracks daily, weekly, monthly, quarterly and year to date production Grade Control results versus the Plant. The system tracks both underground and open pit domains production against the block model. Summary reports are prepared weekly, monthly, and quarterly.
The reconciliation between GC call and Plant check out showed a moderate to poor reconciliation during 2017 mainly linked to the over-calling of underground-mined tons. Some of issues have been investigate and fixed (broken and crushed materials density fixed during the year), but the remaining issue that was resolved with the November 2017 Yalea resource model was the modelled insitu density at Yalea in PP.
Within the 2017 Mineral Resource estimate this was adjusted by utilising a single pass ID2 interpolated density rather than a default value in the lower area of Yalea PP. After a single pass estimation, the mean density for each sub domain was then assigned to theun-estimated portion.
The resultant impact of the of the density estimate was a reduction of 264 kt for 62.5 koz metal loss relative to the previous single density assignment of 3.1 g/cm3 within the ‘Purple Patch’, but with a directly associated 5% improvement on the mine call factor oz reconciliation for 2017 (Table14-68).
Table14-68 Loulo Gounkoto MCF 2017 EOY Reconciliation (Old assign density LEFT and new estimated density + domain assign RIGHT)
| | | | | | | | | | | | | | |
| Dept | | Recon Ore Mine, Stockpiles and Plant Out | | Assigned Density | | Estimated Density |
| | Tons | | Grade | | Ounces | | Tons | | Grade | | Ounces |
GC | | Mine | | 5,027,562 | | 5.24 | | 846,862 | | 5,027,562 | | 5.24 | | 846,862 |
GC | | Stockpile Change | | -64,908 | | 9.60 | | -20,025 | | -64,908 | | 9.60 | | -20,025 |
GC | | GC Actual Feed | | 5,117,531 | | 5.22 | | 859,229 | | 5,117,531 | | 5.22 | | 859,229 |
GC | | Scats Stock Change | | -54,323 | | 2.12 | | -3,711 | | -54,323 | | 2.12 | | -3,711 |
Plant | | Cone Change | | -4,806 | | 18.98 | | -2,932 | | -4,806 | | 18.98 | | -2,932 |
GC | | GC Call | | 5,176,661 | | 5.19 | | 863,645 | | 5,176,661 | | 5.19 | | 863,645 |
GC | | Plant Check Out | | 4,918,317 | | 4.96 | | 784,877 | | 4,918,317 | | 4.96 | | 784,877 |
GC vs Plant | | MCF (%) GC Call vs Plant Check In | | 95 | | 94 | | 89 | | 96 | | 98 | | 95 |
GC vs Plant | | MCF (%) GC Call vs Plant Check Out | | 95 | | 96 | | 91 | | 96 | | 100 | | 96 |
If the density at PP had not been adjusted this would have been a material impact on the 2018 mine plan as 63% of underground stopes planned fall in the PP, and most of those are in the fringe area where the density is lower than that of the average for PP (3.1 g/cm3).
| | |
| 18th September 2018 | | Page 193 |
| | | | |
| | Loulo-Gounkoto Gold Mine Complex NI 43-101 Technical Report | | |
14.20 External Audits
Loulo
An external audit was completed in January 2015 of the Yalea and Gara Mineral Resources by QG.
QG concluded that following their site visit and reviews of the geology and Mineral Resource that:
QG is confident that the 2014 Yalea and Gara Mineral Resources are free of material error. Classification of some of the Indicated Resources at Yalea and particularly Gara is at the limit of Indicated and requires further drilling without necessarily changing/improving the classification.
There are no issues that QG consider need immediate attention. Any recommendations made are more for long term improvement in processes and understanding. QG notes that Randgold has built a strong team to drive the resource estimation process with good, capable practitioners on the ground.
QG considered that both the broad and local geology at both Yalea and Gara is well understood and that Randgold has a strong and capable team on the ground.
QG outlined several areas where incremental improvements of the procedures that could be undertaken. QG’s principal concern was around the extent of drilling within the Indicated material. Since this review was undertaken, significant drilling has been undertaken which has addressed this concern. Other minor improvements included:
| | ● | | Use of a certified weight for calibration during bulk density measurements. |
| | ● | | Logging directly into a digital system on rugged computers. |
| | ● | | Reduce the number of different CRM’s being used at any one time. |
| | ● | | Review QA/QC on periods longer than nine months. |
| | ● | | Undertake a trial estimate where density values are estimated into the block model. |
| | ● | | Applying dynamic anisotropy to estimations to reduce the complexity of orientation domains applied. |
All the recommendations made by QG have either been completed, are in the process of being updated, or have been tested and reviewed by Randgold.
| | |
| 18th September 2018 | | Page 194 |
| | | | |
| | Loulo-Gounkoto Gold Mine Complex NI 43-101 Technical Report | | |
Gounkoto
An external audit completed in February 2015 by QG. QG concluded that the“Gounkoto Mineral Resource is free of error”. QG principle concern with Gounkoto was the geological complexity of the deposit, compared to Yalea and Gara, which warranted additional drilling prior to the development of Gounkoto Underground. QG did note that the broad Gounkoto geology was well understood.
The results concluded that the defining of alteration, veining, mineralisation, and package boundaries was well understood. They note that the Gounkoto geologists have used a conservative approach during wireframing by using alteration as a means of limiting domain boundaries. Although this can result in the exclusion of somelow-grade, inter-alteration assays, this can be classed as a positive methodology if it is mined underground as ‘decisions will more often than not be made on observation not sampling’.
Since this review has taken place, significant additional drilling has taken place to improve confidence in the geological models and the Gounkoto Life of Mine open pit shell has been extended significantly as part of the ‘Super Pit’, which has converted underground resources into open pit resources. In 2016, an independentpre-feasibility study (PFS) was undertaken by Piran Mining Pty Ltd to evaluate the Gounkoto Underground. This PFS deemed that underground mining could be profitable to 540 m below the surface at a $1,000/oz gold price.
Other incremental changes to the Randgold procedures included:
| | ● | | Use of calibrated weights for density measurements |
| | ● | | Reduction in quantity of different CRMs being used |
| | ● | | Applying dynamic anisotropy to estimations to reduce the complexity of orientation domains applied. |
All the recommendations made by QG have either been completed, are in the process of being updated, or have been tested and reviewed by Randgold.
14.21 Discussion
The QP is of the opinion that the 2017 Mineral Resource estimates are free of material error and are a true reflection of the geology and mineralisation that has been observed at both Loulo and Gounkoto.
Randgold plant to implement dynamic anisotropy in folded bodies during the 2018 Mineral Resource updates to reduce the complexity of sub-domaining and improve the quality of local estimation.
Future model revisions at Yalea for year end 2018 Mineral Resource updates will include changes within Yalea South Transfer zone with additional drilling that is planned for 2018.
| | |
| 18th September 2018 | | Page 195 |
| | | | |
| | Loulo-Gounkoto Gold Mine Complex NI 43-101 Technical Report | | |
A geological model review and targeted drilling is planned for 2018 for the purposes of defining additional open pit and underground resources at Loulo 3.
Drilling is planned at Yalea Central Deep zone to test the Inferred material with the purpose of increasing the confidence of the estimate within this zone.
In 2018, Yalea South infill grade control drilling is required to target Indicated resources for the purpose of upgrading to Measured Mineral Resources prior to first production which is scheduled in Q4 2018.
Relative Accuracy / Confidence of the 2017 Mineral Resource Estimate
The QP is of the opinion that the input data for the 2017 model updates is accurate and supports the declaration of a Mineral Resource estimate. The resource estimate has followed industry standard practices for collecting, validating, and estimating data.
The application of thorough exploratory data analysis and quantitative neighbourhood kriging analysis gives a high confidence in the Measured and Indicated material in the model. The Inferred material by nature has a relative low level of accuracy, but a high geological confidence to exist.
As Loulo and Gounkoto are operating mines, grade control and advanced grade control drilling have provided a much higher degree of accuracy in the model and the ability to reconcile mine data to compare with the block model. Year on year model comparisons show a very good reconciliation between the theoretical Mineral Resources and the declared Mineral Resources.
External audits completed by QG consultants in early 2015 documented that, at the time, there was no material concerns with the Mineral Resource estimates of either Loulo or Gounkoto. Since these audits were completed, incremental and documented updates have occurred annually. Minor concerns that QG outlines with the complexity of the Gounkoto mineralisation have been addressed with additional drilling, model updates and apre-feasibility study.
Additional grade control drilling in 2017 has confirmed previous model concepts and provided confidence in the Mineral Resource estimate.
| | |
| 18th September 2018 | | Page 196 |
| | | | |
| | Loulo-Gounkoto Gold Mine Complex NI 43-101 Technical Report | | |
The Ore Reserve estimates have been prepared according to the guidelines of the Australasian Code for Reporting of Exploration Results, Mineral Resources and Ore Reserves standards and guidelines published and maintained by the Joint Ore Reserves Committee of the Australasian Institute of Mining and Metallurgy and the Australian Institute of Geoscientists and Minerals Council of Australia (the JORC (2012) Code). Randgold has reconciled the Mineral Resources and Ore Reserves to Canadian Institute of Mining, Metallurgy and Petroleum (CIM) 2014 Definition Standards for Mineral Resources and Mineral Reserves dated May 10, 2014 (CIM (2014) Standards) as incorporated with NI43-101 and there are no material differences.
Definitions for reserve categories used in this report are consistent with those defined by the CIM (2014) Standards and adopted by NI43-101. In the CIM classification, a Mineral Reserve is defined as “those parts of Mineral Resources which, after the application of all mining factors, result in an estimated tonnage and grade which, in the opinion of the QP(s) making the estimates, is the basis of an economically viable project after taking account of all relevant Modifying Factors. Mineral Reserves are inclusive of diluting material that will be mined in conjunction with the Mineral Reserves and delivered to the treatment plant or equivalent facility”. Mineral Reserves are classified into Proved and Probable categories.
The term ‘Ore Reserves’ as used in this report is synonymous with ‘Mineral Reserve’ as defined by the CIM.
The QP has performed an independent verification of the block model tonnes and grade, and in their opinion, the process has been carried out to industry standards
The QP is not aware of any environmental, legal, title, socioeconomic, marketing, mining, metallurgical, fiscal, infrastructure, permitting, that could materially affect the Ore Reserve estimate.
Loulo
The Loulo gold mine consists of two main deposits, Gara and Yalea, and multiple satellites deposits. Both Gara and Yalea are underground mining operations and their Ore Reserves have been updated with the 2017 additional work in drilling and mapping providing further information to improve the geological model for resources estimation.
In addition, the satellite deposit of Baboto has been updated with a new model for the 2017 declaration. No new data has been added to the satellite deposits of Loulo 3 and Gara West since the previous model update, however the models have been updated with the current estimation processes used for Yalea and Gara.
Both the Gara and Yalea models incorporate data from the open pit and underground grade control infill drilling as well as exploration diamond holes. Thecut-off date for data used to create the models is 20th October 2017 for Yalea and 20th November 2017 for Gara. For the Baboto
| | |
| 18th September 2018 | | Page 197 |
| | | | |
| | Loulo-Gounkoto Gold Mine Complex NI 43-101 Technical Report | | |
satellite, data was incorporated until end of 31st May 2017. No drilling that would make a material impact on the Ore Reserve was completed between thecut-off date and the effective date of the Mineral Resource (31st December 2017).
For Loulo, all Mineral Resources model updates since 2014 were prepared using Maptek Vulcan software. Some earlier models of the minor deposits were created in Gemcom and have not been updated yet. Table15-1 summarises the Loulo Ore Reserve estimate as of 31st December 2017.
The total Proved and Probable Ore Reserves estimated for Loulo as of 31st December 2017 are 36 Mt at 4.50 g/t Au containing 5.2 Moz of gold. The Ore Reserves consist of surface stockpiles, Loulo open pit (OP) and underground (UG) Ore Reserves.
Table15-1 Loulo Gold Mine Ore Reserve Statement as of 31st December 2017
| | | | | | | | | | |
Source | | Ore Reserve | | Tonnes
(Mt) | | Grade g/t | | Gold (Moz) | | *Attributable
Gold (Moz)* |
| Stockpiles | | Proved | | 1.7 | | 1.60 | | 0.086 | | 0.068 |
| | | Proved | | 1.5 | | 2.43 | | 0.12 | | 0.093 |
| Open Pit | | Probable | | 3.9 | | 3.87 | | 0.48 | | 0.39 |
| | | Proved + Probable | | 5.4 | | 3.47 | | 0.60 | | 0.48 |
| | | Proved | | 8.8 | | 4.97 | | 1.4 | | 1.1 |
| Underground | | Probable | | 20 | | 4.82 | | 3.1 | | 2.5 |
| | | Proved + Probable | | 29 | | 4.87 | | 4.5 | | 3.6 |
| | | Proved | | 12 | | 4.18 | | 1.6 | | 1.3 |
| Total | | Probable | | 24 | | 4.67 | | 3.6 | | 2.9 |
| | | Proved + Probable | | 36 | | 4.51 | | 5.2 | | 4.1 |
*Attributable gold (Moz) refers to the quantity attributable to Randgold based on Randgold’s 80% interest in the Loulo Gold Mine. Ore Reserves are reported on a 100% and attributable basis.
The Ore Reserve estimate has been prepared according to JORC (2012) Code. Randgold has reconciled the Ore Reserves to CIM (2014) Standards, and there are no material differences.
Open pit Ore Reserves are reported at a gold price of $1,000/oz and an averagecut-off grade of 1.1 g/t Au including dilution and ore loss factors.
Underground Ore Reserves are reported at a gold price of $1,000/oz and acut-off grade of 2.69 g/t Au for Yalea and 2.4 g/t Au for Gara including dilution and ore loss factors.
Open pit and underground Ore Reserves were estimated by Mr. Derek Holm, FSAIMM, an external consultant and Qualified Person.
Numbers may not add due to rounding.
Gounkoto
Three primary sources of ore contribute to the 2017 Gounkoto Ore Reserve. Gounkoto open pit and underground, and Faraba open pit. The Gounkoto open pit and underground models were updated in 2017 as a result of depletion at Gounkoto open pit along with new drilling and model changes for both open pit and underground operations. The Faraba model remains the same as 2016 as no additional work has been undertaken on the deposit.
Thecut-off date for data used in the Gounkoto update is 14th July 2017. All material drilling was included in the Faraba reserve.
All Mineral Resource models for Gounkoto have been created using Maptek Vulcan. Table15-2 summarises the Gounkoto Ore Reserve estimate as of 31st December 2017.
The total Proved and Probable Ore Reserves for Gounkoto as of 31st December 2017 are estimated to be 20 Mt at 4.58 g/t Au containing 3.0 Moz gold.
| | |
| 18th September 2018 | | Page 198 |
| | | | |
| | Loulo-Gounkoto Gold Mine Complex NI 43-101 Technical Report | | |
Table15-2 Gounkoto Gold Mine Ore Reserve Statement as of 31st December 2017
| | | | | | | | | | |
| Source | | Ore Reserve | | Tonnes (Mt) | | Grade g/t | | Gold (Moz) | | Attributable Gold (Moz)* |
Stockpiles | | Proved | | 1.8 | | 1.96 | | 0.11 | | 0.099 |
| | | Proved | | 4.4 | | 4.75 | | 0.66 | | 0.53 |
Open Pit | | Probable | | 12 | | 4.63 | | 1.8 | | 1.4 |
| | | Proved + Probable | | 16 | | 4.66 | | 2.4 | | 1.9 |
| | | Proved | | - | | - | | - | | - |
Underground | | Probable | | 2.2 | | 6.09 | | 0.42 | | 0.34 |
| | | Proved + Probable | | 2.2 | | 6.09 | | 0.42 | | 0.34 |
| | | Proved | | 6.1 | | 3.95 | | 0.78 | | 0.62 |
Total | | Probable | | 14 | | 4.85 | | 2.2 | | 1.7 |
| | | Proved + Probable | | 20 | | 4.58 | | 3.0 | | 2.4 |
*Attributable gold (Moz) refers to the quantity attributable to Randgold based on Randgold’s 80% interest in the Gounkoto Gold Mine. Ore Reserves are reported on a 100% and attributable basis.
The Ore Reserve estimate has been prepared according to JORC (2012) Code. Randgold has reconciled the Ore Reserves to CIM (2014) Standards, and there are no material differences.
Open pit Ore Reserves are reported at a gold price of $1,000/oz and an averagecut-off grade of 1.1 g/t Au including dilution and ore loss factors.
Underground Ore Reserves are reported at a gold price of $1,000/oz and acut-off grade 3.0 g/t Au including dilution and ore loss factors.
Open pit and underground Ore Reserves were estimated by Mr. Derek Holm, FSAIMM, an external consultant and Qualified Person.
Numbers may not add due to rounding.
For reserve and operational discussion, future and current operations are generally grouped under the following structure:
| | ○ | Loulo (no current production) |
| | • | | Baboto (scheduled for 2018) |
| | • | | Gounkoto(pre-feasibility level deposit) |
Some inputs were shared across all the operations during the preparation of the Reserve estimates. Ore Reserves were based on the development of appropriately detailed and engineered LOM plans. All design and scheduling work have been undertaken to an appropriate level of detail by experienced engineers using appropriate mine planning software. The planning process incorporated appropriate modifying factors and the use ofcut-off grades and other
| | |
| 18th September 2018 | | Page 199 |
| | | | |
| | Loulo-Gounkoto Gold Mine Complex NI 43-101 Technical Report | | |
technical-economic investigations. Further, in presenting the Ore Reserve statements and associated sensitivities the following applies:
| | ● | | The Measured and Indicated Mineral Resources are inclusive of Ore Reserves. |
| | ● | | All Ore Reserves are estimated as of 31st December 2017. |
| | ● | | All Ore Reserves are estimated at a gold price of $1,000/oz. |
| | ● | | All Ore Reserves are estimated in terms ofRun-of-Mine (RoM) grades and tonnage as delivered to the metallurgical processing facilities and are fully diluted. |
| | ● | | Ore Reserves include only Measured and Indicated Mineral Resources with appropriate modifying factors applied and are used in the LOM plan. |
| | ● | | All references to Mineral Resources and Ore Reserves are stated in accordance with the JORC (2012) Code and reconciled to CIM (2014) Standards adopted by NI43-101. |
| | ● | | All ounces referred to in this report are Troy ounces, equivalent to 31.10348 grammes. |
| | ● | | Ore Reserves are stated as total Life of Mine tonnes and gold content as well as Life of Mine gold content that is attributable to Randgold due to the percentage of the operation or Project that Randgold owns. |
The JORC (2012) Code allows a limitednon-material quantity of Inferred Resources to be included in an estimate of Ore Reserves or to support a cash flow, however, a small portion (0.8% of the scheduled tonnes) of the Gounkoto Project are classified as Inferred and have been included in the cash flow projection. This is due to the application of practical mining shapes to the resource model during evaluation. This proportion is deemed small enough to be acceptable to be included in the overall Ore Reserve report.
The location of the operations and deposits is shown in Figure5-1 and Figure5-2.
A summary of the Ore Reserves is given in Sections 15.2 to15.5, with a more detailed description of the mine design and modifying factors in Sections15.6-15.9.
| 15.2 | Loulo Open Pit Ore Reserve |
Surface sources at Loulo comprise the Baboto Pit, Loulo 3 Pit, the Gara West Pit, and some stockpiles.
Some of the Baboto pit was mined in 2018, however the rest of Baboto pit and the other pits will be mined from 2024, after the larger Gounkoto pits start to deplete.
A decision was made in 2017 to sell off the northern portion of the Baboto deposit. This has resulted in a reduction of 76 koz Au to the declared Ore Reserve.
As stockpiles are managed and known, they have been classified as Measured Mineral Resources. The stockpiles include material from all the current operations.
The Loulo open pit Ore Reserve estimate is presented in Table15-3. Further details on the stockpile Ore Reserve is presented in Table15-4.
| | |
| 18th September 2018 | | Page 200 |
| | | | |
| | Loulo-Gounkoto Gold Mine Complex NI 43-101 Technical Report | | |
Table15-3 Loulo Open Pit Ore Reserve as of 31st December 2017
| | | | | | | | |
Source | | Ore Reserve | | Tonnes (Mt) | | Gold (g/t) | | Gold (Moz) |
Stockpiles | | Proved | | 1.7 | | 1.60 | | 0.086 |
| | | Proved | | - | | - | | - |
Gara West Pit | | Probable | | 0.86 | | 2.62 | | 0.073 |
| | | Proved + Probable | | 0.86 | | 2.62 | | 0.073 |
| | | Proved | | - | | - | | - |
Loulo 3 Pit | | Probable | | 2.2 | | 4.90 | | 0.35 |
| | | Proved + Probable | | 2.2 | | 4.90 | | 0.35 |
| | | Proved | | 1.5 | | 2.43 | | 0.12 |
Baboto Pit | | Probable | | 0.82 | | 2.40 | | 0.064 |
| | | Proved + Probable | | 2.3 | | 2.40 | | 0.18 |
| | | Proved | | 3.2 | | 1.98 | | 0.21 |
Total | | Probable | | 3.9 | | 3.86 | | 0.48 |
| | | Proved + Probable | | 7.0 | | 3.02 | | 0.69 |
Ore Reserves are reported on a 100% basis.
The Ore Reserve estimate has been prepared according to JORC (2012) Code. Randgold has reconciled the Ore Reserves to CIM (2014) Standards, and there are no material differences.
Open pit Ore Reserves are reported at a gold price of $1,000/oz and an averagecut-off grade of 1.1 g/t Au including dilution and ore loss factors.
Open pit Ore Reserves were estimated by Mr. Derek Holm, FSAIMM, an external consultant and Qualified Person.
Numbers may not add due to rounding.
Table15-4 Loulo Surface Stockpile Ore Reserve as of 31st December 2017
| | | | | | | | | | | | |
Location | | Stockpiles | | Cut-Off
(g/t) | | Tonnes
(kt) | | Gold
(g/t) | | Gold
(koz) |
Rom Pad | | Transition | | Loulo 3 | | >1.36 - 3.23 | | 491 | | 1.59 | | 25 |
| | | | Yalea OC | | >1.09 - 2.60 | | 347 | | 1.48 | | 16 |
| | | | Gara OC | | >1.04 - 2.07 | | - | | - | | - |
| | Fresh | | Yalea UG | | >2.78 | | 0.51 | | 8.46 | | 0.14 |
| | | | Gara UG | | >2.56 | | 0.072 | | 2.99 | | 0.0070 |
| | | | Big Blocks (Gara/Yalea | | >1.09 - 2.60 | | 2.3 | | 2.13 | | 0.16 |
| | Transition | | Yalea OC | | >2.60 | | 2.7 | | 3.13 | | 0.28 |
Rehandle | | Fresh | | Yalea OC | | >1.09 - 2.60 | | 588 | | 1.61 | | 30.35 |
| | Gara OC | | >1.04 - 2.07 | | 182 | | 1.50 | | 8.80 |
| | Big Blocks (Gara/Yalea | | >1.09 - 2.60 | | 13 | | 2.27 | | 0.93 |
Total Ore Stockpiled | | | | | | 1,626 | | 1.57 | | 880.60 |
Plant Cone | | Fresh | | Yalea UG | | >2.78 | | - | | - | | - |
| | Gara UG | | >2.56 | | 1.2 | | 3.50 | | 0.14 |
| | Strategic Cone | | Mixed Ore | | | | 24 | | 2.71 | | 2.10 |
| | Old Cone | | Mixed Ore | | | | 2.5 | | 2.87 | | 0.23 |
| | 3rd Mill Cone | | Mixed Ore | | | | 7.3 | | 3.52 | | 0.83 |
Total Plant Cone | | | | | | 35.2 | | 2.92 | | 35.2 |
Total Stockpile | | | | | | 1,661 | | 1.60 | | 85 |
Stockpiles are reported on a 100% basis.
The Ore Reserve estimate has been prepared according to JORC (2012) Code. Randgold has reconciled the Ore Reserves to CIM (2014) Standards, and there are no material differences.
Stockpiles were estimated by Mr. Derek Holm, FSAIMM, an external consultant and Qualified Person.
Numbers may not add due to rounding.
| | |
| 18th September 2018 | | Page 201 |
| | | | |
| | Loulo-Gounkoto Gold Mine Complex NI 43-101 Technical Report | | |
| 15.3 | Gounkoto Open Pit Ore Reserve |
Surface sources at Gounkoto comprise the Gounkoto pit, also referred to as the ‘Super Pit’, which provides the bulk of the ore, and the Faraba pit. The Faraba pit will be mined from 2022 as the Gounkoto pit production winds down.
The Gounkoto open pit Ore Reserve estimate is presented in Table15-5.
Table15-5 Gounkoto Open Pit Ore Reserve as of 31st December 2017
| | | | | | | | |
| Source | | Ore Reserve | | Tonnes (Mt) | | Gold g/t | | Gold (Moz) |
Stockpiles | | Proved | | 1.8 | | 1.96 | | 0.11 |
Gounkoto Pit | | Proved | | 4.4 | | 4.75 | | 0.66 |
| | Probable | | 9.3 | | 5.19 | | 1.6 |
| | Proved + Probable | | 13 | | 5.05 | | 2.2 |
Faraba Pit | | Proved | | - | | - | | - |
| | Probable | | 2.5 | | 2.51 | | 0.20 |
| | Proved + Probable | | 2.5 | | 2.51 | | 0.20 |
Total | | Proved | | 6.1 | | 3.95 | | 0.78 |
| | Probable | | 12 | | 4.63 | | 1.8 |
| | Proved + Probable | | 18 | | 4.40 | | 2.5 |
Ore Reserves are reported on a 100% basis.
The Ore Reserve estimate has been prepared according to JORC (2012) Code. Randgold has reconciled the Ore Reserves to CIM (2014) Standards, and there are no material differences.
Open pit Ore Reserves are reported at a gold price of $1,000/oz and an averagecut-off grade of 1.1 g/t Au including dilution and ore loss factors.
Open pit Ore Reserves were estimated by Mr. Derek Holm, FSAIMM, an external consultant and Qualified Person.
Numbers may not add due to rounding.
| 15.4 | Loulo Underground Ore Reserve |
Underground sources at Loulo comprise the Yalea and Gara mines. Both of these are currently being mined. No stockpiles have been included as these were included in the Loulo surface Ore Reserves.
The conversion percentage of Measured and Indicated Mineral Resource to Ore Reserve is Yalea 67% and Gara 61%. The Loulo underground Ore Reserve estimate is presented in Table15-6.
| | |
| 18th September 2018 | | Page 202 |
| | | | |
| | Loulo-Gounkoto Gold Mine Complex NI 43-101 Technical Report | | |
Table15-6 Loulo Underground Ore Reserves as of 31st December 2017
| | | | | | | | |
| Source | | Ore Reserve | | Tonnes (Mt) | | Gold (g/t) | | Gold (Moz) |
Yalea Underground | | Proved | | 3.4 | | 6.40 | | 0.71 |
| | Probable | | 10 | | 5.43 | | 1.8 |
| | Proved & Probable | | 13 | | 5.68 | | 2.5 |
Gara Underground | | Proved | | 5.4 | | 4.05 | | 0.70 |
| | Probable | | 10 | | 4.22 | | 1.4 |
| | Proved & Probable | | 15 | | 4.16 | | 2.1 |
Total Loulo Underground | | Proved | | 8.8 | | 4.97 | | 1.4 |
| | Probable | | 20 | | 4.83 | | 3.1 |
| | Proved & Probable | | 29 | | 4.87 | | 4.5 |
Ore Reserves are reported on a 100% basis.
The Ore Reserve estimate has been prepared according to JORC (2012) Code. Randgold has reconciled the Ore Reserves to CIM (2014) Standards, and there are no material differences.
Underground Ore Reserves are reported at a gold price of $1,000/oz and acut-off grade of 2.69 g/t Au for Yalea and 2.4 g/t Au for Gara including dilution and ore loss factors.
Underground Ore Reserves were estimated by Mr. Derek Holm, FSAIMM, an external consultant and Qualified Person.
Numbers may not add due to rounding.
| 15.5 | Gounkoto Underground Ore Reserve |
The Gounkoto Underground project is the only source of underground ore for the Gounkoto underground Ore Reserve estimate, presented by category, in Table15-7.
Table15-7 Gounkoto Underground Project – Total Ore Reserve by Category as of 31st December 2017
| | | | | | | | |
Source | | Ore Reserve | | Tonnes (Mt) | | Gold (g/t) | | Gold (Moz) |
Total Gounkoto Underground | | Proved | | - | | - | | - |
| | Probable | | 2.2 | | 6.09 | | 0.42 |
| | Proved & Probable | | 2.2 | | 6.09 | | 0.42 |
Ore Reserves are reported on a 100% basis.
The Ore Reserve estimate has been prepared according to JORC (2012) Code. Randgold has reconciled the Ore Reserves to CIM (2014) Standards, and there are no material differences.
Underground Ore Reserves are reported at a gold price of $1,000/oz and acut-off grade 3.0 g/t Au including dilution and ore loss factors.
Underground Ore Reserves were estimated by Mr. Derek Holm, FSAIMM, an external consultant and Qualified Person.
Numbers may not add due to rounding.
| 15.6 | Reserves Estimation Process |
The same Ore Reserve estimation process was followed for all the open pits. Where relevant, details have been given for the separate deposits.
The Loulo underground Ore Reserve estimate is based on two operating mines, Yalea and Gara. As such, the operating parameters of those deposits are well known. The Gounkoto underground Ore Reserve estimate is based on aPre-feasibility study with a lower level of confidence. While the design method and parameters for future underground mining are similar, due to the lower level of confidence, these have been tabled separately.
| | |
| 18th September 2018 | | Page 203 |
| | | | |
| | Loulo-Gounkoto Gold Mine Complex NI 43-101 Technical Report | | |
| 15.7 | Geotechnical Parameters |
Loulo Open Pit Operations
A geotechnical assessment was completed by Dr. Peter Gash (Open Pit Slope Design for the Baboto Pits, MineNet, April 2017) on the Baboto deposit in 2017. The results of this assessment have been used to update the Baboto pit design.
A summary of the parameters applied to the Baboto, Loulo 3, and Gara West pit designs is shown in Table15-8.
There is no geotechnical reason to reduce the bench heights to 5 m in soils. This is driven by the contractor’s preferences.
| | |
| 18th September 2018 | | Page 204 |
| | | | |
| | Loulo-Gounkoto Gold Mine Complex NI 43-101 Technical Report | | |
Table15-8 Baboto – Loulo 3 - Gara West - Slope Parameters
| | | | | | | | | | | | | | | | | | | | | | | | |
Area/Sector | | Inter Ramp (°) (crest-
crest) | | Bench Height (m) | | Bench Angle (°) | | Berm (m) |
| | Baboto | | Loulo
3 | | Gara
West | | Baboto | | Loulo
3 | | Gara
West | | Baboto | | Loulo
3 | | Gara
West | | Baboto | | Loulo
3 | | Gara
West |
Soil Slope - Bench Configuration |
Bench stacks for wall up to 40 m (depth <40 m) | | 44 | | 42 | | 46 | | 10 | | 5 | | 5 | | 60 | | 65 | | 60 | | 4.5 | | 3.2 | | 2.0 |
Bench stacks for wall greater 40 m (depth>40 m) | | 40 | | 40 | | 40 | | 10 | | 5 | | 5 | | 60 | | 65 | | 60 | | 6.0 | | 3.5 | | 3.0 |
Saprock Slope - Single Bench Configuration |
Footwall | | 47.4 | | N/A | | 50 | | 10 | | N/A | | 10 | | 75 | | N/A | | 75 | | 6.5 | | N/A | | 5.5 |
Hanging Wall | | 47.4 | | N/A | | 52 | | 10 | | N/A | | 10 | | 75 | | N/A | | 75 | | 6.5 | | N/A | | 5.0 |
Rock Slope - Single Bench Configuration |
Footwall | | 50.7 | | 48.7 | | 50 | | 10 | | 10 | | 10 | | 75 | | 65 | | 75 | | 5.5 | | 3.0 | | 5.5 |
Hanging Wall | | 52.5 | | 49.0 | | 52 | | 10 | | 10 | | 10 | | 75 | | 70 | | 75 | | 5.0 | | 2.9 | | 5.0 |
Rock Slope - Twin Bench Configuration |
Footwall | | 52.5 | | N/A | | N/A | | 10 | | N/A | | N/A | | 75 | | N/A | | N/A | | 8.0 +
2.0
offset | | N/A | | N/A |
Hanging Wall | | 55.9 | | N/A | | N/A | | 10 | | N/A | | N/A | | 80 | | N/A | | N/A | | 8.0 +
2.0
offset | | N/A | | N/A |
| | |
| 18th September 2018 | | Page 205 |
| | | | |
| | Loulo-Gounkoto Gold Mine Complex NI 43-101 Technical Report | | |
Gounkoto Open Pit Operations
The strength of the rock mass at Gounkoto improves moving away from the orebody rocks and into the walls. The weathering profile is deep in the NE, withtop-of-fresh rock averaging approximately 60 m up to a maximum of 80 m depth below original ground surface.
Slopes in soils are controlled by mass stability conditions and are sensitive to both height and water pressure. The design parameters are therefore qualified by slope height and dewatering measures.
Based on experience to date a twin benching configuration for rock and soil slopes was applied, with the following geometry in each sector (Table15-9).
Table15-9 Geotechnical Slope Requirements
| | | | | | | | | | | | | | | | | | | | | | | | |
| Area/Sector | | Soil/Rock | | | Inter
Ramp (°)
(crest-
crest) | | | Bench
Height (m) | | | Bench
Angle (°) | | | Offset (m) | | | Berm
(m) | |
Soil Slope - Bench Configuration | | | | | | | | | | | | | | | | | | | | | | | | |
| Bench stacks for wall up to 40 m (depth <40 m) | | | All | | | | 44 | | | | 10 | | | | 60 | | | | NA | | | | 4.5 | |
| Bench stacks for wall greater 40 m (depth>40 m) | | | All | | | | 40 | | | | 10 | | | | 60 | | | | NA | | | | 6 | |
| | | | | | | | | | | | | | | | | | | | | | | | |
Rock Slope - Single Bench Configuration | | | | | | | | | | | | | | | | | | | | | |
| Footwall + Side wall (North and South) | | | All | | | | 50.7 | | | | 10 | | | | 75 | | | | NA | | | | 5.5 | |
| Hanging Wall (North and South) | | | All | | | | 54 | | | | 10 | | | | 80 | | | | NA | | | | 5.5 | |
| Rock Slope - Twin Bench Configuration | | | | | | | | | | | | | | | | | | | | | |
| Footwall + Sidewall - North | | | All | | | | 52.5 | | | | 10 | | | | 75 | | | | 2 | | | | 8 | |
| Footwall + Sidewall - South | | | All | | | | 51.6 | | | | 10 | | | | 75 | | | | 2 | | | | 8.5 | |
| Hanging Wall (North and South) | | | All | | | | 55.9 | | | | 10 | | | | 80 | | | | 2 | | | | 8 | |
Slope Monitoring
A radar system (IBIS Rover mobile unit) was purchased in 2017 and installed and provides a complete support for the geotechnical interpretation of slope deformation behaviour.
Dewatering for Slope Stability Improvement
A total of 50 boreholes at an average depth of 100 m will be installed for the expansion of the Super Pit.Six-inch submersible pumps will be installed in two thirds of these boreholes with the remainder acting as monitoring boreholes to keep track of the prevailing Ru (ratio of water pressure to soil pressure). This needs to be below 0.5 as a stability condition for saprolite/soil and/or weak rock slopes. In seasons where the Ru may rise above the allowable 0.5, pumps will be installed on the monitoring boreholes to keep the Ru within stable limits.
Most of the rock slope will be developed below the water table and a network/series ofsub-horizontal drains (weep holes) will continue be used to depressurise the wall and improve the stability of the rock slopes. Thesesub-horizontal holes will be drilled at three holes per fan and each hole will be 50 m into the wall. Each fan will be planned targeting water bearing structures. Thesub-horizontal holes will be free draining and pumps will not be installed in such holes.
| | |
| 18th September 2018 | | Page 206 |
| | | | |
| | Loulo-Gounkoto Gold Mine Complex NI 43-101 Technical Report | | |
Loulo Underground Operations
A geotechnical assessment was undertaken by SRK as part of the LouloPre-Feasibility and Feasibility Studies. Since commencement of underground mining, geotechnical assessments have been undertaken by Middindi Consulting Pty Ltd (Middindi) in 2011 (Geotechnical Report on the Stability and Mine Design of Yalea Underground), and more recently by Dempers and Seymour in 2013 (Loulo Underground Geotechnical Review)
Since 2013, a significant amount of geotechnical work has been undertaken for both Yalea and Gara:
| | ● | | Measurement ofpre-mining rock stress. |
| | ● | | Construction of geotechnical rock mass models. |
| | ● | | Modelling (Map3D) of mining induced stresses of proposed mining sequences. |
| | ● | | Creation of stable span stability curves based on analysis of local data. |
| | ● | | Building of the capability of the site geotechnical team. |
| | ● | | Development of a Dilution Rating System (DRS) at Gara only to improve prediction stope geotechnical conditions. |
This work has enabled the refinement of the mine designs. The rock mass models have provided a better understanding of the variability in hanging wall ground conditions at Yalea and Gara. The stoping designs in the mine design have maximum hanging wall or footwall exposure of a hydraulic radius of 10 m (30 m vertical, 50 m along strike with a 65° dip). However, the majority of stoping will use an underhand (top down) with paste fill mining method that has only single height stope exposures with hydraulic radius 8.6 m (25 m vertical). This design is conservative from a hanging wall span perspective, however from an overall mining perspective it has economic benefits. The basic geotechnical parameters of the operations are given in Table15-10.
Table15-10 Basic Geotechnical Parameters for Yalea and Gara
| | | | | | | | |
| Source | | Planned
Height (m) | | Planned Maximum Width (m) | | Maximum
Length (m) | | Hydraulic
radius (m) |
Yalea | | | | | | | | |
Stopes | | 25 | | 5 to 30 | | 30 to 60 | | 7 to 9 |
Pillars | | 20 to 25 | | 5 to 30 | | 10 | | |
Gara | | | | | | | | |
Stopes | | 25 | | 2 to 20 | | 30 | | 7 |
Pillars | | 20 to 25 | | 5 to 20 | | 10 | | |
Gounkoto Underground Operations
Mining Rock Mass Models have been updated for Gounkoto based on the updated structures, lithological wireframes, and the latest drilling data. This current model version is Gounkoto V5 dated September 2016.
D&S was commissioned by Randgold to update the 3D model of geotechnically significant structures and the Mining Rock Mass Model (MRMM) for the Gounkoto Project.
| | |
| 18th September 2018 | | Page 207 |
| | | | |
| | Loulo-Gounkoto Gold Mine Complex NI 43-101 Technical Report | | |
The modelled structures include Fault Gouge, Fault West Dipping, the faults intersecting MZ3 orebody, and the faults in footwall of MZ1 orebody (excluding the Fault Breccia which is not geotechnically significant) have been modified and updated with the geotechnically significant intercepts and used in updating the MRMM. Two wireframes of structure in the footwall of MZ1 do not have any geotechnically significant intercepts were excluded from the MRMM update.
The rock quality and stress to strength ratios expected to be encountered at Gounkoto are predominantly in the moderately fractured, low to intermediate stress regions of the tunnel instability chart, with limited areas of highly fractured conditions. The basic geotechnical parameters of the project are given in Table15-11.
Table15-11 Basic Geotechnical Parameters for Gounkoto
| | | | | | | | |
| Source | | Planned
Height (m) | | Planned Maximum Width (m) | | Maximum
Length (m) | | Hydraulic
radius (m) |
Gounkoto | | | | | | | | |
Stopes | | 23 | | 2.5 to 41 | | 25 | | 6 |
Pillars | | 18 | | 2.1 to 41 | | 25 | | |
The Gounkoto main pit ramp and decline will serve as the main access for a planned underground mine life of six years. However, it is possible that the mine and main infrastructure life may be considerably greater, so geotechnical design standards were increased to cover a longer potential life of over 10 years.
Internationally accepted development surface support standards will be used to minimise the exposure of personnel and equipment to rockfall hazards. Therefore, all support recommendations will comply with the Mines Occupational Safety and Health Advisory Board (MOSHAB, Australia1999) Code of Practice for Surface Rock Support. This code requires surface support (retainment) of any development backs and walls that are greater than 3.5 m above the floor, the height above which check scaling by hand is considered to be impractical.
Ground support recommendations have considered:
| | ● | | The expected stress regime, rock quality and expected modes of tunnel instability. |
| | ● | | Empirical support design methods. |
| | ● | | Potential wedge instability. |
| | ● | | Excavation size and duty. |
15.8 Parameters Affected by Groundwater Control
Loulo Open Pit
The pit slope calculations for all Loulo Open Pits are based on the assumption that the pit slopes will be dry. With this in mind, ground dewatering is planned and implemented well before the start of mining. The only active mining open pit currently at Loulo is the Baboto pit.
| | |
| 18th September 2018 | | Page 208 |
| | | | |
| | Loulo-Gounkoto Gold Mine Complex NI 43-101 Technical Report | | |
At Baboto over much of the planned perimeter, the regolith is relatively shallow and the slope is expected to be stable. However, the North sector of the South Pit has deep penetrative saprolitisation and this sector will require advance dewatering.
The zones for dewatering installations are shown in Figure15-1.
Figure15-1 Sketch of Baboto Dewatering Arrangement
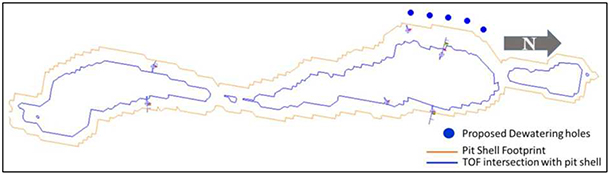
Similar ground water control plans will be developed prior to the mining of the Gara and Loulo 3 pits.
Gounkoto Open Pit
The motivation for an active dewatering strategy is to improve slope stability principally in the regolith slopes, which in turn reflects in a significant increase in the allowable angle. Groundwater control is an absolutepre-condition for adopting the slope design above the fresh rock. The strategy is multi-faceted:
| | ● | | Borehole wells (pumps) – in the regolith. |
| | ● | | Excavation rate – controlling the rate of deepening in saprolite. |
| | ● | | Horizontal drains – in rock at depth. |
| | ● | | Sump strategy - planning by season, cross-fall, capacity. |
| | ● | | Surface works – diversions,run-off control. |
The impact of ground water on strong rock slopes is secondary in most cases and is generally manageable byin-pit horizontal drains. The motivation for dewatering wells is the regolith. For Baboto, systematic horizontal drains will not be needed, unless an exceptional water ingress problem is encountered.
The principal impact of effective dewatering is an increase in the allowable slope angle of up to 15°(I-R). As a consequence of recognising and implementing this strategy, the Randgold pits have steeper regolith slopes than other equivalent pits in the region.
Pumps will be installed in advance of excavation. Drawdown takes time and experience shows that installation around six months in advance of digging is effective.
| | |
| 18th September 2018 | | Page 209 |
| | | | |
| | Loulo-Gounkoto Gold Mine Complex NI 43-101 Technical Report | | |
Loulo Underground
A groundwater monitoring program was implemented at Loulo prior to the commencement of mining operations. Since 2015 Artois Consulting have been working on improving the understanding of hydrogeology and water management at the Loulo mines. In 2017 the main focus of this work was on the Yalea south proposed SURF mining area where weathering extends approximately 300 m below surface.
The weathered area needs to be dewatered to enable the stopes in and near the weathered zone to be mined safely. Piezometric sensors have been installed in bore holes from surface, dewatering holes have been drilled from underground and dewatering has commenced.
This area was saturated to +25 MASL (metres above mean seal level; 135 m below surface). Dewatering has drawn down the ground water level in one hole on the footwall side of the ore zone to-90 MASL (250 m below surface). Further dewatering holes through the weathered zone are required to draw down the water in the hanging wall side of the ore zone.
Gounkoto Underground
Groundwater conditions are likely to be similar to those encountered in the Gara and Yalea mines in that they are not expected to be adverse in terms of either:
| | ● | | Water quality, with fairly benign pH, TDS and contained salts. |
| | ● | | water ingress frequency, volume, and pressure. |
No mine design changes were required to account for groundwater management.
A permanent pump station has been designed at the bottom of the underground workings. It is located near the end of the decline and will pump to the elevation of the portal and discharge into the pit workings. Pumped water will be routed via pipes situated in service drives located off the decline. This pumping arrangement is similar to that of Yalea and Gara and will be further detailed closer to the start of production.
| 15.9 | Dilution and Mining Recovery |
Open Pit Operations
For the Loulo and Gounkoto open pits, a dilution figure of 10% at zero grade was applied, with an ore loss of 2% (3% for Faraba). In some areas of the pit the dilution does contain grade, but the operation has reconciled their production to an equivalent value based on zero grade.
Reconciliations are completed monthly and where required are adjusted to suit the mining conditions. Where pushback mining is being carried out the ore loss is adjusted to allow for ore spill over on the high wall. The ore spill over loss adjustment is an interim adjustment and is reviewed when the pit floor level reaches the ore spill material. Although there are short term adjustments in dilution and ore loss, historical results support these values.
| | |
| 18th September 2018 | | Page 210 |
| | | | |
| | Loulo-Gounkoto Gold Mine Complex NI 43-101 Technical Report | | |
Underground Operations
Loulo
The Loulo site technical team routinely reconcile actual stope and development production against planned performance. A summary of the results is shown in Table15-12 and Table15-13.
Two forms of dilution have been included in the 2017 Ore Reserve estimate, planned dilution (inside the stope design solid) and unplanned dilution (outside the stope design solid).
Planned dilution is included where the footwall or hanging wall is folded and dilution is added to create a mineable stope shape. In Yalea, this is a small quantity (adding 3% dilution); however, in Gara, it is more significant (adding 5% dilution) due to some narrow and highly folded areas. Dilution is added at a gold grade of 0.00 g/t.
Unplanned dilution is added as an equivalent thickness of waste on the hanging wall as panel widths vary in Yalea (3 m to 28 m, average 12 m) and Gara (3 m to 23 m, average 7 m). The Yalea fresh rock stope walls are quite competent with a clean break. The Gara stope walls are less competent, but blasting is carefully managed by the on site teams. This contributes to a relatively low level of dilution
Unplanned dilution thicknesses were calculated from reconciliation of stope performance. All stopes mined in 2017 had a fresh rock hanging wall so this result was used for the fresh rock hanging wall dilution parameter, after subtraction of an allowance for improvement in mining practices.
Paste dilution is now being tracked separately. In 2017, Yalea had 4% paste dilution and Gara 2%. As a result of this understanding of the significance of paste dilution, the paste fill strengths in the lower portion of the wide stopes are being reviewed by the site technical team.
Overall, waste actual dilution was estimated to be an equivalent hanging wall thickness of 0.82 m in Yalea and 1.58 m in Gara. These include planned dilution (within the stope shape) and unplanned dilution (outside of the stope shape).
Table15-12 Summary of Actual 2017 Loulo Underground Mining Dilution
| | | | | | | | | | | | | | | | | | |
| Operation | | Dilution Reported as %s | | Dilution Reported as Thickness | | Total Dilution |
| | Overbreak Dilution | | Fill Dilution
(CAF & Paste) | | | | Actual | | |
| | Total | | Un-
Planned | | Planned | | CAF Dilution | | Paste
Dilution | | Total | | Un-
Planned | | Planned |
| | % | | % | | % | | % | | % | | m | | m | | m | | % |
Yalea | | 11 | | 7 | | 6 | | 0 | | 2 | | 0.82 | | 0.45 | | 0.38 | | 13 |
Gara | | 20 | | 20 | | 5 | | 1 | | 4 | | 1.58 | | 1.26 | | 0.31 | | 25 |
| | |
| 18th September 2018 | | Page 211 |
| | | | |
| | Loulo-Gounkoto Gold Mine Complex NI 43-101 Technical Report | | |
Table15-13 Summary of Loulo Underground Ore Reserve Estimate Dilution
| | | | | | | | | | | | | | | | |
| Area | | Mining Method | | Rock Type | | Planned
Dilution
(%) | | Unplanned
Dilution
(%) | | Unplanned
Dilution
Thickness
(m) | | Total
Dilution
(%) | | Total
Dilution
Thickness
(m) | | Average
Stope
Thickness
(m) |
Yalea | | Long Hole Stoping | | Fresh Ore & Hanging Wall | | 2.7 | | 9.1 | | 1.2 | | 12 | | 1.6 | | 11.7 |
Yalea - South Upper | | Stoping Under Rock Fill | | Fresh Ore | | 1.9 | | 35.0 | | 4.0 | | 37 | | 4.3 | | 11.3 |
Yalea - South Upper | | Stoping Under Rock Fill | | Partially Weathered Trans Ore | | 3.6 | | 35.0 | | 5.0 | | 39 | | 5.5 | | 13.8 |
Yalea - South Upper | | Stoping Under Rock Fill | | Fully Weathered Oxide Ore | | 3.6 | | 35.0 | | 5.0 | | 39 | | 5.4 | | 13.8 |
Yalea Average | | | | | | 3.0 | | 9.4 | | 1.7 | | 16 | | 2.0 | | 11.8 |
Gara | | Long Hole Stoping | | Fresh Ore & Hanging Wall | | 5.0 | | 10.9 | | 1.0 | | 16 | | 1.5 | | 7.7 |
Ore loss in the 2017 Ore Reserve estimate has been included as 4% for Yalea stopes with fresh rock hanging wall and 4% for Gara stopes with fresh rock hanging wall. Yalea ore losses were increased from 2% in the previous estimate to reflect the increase observed in 2017 relative to 2016. Overall actual ore loss is currently estimated to be 5% in Yalea (8% in 2017, 5% in 2016). At Gara actual ore loss is currently 4.5% (2% in 2017, 8% in 2016).
Part of the upper south area of the Yalea has weathered “transition” and oxide material in the stopes and hanging wall. Where transition or oxidised rock was present in the stope or hanging wall rock within 5 m of the stope additional ore loss has been included. This area is planned to be mined using a stoping under rock fill method. Overall ore loss in the stoping under rock fill mining area is 32%. The actual dilution and ore loss values measured and the parameters used for the Ore Reserve estimate are summarised in Table15-14 and Table15-15.
Table15-14 Summary of Loulo Underground Ore Reserve Estimate Dilution
| | | | | | |
| | | | | Estimated Av. Vein | | Ore |
| UG | | Mining | | Thickness | | Loss |
Deposit | | Method | | (m) | | (%) |
| | | LHOS | | 12.7 | | 4.0 |
| | | LHOS | | 10.6 | | 4.0 |
Yalea | | SURF | | 13.0 | | 32.3 |
| | | LHOS+
SURF | | 11.0 | | 8.9 |
| | | | | 11.5 | | 7.6 |
| | | LHOS | | 7.6 | | 4.0 |
Gara | | LHOS | | 7.8 | | 4.0 |
| | | LHOS | | 7.7 | | 4.0 |
Table15-15 Summary of Loulo Underground Ore Reserve Estimate Dilution
| | | | | | |
| | | | | Estimated Av. Vein | | Ore |
| UG | | Mining | | Thickness | | Loss |
Deposit | | Method | | (m) | | (%) |
| | | LHOS | | 12.7 | | 4.0 |
Yalea | | LHOS | | 10.6 | | 4.0 |
| | | SURF | | 13.0 | | 32.3 |
| | |
| 18th September 2018 | | Page 212 |
| | | | |
| | Loulo-Gounkoto Gold Mine Complex NI 43-101 Technical Report | | |
| | | | | | |
| | | LHOS+ SURF | | 11.0 | | 8.9 |
| | | | | 11.5 | | 7.6 |
| | | LHOS | | 7.6 | | 4.0 |
| Gara | | LHOS | | 7.8 | | 4.0 |
| | | LHOS | | 7.7 | | 4.0 |
Gounkoto Dilution and Ore Loss Assessment
The mining method selected for Gounkoto underground is longhole stoping and longhole with backfill and incorporates both transverse and longitudinal access as appropriate to the width of the orebody. Ground conditions have been estimated to be in the majority ‘Fair’, with minor inclusions of ‘Poor’ ground. Stope designs have been based on a stope stability assessment for stable stope surfaces. Therefore, unplanned dilution is expected to be low provided good mining practice is followed.
Stopes have been designed for longhole stoping using a “top hammer” blast hole drill. The complexity of the orebody required some waste, Inferred and unclassified material be included in stope designs so that suitable recovery of the mineralisation abovecut-off grade is achieved. Inferred and unclassified material is classed as planned dilution. None of the proposed stopes report below 3.0 g/t Au and the proportion of Inferred and unclassified material that is included in stope designs is below 1.0% of the total stope tonnes which is considered to be acceptable.
Dilution and losses have been modified where blind uphole stopes are used because of the reduced flexibility in blast hole drilling geometry. A summary of the expected dilution and losses is given in Table15-16.
Table15-16 Gounkoto Underground Mining Dilution and Losses
| | | | |
| Mining Method | | Dilution (%) | | Losses (%) |
| Transverse Primary Stopes | | 5 | | 5 |
| Transvers Primary Stopes (blind uphole) | | 7.5 | | 8 |
| Transverse Secondary Stopes | | 7.5 | | 5 |
| Transverse Secondary Stopes (blind uphole) | | 10 | | 8 |
| Longitudinal Stopes | | 10 | | 5 |
| Longitudinal Stopes (blind uphole) | | 10 | | 21 |
Dilution for the blind uphole stopes is higher than usual stopes to take account of the more difficult mining conditions. In the transverse secondary stopes, waste dilution can occur from the hanging wall contact and the cemented fill, which makes this dilution higher than in the primary stopes.
Similar adjustments were made to the expected mining losses. Expected dilution in the longitudinal stopes is 10% and mining losses are 5%.
Recovery for blind uphole longitudinal stopes has been set at 79% which accounts for 5 m rib pillars being left every 25 m and 95% recovery of the remaining stopes. Recovery for longitudinal blind uphole stopes is better than transverse blind uphole stopes because of better blast hole drilling geometry in narrower stopes.
| | |
| 18th September 2018 | | Page 213 |
| | | | |
| | Loulo-Gounkoto Gold Mine Complex NI 43-101 Technical Report | | |
Differentcut-off grades were applied to the operations and projects as each is subject to different operating costs, losses, and recoveries. Thecut-off grades discussed here were based on simple operating cost estimates, used in the design work, and subsequently confirmed to be viable by a cash flow calculation based on the production schedule and full set of costs.
Open Pit Criteria
The calculation of thecut-off grade is based on the premise that mining has already exposed the ore and the only decision that remains is whether to send the material to the crusher or the waste dump. Mining is viewed as a sunk cost and the cost of exposing the ore is not incorporated into thecut-off grade calculation for material within the pit. While the calculation of the mining cost used in the optimisation process was adjusted for depth based on the 2016 pit designs; the processing cost was not adjusted for depth or variation between ore and waste. The adjustments for additional fuel usage when hauling from depth, additional pumping cost as depth increases and the extra costs associated with drilling and blasting ore are included in the mining cost adjustment factors in the optimisation process.
The full gradecut-off is the ore material that is profitable at $1,000/oz, considering all operating costs of mining, haulage, processing, and general and administrative costs, as well as the appropriate recovery, dilution, and realised gold price post royalty at $1,000/oz spot gold price. It is the principal material fed to the plant.
The marginalcut-off grade is the ore material mined within the $1,000/oz pit design that is profitable on a marginal basis (Full operating cost minus mining costs). The plan is to blend this material with the high-grade ore from the underground mine. Both marginal and full grade ore form the reserve since it forms part of the LOM plan feed schedule.
The marginal orecut-off grade is the reservecut-off grade.
Loulo Open Pits
The weighted averagecut-off grades for the Gara West, Baboto and Loulo 3 open pits are 1.09 g/t Au, 0.96 g/t Au, and 1.09 g/t Au respectively.
Table15-17 shows the economic parameters used for calculating thecut-off grades for the Loulo open pits to determine the Ore Reserves.
Mining costs are based on historical costs for similar size operations within Randgold. The Baboto mining cost is based on tender costs received from SFTP, a Malian mining contractor.
Table15-17: Loulo Open Pit Economic Parameters
| | | | | | | | |
| Parameter | | Unit | | Gara West | | Baboto | | Loulo 3 |
Gold Price | | $/oz | | | | 1,000 | | |
Royalty | | % | | | | 6% | | |
Selling cost | | % | | | | 0% | | |
| | |
| 18th September 2018 | | Page 214 |
| | | | |
| | Loulo-Gounkoto Gold Mine Complex NI 43-101 Technical Report | | |
| | | | | | | | |
| Parameter | | Unit | | Gara West | | Baboto | | Loulo 3 |
Net Gold Price | | $/oz | | 940 |
Met Recovery | | % | | 91% |
Dilution | | % | | 10% |
Ore Loss | | % | | 2% |
Mining Cost - Contractor | | $/t mined | | 3.63 | | 3.18 | | 3.45 |
Mining Cost - Owner’s | | $/t mined | | 0.06 | | 0.06 | | 0.06 |
Mining Cost - Grade Control | | $/t mined | | 0.21 | | 0.07 | | 0.21 |
Total Mining Cost | | $/t mined | | 3.90 | | 3.31 | | 3.72 |
Strip Ratio | | Waste/Ore | | 1.94 | | 4.5 | | 1.94 |
G&A | | $/t milled | | 8.80 | | 7.80 | | 8.80 |
Ore Crushing & Hauling | | $/t milled | | 0 | | 3.63 | | 0 |
Mining | | $/t milled | | 11.46 | | 18.18 | | 10.93 |
Process Plant | | $/t milled | | 20.6 | | 15.2 | | 20.6 |
Total Operating Costs | | $ | | 40.86 | | 44.81 | | 40.33 |
Full GradeCut-off | | g/t | | 1.52 | | 1.62 | | 1.50 |
MarginalCut-off Grade | | g/t | | 1.09 | | 0.96 | | 1.09 |
Diluted Full GradeCut-off Grades | | g/t | | 1.38 | | 1.48 | | 1.36 |
Diluted MarginalCut-off Grades | | g/t | | 0.99 | | 0.88 | | 0.99 |
| | |
| 18th September 2018 | | Page 215 |
| | | | |
| | Loulo-Gounkoto Gold Mine Complex NI 43-101 Technical Report | | |
Gounkoto Open Pit
In the open pit, the weighted averagecut-off grades for the Gounkoto and Faraba open pits are 1.20 g/t Au and 1.32 g/t Au respectively. Table15-18 shows the economic parameters used for estimating thecut-off grade for the Gounkoto open pit and Faraba open pit, in determining the Ore Reserves.
Table15-18: Gounkoto Open Pit Economic Parameters
| | | | | | |
| Parameter | | Unit | | Gounkoto | | Faraba |
Gold Price | | $/oz | | 1,000 |
Royalty | | % | | 6% |
Selling cost | | % | | 0% |
Net Gold Price | | $/oz | | 940 |
Met Recovery | | % | | 91% |
Dilution | | % | | 10% |
Ore Loss | | % | | 2% |
Mining Cost - Contractor | | $/t mined | | 2.95 | | 3.45 |
Mining Cost - Owner’s | | $/t mined | | 0.06 | | 0.06 |
Mining Cost - Grade Control | | $/t mined | | 0.07 | | 0.14 |
Total Mining Cost | | $/t mined | | 3.08 | | 3.65 |
Strip Ratio | | Waste/Ore | | 13.62 | | 3.61 |
G&A | | $/t milled | | 7.70 | | 8.80 |
Ore Crushing & Hauling | | $/t milled | | 5.89 | | 5.9 |
Mining | | $/t milled | | 44.98 | | 16.81 |
Process Plant | | $/t milled | | 19.0 | | 20.6 |
Total Operating Costs | | $ | | 77.57 | | 52.11 |
Full GradeCut-off | | g/t | | 2.85 | | 1.95 |
MarginalCut-off Grade | | g/t | | 1.20 | | 1.32 |
DilutedCut-off Grades | | g/t | | 2.59 | | 1.77 |
Diluted MarginalCut-Off Grades | | g/t | | 1.09 | | 1.20 |
Underground Criteria
The calculation accuracy of thecut-off grade for the Loulo underground deposits was different to that of the Gounkoto deposit, as the Gounkoto work is based on lower confidencepre-feasibility level data.
Loulo Underground
For the Loulo deposits, a full cost minedcut-off grade was estimated, including all operating costs and capital requirements. Revenue was factored down by the processing recovery. Mine dilution and mining recovery were not included in this calculation as thiscut-off grade was applied to mined material to provide an indication of the average grade of a mine, or mine area, required to cover all costs. It was not used to exclude material from the Ore Reserve.
A Marginal minedcut-off grade was estimated in a similar way to the full costcut-off grade, however, it included only the extra operating costs that would be incurred if a stope was mined, and so excluded fixed mining and capital costs. Thiscut-off grade provided an indication if a decision to include (or exclude) a panel in the Ore Reserve would add value. This is the Ore Reservecut-off grade.
The full cost of processing and the site administration cost have been included in the calculation of the marginalcut-off grade. This was included because the Loulo process plant is expected to
| | |
| 18th September 2018 | | Page 216 |
| | | | |
| | Loulo-Gounkoto Gold Mine Complex NI 43-101 Technical Report | | |
be fed to its capacity, and there are multiple ore sources available to provide feed to the Loulo process plant (Yalea, Gara, Gounkoto, and satellite deposits). Any additional lower grade material (just below marginalcut-off grade) would likely displace higher grade mill feed.
In addition, insitucut-off grades were calculated for use when evaluating or viewing block model grades. These were the same as the minedcut-off grades but included mine dilution and recovery.
Cost analysis was undertaken on 2017 actual total mining costs to provide a basis forcut-off grade and economic analysis for the Ore Reserves estimate.
Marginal and break-evencut-off grades were calculated for both Yalea and Gara. Thecut-off grade used for the estimation of the December 2017 Ore Reserves is the diluted marginalcut-off grade (2.60 g/t Au for Yalea and 2.30 g/t Au for Gara). Thesecut-off grades were applied to stope panels after dilution and ore loss had been accounted for in the panel. In Yalea a 2.60 g/t Au cut-off grade is used for the stoping under rock fill (SURF) mining area due to lower backfill costs.
The inputs to thecut-off grade calculations are shown in Table15-19.
| | |
| 18th September 2018 | | Page 217 |
| | | | |
| | Loulo-Gounkoto Gold Mine Complex NI 43-101 Technical Report | | |
Table15-19 Yalea and Gara Underground Mine –Cut-Off Grade Calculation
| | | | | | |
| Parameter | | Unit | | Yalea | | Gara |
Gold Price | | $/oz | | 1,000 | | 1,000 |
Royalty | | % | | 6% | | 6% |
Selling cost | | % | | 0% | | 0% |
Net Gold Price | | $/oz | | 940 | | 940 |
Met Recovery | | % | | 84.47% | | 94.2% |
Dilution | | % | | 11.5% | | 15.6% |
Ore Loss | | % | | 2% | | 4% |
Mine OPEX Development | | $/t milled | | 5.00 | | 3.29 |
Mine Stoping | | $/t milled | | 12.15 | | 11.79 |
Backfill | | $/t milled | | 11.58 | | 10.51 |
Fixed Cost | | $/t milled | | 13.98 | | 14.63 |
Grade Control | | $/t milled | | 3.37 | | 3.40 |
Mine Sustaining Capital | | $/t mined | | 7.69 | | 8.25 |
Total Mining Cost | | $/t mined | | 53.78 | | 53.78 |
G&A | | $/t milled | | 7.80 | | 7.70 |
Process Plant | | $/t milled | | 17.80 | | 18.20 |
Total Operating Costs | | $ | | 79.38 | | 79.68 |
BreakevenIn-SituCut-off
Grade | | g/t | | 3.54 | | 3.29 |
Breakeven MinedCut-off
Grade | | g/t | | 3.11 | | 2.73 |
MarginalIn-situCut-off Grade | | g/t | | 2.97 | | 2.80 |
Marginal MinedCut-off Grade | | g/t | | 2.61 | | 2.33 |
Gounkoto Underground
Underground mine operating costs were determined using November 2012 contractor mining costs, which formed a basis for the December 2016cut-off grade for the Ore Reserve estimate. An insitucut-off grade of 3.0 g/t Au was used for the stope design in the main part of the orebody, and an insitucut-off grade of 4.0 g/t Au was used for the stope design in more isolated areas of the orebody. No supporting calculation was provided for thesecut-off grades. As a check, a new and currentcut-off grade was determined, resulting in a marginal insitucut-off grade of 3.34 g/t Au. This is approximately in line with the combined 3.0 g/t Au and 4.0 g/t Aucut-off grade and compares favourably to the marginal insitucut-off grades of Yalea and Gara of 2.97 g/t Au and 2.80 g/t Au, which are similar operations. RPA recommends the Gounkoto mine design is adjusted with the newcut-off grade results.
The Gounkoto underground ore will be toll treated at the Loulo mill. The total processing cost applied is based on the current costs for the Loulo mill. The inputs to the revisedcut-off grade calculations are shown in Table15-20.
| | |
| 18th September 2018 | | Page 218 |
| | | | |
| | Loulo-Gounkoto Gold Mine Complex NI 43-101 Technical Report | | |
Table15-20 Gounkoto Underground Mine –Cut-Off Grade Calculation
| | | | |
| Parameter | | Unit | | Gounkoto |
Gold Price | | $/oz | | 1,000 |
Royalty | | % | | 6% |
Selling cost | | % | | 0% |
Net Gold Price | | $/oz | | 940 |
Met Recovery | | % | | 92.0% |
Dilution | | % | | 710.2 |
Ore Loss | | % | | 6.3% |
Mine Capital Development | | $/t mined | | 34.36 |
Total Mining Cost | | $/t mined | | 49.52 |
G&A | | $/t milled | | 9.80 |
Process Plant | | $/t milled | | 23.60 |
Total Operating Costs | | $ | | 117.28 |
BreakevenIn-SituCut-off Grade | | g/t | | 4.96 |
Breakeven MinedCut-off Grade | | g/t | | 4.22 |
MarginalIn-situCut-off Grade | | g/t | | 3.34 |
Marginal MinedCut-off Grade | | g/t | | 2.84 |
15.11 Pit Optimisations
Open pit planning was completed using Geovia Whittle 4.1 to derive the optimal pit shell and Geovia Surpac 6.7 for the detailed engineering and design work on the optimised pit shells.
Economic parameters and physical constraints were input into the optimisation software to generate a series of nested pits from which an optimal shell was selected. The reserve pit optimisation was completed in two stages. The initial pit optimisation excluding a minimum mining width was completed to select the optimum pit shell. Thereafter, an evaluation with a minimum mining width of 75 m was run to define the pushbacks for pit scheduling.
Loulo Open Pits
The Loulo 3 pit optimisation was updated for the 2016 Reserve using the “Loul3_res_2015_11_12” resource model combined with the 2016 mining and processing costs and processing recoveries. No updates were undertaken on the 2016 resource model with no significant changes observed on mining and process costs or other economic optimisation parameters. The 2016 Loulo 3 reserve was therefore carried through to the 2017 Reserve.
The Pit Optimisation pit by pit graph in Figure15-2 shows a very flat cash flow generation between the $900 (Pit 5) and the $1,100 (Pit 7) pits, indicating no possible gain in selecting a higher gold price pit than the $1,000 reserve pit. This also indicates there is a fairly low risk associated with a 10% swing in gold price.
| | |
| 18th September 2018 | | Page 219 |
| | | | |
| | Loulo-Gounkoto Gold Mine Complex NI 43-101 Technical Report | | |
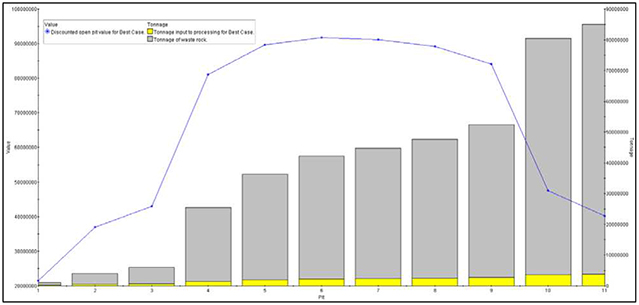
Figure15-2 Pit by Pit Graph of Whittle Optimisation Results for Loulo 3
The results shown in Table15-21 below give further validation to the decision to remain with a $1,000 Whittle shell as the basis for the 2016/2017 Ore Reserve estimate.
Table15-21 Whittle Optimisation Results for Loulo 3
| | | | | | | | | | |
Pit Gold Price
($/oz) | | Cash Flow
($ M) | | Ore Tonnes
(Mt) | | Waste
Tonnes (Mt) | | Ounces
(koz) | | Grade (g/t) |
500 | | 21.46 | | 0.24 | | 0.81 | | 36.91 | | 4.80 |
600 | | 36.98 | | 0.50 | | 3.56 | | 75.73 | | 4.71 |
700 | | 43.00 | | 0.65 | | 5.34 | | 95.57 | | 4.60 |
800 | | 81.02 | | 1.38 | | 24.09 | | 245.85 | | 5.53 |
900 | | 89.66 | | 1.98 | | 34.37 | | 322.63 | | 5.08 |
1,000 | | 91.70 | | 2.23 | | 40.02 | | 358.88 | | 5.00 |
1,100 | | 91.14 | | 2.38 | | 42.48 | | 374.74 | | 4.90 |
1,200 | | 89.21 | | 2.49 | | 45.14 | | 388.83 | | 4.85 |
1,300 | | 84.05 | | 2.69 | | 49.69 | | 410.71 | | 4.75 |
1,400 | | 47.54 | | 3.71 | | 76.69 | | 533.13 | | 4.47 |
1,500 | | 40.20 | | 3.85 | | 81.20 | | 551.03 | | 4.45 |
The Baboto pit optimisation was updated for the 2017 Reserve using the “BS_BC_Regularize Model_170514” resource model. The most notable change from the 2017 resource model to the 2016 model was the exclusion of the Baboto North zone which was acquired by Endeavour Mining in 2017.
The pit optimisation pit by pit graph in Figure15-3 and the results in Table15-22, show a relatively flat cash flow generation between the $900 (Pit 5) and the $1,200 (Pit 8) pits, indicating no significant gain in cash flow or ounces if a higher gold price pit is selected. The Baboto optimisation also indicates there is a fairly low risk associated with a 10% swing in gold price.
| | |
| 18th September 2018 | | Page 220 |
| | | | |
| | Loulo-Gounkoto Gold Mine Complex NI 43-101 Technical Report | | |
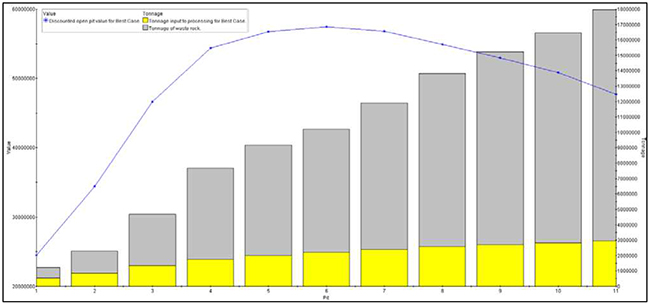
Figure15-3 Pit by Pit Graph of Whittle Optimisation Results for Baboto
Table15-22 Whittle Optimisation Results for Baboto
| | | | | | | | | | |
Pit Gold Price ($/oz) | | Cash Flow ($ M) | | Ore Tonnes (Mt) | | Waste Tonnes (Mt) | | Ounces (koz) | | Grade (g/t) |
500 | | 24.50 | | 0.54 | | 0.69 | | 51.70 | | 3.00 |
600 | | 34.40 | | 0.85 | | 1.44 | | 78.40 | | 2.86 |
700 | | 46.60 | | 1.37 | | 3.31 | | 119.90 | | 2.73 |
800 | | 54.40 | | 1.75 | | 5.94 | | 154.70 | | 2.74 |
900 | | 56.70 | | 2.00 | | 7.17 | | 172.00 | | 2.67 |
1,000 | | 57.30 | | 2.20 | | 8.02 | | 183.70 | | 2.60 |
1,100 | | 56.80 | | 2.39 | | 9.53 | | 196.60 | | 2.56 |
1,200 | | 54.90 | | 2.59 | | 11.23 | | 209.10 | | 2.51 |
1,300 | | 53.00 | | 2.73 | | 12.52 | | 217.60 | | 2.48 |
1,400 | | 50.80 | | 2.83 | | 13.64 | | 223.60 | | 2.46 |
1,500 | | 47.70 | | 2.94 | | 15.04 | | 230.30 | | 2.44 |
The Gara West optimisation was completed in 2015 based on the “gw_res_2015_11_24_bm.bmf” resource. No further updates have been carried out on the resource and optimisation. The pit optimisation pit by pit graph in Figure15-4 and results in Table15-23 indicate a robust $1,000 pit that will allow for a 10% fluctuation in gold price.
| | |
| 18th September 2018 | | Page 221 |
| | | | |
| | Loulo-Gounkoto Gold Mine Complex NI 43-101 Technical Report | | |
Figure15-4 Whittle Optimisation Results for Gara West
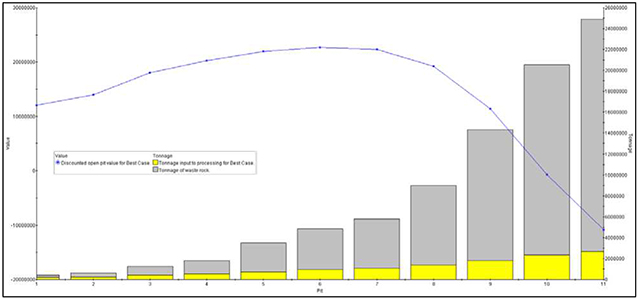
Table15-23 Pit by Pit Graph of Whittle Optimisation Results for Gara West
| | | | | | | | | | |
Pit Gold Price ($/oz) | | Cash Flow ($ M) | | Ore Tonnes (Mt) | | Waste Tonnes (Mt) | | Ounces (koz) | | Grade (g/t) |
500 | | 12.06 | | 0.18 | | 0.26 | | 22.65 | | 3.91 |
600 | | 13.95 | | 0.24 | | 0.36 | | 27.73 | | 3.58 |
700 | | 18.03 | | 0.40 | | 0.87 | | 4.39 | | 3.19 |
800 | | 20.24 | | 0.54 | | 1.26 | | 51.39 | | 2.94 |
900 | | 21.96 | | 0.72 | | 2.76 | | 67.77 | | 2.90 |
1,000 | | 22.69 | | 0.95 | | 3.87 | | 82.95 | | 2.71 |
1,100 | | 22.33 | | 1.06 | | 4.75 | | 90.98 | | 2.67 |
1,200 | | 19.20 | | 1.36 | | 7.64 | | 113.52 | | 2.59 |
1,300 | | 11.37 | | 1.82 | | 12.51 | | 147.02 | | 2.51 |
1,400 | | -0.73 | | 2.33 | | 18.22 | | 182.41 | | 2.43 |
1,500 | | -10.85 | | 2.68 | | 22.21 | | 205.38 | | 2.38 |
Gounkoto Open Pits
The Gounkoto 2017 pit optimisation was completed using the “gk_gc_170714.bmf” resource model. The optimisation, when compared to the previous 2016 optimisation, showed a gain in ore tonnes due to the inclusion of the hanging wall extension ore within the $1,000 Whittle pit.
Figure15-5 shows the area with the extra ore tonnes relative to the current life of mine and reserve pit design.
| | |
| 18th September 2018 | | Page 222 |
| | | | |
| | Loulo-Gounkoto Gold Mine Complex NI 43-101 Technical Report | | |
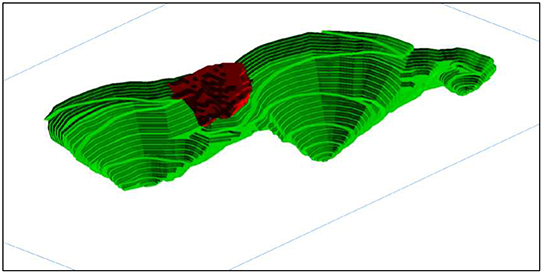
Figure15-5 Gounkoto Pit Design Oblique View looking upwards from underneath, with Gain in Ore Tonnes
This hanging wall extension contains 1.1 Mt of ore, of which 0.85 Mt is below the full grade cut-off, so most of this material would be stockpiled with no short to medium term gain in plant feed and revenue. As such, this material was excluded from the 2017 Ore Reserve statement and further drilling is being carried out in 2018.
The optimisation pit by pit graph in Figure15-6 and Table15-24, show that the Gounkoto Super Pit is still robust at $1,000, allowing for 20% fluctuations in the gold price without significant impact on the economic viability of the operation.
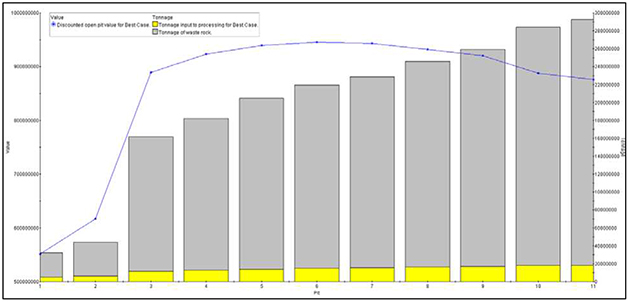
Figure15-6 Whittle Optimisation Results for Gounkoto
| | |
| 18th September 2018 | | Page 223 |
| | | | |
| | Loulo-Gounkoto Gold Mine Complex NI 43-101 Technical Report | | |
Table15-24 Whittle Optimisation results for Gounkoto
| | | | | | | | | | |
Pit Gold Price ($/oz) | | Cash Flow ($ M) | | Ore Tonnes (Mt) | | Waste Tonnes (Mt) | | Ounces (koz) | | Grade (g/t) |
500 | | 551.90 | | 4.69 | | 27.60 | | 910.50 | | 6.04 |
600 | | 616.50 | | 6.04 | | 37.65 | | 1077.00 | | 5.54 |
700 | | 889.50 | | 11.62 | | 150.01 | | 2013.90 | | 5.39 |
800 | | 923.30 | | 12.78 | | 169.41 | | 2169.40 | | 5.28 |
900 | | 939.70 | | 13.81 | | 190.81 | | 2309.70 | | 5.20 |
1,000 | | 945.40 | | 15.09 | | 204.08 | | 2412.60 | | 4.97 |
1,100 | | 943.40 | | 15.62 | | 213.09 | | 2465.10 | | 4.91 |
1,200 | | 931.80 | | 16.41 | | 229.58 | | 2543.10 | | 4.28 |
1,300 | | 920.20 | | 16.88 | | 242.21 | | 2595.30 | | 4.78 |
1,400 | | 887.90 | | 18.01 | | 266.13 | | 2693.90 | | 4.65 |
1,500 | | 875.90 | | 18.33 | | 274.13 | | 2721.40 | | 4.62 |
The Faraba optimisation pit by pit graph shows that the $1,000 pit (pit 6) is stable at $1,000 and can withstand a 10% variation in gold price, however, the optimisation does indicate that should the gold price drop to $800/oz there is virtually no economic pit.
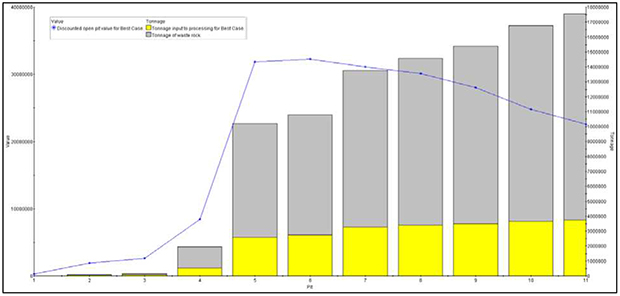
Figure15-7 Whittle Optimisation Results for Faraba
Table15-25 Whittle Optimisation Results for Faraba
| | | | | | | | | | |
Pit Gold Price ($/oz) | | Cash Flow ($ M) | | Ore Tonnes (Mt) | | Waste Tonnes (Mt) | | Ounces (koz) | | Grade (g/t) |
500 | | 0.28 | | 0.01 | | 0.00 | | 0.58 | | 3.02 |
600 | | 1.89 | | 0.05 | | 0.04 | | 4.50 | | 2.68 |
700 | | 2.61 | | 0.08 | | 0.07 | | 6.75 | | 2.52 |
800 | | 8.44 | | 0.52 | | 1.45 | | 38.62 | | 2.33 |
900 | | 31.84 | | 2.59 | | 7.63 | | 187.56 | | 2.26 |
1,000 | | 32.31 | | 2.74 | | 8.05 | | 197.41 | | 2.24 |
1,100 | | 31.11 | | 3.27 | | 10.51 | | 232.25 | | 2.21 |
1,200 | | 30.13 | | 3.39 | | 11.20 | | 239.60 | | 2.20 |
1,300 | | 28.02 | | 3.51 | | 11.86 | | 246.08 | | 2.18 |
1,400 | | 24.80 | | 3.67 | | 13.12 | | 255.43 | | 2.17 |
1,500 | | 22.61 | | 3.73 | | 13.81 | | 259.35 | | 2.16 |
| | |
| 18th September 2018 | | Page 224 |
| | | | |
| | Loulo-Gounkoto Gold Mine Complex NI 43-101 Technical Report | | |
15.12 Mine Design
Open Pits
Detailed design was then undertaken to confirm the viability of the optimised shell. The relatively small dimension of the pits and the characteristics of the ore bodies (i.e. narrow and steeply dipping Birimian meta-sedimentary volcanic sequence), combined with the equipment size is used to engineer the pit design to keep strip ratios in line with optimisation results. The process was iterated until an acceptable level of correlation was achieved between the optimised shell and detailed design.
Mine planning was based on three-dimensional block models of insitu mineralisation, with allowances made for minimum mining widths, dilution, and ore loss appropriate to the mining method being considered. Historical performance measures were considered in determination of these modifying factors.
Infrastructure, waste disposal, and ore stockpile management requirements were incorporated into the planning process. In general, the pit designs can be typified by the characteristics found in Table15-26.
Table15-26 Open Pit Design Characteristics
| | |
| Item | | All Open Pits |
Accesses | | Minimum of two accesses at all times |
Ramps | | Two single lane ramps (1 driving down, 1 driving up) |
Ramp Access | | Minimising ramp access in the hanging wall, unless in a temporary wall |
Ramp Width | | 25 m for double lane and 12 m for single lane ramps, except for dumps (30 m) |
Ramp Gradient | | 10% |
Batter Angles | | 60-75° |
Switchbacks | | Kept to a minimum |
Geotechnical Recommendations | | Followed |
Bench Basis | | 10 m bench (except for Loulo 3 in the saprolite, with 5 m benches planned) |
Strip Ratio | | Kept as low as possible |
Economic Testing | | Tested with Whittle 4X |
Final Face Benches | | No ramp access |
Single Lane Ramps | | Used where required |
The Baboto resource model was updated during 2017. The updated model was used to update the optimisation and pit design along with a mining schedule. A sketch of the updated mine design is given in Figure15-8.
| | |
| 18th September 2018 | | Page 225 |
| | | | |
| | Loulo-Gounkoto Gold Mine Complex NI 43-101 Technical Report | | |
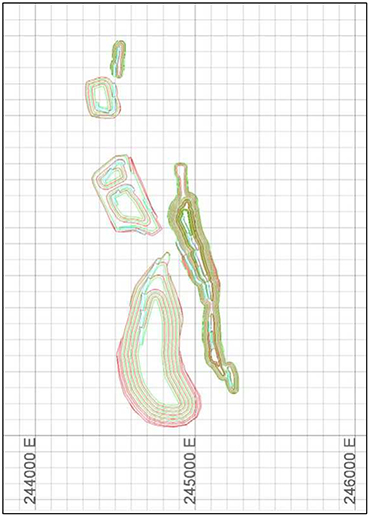
Figure15-8 Baboto Pit and Waste Dump Design
The Gara West pit is a simple pit with similar geotechnical characteristics to Gara, which is nearby. The Whittle optimisation and design accounts for the impact of the western waste dump on the pit size (Figure15-9).
| | |
| 18th September 2018 | | Page 226 |
| | | | |
| | Loulo-Gounkoto Gold Mine Complex NI 43-101 Technical Report | | |
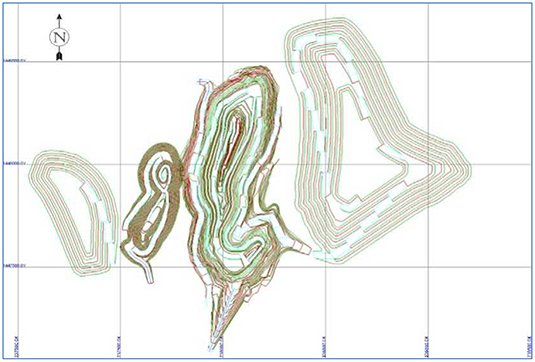
Figure15-9 Gara West Pit And Waste Dump Design
Loulo 3
The Loulo 3 pit has been designed to allow for a pushback to reach deeper ore based on the $1,000/oz Whittle optimised pit (Figure15-10). Utilising smaller equipment sizes in the mining fleet has allowed for narrower ramps and a narrower mining width thereby reducing the amount of waste to be mined and the overall mining cost.
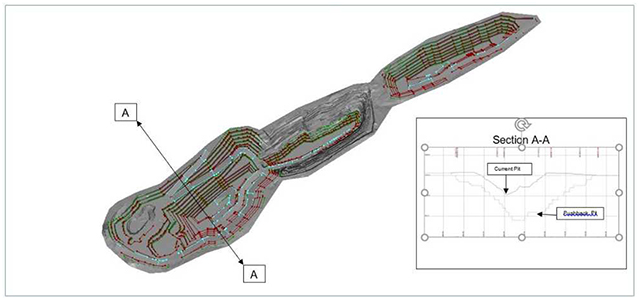
Figure15-10 Loulo 3 Pit Design
| | |
| 18th September 2018 | | Page 227 |
| | | | |
| | Loulo-Gounkoto Gold Mine Complex NI 43-101 Technical Report | | |
Underground Mine Design
Loulo
The 2017 Loulo underground mine plan design and evaluation was completed using Datamine 5D planner software using sub cell block models. The geological zones (including mineralised zone) were defined by three-dimensional wireframe solids and surfaces. Both the block models and wireframes were created with Maptek Vulcan software and converted into Datamine format for use in Datamine 5D planner.
The following process was followed to estimate the Ore Reserve:
| | 1. | Cut-off grades were determined from actual 2017 costs and the previous life of mine plan. |
| | 2. | Stope section strings (2.5 m, 5 m, or 10 m interval between sections) were created to follow the geological mineralised zone wireframes. Strings are based on level intervals determined in the previous Ore Reserve estimate. |
| | 3. | Planned dilution was included where the footwall or hanging wall was folded and dilution is added to create a mineable stope shape. |
| | 4. | Stope section strings were edited based on the as built mined solids to remove development drives and parts of stopes. |
| | 5. | Stope wireframes were created from the strings using Datamine 5DP software. |
| | 6. | The total stope tonnes and gold metal was calculated by evaluating the stope wireframes against the block model. |
| | 7. | Diluted mined tonnes, grades, and ounces were calculated in Datamine EPS scheduler. This included unplanned dilution added as an equivalent thickness on the hanging wall (or as a percentage of waste for the SURF method). Ore Loss is subtracted as a percentage from diluted tonnes and contained metal. |
| | 8. | Final editing of physical quantities was undertaken in an Excel spreadsheet. |
| | 9. | Panels with a diluted grade belowcut-off were excluded from the Ore Reserve estimate. A level by level cash flow analysis was used to confirm that each level contributed positive cash flow after decline and access development was taken into account. Levels with a negative cash flow were excluded from the Ore Reserve. |
| | 10. | Classification of the Ore Reserve was reviewed and, where necessary, adjusted to ensure that classification of Ore Reserves reflects the QP’s view of the deposits. |
The location of the Loulo underground Ore Reserves is shown in Figure15-11 and Figure15-12.
| | |
| 18th September 2018 | | Page 228 |
| | | | |
| | Loulo-Gounkoto Gold Mine Complex NI 43-101 Technical Report | | |
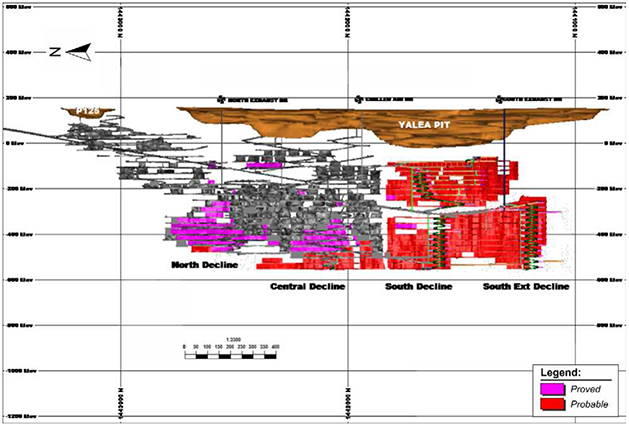
Figure15-11 Yalea Mine Design with Ore Classification
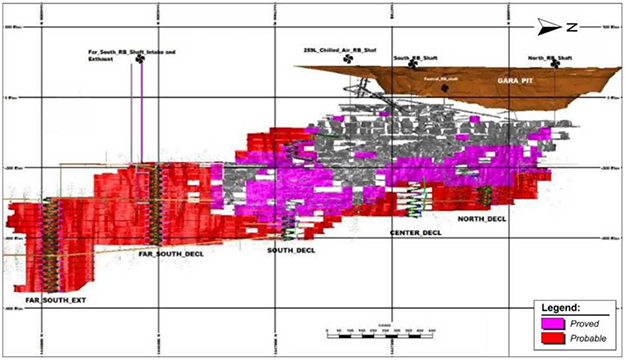
Figure15-12 Gara Mine Design with Ore Classification
Gounkoto
The 2017 Gounkoto underground Ore Reserve estimate was completed using Datamine Studio 5D Planner software with the Mineable Stope Optimiser (MSO) module. This process provided a
| | |
| 18th September 2018 | | Page 229 |
| | | | |
| | Loulo-Gounkoto Gold Mine Complex NI 43-101 Technical Report | | |
comprehensive understanding of the location of the potential stoping areas and their respective tonnes and grade.
An MSO run was conducted on the resource model below the northern part of the open pit. Some of this material was in the Indicated category.
The principle MSO parameters are shown in Table15-27. Long hole stoping method parameters were used. The minimum mining width was 3.0 m and the minimum dip for stopes was set to 50°. The maximum width for a stope was set to 100 m to represent an unlimited maximum mining width, as in practice these stopes would be split into a hanging wall and footwall stopes and mined and filled sequentially where the horizontal width is beyond stable geotechnical widths. The minimum width of internal pillars of material that are below thecut-off grade was set to 10 m. This pillar width assumption was reviewed and confirmed for the final stope designs.
A head gradecut-off of 3.0 g/t Au was used in the MSO work, based on the November 2012 Underground Mining Study. Thiscut-off grade is further detailed in Section 15.8.
A longitudinal projection of the results is shown in Table15-27.
Table15-27 MSO Parameters for MSO Run
| | | | |
| Item | | MSO Setting | | Comment |
Shape Control | | Cut-Off Grade (g/t) | | 3.0 |
| | Width (m) | | 3 |
| | Max Width (m) | | 100 |
| | Min Waste Pillar Width (m) | | 10 |
| | Min Dip Angle (°)* | | 50 |
| | Max Dip Angle (°)* | | 130 |
| | Max Strike Angle (°) | | 45 |
| | Max Strike Angle Change | | 20 |
| | Max Side Length Rati | | 2.25 |
Shape Waste Control | | Maximum Waste Faction | | 1 |
Model Discretisation | | U Number | | 4 |
| | V Number | | 4 |
| | |
| 18th September 2018 | | Page 230 |
| | | | |
| | Loulo-Gounkoto Gold Mine Complex NI 43-101 Technical Report | | |
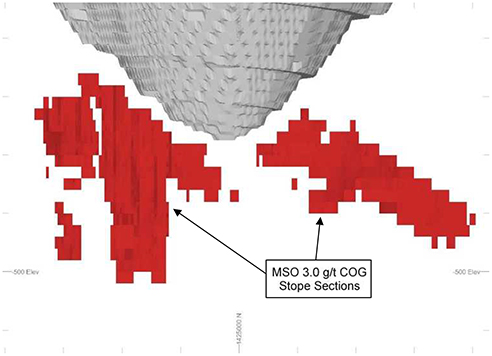
Figure15-13 Longitudinal Projection Looking West showing Results of MSO Run on Northern End of the Resource Model
15.13 Ore Reserve Comparisons
JORC compliant Reserve statements were issued in 2016. Various changes were made to these Reserves up to the end of 2017, as detailed in this section. Section 6.4 (Resource and Reserve Evolution) illustrates changes to the Reserves over the last few years
Loulo Open Pit
The overall 2017 declared ounces for Loulo is 14% lower than 2016. This is predominantly due to the sale of the Baboto North resource, accounting for 76 koz with the remainder due to model and density changes in the Baboto pit. No mining was carried out in the other pits and stockpiles (Table15-28).
| | |
| 18th September 2018 | | Page 231 |
| | | | |
| | Loulo-Gounkoto Gold Mine Complex NI 43-101 Technical Report | | |
Table15-28 Loulo Open Pits Ore Reserve Reconciliation
| | | | | | | | | | |
| Change | | Gara West
(koz) | | Baboto (koz) | | Loulo 3 (koz) | | Stockpiles
(koz) | | Total Loulo Open Pits
(koz) |
2016 Declaration | | 73 | | 291 | | 348 | | 93 | | 805 |
2017 Depletion | | | | | | | | | | |
Model Change | | | | -9.1 | | | | | | |
Density change | | | | -23 | | | | | | |
Pit Design change | | | | -1.8 | | | | | | |
Sale of Baboto North | | | | -76 | | | | | | |
Economic change | | | | 3.8 | | | | | | |
Adjustment | | | | -5.4 | | | | | | |
2017 Declaration | | 73 | | 180 | | 348 | | 93 | | 694 |
Gounkoto Open Pit
The 2017 declared ounces are 7% lower than the 2016 declared ounces for the Gounkoto open pit. This is due to depletion in 2017, with a partial replenishment from model gains due to continued grade control drilling.
There is no change reported for the Faraba open pit (Table15-29).
Table15-29: Gounkoto Open Pit Ore Reserve Sources Reconciliation
| | | | |
| Change | | Gounkoto Open Pit
(koz) | | Faraba Open Pit
(koz) |
2016 Declaration | | 2,509 | | 200 |
| |
2017 Depletion | | -324 | | |
Model Change | | 155 | | |
Density Change | | | | |
Economic Change | | | | |
Design Change | | 6 | | |
| |
2017 Declaration | | 2,334 | | 200 |
Loulo Underground
During 2017, a significant amount of resource extension and grade control drilling was completed in both Yalea and Gara. This led to addition of new areas in both Yalea Far South and Gara Far South Extension (450 koz and 500 koz respectively). Grade control drilling from underground drill sites led to reinterpretation of existing Ore Reserves and a loss in previous Ore Reserves areas of 190 koz in Yalea and 30 koz in Gara.
The net effect was increase in the Yalea Ore Reserve of 180 koz (+6%) and an increase in the Gara Ore Reserve by 390 koz (+21%), after depletion was taken into account.
15.14 External Audits
Loulo
During 2013 and 2014 the Yalea and Gara Life of Mine Planning was reviewed by Practical Mining (Australia). The review concluded that the current mine planning was robust but
| | |
| 18th September 2018 | | Page 232 |
| | | | |
| | Loulo-Gounkoto Gold Mine Complex NI 43-101 Technical Report | | |
recommended further work to improve confidence in mine ventilation, paste fill testwork, geotechnical rock mass modelling,pre-mining stress measurement and mining induced stress modelling. Randgold has undertaken substantial work in these areas and this work is ongoing.
| | |
| 18th September 2018 | | Page 233 |
| | | | |
| | Loulo-Gounkoto Gold Mine Complex NI 43-101 Technical Report | | |
16 Mining Methods
16.1 Loulo Open Pits
The Loulo open pits comprise the Baboto Pit, Loulo 3 Pit, and the Gara West Pit. Some of the Baboto pit was mined in 2018, however the rest of Baboto pit and the other pits will be mined from 2024, after the larger Gounkoto pits start to deplete. Due to the late start date, not much of the planned production has been detailed yet. Randgold intends to use the same contractor that has already mined part of the Baboto pit, so most of this fleet is known. The Loulo 3 and Gara West pits will use the same equipment as they are timed to be mined consecutively.
Baboto
The strategy for the mining of Baboto is to mine a small oxide material pit in 2018 in a first phase and then to return and mine the remainder of the full reserve pit in 2027 in a second phase. A total 279 kt grading 3.12 g/t Au was mined from the oxide pit in 2018 and hauled to the Loulo ROM pad. The rest of the pit will be mined to the final pit limit in 2027, for a total of 2.0 Mt at 2.82 g/t Au and is feed for the Loulo plant from 2027 to 2029 (Table16-2).
Mining is planned to be by mining contractor. Table16-1 lists the planned mining equipment for the Baboto open pit.
Table16-1 Baboto Main Mining Equipment
| | | | | | |
| Mining Equipment | | 2018 | | 2027 | | Equipment Type |
8 m3Hydraulic backhoe excavator | | 2 | | 2 | | Liebherr 970 |
40 T Articulated Dump Trucks | | 5 | | 8 | | Volvo A45G |
Pre-split drill rig - 115 mm diameter | | 0 | | 2 | | To be decided |
Production drill rig –165 mm diameter | | 0 | | 2 | | To be decided |
Grade control drilling | | 0 | | 1 | | Schramm T450B |
Loader CAT 980 or equivalent | | 1 | | 1 | | Caterpillar 980K |
33 m3Haulage truck | | 5 | | 5 | | Volvo FMX 440 |
Figure16-1 shows the location of the Baboto open pits, ROM pad, waste dumps. The Baboto pits are located 12.2 km from the Loulo plant. A haul road has been constructed to haul the ore to the Loulo plant for processing (Figure16-2).
| | |
| 18th September 2018 | | Page 234 |
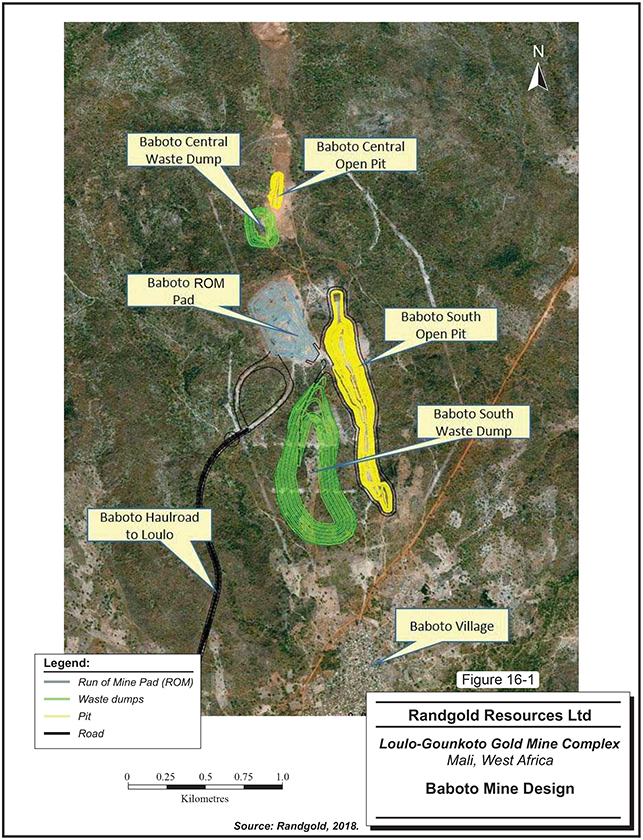
| | |
| 18th September 2018 | | Page 235 |
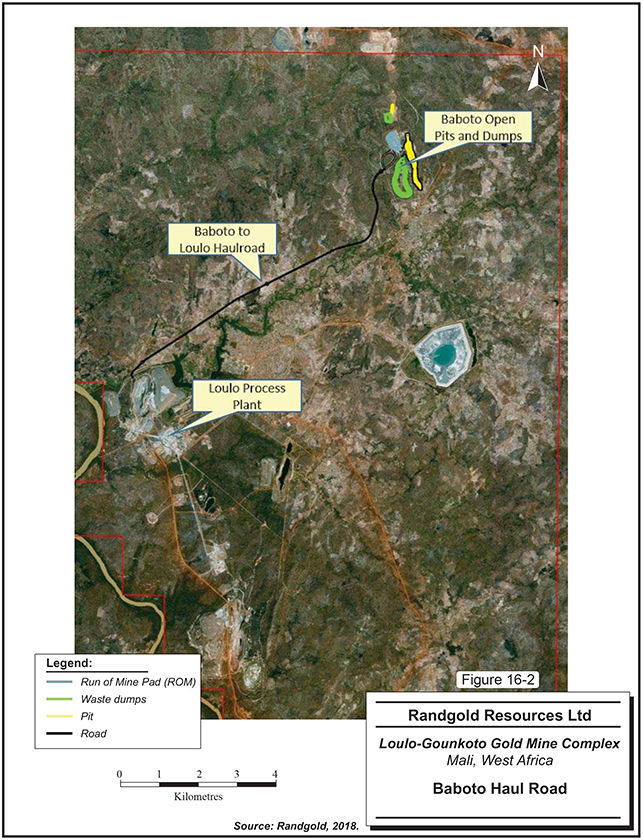
| | |
| 18th September 2018 | | Page 236 |
| | | | |
| | Loulo-Gounkoto Gold Mine Complex NI 43-101 Technical Report | | |
Life of Mine Plan
The mining of the Loulo satellite pits is planned to commence after the completion of the Gounkoto open pit. The Loulo 3 open pit mining will be a pushback from the existing open pit which completed mining in 2011. The additional pushback has become economic on the back of additional resource drilling which detected additional high-grade material in the MZ2 ore zone, below the southern end of the pit.
The Baboto oxide ore will be mined in 2018, to supplement the Loulo plant throughput and will then stop until 2027 when the remaining sulphide ore will be mined.
The Gara West Pit is situated adjacent to the mined out Gara open pit and is in close proximity to the existing infrastructure.
Following on Randgold’s initiatives to promote local business growth, it is envisaged that local mining contractors will be used to mine the Loulo satellite pits.
Table16-2 details the Loulo mine production plan across all open pit ore sources.
Table16-2 Loulo Open Pit Life of Mine Plan
| | | | | | | | | | | | | | | | | | | | | | | | |
| Item | | Units | | LOM | | 2018 | | 2019 | | 2020 | | 2021 | | 2022 | | 2023 | | 2024 | | 2025 | | 2026 | | 2027 |
| Open Pit Mining | | | | | | | | | | | | | | | | | | | | | | | | |
| Waste | | | | | | | | | | | | | | | | | | | | | | | | |
| Loulo 3 | | kt | | 45,901 | | - | | - | | - | | - | | - | | - | | 19,163 | | 26,738 | | - | | - |
| Baboto | | kt | | 9,485 | | 582 | | - | | - | | - | | - | | - | | - | | - | | - | | 8,904 |
| Gara West | | kt | | 7,396 | | - | | - | | - | | - | | - | | - | | - | | - | | 7,396 | | - |
Total Waste Tonnes | | kt | | 62,782 | | 582 | | - | | - | | - | | - | | - | | 19,163 | | 26,738 | | 7,396 | | 8,904 |
Ore |
| Loulo 3 | | kt | | 2,202 | | - | | - | | - | | - | | - | | - | | 977 | | 1,225 | | - | | - |
| Baboto | | kt | | 2,311 | | 337 | | - | | - | | - | | - | | - | | - | | - | | - | | 1,974 |
| Gara West | | kt | | 862 | | - | | - | | - | | - | | - | | - | | - | | - | | 862 | | - |
| Total Ore Tonnes | | kt | | 5,375 | | 337 | | - | | - | | - | | - | | - | | 977 | | 1,225 | | 862 | | 1,974 |
Gold Grade |
| Loulo 3 | | g/t | | 4.99 | | - | | - | | - | | - | | - | | - | | 3.75 | | 5.97 | | - | | - |
| Baboto | | g/t | | 2.79 | | 2.64 | | - | | - | | - | | - | | - | | - | | - | | - | | 2.82 |
| Gara West | | g/t | | 2.62 | | - | | - | | - | | - | | - | | - | | - | | - | | 2.62 | | - |
| Total | | g/t | | 3.66 | | 2.64 | | - | | - | | - | | - | | - | | 3.75 | | 5.97 | | 2.62 | | 2.82 |
Gold Ounces |
| Loulo 3 | | koz | | 353 | | - | | - | | - | | - | | - | | - | | 118 | | 235 | | - | | - |
| Baboto | | koz | | 208 | | 29 | | - | | - | | - | | - | | - | | - | | - | | - | | 179 |
| Gara West | | koz | | 73 | | - | | - | | - | | - | | - | | - | | - | | - | | 73 | | - |
| Total | | koz | | 633 | | 29 | | - | | - | | - | | - | | - | | 118 | | 235 | | 73 | | 179 |
| Strip Ratio | | w:o | | 11.7 | | 1.7 | | - | | - | | - | | - | | - | | 19.6 | | 21.8 | | 8.6 | | 4.5 |
16.2 Gounkoto Open Pit Operations
Mining
Gounkoto is an ongoing operation with a successful selective mining method. Backhoe excavators are used to select waste from the ore. Pit geologists supervise all digging and ore material is classified by grade as either FGO (Full Grade Ore), delivered to primary crushers, or MO (Marginal Ore), which is stockpiled close to the primary crushers. Waste material is hauled
| | |
| 18th September 2018 | | Page 237 |
| | | | |
| | Loulo-Gounkoto Gold Mine Complex NI 43-101 Technical Report | | |
to the nearest waste dump. Truck allocation is completed automatically through the use of the Jigsaw dispatch system. Management reporting is via an intranet-based system.
Fresh rock and transitional zones are drilled and blasted in 10 m lifts, with excavation of benches containing ore in three flitches. A small volume of weathered oxide material is free dig.
Blasting is based on a 5 m by 5 m grid with a drill-hole diameter of 165 mm and a powder factor of 0.59 kg/BCM. Increased pattern size is used in the partially weathered material, while a decreased pattern size is utilised in harder material. The firing sequence blasts ore blocks separately from waste blocks. This style of blasting preserves the integrity of the ore/waste contacts to allow for visual identification of the zones by the pit geologists. The drill rigs are equipped with dip meters to measure accurately the drill-hole depth during drilling.
Ore is zoned in the geological modelling process to a minimum insitu width of 10 m by 5 m by 3.3 m, which reflects the minimum width that the current mining method and equipment can practically achieve.
Mine Infrastructure and Crusher
Ore material is crushed at Gounkoto with a primary Sandvik CJ815 jaw crusher and secondary cone Sandvik CS660 crusher. The final crushed product is minus 40 mm (80%) and minus 60 mm (20%) at a throughput rate depending on the final crushed size requirement. For the selected 35 mm product size the throughput rate is 360 tph.
The crushed material is stockpiled using an inclined slewing conveyor, allowing material classified on grade or oxidation to be separated and allowing loading and crushing to be occur simultaneously.
The ore is loaded from the crushed stockpile into haul trucks by the current haul contractor, SFTP. The haul fleet consists of 13 Volvo 50 t FMX tipper trucks.
The trucks transport ore from Gounkoto to Loulo, approximately 30 km away, using an average cycle time of 90 minutes. The trucks deliver crushed ore to the ROM pad at Loulo and feed the crushed ore directly into the hard rock circuit via the existing gyratory crusher.
Gounkoto has existing heavy mining equipment fleet maintenance and fuel storage facilities, as well as supporting offices and stores and a bulk fuel storage facility.
Equipment, Utilisation and Efficiencies
As of 31st December 2017, the Gounkoto contractor, DTP Terrassement, operates a fleet of thirty 90 t Caterpillar 777 trucks, and five hydraulic backhoe excavators. This fleet currently has a capacity to mine 35 Mtpa, as per the 2018 operational plan. The primary mining fleet is summarised in Table16-3.
| | |
| 18th September 2018 | | Page 238 |
| | | | |
| | Loulo-Gounkoto Gold Mine Complex NI 43-101 Technical Report | | |
Table16-3 Gounkoto Mining Fleet as of 31st December 2017
| | | | | | | | |
| Equipment | | Work Group | | OEM | | Unit | | 2018 |
Excavators | | Production Unit | | Liebherr | | EX9350 | | 5 |
| | Liebherr | | EX9250 | | 1 |
| | Liebherr | | EX984 | | 0 |
| | Komatsu | | PC1250 | | 1 |
Support Excavators | | | | Komatsu | | PC800 | | 1 |
| | | | Komatsu | | PC350 | | 1 |
| | | | Caterpillar | | CAT390D | | 1 |
| | | | Caterpillar | | CAT336 | | 1 |
Trucks | | Production Unit | | Komatsu | | HD785 | | 7 |
| | Caterpillar | | CAT 777D | | 14 |
| | Caterpillar | | CAT 777F | | 16 |
| | Caterpillar | | CAT 777G | | 1 |
| | | Production Unit | | Atlas Copco | | ROC-L8 | | 2 |
| | | Atlas Copco | | DM-30 | | 9 |
Drill Rigs | | RC | | Atlas Copco | | ROC-L8 RC | | 1 |
| | | Atlas Copco | | SMARTROC60 | | 3 |
| | | Atlas Copco | | SMARTROC60 | | 3 |
Water Cart | | Support Unit | | Caterpillar | | CAT 773 | | 3 |
Dozers | | Support Unit | | Caterpillar | | CAT D9 - (Track) | | 9 |
| | Caterpillar | | CAT 834H - (Wheel) | | 2 |
Graders | | Support Unit | | Komatsu | | GD850 | | 1 |
| | Caterpillar | | CAT 16M | | 2 |
Wheel Loaders | | Support Unit | | Komatsu | | WA470 | | 1 |
| | Caterpillar | | CAT 988 | | 1 |
| | Caterpillar | | CAT 988 | | 1 |
| | Caterpillar | | CAT 966 | | 2 |
The contractor is required to provide an availability of at least 80%, and the utilisation is 85%. Historically, the contractor has been able to provide over 80% availability. Both these values have been applied to productivity calculations for 2018 and beyond.
Dewatering
Gounkoto has two sumps, one in the southern section and one in the northern pit. Water is pumped to surface by a double lift arrangement. Pumps on the bank of the bottom sump stage pump to a higher sump (four pumps in the south, two in the north), where diesel pumps and electrical submersible pumps pump the water to surface via multiple high density polyethylene (HDPE) lines. During the wet season, pumping volumes average 5,000 m3/day from the southern sump and 4,000 m3/day from the northern sump. Gounkoto hasback-up diesel pumps available as spares.
Sixteende-watering bores have been drilled on the east side of the pit and five on the west side to actively lower the groundwater level. The vertical bores maintain groundwater level just below pit bottom; however, five horizontal drains have been drilled in the south wall to depth of 50 m to relieve pressure on this wall. Horizontal bores exhibit low flow rates and are monitored at least weekly; additional horizontal drains will be drilled if necessary. At this time the drains in place appear to be performing adequately. A total of 15 additional, deeper,de-watering holes have been planned with 13 already installed along with an additional 10 piezometers, to manage draw down rates.
| | |
| 18th September 2018 | | Page 239 |
| | | | |
| | Loulo-Gounkoto Gold Mine Complex NI 43-101 Technical Report | | |
Waste Dumps
The following design has been used where waste material is dumped on both the hanging wall and footwall side of the pit, at a maximum distance of 1 km from the ramp exit. Dumps are designed according to the following guidelines:
| | ● | | Ramp widths of 30 m, except for drainage ramps which are 10 m |
| | ● | | Overall slope angle of 23º and batter angles of 37º |
| | ● | | Silt catchment provisions around the entire dump |
| | ● | | Small ramps and drainage gullies are provided where needed to providerun-off. All benches are gently sloping towards drainage areas |
| | ● | | Utilisation of topographical features to minimise the footprint, where possible |
| | ● | | Dumps drain away from the pit |
The revised Super Pit design required some of the dumps in the west to be moved and the dumping method to be changed to accommodate an additional 230 Mt. Scheduling changes have allowed in pit backfilling to be planned, reducing the impact of the space constraint due to the Falémé river to the west of the pit. The following further guidelines were followed:
| | ● | | A 30 m gap between toe of the dump and pit edge was maintained. |
| | ● | | A hardcore bund is required to allow water to drain away from the dump and stop waste slumping into the river. |
| | ● | | Increased dump capacity meant increased weight and pore water pressure that will require greater control as part of west wall slope stability management. |
Life of Mine Plan
The Gounkoto mining plan has been sequenced in such a way that the south pit will be mined out in advance of the north pit. The schedule shows that the south pit will be mined out by April 2019. This will allow the waste mined from the north pit to be backfilled into the south pit allowing for a shorter haul than the conventional route of tramming out of the pit and onto a waste dump.
The additional ore mined in 2019, will be stockpiled to ensure the plant feed requirements are maintained during the waste pushback mining in years 2020 and 2022.
Table16-4 details the life of mine production plan for the Gounkoto pit.
| | |
| 18th September 2018 | | Page 240 |
| | | | |
| | Loulo-Gounkoto Gold Mine Complex NI 43-101 Technical Report | | |
Table16-4 Life of Mine Production Plan for the Gounkoto Pit
| | | | | | | | | | | | | | | | | | |
| Item | | Units | | LOM | | 2018 | | 2019 | | 2020 | | 2021 | | 2022 | | 2023 | | 2024 |
Open Pit Mining | | | | | | | | | | | | | | | | | | |
Waste | | | | | | | | | | | | | | | | | | |
Gounkoto | | kt | | 200,921 | | 33,098 | | 32,099 | | 37,837 | | 36,344 | | 28,250 | | 26,692 | | 6,600 |
Faraba | | kt | | 8,954 | | - | | - | | - | | - | | 2,985 | | 2,985 | | 2,985 |
Total Waste Tonnes | | kt | | 209,875 | | 33,098 | | 32,099 | | 37,837 | | 36,344 | | 31,235 | | 29,677 | | 9,585 |
Ore | | | | | | | | | | | | | | | | | | |
Gounkoto | | kt | | 13,660 | | 3,337 | | 2,749 | | 1,041 | | 1,544 | | 919 | | 1,632 | | 2,438 |
Faraba | | kt | | 2,480 | | - | | - | | - | | - | | 827 | | 827 | | 827 |
Total Ore Tonnes | | kt | | 16,140 | | 3,337 | | 2,749 | | 1,041 | | 1,544 | | 1,746 | | 2,458 | | 3,265 |
Gold Grade | | | | | | | | | | | | | | | | | | |
Gounkoto | | g/t | | 5.03 | | 3.61 | | 5.88 | | 4.84 | | 3.97 | | 4.82 | | 3.88 | | 7.62 |
Faraba | | g/t | | 2.51 | | - | | - | | - | | - | | 2.51 | | 2.51 | | 2.51 |
Total | | g/t | | 4.64 | | 3.61 | | 5.88 | | 4.84 | | 3.97 | | 3.73 | | 3.42 | | 6.32 |
Gold Ounces | | | | | | | | | | | | | | | | | | |
Gounkoto | | koz | | 2,209 | | 387 | | 520 | | 162 | | 197 | | 142 | | 204 | | 597 |
Faraba | | koz | | 200 | | - | | - | | - | | - | | 67 | | 67 | | 67 |
Total | | koz | | 2,409 | | 387 | | 520 | | 162 | | 197 | | 209 | | 270 | | 664 |
Strip Ratio | | w:o | | 13.0 | | 9.9 | | 11.7 | | 36.4 | | 23.5 | | 17.9 | | 12.1 | | 2.9 |
| | |
| 18th September 2018 | | Page 241 |
| | | | |
| | Loulo-Gounkoto Gold Mine Complex NI 43-101 Technical Report | | |
16.3 Loulo Underground Mining Operations
Introduction
The underground ore comes from Yalea underground mine, which was developed in 2008 as the Yalea pit came to the end of its life, and the Gara underground mine, which is a more recent extension (2009) of the former Gara open pit. During 2017, Yalea produced 1.5 Mt at 8.18g/t and Gara produced 1.2Mt at 3.75 g/t via an open stoping with backfill mining method.
Both mines have separate management teams and are run independently from each other, although equipment maintenance is undertaken in the Central Workshop which is shared. All mining is carried out as an owner operation.
The Yalea and Gara underground mines are accessed via portals located in open pits and a box cut. The 5.5 m wide by 6.0 m high declines were originally developed as twin declines with one decline carrying a conveyor belt system from the underground crusher to surface for both ore and waste handling purposes, and the other is used for vehicle access.
The lower parts of the mines have been developed as single declines with truck haulage up to the crushers which feed ore and waste onto the conveyors. Currently the crushers are located at 208 level in Yalea and 90 level in Gara. These are proposed to be the end points of the conveyors and all haulage will be diesel trucks to these crushers.
Most of the underground mining production equipment was replaced in 2016. The current fleet is detailed in Table16-5.
| | |
| 18th September 2018 | | Page 242 |
| | | | |
| | Loulo-Gounkoto Gold Mine Complex NI 43-101 Technical Report | | |
Table16-5 Yalea and Gara Mining Fleet as of 31st December 2017
| | | | | | |
| Equipment | | OEM | | Unit | | 2018 |
LHDs | | Sandvik | | LH621 | | 11 |
Trucks | | Sandvik | | TH663 | | 11 |
Development Drills | | Sandvik | | DD421 | | 5 |
Production Drills | | Sandvik | | DL421 | | 4 |
TheLow-Haul-Dump Loaders (LHDs) are equipped with remote control systems. Sandvik has a support team and warehouseon-site to support the operations. Some Caterpillar ancillary equipment is still in use.
Mine Development
In the lower parts of the both mines the declines have been split into multiple access ramps; below 230 level in Yalea and below 145 level in Gara. The ramps are spaced at approximately 500 m intervals along strike. This change has reduced the amount of waste development in the footwall, while limiting the loader tramming distances to mostly below 200 m. The development layout for Yalea and Gara is shown in Figure16-3 and Figure16-4 respectively.
Level accesses are at a vertical interval of 25 m in all new long hole stoping areas; with 20 m level intervals in stoping under rock fill (SURF) areas and some upper areas of the mines were developed with 20 m level interval and are still in production.
Primary development ends and cross cuts are 5.5 m wide by 6.0 m high, sized to fit the Sandvik 60 t trucks, while ore drives and supporting development are 5.0 m wide and 5.5 m high. Ground support is mainly split sets with mesh.
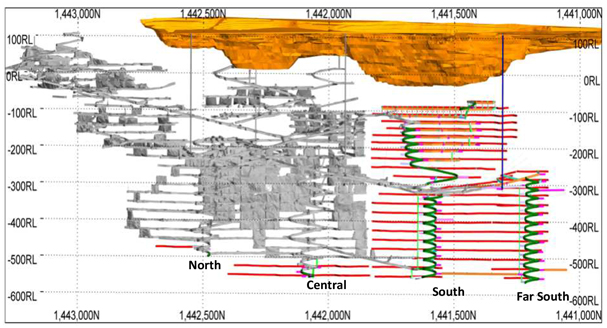
| | |
| 18th September 2018 | | Page 243 |
| | | | |
| | Loulo-Gounkoto Gold Mine Complex NI 43-101 Technical Report | | |
Figure16-3 Yalea Life of Mine Plan Development Long Section (Looking East)
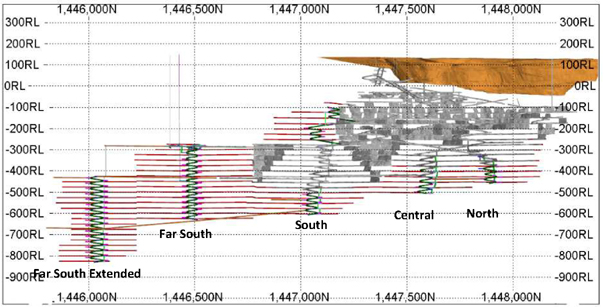
Figure16-4 Gara Life of Mine Plan Development Long Section (Looking West)
Mining Methods
Long hole transverse open stoping and long hole longitudinal retreat open stoping are currently being used. Stoping under rock fill (SURF) mining is planned to be introduced in the weathered areas of Yalea south upper.
Long Hole Open Stoping
Current mining in the lower areas of the mine is an underhand (top down) long hole stoping method which retreats to central accesses in an echelon format. Panels are 50 m long, mined as single level stopes (25 m high) and filled with cemented paste fill. The paste fill is exposed by the mining of both the panel below and the next panel on the same level. At Yalea, 102 mm holes are drilled, while at Gara 89 mm holes are drilled in a fan arrangement and blasted as required to sustain production. Four to five panels are in production at any time. The ring design is modified using geological data to reduce dilution in each panel. Remote LHDs are used to load out blasted material.
Transverse long hole open stoping is used in the wider (over 15 m wide) parts of Yalea North. Transverse stopes are 15 m to 30 m along strike and mined from hanging wall to footwall. Figure16-5 and Figure16-6 illustrate the Yalea and Gara long hole stoping areas.
| | |
| 18th September 2018 | | Page 244 |
| | | | |
| | Loulo-Gounkoto Gold Mine Complex NI 43-101 Technical Report | | |
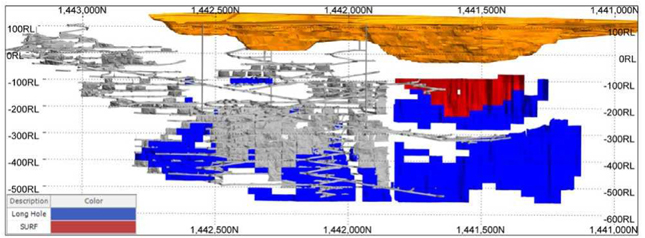
Figure16-5 Yalea Stoping Method Long Section
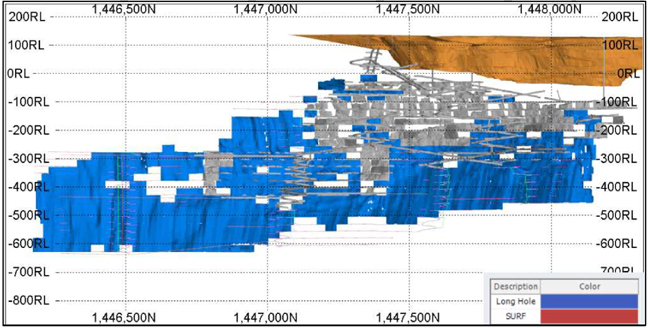
Figure16-6 Gara Stoping Method Long Section
Stoping Under Rock Fill (SURF)
The SURF method is proposed for the part of Yalea South Upper that has weathered transition or saprolite present in the mineralised zone, or the immediate hanging wall. The method will be used as it is expected to provide more consistent production in the poorer ground conditions observed in geotechnical drilling and geotechnical block models. Figure16-5 illustrates the Yalea SURF stoping areas.
The capital development design for SURF mining will support a change to long hole open stoping, if required, after mining of this area has commenced and the geotechnical performance of the ore zone and hanging wall is better understood.
SURF mining involves:
| | |
| 18th September 2018 | | Page 245 |
| | | | |
| | Loulo-Gounkoto Gold Mine Complex NI 43-101 Technical Report | | |
| | ● | | Filling the stopes with waste rock fill from tipping points at the top of the mining area to support the hanging wall. |
| | ● | | Tight blasting production drill rings (up holes) against the waste. |
| | ● | | Mucking ore until waste has rilled into the draw point. |
| | ● | | Tipping additional waste into the top of the mining area to provide support to the hanging wall. |
From an operational perspective, SURF is very similar to longitudinal sub level caving (SLC). The exception is that in SURF, waste rock is tipped into the stope to fill mined voids and prevent caving of the hanging wall. In contrast, SLC works by the hanging wall caving to fill the mined void. In SLC, this caving of the hanging wall will often propagate through to the surface, causing subsidence. In SURF, the intention is to prevent this large-scale caving of the hanging wall.
The development design has waste tip points at the top of the SURF mining area at 20 m spacing to minimise the span of hanging wall exposed (Figure16-7). Production levels are developed with partial footwall drives to enable more competent long hole stoping areas to be mined first (Figure16-8).
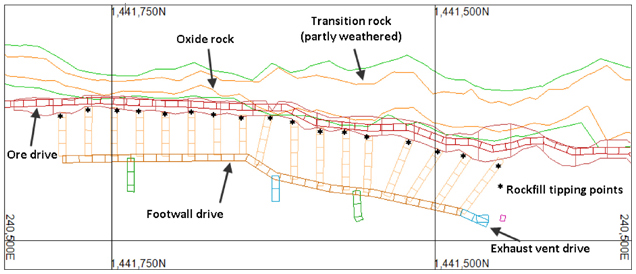
Figure16-7 Stoping Under Rock Fill (SURF) Development Layout at Top of Mining Area (85 Level), Showing Waste Tipping Points
| | |
| 18th September 2018 | | Page 246 |
| | | | |
| | Loulo-Gounkoto Gold Mine Complex NI 43-101 Technical Report | | |
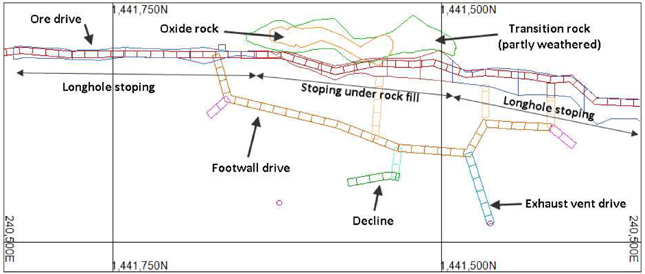
Figure16-8: Stoping Under Rock Fill (SURF) Development Layout of Production Level (185 Level)
Ventilation
At Yalea there are three declines that serve as intake airways: two in the Yalea and one atP-125, with a further intake in a chilled air raise at Yalea North. Two ventilation raises serve as return airways. Primary fans at Yalea are 630 kW units with two located at both the North raise borehole and the South raise borehole. Measured air flow at the North location is 277 m3/s and 273 m3/s at the South. Secondary ventilation to working areas is provided with 110 kW to 180 kW fans and 1,200 mm ventilation ducting.
Primary ventilation at Gara intakes through the twin portal and a chilled air raise bore; and exhausts through a pit vent access and return air raises to surface. Secondary ventilation to working areas is provided with 110 kW to 180 kW fans and 1,200 mm ventilation ducting. Backup power is available for the ventilation fans.
Large refrigeration plants have been constructed at both Yalea and Gara. These plants are identical and cool the intake air by 13°C with a throughput of 150 m3/s. This air enters the mine via the chilled air raise bores to 260 level and to 280 level from where it is mixed with the other fresh air. Both plants were commissioned in early 2017. Power usage of each plant is 3.2 MW.
Backfill
In 2015, paste fill plants were commissioned at both mines. The paste fill plants produce a mixed paste/aggregate fill. The Yalea paste plant produces 3,100 m3 per day and the Gara paste plant produces 2,750 m3 per day.
The ratio of slag/cement/tailings can be varied to change the strength of the backfill with the 90% tailings, 6% cement, and 4% slag giving the highest strength. The type of backfill required from either plant is based on geotechnical modelling of the opening to be filled.
The design strength of paste fill varies from 0.3 MPa to 0.5 MPa compressive strength for stopes that are not exposed below, that is an overhand (bottom up) stoping; to 0.9 MPa to 2.4 MPa
| | |
| 18th September 2018 | | Page 247 |
| | | | |
| | Loulo-Gounkoto Gold Mine Complex NI 43-101 Technical Report | | |
compressive strength for stope that will be exposed below, that is an underhand (top down) stoping method. The plant is currently operating on 100% classified mill tailings, while previously, a 30% aggregate: 70% paste ratio, and a 50% aggregate: 50% paste ratio, have been used. The current configuration reduces pipe wear and the reduced viscosity enables paste reticulation to the extremities of the mine. Cement percentages vary from 2.2% to 5.7% for the above design strength range.
Initially, reticulation issues resulted from long horizontal lines and resulted in excessive pressure on the lines and limited the speed of pumping causing some paste line blockage. Raise boring has been used to drill additional lines; Gara now has two lines, and Yalea has three lines.
Dewatering
The current total pumping capacity at Gara is 120 l/s. The current reticulation uses a series of 20 l/s Mono pumps cascaded from one sump to another up to the main sumps at 135 level. From here it is either pumped to the 40 level XC8 pump station, where water is pumped direct to surface via three 110 mm lines or pumped via a backup system to surface using two 150 mm lines.
The current pumping rate at Yalea is 110 l/s from the underground and 40 l/s from the old open pit. The current reticulation uses the series of Mono pumps in the deeper areas of the North declines pumping at 20 l/s by daisy chain to main sumps at 35 level. From here it is pumped by larger pumps at 40 l/s to the main station on 258 level. From the 258 level sump it is pumped via a sump on 168 level to the main sump at 88 level. In the southern decline, water is pumped to a sump on 208 level from where it is pumped to the 88 level, the main pump chamber. From there water is pumped straight to surface via four 150 mm steel lines.
The electrical feed to the pump stations is supplied via a specific borehole carrying the cable or though the 11kV underground ring feed. There is an emergency power supply arrangement to these pumps.
Life of Mine Plan
The life of mine schedule for Yalea and Gara was created in Datamine 5DP / EPS software, a task-based dependency scheduler. The overall Loulo- Gounkoto complex life of mine was created in Excel by combining the output from the underground and open pit scheduling packages.
The Yalea life of mine extends to 2028 and Gara to 2032 (Table16-6 and Table16-7).
Total life of mine lateral development for Yalea is 39,000 m with capital development forming 44% of this at 17,200 m. The life of mine operating development, including ore drives, is 21,800 m.
Total life of mine lateral development for Gara is 45,000 m with capital development forming 47% of this at 21,300 m. The life of mine operating development, including ore drives, is 23,700 m.
| | |
| 18th September 2018 | | Page 248 |
| | | | |
| | Loulo-Gounkoto Gold Mine Complex NI 43-101 Technical Report | | |
The current fleet is expected to be sufficient and the total labour force will slowly reduce from the current total of 1,260 people.
| | |
| 18th September 2018 | | Page 249 |
| | | | |
| | Loulo-Gounkoto Gold Mine Complex NI 43-101 Technical Report | | |
Table16-6 Yalea Life of Mine Production Schedule
| | | | | | | | | | | | | | | | | | | | | | | | | | |
| | | Units | | 2018 | | 2019 | | 2020 | | 2021 | | 2022 | | 2023 | | 2024 | | 2025 | | 2026 | | 2027 | | 2028 | | LOM
Total |
All Ore Tonnes | | kt | | 1,429 | | 1,439 | | 1,450 | | 1,446 | | 1,455 | | 1,453 | | 1,453 | | 1,372 | | 963 | | 524 | | 301 | | 13,285 |
All Ore Grade | | g/t | | 6.25 | | 6.22 | | 5.92 | | 6.94 | | 6.08 | | 5.31 | | 5.42 | | 5.07 | | 4.31 | | 4.80 | | 3.94 | | 5.70 |
All Ore Ounces | | koz | | 287 | | 288 | | 276 | | 322 | | 285 | | 248 | | 253 | | 224 | | 133 | | 81 | | 38 | | 2,435 |
| | | | | | | | | | | | | | | | | | | | | | | | | | | |
Stope Diluted Tonnage | | kt | | 1,252 | | 1,262 | | 1,273 | | 1,329 | | 1,316 | | 1,365 | | 1,453 | | 1,372 | | 963 | | 524 | | 301 | | 12,411 |
Stope Diluted Grade | | g/t | | 6.39 | | 6.26 | | 5.85 | | 6.92 | | 6.12 | | 5.30 | | 5.42 | | 5.07 | | 4.31 | | 4.80 | | 3.94 | | 5.68 |
| | | | | | | | | | | | | | | | | | | | | | | | | | | |
Ore Development Tonnage | | kt | | 177 | | 177 | | 178 | | 116 | | 139 | | 88 | | - | | - | | - | | - | | - | | 874 |
Ore Development Grade | | g/t | | 5.29 | | 5.92 | | 6.44 | | 7.15 | | 5.73 | | 5.46 | | - | | - | | - | | - | | - | | 5.99 |
| | | | | | | | | | | | | | | | | | | | | | | | | | | |
North All Ore Tonnes | | kt | | 581 | | 408 | | 265 | | 349 | | 240 | | 245 | | 159 | | 172 | | 229 | | 78 | | 0 | | 2,727 |
North All Ore Grade | | g/t | | 5.20 | | 6.84 | | 6.70 | | 8.51 | | 5.39 | | 4.71 | | 4.26 | | 5.72 | | 4.34 | | 6.36 | | | | 5.93 |
| | | | | | | | | | | | | | | | | | | | | | | | | | | |
Central All Ore Tonnes | | kt | | 611 | | 441 | | 249 | | 25 | | - | | - | | - | | - | | - | | 18 | | 0 | | 1,346 |
Central All Ore Grade | | g/t | | 7.51 | | 6.05 | | 4.47 | | 3.26 | | - | | - | | - | | - | | - | | 2.93 | | | | 6.32 |
| | | | | | | | | | | | | | | | | | | | | | | | | | | |
South Upper All Ore Tonne | | kt | | 19 | | 33 | | 129 | | 237 | | 131 | | 471 | | 669 | | 798 | | 447 | | 271 | | 301 | | 3,506 |
South Upper All Ore Grade | | g/t | | 3.43 | | 4.47 | | 5.18 | | 5.17 | | 4.86 | | 4.26 | | 4.61 | | 4.61 | | 3.75 | | 4.04 | | 3.94 | | 4.41 |
| | | | | | | | | | | | | | | | | | | | | | | | | | | |
South Lower All Ore Tonnes | | kt | | 197 | | 529 | | 605 | | 503 | | 569 | | 294 | | 57 | | 200 | | 96 | | - | | - | | 3,050 |
South Lower All Ore Grade | | g/t | | 6.09 | | 5.93 | | 6.15 | | 6.52 | | 5.39 | | 4.53 | | 3.69 | | 5.59 | | 4.30 | | - | | - | | 5.73 |
| | | | | | | | | | | | | | | | | | | | | | | | | | | |
Far South All Ore Tonnes | | kt | | - | | 41 | | 203 | | 331 | | 515 | | 443 | | 567 | | 202 | | 191 | | 157 | | - | | 2,651 |
Far South All Ore Grade | | g/t | | - | | 5.84 | | 6.47 | | 7.46 | | 7.49 | | 7.28 | | 6.86 | | 5.81 | | 5.58 | | 5.57 | | - | | 6.83 |
| | |
| 18th September 2018 | | Page 250 |
| | | | |
| | Loulo-Gounkoto Gold Mine Complex NI 43-101 Technical Report | | |
Table16-7 Gara Life of Mine Production Schedule
| | | | | | | | | | | | | | | | | | | | | | | | | | | | | | | | | | |
| | | Units | | 2018 | | 2019 | | 2020 | | 2021 | | 2022 | | 2023 | | 2024 | | 2025 | | 2026 | | 2027 | | 2028 | | 2029 | | 2030 | | 2031 | | 2032 | | LOM
Total |
All Ore Tonnes | | kt | | 1,181 | | 1,251 | | 1,250 | | 1,250 | | 1,253 | | 1,252 | | 1,255 | | 1,254 | | 1,249 | | 1,252 | | 1,157 | | 917 | | 396 | | 223 | | 200 | | 15,338 |
All Ore Grade | | g/t | | 3.90 | | 3.72 | | 4.16 | | 4.18 | | 3.89 | | 3.97 | | 4.86 | | 4.39 | | 4.24 | | 4.22 | | 4.45 | | 4.53 | | 4.4 | | 4.53 | | 3.36 | | 4.20 |
All Ore Ounces | | koz | | 148 | | 150 | | 167 | | 168 | | 156 | | 160 | | 196 | | 177 | | 170 | | 170 | | 166 | | 133 | | 56 | | 33 | | 22 | | 2,071 |
| | | | | | | | | | | | | | | | | | | | | | | | | | | | | | | | | | | |
Stope Diluted Tonnage | | kt | | 970 | | 1,057 | | 1,046 | | 1,008 | | 1,012 | | 1,001 | | 998 | | 1,254 | | 1,249 | | 1,252 | | 1,157 | | 917 | | 396 | | 223 | | 200 | | 13,741 |
Stope Diluted Grade | | g/t | | 3.85 | | 3.70 | | 4.16 | | 4.13 | | 3.74 | | 3.67 | | 4.77 | | 4.39 | | 4.24 | | 4.22 | | 4.45 | | 4.53 | | 4.40 | | 4.53 | | 3.36 | | 4.16 |
| | | | | | | | | | | | | | | | | | | | | | | | | | | | | | | | | | | |
Ore Development Tonnage | | kt | | 210 | | 194 | | 203 | | 242 | | 241 | | 251 | | 257 | | - | | - | | - | | - | | - | | - | | - | | - | | 1,597 |
Ore Development Grade | | g/t | | 4.12 | | 3.84 | | 4.15 | | 4.38 | | 4.50 | | 5.16 | | 5.19 | | - | | - | | - | | - | | - | | - | | - | | - | | 4.52 |
| | | | | | | | | | | | | | | | | | | | | | | | | | | | | | | | | | | |
North All Ore Tonnes | | kt | | 292 | | 277 | | 238 | | 299 | | 419 | | 559 | | 371 | | 187 | | 105 | | - | | - | | - | | - | | - | | 41 | | 2,788 |
North All Ore Grade | | g/t | | 3.54 | | 3.70 | | 5.67 | | 4.65 | | 3.85 | | 3.80 | | 5.36 | | 5.96 | | 3.63 | | - | | - | | - | | - | | - | | 3.03 | | 4.36 |
| | | | | | | | | | | | | | | | | | | | | | | | | | | | | | | | | | | |
Central All Ore Tonnes | | kt | | 444 | | 356 | | 349 | | 298 | | 311 | | 79 | | - | | 13 | | 17 | | - | | - | | - | | - | | - | | - | | 1,867 |
Central All Ore Grade | | g/t | | 4.15 | | 3.82 | | 3.90 | | 3.27 | | 3.11 | | 2.57 | | - | | 4.41 | | 3.71 | | - | | - | | - | | - | | - | | - | | 3.66 |
| | | | | | | | | | | | | | | | | | | | | | | | | | | | | | | | | | | |
South All Ore Tonne | | kt | | 445 | | 618 | | 555 | | 412 | | 183 | | 68 | | - | | - | | - | | - | | - | | - | | - | | 37 | | 58 | | 2,374 |
South All Ore Grade | | g/t | | 3.88 | | 3.67 | | 3.61 | | 4.42 | | 3.98 | | 3.84 | | - | | - | | - | | - | | - | | - | | - | | 4.68 | | 3.03 | | 3.85 |
| | | | | | | | | | | | | | | | | | | | | | | | | | | | | | | | | | | |
South Upper All Ore Tonne | | kt | | - | | - | | 2 | | 84 | | 110 | | 208 | | 189 | | 181 | | 92 | | 50 | | - | | - | | - | | - | | - | | 915 |
South Upper All Ore Grade | | g/t | | - | | - | | 2.36 | | 4.62 | | 4.67 | | 3.65 | | 4.48 | | 3.64 | | 3.47 | | 3.02 | | - | | - | | - | | - | | - | | 3.98 |
| | | | | | | | | | | | | | | | | | | | | | | | | | | | | | | | | | | |
Far South All Ore Tonnes | | kt | | - | | - | | 107 | | 157 | | 228 | | 148 | | 411 | | 478 | | 688 | | 805 | | 530 | | 147 | | 44 | | - | | 76 | | 3,821 |
Far South All Ore Grade | | g/t | | - | | - | | 4.46 | | 4.16 | | 4.56 | | 4.39 | | 4.40 | | 4.06 | | 4.42 | | 4.20 | | 4.52 | | 3.35 | | 4.27 | | - | | 3.56 | | 4.28 |
| | | | | | | | | | | | | | | | | | | | | | | | | | | | | | | | | | | |
Far South Extended All Ore Tonnes | | kt | | - | | - | | - | | - | | - | | 190 | | 284 | | 394 | | 348 | | 397 | | 626 | | 769 | | 352 | | 187 | | 26 | | 3,573 |
Far South Extended All Ore Grade | | g/t | | - | | - | | - | | - | | - | | 5.10 | | 5.13 | | 4.38 | | 4.30 | | 4.42 | | 4.39 | | 4.75 | | 4.41 | | 4.50 | | 4.01 | | 4.56 |
| | |
| 18th September 2018 | | Page 251 |
| | | | |
| | Loulo-Gounkoto Gold Mine Complex NI 43-101 Technical Report | | |
| 16.4 | Gounkoto Underground Operations |
Introduction
Underground mine operations for Gounkoto were determined in the December 2016 UndergroundPre-Feasibility. The mine life is six years. Ore production starts in 2025 and increases to a maximum of 525 kt in 2027, after which it steadily declines until end of mine life. The last year of production is in 2030 with 316 kt at 5.3 g/t Au.
The operation will include a combination of transverse and longitudinal open stopes and all material will be trucked to surface. There is only a single ramp. The exhaust system is a return air raise (RAR) will be developed simultaneously with the ramp.
Mine Development
The upper portions of the Gounkoto MZ1, MZ2, and MZ3 lodes are being mined in the Gounkoto open pit. The proposed decline will commence from within the pit to minimise the development distance to the orebody and eliminate the need to commence a decline in unconsolidated ground, which is typically 25 m below the surface and can occur up to 50 m below the surface.
The decline will start in 2025 while open pit mining is still underway. There will be an opportunity to stabilise the pit wall above the portal and return air adit positions before they are reached and required for mining. Figure16-9 is an isometric view of the underground mine below the pit and shows the location of the portal access and return air adit.
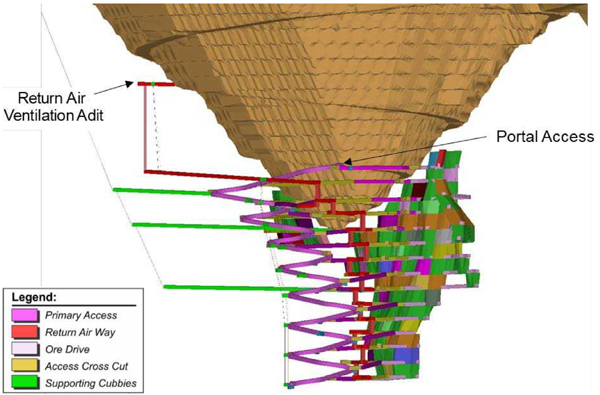
Figure16-9 Isometric View of Underground Design in Relation to Super Pit Design
| | |
| 18th September 2018 | | Page 252 |
| | | | |
| | Loulo-Gounkoto Gold Mine Complex NI 43-101 Technical Report | | |
The decline has been designed to access the orebody from the western side. This avoids accesses going through the Fault Gouge which is adjacent to the eastern side of the orebody and is predominantly classed as ‘Poor’ ground. The West Dipping Fault approaches the western side of the orebody in the upper part of the underground mining area and dips away from the orebody with depth.
The decline maintains a minimum 50 m horizontal clearance to the mining footwall contact of the orebody. The decline has been designed in an oval configuration with straights between curves to better suit truck haulage. Each loop in the decline has been designed to drop down 40 m vertically.
Figure16-10 is a longitudinal projection looking east showing the decline and level development.
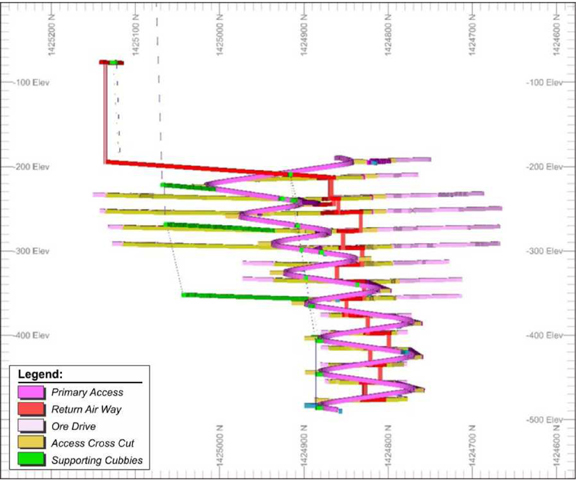
Figure16-10: Longitudinal Projection Looking East Showing Decline and Level Development
Each level has a single access from the decline to the footwall drive. The accesses are designed to be central to the north-south extents of the orebody, but this is limited by the design of the decline which has a loop every second level.
| | |
| 18th September 2018 | | Page 253 |
| | | | |
| | Loulo-Gounkoto Gold Mine Complex NI 43-101 Technical Report | | |
Figure16-11 is a view looking east of a typical level design showing the variation in the position of the level.
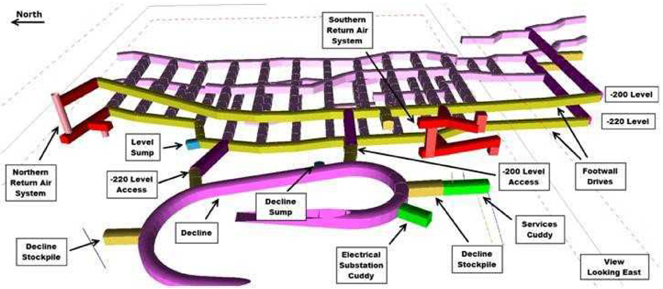
Figure16-11 View Looking East of Typical Level Designs Showing Variation in Position of Level
A plan view of a typical level layout is shown in Figure16-12.
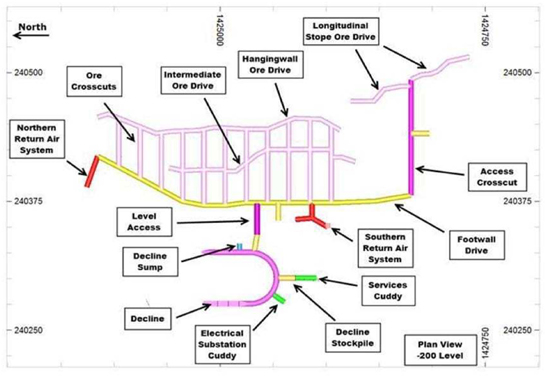
Figure 16-12 Plan View of Typical Level Layout
The levels are designed to have a footwall drive with crosscuts to the orebody for transverse stopes and access to ore drives for longitudinal stopes. The footwall drives on each level extend
| | |
| 18th September 2018 | | Page 254 |
| | | | |
| | Loulo-Gounkoto Gold Mine Complex NI 43-101 Technical Report | | |
from the northern extents to the southern extents of the orebody and provide access to stope crosscuts and return airway systems.
The primary access and cross cuts are 6 m high by 5.5 m wide while ore drives are 5 m high by 5 m wide.
Mining Methods
Long hole transverse stoping and long hole longitudinal stoping will be used at the Gounkoto underground mine.
The extraction sequence for the wider parts of the orebody is a primary/secondary stoping sequence and requires a footwall drive to provide access to the secondary stope after a primary stope is extracted. The primary/secondary stoping sequence enables the filling secondary stopes withun-cemented fill which is a substantial cost saving.
In the transverse stoping area, ore crosscuts are driven from the footwall drive east towards and through the orebody to meet a hanging wall ore drive (slot drive) on the eastern side of the orebody.
Longitudinal stoping areas have a single ore drive driven along the centre or near to the hanging wall of the orebody. The drive is developed to the extents of the stoping block and stopes are taken, retreating to the access crosscut.
The long hole stoping method is a‘bottom-up’ mining method. The number of levels in each stoping block varies depending on the geometry of the orebody. Areas that have less ore or lower grade ore present opportunities for a crown pillar, where ore recoveries are lower. Figure16-13 shows a longitudinal projection of the grades of stopes. The-440 Level has been selected as the base of a block so that higher grade ore can be mined earlier. That block then goes up three levels to the base of the next block at-360 Level. The stoping blocks and stope types are shown in Figure16-14 and Figure16-15.
For longitudinal and transverse stopes, a burden of 2.3 m and a spacing of 3.3 m has been assumed using 89 mm diameter holes.
| | |
| 18th September 2018 | | Page 255 |
| | | | |
| | Loulo-Gounkoto Gold Mine Complex NI 43-101 Technical Report | | |

Figure16-13 Longitudinal Projection Looking East Showing Stopes at an Average Au Grade
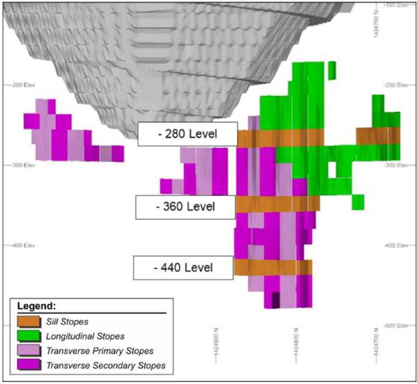
Figure16-14 Longitudinal Projection Looking East Showing Stope Blocks by Mining Type
| | |
| 18th September 2018 | | Page 256 |
| | | | |
| | Loulo-Gounkoto Gold Mine Complex NI 43-101 Technical Report | | |
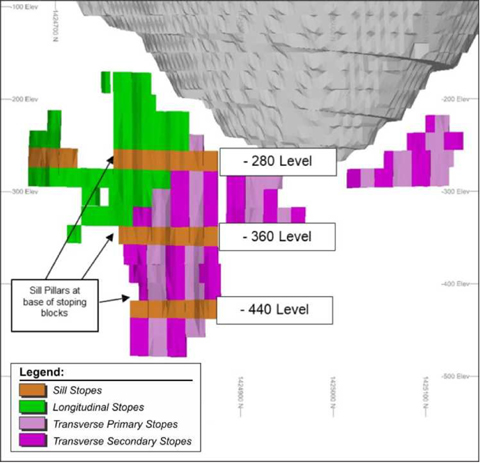
Figure16-15 Longitudinal Projection Looking West Showing Stope Blocks and Stope Types
Transverse Stopes
The transverse stopes are mined using a ‘primary/secondary’ sequence. This is a sequence where every second stope on a level is mined and filled with cement aggregate fill (CAF) or cement rock fill (CRF) before the remaining stopes in between are extracted and can be filled with loose rock fill.
All stopes on the sill level are to be filled with CAF to provide a stable crown for improved recovery when mining the blind uphole stopes underneath. The stopes that are above the sill levels are to be filled using the conventional primary/secondary method.
Where horizontal stope widths, across strike, are greater than approximately 15 m, the stopes have been designed as transverse long hole stopes. This is generally in the MZ3 zone which is in the northern part of the mine. Stope widths less than 15 m have been designed as longitudinal long hole stopes. Figure16-16 is a longitudinal projection of a transverse stope layout.
| | |
| 18th September 2018 | | Page 257 |
| | | | |
| | Loulo-Gounkoto Gold Mine Complex NI 43-101 Technical Report | | |
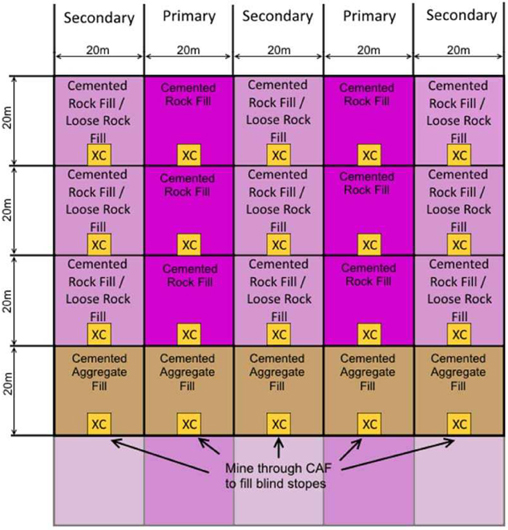
Figure16-16 Longitudinal Projection of Transverse Stope Layout
Longitudinal Stopes
Longitudinal long hole stopes are designed for mining the narrower parts of the orebody. The stopes are mined from the furthest extent of the orebody and retreated back to the access. A single ore drive is used for access for drilling and mucking. Stoping is commenced with a slot at the extreme end of the stope and the stope can be retreated back to a maximum stable span which, in this case, is designed to be 20 m. The stope is then initially filled with CRF to form a solid pillar for the next stope and then finished by filling with loose rock. The next stope is then commenced by slotting against the CRF. A longitudinal projection of the longitudinal stoping method is shown in Figure16-17.
| | |
| 18th September 2018 | | Page 258 |
| | | | |
| | Loulo-Gounkoto Gold Mine Complex NI 43-101 Technical Report | | |
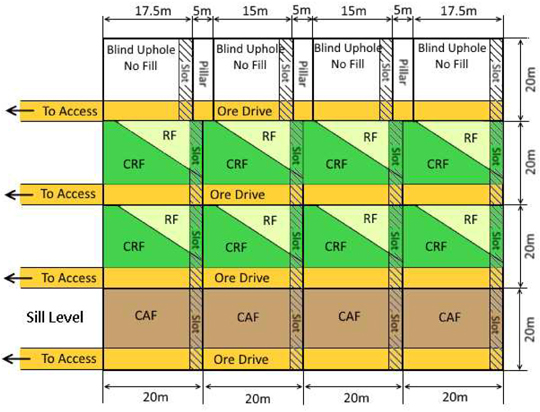
Figure16-17 Longitudinal Projection of Longitudinal Longhole Stoping
Ventilation
The return airway raise will be accessed from an adit within the final pit to minimise raising metres, eliminate the need for apre-sink, and to minimise underground development to the bottom of the raise.
The surface primary exhaust fans will be located on the exhaust portal bench. The primary fan duty is 180 m3/s at 1.15 kg/m3 at 1,625 Pa collar total pressure. The fan will be approximately 400 kW and will consist of two fans in parallel.
Based on experience at Gara and Yalea, Gounkoto underground will require some refrigeration to achieve the Randgold standard of not having persons working outside ofair-conditioned cabins at temperatures above 30° wet bulb. Air will be chilled by a Bulk Air Cooler connected to a fridge plant. The fridge plant is currently assumed to be similar to those used at Yalea and Gara, with further detailing to be completed in the future. Chilled air will be introduced into the main portal via a nearby second portal off the same bench in the open pit, then will travel down the ramp system. Each level will be ventilated in series off the ramp and the air then enters the bottommost RAR connection.
| | |
| 18th September 2018 | | Page 259 |
| | | | |
| | Loulo-Gounkoto Gold Mine Complex NI 43-101 Technical Report | | |
Surface and Underground Infrastructure
There are four underground electrical substations designed in the mine. The electrical substations have been designed to each service three levels. The lower most substation is located in the decline above the lower pump station.
A permanent pump station has been designed at the bottom of the underground workings. It is located near the end of the decline and will pump to the elevation of the portal and discharge into the pit workings. Pumped water will be routed via pipes situated in service drives located off the decline.
CAF is to be used in all sill stopes. The Euromix Continuous Mobile CAF plant, designed by Nisbau GMBH, is currently located at the Loulo mine and is to be relocated to a location on the western side of the Gounkoto open pit and will prepare CAF for delivery underground via service hole at this location.
The slurry plant is to be located on the western side of the pit alongside the CAF plant and will prepare slurry for delivery underground via a service hole at this location.
This approach is similar to what is used at Gara and Yalea, with adjustments expected as production begins.
Life of Mine Plan
The Gounkoto underground life of mine plan is based the productivity rates and time rates achieved at Gara and Yalea, as shown in Table16-8 and Table16-9.
Table16-8 Productivity Rate
| | | | |
| Resource | | Rate | | Units |
Dev Jumbo | | 250 | | metres/month |
ITH Rig | | 20 | | metres/day |
Cable Bolter | | 190 | | Cable bolt metres/day |
Long Hole Rig | | 5,700 | | Production drill metres/month |
Production Bogger | | 1,000 | | insitu tonnes/day |
Development Bogger | | 12 | | metres/day |
Backfill Bogger Rockfill | | 1,000 | | rockfill tonnes/day |
Backfill Bogger Cemented Fill | | 1,000 | | cemented fill tonnes/day |
Cubex V30 | | 2 | | metres/day |
| | |
| 18th September 2018 | | Page 260 |
| | | | |
| | Loulo-Gounkoto Gold Mine Complex NI 43-101 Technical Report | | |
Table16-9 Time Rates for Activities
| | | | |
| Activity | | Rate | | Units |
Development Default | | 4 | | metres/day |
Decline Development | | 4 | | metres/day |
Production Development | | 3 | | metres/day |
| | | | | |
Production drilling | | 5,700 | | prod drill metres/month |
Cable Drilling | | 190 | | cable bolt metres/day |
Service Hole Drilling | | 50 | | metres/day |
| | | | | |
Raise Bore Hole | | 3.5 | | metres/day |
Return Air Raise | | 2 | | metres/day |
Slot Rise | | 2 | | metres/day |
| | | | | |
Long Hole Stope Production | | 1,000 | | insitu tonnes/day |
| | | | | |
Sill Prep | | 2 | | days |
Stope Prep | | 7 | | days |
| | | | | |
Fill Preparation | | 3 | | days |
Fill | | 800 | | rock fill tonnes/day |
The production schedule and key mine physicals are summarised in Table16-10.
Table16-10 Gounkoto Production Schedule and Key Mine Physicals
| | | | | | | | | | | | | | | | |
| Physical | | Unit | | 2025 | | 2026 | | 2027 | | 2028 | | 2029 | | 2030 | | LOM |
Lateral Development | | m | | 4,278 | | 5,900 | | 4,801 | | 422 | | - | | - | | 15,401 |
Vertical Development | | m | | 204 | | 375 | | 665 | | 508 | | 460 | | 271 | | 2,483 |
Ore Tonnes | | kt | | 42 | | 348 | | 525 | | 468 | | 418 | | 316 | | 2,117 |
Contained Au | | k | | 9.04 | | 83.45 | | 97.98 | | 92.47 | | 80.07 | | 58.33 | | 421.33 |
Grade | | g/t | | 6.6 | | 7.5 | | 5.8 | | 6.1 | | 6.0 | | 5.7 | | 6.19 |
Waste Tonnes | | kt | | 310 | | 325 | | 247 | | 9 | | - | | - | | 891 |
Backfill | | kt | | - | | 103 | | 131 | | 201 | | 184 | | 233 | | 853 |
Cemented Rock Fill | | kt | | - | | 59 | | 87 | | 79 | | 47 | | 99 | | 372 |
Cemented Aggregate Fill | | kt | | - | | 26 | | 18 | | 94 | | 93 | | 36 | | 268 |
Rockfill | | kt | | - | | 18 | | 26 | | 28 | | 44 | | 97 | | 213 |
Cable-bolt Metres | | km | | 5 | | 19 | | 31 | | 22 | | 19 | | 10 | | 106 |
Production Drill Metres | | km | | - | | 22 | | 44 | | 49 | | 46 | | 35 | | 197 |
The mine will be fully developed by the end of 2028. Schedule optimisation software was used, which has led to planning a high lateral capital development rate early in the mine life, which will permit the establishment of higher-grade stopes earlier than usual. Despite the extra costs incurred, a higher NPV will be achieved.
Total life of mine lateral development is 15,401 m with capital development forming 45% of this at 6,987 m. The life of mine operating development, including ore drives, is 8,414 m. On average the operating waste component constitutes approximately 42% of the total operating development metres. Total life of mine vertical development is 2,484 m with capital development forming approximately 16% of this at 388 m. Production slot raise development makes up the remaining 84% or 2,096 m. The annual development is summarised in Figure16-18.
| | |
| 18th September 2018 | | Page 261 |
| | | | |
| | Loulo-Gounkoto Gold Mine Complex NI 43-101 Technical Report | | |
Figure16-18 Development Coloured by Year
The location of the annual ore production from the underground mine is shown in Figure16-19. All modifying factors such as stope dilution and mining recoveries have been applied.
Figure16-19 Stoping Coloured by Year
The total ore production for thelife-of-mine is 2.1 Mt.
The annual production reaches a peak in 2027 when the decline has reached its maximum depth and the greatest number of transverse stopes are online. Post 2027 ore development is virtually nil, and the mine becomes a pure stoping operation. Production then steadily declines until end of mine life. The drop off in the production tonnage in these latter years is considered unavoidable due to the geometry and tonnages left in the remaining stopes.
The life of mine gold production is 421 koz with an average life of mine grade of 6.2 g/t Au.
| | |
| 18th September 2018 | | Page 262 |
| | | | |
| | Loulo-Gounkoto Gold Mine Complex NI 43-101 Technical Report | | |
The head grade for the initial years of the life of the mine is higher due to targeted scheduling identified during schedule optimisation. Higher grade development and stopes were scheduled earlier on, while at the same time, keeping the mine life limited so as to maximise NPV. For the years from 2028 to 2030 the grade remains fairly constant, however, a consistent drop in total ore tonnage leads to an equally consistent fall in ounces for the last three years.
Overall this mine schedule is considered the best approach for economic efficiency and maximising pay back opportunity whilst still maintaining a technically sound mining sequence.
Manpower
Total contractor and owner manning will reach a peak of 233 inmid-2027. There is a steady build up in manning from 81 at projectstart-up in 2025 until full production in 2027. The manning remains around 200 over the peak production years 2026 and 2027 before steadily dropping in conjunction with production levels. The contractor manning is approximately 195 and the owner manning ranges between 16 and 21. Labour will be moved across from the current Gara and Yalea operations.
| 16.5 | Loulo-Gounkoto Life of Mine Plan |
The Loulo Life of Mine has the operation mining a total of 52 Mt of ore at 4.73 g/t until the year 2032 (Table16-11). This gives Loulo a remaining life of 15 years. During this15-year period the total plant ore feed tonnage will amount to 56 Mt, including current stockpiles, at an average feed grade of 4.55 g/t resulting in a recovered 7.5 Moz at an average processing recovery of 92%. The Yalea operation will continue until 2030 and Gara until 2032, with the Loulo Open Pits mined from 2024 through to 2027. The Gounkoto Open Pit will be mined out in 2024 with the Faraba Pit starting in 2022 and ending in 2024. The Gounkoto Underground Operation will commence in 2025 and will continue until 2030.
A total of 28.6 Mt of ore will be mined from the Yalea and Gara underground operations with a further 5.4 Mt mined from the Loulo 3, Baboto, and Gara West open pits, at the Loulo Operations. The Gounkoto Operations will contribute 16.1 Mt mined ore tonnes from the Gounkoto and Faraba open pits with the Gounkoto underground operation adding 2.1 Mt.
The timing of the Gounkoto underground operations aims to sustain total underground production as the Yalea operation tails off. This keeps the fleet and labour demand level over this period. No extra labour will be required, and the main fleet will peak at 13 trucks, 10 LHDs, four development rigs and four production rigs.
Similarly, the timing of the various open pits aims to sustain open pit production after the Gounkoto Super Pit tails off.
| | |
| 18th September 2018 | | Page 263 |
| | | | |
| | Loulo-Gounkoto Gold Mine Complex NI 43-101 Technical Report | | |
Table16-11 Loulo-Gounkoto Life of Mine Plan
| | | | | | | | | | | | | | | | | | | | | | | | | | | | | | | | | | |
| | | Units | | LOM | | 2018 | | 2019 | | 2020 | | 2021 | | 2022 | | 2023 | | 2024 | | 2025 | | 2026 | | 2027 | | 2028 | | 2029 | | 2030 | | 2031 | | 2032 |
Waste (Mt) | | | | | | | | | | | | | | | | | | | | | | | | | | | | | | | | | | |
Loulo 3 | | Mt | | 45.9 | | - | | - | | - | | - | | - | | - | | 19.2 | | 26.7 | | - | | - | | - | | - | | - | | - | | - |
Baboto | | Mt | | 9.5 | | 0.6 | | - | | - | | - | | - | | - | | - | | - | | - | | 8.9 | | - | | - | | - | | - | | - |
Gara West | | Mt | | 7.4 | | - | | - | | - | | - | | - | | - | | - | | - | | 7.4 | | - | | - | | - | | - | | - | | - |
Gounkoto | | Mt | | 200.9 | | 33.1 | | 32.1 | | 37.8 | | 36.3 | | 28.3 | | 26.7 | | 6.6 | | - | | - | | - | | - | | - | | - | | - | | - |
Faraba | | Mt | | 9.0 | | - | | - | | - | | - | | 3.0 | | 3.0 | | 3.0 | | - | | - | | - | | - | | - | | - | | - | | - |
Total Open Pit Waste | | Mt | | 272.7 | | 33.7 | | 32.1 | | 37.8 | | 36.3 | | 31.2 | | 29.7 | | 28.7 | | 26.7 | | 7.4 | | 8.9 | | - | | - | | - | | - | | - |
Gara U/G | | Mt | | 2.1 | | 0.3 | | 0.4 | | 0.3 | | 0.3 | | 0.3 | | 0.3 | | 0.2 | | - | | - | | - | | - | | - | | - | | - | | - |
Yalea U/G | | Mt | | 1.4 | | 0.3 | | 0.3 | | 0.2 | | 0.3 | | 0.2 | | 0.1 | | - | | - | | - | | - | | - | | - | | - | | - | | - |
Gounkoto U/G | | Mt | | 0.9 | | - | | - | | - | | - | | - | | - | | - | | 0.3 | | 0.3 | | 0.2 | | 0.0 | | | | | | | | |
Total U/G Waste | | Mt | | 4.4 | | 0.7 | | 0.6 | | 0.6 | | 0.6 | | 0.5 | | 0.4 | | 0.2 | | 0.3 | | 0.3 | | 0.2 | | 0.0 | | | | | | | | |
Total Waste Mined | | Mt | | 277.0 | | 34.3 | | 32.7 | | 38.4 | | 36.9 | | 31.7 | | 30.1 | | 28.9 | | 27.0 | | 7.7 | | 9.2 | | 0.0 | | | | | | | | |
Ore (Mt) | | | | | | | | | | | | | | | | | | | | | | | | | | | | | | | | | | |
Loulo 3 | | Mt | | 2.2 | | - | | - | | - | | - | | - | | - | | 1.0 | | 1.2 | | - | | - | | - | | - | | - | | - | | - |
Baboto | | Mt | | 2.3 | | 0.3 | | - | | - | | - | | - | | - | | - | | - | | | | 2.0 | | - | | - | | - | | - | | - |
Gara West | | Mt | | 0.9 | | - | | - | | - | | - | | - | | - | | - | | - | | 0.9 | | - | | - | | - | | - | | - | | - |
Gounkoto | | Mt | | 13.7 | | 3.3 | | 2.7 | | 1.0 | | 1.5 | | 0.9 | | 1.6 | | 2.4 | | - | | - | | - | | - | | - | | - | | - | | - |
Faraba | | Mt | | 2.5 | | 0.0 | | 0.0 | | 0.0 | | 0.0 | | 0.8 | | 0.8 | | 0.8 | | - | | - | | - | | - | | - | | - | | - | | - |
Total Open Pit Ore | | Mt | | 21.5 | | 3.7 | | 2.7 | | 1.0 | | 1.5 | | 1.7 | | 2.5 | | 4.2 | | 1.2 | | 0.9 | | 2.0 | | - | | - | | - | | - | | - |
Gara U/G | | Mt | | 15.3 | | 1.2 | | 1.3 | | 1.2 | | 1.2 | | 1.3 | | 1.3 | | 1.3 | | 1.3 | | 1.2 | | 1.3 | | 1.2 | | 0.9 | | 0.4 | | 0.2 | | 0.2 |
Yalea U/G | | Mt | | 13.3 | | 1.4 | | 1.4 | | 1.5 | | 1.4 | | 1.5 | | 1.5 | | 1.5 | | 1.4 | | 1.0 | | 0.5 | | 0.3 | | - | | - | | - | | - |
Gounkoto U/G | | Mt | | 2.1 | | - | | - | | - | | - | | - | | - | | - | | - | | 0.3 | | 0.5 | | 0.5 | | 0.4 | | 0.3 | | - | | - |
Total U/G Ore | | Mt | | 30.7 | | 2.6 | | 2.7 | | 2.7 | | 2.7 | | 2.7 | | 2.7 | | 2.7 | | 2.7 | | 2.6 | | 2.3 | | 1.9 | | 1.3 | | 0.7 | | 0.2 | | 0.2 |
Total Ore Mined | | Mt | | 52.3 | | 6.3 | | 5.4 | | 3.7 | | 4.2 | | 4.5 | | 5.2 | | 6.9 | | 3.9 | | 3.4 | | 4.3 | | 1.9 | | 1.3 | | 0.7 | | 0.2 | | 0.2 |
Total Ore to Plant | | Mt | | 55.7 | | 5.1 | | 4.7 | | 4.7 | | 4.7 | | 4.7 | | 4.7 | | 4.7 | | 4.7 | | 4.5 | | 4.7 | | 4.7 | | 1.9 | | 1.3 | | 0.2 | | 0.2 |
Grade (g/t) | | | | | | | | | | | | | | | | | | | | | | | | | | | | | | | | | | |
Loulo 3 | | g/t Au | | 4.99 | | - | | - | | - | | - | | - | | - | | 3.75 | | 5.97 | | - | | - | | - | | - | | - | | - | | - |
Baboto | | g/t Au | | 2.79 | | 2.64 | | - | | - | | - | | - | | - | | - | | - | | | | 2.82 | | - | | - | | - | | - | | - |
Gara West | | g/t Au | | 2.62 | | - | | - | | - | | - | | - | | - | | - | | - | | 2.62 | | - | | - | | - | | - | | - | | - |
Gounkoto | | g/t Au | | 5.03 | | 3.61 | | 5.88 | | 4.84 | | 3.97 | | 4.82 | | 3.88 | | 7.62 | | - | | - | | - | | - | | - | | - | | - | | - |
Faraba | | g/t Au | | 2.51 | | - | | - | | - | | - | | 2.51 | | 2.51 | | 2.51 | | - | | - | | - | | - | | - | | - | | - | | - |
Total Open Pit Ore Mined | | g/t Au | | 4.40 | | 3.52 | | 5.88 | | 4.84 | | 3.97 | | 3.73 | | 3.42 | | 5.73 | | 5.97 | | 2.62 | | 2.82 | | - | | - | | - | | - | | - |
Gara U/G | | g/t Au | | 4.16 | | 3.90 | | 3.72 | | 4.16 | | 4.09 | | 3.89 | | 3.94 | | 4.86 | | 4.36 | | 4.13 | | 4.22 | | 4.22 | | 4.50 | | 4.40 | | 4.53 | | 3.36 |
Yalea U/G | | g/t Au | | 5.70 | | 6.25 | | 6.22 | | 5.92 | | 6.94 | | 6.08 | | 5.31 | | 5.42 | | 5.07 | | 4.31 | | 4.80 | | 3.94 | | - | | - | | - | | - |
Gounkoto U/G | | g/t Au | | 6.19 | | - | | - | | - | | - | | - | | - | | - | | 6.60 | | 7.50 | | 5.80 | | 6.10 | | 6.00 | | 5.70 | | - | | - |
Total U/G Ore Tonnes Mined | | g/t Au | | 4.97 | | 5.19 | | 5.06 | | 5.10 | | 5.61 | | 5.07 | | 4.68 | | 5.16 | | 4.76 | | 4.66 | | 4.72 | | 4.63 | | 4.97 | | 4.98 | | 4.53 | | 3.36 |
| | |
| 18th September 2018 | | Page 264 |
| | | | |
| | Loulo-Gounkoto Gold Mine Complex NI 43-101 Technical Report | | |
| | | | | | | | | | | | | | | | | | | | | | | | | | | | | | | | | | |
| | | Units | | LOM | | 2018 | | 2019 | | 2020 | | 2021 | | 2022 | | 2023 | | 2024 | | 2025 | | 2026 | | 2027 | | 2028 | | 2029 | | 2030 | | 2031 | | 2032 |
Total Tonnes to Plant | | Mt | | 4.73 | | 4.21 | | 5.47 | | 5.03 | | 5.01 | | 4.54 | | 4.08 | | 5.51 | | 5.14 | | 4.14 | | 3.84 | | 4.63 | | 4.97 | | 4.98 | | 4.53 | | 3.36 |
Total Grade to Plant | | g/t Au | | 4.55 | | 4.74 | | 5.07 | | 5.05 | | 5.08 | | 4.32 | | 4.30 | | 4.37 | | 5.50 | | 4.92 | | 4.03 | | 3.05 | | 4.14 | | 4.05 | | 4.53 | | 3.36 |
Ounces (koz) | | | | | | | | | | | | | | | | | | | | | | | | | | | | | | | | | | |
Loulo 3 | | koz | | 353 | | - | | - | | - | | - | | - | | - | | 118 | | 235 | | - | | - | | - | | - | | - | | - | | - |
Baboto | | koz | | 208 | | 29 | | - | | - | | - | | - | | - | | - | | - | | | | 179 | | - | | - | | - | | - | | - |
Gara West | | koz | | 73 | | - | | - | | - | | - | | - | | - | | - | | - | | 73 | | - | | - | | - | | - | | - | | - |
Gounkoto | | koz | | 2,209 | | 387 | | 520 | | 162 | | 197 | | 142 | | 204 | | 597 | | - | | - | | - | | - | | - | | - | | - | | - |
Faraba | | koz | | 200 | | - | | - | | - | | - | | 67 | | 67 | | 67 | | - | | - | | - | | - | | - | | - | | - | | - |
Open Pit Ounces Mined | | koz | | 3,042 | | 416 | | 520 | | 162 | | 197 | | 209 | | 270 | | 782 | | 235 | | 73 | | 179 | | - | | - | | - | | - | | - |
Gara U/G | | koz | | 2,051 | | 148 | | 150 | | 167 | | 164 | | 157 | | 159 | | 196 | | 176 | | 166 | | 170 | | 157 | | 133 | | 56 | | 33 | | 22 |
Yalea U/G | | koz | | 2,435 | | 287 | | 288 | | 276 | | 322 | | 285 | | 248 | | 253 | | 224 | | 133 | | 81 | | 38 | | - | | - | | - | | - |
Gounkoto U/G | | koz | | 421 | | - | | - | | - | | - | | - | | - | | - | | 9 | | 84 | | 98 | | 92 | | 81 | | 58 | | - | | - |
U/G Ounces Mined | | koz | | 4,907 | | 435 | | 437 | | 443 | | 487 | | 441 | | 407 | | 449 | | 408 | | 383 | | 349 | | 287 | | 213 | | 114 | | 33 | | 22 |
Total Ounces Mined | | koz | | 7,950 | | 851 | | 957 | | 605 | | 683 | | 650 | | 677 | | 1,231 | | 643 | | 456 | | 528 | | 287 | | 213 | | 114 | | 33 | | 22 |
Total Ounces to Plant | | koz | | 8,146 | | 775 | | 768 | | 767 | | 769 | | 654 | | 651 | | 663 | | 836 | | 716 | | 611 | | 463 | | 259 | | 163 | | 33 | | 22 |
Recovered Ounces | | koz | | 7,522 | | 715 | | 711 | | 711 | | 711 | | 601 | | 601 | | 613 | | 768 | | 660 | | 564 | | 428 | | 241 | | 148 | | 30 | | 20 |
| | |
| 18th September 2018 | | Page 265 |
| | | | |
| | Loulo-Gounkoto Gold Mine Complex NI 43-101 Technical Report | | |
The Loulo processing plant uses a conventional carbon in leach (CIL) gold extraction process with a budget throughput in 2017 of 4.8 Mt, which is in line with the plant design capacity. A simplified metallurgical flowsheet of the process can be found in Figure17-1.

Figure17-1 Simplified Metallurgical Flowsheet
Since 2014 multiple optimisation projects have been undertaken, resulting in increased throughput and improved recoveries. It is expected that the improvement initiatives will continue but are considered part of operations and not necessarily confined to capital projects. The expected throughputs and recoveries are based on historical metallurgical testwork and the actual operational performance.
The upgraded process plant remains a conventional crushing, milling, gravity, CIL, and tailings disposal circuit. It will process an average of 580 tph using the following circuits:
| | ● | | Crushing – three stage crushing for the hard rock sulphide ores and a single stage roll toothed crusher for the soft weathered oxide ores. |
| | ● | | Milling – one primary mill (7 MW); two identical single stage ball mills (4.5 MW), one scat conveyor system is inserted to return all mills scats back to primary mill via a cone crusher. |
| | |
| 18th September 2018 | | Page 266 |
| | | | |
| | Loulo-Gounkoto Gold Mine Complex NI 43-101 Technical Report | | |
| | ● | | Gravity - four centrifugal primary concentrators followed by two intensive leach reactors to treat primary concentrates. |
| | ● | | Tailings pumping/deposition split between slime dam and paste plant. |
Processing plant production statistics are in Table17-1.
Table17-1 Processing Plant Production Statistics
| | | | | | | | | | | | | | | | | | | | |
| | | 2015
Actual | | 2016
Actual | | 2017
Actual | | 2018
Planned |
Total Ore to Plant (kt) | | 4,543 | | 4,875 | | 4,918 | | 5,081 |
Recovery (%) | | 90.32 | | 91.00 | | 92.70 | | 92.25 |
Recovered ounces | | 630,167 | | 707,116 | | 177,565 | | 715,042 |
Crushing – Hard Ore
Hard rock is delivered to the tipping bin. Tipping can be completed from two directions.
The hard rock crusher plant consists of a primary gyrator crusher (FFE Minerals 1,300 mm by 1,750 mm) driven by a 450 kW electric motor. A tramp iron magnet is installed over the product conveyor to remove steel. A metal detector trips the conveyor if metal is detected.
The primary crusher operated at a rate of 700 tph, feeds the secondary crushers which operate in open circuit and then the tertiary crushers which operate in closed circuit. An additional metal detector is installed on the feed to the tertiary crushers.
The secondary circuit consists of two Sandvik CS6800 Hydrocone crushers and the tertiary circuit consists of four H6800 Hydrocone crushing units, all are powered by a 315 kW electric motor. The secondary and tertiary crushers are housed in separate buildings connected via transfer conveyors.
The final product from the tertiary crushers discharges onto a reclaim ore stockpile, via a conveyor system, and has a live capacity of about 40,000 t and a total of approximately 115,000 t. This is the feed to the SAG mill.
Crushing - Soft Ore
A separate facility exists to crush the soft ore when it is available. The soft ore crushing consists of a tooth roll crusher (MMD 625 - 3 tooth) driven by a 250 kW electric motor. This feeds a separate stockpile area and the roll crusher product is fed directly onto the ball mill conveyor feed.
| | |
| 18th September 2018 | | Page 267 |
| | | | |
| | Loulo-Gounkoto Gold Mine Complex NI 43-101 Technical Report | | |
Grinding and Classification
The milling section produces a leach feed with approximately 75% passing 75 microns. The milling circuit comprises of a SAG mill operating as the primary mill (6.1 m Ǿ and 9.5 m EGL and installed motor power of 7,000 kW to be upgraded to 8,000 kW) operating in open circuit. The oversize or scats arere-handled to the stockpile andre-crushed. The primary mill discharge feeds two parallel single stage overflow type ball mills (5.5 m Ǿ by 8.0 m EGL) with a power rating of 4,500 kW each, operating in closed circuit with a dedicated cluster of twelve 250 mm hydro-cyclones of which eight are typically in use.
An additional High Pressure Grinding Roll (HPGR) has been installed to treat scats at a rate of 100 t/h.
Gravity Concentration
A bleed stream from each cyclone cluster underflow is diverted to its respective gravity concentration circuit.
In each primary concentration circuit, the feed slurry from the cyclone underflow is fed on a horizontal vibrating screen to remove material greater than 2 mm from the concentrator feed that would otherwise plug the concentrator bowl riffles.
Screen undersize from each cluster feeds KnelsonXD-48 andQS-40 gravity gold concentrators after which the concentrates pass to a common feed hopper and Gemini dressing table located in the gold room. There is also the presence of an ILR1000 and ACACIA CS2000.
A recent initiative has been to test the effectiveness of the Knelson concentrators by removing them from the circuit. The water balance necessitated their feed to be sourced from recycled process water rather than fresh or raw water which resulted in significant corrosion of both the units but also their supporting structure located within the mill section. Indications are that due to there being a very low gravity recovery portion, that no deleterious effect has been witnessed.
Leaching and Adsorption
The CIL circuit consists of fourteen tanks that operate in series, each having a nominal capacity of 2,500 m3 giving a retention time of approximately 40 hours. Cyclone overflow, at a density of 35% solids, is introduced onto a linear trash screen (0.7 mm by 0.7 mm apertures) and the undersize goes to the leach feed thickener, the thickener underflow at a density of 50% presented as leach feed. Twopre-oxidation tanks receive the CIL circuit, each with six high-shear reactors (AachenREA-400). Cyanide is added into Tank 2 and doses automatically to control concentration around the desired value with ± 2%. An oxygen dispersion system is installed to maintain optimal dissolved oxygen across CIL to assist leaching consisting of power mixers (EKATO in front tanks #3 to 7). The oxygen plant, operated by Air Liquide, supplies 44 tpd. Hydrogen peroxide is injected at the thickener underflow, as required, to maintain the required dissolved oxygen levels necessary for the process. Each CIL tank is fitted with a mechanically swept cylindrical inter-tank screen (0.8 mm) complete with pumping mechanism.
| | |
| 18th September 2018 | | Page 268 |
| | | | |
| | Loulo-Gounkoto Gold Mine Complex NI 43-101 Technical Report | | |
Fresh carbon is introduced to tank fourteen and is advanced to tank three in counter current flow to the pulp, using recessed impeller vertical pumps.
Elution and Gold Recovery
Loaded carbon is recovered from CIL tank 3 into the acid wash cone. After elutriation, it is acid-washed using a 3% hydrochloric acid solution, followed by a caustic neutralisation/water flushing step. The rinsed carbon is transferred to one of two elution columns where the caustic/cyanide solution is circulated at elevated temperature (135°C) and pressures using the Zadra process. Loulo carbon stripping consists of two parallel circuits from harvest - elution column – heater and exchanger to electro-winning cells at the gold room.
The pressure Zadra method utilises a pressure strip vessel that reverses the chemical equilibrium of the adsorbed gold-cyanide complex on the activated carbon resulting in desorption of the gold-cyanide complex from the activated carbon into the strip solution.
The pressure Zadra process is conducted in abatch-by-batch process and requires approximately eight to 16 hours to complete.
The gold is then recovered downstream from the strip column by electro-winning. Six electro-winning cells are provided in the gold house for the electro-winning circuit where the pregnant electrolyte is introduced for gold deposition.
After each elution, the gold loaded stainless steel mesh cathodes are removed from the electro-winning cells and hosed down with high pressure water stream. This removes the plated gold onto a hopper where it is collected, settled, decanted and the sludge smelted after it has been dried in one of two electrically heated calcine ovens to produce doré bullion.
The barren carbon is now transferred to the adsorption circuit or to the carbon regeneration kiln where it is regenerated at C 700°C in a horizontal gas fired kiln.
The regenerated carbon is charged back into the CIL circuit.
Tailings Thickening and Paste Preparation
Tailings, discharging from No.14 CIL tank, gravitate through the tails linear screen (0.8 mm by 0.8 mm), then feed into the tails tank from where it is pumped to the Intermediate Plant. This is a technical requirement for the underground paste plants, which must use a detoxified coarse tailings as backfill material to fill the stopes. The Intermediate Plant has cyanide destruction together with arsenic fixing andtwo-stage cycloning to remove clay and fines (if present) and discharges the coarse fraction into a tank. The coarse fines are used as tailings and the fine slimes are pumped to the TSF. The tails pump station is equipped with two streams of four stage pumps and a flow diversion valve, where the delivery line of the duty (stainless steel pipe) is dedicated to high throughput deposition. At the valve station, there is a possibility to use a standby line (HDPE pipe) for low throughput operation. Stainless steel pipe rotation is planned to extend the life of main delivery line.
| | |
| 18th September 2018 | | Page 269 |
| | | | |
| | Loulo-Gounkoto Gold Mine Complex NI 43-101 Technical Report | | |
The tailings pipeline is a 450 mm diameter steel pipe, lying above ground and inside a trench, along a vehicle access road between the TSF and the processing plant. The return water line is in the same trench and consists of two 450 mm diameter HDPE pipe.
Recycled water is received from underground paste plants, and tailings storage facilities. Total recycled water is targeted at 80. Provision is made to allow intermittent discharge via the TSF detox pond, after chemical treatment.
Reagents
A dedicated reagent section has been provided for the warehousing of raw materials,make-up, and storage of reagents. These are:
| | ● | | Sodium cyanide - delivered as solid briquettes in bulk bags packed within wooden crates. Make up involves hoisting the bags and lowering them onto a bag splitter above a makeup tank. After agitation for a short period, this solution is transferred to a dosing tank from where it is pumped to the addition points in the plant. |
| | ● | | Lime is delivered in powdered form also in bulk bags. It is made into slurry through a similar make up system to the cyanide and pumped to the plant addition points. |
| | ● | | Flocculants are delivered in powder form and made up in a traditional eductor hydration system. |
| | ● | | Caustic soda is dissolved in an agitated tank and pumped to the elution section. |
| | ● | | Hydrochloric acid is delivered in concentrated form which is stored in a tank and pumped to the elution section. |
| | ● | | Oxygen is produced by Air Liquide under contract via six PSA units outside the plant producing 44 tpd which is piped to the leach section. |
| | ● | | Hydrogen peroxide is stored in 1 m3 plastic isotainers. |
These are mixed in a dedicated area outside the security fence and then pumped in as required. This minimises the number of vehicles that require access to the plant. Apart from the acid, the reagents are all in solid form when delivered and stored onsite.
Maintenance
The mineral processing operations have a formal scheduled maintenance system. Calendar based maintenance is conducted daily, weekly, two weekly, quarterly, six monthly, and yearly. The plant shuts for 14 hours every month when all mills stop and then twice a month one ball mill is shut down for eight hours. Statutory inspections and Original Equipment Manufacturer (OEM) checks are conducted at OEM recommended intervals based on the vendor and equipment. Mills undergo inspections yearly, Putzmeister pumps are inspected by OEM every six months, crushers are inspected yearly, by Sandvik, etc.
A comprehensive Supervisory Control And Data Acquisition (SCADA) on the equipment. For example, there is online, continuous monitoring of the mills for temperature (bearings and lubrication system), and vibration.
| | |
| 18th September 2018 | | Page 270 |
| | | | |
| | Loulo-Gounkoto Gold Mine Complex NI 43-101 Technical Report | | |
Oil testing is undertaken by Shell. Other condition monitoring includes thermography, relay testing, and vibration analysis. While contractors have been and continue to perform many of the Regulatory Compliance Mark testing, an group has been established and technicians received training in South Africa for thermography and are proficient in vibration and acceleration testing.
A total of 112 employees provide staffing of the maintenance department for processing on all shifts and rotations. Contractors and OEM representatives are utilised, as well, for specific tasks. Pragma is utilised as the maintenance software programme for planning, creation of job cards (work orders), and creating/storing historical maintenance and performance data. In addition, the team is starting to do failure analysis to better understand breakdown root causes and to see if a change in maintenance tactics will reduce downtime.
Corrosion
Although Loulo is located in a humid area with high rainfall, the fact that this is a relatively new plant (c. ten years) means that corrosion is still negligible, although it was necessary a few years ago to replace the acid tank with a rubber lined alternative. Following thickness testing of tanks in 2015, Loulo installed fibre reinforcements at the bottom of the CIL tanks.
Most areas in the Plant have been concreted, and spillage is reasonably well managed.
Plant MCCs
The Motor Control Centres (MCCs) are converted shipping containers fitted with passive point fire detection which is monitored locally and remotely at the control room, They are raised andair-conditioned to ensure optimal operating temperatures.
Cables are all bottom entry from the void below. All high voltage (HV) cabling and connections are thermo-graphically checked by a third-party ahead of the rainy season.
Mill motors are fed directly at 11 kV from the power station, via an underground pipe.
The Loulo processing plant has been operating since 2005. The production history is summarised in Table17-2 and Figure17-2.
| | |
| 18th September 2018 | | Page 271 |
| | | | |
| | Loulo-Gounkoto Gold Mine Complex NI 43-101 Technical Report | | |
Table17-2 Loulo Processing Plant Production History
| | | | | | | | | | | | | | | | | | | | | | | | | | | | |
Year | | Total | | | 2005 | | | 2006 | | | 2007 | | | 2008 | | | 2009 | | | 2010 | |
Loulo | | | | | | | | | | | | | | | | | | | | | | | | | | | | |
Milled Tonnes kt | | | 31,900 | | | | 527 | | | | 2,595 | | | | 2,654 | | | | 2,721 | | | | 2,947 | | | | 3,158 | |
Gold Produced, koz | | | 3,819 | | | | 63 | | | | 242 | | | | 265 | | | | 258 | | | | 352 | | | | 317 | |
Gounkoto | | | | | | | | | | | | | | | | | | | | | | | | | | | | |
Milled Tonnes kt | | | 13,769 | | | | | | | | | | | | | | | | | | | | | | | | | |
Gold Produced, koz | | | 1,814 | | | | | | | | | | | | | | | | | | | | | | | | | |
Loulo-Gounkoto | | | | | | | | | | | | | | | | | | | | | | | | | | | | |
Milled Tonnes kt | | | 45,668 | | | | 527 | | | | 2,595 | | | | 2,654 | | | | 2,721 | | | | 2,947 | | | | 3,158 | |
Gold Produced, koz | | | 5,633 | | | | 63 | | | | 242 | | | | 265 | | | | 258 | | | | 352 | | | | 317 | |
Overall Recovery % | | | 90.7 | | | | 95.9 | | | | 93.9 | | | | 93.1 | | | | 91.5 | | | | 87.7 | | | | 92.5 | |
| | | | | | | | | | | | | | | | | | | | | | | | | | | | |
Year | | 2011 | | | 2012 | | | 2013 | | | 2014 | | | 2015 | | | 2016 | | | 2017 | |
Loulo | | | | | | | | | | | | | | | | | | | | | | | | | | | | |
Milled Tonnes kt | | | 2,670 | | | | 1,837 | | | | 2,422 | | | | 2,711 | | | | 2,570 | | | | 2,587 | | | | 2,500 | |
Gold Produced, koz | | | 208 | | | | 220 | | | | 307 | | | | 380 | | | | 351 | | | | 420 | | | | 437 | |
Gounkoto | | | | | | | | | | | | | | | | | | | | | | | | | | | | |
Milled Tonnes kt | | | 949 | | | | 2,518 | | | | 2,041 | | | | 1,699 | | | | 1,973 | | | | 2,288 | | | | 2,300 | |
Gold Produced, koz | | | 138 | | | | 283 | | | | 273 | | | | 259 | | | | 280 | | | | 287 | | | | 293 | |
Loulo-Gounkoto | | | | | | | | | | | | | | | | | | | | | | | | | | | | |
Milled Tonnes kt | | | 3,619 | | | | 4,354 | | | | 4,463 | | | | 4,410 | | | | 4,543 | | | | 4,875 | | | | 4,800 | |
Gold Produced, koz | | | 346 | | | | 503 | | | | 580 | | | | 639 | | | | 630 | | | | 707 | | | | 730 | |
Overall Recovery % | | | 88.1 | | | | 89.3 | | | | 89.2 | | | | 90.2 | | | | 90.0 | | | | 91.0 | | | | 92.7 | |
Figure17-2 Loulo-Gounkoto Processing Milled Tonnes by Ore Source
| | |
| 18th September 2018 | | Page 272 |
| | | | |
| | Loulo-Gounkoto Gold Mine Complex NI 43-101 Technical Report | | |
Loulo-Gounkoto has demonstrated successful operation both in terms of processing throughput and in particular with gold recovery, demonstrating operational evidence for the ability to deliver an average of 4.8 Mtpa over the LOM.
| 17.3 | Capital Projects and Plant Upgrades |
Due to the competency of the Gounkoto ore, the Loulo plant circuit was upgraded with the addition of a primary ball mill in an open circuit configuration with a dedicated mill feed stockpile with 10 to 12 hours of live capacity which enables the consistent operation of the ball mill. The primary mill feed stockpile is sized to maintain steady state feed conditions to the primary ball mill. The incorporation of belt feeders underneath the stockpile alleviates material handling problems associated with sticky and fine material on the mill feed stockpile. The maximum elevation of the TSF will be 55 m and the rate of rise will be less than 2 m per year.
| 17.4 | Metallurgical Recovery |
The Loulo processing plant uses a CIL gold extraction process. The current throughput design capacity is 4.8 Mtpa as per 2017 performance (Table17-2). Yalea process plant recovery for the remaining LOM has been estimated at 84.5% based on historical and current testwork; similarly, Gara is estimated as 94.2%. Yalea recovery is impacted by the presence of arsenic and copper. Arsenic and copper impurities also increase cyanide and oxygen consumption. Gounkoto 2016 Super Pit sampling achieved a recovery of 92.5%. Gold recovery is maintained above 90% by blending the various ore sources (Yalea / Gara/ Gounkoto) to control the copper and arsenic content within the mill feed.
The current LOM has an average recovery 92.3%. The average gold recovery in 2017 was 92.7%, an improvement from 2016 (91.0%).
Operating Costs (OPEX)
The open pit and underground LOM and operating cost estimates have been completed in sufficient detail to be satisfied that economic extraction of the Proved and Probable Ore Reserves is justified.
Table17-3 presents the 2016 and 2017 actual breakdown of costs for processing including plant engineering for Loulo-Gounkoto.
| | |
| 18th September 2018 | | Page 273 |
| | | | |
| | Loulo-Gounkoto Gold Mine Complex NI 43-101 Technical Report | | |
Table17-3 Actual Process and Plant Engineering Operating Costs for 2016 and 2017
| | | | | | | | | | | | | | | |
Cost | | Units | | 2016 Actual | | 2017 Actual |
Fixed Cost | | | | | | | | | | | | | | | |
Consultants | | | | $ ‘000 | | | | | 166 | | | | | 153 | |
Contractors - Assays | | | | $ ‘000 | | | | | 742 | | | | | 798 | |
Contractors - Other | | | | $ ‘000 | | | | | 1,217 | | | | | 1,358 | |
Contractors - Oxygen | | | | $ ‘000 | | | | | 2,312 | | | | | 2,680 | |
Equipment Hire | | | | $ ‘000 | | | | | 2,537 | | | | | 2,523 | |
General Costs | | | | $ ‘000 | | | | | 1,142 | | | | | 1,520 | |
Gold Refining | | | | $ ‘000 | | | | | 1,564 | | | | | 1,646 | |
Labour | | | | $ ‘000 | | | | | 2,831 | | | | | 3,653 | |
Stores - Electrical & Mechanical | | | | $ ‘000 | | | | | 1,666 | | | | | 1,626 | |
Stores - Other | | | | $ ‘000 | | | | | 5,536 | | | | | 5,366 | |
Total Fixed Cost | | | | $ ‘000 | | | | | 19,712 | | | | | 21,323 | |
Tonnes Processed | | | | 1000 | | | | | 4,875 | | | | | 4,918 | |
Total Fixed Cost | | | | $/t | | | | | 4.04 | | | | | 4.34 | |
Variable Cost | | | | | | | | | | | | | | | |
Power | | | | $/t | | | | | 5.49 | | | | | 6.21 | |
Reagents - Cyanide | | | | $/t | | | | | 1.63 | | | | | 1.26 | |
Reagents - Lime | | | | $/t | | | | | 0.77 | | | | | 0.62 | |
Good Issues - Caustic Soda | | | | $/t | | | | | 0.11 | | | | | 0.15 | |
Good Issues - Activated Carbon | | | | $/t | | | | | 0.16 | | | | | 0.13 | |
Reagents - Other | | | | $/t | | | | | 0.33 | | | | | 0.34 | |
Stores - Grinding Media | | | | $/t | | | | | 1.93 | | | | | 1.92 | |
Stores - Screens & Panels | | | | $/t | | | | | 0.04 | | | | | 0.04 | |
Total Variable Costs | | | | $/t | | | | | 10.46 | | | | | 10.67 | |
| | | | | | | | | | | | | | | |
Total Process Cost | | | | $/t | | | | | 14.50 | | | | | 15.01 | |
| | | | | | | | | | | | | | | |
Plant Engineering | | | | $/t | | | | | 2.19 | | | | | 2.20 | |
| | | | | | | | | | | | | | | |
Combined Plant & Engineering | | | | $/t | | | | | 16.69 | | | | | 17.21 | |
LOM processing costs have been budgeted at $18.22/t for Loulo and $17.03/t for Gounkoto, which includes plant engineering costs. The actual costs for Loulo-Gounkoto for 2017 were $17.21/t, which is in line with those expressed for the LOM.
| | |
| 18th September 2018 | | Page 274 |
| | | | |
| | Loulo-Gounkoto Gold Mine Complex NI 43-101 Technical Report | | |
Loulo-Gounkoto complex comprises two distinct mining areas, Loulo and Gounkoto, with the central processing plant and administration complex located at the Loulo site.
Current mining is centred on the Gounkoto open pit and two underground mines at Yalea and Gara.
The current access route to supply the site is by road from the port of Dakar in Senegal to the site. There is also access to Loulo Mine by road from Bamako or by charter flights from Bamako to the airstrip situated near the Gara deposit.
Figure18-1 denotes the relative positions of the major infrastructure items in the immediate vicinity of Loulo. Note that Gounkoto is not shown here as it lies approximately 32 km from Loulo in a Southerly direction. These infrastructure items will be described in greater detail subsequently.
Figure 18-1 Loulo Major Infrastructure Locations
| | |
| 18th September 2018 | | Page 275 |
| | | | |
| | Loulo-Gounkoto Gold Mine Complex NI 43-101 Technical Report | | |
The Dakar to Bamako Millennium highway crosses the Loulo-Gounkoto haul road, approximately 6 km north of the Gounkoto pit. This highway serves as the primary access point for the mine and provide excellent road transport links with the rest of the country as well as to Senegal for which the border is within 3 km of the mine.
The local road infrastructure was developed initially during the geological drilling programmes and upgraded during the construction of the mine. Internal roads provide access to various infrastructure areas, Explosives Storage, Land Fill Site, Mine Villages (Senior and Junior), Central Mine Offices, general mining operations areas, new exploration areas, various water boreholes, and overhead line routes.
The road leading to the TSF is a public road, which runs past the nearby village of Djidian Kenieba. An upgrade exercise was undertaken whereby the roads linking the Mine village to the central office complex via a ring road ultimately culminating at the plant area has been tarred. All other roads are constructed by layered rock/gravel/laterite varying in specification according to traffic expectations.
From the inception of Loulo-Gounkoto, the supply chain partner,CSTT-AO, with subsidiary companies namely Afrilog and Multilog, have been intricately involved in the procurement, warehousing, freight, and all other logistical aspects.
The port of Dakar is used for goods destined to Loulo. The customs process and port authorities are efficient and port costs are in line with global market. Dakar Customs and border Customs operate on afive-day week basis.
Should containers be shipped to Dakar, the majority are trans-shipped in Las Palmas or Algeciras and shuttle shipments between these trans-shipment ports to Dakar are frequent. The port is also well equipped to handle heavier materials and equipment which are frequently received for Loulo-Gounkoto.
Border crossing clearance of goods is typically seamless and efficient between Dakar and Mali customs. This relies heavily on the long-standing partnerships bothCSTT-AO and Randgold have developed over the past decades in West Africa.
As regards trucking and road freight,CSTT-AO is equipped with adequate trucks, lowbed trucks and lifting equipment capable of lifting loads of up to 100 tons (available in Dakar).
CSTT-AO has the following fleet capabilities:
| | ● | | 90 flatbed and semi -trailers |
| | |
| 18th September 2018 | | Page 276 |
| | | | |
| | Loulo-Gounkoto Gold Mine Complex NI 43-101 Technical Report | | |
| | ● | | One low bed of 110 tons capacity |
| | ● | | One low bed of 300 tons capacity |
Where possible load heights are restricted to less than 485 cm including the vehicle height, to allow easy passage from the port to site, with no disruption to power lines or having to make use of bridge bypass routes.
CSTT-AO is equipped and licensed to transport all hazardous materials including being specifically cyanide compliant.
Clearing of freight at Dakar port takes on average eight to twelve days and the road transport from Dakar to the Project site is estimated at two to three days.
CSTT-AO has been developing activities at Kaolack port since November 2016. This is beneficial as Kaolack is 200 km closer to the Malian border than Dakar port.
The maximum draft allowed is 4.3 meters, (2,400 t of break bulk vessel).
To date, quick lime, hydrated lime, grinding media and slag cement have all been imported in break bulk and sent to the mining companies located in the vicinity of the South Eastern region of Senegal and Mali.
Clearing of goods is typically around 48 hours.
The costs associated with 20’ and 40’ containers for bothsea-freight and inland transport (Dakar to Loulo mine site) are calculated on a cost plus basis. This is a fully transparent exercise with shipping/freight invoices being sent through for verification.
| 18.3 | Surface Water Management |
There is an occasional torrential rainfall threat to the operations with the risk of flash flooding. Drainage and diversion ditches are in place around the pits and operational facilities.
There are river diversions at all the old and current pits. A trench designed for a 1 in100-year event has been constructed at Gara. At Yalea, the river runs to the west of the pit and a diversion channel has been dug on the east side to prevent water from creeks entering the pit. The ground is sloped away from the pit wall to further reduce the risk of flooding. The diversions remain in place to protect the underground workings.
Gounkoto is bounded on the west by the Falémé River and a 1.8 km berm and diversion channel have been constructed. On the east side of the pit a river diversion has been necessary to drain water around the pit to the north and then into the Falémé.
The wet season in Mali has torrential rain under which mining can be impossible. Care is taken with mine scheduling to take time into account for digging sumps, as well as providing more than one working area to allow for flexible mining if required. Ore stockpiled at the Gounkoto ROM pad
| | |
| 18th September 2018 | | Page 277 |
| | | | |
| | Loulo-Gounkoto Gold Mine Complex NI 43-101 Technical Report | | |
and thelow-grade stockpile at Gounkoto can provide plant feed in the event of mine production having to be stopped due to weather conditions.
For the Gounkoto open pit, a high capacity pumping system of large high head diesel pumps has been installed. Pumping from pit bottom sumps to booster pumps delivers captured water to treatment ponds prior to releasing to river flow. During the wet season, pumping volumes average 5,000 m3/day from the southern sump and 4,000 m3/day from the northern sump.
The Falémé River is the natural border between Mali and Senegal and provides the majority of the Loulo water requirements.
A main pumping station with two transfer pumps is situated in the river basin upstream of a weir, which maintains a 1 m raise to ensure water availability during the dry season. Water is pumped to the Raw Water Dam at Loulo from where water is delivered to the process plant. There are no restrictions on the amount of water which can be abstracted from the river.
A water treatment plant, fed from the river water supply, supplies all the potable water needs of the operation. A borehole pump is situated near the offices to provideback-up potable water.
There is a very low requirement for water at Gounkoto, other than crushing of the ROM material before loading and dust suppression. Rainfall is regular, and the pit dewatering ponds provide enough water for dust suppression purposes. A small onsite dam provides water storage.
The tailings storage facility (TSF) for Loulo is 8 km from the plant in an area with a number of natural ridges. It has been designed to maintain a minimum freeboard of 1.5 m to provide sufficient storage to contain a 1 in 50 year rainfall event over a72-hour period. The TSF was designed by Knight Piésold and is operated by Fraser Alexander.
The operation is based on a 42 paddock system, using two at any one time. Each paddock is 100 m in length and 35 m wide. Each lift is 200 mm and construction of the walls is completed by hand using deposited material, whilst there is anopen-end deposition. Each paddock is used for 36 to 48 hours.
It takes approximately one and a half months to complete an overall 200 mm lift of tailings in the TSF, which gives an annual rise of approximately 2.0 m (current rate of rise is 2.03 m/year). At approximately 10 m height, the paddock area was stepped in to leave an approximately 8 m wide bench.
The total area of the dam is currently 175.6 ha, and the current height is approximately 27 m. Since the start of operations approximately 33 Mt have been deposited into the TSF.
| | |
| 18th September 2018 | | Page 278 |
| | | | |
| | Loulo-Gounkoto Gold Mine Complex NI 43-101 Technical Report | | |
The current design LOM is 43 m. Should the LOM extend to 2037 the current design would accommodate a final height of up to 55 m Figure18-2 shows the starter wall built in the east side of the TSF.
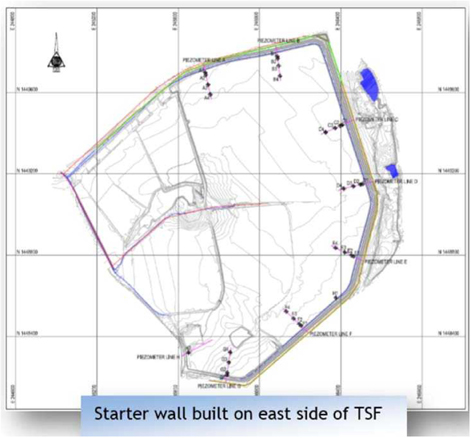
Figure18-2 Starter Wall Built on East Side of TSF
Tailings are discharged from the relevant CIL tank, screened at the tails linear screen (0.8 mm by 0.8 mm) and report to the tails tank from where they are pumped to the either the Intermediate Paste Plant or tailings storage facility (TSF). The current split is approximately 40% / 60%. Total tailings production is approximately 12,000 tpd. The tails pump deliveries are equipped with a flow diversion valve, where the delivery lines of the duty and standby pipes combine into the tailings main pipe.
Two steel tailings lines from the plant and one HDPE return water pipe. The second steel line is used as aback-up line. All pipelines are of 450 mm diameter, lying above ground and inside a trench, along a vehicle access road between the TSF and the processing plant. The tailings are pumped by two 90 kW pumps with a total capacity of 620 m3/hr at an insitu density of 1.37 t/m3.
Return water is pumped from a floating barge with two electric pumps rather than a traditional penstock arrangement. It is estimated that the TSF retains approximately 25% of the water.
During the three months wet season, the TSF tends to absorb more water, which generally reduces during the remainder of the year. A marker system on top of the TSF is used to measure
| | |
| 18th September 2018 | | Page 279 |
| | | | |
| | Loulo-Gounkoto Gold Mine Complex NI 43-101 Technical Report | | |
the pool size. Different colour markers are placed around the pool to monitor any increase in the size of the pool. Freeboard is measured weekly.
If required, excess water can be pumped into the detox pond by a 600 m3/hr pump. The detox pond has an overflow into theso-called “detox area” in the flood plain to the north of the TSF. There is a cyanide destruction installation at the detox pond and the cyanide content of the detox pond and the pool are sampled daily.
Monitoring piezometers surround the facility and are read manually at weekly intervals.
The TSF operation is audited regularly by Epoch from South Africa, who last visited in June 2017. No major areas of concern were noted other than an area of seepage on the western wall that if left unchecked could affect the Factor of Safety of the designed final height.
A further concern the mine is facing is the accumulation of water on the tailings dam, which potentially puts the stability of the dam at risk. Actions are in place to reduce the pool size and the necessary studies are being undertaken together with the submission of an Environmental Impact Assessment (EIA) to the Malian Government as part of an application to extend tailings dam.
All the power used on site is thermally generated, and fuel is imported from Senegal by road. Filtration and/or centrifugation are used to produce a ‘clean’ diesel which can be used in the mobile equipment and the power plant. At Loulo there are two main fuel farms; one near to the workshops and warehouse and the other at the power plant.
At the warehouse there are five 500 kl diesel tanks in a common bund and protected by a ring drencher system that has been recently upgraded. There are also five 50 kl tanks for clean diesel, four at the powerhouse and one for light vehicles.
The second major fuel farm is at the power plant for storage of HFO. All generators run on Heavy Fuel Oil (HFO) with diesel used as a starter fuel. The tank farm comprises:
| | ● | | Three 2,000 kl tanks for HFO storage |
| | ● | | Two 230 kl HFO settling tanks |
| | ● | | One 253 kl day tank for filtered and settled HFO |
| | ● | | One 230 kl Light Fuel Oil (LFO) tank |
Fire protection for the HFO tank farm and both power stations consists of a pump set with a main diesel pump with an electrical jockey pump to maintain pressure under normal circumstances. Water is supplied from a pump station dedicated to these areas.
At Gounkoto there are two 500 kl tanks and one 75 kl and one 45 kl clean diesel tanks. Detection and suppression are installed on the fuel farm; stationary monitors are surround the fuel farm and cooling deluge rings are in place on all storage tanks.
| | |
| 18th September 2018 | | Page 280 |
| | | | |
| | Loulo-Gounkoto Gold Mine Complex NI 43-101 Technical Report | | |
Current demand is approximately 42 MVA. The main power plant is located at Loulo and has an installed capacity of 64 MVA and is a mixture of medium speed and high-speed generators. The power station for the site is operated by Manutention Africaine Mali, part of the Caterpillar Africa Power Systems. A full maintenance contract is in place.
The plant has a mixture of medium speed and high-speed generators as follows:
| | ● | | Fifteen CAT3512B-HB 1.2 MVA high-speed generators. |
| | ● | | Ten CM32 3.5 MVA medium-speed generators. |
| | ● | | Two CM32 5.5 MVA medium-speed generators. |
The high-speed generators run on normal diesel. The medium speed generators are operated preferably on HFO180.
All CAT generators are installed within one power house building. Four of the CM 3.5 MVA generators are within another building adjacent to the original power house. The other six CM 3.5 MVA units are located in the new power house, together with the two CM32 5.5 MVA. There is sufficient space for a further two machines.
Power is distributed around the site at 11kV. A central medium voltage room is used as a switching room to distribute power across the mine through several feeders via dual 11 kV overhead lines. The CAT generators produce power at 400V, which is then stepped up to 11kV through individual transformers. The CM generators produce at 11kV. A central medium voltage room is used as a switching room to distribute power across the mine through several feeders via dual 11 kV overhead lines.
The site base load is normally generated by the CM generators and the CAT generators are used for peak loads to reduce the reliance on the transformers. Currently 60 to 70% of total generation capacity is needed to meet the site demand.
The Yalea and Gara underground mines share four 1.2 MVA rental units asback-up power for the critical underground facilities, such as pumps and ventilation.
The electrical demand at Gounkoto for the open pit mining operations is low, typically requiring around 1.2 MW. Two CAT 3560 1.2 MVA generators plus a further standby 0.8 MVA generator, together comprising 3.0 MVA are installed at Gounkoto and provide the power for the site. Construction of a new power plant at Gounkoto is well advanced, where initially it will have two 1.5 MVA generators but with space for a total of five generators when the future underground mine commences. Backup electrical power can be supplied to Gounkoto via a 33 kV overhead line from Loulo.
| | |
| 18th September 2018 | | Page 281 |
| | | | |
| | Loulo-Gounkoto Gold Mine Complex NI 43-101 Technical Report | | |
Operational Camp (Village)
The Loulo offices, warehouses and accommodation village are located to the east of the Gara open pit. Due to the remote nature of the operations there is a comprehensive provision of auxiliary facilities at Loulo. Living quarters include a mine village for the expatriate labour and senior staff.
A small clubhouse and mine recreation facility have been built on site which is the focal point of the mine living quarters. This structure is designed to blend into the environment. The recreation rooms are designed in a flexible manner so that they are used for all mine functions and training when required
Offices, Stores and Workshops
Extensive use has been made of old shipping containers for buildings either individually, or as part of a brick constructed building such as for the workshops. The mine site buildings are therefore a mixture of constructions. These comprise:
| | ● | | Administration office buildings |
| | ● | | Warehouse and Stockyard |
The warehouse at Loulo serves the Gounkoto Mine.
Both Gara and Yalea underground mines have small workshops near the surface portals where servicing of mobile mine equipment is carried out. A central workshop is used for more substantial maintenance. The mine workshops are used for preventative maintenance and specific component change outs while the Central workshop is responsible for major overhauls and large component change outs.
The Central Workshop is undergoing an expansion, increasing it to 22 bays. An overhead crane is installed. Sandvik has established a warehouseon-site where it holds inventory stock.
The mine workshop at Gounkoto is owned by SOMILO but is operated by the contractor, GMS. The workshop consists of six large bays and each bay can accommodate one CAT 777 truck, or up to four smaller mobile mining machines.
Medical and Emergency Response Facilities
There are three medical clinics available; one in Loulo with three doctors and nurses, one in Gounkoto, and one in the Junior Village. Each clinic has an ambulance.
| | |
| 18th September 2018 | | Page 282 |
| | | | |
| | Loulo-Gounkoto Gold Mine Complex NI 43-101 Technical Report | | |
A number of local medical facilities have been identified, which could assist in case of multiple injuries. Planes and ambulances can be used for medical evacuations.
A Mine Rescue (Proto) Room is established and equipped with facilities for washing and storing the sets, a Drager pump for recharging the cylinders used in the BG4 sets and storing the kit of the individual members.
There are Proto teams in place to serve the underground operations at Loulo each comprising of ten persons. In addition, a turnout agreement has been concluded with the Byrnecut Proto Team at the neighbouring Tabakoto Mine which is owned by Endeavour.
A fully equipped fire truck is stationed at Loulo and is used at the airstrip when planes land. In addition, both at Loulo and Gounkoto mine water trucks are available to supply additional water and firefighting capability.
Airstrip
The airstrip is 1.5 km long and built from laterite. It has been approved by the National Directorate for Civil Aviation. The maximum size of aircraft that can use the airstrip is six tonnes per single wheel and twelve tonnes per double wheel. The airstrip is capable of taking aircraft with a typical capacity of 40 seats.
Randgold organises charter flights from Bamako twice per week, and these are usually20-seater Beechcraft 1900 planes.
| 18.8 | Communication and Information Technology |
Internet Communication
A VSAT has been installed at both Loulo and Gounkoto, and a network link connects the two sites. The IT/ Communications configuration networks Gounkoto into the Loulo network with a high-speed terrestrial network link with each site providing redundancy to the other.
The dual VSAT links provides redundancy in the event of either VSAT becoming temporarilynon-operational. The dual VSAT links also allow communication for their respective site, if the terrestrial link is severed.
The existing networking set up and wireless Internet communication is sufficient for the ongoing operation. Email is managed over the VSAT link with Gounkoto email directed to the Loulo mail server over a terrestrial link.
Mobile and Hand-Held Radios
A VHF radio system is installed to provide contact with all mobile equipment and all of the service vehicles. The VHF system has 8 channels with a computerdial-up channel selection. Use of five of the channels in the operation are allocated as follows:
| | |
| 18th September 2018 | | Page 283 |
| | | | |
| | Loulo-Gounkoto Gold Mine Complex NI 43-101 Technical Report | | |
The remaining channels are used for departments associated with the plant operation and maintenance. Hand held radios are used by roving operators and supervisors to ensure adequate communication.
There is comprehensive security infrastructure at the site, with good access control commensurate with the operations at the site. The Security Manager reports directly to the onsite General Manager. A contractor, AMM, provides the security service. In addition, there are 18 local hunters being used to provide external security patrols.
The principal risks are ongoing loss of company equipment and stores by means of fraud and theft, mainly by employees and the ever-present risk of housebreaking and petty thefts in the residential village.
The Loulo mine property is partially fenced with 2.4 m high chain link fence topped by flat wrapped razor wire and a road runs along the entire perimeter. Site fencing is also provided at Gounkoto.
The plant area is fenced with the access controls at the main gate and to the more sensitive areas within the plant. An electronic access system for the plant is operation.
There is one main entrance to the Loulo site, where a Security Gatehouse has been erected and manned by three guards, on a 12 hour shift cycle. A similar arrangement exists at Gounkoto.
The Spares and Materials storage sites are fenced off by a 1.8 m fence topped by a 0.5 m barrier of flat-wrapped razor wire. The access gates are kept permanently locked and access is controlled by staff in an adjacent office.
| | |
| 18th September 2018 | | Page 284 |
| | | | |
| | Loulo-Gounkoto Gold Mine Complex NI 43-101 Technical Report | | |
| 19 | Market Studies and Contracts |
| 19.1 | Revenue, Tax and Royalty |
Financial evaluation andcut-off grade calculation for the Loulo Ore Reserves has been based on a gold price of $1,000/oz. This is the same as was used for the previous (31st December 2017) Loulo and Gounkoto Ore Reserves estimates.
A royalty of 6% of the proceeds of gold sales is payable by Loulo-Gounkoto to the Mali government.
Loulo-Gounkoto pay income tax at a rate of 30% to the Mali government.
The gold market is highly liquid and benefits from terminal markets (London, New York, Tokyo, and Hong Kong) on almost a continuous basis. Gold prices were in general downward trend from 1980 to 2000 where it traded down to approximately $250/oz. Between 2000 and 2011 the market was on a general upward trend that moved spot prices to a peak of $1,900/oz. momentarily during 2012. 2013 saw a sharp correction in the upward trend, with the spot price dropping to $1,250/oz. Since 2014 the gold price, has fluctuated in range of $1,050/oz to $1,400/oz. Gold is currently (August 2018) trading at $1,200/oz.
Gold produced at the mine site is shipped from site, under secured conditions, to a refining company. Underpre-established contractual conditions, the refiner purchases the gold from the mine with the proceeds automatically credited to the mines’ bank account. The operation is unhedged.
It is Randgold’s strategy to outsource open pit mining activities to contractors and, in all instances, the contract states that the mining operation can purchase the equipment at the end of the contract period at its depreciated price or should the contractor default at a predetermined pricing mechanism. Prior tostart-up all major mining contractors are requested to tender and the most appropriate tender is accepted thereby ensuring that the best competitive current pricing is achieved. Care is taken at the time of finalising contracts to ensure that the rise and fall formula is totally representative of thebuild-up of the quoted price per unit. At the time of award prices quoted are compared to benchmark prices of other owner miner operations.
The contract mining costs are dependent on when tenders are issued as the price of major equipment varies dependant on demand as well as the cost of finance. Rise and fall can be negatively affected by currency fluctuations.
| | |
| 18th September 2018 | | Page 285 |
| | | | |
| | Loulo-Gounkoto Gold Mine Complex NI 43-101 Technical Report | | |
The mine produces doré bars which are sent to an accredited gold refinery for refining. Refining prices are subject to fluctuations in the cost of transport as well as insurance costs. Other contracts that are put in place include assay facilities, oxygen supply, catering services, fuel supply, explosive supply, security.
| | |
| 18th September 2018 | | Page 286 |
| | | | |
| | Loulo-Gounkoto Gold Mine Complex NI 43-101 Technical Report | | |
| 20 | Environmental Studies, Permitting, And Social or Community Impact |
| 20.1 | Environmental Considerations |
Loulo-Gounkoto is a complex of open pit and underground operations which is made up of two main sites, Loulo and Gounkoto, which are around 32 km apart and which have been operating since 2005 at Loulo and 2011 at Gounkoto. Gounkoto is operating under a separate Exploitation Permit from Loulo since 2012 with ore being toll treated at Loulo. Loulo mining activities consist of the Yalea and Gara underground mines, the main open pits being exhausted. Other satellite pits have included Baboto, P129, and Loulo 3. Gounkoto pit is being enlarged to form a ‘Super Pit’ and will be followed by underground operations. Ore from Gounkoto is crushed and stockpiled and trucked to Loulo plant, where it is further crushed and ground and passes through a gravity circuit and CIL plant and smelted to produce bullion. Tailings are pumped 8 km east to the Tailings Storage Facility (TSF); a portion of the tails are fed to the Yalea and Gara paste plants and pumped to the underground workings. The TSF is being raised at a rate of 2 m per year with the current height being 28 m. Its final elevation is designed to be 55 m. A TSF extension will be required to accommodate the current life of mine production and the Environmental and Social Impact Assessment (ESIA) associated with this will be developed in 2018. Other facilities at Gounkoto include accommodation, workshop, and offices, two diversion dams, and acut-off trench to divert flows from the east and prevent them entering the open pit. The Falémé River bounds the western edge of the site and lies along the border with Senegal. The waste rock dump (WRD)which lies between the pit and the river and has been designed with a system of underdrainage and seepage collection to avoid any potential discharges from the WRD into the Falémé River. There are other WRDs surrounding the pit. Loulo facilities include four fuel tank farms containing HFO and LFO.
Typically, oxide ore has been mined from the open pits while the underground operations are targeting sulphide ore.
Environmental Assessment and Permitting
The Environmental and Social department of the mine reports to the mine General Manager (GM) operational with a functional report to the Group Community and Environmental Officer, who provides technical support to ensure that the mine operation remains in compliance with Randgold standards, host country laws and regulations and when necessary to the IFC/World bank standards. Each environmental department develops its budget and programmes in consultation with the Group Community and Environmental Officer, who also undertakes regular audits and inspections to ensure the site is compliant.
An environmental management program is in place which covers both operations. The Loulo and Gounkoto operations are ISO 14001:2004 compliant and independently audited to continuously improve environmental management. External audits are also carried out for compliance with the International Cyanide Management Code (ICMC), although Randgold are not directly members
| | |
| 18th September 2018 | | Page 287 |
| | | | |
| | Loulo-Gounkoto Gold Mine Complex NI 43-101 Technical Report | | |
of the Code the gaps identified in the last external audit, carried out in March 2017, relating to transportation, handling and storage, operations, decommissioning, worker safety, emergency response and community dialogue are being addressed.
A further ESIA was completed in 2014 and submitted for approval in 2015 for the underground (UG) operations at Gounkoto.
Subsequent to the approval of the 2014 underground ESIA, Randgold undertook a feasibility study to determine thetrade-off between underground mining and the expansion of the existing open pit. Based on economic conditions, it was determined that the expansion of the existing open pit (to be referred to as the proposed Super Pit) was the preferred alternative. An ESIA for the Super Pit was submitted and approved in 2016. This ESIA was compiled based on the 2014 underground ESIA.
All environmental permits are in place for the Loulo processing plant and both the Yalea and Gara underground mines, coveringinter aliaexplosives, the Baboto satellite pit and connecting road, the mine canteen, abstraction of water from the river and resettlement of the hamlet of Faraba. The key permit is an environmental clearance permit which is valid for five years, following an audit of the Environmental Management Plan (EMP), the five yearly EMP audit. Works can be halted if the operation is not in compliance with the audit findings and the agreed environmental clearance. The most recent permits for both Loulo and Gounkoto were granted on 21st March 2017.
Environmental Management and Monitoring
The Environmental and Social department of the mine reports to the mine general manager (GM) operational with a functional report to the Group Community and Environmental Officer, who provides technical support when and if needed to bring the mine into compliance with Randgold standards, host country laws and regulations and when necessary to the IFC/World bank standards. Each environmental department develops its budget and programmes in consultation with the Group Community and Environmental Officer, who also undertakes regular audits and inspections to ensure the site is compliant.
An environmental management program is in place which covers both operations The Loulo and Gounkoto operations are ISO 14001:2004 compliant and independently audited to continuously improve environmental management. External audits are also carried out for compliance with the International Cyanide Management Code (ICMC), although Randgold are not members of the Code Gaps identified in the last external audit, carried out in March 2017, relating to transportation, handling and storage, operations, decommissioning, worker safety, emergency response and community dialogue are being addressed.
A comprehensive water balance model is in place for Loulo (Yalea and Gara operations) which models flows, inputs and losses across the complex site, including the open pits and underground workings, plant, TSF, water management structures, offices, camp, and treatment facilities. The dynamic model also identifies river water use, dewatering water, discharges, gains, and losses identifies volumes of potential savings/recycling opportunities which would reduce abstraction
| | |
| 18th September 2018 | | Page 288 |
| | | | |
| | Loulo-Gounkoto Gold Mine Complex NI 43-101 Technical Report | | |
from the river. A similar but simplified water balance is in place for Gounkoto which reflects the fact that no processing is taking place there. Abstraction, storage, use, and discharge are monitored, and records kept in line with the GRI reporting format used by the mine for annual reporting to the Malian government.
Routine environmental monitoring takes place across the sites, including air quality (dust deposition and PM10) water quality, noise, and carbon emissions. Other specialist monitoring includes volatile organic compounds (VOC) emissions from the fuel tank farms, aquatic diversity in the watercourses and water bodies around Loulo, including the Falémé river and the Gara dam, a bioaccumulation study of metals in fish tissues, and gaseous monitoring (CO, NO, NO2, SO2, H2S) of various stacks and exhausts (two gold room, two laboratories, scrapyard incinerator, air power plant and the Gara underground ventilation system). The fish studies noted above clearly showed the impacts of ASM activities on water quality and sediment quality with elevated levels of arsenic and mercury, which is used in the ASM processing Environmental incidents are noted in a register at each site, causes and responses identified and incidents closed out. A total of 25 incidents (24 minor and one moderate) were reported in 2017 at Loulo, of which 56% were related to spills of oil, chemicals, or waste water.
An annual Environmental and Social report is submitted to the Malian authorities, compiled in a format aligned with GRI (Global Reporting Initiative) requirements. These reports cover environmental incidents, biodiversity and soils, water quantity, quality of discharges, surface water and groundwater quality and trends, energy and carbon emissions, cyanide management, noise and dust management, water management, the Environmental and Social Management System and closure costs. The section on Community Development covers grievances, stakeholder dialogue, artisanal mining, education and training, community health, drinking water, food security and economic development.
Mine Rehabilitation and Closure
Rehabilitation is ongoing at various locations at Loulo and as at the end of 2017, approximately 124 ha of land has been rehabilitated. Loulo has a full functioning nursery that is utilised to grow several local species of tree that are used for rehabilitation. While many open pits are mined out and waste rock dumps are inactive, these are still in the process of being assessed for potential future underground operations so will not be rehabilitated until near the end of mine life.
Mine closure costs are updated each year, with increases or decreases in disturbed areas noted and costed. Closure costings assume that there should not be any water requiring treatment from the pits and underground workings; the calculations do not account for any value recovered from the sale of plant, steel or other material; infrastructure (i.e. brick buildings) at the mine camp and mine offices, as well as all roads, which will be left as part of the agribusiness project after the mine closes (see 20.2 Social Considerations); contractor laydown areas will be rehabilitated by the contractors as per the contractor’s agreement; rehabilitation of the administration and certain workshop areas assumes that topsoil will be spread over 50% of the area, 50% of the areas will be ripped and the entire area vegetated. Waste rock dumps (WRDs) will be shaped to angles less than 30° and 300 mm of topsoil will need to be utilised to rehabilitate the TSF on the top and side slopes of the facility, this topsoil will be placed on a 400 mm layer of saprolite to be utilised
| | |
| 18th September 2018 | | Page 289 |
| | | | |
| | Loulo-Gounkoto Gold Mine Complex NI 43-101 Technical Report | | |
as a capping layer. All pit edges will be shaped to approximately 27° to a level of 20 m below ground surface and a berm constructed around the perimeter of the pits. These areas will be vegetated; post-closure ground and surface water monitoring is assumed to continue for five years, with sampling taking place on a quarterly basis, while vegetation monitoring and maintenance will take place for three years.
Total closure costs for the Loulo Permit are estimated at $29.4 M which includes a contingency of 10% to allow for areas which may have been undervalued or which have been overlooked.
The cost for rehabilitation and closure of the Gounkoto mine according to the Digby Wells calculation model is $9.7 M
Some local contractor rates foron-site earth moving machinery were used to calculate the 2017 closure costs.
The University of Bamako chemical department undertakes periodic sampling to determine water quality and paste pH of various water streams, waste rock, sediments, and tailings. Waters sampled include that from the open pits, underground workings, and process water. Waste rock from 13 dumps was sampled in 2016 and Acid Base Accounting and leachate tests carried out. Waste rock is made up of many different lithologies and contains metals such as arsenic, zinc, copper, chromium, and manganese. Despite considerable neutralising potential in most rock types, some lithologies have sulphur concentrations up to 12.5%, and thus less neutralising capacity. A database is being maintained and recommendations are made for the management of waste dumps and any limited ARD.
| 20.2 | Social Considerations |
The various ESIAs carried out have included assessments of impacts and benefits to local communities. A comparative socio-economic survey has been conducted to assess the change (positive and negative) in the surrounding local communities over an eighteen-year period (1997-2015). This showed that since 2002 there has been a significant influx of people into the area of the mine, especially in Djidian-Kenieba and Loulo villages. Population figures were gathered by the fieldwork teams of 1997, 2002, 2007 and 2015. In 1997, the population of Loulo, Sakola, and Djidian-Kenieba was 975 but by 2015 it had grown to 19 685. Influx peaked in 2007 but had decreased by 2015. Modernisation of the communities has increased along with trade and commerce. Educational and skill levels have also increased but access to land to grow crops or graze livestock, and access to natural resources have decreased with higher populations and large tracts of land occupied by the mine infrastructure. The quality of the housing stock has increased, along with transport infrastructure, access to water, access to healthcare and education.
Primary livelihoods are equally distributed between agriculture (40%), orpaillage (40%), followed by housekeeping (15%), salaried employment (11%) (mostly at Randgold), and small-scale trading (10%). Secondary livelihood activities were only practiced by 60% of households, with orpaillage still being the most common, followed by subsistence farming and small-scale trading.
| | |
| 18th September 2018 | | Page 290 |
| | | | |
| | Loulo-Gounkoto Gold Mine Complex NI 43-101 Technical Report | | |
80% of surveyed households Indicated that they are primarily reliant on cash-generating activities. Most common sources of household income were derived from employment at Randgold (34%) followed by artisanal mining (25%) and farming (14%).
Employment and Procurement
The mine is a significant employer to members of the local communities. The underground mining operations contribute to extendedlife-of-mine, employment of local Malians and the growth of the Malian economy. Randgold’s policy is to promote nationals of the host country to manage the Project. Where locally qualified and experienced staff is not available, recruitment from elsewhere is undertaken, with the clear understanding that local personnel are given the training and experience required to allow them to replace the expatriates as soon as possible.
Randgold’s policy of promoting local employment also extends to its contractors. Figures for national employment in 2017 were 2,820 out of a total of 2,975 employer and contractor posts at Loulo and 1,175 out of 1,209 at Gounkoto. Unskilled labour is typically sourced from the local area while more skilled posts are filled by staff from elsewhere in Mali, including Bamako.
There is also a policy of promoting local procurement which also covers contractors. Where possible, goods and services are procured locally. This includes produce from the agribusiness which is purchased for use in the mine canteens.
Resettlement
Phases of economic displacement (loss of crops and trees) and the physical resettlement of some households has occurred during the life of the mine to date as it has expanded. Crops and trees are compensated at published rates; physical resettlement has involved providing affected households with a new home. The most recent resettlement was around Gounkoto and was completed in 2012. This affected 12 households and around 300 hectares of land, including 1,700 economic trees and two artisanal mining (orpaillage) sites. A resettlement audit was carried out in late 2015, in line with good international industry practice.
Stakeholder Engagement
Stakeholder engagement and dialogue is ongoing and the importance of this to the company is demonstrated by the fact that senior managers have Key Performance Indicators (KPIs) related to their involvement in dialogue with communities, which generally requires them to attend quarterly stakeholder meetings. In addition, union representatives attend strategy meetings and board meetings of the local operating company in order to provide information on current community and local employee issue and suggest targets for the company to work towards with respect of the local community.
A grievance mechanism is in place. No grievances were received in 2017. The last grievance was recorded in 2015. Through the stakeholder engagement process, concerns are raised by the community: In 2017, the concerns registered were the generation of dust in the villages and the employability of young people in the community, a recurrent theme of these meetings. The issue
| | |
| 18th September 2018 | | Page 291 |
| | | | |
| | Loulo-Gounkoto Gold Mine Complex NI 43-101 Technical Report | | |
of dust generation has been mitigated through the application of molasses, which acts as a binder, on roads through the riverside villages.
To meet the employment needs of youth in the community, strategies have been identified through the implementation of economic development projects. These economic development projects bring young people to entrepreneurship that will allow them to become self-employed and to become not a mine employee but rather a partner.
Community Development
Randgold continually engages with local communities and focuses on potable water supplies, primary school education, health care education, investment in medical clinics and local economic development projects. Hygiene and sanitation committees have been established to increase awareness. Randgold and its partners have built several classrooms in primary schools in villages around the mine.
A program to improve the agricultural yield of the area has been undertaken, with tractors being donated to the community and an agribusiness training centre constructed to train locals in agricultural entrepreneurship. A community of vegetable growers has developed to supply the mine caterer with fresh produce. The German Corporation for International Cooperation recently joined the mine’s effort in providing one million euros and their technical assistance.
Artisanal and Small-Scale Mining (ASM)
There is a significant ongoing presence of artisanal miners (orpailleurs) operating within the Loulo Permit area, particularly along the haul road. The government of Mali, as part owners of the operations, provide security in the form of Gendarmes who are posted at several locations in guard posts. The Gendarmes intervene on request if ASM activities interfere with the operation of the mine. The Gendarmes have been successful in removing orpailleurs from the Baboto target area. Although this and other key exploration targets remain free of ASM activity, the risk of incursion into exploration or operations areas remains, because of the increasing number of people in the illegal activity. The mining industry in Mali has established a committee to deal with the issue at the highest level of the Government. Dedicated orpaillage corridors are still to be created for artisanal and small-scale mining. The World Bank has recently been involved in proposing solutions. In the meantime, the Mine is reinforcing its relationship with the community to manage the issue.
| | |
| 18th September 2018 | | Page 292 |
| | | | |
| | Loulo-Gounkoto Gold Mine Complex NI 43-101 Technical Report | | |
| 21 | Capital and Operating Costs |
Basis of Estimate
Loulo is anon-going combined open pit and underground mining operation with the necessary facilities, equipment, and manpower in place to produce gold.
The basis for the combined LOM plan is the Proved and Probable Ore Reserves estimate described in Section 15.
In the QP’s opinion, the open pit and underground LOM and cost estimates have been completed in sufficient detail to be satisfied that economic extraction of the Proved and Probable Ore Reserves is justified.
The majority of the capital cost estimates contained in this report are based on quantities generated from the open pit and underground development requirements and data provided by Randgold.
Capital expenditure over the remaining LOM is estimated to be $598 M, made up from the following allocation of costs. A breakdown of the expenditure is detailed in Table21-1. The capital schedule is given in Table21-2 and Table21-3.
Table21-1 LOM Capital Expenditure
| | | | | |
| Capital Expenditure | | Cost ($ M) |
Construction and Project Capital | | 1.4 |
Ongoing Capital | | 107 |
Underground Capital Development and Drilling | | 311 |
Pre-Production Capitalised | | 137 |
Exploration Capitalised | | 2.9 |
Rehabilitation/Mine Closure | | 39 |
Total | | 598 |
Construction and Projects
A small amount of $1.4 M is allocated for projects other than the Gounkoto underground mine.
Ongoing Capital
Ongoing capital of $107 M is allocated to cover the overhaul and replacement costs for mining equipment other capital items.
| | |
| 18th September 2018 | | Page 293 |
| | | | |
| | Loulo-Gounkoto Gold Mine Complex NI 43-101 Technical Report | | |
Underground Capital and Development
The development of the Gounkoto underground operation is forecast to cost $74 M. A further $237 M is planned to cover capital development at the Gara and Yalea operations. Capital development costs are based on a calculated average cost per metre for development including development of declines, decline stockpiles, ventilation drives, level access drives, and long hole ventilation raises.
Pre-Production Capital
Pre-production capital covers open pit waste stripping. This was estimated at $137 M for Gounkoto. Exploration s capitalised where a total of $2.9 M was estimated for Loulo based exploration.
Exploration Capitalised
A total of $2.9 M was estimated for Loulo based exploration.
| | |
| 18th September 2018 | | Page 294 |
| | | | |
| | Loulo-Gounkoto Gold Mine Complex NI 43-101 Technical Report | | |
Table21-2 Loulo Capital Cost
| | | | | | | | | | | | | | | | | | | | | | | | | | | | | | | | | | | | | | | | | | | | | | | | | | | | | | | | | | | | | | | | | | | | | | |
Item | | Units | | Total | | 2018 | | 2019 | | 2020 | | 2021 | | 2022 | | 2023 | | 2024 | | 2025 | | 2026 | | 2027 | | 2028 | | 2029 |
Construction & Project Capital | | $‘000 | | 1,410 | | 304 | | 304 | | 290 | | 256 | | 256 | | - | | - | | - | | - | | - | | - | | - |
Ongoing Capital | | $‘000 | | 56,859 | | 34,459 | | 3,800 | | 3,800 | | 3,800 | | 3,800 | | 3,600 | | 3,600 | | - | | - | | - | | - | | - |
Underground Capital + Development | | $‘000 | | 236,671 | | 45,789 | | 52,306 | | 41,646 | | 34,530 | | 33,936 | | 19,418 | | 9,046 | | - | | - | | - | | - | | - |
Pre-Production Capitalised | | $‘000 | | - | | - | | - | | - | | - | | - | | - | | - | | - | | - | | - | | - | | - |
Exploration Capitalised | | $‘000 | | 2,927 | | 2,927 | | - | | - | | - | | - | | - | | - | | - | | - | | - | | - | | - |
Rehabilitation/Mine Closure | | $‘000 | | 29,400 | | | | | | | | | | | | | | | | | | | | | | | | |
Total Capital Expenditure | | $‘000 | | 327,267 | | 83,479 | | 56,410 | | 45,736 | | 38,586 | | 37,992 | | 23,018 | | 12,646 | | - | | - | | - | | - | | - |
Table21-3 Gounkoto Capital Cost |
Item | | Units | | Total | | 2018 | | 2019 | | 2020 | | 2021 | | 2022 | | 2023 | | 2024 | | 2025 | | 2026 | | 2027 | | 2028 | | 2029 |
Construction & Project Capital | | $‘000 | | - | | - | | - | | - | | - | | - | | - | | - | | - | | - | | - | | - | | - |
Ongoing Capital | | $‘000 | | 50,213 | | 10,035 | | 7,248 | | 15,835 | | 9,797 | | 7,298 | | - | | - | | - | | - | | - | | - | | - |
Underground Capital + Development | | $‘000 | | 73,920 | | - | | - | | - | | - | | - | | - | | - | | 30,734 | | 30,792 | | 8,483 | | 3,208 | | 704 |
Pre-Production Capitalised | | $‘000 | | 136,907 | | 5,825 | | - | | 65,167 | | 44,426 | | 21,488 | | - | | - | | - | | - | | - | | - | | - |
Exploration Capitalised | | $‘000 | | - | | - | | - | | - | | - | | - | | - | | - | | - | | - | | - | | - | | - |
Rehabilitation/Mine Closure | | $‘000 | | 9,700 | | | | | | | | | | | | | | | | | | | | | | | | |
Total Capital Expenditure | | $‘000 | | 270,740 | | 15,860 | | 7,248 | | 81,002 | | 54,223 | | 28,786 | | - | | - | | 30,734 | | 30,792 | | 8,483 | | 3,208 | | 704 |
| | |
| 18th September 2018 | | Page 295 |
| | | | |
| | Loulo-Gounkoto Gold Mine Complex NI 43-101 Technical Report | | |
Basis of Estimate
Randgold maintains detailed operating cost records that provide an excellent basis for estimating future operating costs.
The basis for the combined LOM plan is the Proved and Probable Ore Reserves estimate described in Section 15.
In the QP’s opinion, the open pit and underground LOM and cost estimates have been completed in sufficient detail to be satisfied that economic extraction of the Proved and Probable Ore Reserves is justified.
Costs used for the open pit optimisations were derived from the Mining Contractor’s pricing of the open pit LOM schedule. Owners cost were also added. Labour costs for national employees were based on actual costs. Local labour laws regarding hours of work, etc. were also considered and overtime costs included.
During 2017 costs for processing and G&A were updated based on actuals adjusted for latest forward estimates, production profiles and manning levels.
Customs duties, taxes, charges and logistically costs are included.
LOM Operating Costs
The LOM combined open pit and underground operating cost for Loulo is estimated to be $68.90/t milled and for Gounkoto it is estimated to be $68.49/t. Unit costs used to estimate LOM operating costs are summarised Table21-4 in for Loulo and Gounkoto. Total LOM operating costs for Loulo and Gounkoto are summarised in Table21-5.
Table21-4 LOM Operating Unit Costs for Loulo and Gounkoto
| | | | | | |
| Activity | | Units | | Loulo | | Gounkoto |
Open Pit Mining | | $/t mined | | 2.69 | | 2.64 |
Open Pit Mining | | $/ore t mined | | 34.10 | | 36.95 |
Underground Mining | | $/t mined | | 45.65 | | 57.99 |
Underground Mining | | $/ore t mined | | 46.35 | | 82.40 |
Stockpile Movement | | $/t milled | | -3.63 | | 3.81 |
Processing | | $/t milled | | 18.22 | | 17.03 |
Trucking & Hauling | | $/t milled | | 0.03 | | 5.20 |
G&A | | $/t milled | | 8.30 | | 7.73 |
Mining Total | | $/t milled | | 42.35 | | 38.53 |
Total LOM Net OPEX | | $/t milled | | 68.90 | | 68.49 |
| | |
| 18th September 2018 | | Page 296 |
| | | | |
| | Loulo-Gounkoto Gold Mine Complex NI 43-101 Technical Report | | |
Table21-5 LOM Operating Total Costs for Loulo and Gounkoto
| | | | |
| Description | | Loulo LOM Total Cost ($ ‘000) | | Gounkoto LOM Total Cost ($ ‘000) |
Open Pit Mining | | 183,304 | | 596,433 |
Underground Mining | | 1,326,789 | | 174,447 |
Processing | | 649,829 | | 340,790 |
G&A | | 295,816 | | 154,730 |
Trucking & Hauling | | 1,225 | | 104,036 |
Total Operating Cost | | 2,456,962 | | 1,370,435 |
| | |
| 18th September 2018 | | Page 297 |
| | | | |
| | Loulo-Gounkoto Gold Mine Complex NI 43-101 Technical Report | | |
This section is not required as the property is currently in production, Randgold is a producing issuer, and there is no material expansion of current production. RPA has verified the economic viability of the Ore Reserves via cash flow modelling, using the inputs discussed in this report.
| | |
| 18th September 2018 | | Page 298 |
| | | | |
| | Loulo-Gounkoto Gold Mine Complex NI 43-101 Technical Report | | |
Endeavour Mining Corporation (Endeavour) own the operating Tabakoto gold mine which is approximately 26 km SE of the Loulo mine. Tabakoto reported Measured and Indicated. Mineral Resources on 31st December 2017 of 73.9 Mt at 1.56 g/t Au containing 3.60 Moz of gold. An additional 7.4 Mt at 3.4 g/t Au for 0.8 Moz of Inferred Resources was also declared. A Probable and Proved Ore Reserve of 4.8 Mt at 3.36 g/t Ay for 0.52 Moz was reported. Mineral Resources are inclusive of Ore Reserves. These Mineral Resources and Ore Reserves consist of both open pit and underground material.
The Tabakoto mine, like the Loulo mine, lays within the Kofi formation on the Kedougou-Kenieba erosional inlier. The mine began production in 2006, although problems withstart-up problems resulted in the mine closing in 2007. The minere-commenced operations in 2009 and has been operational since.
| 23.2 | Kofi Exploration Project |
Endeavour own, through Mines de Kofi SA, a local subsidiary, own a series exploration licence that lie directly north of the Loulo Permit. A technical report on their Tabakoto gold Mine dated March 2016 outlined that no Mineral Resource or Ore Reserve had been declared on their exploration permits. During 2017, Endeavour entered into an agreement with Randgold to purchase the Baboto North deposit which is adjacent to Endeavour’s Kofi C deposit. Endeavour expects to initiate mining activities at Baboto North in late 2018. No additional public information is available.
| | |
| 18th September 2018 | | Page 299 |
| | | | |
| | Loulo-Gounkoto Gold Mine Complex NI 43-101 Technical Report | | |
| 24 | Other Relevant Data and Information |
No additional information or explanation is necessary to make this Technical Report understandable and not misleading.
The following is taken from the Annual Report on Form20-F 2017 submitted to the US Securities and Exchange Commission.
Randgold are subject to risks associated with operating gold mines in Mali. In 2017, gold produced in Mali represented approximately 58% of Randgold’s Consolidated group gold production, including joint ventures.
On March 21, 2012, Mali was subject to an attempted coup d’état that resulted in the suspension of the constitution, the partial closing of the borders and the general disruption of business activities in the country. The supply of consumables to our mines in Mali was temporarily interrupted as a result of the political situation. The borders were reopened shortly after these events and an interim government was installed within a month.
In January 2013, following military conflicts with terrorist insurgents, the Malian State requested the assistance of the French Government to assist the Malian army to repel the insurgents who had been occupying parts of the north of the country and beginning to move towards the southern part of the country. During 2013, French and other foreign troops occupied the northern part of the country to assist the Malian State in maintaining control of this region and presidential and parliamentary elections took place during the middle of 2013.
During 2015, a number of attacks by insurgents took place. Despite a peace agreement reached in June 2015 between the Malian government and secular armed groups, the growing presence of armed groups in northern and central Mali and bouts of violence have continued.
In July 2016, Mali extended the country’s state of emergency after a series of deadly attacks.
During 2017, Mali experienced a number of attacks by insurgents, including an attack on peacekeeping troops in the north of the country. In April 2017 and October 2017, Mali extended the country’s state of emergency as there continues to be a threat to security in certain areas of the country. Although we have continued to produce and sell gold throughout this period, there can be no assurance that the political or security situation will not disrupt our ability to continue gold production, or our ability to sell and ship our gold from our mines in Mali. Furthermore, there can be no assurance that the political and security situation in Mali will not have a material adverse effect on our operations and financial condition.
Goods are supplied to Randgold’s operations in Mali primarily by road through Senegal and Côte d’Ivoire, which at times have been disrupted by geopolitical issues. Any present or future policy
| | |
| 18th September 2018 | | Page 300 |
| | | | |
| | Loulo-Gounkoto Gold Mine Complex NI 43-101 Technical Report | | |
changes in the countries in which Randgold operates, or through which Randgold are supplied, may in some way have a significant effect on Randgold’s operations and interests.
| | |
| 18th September 2018 | | Page 301 |
| | | | |
| | Loulo-Gounkoto Gold Mine Complex NI 43-101 Technical Report | | |
| 25 | Interpretation and Conclusions |
Total production at Loulo-Gounkoto in 2017 was 4,918 kt at a head grade of 5.0 g/t Au producing 740 koz of gold (92.7% recovery). Total production from the mine as of 31st December 2017 totals 45,598 kt at a head grade of 4.2 g/t Au producing 5,637 koz (90.2% recovery).
| 25.1 | Geology and Mineral Resources |
The Loulo and Gounkoto has documented standard procedures for the drilling, logging, and sampling processes which meet industry standards. The geological and mineralisation modelling at Loulo and Gounkoto is based on visibly identifiable geological contacts, which ensure a geologically robust interpretation.
The Loulo and Gounkoto has a quality control program in place to ensure the accuracy and precision of the assay results from the analytical laboratory. Checks conducted on the quality control database indicated that the results are of acceptable precision and accuracy. In the QP’s opinion, the sample selection, preparation, and analysis are suitable for use within a Mineral Resource estimate.
Geological models and subsequent Mineral Resource estimations have evolved and improved with each successive model update. Significant grade control drill programs and mapping of exposures within mine developments have been completed to increase the confidence in the Mineral Resource and Ore Reserve estimates. During the last three years, significant resource extension drilling has been undertaken at both Yalea and Gara. This has led to the addition of new extensions Yalea Far South, Gara Far South, and Gara Far South Extended, making a major impact on replenishing 2016 and 2017 depletion.
In the QP’s opinion, both the Loulo Mineral Resources and Gounkoto Mineral Resources top cutting, domaining and estimation approach are appropriate and use industry accepted methods. The QP’s consider the Mineral Resources at Loulo and Gounkoto are appropriately estimated and classified.
The QP is not aware of any environmental, permitting, legal, title, socioeconomic, marketing, fiscal, metallurgical, or other relevant factors, which could materially affect the Mineral Resource estimate.
Exploration at Loulo-Gounkoto is focussed on advancing both brownfields and greenfields targets. Brownfields exploration involves testing underground and open pit extensions of the current Mineral Resources for high-grade mineralisation based on the structural model. During 2017, an updated tectonostratigraphy of the Kofi Series rocks at Loulo-Gounkoto has been developed, to improve the model of regional geologic architecture and understanding of key controls of gold deposit formation, which has subsequently driven are-assessment of greenfields exploration targets. The current exploration concept has been proven to be effective, with both
| | |
| 18th September 2018 | | Page 302 |
| | | | |
| | Loulo-Gounkoto Gold Mine Complex NI 43-101 Technical Report | | |
the discovery of Gounkoto and the successful replenishment of depleted Mineral Resources and Ore Reserves at both mines.
| 25.2 | Mining and Ore Reserves |
The open pit operations at Loulo-Gounkoto consists of multiple open pits. The open pits are operated by a mining contractor and adown-the-hole blasting service is provided by an appropriate blasting contractor. Opportunities exist to upgrade and convert Inferred Mineral Resource within the current pit shells to Ore Reserves with drilling. The open pit operations provide a source of flexibility to supplement the plant feed when required. The Gounkoto open pit mining will be completed in 2024 with the Faraba Pit starting in 2022 and ending in 2024.
The Loulo underground mines are mature operations designed to extract the Yalea and Gara orebodies. The Loulo underground mines use three primary mining methods consisting of long hole transverse open stoping; long hole longitudinal retreat open stoping; and stoping under rock fill (SURF). The Yalea LOM extends to 2028 and Gara to 2032. Yalea and Gara sustain production rates of approximately 1.45 Mtpa and Gara 1.25 Mtpa, respectively.
Gounkoto underground is atPre-feasibility level. The proposed mining method for Gounkoto underground consists of longhole bench stoping with backfill. Due to the relatively small reserve tonnage of Gounkoto underground, all attempts to reduce the capital outlay have been adopted. The MZ3 mineralisation located on the footwall of the Fault Gouge fault has been removed from the schedule due to the poor ground conditions modelled in the area. Construction of the Gounkoto underground operation is currently scheduled to start construction at the end of the open pit mine life in 2024, achieve first production in 2025, and continue until 2030. This is currently expected to be reviewed during 2018. The Gounkoto underground operation will commence in 2025 and will continue until 2030.
Randgold has significant experience in other mining operations within West Africa and the production rates, modification factors, and costs are benchmarked against other West African operations.
The current Ore Reserves for Loulo-Gounkoto support a total mine life of 15 years, mining a total of 52.2 Mt of ore at 4.73 g/t Au until the year 2032. During this15-year period the total plant ore feed tonnage will amount to 56 Mt, including current stockpiles, at an average feed grade of 4.55 g/t Au resulting in 7.5 Moz recovered at an average processing recovery of 92%.
The QP considers the parameters used in the Mineral Resource to Ore Reserve conversion process to be appropriate.
The QP is not aware of any environmental, legal, title, socioeconomic, marketing, mining, metallurgical, fiscal, infrastructure, permitting, that could materially affect the Ore Reserve estimate.
| | |
| 18th September 2018 | | Page 303 |
| | | | |
| | Loulo-Gounkoto Gold Mine Complex NI 43-101 Technical Report | | |
Based upon both metallurgical testwork data and actual operational evidence, the QP is satisfied that Loulo-Gounkoto is able to maintain production, gold recovery and reagent consumptions as forecasted.
The Loulo-Gounkoto has demonstrated successful operation both in terms of processing throughput and in particular with gold recovery.
Yalea recovery is impacted by the presence of arsenic and copper. Consequently, arsenic and copper estimations are completed as part of the Mineral Resource update in order to identify potentially low recovery areas. Gold recovery is maintained above 90% by blending the various ore sources (Yalea / Gara/ Gounkoto) to control copper and arsenic grades in the mill feed.
The current LOM has an average recovery life of mine of 92.3%. The average gold recovery in 2017 was 92.7%, an improvement from 2016 (Figure1-2).
The current LOM has an average recovery life of mine of 92%. Above 90% recovery is achieved by blending the various ore sources (Yalea / Gara/ Gounkoto) to control copper and arsenic grades in the mill feed.
The QP consider the modelled recoveries for all ore sources and the process plant and engineering unit costs applied to the Mineral Resource and Ore Reserve process to be acceptable.
| 25.4 | Environment and Social |
Loulo-Gounkoto has a mature environmental and social management plan and an accredited ISO14001 Environmental Management System in place which addresses current operational needs and can readily be adapted to meet future activities. Mine closure costs are reviewed and revised annually in line with good industry practice.
All permits are in place, and an annual Environmental and Social report compiled in a format aligned with GRI requirements is submitted to the Malian authorities.
Stakeholder engagement is ongoing, and all senior management are involved in regular meetings with the community. The mine prioritises local employment and in 2017 achieved 96% Malian employment across Randgold and contractor workforces.
Randgold continues to invest in community development initiatives, focussing on potable water supplies, primary school education, health care education, investment in medical clinics and local economic development projects, and livelihood projects, such as the program to improve the agricultural yield of the area. The mine is a significant employer to members of the local communities. The mining operations contribute to extendedlife-of-mine, employment of local Malians and the growth of the Malian economy. Randgold’s policy is to promote nationals to manage the Project.
| | |
| 18th September 2018 | | Page 304 |
| | | | |
| | Loulo-Gounkoto Gold Mine Complex NI 43-101 Technical Report | | |
The ongoing presence of artisanal miners (orpailleurs) operating within the Loulo Permit area, has the potential to cause unrest. The government of Mali provides security in the form of Gendarmes who intervene on request if ASM activities interfere with the operation of the mine. The risk of incursion into exploration or operations areas remains, because of the increasing number of people in the largely illegal activity. Dedicated orpaillage corridors have been proposed by the Mine but are still to be created for artisanal and small-scale mining. In the meantime, the Mine is reinforcing its relationships with the community to deal with the issue.
The QP considers the extent of all environmental liabilities, to which the property is subject, to have been appropriately met.
All Permit fees, surface rights fees, and taxes relating to Loulo-Gounkoto exploration and mining rights have been paid to date and reporting requirements have been met.
At the time of compiling this report, the QP is not aware of any risks that could result in the loss of ownership of the deposits or loss of the Permits, in part or in whole.
As a result of the long-established open pit mining operation at the Project, substantial infrastructure exists at Loulo-Gounkoto to support theon-going mining and processing operations.
In comparison to much of the country, road access for staff and materials is excellent via the recently constructed Millennium Highway that crosses the Loulo to Gounkoto haul road approximately 6 km north of Gounkoto.
There is sufficient power supply capacity available from theon-site light and heavy fuel oil generators to meet the power demands of the operations.
An adequate water supply is available for the operation, sourced from the Gara and Falémé rivers which run through the Project site.
Randgold has undertaken analysis of the Project risks. summarises the Project risks and the QPs assessment of the risk degrees and consequences, as well as ongoing/required mitigation measures. The QPs, however, note that the degree of risk refers to our subjective assessment as to how the identified risk could affect the achievement of the Project objectives.
Loulo underground has been in production for 11 years and is a mature operation. Gounkoto open pit has been in production for over seven years and is a mature operation. Apre-feasibility study has been completed on Gounkoto Underground.
| | |
| 18th September 2018 | | Page 305 |
| | | | |
| | Loulo-Gounkoto Gold Mine Complex NI 43-101 Technical Report | | |
In the QPs opinion, there are no significant risks and uncertainties that could reasonably be expected to affect the reliability or confidence in the exploration information, Mineral Resource or Ore Reserve estimates.
Risk Analysis Definitions
The following definitions have been employed by the QP’s in assigning risk factors to the various aspects and components of the Project:
| | ● | | Low– Risks that are considered to be average or typical for a deposit of this nature and could have a relatively insignificant impact on the economics. These generally can be mitigated by normal management processes combined with minor cost adjustments or schedule allowances. |
| | ● | | Minor– Risks that have a measurable impact on the quality of the estimate but not sufficient to have a significant impact on the economics. These generally can be mitigated by normal management processes combined with minor cost adjustments or schedule allowances. |
| | ● | | Moderate– Risks that are considered to be average or typical for a deposit of this nature but could have a more significant impact on the economics. These risks are generally recognisable and, through good planning and technical practices, can be minimised so that the impact on the deposit or its economics is manageable. |
| | ● | | Major– Risks that have a definite, significant, and measurable impact on the economics. This may include basic errors or substandard quality in the basis of estimate studies or project definition. These risks can be mitigated through further study and expenditure that may be significant. Included in this category may be environmental/socialnon- compliance, particularly in regard to Equator Principles and IFC Performance Standards. |
| | ● | | High– Risks that are largely uncontrollable, unpredictable, unusual, or are considered not to be typical for a deposit of a particular type. Good technical practices and quality planning are no guarantee of successful exploitation. These risks can have a major impact on the economics of the deposit including significant disruption of schedule, significant cost increases, and degradation of physical performance. These risks cannot likely be mitigated through further study or expenditure. |
In addition to assigning risk factors, the QPs provided opinion on the probability of the risk occurring during the LOM. The following definitions have been employed by the QPs in assigning probability of the risk occurring:
| | ● | | Rare– The risk is very unlikely to occur during the Project life. |
| | ● | | Unlikely– The risk is more likely not to occur than occur during the Project life. |
| | ● | | Possible– There is an increased probability that the risk will occur during the Project life. |
| | ● | | Likely– The risk is likely to occur during the Project life. |
| | ● | | Almost Certain– The risk is expected to occur during the Project life. |
| | |
| 18th September 2018 | | Page 306 |
| | | | |
| | Loulo-Gounkoto Gold Mine Complex NI 43-101 Technical Report | | |
Risk Analysis Table
Randgold has undertaken analysis of the Project risks. Table25-1 and Table25-2 summarise the Project risks and the QPs assessment of the risk degrees and consequences, as well as ongoing/required mitigation measures. The QPs, however, note that the degree of risk refers to our subjective assessment as to how the identified risk could affect the achievement of the Project objectives.
Table25-1 Loulo Risk Rating
| | | | | | | | |
Issue | | Likelihood | | Consequence Rating | | Risk Rating | | Mitigation |
Geology and Mineral Resources – Confidence in Mineral Resource Models | | Unlikely | | Minor | | Low | | Additional scheduled infill drilling. Resource model updated on a regular basis using production reconciliation results. |
Mining and Ore Reserves – Open Pit Slope Stability | | Unlikely | | Minor | | Minor | | Continuedin-pit monitoring, geotechnical drilling, instrumentation, and continued updating of geotechnical models. |
Mining and Ore Reserves – Underground Recovery and Dilution | | Possible | | Moderate | | Low | | Extensive production drilling for stope design, including geotechnical features. Predictive modelling of dilution. |
Processing – Process Water Management with Mine in Water-Positive Mode | | Possible | | Moderate | | Moderate | | Water balance investigations Processing to reduce high usage of fresh water I-plant water treatment has reduced deleterious elements |
Processing – Baboto oxide effect on paste fill | | Unlikely | | Moderate | | Low | | Several test trials campaigns already successfully completed, which has identified the maximum content of Baboto ore that can accompany a plant feed. Plant trials have demonstrated that blending of oxides, provided that threshold contents are not exceeded, will not compromise the paste plant operation. |
Environmental – TSF Failure | | Possible | | Moderate | | Moderate | | Temporary holding of supernatant in redundant pits. Expansion of TSF. Plant Water balance being addressed. Pool management and removal of excess water off the dam |
| | |
| 18th September 2018 | | Page 307 |
| | | | |
| | Loulo-Gounkoto Gold Mine Complex NI 43-101 Technical Report | | |
| | | | | | | | |
Issue | | Likelihood | | Consequence Rating | | Risk Rating | | Mitigation |
Environmental – Groundwater contamination (As) | | Possible | | Moderate | | Moderate | | Manage As levels of underground and TSF discharge through appropriate dilution techniques. Recycle contaminated water Continuing monitoring and external or third-party audits. |
Social – Social License to Operate | | Possible | | Moderate | | Low | | Regular community and union engagement by company social and sustainability representatives. |
Social – Artisanal Miners | | Likely | | Moderate | | Moderate | | Engagement with Malian Government.to agree an ASM strategy. Gendarmes securing Permit area. |
Country & Political – Security – Governmental | | Possible | | Major | | Low | | Dedicated government liaison team in Bamako. Government participation/ownership. |
Capital and Operating Costs | | Possible | | Minor | | Low | | Continue to track actual costs and LOM forecast costs, including considerations for inflation and foreign exchange. Owner/Operator for underground mining. |
Fiscal Stability | | Possible | | Moderate | | Moderate | | Dedicated government liaison team in Bamako. Government participation/ownership |
| | |
| 18th September 2018 | | Page 308 |
| | | | |
| | Loulo-Gounkoto Gold Mine Complex NI 43-101 Technical Report | | |
Table25-2 Gounkoto Risk Rating
| | | | | | | | |
Issue | | Likelihood | | Consequence Rating | | Risk Rating | | Mitigation |
Geology and Mineral Resources – Confidence in Mineral Resource Models | | Unlikely | | Minor | | Low | | Additional scheduled infill drilling. Resource model updated on a regular basis using production reconciliation results. |
Mining and Ore Reserves – Open Pit Slope Stability | | Unlikely | | Major | | Moderate | | Improved blast hole control. Continuedin-pit monitoring. |
Mining and Ore Reserves – Underground Recovery and Dilution | | Possible | | Moderate | | Moderate | | Further studies as part of the Feasibility Study. |
Environmental – Air Quality (Dust) | | Likely | | Minor | | Moderate | | Dedicated dust suppression on haulage roads. |
Social – Social License to Operate | | Possible | | Moderate | | Low | | Regular community and union engagement by company social and sustainability representatives. |
Social – Artisanal Miners | | Likely | | Moderate | | Moderate | | Engagement with Malian Government.to agree an ASM strategy. Gendarmes securing Permit area. |
Country & Political – Security – Governmental | | Possible | | Major | | Low | | Dedicated government liaison team in Bamako. Government participation/ownership. |
Capital and Operating Costs | | Possible | | Minor | | Low | | Continue to track actual costs and LOM forecast costs, including considerations for inflation and foreign exchange. |
Fiscal Stability | | Possible | | Moderate | | Moderate | | Dedicated government liaison team in Bamako. Government participation/ownership |
| | |
| 18th September 2018 | | Page 309 |
| | | | |
| | Loulo-Gounkoto Gold Mine Complex NI 43-101 Technical Report | | |
The QPs make the following recommendations:
| | ● | | To extend the Loulo-Gounkoto life and replace depleted reserves, the current exploration strategy of targeting extensions of existing brownfields targets should be continued. |
| | ● | | A digital logging and data capture system should be implemented in the near future to minimise manual data capture. |
| | ● | | To reduce the complexity ofsub-domaining and improve the quality of local estimation, dynamic anisotropy should be tested and applied to folded bodies in future Mineral Resource updates. |
| | ● | | The application of a variablecut-off grade at Gara should be reviewed to avoid to the inclusion of large tonnages of lower grade material from the deeper levels of the mine impacting the profitability of the Gara operation. |
| | ● | | The Gara DRS model should be compared to production actuals, in order to establish if it could be directly applied to the Ore Reserve. |
| | ● | | To minimise the possibility of increased mining induced stresses affecting pillar and stope stability, a geotechnical review (including numerical modelling if appropriate) of the current Loulo underground mine plan and stoping sequence should be completed. |
| | ● | | The costs being used to calculate thecut-off grade for Gounkoto underground needs to be updated with the current underground costs and thecut-off grade applied to the next Mineral Resource and Ore Reserve estimates. |
| | ● | | It is recommended that a QP development programme be implemented at the Loulo- Gounkoto for resource geologists, mining engineers, and metallurgists. |
| | ● | | Loulo-Gounkoto is reliant on its own power generation through thermal energy sources. It is recommended that trials of alternative energy solutions continue to be sought as a potential reduction in power costs could have a material impact on the operating costs and mine life. |
| | ● | | An ASM strategy should be sought with the Malian government, and dedicated ASM corridors defined and managed. |
| | |
| 18th September 2018 | | Page 310 |
| | | | |
| | Loulo-Gounkoto Gold Mine Complex NI 43-101 Technical Report | | |
1008_Randgold_Loulo_22a_Yalea_Oxide-Tran_Options_140906_v04, Kenmore Mine Consulting, November 2013-December 2014.
1008_Randgold_Loulo_22b_Yalea_South_under dyke_mining_140806_v03, Kenmore Mine Consulting, November 2013- December 2014.
Air Quality Assessment Loulo 2016.
Air Quality Assessment Loulo 2017.
Annual Reports from 2015, 2016 and 2017.
Audit of Yale and Gara Mineral Resources, Loulo Gold Mine, Mali (DRAFT1), Code- RRS 21304, QG (Australia) Ltd, November 2014.
Competent Persons Report Mineral Resources, Loulo Gold Mines, Mali. Compiled by Simon Bottoms, Group Resource Geologist, Randgold Resources Limited, 31st December 2017.
Environmental Impact Assessment & Environmental Management Program Report, Loulo Gold Mine (Mali), Underground Mining Operations, Digby Wells & Associates, South Africa, October 2008.
Environmental Permit Gounkoto 2017.
Environmental Permit Loulo 2017.
Gara Conveyor and Vehicle Declines Stress Modelling, Chris Nyoni, Randgold Resources Ltd, March 2015.
Gara Crusher Chamber Stress Modelling, Chris Nyoni, Loulo, Randgold Resources Ltd, February 2015.
Geotechnical report on the Stability and mine design of Yalea underground, Middindi Consulting Pty Ltd, Ruimsig South Africa, ReportRDG-12Lou, March 2011.
Golder 2011, Loulo Gold Mine – Paste Backfill Scoping Study, Report11-1900-1005 (4000), Golder Associates, Sudbury, Ontario, Canada, October 2011.
Gounkoto Annual Closure Cost Assessment 2017.
Gounkoto Closure Liability 2017.
Gounkoto Incident Register 2017.
Gounkoto Resettlement Framework Oct 2010.
| | |
| 18th September 2018 | | Page 311 |
| | | | |
| | Loulo-Gounkoto Gold Mine Complex NI 43-101 Technical Report | | |
Gounkoto, 2014. QA/QC Report – Gounkoto QA/QC Period 1st October 2013 to 30th June 2014. Internal SMG report (author not listed).
JORC code 2012 Edition, Australasian Code for Reporting of Exploration Results, Mineral Resources and Ore Reserves, Joint Ore Reserve Committee of The Australian Institute of Mining and Metallurgy, Australian Institute of Geoscientists and Mineral Council of Australia (JORC), 2012.
Kenmore 2013, PowerPoint presentation- 1008_Randgold_Loulo UG review Sched optimisation_stage 1_131114_v02, Kenmore Mine Consulting, November 2013.
Kleynhans, J. and Abdoulaye, N. 2013. Resource Report, Loulo, Mali. Randgold Resources Limited. Internal Company Report. Dated 31st December 2013.
Kleynhans, J., 2013. Resource Report, Gounkoto, Mali. Randgold Resources Limited. Internal Company Report. Dated 31st December 2013.
Loulo Annual Closure Cost Assessment 2017
Loulo Closure Liability 2017
Loulo Gold Mine Tailings assessment – Change order 04, Report11-1900-1049 (CO4), Golder Associates, Sudbury, Ontario, Canada, March 2014.
Loulo Gold Mine Yalea and Gara MRMM, Dempers and Seymour Pty Ltd, Perth, Australia, February 2015.
Loulo Incident Register 2018 Update
Loulo Logging and Mapping Review, Dempers and Seymour Pty Ltd, Perth, Australia, May 2014.
Loulo Map 3D Life of Mine Stress Modelling, Dempers and Seymour Pty Ltd, Perth, Australia, December 2014
Loulo Mining Complex: Hydrogeological review and water management optimisation - Stage 1, Artois Consulting, December 2015.
Loulo Open Pit Ore Reserve Statement 2014, Compiled by Shaun Gillespie, Randgold Resources Ltd, 31 December 2017.
Loulo Optimisation Geotech Closeout_20140702, Dempers and Seymour Pty Ltd, Perth, Australia, July 2013.
Loulo Paste Fill optimisation- December 2014 –V03 (Power point), Gabriel Kone, Loulo, Randgold Resources Ltd, 31st January 2015.
Loulo UG Geotechnical review – Gara and Yalea, Dempers and Seymour Pty Ltd, Perth, Australia, May 2013.
| | |
| 18th September 2018 | | Page 312 |
| | | | |
| | Loulo-Gounkoto Gold Mine Complex NI 43-101 Technical Report | | |
Loulo Underground – Drill and Blast Review, Blast Management International Pty Ltd, Australia, June 2014.
Loulo Ventilation Review (Part A) – VUMA Modelling Review, OZvent Pty Ltd, Brisbane, Australia, August 2014.
Loulo Water Balance Jan 2018.
Loulou EMS Audit report Feb 2017.
NQA audit full EMS Report Dec 2017.
On site Tailings assessment, Report11-1900-1049 (4000) R1, Golder Associates, Sudbury, Ontario, Canada, June 2014.
Open Pit Slope Design for the Baboto Pits, MineNet, April 2017.
RAP Audit baseline April 2016.
Report on heat flow modelling of Gara based on increased tonnage, Boet Van Der Vyver, Loulo, Randgold Resources Ltd, September 2014.
Report on heat flow modelling of Yalea based on 135 kt, Boet Van Der Vyver, Loulo, Randgold Resources Ltd, October 2014.
Report on heat flow models of both Gara and Yalea, Boet Van Der Vyver, Loulo, Randgold Resources Ltd, June 2014.
SRK 2009, IndependentNI43-101 Technical Report on the Loulo Gold Mine, Randgold Resources, Mali, Project No 399377, SRK Consulting, Illovo, South Africa, September 2009.
Stope barricade design. Plan, elevation and details, Project No11-1900-1049, Drawing No 1301, Golder Associates, Sudbury, Ontario, Canada, 18 July 2014.
Yalea Crusher & CD Model Report, Dempers and Seymour Pty Ltd, Perth, Australia, January 2015.
Yalea South Upper Geotechnical Review -, Dempers and Seymour Pty Ltd, Perth, Australia, March 2015.
Yalea stoping geometry and backfill strength report, Dempers and Seymour Pty Ltd, Perth, Australia, November 2014.
Yalea stoping geometry and backfill strength report, Dempers and Seymour Pty Ltd, Perth, Australia, November 2014.
| | |
| 18th September 2018 | | Page 313 |
| | | | |
| | Loulo-Gounkoto Gold Mine Complex NI 43-101 Technical Report | | |
| 28 | Date and Signature Page |
This report titled “Technical Report on the Loulo-Gounkoto Gold Mine Complex, Mali”, effective 31st December 2017 and dated 18th September 2018, was prepared and signed by the following authors:
| | |
| | (Signed & Sealed) “Rodney B. Quick” |
| |
Dated at London, UK | | Rodney B. Quick MSc, Pr. Sci.Nat, |
18thSeptember 2018 | | Group General Manager of Evaluations |
| | Randgold Resources Ltd. |
| |
| | (Signed & Sealed) “Simon P. Bottoms” |
| |
Dated at London, UK | | Simon P. Bottoms, CGeol, MGeol, FGS, |
18thSeptember 2018 | | MAusIMM |
| | Group Mineral Resource Manager |
| | Randgold Resources Ltd. |
| |
| �� | (Signed & Sealed) “Richard Quarmby” |
| |
Dated at London, UK | | Richard Quarmby, BSc, Pr Eng, C Eng, |
| | MSAIChE, MIoMMM, MBA |
18thSeptember 2018 | | Group Metallurgist |
| | Randgold Resources Ltd. |
| |
| | (Signed & Sealed) “Derek Holm” |
| |
Dated at Perth, Australia | | Derek Holm, BSc FSAIMM, |
18thSeptember 2018 | | Senior Mining Engineer |
| | Roscoe Postle Associates |
| |
| | (Signed & Sealed) “Graham E. Trusler” |
| |
Dated at Johannesburg, SA | | Graham E. Trusler, MSc, Pr Eng, MIChE, |
| | MSAIChE |
18thSeptember 2018 | | Chief Executive Officer |
| | Digby Wells and Associates Pty Ltd. |
| | |
| 18th September 2018 | | Page 314 |
| | | | |
| | Loulo-Gounkoto Gold Mine Complex NI 43-101 Technical Report | | |
| 29 | Certificate of Qualified Persons |
| | 29.1 | Simon P. Bottoms, CGeol, MGeol, FGS, MAusIMM |
I, Simon P. Bottoms, CGeol, MGeol, FGS, MAusIMM as, an author of this report entitled “Technical Report on the Loulo-Gounkoto Gold Mine Complex, Mali”, effective 31st December 2017 and dated 18th September 2018, do hereby certify that:
| | 1. | I am the Group Mineral Resource Manager and an Officer of Randgold Resources Limited 3rd Floor, Unity Chambers, 28 Halkett Street, St. Helier, Jersey, Channel Islands. |
| | 2. | I graduated with a Masters of Geology degree from the University of Southampton, United Kingdom in 2009. |
| | 3. | I am a Chartered Geologist registered (1023769) with the Geological Society of London. I am also a current Member of AusIMM. I have worked as a geologist continuously for nine years since my graduation from University. |
| | 4. | I have read the definition of “Qualified Person” set out in National Instrument43-101 (NI43-101) and certify that by reason of my education, affiliation with a professional association (as defined in NI43-101) and past relevant work experience, I fulfil the requirements to be a “Qualified Person” for the purposes of NI43-101. |
| | 5. | I have been involved at Loulo-Gounkoto since 2012 and regularly visit the site. I most recently visited Loulo-Gounkoto from 17th to 24thAugust 2018. |
| | 6. | I am responsible for the preparation of sections 2 to 12, 14, and 23 to 24 of this Technical Report. I share responsibility with myco-authors for sections 1, 25, 26, and 27. |
| | 7. | I am not independent of the issuer applying the test set out in Section 1.5 of NI43-101 since I am a full time employee at Randgold Resources Limited. |
| | 8. | I have had prior involvement with the property that is the subject of the Technical Report. I am a full time employee at Randgold Resources Limited and I have been involved with Loulo-Gounkoto since 2012. |
| | 9. | I have read NI43-101 and Form43-101F1 and the Technical Report has been prepared in compliance with that instrument and form. |
| | 10. | As of the date of this certificate, to the best of my knowledge, information, and belief, the sections 1 to 4, 6 to 12, 14 and 23 to 27 of this Technical Report contains all scientific and technical information that is required to be disclosed to make the Technical Report not misleading. |
Dated this 18th day of September 2018.
(Signed & Sealed) “Simon P. Bottoms”
Simon P. Bottoms, CGeol, MGeol, FGS, MAusIMM
| | |
| 18th September 2018 | | Page 315 |
| | | | |
| | Loulo-Gounkoto Gold Mine Complex NI 43-101 Technical Report | | |
| | 29.2 | Rodney B. Quick MSc, Pr. Sci.Nat |
I, Rodney B. Quick MSc, Pr. Sci.Nat, as an author of this report entitled “Technical Report on the Loulo-Gounkoto Gold Mine Complex, Mali”, effective 31st December 2017 and dated 18th September 2018, do hereby certify that:
| | 1. | I am the Group General Manager of Evaluations and an Officer of Randgold Resources Limited 3rd Floor, Unity Chambers, 28 Halkett Street, St. Helier, Jersey, Channel Islands. |
| | 2. | I graduated with a Bachelor of Science Honours degree in Geology from the University of Natal Durban, South Africa in 1993, and with a Master of Science degree in Geology from the Leicester University, United Kingdom in 2000. |
| | 3. | I am a Professional Natural Scientist registered (400014/05) with the South African Council for Natural Scientific Professions (SACNASP). I am a current Member of SACNASP. I have worked as a geologist continuously 24 years since my graduation from University. |
| | 4. | I have read the definition of “Qualified Person” set out in National Instrument43-101 (NI43-101) and certify that by reason of my education, affiliation with a professional association (as defined in NI43-101) and past relevant work experience, I fulfil the requirements to be a “Qualified Person” for the purposes of NI43-101. |
| | 5. | I have been involved at Loulo-Gounkoto since 2000 and regularly visit the sit e. I most recently visited Loulo-Gounkoto from 30thJuly to 3rdAugust 2018. |
| | 6. | I am responsible for the preparation of sections 19 and 22 of this Technical Report. I share responsibility with myco-authors for sections 1, 21, 25, 26, and 27. |
| | 7. | I am not independent of the issuer applying the test set out in Section 1.5 of NI43-101 since I am a full time employee at Randgold Resources Limited. |
| | 8. | I have had prior involvement with the property that is the subject of the Technical Report. I am a full time employee at Randgold Resources Limited and I have been involved with Loulo-Gounkoto since 2000. |
| | 9. | I have read NI43-101 and Form43-101F1 and the Technical Report has been prepared in compliance with that instrument and form. |
| | 10. | As of the date of this certificate, to the best of my knowledge, information, and belief, the sections 1, 2, 3, 19, 21, 22, 24, 25, 26 and 27 of this Technical Report contains all scientific and technical information that is required to be disclosed to make the Technical Report not misleading. |
Dated this 18th day of September 2018.
(Signed & Sealed) “Rodney B. Quick”
Rodney B. Quick, MSc, Pr. Sci.Nat
| | |
| 18th September 2018 | | Page 316 |
| | | | |
| | Loulo-Gounkoto Gold Mine Complex NI 43-101 Technical Report | | |
| | 29.3 | Richard Quarmby, BSc, Pr Eng, C Eng, MSAIChE, MIoMMM, MBA |
I, Richard Quarmby, BSc, Pr Eng, C Eng, MSAIChE, MIoMMM, MBA, as an author of this report entitled “Technical Report on the Loulo-Gounkoto Gold Mine Complex, Mali”, effective 31st December 2017 and dated 18th September 2018, do hereby certify that:
| | 1. | I am the Group Metallurgist—Projects and an Officer of Randgold Resources Limited 3rd Floor, Unity Chambers, 28 Halkett Street, St. Helier, Jersey, Channel Islands. |
| | 2. | I graduated with a BSc chemical engineering degree from the University of the Witwatersrand in 1985 and earned a Master of Business Administration degree in 2005. |
| | 3. | I have been registered, no. 910237 as a Professional Engineer (Pr Eng) with the Engineering Council of South Africa since 1991 and in 2010 was accepted to the UK equivalent institution i.e. Chartered Engineer with the Engineering Council UK (C Eng), no. 580441. Further, I have been a Member, no. 1361, of the South African Institution of Chemical Engineers (SAIChE) since1989, and am also a registered Member, no. 454225, of the Institute of Materials, Minerals and Mining (IoMMM) UK. I have worked as an engineer continuously since my graduation from University in 1985. |
| | 4. | I have read the definition of “Qualified Person” set out in National Instrument43-101 (NI43-101) and certify that by reason of my education, affiliation with a professional association (as defined in NI43-101) and past relevant work experience, I fulfil the requirements to be a “Qualified Person” for the purposes of NI43-101. |
| | 5. | I have been involved at Loulo-Gounkoto since 2016 and regularly visit the site. I most recently visited Loulo-Gounkoto from 13thto 16thJune 2018. |
| | 6. | I am responsible for the preparation of sections 13, 17 and 18 of this Technical Report. I share responsibility with myco-authors for sections 1, 21, 25, 26, and 27. |
| | 7. | I am not independent of the issuer applying the test set out in Section 1.5 of NI43-101 since I am a full time employee at Randgold Resources Limited. |
| | 8. | I have had prior involvement with the property that is the subject of the Technical Report. I am a full time employee at Randgold Resources Limited and I have been involved with Loulo-Gounkoto since 2016. |
| | 9. | I have read NI43-101 and Form43-101F1 and the Technical Report has been prepared in compliance with that instrument and form. |
| | 10. | As of the date of this certificate, to the best of my knowledge, information, and belief, the sections 13, 17 and 18 of this Technical Report contains all scientific and technical information that is required to be disclosed to make the Technical Report not misleading. |
Dated this 18th day of September 2018.
(Signed & Sealed) “Richard Quarmby”
Richard Quarmby, BSc, Pr Eng, C Eng, MSAIChE, MIoMMM, MBA
| | |
| 18th September 2018 | | Page 317 |
| | | | |
| | Loulo-Gounkoto Gold Mine Complex NI 43-101 Technical Report | | |
| | 29.4 | Derek Holm, BSc, FSAIMM |
I Derek Holm, BSc, FSAIMM, as an author of this report entitled “Technical Report on the Loulo-Gounkoto Gold Mine Complex, Mali”, effective 31st December 2017 and dated 18th September 2018, do hereby certify that:
| | 1. | I am a Senior Mining Engineer with Roscoe Postle Associates UK (RPA UK), of London, UK. |
| | 2. | I graduated from University of Witwatersrand in 2000 with a BSc in Mining Engineering. |
| | 3. | I am a Member of the South African Institute of Mining and Metallurgy (SAIMM) (no. 702981). I have worked as an engineer continuously since my graduation from University in 2000. |
| | 4. | I have read the definition of “Qualified Person” set out in National Instrument43-101 (NI43-101) and certify that by reason of my education, affiliation with a professional association (as defined in NI43-101) and past relevant work experience, I fulfil the requirements to be a “Qualified Person” for the purposes of NI43-101. I have over 18 years of experience within the mining industry in technical, management, and consulting positions. |
| | 5. | I visited Loulo-Gounkoto 12thto 14thSeptember 2018. |
| | 6. | I am responsible for the preparation of sections 15 and 16 of this Technical Report. I share responsibility with myco-authors for sections 1, 25, 26, and 27 |
| | 7. | I am independent of Randgold Resources Limited and related companies applying the test set out in Section 1.5 of NI43-101. |
| | 8. | I have had no prior involvement with the property that is the subject of the Technical Report. |
| | 9. | I have read NI43-101 and Form43-101F1 and the Technical Report has been prepared in compliance with that instrument and form. |
| | 10. | As of the effective date of this report, to the best of my knowledge, information, and belief, sections 15, 16 and 18, and parts of sections 1, 3, 25, 26, and 27 of this Technical Report for which I am responsible contains all scientific and technical information that is required to be disclosed to make this Technical Report not misleading. |
Dated this 18th day of September 2018.
(Signed & Sealed) “Derek Holm”
Derek Holm, BSc, FSAIMM
| | |
| 18th September 2018 | | Page 318 |
| | | | |
| | Loulo-Gounkoto Gold Mine Complex NI 43-101 Technical Report | | |
| | 29.5 | Graham E. Trusler, MSc Pr Eng, MIChE, MSAIChE |
I, Graham E. Trusler, Pr Eng, MIChE, MSAIChE, as an author of this report entitled “Technical Report on the Loulo-Gounkoto Gold Mine Complex, Mali”, effective 31st December 2017 and dated 18th September 2018, do hereby certify that:
| | 1. | I am the CEO of Digby Wells and Associates Pty Ltd., of Johannesburg, South Africa. |
| | 2. | I graduated with a Master of Chemical Engineering degree from the University of KwaZulu-Natal, South Africa, in 1988. |
| | 3. | I have been registered as a Professional Engineer (Pr Eng) (no. 920088) with the Engineering Council of South Africa since 1992. Further, I have been a Member of the South African Institution of Chemical Engineers (SAIChE) since1994. I am also registered as a Chartered Chemical Engineer with the Institution of Chemical Engineers, is a member of the Water Institute of South Africa and a lifetime member of the American Society of Mining and Reclamation. I have worked as an engineer continuously from 1990. |
| | 4. | I have read the definition of “Qualified Person” set out in National Instrument43-101 (NI43-101) and certify that by reason of my education, affiliation with a professional association (as defined in NI43-101) and past relevant work experience, I fulfil the requirements to be a “Qualified Person” for the purposes of NI43-101. I have over 30 years of experience within the mining industry in metallurgical production, research, and environmental issues. |
| | 5. | I have been involved at Loulo-Gounkoto since 1998 and regularly visit the site. I most recently visited Loulo-Gounkoto from 18thto 20thApril 2018. |
| | 6. | I am responsible for the preparation of section 20 of this Technical Report. I share responsibility with myco-authors for sections 1, 25, 26, and 27. |
| | 7. | I am independent of Randgold Resources Limited and related companies applying the test set out in Section 1.5 of NI43-101. |
| | 8. | I have had prior involvement with the property that is the subject of the Technical Report. |
| | 9. | I have read NI43-101 and Form43-101F1 and the Technical Report has been prepared in compliance with that instrument and form. |
| | 10. | As of the effective date of this report, to the best of my knowledge, information, and belief, sections 20, and parts of sections 1, 2, 3, 25, 26, and 27 of this Technical Report for which I am responsible contains all scientific and technical information that is required to be disclosed to make this Technical Report not misleading. |
Dated this 18th day of September 2018.
(Signed & Sealed) “Graham E. Trusler”
Graham E. Trusler, MSc, Pr Eng, MIChE, MSAIChE
| | |
| 18th September 2018 | | Page 319 |
| | | | |
| | Loulo-Gounkoto Gold Mine Complex NI 43-101 Technical Report | | |
30 Appendix
30.1 Appendix 1 – JORC 2012 Edition – Table 1
The following table provides a summary of important assessment and reporting criteria used at the Loulo-Gounkoto Gold Complex for the reporting of Mineral Resources and Ore Reserves in accordance with the Table 1 checklist in The Australasian Code for the Reporting of Exploration Results, Mineral Resources and Ore Reserves (The JORC Code, 2012 Edition). Criteria in each section apply to all preceding and succeeding sections.
Section 1. Sampling Techniques and Data
JORC (2012) Code Checklist of Assessment and Reporting Criteria
| | |
Criteria | | Commentary |
| Sampling techniques | | ● Diamond drill (DD) core samples are taken within geological units and are normally between 0.8 m and 1.20 m long. Diamond drilling has been primarily undertaken by Boart Longyear Canada. The core is photographed before being halved with a diamond saw. Half of the core is submitted for sampling and the other half is stored for future reference. |
| | ● Reverse circulation (RC) samples are sampled on one metre intervals. The RC samples are ether cone split or riffle split on the rig. RC drilling is completed by Boart Longyear Canada, except for some limited Gounkoto grade control drilling that is completed by DCS Mali. Rotary air blast (RAB) drilling has also been undertaken previously, but is only used for geological modelling and not for resource estimation |
| | ● Outcrop, trench, and soil samples are also used for early stage exploration. Trench data with exposure cuts into saprolite is used for estimation and the sampling technique is the same as RC drilling. |
| | ● A February 2015 Mineral Resource audit by QG Consulting (QG) deemed data collection at the Project follows industry standard practices |
| Drilling techniques | | ● Diamond drilling is utilised for exploration and resource development. PQ rods (85.0 mm) and HQ rods (63.3 mm) are used in the weathered saprolite (oxides) with NQ (47.6 mm) rods are used in the unweathered rock. Diamond core is stored in core trays that are marked up and logged before transfer to the core storage. |
| | ● Reverse circulation is no longer used at Yalea and Gara underground operations’ but is still used at Gounkoto and other open pit satellites. |
| | ● RAB drilling has been used for first pass exploration and sterilisation, but it not used in resource estimation |
| | ● All boreholes have been down-hole surveyed using Reflex EZ-Trac instrument every 25 m depth which measures the dip and azimuth. A reflex gyro instrument is used in any zones with magnetic interference. |
| | |
| 18th September 2018 | | Page 320 |
| | | | |
| | Loulo-Gounkoto Gold Mine Complex NI 43-101 Technical Report | | |
| | |
Criteria | | Commentary |
| Drill sample recovery | | ● Core recovery is measured in the field and during detailed logging. |
| | ● RC sample recovery is measured by weighing the total dried weight of sample collected over each one metre interval and comparing this to the theoretical expected weight for the lithological unit and weathering type. |
| | ● Historical studies at Gounkoto have confirmed there to be no significant grade bias through sample recovery rates. |
| Logging | | ● Diamond drill core is logged geologically including weathering, mineralisation, alteration, structure, lithology, and redox. The paper logs are transcribed into the central database using a digital data entry template after verification. |
| | ● Geotechnical logging is only performed on holes specifically drilled for geotechnical assessment. |
| | ● RC chip samples are logged in the same fashion as the drill core, however the samples are logged on one metre intervals due to the sampling method. |
| Sub-sampling techniques and sample preparation | | ● Half core is used whenever possible. Quarter core is only used when there is a requirement for further assays or other analysis types need to be performed on the same interval. Drill core length for each assay is determined by the geology and alteration. |
| | ● RC samples are collected and passed through two riffle splitters to create 2 kg to 3 kg samples. Some minor grade control drilling in Gounkoto uses an on rig cone splitter. Any wet samples are dried before being split. |
| Quality of assay data and laboratory tests - Loulo | | ● All samples are analysed by SGS Loulo Laboratory, and onsite laboratory managed and self-certified by SGS laboratory personnel. All samples are analysed using fire assay (FA550) with submitted sample weights above 2 kg and 150 g for Certified Reference Materials (CRM). |
| | ● CRM standards, blanks, field duplicates and umpire assay are used for QA/QC analysis. The QA/QC sample ratio during the reporting period showed CRM sample insertion at 1 in 18 (5.6%), blank sample insertion at 1 in 18 (5.6%) and field duplicate sample insertion at 1 in 36 (2.8%). |
| | ● During 2017, 370 sample pulps duplicates from Loulo along with CRMs were sent from SGS Loulo to AMTEL laboratory in Canada, for umpire analysis. The umpire results indicate that there is no material bias in the primary laboratory (SGS Loulo). |
| | ● Coarse blank samples are composed of a barren sandstone material sourced 20 km from Loulo, which is considered to be a representative matrix of the Loulo host rock lithological units. |
| | ● During 2017, 730 blank samples were submitted where 100% assayed were within five times the detection limit. Overall the performance of the blanks was deemed as good. |
| | ● Randgold use 12 different CRM standards. During 2017 a total of 731 CRM standards were submitted to SGS Loulo. The CRMS indicated that there was no significant bias at SGS Loulo. |
| | ● Overall the results returned are acceptable and show no major areas of concern. |
| | ● The 2015 external audit by QG concluded that the sample preparation and assay facility at SGS Loulo follows industry standard methods with a good emphasis on sample tracking and QA/QC. |
| | |
| 18th September 2018 | | Page 321 |
| | | | |
| | Loulo-Gounkoto Gold Mine Complex NI 43-101 Technical Report | | |
| | |
Criteria | | Commentary |
Quality of assay data and laboratory tests - Gounkoto | | ● All samples are analysed for the Gounkoto Gold Mine by SGS Loulo Laboratory which is managed and self-certified by SGS laboratory personnel. All samples are analysed using fire assay (FA550) with submitted sample weights above 2 kg and 150 g for CRMs. |
| | ● At Gounkoto Gold Mine, CRM standards, blanks, field duplicates and umpire assay are used for QA/QC analysis. The QA/QC sample ratio during the reporting period showed CRM sample insertion at 1 in 18 (5.6%), blank sample insertion at 1 in 18 (5.6%) and field duplicate sample insertion at 1 in 36 (2.8%). |
| | ● During 2017, 261 sample pulps duplicates from Gounkoto along with CRMs were sent from SGS Loulo to AMTEL laboratory in Canada, for umpire analysis. The umpire results indicate that there is no material bias in the primary laboratory (SGS Loulo). |
| | ● Coarse Blank samples are composed of a barren sandstone material, which is considered to be a representative matrix to the Gounkoto host rock lithological units. |
| | ● During 2017 2,170 blank samples were submitted where 99.95% assayed within 10% of acceptable limits. Overall the performance of the blanks was deemed as good. |
| | ● During 2017 a total of 2172 CRM standards of 10 different types were submitted to SGS Loulo. Overall of CRM improved significantly in 2017 due to the introduction of CRMs sourced from OREAS Australia, as CRMs did show very good homogeneity. |
| | ● Overall the results returned are acceptable and show no major areas of concern. |
| | ● The 2015 external audit by QG concluded that the sample preparation and assay facility at SGS Loulo follows industry standard methods with a good emphasis on sample tracking and QA/QC. |
Verification of sampling and assaying | | ● Twin drilling at Loulo (Yalea and Gara) was utilised as part of the 2002 feasibility studies prior to construction of UG mine development. These comparisons have shown that although there can be variations in grade, as expected, the broad intercepts and relative grade of the intersections are comparable across the twins. |
| | ● Twin drilling at Gounkoto have been utilised to compare seven separate drill holes across the MZ and HW. These comparisons have shown that there can be significant variations in grade, as expected, from the local grade variability in Gounkoto MZ1, MZ2 and MZ3. However, the broad intercepts and relative grade of the intersections are generally comparable across the twins except in the FW finger zone where there are dramatic variations in geometry within a very close spacing (less than 5 m). |
| | ● Twin drilling at all other mineral resources is included as part of the resource definition drilling. |
| | ● All forms of Project data are stored secured in industry standard Maxwell Datashed SQL database for optimal validation through constraints, library tables, triggers, and stored procedures. Any data that fails validation is rejected and stored in a buffer table awaiting correction. |
| | ● A custom MS Access front end application has been designed for data entry, reporting, and viewing which connects via an ODBC connection to the SQL database. Data which is inserted utilises the data validation procedures from the SQL database. |
| | ● Any site databases link back to the main database for information retrieval via ODBC |
| | ● Assay data is imported directly from laboratory assay certificates and validated. Assay data are stored in a normalised format and multiple assays are stored for each sample. Ranking of different assay formats is performed automatically so that one assay result is displayed in the master assay table. Any change to the rankings held within a lookup table must be approved by the onsite Database Manager. |
| | |
| 18th September 2018 | | Page 322 |
| | | | |
| | Loulo-Gounkoto Gold Mine Complex NI 43-101 Technical Report | | |
| | |
Criteria | | Commentary |
Location of data points | | ● Grade control drill hole collar positions are marked out by surveyors and all drill holes collar positions are surveyed using DGPS on surface. |
| | ● Underground drill collars, as well as back sights and foresights, are surveyed using total station underground survey instruments, and marked on the drift walls, by the Loulo Mine Surveyors. |
| | ● All drill holes are down-hole surveyed using a multi shot Reflex EZ-Trac or a conventional Gyro surveying tool which takes measurements of azimuth and dip every 25 m. Some drill holes for the 2002 underground feasibility study were measured using a Gyro every 5 m. |
| | ● Loulo-Gounkoto uses UTM coordinates WGS84 Zone 29N. |
Data spacing and distribution - Loulo | | ● The data spacing for resource classification is constrained for each deposit and is combined with other classification specifications such as minimum samples used to estimate and style of mineralisation. |
| | ● For Yalea in general, Measured material requires grade control (GC) infill drilling at a range of spacing of 25 m to 30 m or less, Indicated material must have a minimum drill spacing of 70 m and Inferred material has a drilling density generally greater than 70 m to 120 m. |
| | ● For Gara in general, Measured Mineral Resources require GC infill drilling at a range of spacing of less than 30 m, Indicated resources must have a minimum of between 30 m to 80 m spacing and Inferred resources has a drilling density of 80 m to 120 m. |
| | ● For Baboto in general, Measured material requires GC infill drilling at a range of spacing of 5 m by 10 m, Indicated and Inferred material must have a minimum drill hole spacing of 80 m spacing although with other classification criteria changing depending on the classification. |
| | ● Sample compositing is applied, prior to top cutting, for samples that are used in the resource estimation. This is currently on a 2 m composite as this is a multiple of the mode sample length for Yalea and Gara. The Satellite deposits including Baboto use a 1 m composite which is the mode sample length. |
Data spacing and distribution - Gounkoto | | ● The data spacing for resource classification is clearly constrained for the deposit. Amongst other classification specifications, in general, Measured material requires a minimum of GC infill drilling at a spacing of 12.5 m x 12.5 m with tighter spacing of 6m both along strike and across dip in the FW finger zones. |
| | ● Indicated material within the Gounkoto super pit must have a minimum of drilling with at least 30 m spacing and the UG Indicated material has a spacing of approximately 40 m by 30 m due to restrictions in drill locations. |
| | ● Inferred material has a drilling spacing between 50 m and 100 m. |
| | ● Sample compositing is applied, prior to top cutting, for samples that are used in the resource estimation. This is currently on a 1.0 or 2.0 m composite as this is a multiple of the modal sample length. |
Orientation of data in relation to geological | | ● At Yalea, the majority of surface drilling is from the East dipping at a bearing of 60° toward the West. |
| | ● At Gara the orientation of drilling is much more variable in response to the folded geometry of the mineralised units. Exploration holes are drilled from the east and west, dipping at around 60oto ensure that drilling is perpendicular to mineralisation. |
| | ● Underground orientations depend on available drilling positions. |
| | |
| 18th September 2018 | | Page 323 |
| | | | |
| | Loulo-Gounkoto Gold Mine Complex NI 43-101 Technical Report | | |
| | |
Criteria | | Commentary |
| structure - Loulo | | ● All surface holes are generally drilled perpendicular to the strike of the mineralisation on the hanging wall / down dip side of the deposit. |
| Orientation of data inrelation to geological structure - Gounkoto | | ● Most exploration holes are drilled from the east, dipping to the west at around 60oto ensure that drilling is perpendicular to mineralisation e.g. MZ1. |
| | ● Grade control drilling has different orientations depending on the ore zone that is being intercepted. Footwall finger zones of MZ1 are drilled from the west to ensure that the high-grade ‘finger’ zones are intersected across their dip. MZ2 and MZ3 are drilled from the east |
| Sample security | | ● Samples on the rigs are bagged and tied with custom Loulo or Gounkoto tags as well as being weighed and documented. The samples are stored in a secure facility. Samples are analysed at SGS Loulo laboratory which is on the Loulo Permit. When samples are required to be prepared/analysed at other laboratoriesoff-site, SGS provide secure transportation for the samples. |
| Audits or reviews | | ● An external audit on the mineral resource and input data procedures was completed in February 2015 by QG. This report stated that sampling procedures for RC and diamond drilling were considered to be good practice. |
| | ● Some minor improvements for the collection of bulk density measurements (use of recording balance and certified weights) were suggested and were implemented during 2016. |
| | ● Outcomes of the external audits have been acted upon where relevant. |
| | |
| 18th September 2018 | | Page 324 |
| | | | |
| | Loulo-Gounkoto Gold Mine Complex NI 43-101 Technical Report | | |
Section 2. Reporting of Exploration Results
(Criteria listed in the preceding section also apply to this section.)
| | |
Criteria | | |
Mineral tenement and land tenure status - Loulo | | ● The Loulo deposits are located 22.5 km north of Randgold Resource’s Gounkoto Gold Mine, within the Loulo Exploitation Permit (Loulo Permit). This Permit is in Western Mali approximately 350 km west of Bamako and 220 km south of Kayes. The deposit lies within the Loulo Permit which is held by Société des Mines de Loulo SA of which there is an 80/20 split between Randgold Resources and the State of Mali. |
| | ● The Loulo Establishment Convention sets out under the 1991 Mining Code that a six percent royalty payable on revenues along with a corporate tax rate on profits of 30% with a minimum of 0.75% on gross revenues is due to the State. |
Mineral tenement and land tenure status - Gounkoto | | ● The Gounkoto deposit is located 22.5 km south of Randgold Resource’s Loulo Gold Mine. This Permit is in Western Mali approximately 350 km west of Bamako and 220 km south of Kayes. The deposit lies within the Gounkoto Exploitation Permit (Gounkoto Permit) which is held by Société des Mines de Gounkoto SA which is held 80% by Randgold and 20% by the sate of Mali. The Gounkoto Permit incorporates Faraba and is located to the south of the current Loulo Permit It is valid for a period of 30 years from August 2012. |
| | ● The Loulo Establishment Convention sets out under the 1991 Mining Code that a six percent royalty payable on revenues along with a corporate tax rate on profits of 30% with a minimum of 0.75% on gross revenues is due to the State. |
Exploration done by other parties | | ● The Gara deposit (previously called Loulo 0 deposit) was discovered in 1981 by the Syndicat Or joint venture. |
| | ● In 1992, BHP Minerals Mali (BHP) entered into an agreement with SOMILO (Société des Mines de Loulo), the joint venture wholly owned by the Republic of Mali and SOREM (a 100% subsidiary of BRGM). BHP undertook exploration mostly focused on Gara. |
| | ● BHP Minerals Mali delineated a Mineral Resource on the Gara deposit prior to 1996. The Mineral resource contained 3.48 Mt at 4.43 g/t Au of Open Pit Indicated material, 0.87 Mt at 9.7 g/t of underground Indicated material and 1.0 Mt at 10.0 g/t Inferred material. An additional 1.42 Mt at 4.63 g/t of Inferred material was identified at outlying satellite deposits |
| | ● Randgold acquired BHP Minerals Mali in 1996 and changed its name to Randgold Resources (Mali) Ltd. Following the discovery of the Yalea deposit a series of feasibility studies were undertaken. |
| | ● Gounkoto is a greenfields discovery by Randgold and thus has not had any other external parties working on it. |
Geology - Loulo | | ● Loulo is located within the Kedougou-Kenieba erosional inlier. The inlier is unconformably overlain by Upper Proterozoic sandstones towards the east and further south. The Kenieba inlier contains several significant gold deposits including Sadiola, Yalea, Segala, Tabakoto, and Gounkoto deposits in Mali, and Sabodala in Senegal. The Senegal-Mali shear marks a major break in the geology from shelf carbonates in the west to the sedimentary sequences of the Kofi formation in the east. This geological setting is the primary host of mines in Burkina Faso, Ghana, Mali, Niger, and Senegal. |
| | |
| 18th September 2018 | | Page 325 |
| | | | |
| | Loulo-Gounkoto Gold Mine Complex NI 43-101 Technical Report | | |
| | |
Criteria | | |
| | | ● At Yalea, the main mineralised body is a hosted by the Yalea Shear, where it is intercepted by the Yalea Structure. The Yalea Shear is a brittle-ductile, north-south striking, mineralised fault that transects the Yalea Structure, which is a complex, north to NNE striking shear zones. The Yalea mineralisation is predominantly hosted in hydrothermally brecciated argillaceous pink quartzites situated. A higher grade ‘Purple Patch’ zone is observed in a dilatational strain transfer zone formed as the western dip of the upper mineralised system steepens, forming hydraulic breccias. Economic levels of gold mineralisation are almost exclusively associated with paragenetically late sulphide veins, breccias and zones of massive sulphides. There is a strong correlation between sulphide intensity and gold mineralisation with the dominant sulphide phases consisting of pyrite (abundant), arsenopyrite and minor chalcopyrite. Yalea mineralisation, remains open at depth and to the south with potential for significant high-grade extensions. |
| | | ● Gara (previously known as Loulo 0) is hosted within an intensely tourmaline greywacke unit which outcrops on surface due to its high resistance to weathering. The geometry of the mineralisation is subjugated by the strike slip shearing on Senegal-Mali shear. This shearing has resulted in folding, fracturing, brecciation, and subsequent development of a quartz-carbonate vein stockworks within the brittle-ductile tourmaline altered greywacke forming what has been termed quartz tourmaline (QT) unit. On the deposit scale the upper limb of this fold dips has a westerly dip, whereas the lower limb dips east. The distribution of gold grade in long section reflects the varying degrees of fracturing, brecciation, and subsequent development of a quartz-carbonate vein stockworks from multiple generations of folding. Gold mineralisation is strata-bound and hosted predominantly within the quartz-tourmaline stockwork veins, which are enveloped within footwall greywackes and hanging wall sandstone. In the open pit area, the high-grade mineralisation is concentrated along the sub- horizontal fold hinge axes, whereas within the underground area, high-grade mineralisation plunges shallowly southward, parallel to the large scale open warp fold axis. The sulphide assemblages predominantly consist of disseminated auriferous pyrite with minor chalcopyrite, scheelite, and nickeliferous sulphides |
| | | ● Baboto is a shear hosted deposit situated along a north-south striking shear structure located approximately 14 km NNE from the Yalea deposit. Baboto is dominated by a thick sequence of metasediments and structural breccias. The main shear zones are vertical to steeply west dipping at Baboto South and sub vertical in Baboto Centre. Gold mineralisation is mainly associated with the finely disseminated pyrite occurring in the brittle-ductile shear breccias, which generally have a lensoidal shape defined by a series ofsub-parallelN-S shears that follow key lithological contacts. |
| | | ● Loulo 3 is located 4 km NNE of the Yalea mine. Loulo 3 consists of three mineralised zones: a NNW trending main zone (MZ1) which is situated on the Loulo 3 structure and is transected by the NNE striking main zone (MZ2), which is situated on the Yalea structure, and the third small sub parallel NW striking footwall zone. Mineralisation consists of a mixture of quartz and hematite veinlets hosted in a zone of silica-carbonate alteration within local tourmaline alteration in the south. The distribution of high-grade zones is controlled by the narrowing of the host stratigraphy package, which focusses strain and fluid flow, causing the hematite rich Yalea Structure to interact with the silica- carbonate Loulo 3 Structure particularly within MZ2. Gold bearing sulphides predominantly consist of pyrite and arsenopyrite. |
| | | ● Gara West is located 200 m west of the pit at Gara and is characterised by predominantly shear and breccia hosted mineralisation within a medium to coarse grained sandstone unit that is variably altered with tourmaline, chlorite, and silica-carbonate. The sandstone hosts four mineralised lodes striking NNE and dipping moderately westward. The gold mineralisation is strata bound as it has been preferentially |
| | |
| 18th September 2018 | | Page 326 |
| | | | |
| | Loulo-Gounkoto Gold Mine Complex NI 43-101 Technical Report | | |
| | |
Criteria | | |
| | | altered with tourmaline (and silica-albite), due to the increased porosity of the protolith, relative to the bounding limestone in both the hanging wall and footwall. |
| | ● Other minor satellite deposits are present within the Loulo Permit, these exhibit similar geological characteristics to the other major deposits outlined above. |
Geology – Gounkoto | | ● Like Loulo, the Permit is located within the Kedougou-Kenieba erosional inlier in a sheared Birimian Greenstone belt. |
| | ● Gounkoto is a large NNW trending shear zone, with a complex assemblage of ductile shear breccias, shears, and faults characterised by a stepped geometry, with wider zones of mineralisation generally seen on the NW trending structures and narrower zones on the north- south trending structures. This is believed to be related to dilation across these structures in a strong sinistral strain environment. The mineralisation is generally hosted in a siliceous ‘Rose Quartzite’ (QR) unit. The mineralisation is subdivided based on the structural and lithological characteristics. |
| | ● The Faraba deposit strikes NNW and is comprised of several zones of gold mineralisation hosted within and along the contacts of north- south striking, coarse grained, gritty sandstone units (lithic wackes) in a package of sheared argillaceous sediments. Lithologic layering (transposed bedding) dips steeply westward; however, the mineralised zones dip steeply to the east. The mineralisation terminates where the Faraba Structure meets the argillite units on either side of the sandstones. The resulting mineralisation occurs as numerous silica- carbonate and secondary iron oxide altered sub vertical panels with narrow east-west dimension, each containingsub-horizontal to shallow plunging zones of higher grade. Gold mineralisation is dominantly hosted by pyrite, with local magnetite, chalcopyrite, arsenopyrite and pyrrhotite. |
Drill hole Information | | ● Exploration at Loulo-Gounkoto is focussed on advancing both brownfields and greenfields targets. Brownfields exploration involves testing underground and open pit targets for high-grade mineralisation based on the structural model. |
| | ● No exploration results have been announced in this report. |
Data aggregation methods | | ● Individual exploration results are seldom reported for Loulo-Gounkoto. Where applicable any results are capped to the same grades as those used for the relevant geological domain defined within the existing Mineral Resource. |
Relationship between mineralisation widths and intercept lengths | | ● No exploration results are reported in this document, but drilling is orientated as perpendicular to orebody as possible. All drill results are reported with the true thickness along with down hole depths. |
| | |
| 18th September 2018 | | Page 327 |
| | | | |
| | Loulo-Gounkoto Gold Mine Complex NI 43-101 Technical Report | | |
| | |
Criteria | | |
Diagrams | | ● No exploration results are reported in this document. |
| Balanced reporting | | ● No exploration results are reported in this document. |
Othersubstantive exploration data | | ● Recent geophysical surveys have been integrated with updated geological maps to develop a tectonostratigraphy of the Kofi Series rocks at Loulo-Gounkoto, to improve the understanding of the controls to gold mineralisation and the regional geologic architecture. This Project- wide geologic framework is driving are-assessment of exploration work to date as part of greenfields target generation. |
| | ● The current exploration concept is proved to be effective with both the discovery of Gounkoto and the successful replenishment of depleted Mineral Resources and Ore Reserves. |
| Further work - Loulo | | ● The key aims of the 2018 Loulo exploration programme are to replace 2018 depletion and discover a stand-alone resource or significant satellite to increase Mineral Resources and LOM of Loulo-Gounkoto. |
| | ● Exploration is targeting the northern side of the deeper Yalea intersections panels, if there is a positive economic scope. Additionally, exploration will target the central conversion target and conceptual targets along strike of the Yalea Transfer Zone. |
| | ● Advanced grade control drilling of Yalea that commenced in 2017 is planned to continue into 2018 to target the Yalea Far South Extension. |
| | ● Loulo 3 drilling is designed to target plunge extensions of MZ2 shoot at near surface and at depth and to test the variability in the mineralisation thickness and grades across at a range of drill spacings. |
| Further work - Gounkoto | | ● As at Loulo, the exploration team is focused on the primary objective of replacing 2018 depletion and discovering additional resources to increase the inventory of Loulo-Gounkoto. |
| | ● During 2018, exploration will target a southerly plunging shoot of chlorite and subordinate haematite and tourmaline alteration which is known to contain higher grade mineralisation. |
| | ● Follow-up RC drilling is also planned to target a HW Hematite Structure, in the eastern portion of the Faraba open pit. |
| | |
| 18th September 2018 | | Page 328 |
| | | | |
| | Loulo-Gounkoto Gold Mine Complex NI 43-101 Technical Report | | |
Section 3. Estimation and Reporting of Mineral Resources
(Criteria listed in section 1, and where relevant in section 2, also apply to this section.)
| | |
Criteria | | Commentary |
Database integrity | | ● Data is stored in a Maxwell Datashed SQL database. Data must pass validation through constraints, library tables, triggers, and stored procedures prior to importing. Failed data is either rejected or stored in buffer tables awaiting correction. Assay data is imported directly from laboratory certificates and only fully trained and authorised network users can upload laboratory data. All other MS Access databases on site use ODBC link to retrieve information from the Datashed SQL database thus ensuring that they utilise all SQL database validation mechanisms. A full-time database administrator is employed at site to manage the database, who is overseen by a regional database manager, |
| | | ● Digital logging solutions for use by geologists to prevent transcription errors are planned for implementation in 2019. |
Site visits | | ● Qualified Person Simon Bottoms CGeol regularly visits the site. During 2017 six separate visits were made to the Loulo and Gounkoto Permits to review exploration programmes and results; Mineral Resource and grade control model updates; in addition to board reviews. |
Geological Interpretation | | ● Vertical sections are created using Vulcan or Gemcom geological modelling software at regular sections dependent on the drilling density. Sections are orientated depending on the strike of the mineralised deposit. Onsite geologists prepare their interpretations on printouts of the sections, using the drilling, lithological, alteration, mineralisation, structure measurement logging together with assay data from the surface and pit mapping, trenching, RC and diamond drill hole data. From these interpretations, strings representing the outlines of the orebody were digitised. The strings are connected to form a three-dimensional triangulation/wireframe using Vulcan or Gemcom geological 3D modelling software. |
| | | ● The Loulo deposits have beensub-divided into different geological domains. Yalea has been split into 7, Gara into 18, Baboto into 5, Gara West into 4 and Loulo 3 into 3 different geological domains. |
| | | ● Gounkoto has beensub-divided into nine geological domains. There are four main zones (MZ1, 2, 3, 4), two footwall zones (FWFE, FWNE), two hanging wall zones (HW) and P64. |
Dimensions - Loulo | | ● Yalea has a strike length of 2.7 km, a maximum defined vertical depth of 1,050 m and an average thickness of approximately 25 m The bottom of the open pit resource is around 150 m to 180 m below surface sea level and the underground resources are defined at present to around 830 m surface. |
| | ● Gara has a strike length of 2.8 km and has a maximum defined vertical depth of 920 m with a thickness between 5 m and 25 m The bottom of the defined open pit resource is around 180 m below surface and the underground resources are defined at present to around 1,010 m below surface. |
| | |
| 18th September 2018 | | Page 329 |
| | | | |
| | Loulo-Gounkoto Gold Mine Complex NI 43-101 Technical Report | | |
| | |
Criteria | | Commentary |
| | | ● Baboto South is 1.5 km along strike, a 320 m defined depth, and an average thickness of 10m. Baboto Centre is 700 m along strike, 140 m in depth, and has an average thickness of 15m. |
| | | ● Loulo 3 has a strike length of 1.8 km, ranges in thickness between 6 m and 12 m and is drilled to a vertical depth of 370 m. |
| | | ● Gara West consists of two mineralised zones (Western and Eastern). The western zone has a strike length of 480 m, and a thickness of 9 m. Similarly, the eastern zone is 440 m in strike, 6 m in thickness. Both zones have demonstrateddown-dip continuity of 130 m. |
| Dimensions - Gounkoto | | ● Gounkoto has an along strike length of 2.2 km, a vertical depth of 700 m, and a thickness between 2 m and 40 m. The bottom of theopen-pit resource is-275 m RL in the north and-190 m RL in the south. The underground resources are limited to 670 m depth in the south, 700 m in the centre, and 450 m depth at the northern end. |
| | | ● Faraba has an along strike length of 900m and a thickness of 5 m to 30m. It has a maximum vertical depth of 320 m but mineralisation is truncated in a curvilinear manner where the Faraba Structure meets the argillite units on either side of the sandstones. |
Estimation and modellingtechniquesLoulo | | ● Each deposit issub-domained separate zones based upon geology, mineralisation, alteration, and grade populations. |
| | ● Drill data is composited between the domain boundaries on two metre intervals at Yalea and Gala, and one metre intervals at Baboto, Loulo 3 and Gara West. A minimum of half the composite length is permitted at domain boundaries with residuals being discarded |
| | ● Comparison studies found very little difference between the total sample intervals and contained metals when comparing the raw and composited samples. Residual analysis is undertaken to ensure the discarded data does not affect the estimation. |
| | ● Multifactor data analysis is completed on each separate geological domain with the aim of identifying any grade outliers and choose an optimum top cap value for each of the orientation domains. The multifactor analysis tools applied include: Histogram plot, Log probability plot, Disintegration analysis, Mean and CV curve to look for the stability point and Metal at Risk (MAR). |
| | ● A 2015 external audit found these decisions to be supportable and appropriate. |
| | ● Exploratory Data Analysis (EDA) and variography is undertaken on the estimation data using Snowden Supervisor for determining the search strategies. Where insufficient data is available for variography on a domain, the results of a similar/parent domain are applied and rotations updated to match the domain. |
| | ● Quantitative Kriging Neighbourhood Analysis (QKNA) is undertaken to aid determining optimum block sizes, sample numbers, ellipsoid volumes, and discretisation |
| | ● Wireframes and block models are furthersub-domained into exploration domains, advanced grade control and grade control domains which allows for the use of different minimum block sizes and search ellipses. The block sizes used in the separate domains are intended to reflect the average drill hole spacing within the different scenarios. |
| | |
| 18th September 2018 | | Page 330 |
| | | | |
| | Loulo-Gounkoto Gold Mine Complex NI 43-101 Technical Report | | |
| | | | | | | | | | | | | | | | | | | | | | | | | | |
Criteria | | | | Commentary | | | | | | | | | | | | |
| | | ● Block model parameters are listed below. Block models are rotated around the Z axis to match the strike of the mineralisation. | |
| | | | | Block Detail (X/Y/Z) | | Yalea | | Gara | | Loulo 3 | | Baboto | | Gara West | | | | | | | | | | | | |
| | | | | Parent Block Size (m) | | 10 by 30 by 20 | | 7.5 by 30 by 15 | | 10 by 20 by 5 | | 5 by 15 by 10 | | 10 by 20 by 5 | | | | | | | | | | | | |
| | | | | GC Domain Block Size (m) | | 5 by 15 by 10 | | 5 by 20 by 10 | | 5 by 10 by 5 | | 3 by 6 by 2.5 | | - | | | | | | | | | | | | |
| | | | | Adv GC Domain Block Size (m) | | 8 by 24 by 16 | | - | | - | | - | | | | | | | | | | | | |
| | | | | Rotation (°) | | 90 | | 90 | | 100 | | 90 | | 90 | | | | | | | | | | | | |
| | | ● Volume comparisons between the block model and the ore wireframes have shown overall that an appropriate block size and sub-blocking procedure is in place. | |
| | | ● Estimation was completed using ordinary kriging (OK) and parent cell estimation; any blocks that were estimated using a negative kriging weight were reset to zero grade. | |
| | | ● For Baboto a restriction on high yield outliers was used to limit samples above 5 g/t Au in the exploration area of the Baboto South and 30 g/t Au in the Baboto South GC area in the third pass on the estimation. | |
| | | ● In Yalea, Geological domain 9006 a high yield limit is used with samples above 38.41 g/t Au not being used if outside of 45 m by 21 m by 6 m search ellipse. | |
| | | ● Block models are depleted against a 5 m Lidar DTM that was generated in 2010, along with annual Lidar scans of open pits and underground development stope scans. Grades are retained in the block model for reconciling to life of mine information | |
| | | ● Validation procedures are undertaken on the estimations. These include comparison of mean grades, visual comparisons to composite grades, slope of regression calculations, comparison to nearest neighbour analysis and Swath plots. As expected, Swath plots indicate increased smoothing outside of GC areas where exploration data is more limited. No conditional bias is observed. | |
Estimation and modelling techniques Gounkoto | | ● Gounkoto and Faraba were domained into separate zones along the strike of the deposit. ● Drill hole intervals that were within the domains were composited to 2.0 m at Gounkoto and 1.0 m at Faraba ● Multifactor data analysis is completed on each separate geological domain with the aim of identifying any grade outliers and choose an optimum top cap value for each of the orientation domains. Composited samples at Gounkoto were either capped between 1.73 g/t or subjected to high-grade constrains during estimation to restrict outliers. Faraba samples were capped to between 8.65 g/t Au and 20.79 g/t Au. | |
| | | ● Exploratory Data Analysis (EDA) and variography is undertaken on the estimation data using Snowden Supervisor for determining the search strategies. Where insufficient data is available for variography on a domain, the results of a similar/parent domain are applied and rotations updated to match the domain. | |
| | | ● Quantitative Kriging Neighbourhood Analysis (QKNA) is undertaken to aid determining optimum block sizes, sample numbers, ellipsoid volumes, and discretisation | |
| | | ● At Gounkoto the sub domaining of the main ore wireframes into exploration domains and grade control domains allows for the use of different minimum block sizes and search ellipses. The block sizes used in the two separate domains are intended to reflect the average drill hole spacing within both scenarios. | |
| | |
| 18th September 2018 | | Page 331 |
| | | | |
| | Loulo-Gounkoto Gold Mine Complex NI 43-101 Technical Report | | |
| | | | | | | | | | | | | | | | | | | | | | | | | | |
Criteria | | Commentary | |
| | | ● At Gounkoto a parent block size of 15 m by 30 m by 9.9 m (XYZ) was applied to exploration areas, advanced grade control areas used a 7.5 m by 15 m by 4.95 m (XYZ) block size and grade control zones used a 5 m by 10 m by 3.3 m block size. Soft boundaries are applied between the different data density areas that are situated within the same geological domain. ● At Faraba a single 20 m by 20 m by 10 m (XYZ) block size was sed. ● At Gounkoto, MZ1 structural domains apply a firm boundary which allows the west dipping and central west domains to use 40% of the search distance to use data from the east dipping domain, but hard bounds the east dipping domain from the other domains to prevent the higher grades in the west and central west dipping domains from being smeared into the lower grade east dipping population. ● Volume comparisons between the block model and the ore wireframes has shown that an appropriate block size andsub-blocking procedure is being used. ● Estimations were completed using ordinary kriging and parent cell estimation; any blocks that were estimated using a negative kriging weight were changed to the nearest anisotropic block grade. Domain MZ3HW, was estimated using inverse distance cubed as there was insufficient data to determine kriging parameters and no geologically comparative domain was identified ● Block models are depleted against a 5 m Lidar DTM that was generated in 2010, along with annual Lidar scans of open pits. Grades are retained in the block model for reconciling to life of mine information ● Validation procedures are undertaken on the estimations. These include comparison of mean grades, visual comparisons to composite grades, slope of regression calculations, comparison to nearest neighbour analysis and Swath plots. As expected, Swath plots indicate increased smoothing outside of GC areas where exploration data is more limited. No conditional bias is observed. | |
| | | | |
Moisture | | ● Tonnage estimates are completed on a dry basis. Both saprolite and transition samples are dried before SG determination. | |
Cut-off Parameters- Loulo | | | | | | | | | |
| | | | | | Deposit | | Yalea | | Gara | | Baboto | | Loulo 3 (2015 costs) | | Gara West (2015 Costs) | | | | | | | | |
| | | | | | Resource Type | | UG | | UG | | OP | | OP | | OP | | | | | | | | |
| | | | | | Mining Cost | | $/t milled | | 46.09 | | 43.63 | | 3.31 | | 3.72 | | 3.90 | | | | | | | | |
| | | | | | Mine Sustaining Capital | | $/t mined | | 7.67 | | 8.25 | | - | | - | | - | | | | | | | | |
| | | | | | Processing Cost | | $/t processed | | 17.80 | | 18.20 | | 15.20 | | 20.60 | | 20.60 | | | | | | | | |
| | | | | | General & Admin Cost | | $/t processed | | 7.80 | | 7.70 | | 7.80 | | 8.80 | | 8.80 | | | | | | | | |
| | | | | | Crushing & Hauling Cost | | $/t processed | | - | | - | | 3.63 | | - | | - | | | | | | | | |
| | | | | | Royalty | | % | | 6 | | 6 | | 6 | | 6 | | 6 | | | | | | | | |
| | | | | | Gold Selling Price | | $/oz | | 1500 | | 1500 | | 1500 | | 1500 | | 1500 | | | | | | | | |
| | | | | | Processing Recovery | | % | | 84.50 | | 94.20 | | 93.00 | | 92.00 | | 89.00 | | | | | | | | |
| | | | | | Dilution | | % | | 11.5 | | 15.6 | | 10.0 | | 10.0 | | 10.0 | | | | | | | | |
| | | | | | Ore Loss | | % | | 2 | | 4 | | 3 | | 3 | | 3 | | | | | | | | |
| | | | | | Au Cut-off Grade (Marginal Ore) | | g/t | | 2.04 | | 1.89 | | 0.73 | | 0.73 | | 0.75 | | | | | | | | |
| | |
| 18th September 2018 | | Page 332 |
| | | | |
| | Loulo-Gounkoto Gold Mine Complex NI 43-101 Technical Report | | |
| | | | | | | | | | | | | | | | | | | | | | | | | | | | | | | | | | | | | | |
Cut-off Parameters - Gounkoto | | | | | | | | | | | | |
| | | | | | | | | | | | Deposit | | Faraba | | | Gounkoto | | | | | | | | | | | | | |
| | | | | | | | | | | | Resource Type | | OP | | | OP | | | UG | | | | | | | | | | | | | |
| | | | | | | | | | | | Mining Cost | | $/t milled | | | 3.52 | | | | 2.95 | | | | 49.3 | | | | | | | | | | | | | |
| | | | | | | | | | | | Mine Sustaining Capital | | $/t mined | | | | | | | - | | | | 8.14 | | | | | | | | | | | | | |
| | | | | | | | | | | | Processing Cost | | $/t processed | | | 20.6 | | | | 19.0 | | | | 17.8 | | | | | | | | | | | | | |
| | | | | | | | | | | | General & Admin Cost | | $/t processed | | | 8.8 | | | | 7.7 | | | | 7.8 | | | | | | | | | | | | | |
| | | | | | | | | | | | Crushing & Hauling Cost | | $/t processed | | | 5.9 | | | | 5.89 | | | | - | | | | | | | | | | | | | |
| | | | | | | | | | | | Royalty | | % | | | 6 | | | | 6 | | | | 6 | | | | | | | | | | | | | |
| | | | | | | | | | | | Gold Selling Price | | $/oz | | | 1500 | | | | 1500 | | | | 1500 | | | | | | | | | | | | | |
| | | | | | | | | | | | Processing Recovery | | % | | | 91 | | | | 92 | | | | 94.2 | | | | | | | | | | | | | |
| | | | | | | | | | | | Dilution | | % | | | 10.0 | | | | 10.0 | | | | 13.4 | | | | | | | | | | | | | |
| | | | | | | | | | | | Ore Loss | | % | | | 3 | | | | 3 | | | | 4 | | | | | | | | | | | | | |
| | | | | | | | | | | | AuCut-off Grade (Marginal Ore) | | g/t | | | 0.8 | | | | 0.80 | | | | 2.3 | | | | | | | | | | | | | |
| | | | | | | | | | | | | | | | | | | | | | | | | | | | | | | | | | | | | | | |
| | | | | | | | | | |
| Mining Factors or Assumptions - Loulo | | ● In the open pit, the mining method assumed is conventional drill and blast followed by truck and excavator load and haul Fresh rock and transitional zones are drilled and blasted in 10 m lifts, with excavation of benches containing ore in three flitches. A small volume of weathered oxide material is free dig. This bench level concurs with the block heights set during the resource estimation to ensure minimal dilution. |
| | | ● The Yalea and Gara underground mines are accessed via portals located in open pits and a box cut. The lower part of the mines has been developed as single declines with truck haulage up to crushers which feed ore and waste onto conveyors |
| | | ● Three mining methods are proposed to be used at Yalea and Gara underground mines. They are long hole transverse open stoping; long hole longitudinal retreat open stoping; and stoping under rock fill (SURF). |
| | | ● Longitudinal stoping in the upper areas of the mines is used in a panel and pillar method, where ~10 m long pillars are left between 50 m long panels. Paste fill plants at each of the mines produce a mixed paste / aggregate fill. With the introduction of paste fill the lower areas of the mines are being mined using an underhand (top down) long hole stoping method which retreats to central accesses in an echelon format. Panels are 50 m long, mined as single level stopes (25 m high) and filled with cemented paste fill. The paste fill is exposed by the mining of both the panel below and the next panel on the same level. |
| | | ● Transverse long hole open stoping is used in the wider (>15 m wide) parts of Yalea North. Transverse stopes are 15 m to 30 m along strike and mined from hanging wall to footwall. |
| | | ● The stoping under rock fill method (SURF) is proposed for the part of Yalea south upper that has weathered transition or saprolite present in the mineralised zone, or the immediate hanging wall. The method will be used as it is expected to provide a more consistent production in the poorer ground. |
| | | ● Level accesses are at a vertical interval 25 m in all new long hole stoping areas; with 20 m level intervals in stoping under rock fill (SURF) areas and some upper areas of the mines which were developed with 20 m level interval are still in production. |
| | |
| 18th September 2018 | | Page 333 |
| | | | |
| | Loulo-Gounkoto Gold Mine Complex NI 43-101 Technical Report | | |
| | |
Criteria | | Commentary |
| | | ● Ore loss in the 2017 Ore Reserve estimate has been included as 2% for Yalea stopes with fresh rock hanging wall and 4% for Gara stopes with fresh rock hanging wall. |
| | | ● The economic and mining factors are well established at the Project |
| Mining Factors or Assumptions - Gounkoto | | ● The Gounkoto open pit mine has been in operation since 2011, with an additional Super Pit feasibility study being undertaken during 2016. Therefore, the economic and mining factors are well established at the Project. Current Load and Haul operations occur on 10 m benches with flitch mining on three 3.3 msub-benches for levels containing ore. This bench level concurs with the block heights set during the resource to ensure minimal dilution. A 10% dilution and 3% ore loss factor is currently applied to reserves and a good 101% reconciliation between GC call and crusher tonnage and 101% on grade giving 101% reconciliation on total ounces reported for the year with short interval variability observed. |
Metallurgical Factors or Assumptions | | ● The Loulo processing plant uses a carbon in leach (CIL) gold extraction process with a throughput capacity of 4.8 Mtpa. |
| | ● The operating philosophy is to maintain process plant gold recovery above 90% by blending the various ore sources to control copper and arsenic grades in the mill feed. This blending process is anticipated to adequately manage copper and arsenic issues over the life of mine. |
| | ● Forecasted gold processing recovery is based on both testwork and operational history. The Yalea and Gara metallurgical recoveries for remaining LOM have been estimated at 84.5% and 94.5% respectively. |
| | ● The Gounkoto Super Pit testwork and historical operations data has indicated an estimated recovery of 92.5%. |
| | ● Yalea recovery is impacted by the presence of arsenic and copper which reduce recovery by impacting the process of adsorption of the gold onto the CIL tanks. Arsenic and copper impurities also increase cyanide and oxygen consumption. Consequently, arsenic and copper estimations are completed as part of the Mineral Resource update in order to identify potentially low recovery areas. Gold recovery is maintained above 90% by blending the various ore sources (Yalea / Gara/ Gounkoto) to control copper and arsenic grades in the mill feed. |
| | ● The current LOM has an average recovery life of mine of 92.3%. The average gold recovery in 2017 was 92.7%, an improvement from 2016 (Figure 1 2). |
| Environmental Factors or Assumptions | | ● An environmental management plan (EMP) is in place, the Loulo operations are ISO 14001 compliant and independently audited to continuously improve environmental management. All environmental permits are in place for the Loulo processing plant and the Yalea / Gara underground mines and the Gounkoto Super Pit. The site is also audited against the requirements of the International Cyanide Management Code. |
| | | ● Waste rock is generated from the open pit and underground operations; the waste rock dump at Gounkoto is close to the Falémé River which forms the border with Senegal. The waste dump has been carefully designed to minimise seepage and a collection system is in place. Waste rock will also be disposed of into the southern portion of the Gounkoto Super Pit to minimise surface disposal. |
| | |
| 18th September 2018 | | Page 334 |
| | | | |
| | Loulo-Gounkoto Gold Mine Complex NI 43-101 Technical Report | | |
| | | | | | | | | | | | | | |
Criteria | | Commentary |
| | | ● Waste rock geochemistry has been studied and revealed potential acid rock drainage (ARD) generation and metals leaching from specific lithologies. However, this is closely monitored and no significant ARD issues have occurred. |
| | | ● Tailings are generated from the Loulo plant and disposed of in the tailings storage facility (TSF) some 8 km east of the plant. The relevant Environmental and Social Impact Assessment (ESIA) and Management Plan for permitting requirements are underway for the expansion of the current TSF. |
| Bulk Density | | ● Density measurements were carried out both within the mineralised domains and within defined waste units. Fresh, transitional, and saprolite material was obtained from the dry diamond drilling core and the water immersion method was used to calculate specific density. Density, for each mineralised domain, waste rock lithology and weathering zone was applied to the appropriate portion of each zone, except for within Yalea ‘Purple Patch’ where a single pass of inverse distance squared was used to interpolate density due to differing density populations. Any blocks not interpolated in a single pass were coded with a default density. |
| Classification - Loulo | | ● Resource classification is clearly defined for the deposits. The classification criteria is based on the table below. Mineral Resources are classified as Measured, Indicated and Inferred Resources based on drilling density, geological continuity, and confidence, the variogram range continuity and the slope of regression. |
| | | | | | | | | | | | | | | | | | | | | | | | | | | | | | | | |
| | | | | | | | | | | | | | | | | Class | | Criteria | | Yalea | | Gara | | Loulo 3 | | Baboto | | Gara West | | | | |
| | | | | | | | | | | | | | | | | Measured | | Maximum Drill Spacing (m) | | 30 | | 30 | | 5 by 10 | | 5 by 10 | | N/A | | | | |
| | | | | | | | | | | | | | | | | Geological Continuity | | 6 Sections | | 6 Sections | | 6 Sections | | 6 Sections | | | | |
| | | | | | | | | | | | | | | | | Min Samples | | 8 | | 8 | | 8 | | 8 | | | | |
| | | | | | | | | | | | | | | | | Minimum Slope of Regression | | 0.8 | | 0.8 | | 0.8 | | 0.8 | | | | |
| | | | | | | | | | | | | | | | | Indicated | | Maximum Drill Spacing (m) | | 30 to 80 | | 40 to 80 | | 20 to 80 | | 20 to 60 | | 10 to 40 | | | | |
| | | | | | | | | | | | | | | | | Sections of Geological Continuity | | Good | | Good | | Good | | Good | | Good | | | | |
| | | | | | | | | | | | | | | | | Min Samples | | 6 | | 6 | | 6 | | 6 | | 6 | | | | |
| | | | | | | | | | | | | | | | | Minimum Slope of Regression | | 0.6 | | 0.6 | | 0.6 | | 0.6 | | 0.6 | | | | |
| | | | | | | | | | | | | | | | | Inferred | | Maximum Drill Spacing (m) | | Over 80 | | Over 80 | | Over 80 | | Over 80 | | Over 40 | | | | |
| | | | | | | | | | | | | | | | | Sections of Geological Continuity | | - | | - | | - | | - | | - | | | | |
| | | | | | | | | | | | | | | | | Min Samples | | 4 | | 4 | | 4 | | 4 | | 4 | | | | |
| | |
| | | ● Slope of regression plots and kriging efficiencies were also used to determine classification |
| | | ● Classification shapes were generated using the above criteria and used to flag the block model to improve continuity. Blocks that did not fall within these criteria were flagged as unclassified. |
| Classification - Gounkoto | | ● Resource classification is clearly defined for the deposits. The classification criteria is based on the table below. Mineral Resources are classified as Measured, Indicated and Inferred Resources based on drilling density, geological continuity, and confidence, the variogram range continuity and the slope of regression. |
| | |
| 18th September 2018 | | Page 335 |
| | | | |
| | Loulo-Gounkoto Gold Mine Complex NI 43-101 Technical Report | | |
| | | | | | | | | | | | | | | | | | | | | | | | | | | | | | | | | | | | | | | | | | | | | | | | | | | | | | | | |
| | | | | | | | | | | | | | | | | | | | | | | | | | | | | | | | | | | | | | | | | | | | | | | | | | | | | | | | | |
| | | | | | | | | | | | | | | | | Class | | Criteria | | Gounkoto
Open Pit | | | Gounkoto
Underground | | | Faraba | | | | | | | | | | | | | | | | | | | | | |
| | | | | | | | | | | | | | | | | Measured | | Maximum Drill Spacing (m) | |
| 12.5 by 12.5
(6 by 6 Finger Zone) |
| | | N/A | | | | 12.5 by 12.5 | | | | | | | | | | | | | | | | | | | | | | | | | | | |
| | | Geological Continuity | | | | | | | | | | | | | | | | | | | | | | | | | | | | | | | | | | |
| | | Min Samples | | | | | | | | | | | | | | | | | | | | | | | | | | | | | | | | | | |
| | | Minimum Slope of Regression | | | 0.7 | | | | | | | | | | | | | | | | | | | | | | | | | | | | | | | |
| | | | | | | | | | | | | | | | | Indicated | | Maximum Drill Spacing (m) | | | 30 | | | | 40 by 30 | | | | 30 | | | | | | | | | | | | | | | | | | | | | | | | | | | |
| | | Sections of Geological Continuity | | | | | | | | | | | | | | | | | | | | | | | | | | | | | | | | | | | | | | |
| | | Min Samples | | | | | | | | | | | | | | | | | | | | | | | | | | | | | | | | | | | | | | |
| | | Minimum Slope of Regression | | | | | | | | | | | | | | | | | | | | | | | | | | | | | | | | | | | | | | |
| | | | | | | | | | | | | | | | | Inferred | | Maximum Drill Spacing (m) | | | <100 | | | | <100 | | | | <100 | | | | | | | | | | | | | | | | | | | | | | | | | | | |
| | | | | | | | | | | | | | | | | Sections of Geological Continuity | | | | | | | | | | | | | | | | | | | | | | | | | | | | | | | | | | | | | | |
| | | | | | | | | | | | | | | | | Min Samples | | | | | | | | | | | | | | | | | | | | | | | | | | | | | | | | | | | | | | |
| | | | | | | | | | |
| | | ● Slope of regression plots and kriging efficiencies were also used to determine classification |
| | | ● Classification shapes were generated using the above criteria and used to flag the block model to improve continuity. Blocks that did not fall within these criteria were flagged as unclassified. |
Audits or Reviews -Loulo | | ● An external audit by QG reviewed the Yalea and Gara estimates in January 2015 |
| | ● QG determined that the Yalea and Gara Mineral Resource estimates were “free of material errors”, and there were no issues that required immediate attention. |
| | ● QG identified that their primary minor concern was that the extents of the Indicated/Inferred boundary would require further drilling, which has since been completed. |
| | ● QG identified other incremental improvements, all of which have been implemented or addressed. |
| | ● QG’s analysis of the resource estimation through review of the wireframes, block model and macros suggested that there are no significant concerns in the resource estimation procedures. Their findings agreed with the use of different orientation domains to manage varying estimation orientations. |
| | ● QG stated that they consider the resource classification complies with the guidelines set out in JORC (2012) Code. |
Audits or Reviews - Gounkoto | | ● An external audit by QG reviewed the Gounkoto estimate in February 2015 |
| | ● QG stated that the Gounkoto Mineral Resource was “free of error”. |
| | ● QG provided a number of incremental improvements, all of which have been implemented or addressed |
| | ● QG’s analysis of the resource estimation through review of the wireframes, block model and macros suggested that there are no material errors in the resource estimation procedures. Their findings agreed with the use of nine orientation domains to manage varying estimation orientations. |
| | ● The report identified that the greatest risk was the complex geological continuity. QG noted that the geological uncertainty could lead to |
| | |
| 18th September 2018 | | Page 336 |
| | | | |
| | Loulo-Gounkoto Gold Mine Complex NI 43-101 Technical Report | | |
| | |
Criteria | | Commentary |
| | | higherore-loss and dilution if the deposit is mined underground. This risk is now been addressed through the completion of a pre- feasibility study on the underground material in 2016. In addition, the life of mine open pit has been deepened to include some formerly underground material. |
| | | ● QG stated that they consider the resource classification complies with the guidelines set out in JORC (2012). |
Discussion of RelativeAccuracy/ Confidence | | ● The resource estimates have followed industry standard practices for collecting, validating, and estimating data. |
| | ● The application of thorough exploratory data analysis and quantitative neighbourhood kriging analysis gives a high confidence in the Measured and Indicated material in the model. The Inferred material by nature has a relative low level of accuracy, but a high geological confidence to exist. |
| | ● As Loulo and Gounkoto are operating mines, grade control and advanced grade control drilling have provided a much higher degree of accuracy in the model and the ability to reconcile mine data to compare with the block model |
| | ● Independent external audits are undertaken every three years, or at material model changes.to ensure that the procedures are appropriate. |
| | |
| 18th September 2018 | | Page 337 |
| | | | |
| | Loulo-Gounkoto Gold Mine Complex NI 43-101 Technical Report | | |
Section 4. Estimation and Reporting of Ore Reserves
(Relevant criteria listed in section 1, 2, and 3 also apply to this section.)
| | |
| Criteria | | Commentary |
| Mineral Resource Estimate for Conversion to Ore Reserves | | ● The Ore Reserve statement is based upon the Mineral Resource declared as of 31st December 2017 by Randgold Resources Ltd. Mineral Resources are reported inclusive of Ore Reserves. ● The Yalea Ore Reserves are based on a geological block model produced in October 2017, Gara in November 2017, Gounkoto in July 2017, Baboto in May 2017, Loulo 3 and Gara West in November 2015. ● Mineral Resources are supported by a dedicated Competent Person Report |
| Site Visits | | ● Mr Derek Holm FSAIMM is a Qualified Person and an independent consultant with over 18 years of experience within the mining industry in technical, management and consulting positions. He visited the site between the 12thand 14thSeptember 2018 |
| | | ● The study to convert Mineral Resources to Ore Reserves is an operational life of mine plan update. The Yalea and Gara underground mines have an operating production history of 10 years at Yalea (9.9 Mt for 1.9 Moz) and 5 years at Gara (6 Mt for 0.8 Moz) respectively. The Competent Person has reviewed studies and operational history that support all material Modifying Factors and considers it is at least equivalent to Pre-Feasibility Study level. |
| | | ● Mining of the Baboto pit is due to start in February 2018 with a small oxide pit. Mining will then cease and commence again in 2027, where the remaining transitional and sulphide ore will be mined. |
| Study Status | | ● The Gounkoto Underground Ore Reserve is predicated upon a Pre-feasibility Study commissioned by Randgold Resources Ltd and completed in December 2017. The finding of the Feasibility Study was an economically viable mining operation that demonstrated lower operation risk, higher operational flexibility, and better overall cash flow to the smaller open pit and larger underground mine that formed the basis of the 2017 LOM plan. |
| | | |
| | |
| 18th September 2018 | | Page 338 |
| | | | |
| | Loulo-Gounkoto Gold Mine Complex NI 43-101 Technical Report | | |
| | | | | | | | | | | | | | |
| Criteria | | Commentary |
| | | Loulo Open Pits: | | |
| | | |
| | | | | Parameter | | Unit | | Gara West | | Baboto | | Loulo 3 | | |
| | | | | Gold Price | | $/oz | | 1,000 | | |
| | | | | Royalty | | % | | 6% | | |
| | | | | Selling cost | | % | | 0% | | |
| | | | | Net Gold Price | | $/oz | | 940 | | |
| | | | | Met Recovery | | % | | 91% | | |
| | | | | Dilution | | % | | 10% | | |
| | | | | Ore Loss | | % | | 2% | | |
| | | | | Mining Cost - Contractor | | $/t mined | | 3.63 | | 3.18 | | 3.45 | | |
| | | | | Mining Cost - Owner’s | | $/t mined | | 0.06 | | 0.06 | | 0.06 | | |
| | | | | Mining Cost - Grade Control | | $/t mined | | 0.21 | | 0.07 | | 0.21 | | |
| | | | | Total Mining Cost | | $/t mined | | 3.90 | | 3.31 | | 3.72 | | |
| | | | | Strip Ratio | | Waste/Ore | | 1.94 | | 4.5 | | 1.94 | | |
| | | | | G&A | | $/t milled | | 8.80 | | 7.80 | | 8.80 | | |
| | | | | Ore Crushing & Hauling | | $/t milled | | 0 | | 3.63 | | 0 | | |
| | | | | Mining | | $/t milled | | 11.46 | | 18.18 | | 10.93 | | |
| Cut-Off Parameters - Loulo | | | | Process Plant | | $/t milled | | 20.6 | | 15.2 | | 20.6 | | |
| | | | Total Operating Costs | | $ | | 40.86 | | 44.81 | | 40.33 | | |
| | | | Full Grade Cut-off | | g/t | | 1.52 | | 1.62 | | 1.50 | | |
| | | | Marginal Cut-off Grade | | g/t | | 1.09 | | 0.96 | | 1.09 | | |
| | | | | Diluted Full Grade Cut-off Grades | | g/t | | 1.38 | | 1.48 | | 1.36 | | |
| | | | | Diluted Marginal Cut-off Grades | | g/t | | 0.99 | | 0.88 | | 0.99 | | |
| | | |
| | | ● The full grade cut-off is the ore material that is profitable at $1,000/oz, considering all operating costs of mining, haulage, processing, and general and administrative costs, as well as the appropriate recovery, dilution, and realised gold price post Royalty at $1,000/oz spot gold price . It is the principal material fed to the plant. |
| | | ● The marginal cut-off grade is the ore material mined within the $1,000/oz pit design that is profitable on a marginal basis (FG OPEX less mining costs). |
| | | |
| | | |
| | | |
| | |
| 18th September 2018 | | Page 339 |
| | | | |
| | Loulo-Gounkoto Gold Mine Complex NI 43-101 Technical Report | | |
| | | | | | | | | | | | |
| Criteria | | Commentary | | | | | | | | | | |
| | | Loulo Underground | | | | | | | | | | |
| | | | | Parameter | | Unit | | Yalea | | Gara | | |
| | | | | Gold Price | | $/oz | | 1,000 | | 1,000 | | |
| | | | | Royalty | | % | | 6% | | 6% | | |
| | | | | Selling cost | | % | | 0% | | 0% | | |
| | | | | Net Gold Price | | $/oz | | 940 | | 940 | | |
| | | | | Met Recovery | | % | | 84.47% | | 94.2% | | |
| | | | | Dilution | | % | | 11.5% | | 15.6% | | |
| | | | | Ore Loss | | % | | 2% | | 4% | | |
| | | | | Mine OPEX Development | | $/t milled | | 5.00 | | 3.29 | | |
| | | | | Mine Stoping | | $/t milled | | 12.15 | | 11.79 | | |
| | | | | Backfill | | $/t milled | | 11.58 | | 10.51 | | |
| | | | | Fixed Cost | | $/t milled | | 13.98 | | 14.63 | | |
| | | | | Grade Control | | $/t milled | | 3.37 | | 3.40 | | |
| | | | | Mine Sustaining Capital | | $/t mined | | 7.69 | | 8.25 | | |
| | | | | Total Mining Cost | | $/t mined | | 53.78 | | 53.78 | | |
| | | | | G&A | | $/t milled | | 7.80 | | 7.70 | | |
| | | | | Process Plant | | $/t milled | | 17.80 | | 18.20 | | |
| | | | | Total Operating Costs | | $ | | 79.38 | | 79.68 | | |
| | | | | Breakeven In-Situ Cut-off Grade | | g/t | | 3.54 | | 3.29 | | |
| | | | | Breakeven Mined Cut-off Grade | | g/t | | 3.11 | | 2.73 | | |
| | | | | Marginal In-situ Cut-off Grade | | g/t | | 2.97 | | 2.80 | | |
| | | | | Marginal Mined Cut-off Grade | | g/t | | 2.61 | | 2.33 | | |
| | |
| | | ● The cut-off grade values are calculated on the basis of mined gold grade, including dilution, in grammes per tonne. No by product credits or metal equivalents are used. Revenue calculation is based on a gold price in $ and takes into account processing losses. Costs are based on 2017 actual operational costs in $. The cut-off grades used are Yalea 2.4 g/t Au and Gara 2.3 g/t Au. |
| | |
| 18th September 2018 | | Page 340 |
| | | | |
| | Loulo-Gounkoto Gold Mine Complex NI 43-101 Technical Report | | |
| | | | | | | | | | | | |
| Criteria | | Commentary | | | | | | | | | | |
| | | Gounkoto Open Pit | | | | | | | | | | |
| | |
| | | ● In the open pit, the weighted average cut-off grades for the Gounkoto and Faraba open pits are 1.20 g/t Au and 1.32 g/t Au respectively. Table 15-18 shows the economic parameters used for estimating the cut-off grade for the Gounkoto open pit and Faraba open pit, in determining the Ore Reserves. |
| | | | | Parameter | | Unit | | Gounkoto | | Faraba | | |
| | | | | Gold Price | | $/oz | | 1,000 | | |
| | | | | Royalty | | % | | 6% | | |
| | | | | Selling cost | | % | | 0% | | |
| | | | | Net Gold Price | | $/oz | | 940 | | |
| | | | | Met Recovery | | % | | 91% | | |
| | | | | Dilution | | % | | 10% | | |
| Cut-Off Parameters - Gounkoto | | | | Ore Loss | | % | | 2% | | |
| | | | Mining Cost - Contractor | | $/t mined | | 2.95 | | 3.45 | | |
| | | | Mining Cost - Owner’s | | $/t mined | | 0.06 | | 0.06 | | |
| | | | Mining Cost - Grade Control | | $/t mined | | 0.07 | | 0.14 | | |
| | | | | Total Mining Cost | | $/t mined | | 3.08 | | 3.65 | | |
| | | | | Strip Ratio | | Waste/Ore | | 13.62 | | 3.61 | | |
| | | | | G&A | | $/t milled | | 7.70 | | 8.80 | | |
| | | | | Ore Crushing & Hauling | | $/t milled | | 5.89 | | 5.9 | | |
| | | | | Mining | | $/t milled | | 44.98 | | 16.81 | | |
| | | | | Process Plant | | $/t milled | | 19.0 | | 20.6 | | |
| | | | | Total Operating Costs | | $ | | 77.57 | | 52.11 | | |
| | | | | Full Grade Cut-off | | g/t | | 2.85 | | 1.95 | | |
| | | | | Marginal Cut-off Grade | | g/t | | 1.20 | | 1.32 | | |
| | | | | Diluted Cut-off Grades | | g/t | | 2.59 | | 1.77 | | |
| | | | | Diluted Marginal Cut-Off Grades | | g/t | | 1.09 | | 1.20 | | |
| | | | | | | | | | | | |
| | |
| 18th September 2018 | | Page 341 |
| | | | |
| | Loulo-Gounkoto Gold Mine Complex NI 43-101 Technical Report | | |
| | | | | | | | | | |
| Criteria | | Commentary | | | | | | | | |
| | | Gounkoto Underground |
| | | ● Underground mine operating costs were determined using November 2012 contractor mining costs, which formed a basis for the December 2016 cut-off grade for the Ore Reserve estimate. An insitu cut-off grade of 3.0 g/t Au was used for the stope design in the main part of the orebody, and an insitu cut-off grade of 4.0 g/t Au was used for the stope design in more isolated areas of the orebody. No supporting calculation was provided for these cut-off grades. As a check, a new and current cut-off grade was determined, resulting in a marginal insitu cut-off grade of 3.34 g/t Au. This is approximately in line with the combined 3.0 g/t Au and 4.0 g/t Au cut-off grade and compares favourably to the marginal insitu cut-off grades of Yalea and Gara of 2.97 g/t Au and 2.80 g/t Au, which are similar operations. The Gounkoto underground ore will be toll treated at the Loulo mill. The total processing cost applied is based on the current costs for the Loulo mill. The inputs to the revised cut-off grade calculations are shown in Table 15-20. |
| | | | | | | | | | | |
| | | | | Parameter | | Unit | | Gounkoto | | |
| | | | | Gold Price | | $/oz | | 1,000 | | |
| | | | | Royalty | | % | | 6% | | |
| | | | | Selling cost | | % | | 0% | | |
| | | | | Net Gold Price | | $/oz | | 940 | | |
| | | | | Met Recovery | | % | | 92.0% | | |
| | | | | Dilution | | % | | 710.2 | | |
| | | | | Ore Loss | | % | | 6.3% | | |
| | | | | Mine Capital Development | | $/t mined | | 34.36 | | |
| | | | | Total Mining Cost | | $/t mined | | 49.52 | | |
| | | | | G&A | | $/t milled | | 9.80 | | |
| | | | | Process Plant | | $/t milled | | 23.60 | | |
| | | | | Total Operating Costs | | $ | | 117.28 | | |
| | | | | Breakeven In-Situ Cut-off Grade | | g/t | | 4.96 | | |
| | | | | Breakeven Mined Cut-off Grade | | g/t | | 4.22 | | |
| | | | | Marginal In-situ Cut-off Grade | | g/t | | 3.34 | | |
| | | | | Marginal Mined Cut-off Grade | | g/t | | 2.84 | | |
| | | | | | | | | | | |
| | | ● Optimisation of the cut-off grade strategy for Gounkoto will be conducted in the feasibility study. |
| | | | | | | | | | | |
| | | | | | | | | | | |
| | |
| 18th September 2018 | | Page 342 |
| | | | |
| | Loulo-Gounkoto Gold Mine Complex NI 43-101 Technical Report | | |
| | |
| Criteria | | Commentary |
Mining Factors or Assumptions | | ● The Ore Reserves have been estimated using three dimensional mine designs. These have been created using three dimensional geological wireframes and take into account the geotechnical environment. |
| | ● Open pit Ore Reserves use a dilution figure of 10% and an ore loss of 2% are based on historical results, which has Proved to be suitable based on the orebody and mining fleet equipment. Dilution is applied to both tonne and grade (increases the tonnes and drops the grade) in the optimisation and mining schedules. It simulates the waste rock that is included into the ore during the mining operation. |
| | ● The predominant UG mining method used is long hole open stoping (bench stoping and transverse long hole stoping). These methods are currently used at Yalea and Gara. Mining factors are supported by reconciliation of previously mined areas. Stope sizes (up to 25 m vertical level interval and up to 50 m panel length) are based on geotechnical analysis of stable spans. A stoping under rock fill (SURF) mining method is proposed to be used in the Yalea south upper area where weathered oxide and transition rock is present in the ore zone and immediate hanging wall. |
| | ● Planned dilution (within stope shapes) has been added where the geological boundary flexes between levels, or where ore drives have been placed in the footwall to avoid weathered zones. Planned dilution is estimated as 3% at Yalea and 5% at Gara. |
| | ● Unplanned dilution (outside stope shapes) has been added based on an equivalent width added to the hanging wall of the stope. Thicknesses were determined from reconciliation of previously mined areas . Unplanned dilution is estimated as 9% for Yalea long hole stoping and 11% for Gara long hole stoping. For the stoping under rock fill areas 35% dilution has been added. Dilution has been added at a grade of 0 g/t Au. |
| | ● In long hole stoping areas (fresh rock ore and hanging wall) a mining recovery factor of 96% has been used . For Stoping under rock fill areas, a mining recovery is applied based on ore rock type (oxide - 50%; transition-65%; fresh - 80%) |
| | ● The Loulo life of mine plan does not include any Inferred Mineral Resources at Gara or Yalea underground mines. |
| | ● The majority of the infrastructure required for the mining is already in place. The life of mine plan includes provision of additional infrastructure for mine ventilation, refrigeration, and dewatering. |
| | ● The Gounkoto Underground mining method is longhole stoping and longhole with backfill and incorporates both transverse and longitudinal access as appropriate to the width of the orebody. The minimum mining width for stopes is 3 m. Ground conditions have been estimated to be in the majority ‘Fair’, with minor inclusions of ‘Poor’ ground. Stope designs have been based on a stope stability assessment for stable stope surfaces. Therefore, unplanned dilution is expected to be low provided good mining practice is followed. |
| | ● Transverse stopes will be mined in a primary/secondary stope sequence. Cemented fill will be used to maximise ore recovery. |
| | ● Stopes have been designed for longhole stoping using a “top hammer” blast hole drill. The complexity of the orebody requires that some waste and Inferred and unclassified material may be included in stope designs so that suitable recovery of the mineralisation above cut-off grade is achieved. This mineralised waste, Inferred and unclassified material is classed as planned dilution. None of the proposed stopes report below 3 g/t Au. The proportion of inferred and unclassified material that is included in stope designs is <1.0% of the total stope tonnes. This is considered to be acceptable. |
| | ● Dilution and recovery factors have been modified where blind uphole stopes are used because of the reduced flexibility in blast hole drilling geometry. |
| | |
| 18th September 2018 | | Page 343 |
| | | | |
| | Loulo-Gounkoto Gold Mine Complex NI 43-101 Technical Report | | |
| | |
| Criteria | | Commentary |
| | | ● In regard to transverse primary stopes, waste dilution only occurs on the H/W contact. |
| | | ● Dilution for transverse primary stopes has been set at 5%. Dilution for transverse primary blind uphole stopes has been set at 7.5% to take account of the more difficult mining conditions. |
| | | ● In regard to transverse secondary stopes, waste dilution can occur from the H/W contact and the cemented fill. |
| | | ● Dilution for transverse secondary stopes has been set at 7.5%. |
| | | ● Dilution for transverse secondary blind uphole stopes has been set at 10%. Recovery for conventional transverse stopes has been set at 95%. Recovery for transverse blind uphole stopes has been reduced to 92%. |
| | | ● In regard to the longitudinal stopes the dilution factor has been set at 10%. Recovery for conventional longitudinal stopes has been set at 95%. |
| | | ● Recovery for blind uphole longitudinal stopes has been set at 79% which accounts for 5 m rib pillars being left every 25 m and 95% recovery of the remaining stopes. Recovery for longitudinal blind uphole stopes is better than transverse blind uphole stopes because of better blast hole drilling geometry in narrower stopes. |
| | | ● Comprehensive 3D numerical modelling was completed on the stope designs and sequence. The results of that numerical modelling concur with the stability assessment. |
| | | ● The underground mine design includes infrastructure suitable for the planned mining method and production rate using an access decline from the existing open pit. |
Metallurgical Factors or Assumptions | | ● Recovery in the CIL plant is based on suitable testwork and historical reconciliations with the metallurgical plant. The recovery applied to the Loulo open pit reserve is 91% for Gara West and Loulo 3 and 93% for Baboto. The recovery is estimated to be 92% and 91% for Gounkoto Open pit Ore and Faraba Open pit Ore respectively. |
| | ● The ore is to be processed through the existing Loulo CIL process plant. The process is well tested and appropriate for style of mineralisation. The process plant has been treating Yalea and Gara ore since 2005 and has demonstrated consistent recovery performance. |
| | ● Separate metallurgical domains have been created for oxide, transition, and fresh ores in each of the deposits. All underground diamond drill grade control samples are assayed for copper. Copper grades are interpolated in geological block model to assist with recovery prediction. |
| | ● The Yalea deposit contains higher levels of arsenic and copper than Gara. Historically these have impacted gold recovery, particularly in weathered material from Yalea open pit (South Area). The current strategy of feeding the process plant with a blend of Yalea, Gara and Gounkoto ores has been successful in achieving overall recoveries in excess of 90%. This strategy is anticipated to be used throughout the life of mine. |
| | ● Overall the Gounkoto ore responds well to direct cyanidation with an average of 92% recovery achieved in previous testwork programmes, Good reconciliation is being achieved from ore currently mined ore from the Gounkoto open pit which is located immediately above the proposed underground operation. |
| | ● It was recommended to use a flat gold recovery of 92% for the Gounkoto UG pre-feasibility study. |
| | |
| 18th September 2018 | | Page 344 |
| | | | |
| | Loulo-Gounkoto Gold Mine Complex NI 43-101 Technical Report | | |
| | |
| Criteria | | Commentary |
| Environmental | | ● All ESIAs and Environmental Management Plans for the Loulo and Gounkoto operations are in place; the environmental permits, renewable every five years, were approved in March 2017 and the operation is ISO 14001 certified. |
| Infrastructure | | ● Substantial infrastructure already exists at the Loulo site as part of the previous open pit mining operation. Ore processing and tailings facilities already exist at Randgold’s Loulo operation. |
| | ● The Life of Mine Plan includes provision of additional infrastructure for mine ventilation, refrigeration, and dewatering. |
| | ● Substantial infrastructure already exists at the Gounkoto site as part of the existing open pit mining operation. |
| | ● Surface infrastructure associated with Gounkoto Open pit operation includes the water diversion trench, camp, power station, surface workshops, offices and all other associated infrastructure required to support the open pit. All of these items have been designed, costed, and accounted for in the economic assessment of the Project. |
| | ● Minor additional surface infrastructure associated with the underground Gounkoto operation is required to the camp, power supply, surface workshops, offices and all other associated infrastructure required to support the u/g project. All of these items have been designed, costed, and accounted for in the economic assessment of the Project to Pre-Feasibility level. |
| Costs | | ● Loulo operating costs (mining, processing, site general and administration) are derived from 2017 actual costs at Loulo operation (including Yalea and Gara underground mines). Life of mine costs have been adjusted to allow for operational changes including changes in paste fill binder. |
| | ● Development capital costs are derived from mine designs and are costed by allocation of a portion of the total development cost during each period. The allocation cost includes a share of mining overhead costs. Plant and equipment capital costs have been estimated by year for the life of mine. |
| | ● Nil allowances were made for deleterious element as there are no significant deleterious elements are present in the gold bullion. |
| | ● Transportation of gold bullion from site and refining charges are included in operating costs for the processing plant and are derived from existing agreements. |
| | ● A royalty of 6% of gold sales is payable to the Malian government. |
| | ● Gounkoto mining costs are based on contract mining costs agreed with the Mining Contractor GMS and the Gounkoto Mine. Owner mining costs of grade control, planning, dewatering and included in the budget numbers. |
| | ● The costs for processing and G&A were updated based on operational data adjusted to forecast production profiles and manning levels for Loulo-Gounkoto. |
| | ● For the Gounkoto Underground Pre-Feasibility Study, the Loulo Operation 2016 mine budget rates were applied where relevant. These are based on an owner mining approach using expat’ labour to conduct the development and production of the mine as well as training of a national workforce over time. |
| | ● In 2015, Feasibility level budget costs were obtained for a larger scale underground operation for infrastructure items such as ventilation fans, refrigeration plant, CAF and CRF plant equipment and pumps. These costs were reviewed and applied into the Pre-Feasibility cost model. |
| | ● Costs for processing and G&A were applied based on the 2016 production profiles and manning levels for Loulo-Gounkoto. |
| | |
| 18th September 2018 | | Page 345 |
| | | | |
| | Loulo-Gounkoto Gold Mine Complex NI 43-101 Technical Report | | |
| | |
| Criteria | | Commentary |
| | | ● Customs duties, taxes, charges, and logistical costs are included in all relevant areas of the operational costs. |
Revenue Factors | | ● A gold price of $1,000/oz was employed for the Ore Reserve process. This value is based on a conservative view of gold price following a period of relatively higher gold price volatility. |
Market Assessment | | ● The gold market is highly liquid and benefits from terminal markets (London, New York, Tokyo, and Hong Kong) on almost a continuous basis. Gold prices were in general on a downward trend from 1980 to 2000 where it traded down to approximately $250/oz. Between 2000 and 2011 the market was on a general upward trend that moved spot prices to a peak of $1,900/oz. 2013 saw a sharp correction in the upward trend, with the spot price dropping to $1250/oz. Since 2014 the gold price, has traded in range of $1,050 to $1,400 / troy. Oz. Gold is currently (August 2018) trading at approximately $1,200/oz. |
| | ● Gold produced at the mine site is shipped from site, under secure conditions, to a refining company. Under pre-established contractual conditions, the refiner purchases the gold from the mine with the proceeds automatically credited to the mines’ bank account. The operation is unhedged.’ |
Economic | | ● The economic analysis of the life of mine uses a range of discount rates from 2.5 to 10%. No inflation of costs or revenues has been included in economic analysis. Sensitivity analysis to gold price, mined grade and operating costs have been undertaken. At Yalea the economic outcome is most sensitive to gold price. At Gara the economic outcome is highly sensitive to all of these factors due to the lower mined grade and profit margin. |
| | ● LOM Capital: $598M including construction, ongoing, capital development, waste stripping, drilling, pre-production, exploration, rehab and closure. |
| Social | | ● The mine has not faced any material social issues. However, there is a growing need to reinforce communication and sensitization in the community regarding mining and its benefits. The mine will continue its engagement to manage this potential risk. |
| | ● The various ESIAs carried out for Loulo and Gounkoto have included assessments of impacts and benefits to local communities. A comparative socio-economic survey has been conducted to assess the change (positive and negative) in the surrounding local communities over an eighteen-year period (1997 to 2015). Since 2002 there has been a significant influx of people into the area of the mine. Modernization of the communities has increased along with trade and commerce. Educational and skill levels have also increased but access to land to grow crops or graze livestock, and access to natural resources have decreased with higher populations. The quality of the housing stock has increased, along with transport infrastructure, access to water, access to healthcare and education. |
| | ● Stakeholder engagement and dialogue is ongoing and the importance of this to the company. In addition, Union representatives attend strategy meetings and quarterly review meeting in order to provide information on current community and local employee issues. |
| | ● A grievance mechanism is in place. No grievances were received in 2017; the last grievance was recorded in 2015. |
| | ● The mine is a significant employer to members of the local communities. The underground mining operations contribute to extended life-of- |
| | |
| 18th September 2018 | | Page 346 |
| | | | |
| | Loulo-Gounkoto Gold Mine Complex NI 43-101 Technical Report | | |
| | |
| Criteria | | Commentary |
| | | mine, employment of local Malians and the growth of the Malian economy. Randgold’s policy is to promote nationals to manage the project. |
| | | ● Randgold’s policy of promoting local employment also extends to its contractors. Figures for national employment in 2017 were 2,820 out of a total of 2,975 employer and contractor posts. Unskilled labour is typically sourced from the local area while more skilled posts are filled by staff from elsewhere in Mali, including Bamako and the other mines currently operating in the country. |
| | | ● Randgold continually invests in the local communities and focuses on potable water supplies, primary school education, health care and education. |
| | | ● A program to improve the agricultural yield of the area has been undertaken, with tractors being donated to the community and an agribusiness training centre constructed to train locals in agricultural entrepreneurship; and to develop community vegetable growers to supply the mine caterer with fresh produce. |
| | | ● Phases of economic displacement (loss of crops and trees) and the physical resettlement of some households has occurred during the life of the mine to date as it has expanded. Crops and trees are compensated at published rates; physical resettlement has involved providing affected households with a new home. The most recent resettlement was around Gounkoto and was completed in 2012. This affected 12 households and around 300 hectares of land, including 1,700 economic trees and two artisanal mining (orpaillage) sites. A resettlement audit was carried out in late 2015, in line with good international industry practice. |
| | | ● There is a significant ongoing presence of artisanal miners (orpailleurs) operating within the Loulo Permit area, particularly along the haul road. The government of Mali, as part owners of the operations, provide security in the form of Gendarmes who intervene on request if ASM activities interfere with the operation of the mine. The Gendarmes have been successful in removing orpailleurs from the Baboto target area. Although this and other key exploration targets remain free of ASM activity, the risk of incursion into exploration or operations areas remains, because of the increasing number of people in the largely illegal (i.e. unlicensed) activity. The mining industry in Mali has established a committee to deal with the issue at the highest level of the Government. Dedicated orpaillage corridors are still to be created for artisanal and small- scale mining. The World Bank has recently been involved in finding solutions. In the meantime, the Mine is reinforcing its relationship with the community to deal with the issue. |
Other | | ● All necessary governmental agreements and approvals critical to the viability of the Project are in place. |
| | ● Loulo operates within the Loulo Permit which authorises the carrying out of exploration and mining activities. The Loulo permit extends beyond the current Yalea and Gara life of mine and is renewable. |
| | ● The most significant risks in the area are the growth in numbers of illegal miners, which has seen a rapid expansion since the improvement in infrastructure between Dakar and Bamako. |
| | ● The Gara mine is within 500 m of the Falémé River, it does have 1 in 100 year flood protection, however the risk remains of extraordinary flooding causing delay in operations. |
| | ● All necessary governmental agreements and approvals critical to the viability of the Project are in place. |
| | |
| 18th September 2018 | | Page 347 |
| | | | |
| | Loulo-Gounkoto Gold Mine Complex NI 43-101 Technical Report | | |
| | |
| Criteria | | Commentary |
Classification | | ● The Loulo Ore Reserves are classified as Proved and Probable based upon the confidence levels determined in the Mineral Resource and accurately reflects the Competent Person’s views of the deposit. |
| | ● Ore Reserves underground at Yalea and Gara are classified as Proved and Probable Ore Reserves. |
| | ● Ore stockpiles on the surface are classified as Measured Mineral Resource and Proved Ore Reserve. These stockpiles are reported as part of the Loulo Open Pit Ore Reserves estimate. |
| | ● The Loulo and Gounkoto Open Pit Ore Reserves are classified as Probable based upon the confidence levels determined in the Mineral Resource and accurately reflects the Competent Person’s views of the deposit. |
Audits or Reviews | | ● An external audit of the Mineral Resource was completed in February 2015 by QG. This audit stated that QG is confident that the Loulo Mineral Resources are free of material error. There are no issues that QG consider need immediate attention. Any recommendations made are more for long term improvement in processes and understanding |
| | ● QG’s analysis of the resource estimation through review of the wireframes, block model and macros suggested that there are no material errors in the resource estimation procedures. Their findings agreed with the use of different orientation domains to manage varying estimation orientations. |
| | ● QG stated that they consider the resource classification complies with the guidelines set out in JORC (2012). |
| | ● All outcomes of the external audits have been acted upon where relevant. |
| | ● During 2013 -2016 the Yalea and Gara Life of Mine Planning was reviewed by Kenmore Mine Consulting. Kenmore has concluded that the current mine planning was robust but recommended further work to improve confidence in mine ventilation, paste fill testwork, geotechnical rock mass modelling, pre- mining stress measurement and mining induced stress modelling. Randgold has undertaken substantial work to address these recommendations and this work is ongoing as part of a continuous improvement program. |
| | ● Additional external expert opinion was sought to provide clarity and finality on decisions such as ventilation and refrigeration requirements and ground stability issues. The mine design has been reviewed by peers and senior Randgold management from the sister operation at Loulo. All items considered of a critical nature by the formal reviews and external experts were resolved and considered in the Ore Reserve. |
| | ● An external audit on the Gounkoto Mineral Resource and input data procedures was completed in February 2015 by QG. This report stated that sampling procedures for RC and diamond drilling was good. Some minor improvements for the collection bulk density measurements (use of recording balance and certified weights) were suggested and were implemented during 2016. |
Discussion of Relative Accuracy/ Confidence | | ● The modifying factors used are considered realistic for the Project based on the mining methods selected and assuming good practise is applied. The values applied are in-line with published data from similar scale operations. |
| | ● Accuracy and confidence level in the Ore Reserve estimate has been assessed qualitatively. |
| | ● Yalea and Gara deposits have a consistent production history over the last 10 years both as open pit and underground mines. Reconciliation process have been undertaken over this time to drive continuous improvement in the operation. |
| | |
| 18th September 2018 | | Page 348 |
| | | | |
| | Loulo-Gounkoto Gold Mine Complex NI 43-101 Technical Report | | |
| | |
| Criteria | | Commentary |
| | | ● The key risks / opportunities that may effect the relative accuracy and confidence of the Ore Reserve are: Gara mined grade - due to the relatively lower economic margin at Gara; Gara dilution - due to narrow vein width and higher variability. |
| | | ● The Gounkoto Open Pit Ore Reserve estimate is classified as Proved and Probable in-line with the Mineral Resource classification and modifying factors applied to the Mineral Resource. |
| | | ● Due to the complex nature of the deposit it is recognised there will be local deviations to the Ore Reserve estimate hence the level of confidence is placed as Probable. However, on a global basis there is no evidence of significant risk to the Ore Reserve. |
| | | ● The modifying factors used are considered realistic for this project based on the geotechnical environment and mining methods selected and assuming good practise is applied. The values applied are in-line with published data from similar scale operations. |
| | | ● The reconciliation between the mined estimated tonnes and grade reconcile well with the weightometer and grade sampling with a +0.6% variance on tonnage, +0.7% variance on grade and 1.3% variance on ounces. |
| | | ● The Gounkoto Underground Ore Reserve estimate is rated as probable in-line with the Mineral Resource classification. A 3rd party review of the Resource model was completed in 2015. The findings were satisfactory. |
| | | ● Due to the complex nature of the deposit it is recognised there will be local deviations to the Ore Reserve estimate hence the level of confidence is placed as Probable. However, on a global basis there is no evidence to suggest significant risk to the Ore Reserve. |
| | | ● The modifying factors used are considered realistic for this project based on the geotechnical environment and mining methods selected and assuming good practise is applied. The values applied are in-line with published data from similar scale operations. |
| | |
| 18th September 2018 | | Page 349 |