Exhibit 99.2
MANAGEMENT’S DISCUSSION AND ANALYSIS (“MD&A”)
QUARTERLY REPORT ON THE FIRST QUARTER OF 2019
This portion of the Quarterly Report provides management’s discussion and analysis (“MD&A”) of the financial condition and results of operations, to enable a reader to assess material changes in financial condition and results of operations as at, and for the three month period ended March 31, 2019, in comparison to the corresponding prior-year period. The MD&A is intended to help the reader understand Barrick Gold Corporation (“Barrick”, “we”, “our” or the “Company”), our operations, financial performance and present and future business environment. This MD&A, which has been prepared as of May 7, 2019, is intended to supplement and complement the condensed unaudited interim consolidated financial statements and notes thereto, prepared in accordance with International Accounting Standard 34 Interim Financial Reporting (“IAS 34”) as issued by the International Accounting Standards Board (“IASB”), for the three month period ended March 31, 2019 (collectively, the “Financial Statements”), which are included in this Quarterly Report on pages 77 to 93. You are encouraged to review the Financial Statements in conjunction with your review of this MD&A. This MD&A should be read in conjunction with both the annual audited consolidated financial statements for the two years ended December 31, 2018, the
related annual MD&A included in the 2018 Annual Report, and the most recent Form 40–F/Annual Information Form on file with the U.S. Securities and Exchange Commission (“SEC”) and Canadian provincial securities regulatory authorities. These documents and additional information relating to the Company are available on SEDAR at www.sedar.com and EDGAR at www.sec.gov. Certain notes to the Financial Statements are specifically referred to in this MD&A and such notes are incorporated by reference herein. All dollar amounts in this MD&A are in millions of United States dollars (“$” or “US$”), unless otherwise specified.
For the purposes of preparing our MD&A, we consider the materiality of information. Information is considered material if: (i) such information results in, or would reasonably be expected to result in, a significant change in the market price or value of our shares; or (ii) there is a substantial likelihood that a reasonable investor would consider it important in making an investment decision; or (iii) it would significantly alter the total mix of information available to investors. We evaluate materiality with reference to all relevant circumstances, including potential market sensitivity.
CAUTIONARY STATEMENT ON FORWARD-LOOKING INFORMATION
Certain information contained or incorporated by reference in this MD&A, including any information as to our strategy, projects, plans or future financial or operating performance, constitutes “forward-looking statements”. All statements, other than statements of historical fact, are forward-looking statements. The words “believe”, “expect”, “anticipate”, “target”, “plan”, “objective”, “assume”, “intend”, “project”, “pursue”, “goal”, “continue”, “budget”, “estimate”, “potential”, “may”, “will”, “can”, “could”, “would”, “should” and similar expressions identify forward-looking statements. In particular, this MD&A contains forward-looking statements including, without limitation, with respect to: (i) Barrick’s forward-looking production guidance; (ii) estimates of future cost of sales per ounce for gold and per pound for copper, total cash costs per ounce and C1 cash costs per pound, andall-in-sustaining costs per ounce/pound; (iii) cash flow forecasts; (iv) projected capital, operating and exploration expenditures; (v) estimated timing for the integration of assets for the joint venture in Nevada with Newmont Gold Corporation; (vi) targeted debt and cost reductions; (vii) mine life and production rates; (viii) estimated timing for construction of, and production from, new projects; (ix) anticipated gold production from the Deep South Project; (x) the potential for plant expansion at Pueblo Viejo to increase throughput and convert resources into reserves; (xi) our pipeline of high confidence projects at or near existing operations; (xi) potential mineralization and metal or mineral recoveries; (xii) our ability to convert resources into reserves; (xiii) asset sales, joint ventures and partnerships; and (xiv) expectations regarding future price assumptions, financial performance and other outlook or guidance.
Forward-looking statements are necessarily based upon a number of estimates and assumptions including material estimates and assumptions related to the factors set forth
below that, while considered reasonable by the Company as at the date of this MD&A in light of management’s experience and perception of current conditions and expected developments, are inherently subject to significant business, economic and competitive uncertainties and contingencies. Known and unknown factors could cause actual results to differ materially from those projected in the forward-looking statements and undue reliance should not be placed on such statements and information. Such factors include, but are not limited to: fluctuations in the spot and forward price of gold, copper or certain other commodities (such as silver, diesel fuel, natural gas and electricity); the speculative nature of mineral exploration and development; changes in mineral production performance, exploitation and exploration successes; risks associated with projects in the early stages of evaluation and for which additional engineering and other analysis is required; the duration of the Tanzanian ban on mineral concentrate exports; the ultimate terms of any definitive agreement between Acacia and the Government of Tanzania to resolve a dispute relating to the imposition of the concentrate export ban and allegations by the Government of Tanzania that Acacia under-declared the metal content of concentrate exports from Tanzania and related matters; whether Acacia will approve the terms of any final agreement reached between Barrick and the Government of Tanzania with respect to the dispute between Acacia and the Government of Tanzania; the ability to realize the anticipated benefits of the proposed Nevada joint venture (including estimated synergies and financial benefits) or implementing the business plan for the proposed Nevada joint venture, including as a result of a delay in its completion or difficulty in integrating the Nevada assets of the companies involved; the risk that the conditions to formation of the proposed Nevada joint venture will not be satisfied; the timing for closing of the Nevada joint venture; the benefits expected from recent
BARRICK FIRST QUARTER 2019 | 17 | MANAGEMENT’S DISCUSSION AND ANALYSIS |
transactions being realized; diminishing quantities or grades of reserves; increased costs, delays, suspensions and technical challenges associated with the construction of capital projects; operating or technical difficulties in connection with mining or development activities, including geotechnical challenges and disruptions in the maintenance or provision of required infrastructure and information technology systems; failure to comply with environmental and health and safety laws and regulations; timing of receipt of, or failure to comply with, necessary permits and approvals; uncertainty whether some or all of Barrick’s targeted investments and projects will meet the Company’s capital allocation objectives and internal hurdle rate; the impact of global liquidity and credit availability on the timing of cash flows and the values of assets and liabilities based on projected future cash flows; adverse changes in our credit ratings; the impact of inflation; fluctuations in the currency markets; changes in U.S. dollar interest rates; risks arising from holding derivative instruments; changes in national and local government legislation, taxation, controls or regulations and/or changes in the administration of laws, policies and practices, expropriation or nationalization of property and political or economic developments in Canada, the United States and other jurisdictions in which the Company or its affiliates do or may carry on business in the future; lack of certainty with respect to foreign legal systems, corruption and other factors that are inconsistent with the rule of law; damage to the Company’s reputation due to the actual or perceived occurrence of any number of events, including negative publicity with respect to the Company’s handling of environmental matters or dealings with community groups, whether true or not; the possibility that future exploration results will not be consistent with the Company’s expectations; risks that exploration data may be incomplete and considerable additional work may be required to complete further evaluation, including but not limited to drilling, engineering and socioeconomic studies and investment; risk of loss due to acts of war, terrorism, sabotage and civil disturbances; litigation and legal and administrative
proceedings; contests over title to properties, particularly title to undeveloped properties, or over access to water, power and other required infrastructure; business opportunities that may be presented to, or pursued by, the Company; our ability to successfully integrate acquisitions or complete divestitures; risks associated with working with partners in jointly controlled assets; employee relations including loss of key employees; increased costs and physical risks, including extreme weather events and resource shortages, related to climate change; and availability and increased costs associated with mining inputs and labor. In addition, there are risks and hazards associated with the business of mineral exploration, development and mining, including environmental hazards, industrial accidents, unusual or unexpected formations, pressures,cave-ins, flooding and gold bullion, copper cathode or gold or copper concentrate losses (and the risk of inadequate insurance, or inability to obtain insurance, to cover these risks).
Many of these uncertainties and contingencies can affect our actual results and could cause actual results to differ materially from those expressed or implied in any forward-looking statements made by, or on behalf of, us. Readers are cautioned that forward-looking statements are not guarantees of future performance. All of the forward-looking statements made in this MD&A are qualified by these cautionary statements. Specific reference is made to the most recent Form40-F/Annual Information Form on file with the SEC and Canadian provincial securities regulatory authorities for a more detailed discussion of some of the factors underlying forward-looking statements and the risks that may affect Barrick’s ability to achieve the expectations set forth in the forward-looking statements contained in this MD&A. We disclaim any intention or obligation to update or revise any forward-looking statements whether as a result of new information, future events or otherwise, except as required by applicable law.
BARRICK FIRST QUARTER 2019 | 18 | MANAGEMENT’S DISCUSSION AND ANALYSIS |
MERGER WITH RANDGOLD RESOURCES LIMITED
On January 1, 2019, Barrick acquired 100% of the issued and outstanding shares of Randgold Resources Limited (“Randgold”) for $7.9 billion based on the December 31, 2018 closing share price of Barrick’s common shares (the “Merger”). We began consolidating the operating results, cash flows and net assets of Randgold from January 1, 2019 and the results presented in this MD&A reflect that. Refer to note 4 of the Financial Statements for further details of this transaction.
USE OFNON-GAAP FINANCIAL PERFORMANCE MEASURES
We use the followingnon-GAAP financial performance measures in our MD&A:
• | “adjusted net earnings” |
• | “free cash flow” |
• | “EBITDA” |
• | “adjusted EBITDA” |
• | “total cash costs per ounce” |
• | “C1 cash costs per pound” |
• | “all-in sustaining costs per ounce/pound” |
• | “all-in costs per ounce” and |
• | “realized price” |
For a detailed description of each of thenon-GAAP financial performance measures used in this MD&A and a detailed reconciliation to the most directly comparable measure under International Financial Reporting Standards (“IFRS”), please refer to theNon-GAAP Financial Performance Measures section of this MD&A on pages 57 to 72. Eachnon-GAAP financial performance measure has been annotated with a reference to an endnote on page 73. Thenon-GAAP financial performance measures set out in this MD&A are intended to provide additional information to investors and do not have any standardized meaning under IFRS, and therefore may not be comparable to other issuers, and should not be considered in isolation or as a substitute for measures of performance prepared in accordance with IFRS.
Changes in Presentation ofNon-GAAP Financial Performance Measures
Total cash costs
Starting in the first quarter of 2019, we have renamed “cash costs” to “total cash costs” when referring to our gold production. The calculation of total cash costs is identical to our previous calculation of cash costs with only a change in the naming convention of thisnon-GAAP measure.
All-in sustaining costs andall-in costs
Starting in the first quarter of 2019, we have included sustaining capital expenditures and project capital expenditures on a cash basis instead of an accrual basis. As a result of adopting IFRS 16Leases, the full lease amount is included in accrued capital expenditures on initial recognition. We believe that the change in capital expenditures from an accrual basis to a cash basis better reflects the timing of costs associated with our operations. The original World Gold Council (“WGC”) Guidance Note explicitly excluded certain financing activities fromall-in sustaining costs andall-in costs. As a result of the new lease accounting standard, the WGC Guidance Note was updated to include both the principal and interest portion of the cash lease payment in theall-in sustaining costs andall-in cost metrics. We have updated our calculation accordingly. Prior periods have not been restated but would not be materially different.
INDEX | page | ||||||||
Overview | |||||||||
Financial and Operating Highlights | 20 | ||||||||
Key Business Developments | 23 | ||||||||
Full Year 2019 Outlook | 24 | ||||||||
Production and Cost Summary | 26 | ||||||||
Operating Divisions Performance | 28 | ||||||||
Barrick Nevada | 29 | ||||||||
Cortez | 30 | ||||||||
Goldstrike | 32 | ||||||||
Turquoise Ridge | 34 | ||||||||
Pueblo Viejo | 35 | ||||||||
Loulo-Gounkoto | 37 | ||||||||
Kibali | 38 | ||||||||
Veladero | 39 | ||||||||
Acacia Mining plc | 41 | ||||||||
Other Mines | 43 | ||||||||
Projects | 45 | ||||||||
Exploration | 46 | ||||||||
Review of Financial Results | 48 | ||||||||
Revenue | 48 | ||||||||
Production Costs | 49 | ||||||||
Capital Expenditures | 50 | ||||||||
General and Administrative Expenses | 51 | ||||||||
Exploration, Evaluation and Project Expenses | 51 | ||||||||
Finance Costs, Net | 51 | ||||||||
Additional Significant Statement of Income Items | 52 | ||||||||
Income Tax Expense | 52 | ||||||||
Financial Condition Review | 53 | ||||||||
Balance Sheet Review | 53 | ||||||||
Shareholders’ Equity | 53 | ||||||||
Financial Position and Liquidity | 53 | ||||||||
Summary of Cash Inflow (Outflow) | 54 | ||||||||
Commitments and Contingencies | 55 | ||||||||
Review of Quarterly Results | 56 | ||||||||
Internal Control over Financial Reporting and Disclosure Controls and Procedures | 56 | ||||||||
IFRS Critical Accounting Policies and Accounting Estimates | 57 | ||||||||
Non-GAAP Financial Performance Measures | 57 | ||||||||
Technical Information | 73 | ||||||||
Endnotes | 73 | ||||||||
Financial Statements | 77 | ||||||||
Notes to Consolidated Financial Statements
|
| 82
|
|
BARRICK FIRST QUARTER 2019 | 19 | MANAGEMENT’S DISCUSSION AND ANALYSIS |
OVERVIEW
Financial and Operating Highlights
For the three months ended | ||||||||||||||||||||
March 31, 2019 | December 31, 2018 | % Change | March 31, 2018 | % Change | ||||||||||||||||
Financial Results($ millions) | ||||||||||||||||||||
Revenues | 2,093 | 1,904 | 10 % | 1,790 | 17 % | |||||||||||||||
Cost of sales | 1,490 | 1,577 | (6)% | 1,152 | 29 % | |||||||||||||||
Net earnings (loss)a | 111 | (1,197 | ) | 109 % | 158 | (30)% | ||||||||||||||
Adjusted net earningsb | 184 | 69 | 167 % | 170 | 8 % | |||||||||||||||
Adjusted EBITDAb | 1,002 | 806 | 24 % | 820 | 22 % | |||||||||||||||
Total capital expenditures - sustainingc | 253 | 267 | (5)% | 233 | 9 % | |||||||||||||||
Total project capital expendituresc | 120 | 100 | 20 % | 93 | 29 % | |||||||||||||||
Total consolidated capital expendituresc,d | 374 | 374 | 0 % | 326 | 15 % | |||||||||||||||
Net cash provided by operating activities | 520 | 411 | 27 % | 507 | 3 % | |||||||||||||||
Free cash flowb | 146 | 37 | 295 % | 181 | (19%) | |||||||||||||||
Per share data (dollars) | ||||||||||||||||||||
Net earnings (loss) (basic and diluted) | 0.06 | (1.02 | ) | 106 % | 0.14 | (57)% | ||||||||||||||
Adjusted net earnings (basic)b | 0.11 | 0.06 | 83 % | 0.15 | (27)% | |||||||||||||||
Weighted average diluted common shares (millions of shares) | 1,746 | 1,168 | 49 % | 1,167 | 50 % | |||||||||||||||
Operating Results | ||||||||||||||||||||
Gold production (thousands of ounces)e | 1,367 | 1,262 | 8 % | 1,049 | 30 % | |||||||||||||||
Gold sold (thousands of ounces)e | 1,365 | 1,232 | 11 % | 1,071 | 27 % | |||||||||||||||
Per ounce data | ||||||||||||||||||||
Market gold price ($/oz) | 1,304 | 1,226 | 6 % | 1,329 | (2)% | |||||||||||||||
Realized gold priceb,e($/oz) | 1,307 | 1,223 | 7 % | 1,332 | (2)% | |||||||||||||||
Cost of sales (Barrick’s share)e,f($/oz) | 947 | 980 | (3)% | 878 | 8 % | |||||||||||||||
Total cash costsb,e($/oz) | 631 | 588 | 7 % | 573 | 10 % | |||||||||||||||
All-in sustaining costsb,e($/oz) | 825 | 788 | 5 % | 804 | 3 % | |||||||||||||||
Copper production (millions of pounds)g | 106 | 109 | (3)% | 85 | 25 % | |||||||||||||||
Copper sold (millions of pounds)g | 103 | 109 | (6)% | 85 | 21 % | |||||||||||||||
Per pound data | ||||||||||||||||||||
Market copper price ($/lb) | 2.82 | 2.80 | 1 % | 3.16 | (11)% | |||||||||||||||
Realized copper priceb,g($/lb) | 3.07 | 2.76 | 11 % | 2.98 | 3 % | |||||||||||||||
Cost of sales (Barrick’s share)g,h($/lb) | 2.21 | 2.85 | (22)% | 2.07 | 7 % | |||||||||||||||
C1 cash costsb,g($/lb) | 1.66 | 1.98 | (16)% | 1.88 | (12)% | |||||||||||||||
All-in sustaining costsb,g($/lb) | 2.46 | 2.95 | (17)% | 2.61 | (6)% | |||||||||||||||
As at March 31, 2019 | As at December 31, 2018 | % Change | As at March 31, 2018 | % Change | ||||||||||||||||
Financial Position(millions) | ||||||||||||||||||||
Debt (current and long-term) | 5,807 | 5,738 | 1 % | 6,401 | (9)% | |||||||||||||||
Cash and equivalents | 2,153 | 1,571 | 37 % | 2,384 | (10)% | |||||||||||||||
Debt, net of cash | 3,654 | 4,167 | (12)% | 4,017 | (9)% |
a. | Net earnings (loss) represents net earnings (loss) attributable to the equity holders of the Company. |
b. | Adjusted net earnings, adjusted EBITDA, free cash flow, adjusted net earnings per share, realized gold price,all-in sustaining costs, total cash costs, C1 cash costs and realized copper price arenon-GAAP financial performance measures with no standardized meaning under IFRS and therefore may not be comparable to similar measures presented by other issuers. For further information and a detailed reconciliation of eachnon-GAAP measure to the most directly comparable IFRS measure, please see pages 57 to 72 of our first quarter MD&A. |
c. | Amounts presented on a consolidated cash basis. Project capital expenditures are included in our calculation ofall-in costs, but not included in our calculation of all- in sustaining costs. |
d. | Total consolidated capital expenditures also includes capitalized interest. |
e. | Includes Acacia on a 63.9% basis, Pueblo Viejo on a 60% basis, South Arturo on a 60% basis, and Veladero on a 50% basis, which reflects our equity share of production and sales. Also includes Loulo-Gounkoto on an 80% basis, Kibali on a 45% basis, Tongon on an 89.7% basis and Morila on a 40% basis, which reflects our equity share of production and sales, commencing January 1, 2019, the effective date of the merger with Randgold. |
f. | Cost of sales per ounce (Barrick’s share) is calculated as cost of sales - gold on an attributable basis (excluding Pierina) divided by gold ounces sold. |
g. | Amounts reflect production and sales from Jabal Sayid and Zaldívar on a 50% basis, which reflects our equity share of production, and Lumwana. |
h. | Cost of sales per pound (Barricks share) is calculated as cost of sales - copper plus our equity share of cost of sales attributable to Zaldívar and Jabal Sayid divided by copper pounds sold. |
BARRICK FIRST QUARTER 2019 | 20 | MANAGEMENT’S DISCUSSION AND ANALYSIS |
Operating Cash Flow and Free Cash Flowa | Debt, net of cash ($ billions) | |
|
Gold Production (thousands of ounces)
| Cost of Salesb, Total Cash Costsa and All-in Sustaining Costsa ($ per pound)
| |
Copper Production (millions of pounds)
| Cost of Salesb, Total Cash Costsa and All-in Sustaining Costsa ($ per ounce)
| |
|
a. | These arenon-GAAP financial performance measures with no standardized meaning under IFRS and therefore may not be comparable to similar measures presented by other issuers. For further information and a detailed reconciliation of eachnon-GAAP measure to the most directly comparable IFRS measure, please see pages 57 to 72 of this MD&A. |
b. | Cost of sales applicable to gold per ounce is calculated using cost of sales applicable to gold on an attributable basis (removing thenon-controlling interest of 40% Pueblo Viejo, 36.1% Acacia and 40% South Arturo from cost of sales), divided by attributable gold ounces. Thenon-controlling interest of 20% Loulo-Gounkoto and 10.3% of Tongon is also removed from cost of sales and our proportionate share of cost of sales attributable to equity method investments (Kibali and Morila) is included commencing January 1, 2019, the effective date of the Merger. Cost of sales applicable to copper per pound is calculated using cost of sales applicable to copper including our proportionate share of cost of sales attributable to equity method investments (Zaldívar and Jabal Sayid), divided by consolidated copper pounds (including our proportionate share of copper pounds from our equity method investments). |
BARRICK FIRST QUARTER 2019 | 21 | MANAGEMENT’S DISCUSSION AND ANALYSIS |
Factors affecting net earnings and adjusted net earnings1 - three months ended March 31, 2019 versus December 31, 2018
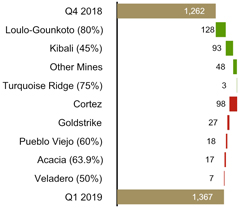
Net earnings attributable to equity holders of Barrick (“net earnings”) for the three months ended March 31, 2019 were $111 million compared with a net loss of $1,197 million in the prior quarter. The significant increase was primarily due to thede-recognition of deferred tax assets of $814 million in the prior quarter. This was combined with impairments of $246 million ($160 million net of tax) ofnon-current assets and $154 million (no tax impact) of goodwill at the Veladero mine, and inventory impairment at Lagunas Norte of $166 million in the prior quarter. After adjusting for items that are not indicative of future operating earnings, adjusted net earnings1 of $184 million for the three months ended March 31, 2019 were 167% higher than the prior quarter. The increase in adjusted net earnings was primarily due to the Merger and the commencement of the contribution of Randgold’s operations to Barrick’s net earnings. Excluding the impact of the merger, gold revenues decreased by 7%, primarily due to lower gold sales of 154 thousand ounces compared to the prior quarter, mainly due to lower grades at Cortez, Goldstrike, and Pueblo Viejo. Net earnings were also positively impacted by higher realized gold prices1 of $1,307 per ounce in the three months ended March 31, 2019 compared to $1,223 per ounce in the prior quarter. Excluding the impact of the Merger, direct mining costs decreased by 20%, primarily due to the lower sales volume and the impact of business improvement initiatives at Pueblo Viejo and Veladero.
Factors affecting net earnings and adjusted net earnings1 - three months ended March 31, 2019 versus March 31, 2018
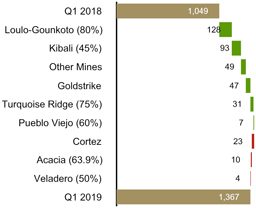
Net earnings for the first quarter of 2019 were $111 million compared with $158 million in the same prior year period. The decrease was mainly due to $32 million relating to organizational restructuring, primarily related to our assets in Peru, and higher foreign currency translation losses primarily relating to the significant weakening of the Argentine peso on the value-added taxes receivable balances. After adjusting for items that are not indicative of future operating earnings, adjusted net earnings1 of $184 million in the first quarter of 2019 were $14 million higher than the same prior year period. The increase in adjusted net earnings was primarily due to the Merger and the commencement of the contribution of Randgold’s operations to Barrick’s net earnings. Excluding the impact of the Merger, gold revenues and cost of sales applicable to gold remained relatively in line with the same prior year period, with no significant movements in realized gold prices1 or sales. Net earnings were also positively impacted by higher copper sales volume primarily due to higher throughput, grade, and recovery at Lumwana and Jabal Sayid following operational improvements at those sites. This was further impacted by higher realized copper price1 of $3.07 per pound in the first quarter of 2019 compared to $2.98 per pound in the same prior year period. This was partially offset by higher copper cost of sales as a result of higher sales volumes.
Significant adjusting items(pre-tax and excludingnon-controlling interest effects) in the three months ended March 31, 2019 include:
• | $47 million in other expense adjustments, including $32 million relating to organizational restructuring, primarily related to our assets in Peru and $15 million relating to the impact of changes in the discount rate assumptions on our closed mine rehabilitation provision; and |
• | $22 million in foreign currency translation losses primarily related to the significant weakening of the Argentine peso on the value-added taxes receivable balances. |
Refer to page 58 for a full list of reconciling items between net earnings and adjusted net earnings1 for the current and previous periods.
Factors affecting Operating Cash Flow and Free Cash Flow1 - three months ended March 31, 2019 versus December 31, 2018
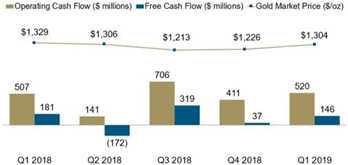
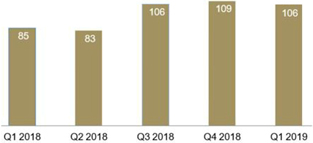
In the three months ended March 31, 2019, we generated $520 million in operating cash flow, compared to $411 million in the prior quarter. The increase of $109 million is primarily due to less cash interest paid during the quarter mainly due to timing, combined with an increase in sales volume as a result of the Merger and the commencement of the contribution of Randgold’s operations to Barrick’s cash flows. Operating cash flow was also positively impacted by higher realized gold and copper prices1 of $1,307 per ounce and $3.07 per pound, respectively, in the three months ended March 31, 2019 compared to $1,223 per ounce and $2.76 per pound, respectively, in the prior quarter.
Free cash flow1 for the three months ended March 31, 2019 was $146 million, compared to $37 million in the prior quarter, reflecting higher operating cash flows, while capital expenditures remained in line with the prior quarter. In the three months ended March 31, 2019, capital expenditures on a cash basis were $374 million, consistent with the prior quarter, as an increase in project capital expenditures was offset by a decrease in minesite sustaining capital expenditures. The increase in project capital expenditures primarily relates to the funding of a power transmission line in Argentina as a result of an agreement made with the Provincial Power Regulatory Body of San Juan (“EPRE”). Minesite sustaining capital expenditures decreased in the first quarter of 2019 mainly due to the deferral of spending at Pueblo Viejo relating to tailing pumps and the Bonao Substation III project. This was combined with lower expenditures at Cortez associated with the Area 34 leach pad expansion and the purchase of underground mobile equipment occurring in the prior quarter.
1 Numerical annotations throughout the text of this document refer to the endnotes found on page 73.
BARRICK FIRST QUARTER 2019 | 22 | MANAGEMENT’S DISCUSSION AND ANALYSIS |
Factors affecting Operating Cash Flow and Free Cash Flow1 - three months ended March 31, 2019 versus March 31, 2018
In the first quarter of 2019, we generated $520 million in operating cash flow, compared to $507 million in the same prior year period. The increase of $13 million was primarily due to higher sales volume as a result of the Merger and the commencement of the contribution of Randgold’s operations to Barrick’s cash flows. This was partially offset by lower realized gold prices1 of $1,307 per ounce in the three months ended March 31, 2019 compared to $1,332 per ounce in the same prior year period, and higher direct mining costs as a result of the increased sales volume.
In the first quarter of 2019, we generated free cash flow1 of $146 million compared to $181 million in the same prior year period. The decrease primarily reflects higher capital expenditures, partially offset by higher operating cash flows. In the first quarter of 2019, capital expenditures on a cash basis were $374 million compared to $326 million in the first quarter of 2018. The increase in capital expenditures of $48 million is primarily due to higher project capital expenditures and higher minesite sustaining capital expenditures. The increase in project capital expenditures is primarily due to the funding of a power transmission line in Argentina between Veladero and Pascua-Lama. Minesite sustaining capital expenditures increased compared to the same prior year period as a result of the Merger.
Key Business Developments
Randgold Resources Limited Merger
On January 1, 2019, we acquired 100% of the issued and outstanding shares of Randgold. Each Randgold shareholder received 6.1280 common shares of Barrick for each Randgold share, which resulted in the issuance of 583,669,178 Barrick common shares. After this share issuance, Barrick shareholders owned 66.7%, while former Randgold shareholders owned 33.3%, of the shares of the combined company. We have determined that this transaction represents a business combination with Barrick identified as the acquirer. Based on the December 31, 2018 closing share price of Barrick’s common shares, the total consideration of the acquisition is $7.9 billion.
Randgold was a publicly traded mining company with ownership interests in the following gold mines: Kibali in the Democratic Republic of Congo; Tongon in Côte d’Ivoire; Loulo-Gounkoto and Morila in Mali; and the Massawa project in Senegal and various exploration properties. We began consolidating the operating results, cash flows and net assets of Randgold from January 1, 2019.
In conjunction with the Merger, Barrick has a new management team, effective January 1, 2019. Mark Bristow is now President and Chief Executive Officer of Barrick. Mark was formerly the Chief Executive Officer of Randgold, a position he held since its incorporation in 1995. Graham Shuttleworth is now Senior Executive Vice-President and Chief Financial Officer of Barrick, having formerly served as Randgold‘s Chief Financial Officer since 2007. Kevin Thomson, Senior Executive Vice-President, Strategic Matters, continues in the role to which he was appointed at Barrick in October 2014.
In addition, Barrick will be managed by three regional Chief Operating Officers, each of whom report to the President and CEO. Mark Hill, formerly Barrick’s Chief Investment Officer, was appointed Chief Operating Officer, LATAM and Australia Pacific. Willem Jacobs, formerly Randgold’s General Manager East and Central Africa, was appointed Chief Operating Officer, Africa and Middle East. Catherine Raw, formerly Barrick’s Chief Financial Officer, was appointed Chief Operating Officer, North America.
Following the closing of the Merger, Barrick’s Board of Directors was reconstituted with the following nine Directors: John Thornton (Executive Chairman), Brett Harvey (Lead Independent Director) Mark Bristow, María Ignacia Benítez, Gustavo Cisneros, Christopher Coleman, Michael Evans, Brian Greenspun, and Andrew Quinn. Regrettably, on February 28, 2019, María Ignacia Benítez passed away. Barricks Corporate Governance & Nominating Committee is now actively looking for an equally compelling and qualified female candidate to appoint to the Board.
Nevada Joint Venture
On March 10, 2019, we entered into an implementation agreement with Newmont Mining Corporation, now Newmont Goldcorp Corporation, (“Newmont”) to create a joint venture combining our respective mining operations, assets, reserves and talent in Nevada, USA. This includes Barrick’s Cortez, Goldstrike, Turquoise Ridge and Goldrush properties and Newmont’s Carlin, Twin Creeks, Phoenix, Long Canyon and Lone Tree properties. Barrick will be the operator of the joint venture and will own 61.5%, with Newmont owning the remaining 38.5% of the joint venture. Practical measures required to integrate the joint venture assets and establish the new business are now being taken and are anticipated to be completed by the end of the second quarter of 2019.
BARRICK FIRST QUARTER 2019 | 23 | MANAGEMENT’S DISCUSSION AND ANALYSIS |
Full Year 2019 Outlook
We are maintaining our 2019 consolidated gold production guidance of5.1-5.6 million ounces. As previously indicated, we have now updated our cost of sales4 to be$910-$970 per ounce and depreciation to be$290-$330 per ounce, reflecting the additional depreciation arising from the preliminary purchase price allocation relating to Randgold’s Loulo-Gounkoto, Kibali, Tongon and Morila mines.
As a result of the changes to our reportable operating segments, commencing in this MD&A, we are providing separate guidance for our Cortez and Goldstrike mines, which we previously presented together as Barrick Nevada. Starting with this MD&A, references to Barrick Nevada also include our 75% interest in Turquoise Ridge.
All other guidance metrics are unchanged.
Five year outlook (2019-2023)
We currently expect our five-year gold production and cost outlook to be within the 2019 outlook ranges, albeit that total cash costs1 andall-in sustaining costs1 are expected to decline over that period to below the bottom of these ranges.
Nevada Joint Venture
We are engaged in reviewing the impact of the Nevada Joint Venture on our guidance and five year outlook and expect to provide an update later this year.
Group Outlook | 2019 | |||
($ millions, except per ounce/pound data) | Estimate | |||
Gold production (millions of ounces) | 5.10 - 5.60 | |||
Gold unit production costs | ||||
Cost of sales - gold ($/oz) | 910 - 970 | |||
Total cash costs ($/oz)a | 650 - 700 | |||
Depreciation ($/oz) | 290 - 330 | |||
All-in sustaining costs ($/oz)a | 870 - 920 | |||
Copper production (millions of pounds) | 375 - 430 | |||
Copper unit production costs | ||||
Cost of sales - copper ($/b) | 2.30 - 2.70 | |||
C1 cash costs ($/lb)a | 1.70 - 2.00 | |||
Depreciation ($/lb) | 0.60 - 0.70 | |||
Copperall-in sustaining costs ($/lb)a | 2.40 - 2.90 | |||
Exploration and project expenses | 280 - 340 | |||
Exploration and evaluation | 160 - 170 | |||
Project expenses | 120 - 150 | |||
General and administrative expenses | ~200 | |||
Corporate administration | ~140 | |||
Share-based compensationb | ~40 | |||
Acaciac | ~20 | |||
Other expense | 80 - 100 | |||
Finance costs | 500 - 550 | |||
Attributable capital expenditures: | ||||
Attributable minesite sustaining | 1,100 - 1,300 | |||
Attributable project | 300 - 400 | |||
Total attributable capital expendituresd | 1,400 - 1,700 | |||
Effective income tax ratee | 40% - 50% | |||
Key Assumptions | ||||
Gold Price ($/oz) | 1,250 | |||
Copper Price ($/lb) | 2.75 | |||
Oil Price (WTI) ($/barrel) | 65 | |||
AUD Exchange Rate (AUD:USD) | 0.75 | |||
ARS Exchange Rate (USD:ARS) | 46.00 | |||
CAD Exchange Rate (USD:CAD) | 1.30 | |||
CLP Exchange Rate (USD:CLP) | 650 | |||
EUR Exchange Rate (EUR:USD) | 1.15 |
a. | Total cash costs, C1 cash costs andall-in sustaining costs arenon-GAAP financial performance measures with no standardized meaning under IFRS and therefore may not be comparable to similar measures of performance presented by other issuers. For further information and a detailed reconciliation of thenon-GAAP measures used in this section of the MD&A to the most directly comparable IFRS measure, please see pages 57 to 72 of this MD&A. |
b. | Based on US$12.40 share price and excludes Acacia. |
c. | Includes share-based compensation based on £1.50 share price or ~US $2.00 share price. |
d. | 2019 Guidance includes our 60% share of Pueblo Viejo and South Arturo, our 80% share of Loulo-Gounkoto, our 89.7% share of Tongon, our 63.9% share of Acacia, our 50% share of Zaldívar and Jabal Sayid, our 45% of Kibali, and our share of joint operations. |
e. | Based on spot gold price as at March 31, 2019. |
BARRICK FIRST QUARTER 2019 | 24 | MANAGEMENT’S DISCUSSION AND ANALYSIS |
Operating Division Guidance
Our 2019 forecast gold and copper production, cost of sales, total cash costs1, andall-in sustaining costs1 ranges by operating division are as follows:
Operating Division | 2019 forecast production (000s ozs) | 2019 forecast cost of salesa ($/oz) | 2019 forecast total cash costsb ($/oz) | 2019 forecast all-in sustaining costsb ($/oz) | ||||||||||||
Gold | ||||||||||||||||
Cortez | 850 - 920 | 810 - 850 | 530 - 580 | 750 - 800 | ||||||||||||
Goldstrikec | 900 - 980 | 1,020 - 1,080 | 740 - 790 | 950 - 990 | ||||||||||||
Turquoise Ridge (75%) | 270 - 310 | 655 - 705 | 550 - 600 | 680 - 730 | ||||||||||||
Pueblo Viejo (60%) | 550 - 600 | 780 - 830 | 465 - 510 | 610 - 650 | ||||||||||||
Loulo-Gounkoto (80%) | 520 - 570 | 880 - 930 | 575 - 625 | 810 - 850 | ||||||||||||
Kibali (45%) | 330 - 350 | 1,150 - 1,200 | 555 - 605 | 670 - 730 | ||||||||||||
Kalgoorlie (50%) | 280 - 300 | 920 - 970 | 740 - 790 | 920 - 960 | ||||||||||||
Tongon (89.7%) | 250 - 270 | 1,300 - 1,350 | 710 - 760 | 780 - 820 | ||||||||||||
Porgera (47.5%) | 240 - 260 | 980 - 1,030 | 800 - 850 | 985 - 1,025 | ||||||||||||
Veladero (50%) | 230 - 250 | 1,250 - 1,350 | 770 - 820 | 1,150 - 1,250 | ||||||||||||
Hemlo | 200 - 220 | 890 - 940 | 765 - 815 | 1,100 - 1,200 | ||||||||||||
Acacia (63.9%) | 320 - 350 | 920 - 970 | 665 - 710 | 860 - 920 | ||||||||||||
Other Sitesd | 190 - 250 | 1,155 - 1,240 | 895 - 945 | 1,055 - 1,115 | ||||||||||||
Total Consolidated Barricke,f,g
|
|
5,100 - 5,600
|
|
|
910 - 970
|
|
|
650 - 700
|
|
|
870 - 920
|
| ||||
2019 forecast production (millions lbs) | 2019 forecast cost of salesa ($/lb) | 2019 forecast C1 cash costsb ($/lb) | 2019 forecastall-in sustaining costsb ($/lb) | |||||||||||||
Copper | ||||||||||||||||
Lumwana | 210 - 240 | 2.25 - 2.50 | 1.80 - 2.10 | 2.75 - 3.15 | ||||||||||||
Zaldívar (50%) | 120 - 130 | 2.40 - 2.70 | 1.65 - 1.85 | 2.00 - 2.20 | ||||||||||||
Jabal Sayid (50%) | 45 - 60 | 2.00 - 2.30 | 1.60 - 1.90 | 1.60 - 1.90 | ||||||||||||
Total Copperg
|
|
375 - 430
|
|
|
2.30 - 2.70
|
|
|
1.70 - 2.00
|
|
|
2.40 - 2.90
|
|
a. | Cost of sales applicable to gold per ounce is calculated using cost of sales applicable to gold on an attributable basis (removing thenon-controlling interest of 40% Pueblo Viejo, 20% of Loulo-Gounkoto, 10.3% of Tongon, 36.1% Acacia and 40% South Arturo from cost of sales and including our proportionate share of cost of sales attributable to equity method investments [Kibali and Morila]), divided by attributable gold ounces sold. Cost of sales applicable to copper per pound is calculated using cost of sales applicable to copper including our proportionate share of cost of sales attributable to equity method investments (Zaldívar and Jabal Sayid), divided by consolidated copper pounds sold (including our proportionate share of copper pounds sold from our equity method investments). |
b. | Total cash costs,all-in sustaining costs and C1 cash costs arenon-GAAP financial performance measures with no standardized meaning under IFRS and therefore may not be comparable to similar measures of performance presented by other issuers. For further information and a detailed reconciliation of thenon-GAAP measures used in this section of the MD&A to the most directly comparable IFRS measures, please see pages 61 to 76 of this MD&A. |
c. | Includes our 60% share of South Arturo. |
d. | Other sites include Lagunas Norte, Golden Sunlight, and Morila (40%) and excludes Pierina which is mining incidental ounces as it enters closure. |
e. | Total cash costs andall-in sustaining costs per ounce include the impact of hedges and/or costs allocated tonon-operating sites. |
f. | Operating unit guidance ranges reflect expectations at each individual operating unit, and may not add up to the company-wide guidance range total. Guidance ranges exclude Pierina which is mining incidental ounces as it enters closure. |
g. | Includes corporate administration costs. |
BARRICK FIRST QUARTER 2019 | 25 | MANAGEMENT’S DISCUSSION AND ANALYSIS |
Production and Cost Summary - Gold
For the three months ended | ||||||||||||||||||
March 31, 2019 | December 31, 2018 | % Change | March 31, 2018 | % Change | ||||||||||||||
Barrick Nevadaa | ||||||||||||||||||
Gold produced (000s oz) | 572 | 694 | (18) | % | 517 | 11 % | ||||||||||||
Cost of sales ($/oz) | 780 | 793 | (2) | % | 829 | (6)% | ||||||||||||
Total cash costs ($/oz)b | 542 | 501 | 8 | % | 533 | 2 % | ||||||||||||
All-in sustaining costs ($/oz)b | 678 | 616 | 10 | % | 694 | (2)% | ||||||||||||
Cortez | ||||||||||||||||||
Gold produced (000s oz) | 262 | 360 | (27) | % | 285 | (8)% | ||||||||||||
Cost of sales ($/oz) | 682 | 675 | 1 | % | 682 | 0 % | ||||||||||||
Total cash costs ($/oz)b | 433 | 350 | 24 | % | 363 | 19 % | ||||||||||||
All-in sustaining costs ($/oz)b | 506 | 424 | 19 | % | 414 | 22 % | ||||||||||||
Goldstrikec | ||||||||||||||||||
Gold produced (000s oz) | 233 | 260 | (10) | % | 186 | 25 % | ||||||||||||
Cost of sales ($/oz) | 947 | 952 | (1) | % | 1,076 | (12)% | ||||||||||||
Total cash costs ($/oz)b | 671 | 656 | 2 | % | 755 | (11)% | ||||||||||||
All-in sustaining costs ($/oz)b | 891 | 833 | 7 | % | 1,094 | (19)% | ||||||||||||
Turquoise Ridge (75%) | ||||||||||||||||||
Gold produced (000s oz) | 77 | 74 | 4 | % | 46 | 67 % | ||||||||||||
Cost of sales ($/oz) | 592 | 802 | (26) | % | 720 | (18)% | ||||||||||||
Total cash costs ($/oz)b | 506 | 701 | (28) | % | 601 | (16)% | ||||||||||||
All-in sustaining costs ($/oz)b | 592 | 798 | (26) | % | 709 | (17)% | ||||||||||||
Pueblo Viejo (60%) | ||||||||||||||||||
Gold produced (000s oz) | 148 | 166 | (11) | % | 141 | 5 % | ||||||||||||
Cost of sales ($/oz) | 696 | 686 | 1 | % | 683 | 2 % | ||||||||||||
Total cash costs ($/oz)b | 421 | 425 | (1) | % | 409 | 3 % | ||||||||||||
All-in sustaining costs ($/oz)b | 543 | 559 | (3) | % | 571 | (5)% | ||||||||||||
Loulo-Gounkoto (80%)d | ||||||||||||||||||
Gold produced (000s oz) | 128 | 154 | (17) | % | ||||||||||||||
Cost of sales ($/oz) | 1,052 | |||||||||||||||||
Total cash costs ($/oz)b | 684 | |||||||||||||||||
All-in sustaining costs ($/oz)b | 840 | |||||||||||||||||
Kibali (45%)d | ||||||||||||||||||
Gold produced (000s oz) | 93 | 94 | (1) | % | ||||||||||||||
Cost of sales ($/oz) | 1,202 | |||||||||||||||||
Total cash costs ($/oz)b | 573 | |||||||||||||||||
All-in sustaining costs ($/oz)b | 673 | |||||||||||||||||
Kalgoorlie (50%) | ||||||||||||||||||
Gold produced (000s oz) | 55 | 58 | (5) | % | 85 | (35)% | ||||||||||||
Cost of sales ($/oz) | 1,064 | 1,022 | 4 | % | 865 | 23 % | ||||||||||||
Total cash costs ($/oz)b | 870 | 857 | 2 | % | 690 | 26 % | ||||||||||||
All-in sustaining costs ($/oz)b | 1,185 | 1,054 | 12 | % | 836 | 42 % | ||||||||||||
Tongon (89.7%)d | ||||||||||||||||||
Gold produced (000s oz) | 61 | 72 | (15) | % | ||||||||||||||
Cost of sales ($/oz) | 1,451 | |||||||||||||||||
Total cash costs ($/oz)b | 799 | |||||||||||||||||
All-in sustaining costs ($/oz)b | 836 | |||||||||||||||||
Porgera (47.5%) | ||||||||||||||||||
Gold produced (000s oz) | 66 | 70 | (6) | % | 40 | 65 % | ||||||||||||
Cost of sales ($/oz) | 1,031 | 733 | 41 | % | 1,138 | (9)% | ||||||||||||
Total cash costs ($/oz)b | 854 | 786 | 9 | % | 801 | 7 % | ||||||||||||
All-in sustaining costs ($/oz)b | 978 | 1,018 | (4) | % | 1,111 | (12)% |
BARRICK FIRST QUARTER 2019 | 26 | MANAGEMENT’S DISCUSSION AND ANALYSIS |
Production and Cost Summary - Gold (continued)
For the three months ended | ||||||||||||||||||
March 31, 2019 | December 31, 2018 | % Change | March 31, 2018 | % Change | ||||||||||||||
Veladero (50%) | ||||||||||||||||||
Gold produced (000s oz) | 70 | 77 | (9) | % | 74 | (5)% | ||||||||||||
Cost of sales ($/oz) | 1,195 | 1,352 | (12) | % | 1,036 | 15 % | ||||||||||||
Total cash costs ($/oz)b | 713 | 823 | (13) | % | 576 | 24 % | ||||||||||||
All-in sustaining costs ($/oz)b | 1,100 | 1,648 | (33) | % | 1,008 | 9 % | ||||||||||||
Hemlo | ||||||||||||||||||
Gold produced (000s oz) | 55 | 52 | 6 | % | 40 | 38 % | ||||||||||||
Cost of sales ($/oz) | 906 | 1,083 | (16) | % | 1,189 | (24)% | ||||||||||||
Total cash costs ($/oz)b | 769 | 932 | (17) | % | 1,095 | (30)% | ||||||||||||
All-in sustaining costs ($/oz)b | 915 | 1,311 | (30) | % | 1,271 | (28)% | ||||||||||||
Acacia (63.9%) | ||||||||||||||||||
Gold produced (000s oz) | 67 | 84 | (20) | % | 77 | (13)% | ||||||||||||
Cost of sales ($/oz) | 1,114 | 852 | 31 | % | 941 | 18 % | ||||||||||||
Total cash costs ($/oz)b | 850 | 651 | 31 | % | 715 | 19 % | ||||||||||||
All-in sustaining costs ($/oz)b | 1,023 | 857 | 19 | % | 976 | 5 % | ||||||||||||
Lagunas Norte | ||||||||||||||||||
Gold produced (000s oz) | 35 | 50 | (30) | % | 66 | (47)% | ||||||||||||
Cost of sales ($/oz) | 1,304 | 4,186 | (69) | % | 542 | 141 % | ||||||||||||
Total cash costs ($/oz)b | 637 | 607 | 5 | % | 330 | 93 % | ||||||||||||
All-in sustaining costs ($/oz)b | 1,018 | 796 | 28 | % | 496 | 105 % | ||||||||||||
Golden Sunlight | ||||||||||||||||||
Gold produced (000s oz) | 7 | 11 | (36) | % | 9 | (22)% | ||||||||||||
Cost of sales ($/oz) | 2,174 | 1,423 | 53 | % | 1,484 | 46 % | ||||||||||||
Total cash costs ($/oz)b | 1,974 | 1,430 | 38 | % | 1,525 | 29 % | ||||||||||||
All-in sustaining costs ($/oz)b | 2,471 | 1,586 | 56 | % | 1,658 | 49 % | ||||||||||||
Morila (40%)d | ||||||||||||||||||
Gold produced (000s oz) | 10 | 8 | 25 | % | ||||||||||||||
Cost of sales ($/oz) | 1,445 | |||||||||||||||||
Total cash costs ($/oz)b | 1,157 | |||||||||||||||||
All-in sustaining costs ($/oz)b | 1,157 | |||||||||||||||||
Total Consolidated | ||||||||||||||||||
Gold produced (000s oz)e | 1,367 | 1,262 | 8 | % | 1,049 | 30 % | ||||||||||||
Cost of sales ($/oz)f | 947 | 980 | (3) | % | 878 | 8 % | ||||||||||||
Total cash costs ($/oz)b | 631 | 588 | 7 | % | 573 | 10 % | ||||||||||||
All-in sustaining costs ($/oz)b | 825 | 788 | 5 | % | 804 | 3 % |
a. | Represents the combined results of Cortez, Goldstrike (including our 60% share of South Arturo), and starting with this MD&A our 75% interest in Turquoise Ridge. |
b. | These arenon-GAAP financial performance measures with no standardized meaning under IFRS and therefore may not be comparable to similar measures presented by other issuers. For further information and a detailed reconciliation of eachnon-GAAP measure used in this section of the MD&A to the most directly comparable IFRS measure, please see pages 57 to 72 of this MD&A. |
c. | Includes production and sales from South Arturo on a 60% basis, which reflects our equity share. |
d. | The results for the three months ended December 31, 2018 did not form a part of the Barrick consolidated results as these sites were acquired as a result of the Merger. As a result, operational statistics are presented for the three months ended December 31, 2018 for reference purposes only. |
e. | Total consolidated gold production for the three months ended December 31, 2018 excludes gold production from the sites acquired as part of the Randgold merger on January 1, 2019. |
f. | Cost of sales per ounce (Barrick’s share) is calculated as cost of sales - gold on an attributable basis (excluding Pierina) divided by gold equity ounces sold. |
BARRICK FIRST QUARTER 2019 | 27 | MANAGEMENT’S DISCUSSION AND ANALYSIS |
Production and Cost Summary - Copper
For the three months ended | ||||||||||||||||||
March 31, 2019 | December 31, 2018 | % Change | March 31, 2018 | % Change | ||||||||||||||
Lumwana | ||||||||||||||||||
Copper production (millions lbs) | 61 | 65 | (6) | % | 48 | 27 % | ||||||||||||
Cost of sales ($/lb) | 2.16 | 3.22 | (33) | % | 2.02 | 7 % | ||||||||||||
C1 cash cash costs ($/lb)a | 1.67 | 2.12 | (21) | % | 2.00 | (17)% | ||||||||||||
All-in sustaining costs ($/lb)a | 2.79 | 3.26 | (14) | % | 2.73 | 2 % | ||||||||||||
Zaldívar (50%) | ||||||||||||||||||
Copper production (millions lbs) | 28 | 29 | (3) | % | 24 | 17 % | ||||||||||||
Cost of sales ($/lb) | 2.68 | 2.55 | 5 | % | 2.37 | 13 % | ||||||||||||
C1 cash cash costs ($/lb)a | 1.91 | 1.91 | 0 | % | 1.84 | 4 % | ||||||||||||
All-in sustaining costs ($/lb)a | 2.12 | 2.50 | (15 | )% | 2.50 | (15)% | ||||||||||||
Jabal Sayid (50%) | ||||||||||||||||||
Copper production (millions lbs) | 17 | 15 | 13 | % | 13 | 31 % | ||||||||||||
Cost of sales ($/lb) | 1.55 | 1.70 | (9) | % | 1.79 | (13)% | ||||||||||||
C1 cash cash costs ($/lb)a | 1.10 | 1.48 | (26) | % | 1.55 | (29)% | ||||||||||||
All-in sustaining costs ($/lb)a | 1.30 | 2.04 | (36) | % | 1.97 | (34)% | ||||||||||||
Total Copper | ||||||||||||||||||
Copper production (millions lbs) | 106 | 109 | (3) | % | 85 | 25 % | ||||||||||||
Cost of sales ($/lb)b | 2.21 | 2.85 | (22) | % | 2.07 | 7 % | ||||||||||||
C1 cash cash costs ($/lb)a | 1.66 | 1.98 | (16) | % | 1.88 | (12)% | ||||||||||||
All-in sustaining costs ($/lb)a | 2.46 | 2.95 | (17) | % | 2.61 | (6)% |
a. | These arenon-GAAP financial performance measures with no standardized meaning under IFRS and therefore may not be comparable to similar measures presented by other issuers. For further information and a detailed reconciliation of eachnon-GAAP measure used in this section of the MD&A to the most directly comparable IFRS measure, please see pages 57 to 72 of our first quarter MD&A. |
b. | Cost of sales per pound (Barricks share) is calculated as cost of sales - copper plus our equity share of cost of sales attributable to Zaldívar and Jabal Sayid divided by copper pounds sold. |
OPERATING DIVISIONS PERFORMANCE
Following the Merger, were-evaluated our reportable operating segments and no longer report on our interests in the followingnon-core properties: Lagunas Norte and Pascua-Lama. In addition, management now reviews the operating results and assesses performance of our operations in Nevada on both a combined and individual minesite level. Our Cortez, Goldstrike and, starting with this MD&A, our 75% interest in Turquoise Ridge minesites collectively are referred to as Barrick Nevada. Our presentation of our reportable operating segments consists of seven gold mines (Cortez, Goldstrike, Turquoise Ridge, Pueblo Viejo, Loulo-Gounkoto,
Kibali and Veladero) and Acacia, a publicly listed company in which we hold a 63.9% equity interest. The remaining operating segments, including our remaining gold mines, copper mines and projects, have been grouped into an “other” category and will not be reported on individually. Segment performance is evaluated based on a number of measures including operating income before tax, production levels and unit production costs. Certain costs are managed on a consolidated basis and are therefore not reflected in segment income.
BARRICK FIRST QUARTER 2019 | 28 | MANAGEMENT’S DISCUSSION AND ANALYSIS |
Barrick Nevadaa, Nevada USA
Summary of Operating and Financial Data | For the three months ended | |||||||||||||||
March 31, 2019
| December 31, 2018
| % Change
| March 31, 2018
| % Change
| ||||||||||||
Total tonnes mined (000s) | 39,745 | 39,829 | 0 % | 52,887 | (25)% | |||||||||||
Open pit ore | 5,581 | 5,914 | (6)% | 3,327 | 68 % | |||||||||||
Open pit waste | 33,104 | 32,960 | 0 % | 48,684 | (32)% | |||||||||||
Underground | 1,060 | 955 | 11 % | 876 | 21 % | |||||||||||
Average grade (grams/tonne) | ||||||||||||||||
Open pit mined | 1.49 | 2.83 | (47)% | 2.13 | (30)% | |||||||||||
Underground mined | 10.65 | 11.51 | (7)% | 10.87 | (2)% | |||||||||||
Processed | 2.72 | 3.58 | (24)% | 3.53 | (23)% | |||||||||||
Ore tonnes processed (000s) | 7,790 | 7,384 | 5 % | 5,481 | 42 % | |||||||||||
Oxide mill | 1,056 | 1,180 | (11)% | 1,063 | (1)% | |||||||||||
Roaster | 1,360 | 1,466 | (7)% | 1,225 | 11 % | |||||||||||
Autoclave | 1,433 | 1,428 | 0 % | 1,193 | 20 % | |||||||||||
Heap leach | 3,941 | 3,310 | 19 % | 2,000 | 97 % | |||||||||||
Recovery rate | 83% | 81% | 2 % | 86% | (3)% | |||||||||||
Oxide Mill | 82% | 82% | 0 % | 85% | (4)% | |||||||||||
Roaster | 87% | 89% | (2)% | 88% | (1)% | |||||||||||
Autoclave | 78% | 68% | 15 % | 71% | 10 % | |||||||||||
Gold produced (000s oz) | 572 | 694 | (18)% | 517 | 11 % | |||||||||||
Oxide mill | 102 | 133 | (23)% | 168 | (39)% | |||||||||||
Roaster | 254 | 375 | (32)% | 207 | 23 % | |||||||||||
Autoclave | 158 | 139 | 14 % | 100 | 58 % | |||||||||||
Heap leach | 58 | 47 | 23 % | 42 | 38 % | |||||||||||
Gold sold (000s oz)
| 574 | 661 | (13)% | 525 | 9 % | |||||||||||
Revenue ($ millions) | 750 | 812 | (8)% | 698 | 7% | |||||||||||
Cost of sales ($ millions) | 448 | 526 | (15)% | 436 | 3 % | |||||||||||
Income ($ millions) | 292 | 266 | 10 % | 259 | 13 % | |||||||||||
EBITDA ($ millions)b | 428 | 459 | (7)% | 414 | 3 % | |||||||||||
Capital expenditures ($ millions)c,d | 149 | 150 | (1)% | 158 | (6)% | |||||||||||
Minesite sustainingc | 70 | 61 | 14 % | 78 | (10)% | |||||||||||
Projectc | 79 | 89 | (11)% | 80 | (1)% | |||||||||||
Cost of sales (per oz) | 780 | 793 | (2)% | 829 | (6)% | |||||||||||
Total cash costs ($/oz)b | 542 | 501 | 8 % | 533 | 2 % | |||||||||||
All-in sustaining costs ($/oz)b | 678 | 616 | 10 % | 694 | (2)% | |||||||||||
All-in costs ($/oz)b | 817 | 751 | 9 % | 848 | (4%) |
a. | Represents the combined results of Cortez, Goldstrike (including our 60% share of South Arturo) and, starting with this MD&A, our 75% interest in Turquoise Ridge. The results in the table for the three months ended December 31, 2018 and March 31, 2018 include our 75% interest in Turquoise Ridge. |
b. | These arenon-GAAP financial performance measures with no standardized meaning under IFRS and therefore may not be comparable to similar measures presented by other issuers. For further information and a detailed reconciliation of eachnon-GAAP measure used in this section of the MD&A to the most directly comparable IFRS measure, please see pages 57 to 72 of this MD&A. |
c. | Presented on a cash basis for the three months ended March 31, 2019, and an accrued basis for the three months ended December 31, 2018 and March 31, 2018 as a result of adopting IFRS 16Leases. Please refer to page 18 of this MD&A for more details. |
d. | Amounts presented exclude capitalized interest. |
Refer to the following pages for a detailed discussion of Cortez, Goldstrike and Turquoise Ridge’s results.
BARRICK FIRST QUARTER 2019 | 29 | MANAGEMENT’S DISCUSSION AND ANALYSIS |
Cortez, Nevada USA
Summary of Operating and Financial Data | For the three months ended | |||||||||||||||
March 31, 2019
| December 31, 2018
| % Change
| March 31, 2018
| % Change
| ||||||||||||
Total tonnes mined (000s) | 27,572 | 28,086 | (2)% | 34,249 | (19)% | |||||||||||
Open pit ore | 4,661 | 4,070 | 15 % | 3,075 | 52 % | |||||||||||
Open pit waste | 22,523 | 23,664 | (5)% | 30,839 | (27)% | |||||||||||
Underground | 388 | 352 | 10 % | 335 | 16 % | |||||||||||
Average grade (grams/tonne) | ||||||||||||||||
Open pit mined | 0.99 | 2.34 | (58)% | 2.10 | (53)% | |||||||||||
Underground mined | 9.36 | 10.74 | (13)% | 11.62 | (19)% | |||||||||||
Processed | 1.66 | 2.65 | (37)% | 2.78 | (40)% | |||||||||||
Ore tonnes processed (000s) | 5,473 | 5,072 | 8 % | 3,436 | 59 % | |||||||||||
Oxide mill | 1,056 | 1,180 | (11)% | 1,063 | (1)% | |||||||||||
Roaster | 476 | 582 | (18)% | 373 | 28 % | |||||||||||
Heap leach | 3,941 | 3,310 | 19 % | 2,000 | 97 % | |||||||||||
Recovery rate | 85% | 83% | 2 % | 93% | (9)% | |||||||||||
Oxide Mill | 82% | 82% | 0 % | 85% | (4)% | |||||||||||
Roaster | 88% | 90% | (2)% | 90% | (2)% | |||||||||||
Gold produced (000s oz) | 262 | 360 | (27)% | 285 | (8)% | |||||||||||
Oxide mill | 102 | 133 | (23)% | 168 | (39)% | |||||||||||
Roaster | 102 | 180 | (43)% | 75 | 36 % | |||||||||||
Heap leach | 58 | 47 | 23 % | 42 | 38 % | |||||||||||
Gold sold (000s oz)
| 259 | 344 | (25)% | 273 | (5)% | |||||||||||
Revenue ($ millions) | 339 | 423 | (20)% | 363 | (7%) | |||||||||||
Cost of sales ($ millions) | 177 | 233 | (24)% | 186 | (5)% | |||||||||||
Income ($ millions) | 155 | 178 | (13)% | 172 | (10)% | |||||||||||
EBITDA ($ millions)a | 219 | 290 | (24)% | 259 | (15)% | |||||||||||
Capital expenditures ($ millions)b,c | 76 | 85 | (11)% | 71 | 6 % | |||||||||||
Minesite sustainingb | 13 | 16 | (21)% | 10 | 28 % | |||||||||||
Projectb | 63 | 69 | (8)% | 61 | 3 % | |||||||||||
Cost of sales (per oz) | 682 | 675 | 1 % | 682 | 0 % | |||||||||||
Total cash costs ($/oz)a | 433 | 350 | 24 % | 363 | 19 % | |||||||||||
All-in sustaining costs ($/oz)a | 506 | 424 | 19 % | 414 | 22 % | |||||||||||
All-in costs ($/oz)a | 749 | 623 | 20 % | 638 | 17% |
a. | These arenon-GAAP financial performance measures with no standardized meaning under IFRS and therefore may not be comparable to similar measures presented by other issuers. For further information and a detailed reconciliation of eachnon-GAAP measure used in this section of the MD&A to the most directly comparable IFRS measure, please see pages 57 to 72 of this MD&A. |
b. | Presented on a cash basis for the three months ended March 31, 2019, and an accrued basis for the three months ended December 31, 2018 and March 31, 2018 as a result of adopting IFRS 16Leases. Please refer to page 18 of this MD&A for more details. |
c. | Amounts presented exclude capitalized interest. |
Safety and Environment
One Lost Time Injury (“LTI”) was recorded during the quarter with a Lost Time Injury Frequency Rate (“LTIFR”) of 1.06 per million hours worked versus 1.98 the previous quarter and 2.25 the same prior year period. No major environmental incident occurred during the quarter.
Financial Results
Q1 2019 compared to Q4 2018
Cortez’s income for the first quarter of 2019 was 13% lower than the fourth quarter of 2018 primarily due to a decrease in sales volume, partially offset by higher realized gold prices1 and lower cost of sales.
Gold production in the first quarter of 2019 was 27% lower compared to the prior quarter, primarily due to expected lower grades mined and processed from the Cortez Hills open pit (“CHOP”) as mining ramps down and is scheduled for
completion in the second quarter of 2019. This was partially offset by a drawdown of gold in circuit inventory from high grade ore in circuit at the end of the prior quarter.
Cost of sales per ounce4 and total cash costs1 in the first quarter of 2019 were $7 per ounce and $83 per ounce higher, respectively, than the prior quarter mainly due to lower production as a result of the lower grades at CHOP. The increase in cost of sales per ounce4 was largely offset by lower depreciation. CHOP has higher depreciation on a per ounce basis relative to other mined ore at Cortez, and so, as mining ramps down, depreciation per ounce falls. In the first quarter of 2019,all-in sustaining costs1 increased by $82 per ounce compared to the prior quarter, again primarily due to lower production resulting from lower grades at CHOP, partially offset by lower minesite sustaining capital expenditures.
BARRICK FIRST QUARTER 2019 | 30 | MANAGEMENT’S DISCUSSION AND ANALYSIS |
Capital expenditures in the first quarter of 2019 decreased by 11% compared to the prior quarter due to lower sustaining capital expenditures and lower project capital expenditures. Lower sustaining capital expenditures relative to the fourth quarter of 2018 is attributed to the prior quarter’s higher expenditure associated with the Area 34 leach pad expansion and the purchase of underground mobile equipment. Lower project capital expenditures are attributed to the Crossroads dewatering well and drain construction ramping down relative to the previous quarter.
Q1 2019 compared to Q1 2018
Cortez’s income for the three month period ended March 31, 2019 was 10% lower than the same prior year period primarily due to a decrease in sales volume and lower realized gold prices1, partially offset by lower cost of sales.
Gold production for the three month period ended March 31, 2019 was 8% lower compared to the same prior year period, primarily due to expected lower grades mined and processed from CHOP as mining ramps down and is scheduled for completion in the second quarter of 2019. This was partially offset by an increase in Cortez Hills underground refractory ore mined and processed, an increase in material hauled over the road from Cortez and processed at Goldstrike’s roaster, and a drawdown of gold in circuit inventory from high grade ore in circuit at the end of the prior quarter.
Cost of sales per ounce4 for the three month period ended March 31, 2019 was in line with the same prior year period, due to lower volumes as a result of lower grades from CHOP offset by lower depreciation. Total cash costs per ounce1 was $70 per ounce higher than the same prior year period, primarily due to lower volumes as a result of lower grades from CHOP. For the three month period ended March 31, 2019,all-in sustaining costs1 increased by $92 per ounce compared to the same prior year period, again primarily due to lower volumes resulting from lower CHOP grades and higher minesite sustaining capital expenditures.
Capital expenditures for the three month period ended March 31, 2019 increased by 6% from the same prior year period due to higher minesite sustaining capital expenditures and higher project capital expenditures. Higher minesite sustaining capital expenditures mainly relates to the lease buyout of support equipment. Higher project capital expenditures are primarily due to increased Crossroads stripping.
BARRICK FIRST QUARTER 2019 | 31 | MANAGEMENT’S DISCUSSION AND ANALYSIS |
Goldstrikea, Nevada USA
Summary of Operating and Financial Data | For the three months ended | |||||||||||||||
March 31, 2019
| December 31, 2018
| % Change
| March 31, 2018
| % Change
| ||||||||||||
Total tonnes mined (000s) | 11,982 | 11,562 | 4 % | 18,481 | (35)% | |||||||||||
Open pit ore | 920 | 1,844 | (50)% | 252 | 265 % | |||||||||||
Open pit waste | 10,581 | 9,296 | 14 % | 17,845 | (41)% | |||||||||||
Underground | 481 | 422 | 14 % | 384 | 25 % | |||||||||||
Average grade (grams/tonne) | ||||||||||||||||
Open pit mined | 4.03 | 3.92 | 3 % | 2.46 | 64 % | |||||||||||
Underground mined | 9.17 | 10.16 | (10)% | 8.52 | 8 % | |||||||||||
Processed | 4.31 | 4.97 | (13)% | 4.09 | 5 % | |||||||||||
Ore tonnes processed (000s) | 2,162 | 2,160 | 0 % | 1,907 | 13 % | |||||||||||
Roaster | 884 | 884 | 0 % | 852 | 4 % | |||||||||||
Autoclave | 1,278 | 1,276 | 0 % | 1,055 | 21 % | |||||||||||
Recovery rate | 78% | 75% | 4 % | 74% | 5 % | |||||||||||
Roaster | 87% | 88% | (1)% | 88% | (1)% | |||||||||||
Autoclave | 66% | 53% | 25 % | 53% | 25 % | |||||||||||
Gold produced (000s oz) | 233 | 260 | (10)% | 186 | 25 % | |||||||||||
Roaster | 152 | 195 | (22)% | 132 | 15 % | |||||||||||
Autoclave | 81 | 65 | 25 % | 54 | 50 % | |||||||||||
Gold sold (000s oz)
| 239 | 251 | (5)% | 189 | 26 % | |||||||||||
Revenue ($ millions) | 311 | 307 | 1 % | 251 | 24% | |||||||||||
Cost of sales ($ millions) | 226 | 239 | (5)% | 205 | 10 % | |||||||||||
Income ($ millions) | 83 | 62 | 34 % | 48 | 73 % | |||||||||||
EBITDA ($ millions)b | 149 | 136 | 10 % | 109 | 37 % | |||||||||||
Capital expenditures ($ millions)c | 50 | 38 | 32 % | 62 | (20)% | |||||||||||
Minesite sustainingc | 50 | 38 | 32 % | 62 | (20)% | |||||||||||
Projectc | 0 | 0 | 0 % | 0 | 0 % | |||||||||||
Cost of sales (per oz) | 947 | 952 | (1)% | 1,076 | (12)% | |||||||||||
Total cash costs ($/oz)b | 671 | 656 | 2 % | 755 | (11)% | |||||||||||
All-in sustaining costs ($/oz)b | 891 | 833 | 7 % | 1,094 | (19)% | |||||||||||
All-in costs ($/oz)b | 891 | 833 | 7 % | 1,094 | (19%) |
a. | Includes our 60% share of South Arturo. |
b. | These arenon-GAAP financial performance measures with no standardized meaning under IFRS and therefore may not be comparable to similar measures presented by other issuers. For further information and a detailed reconciliation of eachnon-GAAP measure used in this section of the MD&A to the most directly comparable IFRS measure, please see pages 57 to 72 of this MD&A. |
c. | Presented on a cash basis for the three months ended March 31, 2019, and an accrued basis for the three months ended December 31, 2018 and March 31, 2018 as a result of adopting IFRS 16Leases. Please refer to page 18 of this MD&A for more details. |
Safety and Environment
Two LTIs were recorded during the quarter with a LTIFR of 1.79 per million hours worked versus 0.81 the previous quarter and zero the same prior year period. No major environmental incident occurred during the quarter. In response to this increase in LTIFR, Goldstrike has carried out a Safety Leadership workshop to improve the effectiveness of focused safety engagements with the workforce. In addition, the new Fatality Prevention Commitments and Hand Injury Awareness and Prevention campaigns have been carried out.
Financial Results
Q1 2019 compared to Q4 2018
Goldstrike’s income for the first quarter of 2019 was 34% higher than the fourth quarter of 2018 primarily due to a decrease in cost of sales and higher realized gold prices1, partially offset by a decrease in sales volume.
Gold production in the first quarter of 2019 was 10% lower compared to the prior quarter, primarily due to lower
production from the roaster. This was because there was less CHOP ore to blend with high grade high total carbonaceous contentopen-pit ore, as well as lower grade underground ore due to fewer high grade stopes available to mine compared to the prior quarter. This was partially offset by an increase in autoclave production due to switching toall-acid ore processing which increased recoveries quarter on quarter.
Cost of sales per ounce4 in the first quarter of 2019 was $5 per ounce lower than the prior quarter mainly due to lower direct mining costs and lower depreciation, partially offset by lower volumes as a result of lower grades processed. Total cash costs per ounce1 in the first quarter of 2019 was $15 per ounce higher than the prior quarter mainly due to lower volumes as a result of lower grades processed, partly offset by lower direct mining costs. In the first quarter of 2019,all-in sustaining costs1 increased by $58 per ounce compared to the prior quarter primarily due to higher minesite sustaining capital expenditures and lower production associated with
BARRICK FIRST QUARTER 2019 | 32 | MANAGEMENT’S DISCUSSION AND ANALYSIS |
lower grades processed, partially offset by lower direct mining costs.
Capital expenditures in the first quarter of 2019 increased by 32% compared to the prior quarter due to higher minesite sustaining expenditures. Higher minesite sustaining capital expenditures are attributed to a lease buyout of support equipment, higher underground development for capital drilling and South Arturo development.
Q1 2019 compared to Q1 2018
Goldstrike’s income for the three month period ended March 31, 2019 was 73% higher than the same prior year period primarily due to an increase in sales volume, partially offset by an increase in cost of sales and lower realized gold prices1.
Gold production for the three month period ended March 31, 2019 was 25% higher compared to the same prior year period, primarily due to higher grade underground stopes available to mine and process. This was further impacted by higher autoclave production due to increased throughput and switching to all acid ore processing which increased recoveries year on year.
Cost of sales per ounce4 and total cash costs1 for the three month period ended March 31, 2019 were $129 per ounce and $84 per ounce lower, respectively, than the same prior year period mainly due to higher production as a result of higher underground grades processed and higher throughput and recovery at the autoclave. This was partially offset by higher direct mining costs primarily relating to switching the autoclave to an all acid blend increasing acid and lime consumption and lower open pit capitalized stripping from the fourth northwest layback relative to the same prior year period. For the three month period ended March 31, 2019,all-in sustaining costs1 decreased by $203 per ounce compared to the same prior year period primarily due to high production linked to higher grades, higher recoveries and lower minesite sustaining capital expenditures, partially offset by higher direct mining costs.
Capital expenditures for the three month period ended March 31, 2019 decreased by 20% from the same prior year period due to lower minesite sustaining capital expenditures. Lower minesite sustaining capital expenditures is attributed to lower open pit capitalized stripping from the fourth northwest layback, partially offset by underground development for capital drilling and South Arturo development.
BARRICK FIRST QUARTER 2019 | 33 | MANAGEMENT’S DISCUSSION AND ANALYSIS |
Turquoise Ridge (75% basis)a, Nevada USA
Summary of Operating and Financial Data | For the three months ended | |||||||||||||||||||
March 31, 2019 | December 31, 2018 | % Change | March 31, 2018 | % Change | ||||||||||||||||
Underground tonnes mined (000s) | 191 | 181 | 5 % | 157 | 22 % | |||||||||||||||
Average grade (grams/tonne) | ||||||||||||||||||||
Underground mined | 15.90 | 15.76 | 1 % | 14.99 | 6 % | |||||||||||||||
Recovery rate | 94% | 93% | 1 % | 98% | (4)% | |||||||||||||||
Gold produced (000s oz) | 77 | 74 | 4 % | 46 | 67 % | |||||||||||||||
Gold sold (000s oz) | 76 | 66 | 15 % | 63 | 21 % | |||||||||||||||
Revenue ($ millions) | 100 | 82 | 22 % | 84 | 19 % | |||||||||||||||
Cost of sales ($ millions) | 45 | 54 | (17)% | 45 | 0 % | |||||||||||||||
Income ($ millions) | 54 | 29 | 86 % | 39 | 38 % | |||||||||||||||
EBITDA ($ millions)b | 60 | 36 | 67 % | 46 | 30 % | |||||||||||||||
Capital expenditures ($ millions)c | 16 | 20 | (20)% | 13 | 23 % | |||||||||||||||
Minesite sustainingc | 7 | 7 | 0 % | 6 | 17 % | |||||||||||||||
Projectc | 9 | 13 | (31)% | 7 | 29 % | |||||||||||||||
Cost of sales ($/oz) | 592 | 802 | (26)% | 720 | (18)% | |||||||||||||||
Total cash costs ($/oz)b | 506 | 701 | (28)% | 601 | (16)% | |||||||||||||||
All-in sustaining costs ($/oz)b | 592 | 798 | (26)% | 709 | (17)% | |||||||||||||||
All-in costs ($/oz)b | 716 | 993 | (28)% | 821 | (13)% |
a. | Barrick owns 75% of the mine, with our joint venture partner, Newmont, owning the remaining 25%. Turquoise Ridge is proportionately consolidated on the basis that the joint venture partners that have joint control have rights to the assets and obligations for the liabilities relating to the arrangement. The figures presented in this table and the discussion that follows are based on our 75% interest in Turquoise Ridge. |
b. | These arenon-GAAP financial performance measures with no standardized meaning under IFRS and therefore may not be comparable to similar measures presented by other issuers. For further information and a detailed reconciliation of eachnon-GAAP measure used in this section of the MD&A to the most directly comparable IFRS measure, please see pages 57 to 72 of this MD&A. |
c. | Presented on a cash basis for the three months ended March 31, 2019, and an accrued basis for the three months ended December 31, 2018 and March 31, 2018 as a result of adopting IFRS 16Leases. Please refer to page 18 of this MD&A for more details. |
Safety and Environment
One LTI was recorded during the quarter with a LTIFR of 2.37 per million hours worked versus zero the previous quarter and 6.28 the same prior year period. No major environmental incident occurred during the quarter.
Financial Results
Q1 2019 compared to Q4 2018
Turquoise Ridge’s income for the first quarter of 2019 was 86% higher than the fourth quarter of 2018 primarily due to an increase in sales volume and a decrease in cost of sales, combined with higher realized gold prices1.
Gold production in the first quarter of 2019 was 4% higher than the prior quarter, primarily due to higher tonnes mined and slightly higher grade.
Cost of sales per ounce4 and total cash costs1 in the first quarter of 2019 were $210 per ounce and $195 per ounce lower, respectively, than the prior quarter primarily reflecting higher tonnes mined and slightly higher grade. In the first quarter of 2019,all-in sustaining costs1 decreased by $206 per ounce compared to the prior quarter primarily reflecting higher tonnes mined and higher grade.
Capital expenditures in the first quarter of 2019, decreased by 20% compared to the prior quarter due to lower project capital expenditures. Project capital expenditures relates to the construction of the third shaft.
Q1 2019 compared to Q1 2018
Turquoise Ridge’s income for the three month period ended March 31, 2019 was 38% higher than the same prior year period primarily due to an increase in sales volume, partially offset by lower realized gold prices1. Cost of sales remained in line with the same prior year period.
Gold production for the three month period ended March 31, 2019 was 67% higher compared to the same prior year period, primarily due to increased mining rates and higher grades.
Cost of sales per ounce4 and total cash costs1 for the three month period ended March 31, 2019 were $128 per ounce and $95 per ounce, respectively, lower than the same prior year period primarily reflecting the impact of increased mining rates and higher grades. For the three month period ended March 31, 2019,all-in sustaining costs1 decreased by $117 per ounce compared to the same prior year period primarily reflecting lower total cash costs1, partially offset by higher minesite sustaining capital expenditures.
Capital expenditures for the three month period ended March 31, 2019, increased by 23% compared to the same prior year period mainly due to higher project capital expenditures attributed to higher spend rates with the sinking of the third shaft.
BARRICK FIRST QUARTER 2019 | 34 | MANAGEMENT’S DISCUSSION AND ANALYSIS |
Pueblo Viejo (60% basis)a, Dominican Republic
Summary of Operating and Financial Data | For the three months ended | |||||||||||||||||||
March 31, 2019 | December 31, 2018 | % Change | March 31, 2018 | % Change | ||||||||||||||||
Open pit tonnes mined (000s) | 7,070 | 6,188 | 14 % | 4,947 | 43 % | |||||||||||||||
Open pit ore | 1,739 | 3,550 | (51)% | 1,251 | 39 % | |||||||||||||||
Open pit waste | 5,331 | 2,638 | 102 % | 3,696 | 44 % | |||||||||||||||
Average grade (grams/tonne) | ||||||||||||||||||||
Open pit mined | 2.28 | 2.84 | (20)% | 2.39 | (5)% | |||||||||||||||
Processed | 3.75 | 4.19 | (11)% | 3.75 | 0 % | |||||||||||||||
Autoclave ore tonnes processed (000s) | 1,306 | 1,380 | (5)% | 1,272 | 3 % | |||||||||||||||
Recovery rate | 89% | 89% | 0 % | 92% | (3)% | |||||||||||||||
Gold produced (000s oz) | 148 | 166 | (11)% | 141 | 5 % | |||||||||||||||
Gold sold (000s oz) | 142 | 170 | (16)% | 148 | (4)% | |||||||||||||||
Revenue ($ millions) | 198 | 209 | (5)% | 218 | (9)% | |||||||||||||||
Cost of sales ($ millions) | 98 | 118 | (17)% | 101 | (3)% | |||||||||||||||
Income ($ millions) | 98 | 86 | 14 % | 115 | (15)% | |||||||||||||||
EBITDA ($ millions)b | 126 | 120 | 5 % | 140 | (10)% | |||||||||||||||
Capital expenditures ($ millions)c | 16 | 21 | (24)% | 23 | (30)% | |||||||||||||||
Minesite sustainingc | 16 | 21 | (24)% | 23 | (30)% | |||||||||||||||
Projectc | 0 | 0 | 0 % | 0 | 0 % | |||||||||||||||
Cost of sales ($/oz) | 696 | 686 | 1 % | 683 | 2 % | |||||||||||||||
Total cash costs ($/oz)b | 421 | 425 | (1)% | 409 | 3 % | |||||||||||||||
All-in sustaining costs ($/oz)b | 543 | 559 | (3)% | 571 | (5)% | |||||||||||||||
All-in costs ($/oz)b | 544 | 560 | (3)% | 571 | (5)% |
a. | Pueblo Viejo is accounted for as a subsidiary with a 40%non-controlling interest. The results in the table and the discussion that follows are based on our 60% share only. |
b. | These arenon-GAAP financial performance measures with no standardized meaning under IFRS and therefore may not be comparable to similar measures presented by other issuers. For further information and a detailed reconciliation of eachnon-GAAP measure used in this section of the MD&A to the most directly comparable IFRS measure, please see pages 57 to 72 of this MD&A. |
c. | Presented on a cash basis for the three months ended March 31, 2019, and an accrued basis for the three months ended December 31, 2018 and March 31, 2018 as a result of adopting IFRS 16Leases. Please refer to page 18 of this MD&A for more details. |
Safety and Environment
Six LTIs were recorded during the quarter with a LTIFR of 2.36 per million hours worked versus zero the previous quarter and 0.38 the same prior year period. As a result, management is working on a safety improvement plan that includes actions to be more engaged with employees in the field. No major environmental incident occurred during the quarter.
Financial Results
Q1 2019 compared to Q4 2018
Pueblo Viejo’s income for the first quarter of 2019 was 14% higher than the fourth quarter of 2018, primarily due to higher realized gold prices1 and lower cost of sales, partially offset by lower sales volume.
Gold production for the first quarter of 2019 was 11% lower than the prior quarter due to the expected decline in ore grade resulting from mining in the Cumba and Monte Negro pits in the current period compared to mining in the Moore pit in the prior quarter. This was combined with lower tonnes processed as a result of planned maintenance occurring at the end of the quarter, which will continue into the beginning of the second quarter of 2019.
Cost of sales per ounce4 and total cash costs1 for the first quarter of 2019 were both in line with the prior quarter. Cost of sales per ounce4 was in line with the prior quarter as depreciation increased on a per ounce basis, which was offset by lower total cash costs1. Total cash costs1 was in line with the prior quarter mainly reflecting lower direct mining costs
attributed to lower labor costs as a result of implementing business improvement initiatives, combined with lower fuel consumption. This was offset by lower grades and lower tonnes processed.
For the first quarter of 2019,all-in sustaining costs1 decreased by $16 per ounce compared to the prior quarter reflecting the lower direct mining costs and lower minesite sustaining capital expenditures.
Capital expenditures for the first quarter of 2019 decreased by 24% compared to the prior quarter, primarily due to delayed spending relating to tailing pumps and the Bonao Substation III project until later in the year.
Q1 2019 compared to Q1 2018
Pueblo Viejo’s income for the three month period ended March 31, 2019 was 15% lower than the same prior year period, primarily due to lower sales volume and lower realized gold prices1, partially offset by lower cost of sales.
Gold production for the three month period ended March 31, 2019 was 5% higher than the same prior year period, primarily due to higher throughput.
Cost of sales per ounce4 and total cash costs1 for the three month period ended March 31, 2019 were $13 and $12 higher, respectively, than the same prior year period mainly relating to lower gold sales volumes due to the timing of sales, partially offset by the positive impact of sales of excess power
BARRICK FIRST QUARTER 2019 | 35 | MANAGEMENT’S DISCUSSION AND ANALYSIS |
generated by our power plant to third parties, which started in the second quarter of 2018. For the three month period ended March 31, 2019,all-in sustaining costs1 decreased by $28 per ounce compared to the same prior year period reflecting the decrease in minesite sustaining capital expenditures.
Capital expenditures for the three month period ended March 31, 2019 decreased by 30% compared to the same prior year period, primarily due to capitalized stripping costs associated with Moore pit phases 5 and 6 occurring in the same prior year period.
BARRICK FIRST QUARTER 2019 | 36 | MANAGEMENT’S DISCUSSION AND ANALYSIS |
Loulo-Gounkoto (80% basis)a, Mali
Summary of Operating and Financial Data | For the three months ended | |||||||||||
March 31, 2019 | December 31, 2018b | % Change | ||||||||||
Total tonnes mined (000s) | 8,779 | 7,439 | 18 % | |||||||||
Open pit ore | 542 | 1,071 | (49)% | |||||||||
Open pit waste | 7,700 | 5,848 | 32 % | |||||||||
Underground | 537 | 520 | 3 % | |||||||||
Average grade (grams/tonne) | ||||||||||||
Open pit mined | 3.90 | 3.70 | 5 % | |||||||||
Underground mined | 4.46 | 5.50 | (19)% | |||||||||
Processed | 4.19 | 5.60 | (25)% | |||||||||
Ore tonnes processed (000s) | 1,011 | 1,018 | (1)% | |||||||||
Recovery rate | 94% | 92 | % | 2 % | ||||||||
Gold produced (000s oz) | 128 | 154 | (17)% | |||||||||
Gold sold (000s oz) | 128 | 153 | (16)% | |||||||||
Revenue ($ millions) | 168 | |||||||||||
Cost of sales ($ millions) | 135 | |||||||||||
Income ($ millions) | 29 | |||||||||||
EBITDA ($ millions)c | 76 | |||||||||||
Capital expenditures ($ millions) | 18 | |||||||||||
Minesite sustaining | 18 | |||||||||||
Project | 0 | |||||||||||
Cost of sales ($/oz) | 1,052 | |||||||||||
Total cash costs ($/oz)c | 684 | |||||||||||
All-in sustaining costs ($/oz)c | 840 | |||||||||||
All-in costs ($/oz)c | 840 |
a. | Barrick owns 80% of Société des Mines de Loulo SA and Société des Mines de Gounkoto with the Republic of Mali owning 20%. Loulo-Gounkoto is accounted for as a subsidiary with a 20%non-controlling interest on the basis that Barrick controls the asset. The results in the table and the discussion that follows are based on our 80% share inclusive of the impact of the purchase price allocation resulting from the Merger. |
b. | These results did not form a part of the Barrick consolidated results as this site was acquired as a result of the Merger. As a result, operational statistics are presented for reference purposes only. |
c. | These arenon-GAAP financial performance measures with no standardized meaning under IFRS and therefore may not be comparable to similar measures presented by other issuers. For further information and a detailed reconciliation of eachnon-GAAP measure used in this section of the MD&A to the most directly comparable IFRS measure, please see pages 57 to 72 of this MD&A. |
Safety and Environment
No LTI was recorded during the quarter with a LTIFR of zero per million hours worked versus zero the previous quarter. No major environmental incident occurred during the quarter.
Financial Results
Loulo-Gounkoto’s income for the first quarter of 2019 was $29 million.
Gold production in the first quarter of 2019 was 17% lower compared to the prior quarter, primarily due to lower grade, while throughput and recovery remained in line with expectations.
Cost of sales per ounce4 and total cash costs1 in the first quarter of 2019 were $1,052 and $684 per ounce, respectively. Excluding the additional depreciation expense resulting from the fair value increment applied to our 80% interest, cost of sales per ounce4 in the first quarter of 2019 was $924 per ounce. Cost of sales per ounce4 and total cash costs1 were impacted by increased direct mining costs mainly relating to higher labor and power costs, partially offset by lower contractor costs. In the first quarter of 2019,all-in sustaining costs1 were $840 per ounce.
Capital expenditures in the first quarter of 2019 was $18 million, consisting of underground development and grade control drilling at Loulo and deferred stripping at Gounkoto.
BARRICK FIRST QUARTER 2019 | 37 | MANAGEMENT’S DISCUSSION AND ANALYSIS |
Kibali (45% basis)a, Democratic Republic of Congo
Summary of Operating and Financial Data | For the three months ended | |||||||||||
March 31, 2019 | December 31, 2018b | % Change | ||||||||||
Total tonnes mined (000s) | 3,162 | 3,664 | (14)% | |||||||||
Open pit ore | 652 | 961 | (32)% | |||||||||
Open pit waste | 2,078 | 2,302 | (10)% | |||||||||
Underground | 432 | 401 | 8 % | |||||||||
Average grade (grams/tonne) | ||||||||||||
Open pit mined | 2.34 | 2.89 | (19)% | |||||||||
Underground mined | 5.39 | 5.43 | (1)% | |||||||||
Processed | 3.89 | 3.47 | 12 % | |||||||||
Ore tonnes processed (000s) | 840 | 911 | (8)% | |||||||||
Recovery rate | 89% | 89 | % | 0 % | ||||||||
Gold produced (000s oz) | 93 | 94 | (1)% | |||||||||
Gold sold (000s oz) | 90 | 98 | (8)% | |||||||||
Revenue ($ millions) | 117 | |||||||||||
Cost of sales ($ millions) | 108 | |||||||||||
Income ($ millions) | 10 | |||||||||||
EBITDA ($ millions)c | 66 | |||||||||||
Capital expenditures ($ millions) | 10 | |||||||||||
Minesite sustaining | 9 | |||||||||||
Project | 1 | |||||||||||
Cost of sales ($/oz) | 1,202 | |||||||||||
Total cash costs ($/oz)c | 573 | |||||||||||
All-in sustaining costs ($/oz)c | 673 | |||||||||||
All-in costs ($/oz)c | 676 |
a. | Barrick owns 45% of Kibali Goldmines SA (Kibali) with the Democratic Republic of Congo (“DRC”) and our joint venture partner owning 10% and 45%, respectively. Kibali is accounted for as an equity method investment on the basis that the joint venture partners that have joint control have rights to the net assets of the joint venture. The figures presented in this table and the discussion that follows are based on our 45% effective interest in Kibali inclusive of the impact of the purchase price allocation resulting from the Merger. |
b. | These results did not form a part of the Barrick consolidated results as this site was acquired as a result of the Merger. As a result, operational statistics are presented for reference purposes only. |
c. | These arenon-GAAP financial performance measures with no standardized meaning under IFRS and therefore may not be comparable to similar measures presented by other issuers. For further information and a detailed reconciliation of eachnon-GAAP measure used in this section of the MD&A to the most directly comparable IFRS measure, please see pages 57 to 72 of this MD&A. |
Safety and Environment
One LTI was recorded during the quarter with a LTIFR of 0.3 per million hours worked versus zero the previous quarter. No major environmental incident occurred during the quarter.
Financial Results
Kibali’s income for the first quarter of 2019 was $10 million.
Gold production in the first quarter of 2019 was in line with the prior quarter, as lower milled tonnes were offset by higher overall feed grade. Gold sales were 8% lower compared to the previous quarter mainly due to the timing of sales.
Cost of sales per ounce4 and total cash costs1 in the first quarter of 2019 were $1,202 and $573 per ounce, respectively. Excluding the additional depreciation expense
resulting from the fair value increment, cost of sales per ounce4 in the first quarter of 2019 was $948 per ounce. Cost of sales per ounce4 and total cash costs1 were impacted by the timing of sales and higher direct mining costs resulting from increased power and lime consumption and higher backfill costs, partially offset by lower general and administrative expenses. In the first quarter of 2019,all-in sustaining costs1 was $673 per ounce, primarily reflecting lower minesite sustaining capital expenditures, partially offset by higher direct mining costs.
Capital expenditures in the first quarter of 2019 was $10 million. Minesite sustaining capital expenditures was $9 million, mainly due to expenditure on underground mining development, underground hauling equipment and underground drilling.
BARRICK FIRST QUARTER 2019 | 38 | MANAGEMENT’S DISCUSSION AND ANALYSIS |
Veladero (50% basis)a, Argentina
Summary of Operating and Financial Data | For the three months ended | |||||||||||||||
March 31, 2019
| December 31, 2018
| % Change
| March 31, 2018
| % Change
| ||||||||||||
Open pit tonnes mined (000s) | 8,848 | 8,378 | 6 % | 10,102 | (12)% | |||||||||||
Open pit ore | 3,599 | 4,406 | (18)% | 4,142 | (13)% | |||||||||||
Open pit waste | 5,249 | 3,972 | 32 % | 5,960 | (12)% | |||||||||||
Average grade (grams/tonne) | ||||||||||||||||
Open pit mined | 0.70 | 0.64 | 9 % | 1.01 | (31)% | |||||||||||
Processed | 0.75 | 0.71 | 6 % | 1.04 | (28)% | |||||||||||
Heap leach ore tonnes processed (000s) | 3,416 | 3,531 | (3)% | 3,960 | (14)% | |||||||||||
Gold produced (000s oz) | 70 | 77 | (9)% | 74 | (5)% | |||||||||||
Gold sold (000s oz)
| 68 | 74 | (8)% | 74 | (8)% | |||||||||||
Revenue ($ millions) | 91 | 95 | (4)% | 101 | (10%) | |||||||||||
Cost of sales ($ millions) | 81 | 98 | (17)% | 76 | 7 % | |||||||||||
Income ($ millions) | 10 | (5 | ) | 300 % | 25 | (60)% | ||||||||||
EBITDA ($ millions)b | 40 | 27 | 48 % | 56 | (29)% | |||||||||||
Capital expenditures ($ millions)c | 40 | 59 | (32)% | 31 | 29 % | |||||||||||
Minesite sustainingc | 25 | 59 | (58)% | 31 | (19)% | |||||||||||
Projectc | 15 | 0 | 0 % | 0 | 0 % | |||||||||||
Cost of sales ($/oz) | 1,195 | 1,352 | (12)% | 1,036 | 15 % | |||||||||||
Total cash costs ($/oz)b | 713 | 823 | (13)% | 576 | 24 % | |||||||||||
All-in sustaining costs ($/oz)b | 1,100 | 1,648 | (33)% | 1,008 | 9 % | |||||||||||
All-in costs ($/oz)b | 1,325 | 1,648 | (20)% | 1,008 | 31% |
a. | Barrick owns 50% of Veladero with our joint venture partner. Veladero is proportionately consolidated on the basis that the joint venture partners that have joint control have rights to the assets and obligations for the liabilities relating to the arrangement. The figures presented in this table and the discussion that follows are based on our 50% interest in Veladero inclusive of the impact of remeasurement of our interest in Veladero following the disposal of a 50% interest on June 30, 2017. |
b. | These arenon-GAAP financial performance measures with no standardized meaning under IFRS and therefore may not be comparable to similar measures presented by other issuers. For further information and a detailed reconciliation of eachnon-GAAP measure used in this section of the MD&A to the most directly comparable IFRS measure, please see pages 57 to 72 of this MD&A. |
c. | Presented on a cash basis for the three months ended March 31, 2019, and an accrued basis for the three months ended December 31, 2018 and March 31, 2018 as a result of adopting IFRS 16Leases. Please refer to page 18 of this MD&A for more details. |
Safety and Environment
No LTI was recorded during the quarter with a LTIFR of zero per million hours worked versus zero the previous quarter and 0.65 the same prior year period. No major environmental incident occurred during the quarter.
Minera Andina del Sol SRL, the joint venture company that operates the Veladero mine, is the subject of a consolidated regulatory proceeding by the San Juan Provincial mining authority in respect of operational incidents that occurred in March 2017 and September 2016 involving the release of gold-bearing process solution. A process solution release also occurred at the Veladero mine in September 2015. The operational incidents noted above have resulted in the payment of administrative fines and additional regulatory and legal proceedings. Refer to note 17 to the Financial Statements for more information regarding these and related matters.
Financial Results
Q1 2019 compared to Q4 2018
Veladero’s income for the first quarter of 2019 was $15 million higher than the fourth quarter of 2018 primarily due to a decrease in cost of sales and higher realized gold prices1, partially offset by lower sales volume.
Gold production in the first quarter of 2019 was 9% lower than the prior quarter, primarily due to lower recovery and lower
tonnes processed. However, more tonnes at higher grades were mined in the current period compared to the prior quarter, reflecting enhanced operational performance as a result of business improvement initiatives.
Cost of sales per ounce4 and total cash costs1 in the first quarter of 2019 were $157 per ounce and $110 per ounce lower, respectively, than the prior quarter mainly due to lower direct mining costs associated with warehousing, information technology and consulting services as a result of business improvement initiatives. In the first quarter of 2019,all-in sustaining costs1 decreased by $548 per ounce compared to the prior quarter, resulting from lower direct mining costs combined with lower minesite sustaining capital expenditures.
Capital expenditures in the first quarter of 2019 decreased by 32% compared to the prior quarter, primarily due to delayed spending on the Valley Leach Facility expansion project for phase 6. Project capital expenditures for the three months ended March 31, 2019 relates to the power transmission line in Argentina as a result of an agreement made with the EPRE.
Q1 2019 compared to Q1 2018
Veladero’s income for thethree month period endedMarch 31, 2019 was 60% lower than the same prior year period primarily due to a decrease in sales volume, an increase in cost of sales, and lower realized gold prices1.
BARRICK FIRST QUARTER 2019 | 39 | MANAGEMENT’S DISCUSSION AND ANALYSIS |
Gold production for the three month period ended March 31, 2019 was 5% lower than the same prior year period, primarily due to lower tonnes processed and expected lower grade.
Cost of sales per ounce4 and total cash costs1 for the three month period ended March 31, 2019 were $159 per ounce and $137 per ounce higher, respectively, than the same prior year period, primarily due to the impact of the export tax announced in September 2018 by the Argentine government. This was combined with the impact of lower tonnes processed and expected lower grade, partially offset by lower direct mining cost due to the implementation of cost reduction initiatives and the significant weakening of the Argentine peso.
For the three month period ended March 31, 2019,all-in sustaining costs1 increased by $92 per ounce compared to the same prior year period, mainly attributed to higher cost of sales per ounce4 and higher minesite sustaining capital expenditures.
Capital expenditures for the three month period ended March 31, 2019 increased by 29% compared to the same prior year period as a result of the funding of a power transmission line in Argentina as a result of an agreement made with the EPRE.
BARRICK FIRST QUARTER 2019 | 40 | MANAGEMENT’S DISCUSSION AND ANALYSIS |
Acacia Mining plc (100% basis), Africa
Summary of Operating and Financial Data | For the three months ended
| |||||||||||||||
March 31, 2019
| December 31, 2018
| % Change
| March 31, 2018
| % Change
| ||||||||||||
Total tonnes mined (000s) | 3,811 | 4,503 | (15)% | 4,135 | (8)% | |||||||||||
Open pit ore | 1,069 | 1,075 | (1)% | 652 | 64% | |||||||||||
Open pit waste | 2,476 | 3,110 | (20)% | 3,188 | (22)% | |||||||||||
Underground | 266 | 318 | (16)% | 295 | (10)% | |||||||||||
Average grade (grams/tonne) | ||||||||||||||||
Open pit mined | 1.84 | 2.04 | (10)% | 1.70 | 8% | |||||||||||
Underground mined | 5.70 | 7.70 | (26)% | 7.80 | (27)% | |||||||||||
Processeda | 1.70 | 2.00 | (15)% | 2.00 | (15)% | |||||||||||
Ore tonnes processed (000s) | 2,324 | 2,329 | 0% | 2,159 | 8% | |||||||||||
Recovery rate | 85% | 86% | (1)% | 87% | (2)% | |||||||||||
Mining | 91% | 91% | 0% | 91% | 0% | |||||||||||
Reprocessed tailings | 51% | 53% | (4)% | 53% | (4)% | |||||||||||
Gold produced (000s oz) | 105 | 131 | (20)% | 121 | (13)% | |||||||||||
Gold sold (000s oz) | 105 | 133 | (21)% | 117 | (10)% | |||||||||||
Revenue ($ millions) | 138 | 165 | (16)% | 157 | (12%) | |||||||||||
Cost of sales ($ millions) | 117 | 114 | 3% | 110 | 6% | |||||||||||
Income ($ millions) | 1 | 32 | (97)% | 71 | (99)% | |||||||||||
EBITDA ($ millions)b | 26 | 55 | (53)% | 95 | (73)% | |||||||||||
Capital expenditures ($ millions)c | 13 | 19 | (32)% | 26 | (50)% | |||||||||||
Minesite sustainingc | 10 | 16 | (38)% | 24 | (58)% | |||||||||||
Projectc | 3 | 3 | 0% | 2 | 50% | |||||||||||
Cost of sales ($/oz) | 1,114 | 852 | 31% | 941 | 18% | |||||||||||
Total cash costs ($/oz)b | 850 | 651 | 31% | 715 | 19% | |||||||||||
All-in sustaining costs ($/oz)b | 1,023 | 857 | 19% | 976 | 5% | |||||||||||
All-in costs ($/oz)b | 1,061 | 878 | 21% | 991 | 7% |
a. | Includes tailings retreatment. |
b. | These arenon-GAAP financial performance measures with no standardized meaning under IFRS and therefore may not be comparable to similar measures presented by other issuers. For further information and a detailed reconciliation of eachnon-GAAP measure used in this section of the MD&A to the most directly comparable IFRS measure, please see pages 57 to 72 of this MD&A. |
c. | Presented on a cash basis for the three months ended March 31, 2019, and an accrued basis for the three months ended December 31, 2018 and March 31, 2018 as a result of adopting IFRS 16Leases. Please refer to page 18 of this MD&A for more details. |
Barrick holds a 63.9% equity interest in Acacia Mining plc, a publicly traded company listed on the London Stock Exchange that is operated independently of Barrick.
Financial Results
Q1 2019 compared to Q4 2018
Acacia’s income for the first quarter of 2019 was 97% lower than the fourth quarter of 2018, mainly attributed to lower sales volume and higher cost of sales, partially offset by higher realized gold prices1.
In the first quarter of 2019, gold production was 20% lower than the prior quarter primarily due to lower production at North Mara driven by a fall of ground in the Gokona underground mine at the end of December 2018 which impacted mine sequencing and grade, as well as an excavator breakdown in the Nyabirama open pit. This was combined with lower production at Buzwagi as the mine is now fully transitioned to a lower grade stockpile processing operation.
Cost of sales per ounce4 and total cash costs1 in the first quarter of 2019 were both 31% higher than the prior quarter primarily reflecting the impact of lower production, and lower capitalized development due to mining in the main ore zone at the Nyabirama open pit at North Mara.All-in sustaining
costs1 per ounce in the first quarter of 2019 was $166 higher than the prior quarter mainly due to higher total cash costs1, partially offset by lower minesite sustaining capital expenditures.
Capital expenditures in the first quarter of 2019 decreased by 32% compared to the fourth quarter of 2018, mainly attributed to lower capitalized development, combined with the rescheduling of projects at North Mara.
Q1 2019 compared to Q1 2018
Acacia’s income for the three month period ended March 31, 2019 was 99% lower than the same prior year period. For the three months ended March 31, 2019, the decrease is mainly attributed to lower sales volume, higher cost of sales, and lower realized gold prices1.
For the three month periods ended March 31, 2019, gold production was 13% lower than the same prior year period primarily due to lower production at North Mara driven by a fall of ground in the Gokona underground mine at the end of December 2018 which impacted mine sequencing and grade, as well as an excavator breakdown in the Nyabirama open pit. This was combined with lower production at Buzwagi as the mine is now fully transitioned to a lower grade stockpile
BARRICK FIRST QUARTER 2019 | 41 | MANAGEMENT ’S DISCUSSION AND ANALYSIS |
processing operation. This was partially offset by higher production at Bulyanhulu due to higher grades and throughput.
Cost of sales per ounce4 and total cash costs1 in the three month periods ended March 31, 2019 were 18% and 19% higher, respectively, than the same prior year period primarily due to the impact of lower production, and lower capitalized development due to mining in the main ore zone at the Nyabirama open pit at North Mara.All-in sustaining costs1 per ounce in the first quarter of 2019 was $47 higher than the prior quarter mainly due to higher total cash costs1, partially offset by lower minesite sustaining capital expenditures.
For the three month period ended March 31, 2019, capital expenditures decreased by 50% compared to the same prior year periods primarily due to lower capitalized development costs at North Mara.
Concentrate Export Ban and Related Disputes with the Government of Tanzania
On March 3, 2017, the Tanzanian Government announced a general ban on the export of metallic mineral concentrates (the “Ban”) following a directive made by the President to promote the creation of a domestic smelting industry. Following the directive, Acacia ceased all exports of its gold/ copper concentrate (“concentrate”) including containers previously approved for export prior to the Ban which are located in Dar es Salaam.
During the second quarter of 2017, the Tanzanian Government initiated investigations which resulted in allegations of historical undeclared revenue and unpaid taxes by Acacia and its predecessor companies. Acacia subsequently received adjusted assessments for the tax years 2000-2017 from the Tanzania Revenue Authority for a total amount of approximately $190 billion for alleged unpaid taxes, interest and penalties. In addition, following the end of the third quarter of 2017, Acacia was served with notices of conflicting adjusted corporate income tax and withholding tax assessments for tax years 2005 to 2011 with respect to Acacia’s former Tulawaka joint venture, and demands for payment, for a total amount of approximately $3 billion. Acacia disputes these assessments and is defending these matters through arbitration and the Tanzanian tax appeals process, respectively.
In addition to the Ban, new and amended legislation was passed in Tanzania in early July 2017, including various amendments to the 2010 Mining Act and a new Finance Act. The amendments to the 2010 Mining Act increased the royalty rate applicable to metallic minerals such as gold, copper and silver to 6% (from 4%), and the new Finance Act imposes a 1% clearing fee on the value of all minerals exported from Tanzania from July 1, 2017. In January 2018, new Mining Regulations were announced by the Tanzanian Government introducing, among other things, local content requirements, export regulations and mineral rights regulations, the scope and effect of which remain under review by Acacia. Acacia continues to monitor the impact of all new legislation in light of its MDAs with the Government of Tanzania. However, to minimize further disruptions to its operations Acacia will, in the interim, satisfy the requirements imposed as regards the
increased royalty rate in addition to the recently imposed 1% clearing fee on exports. Acacia is making these payments under protest, without prejudice to its legal rights under its MDAs.
On October 19, 2017, Barrick announced that it had agreed with the Government of Tanzania on a proposed framework for a new partnership between Acacia and the Government of Tanzania. Acacia did not participate directly in these discussions as the Government of Tanzania had informed Barrick that it wished to continue dialogue solely with Barrick. Barrick and the Government of Tanzania also agreed to form a working group that will focus on the resolution of outstanding tax claims against Acacia. Key terms of the proposed framework announced by Barrick and the Government of Tanzania include (i) the creation of a new Tanzanian company to provide management services to Acacia’s Bulyanhulu, Buzwagi and North Mara mines and all future operations in the country with key officers located in Tanzania and Tanzanian representation on the board of directors; (ii) maximization of local employment of Tanzanians and procurement of goods and services within Tanzania; (iii) economic benefits from Bulyanhulu, Buzwagi and North Mara to be shared on a 50/50 basis, with the Government’s share delivered in the form of royalties, taxes and a 16% free carry interest in Acacia’s Tanzanian operations; and (iv) in support of the working group’s ongoing efforts to resolve outstanding tax claims, Acacia would make a payment of $300 million to the Government of Tanzania, staged over time, on terms to be settled by the working group. Barrick and the Government of Tanzania are also reviewing the conditions for the lifting of the Ban.
On February 20, 2019, Barrick announced that it had arrived at a proposal that sets forth the commercial terms to resolve outstanding disputes concerning Acacia’s operations in Tanzania. The proposal is consistent with the October 19, 2017 framework. Work is underway to finalize the definitive agreements needed to give effect to the proposal. In order to become effective, the proposal and those agreements must be approved by Acacia and the Government of Tanzania, in keeping with applicable laws and regulations.
Barrick is conducting these discussions in its capacity as the largest shareholder of Acacia, in an effort to reach a resolution that is agreeable to all parties. Barrick is not negotiating on behalf of Acacia. In order to allow the process to continue in an orderly manner and without an arbitrary deadline, Barrick has not provided a timetable for the completion of the discussions. If Barrick is able to conclude discussions satisfactorily with the Government, the proposal will be provided to the Independent Committee of the Acacia Board of Directors for its consideration. Barrick notes that Acacia has been exposed to an increasingly challenging operating environment in recent months. Barrick shares Acacia’s concerns about the increasing risks to the safety and security of its people, and continues to believe that a negotiated resolution is in the best interest of all parties.
Refer to note 17 to the Financial Statements for more information regarding this matter.
BARRICK FIRST QUARTER 2019 | 42 | MANAGEMENT’S DISCUSSION AND ANALYSIS |
Other Mines - Gold
Summary of Operating and Financial Data
| For the three months ended
| |||||||||||||||||||||||||||||||||||||||
March 31, 2019
|
December 31, 2018
| |||||||||||||||||||||||||||||||||||||||
Gold produced (000s oz)
|
Cost of sales ($/oz)
| Total cash costs ($/oz)a | All-in sustaining costs ($/oz)a |
Capital Expend- ituresb
|
Gold produced (000s
|
Cost of sales ($/oz)
|
Total cash costs ($/oz)a
| All-in sustaining costs ($/oz)a |
Capital Expend- ituresb
| |||||||||||||||||||||||||||||||
Kalgoorlie (50%) | 55 | 1,064 | 870 | 1,185 | 15 | 58 | 1,022 | 857 | 1,054 | 9 | ||||||||||||||||||||||||||||||
Tongon (89.7%)c | 61 | 1,451 | 799 | 836 | 2 | 72 | ||||||||||||||||||||||||||||||||||
Porgera (47.5%) | 66 | 1,031 | 854 | 978 | 8 | 70 | 733 | 786 | 1,018 | 17 | ||||||||||||||||||||||||||||||
Hemlo | 55 | 906 | 769 | 915 | 8 | 52 | 1,083 | 932 | 1,311 | 17 | ||||||||||||||||||||||||||||||
Lagunas Norte | 35 | 1,304 | 637 | 1,018 | 7 | 50 | 4,186 | 607 | 796 | 7 | ||||||||||||||||||||||||||||||
Golden Sunlight | 7 | 2,174 | 1,974 | 2,471 | 1 | 11 | 1,423 | 1,430 | 1,586 | 1 | ||||||||||||||||||||||||||||||
Morila (40%)c
|
| 10
|
|
| 1,445
|
|
| 1,157
|
|
| 1,157
|
|
| 0
|
|
| 8
|
|
a. | These arenon-GAAP financial performance measures with no standardized meaning under IFRS and therefore may not be comparable to similar measures presented by other issuers. For further information and a detailed reconciliation of eachnon-GAAP measure used in this section of the MD&A to the most directly comparable IFRS measure, please see pages 57 to 72 of this MD&A. |
b. | Includes both minesite sustaining and project capital expenditures. Presented on a cash basis for the three months ended March 31, 2019, and an accrued basis for the three months ended December 31, 2018 as a result of adopting IFRS 16Leases. Please refer to page 19 of this MD&A for more details. |
c. | The results for the three months ended December 31, 2018 did not form a part of the Barrick consolidated results as these sites were acquired as a result of the Merger. As a result, operational statistics are presented for the three months ended December 31, 2018 for reference purposes only. |
Kalgoorlie (50% basis), Australia
Gold production in the first quarter of 2019 for Kalgoorlie was 5% lower compared to the prior quarter, primarily due to a combination of lower grade and mill throughput. Grade was lower due to open pit mine restrictions following geotechnical events, while mill throughput was impacted by unplanned downtime due to a storm. Cost of sales per ounce4 in the first quarter of 2019 was $42 per ounce higher than the prior quarter due to the impact of lower grade and throughput, partly offset by lower direct mining costs. In the first quarter of 2019,all-in sustaining costs1 increased by $131 per ounce compared to the prior quarter primarily due to the impact of lower grade and throughput, combined with higher minesite sustaining capital expenditures related to capitalized waste stripping on the Morrison starter pit.
Tongon (89.7% basis), Côte d’Ivoire
Gold production for Tongon in the first quarter of 2019 was 16% lower compared to prior quarter, primarily due to lower throughput and lower grades. Excluding the additional depreciation expense resulting from the fair value increment applied to our 89.7% interest, cost of sales per ounce4 was $1,088 per ounce.All-in sustaining costs1 in the first quarter of 2019 was $836 per ounce.
Porgera (47.5% basis), Papua New Guinea
Gold production for Porgera in the first quarter of 2019 was 6% lower compared to the fourth quarter of 2018, due to lower grades mined, power supply disruption, and planned maintenance in the first quarter of 2019. A particularly strong fourth quarter 2018 was primarily attributable to higher grade underground ore mined as operations recovered from the impacts of the earthquake occurring in February 2018. Cost of sales per ounce4 in the first quarter of 2019 was 41% higher than the prior quarter, primarily due to the impact of lower grades, with no material change in mining, processing or general and administrative costs. In the first quarter of 2019,all-in sustaining costs1 decreased by $40 per ounce compared to the prior quarter, primarily due to lower minesite sustaining capital expenditures as capital expenditures in the fourth quarter of 2018 were higher than normal as projects which
were delayed by the earthquake came to completion, partially offset by the impact of lower grades.
Hemlo, Ontario, Canada
Hemlo’s gold production in the first quarter of 2019 was 6% higher compared to the prior quarter. This was primarily due to higher grade, partially offset by lower throughput. Cost of sales per ounce4 in the first quarter of 2019 was $177 per ounce lower than the prior quarter primarily due to the impact of higher grades, partially offset by higher direct mining costs primarily attributed to labor costs. In the first quarter of 2019,all-in sustaining costs1 decreased by $396 per ounce compared to the prior quarter due to lower minesite sustaining capital expenditures and lower cost of sales per ounce4.
Lagunas Norte, Peru
Gold production for Lagunas Norte in the first quarter of 2019 was 30% lower than the prior quarter, primarily due to processing lower grade oxide ore and lower recovery carbonaceous and transition ore, in line with expectations as the mine matures. In the fourth quarter of 2018, we determined that the carbonaceous material project did not meet our investment criteria, resulting in an inventory impairment of $166 million which was included in cost of sales. Excluding the impact of the inventory impairment, cost of sales per ounce4 was $445 per ounce higher than the prior quarter largely due to severance costs incurred as a result of the decision to place open pit operations on care and maintenance at the end of 2019. This was combined with the impact of lower tonnes processed and lower recoveries. In the first quarter of 2019,all-in sustaining costs1 increased by $222 per ounce compared to the prior quarter, primarily due to the recognition of lease payments as a result of the new accounting standard for leases and lower production.
Golden Sunlight, Montana, USA
Gold production for Golden Sunlight in the first quarter of 2019 was 36% lower compared to the fourth quarter of 2018, primarily due to lower grade and lower tonnes processed, partially offset by higher mill recovery. Cost of sales per ounce4 in the first quarter of 2019 was $751 per ounce higher than the prior quarter primarily due to the impact of lower grade
BARRICK FIRST QUARTER 2019 | 43 | MANAGEMENT’S DISCUSSION AND ANALYSIS |
and lower tonnes processed, combined with an increase in depreciation expense. This was partially offset by a decrease in direct mining costs. In the first quarter of 2019,all-in sustaining costs1 increased by $885 per ounce compared to the prior quarter primarily due to the impact of lower grade and lower tonnes processed, and an increase in minesite sustaining capital expenditures. Following a detailed review of the Golden Sunlight operation, new underground development has ceased, and mining is limited to existing areas only. A final mill run to process gold ore is currently scheduled for May 2019.
Other Mines - Copper
Morila (40% basis), Côte d’Ivoire
Morila’s gold production in the first quarter of 2019 was 27% higher compared to the prior quarter, primarily due to improved recovery and grade, partially offset by lower milled tonnes. Excluding the additional depreciation expense resulting from the fair value increment applied to our 40% interest, cost of sales per ounce4 was $1,115 per ounce.All-in sustaining costs1 was $1,157 per ounce.
Summary of Operating and Financial Data | For the three months ended
| |||||||||||||||||||||||||||||||||||||||
March 31, 2019
| December 31, 2018
| |||||||||||||||||||||||||||||||||||||||
Copper pounds) | Cost of sales ($/lb) | C1 cash costs ($/lb)a | All-in ($/lb)a | Capital Expend- ituresb | Copper pounds) | Cost of sales ($/lb) | C1 cash costs ($/lb)a | All-in ($/lb)a | Capital Expend- ituresb | |||||||||||||||||||||||||||||||
Lumwana | 61 | 2.16 | 1.67 | 2.79 | 52 | 65 | 3.22 | 2.12 | 3.26 | 47 | ||||||||||||||||||||||||||||||
Zaldívar (50%) | 28 | 2.68 | 1.91 | 2.12 | 5 | 29 | 2.55 | 1.91 | 2.50 | 20 | ||||||||||||||||||||||||||||||
Jabal Sayid (50%)
|
| 17
|
|
| 1.55
|
|
| 1.10
|
|
| 1.30
|
|
| 3
|
|
| 15
|
|
| 1.70
|
|
| 1.48
|
|
| 2.04
|
|
| 4
|
|
a. | These arenon-GAAP financial performance measures with no standardized meaning under IFRS and therefore may not be comparable to similar measures presented by other issuers. For further information and a detailed reconciliation of eachnon-GAAP measure used in this section of the MD&A to the most directly comparable IFRS measure, please see pages 57 to 72 of this MD&A. |
b. | Includes both minesite sustaining and project capital expenditures. Presented on a cash basis for the three months ended March 31, 2019, and an accrued basis for the three months ended December 31, 2018 as a result of adopting IFRS 16Leases. Please refer to page 19 of this MD&A for more details. |
Lumwana, Zambia
Copper production for Lumwana in the first quarter of 2019 was 6% lower than the prior quarter. The decrease in copper production was due to the rain season occurring in the first quarter of the year, which is normally accompanied by production interruptions such as power outages. Despite the expected challenges accompanying the first quarter of the year, the operation performed well as grade remained in line with prior quarter and throughput improved. Cost of sales per pound4 in the first quarter of 2019 was $1.06 lower than the prior quarter primarily due to the positive impact of cost reduction initiatives on direct mining costs, such as lower negotiated contractor mining and hauling rates. In the first quarter of 2019,all-in sustaining costs1 decreased by $0.47 per pound compared to the prior quarter primarily due to lower direct mining costs and lower minesite sustaining capital expenditures.
Zaldívar (50% basis), Chile
Copper production for Zaldívar in the first quarter of 2019 was 3% lower compared to the prior quarter. Lower copper production is mainly attributed to lower tonnes processed from the heap leach due to interruptions to stacking as a result of crusher and conveyor reliability issues and adverse weather conditions. Cost of sales per pound4 in the first quarter of 2019 was $0.13 per pound higher than the prior quarter primarily due to the impact of lower tonnes processed, partially offset by lower energy consumption and lower acid prices and consumption.All-in sustaining costs1 decreased by $0.38 per pound compared to the prior quarter primarily due to lower minesite sustaining capital expenditures, as capital is typically weighted towards the second half of the year, partially offset by the impact of lower tonnes processed.
Jabal Sayid (50% basis), Saudi Arabia
Jabal Sayid’s copper production in the first quarter of 2019 was 13% higher compared to the prior quarter, primarily due to higher grade and throughput. Cost of sales per pound4 in the first quarter of 2019 was $0.15 per pound lower than the prior quarter, primarily due to lower direct mining costs relating to freight and refining. In the first quarter of 2019,all-in sustaining costs1 decreased by $0.74 per pound compared to the prior quarter primarily due to lower direct mining costs and lower minesite sustaining capital expenditures.
BARRICK FIRST QUARTER 2019 | 44 | MANAGEMENT’S DISCUSSION AND ANALYSIS |
Growth Project Updates
Cortez Deep South, Nevada, USA
Under the current Life of Mine plan, the Deep South project starts to contribute to Cortez production from 2020, ramping up to between approximately150-250koz from 2022 to 2031 at an estimated average cost of sales of $650 per ounce, andall-in sustaining cost1 of $580 per ounce. The draft Environmental Impact Statement for the project was published in late October 2018, and the public comment period concluded in December 2018. Deep South will utilize infrastructure which has already been approved under current plans to expand mining in the Lower Zone of the Cortez underground mine, including the new Rangefront twin declines, and other underground infrastructure already in use and under construction. As of March 31, 2019, we have spent a total of $33 million with no spending in the first quarter of 2019.
Goldrush Complex, Nevada, USA
Twin Exploration Declines
Construction of twin exploration declines at Goldrush accelerated in the first quarter of 2019, and each decline has now advanced approximately 680 meters of the planned 4000m. These declines will provide access to the ore body, allowing for further drilling, and the conversion of existing resources to reserves. The exploration declines can be converted to production declines in the future, subject to further permitting. Development of the decline infrastructure areas including wash and lube bay and powder magazine was completed in the first quarter. Underground decline cover drilling to predict the forward ground conditions has been adopted in planning. As at March 31, 2019, we have spent $47 million (including $10 million in the first quarter of 2019) out of a total estimated capital cost of $1.0 billion on the Goldrush exploration declines.
Goldrush and Fourmile Feasibility Study
A review of the geological and geotechnical models for the Goldrush and Fourmile feasibility projects were initiated in the quarter. Drilling continues to test the current drill gap between the two ore bodies with encouraging results and more detail is available in the exploration section of this report. A review of the geotechnical characterization of the drilling completed to date has shown a wide range in ground conditions from poor through to very good conditions. Better definition and modeling of the rock mass variability will allow us to further optimize the mine design with fit for purpose stoping and development designs. Based on this updated mine design, the optimum production rate of the mine will be determined, which will in turn drive the design of the material handling system and backfill strategies. Completion of the study is dependent on the quality review of the existing geotechnical data. Further hydrological modeling is currently planned for the Fourmile area to elevate the confidence in the hydrological model of this area to the same level as that of Goldrush. Initial modeling has indicated that the hydrology of Fourmile is compartmentalized and separate from Goldrush and will thus require a dedicated dewatering system of wells.
Turquoise Ridge Third Shaft, Nevada, USA
Construction of the third shaft at Turquoise Ridge continues to advance according to schedule and within budget, with efforts in 2019 focused on surface civil works and shaft sinking. Shaftsub-collar and ventilation plenum pours were completed in the first quarter. Backfilling of thesub-collar was
completed andpre-sink activities commenced on March 20, 2019. At the end of the first quarter of 2019, the shaftpre-sink had started and has reached a depth of 26m out of a total planned depth of 1,052m as measured by the depth of concrete liner below collar. The assembly of the Galloway commenced with the assembly of the bottom deck. Dewatering wells are complete and commissioned, hoist house foundations complete and hoist assembly has commenced. To date, we capitalized $59 million of spend (including $12 million in the first quarter of 2019) on an accrued basis out of an estimated capital cost of$225-$245 million (75% basis).
Massawa, Senegal
The feasibility study of a Massawa standalone operation was completed in the fourth quarter of 2018 and does not currently pass the investment hurdles we have set for the company, falling short on the 3Moz mark for a Tier 26 asset. Work continues to bring this asset to account, including additional exploration work, while the application for the exploitation permit to develop the project has been submitted to the government.
Pueblo Viejo Plant Expansion Study, Dominican Republic
Scoping studies and pilot project work are supportive of a plant expansion at the Pueblo Viejo mine that could significantly increase throughput, allowing the mine to maintain average annual gold production of approximately 800,000 ounces after 2022 (100% basis). To achieve this, the mine is evaluating a flotation concentrator followed by ultra-fine grinding and tank oxidation of the concentrate. Testing to date has indicated that tank oxidation is preferable to the padpre-oxidation process previously considered. Pueblo Viejo expects to complete feasibility studies for the plant expansion and additional tailings capacity during 2019. The project has the potential to convert roughly seven million ounces of measured and indicated resources to proven and probable reserves (100% basis).
Progress on the project during the first quarter of 2019 includes confirmation that sufficient tank oxidation can be achieved (replacing leach padpre-oxidation) to improve pressure oxidation (“POX”) productivity and ultra-fine grind size in the range (10 microns to 20 microns) is consistent with the finer size improving oxidation kinetics. The split feed options of (i) direct POX feed and (ii) Float, Atmospheric Oxidation and then POX concentrate feed has been selected, with a probable optimization range of 13 Mtpa to 16 Mtpa total throughput. The optimal throughput of the plant and the resulting size of the grind, float and atmospheric tank leach section has not yet been finalized as this is linked with further iterations of the pit optimization with the lower operating costs at higher throughputs and thegeo-metallurgical parameters of the ore (for direct POX feed or float feed).
Further resource drilling and modeling will allow updates of the orebody model in May and September of 2019. Geotechnical drilling and hydro-geological studies are planned for the remainder of 2019 to support the detailed design of a significantly larger pit. The overall project schedule remains on track. We spent $4 million in the first quarter of 2019.
BARRICK FIRST QUARTER 2019 | 45 | MANAGEMENT’S DISCUSSION AND ANALYSIS |
Exploration
Fourmile, Nevada, USA
At Fourmile, a maiden resource of 1.17 Mt @ 18.58 g/t containing 697 koz of gold5 was previously reported from a significantly larger global inventory as at December 31, 2018. Our focus continues to be directed to expanding Fourmile and following up several widely spaced 2018 discovery quality intercepts. Drilling resumed inmid-January with nine drills. During the quarter, 13 diamond drill holes totaling 10,525 meters were completed and 8 diamond drill holes were in progress, bringing the project ahead of schedule. Five of the completed holes are stepping out, testing for mineralization more than 60 meters from the defined resource, four are infilling around the edge of the resource holes (~30 meters spacing), and one hole is testing continuity along the Goldrush/Fourmile corridor. The remaining holes are following up on discovery quality intercepts outside the immediate resource area drilled in 2018. Consolidation of the Fourmile-Goldrush geologic model is nearing completion.
Fourmile will be initially excluded from the Nevada Joint Venture to allow exploration to scope the full extent of mineralization and completion of feasibility level work ahead of potential contribution to the joint venture at fair value.
Cortez, Nevada, USA
At Cortez, some 2km west of Deep South, the overturned limb of the Fortress anticline was tested 700 meters northwest along strike from previous drilling where a large-scale northwest trending overturned fold was recognized. The latest hole targeted an inferred feeder zone below a significant multi-element geochemical anomaly identified from reanalysis of historical drill samples. While the hole intersected favorable alteration in the overturned limb, gold results were disappointing. No additional work is planned for the foreseeable future.
Goldstrike, Nevada, USA
On the Goldstrike property, focus during the quarter has been directed toward ensuring all data is available and validated ahead of consolidating a geologic model covering the full extent of the project area. To date, the effort which includes validation of gold and geochemical data as well as digitizing atop-quality surface geologic map is approximately 50% complete. Completion of the model, peer review, target prioritization are planned in the second quarter of 2019.
Donlin Gold, Alaska, USA
The new geologic model of the Donlin deposit represents an improvement in accuracy and resolution of modeled ore controlling dikes and structure as a result of implementing improved geologic interpretation and modeling software. At the end of the first quarter of 2019, the new geologic model is being used to guide grade estimation and distribution to deliver a more robust and defendable result. Estimation work will be completed in the second quarter followed by evaluation to determine the effects of the new model on the economics of the deposit.
Hemlo, Ontario, Canada
At Hemlo, reassessment of structural controls on mineralization in theC-Zone shows recumbent folding of disseminated style mineralization, with ore shoots plunging parallel to steep fold axis. Two styles of high-grade veins also
appear to plunge steeply. The down-plunge extent of these ore controlling features in theC-Zone is sparsely drilled, which supports theC-Zone Deep extension target, where drilling is scheduled to commence early in the second quarter. The detailed geologic work conducted in the first quarter of 2019 will have implications for near term down-plunge drill testing and future targeting work west of theC-Zone. Additional opportunities, such as down-plunge and lateral extensions, or drill gaps in parallel zones, will be advanced in the second quarter and beyond to delineate new targets.
Del Carmen, Argentina
At Del Carmen, in the southern part of the El Indio belt in Argentina, 15 holes totalling 4,212 meters were drilled around the historic Rojo Grande resource. Most holes intersected favourable alteration however many holes still have assays pending. Results so far are encouraging and will add near surface inventory. Infill drilling will be required to further establish continuity and convert the inventory into resources. Mineralization remains open in many directions, particularly to the west, and towards the northern part of Alturas in a large area with very few drill holes. In addition, surface work on nearby satellite targets has highlighted favorably altered phreatomagmatic breccias up to 1.5km east of Rojo Grande. Three targets will be drilled by initial scout holes in the second quarter of 2019.
Veladero, Argentina
At Veladero in the Cuatro Esquinas area between the Filo Federico and Amable pits, near-surface results beat expectations and may potentially favorably impact any required stripping to access mineralization. Drilling also commenced at several satellite targets such as Cerro Pelado, Brujas and Pecos. Are-evaluation of the Penelope deposit (located at Pascua-Lama) as a potential source of leachable material is underway. The geological model update is in progress and will be completed next quarter. Elsewhere in the Frontera District surface work is delineating new targets which will likely be drilled next field season.
Pueblo Viejo, Dominican Republic
A renewed emphasis on understanding the geological controls at Pueblo Viejo is underway. A selective but detailed relogging campaign was commenced last quarter and this has been validating the need for a revised geology model. An early significant observation is that much of the mineralization below the current pits is disseminated in nature, and there could be multiple controls. Several specific lithologies appear to be more favourable hosts and mineralization could potentially be more continuous along those lithologies. Careful systematic relogging and geological domaining will be required to support a revised block model expected to be completed in the third quarter of 2019.
Lagunas Norte, Peru
At the Lagunas Norte mine, multiple oxide and mixed ore opportunities have been identified within the life of mine open pit. A drilling program of more than 5,000m was initiated in mid-March with six holes completed by the end of the first quarter of 2019. The program has seen moderate success given that it has intercepted mineralization, which is mostly sulfides in the Dafne area. Whilst it is expected that these arenon-refractory, this must be confirmed by cyanidation tests. A
BARRICK FIRST QUARTER 2019 | 46 | MANAGEMENT’S DISCUSSION AND ANALYSIS |
site based exploration team has been established to develop an improved geological model and determine the full sulfide potential as well as areas that require drilling or additional information. Sulfide mineralization is high grade and constrained to three main areas. At Dafne South, gold mineralization is hosted mostly in Chimu sediments, controlled by phreatomagmatic activity at the contact with adjacent Miocene volcanic center and complex folding within the sediments. At Josefa, high grade gold mineralization is closely associated to phreatomagmatic breccias and products along the eastern margin of the Chimu sediments. At Breccia Central,re-logging reveals that mineralization appears to be strongly controlled by brecciation. High grade mineralization occurs almost exclusively localized within sandstone breccia with sulfide cement, brown silica and intercepts of tuffaceous injections with vuggy silica suggesting a close relationship to a phreatomagmatic source.
At La Capilla, located less than 10km from the Lagunas Norte mine site, a first phase of 15 holes for 3,012 meters was drilled during the first quarter confirming outcropping oxide mineralization. Partial results in step out holes to the north and south of this area show multiple holes intersecting oxide gold mineralization over tens of meters, includingDLC-19-006A with 57 meters @ 1.0 g/t Au5. An increased understanding of the controls to mineralization from the recent drilling at La Capilla, suggests there is a very large untested area beyond the current mineral inventory, that requires further drilling.
Massawa, Senegal
At Massawa, in Senegal, further infill work was completed on the Samina and Tina targets that confirmed the continuity of strong grades in both targets. Some results from this work including additional metallurgical test work results are pending. The satellite exploration program moved to the untested southern extension of the Sofia structure which hosts thenon-refractory Sofia deposit. Shallow drilling is in progress, testing a 5km strike length of patchy surface anomalism under transported surface material. At Bambadji, following the validation and update of the regolith interpretation, a regional auger drilling program commenced. This program is testing concealed portions of mineralized structural corridors within the permit and is due to be completed in the second quarter.
Loulo-Gounkoto, Mali
At Loulo-Gounkoto in Mali, resource drilling continued delineating the Transfer Zone limits at Yalea. Scout drilling in the Panel Zone commenced and intersected strong mineralization, potentially extending the previously defined high grade zone in YDH282 (10.9m @ 8.74g/t and 8.15m @ 6.55g/t)5 northwards over 320m. Results are pending. At Loulo 3, a model update is being finalized for use in an updated economic analysis. At Faraba North further modeling of
results confirmed the potential for a small satellite open pit which would require a decision to infill drill further to establish a resource. Drilling to test extensions of the MZ2 and MZ3 targets at Gounkoto for the upcoming underground feasibility study has started.
Bena, Mali
At Bena in Mali, the regional drilling program testing major structures below adverse regolith confirmed the extensions to the Boulandissou Main and Teriya SE targets (results pending) whilst in Mali South, regional field traverses have commenced to build on the existing geological understanding of the terrane and to develop an updated prospectivity analysis for the region.
Tongon, Côte d’Ivoire
At Tongon in Côte d’Ivoire, infill fences of shallow drilling were conducted on the Badenou trend that confirmed that significant surface mineralization is confined to known targets. Deeper reverse circulation (“RC”) drilling is now evaluating these targets further and results are pending. Infill RC drilling at the previously defined Djinne target on the same trend, confirmed its potential to be exploited as a satellite deposit to Tongon.
Mankono, Côte d’Ivoire
At Mankono, infill shallow drilling continued testing the 7km long Bafretou South soil anomaly (6.7km). Results confirmed anomalous bedrock mineralization and further infill drilling is required to confirm its control and continuity. Four other targets were also tested, of which Dokeka returned very high-grade mineralisation from two 100m spaced AC holes (10m @ 52.11g/t and 9m @ 8.69g/t5). Good results also returned from Gbongogo N which was tested with diamond drilling, GBDD024 (10.8m @ 2.41g/t)5 is interpreted to have grazed the top of a larger intrusion at depth. At Boundiali, results from work over 19 priority targets on the Fonondara trend has highlighted three for follow up work, whilst work is also being planned on a separate western structure which features multiple anomalous targets.
Kibali, Democratic Republic of Congo
At Kibali in the DRC, the Gorumbwa mineralized zones were confirmed 700m down plunge from the existing $1,500/oz pit shell by two DDH holes which returned 12m @ 5.46g/t and 5m @ 6.25g/t in GDD0196, and 4m @ 2.49g/t and 4.3m @ 2.94g/t in GDD01975. These lenses are open and will be tested further in the second quarter of 2019. Further drilling is in progress at Oere to confirm continuity of mineralization over 2km of strike and to extend the zone of mineralization along strike in both directions. At Zakitoko, RC testing of 2 out of 4 targets along the KZ South structure continued this quarter and results to date support an anastomosing shear system with narrow mineralization within a wide, anomalous alteration envelope.
BARRICK FIRST QUARTER 2019 | 47 | MANAGEMENT’S DISCUSSION AND ANALYSIS |
REVIEW OF FINANCIAL RESULTS
Revenue
($ millions, except per ounce/pound data in dollars)
| For the three months ended
| |||||||||||
March 31,
|
December 31, 2018
|
March 31, 2018
| ||||||||||
Gold | ||||||||||||
000s oz solda | 1,365 | 1,232 | 1,071 | |||||||||
000s oz produceda | 1,367 | 1,262 | 1,049 | |||||||||
Market priceb | 1,304 | 1,226 | 1,329 | |||||||||
Realized priceb,c | 1,307 | 1,223 | 1,332 | |||||||||
Revenue | 1,906 | 1,734 | 1,643 | |||||||||
Copper | ||||||||||||
millions lbs solda | 103 | 109 | 85 | |||||||||
millions lbs produceda | 106 | 109 | 85 | |||||||||
Market priceb | 2.82 | 2.80 | 3.16 | |||||||||
Realized priceb,c | 3.07 | 2.76 | 2.98 | |||||||||
Revenue | 163 | 144 | 111 | |||||||||
Other sales | 24 | 26 | 36 | |||||||||
Total revenue
|
| 2,093
|
|
| 1,904
|
|
| 1,790
|
|
a. | Includes our equity share of gold ounces from Acacia and Pueblo Viejo and copper pounds from Zaldívar and Jabal Sayid. Also includes our equity share of gold ounces from Loulo-Gounkoto, Tongon, Kibali and Morila commencing January 1, 2019, the effective date of the Merger. |
b. | Per ounce/pound weighted average. |
c. | Realized price is anon-GAAP financial performance measure with no standardized meaning under IFRS and therefore may not be comparable to similar measures of performance presented by other issuers. For further information and a detailed reconciliation of eachnon-GAAP measure used in this section of the MD&A to the most directly comparable IFRS measure, please see pages 57 to 72 of this MD&A. |
Q1 2019 compared to Q4 2018
In the first quarter of 2019, gold revenues increased by 10% compared to the fourth quarter of 2018 primarily due to the impact of the production from sites acquired as part of the Merger. Excluding the impact of the Merger, gold revenues decreased by 7%, primarily due to lower gold sales, partially offset by higher realized gold prices1. The average market price for the three month period ended March 31, 2019 was $1,304 per ounce versus $1,226 per ounce for the prior quarter. During the first quarter of 2019, the gold price ranged from $1,276 per ounce to $1,347 per ounce and closed the quarter at $1,295 per ounce. Gold prices in the quarter were influenced by movements in the US dollar, especially in relation to Chinese and Indian currencies, fluctuations in US Treasury rates and changes in expectations for US benchmark interest rates, along with net purchases from investors and the official sector.
Gold Production Variance (000s oz)
Q1 2019 compared to Q4 2018
In the first quarter of 2019, gold production was 105 thousand ounces higher than the prior quarter. Excluding the impact of the Merger, gold production in the first quarter of 2019 decreased by 188 thousand ounces, or 15%, compared to the prior quarter, primarily due to lower grades at Cortez, Goldstrike and Pueblo Viejo.
Copper revenues in the first quarter of 2019 increased by 13% compared to the prior quarter, primarily due to higher realized copper price1, partially offset by slightly lower copper sales volume. The average market price in the first quarter of 2019 was $2.82 per pound versus $2.80 per pound in the prior quarter. For the three month period ended March 31, 2019, the realized copper price1 was higher than the market copper price as a result of the impact of positive provisional pricing adjustments recorded in the first quarter of 2019. During the first quarter of 2019, the copper price ranged from $2.60 per pound to $2.97 per pound and closed the quarter at $2.94 per pound. Copper prices in the first quarter were positively influenced by continued global economic growth, supply disruptions, a strengthening Chinese yuan and low physical stockpiles compared to recent years.
Copper production in the first quarter of 2019 decreased by 3 million pounds compared to the prior quarter, primarily due to the production interruptions at Lumwana as a result of the rain season occurring in the first quarter of the year.
BARRICK FIRST QUARTER 2019 | 48 | MANAGEMENT’S DISCUSSION AND ANALYSIS |
Q1 2019 compared to Q1 2018
For the three month period ended March 31, 2019, gold revenues increased 16% compared to the same prior year period primarily due to the impact of the production from sites acquired as part of the Merger. Excluding the impact of the Merger, gold revenues remained relatively in line with the same prior year period, with both realized gold prices1 and sales volumes remaining relatively consistent. The average market price for the three month period ended March 31, 2019 was $1,304 per ounce versus $1,329 per ounce for the same prior year period.
Gold Production Variance (000s oz)
Q1 2019 compared to Q1 2018
For the three month period ended March 31, 2019, gold production was 318 thousand ounces higher than the same prior year period. Excluding the impact of the Merger, gold production for the three month period ended March 31, 2019 increased by 11 thousand ounces, or 1%, compared to the same prior year period. Higher gold production for the three month period is mainly due to higher grades at Goldstrike and Turquoise Ridge, offset by lower grades at Cortez and lower tonnes mined and processed at Lagunas Norte.
Copper revenues for the three month period ended March 31, 2019 increased by 47% compared to the same prior year period. Higher copper revenues for the three month period was primarily due to higher copper sales volume and higher realized copper price1. In the first quarter of 2019, the realized copper price1 was higher than the market copper price as a result of the impact of positive provisional pricing adjustments recorded in the first quarter of 2019, whereas the realized copper price1 was lower than the market copper price in the same prior year period as a result of the impact of negative provisional pricing adjustments.
Copper production for the three month period ended March 31, 2019, increased by 21 million pounds compared to the same prior year period, mainly due to higher throughput, grade, and recovery at Lumwana and Jabal Sayid.
Production Costs
($ millions, except per ounce/pound data in dollars)
| For the three months ended
| |||||||||||
March 31,
|
December 31,
|
March 31,
| ||||||||||
Gold | ||||||||||||
Direct mining costsa | 894 | 934 | 690 | |||||||||
Depreciation | 384 | 346 | 298 | |||||||||
Royalty expense | 66 | 58 | 50 | |||||||||
Community relations | 6 | 15 | 8 | |||||||||
Cost of sales | 1,350 | 1,353 | 1,046 | |||||||||
Cost of sales ($/oz)b | 947 | 980 | 878 | |||||||||
Total cash costsc,d | 631 | 588 | 573 | |||||||||
All-in sustaining costsc,d | 825 | 788 | 804 | |||||||||
Copper | ||||||||||||
Direct mining costs | 76 | 113 | 66 | |||||||||
Depreciation | 42 | 84 | 19 | |||||||||
Royalty expense | 12 | 11 | 9 | |||||||||
Community relations | 1 | 2 | 2 | |||||||||
Cost of sales | 131 | 210 | 96 | |||||||||
Cost of sales ($/lb)b | 2.21 | 2.85 | 2.07 | |||||||||
C1 cash costsc,d | 1.66 | 1.98 | 1.88 | |||||||||
All-in sustaining costsc,d | 2.46 | 2.95 | 2.61 |
a. | Includes mining and processing costs. |
b. | Cost of sales applicable to gold per ounce is calculated using cost of sales applicable to gold on an attributable basis (removing thenon-controlling interest of 40% Pueblo Viejo, 36.1% Acacia and 40% South Arturo from cost of sales), divided by attributable gold ounces. Thenon-controlling interest of 20% Loulo-Gounkoto and 10.3% of Tongon is also removed from cost of sales and our proportionate share of cost of sales attributable to equity method investments (Kibali and Morila) is included commencing January 1, 2019, the effective date of the Merger. Cost of sales applicable to copper per pound is calculated using cost of sales applicable to copper including our proportionate share of cost of sales attributable to equity method investments (Zaldívar and Jabal Sayid), divided by consolidated copper pounds (including our proportionate share of copper pounds from our equity method investments). |
c. | Per ounce/pound weighted average. |
d. | Total cash costs, C1 cash costs andall-in sustaining costs arenon-GAAP financial performance measures with no standardized meaning under IFRS and therefore may not be comparable to similar measures of performance presented by other issuers. For further information and a detailed reconciliation of eachnon-GAAP measure used in this section of the MD&A to the most directly comparable IFRS measure, please see pages 57 to 72 of this MD&A. |
Q1 2019 compared to Q4 2018
In the first quarter of 2019, cost of sales applicable to gold was in line with the fourth quarter of 2018, mainly due to lower direct mining costs, offset by higher depreciation expense. Excluding the impact of the Merger, direct mining costs decreased by 20%, primarily due to lower sales volume and the impact of business improvement initiatives at Pueblo Viejo and Veladero. Depreciation expense was higher in the first quarter of 2019 as a result of the fair value increments applied to our interests in the Randgold operations. Excluding the impact of the merger with Randgold, amortization decreased by 19%, also due to the impact of lower ounces sold. Our 45% interest in Kibali and 40% interest in Morila are equity accounted for and therefore we do not include its cost of sales in our consolidated gold cost of sales. On a per ounce basis, cost of sales applicable to gold4, after including our proportionate share of cost of sales at our equity method
BARRICK FIRST QUARTER 2019 | 49 | MANAGEMENT’S DISCUSSION AND ANALYSIS |
investees, was 3% lower than the prior quarter primarily due to the inventory impairment of $166 million at Lagunas Norte recorded in the prior quarter. This was partially offset by higher depreciation expense as a result of the fair value increments applied to our interests in the Randgold operations ($47/oz). Total cash costs1 increased by $43 per ounce compared to the prior quarter primarily due to sales mix, as we sold more ounces from relatively higher cost mines, combined with lower sales volumes from lower cost mines. This was combined with higher total cash costs1 at Cortez mainly due to lower production as a result of the lower grades at CHOP.
In the first quarter of 2019, goldall-in sustaining costs1 were up $37 per ounce or 5%, compared to the prior quarter primarily due to an increase in total cash costs1 as discussed above, partially offset by lower minesite sustaining capital expenditures.
In the first quarter of 2019, cost of sales applicable to copper was 38% lower than the prior quarter primarily due to lower direct mining costs relating to the positive impact of cost reduction initiatives, such as lower negotiated contractor mining and hauling rates at Lumwana. In addition, the fourth quarter of 2018 contained a higher than normal amount of depreciation. Our 50% interests in Zaldívar and Jabal Sayid are equity accounted for and therefore we do not include their cost of sales in our consolidated copper cost of sales. On a per pound basis, cost of sales applicable to copper4 and C1 cash costs4, after including our proportionate share of cost of sales at our equity method investees, decreased by 22% and 16%, respectively, compared to the prior quarter primarily due to lower direct mining costs at Lumwana as discussed above, and lower freight and refining costs at Jabal Sayid.
In the first quarter of 2019, copperall-in sustaining costs1, which have been adjusted to include our proportionate share of equity method investments, were 16% lower than the prior quarter primarily reflecting the lower direct mining costs applicable to copper, partially offset by higher minesite sustaining capital expenditures.
Q1 2019 compared to Q1 2018
For the three month period ended March 31, 2019, cost of sales applicable to gold was 29% higher than the same prior year period. Excluding the impact of the merger with Randgold, cost of sales applicable to gold remained relatively consistent with the same prior year period. Our 45% interest in Kibali and 40% interest in Morila are equity accounted for and therefore we do not include its cost of sales in our consolidated gold cost of sales. On a per ounce basis, cost of sales applicable to gold4, after including our proportionate share of cost of sales at our equity method investees, was 8% higher than the same prior year period primarily due to higher depreciation expense as a result of the fair value increments applied to our interests in the Randgold operations ($47/oz). Total cash costs1 increased by $58 per ounce compared to the same prior year period primarily due to sales mix, as we sold more ounces from relatively higher cost mines, combined with lower sales volumes from lower cost mines.
For the three month period ended March 31, 2019, goldall-in sustaining costs1 increased by 3% compared to the same prior year period, primarily due to an increase in total cash costs1, partially offset by lower minesite sustaining capital expenditures.
For the three month period ended March 31, 2019, cost of sales applicable to copper was 36% higher than the same prior year period primarily due to increased sales volume. Our 50% interests in Zaldívar and Jabal Sayid are equity accounted for and therefore we do not include their cost of sales in our consolidated copper cost of sales. On a per pound basis, cost of sales applicable to copper4, after including our proportionate share of cost of sales at our equity method investees, increased 7% compared to the same prior year period primarily due to higher depreciation expense. C1 cash costs4 per pound, decreased by 12% primarily due to lower direct mining costs at Lumwana and Jabal Sayid.
For the three month period ended March 31, 2019, copperall-in sustaining costs1, which have been adjusted to include our proportionate share of equity method investments, was 6% lower than the same prior year period primarily reflecting the lower direct mining costs applicable to copper, partially offset by higher minesite sustaining capital expenditures.
Capital Expendituresa
($ millions)
| For the three months ended
| |||||||||||
March 31, 2019
|
December 31, 2018
|
March 31, 2018
| ||||||||||
Minesite sustainingb | 253 | 267 | 233 | |||||||||
Project capital expendituresc | 120 | 100 | 93 | |||||||||
Capitalized interest | 1 | 7 | 0 | |||||||||
Total consolidated capital expenditures | 374 | 374 | 326 | |||||||||
Attributable capital expendituresd | 361 | 368 | 320 |
a. | These amounts are presented on a 100% cash basis, except for attributable consolidated capital expenditures. |
b. | Includes both minesite sustaining and mine development. |
c. | Project capital expenditures (on an accrued basis until December 31, 2018, and on a cash basis thereafter) are included in our calculation ofall-in costs, but not included in our calculation ofall-in sustaining costs. |
d. | These amounts are presented on the same basis as our guidance and include our 60% share of Pueblo Viejo and South Arturo, our 63.9% share of Acacia and our 50% share of Zaldívar and Jabal Sayid. Also includes our 80% share of Loulo-Gounkoto, 89.7% share of Tongon, 45% share of Kibali and 40% share of Morila commencing January 1, 2019, the effective date of the Merger. |
Q1 2019 compared to Q4 2018
In the first quarter of 2019, total consolidated capital expenditures on a cash basis remained the same as the fourth quarter of 2018, mainly due to an increase in project capital expenditures, offset by a decrease in minesite sustaining capital expenditures. The increase in project capital expenditures primarily relates to the funding of a power transmission line in Argentina as a result of an agreement made with the EPRE. Minesite sustaining capital expenditures decreased in the first quarter of 2019 mainly due to the deferral of spending at Pueblo Viejo relating to tailing pumps and the Bonao Substation III project. This was combined with lower expenditures at Cortez associated with the Area 34 leach pad expansion and the purchase of underground mobile equipment occurring in the prior quarter.
Q1 2019 compared to Q1 2018
For the three month period ended March 31, 2019, total consolidated capital expenditures on a cash basis increased by 15% compared to the same prior year period, due to an
BARRICK FIRST QUARTER 2019 | 50 | MANAGEMENT’S DISCUSSION AND ANALYSIS |
increase in project capital expenditures and minesite sustaining capital expenditures of 29% and 9%, respectively. The increase in project capital expenditures is primarily due to the funding of a power transmission line in Argentina between Veladero and Pascua-Lama. Minesite sustaining capital expenditures increased compared to the same prior year period as a result of the Merger.
General and Administrative Expenses
($ millions)
| For the three months ended
| |||||||||||
March 31, 2019
|
December 31, 2018
|
March 31, 2018
| ||||||||||
Corporate administrationa | 43 | 34 | 39 | |||||||||
Share-based compensationb | 6 | 11 | 4 | |||||||||
Acacia | 5 | 8 | 5 | |||||||||
General & administrative expenses
|
| 54
|
|
| 53
|
|
| 48
|
|
a. | For the three months ended March 31, 2019, corporate administration costs include approximately $5 million of severance costs (December 31, 2018: $27 million and March 31, 2018: $3 million). |
b. | Based on US$13.71 share price as at March 31, 2019 (December 31, 2018: US$13.54 and March 31, 2018: US$12.45) and excludes Acacia. |
Q1 2019 compared to Q4 2018
In the first quarter of 2019, general and administrative expenses were in line with the fourth quarter of 2018, as higher corporate administration expenses primarily due to executive compensation was offset by lower share-based compensation as the increase in the share price was higher in the prior quarter.
Q1 2019 compared to Q1 2018
For the three month period ended March 31, 2019, general and administrative expenses were $54 million compared to $48 million in the same prior year period due to slight increases in executive compensation expense and share-based compensation.
Exploration, Evaluation and Project Expenses
($ millions)
|
For the three months ended
| |||||||||||
March 31, 2019
|
December 31, 2018
|
March 31, 2018
| ||||||||||
Global exploration and evaluation | 31 | 29 | 30 | |||||||||
Advanced project costs: | ||||||||||||
Pascua-Lama | 13 | 10 | 23 | |||||||||
Other | 4 | 10 | 4 | |||||||||
Corporate development | 8 | 32 | 5 | |||||||||
Business improvement and innovation | 7 | 29 | 5 | |||||||||
Global exploration and evaluation and project expense | 63 | 110 | 67 | |||||||||
Minesite exploration and evaluation | 11 | 14 | 6 | |||||||||
Total exploration, evaluation and project expenses | 74 | 124 | 73 |
Q1 2019 compared to Q4 2018
Exploration, evaluation and project expenses for the first quarter of 2019 decreased by $50 million compared to the fourth quarter of 2018, primarily due to lower corporate development and business improvement and innovation costs. The decrease in corporate development costs is mainly due to $37 million in transaction costs related to the merger with Randgold incurred in the prior quarter. The decrease in business improvement and innovation was related to the completion of a cloud-based human resources system that was substantially completed in the prior quarter and was commissioned in the first quarter of 2019.
Q1 2019 compared to Q1 2018
Exploration, evaluation and project expenses for the three month period ended March 31, 2019 was in line with the same prior year period.
Finance Costs, Net
($ millions)
| For the three months ended
| |||||||||||
March 31, 2019
|
December 31, 2018
|
March 31, 2018
| ||||||||||
Interest expensea | 110 | 110 | 117 | |||||||||
Accretion | 20 | 22 | 20 | |||||||||
Interest capitalized | (2 | ) | (9 | ) | 0 | |||||||
Other finance costs | (1 | ) | (3 | ) | 1 | |||||||
Finance income | (7 | ) | (3 | ) | (5 | ) | ||||||
Finance costs, net
| 120 | 117 | 133 |
a. | For the three months ended March 31, 2019, interest expense includes approximately $25 million ofnon-cash interest expense relating to the gold and silver streaming agreements with Wheaton Precious Metals Corp. and Royal Gold, Inc. (December 31, 2018: $25 million and March 31, 2018: $24 million). |
BARRICK FIRST QUARTER 2019 | 51 | MANAGEMENT’S DISCUSSION AND ANALYSIS |
Q1 2019 compared to Q4 2018
In the first quarter of 2019, net finance costs were in line with the prior quarter.
Q1 2019 compared to Q1 2018
For the three month period ended March 31, 2019, net finance costs were $13 million lower than the same prior year period, primarily due to lower interest expense attributed to debt reductions made in the prior year. In July 2018, we completed a make-whole repurchase of the remaining $629 million of principal on the 4.40% Notes due 2021.
Additional Significant Statement of Income Items
($ millions)
| For the three months ended
| |||||||||
March 31, 2019
|
December 31, 2018
|
March 31, 2018
| ||||||||
Impairment charges (reversals) | 3 | 408 | 2 | |||||||
Loss (gain) on currency translation | 22 | (16 | ) | 15 | ||||||
Other expense (income) | 27 | 35 | 1 |
Impairment Charges (Reversals)
Q1 2019 compared to Q4 2018
In the first quarter of 2019, net impairment charges were $3 million compared to $408 million in the prior quarter. In the fourth quarter of 2018, we recognized impairments of $160 million (net of tax) of noncurrent assets and $154 million of goodwill at Veladero, reflecting an increase in the cost structure related to increasing government imposts coupled with higher energy costs. In the first quarter of 2019, we recorded no significant impairment charges or reversals.
Q1 2019 compared to Q1 2018
For the three month period ended March 31, 2019, net impairment charges were $3 million compared to $2 million in the same prior year period. We recorded no significant impairment charges or reversals in both the three month periods ended March 31, 2019 and March 31, 2018.
For a further breakdown of impairment charges and reversals, refer to note 13 of the Financial Statements.
Loss on Currency Translation
Q1 2019 compared to Q4 2018
Loss on currency translation in the first quarter of 2019 increased by $38 million compared to the prior quarter. The increase is primarily due to unrealized foreign currency translation losses relating to the Argentine peso, which has depreciated significantly in the current year period, and devalues our peso denominated VAT receivable balances. During the fourth quarter of 2018, the Argentine peso had strengthened versus the US dollar, but during the first quarter of 2019 the US dollar continued to trade strongly and the Argentine peso continued its general trend of weakening versus the US dollar, primarily due to the impact of inflation in Argentina.
Q1 2019 compared to Q1 2018
Loss on currency translation for the three month period ended March 31, 2019 increased by $7 million compared to the same prior year period, also due to unrealized foreign currency translation losses relating to the Argentine peso, which has
depreciated significantly in the current year period, and devalues our peso denominated VAT receivable balances.
Other Expense (Income)
Q1 2019 compared to Q4 2018
In the first quarter of 2019, other expense decreased by $8 million compared to the prior quarter. In the first quarter of 2019, other expense primarily consists of various Acacia costs. In the fourth quarter of 2018, other expense primarily consisted of thewrite-off of a Western Australia long-term stamp duty receivable, partially offset by a gain on the sale on our remaining interest in the Bald Mountain Exploration Joint Venture.
Q1 2019 compared to Q1 2018
For the three month period ended March 31, 2019, other expense increased by $26 million compared to the same prior year period, as a result of a $45 million gain on the sale of anon-core royalty asset at Acacia that occurred in the same prior year period, partially offset by lower litigation expenses in the first quarter of 2019.
For a further breakdown of other expense (income), refer to note 9 to the Financial Statements.
Income Tax Expense
Income tax expense was $167 million in the first quarter of 2019. The underlying effective tax rate for ordinary income in the first quarter of 2019 was 43% after adjusting for the impact of foreign currency translation losses on deferred tax balances; the impact ofnon-deductible foreign exchange losses; and the impact of other expense adjustments. The unadjusted tax rate for income in the first quarter of 2019 was 54% of the income before income taxes.
We record deferred tax charges or credits if changes in facts or circumstances affect the estimated tax basis of assets and therefore the amount of deferred tax assets or liabilities to reflect changing expectations in our ability to realize deferred tax assets. The interpretation of tax regulations and legislation and their application to our business is complex and subject to change. We have significant amounts of deferred tax assets (mostly unrecognized following impairments in the fourth quarter of 2018), including tax loss carry forwards, and also deferred tax liabilities. Potential changes of any of these amounts, as well as our ability to realize deferred tax assets, could significantly affect net income or cash flow in future periods. For further details on income tax expense, refer to note 10 of the Financial Statements.
BARRICK FIRST QUARTER 2019 | 52 | MANAGEMENT’S DISCUSSION AND ANALYSIS |
FINANCIAL CONDITION REVIEW
Summary Balance Sheet and Key Financial Ratios
($ millions, except ratios and share amounts)
| As at March 31, 2019
| As at December 31, 2018
| ||||||
Total cash and equivalents | 2,153 | 1,571 | ||||||
Current assets | 2,721 | 2,407 | ||||||
Non-current assets | 27,755 | 18,653 | ||||||
Total Assets | 32,629 | 22,631 | ||||||
Current liabilities excluding short-term debt | 1,676 | 1,625 | ||||||
Non-current liabilities excluding long-term debta | 6,844 | 5,883 | ||||||
Debt (current and long-term) | 5,807 | 5,738 | ||||||
Total Liabilities | 14,327 | 13,246 | ||||||
Total shareholders’ equity | 15,598 | 7,593 | ||||||
Non-controlling interests | 2,704 | 1,792 | ||||||
Total Equity | 18,302 | 9,385 | ||||||
Total common shares outstanding (millions of shares)b | 1,752 | 1,168 | ||||||
Debt, net of cash | 3,654 | 4,167 | ||||||
Key Financial Ratios: | ||||||||
Current ratioc | 2.46:1 | 2.38:1 | ||||||
Debt-to-equityd
| 0.32:1 | 0.61:1 |
a. | Non-current financial liabilities as at March 31, 2019 were $5,986 million (December 31, 2018: $6,201 million). |
b. | Total common shares outstanding do not include 0.4 million stock options. |
c. | Represents current assets divided by current liabilities (including short-term debt) as at March 31, 2019 and December 31, 2018. |
d. | Represents debt divided by total shareholders’ equity (including minority interest) as at March 31, 2019 and December 31, 2018. |
Balance Sheet Review
Total assets were $32.6 billion at March 31, 2019, approximately $10.0 billion higher than at December 31, 2018, primarily reflecting the $7.9 billion Merger. Refer to note 4 for a summary of the purchase price allocation. Our asset base is primarily comprised ofnon-current assets such as property, plant and equipment and goodwill, reflecting the capital-intensive nature of the mining business and our history of growing through acquisitions. Other significant assets include production inventories, indirect taxes recoverable and receivable, concentrate sales receivable and other government and joint venture related receivables, and cash and equivalents.
Total liabilities at March 31, 2019 were $14.3 billion, approximately $1.1 billion higher than at December 31, 2018, also reflecting the Merger and the resulting increase in deferred income tax liability. Our liabilities are primarily comprised of debt, othernon-current liabilities such as provisions and deferred income tax liabilities, and accounts payable.
Shareholders’ Equity
As at April 30, 2019 | Number of shares | |||
Common shares | 1,751,981,799 | |||
Stock options | 436,890 |
Financial Position and Liquidity
Total cash and cash equivalents as at March 31, 2019 were $2.2 billion3. Our capital structure comprises a mix of debt and shareholders’ equity. As at March 31, 2019, our total debt was $5.8 billion (debt net of cash and equivalents was $3.7 billion) and ourdebt-to-equity ratio was 0.32:1. This compares to debt as at December 31, 2018 of $5.7 billion (debt net of cash and equivalents was $4.2 billion), and adebt-to-equity ratio of
0.61:1. This minor increase in debt was primarily a result of the new accounting standard for leases, effective January 1, 2019.
Uses of cash for the remainder of 2019 include capital commitments of $74 million and we expect to incur attributable sustaining and project capital expenditures of approximately $1,100 to $1,400 million during the final nine months of the year, based on our guidance range described on page 24. For the remainder of 2019, we have contractual obligations and commitments of $422 million in purchase obligations for supplies and consumables. In addition, we have $309 million in interest payments and other amounts as detailed in the table on page 55. We expect to fund these commitments through operating cash flow, which is our primary source of liquidity, as well as existing cash balances.
We announced on September 24, 2018 that we entered into a mutual investment agreement to purchase up to $300 million of shares in Shandong Gold Mining Co. Ltd. As of the date of this MD&A, we had purchased approximately $120 million of shares of Shandong Gold Mining Co. Ltd. and may make additional investments under the terms of our agreement.
Our operating cash flow is dependent on the ability of our operations to deliver projected future cash flows. The market prices of gold, and to a lesser extent copper, are the primary drivers of our operating cash flow. Other options to enhance liquidity include further portfolio optimization and the creation of new joint ventures and partnerships; issuance of equity securities in the public markets or to private investors, which could be undertaken for liquidity enhancement and/or in connection with establishing a strategic partnership; issuance of long-term debt securities in the public markets or to private investors (Moody’s and S&P currently rate Barrick’s outstanding long-term debt as investment grade, with ratings of Baa2 and BBB, respectively); and drawing on the
BARRICK FIRST QUARTER 2019 | 53 | MANAGEMENT’S DISCUSSION AND ANALYSIS |
$3.0 billion available under our undrawn credit facility (subject to compliance with covenants and the making of certain representations and warranties, this facility is available for drawdown as a source of financing). The key financial covenant in our undrawn credit facility requires Barrick to maintain a net debt to total capitalization ratio of less than 0.60:1. Barrick’s net debt to total capitalization ratio was 0.17:1 as at March 31, 2019 (0.31:1 as at December 31, 2018).
Summary of Cash Inflow (Outflow)
($ millions)
| For the three months ended
| |||||||||||
March 31,
|
December 31,
|
March 31,
| ||||||||||
Net cash provided by operating activities
|
| 520
|
|
| 411
|
|
| 507
|
| |||
Investing activities | ||||||||||||
Capital expenditures | (374 | ) | (374 | ) | (326 | ) | ||||||
Cash acquired in Merger | 751 | 0 | 0 | |||||||||
Other | 45 | (103 | ) | 42 | ||||||||
Total investing inflows (outflows)
|
| 422
|
|
| (477
| )
|
| (284
| )
| |||
Financing activities | ||||||||||||
Net change in debta | (28 | ) | (7 | ) | (23 | ) | ||||||
Dividends | (333 | ) | (31 | ) | (31 | ) | ||||||
Other
|
| 1
|
|
| (19
| )
|
| (18
| )
| |||
Total financing inflows (outflows)
|
| (360
| )
|
| (57
| )
|
| (72
| )
| |||
Effect of exchange rate
| 0 | (3 | ) | (1 | ) | |||||||
Increase (decrease) in cash and equivalents
|
| 582
|
|
| (126
| )
|
| 150
|
|
a. | The difference between the net change in debt on a cash basis and the net change on the balance sheet is due to changes innon-cash charges, specifically the unwinding of discounts and amortization of debt issue costs. |
Q1 2019 compared to Q4 2018
In the first quarter of 2019, we generated $520 million in operating cash flow, compared to $411 million in the prior quarter. The increase of $109 million was primarily due to less cash interest paid during the quarter mainly as a result of timing. This was combined with an increase in sales volume and higher realized gold and copper prices1.
Cash inflows from investing activities in the first quarter of 2019 were $422 million compared to an outflow of $477 million in the prior quarter. The change of $899 million was primarily due to cash acquired in the Merger of $751 million.
Net financing cash outflows for the first quarter of 2019 amounted to $360 million, compared to $57 million in the prior quarter. The higher outflows are primarily due to dividends declared in the prior quarter by Barrick and Randgold of $76 million and $256 million, respectively, and paid in the first quarter of 2019.
Q1 2019 compared to Q1 2018
In the first quarter of 2019, we generated $520 million in operating cash flow, compared to $507 million in the same prior year period. The increase of $13 million was primarily due to higher sales volume, partially offset by lower realized gold prices1 and higher direct mining costs as a result of the increased sales volume.
Cash inflows from investing activities in the first quarter of 2019 were $422 million compared to an outflow of $284 million in the same prior year period. The change of $706 million was primarily due to cash acquired in the Merger of $751 million.
Net financing cash outflows for the first quarter of 2019 amounted to $360 million, compared to $72 million in the same prior year period. The higher outflows are primarily due to dividends declared in the prior quarter by Barrick and Randgold of $76 million and $256 million, respectively, and paid in the first quarter of 2019.
BARRICK FIRST QUARTER 2019 | 54 | MANAGEMENT’S DISCUSSION AND ANALYSIS |
COMMITMENTS AND CONTINGENCIES
Litigation and Claims
We are currently subject to various litigation proceedings as disclosed in note 17 to the Financial Statements, and we may be involved in disputes with other parties in the future that may result in litigation. If we are unable to resolve these disputes favorably, it may have a material adverse impact on our financial condition, cash flow and results of operations.
Contractual Obligations and Commitments
In the normal course of business, we enter into contracts that give rise to commitments for future minimum payments. The following table summarizes the remaining contractual maturities of our financial liabilities and operating and capital commitments shown on an undiscounted basis:
($ millions)
| Payments due as at March 31, 2019
| |||||||||||||||||||||||||||
2019 | 2020 | 2021 | 2022 | 2023 |
2024 and | Total | ||||||||||||||||||||||
Debta | ||||||||||||||||||||||||||||
Repayment of principal | 17 | 263 | 7 | 337 | 0 | 5,108 | 5,732 | |||||||||||||||||||||
Capital leases | 27 | 22 | 10 | 8 | 7 | 24 | 98 | |||||||||||||||||||||
Interest | 309 | 328 | 321 | 313 | 306 | 4,743 | 6,320 | |||||||||||||||||||||
Provisions for environmental rehabilitationb | 112 | 108 | 188 | 158 | 259 | 2,265 | 3,090 | |||||||||||||||||||||
Restricted share units | 7 | 12 | 10 | 1 | 0 | 0 | 30 | |||||||||||||||||||||
Pension benefits and other post-retirement benefits | 6 | 8 | 9 | 8 | 8 | 145 | 184 | |||||||||||||||||||||
Purchase obligations for supplies and consumablesc | 422 | 297 | 233 | 141 | 110 | 633 | 1,836 | |||||||||||||||||||||
Capital commitmentsd | 74 | 4 | 6 | 0 | 0 | 0 | 84 | |||||||||||||||||||||
Social development costse | 6 | 34 | 8 | 3 | 3 | 56 | 110 | |||||||||||||||||||||
Total | 980 | 1,076 | 792 | 969 | 693 | 12,974 | 17,484 |
a. | Debt and Interest - Our debt obligations do not include any subjective acceleration clauses or other clauses that enable the holder of the debt to call for early repayment, except in the event that we breach any of the terms and conditions of the debt or for other customary events of default. We are not required to post any collateral under any debt obligations. Projected interest payments on variable rate debt were based on interest rates in effect at March 31, 2019. Interest is calculated on our long-term debt obligations using both fixed and variable rates. |
b. | Provisions for environmental rehabilitation - Amounts presented in the table represent the undiscounted uninflated future payments for the expected cost of provisions for environmental rehabilitation. |
c. | Purchase obligations for supplies and consumables - Includes commitments related to new purchase obligations to secure a supply of acid, tires and cyanide for our production process. |
d. | Capital commitments - Purchase obligations for capital expenditures include only those items where binding commitments have been entered into. |
e. | Social development costs - Includes a commitment of $42 million ($28 million in 2020 and $14 million in 2024 and thereafter) related to the funding of a power transmission line in Argentina. |
We announced on September 24, 2018 that we entered into a mutual investment agreement to purchase up to $300 million of shares in Shandong Gold Mining Co. Ltd. As of the date of this MD&A, we had purchased approximately $120 million of shares of Shandong Gold Mining Co. Ltd. and may make additional investments under the terms of our agreement.
BARRICK FIRST QUARTER 2019 | 55 | MANAGEMENT’S DISCUSSION AND ANALYSIS |
REVIEW OF QUARTERLY RESULTS
Quarterly Informationa
($ millions, except where indicated) | 2019 Q1 | 2018 Q4 | 2018 Q3 | 2018 Q2 | 2018 Q1 | 2017 Q4 | 2017 Q3 | 2017 Q2 | ||||||||||||||||||||||||||||||||
Revenues | 2,093 | 1,904 | 1,837 | 1,712 | 1,790 | 2,228 | 1,993 | 2,160 | ||||||||||||||||||||||||||||||||
Realized price per ounce – goldb | 1,307 | 1,223 | 1,216 | 1,313 | 1,332 | 1,280 | 1,274 | 1,258 | ||||||||||||||||||||||||||||||||
Realized price per pound – copperb | 3.07 | 2.76 | 2.76 | 3.11 | 2.98 | 3.34 | 3.05 | 2.60 | ||||||||||||||||||||||||||||||||
Cost of sales | 1,490 | 1,577 | 1,315 | 1,176 | 1,152 | 1,411 | 1,270 | 1,277 | ||||||||||||||||||||||||||||||||
Net earnings (loss) | 111 | (1,197 | ) | (412 | ) | (94 | ) | 158 | (314 | ) | (11 | ) | 1,084 | |||||||||||||||||||||||||||
Per share (dollars)c | 0.06 | (1.02 | ) | (0.35 | ) | (0.08 | ) | 0.14 | (0.27 | ) | (0.01 | ) | 0.93 | |||||||||||||||||||||||||||
Adjusted net earningsb | 184 | 69 | 89 | 81 | 170 | 253 | 200 | 261 | ||||||||||||||||||||||||||||||||
Per share (dollars)b,c | 0.11 | 0.06 | 0.08 | 0.07 | 0.15 | 0.22 | 0.17 | 0.22 | ||||||||||||||||||||||||||||||||
Operating cash flow | 520 | 411 | 706 | 141 | 507 | 590 | 532 | 448 | ||||||||||||||||||||||||||||||||
Cash capital expenditures | 374 | 374 | 387 | 313 | 326 | 350 | 307 | 405 | ||||||||||||||||||||||||||||||||
Free cash flowb | 146 | 37 | 319 | (172 | ) | 181 | 240 | 225 | 43 |
a. | Sum of all the quarters may not add up to the annual total due to rounding. |
b. | Realized price, adjusted net earnings, adjusted net earnings per share and free cash flow arenon-GAAP financial performance measures with no standardized meaning under IFRS and therefore may not be comparable to similar measures of performance presented by other issuers. For further information and a detailed reconciliation of eachnon-GAAP measure used in this section of the MD&A to the most directly comparable IFRS measure, please see pages 57 to 72 of this MD&A. |
c. | Calculated using weighted average number of shares outstanding under the basic method of earnings per share. |
Our recent financial results reflect our emphasis on cost control and growing operating cash flow and free cash flow1. The positive free cash flow1 generated, combined with the proceeds from various divestitures, have allowed us to strengthen our balance sheet over the past two years.
In the first quarter of 2019, we had an increase in sales volume due to the Merger and the commencement of the contribution of Randgold’s operations to Barrick’s net earnings and cash flows. In the fourth quarter of 2018, we recorded $319 million (net of tax effects andnon-controlling interests) of net asset impairments primarily relating to impairments of $160 million ofnon-current assets and $154 million of goodwill at the Veladero mine. We also recorded in the fourth quarter of 2018 an inventory impairment of $166 million at Lagunas Norte,
which was included in cost of sales. In the third quarter of 2018, we recorded a $405 million impairment charge resulting from an asset impairment at Lagunas Norte. In the fourth quarter of 2017, we recorded $521 million (net of tax effects andnon-controlling interest) of net asset impairments primarily relating to impairments at the Pascua-Lama project and Acacia’s Bulyanhulu mine, partially offset by an impairment reversal at Lumwana. In the third quarter of 2017, we recognized a $172 million tax provision relating to the impact of the proposed framework for Acacia operations in Tanzania. In the second quarter of 2017, we recorded $858 million (net of tax effects) of gains on the disposition of 50% of the Veladero mine and a 25% interest in the Cerro Casale project, now known as the Norte Abierto project.
INTERNAL CONTROL OVER FINANCIAL REPORTING AND DISCLOSURE CONTROLS AND PROCEDURES
Management is responsible for establishing and maintaining adequate internal control over financial reporting and disclosure controls and procedures as defined in our 2018 annual MD&A.
Together, the internal control frameworks provide internal control over financial reporting and disclosure. Due to its inherent limitations, internal control over financial reporting and disclosure may not prevent or detect all misstatements. Further, the effectiveness of internal control is subject to the risk that controls may become inadequate because of changes in conditions, or that the degree of compliance with policies or procedures may change.
As disclosed on page 23 of this MD&A, Barrick acquired Randgold and in conjunction with the Merger, Barrick has a new management team effective January 1, 2019 which includes new regional management for North America, Latin America and Australia Pacific, and Africa and the Middle East. Following an evaluation by management, during the three months ended March 31, 2019, there were no changes in internal controls over financial reporting that have materially affected, or are reasonably likely to materially affect our internal controls over financial reporting. Under the supervision and with the participation of management, including the President and Chief Executive Officer and Senior Executive Vice-President and Chief Financial Officer, management will continue to monitor and evaluate the design and effectiveness of its internal control over financial reporting and disclosure controls and procedures, and may make modifications from time to time as considered necessary.
BARRICK FIRST QUARTER 2019 | 56 | MANAGEMENT’S DISCUSSION AND ANALYSIS |
IFRS CRITICAL ACCOUNTING POLICIES AND ACCOUNTING ESTIMATES
Management has discussed the development and selection of our critical accounting estimates with the Audit Committee of the Board of Directors, and the Audit Committee has reviewed the disclosure relating to such estimates in conjunction with its review of this MD&A. The accounting policies and methods we utilize determine how we report our financial condition and results of operations, and they may require Management to make estimates or rely on assumptions about matters that are inherently uncertain. The consolidated financial statements have been prepared in accordance with International Financial Reporting Standards (“IFRS”) as issued by the International Accounting Standards Board (“IASB”) under the historical cost convention, as modified by revaluation of certain financial assets, derivative contracts and post-retirement assets. Our significant accounting policies are disclosed in note 2 of the Financial
NON-GAAP FINANCIAL PERFORMANCE MEASURES
Adjusted Net Earnings and Adjusted Net Earnings per Share
Adjusted net earnings is anon-GAAP financial measure which excludes the following from net earnings:
• | Impairment charges (reversals) related to intangibles, goodwill, property, plant and equipment, and investments; |
• | Acquisition/disposition gains/losses; |
• | Foreign currency translation gains/losses; |
• | Significant tax adjustments; |
• | Unrealized gains/losses onnon-hedge derivative instruments; and |
• | Tax effect andnon-controlling interest of the above items. |
Management uses this measure internally to evaluate our underlying operating performance for the reporting periods presented and to assist with the planning and forecasting of future operating results. Management believes that adjusted net earnings is a useful measure of our performance because impairment charges, acquisition/disposition gains/losses and significant tax adjustments do not reflect the underlying operating performance of our core mining business and are not necessarily indicative of future operating results. Furthermore, foreign currency translation gains/losses and unrealized gains/losses fromnon-hedge derivatives are not necessarily reflective of the underlying operating results for the reporting periods presented. The tax effect andnon-controlling interest of the adjusting items are also excluded to reconcile the amounts to Barrick’s share on apost-tax basis, consistent with net earnings.
Statements, including a summary of current and future changes in accounting policies.
Critical Accounting Estimates and Judgments
Certain accounting estimates have been identified as being “critical” to the presentation of our financial condition and results of operations because they require us to make subjective and/or complex judgments about matters that are inherently uncertain; or there is a reasonable likelihood that materially different amounts could be reported under different conditions or using different assumptions and estimates. Our significant accounting judgments, estimates and assumptions are disclosed in note 3 of the accompanying Financial Statements.
As noted, we use this measure for internal purposes. Management’s internal budgets and forecasts and public guidance do not reflect the types of items we adjust for. Consequently, the presentation of adjusted net earnings enables investors and analysts to better understand the underlying operating performance of our core mining business through the eyes of management. Management periodically evaluates the components of adjusted net earnings based on an internal assessment of performance measures that are useful for evaluating the operating performance of our business segments and a review of thenon-GAAP measures used by mining industry analysts and other mining companies.
Adjusted net earnings is intended to provide additional information only and does not have any standardized definition under IFRS and should not be considered in isolation or as a substitute for measures of performance prepared in accordance with IFRS. The measures are not necessarily indicative of operating profit or cash flow from operations as determined under IFRS. Other companies may calculate these measures differently. The following table reconciles thesenon-GAAP measures to the most directly comparable IFRS measure.
BARRICK FIRST QUARTER 2019 | 57 | MANAGEMENT’S DISCUSSION AND ANALYSIS |
Reconciliation of Net Earnings to Net Earnings per Share, Adjusted Net Earnings and Adjusted Net Earnings per Share
($ millions, except per share amounts in dollars)
| For the three months ended
| |||||||||||
March 31, 2019
| December 31, 2018
| March 31, 2018
| ||||||||||
Net earnings (loss) attributable to equity holders of the Company | $111 | ($1,197 | ) | $158 | ||||||||
Impairment charges related to intangibles, goodwill, property, plant and equipment, and investmentsa | 3 | 408 | 2 | |||||||||
Acquisition/disposition (gains) lossesb | — | (19 | ) | (46 | ) | |||||||
Foreign currency translation losses (gains) | 22 | (16 | ) | 15 | ||||||||
Significant tax adjustmentsc | 8 | 719 | 46 | |||||||||
Other expense (income) adjustmentsd | 47 | 261 | (6 | ) | ||||||||
Unrealized (gains) losses onnon-hedge derivative instruments | (1 | ) | 1 | — | ||||||||
Tax effect andnon-controlling interest | (6 | ) | (88 | ) | 1 | |||||||
Adjusted net earnings | $184 | $69 | $170 | |||||||||
Net earnings per sharee | 0.06 | (1.02 | ) | 0.14 | ||||||||
Adjusted net earnings per sharee | 0.11 | 0.06 | 0.15 |
a. | Net impairment charges for the three months ended December 31, 2018 primarily relate tonon-current asset and goodwill impairments at Veladero. |
b. | Disposition gains primarily relate to the gain on the sale of anon-core royalty asset at Acacia for the three months ended March 31, 2018. |
c. | Significant tax adjustments for the three months ended December 31, 2018 primarily relate to thede-recognition of our Canadian and Peruvian deferred tax assets. |
d. | Other expense adjustments for the three months ended March 31, 2019 primarily relate to severance costs as a result of the implementation of a number of organizational reductions and the impact of changes in the discount rate assumptions on our closed mine rehabilitation provision. For the three months ended December 31, 2018, other expense adjustments mainly relate to the inventory impairment charge at Lagunas Norte, thewrite-off of a Western Australia long-term stamp duty receivable and costs associated with the merger with Randgold. |
e. | Calculated using weighted average number of shares outstanding under the basic method of earnings per share. |
Free Cash Flow
Free cash flow is a measure that deducts capital expenditures from net cash provided by operating activities. Management believes this to be a useful indicator of our ability to operate without reliance on additional borrowing or usage of existing cash.
Free cash flow is intended to provide additional information only and does not have any standardized definition under
IFRS and should not be considered in isolation or as a substitute for measures of performance prepared in accordance with IFRS. The measure is not necessarily indicative of operating profit or cash flow from operations as determined under IFRS. Other companies may calculate this measure differently. The following table reconciles thisnon-GAAP measure to the most directly comparable IFRS measure.
Reconciliation of Net Cash Provided by Operating Activities to Free Cash Flow
($ millions)
| For the three months ended
| |||||||||||
March 31, 2019
| December 31, 2018
| March 31, 2018
| ||||||||||
Net cash provided by operating activities | $520 | $411 | $507 | |||||||||
Capital expenditures | (374 | ) | (374 | ) | (326 | ) | ||||||
Free cash flow | $146 | $37 | $181 |
BARRICK FIRST QUARTER 2019 | 58 | MANAGEMENT’S DISCUSSION AND ANALYSIS |
Total cash costs per ounce,All-in sustaining costs per ounce,All-in costs per ounce, C1 cash costs per pound andAll-in sustaining costs per pound
Total cash costs per ounce,all-in sustaining costs per ounce andall-in costs per ounce arenon-GAAP financial measures which are calculated based on the definition published by the World Gold Council (a market development organization for the gold industry comprised of and funded by 27 gold mining companies from around the world, including Barrick). The WGC is not a regulatory organization. Management uses these measures to monitor the performance of our gold mining operations and its ability to generate positive cash flow, both on an individual site basis and an overall company basis.
Total cash costs start with our cost of sales related to gold production and removes depreciation, thenon-controlling interest of cost of sales and includesby-product credits.All-in sustaining costs start with total cash costs and include sustaining capital expenditures, sustaining leases, general and administrative costs, minesite exploration and evaluation costs and reclamation cost accretion and amortization. These additional costs reflect the expenditures made to maintain current production levels.
Starting in the first quarter of 2019, we have renamed “cash costs” to “total cash costs” when referring to our gold production. The calculation of total cash costs is identical to our previous calculation of cash costs with only a change in the naming convention of thisnon-GAAP measure.
All-in costs starts withall-in sustaining costs and adds additional costs that reflect the varying costs of producing gold over the life-cycle of a mine, including: project capital expenditures (capital expenditures at new projects and discrete projects at existing operations intended to increase production capacity and will not benefit production for at least 12 months) and othernon-sustaining costs (primarilynon-sustaining leases, exploration and evaluation costs, community relations costs and general and administrative costs that are not associated with current operations). These definitions recognize that there are different costs associated with the life-cycle of a mine, and that it is therefore appropriate to distinguish between sustaining andnon-sustaining costs.
Starting in the first quarter of 2019, we have included sustaining capital expenditures and project capital expenditures on a cash basis instead of an accrual basis. As a result of adopting IFRS 16Leases, the full lease amount is included in accrued capital expenditures on initial recognition. We believe that the change in capital expenditures from an accrual basis to a cash basis better reflects the timing of costs associated with our operations. The original World Gold Council (“WGC”) Guidance Note explicitly excluded certain financing activities fromall-in sustaining costs andall-in costs. As a result of the new lease accounting standard, the WGC Guidance Note was updated to include both the principal and interest portion of the cash lease payment in theall-in sustaining costs andall-in cost metrics. We have updated our calculation accordingly. Prior periods have not been restated but would not be materially different.
We believe that our use of total cash costs,all-in sustaining costs andall-in costs will assist analysts, investors and other stakeholders of Barrick in understanding the costs associated with producing gold, understanding the economics of gold
mining, assessing our operating performance and also our ability to generate free cash flow from current operations and to generate free cash flow on an overall company basis. Due to the capital-intensive nature of the industry and the long useful lives over which these items are depreciated, there can be a significant timing difference between net earnings calculated in accordance with IFRS and the amount of free cash flow that is being generated by a mine and therefore we believe these measures are usefulnon-GAAP operating metrics and supplement our IFRS disclosures. These measures are not representative of all of our cash expenditures as they do not include income tax payments, interest costs or dividend payments. These measures do not include depreciation or amortization.
Total cash costs per ounce,all-in sustaining costs andall-in costs are intended to provide additional information only and do not have standardized definitions under IFRS and should not be considered in isolation or as a substitute for measures of performance prepared in accordance with IFRS. These measures are not equivalent to net income or cash flow from operations as determined under IFRS. Although the WGC has published a standardized definition, other companies may calculate these measures differently.
In addition to presenting these metrics on aby-product basis, we have calculated these metrics on aco-product basis. Ourco-product metrics remove the impact of other metal sales that are produced as aby-product of our gold production from cost per ounce calculations but does not reflect a reduction in costs for costs associated with other metal sales.
C1 cash costs per pound andall-in sustaining costs per pound arenon-GAAP financial measures related to our copper mine operations. We believe that C1 cash costs per pound enables investors to better understand the performance of our copper operations in comparison to other copper producers who present results on a similar basis. C1 cash costs per pound excludes royalties and production taxes andnon-routine charges as they are not direct production costs.All-in sustaining costs per pound is similar to the goldall-in sustaining costs metric and management uses this to better evaluate the costs of copper production. We believe this measure enables investors to better understand the operating performance of our copper mines as this measure reflects all of the sustaining expenditures incurred in order to produce copper.All-in sustaining costs per pound includes C1 cash costs, sustaining capital expenditures, sustaining leases, general and administrative costs, minesite exploration and evaluation costs, royalties and production taxes, reclamation cost accretion and amortization and write-downs taken on inventory to net realizable value.
BARRICK FIRST QUARTER 2019 | 59 | MANAGEMENT’S DISCUSSION AND ANALYSIS |
Reconciliation of Gold Cost of Sales to Total cash costs,All-in sustaining costs andAll-in costs, including on a per ounce basis
($ millions, except per ounce information in dollars)
| For the three months ended
| |||||||||||||
Footnote
| March 31, 2019
| December 31, 2018
| March 31, 2018
| |||||||||||
Cost of sales applicable to gold production | $1,350 | $1,353 | $1,046 | |||||||||||
Depreciation | (384 | ) | (346 | ) | (298 | ) | ||||||||
Cash cost of sales applicable to equity method investments | 62 | — | — | |||||||||||
By-product credits | (24 | ) | (26 | ) | (36 | ) | ||||||||
Realized (gains) losses on hedge andnon-hedge derivatives | a | — | 3 | — | ||||||||||
Non-recurring items | b | (20 | ) | (155 | ) | (7 | ) | |||||||
Other | c | (20 | ) | (27 | ) | (21 | ) | |||||||
Non-controlling interests | d | (101 | ) | (80 | ) | (72 | ) | |||||||
Total cash costs | $863 | $722 | $612 | |||||||||||
General & administrative costs | 54 | 53 | 48 | |||||||||||
Minesite exploration and evaluation costs | e | 11 | 14 | 6 | ||||||||||
Minesite sustaining capital expenditures | f | 253 | 276 | 231 | ||||||||||
Sustaining leases | 10 | — | — | |||||||||||
Rehabilitation - accretion and amortization (operating sites) | g | 14 | 18 | 19 | ||||||||||
Non-controlling interest, copper operations and other | h | (75 | ) | (118 | ) | (55 | ) | |||||||
All-in sustaining costs | $1,130 | $965 | $861 | |||||||||||
Project exploration and evaluation and project costs | e | 63 | 110 | 67 | ||||||||||
Community relations costs not related to current operations | 1 | 2 | 1 | |||||||||||
Project capital expenditures | f | 120 | 127 | 100 | ||||||||||
Rehabilitation - accretion and amortization(non-operating sites) | g | 7 | 8 | 8 | ||||||||||
Non-controlling interest and copper operations | h | (3 | ) | (5 | ) | (5 | ) | |||||||
All-in costs | $1,318 | $1,207 | $1,032 | |||||||||||
Ounces sold - equity basis (000s ounces) | i | 1,365 | 1,232 | 1,071 | ||||||||||
Cost of sales per ounce | j,k | $947 | $980 | $878 | ||||||||||
Total cash costs per ounce | k | $631 | $588 | $573 | ||||||||||
Total cash costs per ounce (on aco-product basis) | k,l | $644 | $602 | $596 | ||||||||||
All-in sustaining costs per ounce | k | $825 | $788 | $804 | ||||||||||
All-in sustaining costs per ounce (on aco-product basis) | k,l | $838 | $802 | $827 | ||||||||||
All-in costs per ounce | k | $964 | $985 | $963 | ||||||||||
All-in costs per ounce (on aco-product basis) | k,l | $977 | $999 | $986 |
a. | Realized (gains) losses on hedge andnon-hedge derivatives |
Includes realized hedge losses of $nil for the three month period ended March 31, 2019 (December 31, 2018: $2 million and March 31, 2018: $1 million), and realizednon-hedge gains of $nil for the three month period ended March 31, 2019 (December 31, 2018: losses of $1 million and March 31, 2018: gains of $1 million, respectively). Refer to note 5 to the Financial Statements for further information.
b. | Non-recurring items |
Non-recurring items in 2019 relate to organizational restructuring. These costs are not indicative of our cost of production and have been excluded from the calculation of total cash costs.
c. | Other |
Other adjustments for the three month period ended March 31, 2019 include the removal of total cash costs andby-product credits associated with our Pierina mine, which is mining incidental ounces as it enters closure, of $18 million (December 31, 2018: $27 million and March 31, 2018: $21 million).
d. | Non-controlling interests |
Non-controlling interests includenon-controlling interests related to gold production of $152 million for the three month periods ended March 31, 2019 (December 31, 2018: $114 million and March 31, 2018: $106 million).Non-controlling interests include Pueblo Viejo and Acacia. Starting January 1, 2019, the effective date of the Merger,non-controlling interests also include Loulo-Gounkoto and Tongon. Refer to note 5 to the Financial Statements for further information.
e. | Exploration and evaluation costs |
Exploration, evaluation and project expenses are presented as minesite sustaining if it supports current mine operations and project if it relates to future projects. Refer to page 51 of this MD&A.
f. | Capital expenditures |
Capital expenditures are related to our gold sites only and are presented on a 100% cash basis for the three months ended March 31, 2019 and on a 100% accrued basis for the three month periods ended December 31, 2018 and March 31, 2018. They are split between minesite sustaining and project capital
BARRICK FIRST QUARTER 2019 | 60 | MANAGEMENT’S DISCUSSION AND ANALYSIS |
expenditures. Project capital expenditures are distinct projects designed to increase the net present value of the mine and are not related to current production. Significant projects in the current year are stripping at Cortez Crossroads, the Goldrush exploration declines, the Deep South Expansion, and construction of the third shaft at Turquoise Ridge. Refer to page 50 of this MD&A.
g. | Rehabilitation—accretion and amortization |
Includes depreciation on the assets related to rehabilitation provisions of our gold operations and accretion on the rehabilitation provision of our gold operations, split between operating andnon-operating sites.
h. | Non-controlling interest and copper operations |
Removes general & administrative costs related tonon-controlling interests and copper based on a percentage allocation of revenue. Also removes exploration, evaluation and project expenses, rehabilitation costs and capital expenditures incurred by our copper sites and thenon-controlling interest of our Acacia and Pueblo Viejo operating segments and South Arturo. Also removes thenon-controlling interest of our Loulo-Gounkoto and Tongon operating segments commencing January 1, 2019, the effective date of the Merger, and includes capital expenditures applicable to equity method investments. Figures remove the impact of Pierina. The impact is summarized as the following:
($ millions)
| For the three months ended
| |||||||||||
Non-controlling interest, copper operations and other
|
March 31, 2019
|
December 31, 2018
|
March 31, 2018
| |||||||||
General & administrative costs | ($10 | ) | ($36 | ) | ($7 | ) | ||||||
Minesite exploration and evaluation expenses | (1 | ) | (2 | ) | — | |||||||
Rehabilitation - accretion and amortization (operating sites) | (1 | ) | (2 | ) | (1 | ) | ||||||
Minesite sustaining capital expenditures | (63 | ) | (78 | ) | (47 | ) | ||||||
All-in sustaining costs total | ($75 | ) | ($118 | ) | ($55 | ) | ||||||
Project exploration and evaluation and project costs | (2 | ) | (3 | ) | (3 | ) | ||||||
Project capital expenditures | (1 | ) | (2 | ) | (2 | ) | ||||||
All-in costs total | ($3 | ) | ($5 | ) | ($5 | ) |
i. | Ounces sold - equity basis |
Figures remove the impact of Pierina which is mining incidental ounces as it enters closure.
j. | Cost of sales per ounce |
Figures remove the cost of sales impact of Pierina of $27 million for the three month periods ended March 31, 2019 (December 31, 2018: $32 million and March 31, 2018: $32 million),which is mining incidental ounces as it enters closure. Cost of sales per ounce excludesnon-controlling interest related to gold production. Cost of sales applicable to gold per ounce is calculated using cost of sales on an attributable basis (removing thenon-controlling interest of 40% Pueblo Viejo, 36.1% Acacia and 40% South Arturo from cost of sales), divided by attributable gold ounces. Thenon-controlling interest of 20% Loulo-Gounkoto and 10.3% of Tongon is also removed from cost of sales and our proportionate share of cost of sales attributable to equity method investments (Kibali and Morila) is included commencing January 1, 2019, the effective date of the Merger.
k. | Per ounce figures |
Cost of sales per ounce, total cash costs per ounce,all-in sustaining costs per ounce andall-in costs per ounce may not calculate based on amounts presented in this table due to rounding.
l. | Co-product costs per ounce |
Total cash costs per ounce,all-in sustaining costs per ounce andall-in costs per ounce presented on aco-product basis removes the impact ofby-product credits of our gold production (net ofnon-controlling interest) calculated as:
($ millions)
| For the three months ended
| |||||||||||
March 31, 2019
|
December 31, 2018
| �� |
March 31, 2018
| |||||||||
By-product credits | $24 | $26 | $36 | |||||||||
Non-controlling interest | (8 | ) | (10 | ) | (11 | ) | ||||||
By-product credits (net ofnon-controlling interest)
|
| $16
|
|
| $16
|
|
| $25
|
|
BARRICK FIRST QUARTER 2019 | 61 | MANAGEMENT’S DISCUSSION AND ANALYSIS |
Reconciliation of Gold Cost of Sales to Total cash costs,All-in sustaining costs andAll-in costs, including on a per ounce basis, by operating site
($ millions, except per ounce information in dollars)
| For the three months ended March 31, 2019
| |||||||||||||||||||||||||||||||||||||
Footnote | Barrick Nevadaa | Cortez | Goldstrike | Turquoise Ridge | Pueblo Viejo |
Loulo- | Kibali | Veladero | Acacia | |||||||||||||||||||||||||||||
Cost of sales applicable to gold production | $448 | $177 | $226 | $45 | $163 | $169 | $108 | $81 | $117 | |||||||||||||||||||||||||||||
Depreciation | (136 | ) | (64 | ) | (66 | ) | (6 | ) | (46 | ) | (59 | ) | (56 | ) | (30 | ) | (25 | ) | ||||||||||||||||||||
By-product credits | — | — | — | — | (16 | ) | — | — | (2 | ) | (1 | ) | ||||||||||||||||||||||||||
Non-recurring items | b | — | — | — | — | (1 | ) | — | — | (2 | ) | — | ||||||||||||||||||||||||||
Other | — | — | — | — | — | — | — | — | — | |||||||||||||||||||||||||||||
Non-controlling interests | — | — | — | — | (41 | ) | (22 | ) | — | — | (33 | ) | ||||||||||||||||||||||||||
Total cash costs | $312 | $113 | $160 | $39 | $59 | $88 | $52 | $47 | $58 | |||||||||||||||||||||||||||||
General & administrative costs | — | — | — | — | — | — | �� | — | 5 | |||||||||||||||||||||||||||||
Minesite exploration and evaluation costs | c | 4 | 2 | 2 | — | — | 2 | — | — | — | ||||||||||||||||||||||||||||
Minesite sustaining capital expenditures | d | 75 | 13 | 55 | 7 | 27 | 22 | 9 | 25 | 10 | ||||||||||||||||||||||||||||
Sustaining leases | — | — | — | — | — | 1 | — | 1 | — | |||||||||||||||||||||||||||||
Rehabilitation - accretion and amortization (operating sites) | e | 5 | 4 | 1 | — | 2 | — | — | 1 | 1 | ||||||||||||||||||||||||||||
Non-controlling interests | (5 | ) | — | (5 | ) | — | (12 | ) | (5 | ) | — | — | (6 | ) | ||||||||||||||||||||||||
All-in sustaining costs | $391 | $132 | $213 | $46 | $76 | $108 | $61 | $74 | $68 | |||||||||||||||||||||||||||||
Project exploration and evaluation and project costs | c | — | — | — | — | — | — | — | — | — | ||||||||||||||||||||||||||||
Project capital expenditures | d | 79 | 63 | — | 9 | — | — | 1 | 15 | 3 | ||||||||||||||||||||||||||||
Non-controlling interests | — | — | — | — | — | — | — | — | (1 | ) | ||||||||||||||||||||||||||||
All-in costs | $470 | $195 | $213 | $55 | $76 | $108 | $62 | $89 | $70 | |||||||||||||||||||||||||||||
Ounces sold - equity basis (000s ounces) | 574 | 259 | 239 | 76 | 142 | 128 | 90 | 68 | 67 | |||||||||||||||||||||||||||||
Cost of sales per ounce | f,g | $780 | $682 | $947 | $592 | $696 | $1,052 | $1,202 | $1,195 | $1,114 | ||||||||||||||||||||||||||||
Total cash costs per ounce | g | $542 | $433 | $671 | $506 | $421 | $684 | $573 | $713 | $850 | ||||||||||||||||||||||||||||
Total cash costs per ounce (on aco-product basis) | g,h | $543 | $434 | $671 | $506 | $492 | $684 | $576 | $736 | $859 | ||||||||||||||||||||||||||||
All-in sustaining costs per ounce | g | $678 | $506 | $891 | $592 | $543 | $840 | $673 | $1,100 | $1,023 | ||||||||||||||||||||||||||||
All-in sustaining costs per ounce (on aco-product basis) | g,h | $679 | $507 | $891 | $592 | $614 | $840 | $676 | $1,123 | $1,032 | ||||||||||||||||||||||||||||
All-in costs per ounce | g | $817 | $749 | $891 | $716 | $544 | $840 | $676 | $1,325 | $1,061 | ||||||||||||||||||||||||||||
All-in costs per ounce (on aco-product basis) | g,h | $818 | $750 | $891 | $716 | $615 | $840 | $679 | $1,348 | $1,070 |
BARRICK FIRST QUARTER 2019 | 62 | MANAGEMENT’S DISCUSSION AND ANALYSIS |
($ millions, except per ounce information in dollars)
| For the three months ended March 31, 2019
| |||||||||||||||||||||||||||||||
Footnote | Kalgoorlie | Tongon | Porgera | Hemlo |
Lagunas | Golden Sunlight | Morila | |||||||||||||||||||||||||
Cost of sales applicable to gold production | $62 | $98 | $67 | $53 | $48 | $16 | $14 | |||||||||||||||||||||||||
Depreciation | (11 | ) | (44 | ) | (11 | ) | (7 | ) | (7 | ) | (1 | ) | (3 | ) | ||||||||||||||||||
By-product credits | — | — | (1 | ) | �� | (2 | ) | — | — | |||||||||||||||||||||||
Non-recurring items | b | — | — | — | (1 | ) | (15 | ) | — | — | ||||||||||||||||||||||
Other | — | — | — | — | — | — | ||||||||||||||||||||||||||
Non-controlling interests | — | (6 | ) | — | — | — | — | — | ||||||||||||||||||||||||
Total cash costs | $51 | $48 | $55 | $45 | $24 | $15 | $11 | |||||||||||||||||||||||||
General & administrative costs | — | — | — | — | — | — | — | |||||||||||||||||||||||||
Minesite exploration and evaluation costs | c | 1 | 1 | — | — | 1 | — | — | ||||||||||||||||||||||||
Minesite sustaining capital expenditures | d | 15 | 2 | 8 | 8 | 7 | 1 | — | ||||||||||||||||||||||||
Sustaining leases | 2 | — | — | — | 5 | — | — | |||||||||||||||||||||||||
Rehabilitation - accretion and amortization (operating sites) | e | 1 | — | — | — | 2 | 3 | — | ||||||||||||||||||||||||
Non-controlling interests | — | — | — | — | — | — | — | |||||||||||||||||||||||||
All-in sustaining costs | $70 | $51 | $63 | $53 | $39 | $19 | $11 | |||||||||||||||||||||||||
Project exploration and evaluation and project costs | c | — | — | — | — | — | — | — | ||||||||||||||||||||||||
Project capital expenditures | d | — | — | — | — | — | — | — | ||||||||||||||||||||||||
Non-controlling interests | — | — | — | — | — | — | — | |||||||||||||||||||||||||
All-in costs | $70 | $51 | $63 | $53 | $39 | $19 | $11 | |||||||||||||||||||||||||
Ounces sold - equity basis (000s ounces) | 58 | 61 | 65 | 58 | 37 | 7 | 10 | |||||||||||||||||||||||||
Cost of sales per ounce | f,g | $1,064 | $1,451 | $1,031 | $906 | $1,304 | $2,174 | $1,445 | ||||||||||||||||||||||||
Total cash costs per ounce | g | $870 | $799 | $854 | $769 | $637 | $1,974 | $1,157 | ||||||||||||||||||||||||
Total cash costs per ounce (on aco-product basis) | g,h | $873 | $801 | $867 | $773 | $704 | $1,996 | $1,160 | ||||||||||||||||||||||||
All-in sustaining costs per ounce | g | $1,185 | $836 | $978 | $915 | $1,018 | $2,471 | $1,157 | ||||||||||||||||||||||||
All-in sustaining costs per ounce (on aco-product basis) | g,h | $1,188 | $838 | $991 | $919 | $1,085 | $2,493 | $1,160 | ||||||||||||||||||||||||
All-in costs per ounce | g | $1,185 | $840 | $978 | $916 | $1,012 | $2,471 | $1,157 | ||||||||||||||||||||||||
All-in costs per ounce (on aco-product basis) | g,h | $1,188 | $842 | $991 | $920 | $1,079 | $2,493 | $1,160 |
BARRICK FIRST QUARTER 2019 | 63 | MANAGEMENT’S DISCUSSION AND ANALYSIS |
($ millions, except per ounce information in dollars)
| For the three months ended December 31, 2018
| |||||||||||||||||||||||||||||||||||||||
Footnote | Barrick Nevadaa | Cortez | Goldstrike |
Turquoise | Pueblo Viejo | Loulo- Gounkotoi | Kibalii | Veladero | Acacia | |||||||||||||||||||||||||||||||
Cost of sales applicable to gold production | $526 | $233 | $239 | $54 | $192 | $98 | $114 | |||||||||||||||||||||||||||||||||
Depreciation | (193 | ) | (112 | ) | (74 | ) | (7 | ) | (53 | ) | (32 | ) | (23 | ) | ||||||||||||||||||||||||||
By-product credits | — | — | — | — | (17 | ) | (2 | ) | (1 | ) | ||||||||||||||||||||||||||||||
Non-recurring items | b | — | — | — | — | (2 | ) | (4 | ) | — | ||||||||||||||||||||||||||||||
Other | — | — | — | — | 1 | — | — | |||||||||||||||||||||||||||||||||
Non-controlling interests | — | — | — | — | (49 | ) | — | (33 | ) | |||||||||||||||||||||||||||||||
Total cash costs | $333 | $121 | $165 | $47 | $72 | $60 | $57 | |||||||||||||||||||||||||||||||||
General & administrative costs | — | — | — | — | — | — | 8 | |||||||||||||||||||||||||||||||||
Minesite exploration and evaluation costs | c | 8 | 4 | 4 | — | — | 1 | — | ||||||||||||||||||||||||||||||||
Minesite sustaining capital expenditures | d | 64 | 16 | 41 | 7 | 35 | 59 | 16 | ||||||||||||||||||||||||||||||||
Rehabilitation - accretion and amortization (operating sites) | e | 8 | 6 | 2 | — | 3 | — | 1 | ||||||||||||||||||||||||||||||||
Non-controlling interests | (3 | ) | — | (3 | ) | — | (15 | ) | — | (9 | ) | |||||||||||||||||||||||||||||
All-in sustaining costs | $410 | $147 | $209 | $54 | $95 | $120 | $73 | |||||||||||||||||||||||||||||||||
Project exploration and evaluation and project costs | c | — | — | — | — | — | — | — | ||||||||||||||||||||||||||||||||
Project capital expenditures | d | 89 | 69 | — | 13 | — | — | 3 | ||||||||||||||||||||||||||||||||
Non-controlling interests | — | — | — | — | — | — | (1 | ) | ||||||||||||||||||||||||||||||||
All-in costs | $499 | $216 | $209 | $67 | $95 | $120 | $75 | |||||||||||||||||||||||||||||||||
Ounces sold - equity basis (000s ounces) | 661 | 344 | 251 | 66 | 170 | 74 | 86 | |||||||||||||||||||||||||||||||||
Cost of sales per ounce | f,g | $793 | $675 | $952 | $802 | $686 | $1,352 | $852 | ||||||||||||||||||||||||||||||||
Total cash costs per ounce | g | $501 | $350 | $656 | $701 | $425 | $823 | $651 | ||||||||||||||||||||||||||||||||
Total cash costs per ounce (on aco-product basis) | g,h | $502 | $351 | $657 | $701 | $482 | $848 | $658 | ||||||||||||||||||||||||||||||||
All-in sustaining costs per ounce | g | $616 | $424 | $833 | $798 | $559 | $1,648 | $857 | ||||||||||||||||||||||||||||||||
All-in sustaining costs per ounce (on aco-product basis) | g,h | $617 | $425 | $834 | $798 | $616 | $1,673 | $864 | ||||||||||||||||||||||||||||||||
All-in costs per ounce | g | $751 | $623 | $833 | $993 | $560 | $1,648 | $878 | ||||||||||||||||||||||||||||||||
All-in costs per ounce (on aco-product basis) | g,h | $752 | $624 | $834 | $993 | $617 | $1,673 | $885 |
BARRICK FIRST QUARTER 2019 | 64 | MANAGEMENT’S DISCUSSION AND ANALYSIS |
($ millions, except per ounce information in dollars)
| For the three months ended December 31, 2018
| |||||||||||||||||||||||||||||||
Footnote | Kalgoorlie | Tongoni | Porgera | Hemlo |
Lagunas Norte | Golden Sunlight | Morilai | |||||||||||||||||||||||||
Cost of sales applicable to gold production | $64 | $54 | $52 | $208 | $14 | |||||||||||||||||||||||||||
Depreciation | (10 | ) | (14 | ) | (7 | ) | (10 | ) | — | |||||||||||||||||||||||
By-product credits | (1 | ) | — | — | (3 | ) | — | |||||||||||||||||||||||||
Non-recurring items | b | — | 17 | — | (166 | ) | — | |||||||||||||||||||||||||
Other | — | — | — | — | — | |||||||||||||||||||||||||||
Non-controlling interests | — | — | — | — | — | |||||||||||||||||||||||||||
Total cash costs | $53 | $57 | $45 | $29 | $14 | |||||||||||||||||||||||||||
General & administrative costs | — | — | — | — | — | |||||||||||||||||||||||||||
Minesite exploration and evaluation costs | b | 2 | — | — | 1 | — | ||||||||||||||||||||||||||
Minesite sustaining capital expenditures | c | 9 | 17 | 17 | 7 | 1 | ||||||||||||||||||||||||||
Rehabilitation - accretion and amortization (operating sites) | d | 1 | (1 | ) | 1 | 2 | 1 | |||||||||||||||||||||||||
Non-controlling interests | — | — | — | — | — | |||||||||||||||||||||||||||
All-in sustaining costs | $65 | $73 | $63 | $39 | $16 | |||||||||||||||||||||||||||
Project exploration and evaluation and project costs | b | — | — | — | — | — | ||||||||||||||||||||||||||
Project capital expenditures | c | — | — | — | — | — | ||||||||||||||||||||||||||
Non-controlling interests | — | — | — | — | — | |||||||||||||||||||||||||||
All-in costs | $65 | $73 | $63 | $39 | $16 | |||||||||||||||||||||||||||
Ounces sold - equity basis (000s ounces) | 61 | 72 | 48 | 50 | 10 | |||||||||||||||||||||||||||
Cost of sales per ounce | f,g | $1,022 | $733 | $1,083 | $4,186 | $1,423 | ||||||||||||||||||||||||||
Total cash costs per ounce | g | $857 | $786 | $932 | $607 | $1,430 | ||||||||||||||||||||||||||
Total cash costs per ounce (on aco-product basis) | g,h | $863 | $796 | $935 | $653 | $1,448 | ||||||||||||||||||||||||||
All-in sustaining costs per ounce | g | $1,054 | $1,018 | $1,311 | $796 | $1,586 | ||||||||||||||||||||||||||
All-in sustaining costs per ounce (on aco-product basis) | g,h | $1,060 | $1,028 | $1,314 | $842 | $1,604 | ||||||||||||||||||||||||||
All-in costs per ounce | g | $1,054 | $1,018 | $1,311 | $800 | $1,586 | ||||||||||||||||||||||||||
All-in costs per ounce (on aco-product basis) | g,h | $1,060 | $1,028 | $1,314 | $846 | $1,604 |
BARRICK FIRST QUARTER 2019 | 65 | MANAGEMENT’S DISCUSSION AND ANALYSIS |
($ millions, except per ounce information in dollars)
| For the three months ended March 31, 2018
| |||||||||||||||||||||||||||||||||||||
Footnote | Barrick Nevadaa | Cortez | Goldstrike |
Turquoise | Pueblo Viejo | Loulo- Gounkotoi | Kibalii | Veladero | Acacia | |||||||||||||||||||||||||||||
Cost of sales applicable to gold production | $436 | $186 | $205 | $45 | $167 | $76 | $110 | |||||||||||||||||||||||||||||||
Depreciation | (155 | ) | (87 | ) | (61 | ) | (7 | ) | (41 | ) | (31 | ) | (24 | ) | ||||||||||||||||||||||||
By-product credits | (1 | ) | — | (1 | ) | — | (25 | ) | (1 | ) | (1 | ) | ||||||||||||||||||||||||||
Non-recurring items | b | — | — | — | — | — | — | — | ||||||||||||||||||||||||||||||
Other | — | — | — | — | — | — | — | |||||||||||||||||||||||||||||||
Non-controlling interests | — | — | — | — | (41 | ) | — | (31 | ) | |||||||||||||||||||||||||||||
Total cash costs | $280 | $99 | $143 | $38 | $60 | $44 | $54 | |||||||||||||||||||||||||||||||
General & administrative costs | — | — | — | — | — | — | — | |||||||||||||||||||||||||||||||
Minesite exploration and evaluation costs | c | 2 | 1 | 1 | — | — | — | — | ||||||||||||||||||||||||||||||
Minesite sustaining capital expenditures | d | 78 | 10 | 62 | 6 | 38 | 31 | 24 | ||||||||||||||||||||||||||||||
Rehabilitation - accretion and amortization (operating sites) | e | 4 | 2 | 2 | — | 2 | — | 1 | ||||||||||||||||||||||||||||||
Non-controlling interests | — | — | — | — | (16 | ) | — | (9 | ) | |||||||||||||||||||||||||||||
All-in sustaining costs | $364 | $112 | $208 | $44 | $84 | $75 | $70 | |||||||||||||||||||||||||||||||
Project exploration and evaluation and project costs | c | — | — | — | — | — | — | — | ||||||||||||||||||||||||||||||
Project capital expenditures | d | 80 | 61 | — | 7 | — | — | 2 | ||||||||||||||||||||||||||||||
Non-controlling interests | — | — | — | — | — | — | (1 | ) | ||||||||||||||||||||||||||||||
All-in costs | $444 | $173 | $208 | $51 | $84 | $75 | $71 | |||||||||||||||||||||||||||||||
Ounces sold - equity basis (000s ounces) | 525 | 273 | 189 | 63 | 148 | 74 | 75 | |||||||||||||||||||||||||||||||
Cost of sales per ounce | f,g | $829 | $682 | $1,076 | $720 | $683 | $1,036 | $941 | ||||||||||||||||||||||||||||||
Total cash costs per ounce | g | $533 | $363 | $755 | $601 | $409 | $576 | $715 | ||||||||||||||||||||||||||||||
Total cash costs per ounce (on aco-product basis) | g,h | $534 | $363 | $756 | $601 | $512 | $595 | $722 | ||||||||||||||||||||||||||||||
All-in sustaining costs per ounce | g | $694 | $414 | $1,094 | $709 | $571 | $1,008 | $976 | ||||||||||||||||||||||||||||||
All-in sustaining costs per ounce (on aco-product basis) | g,h | $695 | $414 | $1,095 | $709 | $674 | $1,027 | $983 | ||||||||||||||||||||||||||||||
All-in costs per ounce | g | $848 | $638 | $1,094 | $821 | $571 | $1,008 | $991 | ||||||||||||||||||||||||||||||
All-in costs per ounce (on aco-product basis) | g,h | $849 | $638 | $1,095 | $821 | $674 | $1,027 | $998 |
BARRICK FIRST QUARTER 2019 | 66 | MANAGEMENT’S DISCUSSION AND ANALYSIS |
($ millions, except per ounce information in dollars)
| For the three months ended March 31, 2018
| |||||||||||||||||||||||||||||
Footnote | Kalgoorlie | Tongoni | Porgera | Hemlo |
Lagunas | Golden Sunlight | Morilai | |||||||||||||||||||||||
Cost of sales applicable to gold production | $72 | $51 | $52 | $38 | $13 | |||||||||||||||||||||||||
Depreciation | (14 | ) | (8 | ) | (4 | ) | (11 | ) | — | |||||||||||||||||||||
By-product credits | — | — | — | (4 | ) | — | ||||||||||||||||||||||||
Non-recurring items | b | — | (7 | ) | — | — | — | |||||||||||||||||||||||
Other | — | — | — | — | — | |||||||||||||||||||||||||
Non-controlling interests | — | — | — | — | — | |||||||||||||||||||||||||
Total cash costs | $58 | $36 | $48 | $23 | $13 | |||||||||||||||||||||||||
General & administrative costs | — | — | — | — | — | |||||||||||||||||||||||||
Minesite exploration and evaluation costs | c | 3 | — | — | 1 | — | ||||||||||||||||||||||||
Minesite sustaining capital expenditures | d | 8 | 14 | 7 | 2 | — | ||||||||||||||||||||||||
Rehabilitation - accretion and amortization (operating sites) | e | 1 | — | 1 | 9 | 1 | ||||||||||||||||||||||||
Non-controlling interests | — | — | — | — | — | |||||||||||||||||||||||||
All-in sustaining costs | $70 | $50 | $56 | $35 | $14 | |||||||||||||||||||||||||
Project exploration and evaluation and project costs | c | — | — | — | — | — | ||||||||||||||||||||||||
Project capital expenditures | d | — | — | — | 1 | — | ||||||||||||||||||||||||
Non-controlling interests | — | — | — | — | — | |||||||||||||||||||||||||
All-in costs | $70 | $50 | $56 | $36 | $14 | |||||||||||||||||||||||||
Ounces sold - equity basis (000s ounces) | 83 | 45 | 44 | 69 | 8 | |||||||||||||||||||||||||
Cost of sales per ounce | f,g | $865 | $1,138 | $1,189 | $542 | $1,484 | ||||||||||||||||||||||||
Total cash costs per ounce | g | $690 | $801 | $1,095 | $330 | $1,525 | ||||||||||||||||||||||||
Total cash costs per ounce (on aco-product basis) | g,h | $693 | $809 | $1,100 | $389 | $1,530 | ||||||||||||||||||||||||
All-in sustaining costs per ounce | g | $836 | $1,111 | $1,271 | $496 | $1,658 | ||||||||||||||||||||||||
All-in sustaining costs per ounce (on aco-product basis) | g,h | $839 | $1,119 | $1,276 | $555 | $1,663 | ||||||||||||||||||||||||
All-in costs per ounce | g | $836 | $1,111 | $1,277 | $507 | $1,658 | ||||||||||||||||||||||||
All-in costs per ounce (on aco-product basis) | g,h | $839 | $1,119 | $1,282 | $566 | $1,663 |
a. | Barrick Nevada represents the combined results of Cortez, Goldstrike (including our 60% share of South Arturo) and, starting with this MD&A, our 75% interest in Turquoise Ridge. The reconciliations for the three month periods ended December 31, 2018 and March 31, 2018 include our 75% interest in Turquoise Ridge. |
b. | Non-recurring items |
Non-recurring items in 2019 relate to organizational restructuring. These costs are not indicative of our cost of production and have been excluded from the calculation of total cash costs.
c. | Exploration and evaluation costs |
Exploration, evaluation and project expenses are presented as minesite sustaining if it supports current mine operations and project if it relates to future projects. Refer to page 51 of this MD&A.
d. | Capital expenditures |
Capital expenditures are related to our gold sites only and are presented on a 100% cash basis for the three months ended March 31, 2019 and on a 100% accrued basis for the three month periods ended December 31, 2018 and March 31, 2018. They are split between minesite sustaining and project capital expenditures. Project capital expenditures are distinct projects designed to increase the net present value of the mine and are not related to current production. Significant projects in the current year are stripping at Cortez Crossroads, the Goldrush exploration declines, the Deep South Expansion, and construction of the third shaft at Turquoise Ridge. Refer to page 50 of this MD&A.
e. | Rehabilitation - accretion and amortization |
Includes depreciation on the assets related to rehabilitation provisions of our gold operations and accretion on the rehabilitation provision of our gold operations, split between operating andnon-operating sites.
f. | Cost of sales per ounce |
Cost of sales applicable to gold per ounce is calculated using cost of sales on an attributable basis (removing thenon-controlling interest of 40% Pueblo Viejo, 36.1% Acacia and 40% South Arturo from cost of sales), divided by attributable gold ounces. Thenon-controlling interest of 20% Loulo-Gounkoto and 10.3% of Tongon is also removed from cost of sales and our proportionate share of cost of sales attributable to equity method investments (Kibali and Morila) is included commencing January 1, 2019, the effective date of the Merger.
BARRICK FIRST QUARTER 2019 | 67 | MANAGEMENT’S DISCUSSION AND ANALYSIS |
g. | Per ounce figures |
Cost of sales per ounce, total cash costs per ounce,all-in sustaining costs per ounce andall-in costs per ounce may not calculate based on amounts presented in this table due to rounding.
h. | Co-product costs per ounce |
Total cash costs per ounce,all-in sustaining costs per ounce andall-in costs per ounce presented on aco-product basis removes the impact ofby-product credits of our gold production (net ofnon-controlling interest) calculated as:
($ millions)
|
For the three months ended March 31, 2019
| |||||||||||||||||||||||||||||||||||
Barrick | Cortez | Goldstrike | Turquoise Ridge | Pueblo Viejo | Loulo- Gounkoto | Kibali | Veladero | Acacia | ||||||||||||||||||||||||||||
By-product credits | $— | $— | $— | $— | $16 | $— | $— | $2 | $1 | |||||||||||||||||||||||||||
Non-controlling interest | — | — | — | — | (6 | ) | — | — | — | |||||||||||||||||||||||||||
By-product credits (net ofnon-controlling interest) | $— | $— | $— | $— | $10 | $— | $— | $2 | $1 | |||||||||||||||||||||||||||
($ millions) | For the three months ended March 31, 2019
| |||||||||||||||||||||||||||||||||||
Kalgoorlie | Tongon | Porgera | Hemlo | Lagunas Norte | Golden Sunlight | Morila | ||||||||||||||||||||||||||||||
By-product credits | $— | $— | $1 | $— | $2 | $— | $— | |||||||||||||||||||||||||||||
Non-controlling interest | — | — | — | — | — | — | — | |||||||||||||||||||||||||||||
By-product credits (net ofnon-controlling interest) | $— | $— | $1 | $— | $2 | $— | $— | |||||||||||||||||||||||||||||
For the three months ended December 31, 2018
| ||||||||||||||||||||||||||||||||||||
Barrick Nevadaa | Cortez | Goldstrike | Turquoise Ridge | Pueblo Viejo | Loulo- Gounkotoi | Kibalii | Veladero | Acacia | ||||||||||||||||||||||||||||
By-product credits | $— | $— | $— | $— | $17 | $2 | $1 | |||||||||||||||||||||||||||||
Non-controlling interest | — | — | — | (7 | ) | — | — | |||||||||||||||||||||||||||||
By-product credits (net ofnon-controlling interest) | $— | $— | $— | $— | $10 | $2 | $1 | |||||||||||||||||||||||||||||
For the three months ended December 31, 2018
| ||||||||||||||||||||||||||||||||||||
Kalgoorlie | Tongoni | Porgera | Hemlo | Lagunas Norte | Golden Sunlight | Morilai | ||||||||||||||||||||||||||||||
By-product credits | $1 | $— | $— | $3 | $— | |||||||||||||||||||||||||||||||
Non-controlling interest | — | — | — | — | — | |||||||||||||||||||||||||||||||
By-product credits (net ofnon-controlling interest) | $1 | $— | $— | $3 | $— | |||||||||||||||||||||||||||||||
For the three months ended March 31, 2018
| ||||||||||||||||||||||||||||||||||||
Barrick Nevadaa | Cortez | Goldstrike | Turquoise Ridge | Pueblo Viejo | Loulo- Gounkotoi | Kibalii | Veladero | Acacia | ||||||||||||||||||||||||||||
By-product credits | $1 | $— | $1 | $— | $25 | $1 | $1 | |||||||||||||||||||||||||||||
Non-controlling interest | — | — | — | — | (10 | ) | — | — | ||||||||||||||||||||||||||||
By-product credits (net ofnon-controlling interest) | $1 | $— | $1 | $— | $15 | $1 | $1 | |||||||||||||||||||||||||||||
For the three months ended March 31, 2018
| ||||||||||||||||||||||||||||||||||||
Kalgoorlie | Tongoni | Porgera | Hemlo | Lagunas Norte | Golden Sunlight | Morilai | ||||||||||||||||||||||||||||||
By-product credits | $— | $— | $— | $4 | $— | |||||||||||||||||||||||||||||||
Non-controlling interest | — | — | — | — | — | |||||||||||||||||||||||||||||||
By-product credits (net ofnon-controlling interest) | $— | $— | $— | $4 | $— |
i. | The results for the three months ended December 31, 2018 and March 31, 2018 did not form a part of the Barrick consolidated results as these sites were acquired as a result of the Merger. Therefore, no comparative figures are provided. |
BARRICK FIRST QUARTER 2019 | 68 | MANAGEMENT’S DISCUSSION AND ANALYSIS |
Reconciliation of Copper Cost of Sales to C1 cash costs andAll-in sustaining costs, including on a per pound basis
($ millions, except per pound information in dollars)
| For the three months ended
| |||||||||||
March 31, 2019
| December 31, 2018
| March 31, 2018
| ||||||||||
Cost of sales | $131 | $210 | $96 | |||||||||
Depreciation/amortization | (42 | ) | (84 | ) | (19 | ) | ||||||
Treatment and refinement charges | 31 | 41 | 31 | |||||||||
Cash cost of sales applicable to equity method investments | 66 | 78 | 63 | |||||||||
Less: royalties and production taxesa | (12 | ) | (15 | ) | (10 | ) | ||||||
By-product credits | (3 | ) | (2 | ) | (2 | ) | ||||||
Other | — | (11 | ) | — | ||||||||
C1 cash cost of sales | $171 | $217 | $159 | |||||||||
General & administrative costs | 5 | 5 | 5 | |||||||||
Rehabilitation - accretion and amortization | 3 | 3 | 5 | |||||||||
Royalties and production taxesa | 12 | 15 | 10 | |||||||||
Minesite exploration and evaluation costs | 2 | 2 | — | |||||||||
Minesite sustaining capital expenditures | 59 | 67 | 42 | |||||||||
Sustaining leases | 1 | — | — | |||||||||
Inventory write-downs | — | 11 | — | |||||||||
All-in sustaining costs | $253 | $320 | $221 | |||||||||
Pounds sold - consolidated basis (millions pounds) | 103 | 109 | 85 | |||||||||
Cost of sales per poundb,c | $2.21 | $2.85 | $2.07 | |||||||||
C1 cash cost per poundb | $1.66 | $1.98 | $1.88 | |||||||||
All-in sustaining costs per poundb | $2.46 | $2.95 | $2.61 |
a. | For the three month period ended March 31, 2019, royalties and production taxes include royalties of $12 million (December 31, 2018: $11 million and March 31, 2018: $9 million, respectively). |
b. | Cost of sales per pound, C1 cash costs per pound andall-in sustaining costs per pound may not calculate based on amounts presented in this table due to rounding. |
c. | Cost of sales applicable to copper per pound is calculated using cost of sales including our proportionate share of cost of sales attributable to equity method investments (Zaldívar and Jabal Sayid), divided by consolidated copper pounds (including our proportionate share of copper pounds from our equity method investments). |
BARRICK FIRST QUARTER 2019 | 69 | MANAGEMENT’S DISCUSSION AND ANALYSIS |
Reconciliation of Copper Cost of Sales to C1 cash costs andAll-in sustaining costs, including on a per pound basis, by operating site
($ millions, except per pound information in dollars)
| For the three months ended
| |||||||||||||||||||||||||||||||||||
March 31, 2019
| December 31, 2018
| March 31, 2018
| ||||||||||||||||||||||||||||||||||
Zaldívar | Lumwana | Jabal Sayid | Zaldívar | Lumwana | Jabal Sayid | Zaldívar | Lumwana | Jabal Sayid | ||||||||||||||||||||||||||||
Cost of sales | $74 | $131 | $22 | $77 | $210 | $23 | $56 | $96 | $25 | |||||||||||||||||||||||||||
Depreciation/amortization | (21 | ) | (42 | ) | (9 | ) | (19 | ) | (84 | ) | (3 | ) | (13 | ) | (19 | ) | (5 | ) | ||||||||||||||||||
Treatment and refinement charges | — | 26 | 5 | — | 36 | 5 | — | 27 | 4 | |||||||||||||||||||||||||||
Less: royalties and production taxesa | — | (12 | ) | — | — | (11 | ) | (4 | ) | — | (9 | ) | (1 | ) | ||||||||||||||||||||||
By-product credits | — | — | (3 | ) | — | — | (2 | ) | — | — | (2 | ) | ||||||||||||||||||||||||
Other | — | — | — | — | (11 | ) | — | — | — | — | ||||||||||||||||||||||||||
C1 cash cost of sales | $53 | $103 | $15 | $58 | $140 | $19 | $43 | $95 | $21 | |||||||||||||||||||||||||||
Rehabilitation - accretion and amortization | — | 3 | — | — | 3 | — | — | 5 | — | |||||||||||||||||||||||||||
Royalties and production taxesa | — | 12 | — | — | 11 | 4 | — | 9 | 1 | |||||||||||||||||||||||||||
Minesite exploration and evaluation costs | 2 | — | — | 2 | — | — | — | — | — | |||||||||||||||||||||||||||
Minesite sustaining capital expenditures | 4 | 52 | 3 | 16 | 47 | 4 | 16 | 21 | 5 | |||||||||||||||||||||||||||
Sustaining leases | — | 1 | — | — | — | — | — | — | — | |||||||||||||||||||||||||||
Inventory write-downs | — | — | — | — | 11 | — | — | — | — | |||||||||||||||||||||||||||
All-in sustaining costs | $59 | $171 | $18 | $76 | $212 | $27 | $59 | $130 | $27 | |||||||||||||||||||||||||||
Pounds sold - consolidated basis (millions pounds) | 28 | 61 | 14 | 30 | 65 | 14 | 24 | 47 | 14 | |||||||||||||||||||||||||||
Cost of sales per poundb,c | $2.68 | $2.16 | $1.55 | $2.55 | $3.22 | $1.70 | $2.37 | $2.02 | $1.79 | |||||||||||||||||||||||||||
C1 cash cost per poundb | $1.91 | $1.67 | $1.10 | $1.91 | $2.12 | $1.48 | $1.84 | $2.00 | $1.55 | |||||||||||||||||||||||||||
All-in sustaining costs per poundb | $2.12 | $2.79 | $1.30 | $2.50 | $3.26 | $2.04 | $2.50 | $2.73 | $1.97 |
a. | For the three month period ended March 31, 2019, royalties and production taxes include royalties of $12 million (December 31, 2018: $11 million and March 31, 2018: $9 million, respectively). |
b. | Cost of sales per pound, C1 cash costs per pound andall-in sustaining costs per pound may not calculate based on amounts presented in this table due to rounding. |
c. | Cost of sales applicable to copper per pound is calculated using cost of sales including our proportionate share of cost of sales attributable to equity method investments (Zaldívar and Jabal Sayid), divided by consolidated copper pounds (including our proportionate share of copper pounds from our equity method investments). |
EBITDA and Adjusted EBITDA
EBITDA is anon-GAAP financial measure, which excludes the following from net earnings:
• | Income tax expense; |
• | Finance costs; |
• | Finance income; |
• | Depreciation; and |
• | Income tax expense, finance costs, finance income and depreciation from equity investees. |
Management believes that EBITDA is a valuable indicator of our ability to generate liquidity by producing operating cash flow to fund working capital needs, service debt obligations, and fund capital expenditures. Management uses EBITDA for this purpose. EBITDA is also frequently used by investors and analysts for valuation purposes whereby EBITDA is multiplied by a factor or “EBITDA multiple” that is based on an observed or inferred relationship between EBITDA and market values to determine the approximate total enterprise value of a company.
Adjusted EBITDA removes the effect of impairment charges; acquisition/disposition gains/losses; foreign currency translation gains/losses; other expense adjustments; and unrealized gains onnon-hedge derivative instruments. We believe these items provide a greater level of consistency with the adjusting items included in our Adjusted Net Earnings reconciliation, with the exception that these amounts are adjusted to remove any impact on finance costs/income, income tax expense and/or depreciation, including the impact incurred in our equity method accounted investments, as they do not affect EBITDA. We believe this additional information will assist analysts, investors and other stakeholders of Barrick in better understanding our ability to generate liquidity from operating cash flow, by excluding these amounts from the calculation as they are not indicative of the performance of our core mining business and not necessarily reflective of the underlying operating results for the periods presented.
EBITDA and adjusted EBITDA are intended to provide additional information to investors and analysts and do not
BARRICK FIRST QUARTER 2019 | 70 | MANAGEMENT’S DISCUSSION AND ANALYSIS |
have any standardized definition under IFRS and should not be considered in isolation or as a substitute for measures of performance prepared in accordance with IFRS. EBITDA and adjusted EBITDA exclude the impact of cash costs of financing activities and taxes, and the effects of changes in
operating working capital balances, and therefore are not necessarily indicative of operating profit or cash flow from operations as determined under IFRS. Other companies may calculate EBITDA and adjusted EBITDA differently.
Reconciliation of Net Earnings to EBITDA and Adjusted EBITDA
($ millions)
| For the three months ended
| |||||||||||
March 31, 2019
| December 31, 2018
| March 31, 2018
| ||||||||||
Net earnings (loss) | $ 140 | ($1,165 | ) | $192 | ||||||||
Income tax expense | 167 | 776 | 201 | |||||||||
Finance costs, neta | 100 | 95 | 113 | |||||||||
Depreciation | 435 | 441 | 325 | |||||||||
EBITDA | $ 842 | $ 147 | $831 | |||||||||
Impairment charges related to intangibles, goodwill, property, plant and equipment, and investmentsb | 3 | 408 | 2 | |||||||||
Acquisition/disposition (gains) lossesc | — | (19 | ) | (46 | ) | |||||||
Foreign currency translation losses (gains) | 22 | (16 | ) | 15 | ||||||||
Other expense (income) adjustmentsd | 47 | 261 | (6 | ) | ||||||||
Unrealized (gains) losses onnon-hedge derivative instruments | (1 | ) | 1 | — | ||||||||
Income tax expense, net finance costs, and depreciation from equity investees | $89 | $24 | $24 | |||||||||
Adjusted EBITDA | $1,002 | $806 | $820 |
a. | Finance costs exclude accretion. |
b. | Net impairment charges for the three months ended December 31, 2018 primarily relate tonon-current asset and goodwill impairments at Veladero. |
c. | Disposition gains primarily relate to the gain on the sale of anon-core royalty asset at Acacia for the three months ended March 31, 2018. |
d. | Other expense adjustments for the three months ended March 31, 2019 primarily relate to severance costs as a result of the implementation of a number of organizational reductions and the impact of changes in the discount rate assumptions on our closed mine rehabilitation provision. For the three months ended December 31, 2018, other expense adjustments mainly relate to the inventory impairment charge at Lagunas Norte, thewrite-off of a Western Australia long-term stamp duty receivable and costs associated with the merger with Randgold. |
Reconciliation of Income to EBITDA by operating site
($ millions)
| For the three months ended March 31, 2019
| |||||||||||||||||||||||||||||||||||
Barrick Nevadaa | Cortez | Goldstrike | Turquoise Ridge | Pueblo Viejo (60%) | Loulo-Gounkoto (80%) | Kibali | Veladero | Acacia (100%) | ||||||||||||||||||||||||||||
Income | $292 | $155 | $83 | $54 | $98 | $29 | $10 | $10 | $1 | |||||||||||||||||||||||||||
Depreciation | 136 | 64 | 66 | 6 | 28 | 47 | 56 | 30 | 25 | |||||||||||||||||||||||||||
EBITDA | $428 | $219 | $149 | $60 | $126 | $76 | $66 | $40 | $26 | |||||||||||||||||||||||||||
For the three months ended December 31, 2018 | ||||||||||||||||||||||||||||||||||||
Barrick Nevadaa | Cortez | Goldstrike | Turquoise Ridge | Pueblo Viejo (60%) | Loulo-Gounkotob (80%) | Kibalib | Veladero | Acacia (100%) | ||||||||||||||||||||||||||||
Income | $266 | $178 | $62 | $29 | $86 | ($5 | ) | $32 | ||||||||||||||||||||||||||||
Depreciation | 193 | 112 | 74 | 7 | 34 | 32 | 23 | |||||||||||||||||||||||||||||
EBITDA | $459 | $290 | $136 | $36 | $120 | $27 | $55 | |||||||||||||||||||||||||||||
For the three months ended March 31, 2018 | ||||||||||||||||||||||||||||||||||||
Barrick Nevadaa | Cortez | Goldstrike | Turquoise Ridge | Pueblo Viejo (60%) | Loulo-Gounkotob (80%) | Kibalib | Veladero | Acacia (100%) | ||||||||||||||||||||||||||||
Income | $259 | $172 | $48 | $39 | $115 | $25 | $71 | |||||||||||||||||||||||||||||
Depreciation | 155 | 87 | 61 | 7 | 25 | 31 | 24 | |||||||||||||||||||||||||||||
EBITDA | $414 | $259 | 109 | $46 | $140 | $56 | $95 |
a. | Barrick Nevada represents the combined results of Cortez, Goldstrike (including our 60% share of South Arturo) and, starting with this MD&A, our 75% interest in Turquoise Ridge. The reconciliations for the three month periods ended December 31, 2018 and March 31, 2018 include our 75% interest in Turquoise Ridge. |
b. | These sites were acquired as a result of the Merger and therefore no 2018 figures are provided. |
BARRICK FIRST QUARTER 2019 | 71 | MANAGEMENT’S DISCUSSION AND ANALYSIS |
Realized Price
Realized price is anon-GAAP financial measure which excludes from sales:
• | Unrealized gains and losses onnon-hedge derivative contracts; |
• | Unrealizedmark-to-market gains and losses on provisional pricing from copper and gold sales contracts; |
• | Sales attributable to ore purchase arrangements; |
• | Treatment and refining charges; and |
• | Export duties. |
This measure is intended to enable Management to better understand the price realized in each reporting period for gold and copper sales because unrealizedmark-to-market values ofnon-hedge gold and copper derivatives are subject to change each period due to changes in market factors such as market and forward gold and copper prices, so that prices ultimately realized may differ from those recorded. The exclusion of such unrealizedmark-to-market gains and losses from the presentation of this performance measure enables investors to understand performance based on the realized proceeds of selling gold and copper production.
The gains and losses onnon-hedge derivatives and receivable balances relate to instruments/balances that mature in future periods, at which time the gains and losses
will become realized. The amounts of these gains and losses reflect fair values based on market valuation assumptions at the end of each period and do not necessarily represent the amounts that will become realized on maturity. We also exclude export duties that are paid upon sale and netted against revenues as well as treatment and refining charges that are paid to the refiner on gold and copper concentrate sales that are netted against revenues. We believe this provides investors and analysts with a more accurate measure with which to compare to market gold prices and to assess our gold sales performance. For those reasons, management believes that this measure provides a more accurate reflection of our Company’s past performance and is a better indicator of its expected performance in future periods.
The realized price measure is intended to provide additional information and does not have any standardized definition under IFRS and should not be considered in isolation or as a substitute for measures of performance prepared in accordance with IFRS. The measure is not necessarily indicative of sales as determined under IFRS. Other companies may calculate this measure differently. The following table reconciles realized prices to the most directly comparable IFRS measure.
Reconciliation of Sales to Realized Price per ounce/pound
($millions, except per ounce/pound information in dollars)
| Gold
| Copper
| ||||||||||||||||||||||
For the three months ended
| ||||||||||||||||||||||||
March 31, 2019 | December 31, 2018 | March 31, 2018 | March 31, 2019 | December 31, 2018 | March 31, 2018 | |||||||||||||||||||
Sales | $1,906 | $1,734 | $1,643 | $163 | $144 | $111 | ||||||||||||||||||
Sales applicable tonon-controlling interests | (224 | ) | (197 | ) | (187 | ) | — | — | — | |||||||||||||||
Sales applicable to equity method investmentsa,b | 129 | — | — | 121 | 116 | 113 | ||||||||||||||||||
Realizednon-hedge gold/copper derivative (losses) gains | — | — | — | — | — | — | ||||||||||||||||||
Sales applicable to Pierinac | (26 | ) | (28 | ) | (29 | ) | — | — | — | |||||||||||||||
Treatment and refinement charges | — | — | — | 31 | 41 | 31 | ||||||||||||||||||
Export duties | — | (4 | ) | — | — | — | — | |||||||||||||||||
Revenues – as adjusted | $1,785 | $1,505 | $1,427 | $315 | $301 | $255 | ||||||||||||||||||
Ounces/pounds sold (000s ounces/millions pounds)c | 1,365 | 1,232 | 1,071 | 103 | 109 | 85 | ||||||||||||||||||
Realized gold/copper price per ounce/poundd | $1,307 | $1,223 | $1,332 | $3.07 | $2.76 | $2.98 |
a. | Represents sales of $117 million for the three months ended March 31, 2019 (December 31, 2018: $nil and March 31, 2018: $nil) applicable to our 45% equity method investment in Kibali and $12 million (December 31, 2018: $nil and March 31, 2018: $nil) applicable to our 40% equity method investment in Morila for gold. Represents sales of $81 million for the three months ended March 31, 2019 (December 31, 2018: $84 million and March 31, 2018: $72 million) applicable to our 50% equity method investment in Zaldívar and $44 million (December 31, 2018: $37 million and March 31, 2018: $41 million) applicable to our 50% equity method investment in Jabal Sayid for copper. |
b. | Sales applicable to equity method investments are net of treatment and refinement charges. |
c. | Figures exclude Pierina from the calculation of realized price per ounce as the mine is mining incidental ounces as it enters closure. |
d. | Realized price per ounce/pound may not calculate based on amounts presented in this table due to rounding. |
BARRICK FIRST QUARTER 2019 | 72 | MANAGEMENT’S DISCUSSION AND ANALYSIS |
TECHNICAL INFORMATION
The scientific and technical information contained in this MD&A has been reviewed and approved by Steven Yopps, MMSA, Director - Metallurgy, North America; Chad Yuhasz, P.Geo, Mineral Resource Manager, Latin America and Australia Pacific; Simon Bottoms, CGeol, MGeol, FGS, MAusIMM, Mineral Resources Manager: Africa and Middle East; Rodney Quick, MSc, Pr. Sci.Nat, Mineral Resource Management and Evaluation Executive; John Steele, CIM, Metallurgy, Engineering and Capital Projects Executive; and Rob Krcmarov, FAusIMM, Executive Vice President, Exploration and Growth – each a “Qualified Person” as defined in National Instrument43-101 –Standards of Disclosure for Mineral Projects.
ENDNOTES
1 | These arenon-GAAP financial performance measures with no standardized meaning under IFRS and therefore may not be comparable to similar measures presented by other issuers. For further information and a detailed reconciliation of eachnon- GAAP measure to the most directly comparable IFRS measure, please see pages 57 to 72 of this MD&A. |
2 | Amount excludes capital leases and includes Acacia (100% basis). |
3 | Includes $118 million of cash, primarily held at Acacia, which may not be readily deployed. |
4 | Cost of sales applicable to gold per ounce is calculated using cost of sales applicable to gold on an attributable basis (removing thenon-controlling interest of 40% Pueblo Viejo, 36.1% Acacia and 40% South Arturo from cost of sales), divided by attributable gold ounces. Thenon-controlling interest of 20% Loulo-Gounkoto and 10.3% of Tongon is also removed from cost of sales and our proportionate share of cost of sales attributable to equity method investments (Kibali and Morila) is included commencing January 1, 2019, the effective date of the Merger. Cost of sales applicable to copper per pound is calculated using cost of sales applicable to copper including our proportionate share of cost of sales attributable to equity method investments (Zaldívar and Jabal Sayid), divided by consolidated copper pounds (including our proportionate share of copper pounds from our equity method investments). |
5 | Fourmile Significant Intercepts1 |
Drill Results from Q1 2019 | ||||||||||||
Drill Hole2 | Azimuth | Dip | Interval (m) | Width (m)3 | Au (g/t) |
| ||||||
FM19-23D | 94 | (70) | 695 - 698
722.1 - 723.8 | 3
1.7 | 5.2
13.4 | |||||||
FM18-54D | 36 | (83) | 533.1 - 537.7
550.6 - 552
553.4 - 556.1 | 4.6
1.4
2.7 | 7.6
7.2
6.7 | |||||||
FM18-58D | 267 | (84) | 713.7 - 717.8
721.1 - 726.3
922 - 926.6 | 4.1
5.2
4.6 | 8.4
23.5
9.4 |
1 | All intercepts calculated using a 5 g/t Au cutoff and are uncapped; minimum intercept width is 0.8 m; internal dilution is less than 20% total width. |
2 | Fourmile drill hole nomenclature: FM (Fourmile) followed by the year (18 for 2018). |
3 | True width of intercepts are uncertain at this stage. |
The drilling results for the Fourmile property contained in this report have been prepared in accordance with National Instrument43-101 – Standards of Disclosure for Mineral Projects. All drill hole assay information has been manually reviewed and approved by staff geologists andre-checked by the project manager. Sample preparation and analyses are conducted by an independent laboratory. Procedures are employed to ensure security of samples during their delivery from the drill rig to the laboratory. The quality assurance procedures, data verification and assay protocols used in connection with drilling and sampling on the Fourmile property conform to industry accepted quality control methods.
BARRICK FIRST QUARTER 2019 | 73 | MANAGEMENT’S DISCUSSION AND ANALYSIS |
La Capilla Significant Intercepts1
Drill Results from Q1 2019 | ||||||||||||
Drill Hole2 | Azimuth | Dip | Interval (m) | Width (m)3 | Au (g/t) |
| ||||||
RLC-19-001 | 0 | (68) | 46-58
98-115 | 12
17 | 0.52
0.48 | |||||||
RLC-19-002 | 0 | (71) | 5-19 | 14 | 0.45 | |||||||
RLC-19-003 | 0 | (67) | 8-91 | 83 | 0.74 | |||||||
RLC-19-004 | 270 | (65) | 119-139 | 20 | 0.46 | |||||||
RLC-19-005 | 0 | (67) | 115-123 | 8 | 0.71 | |||||||
RLC-19-006 | 0 | (67) | 49-61 | 12 | 0.68 | |||||||
RLC-19-007 | 270 | (68) | 47-61 | 14 | 1.22 | |||||||
DLC-19-001 | 355 | (65) | 0-42.3 | 42.3 | 1.02 | |||||||
DLC-19-002 | 358 | (64) | 0-9.9 | 9.9 | 0.89 | |||||||
DLC-19-005 | 358 | (55) | 51-85 | 34 | 0.4 | |||||||
DLC-19-006 | 180 | (60) | 4-55.4 | 51.4 | 1.22 | |||||||
DLC-19-006A | 183 | (59) | 4.5-37.5
44-61 | 33
17 | 0.77
1.51 | |||||||
DLC-19-007 | 357 | (59) | 0-7 | 7 | 1.33 | |||||||
DLC-19-008 | 355 | (59) | 47.6-61 | 13.4 | 1.84 | |||||||
DLC-19-009 | 180 | (55) | 0-9.5
20.5-35.5
59.5-68 | 9.5
15
8.5 | 1.04
1.57
0.74 |
1 | All intercepts calculated using a 0.25 g/t Au cutoff and are uncapped; minimum intercept width is 1.0 m; internal dilution is less than 20% total width. |
2 | La Capilla drill hole nomenclature: RLC (Reverse Circulation) followed by the year (19 for 2019), or DLC (Diamond Drill Hole) followed by the year. |
3 | True width of intercepts are uncertain at this stage. |
The drilling results for the La Capilla property contained in this report have been prepared in accordance with National Instrument43-101 – Standards of Disclosure for Mineral Projects. All drill hole assay information has been manually reviewed and approved by staff geologists andre-checked by the project manager. Sample preparation and analyses are conducted by an independent laboratory. Procedures are employed to ensure security of samples during their delivery from the drill rig to the laboratory. The quality assurance procedures, data verification and assay protocols used in connection with drilling and sampling on the La Capilla property conform to industry accepted quality control methods.
Loulo Significant Intercepts1
Yalea Panel Drill Results | ||||||||||||||||
Drill Hole2 | Type | Azimuth | Dip | Interval (m) | Width (m) | TW (m) | Au (g/t) | Period | ||||||||
YDH282 | DDH | 253 | (56.6) | 992.00-1002.90 | 10.9 | 8.74 | 4.6 | 2018 Q3 | ||||||||
YDH282 | DDH | 253 | (56.6) | 1004.00-1012.15 | 8.15 | 6.55 | 6.97 | 2018 Q3 | ||||||||
YDH281 | DDH | 251 | (54) | 1078.50-1083.65 | 5.15 | 4.22 | 1.83 | 2018 Q3 | ||||||||
YaDH82 | DDH | 256 | (62.6) | 851.10-853.90 | 2.8 | 2.01 | 2.59 | 2018 Q1 | ||||||||
YaDH53 | DDH | 81 | (63) | 885.90-897.20 | 11.3 | 7.51 | 2.91 | 2018 Q2 | ||||||||
YaDH48 | DDH | 257.5 | (61) | 899.00-903.00 | 4 | 3.26 | 1.58 | 2018 Q4 | ||||||||
YaDH70 | DDH | 254.3 | (62.3) | 1020.80-1023.90 | 3.1 | 2.35 | 2.17 | 2018 Q4 | ||||||||
YaDH73 | DDH | 254.7 | (53.5) | 1010.65-1017.65 | 7 | 6.07 | 1.18 | 2018 Q4 | ||||||||
YDH270 | DDH | 255 | (60) | 1106.05-1116.00 | 9.95 | 8.29 | 2.24 | 2005 Q1 | ||||||||
YDH274 | DDH | 256 | (67.3) | 908.80-925.65 | 16.85 | 10.88 | 3.14 | 2017 Q3 | ||||||||
YDH277 | DDH | 259.6 | (50) | 1014.40-1021.00 | 6.6 | 5.16 | 11.06 | 2015 Q4 |
1 | All intercepts calculated using a 0.5 g/t Au cutoff and are uncapped; minimum intercept width is 2m; |
2 | Loulo drill hole nomenclature: prospect initial YD or Ya (Yalea), followed by the type of drilling DH |
BARRICK FIRST QUARTER 2019 | 74 | MANAGEMENT’S DISCUSSION AND ANALYSIS |
The drilling results for the Loulo property contained in this report have been prepared in accordance with National Instrument43-101 –Standards of Disclosure for Mineral Projects. All drill hole assay information has been manually reviewed and approved by staff geologists andre-checked by the project manager. Sample preparation and analyses are conducted by an independent laboratory. Procedures are employed to ensure security of samples during their delivery from the drill rig to the laboratory. The quality assurance procedures, data verification and assay protocols used in connection with drilling and sampling on the Loulo property conform to industry accepted quality control methods.
Mankono Significant Intercepts1
Including4 | ||||||||||||||||||||||||||||
Drill Hole2
| Type
| Azimuth
| Dip
| Interval (m)
| Width (m)3
| Au (g/t)
| Interval (m)
| Width (m)
| Au (g/t)
| Period
| ||||||||||||||||||
Dokeka Drill Results
| ||||||||||||||||||||||||||||
DKAC016 | AC | 135 | (50) | 1.00-3.00 | 2.00 | 1.13 | ||||||||||||||||||||||
DKAC020 | AC | 315 | (50) | 10.00-15.00 | 5.00 | 1.74 | ||||||||||||||||||||||
DKAC024 | AC | 315 | (50) | 17.00-27.00 | 10.00 | 52.11 | 24-27 | 3.00 | 158.66 | |||||||||||||||||||
DKAC025 | AC | 135 | (50) | 0.00-9.00 | 9.00 | 8.69 | 0-2 | 2.00 | 32.21 | 2019 Q1 | ||||||||||||||||||
DKAC025 | AC | 135 | (50) | 24.00-30.00 | 6.00 | 2.46 | 27-28 | 1.00 | 8.27 | |||||||||||||||||||
DKAC046 | AC | 315 | (50) | 38.00-41.00 | 3.00 | 3.75 | 40-41 | 1.00 | 6.13 | |||||||||||||||||||
DKAC047 | AC | 315 | (50) | 22.00-26.00 | 4.00 | 2.86 | ||||||||||||||||||||||
Gbongogo North Drill Results
|
| |||||||||||||||||||||||||||
GBDDH024 | DDH | 110 | (60) | 107.70 | 10.80 | 2.41 | 112.7-113.7 | 1.00 | 14.49 | |||||||||||||||||||
151.00 | 15.00 | 0.58 | 2019 Q1 | |||||||||||||||||||||||||
GBDDH025 | DDH | 110 | (60) | 98.00 | 2.80 | 0.8 | ||||||||||||||||||||||
43.00 | 2.00 | 0.88 | ||||||||||||||||||||||||||
55.80 | 5.00 | 0.83 | ||||||||||||||||||||||||||
GBDDH010 | DDH | 115 | (50) | 75.00 | 3.00 | 0.78 | 2016 Q3 | |||||||||||||||||||||
105.00 | 5.30 | 2.67 | 106.2-108.8 | 2.00 | 6.36 | |||||||||||||||||||||||
115.00 | 3.80 | 1.09 |
1 | All intercepts calculated using a 0.5 g/t Au cutoff and are uncapped; minimum intercept width is 2m; internal dilution is equal to or less than 25% total width. |
2 | Mankono drill hole nomenclature: prospect initial GB (Gbongogo N), DK (Dokeka) followed by the type of drilling AC (Air Core), DDH (Diamond) with no designation of the year. |
3 | True width of intercepts are uncertain at this stage. |
4 | Includings defined as any interval with a weighted average Au g/t equal to or greater than 5g/t. |
The drilling results for the Mankono property contained in this report have been prepared in accordance with National Instrument43-101 –Standards of Disclosure for Mineral Projects. All drill hole assay information has been manually reviewed and approved by staff geologists andre-checked by the project manager. Sample preparation and analyses are conducted by an independent laboratory. Procedures are employed to ensure security of samples during their delivery from the drill rig to the laboratory. The quality assurance procedures, data verification and assay protocols used in connection with drilling and sampling on the Mankono property conform to industry accepted quality control methods.
BARRICK FIRST QUARTER 2019 | 75 | MANAGEMENT’S DISCUSSION AND ANALYSIS |
Kibali Significant Intercepts1
Gorumbwa Drill Results
| ||||||||||||||||||||||||||||
Including4 | ||||||||||||||||||||||||||||
Drill Hole2
| Type
| Azimuth
| Dip
| Interval (m)
| Width (m)3
| Au (g/t)
| Interval (m)
| Width (m)
| Au (g/t)
| Period
| ||||||||||||||||||
GDD196 | DDH | 233 | (70) | 521.00-533.00 | 12.00 | 5.46 | 530.9-533 | 2.10 | 26.1 | |||||||||||||||||||
GDD196 | DDH | 233 | (70) | 577.00-582.00 | 5.00 | 6.25 | 579-580 | 1.00 | 19.3 | 2019 Q1 | ||||||||||||||||||
GDD197 | DDH | 233 | (70) | 474.00-478.00 | 4.00 | 2.49 | 475-477 | 2.00 | 3.91 | |||||||||||||||||||
GDD197 | DDH | 233 | (70) | 605.95-610.25 | 4.30 | 2.94 | 608-610.25 | 2.25 | 4.36 |
1 All intercepts calculated using a 0.5 g/t Au cutoff and are uncapped; minimum intercept width is 2m; internal dilution is equal to or less than 25% total width.
2 Kibali drill hole nomenclature: prospect initial G (Gorumbwa) followed by the type of drilling DD (Diamond) with no designation of the year.
3 True width of intercepts are uncertain at this stage.
4 Includings defined as any interval with a weighted average Au g/t equal to or greater than 5g/t.
The drilling results for the Kibali property contained in this report have been prepared in accordance with National Instrument43-101 –Standards of Disclosure for Mineral Projects. All drill hole assay information has been manually reviewed and approved by staff geologists andre-checked by the project manager. Sample preparation and analyses are conducted by an independent laboratory. Procedures are employed to ensure security of samples during their delivery from the drill rig to the laboratory. The quality assurance procedures, data verification and assay protocols used in connection with drilling and sampling on the Kibali property conform to industry accepted quality control methods.
6 | Barrick is focusing its efforts on identifying, investing in and developing assets that meet the Company’s investment criteria, which are: (i) with respect to tier one assets, assets with a reserve potential greater than 5 million ounces of gold expected to generate an internal rate of return (“IRR”) of at least 15% (at a long-term gold price calculated with reference to a standard reference gold mine model using current input costs); and (ii) with respect to tier two assets, assets with a reserve potential of greater than 3 million ounces of gold expected to generate an IRR of at least 20% (at a long-term gold price calculated with reference to a standard reference gold mine model using current input costs). |
BARRICK FIRST QUARTER 2019 | 76 | MANAGEMENT’S DISCUSSION AND ANALYSIS |
Consolidated Statements of Income
Barrick Gold Corporation (in millions of United States dollars, except per share data) (Unaudited) | Three months ended March 31, | |||||||
2019 | 2018 | |||||||
Revenue (notes 5 and 6) | $2,093 | $1,790 | ||||||
Costs and expenses (income) | ||||||||
Cost of sales (notes 5 and 7) | 1,490 | 1,152 | ||||||
General and administrative expenses | 54 | 48 | ||||||
Exploration, evaluation and project expenses | 74 | 73 | ||||||
Impairment charges (notes 9B and 13) | 3 | 2 | ||||||
Loss on currency translation | 22 | 15 | ||||||
Closed mine rehabilitation | 25 | (9 | ) | |||||
Income from equity investees (note 12) | (28 | ) | (16 | ) | ||||
Gain onnon-hedge derivatives | (1 | ) | (2 | ) | ||||
Other expense (note 9A) | 27 | 1 | ||||||
Income before finance costs and income taxes | $427 | $526 | ||||||
Finance costs, net | (120 | ) | (133 | ) | ||||
Income before income taxes | $307 | $393 | ||||||
Income tax expense (note 10) | (167 | ) | (201 | ) | ||||
Net income | $140 | $192 | ||||||
Attributable to: | ||||||||
Equity holders of Barrick Gold Corporation | $111 | $158 | ||||||
Non-controlling interests | $29 | $34 | ||||||
Earnings per share data attributable to the equity holders of Barrick Gold Corporation (note 8) | ||||||||
Net income | ||||||||
Basic | $0.06 | $0.14 | ||||||
Diluted | $0.06 | $0.14 |
The accompanying notes are an integral part of these condensed interim consolidated financial statements.
BARRICK FIRST QUARTER 2019 | 77 | FINANCIAL STATEMENTS (UNAUDITED) |
Consolidated Statements of Comprehensive Income
Barrick Gold Corporation (in millions of United States dollars) (Unaudited) | Three months ended March 31, | |||||||
2019 | 2018 | |||||||
Net income | $140 | $192 | ||||||
Other comprehensive (loss) income, net of taxes | ||||||||
Items that may be reclassified subsequently to profit or loss: | ||||||||
Unrealized gains (losses) on derivatives designated as cash flow hedges, net of tax $nil and ($3) | — | 6 | ||||||
Currency translation adjustments, net of tax $nil and $nil | (2 | ) | — | |||||
Items that will not be reclassified to profit or loss: | ||||||||
Net unrealized change on equity investments, net of tax $nil and $nil | (3 | ) | (4 | ) | ||||
Net realized change on equity investments, net of tax $nil and $nil | (1 | ) | — | |||||
Total other comprehensive (loss) income | (6 | ) | 2 | |||||
Total comprehensive income | $134 | $194 | ||||||
Attributable to: | ||||||||
Equity holders of Barrick Gold Corporation | $105 | $160 | ||||||
Non-controlling interests | $29 | $34 |
The accompanying notes are an integral part of these condensed interim consolidated financial statements.
BARRICK FIRST QUARTER 2019 | 78 | FINANCIAL STATEMENTS (UNAUDITED) |
Consolidated Statements of Cash Flow
Barrick Gold Corporation (in millions of United States dollars) (Unaudited) | Three months ended March 31, | |||||||
2019
| 2018
| |||||||
OPERATING ACTIVITIES | ||||||||
Net income | $140 | $192 | ||||||
Adjustments for the following items: | ||||||||
Depreciation | 435 | 325 | ||||||
Finance costs | 127 | 138 | ||||||
Impairment charges (notes 9B and 13) | 3 | 2 | ||||||
Income tax expense (note 10) | 167 | 201 | ||||||
Gain on sale ofnon-current assets | — | (46 | ) | |||||
Currency translation losses | 22 | 15 | ||||||
Change in working capital (note 11) | (244 | ) | (152 | ) | ||||
Other operating activities (note 11) | (28 | ) | (88 | ) | ||||
Operating cash flows before interest and income taxes | 622 | 587 | ||||||
Interest paid | (28 | ) | (28 | ) | ||||
Income taxes paid | (74 | ) | (52 | ) | ||||
Net cash provided by operating activities | 520 | 507 | ||||||
INVESTING ACTIVITIES | ||||||||
Property, plant and equipment | ||||||||
Capital expenditures (note 5) | (374 | ) | (326 | ) | ||||
Sales proceeds | 3 | 47 | ||||||
Investment purchases | (3 | ) | (1 | ) | ||||
Cash acquired in merger | 751 | — | ||||||
Other investing activities (note 11) | 45 | (4 | ) | |||||
Net cash provided by (used in) investing activities | 422 | (284 | ) | |||||
FINANCING ACTIVITIES | ||||||||
Lease repayments | (12 | ) | — | |||||
Debt repayments | (16 | ) | (23 | ) | ||||
Dividends | (333 | ) | (31 | ) | ||||
Funding fromnon-controlling interests | 6 | 8 | ||||||
Disbursements tonon-controlling interests | (5 | ) | (26 | ) | ||||
Net cash used in financing activities | (360 | ) | (72 | ) | ||||
Effect of exchange rate changes on cash and equivalents | — | (1 | ) | |||||
Net increase in cash and equivalents | 582 | 150 | ||||||
Cash and equivalents at the beginning of period | 1,571 | 2,234 | ||||||
Cash and equivalents at the end of period | $2,153 | $2,384 |
The accompanying notes are an integral part of these condensed interim consolidated financial statements.
BARRICK FIRST QUARTER 2019 | 79 | FINANCIAL STATEMENTS (UNAUDITED) |
Consolidated Balance Sheets
Barrick Gold Corporation (in millions of United States dollars) (Unaudited) | As at March 31, | As at December 31, | ||||||
2019 | 2018 | |||||||
ASSETS | ||||||||
Current assets | ||||||||
Cash and equivalents (note 14A) | $2,153 | $1,571 | ||||||
Accounts receivable | 383 | 248 | ||||||
Inventories | 1,966 | 1,852 | ||||||
Other current assets | 372 | 307 | ||||||
Total current assets | $4,874 | $3,978 | ||||||
Non-current assets | ||||||||
Equity in investees (note 12) | 4,444 | 1,234 | ||||||
Property, plant and equipment | 16,891 | 12,826 | ||||||
Goodwill | 2,810 | 1,176 | ||||||
Intangible assets | 227 | 227 | ||||||
Deferred income tax assets | 251 | 259 | ||||||
Non-current portion of inventory | 1,879 | 1,696 | ||||||
Other assets | 1,253 | 1,235 | ||||||
Total assets
| $32,629 | $22,631 | ||||||
LIABILITIES AND EQUITY | ||||||||
Current liabilities | ||||||||
Accounts payable | $1,213 | $1,101 | ||||||
Debt | 308 | 43 | ||||||
Current income tax liabilities | 191 | 203 | ||||||
Other current liabilities | 272 | 321 | ||||||
Total current liabilities | $1,984 | $1,668 | ||||||
Non-current liabilities | ||||||||
Debt | 5,499 | 5,695 | ||||||
Provisions | 3,113 | 2,904 | ||||||
Deferred income tax liabilities | 2,003 | 1,236 | ||||||
Other liabilities | 1,728 | 1,743 | ||||||
Total liabilities
| $14,327 | $13,246 | ||||||
Equity | ||||||||
Capital stock (note 16) | $28,792 | $20,883 | ||||||
Deficit | (13,351 | ) | (13,453 | ) | ||||
Accumulated other comprehensive loss | (164 | ) | (158 | ) | ||||
Other | 321 | 321 | ||||||
Total equity attributable to Barrick Gold Corporation shareholders | $15,598 | $7,593 | ||||||
Non-controlling interests
| 2,704 | 1,792 | ||||||
Total equity
| $18,302 | $9,385 | ||||||
Contingencies and commitments (notes 5 and 17) | ||||||||
Total liabilities and equity
| $32,629 | $22,631 |
The accompanying notes are an integral part of these condensed interim consolidated financial statements.
BARRICK FIRST QUARTER 2019 | 80 | FINANCIAL STATEMENTS (UNAUDITED) |
Consolidated Statements of Changes in Equity
Barrick Gold Corporation
| Attributable to equity holders of the company
| |||||||||||||||||||||||||||||||
(in millions of United States dollars) (Unaudited) | Common Shares (in thousands) | Capital stock | Retained deficit |
Accumulated | Other2 | Total equity attributable to shareholders | Non- controlling interests | Total equity | ||||||||||||||||||||||||
At January 1, 2019 | 1,167,847 | $20,883 | ($13,453 | ) | ($158 | ) | $321 | $7,593 | $1,792 | $9,385 | ||||||||||||||||||||||
Net income | — | — | 111 | — | — | 111 | 29 | 140 | ||||||||||||||||||||||||
Total other comprehensive loss | — | — | — | (6 | ) | — | (6 | ) | — | (6 | ) | |||||||||||||||||||||
Total comprehensive income (loss) | — | — | 111 | (6 | ) | — | 105 | 29 | 134 | |||||||||||||||||||||||
Transactions with owners | ||||||||||||||||||||||||||||||||
Dividends | — | — | (3 | ) | — | — | (3 | ) | — | (3 | ) | |||||||||||||||||||||
Merger with Randgold Resources Limited | 583,669 | 7,903 | — | — | — | 7,903 | 882 | 8,785 | ||||||||||||||||||||||||
Funding fromnon-controlling interests | — | — | — | — | — | — | 6 | 6 | ||||||||||||||||||||||||
Other decrease in non-controlling interest | — | — | — | — | — | — | (5 | ) | (5 | ) | ||||||||||||||||||||||
Dividend reinvestment plan (note 16) | 466 | 6 | (6 | ) | — | — | — | — | — | |||||||||||||||||||||||
Total transactions with owners
| 584,135 | 7,909 | (9 | ) | — | — | 7,900 | 883 | 8,783 | |||||||||||||||||||||||
At March 31, 2019 | 1,751,982 | $28,792 | ($13,351 | ) | ($164 | ) | $321 | $15,598 | $2,704 | $18,302 | ||||||||||||||||||||||
At December 31, 2017 | 1,166,577 | $20,893 | ($11,759 | ) | ($169 | ) | $321 | $9,286 | $1,781 | $11,067 | ||||||||||||||||||||||
Impact of adopting IFRS 15 on January 1, 2018
| — | — | 64 | — | — | 64 | — | 64 | ||||||||||||||||||||||||
At January 1, 2018 (restated) | 1,166,577 | $20,893 | ($11,695 | ) | ($169 | ) | $321 | $9,350 | $1,781 | $11,131 | ||||||||||||||||||||||
Net income | — | — | 158 | — | — | 158 | 34 | 192 | ||||||||||||||||||||||||
Total other comprehensive income | — | — | — | 2 | — | 2 | — | 2 | ||||||||||||||||||||||||
Total comprehensive income
| — | — | 158 | 2 | — | 160 | 34 | 194 | ||||||||||||||||||||||||
Transactions with owners | ||||||||||||||||||||||||||||||||
Dividends | — | — | (31 | ) | — | — | (31 | ) | — | (31 | ) | |||||||||||||||||||||
Funding fromnon-controlling interests | — | — | — | — | — | — | 8 | 8 | ||||||||||||||||||||||||
Other decrease in non-controlling interests | — | — | — | — | — | — | (36 | ) | (36 | ) | ||||||||||||||||||||||
Dividend reinvestment plan
| 316 | 4 | (4 | ) | — | — | — | — | — | |||||||||||||||||||||||
Total transactions with owners
| 316 | 4 | (35 | ) | — | — | (31 | ) | (28 | ) | (59 | ) | ||||||||||||||||||||
At March 31, 2018 | 1,166,893 | $20,897 | ($11,572 | ) | ($167 | ) | $321 | $9,479 | $1,787 | $11,266 |
1 | Includes cumulative translation losses at March 31, 2019: $84 million (March 31, 2018: $73 million). |
2 | Includes additionalpaid-in capital as at March 31, 2019: $283 million (December 31, 2018: $283 million; March 31, 2018: $283 million) and convertible borrowings - equity component as at March 31, 2019: $38 million (December 31, 2018: $38 million; March 31, 2018: $38 million). |
The accompanying notes are an integral part of these condensed interim consolidated financial statements.
BARRICK FIRST QUARTER 2019 | 81 | FINANCIAL STATEMENTS (UNAUDITED) |
NOTES TO CONSOLIDATED
FINANCIAL STATEMENTS
Barrick Gold Corporation.Tabular dollar amounts in millions of United States dollars, unless otherwise shown.
1 > CORPORATE INFORMATION
Barrick Gold Corporation (“Barrick”, “we” or the “Company”) is a corporation governed by theBusiness Corporations Act (British Columbia). The Company’s head office is located at Brookfield Place, TD Canada Trust Tower, 161 Bay Street, Suite 3700, Toronto, Ontario, M5J 2S1. The Company’s registered office is 925 West Georgia Street, Suite 1600, Vancouver, British Columbia, V6C 3L2. We are principally engaged in the production and sale of gold and copper, as well as related activities such as exploration and mine development. Our producing gold mines are located in Canada, the United States, Peru, Côte d’Ivoire, Mali and the Dominican Republic and our producing copper mine is in Zambia. We hold a 50% interest in Veladero, a gold mine located in Argentina, a 50% interest in Kalgoorlie, a gold mine located in Australia, a 50% equity interest in Barrick Niugini Limited (“BNL”), which owns a 95% interest in Porgera, a gold mine located in Papua New Guinea, a 50% equity interest in Morila Limited, which owns an 80% interest in Morila, a gold mine located in Mali, and a 50% equity interest in Kibali (Jersey) Limited, which owns a 90% interest in Kibali, a gold mine located in the Democratic Republic of Congo. We also hold a 63.9% equity interest in Acacia Mining plc (“Acacia”), a company listed on the London Stock Exchange that owns gold mines and exploration properties in Africa. We have a 50% interest in Zaldívar, a copper mine located in Chile and a 50% interest in Jabal Sayid, a copper mine located in Saudi Arabia. We also have various projects located throughout the Americas and Africa. We sell our gold and copper production into the world market.
2 > SIGNIFICANT ACCOUNTING POLICIES
A) Statement of Compliance
These condensed interim consolidated financial statements have been prepared in accordance with International Accounting Standard 34 Interim Financial Reporting (“IAS 34”) as issued by the International Accounting Standards Board (“IASB”). These interim financial statements should be read in conjunction with Barrick’s most recently issued Annual Report which includes information necessary or useful to understanding the Company’s business and financial statement presentation. In particular, the Company’s significant accounting policies were presented in Note 2 of the Annual Consolidated Financial Statements for the year ended December 31, 2018 (“2018 Annual Financial Statements”), and have been consistently applied in the preparation of these interim financial statements, except as otherwise noted in Note 2B. These condensed interim consolidated financial statements were authorized for issuance by the Board of Directors on May 7, 2019.
B) New Accounting Standards Effective in 2019
Impact of Adoption of IFRS 16 Leases
We have adopted the requirements of IFRS 16 Leases (“IFRS 16”) as of January 1, 2019. IFRS 16 specifies how to recognize, measure, present and disclose leases. The standard provides a single lessee accounting model, requiring lessees to recognize assets and liabilities for all major leases
where a lessee has the right to control the use of an identified asset. We elected to apply IFRS 16 using the modified retrospective approach and therefore the comparative information has not been restated and continues to be reported under IAS 17 Leases and IFRIC 4: Determining Whether an Arrangement Contains a Lease. The reclassifications and the adjustments arising from the new leasing rules are therefore recognized on January 1, 2019. The details of accounting policy changes and the quantitative impact of these changes are described below.
Accounting policy changes
Through 2018, assets acquired via a finance lease were recorded as an asset with a corresponding liability at an amount equal to the lower of the fair value of the leased property and the present value of the minimum lease payments. Each lease payment was allocated between the liability and finance cost using the effective interest method, whereby a constant rate of interest expense is recognized on the balance of the liability outstanding. The interest element of the lease was charged to the consolidated statements of income as a finance cost. Property, plant and equipment assets acquired under finance leases were depreciated over the shorter of the useful life of the asset and the lease term. All other leases were classified as operating leases. Operating lease payments were recognized as an operating cost in the consolidated statements of income on a straight-line basis over the lease term.
From January 1, 2019, leases are recognized as aright-of-use asset and a corresponding liability at the date at which the leased asset is available for use by the Company. Each lease payment is allocated between the liability and finance cost. The finance cost is charged to profit or loss over the lease period so as to produce a constant periodic rate of interest on the remaining balance of the liability for each period. Theright-of-use asset is depreciated over the shorter of the asset’s useful life and the lease term on a straight-line basis.
Assets and liabilities arising from a lease are initially measured on a present value basis. Lease liabilities include the net present value of the following lease payments:
• | fixed payments (includingin-substance fixed payments), less any lease incentives receivable; |
• | variable lease payments that are based on an index or a rate; |
• | amounts expected to be payable by the lessee under residual value guarantees; |
• | the exercise price of a purchase option if the lessee is reasonably certain to exercise that option; and |
• | payments of penalties for terminating the lease, if the lease term reflects the lessee exercising that option. |
The lease payments are discounted using the interest rate implicit in the lease. If that rate cannot be determined, the lessee’s incremental borrowing rate is used, being the rate that the lessee would have to pay to borrow the funds
BARRICK FIRST QUARTER 2019 | 82 | NOTES TO FINANCIAL STATEMENTS (UNAUDITED) |
necessary to obtain an asset of similar value in a similar economic environment with similar terms and conditions.
Right-of-use assets are measured at cost comprising the following:
• | the amount of the initial measurement of lease liability; |
• | any lease payments made at or before the commencement date less any lease incentives received; |
• | any initial direct costs; and |
• | restoration costs. |
Payments associated with short-term leases and leases oflow-value assets are recognized on a straight-line basis as an expense in profit or loss. Short-term leases are leases with a lease term of 12 months or less.Low-value assets are generally comprised ofIT-equipment and small items of office furniture.
Impact on consolidated financial statements
On adoption of IFRS 16, we recognized lease liabilities in relation to leases which had previously been classified as operating leases.These liabilities were measured at the present value of the remaining lease payments, discounted using the weighted average incremental borrowing rate as of January 1, 2019 of 5.83%.
For leases previously classified as finance leases the entity recognized the carrying amount of the lease asset and lease liability immediately before transition as the carrying amount of theright-of-use asset and the lease liability at the date of initial application. The measurement principles of IFRS 16 are applied after the date of initial application.
The following table reconciles the Company’s operating lease obligations as at December 31, 2018 as previously disclosed in the Company’s 2018 Annual Financial Statements, to the lease obligations recognized on initial application of IFRS 16 at January 1, 2019:
Barrick operating lease commitments disclosed as at December 31, 2018 |
$ |
167 |
| |
Add: embedded service contracts not previously assessed as a lease | 38 | |||
(Less): contracts reassessed as service agreements | (130 | ) | ||
(Less): short-term leases recognized on a straight-line basis as expense | (6 | ) | ||
(Less):low-value leases recognized on a straight-line basis as expense | (1 | ) | ||
(Less): discounting using the lessee’s incremental borrowing rate of at January 1, 2019
| (4 | ) | ||
Discounted leases recognized as at January 1, 2019
| $ | 64 | ||
Add: finance lease liabilities recognized as at December 31, 2018 | 19 | |||
Add: leases acquired as part of the merger with Randgold on January 1, 2019 | 28 | |||
Discounted lease liability recognized as at January 1, 2019 | $ | 111 | ||
Of which are: | ||||
Current lease liabilities | 37 | |||
Non-current lease liabilities | $ | 74 |
The recognized right-of-use assets relate to the following types of assets:
March 31,
| January 1,
| |||||||
Buildings, Plant & Equipment | $ | 64 | $ | 69 | ||||
Underground mobile equipment | 7 | 7 | ||||||
Light vehicles and other mobile equipment | 7 | 9 | ||||||
Totalright-of-use assets
| $
| 78
|
| $
| 85
|
|
Right-of use assets were measured at the amount equal to the lease liability, except for onerous contracts.
The change in accounting policy affected the following items in the balance sheet on January 1, 2019:
• | property, plant and equipment - increase by $85 million |
• | deferred income tax assets - $nil |
• | debt - increase by $92 million |
There was no net impact on deficit on January 1, 2019.
Consolidated net income decreased by $1 million for the three months ended March 31, 2019 as a result of the adoption of IFRS 16.
Practical expedients applied
In applying IFRS 16 for the first time, we have used the following practical expedients permitted by the standard:
• | the accounting for operating leases with a remaining lease term of less than 12 months as at January 1, 2019 as short-term leases; |
• | the exclusion of initial direct costs for the measurement of theright-of-use asset at the date of initial application; |
• | the adjustment of theright-of-use assets at the date of initial application by the amount of any provision for onerous contracts recognized immediately before the date of initial application; and |
• | to not separatenon-lease components from lease components, and instead account for each lease component and any associatednon-lease components as a single lease component. |
3 > SIGNIFICANT JUDGMENTS, ESTIMATES, ASSUMPTIONS AND RISKS
The judgments, estimates, assumptions and risks discussed here reflect updates from the 2018 Annual Financial Statements. For judgments, estimates, assumptions and risks related to other areas not discussed in these interim consolidated financial statements, please refer to Notes 3 and 28 of the 2018 Annual Financial Statements.
A) Provision for Environmental Rehabilitation (“PER”)
Provisions are updated each reporting period for changes to expected cash flows and for the effect of changes in the discount rate and foreign exchange rate, and the change in estimate is added or deducted from the related asset and depreciated over the expected economic life of the operation to which it relates. We recorded a net increase of $202 million (2018: $106 million net decrease) to the PER at our minesites for the three months ended March 31, 2019 primarily due to a decrease in the discount rate and the
BARRICK FIRST QUARTER 2019 | 83 | NOTES TO FINANCIAL STATEMENTS (UNAUDITED) |
acquisition of Randgold Resources Limited (“Randgold”) on January 1, 2019.
Adjustments to the estimated amount and timing of future closure and rehabilitation cash flows are a normal occurrence in light of the significant judgments and estimates involved. Rehabilitation provisions are adjusted as a result of changes in estimates and assumptions and are accounted for prospectively. In the fourth quarter of each year, our life of mine plans are updated and that typically results in an update to the rehabilitation provision.
Under the Comprehensive Environmental Response, Compensation, and Liability Act of 1980 (“CERCLA”) and its state law equivalents, present or past owners of a property may be held jointly and severally liable for cleanup costs or forced to undertake remedial actions in response to unpermitted releases of hazardous substances at such property, in addition to, among other potential consequences, potential liability to governmental entities for the cost of damages to natural resources, which may be substantial. These subject properties are referred to as “superfund” sites. In addition to properties that have previously been designated as such, there is a chance that our current or legacy operations not currently designated as superfund sites in the U.S. could also be so designated as a superfund site in the future, exposing Barrick to potential further liability under CERCLA. The U.S. Environmental Protection Agency recently announced it is considering listing on the CERCLA National Priorities List a 322 square mile site in the San Mateo basin in New Mexico (“San Mateo Site”) due to alleged surface and ground water contamination from past uranium mining. The San Mateo Site includes legacy operations of our wholly owned subsidiary Homestake Mining Company of California.
B) Pascua-Lama
The Pascua-Lama project received $454 million as at March 31, 2019 (December 31, 2018: $443 million) in value added tax (“VAT”) refunds in Chile relating to the development of the Chilean side of the project. Under the current arrangement this amount plus interest of $362 million (December 31, 2018: $340 million) must be repaid if the project does not evidence exports for an amount of $3,538 million within a term that expires on December 31, 2026. The terms of the current VAT arrangement in Chile are applicable to either an open pit or an underground mine design. In addition, we have recorded $97 million in VAT recoverable in Argentina as at March 31, 2019 (December 31, 2018: $112 million) relating to the development of the Argentine side of the project. These amounts may not be recoverable if the project does not enter into production and are subject to foreign currency risk as the amounts are recoverable in Argentine pesos.
C) Contingencies
Contingencies can be either possible assets or possible liabilities arising from past events which, by their nature, will be resolved only when one or more future events, not wholly within our control, occur or fail to occur. The assessment of such contingencies inherently involves the exercise of significant judgment and estimates of the outcome of future events. Refer to note 17 for further details on contingencies.
D) Zambia Tax Matters
The mining taxes assessed to the Lumwana Mine have contradicted the Development Agreement that was finalized between Lumwana Mining Company Limited (“LMC”) and the Government of Zambia on December 16, 2005. In 2015, the Company began to take steps to preserve its rights under the Development Agreement and started to engage in formal discussions with the government to redress historical tax issues relating to the Development Agreement. On October 3, 2018, a deed of settlement was signed by the Government of Zambia and LMC. The deed provides that, within 30 days of the deed, LMC shall file tax returns for 2012 through 2017, and the government shall have the right to conduct and complete an audit of the returns within 60 days of the deed. LMC has filed the tax returns for 2012 through 2017 and the audit of these tax returns by the Zambian tax authority is expected to be completed in the second quarter of 2019.
4 > ACQUISITIONS AND DIVESTITURES
A) Randgold Resources Limited Merger
On January 1, 2019, we acquired 100% of the issued and outstanding shares of Randgold Resources Limited (the “Merger”). Each Randgold shareholder received 6.1280 common shares of Barrick for each Randgold share, which resulted in the issuance of 583,669,178 Barrick common shares. After this share issuance, Barrick shareholders owned 66.7%, while former Randgold shareholders owned 33.3%, of the shares of the combined company. We have determined that this transaction represents a business combination with Barrick identified as the acquirer. Based on the December 31, 2018 closing share price of Barrick’s common shares, the total consideration of the acquisition was $7.9 billion. We began consolidating the operating results, cash flows and net assets of Randgold from January 1, 2019.
Randgold was a publicly traded mining company with ownership interests in the following gold mines: Kibali in the Democratic Republic of Congo; Tongon in Côte d’Ivoire; Loulo-Gounkoto and Morila in Mali; and the Massawa project in Senegal. The following table includes the joint arrangement and entities other than 100% owned subsidiaries.
Place of business | Entity type | Economic interest1 | Method | |||||
Loulo | Mali | Subsidiary | 80% | Consolidation | ||||
Gounkoto | Mali | Subsidiary | 80% | Consolidation | ||||
Tongon | Côte d’Ivoire | Subsidiary | 89.7% | Consolidation | ||||
Kibali | Democratic Republic of Congo | JV | 45% | Equity Method | ||||
Morila | Mali | JV | 40% | Equity Method |
1 | Unless otherwise noted, all of our joint arrangements are funded by contributions made by the parties sharing joint control in proportion to their economic interest. |
BARRICK FIRST QUARTER 2019 | 84 | NOTES TO FINANCIAL STATEMENTS (UNAUDITED) |
The tables below present the purchase cost and our preliminary allocation of the purchase price to the assets and liabilities acquired. This allocation is preliminary as we have not had sufficient time to complete the valuation process. We anticipate there will be adjustments to the estimated fair values as the valuation work is finalized, which we expect to complete by the end of 2019.
Purchase Cost | ||||
Fair value of equity shares issued | $ | 7,903 | ||
Fair value of restricted shares issued | 6 | |||
Fair value of consideration | $ | 7,909 | ||
Preliminary Fair Value at Acquisition | ||||
Assets | ||||
Cash | $ | 751 | ||
Other current assets | 324 | |||
Equity in investees | 3,197 | |||
Property, plant and equipment | 3,930 | |||
Other assets | 231 | |||
Goodwill | 1,634 | |||
Total assets
| $ | 10,067 | ||
Liabilities | ||||
Current liabilities | $ | 448 | ||
Deferred income tax liabilities | 742 | |||
Provisions | 55 | |||
Debt1 | 31 | |||
Total liabilities | $ | 1,276 | ||
Non-controlling interests | 882 | |||
Net assets
| $ | 7,909 |
1 | Debt mainly relates to leases as a result of adopting IFRS16. |
In accordance with the acquisition method of accounting, the acquisition cost has been allocated to the underlying assets acquired and liabilities assumed, based primarily upon their estimated fair values at the date of acquisition. We primarily used a static discounted cash flow model (being the net
present value of expected future cash flows) to determine the fair value of the mining interests, and used a replacement cost approach in determining the fair value of buildings, plant and equipment. Expected future cash flows are based on estimates of projected future revenues, expected conversions of resources to reserves, expected future production costs and capital expenditures based on the life of mine plan as at the acquisition date. The excess of acquisition cost over the net identifiable assets acquired represents goodwill.
Goodwill arose on the acquisition principally because of the following factors: 1) it significantly strengthened Barrick’s position in the industry relative to high-quality gold reserves in many of the world’s most prolific gold districts, positioning the Company for sustainable growth; 2) it included the acquisition of a proven management team, with a shared vision and commitment to excellence, and a powerful financial base that will support sustainable investment in growth; and 3) the recognition of a deferred tax liability for the difference between the assigned values and the tax bases of assets acquired and liabilities assumed at amounts that do not reflect fair value. The goodwill is not deductible for income tax purposes.
The fair value of accounts receivable is $193 million, which is equivalent to the contractual amount.
Prior to the Merger, Randgold had received various tax claims from the State of Mali in respect of its Mali operations, which totaled $267.7 million as at January 1, 2019. The Company has recorded an estimated amount for the potential liability arising from certain specific elements of the Malian tax claims. Refer to note 17 for further details.
Since it has been consolidated from January 1, 2019, Randgold contributed revenue of $298 million and net income of $29 million.
Acquisition related costs of approximately $37 million were expensed in the prior year and were presented as part of corporate development costs in exploration, evaluation & project expense.
5 > SEGMENT INFORMATION
Starting in this first quarter of 2019, management reviews the operating results and assesses performance of our operations in Nevada at an individual minesite level; therefore our Cortez and Goldstrike minesites, previously presented as Barrick Nevada, have been presented separately. Prior period figures have been restated to reflect this disaggregation. Barrick’s business is organized into seventeen minesites, one publicly traded company and two projects. Barrick’s Chief Operating Decision Maker (“CODM”), reviews the operating results, assesses performance and makes capital allocation decisions at the minesite, grouping, Company and/or project level. Upon completion of the Merger, Mark Bristow, as President and Chief Executive Officer, assumed this role. Each individual minesite and the Pascua-Lama project, with the exception of Acacia, are operating segments for financial reporting purposes. Following the merger with Randgold, were-evaluated our reportable operating segments and no longer report on our interests in the followingnon-core properties: Lagunas Norte and Pascua-Lama. Our presentation of our reportable operating segments consists of seven gold mines (Cortez, Goldstrike, Turquoise Ridge, Pueblo Viejo, Loulo-Gounkoto, Kibali and Veladero) and Acacia. The remaining operating segments, including our remaining gold mines, copper mines and projects, have been grouped into an “other” category and will not be reported on individually. Segment performance is evaluated based on a number of measures including operating income before tax, production levels and unit production costs. Certain costs are managed on a consolidated basis and are therefore not reflected in segment income.
BARRICK FIRST QUARTER 2019 | 85 | NOTES TO FINANCIAL STATEMENTS (UNAUDITED) |
Consolidated Statement of Income Information
Cost of Sales | ||||||||||||||||||||||||
For the three months ended March 31, 2019 | Revenue | Direct mining, royalties and community relations | Depreciation | Exploration, evaluation and project expenses | Other expenses (income)1 | Segment income (loss) | ||||||||||||||||||
Cortez | $339 | $113 | $64 | $2 | $5 | $155 | ||||||||||||||||||
Goldstrike | 311 | 160 | 66 | 2 | — | 83 | ||||||||||||||||||
Turquoise Ridge | 100 | 39 | 6 | — | 1 | 54 | ||||||||||||||||||
Pueblo Viejo2 | 326 | 117 | 46 | 3 | 1 | 159 | ||||||||||||||||||
Loulo-Gounkoto2 | 210 | 110 | 59 | 2 | 3 | 36 | ||||||||||||||||||
Kibali | 117 | 52 | 56 | — | (1 | ) | 10 | |||||||||||||||||
Veladero | 91 | 51 | 30 | — | — | 10 | ||||||||||||||||||
Acacia2 | 138 | 92 | 25 | — | 20 | 1 | ||||||||||||||||||
Other Mines2,3,4 | 578 | 374 | 129 | 4 | 10 | 61 | ||||||||||||||||||
Reportable segment income | $2,210 | $1,108 | $481 | $13 | $39 | $569 | ||||||||||||||||||
Share of equity investees | (117 | ) | (52 | ) | (56 | ) | — | 1 | (10 | ) | ||||||||||||||
Segment income | $2,093 | $1,056 | $425 | $13 | $40 | $559 |
Consolidated Statement of Income Information
Cost of Sales | ||||||||||||||||||||||||
For the three months ended March 31, 2018 | Revenue | Direct mining, royalties and community relations | Depreciation | Exploration, evaluation and project expenses | Other expenses (income)1 | Segment income (loss) | ||||||||||||||||||
Cortez | $363 | $99 | $87 | $2 | $3 | $172 | ||||||||||||||||||
Goldstrike | 251 | 144 | 61 | — | (2 | ) | 48 | |||||||||||||||||
Turquoise Ridge | 84 | 38 | 7 | — | — | 39 | ||||||||||||||||||
Pueblo Viejo2 | 356 | 126 | 41 | 4 | — | 185 | ||||||||||||||||||
Loulo-Gounkoto2 | — | — | — | — | — | — | ||||||||||||||||||
Kibali | — | — | — | — | — | — | ||||||||||||||||||
Veladero | 101 | 45 | 31 | — | — | 25 | ||||||||||||||||||
Acacia2 | 157 | 86 | 24 | — | (24 | ) | 71 | |||||||||||||||||
Other Mines2,3,4 | 478 | 287 | 66 | 3 | 22 | 100 | ||||||||||||||||||
Reportable segment income | $1,790 | $825 | $317 | $9 | ($1 | ) | $640 | |||||||||||||||||
Share of equity investees | — | — | — | — | — | — | ||||||||||||||||||
Segment income | $1,790 | $825 | $317 | $9 | ($1 | ) | $640 |
1 | Includes accretion expense, which is included within finance costs in the consolidated statement of income. For the three months ended March 31, 2019, accretion expense was $14 million (2018: $12 million). |
2 | Includesnon-controlling interest portion of revenues, cost of sales and segment income for the three months ended March 31, 2019 for Pueblo Viejo $128 million, $65 million, $61 million (2018: $138 million, $66 million, $70 million), Loulo-Gounkoto $42 million, $34 million, $7 million (2018: $nil, $nil, $nil), Acacia $50 million, $42 million, $1 million (2018: $57 million, $40 million, $26 million) and Tongon $9 million, $11 million, $(2) million (2018: $nil, $nil, $nil). |
3 | Includes cost of sales of Pierina for the three months ended March 31, 2019 of $27 million (2018: $32 million). |
4 | Includes provisional pricing adjustments for the three months ended March 31, 2019 of $22 million gains (2018: $23 million losses). |
BARRICK FIRST QUARTER 2019 | 86 | NOTES TO FINANCIAL STATEMENTS (UNAUDITED) |
Reconciliation of Segment Income to Income Before Income Taxes
For the three months ended March 31 | ||||||||
2019 | 2018 | |||||||
Segment income | $559 | $640 | ||||||
Other cost of sales/amortization1 | (9 | ) | (10 | ) | ||||
Exploration, evaluation and project expenses not attributable to segments | (61 | ) | (64 | ) | ||||
General and administrative expenses | (54 | ) | (48 | ) | ||||
Other income (expense) not attributable to segments | (5 | ) | (19 | ) | ||||
Impairment charges not attributable to segments | (3 | ) | (2 | ) | ||||
Loss on currency translation | (22 | ) | (15 | ) | ||||
Closed mine rehabilitation | (25 | ) | 9 | |||||
Income from equity investees | 28 | 16 | ||||||
Finance costs, net (includesnon-segment accretion) | (102 | ) | (116 | ) | ||||
Gain onnon-hedge derivatives2 | 1 | 2 | ||||||
Income before income taxes | $307 | $393 |
1 | Includes realized hedge gains and losses for the three months ended March 31, 2019 of $nil losses (2018: $1 million losses). |
2 | Includes unrealizednon-hedge gains and losses for the three months ended March 31, 2019 of $1 million gains (2018: $nil losses). |
Capital Expenditures Information
Segment capital expenditures1 | ||||||||
For the three months ended March 31 | ||||||||
2019 | 2018 | |||||||
Cortez | $77 | $71 | ||||||
Goldstrike | 55 | 63 | ||||||
Turquoise Ridge | 26 | 13 | ||||||
Pueblo Viejo | 32 | 38 | ||||||
Loulo-Gounkoto | 50 | — | ||||||
Kibali | 10 | — | ||||||
Veladero | 29 | 31 | ||||||
Acacia | 16 | 26 | ||||||
Other Mines | 110 | 55 | ||||||
Reportable segment total | $405 | $297 | ||||||
Other items not allocated to segments | 43 | 34 | ||||||
Total | $448 | $331 | ||||||
Share of equity investees | ($10 | ) | $— | |||||
Total | $438 | $331 |
1 | Segment capital expenditures are presented for internal management reporting purposes on an accrual basis. Capital expenditures in the Consolidated Statements of Cash Flow are presented on a cash basis. For the three months ended March 31, 2019, cash expenditures were $374 million (2018: $326 million) and the increase in accrued expenditures was $64 million (2018: $5 million increase). |
Purchase Commitments
At March 31, 2019, we had purchase obligations for supplies and consumables of $1,836 million (December 31, 2018: $1,972 million).
Capital Commitments
In addition to entering into various operational commitments in the normal course of business, we had capital commitments of $84 million at March 31, 2019 (December 31, 2018: $82 million).
BARRICK FIRST QUARTER 2019 | 87 | NOTES TO FINANCIAL STATEMENTS (UNAUDITED) |
6 > REVENUE
For the three months ended March 31 | ||||||||
2019 | 2018 | |||||||
Gold sales | ||||||||
Spot market sales | $1,894 | $1,640 | ||||||
Concentrate sales | 12 | 3 | ||||||
Provisional pricing adjustments | — | — | ||||||
$1,906 | $1,643 | |||||||
Copper sales | ||||||||
Copper concentrate sales | $141 | $134 | ||||||
Provisional pricing adjustments | 22 | (23 | ) | |||||
$163 | $111 | |||||||
Other sales1 | 24 | 36 | ||||||
Total | $2,093 | $1,790 |
1 | Revenues include the sale of by-products for our gold and copper mines. |
7 > COST OF SALES
Gold | Copper | Other3 | Total | |||||||||||||||||||||||||||||
For the three months ended March 31 | 2019 | 2018 | 2019 | 2018 | 2019 | 2018 | 2019 | 2018 | ||||||||||||||||||||||||
Direct mining cost1,2 | $894 | $690 | $76 | $66 | $— | $2 | $970 | $758 | ||||||||||||||||||||||||
Depreciation | 384 | 298 | 42 | 19 | 9 | 8 | 435 | 325 | ||||||||||||||||||||||||
Royalty expense | 66 | 50 | 12 | 9 | — | — | 78 | 59 | ||||||||||||||||||||||||
Community relations | 6 | 8 | 1 | 2 | — | — | 7 | 10 | ||||||||||||||||||||||||
$1,350 | $1,046 | $131 | $96 | $9 | $10 | $1,490 | $1,152 |
1 | Direct mining cost includes charges to reduce the cost of inventory to net realizable value as follows: $4 million for the three months ended March 31, 2019 (2018: $3 million). |
2 | Direct mining cost includes the costs of extractingby-products. |
3 | Other includes realized hedge gains and losses and corporate amortization. |
8 > EARNINGS PER SHARE
For the three months ended March 31 | ||||||||||||||||
2019 | 2018 | |||||||||||||||
Basic | Diluted | Basic | Diluted | |||||||||||||
Net income | $140 | $140 | $192 | $192 | ||||||||||||
Net income attributable tonon-controlling interests | (29 | ) | (29 | ) | (34 | ) | (34 | ) | ||||||||
Net income attributable to equity holders of Barrick Gold Corporation | $111 | $111 | $158 | $158 | ||||||||||||
Weighted average shares outstanding | 1,745 | 1,746 | 1,167 | 1,167 | ||||||||||||
Earnings per share data attributable to the equity holders of Barrick Gold Corporation Net income | $0.06 | $0.06 | $0.14 | $0.14 |
BARRICK FIRST QUARTER 2019 | 88 | NOTES TO FINANCIAL STATEMENTS (UNAUDITED) |
9 > OTHER EXPENSE
A) Other Expense (Income)
For the three months ended March 31 | ||||||||
2019 | 2018 | |||||||
Other expense: | ||||||||
Bank charges | $5 | $7 | ||||||
Bulyanhulu reduced operations program cost1 | 6 | 8 | ||||||
Litigation | 10 | 27 | ||||||
Miscellaneous write-offs | 2 | 2 | ||||||
Acacia - other | 1 | 2 | ||||||
Other | 8 | 9 | ||||||
Total other expense | $32 | $55 | ||||||
Other income: | ||||||||
Gain on sale of long-lived assets | $— | ($46 | ) | |||||
Other | (5 | ) | (8 | ) | ||||
Total other income | ($5 | ) | ($54 | ) | ||||
Total | $27 | $1 |
1 | Primarily relates to care and maintenance costs. |
B) Impairment (Reversals) Charges
For the three months ended March 31 | ||||||||
2019 | 2018 | |||||||
Impairment (reversals) ofnon-current assets1 | $3 | $2 | ||||||
Total | $3 | $2 |
1 | Refer to note 13 for further details. |
10 > INCOME TAX EXPENSE
For the three months ended March 31 | ||||||||
2019 | 2018 | |||||||
Current | $130 | $133 | ||||||
Deferred | 37 | 68 | ||||||
$167 | $201 |
Income tax expense was $167 million for the three months ended March 31, 2019. The underlying effective tax rate for ordinary income for the three months ended March 31, 2019 was 43% after adjusting for the net impact of foreign currency translation losses on deferred tax balances; the impact ofnon-deductible foreign exchange losses, and the impact of other expense adjustments. The unadjusted tax rate for income for the three months ended March 31, 2019, was 54% of the income before income taxes.
Currency Translation
Deferred tax balances are subject to remeasurement for changes in currency exchange rates each period. The most significant balances are Argentine net deferred tax liabilities. In the three months ended March 31, 2019 and 2018, tax expense of $8 million and $4 million, respectively, primarily arose from translation losses on tax balances in Argentina, due to the weakening of the Argentine peso against the U.S. dollar. These translation losses are included within deferred income tax expense.
BARRICK FIRST QUARTER 2019 | 89 | NOTES TO FINANCIAL STATEMENTS (UNAUDITED) |
11 > CASH FLOW – OTHER ITEMS
Operating Cash Flows – Other Items | For the three months ended March 31 | |||||||
2019 | 2018 | |||||||
Adjustments fornon-cash income statement items: | ||||||||
Gain onnon-hedge derivatives | ($1 | ) | ($2 | ) | ||||
Share-based compensation expense | 12 | 2 | ||||||
Income from investment in equity investees | (28 | ) | (16 | ) | ||||
Change in estimate of rehabilitation costs at closed mines | 25 | (9 | ) | |||||
Net inventory impairment charges | — | 3 | ||||||
Change in other assets and liabilities | (22 | ) | (50 | ) | ||||
Settlement of rehabilitation obligations | (14 | ) | (16 | ) | ||||
Other operating activities | ($28 | ) | ($88 | ) | ||||
Cash flow arising from changes in: | ||||||||
Accounts receivable | $11 | $66 | ||||||
Inventory | (6 | ) | (76 | ) | ||||
Other current assets | (85 | ) | (62 | ) | ||||
Accounts payable | (123 | ) | (82 | ) | ||||
Other current liabilities | (41 | ) | 2 | |||||
Change in working capital | ($244 | ) | ($152 | ) | ||||
Investing Cash Flows – Other Items | For the three months ended March 31 | |||||||
2019 | 2018 | |||||||
Dividends received from equity method investments | $15 | $— | ||||||
Funding of equity method investments | — | (4 | ) | |||||
Shareholder loan repayments from equity method investments | 30 | — | ||||||
Other net investing activities | $45 | ($4 | ) |
12 > EQUITY ACCOUNTING METHOD INVESTMENT CONTINUITY
Kibali | Morila | Jabal Sayid | Zaldívar | Other | Total | |||||||||||||||||||
At January 1, 2018 | $— | $— | $206 | $975 | $32 | $1,213 | ||||||||||||||||||
Funds invested | — | — | — | — | 5 | 5 | ||||||||||||||||||
Equitypick-up (loss) from equity investees | — | — | 39 | 14 | (7 | ) | 46 | |||||||||||||||||
Impairment charges | — | — | — | — | (30 | ) | (30 | ) | ||||||||||||||||
At December 31, 2018 | $— | $— | $245 | $989 | $— | $1,234 | ||||||||||||||||||
Acquisitions | 3,140 | 4 | — | — | 53 | 3,197 | ||||||||||||||||||
Equitypick-up (loss) from equity investees | 13 | (2 | ) | 15 | 2 | — | 28 | |||||||||||||||||
Dividends received | (15 | ) | — | — | — | — | (15 | ) | ||||||||||||||||
At March 31, 2019 | $3,138 | $2 | $260 | $991 | $53 | $4,444 |
13 > IMPAIRMENT OF GOODWILL AND OTHER ASSETS
In accordance with our accounting policy, goodwill is tested for impairment in the fourth quarter and also when there is an indicator of impairment.Non-current assets are tested for impairment or impairment reversals when events or changes in circumstances suggest that the carrying amount may not be recoverable or is understated. Refer to note 21 of the 2018 Annual Financial Statements for further information.
For the three months ended March 31, 2019, we recorded impairments of $3 million (2018: $2 million impairments) fornon-current assets.
BARRICK FIRST QUARTER 2019 | 90 | NOTES TO FINANCIAL STATEMENTS (UNAUDITED) |
Indicators of impairment
First Quarter 2019
Lumwana
On September 28, 2018, as part of their 2019 budget, the Zambian government introduced changes to the current mining tax regime. The changes included an increase in royalty rates by 1.5%, the introduction of a 10% royalty on copper production if copper price increases above a certain price, the imposition of a 5% import duty on copper concentrates, thenon-deductibility of mineral royalties paid or payable for income tax purposes, and the replacement of the VAT with anon-refundable sales tax, although any outstanding VAT claims will be settled through the current refund mechanism. In the fourth quarter of 2018, the Zambian government finalized the changes to the current tax regime, which was effective January 1, 2019, with the exception of
the changes to thenon-refundable sales tax, which were expected to be finalized in the first quarter of 2019 and effective April 1, 2019. The finalization of the changes to the mining tax regime, excluding the changes to thenon-refundable sales tax, was considered an indicator of impairment and an impairment assessment was performed in the fourth quarter of 2018. In the first quarter of 2019, the changes to thenon-refundable sales tax were still subject to approval by Parliament and the tentative effective date has been delayed until July 1, 2019. We will assess the impact of thenon-refundable sales tax on the mine’s cash flows once the outcome is finalized.
14 > FINANCIAL INSTRUMENTS
Financial instruments include cash; evidence of ownership in an entity; or a contract that imposes an obligation on one party and conveys a right to a second party to deliver/receive cash or another financial instrument.
A) Cash and Equivalents
Cash and equivalents include cash, term deposits, treasury bills and money market funds with original maturities of less than 90 days. Cash and equivalents also include $484 million cash that is held in subsidiaries that have regulatory regulations or contractual restrictions, or operate in countries where exchange controls and other legal restrictions apply and are therefore not available for general use by the Company.
15 > FAIR VALUE MEASUREMENTS
A) Assets and Liabilities Measured at Fair Value on a Recurring Basis
As at March 31, 2019 | Quoted prices in active markets for identical assets
(Level 1) | Significant other observable inputs
(Level 2) | Significant unobservable inputs
(Level 3) |
Aggregate fair value | ||||
Cash and equivalents | $2,153 | $— | $— | $2,153 | ||||
Other investments | 207 | — | — | 207 | ||||
Derivatives | — | 2 | — | 2 | ||||
Receivables from provisional copper and gold sales | — | 78 | — | 78 | ||||
| $2,360 | $80 | $— | $2,440 |
B) Fair Values of Financial Assets and Liabilities
As at March 31, 2019 | As at December 31, 2018 | |||||||
Carrying amount |
Estimated | Carrying amount | Estimated fair value | |||||
Financial assets | ||||||||
Other assets1 | $524 | $524 | $559 | $559 | ||||
Other investments2 | 207 | 207 | 209 | 209 | ||||
Derivative assets | 2 | 2 | 3 | 3 | ||||
$733 | $733 | $771 | $771 | |||||
Financial liabilities | ||||||||
Debt3 | $5,807 | $6,594 | $5,738 | $6,183 | ||||
Derivative liabilities | — | — | 3 | 3 | ||||
Other liabilities | 533 | 533 | 297 | 297 | ||||
$6,340 | $7,127 | $6,038 | $6,483 |
1 | Includes restricted cash and amounts due from our partners. |
2 | Recorded at fair value. Quoted market prices are used to determine fair value. |
3 | Debt is generally recorded at amortized cost. The fair value of debt is primarily determined using quoted market prices. Balance includes both current and long-term portions of debt. |
We do not offset financial assets with financial liabilities.
The Company’s valuation techniques were presented in Note 26 of the 2018 Annual Financial Statements and have been consistently applied in these interim financial statements.
BARRICK FIRST QUARTER 2019 | 91 | NOTES TO FINANCIAL STATEMENTS (UNAUDITED) |
16 > CAPITAL STOCK
A) Authorized Capital Stock
Our authorized capital stock is composed of an unlimited number of common shares (issued 1,751,981,799 common shares as at March 31, 2019). Our common shares have no par value.
On January 1, 2019, we issued 583,669,178 common shares to Randgold shareholders as a result of the Merger. Refer to note 4A for further details.
B) Dividends
The Company’s practice has been to declare dividends after a quarter in the announcement of the results for the quarter. Dividends declared are paid in the same quarter. However, during the first quarter of 2019, $76.3 million in dividends were paid in relation to the additional dividend that was declared in the fourth quarter of 2018. In addition, the Company paid $256.2 million in dividends that were declared by Randgold in the fourth quarter of 2018.
The Company’s dividend reinvestment plan resulted in 465,711 common shares issued to shareholders for the three months ended March 31, 2019.
17 > CONTINGENCIES
Certain conditions may exist as of the date the financial statements are issued that may result in a loss to the Company, but which will only be resolved when one or more future events occur or fail to occur. The impact of any resulting loss from such matters affecting these financial statements and noted below may be material.
Except as noted below, no material changes have occurred with respect to the matters disclosed in Note 36 “Contingencies” to the 2018 Annual Financial Statements, and no new contingencies have occurred that are material to the Company since the issuance of the 2018 Annual Financial Statements.
The description set out below should be read in conjunction with Note 36 “Contingencies” to the 2018 Annual Financial Statements.
Litigation and Claims Update
Proposed Canadian Shareholder Class Action (Veladero)
On April 11, 2019, Barrick received an offer from the plaintiff to dismiss the proposed class action lawsuit without costs. Ontario Superior Court of Justice approval of the offer to dismiss is pending.
Pascua-Lama - SMA Regulatory Sanctions
On March 14, 2019, the Chilean Supreme Court annulled the October 12, 2018 administrative decision of the Antofagasta Environmental Court on procedural grounds and remanded the case back to the Environmental Court for review by a different panel of judges. The Chilean Supreme Court did not review the merits of the Revised Resolution, which remains in effect. CMN’s appeal of the Revised Resolution remains pending before the new panel of judges ordered by the Chilean Supreme Court. The Company intends to vigorously defend this matter and continues to evaluate all its legal options.
Pascua-Lama – Water Quality Review
On February 19, 2019, the Chilean Supreme Court accepted the appeal by the indigenous residents of the Environmental Court’s decision. No hearing dates have yet been set. No amounts have been recorded for any potential liability arising from this matter, as the Company cannot reasonably predict any potential losses.
Veladero – Tax Assessment and Criminal Charges
Hearings for the Criminal Tax case were held between March 25 and March 27, 2019. The defendants filed a motion to dismiss based on the statute of limitations, which was granted in part and which has been appealed by the prosecution.
The Company filed Mutual Agreement Procedure applications in Canada on December 21, 2018, and in Argentina on March 29, 2019, pursuant to the Canada-Argentina Income Tax Convention Act (the “Canada-Argentina Tax Treaty”) to escalate resolution of the Tax Assessment to the competent authority (as defined in the Canada-Argentina Tax Treaty) in an effort to seek efficient resolution of the matter.
The Company believes that the Tax Assessment and the Criminal Tax Case are without merit and intends to defend the proceedings vigorously. No amounts have been recorded for any potential liability arising from the Tax Assessment or the Criminal Tax Case, as the Company cannot reasonably predict the outcome.
Writ of Kalikasan
On March 20, 2019, the Company was notified that the Court of Appeals granted a motion by the Petitioners to lift the Suspension of Proceedings and denied the motion to intervene filed by the two baranguays. A preliminary hearing date has yet to be scheduled. No decision has been issued with respect to the Urgent Motion for Ruling on Jurisdiction or certain other matters before the Philippine Supreme Court. The Company intends to continue to defend the action vigorously.
Malian Tax Dispute
Prior to the Merger, Randgold had received various tax claims from the State of Mali in respect of its Mali operations, which totaled $267.7 million at January 1, 2019. Each of Loulo and Gounkoto (which together form the Loulo-Gounkoto complex) and Morila have separate legally binding establishment conventions with the State of Mali, which guarantee fiscal stability, govern applicable taxes and allow for international arbitration in the event of disputes. Barrick considers the claims to be without merit under the terms of the applicable establishment conventions. The Company continues to engage with the Malian authorities to resolve these outstanding fiscal issues. The Company has recorded an estimated amount for the potential liability arising from certain specific elements of the Malian tax claims. However, no amounts have been recorded for any potential liability or asset impairment arising from the material claims asserted by the State of Mali, as the Company cannot reasonably predict the outcome.
During 2016, Randgold also received payment demands in respect of these disputed amounts, and consequently, from 2016 up to December 2018, Randgold paid tax advances to the State of Mali to support the resolution of the tax disputes, which after offsetting other tax payments resulted in a
BARRICK FIRST QUARTER 2019 | 92 | NOTES TO FINANCIAL STATEMENTS (UNAUDITED) |
receivable being recorded of $41.1 million. As part of the purchase price allocation for the Merger (see note 4), the fair value of this receivable has been reduced to $nil.
Acacia Mining plc – Concentrate Export Ban and Related Disputes
On February 20, 2019, Barrick announced that it had arrived at a proposal that sets forth the commercial terms to resolve outstanding disputes concerning Acacia’s operations in Tanzania. The proposal is consistent with the October 19, 2017 framework. Work is underway to finalize the definitive agreements needed to give effect to the proposal. In order to become effective, the proposal and those agreements must be approved by Acacia and the Government of Tanzania, in keeping with applicable laws and regulations.
BARRICK FIRST QUARTER 2019 | 93 | NOTES TO FINANCIAL STATEMENTS (UNAUDITED) |
Corporate Office | Enquiries | |
Barrick Gold Corporation 161 Bay Street, Suite 3700 Toronto, Ontario M5J 2S1 Canada | President and Chief Executive Officer Mark Bristow +1 647 205 7694 +44 788 071 1386 | |
Telephone: +1 416 861-9911 Email: investor@barrick.com Website: www.barrick.com | Senior Executive Vice-President and Chief Financial Officer Graham Shuttleworth +44 1534 735 333 +44 779 771 1338 | |
Shares Listed
GOLD The New York Stock Exchange ABX The Toronto Stock Exchange | Investor and Media Relations Kathy du Plessis +44 20 7557 7738 Email: barrick@dpapr.com | |
Transfer Agents and Registrars
AST Trust Company (Canada) P.O. Box 700, Postal Station B Montreal, Quebec H3B 3K3 or American Stock Transfer & Trust Company, LLC 6201 – 15 Avenue Brooklyn, New York 11219
Telephone:1-800-387-0825 Fax:1-888-249-6189 Email: inquiries@astfinancial.com Website: www.astfinancial.com | ||
Cautionary Statement on Forward-Looking Information |
Certain information contained or incorporated by reference in this press release, including any information as to our strategy, projects, plans, or future financial or operating performance, constitutes “forward-looking statements”. All statements, other than statements of historical fact, are forward-looking statements. The words “believe”, “expect”, “anticipate”, “plan”, “assume”, “intend”, “project”, “continue”, “budget”, “estimate”, “potential”, “may”, “will”, “can”, “should”, “could”, “would”, and similar expressions identify forward-looking statements. In particular, this press release contains forward-looking statements including, without limitation, with respect to: our goal of being the world’s most valued gold company; our ability to meet our business objectives; investment and other opportunities that are available to us; our ability to deliver long-term benefits to host countries and communities; potential mineralization; potential consolidation of the Fourmile project and Goldrush and
the value of such a consolidation; the development of potential Tier One gold assets to become Tier One gold assets, including Fourmile and Turquoise Ridge; expected extensions to the life of mine at Kibali and the potential to replenish reserves and resources as a result of recent discoveries; forward-looking production guidance in respect of Kibali; the potential for new mines in the Democratic Republic of Congo; and potential partnerships and engagement with the Congolese government.
Forward-looking statements are necessarily based upon a number of estimates and assumptions including material estimates and assumptions related to the factors set forth below that, while considered reasonable by the Company as at the date of this press release in light of management’s experience and perception of current conditions and expected developments, are inherently subject to significant
business, economic and competitive uncertainties and contingencies. Known and unknown factors could cause actual results to differ materially from those projected in the forward-looking statements, and undue reliance should not be placed on such statements and information. Such factors include, but are not limited to: fluctuations in the spot and forward price of gold, copper, or certain other commodities (such as silver, diesel fuel, natural gas, and electricity); the speculative nature of mineral exploration and development; changes in mineral production performance, exploitation, and exploration successes; risks associated with projects in the early stages of evaluation, and for which additional engineering and other analysis is required to fully assess their impact; the duration of the Tanzanian ban on mineral concentrate exports; the ultimate terms of any definitive agreement between Acacia and the Government of Tanzania to resolve a dispute relating to the imposition of the concentrate export ban and allegations by the Government of Tanzania that Acacia under-declared the metal content of concentrate exports from Tanzania and related matters; whether Acacia will approve the terms of any final agreement reached between Barrick and the Government of Tanzania with respect to the dispute between Acacia and the Government of Tanzania; the ability to realize the anticipated benefits of the proposed Nevada joint venture (including estimated synergies and financial benefits) or implementing the business plan for the proposed Nevada joint venture, including as a result of a delay in its completion or difficulty in integrating the Nevada assets of the companies involved; the risk that the conditions to formation of the proposed Nevada joint venture will not be satisfied; the timing for closing of the Nevada joint venture; the benefits expected from recent transactions being realized, including the Randgold merger; diminishing quantities or grades of reserves; increased costs, delays, suspensions and technical challenges associated with the construction of capital projects; operating or technical difficulties in connection with mining or development activities, including geotechnical challenges and disruptions in the maintenance or provision of required infrastructure and information technology systems; failure to comply with environmental and health and safety laws and regulations; timing of receipt of, or failure to comply with, necessary permits and approvals; uncertainty whether some or all of targeted investments and projects will meet the Company’s capital allocation objectives and internal hurdle rate; the impact of global liquidity and credit availability on the timing of cash flows and the values of assets and liabilities based on projected future cash flows; adverse changes in our credit ratings; the impact of inflation; fluctuations in the currency markets; changes in U.S. dollar interest rates; risks arising from holding derivative instruments; changes in national and local government legislation, taxation, controls or regulations and/ or changes in the administration of laws, policies and practices, expropriation or nationalization of property and political or economic developments in Canada, the United States, and other
jurisdictions in which the Company or its affiliates do or may carry on business in the future; lack of certainty with respect to foreign legal systems, corruption and other factors that are inconsistent with the rule of law; damage to the Company’s reputation due to the actual or perceived occurrence of any number of events, including negative publicity with respect to the Company’s handling of environmental matters or dealings with community groups, whether true or not; the possibility that future exploration results will not be consistent with the Company’s expectations; risks that exploration data may be incomplete and considerable additional work may be required to complete further evaluation, including but not limited to drilling, engineering and socioeconomic studies and investment; risk of loss due to acts of war, terrorism, sabotage and civil disturbances; litigation and legal and administrative proceedings; contests over title to properties, particularly title to undeveloped properties, or over access to water, power and other required infrastructure; business opportunities that may be presented to, or pursued by, the Company; our ability to successfully integrate acquisitions or complete divestitures; risks associated with working with partners in jointly controlled assets; employee relations including loss of key employees; increased costs and physical risks, including extreme weather events and resource shortages, related to climate change; availability and increased costs associated with mining inputs and labor. In addition, there are risks and hazards associated with the business of mineral exploration, development and mining, including environmental hazards, industrial accidents, unusual or unexpected formations, pressures,cave-ins, flooding and gold bullion, copper cathode or gold or copper concentrate losses (and the risk of inadequate insurance, or inability to obtain insurance, to cover these risks).
Many of these uncertainties and contingencies can affect our actual results and could cause actual results to differ materially from those expressed or implied in any forward-looking statements made by, or on behalf of, us. Readers are cautioned that forward-looking statements are not guarantees of future performance. All of the forward-looking statements made in this press release are qualified by these cautionary statements. Specific reference is made to the most recent Form40-F/Annual Information Form on file with the SEC and Canadian provincial securities regulatory authorities for a more detailed discussion of some of the factors underlying forward-looking statements and the risks that may affect Barrick’s ability to achieve the expectations set forth in the forward-looking statements contained in this press release.
The Company disclaims any intention or obligation to update or revise any forward-looking statements whether as a result of new information, future events or otherwise, except as required by applicable law.