Exhibit 99.2
MANAGEMENT’S DISCUSSION AND ANALYSIS (“MD&A”)
QUARTERLY REPORT ON THE THIRD QUARTER OF 2019
This portion of the Quarterly Report provides management’s discussion and analysis (“MD&A”) of the financial condition and results of operations, to enable a reader to assess material changes in financial condition and results of operations as at, and for the three and nine month periods ended September 30, 2019, in comparison to the corresponding prior-year periods. The MD&A is intended to help the reader understand Barrick Gold Corporation (“Barrick”, “we”, “our” or the “Company”), our operations, financial performance and present and future business environment. This MD&A, which has been prepared as of November 5, 2019, is intended to supplement and complement the condensed unaudited interim consolidated financial statements and notes thereto, prepared in accordance with International Accounting Standard 34 Interim Financial Reporting (“IAS 34”) as issued by the International Accounting Standards Board (“IASB”), for the three and nine month periods ended September 30, 2019 (collectively, the “Financial Statements”), which are included in this Quarterly Report on pages 102 to 123. You are encouraged to review the Financial Statements in conjunction with your review of this MD&A. This MD&A should be read in conjunction with both the annual audited consolidated financial statements for the two years ended December 31, 2018, the related annual MD&A included in the 2018 Annual Report, and the most
recent Form 40–F/Annual Information Form on file with the U.S. Securities and Exchange Commission (“SEC”) and Canadian provincial securities regulatory authorities. These documents and additional information relating to the Company are available on SEDAR at www.sedar.com and EDGAR at www.sec.gov. Certain notes to the Financial Statements are specifically referred to in this MD&A and such notes are incorporated by reference herein. All dollar amounts in this MD&A are in millions of United States dollars (“$” or “US$”), unless otherwise specified.
For the purposes of preparing our MD&A, we consider the materiality of information. Information is considered material if: (i) such information results in, or would reasonably be expected to result in, a significant change in the market price or value of our shares; or (ii) there is a substantial likelihood that a reasonable investor would consider it important in making an investment decision; or (iii) it would significantly alter the total mix of information available to investors. We evaluate materiality with reference to all relevant circumstances, including potential market sensitivity.
CAUTIONARY STATEMENT ON FORWARD-LOOKING INFORMATION
Certain information contained or incorporated by reference in this MD&A, including any information as to our strategy, projects, plans or future financial or operating performance, constitutes “forward-looking statements”. All statements, other than statements of historical fact, are forward-looking statements. The words “believe”, “expect”, “anticipate”, “target”, “plan”, “objective”, “assume”, “intend”, “project”, “pursue”, “goal”, “continue”, “budget”, “estimate”, “potential”, “may”, “will”, “can”, “could”, “would”, “should” and similar expressions identify forward-looking statements. In particular, this MD&A contains forward-looking statements including, without limitation, with respect to: (i) Barrick’s forward-looking production guidance; (ii) estimates of future cost of sales per ounce for gold and per pound for copper, total cash costs per ounce and C1 cash costs per pound, andall-in-sustaining costs per ounce/pound; (iii) cash flow forecasts; (iv) projected capital, operating and exploration expenditures; (v) mine life and production rates; (vi) estimated timing for construction of, and production from, new projects; (vii) anticipated gold production from the Deep South Project; (viii) timing of completion of a feasibility study for Goldrush and Fourmile and timing of approval of the plan of operations; (ix) the potential for plant expansion at Pueblo Viejo to increase throughput and convert resources into reserves; (x) the new partnership between Barrick and the Government of Tanzania (“GoT”) and the agreement to resolve all outstanding disputes between Acacia and the GoT; (xi) expected agreement with the government of Papua New Guinea regarding an extension of Porgera’s special mining lease; (xii) expected timing for completion of refurbishments at one of the smelters that processes Lumwana concentrate; (xiii) our pipeline of high confidence projects at or near existing operations; (xiv)
potential mineralization and metal or mineral recoveries; (xv) our ability to convert resources into reserves; (xvi) asset sales, joint ventures and partnerships, including with respect to Kalgoorlie; and (xvii) expectations regarding future price assumptions, financial performance and other outlook or guidance.
Forward-looking statements are necessarily based upon a number of estimates and assumptions including material estimates and assumptions related to the factors set forth below that, while considered reasonable by the Company as at the date of this MD&A in light of management’s experience and perception of current conditions and expected developments, are inherently subject to significant business, economic and competitive uncertainties and contingencies. Known and unknown factors could cause actual results to differ materially from those projected in the forward-looking statements and undue reliance should not be placed on such statements and information. Such factors include, but are not limited to: fluctuations in the spot and forward price of gold, copper or certain other commodities (such as silver, diesel fuel, natural gas and electricity); the speculative nature of mineral exploration and development; changes in mineral production performance, exploitation and exploration successes; risks associated with projects in the early stages of evaluation and for which additional engineering and other analysis is required; whether the agreement to settle all disputes between Acacia and the GoT will be legalized and executed by the GoT; the Company’s ability to successfullyre-integrate Acacia’s operations; the benefits expected from recent transactions being realized, including Nevada Gold Mines; diminishing quantities or grades of reserves; increased
| BARRICK THIRD QUARTER 2019 | 28 | MANAGEMENT’S DISCUSSION AND ANALYSIS |
costs, delays, suspensions and technical challenges associated with the construction of capital projects; operating or technical difficulties in connection with mining or development activities, including geotechnical challenges and disruptions in the maintenance or provision of required infrastructure and information technology systems; failure to comply with environmental and health and safety laws and regulations;non-renewal of key licenses by governmental authorities; timing of receipt of, or failure to comply with, necessary permits and approvals; uncertainty whether some or all of Barrick’s targeted investments and projects will meet the Company’s capital allocation objectives and internal hurdle rate; the impact of global liquidity and credit availability on the timing of cash flows and the values of assets and liabilities based on projected future cash flows; adverse changes in our credit ratings; the impact of inflation; fluctuations in the currency markets; changes in U.S. dollar interest rates; risks arising from holding derivative instruments; changes in national and local government legislation, taxation, controls or regulations and/or changes in the administration of laws, policies and practices, expropriation or nationalization of property and political or economic developments in Canada, the United States and other jurisdictions in which the Company or its affiliates do or may carry on business in the future; lack of certainty with respect to foreign legal systems, corruption and other factors that are inconsistent with the rule of law; risks associated with illegal and artisanal mining; the risks of operating in jurisdictions where infectious diseases present major health care issues; disruption of supply routes which may cause delays in construction and mining activities; damage to the Company’s reputation due to the actual or perceived occurrence of any number of events, including negative publicity with respect to the Company’s handling of environmental matters or dealings with community groups, whether true or not; the possibility that future exploration results will not be consistent with the Company’s expectations; risks that exploration data may be incomplete and considerable additional work may be required to complete further evaluation, including but not limited to drilling, engineering and socioeconomic studies and investment; risk
of loss due to acts of war, terrorism, sabotage and civil disturbances; litigation and legal and administrative proceedings; contests over title to properties, particularly title to undeveloped properties, or over access to water, power and other required infrastructure; business opportunities that may be presented to, or pursued by, the Company; our ability to successfully integrate acquisitions or complete divestitures; risks associated with working with partners in jointly controlled assets; employee relations including loss of key employees; increased costs and physical risks, including extreme weather events and resource shortages, related to climate change; and availability and increased costs associated with mining inputs and labor. In addition, there are risks and hazards associated with the business of mineral exploration, development and mining, including environmental hazards, industrial accidents, unusual or unexpected formations, pressures,cave-ins, flooding and gold bullion, copper cathode or gold or copper concentrate losses (and the risk of inadequate insurance, or inability to obtain insurance, to cover these risks).
Many of these uncertainties and contingencies can affect our actual results and could cause actual results to differ materially from those expressed or implied in any forward-looking statements made by, or on behalf of, us. Readers are cautioned that forward-looking statements are not guarantees of future performance. All of the forward-looking statements made in this MD&A are qualified by these cautionary statements. Specific reference is made to the most recent Form40-F/Annual Information Form on file with the SEC and Canadian provincial securities regulatory authorities for a more detailed discussion of some of the factors underlying forward-looking statements and the risks that may affect Barrick’s ability to achieve the expectations set forth in the forward-looking statements contained in this MD&A. We disclaim any intention or obligation to update or revise any forward-looking statements whether as a result of new information, future events or otherwise, except as required by applicable law.
| BARRICK THIRD QUARTER 2019 | 29 | MANAGEMENT’S DISCUSSION AND ANALYSIS |
MERGER WITH RANDGOLD RESOURCES LIMITED
On January 1, 2019, Barrick acquired 100% of the issued and outstanding shares of Randgold Resources Limited (“Randgold”) for $7.9 billion based on the December 31, 2018 closing share price of Barrick’s common shares (the “Merger”). We began consolidating the operating results, cash flows and net assets of Randgold from January 1, 2019 and the results presented in this MD&A reflect that. Refer to note 4 of the Financial Statements for further details of this transaction.
USE OFNON-GAAP FINANCIAL PERFORMANCE MEASURES
We use the followingnon-GAAP financial performance measures in our MD&A:
| • | “adjusted net earnings” |
| • | “free cash flow” |
| • | “EBITDA” |
| • | “adjusted EBITDA” |
| • | “total cash costs per ounce” |
| • | “C1 cash costs per pound” |
| • | “all-in sustaining costs per ounce/pound” |
| • | “all-in costs per ounce” and |
| • | “realized price” |
For a detailed description of each of thenon-GAAP financial performance measures used in this MD&A and a detailed reconciliation to the most directly comparable measure under International Financial Reporting Standards (“IFRS”), please refer to theNon-GAAP Financial Performance Measures section of this MD&A on pages 77 to 98. Eachnon-GAAP financial performance measure has been annotated with a reference to an endnote on page 99. Thenon-GAAP financial performance measures set out in this MD&A are intended to provide additional information to investors and do not have any standardized meaning under IFRS, and therefore may not be comparable to other issuers, and should not be considered in isolation or as a substitute for measures of performance prepared in accordance with IFRS.
Changes in Presentation ofNon-GAAP Financial Performance Measures
Total cash costs
Starting from the first quarter of 2019, we have renamed “cash costs” to “total cash costs” when referring to our gold operations. The calculation of total cash costs is identical to our previous calculation of cash costs with only a change in the naming convention of thisnon-GAAP measure.
All-in sustaining costs andall-in costs
Starting from the first quarter of 2019, we have included sustaining capital expenditures and project capital expenditures on a cash basis instead of an accrual basis. As a result of adopting IFRS 16Leases, the full lease amount is included in accrued capital expenditures on initial recognition. We believe that the change in capital expenditures from an accrual basis to a cash basis better reflects the timing of costs associated with our operations. The original World Gold Council (“WGC”) Guidance Note explicitly excluded certain financing activities fromall-in sustaining costs andall-in costs. As a result of the new lease accounting standard, the WGC Guidance Note was updated to include both the principal and interest portion of the cash lease payment in theall-in sustaining costs andall-in cost metrics. We have updated our calculation accordingly. Prior periods have not been restated but would not be materially different.
| INDEX | page | |||
| Overview | ||||
Financial and Operating Highlights | 31 | |||
Key Business Developments | 35 | |||
Full Year 2019 Outlook | 37 | |||
Production and Cost Summary | 39 | |||
| Operating Divisions Performance | 41 | |||
Nevada Gold Mines LLC | 42 | |||
Cortez | 43 | |||
Carlin | 45 | |||
Turquoise Ridge | 47 | |||
Other Mines | 49 | |||
Pueblo Viejo | 50 | |||
Loulo-Gounkoto | 52 | |||
Kibali | 53 | |||
Veladero | 55 | |||
Tanzania | 57 | |||
Other Mines | 60 | |||
Projects | 62 | |||
Exploration | 63 | |||
| Review of Financial Results | 65 | |||
Revenue | 65 | |||
Production Costs | 67 | |||
Capital Expenditures | 68 | |||
General and Administrative Expenses | 69 | |||
Exploration, Evaluation and Project Expenses | 70 | |||
Finance Costs, Net | 70 | |||
Additional Significant Statement of Income Items | 71 | |||
Income Tax Expense | 72 | |||
| Financial Condition Review | 73 | |||
Balance Sheet Review | 73 | |||
Shareholders’ Equity | 73 | |||
Financial Position and Liquidity | 73 | |||
Summary of Cash Inflow (Outflow) | 74 | |||
| Commitments and Contingencies | 75 | |||
| Review of Quarterly Results | 76 | |||
| Internal Control over Financial Reporting and Disclosure Controls and Procedures | 76 | |||
| IFRS Critical Accounting Policies and Accounting Estimates | 77 | |||
| Non-GAAP Financial Performance Measures | 77 | |||
| Technical Information | 99 | |||
| Endnotes | 99 | |||
| Financial Statements | 102 | |||
| Notes to Consolidated Financial Statements | 107 | |||
| BARRICK THIRD QUARTER 2019 | 30 | MANAGEMENT’S DISCUSSION AND ANALYSIS |
OVERVIEW
Financial and Operating Highlights
| For the three months ended | For the nine months ended | |||||||||||||||||||||||||||||||
| 9/30/19 | 6/30/19 | % Change | 9/30/18 | % Change | 9/30/19 | 9/30/18 | % Change | |||||||||||||||||||||||||
Financial Results($ millions) | ||||||||||||||||||||||||||||||||
Revenues | 2,678 | 2,063 | 30 | % | 1,837 | 46 | % | 6,834 | 5,339 | 28 | % | |||||||||||||||||||||
Cost of sales | 1,889 | 1,545 | 22 | % | 1,315 | 44 | % | 4,924 | 3,643 | 35 | % | |||||||||||||||||||||
Net earnings (loss)a | 2,277 | 194 | 1,074 | % | (412 | ) | 653 | % | 2,582 | (348 | ) | 842 | % | |||||||||||||||||||
Adjusted net earningsb | 264 | 154 | 71 | % | 89 | 197 | % | 602 | 340 | 77 | % | |||||||||||||||||||||
Adjusted EBITDAb | 1,297 | 972 | 33 | % | 776 | 67 | % | 3,271 | 2,274 | 44 | % | |||||||||||||||||||||
Adjusted EBITDA marginc | 48 | % | 47 | % | 2 | % | 42 | % | 14 | % | 48 | % | 43 | % | 12 | % | ||||||||||||||||
Total capital expenditures - sustainingd | 406 | 267 | 52 | % | 256 | 59 | % | 926 | 701 | 32 | % | |||||||||||||||||||||
Total project capital expendituresd | 96 | 108 | (11 | )% | 131 | (27 | )% | 324 | 325 | 0 | % | |||||||||||||||||||||
Total consolidated capital expendituresd,e | 502 | 379 | 32 | % | 387 | 30 | % | 1,255 | 1,026 | 22 | % | |||||||||||||||||||||
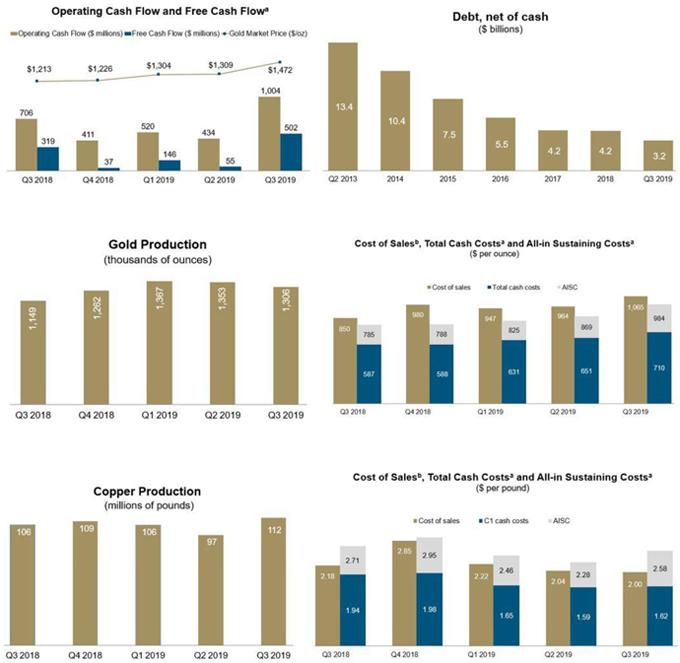
Net cash provided by operating activities | 1,004 | 434 | 131 | % | 706 | 42 | % | 1,958 | 1,354 | 45 | % | |||||||||||||||||||||
Net cash provided by operating activities marginf | 37 | % | 21 | % | 76 | % | 38 | % | (3 | )% | 29 | % | 25 | % | 16 | % | ||||||||||||||||
Free cash flowb | 502 | 55 | 813 | % | 319 | 57 | % | 703 | 328 | 114 | % | |||||||||||||||||||||
Net earnings (loss) per share (basic and diluted) | 1.30 | 0.11 | 1,082 | % | (0.35 | ) | 471 | % | 1.47 | (0.30 | ) | 590 | % | |||||||||||||||||||
Adjusted net earnings (basic)bper share | 0.15 | 0.09 | 67 | % | 0.08 | 88 | % | 0.34 | 0.29 | 17 | % | |||||||||||||||||||||
Weighted average diluted common shares (millions of shares) | 1,756 | 1,752 | 0 | % | 1,167 | 50 | % | 1,751 | 1,167 | 50 | % | |||||||||||||||||||||
Operating Results | ||||||||||||||||||||||||||||||||
Gold production (thousands of ounces)g | 1,306 | 1,353 | (3 | )% | 1,149 | 14 | % | 4,026 | 3,265 | 23 | % | |||||||||||||||||||||
Gold sold (thousands of ounces)g | 1,318 | 1,372 | (4 | )% | 1,204 | 9 | % | 4,055 | 3,312 | 22 | % | |||||||||||||||||||||
Market gold price ($/oz) | 1,472 | 1,309 | 12 | % | 1,213 | 21 | % | 1,364 | 1,282 | 6 | % | |||||||||||||||||||||
Realized gold priceb,g($/oz) | 1,476 | 1,317 | 12 | % | 1,216 | 21 | % | 1,365 | 1,284 | 6 | % | |||||||||||||||||||||
Gold cost of sales (Barrick’s share)g,h($/oz) | 1,065 | 964 | 10 | % | 850 | 25 | % | 991 | 859 | 15 | % | |||||||||||||||||||||
Gold total cash costsb,g($/oz) | 710 | 651 | 9 | % | 587 | 21 | % | 663 | 588 | 13 | % | |||||||||||||||||||||
Goldall-in sustaining costsb,g($/oz) | 984 | 869 | 13 | % | 785 | 25 | % | 883 | 813 | 9 | % | |||||||||||||||||||||
Copper production (millions of pounds)i | 112 | 97 | 15 | % | 106 | 6 | % | 315 | 274 | 15 | % | |||||||||||||||||||||
Copper sold (millions of pounds)i | 65 | 96 | (32 | )% | 114 | (43 | )% | 264 | 273 | (3 | )% | |||||||||||||||||||||
Market copper price ($/lb) | 2.63 | 2.77 | (5 | )% | 2.77 | (5 | )% | 2.74 | 3.01 | (9 | )% | |||||||||||||||||||||
Realized copper priceb,i($/lb) | 2.55 | 2.62 | (3 | )% | 2.76 | (8 | )% | 2.78 | 2.92 | (5 | )% | |||||||||||||||||||||
Copper cost of sales (Barrick’s share)i,j($/lb) | 2.00 | 2.04 | (2 | )% | 2.18 | (8 | )% | 2.10 | 2.22 | (5 | )% | |||||||||||||||||||||
Copper C1 cash costsb,i($/lb) | 1.62 | 1.59 | �� | 2 | % | 1.94 | (16 | )% | 1.62 | 1.97 | (18 | )% | ||||||||||||||||||||
Copperall-in sustaining costsb,i($/lb) | 2.58 | 2.28 | 13 | % | 2.71 | (5 | )% | 2.42 | 2.76 | (12 | )% | |||||||||||||||||||||
| As at 9/30/19 | As at 6/30/19 | % Change | As at 9/30/18 | % Change | ||||||||||||||||||||||||||||
Financial Position($ millions) | ||||||||||||||||||||||||||||||||
Debt (current and long-term) | 5,560 | 5,807 | (4 | )% | 5,745 | (3 | )% | |||||||||||||||||||||||||
Cash and equivalents | 2,405 | 2,153 | 12 | % | 1,697 | 42 | % | |||||||||||||||||||||||||
Debt, net of cash | 3,155 | 3,654 | (14 | )% | 4,048 | (22 | )% | |||||||||||||||||||||||||
| a. | Net earnings (loss) represents net earnings (loss) attributable to the equity holders of the Company. |
| b. | Adjusted net earnings, adjusted EBITDA, free cash flow, adjusted net earnings per share, realized gold price,all-in sustaining costs, total cash costs, C1 cash costs and realized copper price arenon-GAAP financial performance measures with no standardized meaning under IFRS and therefore may not be comparable to similar measures presented by other issuers. For further information and a detailed reconciliation of eachnon-GAAP measure to the most directly comparable IFRS measure, please see pages 77 to 98 of this MD&A. |
| c. | Represents adjusted EBITDA divided by revenue. |
| d. | Amounts presented on a consolidated cash basis. Project capital expenditures are included in our calculation ofall-in costs, but not included in our calculation ofall-in sustaining costs. |
| e. | Total consolidated capital expenditures also includes capitalized interest. |
| f. | Represents net cash provided by operating activities divided by revenue. |
| g. | Includes Tanzania on a 63.9% basis (notwithstanding the completion of the Acacia transaction on September 17, 2019, we consolidated our interest in Acacia and recorded anon-controlling interest of 36.1% in the income statement for the entirety of the third quarter of 2019 as a matter of convenience), Pueblo Viejo on a 60% basis, South Arturo on a 60% basis (36.9% from July 1, 2019 onwards as a result of its contribution to Nevada Gold Mines), and Veladero on a 50% basis, which reflects our equity share of production and sales. Also includes Loulo-Gounkoto on an 80% basis, Kibali on a 45% basis, Tongon on an 89.7% basis and Morila on a 40% basis, which reflects our equity share of production and sales, commencing January 1, 2019, the effective date of the Merger. Also removes thenon-controlling interest of 38.5% Nevada Gold Mines from July 1, 2019 onwards. |
| h. | Gold cost of sales (Barrick’s share) is calculated as cost of sales - gold on an attributable basis (excluding sites in care and maintenance) divided by ounces sold. |
| i. | Amounts reflect production and sales from Jabal Sayid and Zaldívar on a 50% basis, which reflects our equity share of production, and Lumwana. |
| j. | Copper cost of sales (Barrick’s share) is calculated as cost of sales - copper plus our equity share of cost of sales attributable to Zaldívar and Jabal Sayid divided by pounds sold. |
| BARRICK THIRD QUARTER 2019 | 31 | MANAGEMENT’S DISCUSSION AND ANALYSIS |
| a. | These arenon-GAAP financial performance measures with no standardized meaning under IFRS and therefore may not be comparable to similar measures presented by other issuers. For further information and a detailed reconciliation of eachnon-GAAP measure to the most directly comparable IFRS measure, please see pages 77 to 98 of this MD&A. |
| b. | Cost of sales applicable to gold per ounce is calculated using cost of sales applicable to gold on an attributable basis (removing thenon-controlling interest of 40% Pueblo Viejo, 36.1% Tanzania (notwithstanding the completion of the Acacia transaction on September 17, 2019, we consolidated our interest in Acacia and recorded anon-controlling interest of 36.1% in the income statement for the entirety of the third quarter of 2019 as a matter of convenience) and 40% South Arturo from cost of sales (63.1% of South Arturo from July 1, 2019 onwards as a result of its contribution to Nevada Gold Mines)), divided by attributable gold ounces. Thenon-controlling interest of 20% Loulo-Gounkoto and 10.3% of Tongon is also removed from cost of sales and our proportionate share of cost of sales attributable to equity method investments (Kibali and Morila) is included commencing January 1, 2019, the effective date of the Merger. Also removes thenon-controlling interest of 38.5% Nevada Gold Mines from cost of sales from July 1, 2019 onwards. Cost of sales applicable to copper per pound is calculated using cost of sales applicable to copper including our proportionate share of cost of sales attributable to equity method investments (Zaldívar and Jabal Sayid), divided by consolidated copper pounds (including our proportionate share of copper pounds from our equity method investments). |
| BARRICK THIRD QUARTER 2019 | 32 | MANAGEMENT’S DISCUSSION AND ANALYSIS |
Factors affecting net earnings and adjusted net earnings1- three months ended September 30, 2019 versus June 30, 2019
Net earnings attributable to equity holders of Barrick (“net earnings”) for the three months ended September 30, 2019 were $2,277 million compared to $194 million in the prior quarter. The significant increase was primarily due to a gain of $1.9 billion ($1.5 billion net of taxes) relating to the remeasurement of Turquoise Ridge to fair value as a result of its contribution to Nevada Gold Mines LLC (“Nevada Gold Mines”) and an impairment reversal of $947 million ($663 million net of taxes) at Lumwana. After adjusting for items that are not indicative of future operating earnings, adjusted net earnings1 of $264 million for the three months ended September 30, 2019 were 71% higher than the prior quarter. The increase in adjusted net earnings was primarily due to higher realized gold prices1of $1,476 per ounce in the three months ended September 30, 2019 compared to $1,317 per ounce in the prior quarter. This was partially offset by lower gold sales volumes as a result of the Prohibition Notice, which resulted in the suspension of operations at North Mara in Tanzania.
Factors affecting net earnings and adjusted net earnings1- three months ended September 30, 2019 versus September 30, 2018
Net earnings for the third quarter of 2019 were $2,277 million compared to a loss of $412 million in the same prior year period. The significant increase was mainly due to a gain of $1.9 billion ($1.5 billion net of taxes) relating to the remeasurement of Turquoise Ridge to fair value as a result of its contribution to Nevada Gold Mines and an impairment reversal of $947 million ($663 million net of taxes) at Lumwana. In addition to these impacts, there was a $405 million impairment charge recorded in the third quarter of 2018 resulting from an asset impairment of Lagunas Norte. After adjusting for items that are not indicative of future operating earnings, adjusted net earnings1 of $264 million in the third quarter of 2019 were $175 million higher than the same prior year period. The increase in adjusted net earnings was primarily due to the Merger. Excluding the impact of the Merger, the increase in adjusted net earnings was primarily due to higher realized gold prices1of $1,476 per ounce in the three months ended September 30, 2019 compared to $1,216 per ounce in the same prior year period.
Significant adjusting items(pre-tax and excludingnon-controlling interest effects) in the three months ended September 30, 2019 include:
| • | $1,901 million in acquisition/disposition gains mainly relating to the remeasurement of Turquoise Ridge to fair value as a result of its contribution to Nevada Gold Mines; partially offset by |
| • | $872 million in net impairment reversals, relating to Lumwana, partially offset by impairments of land holdings and CHOP infrastructure assets at Cortez; and |
| • | $53 million in other expense adjustments, primarily related to severance costs as a result of the implementation of a number of organizational reductions, the impact of changes in the discount rate assumptions on our closed mine rehabilitation provision, and transaction costs related to Nevada Gold Mines and Acacia Mining plc. |
Refer to page 78 for a full list of reconciling items between net earnings and adjusted net earnings1 for the current and previous periods.
Factors affecting net earnings and adjusted net earnings1- nine months ended September 30, 2019 versus September 30, 2018
Net earnings for the nine months ended September 30, 2019 were $2,582 million compared to a loss of $348 million in the same prior year period. The significant increase was mainly due to a gain of $1.9 billion ($1.5 billion net of taxes) relating to the remeasurement of Turquoise Ridge to fair value as a result of its contribution to Nevada Gold Mines and an impairment reversal of $947 million ($663 million net of taxes) at Lumwana. In addition to these impacts, there was a $405 million impairment charge recorded in the third quarter of 2018 resulting from an asset impairment of Lagunas Norte. Net earnings were also positively impacted by relatively lower foreign currency translation losses relating to the Argentine peso. The peso has significantly depreciated in both periods and has revalued our peso denominated value-added tax receivable balances. After adjusting for items that are not indicative of future operating earnings, adjusted net earnings1 of $602 million for the nine months ended September 30, 2019 were $262 million higher than the same prior year period. The increase in adjusted net earnings was primarily due to the Merger. Excluding the impact of the Merger, the increase in adjusted net earnings was primarily due to an increase in realized gold prices1.
Significant adjusting items(pre-tax and excludingnon-controlling interest effects) in the nine months ended September 30, 2019 include:
| • | $1,913 million in acquisition/disposition gains mainly relating to the remeasurement of Turquoise Ridge to fair value as a result of its contribution to Nevada Gold Mines; partially offset by, |
| • | $158 million in other expense adjustments, primarily related to severance costs as a result of the implementation of a number of organizational reductions, the impact of changes in the discount rate assumptions on our closed mine rehabilitation provision, and transaction costs related to Nevada Gold Mines and Acacia Mining plc; and |
| • | $857 million in net impairment reversals, relating to Lumwana, partially offset by impairments of land holdings and CHOP infrastructure assets at Cortez. |
Refer to page 78 for a full list of reconciling items between net earnings and adjusted net earnings1 for the current and previous periods.
* Numerical annotations throughout the text of this document refer to the endnotes found on page 99.
| BARRICK THIRD QUARTER 2019 | 33 | MANAGEMENT’S DISCUSSION AND ANALYSIS |
Factors affecting Operating Cash Flow and Free Cash Flow1- three months ended September 30, 2019 versus June 30, 2019
In the three months ended September 30, 2019, we generated $1,004 million in operating cash flow, compared to $434 million in the prior quarter. The increase of $570 million was primarily due to the impact of the production from Nevada Gold Mines, which commenced on July 1, 2019 and is consolidated and included at 100%. This was combined with higher realized gold prices1 of $1,476 per ounce in the three months ended September 30, 2019 compared to $1,317 per ounce in the prior quarter and a favorable movement in working capital, mainly as a result of the timing of payments and receivables, partially offset by an unfavorable movement in other current assets. Operating cash flow was also positively impacted by lower income taxes paid and cash interest paid.
Free cash flow1 for the three months ended September 30, 2019 was $502 million, compared to $55 million in the prior quarter, reflecting higher operating cash flows, partially offset by higher capital expenditures. In the three months ended September 30, 2019, capital expenditures on a cash basis were $502 million compared to $379 million in the prior quarter primarily due to the consolidation impact of Nevada Gold Mines, as described above. This was combined with a strategic land acquisition at Cortez and increased capitalized stripping, underground development and minesite sustaining capital at Loulo-Gounkoto, while project capital expenditures were in line with the same prior year period.
Factors affecting Operating Cash Flow and Free Cash Flow1- three months ended September 30, 2019 versus September 30, 2018
In the third quarter of 2019, we generated $1,004 million in operating cash flow, compared to $706 million in the same prior year period. The increase of $298 million was primarily due to higher sales volume as a result of the Merger and the formation of Nevada Gold Mines as discussed above. This was combined with higher realized gold prices1 of $1,476 per ounce in the three months ended September 30, 2019 compared to $1,216 per ounce in the same prior year period, partially offset by higher direct mining costs as a result of the increased sales volume.
In the third quarter of 2019, we generated free cash flow1 of $502 million compared to $319 million in the same prior year period. The increase primarily reflects higher operating cash flows, partially offset by higher capital expenditures. In the third quarter of 2019, capital expenditures on a cash basis were $502 million compared to $387 million in the third quarter of 2018. The increase in capital expenditures of $115 million was primarily due to higher project minesite sustaining capital expenditures as a result of the Merger and the consolidation impact of Nevada Gold Mines, partially offset by decreases at Pueblo Viejo as a result of lower capitalized stripping costs and timing in project execution and at Tanzania due to lower capitalized stripping. This was further impacted by a decrease in project capital expenditures at Cortez due to the ramp down in the Rangefront Declines, Deep South, and Crossroads dewatering projects, partially offset by increased Crossroads stripping.
Factors affecting Operating Cash Flow and Free Cash Flow1- nine months ended September 30, 2019 versus September 30, 2018
For the nine months ended September 30, 2019, we generated $1,958 million in operating cash flow, compared to $1,354 million in the same prior year period. The increase of $604 million was primarily due to higher sales volume as a result of the Merger, the formation of Nevada Gold Mines. This was combined with higher realized gold prices1of $1,365 per ounce in the nine months ended September 30, 2019 compared to $1,284 per ounce in the same prior year period and higher direct mining costs as a result of the increased sales volume.
For the nine months ended September 30, 2019, we generated free cash flow1 of $703 million compared to $328 million in the same prior year period. The increase primarily reflects higher operating cash flows, partially offset by higher capital expenditures. In the nine months ended September 30, 2019, capital expenditures on a cash basis were $1,255 million compared to $1,026 million in the same prior year period. Higher capital expenditures of $229 million were primarily due to an increase in minesite sustaining capital expenditures as a result of the Merger and the consolidation impact of Nevada Gold Mines, while project capital expenditures remained in line with the same prior year period.
| BARRICK THIRD QUARTER 2019 | 34 | MANAGEMENT’S DISCUSSION AND ANALYSIS |
Key Business Developments
Acacia Mining plc
On September 17, 2019, Barrick acquired all of the Acacia Mining plc (“Acacia”) shares we did not already own through ashare-for-share exchange of 0.168 Barrick shares and any Acacia Exploration Special Dividends for each ordinary share of Acacia. The Acacia Exploration Special Dividends3 and any deferred cash consideration dividends (if applicable) will be paid as a consequence of a sales process to realize value from the sale of certain Acacia exploration properties to be undertaken during the two year period following closing. This transaction resulted in the issuance of 24,836,876 Barrick common shares or approximately 1% of Barrick’s share capital. As a result, Acacia ceased trading on the London Stock Exchange and became a wholly-owned subsidiary of Barrick called Barrick TZ Limited. Refer to note 4 to the Financial Statements for more information.
Notwithstanding the completion of the Acacia transaction on September 17, 2019, we consolidated our interest in Acacia and recorded anon-controlling interest of 36.1% in the income statement for the entirety of the third quarter of 2019 as a matter of convenience. As at September 30, 2019, we derecognized thenon-controlling interest on the balance sheet related to our former 63.9% ownership of Acacia to reflect our current 100% interest. The former Acacia mine sites (Bulyanhulu, North Mara and Buzwagi) will now be referred to as Tanzania in this report.
On October 20, 2019, we announced that we had reached an agreement with the Government of Tanzania (“GoT”) to settle all disputes between the GoT and the mining companies formerly operated by Acacia but now managed by Barrick. The final agreements have been submitted to the Tanzanian Attorney General for review and legalization.
The terms of the agreement include the payment of $300 million to settle all outstanding tax and other disputes; the lifting of the concentrate export ban; the sharing of future economic benefits from the mines on a 50/50 basis; and a dispute resolution mechanism that provides for binding international arbitration.
In conjunction with the finalization of the agreement, a new operating company called Twiga Minerals Corporation (“Twiga”) has been formed to manage the Bulyanhulu, Buzwagi and North Mara mines. The GoT will receive a free carried shareholding of 16% in each of the mines and will receive its half of the economic benefits from taxes, royalties, clearing fees and participation in all cash distributions made by the mines and Twiga. An annualtrue-up mechanism will be included to maintain the 50/50 split.
Operating results will be included at 100% from October 1, 2019 up until the GoT’s 16% free-carried interest is made effective, and on an 84% basis thereafter.
Nevada Gold Mines LLC
On March 10, 2019, we entered into an implementation agreement with Newmont Mining Corporation, now Newmont Goldcorp Corporation, (“Newmont Goldcorp”) to create a joint venture combining our respective mining operations, assets, reserves and talent in Nevada, USA. This includes Barrick’s Cortez, Goldstrike, Turquoise Ridge and Goldrush properties
and Newmont’s Carlin, Twin Creeks, Phoenix, Long Canyon and Lone Tree properties. On July 1, 2019, the transaction closed, establishing Nevada Gold Mines LLC (“Nevada Gold Mines”), and we began consolidating the operating results, cash flows and net assets of Nevada Gold Mines from that date forward. Barrick is the operator of the joint venture and owns 61.5%, with Newmont Goldcorp owning the remaining 38.5% of the joint venture.
As a result of this transaction, Barrick recognized a gain through earnings of $1.9 billion on the remeasurement of our previous 75% interest of Turquoise Ridge. Refer to note 4 to the Financial Statements for more information.
Debt Management
On July 15, 2019, Barrick completed a make-whole repurchase of the approximately $248 million of outstanding principal on our 4.95% Notes due 2020 and incurred a loss on debt extinguishment of $3 million in the third quarter of 2019. The debt repayment is expected to result in an annualized interest saving of approximately $12 million.
Reko Diq Arbitration
On July 12, 2019, the World Bank International Centre for Settlement of Investment Disputes (“ICSID”) awarded $5.84 billion in damages to Tethyan Copper Company Pty Limited, a joint venture held equally by Barrick and Antofagasta plc, in relation to the arbitration claims filed against the Islamic Republic of Pakistan following the unlawful denial of a mining lease for the Reko Diq project in Pakistan in 2011.
Damages include compensation of $4.087 billion in relation to the fair market value of the Reko Diq project at the time the mining lease was denied, and interest until the date of the award of $1.753 billion. Compound interest continues to apply at a rate of US Prime +1% per annum until the award is paid. The proceeds of this award will not be recognized in our financial statements until any such proceeds have been collected. Refer to note 17 to the Financial Statements for more information regarding these and related matters.
Randgold Resources Limited Merger
On January 1, 2019, we acquired 100% of the issued and outstanding shares of Randgold. Each Randgold shareholder received 6.1280 common shares of Barrick for each Randgold share, which resulted in the issuance of 583,669,178 Barrick common shares. After this share issuance, Barrick shareholders owned 66.7%, while former Randgold shareholders owned 33.3%, of the shares of the combined company. We have determined that this transaction represents a business combination with Barrick identified as the acquirer. Based on the December 31, 2018 closing share price of Barrick’s common shares, the total consideration of the acquisition is $7.9 billion.
Randgold was a publicly traded mining company with ownership interests in the following gold mines: Kibali in the Democratic Republic of Congo; Tongon in Côte d’Ivoire; Loulo-Gounkoto and Morila in Mali; and the Massawa project in Senegal and various exploration properties. We began consolidating the operating results, cash flows and net assets of Randgold from January 1, 2019.
| BARRICK THIRD QUARTER 2019 | 35 | MANAGEMENT’S DISCUSSION AND ANALYSIS |
In conjunction with the Merger, Barrick has a new management team, effective January 1, 2019. Mark Bristow is now President and Chief Executive Officer of Barrick. He was formerly the Chief Executive Officer of Randgold, a position he held since its incorporation in 1995. Graham Shuttleworth is now Senior Executive Vice-President and Chief Financial Officer of Barrick, having formerly served as Randgold‘s Chief Financial Officer since 2007. Kevin Thomson, Senior Executive Vice-President, Strategic Matters, continues in the role to which he was appointed at Barrick in October 2014.
In addition, Barrick is now managed by three regional Chief Operating Officers, each of whom report to the President and CEO. Mark Hill, formerly Barrick’s Chief Investment Officer, was appointed Chief Operating Officer, LATAM and Australia Pacific. Willem Jacobs, formerly Randgold’s General Manager East and Central Africa, was appointed Chief Operating Officer, Africa and Middle East. Catherine Raw, formerly Barrick’s Chief Financial Officer, was appointed Chief Operating Officer, North America.
Following the closing of the Merger, Barrick’s Board of Directors was reconstituted with the following nine Directors: John Thornton (Executive Chairman), Brett Harvey (Lead Independent Director) Mark Bristow, María Ignacia Benítez, Gustavo Cisneros, Christopher Coleman, Michael Evans, Brian Greenspun, and Andrew Quinn. Regrettably, on February 28, 2019, María Ignacia Benítez passed away. Barrick’s Corporate Governance & Nominating Committee initiated a search for an equally compelling and qualified female candidate to fill the vacant Board position and on August 9, 2019, we announced the appointment of Loreto Silva to the Board of Directors as an independent director.
| BARRICK THIRD QUARTER 2019 | 36 | MANAGEMENT’S DISCUSSION AND ANALYSIS |
Full Year 2019 Outlook
Based on the solid results of our first three quarters of 2019, we expect 2019 attributable gold production to be at the upper end of our existing guidance range of5.1-5.6 million ounces and both total cash costs per ounce1 andall-in sustaining costs per ounce1at the lower end of the ranges. As reported in our second quarter MD&A, our guidance range for cost of sales per ounce has now been revised for the impact of the formation of Nevada Gold Mines.
Commencing with this third quarter MD&A, we report on Nevada Gold Mines as five distinct operating divisions in which we own 61.5%: Cortez, Carlin (including Goldstrike), Turquoise Ridge (including Twin Creeks), Phoenix and Long Canyon. In relation to Cortez, Goldstrike and Turquoise Ridge, the full year guidance is inclusive of our interest in these operating divisions for the first six months of 2019 prior to the formation of Nevada Gold Mines. The guidance for cost of sales per ounce for Carlin, Turquoise Ridge, Phoenix and Long Canyon has been updated to include the additional depreciation resulting from the restatement of these assets to fair market value as a consequence of the formation of Nevada Gold Mines from July 1, 2019.
As reported in our second quarter MD&A, we will cease to include production ornon-GAAP cost metrics for Lagunas Norte going forward following the decision to place the mine on care and maintenance at the end of the third quarter.
All other guidance metrics are unchanged inclusive of the Company Outlook.
Five year outlook (2020-2024)
We continue to expect our five-year gold production outlook to be maintained within the5.1-5.6 million ounce range based on the existing portfolio. We also expect that our cost metrics will be maintained within the following ranges over this five-year time frame: cost of sales per ounce at$1,000-$1,060 per ounce, total cash costs per ounce1 at$650-$700 per ounce andall-in sustaining costs per ounce1 at$850-$950 per ounce, noting we expectall-in sustaining costs per ounce1 to decline over this period.
Company Outlook ($ millions, except per ounce/pound data) | 2019 Estimate | |||
Gold production (millions of ounces) | 5.10 - 5.60 | |||
Gold unit production costs | ||||
Cost of sales - gold ($/oz) | 940 - 990 | |||
Total cash costs ($/oz)a | 650 - 700 | |||
Depreciation ($/oz) | 320 - 350 | |||
All-in sustaining costs ($/oz)a | 870 - 920 | |||
Copper production (millions of pounds) | 375 - 430 | |||
Copper unit production costs | ||||
Cost of sales - copper ($/lb) | 2.30 - 2.70 | |||
C1 cash costs ($/lb)a | 1.70 - 2.00 | |||
Depreciation ($/lb) | 0.60 - 0.70 | |||
Copperall-in sustaining costs ($/lb)a | 2.40 - 2.90 | |||
Exploration and project expenses | 280 - 340 | |||
Exploration and evaluation | 170 - 180 | |||
Project expenses | 120 - 150 | |||
General and administrative expenses | ~200 | |||
Corporate administration | ~140 | |||
Share-based compensationb | ~40 | |||
Tanzaniac | ~20 | |||
Other expensed | 80 - 100 | |||
Finance costs | 500 - 550 | |||
Attributable capital expenditures: | ||||
Attributable minesite sustaining | 1,100 - 1,300 | |||
Attributable project | 300 - 400 | |||
Total attributable capital expenditurese | 1,400 - 1,700 | |||
Effective income tax ratef | 40% - 50% | |||
Key Assumptions | ||||
Gold Price ($/oz) | 1,250 | |||
Copper Price ($/lb) | 2.75 | |||
Oil Price (WTI) ($/barrel) | 65 | |||
AUD Exchange Rate (AUD:USD) | 0.75 | |||
ARS Exchange Rate (USD:ARS) | 60.00 | |||
CAD Exchange Rate (USD:CAD) | 1.30 | |||
CLP Exchange Rate (USD:CLP) | 680 | |||
EUR Exchange Rate (EUR:USD) | 1.20 | |||
| a. | Total cash costs, C1 cash costs andall-in sustaining costs arenon-GAAP financial performance measures with no standardized meaning under IFRS and therefore may not be comparable to similar measures of performance presented by other issuers. For further information and a detailed reconciliation of thenon-GAAP measures used in this section of the MD&A to the most directly comparable IFRS measure, please see pages 77 to 98 of this MD&A. |
| b. | Based on US$12.40 share price and excludes share-based compensation relating to Acacia Mining plc. |
| c. | Formerly known as Acacia Mining plc, this includes share-based compensation based on a share price of £1.50 or ~US$2.00. |
| d. | Other expense guidance excludes the remeasurement gain on Turquoise Ridge |
| e. | 2019 Guidance includes our 60% share of Pueblo Viejo, our 80% share of Loulo-Gounkoto, our 89.7% share of Tongon, our 63.9% share of Tanzania up until September 30, 2019 (notwithstanding the completion of the Acacia transaction on September 17, 2019, our guidance includes our 63.9% share up until the end of the third quarter of 2019 as a matter of convenience), our 50% share of Zaldívar and Jabal Sayid, our 45% of Kibali, and our share of joint operations. Furthermore, 2019 Guidance includes Cortez (100%), Goldstrike (100%) and Turquoise Ridge (75%), also known as Barrick Nevada, from January 1, 2019 to June 30, 2019, and Cortez, Carlin (including Goldstrike), Turquoise Ridge (including Twin Creeks), Phoenix and Long Canyon on a 61.5% basis from July 1, 2019 onwards as a result of the formation of Nevada Gold Mines with Newmont Goldcorp on July 1, 2019. South Arturo is included on a 60% basis from January 1, 2019 to June 30, 2019 and 36.9% from July 1, 2019 onwards. |
| f. | Based on key assumptions included in this table. |
| BARRICK THIRD QUARTER 2019 | 37 | MANAGEMENT’S DISCUSSION AND ANALYSIS |
Operating Division Guidance
Our 2019 forecast gold and copper production, cost of sales, total cash costs1, andall-in sustaining costs1 ranges by operating division are as follows:
| Operating Division | 2019 forecast attributable production (000s ozs) | 2019 forecast cost of salesa ($/oz) | 2019 forecast total cash costsb ($/oz) | 2019 forecast all-in sustaining costsb ($/oz) | ||||||||||||
| Gold | ||||||||||||||||
Carlinc,d | 960 - 1,020 | 1,020 - 1,080 | 740 - 790 | 955 - 995 | ||||||||||||
Cortezc | 760 - 810 | 810 - 850 | 530 - 580 | 670 - 710 | ||||||||||||
Turquoise Ridgec | 330 - 370 | 800 - 850 | 550 - 600 | 680 - 730 | ||||||||||||
Phoenixc | 50 - 70 | 2,250 - 2,300 | 940 - 990 | 1,120 - 1,150 | ||||||||||||
Long Canyonc | 40 - 50 | 1,100 - 1,150 | 300 - 350 | 920 - 950 | ||||||||||||
Pueblo Viejo (60%) | 550 - 600 | 780 - 830 | 465 - 510 | 610 - 650 | ||||||||||||
Loulo-Gounkoto (80%) | 520 - 570 | 880 - 930 | 575 - 625 | 810 - 850 | ||||||||||||
Kibali (45%) | 330 - 350 | 1,150 - 1,200 | 555 - 605 | 670 - 730 | ||||||||||||
Kalgoorlie (50%) | 260 - 280 | 920 - 970 | 740 - 790 | 1,010 - 1,050 | ||||||||||||
Tongon (89.7%) | 250 - 270 | 1,300 - 1,350 | 710 - 760 | 780 - 820 | ||||||||||||
Porgera (47.5%) | 240 - 260 | 980 - 1,030 | 800 - 850 | 985 - 1,025 | ||||||||||||
Veladero (50%) | 230 - 250 | 1,250 - 1,350 | 770 - 820 | 1,150 - 1,250 | ||||||||||||
Hemlo | 200 - 220 | 890 - 940 | 765 - 815 | 1,100 - 1,200 | ||||||||||||
Tanzania (63.9%)e | 320 - 350 | 920 - 970 | 665 - 710 | 860 - 920 | ||||||||||||
Other Sitesf | 120 - 160 | 1,155 - 1,240 | 895 - 945 | 1,055 - 1,115 | ||||||||||||
| Total Attributable to Barrickg,h,i | 5,100 - 5,600 | 940 - 990 | 650 - 700 | 870 - 920 | ||||||||||||
| 2019 forecast attributable production (millions lbs) | 2019 forecast cost of salesa($/lb) | 2019 forecast C1 cash costsb ($/lb) | 2019 forecastall-in sustaining costsb ($/lb) | |||||||||||||
| Copper | ||||||||||||||||
Lumwana | 210 - 240 | 2.25 - 2.50 | 1.80 - 2.10 | 2.75 - 3.15 | ||||||||||||
Zaldívar (50%) | 120 - 130 | 2.40 - 2.70 | 1.65 - 1.85 | 2.00 - 2.20 | ||||||||||||
Jabal Sayid (50%) | 45 - 60 | 2.00 - 2.30 | 1.60 - 1.90 | 1.60 - 1.90 | ||||||||||||
| Total Copperh | 375 - 430 | 2.30 - 2.70 | 1.70 - 2.00 | 2.40 - 2.90 | ||||||||||||
| a. | Cost of sales applicable to gold per ounce is calculated using cost of sales applicable to gold on an attributable basis (removing thenon-controlling interest of 40% Pueblo Viejo, 20% of Loulo-Gounkoto, 10.3% of Tongon, 36.1% Tanzania (notwithstanding the completion of the Acacia transaction on September 17, 2019, our guidance includes our 63.9% share up until the end of the third quarter of 2019 as a matter of convenience) and 40% South Arturo (63.1% of South Arturo from July 1, 2019 onwards as a result of its contribution to Nevada Gold Mines) from cost of sales and including our proportionate share of cost of sales attributable to our equity method investments in Kibali and Morila), divided by attributable gold ounces sold. Also removes thenon-controlling interest of 38.5% Nevada Gold Mines from cost of sales from July 1, 2019 onwards. Cost of sales applicable to copper per pound is calculated using cost of sales applicable to copper including our proportionate share of cost of sales attributable to our equity method investments in Zaldívar and Jabal Sayid, divided by consolidated copper pounds sold (including our proportionate share of copper pounds sold from our equity method investments). The guidance for cost of sales per ounce for Carlin, Turquoise Ridge, Phoenix and Long Canyon has been updated to include the additional depreciation resulting from the restatement of these assets to fair market value as a consequence of the formation of Nevada Gold Mines from July 1, 2019. |
| b. | Total cash costs,all-in sustaining costs and C1 cash costs arenon-GAAP financial performance measures with no standardized meaning under IFRS and therefore may not be comparable to similar measures of performance presented by other issuers. For further information and a detailed reconciliation of thenon-GAAP measures used in this section of the MD&A to the most directly comparable IFRS measures, please see pages 61 to 76 of this MD&A. |
| c. | These five operations are part of Nevada Gold Mines from July 1, 2019. Amounts include Cortez (100%), Goldstrike (100%) and Turquoise Ridge (75%), also known collectively as Barrick Nevada, from January 1, 2019 to June 30, 2019, and Cortez, Carlin (which includes Goldstrike), Turquoise Ridge (including Twin Creeks), Phoenix and Long Canyon on a 61.5% basis from July 1, 2019 onwards as a result of the formation of Nevada Gold Mines with Newmont Goldcorp on July 1, 2019. |
| d. | Includes our 60% share of South Arturo from January 1, 2019 to June 30, 2019 and 36.9% from July 1, 2019 onwards as a result of the formation of Nevada Gold Mines with Newmont Goldcorp on July 1, 2019. |
| e. | Formerly known as Acacia Mining plc. On September 17, 2019, Barrick acquired all of the shares of Acacia it did not own. Operating results will be included at 100% from October 1, 2019 (notwithstanding the completion of the Acacia transaction on September 17, 2019, we consolidated our interest in Acacia and recorded anon-controlling interest of 36.1% in the income statement for the entirety of the third quarter of 2019 as a matter of convenience) up until the GoT’s 16% free-carried interest is made effective, and on an 84% basis thereafter. |
| f. | Other sites include Lagunas Norte, Golden Sunlight, and Morila (40%) and excludes Pierina which is mining incidental ounces as it enters closure. Due to the planned ramp down of operations, we have ceased to include production ornon-GAAP cost metrics for Golden Sunlight or Morila after the second quarter and will cease to include Lagunas Norte after the end of the third quarter. |
| g. | Total cash costs andall-in sustaining costs per ounce include the impact of hedges and/or costs allocated tonon-operating sites. |
| h. | Operating unit guidance ranges reflect expectations at each individual operating unit, and may not add up to the company-wide guidance range total. Guidance ranges exclude Pierina which is mining incidental ounces as it enters closure. |
| i. | Includes corporate administration costs. |
| BARRICK THIRD QUARTER 2019 | 38 | MANAGEMENT’S DISCUSSION AND ANALYSIS |
Production and Cost Summary - Gold
| For the three months ended | ||||||||||||||||||||
| 9/30/19 | 6/30/19 | % Change | 9/30/18 | % Change | ||||||||||||||||
| Nevada Gold Mines LLC (61.5%)a | ||||||||||||||||||||
Gold produced (000s oz) | 535 | 526 | 2 | % | 624 | (14 | )% | |||||||||||||
Cost of sales ($/oz) | 1,027 | 842 | 22 | % | 800 | 28 | % | |||||||||||||
Total cash costs ($/oz)b | 693 | 594 | 17 | % | 526 | 32 | % | |||||||||||||
All-in sustaining costs ($/oz)b | 946 | 752 | 26 | % | 640 | 48 | % | |||||||||||||
Cortez (61.5%)c | ||||||||||||||||||||
Gold produced (000s oz) | 126 | 280 | (55 | )% | 326 | (61 | )% | |||||||||||||
Cost of sales ($/oz) | 829 | 719 | 15 | % | 630 | 32 | % | |||||||||||||
Total cash costs ($/oz)b | 570 | 489 | 17 | % | 342 | 67 | % | |||||||||||||
All-in sustaining costs ($/oz)b | 772 | 561 | 38 | % | 444 | 74 | % | |||||||||||||
Carlin (61.5%)d | ||||||||||||||||||||
Gold produced (000s oz) | 278 | 181 | 54 | % | 219 | 27 | % | |||||||||||||
Cost of sales ($/oz) | 1,007 | 1,116 | (10 | )% | 1,047 | (4 | )% | |||||||||||||
Total cash costs ($/oz)b | 775 | 769 | 1 | % | 738 | 5 | % | |||||||||||||
All-in sustaining costs ($/oz)b | 1,014 | 1,088 | (7 | )% | 892 | 14 | % | |||||||||||||
Turquoise Ridge (61.5%)e | ||||||||||||||||||||
Gold produced (000s oz) | 82 | 65 | 26 | % | 79 | 4 | % | |||||||||||||
Cost of sales ($/oz) | 1,077 | 665 | 62 | % | 805 | 34 | % | |||||||||||||
Total cash costs ($/oz)b | 622 | 569 | 9 | % | 711 | (13 | )% | |||||||||||||
All-in sustaining costs ($/oz)b | 840 | 667 | 26 | % | 757 | 11 | % | |||||||||||||
Phoenix (61.5%)f | ||||||||||||||||||||
Gold produced (000s oz) | 25 | |||||||||||||||||||
Cost of sales ($/oz) | 2,186 | |||||||||||||||||||
Total cash costs ($/oz)b | 1,010 | |||||||||||||||||||
All-in sustaining costs ($/oz)b | 1,622 | |||||||||||||||||||
Long Canyon (61.5%)f | ||||||||||||||||||||
Gold produced (000s oz) | 24 | |||||||||||||||||||
Cost of sales ($/oz) | 1,170 | |||||||||||||||||||
Total cash costs ($/oz)b | 353 | |||||||||||||||||||
All-in sustaining costs ($/oz)b | 714 | |||||||||||||||||||
| Pueblo Viejo (60%) | ||||||||||||||||||||
Gold produced (000s oz) | 139 | 124 | 12 | % | 151 | (8 | )% | |||||||||||||
Cost of sales ($/oz) | 807 | 852 | (5 | )% | 803 | 0 | % | |||||||||||||
Total cash costs ($/oz)b | 504 | 557 | (10 | )% | 517 | (3 | )% | |||||||||||||
All-in sustaining costs ($/oz)b | 631 | 702 | (10 | )% | 688 | (8 | )% | |||||||||||||
| Loulo-Gounkoto (80%)g | ||||||||||||||||||||
Gold produced (000s oz) | 153 | 147 | 4 | % | ||||||||||||||||
Cost of sales ($/oz) | 1,018 | 1,072 | (5 | )% | ||||||||||||||||
Total cash costs ($/oz)b | 630 | 598 | 5 | % | ||||||||||||||||
All-in sustaining costs ($/oz)b | 966 | 811 | 19 | % | ||||||||||||||||
| Kibali (45%)g | ||||||||||||||||||||
Gold produced (000s oz) | 91 | 95 | (4 | )% | ||||||||||||||||
Cost of sales ($/oz) | 1,187 | 868 | 37 | % | ||||||||||||||||
Total cash costs ($/oz)b | 554 | 540 | 3 | % | ||||||||||||||||
All-in sustaining costs ($/oz)b | 703 | 651 | 8 | % | ||||||||||||||||
| Kalgoorlie (50%) | ||||||||||||||||||||
Gold produced (000s oz) | 58 | 57 | 2 | % | 75 | (23 | )% | |||||||||||||
Cost of sales ($/oz) | 1,037 | 1,038 | 0 | % | 923 | 12 | % | |||||||||||||
Total cash costs ($/oz)b | 856 | 846 | 1 | % | 753 | 14 | % | |||||||||||||
All-in sustaining costs ($/oz)b | 1,170 | 1,204 | (3 | )% | 840 | 39 | % | |||||||||||||
| BARRICK THIRD QUARTER 2019 | 39 | MANAGEMENT’S DISCUSSION AND ANALYSIS |
Production and Cost Summary - Gold (continued)
| For the three months ended | ||||||||||||||||||||
| 9/30/19 | 6/30/19 | % Change | 9/30/18 | % Change | ||||||||||||||||
| Tongon (89.7%)g | ||||||||||||||||||||
Gold produced (000s oz) | 62 | 61 | 2 | % | ||||||||||||||||
Cost of sales ($/oz) | 1,396 | 1,562 | (11 | )% | ||||||||||||||||
Total cash costs ($/oz)b | 793 | 750 | 6 | % | ||||||||||||||||
All-in sustaining costs ($/oz)b | 869 | 802 | 8 | % | ||||||||||||||||
| Porgera (47.5%) | ||||||||||||||||||||
Gold produced (000s oz) | 75 | 61 | 23 | % | 53 | 42 | % | |||||||||||||
Cost of sales ($/oz) | 1,024 | 1,032 | (1 | )% | 1,067 | (4 | )% | |||||||||||||
Total cash costs ($/oz)b | 868 | 893 | (3 | )% | 775 | 12 | % | |||||||||||||
All-in sustaining costs ($/oz)b | 1,053 | 1,112 | (5 | )% | 1,084 | (3 | )% | |||||||||||||
| Veladero (50%) | ||||||||||||||||||||
Gold produced (000s oz) | 58 | 75 | (23 | )% | 49 | 18 | % | |||||||||||||
Cost of sales ($/oz) | 1,243 | 1,186 | 5 | % | 1,083 | 15 | % | |||||||||||||
Total cash costs ($/oz)b | 773 | 746 | 4 | % | 581 | 33 | % | |||||||||||||
All-in sustaining costs ($/oz)b | 1,142 | 1,046 | 9 | % | 995 | 15 | % | |||||||||||||
| Hemlo | ||||||||||||||||||||
Gold produced (000s oz) | 49 | 55 | (11 | )% | 41 | 20 | % | |||||||||||||
Cost of sales ($/oz) | 1,083 | 953 | 14 | % | 1,095 | (1 | )% | |||||||||||||
Total cash costs ($/oz)b | 953 | 822 | 16 | % | 996 | (4 | )% | |||||||||||||
All-in sustaining costs ($/oz)b | 1,280 | 1,015 | 26 | % | 1,247 | 3 | % | |||||||||||||
| Tanzania (63.9%)h | ||||||||||||||||||||
Gold produced (000s oz) | 53 | 101 | (48 | )% | 87 | (39 | )% | |||||||||||||
Cost of sales ($/oz) | 1,057 | 920 | 15 | % | 842 | 26 | % | |||||||||||||
Total cash costs ($/oz)b | 788 | 659 | 20 | % | 670 | 18 | % | |||||||||||||
All-in sustaining costs ($/oz)b | 947 | 792 | 20 | % | 880 | 8 | % | |||||||||||||
| Lagunas Norte | ||||||||||||||||||||
Gold produced (000s oz) | 33 | 39 | (15 | )% | 64 | (48 | )% | |||||||||||||
Cost of sales ($/oz) | 1,661 | 952 | 74 | % | 720 | 131 | % | |||||||||||||
Total cash costs ($/oz)b | 1,327 | 732 | 81 | % | 472 | 181 | % | |||||||||||||
All-in sustaining costs ($/oz)b | 1,422 | 998 | 42 | % | 631 | 125 | % | |||||||||||||
| Total Attributable to Barricki | ||||||||||||||||||||
Gold produced (000s oz) | 1,306 | 1,353 | (3 | )% | 1,149 | 14 | % | |||||||||||||
Cost of sales ($/oz)j | 1,065 | 964 | 10 | % | 850 | 25 | % | |||||||||||||
Total cash costs ($/oz)b | 710 | 651 | 9 | % | 587 | 21 | % | |||||||||||||
All-in sustaining costs ($/oz)b | 984 | 869 | 13 | % | 785 | 25 | % | |||||||||||||
| a. | Represents the combined results of Cortez, Goldstrike (including our 60% share of South Arturo) and our 75% interest in Turquoise Ridge until June 30, 2019. Commencing July 1, 2019, the date Nevada Gold Mines was established, the results represent our 61.5% interest in Cortez, Carlin (including Goldstrike and 60% of South Arturo), Turquoise Ridge (including Twin Creeks), Phoenix and Long Canyon. |
| b. | These arenon-GAAP financial performance measures with no standardized meaning under IFRS and therefore may not be comparable to similar measures presented by other issuers. For further information and a detailed reconciliation of eachnon-GAAP measure used in this section of the MD&A to the most directly comparable IFRS measure, please see pages 77 to 98 of this MD&A. |
| c. | On July 1, 2019, Cortez was contributed to Nevada Gold Mines, a joint venture with Newmont Goldcorp. As a result, the amounts presented are on an 100% basis up until June 30, 2019, and on a 61.5% basis thereafter. |
| d. | On July 1, 2019, Barrick’s Goldstrike and Newmont Goldcorp’s Carlin were contributed to Nevada Gold Mines and are now referred to as Carlin. As a result, the amounts presented represent Goldstrike on a 100% basis (including our 60% share of South Arturo) up until June 30, 2019, and the combined results of Carlin and Goldstrike (including our 60% share of South Arturo) on a 61.5% basis thereafter. |
| e. | Barrick owned 75% of Turquoise Ridge through the end of the second quarter of 2019, with our joint venture partner, Newmont Goldcorp, owning the remaining 25%. Turquoise Ridge was proportionately consolidated on the basis that the joint venture partners that have joint control have rights to the assets and obligations for the liabilities relating to the arrangement. The figures presented in this table are based on our 75% interest in Turquoise Ridge until June 30, 2019. On July 1, 2019, Barrick’s 75% interest in Turquoise Ridge and Newmont Goldcorp’s Twin Creeks and 25% interest in Turquoise Ridge were contributed to Nevada Gold Mines. Starting July 1, 2019, the results represent our 61.5% share of Turquoise Ridge and Twin Creeks, now referred to as Turquoise Ridge. |
| f. | These sites were acquired as a result of the formation of Nevada Gold Mines on July 1, 2019. |
| g. | These sites did not form a part of the Barrick consolidated results in the three months ended June 30, 2018 as these sites were acquired as a result of the Merger. |
| h. | Formerly known as Acacia Mining plc. On September 17, 2019, Barrick acquired all of the shares of Acacia it did not own. Operating results will be included at 100% from October 1, 2019 (notwithstanding the completion of the Acacia transaction on September 17, 2019, we consolidated our interest in Acacia and recorded anon-controlling interest of 36.1% in the income statement for the entirety of the third quarter of 2019 as a matter of convenience) up until the GoT’s 16% free-carried interest is made effective, and on an 84% basis thereafter. |
| i. | With the end of mining at Golden Sunlight and Morila in the second quarter as previously reported, we have ceased to include production ornon-GAAP cost metrics for these sites from July 1, 2019 onwards although these sites are included in the Total Attributable to Barrick in the prior period comparatives. |
| j. | Cost of sales per ounce (Barrick’s share) is calculated as cost of sales - gold on an attributable basis (excluding sites in care and maintenance) divided by gold equity ounces sold. |
| BARRICK THIRD QUARTER 2019 | 40 | MANAGEMENT’S DISCUSSION AND ANALYSIS |
Production and Cost Summary - Copper
| For the three months ended | ||||||||||||||||||||
| 9/30/19 | 6/30/19 | % Change | 9/30/18 | % Change | ||||||||||||||||
| Lumwana | ||||||||||||||||||||
Copper production (millions lbs) | 65 | 49 | 33 | % | 64 | 2 | % | |||||||||||||
Cost of sales ($/lb) | 2.04 | 2.07 | (1 | )% | 2.21 | (8 | )% | |||||||||||||
C1 cash costs ($/lb)a | 1.83 | 1.70 | 8 | % | 2.05 | (11 | )% | |||||||||||||
All-in sustaining costs ($/lb)a | 3.66 | 2.78 | 32 | % | 3.12 | 17 | % | |||||||||||||
| Zaldívar (50%) | ||||||||||||||||||||
Copper production (millions lbs) | 32 | 32 | 0 | % | 28 | 14 | % | |||||||||||||
Cost of sales ($/lb) | 2.18 | 2.32 | (6 | )% | 2.59 | (16 | )% | |||||||||||||
C1 cash costs ($/lb)a | 1.55 | 1.61 | (4 | )% | 1.98 | (22 | )% | |||||||||||||
All-in sustaining costs ($/lb)a | 1.91 | 1.85 | 3 | % | 2.29 | (17 | )% | |||||||||||||
| Jabal Sayid (50%) | ||||||||||||||||||||
Copper production (millions lbs) | 15 | 16 | (6 | )% | 14 | 7 | % | |||||||||||||
Cost of sales ($/lb) | 1.63 | 1.45 | 12 | % | 1.66 | (2 | )% | |||||||||||||
C1 cash costs ($/lb)a | 1.42 | 1.22 | 16 | % | 1.56 | (9 | )% | |||||||||||||
All-in sustaining costs ($/lb)a | 1.65 | 1.31 | 26 | % | 1.67 | (1 | )% | |||||||||||||
| Total Copper | ||||||||||||||||||||
Copper production (millions lbs) | 112 | 97 | 15 | % | 106 | 6 | % | |||||||||||||
Cost of sales ($/lb)b | 2.00 | 2.04 | (2 | )% | 2.18 | (8 | )% | |||||||||||||
C1 cash costs ($/lb)a | 1.62 | 1.59 | 2 | % | 1.94 | (16 | )% | |||||||||||||
All-in sustaining costs ($/lb)a | 2.58 | 2.28 | 13 | % | 2.71 | (5 | )% | |||||||||||||
| a. | These arenon-GAAP financial performance measures with no standardized meaning under IFRS and therefore may not be comparable to similar measures presented by other issuers. For further information and a detailed reconciliation of eachnon-GAAP measure used in this section of the MD&A to the most directly comparable IFRS measure, please see pages 77 to 98 of this MD&A. |
| b. | Cost of sales per pound (Barrick’s share) is calculated as cost of sales - copper plus our equity share of cost of sales attributable to Zaldívar and Jabal Sayid divided by copper pounds sold. |
OPERATING DIVISIONS PERFORMANCE
Following the Merger in Q1 2019 and the events surrounding Nevada Gold Mines and Acacia Mining plc in Q3 2019 (refer to page 35 for further details), our presentation of reportable operating segments consists of seven gold mines (Cortez, Carlin, Turquoise Ridge, Pueblo Viejo, Loulo-Gounkoto, Kibali and Veladero) and Tanzania, a grouping of three operating mines formerly held in Acacia Mining plc (now called Barrick TZ Limited). The remaining operating segments, including our
remaining gold mines, copper mines and projects, have been grouped into an “other” category and will not be reported on individually. Segment performance is evaluated based on a number of measures including operating income before tax, production levels and unit production costs. Certain costs are managed on a consolidated basis and are therefore not reflected in segment income.
| BARRICK THIRD QUARTER 2019 | 41 | MANAGEMENT’S DISCUSSION AND ANALYSIS |
Nevada Gold Mines (61.5% basis)a, Nevada USA
| Summary of Operating and Financial Data | For the three months ended | For the nine months ended | ||||||||||||||||||||||||||||||
| 9/30/19 | 6/30/19 | % Change | 9/30/18 | % Change | 9/30/19 | 9/30/18 | % Change | |||||||||||||||||||||||||
| Total tonnes mined (000s) | 52,528 | 43,916 | 20 | % | 43,039 | 22 | % | 136,189 | 142,375 | (4 | )% | |||||||||||||||||||||
Open pit ore | 7,706 | 4,339 | 78 | % | 6,636 | 16 | % | 17,626 | 14,691 | 20 | % | |||||||||||||||||||||
Open pit waste | 43,572 | 38,569 | 13 | % | 35,474 | 23 | % | 115,245 | 125,000 | (8 | )% | |||||||||||||||||||||
Underground | 1,250 | 1,008 | 24 | % | 929 | 35 | % | 3,318 | 2,684 | 24 | % | |||||||||||||||||||||
Average grade (grams/tonne) | ||||||||||||||||||||||||||||||||
Open pit mined | 0.77 | 0.72 | 7 | % | 2.87 | (73 | )% | 0.99 | 3.01 | (67 | )% | |||||||||||||||||||||
Underground mined | 9.97 | 10.86 | (8 | )% | 10.57 | (6 | )% | 10.45 | 10.76 | (3 | )% | |||||||||||||||||||||
Processed | 2.02 | 2.75 | (27 | )% | 3.32 | (39 | )% | 2.44 | 3.42 | (29 | )% | |||||||||||||||||||||
Ore tonnes processed (000s) | 10,211 | 7,137 | 43 | % | 6,972 | 46 | % | 25,138 | 17,844 | 41 | % | |||||||||||||||||||||
Oxide mill | 3,124 | 1,114 | 180 | % | 1,091 | 186 | % | 5,294 | 3,348 | 58 | % | |||||||||||||||||||||
Roaster | 1,309 | 1,364 | (4 | )% | 1,410 | (7 | )% | 4,033 | 3,638 | 11 | % | |||||||||||||||||||||
Autoclave | 1,316 | 1,351 | (3 | )% | 1,106 | 19 | % | 4,100 | 3,458 | 19 | % | |||||||||||||||||||||
Heap leach | 4,462 | 3,308 | 35 | % | 3,365 | 33 | % | 11,711 | 7,400 | 58 | % | |||||||||||||||||||||
Recovery rate | 79 | % | 79 | % | 0 | % | 82 | % | (4 | )% | 82 | % | 83 | % | (1 | )% | ||||||||||||||||
Oxide Mill | 60 | % | 78 | % | (23 | )% | 82 | % | (27 | )% | 72 | % | 83 | % | (13 | )% | ||||||||||||||||
Roaster | 87 | % | 87 | % | 0 | % | 91 | % | (4 | )% | 87 | % | 90 | % | (3 | )% | ||||||||||||||||
Autoclave | 79 | % | 67 | % | 18 | % | 66 | % | 20 | % | 74 | % | 69 | % | 7 | % | ||||||||||||||||
Gold produced (000s oz) | 535 | 526 | 2 | % | 624 | (14 | )% | 1,633 | 1,674 | (2 | )% | |||||||||||||||||||||
Oxide mill | 76 | 82 | (7 | )% | 108 | (30 | )% | 260 | 457 | (43 | )% | |||||||||||||||||||||
Roaster | 275 | 255 | 8 | % | 365 | (25 | )% | 784 | 745 | 5 | % | |||||||||||||||||||||
Autoclave | 112 | 122 | (8 | )% | 121 | (8 | )% | 392 | 358 | 9 | % | |||||||||||||||||||||
Heap leach | 72 | 67 | 8 | % | 30 | 141 | % | 197 | 114 | 73 | % | |||||||||||||||||||||
Gold sold (000s oz) | 537 | 547 | (2 | )% | 671 | (20 | )% | 1,658 | 1,698 | (2 | )% | |||||||||||||||||||||
Revenue ($ millions) | 804 | 713 | 13 | % | 816 | (1 | %) | 2,267 | 2,174 | 4 | % | |||||||||||||||||||||
Cost of sales ($ millions) | 552 | 462 | 19 | % | 534 | 3 | % | 1,462 | 1,394 | 5 | % | |||||||||||||||||||||
Income ($ millions) | 237 | 244 | (3 | )% | 271 | (13 | )% | 773 | 751 | 3 | % | |||||||||||||||||||||
EBITDA ($ millions)b | 403 | 371 | 9 | % | 454 | (11 | )% | 1,202 | 1,234 | (3 | )% | |||||||||||||||||||||
EBITDA marginc | 50 | % | 52 | % | (4 | )% | 56 | % | (10 | )% | 53 | % | 57 | % | (7 | )% | ||||||||||||||||
Capital expenditures ($ millions)d,e | 164 | 169 | (3 | )% | 154 | 6 | % | 482 | 476 | 1 | % | |||||||||||||||||||||
Minesite sustainingd | 110 | 76 | 45 | % | 57 | 93 | % | 256 | 211 | 21 | % | |||||||||||||||||||||
Projectd | 54 | 93 | (42 | )% | 97 | (44 | )% | 226 | 265 | (15 | )% | |||||||||||||||||||||
Cost of sales ($/oz) | 1,027 | 842 | 22 | % | 800 | 28 | % | 881 | 822 | 7 | % | |||||||||||||||||||||
Total cash costs ($/oz)b | 693 | 594 | 17 | % | 526 | 32 | % | 608 | 536 | 13 | % | |||||||||||||||||||||
All-in sustaining costs ($/oz)b | 946 | 752 | 26 | % | 640 | 48 | % | 789 | 682 | 16 | % | |||||||||||||||||||||
All-in costs ($/oz)b | 1,048 | 922 | 14 | % | 788 | 33 | % | 926 | 840 | 10 | % | |||||||||||||||||||||
| a. | Represents the combined results of Cortez, Goldstrike (including our 60% share of South Arturo) and our 75% interest in Turquoise Ridge until June 30, 2019. Commencing July 1, 2019, the date Nevada Gold Mines was established, the results represent our 61.5% interest in Cortez, Carlin (including Goldstrike and 60% of South Arturo), Turquoise Ridge (including Twin Creeks), Phoenix and Long Canyon. |
| b. | These arenon-GAAP financial performance measures with no standardized meaning under IFRS and therefore may not be comparable to similar measures presented by other issuers. For further information and a detailed reconciliation of eachnon-GAAP measure used in this section of the MD&A to the most directly comparable IFRS measure, please see pages 77 to 98 of this MD&A. |
| c. | Represents EBITDA divided by revenue. |
| d. | Presented on a cash basis as a result of adopting IFRS 16Leasesstarting in the first quarter of 2019. Capital expenditures for the three and nine months ended September 30, 2018 are presented on an accrued basis. Please refer to page 30 of this MD&A for more details. |
| e. | Amounts presented exclude capitalized interest. |
As discussed on page 35, on July 1, 2019, Nevada Gold Mines was established, which includes Barrick’s Cortez, Goldstrike, Turquoise Ridge and Goldrush properties and Newmont’s Carlin, Twin Creeks, Phoenix, Long Canyon and Lone Tree properties. Barrick is the operator of the joint venture and owns 61.5%, with Newmont Goldcorp owning the remaining 38.5% of the joint venture. Refer to the following pages for a detailed discussion of Cortez, Carlin (including Goldstrike) and Turquoise Ridge (including Twin Creeks) results.
| BARRICK THIRD QUARTER 2019 | 42 | MANAGEMENT’S DISCUSSION AND ANALYSIS |
Cortez (61.5% basis)a, Nevada USA
| Summary of Operating and Financial Data | For the three months ended | For the nine months ended | ||||||||||||||||||||||||||||||
| 9/30/19 | 6/30/19 | % Change | 9/30/18 | % Change | 9/30/19 | 9/30/18 | % Change | |||||||||||||||||||||||||
| Total tonnes mined (000s) | 23,357 | 31,598 | (26 | )% | 30,174 | (23 | )% | 82,527 | 93,843 | (12 | )% | |||||||||||||||||||||
Open pit ore | 2,158 | 3,945 | (45 | )% | 4,804 | (55 | )% | 10,764 | 11,909 | (10 | )% | |||||||||||||||||||||
Open pit waste | 20,948 | 27,283 | (23 | )% | 25,029 | (16 | )% | 70,754 | 80,909 | (13 | )% | |||||||||||||||||||||
Underground | 251 | 370 | (32 | )% | 341 | (26 | )% | 1,009 | 1,025 | (2 | )% | |||||||||||||||||||||
Average grade (grams/tonne) | ||||||||||||||||||||||||||||||||
Open pit mined | 0.42 | 0.65 | (35 | )% | 2.39 | (82 | )% | 1.00 | 2.87 | (65 | )% | |||||||||||||||||||||
Underground mined | 11.41 | 10.74 | 6 | % | 10.57 | 8 | % | 10.39 | 10.72 | (3 | )% | |||||||||||||||||||||
Processed | 1.54 | 1.82 | (15 | )% | 2.38 | (35 | )% | 1.68 | 2.68 | (37 | )% | |||||||||||||||||||||
Ore tonnes processed (000s) | 2,837 | 5,014 | (43 | )% | 4,997 | (43 | )% | 13,324 | 11,929 | 12 | % | |||||||||||||||||||||
Oxide mill | 654 | 1,114 | (41 | )% | 1,091 | (40 | )% | 2,824 | 3,348 | (16 | )% | |||||||||||||||||||||
Roaster | 329 | 592 | (44 | )% | 541 | (39 | )% | 1,397 | 1,181 | 18 | % | |||||||||||||||||||||
Heap leach | 1,854 | 3,308 | (44 | )% | 3,365 | (45 | )% | 9,103 | 7,400 | 23 | % | |||||||||||||||||||||
Recovery rate | 84 | % | 84 | % | 0 | % | 85 | % | (1 | )% | 89 | % | 88 | % | 1 | % | ||||||||||||||||
Oxide Mill | 79 | % | 78 | % | 2 | % | 82 | % | (3 | )% | 80 | % | 83 | % | (4 | )% | ||||||||||||||||
Roaster | 86 | % | 88 | % | (2 | )% | 92 | % | (6 | )% | 87 | % | 91 | % | (5 | )% | ||||||||||||||||
Gold produced (000s oz) | 126 | 280 | (55 | )% | 326 | (61 | )% | 668 | 906 | (26 | )% | |||||||||||||||||||||
Oxide mill | 34 | 82 | (59 | )% | 108 | (69 | )% | 218 | 457 | (52 | )% | |||||||||||||||||||||
Roaster | 62 | 131 | (53 | )% | 188 | (67 | )% | 295 | 335 | (12 | )% | |||||||||||||||||||||
Heap leach | 30 | 67 | (55 | )% | 30 | — | % | 155 | 114 | 36 | % | |||||||||||||||||||||
Gold sold (000s oz) | 126 | 281 | (55 | )% | 354 | (64 | )% | 666 | 911 | (27 | )% | |||||||||||||||||||||
Revenue ($ millions) | 185 | 368 | (50 | )% | 432 | (57 | %) | 892 | 1,166 | (24 | )% | |||||||||||||||||||||
Cost of sales ($ millions) | 105 | 202 | (48 | )% | 224 | (53 | )% | 484 | 595 | (19 | )% | |||||||||||||||||||||
Income ($ millions) | 77 | 158 | (51 | )% | 199 | (61 | )% | 390 | 550 | (29 | )% | |||||||||||||||||||||
EBITDA ($ millions)b | 109 | 223 | (51 | )% | 301 | (64 | )% | 551 | 824 | (33 | )% | |||||||||||||||||||||
EBITDA marginc | 59 | % | 61 | % | (2 | )% | 70 | % | (15 | )% | 62 | % | 71 | % | (12 | )% | ||||||||||||||||
Capital expenditures ($ millions)d,e | 53 | 83 | (36 | )% | 97 | (46 | )% | 212 | 255 | (17 | )% | |||||||||||||||||||||
Minesite sustainingd | 22 | 15 | 47 | % | 22 | 0 | % | 50 | 49 | 1 | % | |||||||||||||||||||||
Projectd | 31 | 68 | (55 | )% | 75 | (59 | )% | 162 | 206 | (22 | )% | |||||||||||||||||||||
Cost of sales ($/oz) | 829 | 719 | 15 | % | 630 | 32 | % | 725 | 653 | 11 | % | |||||||||||||||||||||
Total cash costs ($/oz)b | 570 | 489 | 17 | % | 342 | 67 | % | 482 | 352 | 37 | % | |||||||||||||||||||||
All-in sustaining costs ($/oz)b | 772 | 561 | 38 | % | 444 | 74 | % | 580 | 433 | 34 | % | |||||||||||||||||||||
All-in costs ($/oz)b | 1,020 | 795 | 28 | % | 657 | 55 | % | 818 | 660 | 24 | % | |||||||||||||||||||||
| a. | On July 1, 2019, Cortez was contributed to Nevada Gold Mines, a joint venture with Newmont Goldcorp. As a result, the amounts presented are on an 100% basis up until June 30, 2019, and on a 61.5% basis thereafter. |
| b. | These arenon-GAAP financial performance measures with no standardized meaning under IFRS and therefore may not be comparable to similar measures presented by other issuers. For further information and a detailed reconciliation of eachnon-GAAP measure used in this section of the MD&A to the most directly comparable IFRS measure, please see pages 77 to 98 of this MD&A. |
| c. | Represents EBITDA divided by revenue. |
| d. | Presented on a cash basis as a result of adopting IFRS 16Leasesstarting in the first quarter of 2019. Capital expenditures for the three and nine months ended September 30, 2018 are presented on an accrued basis. Please refer to page 30 of this MD&A for more details. |
| e. | Amounts presented exclude capitalized interest. |
On July 1, 2019, Barrick’s Cortez operations were contributed to Nevada Gold Mines, a joint venture with Newmont Goldcorp. As a result, the amounts presented represent Cortez on a 100% basis up until June 30, 2019 and on a 61.5% basis thereafter.
Safety and Environment
There were no Lost Time Injuries (“LTI”) at Cortez during the quarter which resulted in a Lost Time Injury Frequency Rate (“LTIFR”) of zero per million hours worked which is an improvement on the previous quarter. No major environmental incidents occurred during the quarter.
Financial Results
Q3 2019 compared to Q2 2019
Cortez’s income for the third quarter of 2019 reflects our 61.5% interest in Nevada Gold Mines following the formation of Nevada Gold Mines on July 1, 2019. Income for Cortez for the prior quarter represents Barrick’s 100% share of the Cortez operations. This change in ownership is the primary driver of the decrease in income. In addition to this impact, Cortez’s income in the current quarter was lower due to a decrease in sales volume and higher cost of sales per ounce2,partially offset by the higher realized gold price1.
Gold production in the third quarter of 2019 was 55% lower compared to the prior quarter, primarily due to the reduction in Barrick’s interest in Cortez from 100% in the prior quarter
| BARRICK THIRD QUARTER 2019 | 43 | MANAGEMENT’S DISCUSSION AND ANALYSIS |
to 61.5% from July 1, 2019. In addition to this impact, grades processed were lower and less ore was processed at the Cortez oxide mill and Carlin roasters in the current quarter as mining from CHOP was completed in the second quarter.
Cost of sales per ounce2 and total cash costs per ounce1 in the third quarter of 2019 were 15% and 17% higher, respectively, versus the prior quarter due to lower grades processed as mining in the higher grade CHOP was completed during the second quarter and the Crossroads pit remained in a stripping phase. In the third quarter of 2019,all-in sustaining costs per ounce1 increased by 38% compared to the prior quarter due to higher total cash costs per ounce1 and higher minesite sustaining capital expenditures as Crossroads transitioned frompre-production in the second quarter to production status in the third quarter.
Capital expenditures in the third quarter of 2019 decreased by 36% compared to the prior quarter due to the reduction in Barrick’s interest in Cortez from 100% in the prior quarter to 61.5% from July 1, 2019. In addition to this impact, project capital expenditures were lower relative to the second quarter of 2019 as the Crossroads pit was inpre-production in the second quarter and has transitioned to production status in the third quarter. Higher minesite sustaining capital expenditures relative to the second quarter of 2019 is attributed to a strategic land acquisition adjacent to the Cortez operations that occurred in the third quarter.
Q3 2019 compared to Q3 2018
Cortez’s income for the three month period ended September 30, 2019 reflects the formation of Nevada Gold Mines as described above. Income for Cortez for the same prior year period represents Barrick’s 100% share of the Cortez operations. In addition to this impact, Cortez’s income was lower than the same prior year period due to a decrease in sales volume, and higher cost of sales per ounce2partially offset by the higher realized gold price1.
Gold production for the three month period ended September 30, 2019 was 61% lower compared to the prior quarter due to the reduction in Barrick’s interest in Cortez from 100% in the same prior year period to 61.5% in the current period. In addition to this impact, gold production was lower compared to the same prior year period due to lower grades processed as mining from the high grade CHOP was completed in the second quarter of 2019. This was partially offset by higher leach pad production. Leach production has increased as mining and placement of ore from Crossroads has ramped up and more tonnes are placed under solution.
Cost of sales per ounce2 and total cash costs per ounce1for the three month period ended September 30, 2019 were 32% and 67% higher respectively than the same prior year period, due to lower grades processed as mining from CHOP was completed in the second quarter of 2019 combined with increased royalty costs and more tonnes hauled. Royalties have increased as production shifts from CHOP to Crossroads, which carries a higher royalty rate. In relation to cost of sales per ounce2 this impact was partially offset by lower depreciation. CHOP has higher depreciation on a per ounce basis relative to other ore mined at Cortez, and therefore, depreciation per ounce has decreased with the completion of mining at CHOP.For the three month period ended September 30, 2019,all-in sustaining costs per ounce1 increased by 74% compared to the same prior year period, due to higher total cash costs per ounce1.
Capital expenditures for the three month period ended September 30, 2019 decreased by 46% from the same prior year period due to the reduction in Barrick’s interest in Cortez from 100% in the same prior year period to 61.5% in the current quarter. In addition to this impact, lower project capital expenditures was due to the ramp down in the Rangefront Declines, Deep South, and Crossroads dewatering projects partially offset by higher Crossroadspre-production stripping.
YTD Q3 2019 compared to YTD Q3 2018
Cortez’s income for the nine month period ended September 30, 2019 reflects the formation of Nevada Gold Mines as described above. Income for Cortez for the same prior year period represents Barrick’s 100% share of the Cortez operations. In addition to this impact, Cortez’s income was impacted by a decrease in sales volume and higher cost of sales per ounce2partially offset by the higher realized gold price1.
Gold production for the nine month period ended September 30, 2019 was 26% lower compared to the same prior year period, primarily due to the reduction in Barrick’s interest in Cortez from July 1, 2019 combined with lower grades mined and processed from CHOP as mining was completed in the second quarter of 2019. This was partially offset by increased ore processed at the Carlin Roasters, higher leach production, and a reduction of gold in circuit. In the second quarter of 2018, the Goldstrike roaster had a planned 21 day maintenance event impacting production. Leach production has increased as mining and placement from Crossroads has ramped up and additional tonnes placed under solution. The lower gold in circuit balances were also related to the completion of mining at CHOP as the high grade CHOP ore in circuit was drawn down by the end of the second quarter.
Cost of sales per ounce2 for the nine month period ended September 30, 2019 was 11% higher than the same prior year period, due to higher total cash costs per ounce1 partially offset by lower depreciation per ounce. CHOP has higher depreciation on a per ounce basis relative to other ore mined at Cortez, and therefore, depreciation per ounce has decreased with the completion of mining at CHOP. Total cash costs per ounce1was 37% higher than the same prior year period, due to lower grades as mining from CHOP was completed in the second quarter of 2019 combined with increased royalty costs and more tonnes hauled. Royalties have increased as production shifts from CHOP to Crossroads, which carries a higher royalty rate.For the nine month period ended September 30, 2019,all-in sustaining costs per ounce1 increased by 34% compared to the same prior year period, due to higher total cash costs1.
Capital expenditures for the nine month period ended September 30, 2019 were 17% lower than the same prior year period due to the reduction in Barrick’s interest in Cortez from 100% to 61.5% from July 1, 2019. In addition to this, the lower project capital expenditures was due to the ramp down in the Rangefront Declines, Deep South, and Crossroads dewatering projects, partially offset by higher Crossroads stripping.
| BARRICK THIRD QUARTER 2019 | 44 | MANAGEMENT’S DISCUSSION AND ANALYSIS |
Carlin (61.5% basis)a, Nevada USA
| Summary of Operating and Financial Data | For the three months ended | For the nine months ended | ||||||||||||||||||||||||||||||
| 9/30/19 | 6/30/19 | % Change | 9/30/18 | % Change | 9/30/19 | 9/30/18 | % Change | |||||||||||||||||||||||||
Total tonnes mined (000s) | 11,584 | 12,138 | (5 | )% | 12,698 | (9 | )% | 35,704 | 48,043 | (26 | )% | |||||||||||||||||||||
Open pit ore | 1,627 | 394 | 313 | % | 1,832 | (11 | )% | 2,941 | 2,782 | 6 | % | |||||||||||||||||||||
Open pit waste | 9,145 | 11,286 | (19 | )% | 10,445 | (12 | )% | 31,012 | 44,091 | (30 | )% | |||||||||||||||||||||
Underground | 812 | 458 | 77 | % | 421 | 93 | % | 1,751 | 1,170 | 50 | % | |||||||||||||||||||||
Average grade (grams/tonne) | ||||||||||||||||||||||||||||||||
Open pit mined | 1.44 | 1.43 | 1 | % | 4.13 | (65 | )% | 0.75 | 3.63 | (79 | )% | |||||||||||||||||||||
Underground mined | 8.61 | 9.32 | (8 | )% | 9.19 | (6 | )% | 8.93 | 9.11 | (2 | )% | |||||||||||||||||||||
Processed | 3.33 | 4.26 | (22 | )% | 4.66 | (29 | )% | 3.87 | 4.07 | (5 | )% | |||||||||||||||||||||
Ore tonnes processed (000s) | 3,188 | 1,961 | 63 | % | 1,975 | 61 | % | 7,311 | 5,915 | 24 | % | |||||||||||||||||||||
Oxide mill | 663 | n/a | n/a | n/a | n/a | 663 | n/a | n/a | ||||||||||||||||||||||||
Roasters | 980 | 772 | 27 | % | 869 | 13 | % | 2,636 | 2,457 | 7 | % | |||||||||||||||||||||
Autoclave | 810 | 1,189 | (32 | )% | 1,106 | (27 | )% | 3,277 | n/a | n/a | ||||||||||||||||||||||
Heap leach | 735 | n/a | n/a | n/a | n/a | 735 | 3,458 | n/a | ||||||||||||||||||||||||
Recovery rate | 76 | % | 71 | % | 7 | % | 74 | % | 3 | % | 75 | % | 74 | % | 1 | % | ||||||||||||||||
Roasters | 87 | % | 86 | % | 2 | % | 90 | % | (3 | )% | 86 | % | 88 | % | (3 | )% | ||||||||||||||||
Autoclave | 63 | % | 50 | % | 25 | % | 43 | % | 46 | % | 60 | % | 53 | % | 13 | % | ||||||||||||||||
Gold produced (000s oz) | 278 | 181 | 54 | % | 219 | 27 | % | 692 | 574 | 21 | % | |||||||||||||||||||||
Oxide mill | 14 | n/a | n/a | n/a | n/a | 14 | n/a | n/a | ||||||||||||||||||||||||
Roasters | 213 | 124 | 72 | % | 176 | 21 | % | 489 | 410 | 19 | % | |||||||||||||||||||||
Autoclave | 38 | 57 | (33 | )% | 43 | (12 | )% | 176 | 164 | 7 | % | |||||||||||||||||||||
Heap leach | 13 | n/a | n/a | n/a | n/a | 13 | n/a | n/a | ||||||||||||||||||||||||
Gold sold (000s oz) | 272 | 181 | 50 | % | 242 | 12 | % | 692 | 591 | 17 | % | |||||||||||||||||||||
Revenue ($ millions) | 401 | 235 | 71 | % | 294 | 36 | % | 947 | 759 | 25 | % | |||||||||||||||||||||
Cost of sales ($ millions) | 274 | 203 | 35 | % | 250 | 9 | % | 703 | 647 | 9 | % | |||||||||||||||||||||
Income ($ millions) | 121 | 33 | 265 | % | 42 | 187 | % | 237 | 104 | 127 | % | |||||||||||||||||||||
EBITDA ($ millions)b | 183 | 86 | 112 | % | 115 | 59 | % | 418 | 292 | 43 | % | |||||||||||||||||||||
EBITDA marginc | 46 | % | 37 | % | 24 | % | 39 | % | 16 | % | 44 | % | 38 | % | 15 | % | ||||||||||||||||
Capital expenditures ($ millions)d | 56 | 54 | 4 | % | 31 | 78 | % | 160 | 147 | 9 | % | |||||||||||||||||||||
Minesite sustainingd | 56 | 54 | 4 | % | 31 | 78 | % | 160 | 147 | 9 | % | |||||||||||||||||||||
Projectd | 0 | 0 | 0 | % | 0 | 0 | % | 0 | 0 | 0 | % | |||||||||||||||||||||
Cost of sales ($/oz) | 1,007 | 1,116 | (10 | )% | 1,047 | (4 | )% | 1,015 | 1,098 | (8 | )% | |||||||||||||||||||||
Total cash costs ($/oz)b | 775 | 769 | 1 | % | 738 | 5 | % | 738 | 775 | (5 | )% | |||||||||||||||||||||
All-in sustaining costs ($/oz)b | 1,014 | 1,088 | (7 | )% | 892 | 14 | % | 992 | 1,046 | (5 | )% | |||||||||||||||||||||
All-in costs ($/oz)b | 1,014 | 1,088 | (7 | )% | 892 | 14 | % | 992 | 1,046 | (5 | )% | |||||||||||||||||||||
| a. | On July 1, 2019, Barrick’s Goldstrike and Newmont Goldcorp’s Carlin were contributed to Nevada Gold Mines and are now referred to as Carlin. As a result, the amounts presented represent Goldstrike on a 100% basis (including our 60% share of South Arturo) up until June 30, 2019, and the combined results of Carlin and Goldstrike (including our 60% share of South Arturo) on a 61.5% basis thereafter. |
| b. | These arenon-GAAP financial performance measures with no standardized meaning under IFRS and therefore may not be comparable to similar measures presented by other issuers. For further information and a detailed reconciliation of eachnon-GAAP measure used in this section of the MD&A to the most directly comparable IFRS measure, please see pages 77 to 98 of this MD&A. |
| c. | Represents EBITDA divided by revenue. |
| d. | Presented on a cash basis as a result of adopting IFRS 16Leasesstarting in the first quarter of 2019. Capital expenditures for the three and nine months ended September 30, 2018 are presented on an accrued basis. Please refer to page 30 of this MD&A for more details. |
On July 1, 2019, Barrick’s Goldstrike and Newmont Goldcorp’s Carlin were contributed to Nevada Gold Mines and are now referred to as Carlin. As a result, the amounts presented represent Goldstrike on a 100% basis (including our 60% share of South Arturo) up until June 30, 2019, and the combined results of Carlin and Goldstrike (including our 60% share of South Arturo) on a 61.5% basis thereafter. As a result of this transaction, there is now a higher proportion of open pit ore mined and consequently the average grade processed is lower which also aligns with the inclusion of a heap leach facility contributed by Newmont Goldcorp.
Safety and Environment
Five LTIs were recorded during the quarter (Goldstrike and Carlin) with an LTIFR of 2.05 per million hours worked versus 2.43 the previous quarter (Goldstrike only). Site leadership teams continue to focus their field engagements to reduce the occurrence of injuries that result from pinch-points and slips, trips and falls. As a result, Carlin achieved zero LTI for the month of September. No major environmental incidents occurred during the quarter.
| BARRICK THIRD QUARTER 2019 | 45 | MANAGEMENT’S DISCUSSION AND ANALYSIS |
Financial Results
Q3 2019 compared to Q2 2019
Carlin’s income for the third quarter of 2019 reflects our 61.5% interest in Nevada Gold Mines and is inclusive of income from Newmont Goldcorp’s former Carlin operations and the Goldstrike operations following the formation of Nevada Gold Mines on July 1, 2019. Income for Carlin for the prior quarter represents Barrick’s 100% interest in the Goldstrike operations prior to the formation of Nevada Gold Mines. Consequently, this was the primary driver of the 265% increase in Carlin’s income compared to the second quarter of 2019.
Gold production in the third quarter of 2019 was 54% higher compared to the prior quarter, primarily due to the inclusion of Newmont Goldcorp’s former Carlin operations from July 1, 2019, partially offset by the reduction in Barrick’s interest in Goldstrike from 100% in the prior quarter to 61.5% from July 1, 2019.
Cost of sales per ounce2 in the third quarter of 2019 was 10% lower than the prior quarter mainly due to lower depreciation on a per ounce sold basis.Total cash costs per ounce1were in line with the prior quarter as the higher tonnes processed across the combined operations more than compensated for the lower average grade. In the third quarter of 2019,all-in sustaining costs per ounce1 decreased by 7% compared to the prior quarter primarily due to lower minesite sustaining capital expenditures on a per ounce sold basis.
Capital expenditures in the third quarter of 2019 increased by 4% compared to the prior quarter due to higher sustaining capital expenditures, primarily due to the inclusion of Newmont Goldcorp’s former Carlin operations from July 1, 2019 partially offset by the reduction in Barrick’s interest in Goldstrike from 100% in the prior quarter to 61.5% from July 1, 2019.
Q3 2019 compared to Q3 2018
Carlin’s income for the three month period ended September 30, 2019 was 187% higher than the same prior year period primarily due to an increase in gold sales volume and the higher realized gold price1.
Gold production for the three month period ended September 30, 2019 was 27% higher compared to the same prior year period, primarily due to the inclusion of Newmont Goldcorp’s former Carlin operations from July 1, 2019, partially offset by the reduction in Barrick’s interest in Goldstrike from 100% in the prior year period to 61.5% in the current period.
Cost of sales per ounce2 for the three month period ended September 30, 2019 was in line with the same prior year period. Total cash costs per ounce1 for the current period was 5% higher than the same prior year period mainly due to the change to an overall lower grade ore processed, partially offset by the higher volumes processed through the combination of Newmont Goldcorp’s former Carlin operations
and Goldstrike. For the three month period ended September 30, 2019,all-in sustaining costs per ounce1 increased by 14% compared to the same prior year period primarily due to the higher total cash costs per ounce1and higher minesite sustaining capital expenditures.
Capital expenditures for the three month period ended September 30, 2019 increased by 78% mainly due to an increase in minesite sustaining capital expenditures. Higher minesite sustaining capital expenditure was driven by the inclusion of Newmont Goldcorp’s former Carlin operations in the current period as well as an increase in underground development associated with the Ren deposit.
YTD Q3 2019 compared to YTD Q3 2018
Carlin’s income for the nine month period ended September 30, 2019 was 127% higher than the same prior year period primarily due to an increase in gold sales volume, a decrease in cost of sales per ounce2 and the higher realized gold price1.
Gold production for the nine month period ended September 30, 2019 was 21% higher compared to the same prior year period, primarily due to the inclusion of Newmont Goldcorp’s former Carlin operations. This was partially offset by the reduction in Barrick’s interest in Goldstrike from 100% to 61.5% from July 1, 2019 and higher production in the first six months of the current period as a scheduled roaster maintenance shutdown occurred in the first six months of the prior year period.
Cost of sales per ounce2 and total cash costs per ounce1 for the nine month period ended September 30, 2019 were 8% and 5% lower, respectively, than the same prior year period mainly due to the impact of increased production related to the higher volumes processed through the combination of Newmont Goldcorp’s former Carlin operations and Goldstrike operations partially offset by the change to an overall lower grade ore processed. For the nine month period ended September 30, 2019,all-in sustaining costs per ounce1 decreased by 5% compared to the same prior year period primarily due to the impact of lower total cash costs per ounce1.
Capital expenditures for the nine month period ended September 30, 2019 increased by 9% from the same prior year period due to higher minesite sustaining capital expenditures. Higher minesite sustaining capital expenditures are attributed to the inclusion of Newmont Goldcorp’s former Carlin operations, partially offset by the reduction in Barrick’s interest in Goldstrike from 100% to 61.5% from July 1, 2019. Offsetting this impact, minesite sustaining capital was lower in the first six months of the current period relative to the prior year period as a result of lower capitalized stripping from the fourth northwest layback atBetze-Post, partially offset by increased underground development for capital drilling.
| BARRICK THIRD QUARTER 2019 | 46 | MANAGEMENT’S DISCUSSION AND ANALYSIS |
Turquoise Ridge (61.5%)a, Nevada USA
| Summary of Operating and Financial Data | For the three months ended | For the nine months ended | ||||||||||||||||||||||||||||||
| 9/30/19 | 6/30/19 | % Change | 9/30/18 | % Change | 9/30/19 | 9/30/18 | % Change | |||||||||||||||||||||||||
Total tonnes mined (000s) | 4,811 | 180 | 2,573 | % | 167 | 2,781 | % | 5,182 | 489 | 960 | % | |||||||||||||||||||||
Open pit ore | 732 | n/a | n/a | n/a | n/a | 732 | n/a | n/a | ||||||||||||||||||||||||
Open pit waste | 3,892 | n/a | n/a | n/a | n/a | 3,892 | n/a | n/a | ||||||||||||||||||||||||
Underground | 187 | 180 | 4 | % | 167 | 12 | % | 558 | 489 | 14 | % | |||||||||||||||||||||
Average grade (grams/tonne) | ||||||||||||||||||||||||||||||||
Open pit mined | 1.01 | n/a | n/a | n/a | n/a | 1.01 | n/a | n/a | ||||||||||||||||||||||||
Underground mined | 13.28 | 14.28 | (7 | )% | 14.31 | (7 | )% | 14.57 | 14.69 | (1 | )% | |||||||||||||||||||||
Processed | 3.78 | 15.25 | (75 | )% | 14.84 | (75 | )% | 6.61 | 14.42 | (54 | )% | |||||||||||||||||||||
Ore tonnes processed (000s) | 950 | 162 | 486 | % | 179 | 431 | % | 1,267 | 448 | 183 | % | |||||||||||||||||||||
Oxide Mill | 107 | n/a | n/a | n/a | n/a | 107 | n/a | n/a | ||||||||||||||||||||||||
Autoclave | 506 | 162 | 212 | % | 179 | 183 | % | 823 | 448 | 84 | % | |||||||||||||||||||||
Heap leach | 337 | n/a | n/a | n/a | n/a | 337 | n/a | n/a | ||||||||||||||||||||||||
Recovery rate | 89 | % | 91 | % | (2 | )% | 93 | % | (4 | )% | 90 | % | 93 | % | (3 | )% | ||||||||||||||||
Oxide Mill | 87 | % | n/a | n/a | n/a | n/a | 87 | % | n/a | n/a | ||||||||||||||||||||||
Autoclave | 89 | % | 91 | % | (2 | )% | 93 | % | (4 | )% | 91 | % | 93 | % | (2 | )% | ||||||||||||||||
Gold produced (000s oz) | 82 | 65 | 26 | % | 79 | 4 | % | 224 | 194 | 15 | % | |||||||||||||||||||||
Oxide Mill | 5 | n/a | n/a | n/a | n/a | 5 | n/a | n/a | ||||||||||||||||||||||||
Autoclave | 74 | 65 | 14 | % | 79 | (6 | )% | 216 | 194 | 11 | % | |||||||||||||||||||||
Heap leach | 3 | n/a | n/a | n/a | n/a | 3 | n/a | n/a | ||||||||||||||||||||||||
Gold sold (000s oz) | 96 | 85 | 13 | % | 75 | 28 | % | 257 | 196 | 31 | % | |||||||||||||||||||||
Revenue ($ millions) | 142 | 110 | 29 | % | 90 | 58 | % | 352 | 249 | 41 | % | |||||||||||||||||||||
Cost of sales ($ millions) | 103 | 57 | 81 | % | 60 | 72 | % | 205 | 152 | 35 | % | |||||||||||||||||||||
Income ($ millions) | 38 | 53 | (28 | )% | 30 | 27 | % | 145 | 97 | 49 | % | |||||||||||||||||||||
EBITDA ($ millions)b | 81 | 62 | 30 | % | 37 | 118 | % | 203 | 118 | 72 | % | |||||||||||||||||||||
EBITDA marginc | 57 | % | 56 | % | 1 | % | 41 | % | 38 | % | 58 | % | 47 | % | 21 | % | ||||||||||||||||
Capital expenditures ($ millions)d | 26 | 19 | 36 | % | 15 | 72 | % | 61 | 42 | 45 | % | |||||||||||||||||||||
Minesite sustainingd | 18 | 7 | 155 | % | 3 | 494 | % | 32 | 13 | 145 | % | |||||||||||||||||||||
Projectd | 8 | 12 | (33 | )% | 12 | (33 | )% | 29 | 29 | 0 | % | |||||||||||||||||||||
Cost of sales ($/oz) | 1,077 | 665 | 62 | % | 805 | 34 | % | 797 | 777 | 3 | % | |||||||||||||||||||||
Total cash costs ($/oz)b | 622 | 569 | 9 | % | 711 | (13 | )% | 570 | 671 | (15 | )% | |||||||||||||||||||||
All-in sustaining costs ($/oz)b | 840 | 667 | 26 | % | 757 | 11 | % | 710 | 743 | (4 | )% | |||||||||||||||||||||
All-in costs ($/oz)b | 927 | 806 | 15 | % | 920 | 1 | % | 825 | 891 | (7 | )% | |||||||||||||||||||||
| a. | Barrick owned 75% of Turquoise Ridge through the end of the second quarter of 2019, with our joint venture partner, Newmont Goldcorp, owning the remaining 25%. Turquoise Ridge was proportionately consolidated on the basis that the joint venture partners that have joint control have rights to the assets and obligations for the liabilities relating to the arrangement. The figures presented in this table are based on our 75% interest in Turquoise Ridge until June 30, 2019. On July 1, 2019, Barrick’s 75% interest in Turquoise Ridge and Newmont Goldcorp’s Twin Creeks and 25% interest in Turquoise Ridge were contributed to Nevada Gold Mines. Starting July 1, 2019, the results represent our 61.5% share of Turquoise Ridge and Twin Creeks, now referred to as Turquoise Ridge. |
| b. | These arenon-GAAP financial performance measures with no standardized meaning under IFRS and therefore may not be comparable to similar measures presented by other issuers. For further information and a detailed reconciliation of eachnon-GAAP measure used in this section of the MD&A to the most directly comparable IFRS measure, please see pages 77 to 98 of this MD&A. |
| c. | Represents EBITDA divided by revenue. |
| d. | Presented on a cash basis as a result of adopting IFRS 16Leasesstarting in the first quarter of 2019. Capital expenditures for the three and nine months ended September 30, 2018 are presented on an accrued basis. Please refer to page 30 of this MD&A for more details. |
Barrick owned 75% of Turquoise Ridge through the end of the second quarter of 2019, with our joint venture partner, Newmont Goldcorp, owning the remaining 25%. Turquoise Ridge was proportionately consolidated on the basis that the joint venture partners that have joint control have rights to the assets and obligations for the liabilities relating to the arrangement. The figures presented in this table are based on our 75% interest in Turquoise Ridge until June 30, 2019. On July 1, 2019, Barrick’s 75% interest in Turquoise Ridge and Newmont Goldcorp’s Twin Creeks and 25% interest in Turquoise Ridge were contributed to Nevada Gold Mines. Starting July 1, 2019, the results represent our 61.5% share
of Turquoise Ridge and Twin Creeks, now referred to as Turquoise Ridge.
Safety and Environment
There was one LTI during the quarter (Turquoise Ridge and Twin Creeks) which resulted in an LTIFR of 1.41 per million hours worked versus zero the previous quarter (Turquoise Ridge only). No major environmental incidents occurred during the quarter.
| BARRICK THIRD QUARTER 2019 | 47 | MANAGEMENT’S DISCUSSION AND ANALYSIS |
Financial Results
Q3 2019 compared to Q2 2019
Turquoise Ridge’s income for the third quarter of 2019 reflects our 61.5% interest in Nevada Gold Mines and is inclusive of income from the Twin Creeks operations following the formation of Nevada Gold Mines on July 1, 2019. Income for Turquoise Ridge for the prior quarter represents Barrick’s 75% share of the Turquoise Ridge operations. In addition to this impact, the Turquoise Ridge assets have been restated to fair market value as a consequence of the transaction which results in a higher depreciation charge from July 1, 2019. This was the primary driver of the lower income in the current quarter relative to the prior quarter. Partially offsetting this impact was higher sales volume and the higher realized gold price1.
Gold production in the third quarter of 2019 was 26% higher than the prior quarter, primarily due to the inclusion of Twin Creeks partially offset by the reduction in Barrick’s interest in Turquoise Ridge from 75% in the prior quarter to 61.5% from July 1, 2019.
Cost of sales per ounce2 in the third quarter of 2019 was 62% higher than the prior quarter primarily reflecting higher depreciation charges resulting from restatement of assets to fair value on the formation of Nevada Gold Mines as described above. Total cash costs per ounce1was 9% higher than the prior quarter resulting from the inclusion of lower grade open pit ore from Twin Creeks, partially offset by the lower costs of mining and processing on a per tonne basis as the formation of Nevada Gold Mines has transformed the business from an underground mining operation to an integrated mine site with an open pit and processing facilities.All-in sustaining costs per ounce1 increased by 26% compared to the prior quarter primarily reflecting higher total cash costs per ounce1 and higher minesite sustaining capital expenditure.
Capital expenditures in the third quarter of 2019 increased by 36% compared to the prior quarter due to higher minesite sustaining capital expenditure which was driven by the inclusion of Twin Creeks from July 1, 2019.
Q3 2019 compared to Q3 2018
Turquoise Ridge’s income for the three month period ended September 30, 2019 reflects the formation of Nevada Gold Mines and the higher depreciation charge resulting from the restatement of the Turquoise Ridge assets to fair market value as described above. Notwithstanding this impact, Turquoise Ridge’s income in the current quarter was higher than the prior quarter due to higher sales volume and the higher realized gold price1, partially offset by higher cost of sales per ounce2.
Gold production for the three month period ended September 30, 2019 was 4% higher compared to the same prior year period, primarily due to the inclusion of Twin Creeks partially offset by the reduction in Barrick’s interest in Turquoise Ridge from 75% in the prior quarter to 61.5% from July 1, 2019.
Cost of sales per ounce2 for the three month period ended September 30, 2019 was 34% higher than the same prior year
period reflecting the higher depreciation charges following the restatement to fair value as described above. For the three month period ended September 30, 2019, total cash costs per ounce1decreased by 13% compared to the same prior year period primarily due to lower costs of mining and processing on a per tonne basis partially offset by the lower grade Twin Creeks open pit ore.All-in sustaining costs per ounce1 increased by 11% reflecting higher minesite sustaining capital expenditure partially offset by lower total cash costs per ounce1.
Capital expenditures for the three month period ended September 30, 2019, increased by 72% compared to the same prior year period mainly due to an increase in minesite sustaining capital expenditures. Higher minesite sustaining capital expenditure was driven by the inclusion of Twin Creeks in the current period.
YTD Q3 2019 compared to YTD Q3 2018
Turquoise Ridge’s income for the nine month period ended September 30, 2019 was 49% higher than the same prior year period primarily due to higher sales volume and higher realized gold prices1 offset by higher cost of sales per ounce2.
Gold production for the nine month period ended September 30, 2019 was 15% higher compared to the same prior year period, primarily due to the inclusion of Twin Creeks partially offset by the reduction in Barrick’s interest in Turquoise Ridge from 75% to 61.5% from July 1, 2019 and higher production in the first six months of the current period relative to the first six months of the prior year period.
Cost of sales per ounce2for the nine month period ended September 30, 2019 was 3% higher than the same prior year period primarily due to the higher depreciation charge from July 1, 2019 following the restatement to fair value as described above.For the nine month period ended September 30, 2019, total cash costs per ounce1decreased by 15% compared to the same prior year period primarily due to lower costs of mining and processing on a per tonne basis from the inclusion of Twin Creeks partially offset by the lower grade Twin Creeks open pit ore from July 1, 2019. In addition, production was higher for the first six months of the year relative to the prior period due to higher ore tonnes mined at better grades.All-in sustaining costs per ounce1 decreased by 4% compared to the same prior year period primarily reflecting lower total cash costs per ounce1offset by higher minesite sustaining capital expenditure.
Capital expenditures for the nine month period ended September 30, 2019 increased by 45% compared to the same prior year period mainly due to higher minesite sustaining capital expenditure and to a lesser extent, higher project capital expenditure. Higher minesite sustaining capital expenditure relates to the inclusion of Twin Creeks from July 1, 2019 and higher underground development and equipment replacements in the first six months. Higher project capital expenditure is attributed to a ramp up in construction activities for the third shaft.
| BARRICK THIRD QUARTER 2019 | 48 | MANAGEMENT’S DISCUSSION AND ANALYSIS |
Other Nevada Gold Mines
| Summary of Operating and Financial Data | For the three months ended | |||||||||||||||||||||||||||||||||||||||
| 9/30/19 | 6/30/19 | |||||||||||||||||||||||||||||||||||||||
| Gold produced (000s oz) | Cost of ($/oz) | Total cash ($/oz)a | All-in ($/oz)a | Capital Expend- ituresb | Gold produced (000s oz) | Cost of ($/oz) | Total cash ($/oz)a | All-in ($/oz)a | Capital Expend- ituresb | |||||||||||||||||||||||||||||||
Phoenix (61.5%)c | 25 | 2,186 | 1,010 | 1,622 | 9 | |||||||||||||||||||||||||||||||||||
Long Canyon (61.5%)c | 24 | 1,170 | 353 | 714 | 6 | |||||||||||||||||||||||||||||||||||
| a. | These arenon-GAAP financial performance measures with no standardized meaning under IFRS and therefore may not be comparable to similar measures presented by other issuers. For further information and a detailed reconciliation of eachnon-GAAP measure used in this section of the MD&A to the most directly comparable IFRS measure, please see pages 77 to 98 of this MD&A. |
| b. | Includes both minesite sustaining and project capital expenditures. |
| c. | These sites were acquired as a result of the formation of Nevada Gold Mines on July 1, 2019. |
Phoenix
Gold production for Phoenix in the third quarter of 2019 reflects our 61.5% interest in Nevada Gold Mines following the formation of Nevada Gold Mines on July 1, 2019. Cost of sales per ounce2 was $2,186 per ounce which is inclusive of the additional depreciation expense resulting from the restatement of the Phoenix assets to fair market value as a consequence of the transaction.All-in sustaining costs1in the third quarter of 2019 was $1,622 per ounce which was impacted by lower copperby-product credits related to the timing of copper concentrate sales at the end of the second quarter.
Long Canyon
Gold production for Long Canyon in the third quarter of 2019 reflects our 61.5% interest in Nevada Gold Mines following the formation of Nevada Gold Mines on July 1, 2019. Cost of sales per ounce2 was $1,170 per ounce which is inclusive of the additional depreciation expense resulting from the restatement of the Long Canyon assets to fair market value as a consequence of the transaction.All-in sustaining costs1in the third quarter of 2019 was $714 per ounce due to strong performance.
| BARRICK THIRD QUARTER 2019 | 49 | MANAGEMENT’S DISCUSSION AND ANALYSIS |
Pueblo Viejo (60% basis)a, Dominican Republic
| Summary of Operating and Financial Data | For the three months ended | For the nine months ended | ||||||||||||||||||||||||||||||
| 9/30/19 | 6/30/19 | % Change | 9/30/18 | % Change | 9/30/19 | 9/30/18 | % Change | |||||||||||||||||||||||||
Open pit tonnes mined (000s) | 5,817 | 6,116 | (5 | )% | 6,243 | (7 | )% | 19,003 | 17,875 | 6 | % | |||||||||||||||||||||
Open pit ore | 1,767 | 1,496 | 18 | % | 2,958 | (40 | )% | 5,002 | 5,868 | (15 | )% | |||||||||||||||||||||
Open pit waste | 4,050 | 4,620 | (12 | )% | 3,285 | 23 | % | 14,001 | 12,007 | 17 | % | |||||||||||||||||||||
Average grade (grams/tonne) | ||||||||||||||||||||||||||||||||
Open pit mined | 2.98 | 2.74 | 9 | % | 3.09 | (4 | )% | 2.66 | 2.74 | (3 | )% | |||||||||||||||||||||
Processed | 4.05 | 3.56 | 14 | % | 4.60 | (12 | )% | 3.79 | 3.98 | (5 | )% | |||||||||||||||||||||
Autoclave ore tonnes processed (000s) | 1,182 | 1,212 | (2 | )% | 1,185 | 0 | % | 3,700 | 3,628 | 2 | % | |||||||||||||||||||||
Recovery rate | 90 | % | 90 | % | 0 | % | 86 | % | 4 | % | 89 | % | 89 | % | 0 | % | ||||||||||||||||
Gold produced (000s oz) | 139 | 124 | 12 | % | 151 | (8 | )% | 411 | 415 | (1 | )% | |||||||||||||||||||||
Gold sold (000s oz) | 136 | 132 | 3 | % | 147 | (7 | )% | 410 | 420 | (2 | )% | |||||||||||||||||||||
Revenue ($ millions) | 213 | 192 | 11 | % | 193 | 10 | % | 603 | 589 | 2 | % | |||||||||||||||||||||
Cost of sales ($ millions) | 109 | 114 | (4 | )% | 117 | (7 | )% | 321 | 325 | (1 | )% | |||||||||||||||||||||
Income ($ millions) | 104 | 75 | 39 | % | 74 | 41 | % | 277 | 256 | 8 | % | |||||||||||||||||||||
EBITDA ($ millions)b | 133 | 104 | 28 | % | 103 | 29 | % | 363 | 337 | 8 | % | |||||||||||||||||||||
EBITDA marginc | 62 | % | 54 | % | 15 | % | 53 | % | 17 | % | 60 | % | 57 | % | 5 | % | ||||||||||||||||
Capital expenditures ($ millions)d | 16 | 18 | (11 | )% | 23 | (30 | )% | 50 | 66 | (25 | )% | |||||||||||||||||||||
Minesite sustainingd | 16 | 18 | (11 | )% | 23 | (30 | )% | 50 | 66 | (25 | )% | |||||||||||||||||||||
Projectd | 0 | 0 | 0 | % | 0 | 0 | % | 0 | 0 | 0 | % | |||||||||||||||||||||
Cost of sales ($/oz) | 807 | 852 | (5 | )% | 803 | 0 | % | 783 | 775 | 1 | % | |||||||||||||||||||||
Total cash costs ($/oz)b | 504 | 557 | (10 | )% | 517 | (3 | )% | 492 | 481 | 2 | % | |||||||||||||||||||||
All-in sustaining costs ($/oz)b | 631 | 702 | (10 | )% | 688 | (8 | )% | 623 | 648 | (4 | )% | |||||||||||||||||||||
All-in costs ($/oz)b | 636 | 724 | (12 | )% | 688 | (8 | )% | 632 | 648 | (2 | )% | |||||||||||||||||||||
| a. | Pueblo Viejo is accounted for as a subsidiary with a 40%non-controlling interest. The results in the table and the discussion that follows are based on our 60% share only. |
| b. | These arenon-GAAP financial performance measures with no standardized meaning under IFRS and therefore may not be comparable to similar measures presented by other issuers. For further information and a detailed reconciliation of eachnon-GAAP measure used in this section of the MD&A to the most directly comparable IFRS measure, please see pages 77 to 98 of this MD&A. |
| c. | Represents EBITDA divided by revenue. |
| d. | Presented on a cash basis as a result of adopting IFRS 16Leasesstarting in the first quarter of 2019. Capital expenditures for the three and nine months ended September 30, 2018 are presented on an accrued basis. Please refer to page 30 of this MD&A for more details. |
Safety and Environment
There were no LTIs at Pueblo Viejo during the quarter which resulted in an LTIFR of zero per million hours worked versus 0.39 the previous quarter. No major environmental incidents were reported during the quarter.
Financial Results
Q3 2019 compared to Q2 2019
Pueblo Viejo’s income for the third quarter of 2019 was 39% higher than the second quarter of 2019, due to higher sales volume, higher realized gold prices1 and lower cost of sales per ounce2.
Gold production for the third quarter of 2019 was 12% higher than the prior quarter mainly due to higher head grade as a result of mining in higher grade ore zones in the Cumba and Moore pits. This was partially offset by slightly lower throughput. We expect production to increase in the fourth quarter of 2019 as a result of higher throughput, head grade and recovery, with no major shutdowns and maintenance scheduled in the last quarter of 2019.
Cost of sales per ounce2 and total cash costs per ounce1 for the third quarter of 2019 were 5% and 10% lower, respectively, than the prior quarter primarily reflecting the impact of higher sales volume that was driven by the increase in grade and production. For the third quarter of 2019,all-in sustaining costs per ounce1 decreased by 10% mainly reflecting lower total
cash costs per ounce1 and lower minesite sustaining capital expenditures.
Capital expenditures for the third quarter of 2019 decreased by 11% compared to the prior quarter, primarily due to lower capitalized stripping costs as a result of higher ore tonnes mined.
Q3 2019 compared to Q3 2018
Pueblo Viejo’s income for the three month period ended September 30, 2019 was 41% higher than the same prior year period, primarily due to higher realized gold prices1 partially offset by lower sales volumes.
Gold production for the three month period ended September 30, 2019 was 8% lower than the same prior year period, due to lower head grades as mining was focused on developing the Monte Negro and Cumba pits in the current period, whereas in the same prior year period, mining was primarily focused on the higher grade Moore pit. This was partially offset by higher recoveries.
Cost of sales per ounce2 was in line with the same prior year period as the impact of lower gold sold was offset by lower labor, contractor and maintenance costs due to the scheduled total plant shutdown which occurred in the same prior year period, whereas in the current year, the total plant shutdown occurred in the second quarter. Total cash costs per ounce1
| BARRICK THIRD QUARTER 2019 | 50 | MANAGEMENT’S DISCUSSION AND ANALYSIS |
for the three month period ended September 30, 2019 was 3% lower than the same prior year period primarily due to the timing of the total plant shutdown as explained above. For the three month period ended September 30, 2019,all-in sustaining costs per ounce1 decreased by 8% compared to the same prior year period reflecting lower total cash costs per ounce1, and lower minesite sustaining capital expenditures.
Capital expenditures for the three month period ended September 30, 2019 decreased by 30% compared to the same prior year period, primarily due to lower capitalized stripping costs resulting from lower waste tonnes mined in the Moore pit, as the current focus is on stripping in the Monte Negro and Cumba pits. This was combined with lower minesite sustaining capital expenditures driven by timing in project execution.
YTD Q3 2019 compared to YTD Q3 2018
Pueblo Viejo’s income for the nine month period ended September 30, 2019 was 8% higher than the same prior year period, primarily due to higher realized gold prices1 partially offset by lower sales volumes and higher cost of sales per ounce2.
Gold production for the nine month period ended September 30, 2019 was 1% lower than the same prior year period primarily due to lower head grades as mining was focused on developing the Monte Negro and Cumba pits in the current period, whereas in the same prior year period, mining was primarily focused on the higher grade Moore pit. This was largely offset by higher throughput.
Cost of sales per ounce2 and total cash costs per ounce1 for the nine month period ended September 30, 2019 were 1% and 2% higher, respectively, than the same prior year period mainly due to the impact of lower sales volume and lower silverby-product credits, partially offset by higher excess power generated by our power plant and sold to third parties. For the nine month period ended September 30, 2019,all-in sustaining costs per ounce1 decreased by 4% compared to the same prior year period, primarily reflecting lower minesite sustaining capital expenditures, partially offset by higher total cash costs per ounce1.
Capital expenditures for the nine month period ended September 30, 2019 decreased by 25% compared to the same prior year period, primarily due to lower capitalized stripping costs driven by lower tonnes mined in the Moore pit this year as the current focus is on stripping in the Monte Negro and Cumba pits.
| BARRICK THIRD QUARTER 2019 | 51 | MANAGEMENT’S DISCUSSION AND ANALYSIS |
Loulo-Gounkoto (80% basis)a, Mali
| Summary of Operating and Financial Data | For the three months ended | For the nine months ended | ||||||||||||||||||||||
| 9/30/19 | 6/30/19 | % Change | 9/30/19 | 9/30/18b | % Change | |||||||||||||||||||
Total tonnes mined (000s) | 8,115 | 8,048 | 1 | % | 24,942 | 23,487 | 6 | % | ||||||||||||||||
Open pit ore | 286 | 818 | (65 | )% | 1,646 | 2,413 | (32 | )% | ||||||||||||||||
Open pit waste | 7,244 | 6,673 | 9 | % | 21,617 | 19,430 | 11 | % | ||||||||||||||||
Underground | 585 | 557 | 5 | % | 1,679 | 1,644 | 2 | % | ||||||||||||||||
Average grade (grams/tonne) | ||||||||||||||||||||||||
Open pit mined | 4.06 | 4.58 | (11 | )% | 4.27 | 2.80 | 53 | % | ||||||||||||||||
Underground mined | 5.09 | 3.96 | 29 | % | 4.51 | 5.03 | (10 | )% | ||||||||||||||||
Processed | 5.14 | 4.74 | 8 | % | 4.69 | 4.05 | 16 | % | ||||||||||||||||
Ore tonnes processed (000s) | 1,013 | 1,034 | (2 | )% | 3,059 | 3,105 | (1 | )% | ||||||||||||||||
Recovery rate | 92 | % | 93 | % | (1 | )% | 93 | % | 93 | % | 0 | % | ||||||||||||
Gold produced (000s oz) | 153 | 147 | 4 | % | 428 | 375 | 14 | % | ||||||||||||||||
Gold sold (000s oz) | 155 | 148 | 5 | % | 431 | 381 | 13 | % | ||||||||||||||||
Revenue ($ millions) | 230 | 194 | 18 | % | 592 | |||||||||||||||||||
Cost of sales ($ millions) | 159 | 158 | 1 | % | 452 | |||||||||||||||||||
Income ($ millions) | 64 | 32 | 100 | % | 125 | |||||||||||||||||||
EBITDA ($ millions)c | 125 | 102 | 22 | % | 303 | |||||||||||||||||||
EBITDA margind | 54 | % | 53 | % | 3 | % | 51 | % | ||||||||||||||||
Capital expenditures ($ millions) | 49 | 31 | 57 | % | 98 | |||||||||||||||||||
Minesite sustaining | 49 | 29 | 69 | % | 96 | |||||||||||||||||||
Project | 0 | 2 | 0 | % | 2 | |||||||||||||||||||
Cost of sales ($/oz) | 1,018 | 1,072 | (5 | )% | 1,047 | |||||||||||||||||||
Total cash costs ($/oz)c | 630 | 598 | 5 | % | 635 | |||||||||||||||||||
All-in sustaining costs ($/oz)c | 966 | 811 | 19 | % | 875 | |||||||||||||||||||
All-in costs ($/oz)c | 971 | 821 | 18 | % | 880 | |||||||||||||||||||
| a. | Barrick owns 80% of Société des Mines de Loulo SA and Société des Mines de Gounkoto with the Republic of Mali owning 20%. Loulo-Gounkoto is accounted for as a subsidiary with a 20%non-controlling interest on the basis that Barrick controls the asset. The results in the table and the discussion that follows are based on our 80% share inclusive of the impact of the purchase price allocation resulting from the Merger. |
| b. | These results did not form a part of the Barrick consolidated results as this site was acquired as a result of the Merger. As a result, operational statistics are presented for reference purposes only. |
| c. | These arenon-GAAP financial performance measures with no standardized meaning under IFRS and therefore may not be comparable to similar measures presented by other issuers. For further information and a detailed reconciliation of eachnon-GAAP measure used in this section of the MD&A to the most directly comparable IFRS measure, please see pages 77 to 98 of this MD&A. |
| d. | Represents EBITDA divided by revenue. |
Safety and Environment
No LTIs were recorded during the quarter with an LTIFR of zero per million hours worked versus two the previous quarter. No major environmental incidents occurred during the quarter.
Financial Results
Q3 2019 compared to Q2 2019
Loulo-Gounkoto’s income for the third quarter of 2019 was 100% higher than the second quarter of 2019, primarily due to higher gold sales volume and higher realized gold prices1.
Gold production for the third quarter of 2019 was 4% higher than the prior quarter mainly due to higher underground grade from Yalea, partially offset by lower recovery and slightly lower throughput.
Cost of sales per ounce2 for the third quarter of 2019 was 5% lower than the prior quarter primarily due to lower depreciation. Total cash costs per ounce1was 5% higher than the prior quarter mainly due to the impact of higher mining expenditures related to increased underground maintenance and processing costs. For the third quarter of 2019,all-in sustaining costs1 increased by 19% compared to the prior quarter reflecting the higher total cash costs per ounce1 in addition to higher minesite sustaining capital expenditures.
Capital expenditures for the third quarter of 2019 increased by 57% compared to the prior quarter, primarily due to increased capitalized stripping at Gounkoto, underground development at Gara and Yalea and minesite sustaining capital.
YTD Q3 2019
Loulo-Gounkoto’s income for the nine month period ended September 30, 2019 was $125 million.
Gold production in the nine month period ended September 30, 2019 was 14% higher compared to the same prior year period, primarily due to the higher feed grade processed from Yalea and the Gounkoto South pit.
Cost of sales per ounce2 and total cash costs per ounce1 in the nine month period ended September 30, 2019 were $1,047 and $635 per ounce, respectively. Cost of sales per ounce3 and total cash costs per ounce1 were positively impacted primarily by the higher feed grade to the mill. For the nine month period ended September 30, 2019,all-in sustaining costs1 were $875 per ounce.
Capital expenditures in the nine month period ended September 30, 2019 was $98 million, consisting of underground development and drilling in Gara and Yalea, and minesite sustaining capital.
| BARRICK THIRD QUARTER 2019 | 52 | MANAGEMENT’S DISCUSSION AND ANALYSIS |
Kibali (45% basis)a, Democratic Republic of Congo
| Summary of Operating and Financial Data | For the three months ended | For the nine months ended | ||||||||||||||||||||||
| 9/30/19 | 6/30/19 | % Change | 9/30/19 | 9/30/18b | % Change | |||||||||||||||||||
Total tonnes mined (000s) | 3,077 | 2,938 | 5 | % | 9,177 | 11,126 | (18 | )% | ||||||||||||||||
Open pit ore | 269 | 426 | (37 | )% | 1,347 | 1,494 | (10 | )% | ||||||||||||||||
Open pit waste | 2,330 | 2,126 | 10 | % | 6,534 | 8,407 | (22 | )% | ||||||||||||||||
Underground | 478 | 386 | 24 | % | 1,296 | 1,225 | 6 | % | ||||||||||||||||
Average grade (grams/tonne) | ||||||||||||||||||||||||
Open pit mined | 2.26 | 2.44 | (7 | )% | 2.35 | 2.40 | (2 | )% | ||||||||||||||||
Underground mined | 5.17 | 5.27 | (2 | )% | 5.27 | 4.98 | 6 | % | ||||||||||||||||
Processed | 3.74 | 3.88 | (4 | )% | 3.84 | 3.40 | 13 | % | ||||||||||||||||
Ore tonnes processed (000s) | 852 | 850 | 0 | % | 2,542 | 3,084 | (18 | )% | ||||||||||||||||
Recovery rate | 88 | % | 89 | % | (1 | )% | 89 | % | 88 | % | 1 | % | ||||||||||||
Gold produced (000s oz) | 91 | 95 | (4 | )% | 279 | 269 | 4 | % | ||||||||||||||||
Gold sold (000s oz) | 89 | 95 | (6 | )% | 274 | 272 | 1 | % | ||||||||||||||||
Revenue ($ millions) | 133 | 125 | 6 | % | 375 | |||||||||||||||||||
Cost of sales ($ millions) | 107 | 82 | 30 | % | 297 | |||||||||||||||||||
Income ($ millions) | 25 | 43 | (42 | )% | 78 | |||||||||||||||||||
EBITDA ($ millions)c | 82 | 74 | 11 | % | 222 | |||||||||||||||||||
EBITDA margind | 62 | % | 59 | % | 3 | % | 59 | % | ||||||||||||||||
Capital expenditures ($ millions) | 14 | 10 | 40 | % | 34 | |||||||||||||||||||
Minesite sustaining | 13 | 10 | 30 | % | 32 | |||||||||||||||||||
Project | 1 | 0 | 0 | % | 2 | |||||||||||||||||||
Cost of sales ($/oz) | 1,187 | 868 | 37 | % | 1,081 | |||||||||||||||||||
Total cash costs ($/oz)c | 554 | 540 | 3 | % | 555 | |||||||||||||||||||
All-in sustaining costs ($/oz)c | 703 | 651 | 8 | % | 678 | |||||||||||||||||||
All-in costs ($/oz)c | 717 | 655 | 9 | % | 685 | |||||||||||||||||||
| a. | Barrick owns 45% of Kibali Goldmines SA (Kibali) with the Democratic Republic of Congo (“DRC”) and our joint venture partner, AngloGold Ashanti, owning 10% and 45%, respectively. Kibali is accounted for as an equity method investment on the basis that the joint venture partners that have joint control have rights to the net assets of the joint venture. The figures presented in this table and the discussion that follows are based on our 45% effective interest in Kibali inclusive of the impact of the purchase price allocation resulting from the Merger. |
| b. | These results did not form a part of the Barrick consolidated results as this site was acquired as a result of the Merger. As a result, operational statistics are presented for reference purposes only. |
| c. | These arenon-GAAP financial performance measures with no standardized meaning under IFRS and therefore may not be comparable to similar measures presented by other issuers. For further information and a detailed reconciliation of eachnon-GAAP measure used in this section of the MD&A to the most directly comparable IFRS measure, please see pages 77 to 98 of this MD&A. |
| d. | Represents EBITDA divided by revenue. |
Safety and Environment
Kibali sustained one LTI during the quarter which resulted in an LTIFR of 0.29 per million hours worked, an increase from zero of the previous quarter. No major environmental incidents occurred during the quarter.
Financial Results
Q3 2019 compared to Q2 2019
Kibali’s income for the third quarter of 2019 was 42% lower than the second quarter of 2019, primarily due to higher cost of sales per ounce2 and lower sales volumes, partially offset by higher realized gold prices1.
Gold production for the third quarter of 2019 was 4% lower than the prior quarter as a result of lower feed grade processed, in order to assist with restoring stockpiles after the drawdown in the second quarter resulting from the winder failure. This impact was partially offset by slightly increased throughput and a stable plant recovery performance.
Cost of sales per ounce2 for the third quarter of 2019 was 37% higher than the prior quarter primarily due to a second quarter adjustment which lowered depreciation expense relating to the purchase price allocation fair value increment. Total cash
costs per ounce1was 3% higher than the prior quarter due to the lower grade processed partially offset by lower power costs as a result of improved hydro power generation and savings on reagents.
For the third quarter of 2019,all-in sustaining costs per ounce1 increased by 8% compared to the prior quarter, reflecting higher total cash costs per ounce1, as well as increased minesite sustaining capital expenditures, when compared with the previous period.
Capital expenditures for the third quarter of 2019 increased by 40% due to higher expenditure incurred on mobile fleet rebuilds, increased expenditure on processing projects and higher levels of capitalized stripping.
YTD Q3 2019
Kibali’s income for the nine month period ended September 30, 2019 was $78 million.
Gold production in the nine month period ended September 30, 2019 was 4% higher compared to the same prior year period, primarily due to increased feed grade in the current period as a result of blending more higher grade
| BARRICK THIRD QUARTER 2019 | 53 | MANAGEMENT’S DISCUSSION AND ANALYSIS |
underground material in line with the mine plan. This impact was partially offset by lower throughput.
Cost of sales per ounce2 and total cash costs per ounce1 in the nine month period ended September 30, 2019 were $1,081 and $555 per ounce, respectively. Cost of sales was higher as a result of the depreciation charge relating to the purchase price allocation fair value increment. Although total cash costs per ounce1 were impacted by higher operating expenditures in the first quarter of the year, cost performance has improved during the remainder of the year. For the nine month period ended September 30, 2019,all-in sustaining costs per ounce1 were $678 per ounce.
Capital expenditures in the nine month period ended September 30, 2019 was $34 million, consisting of underground mining development, underground hauling equipment, capitalized stripping, capitalized drilling and rebuilds of mobile equipment.
| BARRICK THIRD QUARTER 2019 | 54 | MANAGEMENT’S DISCUSSION AND ANALYSIS |
Veladero (50% basis)a, Argentina
| Summary of Operating and Financial Data | For the three months ended | For the nine months ended | ||||||||||||||||||||||||||||||
| 9/30/19 | 6/30/19 | % Change | 9/30/18 | % Change | 9/30/19 | 9/30/18 | % Change | |||||||||||||||||||||||||
Open pit tonnes mined (000s) | 9,449 | 8,184 | 15 | % | 7,924 | 19 | % | 26,481 | 27,268 | (3 | )% | |||||||||||||||||||||
Open pit ore | 3,909 | 3,712 | 5 | % | 3,491 | 12 | % | 11,220 | 11,312 | (1 | )% | |||||||||||||||||||||
Open pit waste | 5,540 | 4,472 | 24 | % | 4,433 | 25 | % | 15,261 | 15,956 | (4 | )% | |||||||||||||||||||||
Average grade (grams/tonne) | ||||||||||||||||||||||||||||||||
Open pit mined | 0.68 | 0.63 | 8 | % | 0.68 | 0 | % | 0.67 | 0.84 | (20 | )% | |||||||||||||||||||||
Processed | 0.74 | 0.75 | (1 | )% | 0.74 | 0 | % | 0.75 | 0.90 | (17 | )% | |||||||||||||||||||||
Heap leach ore tonnes processed (000s) | 3,463 | 2,828 | 22 | % | 3,165 | 9 | % | 9,707 | 10,016 | (3 | )% | |||||||||||||||||||||
Gold produced (000s oz) | 58 | 75 | (23 | )% | 49 | 18 | % | 203 | 201 | 1 | % | |||||||||||||||||||||
Gold sold (000s oz) | 59 | 74 | (20 | )% | 50 | 18 | % | 201 | 206 | (2 | )% | |||||||||||||||||||||
Revenue ($ millions) | 89 | 100 | (11 | )% | 59 | 51 | % | 280 | 271 | 3 | % | |||||||||||||||||||||
Cost of sales ($ millions) | 72 | 88 | (18 | )% | 55 | 31 | % | 241 | 212 | 14 | % | |||||||||||||||||||||
Income ($ millions) | 14 | 12 | 17 | % | 6 | 133 | % | 36 | 58 | (38 | )% | |||||||||||||||||||||
EBITDA ($ millions)b | 39 | 43 | (9 | )% | 30 | 30 | % | 122 | 147 | (17 | )% | |||||||||||||||||||||
EBITDA marginc | 44 | % | 43 | % | 2 | % | 51 | % | (14 | )% | 44 | % | 54 | % | (20 | )% | ||||||||||||||||
Capital expenditures ($ millions)d | 19 | 19 | 0 | % | 20 | (5 | )% | 78 | 84 | (7 | )% | |||||||||||||||||||||
Minesite sustainingd | 19 | 19 | 0 | % | 20 | (5 | )% | 63 | 84 | (25 | )% | |||||||||||||||||||||
Projectd | 0 | 0 | 0 | % | 0 | 0 | % | 15 | 0 | 100 | % | |||||||||||||||||||||
Cost of sales ($/oz) | 1,243 | 1,186 | 5 | % | 1,083 | 15 | % | 1,206 | 1,027 | 17 | % | |||||||||||||||||||||
Total cash costs ($/oz)b | 773 | 746 | 4 | % | 581 | 33 | % | 742 | 560 | 33 | % | |||||||||||||||||||||
All-in sustaining costs ($/oz)b | 1,142 | 1,046 | 9 | % | 995 | 15 | % | 1,093 | 980 | 12 | % | |||||||||||||||||||||
All-in costs ($/oz)b | 1,142 | 1,046 | 9 | % | 995 | 15 | % | 1,169 | 980 | 19 | % | |||||||||||||||||||||
| a. | Barrick owns 50% of Veladero with our joint venture partner, Shandong Gold, owning the remaining 50%. Veladero is proportionately consolidated on the basis that the joint venture partners that have joint control have rights to the assets and obligations for the liabilities relating to the arrangement. The figures presented in this table and the discussion that follows are based on our 50% interest in Veladero inclusive of the impact of remeasurement of our interest in Veladero following the disposal of a 50% interest on June 30, 2017. |
| b. | These arenon-GAAP financial performance measures with no standardized meaning under IFRS and therefore may not be comparable to similar measures presented by other issuers. For further information and a detailed reconciliation of eachnon-GAAP measure used in this section of the MD&A to the most directly comparable IFRS measure, please see pages 77 to 98 of this MD&A. |
| c. | Represents EBITDA divided by revenue. |
| d. | Presented on a cash basis as a result of adopting IFRS 16Leasesstarting in the first quarter of 2019. Capital expenditures for the three and nine months ended September 30, 2018 are presented on an accrued basis. Please refer to page 30 of this MD&A for more details. |
Safety and Environment
Veladero continues to deliver a high standard of safety with no LTIs recorded during the quarter resulting in a LTIFR of zero per million hours worked versus 0.52 the previous quarter. No major environmental incidents occurred during the quarter.
Minera Andina del Sol SRL, the joint venture company that operates the Veladero mine, is the subject of various regulatory proceedings related to operational incidents occurring in March 2017, September 2016 and September 2015. Refer to note 17 to the Financial Statements for more information regarding these and related matters.
Financial Results
Q3 2019 compared to Q2 2019
Veladero’s income for the third quarter of 2019 was 17% higher than the second quarter of 2019 primarily due to higher realized gold prices1, partially offset by lower sales volume and higher cost of sales per ounce2.
Gold production in the third quarter of 2019 was 23% lower than the prior quarter, impacted by the lower recovery rates experienced during the winter months. The recovery rate in the prior quarter also saw the immediate benefit of initiatives
targeting improved recoveries on material stacked in prior periods in order to reduce pad inventories.
Cost of sales per ounce2 and total cash costs per ounce1 in the third quarter of 2019 increased by 5% and 4% respectively, mainly due to the impact of lower sales volume, lowerby-product credits and higher export taxes resulting from higher realized gold prices1. This was partially offset by lower direct mining costs mainly due to the devaluation of the Argentine peso and cost saving initiatives. In the third quarter of 2019,all-in sustaining costs per ounce1 increased by 9% compared to the prior quarter due to the increased total cash costs per ounce1and higher minesite sustaining capital expenditures on a per ounce sold basis.
Capital expenditures in the third quarter of 2019 were in line with the prior quarter.
Q3 2019 compared to Q3 2018
Veladero’s income for the three month period ended September 30, 2019 was 133% higher than the same prior year period primarily due to higher gold sales volumes and higher realized gold prices1, partially offset by higher cost of sales per ounce2.
| BARRICK THIRD QUARTER 2019 | 55 | MANAGEMENT’S DISCUSSION AND ANALYSIS |
Gold production for the three month period ended September 30, 2019 was 18% higher than the same prior year period, primarily due to higher tonnes processed and improvements in recoveries.
Cost of sales per ounce2 and total cash costs per ounce1for the three month period ended September 30, 2019 were 15% and 33% higher respectively, than the same prior year period, primarily due to the export tax announced in September 2018 by the Argentine government, partially offset by the impact of higher gold sales volumes. For the three month period ended September 30, 2019,all-in sustaining costs per ounce1 increased by 15% compared to the same prior year period, mainly attributed to higher total cash costs per ounce1, slightly offset by lower minesite sustaining capital expenditures.
Capital expenditures for the three month period ended September 30, 2019 decreased by 5% compared to the same prior year period due to lower capitalized stripping, partially offset by an increase in spending on the phase 6 expansion of the Valley Leach Facility.
YTD Q3 2019 compared to YTD Q3 2018
Veladero’s income for the nine month period ended September 30, 2019 was 38% lower than the same prior year period primarily due to higher cost of sales per ounce2and a decrease in gold sales volume, partially offset by higher realized gold prices1.
Gold production for the nine month period ended September 30, 2019 was 1% higher than the same prior year period, primarily due to lower grades, partially offset by higher recoveries.
Cost of sales per ounce2 and total cash costs per ounce1for the nine month period ended September 30, 2019 were 17% and 33% higher, respectively, than the same prior year period, primarily due to the impact of the export tax announced in September 2018 by the Argentine government. For the nine month period ended September 30, 2019,all-in sustaining costs per ounce1 increased by 12% compared to the same prior year period, mainly attributed to higher total cash costs per ounce1, partially offset by lower minesite sustaining capital expenditures.
Capital expenditures for the nine month period ended September 30, 2019 decreased by 7% compared to the same prior year period as a result of lower capitalized stripping, partially offset by an increase in spending on the phase 6 expansion of the Valley Leach Facility.
On September 1, 2019, the Argentine government issued Decree 609/2019 announcing currency restrictions in Argentina (the “Decree”). Subsequently, the Argentine Central Bank issued Communication “A” 6770 complementing the Decree. As a result, export proceeds were required to be converted into Argentine pesos within 5 days, which was later extended to 180 days. Dividend distributions and payments to foreign suppliers now require specific authorizations from the Central Bank. These currency restrictions, which became effective immediately, have had limited impact on operations to date and are set to expire on December 31, 2019.
| BARRICK THIRD QUARTER 2019 | 56 | MANAGEMENT’S DISCUSSION AND ANALYSIS |
Tanzania (63.9% basis)a, Africa
| Summary of Operating and Financial Data | For the three months ended | For the nine months ended | ||||||||||||||||||||||||||||||
| 9/30/19 | 6/30/19 | % Change | 9/30/18 | % Change | 9/30/19 | 9/30/18 | % Change | |||||||||||||||||||||||||
Total tonnes mined (000s) | 1,784 | 2,709 | (34 | )% | 2,822 | (37 | )% | 6,928 | 8,052 | (14 | )% | |||||||||||||||||||||
Open pit ore | 668 | 812 | (18 | )% | 565 | 18 | % | 2,163 | 1,400 | 55 | % | |||||||||||||||||||||
Open pit waste | 973 | 1,728 | (44 | )% | 2,128 | (54 | )% | 4,283 | 6,286 | (32 | )% | |||||||||||||||||||||
Underground | 143 | 169 | (15 | )% | 129 | 11 | % | 482 | 366 | 32 | % | |||||||||||||||||||||
Average grade (grams/tonne) | ||||||||||||||||||||||||||||||||
Open pit mined | 1.89 | 2.19 | (13 | )% | 1.98 | (4 | )% | 1.99 | 1.96 | 1 | % | |||||||||||||||||||||
Underground mined | 4.97 | 9.27 | (46 | )% | 7.40 | (33 | )% | 7.15 | 7.80 | (8 | )% | |||||||||||||||||||||
Processedb | 1.54 | 2.25 | (32 | )% | 2.10 | (27 | )% | 1.84 | 2.00 | (8 | )% | |||||||||||||||||||||
Ore tonnes processed (000s) | 1,275 | 1,582 | (19 | )% | 1,516 | (16 | )% | 4,342 | 4,437 | (2 | )% | |||||||||||||||||||||
Recovery rate | 84 | % | 89 | % | (6 | )% | 87 | % | (4 | )% | 86 | % | 87 | % | (1 | )% | ||||||||||||||||
Mining | 91 | % | 93 | % | (2 | )% | 92 | % | (1 | )% | 92 | % | 92 | % | 0 | % | ||||||||||||||||
Reprocessed tailings | 49 | % | 50 | % | (2 | )% | 53 | % | (7 | )% | 50 | % | 54 | % | (7 | )% | ||||||||||||||||
Gold produced (000s oz) | 53 | 101 | (48 | )% | 87 | (39 | )% | 221 | 250 | (12 | )% | |||||||||||||||||||||
Gold sold (000s oz) | 59 | 92 | (36 | )% | 87 | (32 | )% | 218 | 247 | (12 | )% | |||||||||||||||||||||
Revenue ($ millions) | 89 | 121 | (26 | )% | 106 | (16 | %) | 298 | 319 | (7 | )% | |||||||||||||||||||||
Cost of sales ($ millions) | 63 | 84 | (25 | )% | 72 | (13 | )% | 222 | 218 | 2 | % | |||||||||||||||||||||
Income ($ millions) | 0 | 24 | (100 | )% | 22 | (100 | )% | 23 | 89 | (74 | )% | |||||||||||||||||||||
EBITDA ($ millions)c | 16 | 46 | (65 | )% | 35 | (54 | )% | 78 | 131 | (40 | )% | |||||||||||||||||||||
EBITDA margind | 18 | % | 38 | % | (53 | )% | 33 | % | (46 | )% | 26 | % | 41 | % | (36 | )% | ||||||||||||||||
Capital expenditures ($ millions)e | 10 | 10 | 0 | % | 15 | (33 | )% | 29 | 47 | (39 | )% | |||||||||||||||||||||
Minesite sustaininge | 8 | 7 | 14 | % | 12 | (33 | )% | 22 | 41 | (45 | )% | |||||||||||||||||||||
Projecte | 2 | 3 | (33 | )% | 3 | (33 | )% | 7 | 6 | 16 | % | |||||||||||||||||||||
Cost of sales ($/oz) | 1,057 | 920 | 15 | % | 842 | 26 | % | 1,017 | 884 | 15 | % | |||||||||||||||||||||
Total cash costs ($/oz)c | 788 | 659 | 20 | % | 670 | 18 | % | 760 | 690 | 10 | % | |||||||||||||||||||||
All-in sustaining costs ($/oz)c | 947 | 792 | 20 | % | 880 | 8 | % | 875 | 922 | (5 | )% | |||||||||||||||||||||
All-in costs ($/oz)c | 977 | 817 | 20 | % | 911 | 7 | % | 905 | 946 | (4 | )% | |||||||||||||||||||||
| a. | Formerly known as Acacia Mining plc and now called Barrick TZ Limited. On September 17, 2019, Barrick acquired all of the shares of Acacia it did not own. Refer to note 4 to the Financial Statements for more information. This information was previously disclosed on a 100% basis. |
| b. | Includes tailings retreatment. |
| c. | These arenon-GAAP financial performance measures with no standardized meaning under IFRS and therefore may not be comparable to similar measures presented by other issuers. For further information and a detailed reconciliation of eachnon-GAAP measure used in this section of the MD&A to the most directly comparable IFRS measure, please see pages 77 to 98 of this MD&A. |
| d. | Represents EBITDA divided by revenue. |
| e. | Presented on a cash basis as a result of adopting IFRS 16Leasesstarting in the first quarter of 2019. Capital expenditures for the three and nine months ended September 30, 2018 are presented on an accrued basis. Please refer to page 30 of this MD&A for more details. |
On September 17, 2019, Barrick acquired all of the shares of Acacia that it did not own. Notwithstanding the completion of the Acacia transaction on September 17, 2019, we consolidated our interest in Acacia and recorded anon-controlling interest of 36.1% in the income statement for the entirety of the third quarter of 2019 as a matter of convenience. Refer to note 4 to the Financial Statements for more information.
Financial Results
Q3 2019 compared to Q2 2019
Tanzania’s income for the third quarter of 2019 was $24 million lower than the second quarter of 2019, mainly attributed to lower sales volume, higher cost of sales per ounce2, and severance costs for legacy Acacia employees and advisory costs incurred by Acacia prior to the acquisition of thenon-controlling interest by Barrick. These impacts were partially offset by the higher realized gold price1.
In the third quarter of 2019, gold production was 48% lower than the prior quarter primarily due to the Prohibition Notice
at North Mara which resulted in the closure of the North Mara tailings storage facility (“TSF”) and shut down of the processing plant from July 20, 2019. On September 17, 2019, following the submission of a detailed action plan to remediate issues related to the TSF and the implementation of remedial measures to contain the seepage from the TSF, the Prohibition Notice was lifted and North Mara was permitted to resume operations at the TSF.
Cost of sales per ounce2 and total cash costs per ounce1in the third quarter of 2019 were 15% and 20% higher, respectively, than the prior quarter primarily reflecting the lower production base at North Mara, partially offset by lower direct mining costs as a result of reduced activity.All-in sustaining costs per ounce1 in the third quarter of 2019 was 20% higher than the prior quarter mainly due to higher total cash costs1 and higher minesite sustaining capital expenditures.
Capital expenditures in the third quarter of 2019 were in line with the second quarter of 2019, mainly attributed to higher
| BARRICK THIRD QUARTER 2019 | 57 | MANAGEMENT’S DISCUSSION AND ANALYSIS |
capitalized underground development costs as a result of a focus on underground waste development at North Mara following the plant closure, offset by lower capitalized drilling costs at North Mara.
Q3 2019 compared to Q3 2018
Tanzania’s income for the three month period ended September 30, 2019 was $22 million lower than the same prior year period, mainly due to lower sales volume, higher cost of sales per ounce3, severance costs for legacy Acacia employees and advisory costs incurred by Acacia prior to the acquisition of thenon-controlling interest by Barrick. These impacts were partially offset by the higher realized gold price1.
For the three month period ended September 30, 2019, gold production was 39% lower than the same prior year period primarily due to the Prohibition Notice at North Mara as discussed above, combined with lower production at Buzwagi as the prior year included higher grade ore mined from the final cut of the open pit compared to processing only lower grade stockpiles in the current year.
Cost of sales per ounce2 and total cash costs per ounce1 in the three month period ended September 30, 2019 were 26% and 18% higher, respectively, than the same prior year period primarily reflecting the impact of lower production, combined with higher direct mining costs as a result of lower capitalized stripping costs, partially offset by lower sales related costs due to the impact of lower sales.All-in sustaining costs per ounce1 in the third quarter of 2019 was 8% higher than the same prior year period mainly due to higher total cash costs1, partially offset by lower minesite sustaining capital expenditures.
For the three month period ended September 30, 2019, capital expenditures decreased by 33% compared to the same prior year period primarily due to lower capitalized stripping as a result of mining moving into the main ore zone at the Nyabirama open pit at North Mara.
YTD Q3 2019 compared to YTD Q3 2018
Tanzania’s income for the nine month period ended September 30, 2019 was 74% lower than the same prior year period primarily due to lower sales volumes, higher cost of sales per ounce2, severance costs for legacy Acacia employees and advisory costs incurred by Acacia prior to the acquisition of thenon-controlling interest by Barrick. These impacts were partially offset by the higher realized gold price1.
Gold production for the nine month period ended September 30, 2019 was 12% lower than the same prior year period, primarily due to lower production at Buzwagi as the mine was fully transitioned to a lower grade stockpile processing operation, and lower production at North Mara due to the Prohibition Notice occurring in the third quarter of 2019, the consequences of a fall of ground in the Gokona underground mine and an excavator breakdown in the Nyabirama open pit which affected the first quarter of 2019.
Cost of sales per ounce2 and total cash costs per ounce1for the nine month period ended September 30, 2019 were 15% and 10% higher, respectively, than the same prior year period, primarily due to the impact of lower production and lower capitalized stripping costs at North Mara. For the nine month period ended September 30, 2019,all-in sustaining costs per
ounce1 decreased by 5% compared to the same prior year period, mainly attributed to lower minesite sustaining capital expenditures, partially offset by higher total cash costs per ounce1.
Capital expenditures for the nine month period ended September 30, 2019 decreased by 39% compared to the same prior year period mainly due to lower minesite sustaining capital expenditures. This is a result of lower capitalized stripping costs at North Mara and reduced operations at Bulyanhulu and Buzwagi.
Concentrate Export Ban and Related Disputes with the Government of Tanzania
On March 3, 2017, the GoT announced a general ban on the export of metallic mineral concentrates (the “Ban”) following a directive made by the President to promote the creation of a domestic smelting industry. Following the directive, Acacia ceased all exports of its gold/copper concentrate (“concentrate”) including containers previously approved for export prior to the Ban which are located in Dar es Salaam.
During the second quarter of 2017, the GoT initiated investigations which resulted in allegations of historical undeclared revenue and unpaid taxes by Acacia and its predecessor companies. Acacia subsequently received adjusted assessments for the tax years 2000-2017 from the Tanzania Revenue Authority for a total amount of approximately $190 billion for alleged unpaid taxes, interest and penalties. In addition, following the end of the third quarter of 2017, Acacia was served with notices of conflicting adjusted corporate income tax and withholding tax assessments for tax years 2005 to 2011 with respect to Acacia’s former Tulawaka joint venture, and demands for payment, for a total amount of approximately $3 billion. Acacia disputed these assessments through arbitration and the Tanzanian tax appeals process, respectively.
In addition to the Ban, new and amended legislation was passed in Tanzania in early July 2017, including various amendments to the 2010 Mining Act and a new Finance Act. The amendments to the 2010 Mining Act increased the royalty rate applicable to metallic minerals such as gold, copper and silver to 6% (from 4%), and the new Finance Act imposes a 1% clearing fee on the value of all minerals exported from Tanzania from July 1, 2017. In January 2018, new Mining Regulations were announced by the GoT introducing, among other things, local content requirements, export regulations and mineral rights regulations, the scope and effect of which remain under review. Barrick continues to monitor the impact of all new legislation in light of Acacia’s Mineral Development Agreements with the GoT.
On October 19, 2017, Barrick announced that it had agreed with the GoT on a proposed framework for a new partnership between Acacia and the GoT. Acacia did not participate directly in these discussions as the GoT had informed Barrick that it wished to continue dialogue solely with Barrick. Barrick and the GoT also agreed to form a working group that would focus on the resolution of outstanding tax claims against Acacia. Key terms of the proposed framework announced by Barrick and the GoT included (i) the creation of a new Tanzanian company to provide management services to Acacia’s Bulyanhulu, Buzwagi and North Mara mines and all future operations in the country with key officers located in
| BARRICK THIRD QUARTER 2019 | 58 | MANAGEMENT’S DISCUSSION AND ANALYSIS |
Tanzania and Tanzanian representation on the board of directors; (ii) maximization of local employment of Tanzanians and procurement of goods and services within Tanzania; (iii) economic benefits from Bulyanhulu, Buzwagi and North Mara to be shared on a 50/50 basis, with the GoT’s share delivered in the form of royalties, taxes and a 16% free carry interest in Acacia’s Tanzanian operations; and (iv) in support of the working group’s ongoing efforts to resolve outstanding tax claims, Acacia would make a payment of $300 million to the GoT, staged over time, on terms to be settled by the working group. Barrick and the Government of Tanzania also reviewed the conditions for the lifting of the Ban.
On February 20, 2019, Barrick announced that it had arrived at a proposal with the GoT that set forth the commercial terms to resolve outstanding disputes concerning Acacia’s operations in Tanzania.
On May 19, 2019, the GoT Negotiating Team wrote to Acacia’s three Tanzanian operating companies (the “TMCs”) to indicate that the GoT had resolved not to proceed to execute final agreements for the resolution of Acacia’s disputes if Acacia was one of the counterparties to the agreements.
On July 12, 2019, Acacia’s North Mara mine received a letter from the Mining Commission of the Tanzanian Ministry of Minerals informing it that the Mining Commission is soon to conduct an inspection of North Mara’s gold production (the “No Export Letter”). The No Export Letter stated that export permits for gold shipments from North Mara would be issued following completion of this inspection.
Following an investigation conducted by the Mining Commission on July 30 and 31, 2019, the North Mara mine received a letter from the Mining Commission (the “Inspection Findings Letter”) stating that it believes that certain provisions of the Mining Regulations, 2010 were violated and directing the North Mara mine to submit a feasibility study report and current mine plan for its approval by August 16, 2019. The Inspection Findings Letter also authorized the resumption of gold exports from North Mara subject to its adherence to the export procedure.
On July 19, 2019, the Acacia Transaction Committee Directors and Barrick published a firm offer announcement pursuant to Rule 2.7 of the City Code on Takeovers and Mergers (“Rule 2.7 Announcement”) announcing that they had reached agreement on the terms of a recommended final offer by Barrick for the ordinary share capital of Acacia Mining plc that Barrick does not already own (see “Key Business Developments - Acacia Mining plc”), with the belief that the recommended final offer would enable Barrick to finalize the terms of a full, final and comprehensive settlement of all of Acacia’s existing disputes with the GoT. To facilitate this and in anticipation of the Rule 2.7 Announcement, on July 17, 2019, Acacia announced that Bulyanhulu Gold Mine Limited and Pangea Minerals Limited would immediately seek a stay of their international arbitration proceedings with the GoT. As part of the stay, the hearings scheduled to begin in July 2019 were postponed. The parties to the arbitration have committed to providing the arbitration tribunal with an update on the status of the settlement discussions by December 30, 2019.
On September 12, 2019, the High Court of Justice in England and Wales made an order sanctioning the scheme of
arrangement under Part 26 of the Companies Act 2006 (the “Scheme”), and on September 17, 2019, Barrick completed the acquisition of all of the shares of Acacia Mining plc that the Company did not already own pursuant to the Scheme. Acacia Mining plc ceased trading on the London Stock Exchange and became a wholly-owned subsidiary of Barrick called Barrick TZ Limited.
On October 20, 2019, Barrick announced that it had reached an agreement with the GoT to settle all disputes between the GoT and the mining companies formerly operated by Acacia but now managed by Barrick. The final agreements have been submitted to the Tanzanian Attorney General for review and legalization.
The terms of the agreement include the payment of $300 million to settle all outstanding tax and other disputes; the lifting of the Ban; the sharing of future economic benefits from the Bulyanhulu, Buzwagi and North Mara mines on a 50/50 basis; and a dispute resolution mechanism that provides for binding international arbitration.
In conjunction with the finalization of the agreement, a new operating company called Twiga has been formed to manage the Bulyanhulu, Buzwagi and North Mara mines. The GoT will receive a free carried shareholding of 16% in each of the mines and will receive its half of the economic benefits from taxes, royalties, clearing fees and participation in all cash distributions made by the mines and Twiga. An annualtrue-up mechanism will be included to maintain the 50/50 split.
Refer to note 17 to the Financial Statements for more information regarding these matters.
North Mara Environmental Issues
During 2019, the GoT issued two environmental protection orders and directions to Acacia’s North Mara mine in relation to alleged breaches of environmental regulations relating to seepage from and the discharge of a hazardous substance from the North Mara mine TSF. In March 2019, the GoT directed the North Mara Mine to resolve an incident that resulted in the spillage of water into the local environment. On July 16, 2019, the Tanzanian National Environment Management Council (“NEMC”) issued the Prohibition Notice to North Mara Gold Mine Limited (the Tanzanian operating company of the North Mara mine), which ordered the North Mara mine to suspend operations at its TSF on Saturday July 20, 2019. NEMC cited the North Mara mine’s failure to contain and prevent seepage from the TSF as grounds for its issuance of the Prohibition Notice.
On September 17, 2019, following the submission of a detailed action plan to remediate issues related to the TSF and the implementation of remedial measures to contain the seepage from the TSF, the Prohibition Notice was lifted and North Mara was permitted to resume operations at the TSF.
Refer to note 17 to the Financial Statements for more information regarding this matter.
| BARRICK THIRD QUARTER 2019 | 59 | MANAGEMENT’S DISCUSSION AND ANALYSIS |
Other Mines - Gold
| Summary of Operating and Financial Data | For the three months ended | |||||||||||||||||||||||||||||||||||||||
| 9/30/19 | 6/30/19 | |||||||||||||||||||||||||||||||||||||||
Gold produced (000s oz) | Cost of sales ($/oz) | Total cash costs ($/oz)a | All-in sustaining costs ($/oz)a | Capital Expend- ituresb | Gold produced (000s oz) | Cost of sales ($/oz) | Total cash costs ($/oz)a | All-in sustaining costs ($/oz)a | Capital Expend- ituresb | |||||||||||||||||||||||||||||||
Kalgoorlie (50%) | 58 | 1,037 | 856 | 1,170 | 15 | 57 | 1,038 | 846 | 1,204 | 16 | ||||||||||||||||||||||||||||||
Tongon (89.7%) | 62 | 1,396 | 793 | 869 | 4 | 61 | 1,562 | 750 | 802 | 2 | ||||||||||||||||||||||||||||||
Porgera (47.5%) | 75 | 1,024 | 868 | 1,053 | 14 | 61 | 1,032 | 893 | 1,112 | 12 | ||||||||||||||||||||||||||||||
Hemlo | 49 | 1,083 | 953 | 1,280 | 15 | 55 | 953 | 822 | 1,015 | 9 | ||||||||||||||||||||||||||||||
Lagunas Norte | 33 | 1,661 | 1,327 | 1,422 | 0 | 39 | 952 | 732 | 998 | 4 | ||||||||||||||||||||||||||||||
Golden Sunlightc | 6 | 2,336 | 2,037 | 2,434 | 1 | |||||||||||||||||||||||||||||||||||
Morila (40%)c | 6 | 2,585 | 1,446 | 1,449 | 0 | |||||||||||||||||||||||||||||||||||
| a. | These arenon-GAAP financial performance measures with no standardized meaning under IFRS and therefore may not be comparable to similar measures presented by other issuers. For further information and a detailed reconciliation of eachnon-GAAP measure used in this section of the MD&A to the most directly comparable IFRS measure, please see pages 77 to 98 of this MD&A. |
| b. | Includes both minesite sustaining and project capital expenditures. |
| c. | With the end of mining at Golden Sunlight and Morila in the second quarter as expected, we have ceased to include the immaterial residual ounces in our production ornon-GAAP cost metrics for these operations. |
Kalgoorlie (50% basis), Australia
Gold production in the third quarter of 2019 for Kalgoorlie was 2% higher compared to the prior quarter, primarily due to higher grade and recovery, offset by lower throughput. Cost of sales per ounce2 in the third quarter of 2019 was in line with the prior quarter, consistent with production. In the third quarter of 2019,all-in sustaining costs per ounce1 decreased by 3% compared to the prior quarter primarily due to lower minesite sustaining capital expenditures, partially offset by higher total cash costs per ounce1.
Newmont Goldcorp (the operator) has advised that as a result of the exclusion zones put in place to safely manage the east and west walls of the pit, 2019 production will be impacted by 40 thousand attributable ounces. As such, it is unlikely that Kalgoorlie will be able to meet its production guidance for 2019. As previously reported, we are continuing with a sales process for our 50 percent stake in the Kalgoorlie operations in Australia which we expect to advance in the fourth quarter of 2019.
Tongon (89.7% basis), Côte d’Ivoire
Gold production for Tongon in the third quarter of 2019 was in line with the prior quarter. Cost of sales per ounce2 in the third quarter of 2019 was 11% lower than the prior quarter as a result of lower depreciation charges, partially offset by higher operating costs. Increased total cash costs per ounce1 were primarily driven by higher plant engineering and maintenance costs as well as community project expenditure being higher in the quarter, but in line with plan.All-in sustaining costs per ounce1in the third quarter of 2019 increased by 8%, mainly due to the increase in total cash costs per ounce1.
Porgera (47.5% basis), Papua New Guinea
Gold production for Porgera in the third quarter of 2019 was 23% higher compared to the second quarter of 2019, primarily due to higher throughput in the current quarter. The prior quarter was impacted by interruptions to the mine’s power supply. Cost of sales per ounce2 in the third quarter of 2019 was in line with the prior quarter.All-in sustaining costs per ounce1 decreased by 5% compared to the prior quarter, primarily due to the impact of higher production, partially offset by increased power costs and higher minesite sustaining capital expenditures due to several large equipment purchases.
Porgera’s current Special Mining Lease terminated on August 16, 2019. The company has been working constructively with the PNG government to negotiate a20-year extension. On August 2, 2019, the National Court of Papua New Guinea ruled that the provisions of the country’s 1992 Mining Act applied to the Porgera gold mine, thus allowing it to continue operating while the application to extend its Special Mining Lease is being considered. The Company expects to reach an agreement with the government and does not expect interruptions to the operation while these discussions are ongoing.
Hemlo, Ontario, Canada
Hemlo’s gold production in the third quarter of 2019 was 11% lower than the prior quarter due to lower mill throughput, partially offset by higher grade. Cost of sales per ounce2 in the third quarter of 2019 was 14% higher than the prior quarter primarily due to the higher direct mining costs and lower production. In the third quarter of 2019,all-in sustaining costs per ounce1 increased by 26% compared to the prior quarter due to higher royalties resulting from mine sequencing, combined with higher minesite sustaining capital expenditures.
Lagunas Norte, Peru
Gold production for Lagunas Norte in the third quarter of 2019 was 15% lower compared to the prior quarter, primarily due to mine depletion as a result of the decision to transition the site to care and maintenance at the end of the third quarter of 2019. Cost of sales per ounce2 was 74% higher than the prior quarter mainly due to an $11 million inventory obsolescence provision recorded during the quarter related to the transition to care and maintenance, partially offset by lower direct mining costs as a result of the reduction in operating activities. In the third quarter of 2019,all-in sustaining costs per ounce1 increased by 42% compared to the prior quarter, primarily due to higher total cash costs per ounce1, partially offset by lower minesite sustaining capital expenditures. As previously mentioned, as Lagunas Norte has transitioned to care and maintenance at the end of the third quarter of 2019, we will cease to include production ornon-GAAP cost metrics for this operation going forward.
| BARRICK THIRD QUARTER 2019 | 60 | MANAGEMENT’S DISCUSSION AND ANALYSIS |
Other Mines - Copper
| Summary of Operating and Financial Data | For the three months ended | |||||||||||||||||||||||||||||||||||||||
| 9/30/19 | 6/30/19 | |||||||||||||||||||||||||||||||||||||||
Copper production (millions of pounds) | Cost of sales ($/lb) | C1 cash costs ($/lb)a | All-in sustaining costs ($/lb)a | Capital Expend- ituresb | Copper production (millions of pounds) | Cost of sales ($/lb) | C1 cash costs ($/lb)a | All-in sustaining costs ($/lb)a | Capital Expend- ituresb | |||||||||||||||||||||||||||||||
Lumwana | 65 | 2.04 | 1.83 | 3.66 | 37 | 49 | 2.07 | 1.70 | 2.78 | 40 | ||||||||||||||||||||||||||||||
Zaldívar (50%) | 32 | 2.18 | 1.55 | 1.91 | 11 | 32 | 2.32 | 1.61 | 1.85 | 7 | ||||||||||||||||||||||||||||||
Jabal Sayid (50%) | 15 | 1.63 | 1.42 | 1.65 | 4 | 16 | 1.45 | 1.22 | 1.31 | 1 | ||||||||||||||||||||||||||||||
| a. | These arenon-GAAP financial performance measures with no standardized meaning under IFRS and therefore may not be comparable to similar measures presented by other issuers. For further information and a detailed reconciliation of eachnon-GAAP measure used in this section of the MD&A to the most directly comparable IFRS measure, please see pages 77 to 98 of this MD&A. |
| b. | Includes both minesite sustaining and project capital expenditures. |
Lumwana, Zambia
Copper production for Lumwana in the third quarter of 2019 was 33% higher than the prior quarter as record throughput levels, higher feed grade and a strong plant performance all contributed to deliver higher production. Increased processed tonnes and grade in comparison with the prior quarter came as a result of higher plant availabilities, as plant maintenance issues on the main conveyor which hampered production in the second quarter were addressed, allowing the plant feed to be more closely aligned to plan. In spite of a strong quarter on production, sales were negatively affected by a major refurbishment at one of the third-party smelters that processes a portion of the mine’s concentrate. The refurbishment is expected to be completed by the end of this year. We continue to evaluate alternative smelter opportunities during this maintenance period. Cost of sales per pound2 in the third quarter of 2019 was 1% lower than the prior quarter primarily due to lower depreciation charges outweighing increased concentrate marketing costs. In the third quarter of 2019,all-in sustaining costs per pound1 were higher than the prior quarter, mainly as a result in of decreased copper pounds sold in the period.
Zaldívar (50% basis), Chile
Copper production for Zaldívar in the third quarter of 2019 was in line with the prior quarter on lower throughput, grades and recoveries offset by increased production from secondary leaching. Cost of sales per pound2 in the third quarter of 2019 was 6% lower than the prior quarter primarily due to a build up in leach pad inventories with increased residence time for heap leach ore.All-in sustaining costs per pound1 increased by 4% compared to the prior quarter primarily due to the impact of higher capitalized stripping and sustaining capital expenditures.
Jabal Sayid (50% basis), Saudi Arabia
Jabal Sayid’s copper production in the third quarter of 2019 was 6% lower compared to the prior quarter. The reduction from the prior period was primarily due to a decrease in the feed grade in line with the mine plan. Cost of sales per pound2 in the third quarter of 2019 was 12% higher than the prior quarter, primarily due to the impact of processing lower grade material, which resulted in decreased production volumes.All-in sustaining costs per pound1 in the third quarter of 2019 increased by 26% when compared to the prior quarter as a result of higher unit cash costs1, decreased production volumes and increased mining capital expenditure, in line with the plan.
| BARRICK THIRD QUARTER 2019 | 61 | MANAGEMENT’S DISCUSSION AND ANALYSIS |
Growth Project Updates
Cortez Deep South, Nevada, USA6
Under the current Life of Mine plan, the Deep South project starts to contribute to Cortez production from 2020, ramping up to between approximately150-250koz (100% basis) from 2022 to 2031 at an estimated average cost of sales of $650 per ounce, andall-in sustaining cost1 of $580 per ounce. The draft Environmental Impact Statement for the project was published in late October 2018, and the Record of Decision was received in September 2019. Deep South will utilize infrastructure which has already been approved under current plans to expand mining in the Lower Zone of the Cortez underground mine, including the new Rangefront twin declines, and other underground infrastructure already in use and under construction. As of September 30, 2019, we have spent a total of $33 million on this project (100% basis). As this project has been handed over to operations, it will no longer be separately reported on in this section of the MD&A.
Goldrush Complex, Nevada, USA
At Goldrush, we submitted a Plan of Operations to the Bureau of Land Management in September 2019 to commence permitting for the project. Significant resource growth is expected at Fourmile and a small portion of the mineralization that is contiguous to Goldrush has also been included in this submission. The anticipated approval timeline is approximately two years.
The 2019 Goldrush infill and edge drilling program was completed in October 2019 as planned and will be included into a block model update expected at the end of October. Geotechnical work continues to progress well with the expected deliverable of the mining rock mass model on track for the end of November 2019.
A preliminary conceptual design for the paste plant has been completed and environmental and strength testing continues on the samples provided. Negotiations have commenced to secure power supply for thestart-up and life of mine operations. The Nevada Energy power system impact study is ongoing and will be completed by the end of 2019.
Construction of the twin exploration declines at Goldrush has accelerated and we are now consistently achieving and exceeding contractual development rates. These declines will provide access to the ore body, allowing for further drilling, and the potential conversion of existing resources to reserves. The exploration declines can be converted to production declines in the future, subject to permitting. Overall progress stands at 46% and an updated decline completion date will be released together with results for the fourth quarter of 2019. As at September 30, 2019, we have spent $109 million (including $24 million in the third quarter of 2019) on the Goldrush project inclusive of the exploration declines (100% basis). The current capital estimate for the Goldrush project is approximately $1.0 billion (100% basis), subject to the completion of the updated Goldrush feasibility study. We continue to expect updated mine and feed schedules by the third quarter of 2020 and the final Goldrush feasibility study to be completed in the first quarter of 2021.
Turquoise Ridge Third Shaft, Nevada, USA7
Construction of the third shaft at Turquoise Ridge, which has a hoisting capacity of 5,500 tonnes per day, continues to advance according to schedule and within budget, with efforts
in 2019 focused on surface civil works and shaft sinking. Major progress for the quarter focused around the hoist house and the head frame in preparation for sinking activities. Hoist house erection is substantially complete with only architectural finishes, final plumbing and HVAC completion remaining. The commissioning of the production hoist and Mary Anne hoist was completed without issues. Head frame erection is substantially complete and preparation for sinking rope installation is underway. All sinking equipment is on site and ready for commissioning in the fourth quarter of 2019. To date, we have spent $109 million (including $12.5 million in the third quarter of 2019) out of an estimated capital cost of approximately$300-$327 million (100% basis).
Pueblo Viejo Plant Expansion Study, Dominican Republic8
Studies and pilot project work are supportive of a plant expansion at the Pueblo Viejo mine that could significantly increase throughput, allowing the mine to maintain average annual gold production of approximately 800,000 ounces after 2022 (100% basis). Recent comminutiontrade-off studies now see the potential Pueblo Viejo Plant Expansion Study flowsheet incorporate an upgrade of the existing primary crusher with a new feed tunnel (from the current coarse ore stockpile) delivering to a new single stage semi-autogenous grinding (SAG) mill. This potential alternative flowsheet would replace the previously proposed new primary and secondary crushing circuit installations, a new fine ore stockpile and an additional ball mill for the comminution circuit.
Another potential oxidation alternative to the previously proposed ultrafine grinding and tank oxidation circuit is being advanced. This option involves an upgrade of the existing autoclaves to “flash” “(vaporize)” additional cooling water as the means of dissipating the extra heat from the higher sulphide feed to the pressure oxidation “(POX)” circuit. This involves additional high-pressure cooling water pumps and recycle flash capability using additional slurry pumping capacity.
These comminution and oxidation alternatives are being progressed since they provide opportunity for lower capital and operating costs. A new flotation circuit prior to oxidation remains as previously proposed as does an additional 2,000 tpd oxygen plant.
Significant progress has been made in respect of the engineering of the above mentioned flowsheet during the third quarter. Block flow diagrams, process design criteria, process descriptions, process flow diagrams, process and instrumentation drawings have been generated. Quantitative risk assessments “(HAZOP)” were also conducted during the quarter. Data sheets are being prepared and sent to vendors for a competitive bidding process. The program remains on track for the plant expansion prefeasibility study to be completed by the end of the fourth quarter of 2019 as well as a fatal flaw analysis for additional tailings capacity.
A parallel program is proceeding in line with Pueblo Viejo’s environmental responsibility, where baseline studies, including hydrological evaluations are well advanced for ultimate inclusion into a comprehensive plant expansion Environmental Impact Study, also scheduled for completion by the end of fourth quarter of 2019. Environmental Impact Studies will continue into 2020 for additional tailings storage.
| BARRICK THIRD QUARTER 2019 | 62 | MANAGEMENT’S DISCUSSION AND ANALYSIS |
Exploration
Nevada Gold Mines LLC, Nevada, USA
Following the formation of Nevada Gold Mines LLC at the start of the quarter, exploration plans have been reviewed and refocused on opportunities within the newly consolidated land holdings. At Carlin, which now encompasses the former Goldstrike property plus the extensive Carlin footprint, and Turquoise Ridge, which consolidates the former Turquoise Ridge and Twin Creeks, data integration and consolidated geologic modeling is in progress. Multiple opportunities in addition to those planned at the start of the year have been identified and actions taken to accelerate the best projects. One of these opportunities is a 20 square kilometer portion of Little Boulder Basin. The project area falls between two Tier One4 deposits, Goldstrike and Leeville, and has only two legacy drill holes testing favorable host rocks. Both holes intersected mineralization well above the typical underground mining cutoff grade. Drilling has commenced and will initially focus on building the geology framework to drive future targeting efforts. Other exploration priorities include expanding Leeville, testing the down dip extension of high-grade breccia bodies along the Post-Genesis Fault, and delineating new targets around Gold Quarry and in the Rain district. Data compilation and geologic modeling will be the focus for the fourth quarter of 2019 ahead of ramp up of drilling programs during the first quarter of 2020. Leveraging experience and expertise coming from the success of Fourmile to advance similar opportunities across all the major mining districts is an important aspect of the exploration strategy.
At Turquoise Ridge, drill results received during the quarter have largely been better than expected. Drilling continues on a number of focused target areas, including along the FED/BPE corridor, which if positive would extend mineralization 150 meters down plunge. Integration of data and personnel following the formation of Nevada Gold Mines has been swift and will provide opportunity for construction of a cohesive geologic model for focused targeting in the future.
Fourmile, Nevada, USA5
At Fourmile, which has the potential to be contributed to Nevada Gold Mines if certain targets are met, drilling in the third quarter fully transitioned to focus on expanding the geologic framework and exploring for mineralization in a large and sparsely drilled area to the north and west of Fourmile. An early result from this wider spaced drill campaign was reported as a new discovery in September. The discovery hole (FM19-11DW14) located one kilometer north of Fourmile, intersected a thick zone of brecciated favorable host rock with three mineralized intervals including 10.7 meters at 24.8 g/t, 4.6 meters at 49.4 g/t and 6.1 meters at 21.2 g/t. Follow up drilling is in progress. Targeting continues to be supported byon-going detailed geologic mapping and sampling activities.
All results from tighter spaced drilling around the Fourmile resource area were received by the end of the quarter and include another best hole on the project to date highlighted by 25.6 meters at 80.9 g/t and 29.0 meters at 54.6 g/t. These resource growth focused results are expected to be included in theyear-end reserve and resource estimate. Anticipated resource additions will be reported with year end results. Mineralization remains open in several directions, especially in the vicinity of the intersection of two important ore controlling faults: 1) Anna, a steeply west dipping and breccia localizing
fault zone; and 2) Sadler, a moderately west dipping fault with reverse displacement and associated fault propagated folds. This intersection occurs to the west and below the majority of drilling completed to date, and is in the location of some of the best intercepts at Fourmile. Drilling to target this important structural intersection will resume in the first quarter of 2020.
During the third quarter of 2019, seventeen diamond drill holes totaling 16,250 meters were completed. The strike extent of mineralization at Fourmile has expanded to 1.3 kilometers and the southern gap between Fourmile and Goldrush has been closed after intersecting significant mineralization in several nominally 100 to 200 meter spaced drill holes. The exploration program is advancing with four diamond drill holes in progress.
Hemlo, Ontario, Canada
Drilling successfully confirmed down plunge extensions to the C Zone, validating our recently improved geology model. TheC-Zone represents most of the current resources and underground mill feed at Hemlo. Additional extension opportunities have been identified and these will be validated by drilling commencing in early 2020.
Pueblo Viejo, Dominican Republic
Systematicre-logging of hundreds of holes totaling 225,000 meters covering the entire property and development of a new 3D geology model was completed during the third quarter of 2019. This is the first integrated geology, alteration and structural model completed since 2009 and will form the basis of a revised and improved block model and resource estimate in support of expansion plans at Pueblo Viejo. This renewed understanding on the controls to mineralization generated targets, and drill testing has commenced. At Mejita, a new concept for controls to high grade mineralization is being tested, which if validated could expose a high-grade corridor southward to an open area that has recorded elevated gold in soils.
Del Carmen, Argentina
At Del Carmen, results of the prior quarter’s drilling on the Rojo Grande prospect have been incorporated into a new geological model which is being used to constrain updated mineral inventory estimates. Mineralization at Rojo Grande is at or near surface and could provide a source of early ore for potential development scenarios at Alturas. These newly defined high-grade controls to mineralization are also being applied to the entireAlturas-Del Carmen project area, which has identified four prospective targets for drill testing this field season.
Veladero, Argentina5
At Veladero, over 150,000 meters has beenre-logged to date as part of a holistic effort to update the geological model, focused on delineating controls to high grade mineralization. Drilling in the Cuatro Esquinas area returned higher grades than modeled(DDH-946B, 288 meters at 1.23 g/t, including 86 meters at 3.12g/t), pointing to exploration upside and potential life of mine extensions. An updated block model constrained by the new geological model will be generated in the fourth quarter of 2019. At the district level, two brownfield targets have been delineated for drill testing this upcoming summer, whilst three other areas of interest have been
| BARRICK THIRD QUARTER 2019 | 63 | MANAGEMENT’S DISCUSSION AND ANALYSIS |
identified for follow up activities such as mapping, sampling and geophysics.
Lagunas Norte, Peru
At Lagunas Norte, we are continuing to validate the resource model despite putting the asset on care and maintenance. The geology model for refractory sulphide mineralization (“PMR”) was revised based onre-logging from three main areas, which is forming the basis of an updated resource estimate. Additional drilling may be warranted to validate the model and upside potential. The focus is currently oriented towards identifying extensions of the new mineralization controls defined in the different sectors of the deposit. In the Dafne sector, the continuity of the controls modeled remain untested for more than 300 meters southward of section 3050mN. Additionally, surface work suggests potential for sulphide mineralization in the La Antena area, located immediately south of the open pit. Both targets will be drill tested in the fourth quarter of 2019.
Pascua-Lama, Argentina/Chile
At Pascua-Lama, an improved 3D geology model was completed, which is the first model update in over 15 years. This has resulted in an improved understanding on the controls to mineralization which is being used to constrain a new block model. Drilling to validate the updated model is contemplated for this coming summer.
Bambadji, Senegal
At Bambadji in Senegal, results from auger drilling beneath transported material confirmed two separate multi-kilometer anomalous structures which are largely untested. These structures form part of a recognized regional trend in gold mineralization in the district and will be the focus of follow up work.
Loulo-Gounkoto, Mali9
At Yalea, strong drill results continue to confirm that high grade mineralization is open to the south of the Transfer Zone target which will be tested with step out holes in the fourth quarter of 2019. At Loulo 3 South, drill results confirmed continuous mineralization with grades increasing at depth, highlighting the potential for additional economic mineralization along the Yalea structure. At Gounkoto, infill drilling has confirmed the continuity of high-grade mineralization as part of the underground feasibility study, whilst identifying a smaller high-grade shoot at depth in the south of the deposit. Outside the main deposit, auger drilling at Gounkoto South has more accurately traced out the surface expression of the main
mineralized structures ahead of follow up work in coming quarters. Elsewhere in Mali, generative work is in progress in the Kenieba-Kedougou Inlier and in Mali South with ground consolidation underway.
Tongon, Côte d’Ivoire
At Nielle, optimisation work was completed on exploration targets along the Badenou trend confirming the potential at extending the Tongon mine life by up to half a year at the current production rate. Remaining drill gaps along that trend will be tested while are-assessment of the full Nielle portfolio has identified five untested priority targets for follow up.
Boundiali, Côte d’Ivoire
Exploration work will now refocus on the Syama Corridor in the west of the permit. The Sissedougou permit decree was received this quarter, allowing for the start ofsub-surface work in the fourth quarter of 2019 while stream sediment sampling in south eastern Côte d’Ivoire has progressed slowly as a result of continued social and community issues.
Kibali, Democratic Republic of Congo10
At Kibali, drilling in the Gorumbwa-Sessenge gap confirmed multiple narrow andlow-grade lodes. Further infill drilling is in progress as the area has the potential to merge the separate pits around Durba Hill. At both Pakaka and Ikamva, drilling 300m down plunge from the base of the resourcepit-shells intersected mineralization with narrow high-grade zones within wide altered intersections. If results are positive, further infill drilling will be considered to confirm the underground potential. Diamond drilling at Oere in the third quarter has confirmed mineralization is proximal to the same fault that controls the Kalimva deposit along strike to the north. Conceptual drilling is planned to test the observed increase in grade down dip while further testing will continue along strike over the remaining parts of the target in the fourth quarter.
Jabal Sayid, Kingdom of Saudi Arabia
At Jabal Sayid, a review of the geological model for the two main lodes has taken place as a precursor for more detailed remodeling and further investigation. A preliminary revision of the lithostratigraphy, structural settings and metal zonation of lode 4 and lode 2 has highlighted eight near mine targets to be investigated further in the fourth quarter.
| BARRICK THIRD QUARTER 2019 | 64 | MANAGEMENT’S DISCUSSION AND ANALYSIS |
REVIEW OF FINANCIAL RESULTS
Revenue
($ millions, except per ounce/pound data in dollars) | For the three months ended | For the nine months ended | ||||||||||||||||||
| 9/30/19 | 6/30/19 | 9/30/18 | 9/30/19 | 9/30/18 | ||||||||||||||||
Gold | ||||||||||||||||||||
000s oz solda | 1,318 | 1,372 | 1,204 | 4,055 | 3,312 | |||||||||||||||
000s oz produceda | 1,306 | 1,353 | 1,149 | 4,026 | 3,265 | |||||||||||||||
Market price ($/oz) | 1,472 | 1,309 | 1,213 | 1,364 | 1,282 | |||||||||||||||
Realized price ($/oz)b | 1,476 | 1,317 | 1,216 | 1,365 | 1,284 | |||||||||||||||
Revenue | 2,585 | 1,937 | 1,661 | 6,428 | 4,866 | |||||||||||||||
Copper | ||||||||||||||||||||
millions lbs solda | 65 | 96 | 114 | 264 | 273 | |||||||||||||||
millions lbs produceda | 112 | 97 | 106 | 315 | 274 | |||||||||||||||
Market price ($/lb) | 2.63 | 2.77 | 2.77 | 2.74 | 3.01 | |||||||||||||||
Realized price ($/lb)b | 2.55 | 2.62 | 2.76 | 2.78 | 2.92 | |||||||||||||||
Revenue | 45 | 103 | 145 | 311 | 368 | |||||||||||||||
Other sales | 48 | 23 | 31 | 95 | 105 | |||||||||||||||
Total revenue | 2,678 | 2,063 | 1,837 | 6,834 | 5,339 | |||||||||||||||
| a. | Includes our equity share of gold ounces from Tanzania (notwithstanding the completion of the Acacia transaction on September 17, 2019, we consolidated our interest in Acacia and recorded anon-controlling interest of 36.1% in the income statement for the entirety of the third quarter of 2019 as a matter of convenience) and Pueblo Viejo and copper pounds from Zaldívar and Jabal Sayid. Also includes our equity share of gold ounces from Loulo-Gounkoto, Tongon, Kibali and Morila commencing January 1, 2019, the effective date of the Merger. Starting July 1, 2019, it also includes our 61.5% share of Nevada Gold Mines. |
| b. | Realized price is anon-GAAP financial performance measure with no standardized meaning under IFRS and therefore may not be comparable to similar measures of performance presented by other issuers. For further information and a detailed reconciliation of eachnon-GAAP measure used in this section of the MD&A to the most directly comparable IFRS measure, please see pages 77 to 98 of this MD&A. |
Q3 2019 compared to Q2 2019
In the third quarter of 2019, gold revenues increased by 33% compared to the second quarter of 2019 primarily due to the impact of the production from Nevada Gold Mines, which commenced on July 1, 2019 and is consolidated and included in revenue at 100%. Excluding the impact of the formation of Nevada Gold Mines, gold revenues increased by 4% primarily due to higher realized gold prices1, partially offset by lower gold sales volume. The average market price for the three month period ended September 30, 2019 was $1,472 per ounce versus $1,309 per ounce for the prior quarter. During the third quarter of 2019, the gold price ranged from $1,382 per ounce to $1,557 per ounce, asix-year high, and closed the quarter at $1,485 per ounce. Gold prices in the quarter were influenced by fluctuations in US Treasury rates and changes in expectations for US benchmark interest rates; movements in the US dollar; economic concerns as a result of global trade disputes; and net purchases from investors and the official sector.
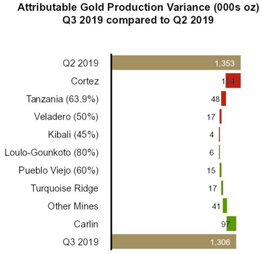
In the third quarter of 2019, gold production on an attributable basis was 47 thousand ounces lower than the prior quarter. Excluding the impact of the formation of Nevada Gold Mines, gold production in the third quarter of 2019 decreased by 128 thousand ounces, or 9%, compared to the prior quarter, primarily due to lower grade and decreased ore processed at Cortez as mining from CHOP was completed in the second quarter of 2019 and the Prohibition Notice at North Mara in Tanzania.
Copper revenues in the third quarter of 2019 decreased by 56% compared to the prior quarter, primarily due to lower copper sales volume and lower realized copper prices1. The average market price in the third quarter of 2019 was $2.63 per pound versus $2.77 per pound in the prior quarter. Realized copper price1 in both the third quarter and the prior quarter was lower than the market copper price as a result of the impact of negative provisional pricing adjustments recorded. During the third quarter of 2019, the copper price ranged from $2.50 per pound to $2.80 per pound and closed the quarter at $2.60 per pound. Copper prices in the third quarter were negatively influenced by concerns regarding global trade disputes, a weakening Chinese yuan, and slowing economic growth in China.
Attributable copper production in the third quarter of 2019 increased by 15 million pounds compared to the prior quarter, primarily due to higher grade and increased throughput at Lumwana. In spite of a strong quarter on production, sales were negatively affected by a major refurbishment at one of the third-party smelters that processes a portion of Lumwana’s concentrate. The refurbishment is expected to be completed by the end of this year. We continue to evaluate alternative options for selling our concentrate during this maintenance period.
| BARRICK THIRD QUARTER 2019 | 65 | MANAGEMENT’S DISCUSSION AND ANALYSIS |
Q3 2019 compared to Q3 2018
For the three month period ended September 30, 2019, gold revenues increased by 56% compared to the same prior year period primarily due to the impact of production from sites acquired as part of the Merger and from Nevada Gold Mines, which commenced on July 1, 2019 and is consolidated and included in revenue at 100%. Excluding the impact of the Merger and the formation of Nevada Gold Mines, gold revenues decreased by 2%, mainly due to lower gold sales volumes, partially offset by higher realized gold prices1. The average market price for the three month period ended September 30, 2019 was $1,472 per ounce versus $1,213 per ounce for the same prior year period.
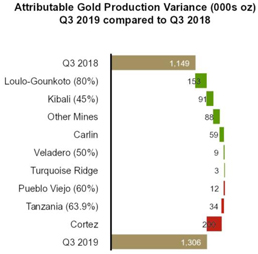
For the three month period ended September 30, 2019, attributable gold production was 157 thousand ounces higher than the same prior year period. Excluding the impact of the Merger and the formation of Nevada Gold Mines, gold production for the three month period ended September 30, 2019 decreased by 236 thousand ounces, or 21%, compared to the same prior year period. Lower gold production for the three month period is mainly due to lower grades mined and processed at Cortez as mining from CHOP was completed in the second quarter of 2019, and the Prohibition Notice at North Mara.
Copper revenues for the three month period ended September 30, 2019 decreased by 69% compared to the same prior year period. Lower copper revenues for the three month period was primarily due to lower copper sales volumes and lower realized copper prices1. In the third quarter of 2019, the realized copper price1 was lower than the market copper price as a result of the impact of negative provisional pricing adjustments recorded in the third quarter of 2019, whereas the realized copper price1 was in line with the market copper price in the same prior year period.
Attributable copper production for the three month period ended September 30, 2019, increased by 6 million pounds compared to the same prior year period, as a result of incremental increases at all sites. Copper sales during the third quarter of 2019 were negatively affected by a major refurbishment at one of the third-party smelters that processes
a portion of Lumwana’s concentrate. The refurbishment is expected to be completed by the end of this year. We continue to evaluate alternative options for selling our concentrate during this maintenance period.
YTD Q3 2019 compared to YTD Q3 2018
For the nine month period ended September 30, 2019, gold revenues increased 32% compared to the same prior year period primarily due to the impact of production from sites acquired as part of the Merger and from Nevada Gold Mines, which commenced on July 1, 2019 and is consolidated and included in revenue at 100%. Excluding the impact of the Merger and the formation of Nevada Gold Mines, gold revenues were broadly in line with the same prior year period, as a decrease in gold sales volumes was largely offset by an increase in realized gold prices1. The average market price for the nine month period ended September 30, 2019 was $1,364 per ounce versus $1,282 per ounce for the same prior year period.
For the nine month period ended September 30, 2019, attributable gold production was 761 thousand ounces higher than the same prior year period. Excluding the impact of the Merger and the formation of Nevada Gold Mines, gold production for the nine month period ended September 30, 2019 decreased by 227 thousand ounces, mainly due to lower grades mined and processed at Cortez as mining from CHOP was completed in the second quarter of 2019, and lower production at Lagunas Norte as it enters care and maintenance.
Copper revenues for the nine month period ended September 30, 2019 decreased by 15% compared to the same prior year period. Lower copper revenues for the nine month period was primarily due to lower realized copper prices1, combined with lower copper sales volumes. Copper sales were negatively affected by a major refurbishment at one of the third-party smelters that processes a portion of Lumwana’s concentrate. For the nine month period ended September 30, 2019, the realized copper price1 was higher than the market copper price as a result of the impact of positive provisional pricing adjustments recorded in the current year, whereas the realized copper price1 was lower than the market copper price in the same prior year period as a result of the impact of negative provisional pricing adjustments.
Attributable copper production for the nine month period ended September 30, 2019, increased by 41 million pounds compared to the same prior year period, mainly due to crusher availability issues at Lumwana and crusher and conveyor issues at Zaldívar, both occurring in the same prior year period.
| BARRICK THIRD QUARTER 2019 | 66 | MANAGEMENT’S DISCUSSION AND ANALYSIS |
Production Costs
($ millions, except per ounce/ pound data in dollars) | For the three months ended | For the nine months ended | ||||||||||||||||||
| 9/30/19 | 6/30/19 | 9/30/18 | 9/30/19 | 9/30/18 | ||||||||||||||||
Gold | ||||||||||||||||||||
Direct mining costsa | 1,207 | 921 | 790 | 3,022 | 2,196 | |||||||||||||||
Depreciation | 538 | 431 | 319 | 1,353 | 907 | |||||||||||||||
Royalty expense | 79 | 78 | 45 | 223 | 138 | |||||||||||||||
Community relations | 7 | 7 | 10 | 20 | 27 | |||||||||||||||
Cost of sales | 1,831 | 1,437 | 1,164 | 4,618 | 3,268 | |||||||||||||||
Cost of sales ($/oz)b | 1,065 | 964 | 850 | 991 | 859 | |||||||||||||||
Total cash costs ($/oz)c | 710 | 651 | 587 | 663 | 588 | |||||||||||||||
All-in sustaining costs ($/oz)c | 984 | 869 | 785 | 883 | 813 | |||||||||||||||
Copper | ||||||||||||||||||||
Direct mining costs | 30 | 63 | 96 | 169 | 231 | |||||||||||||||
Depreciation | 13 | 28 | 37 | 83 | 86 | |||||||||||||||
Royalty expense | 5 | 9 | 11 | 26 | 28 | |||||||||||||||
Community relations | 1 | 1 | 0 | 3 | 3 | |||||||||||||||
Cost of sales | 49 | 101 | 144 | 281 | 348 | |||||||||||||||
Cost of sales ($/lb)b | 2.00 | 2.04 | 2.18 | 2.10 | 2.22 | |||||||||||||||
C1 cash costs ($/lb)c | 1.62 | 1.59 | 1.94 | 1.62 | 1.97 | |||||||||||||||
All-in sustaining costs ($/lb)c | 2.58 | 2.28 | 2.71 | 2.42 | 2.76 | |||||||||||||||
| a. | Includes mining and processing costs. |
| b. | Cost of sales applicable to gold per ounce is calculated using cost of sales applicable to gold on an attributable basis (removing thenon-controlling interest of 40% Pueblo Viejo, 36.1% Tanzania (notwithstanding the completion of the Acacia transaction on September 17, 2019, we consolidated our interest in Acacia and recorded anon-controlling interest of 36.1% in the income statement for the entirety of the third quarter of 2019 as a matter of convenience) and 40% South Arturo from cost of sales (63.1% of South Arturo from July 1, 2019 onwards as a result of its contribution to Nevada Gold Mines)), divided by attributable gold ounces. Thenon-controlling interest of 20% Loulo-Gounkoto and 10.3% of Tongon is also removed from cost of sales and our proportionate share of cost of sales attributable to equity method investments (Kibali and Morila) is included commencing January 1, 2019, the effective date of the Merger. Also removes thenon-controlling interest of 38.5% Nevada Gold Mines from cost of sales from July 1, 2019 onwards. Cost of sales applicable to copper per pound is calculated using cost of sales applicable to copper including our proportionate share of cost of sales attributable to equity method investments (Zaldívar and Jabal Sayid), divided by consolidated copper pounds (including our proportionate share of copper pounds from our equity method investments). |
| c. | Total cash costs, C1 cash costs andall-in sustaining costs arenon-GAAP financial performance measures with no standardized meaning under IFRS and therefore may not be comparable to similar measures of performance presented by other issuers. For further information and a detailed reconciliation of eachnon-GAAP measure used in this section of the MD&A to the most directly comparable IFRS measure, please see pages 77 to 98 of this MD&A. |
Q3 2019 compared to Q2 2019
In the third quarter of 2019, cost of sales applicable to gold was 27% higher compared to the second quarter of 2019, mainly due to higher direct mining costs and depreciation expense primarily due to the inclusion of production from
Nevada Gold Mines, which commenced on July 1, 2019 and is consolidated and included in cost of sales at 100%. Excluding the impact of the formation of Nevada Gold Mines, direct mining costs and depreciation expense were broadly in line with the prior quarter. Our 45% interest in Kibali and 40% interest in Morila are equity accounted for and therefore we do not include their cost of sales in our consolidated gold cost of sales. On a per ounce basis, cost of sales applicable to gold2, after including our proportionate share of cost of sales at our equity method investees, and total cash costs1 were 10% and 9% higher, respectively, than the prior quarter primarily due to the $11 million inventory obsolescence provision recorded at Lagunas Norte relating to the transition to care and maintenance, and the impact of lower grades processed at Cortez as mining in the higher grade CHOP was completed during the second quarter.
In the third quarter of 2019, goldall-in sustaining costs1 were up 13% on a per ounce basis compared to the prior quarter primarily due to an increase in total cash costs1 as discussed above, combined with higher minesite sustaining capital expenditures.
In the third quarter of 2019, cost of sales applicable to copper was 51% lower than the prior quarter primarily due to lower copper sales volume at Lumwana, as sales were negatively affected by a major refurbishment at one of the third-party smelters that processes a portion of Lumwana’s concentrate. The refurbishment is expected to be completed by the end of this year. Our 50% interests in Zaldívar and Jabal Sayid are equity accounted for and therefore we do not include their cost of sales in our consolidated copper cost of sales. On a per pound basis, cost of sales applicable to copper2 and C1 cash costs1, after including our proportionate share of cost of sales at our equity method investees, decreased by 2% and increased by 2%, respectively, compared to the prior quarter as lower depreciation charges outweighed increased concentrate marketing costs at Lumwana.
In the third quarter of 2019, copperall-in sustaining costs1, which have been adjusted to include our proportionate share of equity method investees, were 13% higher per pound than the prior quarter primarily reflecting higher minesite sustaining capital expenditures on a per pound basis.
Q3 2019 compared to Q3 2018
For the three month period ended September 30, 2019, cost of sales applicable to gold was 57% higher than the same prior year period due to increased sales volumes resulting from the Merger and the formation of Nevada Gold Mines. Excluding the impact of the Merger and Nevada Gold Mines, cost of sales applicable to gold was 7% higher compared to the same prior year period, primarily due to lower grade ore processed at Goldstrike and the export tax announced in September 2018 by the Argentine government at Veladero. Our 45% interest in Kibali and 40% interest in Morila are equity accounted for and therefore we do not include their cost of sales in our consolidated gold cost of sales. On a per ounce basis, cost of sales applicable to gold2, after including our proportionate share of cost of sales at our equity method investees, was 25% higher than the same prior year period primarily due to higher depreciation expense as a result of the fair value increments applied to our interests in the Randgold and Nevada Gold Mines operations. Total cash costs per ounce1 increased by 21% compared to the same prior year
| BARRICK THIRD QUARTER 2019 | 67 | MANAGEMENT’S DISCUSSION AND ANALYSIS |
period mainly due to the $11 million inventory obsolescence provision recorded at Lagunas Norte relating to the transition to care and maintenance, and the impact of lower grades processed at Cortez as mining in the higher grade CHOP was completed during the second quarter
For the three month period ended September 30, 2019, goldall-in sustaining costs1 increased by 25% on a per ounce basis compared to the same prior year period, primarily due to an increase in total cash costs1, combined with higher minesite sustaining capital expenditures.
For the three month period ended September 30, 2019, cost of sales applicable to copper was 66% lower than the same prior year period primarily due to lower copper sales volume at Lumwana, as sales were negatively affected by a major refurbishment at one of the third-party smelters that processes a portion of Lumwana’s concentrate. The refurbishment is expected to be completed by the end of this year. Our 50% interests in Zaldívar and Jabal Sayid are equity accounted for and therefore we do not include their cost of sales in our consolidated copper cost of sales. On a per pound basis, cost of sales applicable to copper2and C1 cash costs1, after including our proportionate share of cost of sales at our equity method investees, decreased by 8% and 16%, respectively, compared to the same prior year period primarily due to lower repairs and maintenance costs at Lumwana.
For the three month period ended September 30, 2019, copperall-in sustaining costs1, which have been adjusted to include our proportionate share of equity method investees, was 5% lower per pound than the same prior year period primarily reflecting lower C1 cash costs1, partially offset by higher minesite sustaining capital expenditures on a per pound basis.
YTD Q3 2019 compared to YTD Q3 2018
For the nine month period ended September 30, 2019, cost of sales applicable to gold was 41% higher than the same prior year period due to higher sales volume resulting from the Merger and the formation of Nevada Gold Mines. Excluding the impact of the Merger and formation of Nevada Gold Mines, cost of sales applicable to gold was broadly in line with the same prior year period. Our 45% interest in Kibali and 40% interest in Morila are equity accounted for and therefore we do not include their cost of sales in our consolidated gold cost of sales. On a per ounce basis, cost of sales applicable to gold2, after including our proportionate share of cost of sales at our equity method investees, was 15% higher than the same prior year period primarily due to higher depreciation expense as a result of the fair value increments applied to our interests in the Randgold and Nevada Gold Mines operations. Total cash costs per ounce1 increased by 13% compared to the same prior year period primarily due to the impact of lower grades processed at Cortez and the impact of the export tax announced in September 2018 by the Argentine government at Veladero.
For the nine month period ended September 30, 2019, goldall-in sustaining costs per ounce1 increased by 9% compared to the same prior year period, primarily due to an increase in total cash costs per ounce1, whileminesite sustaining capital expenditures remained relatively consistent on a per ounce basis.
For the nine month period ended September 30, 2019, cost of sales applicable to copper was 19% lower than the same prior year period primarily due to the impact of lower copper sales volume at Lumwana, as sales were negatively affected by a major refurbishment at one of the third-party smelters that processes a portion of Lumwana’s concentrate. The refurbishment is expected to be completed by the end of this year. Our 50% interests in Zaldívar and Jabal Sayid are equity accounted for and therefore we do not include their cost of sales in our consolidated copper cost of sales. On a per pound basis, cost of sales applicable to copper2and C1 cash costs1, after including our proportionate share of cost of sales at our equity method investees, decreased by 6% and 18%, respectively, compared to the same prior year period primarily due to the implementation of efficiency initiatives in the current period and higher repairs and maintenance costs associated with addressing crusher availability issues at Lumwana occurring in the same prior year period. The decrease in cost of sales applicable to copper2 on a per pound basis was partially offset by higher depreciation at Lumwana.
For the nine month period ended September 30, 2019, copperall-in sustaining costs1, which have been adjusted to include our proportionate share of equity method investees, were 12% lower per pound than the same prior year period primarily reflecting the lower C1 cash costs1, slightly offset by higher minesite sustaining capital expenditures.
Capital Expendituresa
| ($ millions) | For the three months ended | For the nine months ended | ||||||||||||||||||
| 9/30/19 | 6/30/19 | 9/30/18 | 9/30/19 | 9/30/18 | ||||||||||||||||
Minesite sustainingb | 406 | 267 | 256 | 926 | 701 | |||||||||||||||
Project capital expendituresc | 96 | 108 | 131 | 324 | 325 | |||||||||||||||
Capitalized interest | 0 | 4 | 0 | 5 | 0 | |||||||||||||||
Total consolidated capital expenditures | 502 | 379 | 387 | 1,255 | 1,026 | |||||||||||||||
Attributable capital expendituresd | 397 | 361 | 372 | 1,119 | 995 | |||||||||||||||
| a. | These amounts are presented on a 100% cash basis, except for attributable capital expenditures. |
| b. | Includes both minesite sustaining and mine development. |
| c. | Project capital expenditures (on an accrued basis until December 31, 2018, and on a cash basis thereafter) are included in our calculation ofall-in costs, but not included in our calculation ofall-in sustaining costs. |
| d. | These amounts are presented on the same basis as our guidance and include our 60% share of Pueblo Viejo and South Arturo (36.9% of South Arturo from July 1, 2019 onwards as a result of its contribution to Nevada Gold Mines), our 63.9% share of Tanzania (notwithstanding the completion of the Acacia transaction on September 17, 2019, we consolidated our interest in Acacia and recorded anon-controlling interest of 36.1% in the income statement for the entirety of the third quarter of 2019 as a matter of convenience) and our 50% share of Zaldívar and Jabal Sayid. Also includes our 80% share of Loulo-Gounkoto, 89.7% share of Tongon, 45% share of Kibali and 40% share of Morila commencing January 1, 2019, the effective date of the Merger. Starting July 1, 2019, it also includes our 61.5% share of Nevada Gold Mines. |
Q3 2019 compared to Q2 2019
In the third quarter of 2019, total consolidated capital expenditures on a cash basis increased by 32% compared to the second quarter of 2019, primarily due to the impact of capital expenditures from Nevada Gold Mines, which
| BARRICK THIRD QUARTER 2019 | 68 | MANAGEMENT’S DISCUSSION AND ANALYSIS |
commenced on July 1, 2019, and is consolidated and included at 100%. Excluding the impact of the formation of Nevada Gold Mines, capital expenditures increased by 9% primarily due to a strategic land acquisition at Cortez and increased capitalized stripping, underground development and minesite sustaining capital at Loulo-Gounkoto. Project capital expenditures remained relatively consistent with the prior quarter.
Q3 2019 compared to Q3 2018
For the three month period ended September 30, 2019, total consolidated capital expenditures on a cash basis increased by 30% compared to the same prior year period, primarily due to the impact of the sites acquired as part of the Merger and from Nevada Gold Mines, which commenced on July 1, 2019, and is consolidated and included at 100%. Excluding the impact of the Merger and the formation of Nevada Gold Mines, capital expenditures decreased by 7% mainly at Pueblo Viejo as a result of lower capitalized stripping costs and timing in project execution and at Tanzania due to lower capitalized stripping. This was further impacted by a decrease in project capital expenditures at Cortez due to the ramp down in the Rangefront Declines, Deep South, and Crossroads dewatering projects, partially offset by increased Crossroads stripping.
YTD Q3 2019 compared to YTD Q3 2018
For the nine month period ended September 30, 2019, total consolidated capital expenditures on a cash basis increased by 22% compared to the same prior year period, due to the impact of the sites acquired as part of the Merger and from Nevada Gold Mines, which commenced on July 1, 2019, and is consolidated and included at 100%. Excluding the impact of the Merger and the formation of Nevada Gold Mines, capital expenditures remained in line with the prior year.
General and Administrative Expenses
| ($ millions) | For the three months ended | For the nine months ended | ||||||||||||||||||
| 9/30/19 | 6/30/19 | 9/30/18 | 9/30/19 | 9/30/18 | ||||||||||||||||
Corporate administrationa | 39 | 40 | 61 | 122 | 178 | |||||||||||||||
Share-based compensationb | 13 | 13 | 2 | 32 | 16 | |||||||||||||||
Tanzaniac | 16 | 6 | 8 | 27 | 18 | |||||||||||||||
General & administrative expenses | 68 | 59 | 71 | 181 | 212 | |||||||||||||||
| a. | For the three and nine months ended September 30, 2019, corporate administration costs include approximately $3 million and $18 million, respectively, of severance costs (June 30, 2019: $10 million and September 30, 2018: $8 million and $36 million, respectively). |
| b. | Based on US$17.33 share price as at September 30, 2019 (June 30, 2019: US$15.77 and September 30, 2018: US$11.08) and excludes share-based compensation relating to Tanzania. |
| c. | Formerly known as Acacia Mining plc. This line includes severance costs of approximately $13 million and $15 million for the three and nine months ended September 30, 2019, respectively. |
Q3 2019 compared to Q2 2019
In the third quarter of 2019, general and administrative expenses increased by $9 million compared to the second quarter of 2019 primarily related to severance costs at Tanzania resulting from the closure of Acacia’s London and Johannesburg offices.
Q3 2019 compared to Q3 2018
For the three month period ended September 30, 2019, general and administrative expenses decreased by $3 million compared to the same prior year period primarily due to a decrease in corporate administration expenses attributed to the organizational reductions related to both the decentralized operating model in the prior year period and the Merger. This was partially offset by an increase in share-based compensation as a result of higher share prices compared to the same prior year period and higher general and administrative expenses at Tanzania due to severance costs resulting from the closing of Acacia’s London and Johannesburg offices.
YTD Q3 2019 compared to YTD Q3 2018
For the nine month period ended September 30, 2019, general and administrative expenses decreased by $31 million compared to the same prior year period due to lower corporate administration expenses attributed to the organizational reductions related to both the decentralized operating model in the prior year period and the Merger in the current period. This was partially offset by higher share-based compensation resulting from higher share prices compared to the same prior year period and higher general and administrative expenses at Tanzania due to severance costs resulting from the closing of Acacia’s London and Johannesburg offices.
| BARRICK THIRD QUARTER 2019 | 69 | MANAGEMENT’S DISCUSSION AND ANALYSIS |
Exploration, Evaluation and Project Expenses
| ($ millions) | For the three months ended | For the nine months ended | ||||||||||||||||||
| 9/30/19 | 6/30/19 | 9/30/18 | 9/30/19 | 9/30/18 | ||||||||||||||||
Global exploration and evaluation | 34 | 45 | 26 | 110 | 92 | |||||||||||||||
Advanced project costs: | ||||||||||||||||||||
Pascua-Lama | 13 | 12 | 19 | 38 | 67 | |||||||||||||||
Other | 5 | 5 | 12 | 14 | 26 | |||||||||||||||
Corporate development | 11 | 22 | 16 | 41 | 28 | |||||||||||||||
Business improvement and innovation | 1 | 2 | 5 | 10 | 15 | |||||||||||||||
Global exploration and evaluation and project expense | 64 | 86 | 78 | 213 | 228 | |||||||||||||||
Minesite exploration and evaluation | 22 | 12 | 11 | 45 | 31 | |||||||||||||||
Total exploration, evaluation and project expenses | 86 | 98 | 89 | 258 | 259 | |||||||||||||||
Q3 2019 compared to Q2 2019
Exploration, evaluation and project expenses for the third quarter of 2019 decreased by $12 million compared to the second quarter of 2019 primarily due to lower corporate development costs as a result of transaction costs related to the establishment of the Nevada Gold Mines joint venture occurring in the prior quarter, partially offset by the transaction costs related to acquiring the shares that we did not already own in Acacia. This was further impacted by lower global exploration and evaluation expenses at Fourmile and Pueblo Viejo, partially offset by higher minesite exploration and evaluation expenses at Nevada Gold Mines.
Q3 2019 compared to Q3 2018
Exploration, evaluation and project expenses for the three month period ended September 30, 2019 was $3 million lower than the same prior year period. Lower advanced project costs, primarily at Pascua-Lama, combined with lower corporate development costs primarily relating to the Merger occurring in the same prior year period was largely offset by higher minesite exploration and evaluation costs and higher global exploration and evaluation expenses at Nevada Gold Mines.
YTD Q3 2019 compared to YTD Q3 2018
Exploration, evaluation and project expenses for the nine month period ended September 30, 2019 was in line with the same prior year period. Lower advanced project costs, primarily at Pascua-Lama, was partially offset by higher global exploration and evaluation expenses mainly due to increased drilling at Pueblo Viejo and higher minesite exploration and evaluation costs at Nevada Gold Mines. This was further impacted by higher corporate development costs resulting from the transaction costs related to Nevada Gold Mines and acquiring the shares that we did not already own in Acacia.
Finance Costs, Net
| ($ millions) | For the three months ended | For the nine months ended | ||||||||||||||||||
| 9/30/19 | 6/30/19 | 9/30/18 | 9/30/19 | 9/30/18 | ||||||||||||||||
Interest expensea | 112 | 109 | 110 | 331 | 342 | |||||||||||||||
Accretion | 19 | 20 | 23 | 59 | 65 | |||||||||||||||
Loss on debt extinguishment | 3 | 0 | 29 | 3 | 29 | |||||||||||||||
Interest capitalized | (3 | ) | (3 | ) | 0 | (8 | ) | 0 | ||||||||||||
Other finance costs | (2 | ) | (1 | ) | 1 | (4 | ) | 4 | ||||||||||||
Finance income | (4 | ) | (7 | ) | (4 | ) | (18 | ) | (12 | ) | ||||||||||
Finance costs, net | 125 | 118 | 159 | 363 | 428 | |||||||||||||||
| a. | For the three and nine months ended September 30, 2019, interest expense includes approximately $25 million and $75 million, respectively, ofnon-cash interest expense relating to the gold and silver streaming agreements with Wheaton Precious Metals Corp. and Royal Gold, Inc. (June 30, 2019: $25 million and September 30, 2018: $24 million and $73 million, respectively). |
Q3 2019 compared to Q2 2019
In the third quarter of 2019, net finance costs were 6% higher than the prior quarter, mainly due to higher interest expense resulting from capital leases, combined with a loss on debt extinguishment of $3 million as a result of the make-whole repurchase of the outstanding $248 million of principal of our 4.95% notes due 2020.
Q3 2019 compared to Q3 2018
For the three month period ended September 30, 2019, net finance costs were 21% lower than the same prior year period, primarily due to a decrease in loss on debt extinguishment. The loss on debt extinguishment in the third quarter of 2019 relates to the make-whole repurchase of the outstanding $248 million of principal of our 4.95% notes due 2020 in July 2019. For the third quarter of 2018, the loss on debt extinguishment relates to the make-whole repurchase of the remaining $629 million of principal on the 4.40% Notes due 2021 in July 2018.
YTD Q3 2019 compared to YTD Q3 2018
For the nine month period ended September 30, 2019, net finance costs were 15% lower than the same prior year period, primarily due to a decrease in loss on debt extinguishment, as described above. This was combined with lower interest expense attributed to debt reductions made in the prior year when we completed a make-whole repurchase of the remaining $629 million of principal on the 4.40% Notes due 2021.
| BARRICK THIRD QUARTER 2019 | 70 | MANAGEMENT’S DISCUSSION AND ANALYSIS |
Additional Significant Statement of Income Items
| ($ millions) | For the three months ended | For the nine months ended | ||||||||||||||||||
| 9/30/19 | 6/30/19 | 9/30/18 | 9/30/19 | 9/30/18 | ||||||||||||||||
Impairment charges (reversals) | (872 | ) | 12 | 431 | (857 | ) | 492 | |||||||||||||
(Gain) loss on currency translation | 40 | (6 | ) | 62 | 56 | 152 | ||||||||||||||
Other expense (income) | (1,852 | ) | 7 | 16 | (1,818 | ) | 55 | |||||||||||||
Impairment Charges (Reversals)
Q3 2019 compared to Q2 2019
In the third quarter of 2019, net impairment reversals were $872 million compared to net impairment charges of $12 million in the prior quarter. The net impairment reversal in the third quarter of 2019 relates to a reversal at Lumwana of $947 million, partially offset by impairments of land holdings and CHOP infrastructure assets at Cortez. In the second quarter of 2019, the net impairment charges primarily relate to equipment at Golden Sunlight as underground development has ceased.
Q3 2019 compared to Q3 2018
For the three month period ended September 30, 2019, net impairment reversals were $872 million compared to net impairment charges of $431 million in the same prior year period. The net impairment reversal in the third quarter of 2019 relates to a reversal at Lumwana of $947 million, partially offset by impairments of land holdings and CHOP infrastructure assets at Cortez. In the third quarter of 2018, the net impairment charges primarily relate to an asset impairment at Lagunas Norte.
YTD Q3 2019 compared to YTD Q3 2018
For the nine month period ended September 30, 2019, net impairment reversals were $857 million compared to net impairment charges of $492 million in the same prior year period. The net impairment reversal in the current year relates to a reversal at Lumwana of $947 million, partially offset by impairments of land holdings and CHOP infrastructure assets at Cortez and equipment at Golden Sunlight as underground development has ceased. For the nine month period ended September 30, 2018, the net impairment charges primarily relate to an asset impairment at Lagunas Norte, combined with impairment charges of $30 million on the Kabanga project (a joint venture between Barrick and Glencore) and $24 million on Acacia’s Nyanzaga project in Tanzania.
For a further breakdown of impairment charges and reversals, refer to note 13 of the Financial Statements.
(Gain) Loss on Currency Translation
Q3 2019 compared to Q2 2019
Loss on currency translation in the third quarter of 2019 was $40 million compared to a gain of $6 million in the prior quarter. The decrease was primarily due to unrealized foreign currency translation losses resulting from the depreciation of the Argentine peso in the current quarter versus modest appreciation in the prior quarter. This currency depreciation resulted in the revaluation of our peso denominated value-added tax receivable balances. During the third quarter of 2019, the Argentine peso weakened significantly versus the US dollar due in part to high inflation and political uncertainty in the country.
Q3 2019 compared to Q3 2018
Loss on currency translation in the third quarter of 2019 was $40 million compared to $62 million in the same prior year period due to unrealized foreign currency translation losses relating to the Argentine peso, which depreciated significantly in both periods, but from a lower asset base in 2019 versus 2018. Fluctuations in the Argentine peso exchange rate versus the US dollar revalue our peso denominated value-added tax receivable balances.
YTD Q3 2019 compared to YTD Q3 2018
Loss on currency translation for the nine month period ended September 30, 2019 decreased by $96 million compared to the same prior year period, due to continued unrealized foreign currency translation losses relating to the Argentine peso, but from a lower asset base in 2019 versus 2018. The peso has significantly depreciated in both periods and has revalued our peso denominated value-added tax receivable balances. After modest appreciation of the Argentine peso in the second quarter of 2019, the impact of inflation and political uncertainty in Argentina experienced in the third quarter of 2019 has driven a return to the general trend in recent years of a weakening peso versus the US dollar.
Other Expense (Income)
Q3 2019 compared to Q2 2019
In the third quarter of 2019, other income was $1,852 million compared to an expense of $7 million in the prior quarter. Other income in the third quarter of 2019 mainly relates to the gain on the remeasurement of Barrick’s 75% interest in Turquoise Ridge to fair value as a result of its contribution to Nevada Gold Mines. Refer to note 4 to the Financial Statements for more information. Other expense in the third quarter of 2019 primarily consists of various costs and litigation expenses incurred by Acacia, partially offset by a gain of $12 million on the sale of long-lived assets.
Q3 2019 compared to Q3 2018
For the three month period ended September 30, 2019, other income was $1,852 million compared to an expense of $16 million in the same prior year period. Other income in the third quarter of 2019 mainly relates to the gain on the remeasurement of Barrick’s 75% interest in Turquoise Ridge to fair value as a result of its contribution to Nevada Gold Mines. Refer to note 4 to the Financial Statements for more information. For the three month period ended September 30, 2018, other expense mainly relates to a $27 million settlement of a dispute regarding a historical supplier contract acquired as part of the Equinox acquisition of 2011, partially offset by $24 million of insurance proceeds received at Kalgoorlie.
YTD Q3 2019 compared to YTD Q3 2018
For the nine month period ended September 30, 2019, other income was $1,818 million compared to an expense of $55 million in the same prior year period. Other income in the current year mainly relates to the gain on the remeasurement of Barrick’s 75% interest in Turquoise Ridge to fair value as a result of its contribution to Nevada Gold Mines. Refer to note 4 to the Financial Statements for more information. For the nine month period ended September 30, 2018, other expense mainly relates to litigation expenses incurred by Acacia and the Bulyanhulu reduced operations program, partially offset by a gain on the sale of anon-core royalty asset at Tanzania.
For a further breakdown of other expense (income), refer to note 9 to the Financial Statements.
| BARRICK THIRD QUARTER 2019 | 71 | MANAGEMENT’S DISCUSSION AND ANALYSIS |
Income Tax Expense
Income tax expense was $791 million in the third quarter of 2019. The unadjusted effective income tax rate in the third quarter of 2019 was 25% of the income before income taxes.
The underlying effective income tax rate on ordinary income in the third quarter of 2019 was 31% which includes the impact ofnon-deductible depreciation on the Randgold and Nevada Gold Mines purchase price allocations. Adjustments are made for the impact of the remeasurement of our previously held 75% interest in Turquoise Ridge to fair value; the impact of the impairment reversal at Lumwana; the impact of foreign currency translation losses on deferred tax balances; the impact ofnon-deductible losses on currency translation; the impact of a reduced corporate tax rate in Argentina on deferred tax balances; the impact of recognizing thenon-controlling interest on Turquoise Ridge´s deferred tax liabilities and the impact of other expense adjustments.
We record deferred tax charges or credits if changes in facts or circumstances affect the estimated tax basis of assets and therefore the amount of deferred tax assets or liabilities to reflect changing expectations in our ability to realize deferred tax assets. The interpretation of tax regulations and legislation and their application to our business is complex and subject to change. We have significant amounts of deferred tax assets (mostly unrecognized following impairments in the fourth quarter of 2018), including tax loss carry forwards, and also deferred tax liabilities. Potential changes of any of these amounts, as well as our ability to realize deferred tax assets, could significantly affect net income or cash flow in future periods. For further details on income tax expense, refer to note 10 of the Financial Statements.
Nevada Joint Venture
Nevada Gold Mines is a limited liability company treated as a flow through partnership for US tax purposes. The partnership is not subject to income tax directly, but each of its partners is liable for tax on its share of the profits of the partnership. As such, Barrick accounts for its current and deferred tax associated with the investment (61.5% share) following the principles in IAS 12.
A deferred tax expense of $376 million was recorded in the third quarter of 2019 following the Turquoise Ridge mine remeasurement to fair value and the $1.9 billion recognized gain. For further details, refer to note 4 of the Financial Statements.
Argentina Deferred Taxes
In December 2017, Argentina reduced its 35% corporate tax rate to 30% for 2018 and 2019, with further reduction to 25% for 2020 and thereafter. Concurrently, a dividend distribution tax was introduced that charges 7% tax on dividend distributions for 2018 and 2019, and 13% tax on dividend distributions for 2020 and thereafter.
A deferred tax recovery of $70 million was recorded as a result of an inflation adjustment implemented for statutory financial statement purposes in Argentina, and finalized in the second quarter of 2019, which results in Veladero not having dividend distribution capacity for prior years. The impact of material inflationary adjustments on distributable reserves and deferred taxes is expected to remain variable and will be evaluated on an annual basis.
| BARRICK THIRD QUARTER 2019 | 72 | MANAGEMENT’S DISCUSSION AND ANALYSIS |
FINANCIAL CONDITION REVIEW
Summary Balance Sheet and Key Financial Ratios
| ($ millions, except ratios and share amounts) | As at 9/30/19 | As at 12/31/18 | ||||||
Total cash and equivalents | 2,405 | 1,571 | ||||||
Current assets | 3,105 | 2,407 | ||||||
Non-current assets | 38,357 | 18,653 | ||||||
Total Assets | 43,867 | 22,631 | ||||||
Current liabilities excluding short-term debt | 1,778 | 1,625 | ||||||
Non-current liabilities excluding long-term debta | 8,129 | 5,883 | ||||||
Debt (current and long-term) | 5,560 | 5,738 | ||||||
Total Liabilities | 15,467 | 13,246 | ||||||
Total shareholders’ equity | 20,149 | 7,593 | ||||||
Non-controlling interests | 8,251 | 1,792 | ||||||
Total Equity | 28,400 | 9,385 | ||||||
Total common shares outstanding (millions of shares)b | 1,778 | 1,168 | ||||||
Debt, net of cash | 3,155 | 4,167 | ||||||
Key Financial Ratios: | ||||||||
Current ratioc | 2.99:1 | 2.38:1 | ||||||
Debt-to-equityd | 0.20:1 | 0.61:1 | ||||||
| a. | Non-current financial liabilities as at September 30, 2019 were $6,004 million (December 31, 2018: $6,201 million). |
| b. | Total common shares outstanding do not include 0.4 million stock options. |
| c. | Represents current assets divided by current liabilities (including short-term debt) as at September 30, 2019 and December 31, 2018. |
| d. | Represents debt divided by total shareholders’ equity (including minority interest) as at September 30, 2019 and December 31, 2018. |
Balance Sheet Review
Total assets were $43.9 billion at September 30, 2019, approximately $21.2 billion higher than at December 31, 2018, primarily reflecting the impact of the sites acquired and asset values restated to fair market value in connection with the formation of Nevada Gold Mines on July 1, 2019. These sites are consolidated at 100%. The increase in total assets also reflects the $7.9 billion Merger. Refer to note 4 for a summary of the purchase price allocations in relation to these transactions.
Our asset base is primarily comprised ofnon-current assets such as property, plant and equipment and goodwill, reflecting the capital-intensive nature of the mining business and our history of growing through acquisitions. Other significant assets include production inventories, indirect taxes recoverable and receivable, concentrate sales receivable and other government and joint venture related receivables, and cash and equivalents.
Total liabilities at September 30, 2019 were $15.5 billion, approximately $2.2 billion higher than at December 31, 2018, also reflecting the impact of the formation of Nevada Gold Mines and the Merger. This was combined with the resulting increase in deferred income tax liabilities. Our liabilities are primarily comprised of debt, othernon-current liabilities such as provisions and deferred income tax liabilities, and accounts payable.
Shareholders’ Equity
| As at 10/29/19 | Number of shares | |||
Common shares | 1,777,781,827 | |||
Stock options | 278,732 | |||
Financial Position and Liquidity
Total cash and cash equivalents as at September 30, 2019 were $2.4 billion. Our capital structure comprises a mix of debt,non-controlling interest (primarily at Nevada Gold Mines) and shareholders’ equity. As at September 30, 2019, our total debt was $5.6 billion (debt net of cash and equivalents was $3.2 billion) and ourdebt-to-equity ratio was 0.2:1. This compares to debt as at December 31, 2018 of $5.7 billion (debt net of cash and equivalents was $4.2 billion), and adebt-to-equity ratio of 0.61:1.
On July 15, 2019, we completed a make-whole repurchase of the outstanding $248 million of principal of our 4.95% notes due 2020, which has reduced our total debt to below $5.6 billion at September 30, 2019.
Uses of cash for the remainder of 2019 include capital commitments of $101 million and we expect to incur attributable sustaining and project capital expenditures of approximately $400 to $700 million during the last quarter of the year, based on our guidance range on page 37. For the remainder of 2019, we have contractual obligations and commitments of $317 million for supplies and consumables. In addition, we have $142 million in interest payments and other amounts as detailed in the table on page 75. We expect to fund these commitments through operating cash flow, which is our primary source of liquidity, as well as existing cash balances.
Our operating cash flow is dependent on the ability of our operations to deliver projected future cash flows. The market prices of gold, and to a lesser extent copper, are the primary drivers of our operating cash flow. Other options to enhance liquidity include further portfolio optimization and the creation of new joint ventures and partnerships; issuance of equity securities in the public markets or to private investors, which could be undertaken for liquidity enhancement and/or in connection with establishing a strategic partnership; issuance of long-term debt securities in the public markets or to private
| BARRICK THIRD QUARTER 2019 | 73 | MANAGEMENT’S DISCUSSION AND ANALYSIS |
investors (Moody’s and S&P currently rate Barrick’s outstanding long-term debt as investment grade, with ratings of Baa2 and BBB, respectively); and drawing on the $3.0 billion available under our undrawn credit facility (subject to compliance with covenants and the making of certain representations and warranties, this facility is available for drawdown as a source of financing). The key financial covenant in our undrawn credit facility requires Barrick to maintain a net debt to total capitalization ratio of less than 0.60:1. Barrick’s net debt to total capitalization ratio was 0.10:1 as at September 30, 2019 (0.31:1 as at December 31, 2018).
Summary of Cash Inflow (Outflow)
| ($ millions) | For the three months ended | For the nine months ended | ||||||||||||||||||
| 9/30/19 | 6/30/19 | 9/30/18 | 9/30/19 | 9/30/18 | ||||||||||||||||
Net cash provided by operating activities | 1,004 | 434 | 706 | 1,958 | 1,354 | |||||||||||||||
Investing activities | ||||||||||||||||||||
Capital expenditures | (502 | ) | (379 | ) | (387 | ) | (1,255 | ) | (1,026 | ) | ||||||||||
Cash acquired in Merger | 0 | 0 | 0 | 751 | 0 | |||||||||||||||
Dividends received from equity method investments | 72 | 17 | 0 | 104 | 0 | |||||||||||||||
Other | 47 | 11 | 1 | 88 | 9 | |||||||||||||||
Total investing inflows (outflows) | (383 | ) | (351 | ) | (386 | ) | (312 | ) | (1,017 | ) | ||||||||||
Financing activities | ||||||||||||||||||||
Net change in debta | (269 | ) | (6 | ) | (649 | ) | (303 | ) | (680 | ) | ||||||||||
Dividends | (67 | ) | (61 | ) | (31 | ) | (461 | ) | (94 | ) | ||||||||||
Net (disbursements) funding tonon-controlling interests | (31 | ) | (15 | ) | 5 | (45 | ) | (65 | ) | |||||||||||
Other | (2 | ) | 0 | (29 | ) | (2 | ) | (29 | ) | |||||||||||
Total financing inflows (outflows) | (369 | ) | (82 | ) | (704 | ) | (811 | ) | (868 | ) | ||||||||||
Effect of exchange rate | 0 | (1 | ) | (4 | ) | (1 | ) | (6 | ) | |||||||||||
Increase (decrease) in cash and equivalents | 252 | 0 | (388 | ) | 834 | (537 | ) | |||||||||||||
| a. | The difference between the net change in debt on a cash basis and the net change on the balance sheet is due to changes innon-cash charges, specifically the unwinding of discounts and amortization of debt issue costs. |
Q3 2019 compared to Q2 2019
In the third quarter of 2019, we generated $1,004 million in operating cash flow, compared to $434 million in the prior quarter. The increase of $570 million was primarily due to the impact of the production from Nevada Gold Mines, which commenced on July 1, 2019 and is consolidated and included at 100%. This was combined with higher realized gold prices1 of $1,476 per ounce in the three months ended September 30, 2019 compared to $1,317 per ounce in the prior quarter and a favorable movement in working capital, mainly as a result
of the timing of payments and receivables, partially offset by an unfavorable movement in other current assets. Operating cash flow was also positively impacted by lower income taxes paid and cash interest paid.
Cash outflows from investing activities in the third quarter of 2019 were $383 million compared to $351 million in the prior quarter. The change of $32 million was primarily due to an increase in capital expenditures resulting from the impact of Nevada Gold Mines.
Net financing cash outflows for the third quarter of 2019 amounted to $369 million, compared to $82 million in the prior quarter. The increase of $287 million is primarily due to the make-whole repurchase of the outstanding $248 million of principal of our 4.95% notes due 2020 in July 2019. This was combined with an increase in disbursements tonon-controlling interests.
Q3 2019 compared to Q3 2018
In the third quarter of 2019, we generated $1,004 million in operating cash flow, compared to $706 million in the same prior year period. The increase of $298 million was primarily due to higher sales volume and higher realized gold prices1, partially offset by higher direct mining costs as a result of the increased sales volume.
Cash outflows from investing activities in the third quarter of 2019 were $383 million compared to $386 million in the same prior year period. The change of $3 million was primarily due to an increase in capital expenditures resulting from the impact of Nevada Gold Mines.
Net financing cash outflows for the third quarter of 2019 amounted to $369 million, compared to $704 million in the same prior year period. The lower outflows are primarily due to lower debt repayments in the nine months ended September 30, 2019, partially offset by an increase in disbursements tonon-controlling interests.
YTD Q3 2019 compared to YTD Q3 2018
For the nine month period ended September 30, 2019, we generated $1,958 million in operating cash flow, compared to $1,354 million in the same prior year period. The increase of $604 million was primarily due to higher sales volume and higher realized gold prices1, partially offset by higher direct mining costs as a result of the increased sales volume.
Cash outflows from investing activities for the nine month period ended September 30, 2019 were $312 million compared to an outflow of $1,017 million in the same prior year period. The change of $705 million was primarily due to cash acquired of $751 million as a result of the Merger, combined with dividends received and shareholder loan repayments from equity method investments. This was partially offset by higher capital expenditures during the current year.
Net financing cash outflows for the nine month period ended September 30, 2019 amounted to $811 million, compared to $868 million in the same prior year period. The higher outflows are primarily due to dividends declared in the fourth quarter of 2018 by Barrick and Randgold of $67 million and $256 million, respectively, and paid in the first quarter of 2019. This was combined with an increase in dividends declared for the first quarter of 2019, reflecting Barrick’s profitability and financial strength and is in line with the commitment to shareholder returns made when the Merger was announced. Net financing cash outflows was also impacted by an increase in disbursements to non-controlling interests, partially offset by lower debt repayments during the year.
| BARRICK THIRD QUARTER 2019 | 74 | MANAGEMENT’S DISCUSSION AND ANALYSIS |
COMMITMENTS AND CONTINGENCIES
Litigation and Claims
We are currently subject to various litigation proceedings as disclosed in note 17 to the Financial Statements, and we may be involved in disputes with other parties in the future that may result in litigation. If we are unable to resolve these disputes favorably, it may have a material adverse impact on our financial condition, cash flow and results of operations.
Contractual Obligations and Commitments
In the normal course of business, we enter into contracts that give rise to commitments for future minimum payments. The following table summarizes the remaining contractual maturities of our financial liabilities and operating and capital commitments shown on an undiscounted basis:
| ($ millions) | Payments due as at 9/30/19 | |||||||||||||||||||||||||||
| 2019 | 2020 | 2021 | 2022 | 2023 | 2024 and thereafter | Total | ||||||||||||||||||||||
Debta | ||||||||||||||||||||||||||||
Repayment of principal | 1 | 14 | 7 | 337 | 0 | 5,109 | 5,468 | |||||||||||||||||||||
Capital leases | 12 | 30 | 19 | 12 | 8 | 36 | 117 | |||||||||||||||||||||
Interest | 142 | 323 | 321 | 314 | 307 | 4,751 | 6,158 | |||||||||||||||||||||
Provisions for environmental rehabilitationb | 176 | 140 | 205 | 189 | 208 | 2,626 | 3,544 | |||||||||||||||||||||
Restricted share units | 6 | 21 | 14 | 2 | 0 | 0 | 43 | |||||||||||||||||||||
Pension benefits and other post-retirement benefits | 2 | 8 | 9 | 8 | 8 | 145 | 180 | |||||||||||||||||||||
Minimum royalty paymentsc | 0 | 19 | 0 | 0 | 0 | 0 | 19 | |||||||||||||||||||||
Purchase obligations for supplies and consumablesd | 317 | 300 | 241 | 116 | 100 | 665 | 1,739 | |||||||||||||||||||||
Capital commitmentse | 101 | 42 | 9 | 2 | 2 | 3 | 159 | |||||||||||||||||||||
Social development costsf | 5 | 32 | 8 | 3 | 3 | 56 | 107 | |||||||||||||||||||||
Total | 762 | 929 | 833 | 983 | 636 | 13,391 | 17,534 | |||||||||||||||||||||
| a. | Debt and Interest - Our debt obligations do not include any subjective acceleration clauses or other clauses that enable the holder of the debt to call for early repayment, except in the event that we breach any of the terms and conditions of the debt or for other customary events of default. We are not required to post any collateral under any debt obligations. Projected interest payments on variable rate debt were based on interest rates in effect at September 30, 2019. Interest is calculated on our long-term debt obligations using both fixed and variable rates. |
| b. | Provisions for environmental rehabilitation - Amounts presented in the table represent the undiscounted uninflated future payments for the expected cost of provisions for environmental rehabilitation. |
| c. | Minimum royalty payments are related to continuing operations and are presented net of recoverable amounts. |
| d. | Purchase obligations for supplies and consumables - Includes commitments related to new purchase obligations to secure a supply of acid, tires and cyanide for our production process. |
| e. | Capital commitments - Purchase obligations for capital expenditures include only those items where binding commitments have been entered into. |
| f. | Social development costs - Includes a commitment of $42 million ($28 million in 2020 and $14 million in 2024 and thereafter) related to the funding of a power transmission line in Argentina. |
| BARRICK THIRD QUARTER 2019 | 75 | MANAGEMENT’S DISCUSSION AND ANALYSIS |
REVIEW OF QUARTERLY RESULTS
Quarterly Informationa
| ($ millions, except where indicated) | 2019 | 2019 | 2019 | 2018 | 2018 | 2018 | 2018 | 2017 | ||||||||||||||||||||||||
| Q3 | Q2 | Q1 | Q4 | Q3 | Q2 | Q1 | Q4 | |||||||||||||||||||||||||
Revenues | 2,678 | 2,063 | 2,093 | 1,904 | 1,837 | 1,712 | 1,790 | 2,228 | ||||||||||||||||||||||||
Realized price per ounce – goldb | 1,476 | 1,317 | 1,307 | 1,223 | 1,216 | 1,313 | 1,332 | 1,280 | ||||||||||||||||||||||||
Realized price per pound – copperb | 2.55 | 2.62 | 3.07 | 2.76 | 2.76 | 3.11 | 2.98 | 3.34 | ||||||||||||||||||||||||
Cost of sales | 1,889 | 1,545 | 1,490 | 1,577 | 1,315 | 1,176 | 1,152 | 1,411 | ||||||||||||||||||||||||
Net earnings (loss) | 2,277 | 194 | 111 | (1,197 | ) | (412 | ) | (94 | ) | 158 | (314) | |||||||||||||||||||||
Per share (dollars)c | 1.30 | 0.11 | 0.06 | (1.02 | ) | (0.35 | ) | (0.08 | ) | 0.14 | (0.27 | ) | ||||||||||||||||||||
Adjusted net earningsb | 264 | 154 | 184 | 69 | 89 | 81 | 170 | 253 | ||||||||||||||||||||||||
Per share (dollars)b,c | 0.15 | 0.09 | 0.11 | 0.06 | 0.08 | 0.07 | 0.15 | 0.22 | ||||||||||||||||||||||||
Operating cash flow | 1,004 | 434 | 520 | 411 | 706 | 141 | 507 | 590 | ||||||||||||||||||||||||
Cash capital expenditures | 502 | 379 | 374 | 374 | 387 | 313 | 326 | 350 | ||||||||||||||||||||||||
Free cash flowb | 502 | 55 | 146 | 37 | 319 | (172 | ) | 181 | 240 | |||||||||||||||||||||||
| a. | Sum of all the quarters may not add up to the annual total due to rounding. |
| b. | Realized price, adjusted net earnings, adjusted net earnings per share and free cash flow arenon-GAAP financial performance measures with no standardized meaning under IFRS and therefore may not be comparable to similar measures of performance presented by other issuers. For further information and a detailed reconciliation of eachnon-GAAP measure used in this section of the MD&A to the most directly comparable IFRS measure, please see pages 77 to 98 of this MD&A. |
| c. | Calculated using weighted average number of shares outstanding under the basic method of earnings per share. |
Our recent financial results reflect our emphasis on cost discipline and growing operating cash flow. The positive free cash flow1 generated, combined with the proceeds from various divestitures, have allowed us to continually strengthen our balance sheet over the past two years.
In the third quarter of 2019, net earnings and cash flows were impacted by the formation of Nevada Gold Mines and the commencement of the contribution of its operations to Barrick’s net earnings and cash flows. Net earnings in the third quarter of 2019 includes a $1.5 billion (net of tax effects) gain on remeasurement of Turquoise Ridge as a result of its contribution to Nevada Gold Mines and a $663 million (net of tax effects) impairment reversal at Lumwana. Starting in the first quarter of 2019, we had an increase in sales volume due to the Merger and the commencement of the contribution of
Randgold’s operations to Barrick’s net earnings and cash flows. In the fourth quarter of 2018, we recorded $319 million (net of tax effects andnon-controlling interests) of net asset impairments primarily relating to impairments of $160 million ofnon-current assets and $154 million of goodwill at the Veladero mine. We also recorded in the fourth quarter of 2018 an inventory impairment of $166 million at Lagunas Norte, which was included in cost of sales. In the third quarter of 2018, we recorded a $405 million impairment charge resulting from an asset impairment at Lagunas Norte. In the fourth quarter of 2017, we recorded $521 million (net of tax effects andnon-controlling interest) of net asset impairments primarily relating to impairments at the Pascua-Lama project and the Bulyanhulu mine in Tanzania, partially offset by an impairment reversal at Lumwana.
INTERNAL CONTROL OVER FINANCIAL REPORTING AND DISCLOSURE CONTROLS AND PROCEDURES
Management is responsible for establishing and maintaining adequate internal control over financial reporting and disclosure controls and procedures as defined in our 2018 annual MD&A.
Together, the internal control frameworks provide internal control over financial reporting and disclosure. Due to its inherent limitations, internal control over financial reporting and disclosure may not prevent or detect all misstatements. Further, the effectiveness of internal control is subject to the risk that controls may become inadequate because of changes in conditions, or that the degree of compliance with policies or procedures may change.
There were no changes in our internal controls over financial reporting during the three months ended September 30, 2019 that have materially affected, or are reasonably likely to materially affect, our internal controls over financial reporting.
Under the supervision and with the participation of management, including the President and Chief Executive Officer and Senior Executive Vice-President and Chief Financial Officer, management will continue to monitor and evaluate the design and effectiveness of its internal control over financial reporting and disclosure controls and procedures, and may make modifications from time to time as considered necessary.
| BARRICK THIRD QUARTER 2019 | 76 | MANAGEMENT’S DISCUSSION AND ANALYSIS |
IFRS CRITICAL ACCOUNTING POLICIES AND ACCOUNTING ESTIMATES
Management has discussed the development and selection of our critical accounting estimates with the Audit Committee of the Board of Directors, and the Audit Committee has reviewed the disclosure relating to such estimates in conjunction with its review of this MD&A. The accounting policies and methods we utilize determine how we report our financial condition and results of operations, and they may require Management to make estimates or rely on assumptions about matters that are inherently uncertain. The consolidated financial statements have been prepared in accordance with International Financial Reporting Standards (“IFRS”) as issued by the International Accounting Standards Board (“IASB”) under the historical cost convention, as modified by revaluation of certain financial assets, derivative contracts and post-retirement assets. Our significant accounting policies are disclosed in note 2 of the Financial
Statements, including a summary of current and future changes in accounting policies.
Critical Accounting Estimates and Judgments
Certain accounting estimates have been identified as being “critical” to the presentation of our financial condition and results of operations because they require us to make subjective and/or complex judgments about matters that are inherently uncertain; or there is a reasonable likelihood that materially different amounts could be reported under different conditions or using different assumptions and estimates. Our significant accounting judgments, estimates and assumptions are disclosed in note 3 of the accompanying Financial Statements.
NON-GAAP FINANCIAL PERFORMANCE MEASURES
Adjusted Net Earnings and Adjusted Net Earnings per Share
Adjusted net earnings is anon-GAAP financial measure which excludes the following from net earnings:
| • | Impairment charges (reversals) related to intangibles, goodwill, property, plant and equipment, and investments; |
| • | Acquisition/disposition gains/losses; |
| • | Foreign currency translation gains/losses; |
| • | Significant tax adjustments; |
| • | Unrealized gains/losses onnon-hedge derivative instruments; and |
| • | Tax effect andnon-controlling interest of the above items. |
Management uses this measure internally to evaluate our underlying operating performance for the reporting periods presented and to assist with the planning and forecasting of future operating results. Management believes that adjusted net earnings is a useful measure of our performance because impairment charges, acquisition/disposition gains/losses and significant tax adjustments do not reflect the underlying operating performance of our core mining business and are not necessarily indicative of future operating results. Furthermore, foreign currency translation gains/losses and unrealized gains/losses fromnon-hedge derivatives are not necessarily reflective of the underlying operating results for the reporting periods presented. The tax effect andnon-controlling interest of the adjusting items are also excluded to reconcile the amounts to Barrick’s share on apost-tax basis, consistent with net earnings.
As noted, we use this measure for internal purposes. Management’s internal budgets and forecasts and public guidance do not include the types of items we adjust for. Consequently, the presentation of adjusted net earnings enables investors and analysts to better understand the underlying operating performance of our core mining business through the eyes of management. Management periodically evaluates the components of adjusted net earnings based on an internal assessment of performance measures that are useful for evaluating the operating performance of our business segments and a review of thenon-GAAP measures used by mining industry analysts and other mining companies.
Adjusted net earnings is intended to provide additional information only and does not have any standardized definition under IFRS and should not be considered in isolation or as a substitute for measures of performance prepared in accordance with IFRS. The measures are not necessarily indicative of operating profit or cash flow from operations as determined under IFRS. Other companies may calculate these measures differently. The following table reconciles thesenon-GAAP measures to the most directly comparable IFRS measure.
| BARRICK THIRD QUARTER 2019 | 77 | MANAGEMENT’S DISCUSSION AND ANALYSIS |
Reconciliation of Net Earnings to Net Earnings per Share, Adjusted Net Earnings and Adjusted Net Earnings per Share
| ($ millions, except per share amounts in dollars) | For the three months ended | For the nine months ended | ||||||||||||||||||
| 9/30/19 | 6/30/19 | 9/30/18 | 9/30/19 | 9/30/18 | ||||||||||||||||
Net earnings (loss) attributable to equity holders of the Company | 2,277 | 194 | (412 | ) | 2,582 | (348 | ) | |||||||||||||
Impairment charges (reversals) related to intangibles, goodwill, property, plant and equipment, and investmentsa | (872 | ) | 12 | 431 | (857 | ) | 492 | |||||||||||||
Acquisition/disposition (gains) lossesb | (1,901 | ) | (12 | ) | (1 | ) | (1,913 | ) | (49 | ) | ||||||||||
(Gain) loss on currency translation | 40 | (6 | ) | 62 | 56 | 152 | ||||||||||||||
Significant tax adjustmentsc | 35 | (83 | ) | (39 | ) | (40 | ) | 23 | ||||||||||||
Other expense adjustmentsd | 53 | 58 | 68 | 158 | 105 | |||||||||||||||
Unrealized (gains) losses onnon-hedge derivative instruments | 1 | 0 | 0 | 0 | 0 | |||||||||||||||
Tax effect andnon-controlling interest | 631 | (9 | ) | (20 | ) | 616 | (35 | ) | ||||||||||||
Adjusted net earnings | 264 | 154 | 89 | 602 | 340 | |||||||||||||||
Net earnings per sharee | 1.30 | 0.11 | (0.35 | ) | 1.47 | (0.30 | ) | |||||||||||||
Adjusted net earnings per sharee | 0.15 | 0.09 | 0.08 | 0.34 | 0.29 | |||||||||||||||
| a. | Net impairment reversals for the three and nine month periods ended September 30, 2019 primarily relate tonon-current asset reversals at Lumwana, partially offset by impairments at Cortez and Lagunas Norte. For the three and nine months ended September 30, 2018, net impairment charges primarily relate tonon-current asset impairments at Lagunas Norte. |
| b. | Acquisition/disposition gains for the three and nine month periods ended September 30, 2019 primarily relate to the gain on the remeasurement of Turquoise Ridge to fair value as a result of its contribution to Nevada Gold Mines. |
| c. | Significant tax adjustments for the three months ended June 30, 2019 primarily relate to an adjustment to deferred taxes at Veladero. |
| d. | Other expense adjustments for the three and nine month periods ended September 30, 2019 primarily relate to severance costs as a result of the implementation of a number of organizational reductions, the impact of changes in the discount rate assumptions on our closed mine rehabilitation provision and transaction costs related to Nevada Gold Mines and Acacia. |
| e. | Calculated using weighted average number of shares outstanding under the basic method of earnings per share. |
Free Cash Flow
Free cash flow is a measure that deducts capital expenditures from net cash provided by operating activities. Management believes this to be a useful indicator of our ability to operate without reliance on additional borrowing or usage of existing cash.
Free cash flow is intended to provide additional information only and does not have any standardized definition under
IFRS and should not be considered in isolation or as a substitute for measures of performance prepared in accordance with IFRS. The measure is not necessarily indicative of operating profit or cash flow from operations as determined under IFRS. Other companies may calculate this measure differently. The following table reconciles thisnon-GAAP measure to the most directly comparable IFRS measure.
Reconciliation of Net Cash Provided by Operating Activities to Free Cash Flow
| ($ millions) | For the three months ended | For the nine months ended | ||||||||||||||||||
| 9/30/19 | 6/30/19 | 9/30/18 | 9/30/19 | 9/30/18 | ||||||||||||||||
Net cash provided by operating activities | 1,004 | 434 | 706 | 1,958 | 1,354 | |||||||||||||||
Capital expenditures | (502 | ) | (379 | ) | (387 | ) | (1,255 | ) | (1,026 | ) | ||||||||||
Free cash flow | 502 | 55 | 319 | 703 | 328 | |||||||||||||||
| BARRICK THIRD QUARTER 2019 | 78 | MANAGEMENT’S DISCUSSION AND ANALYSIS |
Total cash costs per ounce,All-in sustaining costs per ounce,All-in costs per ounce, C1 cash costs per pound andAll-in sustaining costs per pound
Total cash costs per ounce,all-in sustaining costs per ounce andall-in costs per ounce arenon-GAAP financial measures which are calculated based on the definition published by the World Gold Council (a market development organization for the gold industry comprised of and funded by 26 gold mining companies from around the world, including Barrick). The WGC is not a regulatory organization. Management uses these measures to monitor the performance of our gold mining operations and its ability to generate positive cash flow, both on an individual site basis and an overall company basis.
Total cash costs start with our cost of sales related to gold production and removes depreciation, thenon-controlling interest of cost of sales and includesby-product credits.All-in sustaining costs start with total cash costs and include sustaining capital expenditures, sustaining leases, general and administrative costs, minesite exploration and evaluation costs and reclamation cost accretion and amortization. These additional costs reflect the expenditures made to maintain current production levels.
Starting from the first quarter of 2019, we have renamed “cash costs” to “total cash costs” when referring to our gold operations. The calculation of total cash costs is identical to our previous calculation of cash costs with only a change in the naming convention of thisnon-GAAP measure.
All-in costs starts withall-in sustaining costs and adds additional costs that reflect the varying costs of producing gold over the life-cycle of a mine, including: project capital expenditures (capital expenditures at new projects and discrete projects at existing operations intended to increase production capacity and will not benefit production for at least 12 months) and othernon-sustaining costs (primarilynon-sustaining leases, exploration and evaluation costs, community relations costs and general and administrative costs that are not associated with current operations). These definitions recognize that there are different costs associated with the life-cycle of a mine, and that it is therefore appropriate to distinguish between sustaining andnon-sustaining costs.
Starting from the first quarter of 2019, we have included sustaining capital expenditures and project capital expenditures on a cash basis instead of an accrual basis. As a result of adopting IFRS 16Leases, the full lease amount is included in accrued capital expenditures on initial recognition. We believe that the change in capital expenditures from an accrual basis to a cash basis better reflects the timing of costs associated with our operations. The original World Gold Council (“WGC”) Guidance Note explicitly excluded certain financing activities fromall-in sustaining costs andall-in costs. As a result of the new lease accounting standard, the WGC Guidance Note was updated to include both the principal and interest portion of the cash lease payment in theall-in sustaining costs andall-in cost metrics. We have updated our calculation accordingly. Prior periods have not been restated but would not be materially different.
We believe that our use of total cash costs,all-in sustaining costs andall-in costs will assist analysts, investors and other stakeholders of Barrick in understanding the costs associated with producing gold, understanding the economics of gold
mining, assessing our operating performance and also our ability to generate free cash flow from current operations and to generate free cash flow on an overall company basis. Due to the capital-intensive nature of the industry and the long useful lives over which these items are depreciated, there can be a significant timing difference between net earnings calculated in accordance with IFRS and the amount of free cash flow that is being generated by a mine and therefore we believe these measures are usefulnon-GAAP operating metrics and supplement our IFRS disclosures. These measures are not representative of all of our cash expenditures as they do not include income tax payments, interest costs or dividend payments. These measures do not include depreciation or amortization.
Total cash costs per ounce,all-in sustaining costs andall-in costs are intended to provide additional information only and do not have standardized definitions under IFRS and should not be considered in isolation or as a substitute for measures of performance prepared in accordance with IFRS. These measures are not equivalent to net income or cash flow from operations as determined under IFRS. Although the WGC has published a standardized definition, other companies may calculate these measures differently.
In addition to presenting these metrics on aby-product basis, we have calculated these metrics on aco-product basis. Ourco-product metrics remove the impact of other metal sales that are produced as aby-product of our gold production from cost per ounce calculations but does not reflect a reduction in costs for costs associated with other metal sales.
C1 cash costs per pound andall-in sustaining costs per pound arenon-GAAP financial measures related to our copper mine operations. We believe that C1 cash costs per pound enables investors to better understand the performance of our copper operations in comparison to other copper producers who present results on a similar basis. C1 cash costs per pound excludes royalties and production taxes andnon-routine charges as they are not direct production costs.All-in sustaining costs per pound is similar to the goldall-in sustaining costs metric and management uses this to better evaluate the costs of copper production. We believe this measure enables investors to better understand the operating performance of our copper mines as this measure reflects all of the sustaining expenditures incurred in order to produce copper.All-in sustaining costs per pound includes C1 cash costs, sustaining capital expenditures, sustaining leases, general and administrative costs, minesite exploration and evaluation costs, royalties and production taxes, reclamation cost accretion and amortization and write-downs taken on inventory to net realizable value.
| BARRICK THIRD QUARTER 2019 | 79 | MANAGEMENT’S DISCUSSION AND ANALYSIS |
Reconciliation of Gold Cost of Sales to Total cash costs,All-in sustaining costs andAll-in costs, including on a per ounce basis
| ($ millions, except per ounce information in dollars) | For the three months ended | For the nine months ended | ||||||||||||||||||||
| Footnote | 9/30/19 | 6/30/19 | 9/30/18 | 9/30/19 | 9/30/18 | |||||||||||||||||
Cost of sales applicable to gold production | 1,831 | 1,437 | 1,164 | 4,618 | 3,268 | |||||||||||||||||
Depreciation | (538 | ) | (431 | ) | (319 | ) | (1,353 | ) | (907 | ) | ||||||||||||
Cash cost of sales applicable to equity method investments | 45 | 62 | 0 | 169 | 0 | |||||||||||||||||
By-product credits | (48 | ) | (23 | ) | (31 | ) | (95 | ) | (105 | ) | ||||||||||||
Realized (gains) losses on hedge andnon-hedge derivatives | a | 1 | (1 | ) | 0 | 0 | 0 | |||||||||||||||
Non-recurring items | b | (4 | ) | (9 | ) | (7 | ) | (33 | ) | (17 | ) | |||||||||||
Other | c | (19 | ) | (26 | ) | (18 | ) | (65 | ) | (60 | ) | |||||||||||
Non-controlling interests | d | (339 | ) | (112 | ) | (83 | ) | (552 | ) | (233 | ) | |||||||||||
Total cash costs | 929 | 897 | 706 | 2,689 | 1,946 | |||||||||||||||||
General & administrative costs | 68 | 59 | 71 | 181 | 212 | |||||||||||||||||
Minesite exploration and evaluation costs | e | 22 | 12 | 11 | 45 | 31 | ||||||||||||||||
Minesite sustaining capital expenditures | f | 406 | 267 | 233 | 926 | 699 | ||||||||||||||||
Sustaining leases | 5 | 8 | 0 | 23 | 0 | |||||||||||||||||
Rehabilitation - accretion and amortization (operating sites) | g | 28 | 16 | 25 | 58 | 63 | ||||||||||||||||
Non-controlling interest, copper operations and other | h | (184 | ) | (76 | ) | (101 | ) | (335 | ) | (256 | ) | |||||||||||
All-in sustaining costs | 1,274 | 1,183 | 945 | 3,587 | 2,695 | |||||||||||||||||
Project exploration and evaluation and project costs | e | 64 | 86 | 78 | 213 | 228 | ||||||||||||||||
Community relations costs not related to current operations | 1 | 0 | 1 | 2 | 2 | |||||||||||||||||
Project capital expenditures | f | 96 | 108 | 126 | 324 | 332 | ||||||||||||||||
Rehabilitation - accretion and amortization(non-operating sites) | g | 5 | 7 | 9 | 19 | 25 | ||||||||||||||||
Non-controlling interest and copper operations and other | h | (46 | ) | (28 | ) | (8 | ) | (77 | ) | (16 | ) | |||||||||||
All-in costs | 1,394 | 1,356 | 1,151 | 4,068 | 3,266 | |||||||||||||||||
Ounces sold - equity basis (000s ounces) | i | 1,318 | 1,372 | 1,204 | 4,055 | 3,312 | ||||||||||||||||
Cost of sales per ounce | j,k | 1,065 | 964 | 850 | 991 | 859 | ||||||||||||||||
Total cash costs per ounce | k | 710 | 651 | 587 | 663 | 588 | ||||||||||||||||
Total cash costs per ounce (on aco-product basis) | k,l | 735 | 663 | 603 | 680 | 609 | ||||||||||||||||
All-in sustaining costs per ounce | k | 984 | 869 | 785 | 883 | 813 | ||||||||||||||||
All-in sustaining costs per ounce (on aco-product basis) | k,l | 1,009 | 881 | 801 | 900 | 834 | ||||||||||||||||
All-in costs per ounce | k | 1,074 | 999 | 956 | 999 | 986 | ||||||||||||||||
All-in costs per ounce (on aco-product basis) | k,l | 1,099 | 1,011 | 972 | 1,016 | 1,007 | ||||||||||||||||
| a. | Realized (gains) losses on hedge andnon-hedge derivatives |
Includes realized hedge losses of $nil and $nil, respectively, for the three and nine month periods ended September 30, 2019 (June 30, 2019: $nil and September 30, 2018: $nil and $2 million), and realizednon-hedge losses of $1 million and $nil, respectively, for the three and nine month periods ended September 30, 2019 (June 30, 2019: gains of $1 million and September 30, 2018: $nil and $2 million, respectively). Refer to note 5 to the Financial Statements for further information.
| b. | Non-recurring items |
Non-recurring items in 2019 relate to organizational restructuring. These costs are not indicative of our cost of production and have been excluded from the calculation of total cash costs.
| c. | Other |
Other adjustments for the three and nine month periods ended September 30, 2019 include the removal of total cash costs andby-product credits associated with our Pierina mine, and starting in the third quarter of 2019, Golden Sunlight and Morila, which all are mining incidental ounces as they enter closure, of $19 million and $57 million, respectively (June 30, 2019: $19 million and September 30, 2018: $18 million and $60 million, respectively, relating to Pierina only).
| BARRICK THIRD QUARTER 2019 | 80 | MANAGEMENT’S DISCUSSION AND ANALYSIS |
| d. | Non-controlling interests |
Non-controlling interests includenon-controlling interests related to gold production of $506 million and $829 million, respectively, for the three and nine month periods ended September 30, 2019 (June 30, 2019: $171 million and September 30, 2018: $121 million and $339 million, respectively).Non-controlling interests include Pueblo Viejo and Tanzania (notwithstanding the completion of the Acacia transaction on September 17, 2019, we consolidated our interest in Acacia and recorded anon-controlling interest of 36.1% in the income statement for the entirety of the third quarter of 2019 as a matter of convenience). Starting January 1, 2019, the effective date of the Merger,non-controlling interests also include Loulo-Gounkoto and Tongon and starting July 1, 2019, it also includes Nevada Gold Mines. Refer to note 5 to the Financial Statements for further information.
| e. | Exploration and evaluation costs |
Exploration, evaluation and project expenses are presented as minesite sustaining if it supports current mine operations and project if it relates to future projects. Refer to page 70 of this MD&A.
| f. | Capital expenditures |
Capital expenditures are related to our gold sites only and are presented on a 100% cash basis starting from January 1, 2019 and on a 100% accrued basis for the three and nine month periods ended September 30, 2018. They are split between minesite sustaining and project capital expenditures. Project capital expenditures are distinct projects designed to increase the net present value of the mine and are not related to current production. Significant projects in the current year are stripping at Rangefront declines, Cortez Crossroads, the Goldrush exploration declines, the Deep South Expansion, and construction of the third shaft at Turquoise Ridge. Refer to page 68 of this MD&A.
| g. | Rehabilitation—accretion and amortization |
Includes depreciation on the assets related to rehabilitation provisions of our gold operations and accretion on the rehabilitation provision of our gold operations, split between operating andnon-operating sites.
| h. | Non-controlling interest and copper operations |
Removes general & administrative costs related tonon-controlling interests and copper based on a percentage allocation of revenue. Also removes exploration, evaluation and project expenses, rehabilitation costs and capital expenditures incurred by our copper sites and thenon-controlling interest of our Tanzania (notwithstanding the completion of the Acacia transaction on September 17, 2019, we consolidated our interest in Acacia and recorded anon-controlling interest of 36.1% in the income statement for the entirety of the third quarter of 2019 as a matter of convenience) and Pueblo Viejo operating segments and South Arturo (63.1% of South Arturo from July 1, 2019 onwards as a result of its contribution to Nevada Gold Mines). Also removes thenon-controlling interest of our Loulo-Gounkoto and Tongon operating segments commencing January 1, 2019, the effective date of the Merger, and of Nevada Gold Mines starting July 1, 2019. It also includes capital expenditures applicable to equity method investments. Figures remove the impact of Pierina, and starting in the third quarter of 2019, Golden Sunlight and Morila. The impact is summarized as the following:
| ($ millions) | For the three months ended | For the nine months ended | ||||||||||||||||||
| Non-controlling interest, copper operations and other | 9/30/19 | 6/30/19 | 9/30/18 | 9/30/19 | 9/30/18 | |||||||||||||||
General & administrative costs | (22 | ) | (23 | ) | (20 | ) | (55 | ) | (68 | ) | ||||||||||
Minesite exploration and evaluation expenses | (9 | ) | 0 | 0 | (10 | ) | (1 | ) | ||||||||||||
Rehabilitation - accretion and amortization (operating sites) | (10 | ) | (1 | ) | (1 | ) | (12 | ) | (4 | ) | ||||||||||
Minesite sustaining capital expenditures | (143 | ) | (52 | ) | (80 | ) | (258 | ) | (183 | ) | ||||||||||
All-in sustaining costs total | (184 | ) | (76 | ) | (101 | ) | (335 | ) | (256 | ) | ||||||||||
Project exploration and evaluation and project costs | (12 | ) | (26 | ) | (7 | ) | (40 | ) | (13 | ) | ||||||||||
Project capital expenditures | (34 | ) | (2 | ) | (1 | ) | (37 | ) | (3 | ) | ||||||||||
All-in costs total | (46 | ) | (28 | ) | (8 | ) | (77 | ) | (16 | ) | ||||||||||
| i. | Ounces sold - equity basis |
Figures remove the impact of Pierina, and starting in the third quarter of 2019, Golden Sunlight and Morila, which are mining incidental ounces as the sites enter closure.
| j. | Cost of sales per ounce |
Figures remove the cost of sales impact of Pierina of $28 million and $99 million, respectively, for the three and nine month periods ended September 30, 2019 (June 30, 2019: $44 million and September 30, 2018: $23 million and $84 million, respectively), and starting in the third quarter of 2019, Golden Sunlight of $1 million and $1 million, respectively, for the three and nine month periods ended September 30, 2019 (June 30, 2019: $nil and September 30, 2018: $nil and $nil, respectively) and Morila of $10 million and $10 million , respectively, for the three and nine month periods ended September 30, 2019 (June 30, 2019: $nil and September 30, 2018: $nil and $nil, respectively) which are mining incidental ounces as these sites enter closure. Cost of sales per ounce excludesnon-controlling interest related to gold production. Cost of sales applicable to gold per ounce is calculated using cost of sales on an attributable basis (removing thenon-controlling interest of 40% Pueblo Viejo, 36.1% Tanzania (notwithstanding the completion of the Acacia transaction on September 17, 2019, we consolidated our interest in Acacia and recorded anon-controlling interest of 36.1% in the income statement for the entirety of the third quarter of 2019 as a matter of convenience) and 40% South Arturo from cost of sales (63.1% of South Arturo from July 1, 2019 onwards as a result of its contribution to Nevada Gold Mines)), divided by attributable gold ounces. Thenon-controlling interest of 20% Loulo-Gounkoto and 10.3% of Tongon is also removed from cost of sales and our proportionate share of cost of sales attributable to equity method investments (Kibali and Morila) is included commencing January 1, 2019, the effective date of the Merger. Also removes thenon-controlling interest of 38.5% Nevada Gold Mines from cost of sales from July 1, 2019 onwards.
| k. | Per ounce figures |
Cost of sales per ounce, total cash costs per ounce,all-in sustaining costs per ounce andall-in costs per ounce may not calculate based on amounts presented in this table due to rounding.
| l. | Co-product costs per ounce |
Total cash costs per ounce,all-in sustaining costs per ounce andall-in costs per ounce presented on aco-product basis removes the impact ofby-product credits of our gold production (net ofnon-controlling interest) calculated as:
| ($ millions) | For the three months ended | For the nine months ended | ||||||||||||||||||
| 9/30/19 | 6/30/19 | 9/30/18 | 9/30/19 | 9/30/18 | ||||||||||||||||
By-product credits | 48 | 23 | 31 | 95 | 105 | |||||||||||||||
Non-controlling interest | (16 | ) | (7 | ) | (11 | ) | (31 | ) | (35 | ) | ||||||||||
By-product credits (net ofnon-controlling interest) | 32 | 16 | 20 | 64 | 70 | |||||||||||||||
| BARRICK THIRD QUARTER 2019 | 81 | MANAGEMENT’S DISCUSSION AND ANALYSIS |
Reconciliation of Gold Cost of Sales to Total cash costs,All-in sustaining costs andAll-in costs, including on a per ounce basis, by operating site
| ($ millions, except per ounce information in dollars) | For the three months ended 9/30/19 | |||||||||||||||||||||||||||||||||||||
| Footnote | Nevada Gold Minesa | Cortez | Carlinb | Turquoise Ridgec | Phoenix | Long Canyon | Pueblo Viejo | Loulo- Gounkoto | Kibali | |||||||||||||||||||||||||||||
Cost of sales applicable to gold production | 897 | 170 | 445 | 168 | 68 | 46 | 181 | 199 | 107 | |||||||||||||||||||||||||||||
Depreciation | (270 | ) | (53 | ) | (101 | ) | (70 | ) | (14 | ) | (32 | ) | (48 | ) | (76 | ) | (57 | ) | ||||||||||||||||||||
By-product credits | (25 | ) | (1 | ) | (1 | ) | (1 | ) | (22 | ) | 0 | (17 | ) | 0 | 0 | |||||||||||||||||||||||
Non-recurring items | d | 0 | 0 | 0 | 0 | 0 | 0 | 0 | 0 | 0 | ||||||||||||||||||||||||||||
Other | 0 | 0 | 0 | 0 | 0 | 0 | 0 | 0 | 0 | |||||||||||||||||||||||||||||
Non-controlling interests | (233 | ) | (45 | ) | (133 | ) | (37 | ) | (13 | ) | (5 | ) | (48 | ) | (25 | ) | 0 | |||||||||||||||||||||
Total cash costs | 369 | 71 | 210 | 60 | 19 | 9 | 68 | 98 | 50 | |||||||||||||||||||||||||||||
General & administrative costs | 0 | 0 | 0 | 0 | 0 | 0 | 0 | 0 | 0 | |||||||||||||||||||||||||||||
Minesite exploration and evaluation costs | e | 12 | 2 | 5 | 2 | 0 | 3 | 0 | 3 | 0 | ||||||||||||||||||||||||||||
Minesite sustaining capital expenditures | f | 188 | 36 | 102 | 27 | 14 | 9 | 27 | 60 | 13 | ||||||||||||||||||||||||||||
Sustaining leases | 1 | 0 | 0 | 1 | 0 | 0 | 0 | 2 | 0 | |||||||||||||||||||||||||||||
Rehabilitation - accretion and amortization (operating sites) | g | 20 | 4 | 8 | 3 | 4 | 1 | 3 | 0 | 0 | ||||||||||||||||||||||||||||
Non-controlling interests | (86 | ) | (15 | ) | (48 | ) | (12 | ) | (6 | ) | (5 | ) | (12 | ) | (13 | ) | 0 | |||||||||||||||||||||
All-in sustaining costs | 504 | 98 | 277 | 81 | 31 | 17 | 86 | 150 | 63 | |||||||||||||||||||||||||||||
Project exploration and evaluation and project costs | e | 0 | 0 | 0 | 0 | 0 | 0 | 0 | 0 | 0 | ||||||||||||||||||||||||||||
Project capital expenditures | f | 85 | 49 | 0 | 13 | 0 | 0 | 0 | 1 | 1 | ||||||||||||||||||||||||||||
Non-controlling interests | (31 | ) | (18 | ) | 0 | (5 | ) | 0 | 0 | 0 | (1 | ) | 0 | |||||||||||||||||||||||||
All-in costs | 558 | 129 | 277 | 89 | 31 | 17 | 86 | 150 | 64 | |||||||||||||||||||||||||||||
Ounces sold - equity basis (000s ounces) | 537 | 126 | 272 | 96 | 19 | 24 | 136 | 155 | 89 | |||||||||||||||||||||||||||||
Cost of sales per ounce | h,i | 1,027 | 829 | 1,007 | 1,077 | 2,186 | 1,170 | 807 | 1,018 | 1,187 | ||||||||||||||||||||||||||||
Total cash costs per ounce | i | 693 | 570 | 775 | 622 | 1,010 | 353 | 504 | 630 | 554 | ||||||||||||||||||||||||||||
Total cash costs per ounce (on aco-product basis) | i,j | 694 | 571 | 776 | 622 | 1,734 | 355 | 587 | 630 | 554 | ||||||||||||||||||||||||||||
All-in sustaining costs per ounce | i | 946 | 772 | 1,014 | 840 | 1,622 | 714 | 631 | 966 | 703 | ||||||||||||||||||||||||||||
All-in sustaining costs per ounce (on aco-product basis) | i,j | 947 | 773 | 1,015 | 840 | 2,346 | 716 | 714 | 966 | 703 | ||||||||||||||||||||||||||||
All-in costs per ounce | i | 1,048 | 1,020 | 1,014 | 927 | 1,622 | 714 | 636 | 971 | 717 | ||||||||||||||||||||||||||||
All-in costs per ounce (on aco-product basis) | i,j | 1,049 | 1,021 | 1,015 | 927 | 2,346 | 716 | 719 | 971 | 717 | ||||||||||||||||||||||||||||
| BARRICK THIRD QUARTER 2019 | 82 | MANAGEMENT’S DISCUSSION AND ANALYSIS |
| ($ millions, except per ounce information in dollars) | For the three months ended 9/30/19 | |||||||||||||||||||||||||||||||
| Footnote | Veladero | Tanzania | Kalgoorlie | Tongon | Porgera | Hemlo | Lagunas Norte | |||||||||||||||||||||||||
Cost of sales applicable to gold production | 72 | 98 | 60 | 102 | 77 | 55 | 54 | |||||||||||||||||||||||||
Depreciation | (25 | ) | (24 | ) | (10 | ) | (44 | ) | (11 | ) | (6 | ) | (5 | ) | ||||||||||||||||||
By-product credits | (1 | ) | (1 | ) | 0 | 0 | (1 | ) | (1 | ) | (2 | ) | ||||||||||||||||||||
Non-recurring items | d | 0 | 0 | 0 | 0 | 0 | (1 | ) | (3 | ) | ||||||||||||||||||||||
Other | 0 | 0 | 0 | 0 | 0 | 0 | 0 | |||||||||||||||||||||||||
Non-controlling interests | 0 | (27 | ) | 0 | (6 | ) | 0 | 0 | 0 | |||||||||||||||||||||||
Total cash costs | 46 | 46 | 50 | 52 | 65 | 47 | 44 | |||||||||||||||||||||||||
General & administrative costs | 0 | 16 | 0 | 0 | 0 | 0 | 0 | |||||||||||||||||||||||||
Minesite exploration and evaluation costs | e | 1 | 0 | 2 | 0 | 0 | 0 | 1 | ||||||||||||||||||||||||
Minesite sustaining capital expenditures | f | 19 | 14 | 15 | 4 | 14 | 15 | 0 | ||||||||||||||||||||||||
Sustaining leases | 1 | 0 | 1 | 1 | 1 | 0 | 0 | |||||||||||||||||||||||||
Rehabilitation - accretion and amortization (operating sites) | g | 1 | 1 | 0 | 0 | (1 | ) | 1 | 2 | |||||||||||||||||||||||
Non-controlling interests | 0 | (11 | ) | 0 | 0 | 0 | 0 | 0 | ||||||||||||||||||||||||
All-in sustaining costs | 68 | 66 | 68 | 57 | 79 | 63 | 47 | |||||||||||||||||||||||||
Project exploration and evaluation and project costs | e | 0 | 0 | 0 | 0 | 0 | 0 | 0 | ||||||||||||||||||||||||
Project capital expenditures | f | 0 | 2 | 0 | 0 | 0 | 0 | 0 | ||||||||||||||||||||||||
Non-controlling interests | 0 | 0 | 0 | 0 | 0 | 0 | 0 | |||||||||||||||||||||||||
All-in costs | 68 | 68 | 68 | 57 | 79 | 63 | 47 | |||||||||||||||||||||||||
Ounces sold - equity basis (000s ounces) | 59 | 59 | 58 | 66 | 75 | 50 | 33 | |||||||||||||||||||||||||
Cost of sales per ounce | h,i | 1,243 | 1,057 | 1,037 | 1,396 | 1,024 | 1,083 | 1,661 | ||||||||||||||||||||||||
Total cash costs per ounce | i | 773 | 788 | 856 | 793 | 868 | 953 | 1,327 | ||||||||||||||||||||||||
Total cash costs per ounce (on aco-product basis) | i,j | 799 | 796 | 859 | 795 | 878 | 956 | 1,374 | ||||||||||||||||||||||||
All-in sustaining costs per ounce | i | 1,142 | 947 | 1,170 | 869 | 1,053 | 1,280 | 1,422 | ||||||||||||||||||||||||
All-in sustaining costs per ounce (on aco-product basis) | i,j | 1,168 | 955 | 1,173 | 871 | 1,063 | 1,283 | 1,469 | ||||||||||||||||||||||||
All-in costs per ounce | i | 1,142 | 977 | 1,170 | 869 | 1,053 | 1,280 | 1,422 | ||||||||||||||||||||||||
All-in costs per ounce (on aco-product basis) | i,j | 1,168 | 985 | 1,173 | 871 | 1,063 | 1,283 | 1,469 | ||||||||||||||||||||||||
| BARRICK THIRD QUARTER 2019 | 83 | MANAGEMENT’S DISCUSSION AND ANALYSIS |
| ($ millions, except per ounce information in dollars) | For the three months ended 6/30/19 | |||||||||||||||||||||||||||||||||||||
| Footnote | Nevada Gold Minesa | Cortez | Carlinb | Turquoise Ridgec | Phoenixk | Long Canyonk | Pueblo Viejo | Loulo- Gounkotol | Kibalil | |||||||||||||||||||||||||||||
Cost of sales applicable to gold production | 462 | 202 | 203 | 57 | 188 | 197 | 82 | |||||||||||||||||||||||||||||||
Depreciation | (127 | ) | (65 | ) | (53 | ) | (9 | ) | (47 | ) | (87 | ) | (31 | ) | ||||||||||||||||||||||||
By-product credits | 0 | 0 | 0 | 0 | (16 | ) | 0 | 0 | ||||||||||||||||||||||||||||||
Non-recurring items | d | (9 | ) | 0 | (9 | ) | 0 | 0 | 0 | 0 | ||||||||||||||||||||||||||||
Other | 0 | 0 | 0 | 0 | 0 | 0 | 0 | |||||||||||||||||||||||||||||||
Non-controlling interests | (1 | ) | 0 | (1 | ) | 0 | (50 | ) | (22 | ) | 0 | |||||||||||||||||||||||||||
Total cash costs | 325 | 137 | 140 | 48 | 75 | 88 | 51 | |||||||||||||||||||||||||||||||
General & administrative costs | 0 | 0 | 0 | 0 | 0 | 0 | 0 | |||||||||||||||||||||||||||||||
Minesite exploration and evaluation costs | e | 4 | 1 | 2 | 1 | 0 | 2 | 1 | ||||||||||||||||||||||||||||||
Minesite sustaining capital expenditures | f | 80 | 15 | 58 | 7 | 30 | 37 | 10 | ||||||||||||||||||||||||||||||
Sustaining leases | 0 | 0 | 0 | 0 | 0 | 0 | 0 | |||||||||||||||||||||||||||||||
Rehabilitation - accretion and amortization (operating sites) | g | 5 | 4 | 1 | 0 | 1 | 0 | 0 | ||||||||||||||||||||||||||||||
Non-controlling interests | (4 | ) | 0 | (4 | ) | 0 | (12 | ) | (8 | ) | 0 | |||||||||||||||||||||||||||
All-in sustaining costs | 410 | 157 | 197 | 56 | 94 | 119 | 62 | |||||||||||||||||||||||||||||||
Project exploration and evaluation and project costs | e | 0 | 0 | 0 | 0 | 3 | 0 | 0 | ||||||||||||||||||||||||||||||
Project capital expenditures | f | 93 | 68 | 0 | 12 | 0 | 2 | 0 | ||||||||||||||||||||||||||||||
Non-controlling interests | 0 | 0 | 0 | 0 | 0 | 0 | 0 | |||||||||||||||||||||||||||||||
All-in costs | 503 | 225 | 197 | 68 | 97 | 121 | 62 | |||||||||||||||||||||||||||||||
Ounces sold - equity basis (000s ounces) | 547 | 281 | 181 | 85 | 132 | 148 | 95 | |||||||||||||||||||||||||||||||
Cost of sales per ounce | h,i | 842 | 719 | 1,007 | 665 | 852 | 1,072 | 868 | ||||||||||||||||||||||||||||||
Total cash costs per ounce | i | 594 | 489 | 769 | 569 | 557 | 598 | 540 | ||||||||||||||||||||||||||||||
Total cash costs per ounce (on aco-product basis) | i,j | 595 | 490 | 770 | 569 | 631 | 598 | 542 | ||||||||||||||||||||||||||||||
All-in sustaining costs per ounce | i | 752 | 561 | 1,088 | 667 | 702 | 811 | 651 | ||||||||||||||||||||||||||||||
All-in sustaining costs per ounce (on aco-product basis) | i,j | 753 | 562 | 1,089 | 667 | 776 | 811 | 653 | ||||||||||||||||||||||||||||||
All-in costs per ounce | i | 922 | 795 | 1,088 | 806 | 724 | 821 | 655 | ||||||||||||||||||||||||||||||
All-in costs per ounce (on aco-product basis) | i,j | 923 | 796 | 1,089 | 806 | 798 | 821 | 657 | ||||||||||||||||||||||||||||||
| BARRICK THIRD QUARTER 2019 | 84 | MANAGEMENT’S DISCUSSION AND ANALYSIS |
| ($ millions, except per ounce information in dollars) | For the three months ended 6/30/19 | |||||||||||||||||||||||||||||||||||||
| Footnote | Veladero | Tanzania | Kalgoorlie | Tongonl | Porgera | Hemlo | Lagunas Norte | Golden Sunlightm | Morilal,m | |||||||||||||||||||||||||||||
Cost of sales applicable to gold production | 88 | 132 | 57 | 103 | 65 | 52 | 37 | 12 | 19 | |||||||||||||||||||||||||||||
Depreciation | (31 | ) | (35 | ) | (11 | ) | (53 | ) | (8 | ) | (7 | ) | (7 | ) | (2 | ) | (8 | ) | ||||||||||||||||||||
By-product credits | (2 | ) | (1 | ) | 0 | 0 | 0 | 0 | (2 | ) | 0 | 0 | ||||||||||||||||||||||||||
Non-recurring items | d | 1 | 0 | 0 | 0 | 0 | 0 | 0 | 0 | 0 | ||||||||||||||||||||||||||||
Other | 0 | 0 | 0 | 0 | 0 | 0 | 0 | 0 | 0 | |||||||||||||||||||||||||||||
Non-controlling interests | 0 | (34 | ) | 0 | (5 | ) | 0 | 0 | 0 | 0 | 0 | |||||||||||||||||||||||||||
Total cash costs | 56 | 62 | 46 | 45 | 57 | 45 | 28 | 10 | 11 | |||||||||||||||||||||||||||||
General & administrative costs | 0 | 6 | 0 | 0 | 0 | 0 | 0 | 0 | 0 | |||||||||||||||||||||||||||||
Minesite exploration and evaluation costs | e | 1 | 0 | 1 | 1 | 1 | 1 | 0 | 0 | 0 | ||||||||||||||||||||||||||||
Minesite sustaining capital expenditures | f | 19 | 11 | 16 | 2 | 12 | 9 | 4 | 1 | 0 | ||||||||||||||||||||||||||||
Sustaining leases | 0 | 1 | 1 | 0 | 1 | 0 | 3 | 0 | 0 | |||||||||||||||||||||||||||||
Rehabilitation - accretion and amortization (operating sites) | g | 2 | 2 | 1 | 0 | 0 | 1 | 3 | 1 | 0 | ||||||||||||||||||||||||||||
Non-controlling interests | 0 | (7 | ) | 0 | (1 | ) | 0 | 0 | 0 | 0 | 0 | |||||||||||||||||||||||||||
All-in sustaining costs | 78 | 75 | 65 | 47 | 71 | 56 | 38 | 12 | 11 | |||||||||||||||||||||||||||||
Project exploration and evaluation and project costs | e | 0 | 0 | 0 | 0 | 0 | 0 | 0 | 0 | 0 | ||||||||||||||||||||||||||||
Project capital expenditures | f | 0 | 5 | 0 | 0 | 0 | 0 | 0 | 0 | 0 | ||||||||||||||||||||||||||||
Non-controlling interests | 0 | (2 | ) | 0 | 0 | 0 | 0 | 0 | 0 | 0 | ||||||||||||||||||||||||||||
All-in costs | 78 | 78 | 65 | 47 | 71 | 56 | 38 | 12 | 11 | |||||||||||||||||||||||||||||
Ounces sold - equity basis (000s ounces) | 74 | 92 | 55 | 59 | 63 | 56 | 38 | 6 | 7 | |||||||||||||||||||||||||||||
Cost of sales per ounce | h,i | 1,186 | 920 | 1,038 | 1,562 | 1,032 | 953 | 952 | 2,336 | 2,585 | ||||||||||||||||||||||||||||
Total cash costs per ounce | i | 746 | 659 | 846 | 750 | 893 | 822 | 732 | 2,037 | 1,446 | ||||||||||||||||||||||||||||
Total cash costs per ounce (on aco-product basis) | i,j | 775 | 665 | 847 | 752 | 903 | 825 | 772 | 2,076 | 1,450 | ||||||||||||||||||||||||||||
All-in sustaining costs per ounce | i | 1,046 | 792 | 1,204 | 802 | 1,112 | 1,015 | 998 | 2,434 | 1,449 | ||||||||||||||||||||||||||||
All-in sustaining costs per ounce (on aco-product basis) | i,j | 1,075 | 798 | 1,205 | 804 | 1,122 | 1,018 | 1,038 | 2,473 | 1,453 | ||||||||||||||||||||||||||||
All-in costs per ounce | i | 1,046 | 817 | 1,204 | 803 | 1,112 | 1,017 | 998 | 2,434 | 1,449 | ||||||||||||||||||||||||||||
All-in costs per ounce (on aco-product basis) | i,j | 1,075 | 823 | 1,205 | 805 | 1,122 | 1,020 | 1,038 | 2,473 | 1,453 | ||||||||||||||||||||||||||||
| BARRICK THIRD QUARTER 2019 | 85 | MANAGEMENT’S DISCUSSION AND ANALYSIS |
| ($ millions, except per ounce information in dollars) | For the three months ended 9/30/18 | |||||||||||||||||||||||||||||||||||||||
| Footnote | Nevada Gold Minesa | Cortez | Carlinb | Turquoise Ridgec | Phoenixk | Long Canyonk | Pueblo Viejo | Loulo- Gounkotol | Kibalil | |||||||||||||||||||||||||||||||
Cost of sales applicable to gold production | 534 | 224 | 250 | 60 | 196 | |||||||||||||||||||||||||||||||||||
Depreciation | (182 | ) | (102 | ) | (73 | ) | (7 | ) | (48 | ) | ||||||||||||||||||||||||||||||
By-product credits | 0 | 0 | 0 | 0 | (23 | ) | ||||||||||||||||||||||||||||||||||
Non-recurring items | d | 0 | 0 | 0 | 0 | 0 | ||||||||||||||||||||||||||||||||||
Other | 0 | 0 | 0 | 0 | 0 | |||||||||||||||||||||||||||||||||||
Non-controlling interests | 0 | 0 | 0 | 0 | (49 | ) | ||||||||||||||||||||||||||||||||||
Total cash costs | 352 | 122 | 177 | 53 | 76 | |||||||||||||||||||||||||||||||||||
General & administrative costs | 0 | 0 | 0 | 0 | 0 | |||||||||||||||||||||||||||||||||||
Minesite exploration and evaluation costs | e | 7 | 2 | 5 | 0 | 0 | ||||||||||||||||||||||||||||||||||
Minesite sustaining capital expenditures | f | 59 | 22 | 34 | 3 | 39 | ||||||||||||||||||||||||||||||||||
Rehabilitation - accretion and amortization (operating sites) | g | 13 | 11 | 1 | 1 | 3 | ||||||||||||||||||||||||||||||||||
Non-controlling interests | (3 | ) | 0 | (3 | ) | 0 | (17 | ) | ||||||||||||||||||||||||||||||||
All-in sustaining costs | 428 | 157 | 214 | 57 | 101 | |||||||||||||||||||||||||||||||||||
Project exploration and evaluation and project costs | e | 0 | 0 | 0 | 0 | 0 | ||||||||||||||||||||||||||||||||||
Project capital expenditures | f | 97 | 75 | 0 | 12 | 0 | ||||||||||||||||||||||||||||||||||
Non-controlling interests | 0 | 0 | 0 | 0 | 0 | |||||||||||||||||||||||||||||||||||
All-in costs | 525 | 232 | 214 | 69 | 101 | |||||||||||||||||||||||||||||||||||
Ounces sold - equity basis (000s ounces) | 671 | 354 | 242 | 75 | 147 | |||||||||||||||||||||||||||||||||||
Cost of sales per ounce | h,i | 800 | 630 | 1,047 | 805 | 803 | ||||||||||||||||||||||||||||||||||
Total cash costs per ounce | i | 526 | 342 | 738 | 711 | 517 | ||||||||||||||||||||||||||||||||||
Total cash costs per ounce (on aco-product basis) | i,j | 527 | 342 | 740 | 711 | 600 | ||||||||||||||||||||||||||||||||||
All-in sustaining costs per ounce | i | 640 | 444 | 892 | 757 | 688 | ||||||||||||||||||||||||||||||||||
All-in sustaining costs per ounce (on aco-product basis) | i,j | 641 | 444 | 894 | 757 | 771 | ||||||||||||||||||||||||||||||||||
All-in costs per ounce | i | 788 | 657 | 892 | 920 | 688 | ||||||||||||||||||||||||||||||||||
All-in costs per ounce (on aco-product basis) | i,j | 789 | 657 | 894 | 920 | 771 | ||||||||||||||||||||||||||||||||||
| BARRICK THIRD QUARTER 2019 | 86 | MANAGEMENT’S DISCUSSION AND ANALYSIS |
| ($ millions, except per ounce information in dollars) | For the three months ended 9/30/18 | |||||||||||||||||||||||||||||||||||||||
| Footnote | Veladero | Tanzania | Kalgoorlie | Tongonl | Porgera | Hemlo | Lagunas Norte | Golden Sunlightm | Morilal.m | |||||||||||||||||||||||||||||||
Cost of sales applicable to gold production | 55 | 114 | 70 | 66 | �� | 44 | 49 | 13 | ||||||||||||||||||||||||||||||||
Depreciation | (24 | ) | (19 | ) | (12 | ) | (11 | ) | (4 | ) | (14 | ) | (1 | ) | ||||||||||||||||||||||||||
By-product credits | (2 | ) | (1 | ) | (1 | ) | (1 | ) | (1 | ) | (3 | ) | 0 | |||||||||||||||||||||||||||
Non-recurring items | d | 0 | 0 | 0 | (7 | ) | 0 | 0 | 0 | |||||||||||||||||||||||||||||||
Other | 0 | 0 | 0 | 0 | 0 | 0 | 0 | |||||||||||||||||||||||||||||||||
Non-controlling interests | 0 | (33 | ) | 0 | 0 | 0 | 0 | 0 | ||||||||||||||||||||||||||||||||
Total cash costs | 29 | 61 | 57 | 47 | 39 | 32 | 12 | |||||||||||||||||||||||||||||||||
General & administrative costs | 0 | 8 | 0 | 0 | 0 | 0 | 0 | |||||||||||||||||||||||||||||||||
Minesite exploration and evaluation costs | e | 0 | 0 | 2 | 0 | 0 | 0 | 0 | ||||||||||||||||||||||||||||||||
Minesite sustaining capital expenditures | f | 20 | 19 | 4 | 20 | 9 | 4 | 1 | ||||||||||||||||||||||||||||||||
Rehabilitation - accretion and amortization (operating sites) | g | 1 | 1 | 1 | 0 | 1 | 6 | 1 | ||||||||||||||||||||||||||||||||
Non-controlling interests | 0 | (14 | ) | 0 | 0 | 0 | 0 | 0 | ||||||||||||||||||||||||||||||||
All-in sustaining costs | 50 | 75 | 64 | 67 | 49 | 42 | 14 | |||||||||||||||||||||||||||||||||
Project exploration and evaluation and project costs | e | 0 | 0 | 0 | 0 | 0 | 0 | 0 | ||||||||||||||||||||||||||||||||
Project capital expenditures | f | 0 | 4 | 0 | 0 | 0 | 1 | 0 | ||||||||||||||||||||||||||||||||
Non-controlling interests | 0 | (1 | ) | 0 | 0 | 0 | 0 | 0 | ||||||||||||||||||||||||||||||||
All-in costs | 50 | 78 | 64 | 67 | 49 | 43 | 14 | |||||||||||||||||||||||||||||||||
Ounces sold - equity basis (000s ounces) | 50 | 87 | 77 | 62 | 39 | 67 | 4 | |||||||||||||||||||||||||||||||||
Cost of sales per ounce | h,i | 1,083 | 842 | 923 | 1,067 | 1,095 | 720 | 2,820 | ||||||||||||||||||||||||||||||||
Total cash costs per ounce | i | 581 | 670 | 753 | 775 | 996 | 472 | 2,693 | ||||||||||||||||||||||||||||||||
Total cash costs per ounce (on aco-product basis) | i,j | 611 | 678 | 760 | 786 | 999 | 514 | 2,697 | ||||||||||||||||||||||||||||||||
All-in sustaining costs per ounce | i | 995 | 880 | 840 | 1,084 | 1,247 | 631 | 3,052 | ||||||||||||||||||||||||||||||||
All-in sustaining costs per ounce (on aco-product basis) | i,j | 1,025 | 888 | 847 | 1,095 | 1,250 | 673 | 3,056 | ||||||||||||||||||||||||||||||||
All-in costs per ounce | i | 995 | 911 | 840 | 1,084 | 1,248 | 644 | 3,052 | ||||||||||||||||||||||||||||||||
All-in costs per ounce (on aco-product basis) | i,j | 1,025 | 919 | 847 | 1,095 | 1,251 | 686 | 3,056 | ||||||||||||||||||||||||||||||||
| BARRICK THIRD QUARTER 2019 | 87 | MANAGEMENT’S DISCUSSION AND ANALYSIS |
| ($ millions, except per ounce information in dollars) | For the nine months ended 9/30/2019 | |||||||||||||||||||||||||||||||||||||||
| Footnote | Nevada Gold Minesa | Cortez | Carlinb | Turquoise Ridgec | Phoenix | Long Canyon | Pueblo Viejo | Loulo- Gounkoto | Kibali | |||||||||||||||||||||||||||||||
Cost of sales applicable to gold production | 1,807 | 549 | 874 | 270 | 68 | 46 | 532 | 565 | 297 | |||||||||||||||||||||||||||||||
Depreciation | (533 | ) | (182 | ) | (220 | ) | (85 | ) | (14 | ) | (32 | ) | (141 | ) | (222 | ) | (144 | ) | ||||||||||||||||||||||
By-product credits | (25 | ) | (1 | ) | (1 | ) | (1 | ) | (22 | ) | 0 | (49 | ) | 0 | 0 | |||||||||||||||||||||||||
Non-recurring items | d | (9 | ) | 0 | (9 | ) | 0 | 0 | 0 | (1 | ) | 0 | 0 | |||||||||||||||||||||||||||
Other | 0 | 0 | 0 | 0 | 0 | 0 | 0 | |||||||||||||||||||||||||||||||||
Non-controlling interests | (234 | ) | (45 | ) | (134 | ) | (37 | ) | (13 | ) | (5 | ) | (139 | ) | (69 | ) | 0 | |||||||||||||||||||||||
Total cash costs | 1,006 | 321 | 510 | 147 | 19 | 9 | 202 | 274 | 153 | |||||||||||||||||||||||||||||||
General & administrative costs | 0 | 0 | 0 | 0 | 0 | 0 | 0 | 0 | 0 | |||||||||||||||||||||||||||||||
Minesite exploration and evaluation costs | e | 20 | 5 | 9 | 3 | 0 | 3 | 0 | 7 | 1 | ||||||||||||||||||||||||||||||
Minesite sustaining capital expenditures | f | 343 | 64 | 215 | 41 | 14 | 9 | 84 | 119 | 32 | ||||||||||||||||||||||||||||||
Sustaining leases | 1 | 0 | 0 | 1 | 0 | 0 | 0 | 3 | 0 | |||||||||||||||||||||||||||||||
Rehabilitation - accretion and amortization (operating sites) | g | 30 | 12 | 10 | 3 | 4 | 1 | 6 | 0 | 0 | ||||||||||||||||||||||||||||||
Non-controlling interests | (95 | ) | (15 | ) | (57 | ) | (12 | ) | (6 | ) | (5 | ) | (36 | ) | (26 | ) | 0 | |||||||||||||||||||||||
All-in sustaining costs | 1,305 | 387 | 687 | 183 | 31 | 17 | 256 | 377 | 186 | |||||||||||||||||||||||||||||||
Project exploration and evaluation and project costs | e | 0 | 0 | 0 | 0 | 0 | 0 | 3 | 0 | 0 | ||||||||||||||||||||||||||||||
Project capital expenditures | f | 257 | 180 | 0 | 34 | 0 | 0 | 0 | 3 | 2 | ||||||||||||||||||||||||||||||
Non-controlling interests | (31 | ) | (18 | ) | 0 | (5 | ) | 0 | 0 | 0 | (1 | ) | 0 | |||||||||||||||||||||||||||
All-in costs | 1,531 | 549 | 687 | 212 | 31 | 17 | 259 | 379 | 188 | |||||||||||||||||||||||||||||||
Ounces sold - equity basis (000s ounces) | 1,658 | 666 | 692 | 257 | 19 | 24 | 410 | 431 | 274 | |||||||||||||||||||||||||||||||
Cost of sales per ounce | h,i | 881 | 725 | 1,015 | 797 | 2,186 | 1,170 | 783 | 1,047 | 1,081 | ||||||||||||||||||||||||||||||
Total cash costs per ounce | i | 608 | 482 | 738 | 570 | 1,010 | 353 | 492 | 635 | 555 | ||||||||||||||||||||||||||||||
Total cash costs per ounce (on aco-product basis) | i,j | 609 | 483 | 739 | 572 | 1,734 | 354 | 568 | 635 | 555 | ||||||||||||||||||||||||||||||
All-in sustaining costs per ounce | i | 789 | 580 | 992 | 710 | 1,622 | 714 | 623 | 875 | 678 | ||||||||||||||||||||||||||||||
All-in sustaining costs per ounce (on aco-product basis) | i,j | 790 | 581 | 993 | 712 | 2,346 | 715 | 699 | 875 | 678 | ||||||||||||||||||||||||||||||
All-in costs per ounce | i | 926 | 818 | 992 | 825 | 1,622 | 714 | 632 | 880 | 685 | ||||||||||||||||||||||||||||||
All-in costs per ounce (on aco-product basis) | i,j | 927 | 819 | 993 | 827 | 2,346 | 715 | 708 | 880 | 685 | ||||||||||||||||||||||||||||||
| BARRICK THIRD QUARTER 2019 | 88 | MANAGEMENT’S DISCUSSION AND ANALYSIS |
| ($ millions, except per ounce information in dollars) | For the nine months ended 9/30/2019 | |||||||||||||||||||||||||||||||
| Footnote | Veladero | Tanzania | Kalgoorlie | Tongon | Porgera | Hemlo | Lagunas Norte | |||||||||||||||||||||||||
Cost of sales applicable to gold production | 241 | 347 | 179 | 303 | 209 | 160 | 139 | |||||||||||||||||||||||||
Depreciation | (86 | ) | (84 | ) | (32 | ) | (141 | ) | (30 | ) | (20 | ) | (19 | ) | ||||||||||||||||||
By-product credits | (5 | ) | (3 | ) | 0 | 0 | (2 | ) | (1 | ) | (6 | ) | ||||||||||||||||||||
Non-recurring items | d | (1 | ) | 0 | 0 | 0 | 0 | (2 | ) | (18 | ) | |||||||||||||||||||||
Other | 0 | 0 | 0 | 0 | 0 | 0 | ||||||||||||||||||||||||||
Non-controlling interests | 0 | (94 | ) | 0 | (17 | ) | 0 | 0 | 0 | |||||||||||||||||||||||
Total cash costs | 149 | 166 | 147 | 145 | 177 | 137 | 96 | |||||||||||||||||||||||||
General & administrative costs | 0 | 27 | 0 | 0 | 0 | 0 | 0 | |||||||||||||||||||||||||
Minesite exploration and evaluation costs | e | 2 | 0 | 4 | 2 | 1 | 1 | 2 | ||||||||||||||||||||||||
Minesite sustaining capital expenditures | f | 63 | 35 | 46 | 8 | 34 | 32 | 11 | ||||||||||||||||||||||||
Sustaining leases | 2 | 1 | 4 | 1 | 2 | 0 | 8 | |||||||||||||||||||||||||
Rehabilitation - accretion and amortization (operating sites) | g | 4 | 4 | 2 | 0 | (1 | ) | 2 | 7 | |||||||||||||||||||||||
Non-controlling interests | 0 | (24 | ) | 0 | (1 | ) | 0 | 0 | 0 | |||||||||||||||||||||||
All-in sustaining costs | 220 | 209 | 203 | 155 | 213 | 172 | 124 | |||||||||||||||||||||||||
Project exploration and evaluation and project costs | e | 0 | 0 | 0 | 0 | 0 | 0 | 0 | ||||||||||||||||||||||||
Project capital expenditures | f | 15 | 10 | 0 | 0 | 0 | 0 | 0 | ||||||||||||||||||||||||
Non-controlling interests | 0 | (3 | ) | 0 | 0 | 0 | 0 | 0 | ||||||||||||||||||||||||
All-in costs | 235 | 216 | 203 | 155 | 213 | 172 | 124 | |||||||||||||||||||||||||
Ounces sold - equity basis (000s ounces) | 201 | 218 | 171 | 186 | 203 | 164 | 108 | |||||||||||||||||||||||||
Cost of sales per ounce | h,i | 1,206 | 1,017 | 1,047 | 1,467 | 1,029 | 977 | 1,285 | ||||||||||||||||||||||||
Total cash costs per ounce | i | 742 | 760 | 857 | 781 | 871 | 843 | 879 | ||||||||||||||||||||||||
Total cash costs per ounce (on aco-product basis) | i,j | 768 | 768 | 860 | 783 | 882 | 847 | 931 | ||||||||||||||||||||||||
All-in sustaining costs per ounce | i | 1,093 | 875 | 1,186 | 837 | 1,047 | 1,061 | 1,133 | ||||||||||||||||||||||||
All-in sustaining costs per ounce (on aco-product basis) | i,j | 1,119 | 883 | 1,189 | 839 | 1,058 | 1,065 | 1,185 | ||||||||||||||||||||||||
All-in costs per ounce | i | 1,169 | 905 | 1,186 | 837 | 1,047 | 1,062 | 1,131 | ||||||||||||||||||||||||
All-in costs per ounce (on aco-product basis) | i,j | 1,195 | 913 | 1,189 | 839 | 1,058 | 1,066 | 1,183 | ||||||||||||||||||||||||
| BARRICK THIRD QUARTER 2019 | 89 | MANAGEMENT’S DISCUSSION AND ANALYSIS |
| ($ millions, except per ounce information in dollars) | For the nine months ended 9/30/2018 | |||||||||||||||||||||||||||||||||||||
| Footnote | Nevada Gold Minesa | Cortez | Carlinb | Turquoise Ridgec | Phoenixk | Long Canyonk | Pueblo Viejo | Loulo- Gounkotol | Kibalil | |||||||||||||||||||||||||||||
Cost of sales applicable to gold production | 1,394 | 595 | 647 | 152 | 540 | |||||||||||||||||||||||||||||||||
Depreciation | (483 | ) | (274 | ) | (188 | ) | (21 | ) | (132 | ) | ||||||||||||||||||||||||||||
By-product credits | (2 | ) | 0 | (2 | ) | 0 | (73 | ) | ||||||||||||||||||||||||||||||
Non-recurring items | d | 0 | 0 | 0 | 0 | 0 | ||||||||||||||||||||||||||||||||
Other | 0 | 0 | 0 | 0 | 1 | |||||||||||||||||||||||||||||||||
Non-controlling interests | 0 | 0 | 0 | 0 | (134 | ) | ||||||||||||||||||||||||||||||||
Total cash costs | 909 | 321 | 457 | 131 | 202 | |||||||||||||||||||||||||||||||||
General & administrative costs | 0 | 0 | 0 | 0 | 0 | |||||||||||||||||||||||||||||||||
Minesite exploration and evaluation costs | e | 16 | 6 | 10 | 0 | 0 | ||||||||||||||||||||||||||||||||
Minesite sustaining capital expenditures | f | 215 | 49 | 153 | 13 | 110 | ||||||||||||||||||||||||||||||||
Rehabilitation - accretion and amortization (operating sites) | g | 23 | 19 | 3 | 1 | 7 | ||||||||||||||||||||||||||||||||
Non-controlling interests | (6 | ) | (6 | ) | 0 | (47 | ) | |||||||||||||||||||||||||||||||
All-in sustaining costs | 1,157 | 395 | 617 | 145 | 272 | |||||||||||||||||||||||||||||||||
Project exploration and evaluation and project costs | e | 0 | 0 | 0 | 0 | 0 | ||||||||||||||||||||||||||||||||
Project capital expenditures | f | 265 | 206 | 0 | 29 | 0 | ||||||||||||||||||||||||||||||||
Non-controlling interests | 0 | 0 | 0 | 0 | 0 | |||||||||||||||||||||||||||||||||
All-in costs | 1,422 | 601 | 617 | 174 | 272 | |||||||||||||||||||||||||||||||||
Ounces sold - equity basis (000s ounces) | 1,698 | 911 | 591 | 196 | 420 | |||||||||||||||||||||||||||||||||
Cost of sales per ounce | h,i | 822 | 653 | 1,098 | 777 | 775 | ||||||||||||||||||||||||||||||||
Total cash costs per ounce | i | 536 | 352 | 775 | 671 | 481 | ||||||||||||||||||||||||||||||||
Total cash costs per ounce (on aco-product basis) | i,j | 537 | 352 | 778 | 671 | 581 | ||||||||||||||||||||||||||||||||
All-in sustaining costs per ounce | i | 682 | 433 | 1,046 | 743 | 648 | ||||||||||||||||||||||||||||||||
All-in sustaining costs per ounce (on aco-product basis) | i,j | 683 | 433 | 1,049 | 743 | 748 | ||||||||||||||||||||||||||||||||
All-in costs per ounce | i | 840 | 660 | 1,046 | 891 | 648 | ||||||||||||||||||||||||||||||||
All-in costs per ounce (on aco-product basis) | i,j | 841 | 660 | 1,049 | 891 | 748 | ||||||||||||||||||||||||||||||||
| BARRICK THIRD QUARTER 2019 | 90 | MANAGEMENT’S DISCUSSION AND ANALYSIS |
| ($ millions, except per ounce information in dollars) | For the nine months ended 9/30/2018 | |||||||||||||||||||||||||||||||||||||
| Footnote | Veladero | Tanzania | Kalgoorlie | Tongonl | Porgera | Hemlo | Lagunas Norte | Golden Sunlightm | Morilal,m | |||||||||||||||||||||||||||||
Cost of sales applicable to gold production | 212 | 342 | 224 | 159 | 143 | 129 | 39 | |||||||||||||||||||||||||||||||
Depreciation | (89 | ) | (66 | ) | (42 | ) | (28 | ) | (11 | ) | (36 | ) | 0 | |||||||||||||||||||||||||
By-product credits | (6 | ) | (3 | ) | (1 | ) | (2 | ) | (1 | ) | (10 | ) | 0 | |||||||||||||||||||||||||
Non-recurring items | d | 0 | 0 | 0 | (17 | ) | 0 | 0 | 0 | |||||||||||||||||||||||||||||
Other | 0 | 0 | 0 | 0 | 0 | 0 | 0 | |||||||||||||||||||||||||||||||
Non-controlling interests | 0 | (98 | ) | 0 | 0 | 0 | 0 | 0 | ||||||||||||||||||||||||||||||
Total cash costs | 117 | 175 | 181 | 112 | 131 | 83 | 39 | |||||||||||||||||||||||||||||||
General & administrative costs | 0 | 18 | 0 | 0 | 0 | 0 | 0 | |||||||||||||||||||||||||||||||
Minesite exploration and evaluation costs | e | 1 | 0 | 8 | 0 | 0 | 1 | 0 | ||||||||||||||||||||||||||||||
Minesite sustaining capital expenditures | f | 84 | 65 | 17 | 45 | 25 | 13 | 2 | ||||||||||||||||||||||||||||||
Rehabilitation - accretion and amortization (operating sites) | g | 1 | 3 | 3 | 0 | 3 | 23 | 2 | ||||||||||||||||||||||||||||||
Non-controlling interests | 0 | (31 | ) | 0 | 0 | 0 | 0 | 0 | ||||||||||||||||||||||||||||||
All-in sustaining costs | 203 | 230 | 209 | 157 | 159 | 120 | 43 | |||||||||||||||||||||||||||||||
Project exploration and evaluation and project costs | e | 0 | 0 | 0 | 0 | 0 | 0 | 0 | ||||||||||||||||||||||||||||||
Project capital expenditures | f | 0 | 9 | 0 | 0 | 0 | 2 | 0 | ||||||||||||||||||||||||||||||
Non-controlling interests | 0 | (3 | ) | 0 | 0 | 0 | 0 | 0 | ||||||||||||||||||||||||||||||
All-in costs | 203 | 236 | 209 | 157 | 159 | 122 | 43 | |||||||||||||||||||||||||||||||
Ounces sold - equity basis (000s ounces) | 206 | 247 | 259 | 141 | 120 | 201 | 20 | |||||||||||||||||||||||||||||||
Cost of sales per ounce | h,i | 1,027 | 884 | 870 | 1,129 | 1,186 | 639 | 1,927 | ||||||||||||||||||||||||||||||
Total cash costs per ounce | i | 560 | 690 | 702 | 800 | 1,091 | 409 | 1,934 | ||||||||||||||||||||||||||||||
Total cash costs per ounce (on aco-product basis) | i,j | 586 | 697 | 707 | 816 | 1,095 | 461 | 1,940 | ||||||||||||||||||||||||||||||
All-in sustaining costs per ounce | i | 980 | 922 | 809 | 1,116 | 1,321 | 596 | 2,145 | ||||||||||||||||||||||||||||||
All-in sustaining costs per ounce (on aco-product basis) | i,j | 1,006 | 929 | 814 | 1,132 | 1,325 | 648 | 2,151 | ||||||||||||||||||||||||||||||
All-in costs per ounce | i | 980 | 946 | 809 | 1,116 | 1,323 | 605 | 2,145 | ||||||||||||||||||||||||||||||
All-in costs per ounce (on aco-product basis) | i,j | 1,006 | 953 | 814 | 1,132 | 1,327 | 657 | 2,151 | ||||||||||||||||||||||||||||||
| a. | Represents the combined results of Cortez, Goldstrike (including our 60% share of South Arturo) and our 75% interest in Turquoise Ridge until June 30, 2019. Commencing July 1, 2019, the date Nevada Gold Mines was established, the results represent our 61.5% interest in Cortez, Carlin (including Goldstrike and 60% of South Arturo), Turquoise Ridge (including Twin Creeks), Phoenix and Long Canyon. |
| b. | On July 1, 2019, Barrick’s Goldstrike and Newmont Goldcorp’s Carlin were contributed to Nevada Gold Mines and are now referred to as Carlin. As a result, the amounts presented represent Goldstrike on a 100% basis (including our 60% share of South Arturo) up until June 30, 2019, and the combined results of Carlin and Goldstrike (including our 60% share of South Arturo) on a 61.5% basis thereafter. |
| c. | Barrick owned 75% of Turquoise Ridge through the end of the second quarter of 2019, with our joint venture partner, Newmont Goldcorp, owning the remaining 25%. Turquoise Ridge was proportionately consolidated on the basis that the joint venture partners that have joint control have rights to the assets and obligations for the liabilities relating to the arrangement. The figures presented in this table are based on our 75% interest in Turquoise Ridge until June 30, 2019. On July 1, 2019, Barrick’s 75% interest in Turquoise Ridge and Newmont Goldcorp’s Twin Creeks and 25% interest in Turquoise Ridge were contributed to Nevada Gold Mines. Starting July 1, 2019, the results represent our 61.5% share of Turquoise Ridge and Twin Creeks, now referred to as Turquoise Ridge. |
| d. | Non-recurring items |
Non-recurring items in 2019 relate to organizational restructuring. These costs are not indicative of our cost of production and have been excluded from the calculation of total cash costs.
| BARRICK THIRD QUARTER 2019 | 91 | MANAGEMENT’S DISCUSSION AND ANALYSIS |
| e. | Exploration and evaluation costs |
Exploration, evaluation and project expenses are presented as minesite sustaining if it supports current mine operations and project if it relates to future projects. Refer to page 70 of this MD&A.
| f. | Capital expenditures |
Capital expenditures are related to our gold sites only and are presented on a 100% cash basis starting from January 1, 2019 and on a 100% accrued basis for the three and nine month periods ended September 30, 2018. They are split between minesite sustaining and project capital expenditures. Project capital expenditures are distinct projects designed to increase the net present value of the mine and are not related to current production. Significant projects in the current year are stripping at Rangefront declines, Cortez Crossroads, the Goldrush exploration declines, the Deep South Expansion, and construction of the third shaft at Turquoise Ridge. Refer to page 68 of this MD&A.
| g. | Rehabilitation - accretion and amortization |
Includes depreciation on the assets related to rehabilitation provisions of our gold operations and accretion on the rehabilitation provision of our gold operations, split between operating andnon-operating sites.
| h. | Cost of sales per ounce |
Cost of sales applicable to gold per ounce is calculated using cost of sales on an attributable basis (removing thenon-controlling interest of 40% Pueblo Viejo, 36.1% Tanzania (notwithstanding the completion of the Acacia transaction on September 17, 2019, we consolidated our interest in Acacia and recorded anon-controlling interest of 36.1% in the income statement for the entirety of the third quarter of 2019 as a matter of convenience) and 40% South Arturo from cost of sales (63.1% of South Arturo from July 1, 2019 onwards as a result of its contribution to Nevada Gold Mines)), divided by attributable gold ounces. Thenon-controlling interest of 20% Loulo-Gounkoto and 10.3% of Tongon is also removed from cost of sales and our proportionate share of cost of sales attributable to equity method investments (Kibali and Morila) is included commencing January 1, 2019, the effective date of the Merger. Also removes thenon-controlling interest of 38.5% Nevada Gold Mines from cost of sales from July 1, 2019 onwards.
| i. | Per ounce figures |
Cost of sales per ounce, total cash costs per ounce,all-in sustaining costs per ounce andall-in costs per ounce may not calculate based on amounts presented in this table due to rounding.
| j. | Co-product costs per ounce |
Total cash costs per ounce,all-in sustaining costs per ounce andall-in costs per ounce presented on aco-product basis removes the impact ofby-product credits of our gold production (net ofnon-controlling interest) calculated as:
| ($ millions) | For the three months ended 9/30/19 | |||||||||||||||||||||||||||||||||||
| Nevada Gold Minesa | Cortez | Carlinb | Turquoise Ridgec | Phoenix | Long Canyon | Pueblo Viejo | Loulo- Gounkoto | Kibali | ||||||||||||||||||||||||||||
By-product credits | 25 | 1 | 1 | 1 | 22 | 0 | 17 | 0 | 0 | |||||||||||||||||||||||||||
Non-controlling interest | (9 | ) | 0 | 0 | 0 | (9 | ) | 0 | (6 | ) | 0 | 0 | ||||||||||||||||||||||||
By-product credits (net ofnon-controlling interest) | 16 | 1 | 1 | 1 | 13 | 0 | 11 | 0 | 0 | |||||||||||||||||||||||||||
| ($ millions) | For the three months ended 9/30/19 | |||||||||||||||||||||||||||||||||||
| Veladero | Tanzania | Kalgoorlie | Tongon | Porgera | Hemlo | Lagunas Norte | ||||||||||||||||||||||||||||||
By-product credits | 1 | 1 | 0 | 0 | 1 | 1 | 2 | |||||||||||||||||||||||||||||
Non-controlling interest | 0 | 0 | 0 | 0 | 0 | 0 | 0 | |||||||||||||||||||||||||||||
By-product credits (net ofnon-controlling interest) | 1 | 1 | 0 | 0 | 1 | 1 | 2 | |||||||||||||||||||||||||||||
| ($ millions) | For the three months ended 6/30/19 | |||||||||||||||||||||||||||||||||||
| Nevada Gold Minesa | Cortez | Carlinb | Turquoise Ridgec | Phoenixk | Long Canyonk | Pueblo Viejo | Loulo- Gounkotol | Kibalil | ||||||||||||||||||||||||||||
By-product credits | 0 | 0 | 0 | 0 | 16 | 0 | 0 | |||||||||||||||||||||||||||||
Non-controlling interest | 0 | 0 | 0 | 0 | (6 | ) | 0 | 0 | ||||||||||||||||||||||||||||
By-product credits (net ofnon-controlling interest) | 0 | 0 | 0 | 0 | 10 | 0 | 0 | |||||||||||||||||||||||||||||
| ($ millions) | For the three months ended 6/30/19 | |||||||||||||||||||||||||||||||||||
| Veladero | Tanzania | Kalgoorlie | Tongonl | Porgera | Hemlo | Lagunas Norte | Golden Sunlight | Morila | ||||||||||||||||||||||||||||
By-product credits | 2 | 1 | 0 | 0 | 0 | 0 | 2 | 0 | 0 | |||||||||||||||||||||||||||
Non-controlling interest | 0 | (1 | ) | 0 | 0 | 0 | 0 | 0 | 0 | 0 | ||||||||||||||||||||||||||
By-product credits (net ofnon-controlling interest) | 2 | 0 | 0 | 0 | 0 | 0 | 2 | 0 | 0 | |||||||||||||||||||||||||||
| BARRICK THIRD QUARTER 2019 | 92 | MANAGEMENT’S DISCUSSION AND ANALYSIS |
| ($ millions) | For the three months ended 9/30/18 | |||||||||||||||||||||||||||||||||||
| Nevada Gold Minesa | Cortez | Carlinb | Turquoise Ridgec | Phoenixk | Long Canyonk | Pueblo Viejo | Loulo- Gounkotol | Kibalil | ||||||||||||||||||||||||||||
By-product credits | 0 | 0 | 0 | 0 | 23 | |||||||||||||||||||||||||||||||
Non-controlling interest | 0 | 0 | 0 | 0 | (10 | ) | ||||||||||||||||||||||||||||||
By-product credits (net ofnon-controlling interest) | 0 | 0 | 0 | 0 | 13 | |||||||||||||||||||||||||||||||
| ($ millions) | For the three months ended 9/30/18 | |||||||||||||||||||||||||||||||||||
| Veladero | Tanzania | Kalgoorlie | Tongonl | Porgera | Hemlo | Lagunas Norte | Golden Sunlight | Morilal | ||||||||||||||||||||||||||||
By-product credits | 2 | 1 | 1 | 1 | 1 | 3 | 0 | 0 | ||||||||||||||||||||||||||||
Non-controlling interest | 0 | (1 | ) | 0 | 0 | 0 | 0 | 0 | 0 | |||||||||||||||||||||||||||
By-product credits (net ofnon-controlling interest) | 2 | 0 | 1 | 1 | 1 | 3 | 0 | 0 | ||||||||||||||||||||||||||||
| ($ millions) | For the nine months ended 9/30/2019 | |||||||||||||||||||||||||||||||||||
| Nevada Gold Minesa | Cortez | Carlinb | Turquoise Ridgec | Phoenix | Long Canyon | Pueblo Viejo | Loulo- Gounkoto | Kibali | ||||||||||||||||||||||||||||
By-product credits | 25 | 1 | 1 | 1 | 22 | 0 | 49 | 0 | 0 | |||||||||||||||||||||||||||
Non-controlling interest | (9 | ) | 0 | 0 | 0 | (9 | ) | 0 | (18 | ) | 0 | 0 | ||||||||||||||||||||||||
By-product credits (net ofnon-controlling interest) | 16 | 1 | 1 | 1 | 13 | 0 | 31 | 0 | 0 | |||||||||||||||||||||||||||
| ($ millions) | For the nine months ended 9/30/2019 | |||||||||||||||||||||||||||||||||||
| Veladero | Tanzania | Kalgoorlie | Tongon | Porgera | Hemlo | Lagunas Norte | Golden Sunlightm | Morilam | ||||||||||||||||||||||||||||
By-product credits | 5 | 3 | 0 | 0 | 2 | 1 | 6 | 0 | 0 | |||||||||||||||||||||||||||
Non-controlling interest | 0 | (1 | ) | 0 | 0 | 0 | 0 | 0 | 0 | 0 | ||||||||||||||||||||||||||
By-product credits (net ofnon-controlling interest) | 5 | 2 | 0 | 0 | 2 | 1 | 6 | 0 | 0 | |||||||||||||||||||||||||||
| ($ millions) | For the nine months ended 9/30/2018 | |||||||||||||||||||||||||||||||||||
| Nevada Gold Minesa | Cortez | Carlinb | Turquoise Ridgec | Phoenixk | Long Canyonk | Pueblo Viejo | Loulo- Gounkotol | Kibalil | ||||||||||||||||||||||||||||
By-product credits | 2 | 0 | 2 | 0 | 73 | |||||||||||||||||||||||||||||||
Non-controlling interest | 0 | 0 | 0 | 0 | (30 | ) | ||||||||||||||||||||||||||||||
By-product credits (net ofnon-controlling interest) | 2 | 0 | 2 | 0 | 43 | |||||||||||||||||||||||||||||||
| ($ millions) | For the nine months ended 9/30/2018 | |||||||||||||||||||||||||||||||||||
| Veladero | Tanzania | Kalgoorlie | Tongonl | Porgera | Hemlo | Lagunas Norte | Golden Sunlightm | Morilal | ||||||||||||||||||||||||||||
By-product credits | 6 | 3 | 1 | 2 | 1 | 10 | 0 | 0 | ||||||||||||||||||||||||||||
Non-controlling interest | 0 | (1 | ) | 0 | 0 | 0 | 0 | 0 | 0 | |||||||||||||||||||||||||||
By-product credits (net ofnon-controlling interest) | 6 | 2 | 1 | 2 | 1 | 10 | 0 | 0 | ||||||||||||||||||||||||||||
| k. | The results for the three months ended June 30, 2019 and the three and nine months ended September 30, 2018 did not form a part of the Barrick consolidated results as these sites were acquired as a result of the formation of Nevada Gold Mines. Therefore, no comparative figures are provided. |
| l. | The results for the three and nine months ended September 30, 2018 did not form a part of the Barrick consolidated results as these sites were acquired as a result of the Merger. Therefore, no comparative figures are provided. |
| m. | With the end of mining at Golden Sunlight and Morila in the second quarter of 2019 as previously reported, we have ceased to include production ornon-GAAP cost metrics for these sites from July 1, 2019 onwards. |
| BARRICK THIRD QUARTER 2019 | 93 | MANAGEMENT’S DISCUSSION AND ANALYSIS |
Reconciliation of Copper Cost of Sales to C1 cash costs andAll-in sustaining costs, including on a per pound basis
| ($ millions, except per pound information in dollars) | For the three months ended | For the nine months ended | ||||||||||||||||||
| 9/30/19 | 6/30/19 | 9/30/18 | 9/30/19 | 9/30/18 | ||||||||||||||||
Cost of sales | 49 | 101 | 144 | 281 | 348 | |||||||||||||||
Depreciation/amortization | (13 | ) | (28 | ) | (37 | ) | (83 | ) | (86 | ) | ||||||||||
Treatment and refinement charges | 18 | 25 | 43 | 74 | 103 | |||||||||||||||
Cash cost of sales applicable to equity method investments | 59 | 69 | 81 | 194 | 203 | |||||||||||||||
Less: royalties and production taxesa | (5 | ) | (9 | ) | (10 | ) | (26 | ) | (29 | ) | ||||||||||
By-product credits | (3 | ) | (2 | ) | (1 | ) | (8 | ) | (4 | ) | ||||||||||
Other | 0 | (5 | ) | 0 | (5 | ) | 0 | |||||||||||||
C1 cash cost of sales | 105 | 151 | 220 | 427 | 535 | |||||||||||||||
General & administrative costs | 5 | 6 | 7 | 16 | 23 | |||||||||||||||
Rehabilitation - accretion and amortization | 2 | 3 | 5 | 8 | 13 | |||||||||||||||
Royalties and production taxesa | 5 | 9 | 10 | 26 | 29 | |||||||||||||||
Minesite exploration and evaluation costs | 1 | 1 | 1 | 4 | 2 | |||||||||||||||
Minesite sustaining capital expenditures | 48 | 48 | 65 | 155 | 153 | |||||||||||||||
Sustaining leases | 0 | 1 | 0 | 2 | 0 | |||||||||||||||
Inventory write-downs | 0 | 0 | 0 | 0 | 0 | |||||||||||||||
All-in sustaining costs | 166 | 219 | 308 | 638 | 755 | |||||||||||||||
Pounds sold - consolidated basis (millions pounds) | 65 | 96 | 114 | 264 | 273 | |||||||||||||||
Cost of sales per poundb,c | 2.00 | 2.04 | 2.18 | 2.10 | 2.22 | |||||||||||||||
C1 cash cost per poundb | 1.62 | 1.59 | 1.94 | 1.62 | 1.97 | |||||||||||||||
All-in sustaining costs per poundb | 2.58 | 2.28 | 2.71 | 2.42 | 2.76 | |||||||||||||||
| a. | For the three and nine month periods ended September 30, 2019, royalties and production taxes include royalties of $5 million and $26 million, respectively (June 30, 2019: $9 million and September 30, 2018: $11 million and $28 million, respectively). |
| b. | Cost of sales per pound, C1 cash costs per pound andall-in sustaining costs per pound may not calculate based on amounts presented in this table due to rounding. |
| c. | Cost of sales applicable to copper per pound is calculated using cost of sales including our proportionate share of cost of sales attributable to equity method investments (Zaldívar and Jabal Sayid), divided by consolidated copper pounds (including our proportionate share of copper pounds from our equity method investments). |
| BARRICK THIRD QUARTER 2019 | 94 | MANAGEMENT’S DISCUSSION AND ANALYSIS |
Reconciliation of Copper Cost of Sales to C1 cash costs andAll-in sustaining costs, including on a per pound basis, by operating site
| ($ millions, except per pound information in dollars) | For the three months ended | |||||||||||||||||||||||||||||||||||
| 9/30/19 | 6/30/19 | 9/30/18 | ||||||||||||||||||||||||||||||||||
| Zaldívar | Lumwana | Jabal Sayid | Zaldívar | Lumwana | Jabal Sayid | Zaldívar | Lumwana | Jabal Sayid | ||||||||||||||||||||||||||||
Cost of sales | 57 | 49 | 24 | 72 | 101 | 25 | 70 | 144 | 36 | |||||||||||||||||||||||||||
Depreciation/amortization | (17 | ) | (13 | ) | (5 | ) | (22 | ) | (28 | ) | (6 | ) | (16 | ) | (37 | ) | (8 | ) | ||||||||||||||||||
Treatment and refinement charges | 0 | 14 | 4 | 0 | 20 | 5 | 0 | 36 | 7 | |||||||||||||||||||||||||||
Less: royalties and production taxesa | 0 | (5 | ) | 0 | 0 | (9 | ) | 0 | 0 | (11 | ) | 1 | ||||||||||||||||||||||||
By-product credits | 0 | 0 | (3 | ) | 0 | 0 | (2 | ) | 0 | 0 | (1 | ) | ||||||||||||||||||||||||
Other | 0 | 0 | 0 | 0 | (5 | ) | 0 | 0 | 0 | 0 | ||||||||||||||||||||||||||
C1 cash cost of sales | 40 | 45 | 20 | 50 | 79 | 22 | 54 | 132 | 35 | |||||||||||||||||||||||||||
Rehabilitation - accretion and amortization | 0 | 2 | 0 | 1 | 2 | 0 | 0 | 5 | 0 | |||||||||||||||||||||||||||
Royalties and production taxesa | 0 | 5 | 0 | 0 | 9 | 0 | 0 | 11 | (1 | ) | ||||||||||||||||||||||||||
Minesite exploration and evaluation costs | 1 | 0 | 0 | 1 | 0 | 0 | 0 | 1 | 0 | |||||||||||||||||||||||||||
Minesite sustaining capital expenditures | 7 | 37 | 4 | 7 | 40 | 1 | 7 | 55 | 3 | |||||||||||||||||||||||||||
Sustaining leases | 0 | 0 | 0 | 0 | 1 | 0 | 0 | 0 | 0 | |||||||||||||||||||||||||||
All-in sustaining costs | 48 | 89 | 24 | 59 | 131 | 23 | 61 | 204 | 37 | |||||||||||||||||||||||||||
Pounds sold - consolidated basis (millions pounds) | 26 | 24 | 15 | 31 | 48 | 17 | 28 | 65 | 21 | |||||||||||||||||||||||||||
Cost of sales per poundb,c | 2.18 | 2.04 | 1.63 | 2.32 | 2.07 | 1.45 | 2.59 | 2.21 | 1.66 | |||||||||||||||||||||||||||
C1 cash cost per poundb | 1.55 | 1.83 | 1.42 | 1.61 | 1.70 | 1.22 | 1.98 | 2.05 | 1.56 | |||||||||||||||||||||||||||
All-in sustaining costs per poundb | 1.91 | 3.66 | 1.65 | 1.85 | 2.78 | 1.31 | 2.29 | 3.12 | 1.67 | |||||||||||||||||||||||||||
| ($ millions, except per pound information in dollars) | For the nine months ended | |||||||||||||||||||||||
| 9/30/19 | 9/30/18 | |||||||||||||||||||||||
| Zaldívar | Lumwana | Jabal Sayid | Zaldívar | Lumwana | Jabal Sayid | |||||||||||||||||||
Cost of sales | 203 | 281 | 71 | 185 | 348 | 75 | ||||||||||||||||||
Depreciation/amortization | (60 | ) | (83 | ) | (20 | ) | (40 | ) | (86 | ) | (16 | ) | ||||||||||||
Treatment and refinement charges | 0 | 60 | 14 | 0 | 89 | 14 | ||||||||||||||||||
Less: royalties and production taxesa | 0 | (26 | ) | 0 | 0 | (28 | ) | (1 | ) | |||||||||||||||
By-product credits | 0 | 0 | (8 | ) | 0 | 0 | (4 | ) | ||||||||||||||||
Other | 0 | (5 | ) | 0 | 0 | 0 | 0 | |||||||||||||||||
C1 cash cost of sales | 143 | 227 | 57 | 145 | 323 | 68 | ||||||||||||||||||
Rehabilitation - accretion and amortization | 1 | 7 | 0 | 0 | 13 | 0 | ||||||||||||||||||
Royalties and production taxesa | 0 | 26 | 0 | 0 | 28 | 1 | ||||||||||||||||||
Minesite exploration and evaluation costs | 4 | 0 | 0 | 0 | 2 | 0 | ||||||||||||||||||
Minesite sustaining capital expenditures | 18 | 129 | 8 | 33 | 107 | 13 | ||||||||||||||||||
Sustaining leases | 0 | 2 | 0 | 0 | 0 | 0 | ||||||||||||||||||
Inventory write-downs | 0 | 0 | 0 | 0 | 0 | 0 | ||||||||||||||||||
All-in sustaining costs | 166 | 391 | 65 | 178 | 473 | 82 | ||||||||||||||||||
Pounds sold - consolidated basis (millions pounds) | 85 | 133 | 46 | 73 | 157 | 43 | ||||||||||||||||||
Cost of sales per poundb,c | 2.39 | 2.11 | 1.54 | 2.55 | 2.22 | 1.73 | ||||||||||||||||||
C1 cash cost per poundb | 1.69 | 1.71 | 1.25 | 2.00 | 2.07 | 1.55 | ||||||||||||||||||
All-in sustaining costs per poundb | 1.97 | 2.94 | 1.42 | 2.46 | 3.01 | 1.88 | ||||||||||||||||||
| a. | For the three and nine month period ended September 30, 2019, royalties and production taxes include royalties of $5 million and $26 million, respectively (June 30, 2019: $12 million and September 30, 2018: $11 million and $28 million, respectively). |
| b. | Cost of sales per pound, C1 cash costs per pound andall-in sustaining costs per pound may not calculate based on amounts presented in this table due to rounding. |
| c. | Cost of sales applicable to copper per pound is calculated using cost of sales including our proportionate share of cost of sales attributable to equity method investments (Zaldívar and Jabal Sayid), divided by consolidated copper pounds (including our proportionate share of copper pounds from our equity method investments). |
| BARRICK THIRD QUARTER 2019 | 95 | MANAGEMENT’S DISCUSSION AND ANALYSIS |
EBITDA and Adjusted EBITDA
EBITDA is anon-GAAP financial measure, which excludes the following from net earnings:
| • | Income tax expense; |
| • | Finance costs; |
| • | Finance income; |
| • | Depreciation; and |
| • | Income tax expense, finance costs, finance income and depreciation from equity investees. |
Management believes that EBITDA is a valuable indicator of our ability to generate liquidity by producing operating cash flow to fund working capital needs, service debt obligations, and fund capital expenditures. Management uses EBITDA for this purpose. EBITDA is also frequently used by investors and analysts for valuation purposes whereby EBITDA is multiplied by a factor or “EBITDA multiple” that is based on an observed or inferred relationship between EBITDA and market values to determine the approximate total enterprise value of a company.
Adjusted EBITDA removes the effect of impairment charges; acquisition/disposition gains/losses; foreign currency translation gains/losses; other expense adjustments; and unrealized gains onnon-hedge derivative instruments. We believe these items provide a greater level of consistency with
the adjusting items included in our Adjusted Net Earnings reconciliation, with the exception that these amounts are adjusted to remove any impact on finance costs/income, income tax expense and/or depreciation, including the impact incurred in our equity method accounted investments, as they do not affect EBITDA. We believe this additional information will assist analysts, investors and other stakeholders of Barrick in better understanding our ability to generate liquidity from operating cash flow, by excluding these amounts from the calculation as they are not indicative of the performance of our core mining business and not necessarily reflective of the underlying operating results for the periods presented.
EBITDA and adjusted EBITDA are intended to provide additional information to investors and analysts and do not have any standardized definition under IFRS and should not be considered in isolation or as a substitute for measures of performance prepared in accordance with IFRS. EBITDA and adjusted EBITDA exclude the impact of cash costs of financing activities and taxes, and the effects of changes in operating working capital balances, and therefore are not necessarily indicative of operating profit or cash flow from operations as determined under IFRS. Other companies may calculate EBITDA and adjusted EBITDA differently.
Reconciliation of Net Earnings to EBITDA and Adjusted EBITDA
| ($ millions) | For the three months ended | For the nine months ended | ||||||||||||||||||
| 9/30/19 | 6/30/19 | 9/30/18 | 9/30/19 | 9/30/18 | ||||||||||||||||
Net earnings (loss) | 2,435 | 223 | (386 | ) | 2,798 | (270 | ) | |||||||||||||
Income tax expense | 791 | 41 | 105 | 999 | 422 | |||||||||||||||
Finance costs, neta | 106 | 98 | 136 | 304 | 363 | |||||||||||||||
Depreciation | 559 | 466 | 363 | 1,460 | 1,016 | |||||||||||||||
| EBITDA | 3,891 | 828 | 218 | 5,561 | 1,531 | |||||||||||||||
| Impairment charges related to intangibles, goodwill, property, plant and equipment, and investmentsb | (872 | ) | 12 | 431 | (857 | ) | 492 | |||||||||||||
| Acquisition/disposition (gains) lossesc | (1,901 | ) | (12 | ) | (1 | ) | (1,913 | ) | (49 | ) | ||||||||||
| Loss on currency translation | 40 | (6 | ) | 62 | 56 | 152 | ||||||||||||||
| Other expense (income) adjustmentsd | 53 | 58 | 39 | 158 | 75 | |||||||||||||||
| Unrealized (gains) losses onnon-hedge derivative instruments | 1 | 0 | 0 | 0 | 0 | |||||||||||||||
| Income tax expense, net finance costs, and depreciation from equity investees | 85 | 92 | 27 | 266 | 73 | |||||||||||||||
Adjusted EBITDA | 1,297 | 972 | 776 | 3,271 | 2,274 | |||||||||||||||
| a. | Finance costs exclude accretion. |
| b. | Net impairment reversals for the three and nine month periods ended September 30, 2019 primarily relate tonon-current asset reversals at Lumwana, partially offset by impairments at Cortez and Lagunas Norte. For the three and nine months ended September 30, 2018, net impairment charges primarily relate tonon-current asset impairments at Lagunas Norte. |
| c. | Acquisition/disposition gains for the three and nine month periods ended September 30, 2019 primarily relate to the gain on the remeasurement of Turquoise Ridge to fair value as a result of its contribution to Nevada Gold Mines. |
| d. | Other expense adjustments for the three and nine month periods ended September 30, 2019 primarily relate to severance costs as a result of the implementation of a number of organizational reductions, the impact of changes in the discount rate assumptions on our closed mine rehabilitation provision and transaction costs related to Nevada Gold Mines and Acacia. |
| BARRICK THIRD QUARTER 2019 | 96 | MANAGEMENT’S DISCUSSION AND ANALYSIS |
Reconciliation of Income to EBITDA by operating site
| ($ millions) | For the three months ended 9/30/19 | |||||||||||||||||||||||||||||||||||
| Nevada Gold Minesa (61.5%) | Cortez (61.5%) | Carlinb (61.5%) | Turquoise Ridgec (61.5%) | Pueblo Viejo (60%) | Loulo-Gounkoto (80%) | Kibali (45%) | Veladero (50%) | Tanzania (63.9%) | ||||||||||||||||||||||||||||
Income | 237 | 77 | 121 | 38 | 104 | 64 | 25 | 14 | 0 | |||||||||||||||||||||||||||
Depreciation | 166 | 32 | 62 | 43 | 29 | 61 | 57 | 25 | 16 | |||||||||||||||||||||||||||
EBITDA | 403 | 109 | 183 | 81 | 133 | 125 | 82 | 39 | 16 | |||||||||||||||||||||||||||
| For the three months ended 6/30/19 | ||||||||||||||||||||||||||||||||||||
| Nevada Gold Minesa (100%) | Cortez (100%) | Carlinb (100%) | Turquoise Ridgec (75%) | Pueblo Viejo (60%) | Loulo-Gounkoto (80%) | Kibali (45%) | Veladero (50%) | Tanzania (63.9%) | ||||||||||||||||||||||||||||
Income | 244 | 158 | 33 | 53 | 75 | 32 | 43 | 12 | 24 | |||||||||||||||||||||||||||
Depreciation | 127 | 65 | 53 | 9 | 29 | 70 | 31 | 31 | 22 | |||||||||||||||||||||||||||
EBITDA | 371 | 223 | 86 | 62 | 104 | 102 | 74 | 43 | 46 | |||||||||||||||||||||||||||
| For the three months ended 9/30/18 | ||||||||||||||||||||||||||||||||||||
| Nevada Gold Minesa (100%) | Cortez (100%) | Carlinb (100%) | Turquoise Ridgec (75%) | Pueblo Viejo (60%) | Loulo-Gounkotod | Kibalid | Veladero (50%) | Tanzania (63.9%) | ||||||||||||||||||||||||||||
Income | 271 | 199 | 42 | 30 | 74 | 6 | 22 | |||||||||||||||||||||||||||||
Depreciation | 183 | 102 | 73 | 7 | 29 | 24 | 13 | |||||||||||||||||||||||||||||
EBITDA | 454 | 301 | 115 | 37 | 103 | 30 | 35 | |||||||||||||||||||||||||||||
| ($ millions) | For the nine months ended 9/30/2019 | |||||||||||||||||||||||||||||||||||
| Nevada Gold Minesa (61.5%) | Cortez (61.5%) | Carlinb (61.5%) | Turquoise Ridgec (61.5%) | Pueblo Viejo (60%) | Loulo-Gounkoto (80%) | Kibali (45%) | Veladero (50%) | Tanzania (63.9%) | ||||||||||||||||||||||||||||
Income | 773 | 390 | 237 | 145 | 277 | 125 | 78 | 36 | 23 | |||||||||||||||||||||||||||
Depreciation | 429 | 161 | 181 | 58 | 86 | 178 | 144 | 86 | 55 | |||||||||||||||||||||||||||
EBITDA | 1,202 | 551 | 418 | 203 | 363 | 303 | 222 | 122 | 78 | |||||||||||||||||||||||||||
| ($ millions) | For the nine months ended 9/30/2018 | |||||||||||||||||||||||||||||||||||
| Nevada Gold Minesa (100%) | Cortez (100%) | Carlinb (100%) | Turquoise Ridgec (75%) | Pueblo Viejo (60%) | Loulo-Gounkotod | Kibalid | Veladero (50%) | Tanzania (63.9%) | ||||||||||||||||||||||||||||
Income | 751 | 550 | 104 | 97 | 256 | 58 | 89 | |||||||||||||||||||||||||||||
Depreciation | 483 | 274 | 188 | 21 | 81 | 89 | 42 | |||||||||||||||||||||||||||||
EBITDA | 1,234 | 824 | 292 | 118 | 337 | 147 | 131 | |||||||||||||||||||||||||||||
| a. | Represents the combined results of Cortez, Goldstrike (including our 60% share of South Arturo) and our 75% interest in Turquoise Ridge until June 30, 2019. Commencing July 1, 2019, the date Nevada Gold Mines was established, the results represent our 61.5% interest in Cortez, Carlin (including Goldstrike and 60% of South Arturo), Turquoise Ridge (including Twin Creeks), Phoenix and Long Canyon. |
| b. | On July 1, 2019, Barrick’s Goldstrike and Newmont Goldcorp’s Carlin were contributed to Nevada Gold Mines and are now referred to as Carlin. As a result, the amounts presented represent Goldstrike on a 100% basis (including our 60% share of South Arturo) up until June 30, 2019, and the combined results of Carlin and Goldstrike (including our 60% share of South Arturo) on a 61.5% basis thereafter. |
| c. | Barrick owned 75% of Turquoise Ridge through the end of the second quarter of 2019, with our joint venture partner, Newmont Goldcorp, owning the remaining 25%. Turquoise Ridge was proportionately consolidated on the basis that the joint venture partners that have joint control have rights to the assets and obligations for the liabilities relating to the arrangement. The figures presented in this table are based on our 75% interest in Turquoise Ridge until June 30, 2019. On July 1, 2019, Barrick’s 75% interest in Turquoise Ridge and Newmont Goldcorp’s Twin Creeks and 25% interest in Turquoise Ridge were contributed to Nevada Gold Mines. Starting July 1, 2019, the results represent our 61.5% share of Turquoise Ridge and Twin Creeks, now referred to as Turquoise Ridge. |
| d. | The results for the three and nine months ended September 30, 2018 did not form a part of the Barrick consolidated results as these sites were acquired as a result of the Merger. Therefore, no comparative figures are provided. |
| BARRICK THIRD QUARTER 2019 | 97 | MANAGEMENT’S DISCUSSION AND ANALYSIS |
Realized Price
Realized price is anon-GAAP financial measure which excludes from sales:
| • | Unrealized gains and losses onnon-hedge derivative contracts; |
| • | Unrealizedmark-to-market gains and losses on provisional pricing from copper and gold sales contracts; |
| • | Sales attributable to ore purchase arrangements; |
| • | Treatment and refining charges; and |
| • | Export duties. |
This measure is intended to enable Management to better understand the price realized in each reporting period for gold and copper sales because unrealizedmark-to-market values ofnon-hedge gold and copper derivatives are subject to change each period due to changes in market factors such as market and forward gold and copper prices, so that prices ultimately realized may differ from those recorded. The exclusion of such unrealizedmark-to-market gains and losses from the presentation of this performance measure enables investors to understand performance based on the realized proceeds of selling gold and copper production.
The gains and losses onnon-hedge derivatives and receivable balances relate to instruments/balances that mature in future periods, at which time the gains and losses
will become realized. The amounts of these gains and losses reflect fair values based on market valuation assumptions at the end of each period and do not necessarily represent the amounts that will become realized on maturity. We also exclude export duties that are paid upon sale and netted against revenues as well as treatment and refining charges that are paid to the refiner on gold and copper concentrate sales that are netted against revenues. We believe this provides investors and analysts with a more accurate measure with which to compare to market gold prices and to assess our gold sales performance. For those reasons, management believes that this measure provides a more accurate reflection of our Company’s past performance and is a better indicator of its expected performance in future periods.
The realized price measure is intended to provide additional information and does not have any standardized definition under IFRS and should not be considered in isolation or as a substitute for measures of performance prepared in accordance with IFRS. The measure is not necessarily indicative of sales as determined under IFRS. Other companies may calculate this measure differently. The following table reconciles realized prices to the most directly comparable IFRS measure.
Reconciliation of Sales to Realized Price per ounce/pound
| ($ millions, except per ounce/pound information in dollars) | Gold | Copper | Gold | Copper | ||||||||||||||||||||||||||||||||||||
| For the three months ended | For the nine months ended | |||||||||||||||||||||||||||||||||||||||
| 9/30/19 | 6/30/19 | 9/30/18 | 9/30/19 | 6/30/19 | 9/30/18 | 9/30/19 | 9/30/18 | 9/30/19 | 9/30/18 | |||||||||||||||||||||||||||||||
Sales | 2,585 | 1,937 | 1,661 | 45 | 103 | 145 | 6,428 | 4,866 | 311 | 368 | ||||||||||||||||||||||||||||||
Sales applicable tonon-controlling interests | (748 | ) | (240 | ) | (179 | ) | 0 | 0 | 0 | (1,212 | ) | (537 | ) | 0 | 0 | |||||||||||||||||||||||||
Sales applicable to equity method investmentsa,b | 140 | 135 | 0 | 100 | 124 | 126 | 404 | 0 | 345 | 326 | ||||||||||||||||||||||||||||||
Realizednon-hedge gold/copper derivative (losses) gains | 0 | 1 | 0 | 0 | 0 | 0 | 1 | 2 | 0 | 0 | ||||||||||||||||||||||||||||||
Sales applicable to sites in care and maintenancec | (32 | ) | (26 | ) | (22 | ) | 0 | 0 | 0 | (84 | ) | (83 | ) | 0 | 0 | |||||||||||||||||||||||||
Treatment and refinement charges | 0 | 0 | 0 | 18 | 25 | 43 | 0 | 1 | 74 | 103 | ||||||||||||||||||||||||||||||
Export duties | 0 | 0 | 3 | 0 | 0 | 0 | 0 | 3 | 0 | 0 | ||||||||||||||||||||||||||||||
Revenues – as adjusted | 1,945 | 1,807 | 1,463 | 163 | 252 | 314 | 5,537 | 4,252 | 730 | 797 | ||||||||||||||||||||||||||||||
Ounces/pounds sold (000s ounces/millions pounds)c | 1,318 | 1,372 | 1,204 | 65 | 96 | 114 | 4,055 | 3,312 | 264 | 273 | ||||||||||||||||||||||||||||||
Realized gold/copper price per ounce/poundd | 1,476 | 1,317 | 1,216 | 2.55 | 2.62 | 2.76 | 1,365 | 1,284 | 2.78 | 2.92 | ||||||||||||||||||||||||||||||
| a. | Represents sales of $133 million and $375 million, respectively, for the three and nine month periods ended September 30, 2019 (June 30, 2019: $125 million and September 30, 2018: $nil and $nil, respectively) applicable to our 45% equity method investment in Kibali of $8 million and $30 million, respectively (June 30, 2019: $10 million and September 30, 2018: $nil and $nil, respectively) applicable to our 40% equity method investment in Morila for gold. Represents sales of $66 million and $233 million, respectively, for the three and nine months ended September 30, 2019 (June 30, 2019: $86 million and September 30, 2018: $74 million and $216 million, respectively) applicable to our 50% equity method investment in Zaldívar and $37 million and $125 million, respectively (June 30, 2019: $44 million and September 30, 2018: $58 million and $124 million, respectively) applicable to our 50% equity method investment in Jabal Sayid for copper. |
| b. | Sales applicable to equity method investments are net of treatment and refinement charges. |
| c. | Figures exclude Pierina, and starting in the third quarter of 2019, Golden Sunlight and Morila, from the calculation of realized price per ounce as the mine is mining incidental ounces as it enters closure. |
| d. | Realized price per ounce/pound may not calculate based on amounts presented in this table due to rounding. |
| BARRICK THIRD QUARTER 2019 | 98 | MANAGEMENT’S DISCUSSION AND ANALYSIS |
TECHNICAL INFORMATION
The scientific and technical information contained in this MD&A has been reviewed and approved by Steven Yopps, MMSA, Director - Metallurgy, North America; Chad Yuhasz, P.Geo, Mineral Resource Manager, Latin America and Australia Pacific; Simon Bottoms, CGeol, MGeol, FGS, MAusIMM, Mineral Resources Manager: Africa and Middle East; Rodney Quick, MSc, Pr. Sci.Nat, Mineral Resource Management and Evaluation Executive; John Steele, CIM, Metallurgy, Engineering and Capital Projects Executive; and Rob Krcmarov, FAusIMM, Executive Vice President, Exploration and Growth – each a “Qualified Person” as defined in National Instrument43-101 –Standards of Disclosure for Mineral Projects.
All mineral reserve and mineral resource estimates are estimated in accordance with National Instrument43-101 –Standards of Disclosure for Mineral Projects. Unless otherwise noted, such mineral reserve and mineral resource estimates are as of December 31, 2018.
ENDNOTES
| 1 | These arenon-GAAP financial performance measures with no standardized meaning under IFRS and therefore may not be comparable to similar measures presented by other issuers. For further information and a detailed reconciliation of eachnon-GAAP measure to the most directly comparable IFRS measure, please see pages 77 to 98 of this MD&A. |
| 2 | Cost of sales applicable to gold per ounce is calculated using cost of sales applicable to gold on an attributable basis (removing thenon-controlling interest of 40% Pueblo Viejo, 36.1% Tanzania (notwithstanding the completion of the Acacia transaction on September 17, 2019, we consolidated our interest in Acacia and recorded anon-controlling interest of 36.1% in the income statement for the entirety of the third quarter of 2019 as a matter of convenience) and 40% South Arturo from cost of sales (63.1% of South Arturo from July 1, 2019 onwards as a result of its contribution to Nevada Gold Mines)), divided by attributable gold ounces. Thenon-controlling interest of 20% Loulo-Gounkoto and 10.3% of Tongon is also removed from cost of sales and our proportionate share of cost of sales attributable to equity method investments (Kibali and Morila) is included commencing January 1, 2019, the effective date of the Merger. Also removes thenon-controlling interest of 38.5% Nevada Gold Mines from cost of sales from July 1, 2019 onwards. Cost of sales applicable to copper per pound is calculated using cost of sales applicable to copper including our proportionate share of cost of sales attributable to equity method investments (Zaldívar and Jabal Sayid), divided by consolidated copper pounds (including our proportionate share of copper pounds from our equity method investments). |
| 3 | The term “Acacia Exploration Special Dividends” refers to special dividends potentially payable by Barrick to former shareholders of Acacia, as a consequence of the sales process to realize value from the sale (if any) of certain of Acacia’s exploration assets located in the Republic of Kenya, the Republic of Mali and Burkina Faso, and excluding the sale of Acacia’s interests in the Nyanzaga Gold Project in Tanzania and the South Houndé Project in Burkina Faso, for which Acacia had already commenced and advanced sales processes. |
| 4 | A Tier One Gold Asset is a mine with a stated life in excess of 10 years with 2017 production of at least 500,000 ounces of gold and 2017 total cash cost per ounce within the bottom half of Wood Mackenzie’s cost curve tools (excluding state-owned and privately-owned mines). For purposes of determining Tier One Gold Assets, Total cash cost per ounce is based on data from Wood Mackenzie as of August 31, 2018. The Wood Mackenzie calculation of Total cash cost per ounce may not be identical to the manner in which Barrick calculates comparable measures. Total cash cost per ounce is anon-GAAP financial performance measure with no standardized meaning under IFRS and therefore may not be comparable to similar measures presented by other issuers. Total cash cost per ounce should not be considered by investors as an alternative to operating profit, net profit attributable to shareholders, or to other IFRS measures. Barrick believes that Total cash cost per ounce is a useful indicator for investors and management of a mining company’s performance as it provides an indication of a company’s profitability and efficiency, the trends in cash costs as the company’s operations mature, and a benchmark of performance to allow for comparison against other companies. Wood Mackenzie is an independent third party research and consultancy firm that provides data for, among others, the metals and mining industry. Wood Mackenzie does not have any affiliation to Barrick. |
| 5 | Fourmile Significant Intercepts1 |
| Drill Results from Q3 2019 | ||||||||||
| Drill Hole2 | Azimuth | Dip | Interval (m) | Width (m)3 | Au (g/t) | |||||
| 1208.2 - 1209.7 | 1.5 | 8 | ||||||||
| 1238.1 - 1239.3 | 1.2 | 73.4 | ||||||||
| 1279.8 - 1290.5 | 10.7 | 24.8 | ||||||||
| 1304.2 - 1305.7 | 1.5 | 8.1 | ||||||||
| 1319.5 - 1321.0 | 1.5 | 5 | ||||||||
| 1343.8 - 1348.4 | 4.6 | 49.4 | ||||||||
FM19-11DW14 | 18 | (74) | 1351.5 - 1357.6 | 6.1 | 21.2 | |||||
| BARRICK THIRD QUARTER 2019 | 99 | MANAGEMENT’S DISCUSSION AND ANALYSIS |
| 817.5 - 820.5 | 3 | 32.2 | ||||||||
| 826.0 - 827.5 | 1.5 | 9.1 | ||||||||
| 830.6 - 841.3 | 10.7 | 8 | ||||||||
FM19-37D | 251 | (80) | 845.8 - 848.9 | 3.0 | 19.7 | |||||
FM19-38D | 358 | (85) | 771.0 - 775.7 | 4.7 | 9.6 | |||||
| 874.8 - 896.3 | 21.5 | 28.5 | ||||||||
| 900.5 - 904.5 | 4 | 38.4 | ||||||||
| 906.7 - 907.8 | 1.1 | 11.2 | ||||||||
| 913.5 - 923.4 | 9.9 | 28.1 | ||||||||
FM19-39D | 163 | (85) | 942.8 - 945.8 | 3 | 7.2 | |||||
FM19-41D | 108 | (83) | no intercepts > 5 gpt Au | |||||||
FM19-42D | 349 | (72) | no intercepts > 5 gpt Au | |||||||
| 764.7 - 766.2 | 1.5 | 22.5 | ||||||||
| 949.9 - 956.9 | 7.0 | 67 | ||||||||
FM19-43D | 92 | (81) | 1078.2 - 1079.4 | 1.2 | 8.4 | |||||
FM19-44D | 172 | (86) | 728.9 - 730.3 | 1.4 | 7.1 | |||||
| 692.7 - 697.4 | 4.7 | 8.5 | ||||||||
FM19-45D | 128 | (81) | 701.8 - 715.7 | 13.9 | 11.7 | |||||
| 723.9 - 725.4 | 1.5 | 12 | ||||||||
| 841.6 - 867.2 | 25.6 | 80.9 | ||||||||
| 880.8 - 884.8 | 4.0 | 18.8 | ||||||||
| 888.8 - 890.3 | 1.5 | 8.5 | ||||||||
FM19-46D | 156 | (83) | 894.6 - 923.6 | 29.0 | 54.6 | |||||
| 761.1 - 764.3 | 3.2 | 8 | ||||||||
FM19-47D | 107 | (83) | 951.2 - 961.0 | 9.8 | 48.5 | |||||
FM19-48D | 50 | (86) | 857.7 - 860.7 | 3 | 16.8 | |||||
| 793.4 - 821.7 | 28.3 | 26.5 | ||||||||
FM19-49D5 | 303 | (81) | 828 - 829.5 | 1.5 | 5.1 | |||||
| 683.1 - 691.0 | 7.9 | 10.9 | ||||||||
| 694.0 - 697.1 | 3.1 | 13.2 | ||||||||
FM19-51D | 93 | (83) | 704.7 - 715.1 | 10.4 | 10.8 | |||||
| 696.7 - 698.1 | 1.4 | 5.3 | ||||||||
| 722.7 - 730.0 | 7.3 | 35.9 | ||||||||
| 753.2 - 758.5 | 5.3 | 134.6 | ||||||||
FM19-52D | 18 | (83) | 762.3 - 763.8 | 1.5 | 16.1 | |||||
FM19-53D | 149 | (74) | 739.1 - 742.1 | 3 | 14.1 | |||||
FM19-54D | 92 | (74) | 842.5-845.2 | 2.7 | 19.5 | |||||
| 707.0 - 714.0 | 7 | 47.6 | ||||||||
| 716.6 - 718.7 | 2.1 | 18.2 | ||||||||
FM19-55D | 23 | (84) | 786.1 - 791.6 | 5.5 | 53.6 | |||||
| 687.6 - 689.1 | 1.5 | 9.9 | ||||||||
| 696.8 - 698.3 | 1.5 | 13 | ||||||||
| 867.5 - 875.1 | 7.6 | 48.5 | ||||||||
FM19-56D | 109 | (85) | 881.2 - 882.6 | 1.4 | 6.9 | |||||
| 776.9 - 779.9 | 3 | 9.6 | ||||||||
FM19-58D | 200 | (87) | 793.1 - 803.8 | 10.7 | 38 | |||||
| 546.9 - 548.0 | 1.1 | 5.4 | ||||||||
FM19-59D | 39 | (77) | 566.3 - 586.4 | 20.1 | 16.4 | |||||
| 703.9 - 705.6 | 1.7 | 8.3 | ||||||||
| 719.6 - 724.5 | 4.9 | 10.2 | ||||||||
FM19-60D | 144 | (78) | 729.8 - 731.2 | 1.4 | 5.5 | |||||
| BARRICK THIRD QUARTER 2019 | 100 | MANAGEMENT’S DISCUSSION AND ANALYSIS |
| 723.6 - 725.7 | 2.1 | 9 | ||||||||
| 727.0 - 728.5 | 1.5 | 5.2 | ||||||||
| 788.8 - 810.1 | 21.3 | 35.8 | ||||||||
FM19-63D | 93 | (84) | 814.7 - 816.2 | 1.5 | 12.9 | |||||
| 1. | All intercepts calculated using a 5 g/t Au cutoff and are uncapped; minimum intercept width is 0.8 m; internal dilution is less than 20% total width. |
| 2. | Fourmile drill hole nomenclature: FM (Fourmile) followed by the year (19 for 2019). |
| 3. | True width of intercepts are uncertain at this stage. |
| 4. | Partial results received. |
| 5. | Hole terminated in mineralization. |
The drilling results for the Fourmile property contained in this press release have been prepared in accordance with National Instrument43-101 -Standards of Disclosure for Mineral Projects. All drill hole assay information has been manually reviewed and approved by staff geologists andre-checked by the project manager. Sample preparation and analyses are conducted by ALS Minerals, an independent laboratory. Industry accepted best practices for preparation and fire assaying procedures are utilized to determine gold content. Procedures are employed to ensure security of samples during their delivery from the drill rig to the laboratory. The quality assurance procedures, data verification and assay protocols used in connection with drilling and sampling on the Fourmile property conform to industry accepted quality control methods.
Veladero Significant Intercepts1
| Veladero Significant Intervals1 | ||||||||||||||||||
| Drill results from Q2 2019 | ||||||||||||||||||
| Including | ||||||||||||||||||
| Drill Hole2 | Type | Azimuth | Dip | Interval (m) | Width (m) | Au (g/t) | Interval (m) | Width (m) | Au (g/t) | |||||||||
| DDH-946B | DDH | 280 | (73) | 139.1 - 427.1 | 288.00 | 1.23 | 324 - 410 | 86.00 | 3.12 | |||||||||
0946 | RC | 270 | (75) | 87 - 169 | 82.00 | 1.06 | ||||||||||||
0944 | RC | 300 | (70) | 166 - 223 | 57.00 | 0.64 | ||||||||||||
| DDH-943 | DDH | 265 | (80) | 231 - 381 | 150.00 | 0.54 | ||||||||||||
| 1. | Significant intervals reported with intervals³ 15 m and cutoff³ 0.398 ppm Au. |
| 2. | All holes are located in the Cuatro Esquinas target. |
| 3. | Due to the nature of the mineralization - Drilled width approximates True Width |
The drilling results for the Veladero property contained in this report have been prepared in accordance with National Instrument43-101 –Standards of Disclosure for Mineral Projects. All drill hole assay information has been manually reviewed and approved by staff geologists andre-checked by the project manager. Sample preparation and analyses are conducted by ALS Minerals, an independent laboratory. Industry accepted best practices for preparation and fire assaying procedures are utilized to determine gold content. Procedures are employed to ensure security of samples. TheQA-QC procedures, data verification and assay protocols used in connection with drilling and sampling on the Veladero property conform to industry accepted quality control methods.
| 6 | See the Technical Report on the Cortez Joint Venture Operations, dated March 22, 2019, and filed on SEDAR at www.sedar.com and EDGAR at www.sec.gov on March 22, 2019. |
| 7 | See the Technical Report on the Turquoise Ridge mine, dated March 19, 2019, and filed on SEDAR at www.sedar.com and EDGAR at www.sec.gov on March 23, 2019. |
| 8 | See the Technical Report on the Pueblo Viejo mine, Sanchez Ramirez Province, Dominican Republic, dated March 19, 2018, and filed on SEDAR at www.sedar.com and EDGAR at www.sec.gov on March 23, 2018. |
| 9 | See the Technical Report on the Loulo-Gounkoto Gold Mine Complex, Mali, dated September 18, 2018, with an effective date of December 31, 2017, and filed on SEDAR at www.sedar.com and EDGAR at www.sec.gov on January 2, 2019. |
| 10 | See the Technical Report on the Kibali Gold Mine, Republic of Congo, dated September 18, 2018, with an effective date of December 31, 2017, and filed on SEDAR at www.sedar.com and EDGAR at www.sec.gov on January 2, 2019. |
| BARRICK THIRD QUARTER 2019 | 101 | MANAGEMENT’S DISCUSSION AND ANALYSIS |
Consolidated Statements of Income
| Barrick Gold Corporation (in millions of United States dollars, except per share data) (Unaudited) | Three months ended September 30, | Nine months ended September 30, | ||||||||||||||
| 2019 | 2018 | 2019 | 2018 | |||||||||||||
Revenue (notes 5 and 6) | $2,678 | $1,837 | $6,834 | $5,339 | ||||||||||||
Costs and expenses (income) | ||||||||||||||||
Cost of sales (notes 5 and 7) | 1,889 | 1,315 | 4,924 | 3,643 | ||||||||||||
General and administrative expenses | 68 | 71 | 181 | 212 | ||||||||||||
Exploration, evaluation and project expenses | 86 | 89 | 258 | 259 | ||||||||||||
Impairment (reversals) charges (notes 9B and 13) | (872 | ) | 431 | (857 | ) | 492 | ||||||||||
Loss on currency translation | 40 | 62 | 56 | 152 | ||||||||||||
Closed mine rehabilitation | 5 | (6 | ) | 46 | (6 | ) | ||||||||||
Income from equity investees (note 12) | (38 | ) | (19 | ) | (116 | ) | (45 | ) | ||||||||
Loss (gain) onnon-hedge derivatives | 1 | — | — | (3 | ) | |||||||||||
Other (income) expense (note 9A) | (1,852 | ) | 16 | (1,818 | ) | 55 | ||||||||||
Income (loss) before finance costs and income taxes | $3,351 | ($122 | ) | $4,160 | $580 | |||||||||||
Finance costs, net | (125 | ) | (159 | ) | (363 | ) | (428 | ) | ||||||||
Income (loss) before income taxes | $3,226 | ($281 | ) | $3,797 | $152 | |||||||||||
Income tax expense (note 10) | (791 | ) | (105 | ) | (999 | ) | (422 | ) | ||||||||
Net income (loss) | $2,435 | ($386 | ) | $2,798 | ($270 | ) | ||||||||||
Attributable to: | ||||||||||||||||
Equity holders of Barrick Gold Corporation | $2,277 | ($412 | ) | $2,582 | ($348 | ) | ||||||||||
Non-controlling interests | $158 | $26 | $216 | $78 | ||||||||||||
Earnings (loss) per share data attributable to the equity holders of Barrick Gold Corporation (note 8) | ||||||||||||||||
Net income (loss) | ||||||||||||||||
Basic | $1.30 | ($0.35 | ) | $1.47 | ($0.30 | ) | ||||||||||
Diluted | $1.30 | ($0.35 | ) | $1.47 | ($0.30 | ) | ||||||||||
The accompanying notes are an integral part of these condensed interim consolidated financial statements.
| BARRICK THIRD QUARTER 2019 | 102 | FINANCIAL STATEMENTS (UNAUDITED) |
Consolidated Statements of Comprehensive Income
| Barrick Gold Corporation (in millions of United States dollars) (Unaudited) | Three months ended September 30, | Nine months ended September 30, | ||||||||||||||
| 2019 | 2018 | 2019 | 2018 | |||||||||||||
Net income (loss) | $2,435 | ($386 | ) | $2,798 | ($270 | ) | ||||||||||
Other comprehensive (loss) income, net of taxes | ||||||||||||||||
Items that may be reclassified subsequently to profit or loss: | ||||||||||||||||
Unrealized gains (losses) on derivatives designated as cash flow hedges, net of tax $nil, ($1), $nil and ($7) | — | 5 | — | 15 | ||||||||||||
Realized (gains) losses on derivatives designated as cash flow hedges, net of tax $nil, $1, $nil and $1 | — | (1 | ) | — | (1 | ) | ||||||||||
Currency translation adjustments, net of tax $nil, $nil, $nil and $nil | (1 | ) | (6 | ) | (4 | ) | (4 | ) | ||||||||
Items that will not be reclassified to profit or loss: | ||||||||||||||||
Actuarial gain (loss) on post employment benefit obligations, net of tax $nil, $nil, $nil and $nil | — | — | — | 1 | ||||||||||||
Net unrealized change on equity investments, net of tax $nil, $nil, $nil and $nil | 53 | (4 | ) | 61 | (12 | ) | ||||||||||
Net realized change on equity investments, net of tax $nil, $nil, $nil and $nil | — | — | (1 | ) | — | |||||||||||
Total other comprehensive income (loss) | 52 | (6 | ) | 56 | (1 | ) | ||||||||||
Total comprehensive income (loss) | $2,487 | ($392 | ) | $2,854 | ($271 | ) | ||||||||||
Attributable to: | ||||||||||||||||
Equity holders of Barrick Gold Corporation | $2,329 | ($418 | ) | $2,638 | ($349 | ) | ||||||||||
Non-controlling interests | $158 | $26 | $216 | $78 | ||||||||||||
The accompanying notes are an integral part of these condensed interim consolidated financial statements.
| BARRICK THIRD QUARTER 2019 | 103 | FINANCIAL STATEMENTS (UNAUDITED) |
Consolidated Statements of Cash Flow
| Barrick Gold Corporation (in millions of United States dollars) (Unaudited) | Three months ended September 30, | Nine months ended September 30, | ||||||||||||||
| 2019 | 2018 | 2019 | 2018 | |||||||||||||
OPERATING ACTIVITIES | ||||||||||||||||
Net income (loss) | $2,435 | ($386 | ) | $2,798 | ($270 | ) | ||||||||||
Adjustments for the following items: | ||||||||||||||||
Depreciation | 559 | 363 | 1,460 | 1,016 | ||||||||||||
Finance costs | 129 | 163 | 381 | 440 | ||||||||||||
Impairment (reversals) charges (notes 9B and 13) | (872 | ) | 431 | (857 | ) | 492 | ||||||||||
Income tax expense (note 10) | 791 | 105 | 999 | 422 | ||||||||||||
Remeasurement of Turquoise Ridge to fair value | (1,886 | ) | — | (1,886 | ) | — | ||||||||||
Gain on sale ofnon-current assets | (15 | ) | (1 | ) | (27 | ) | (49 | ) | ||||||||
Loss on currency translation | 40 | 62 | 56 | 152 | ||||||||||||
Change in working capital (note 11) | 67 | 167 | (263 | ) | (69 | ) | ||||||||||
Other operating activities (note 11) | (126 | ) | (63 | ) | (112 | ) | (204 | ) | ||||||||
Operating cash flows before interest and income taxes | 1,122 | 841 | 2,549 | 1,930 | ||||||||||||
Interest paid | (31 | ) | (29 | ) | (196 | ) | (212 | ) | ||||||||
Income taxes paid | (87 | ) | (106 | ) | (395 | ) | (364 | ) | ||||||||
Net cash provided by operating activities | 1,004 | 706 | 1,958 | 1,354 | ||||||||||||
INVESTING ACTIVITIES | ||||||||||||||||
Property, plant and equipment | ||||||||||||||||
Capital expenditures (note 5) | (502 | ) | (387 | ) | (1,255 | ) | (1,026 | ) | ||||||||
Sales proceeds | 13 | 1 | 31 | 53 | ||||||||||||
Investment (purchases) proceeds | 3 | — | (4 | ) | (39 | ) | ||||||||||
Cash acquired in merger | — | — | 751 | — | ||||||||||||
Other investing activities (note 11) | 103 | — | 165 | (5 | ) | |||||||||||
Net cash used in investing activities | (383 | ) | (386 | ) | (312 | ) | (1,017 | ) | ||||||||
FINANCING ACTIVITIES | ||||||||||||||||
Lease repayments | (5 | ) | — | (23 | ) | — | ||||||||||
Debt repayments | (264 | ) | (649 | ) | (280 | ) | (680 | ) | ||||||||
Dividends | (67 | ) | (31 | ) | (461 | ) | (94 | ) | ||||||||
Funding fromnon-controlling interests | 102 | 5 | 116 | 17 | ||||||||||||
Disbursements tonon-controlling interests | (133 | ) | — | (161 | ) | (82 | ) | |||||||||
Other financing activities | (2 | ) | (29 | ) | (2 | ) | (29 | ) | ||||||||
Net cash used in financing activities | (369 | ) | (704 | ) | (811 | ) | (868 | ) | ||||||||
Effect of exchange rate changes on cash and equivalents | — | (4 | ) | (1 | ) | (6 | ) | |||||||||
Net increase (decrease) in cash and equivalents | 252 | (388 | ) | 834 | (537 | ) | ||||||||||
Cash and equivalents at the beginning of period | 2,153 | 2,085 | 1,571 | 2,234 | ||||||||||||
Cash and equivalents at the end of period | $2,405 | $1,697 | $2,405 | $1,697 | ||||||||||||
The accompanying notes are an integral part of these condensed interim consolidated financial statements.
| BARRICK THIRD QUARTER 2019 | 104 | FINANCIAL STATEMENTS (UNAUDITED) |
Consolidated Balance Sheets
| Barrick Gold Corporation (in millions of United States dollars) (Unaudited) | As at September 30, | As at December 31, | ||||||
| 2019 | 2018 | |||||||
ASSETS | ||||||||
Current assets | ||||||||
Cash and equivalents (note 14A) | $2,405 | $1,571 | ||||||
Accounts receivable | 311 | 248 | ||||||
Inventories | 2,265 | 1,852 | ||||||
Other current assets | 529 | 307 | ||||||
Total current assets | $5,510 | $3,978 | ||||||
Non-current assets | ||||||||
Equity in investees (note 12) | 4,474 | 1,234 | ||||||
Property, plant and equipment | 24,758 | 12,826 | ||||||
Goodwill | 4,798 | 1,176 | ||||||
Intangible assets | 227 | 227 | ||||||
Deferred income tax assets | 334 | 259 | ||||||
Non-current portion of inventory | 2,434 | 1,696 | ||||||
Other assets | 1,332 | 1,235 | ||||||
Total assets | $43,867 | $22,631 | ||||||
LIABILITIES AND EQUITY | ||||||||
Current liabilities | ||||||||
Accounts payable | $1,337 | $1,101 | ||||||
Debt (note 14B) | 66 | 43 | ||||||
Current income tax liabilities | 133 | 203 | ||||||
Other current liabilities | 308 | 321 | ||||||
Total current liabilities | $1,844 | $1,668 | ||||||
Non-current liabilities | ||||||||
Debt (note 14B) | 5,494 | 5,695 | ||||||
Provisions | 3,664 | 2,904 | ||||||
Deferred income tax liabilities | 2,692 | 1,236 | ||||||
Other liabilities | 1,773 | 1,743 | ||||||
Total liabilities | $15,467 | $13,246 | ||||||
Equity | ||||||||
Capital stock (note 16) | $29,228 | $20,883 | ||||||
Deficit | (11,020 | ) | (13,453 | ) | ||||
Accumulated other comprehensive loss | (102 | ) | (158 | ) | ||||
Other | 2,043 | 321 | ||||||
Total equity attributable to Barrick Gold Corporation shareholders | $20,149 | $7,593 | ||||||
Non-controlling interests | 8,251 | 1,792 | ||||||
Total equity | $28,400 | $9,385 | ||||||
Contingencies and commitments (notes 5 and 17) | ||||||||
Total liabilities and equity | $43,867 | $22,631 | ||||||
The accompanying notes are an integral part of these condensed interim consolidated financial statements.
| BARRICK THIRD QUARTER 2019 | 105 | FINANCIAL STATEMENTS (UNAUDITED) |
Consolidated Statements of Changes in Equity
| Barrick Gold Corporation | Attributable to equity holders of the company | |||||||||||||||||||||||||||||||
| (in millions of United States dollars) (Unaudited) | Common Shares (in thousands) | Capital stock | Retained deficit | Accumulated other comprehensive income (loss)1 | Other2 | Total equity attributable to shareholders | Non- controlling | Total equity | ||||||||||||||||||||||||
At January 1, 2019 | 1,167,847 | $20,883 | ($13,453 | ) | ($158 | ) | $321 | $7,593 | $1,792 | $9,385 | ||||||||||||||||||||||
Net income | — | — | 2,582 | — | — | 2,582 | 216 | 2,798 | ||||||||||||||||||||||||
Total other comprehensive income | — | — | — | 56 | — | 56 | — | 56 | ||||||||||||||||||||||||
Total comprehensive income | — | — | 2,582 | 56 | — | 2,638 | 216 | 2,854 | ||||||||||||||||||||||||
Transactions with owners | ||||||||||||||||||||||||||||||||
Dividends | — | — | (131 | ) | — | — | (131 | ) | — | (131 | ) | |||||||||||||||||||||
Merger with Randgold Resources Limited | 583,669 | 7,903 | — | — | — | 7,903 | 874 | 8,777 | ||||||||||||||||||||||||
Nevada Gold Mines JV with Newmont Goldcorp Corporation | — | — | — | — | 1,645 | 1,645 | 5,909 | 7,554 | ||||||||||||||||||||||||
Acquisition of 36.1% of Acacia Mining plc | 24,837 | 423 | — | — | 70 | 493 | (495 | ) | (2 | ) | ||||||||||||||||||||||
Issued on exercise of stock options | 130 | 1 | — | — | — | 1 | — | 1 | ||||||||||||||||||||||||
Funding fromnon-controlling interests | — | — | — | — | — | — | 116 | 116 | ||||||||||||||||||||||||
Other decrease innon-controlling interest | — | — | — | — | — | — | (161 | ) | (161 | ) | ||||||||||||||||||||||
Dividend reinvestment plan (note 16) | 1,299 | 18 | (18 | ) | — | — | — | — | — | |||||||||||||||||||||||
Share-based payments | — | — | — | — | 7 | 7 | — | 7 | ||||||||||||||||||||||||
Total transactions with owners | 609,935 | 8,345 | (149 | ) | — | 1,722 | 9,918 | 6,243 | 16,161 | |||||||||||||||||||||||
At September 30, 2019 | 1,777,782 | $29,228 | ($11,020 | ) | ($102 | ) | $2,043 | $20,149 | $8,251 | $28,400 | ||||||||||||||||||||||
At December 31, 2017 | 1,166,577 | $20,893 | ($11,759 | ) | ($169 | ) | $321 | $9,286 | $1,781 | $11,067 | ||||||||||||||||||||||
Impact of adopting IFRS 15 on January 1, 2018 | — | — | 64 | — | — | 64 | — | 64 | ||||||||||||||||||||||||
At January 1, 2018 (restated) | 1,166,577 | $20,893 | ($11,695 | ) | ($169 | ) | $321 | $9,350 | $1,781 | $11,131 | ||||||||||||||||||||||
Net (loss) income | — | — | (348 | ) | — | — | (348 | ) | 78 | (270 | ) | |||||||||||||||||||||
Total other comprehensive income (loss) | — | — | — | (1 | ) | — | (1 | ) | — | (1 | ) | |||||||||||||||||||||
Total comprehensive (loss) income | — | — | (348 | ) | (1 | ) | — | (349 | ) | 78 | (271 | ) | ||||||||||||||||||||
Transactions with owners | ||||||||||||||||||||||||||||||||
Dividends | — | — | (94 | ) | — | — | (94 | ) | — | (94 | ) | |||||||||||||||||||||
Issued on exercise of stock options | 20 | — | — | — | — | — | — | — | ||||||||||||||||||||||||
Funding fromnon-controlling interests | — | — | — | — | — | — | 17 | 17 | ||||||||||||||||||||||||
Other decrease innon-controlling interests | — | — | — | — | — | — | (97 | ) | (97 | ) | ||||||||||||||||||||||
Dividend reinvestment plan | 996 | 11 | (11 | ) | — | — | — | — | — | |||||||||||||||||||||||
Total transactions with owners | 1,016 | 11 | (105 | ) | — | — | (94 | ) | (80 | ) | (174 | ) | ||||||||||||||||||||
At September 30, 2018 | 1,167,593 | $20,904 | ($12,148 | ) | ($170 | ) | $321 | $8,907 | $1,779 | $10,686 | ||||||||||||||||||||||
| 1 | Includes cumulative translation losses at September 30, 2019: $87 million (September 30, 2018: $77 million). |
| 2 | Includes additionalpaid-in capital as at September 30, 2019: $1,998 million (December 31, 2018: $283 million; September 30, 2018: $283 million) and convertible borrowings - equity component as at September 30, 2019: $38 million (December 31, 2018: $38 million; September 30, 2018: $38 million). |
The accompanying notes are an integral part of these condensed interim consolidated financial statements.
| BARRICK THIRD QUARTER 2019 | 106 | FINANCIAL STATEMENTS (UNAUDITED) |
NOTES TO CONSOLIDATED
FINANCIAL STATEMENTS
Barrick Gold Corporation.Tabular dollar amounts in millions of United States dollars, unless otherwise shown.
1 > CORPORATE INFORMATION
Barrick Gold Corporation (“Barrick”, “we” or the “Company”) is a corporation governed by theBusiness Corporations Act (British Columbia). The Company’s head office is located at Brookfield Place, TD Canada Trust Tower, 161 Bay Street, Suite 3700, Toronto, Ontario, M5J 2S1. The Company’s registered office is 925 West Georgia Street, Suite 1600, Vancouver, British Columbia, V6C 3L2. We are principally engaged in the production and sale of gold and copper, as well as related activities such as exploration and mine development. We sell our gold and copper into the world market.
We have ownership interests in producing gold mines that are located in Argentina, Australia, Canada, Côte d’Ivoire, Democratic Republic of Congo, Dominican Republic, Mali, Papua New Guinea, Peru, Tanzania and the United States. We have ownership interests in producing copper mines in Chile, Saudi Arabia and Zambia. We also have various projects located throughout the Americas and Africa. Refer to note 4 for information on acquisitions and divestments occurring during this year.
2 > SIGNIFICANT ACCOUNTING POLICIES
A) Statement of Compliance
These condensed interim consolidated financial statements have been prepared in accordance with International Accounting Standard 34 Interim Financial Reporting (“IAS 34”) as issued by the International Accounting Standards Board (“IASB”). These interim financial statements should be read in conjunction with Barrick’s most recently issued Annual Report which includes information necessary or useful to understanding the Company’s business and financial statement presentation. In particular, the Company’s significant accounting policies were presented in Note 2 of the Annual Consolidated Financial Statements for the year ended December 31, 2018 (“2018 Annual Financial Statements”), and have been consistently applied in the preparation of these interim financial statements, except as otherwise noted in Note 2B. These condensed interim consolidated financial statements were authorized for issuance by the Board of Directors on November 5, 2019.
B) New Accounting Standards Effective in 2019
Impact of Adoption of IFRS 16 Leases
We have adopted the requirements of IFRS 16 Leases (“IFRS 16”) as of January 1, 2019. IFRS 16 specifies how to recognize, measure, present and disclose leases. The standard provides a single lessee accounting model, requiring lessees to recognize assets and liabilities for all major leases where a lessee has the right to control the use of an identified asset. We elected to apply IFRS 16 using the modified retrospective approach and therefore the comparative information has not been restated and continues to be reported under IAS 17 Leases and IFRIC 4: Determining Whether an Arrangement Contains a Lease. The reclassifications and the adjustments arising from the new
leasing rules are therefore recognized on January 1, 2019. The details of accounting policy changes and the quantitative impact of these changes are described below.
Accounting policy changes
Through 2018, assets acquired via a finance lease were recorded as an asset with a corresponding liability at an amount equal to the lower of the fair value of the leased property and the present value of the minimum lease payments. Each lease payment was allocated between the liability and finance cost using the effective interest method, whereby a constant rate of interest expense is recognized on the balance of the liability outstanding. The interest element of the lease was charged to the consolidated statements of income as a finance cost. Property, plant and equipment assets acquired under finance leases were depreciated over the shorter of the useful life of the asset and the lease term. All other leases were classified as operating leases. Operating lease payments were recognized as an operating cost in the consolidated statements of income on a straight-line basis over the lease term.
From January 1, 2019, leases are recognized as aright-of-use asset and a corresponding liability at the date at which the leased asset is available for use by the Company. Each lease payment is allocated between the liability and finance cost. The finance cost is charged to profit or loss over the lease period so as to produce a constant periodic rate of interest on the remaining balance of the liability for each period. Theright-of-use asset is depreciated over the shorter of the asset’s useful life and the lease term on a straight-line basis.
Assets and liabilities arising from a lease are initially measured on a present value basis. Lease liabilities include the net present value of the following lease payments:
| • | fixed payments (includingin-substance fixed payments), less any lease incentives receivable; |
| • | variable lease payments that are based on an index or a rate; |
| • | amounts expected to be payable by the lessee under residual value guarantees; |
| • | the exercise price of a purchase option if the lessee is reasonably certain to exercise that option; and |
| • | payments of penalties for terminating the lease, if the lease term reflects the lessee exercising that option. |
The lease payments are discounted using the interest rate implicit in the lease. If that rate cannot be determined, the lessee’s incremental borrowing rate is used, being the rate that the lessee would have to pay to borrow the funds necessary to obtain an asset of similar value in a similar economic environment with similar terms and conditions.
Right-of-use assets are measured at cost comprising the following:
| • | the amount of the initial measurement of lease liability; |
| • | any lease payments made at or before the commencement date less any lease incentives received; |
| • | any initial direct costs; and |
| • | restoration costs. |
Payments associated with short-term leases and leases oflow-value assets are recognized on a straight-line basis as an expense in profit or loss. Short-term leases are leases with
| BARRICK THIRD QUARTER 2019 | 107 | NOTES TO FINANCIAL STATEMENTS (UNAUDITED) |
a lease term of 12 months or less.Low-value assets are generally comprised ofIT-equipment and small items of office furniture.
Impact on consolidated financial statements
On adoption of IFRS 16, we recognized lease liabilities in relation to leases which had previously been classified as operating leases.These liabilities were measured at the present value of the remaining lease payments, discounted using the weighted average incremental borrowing rate as of January 1, 2019 of 5.83%.
For leases previously classified as finance leases the entity recognized the carrying amount of the lease asset and lease liability immediately before transition as the carrying amount of theright-of-use asset and the lease liability at the date of initial application. The measurement principles of IFRS 16 are applied after the date of initial application.
The following table reconciles the Company’s operating lease obligations as at December 31, 2018 as previously disclosed in the Company’s 2018 Annual Financial Statements, to the lease obligations recognized on initial application of IFRS 16 at January 1, 2019:
Barrick operating lease commitments disclosed as at December 31, 2018 | $ | 167 | ||
Add: embedded service contracts not previously assessed as a lease | 38 | |||
(Less): contracts reassessed as service agreements | (130 | ) | ||
(Less): short-term leases recognized on a straight-line basis as expense | (6 | ) | ||
(Less):low-value leases recognized on a straight-line basis as expense | (1 | ) | ||
(Less): discounting using the lessee’s incremental borrowing rate of at January 1, 2019 | (4 | ) | ||
Discounted leases recognized as at January 1, 2019 | $ | 64 | ||
Add: finance lease liabilities recognized as at December 31, 2018 | 19 | |||
Add: leases acquired as part of the merger with Randgold on January 1, 2019 | 28 | |||
Discounted lease liability recognized as at January 1, 2019 | $ | 111 | ||
Of which are: | ||||
Current lease liabilities | 37 | |||
Non-current lease liabilities | $ | 74 | ||
The recognizedright-of-use assets relate to the following types of assets:
September 30, 2019 | January 1, 2019 | |||||||
Buildings, Plant & Equipment | $ | 80 | $ | 69 | ||||
Underground mobile equipment | 8 | 7 | ||||||
Light vehicles and other mobile equipment | 6 | 9 | ||||||
Totalright-of-use assets | $ | 94 | $ | 85 | ||||
Right-of use assets were measured at the amount equal to the lease liability, except for onerous contracts.
The change in accounting policy affected the following items in the balance sheet on January 1, 2019:
| • | property, plant and equipment - increase by $85 million |
| • | deferred income tax assets - $nil. |
| • | debt - increase by $92 million |
There was no net impact on deficit on January 1, 2019.
Consolidated net income decreased by $nil and $1 million, respectively, for the three and nine months ended September 30, 2019 as a result of the adoption of IFRS 16.
Practical expedients applied
In applying IFRS 16 for the first time, we have used the following practical expedients permitted by the standard:
| • | the accounting for operating leases with a remaining lease term of less than 12 months as at January 1, 2019 as short-term leases; |
| • | the exclusion of initial direct costs for the measurement of theright-of-use asset at the date of initial application; |
| • | the adjustment of theright-of-use assets at the date of initial application by the amount of any provision for onerous contracts recognized immediately before the date of initial application; and |
| • | to not separatenon-lease components from lease components, and instead account for each lease component and any associatednon-lease components as a single lease component. |
3 > SIGNIFICANT JUDGMENTS, ESTIMATES, ASSUMPTIONS AND RISKS
The judgments, estimates, assumptions and risks discussed here reflect updates from the 2018 Annual Financial Statements. For judgments, estimates, assumptions and risks related to other areas not discussed in these interim consolidated financial statements, please refer to Notes 3 and 28 of the 2018 Annual Financial Statements.
A) Provision for Environmental Rehabilitation (“PER”)
Provisions are updated each reporting period for changes to expected cash flows and for the effect of changes in the discount rate and foreign exchange rate, and the change in estimate is added or deducted from the related asset and depreciated over the expected economic life of the operation to which it relates. We recorded a net increase of $481 million (2018: $66 million net decrease) to the PER at our minesites for the three months ended September 30, 2019 and a net increase of $752 million (2018: $148 million net decrease) for the nine months ended September 30, 2019 primarily due to the contribution of Newmont Goldcorp Corporation’s assets to Nevada Gold Mines LLC on July 1, 2019, the acquisition of Randgold Resources Limited (“Randgold”) on January 1, 2019 and a decrease in the discount rate.
Adjustments to the estimated amount and timing of future closure and rehabilitation cash flows are a normal occurrence in light of the significant judgments and estimates involved. Rehabilitation provisions are adjusted as a result of changes in estimates and assumptions and are accounted for prospectively. In the fourth quarter of each year, our life of mine plans are updated and that typically results in an update to the rehabilitation provision.
| BARRICK THIRD QUARTER 2019 | 108 | NOTES TO FINANCIAL STATEMENTS (UNAUDITED) |
With respect to our U.S. properties, under the Comprehensive Environmental Response, Compensation, and Liability Act of 1980 (“CERCLA”) and its state law equivalents, present or past owners of a property may be held jointly and severally liable for cleanup costs or forced to undertake remedial actions in response to unpermitted releases of hazardous substances at such property, in addition to, among other potential consequences, potential liability to governmental entities for the cost of damages to natural resources, which may be substantial. These subject properties are referred to as “superfund” sites. In addition to properties that have previously been designated as such, there is a chance that our current or legacy operations not currently designated as superfund sites in the U.S. could also be so designated as a superfund site in the future, exposing Barrick to potential further liability under CERCLA. The U.S. Environmental Protection Agency recently announced it is considering listing on the CERCLA National Priorities List a 322 square mile site in the San Mateo basin in New Mexico (“San Mateo Site”) due to alleged surface and ground water contamination from past uranium mining. The San Mateo Site includes legacy operations of our wholly owned subsidiary Homestake Mining Company of California.
B) Pascua-Lama
The Pascua-Lama project received $433 million as at September 30, 2019 (December 31, 2018: $443 million) in value added tax (“VAT”) refunds in Chile relating to the development of the Chilean side of the project. Under the current arrangement this amount plus interest, calculated from the date of receipt by Barrick, of up to potentially $371 million (December 31, 2018: $340 million) must be repaid if the project does not evidence exports for an amount of $3,538 million within a term that expires on December 31, 2026. The terms of the current VAT arrangement in Chile are applicable to either an open pit or an underground mine design. In addition, we have recorded $74 million in VAT recoverable in Argentina as at September 30, 2019 (December 31, 2018: $112 million) relating to the development of the Argentine side of the project. These amounts may not be recoverable if the project does not enter into production and are subject to foreign currency risk as the amounts are recoverable in Argentine pesos.
C) Contingencies
Contingencies can be either possible assets or possible liabilities arising from past events which, by their nature, will be resolved only when one or more future events, not wholly within our control, occur or fail to occur. The assessment of such contingencies inherently involves the exercise of significant judgment and estimates of the outcome of future events. Refer to note 17 for further details on contingencies.
D) Zambia Tax Matters
The mining taxes assessed to the Lumwana Mine have contradicted the Development Agreement that was finalized between Lumwana Mining Company Limited (“LMC”) and the Government of Zambia on December 16, 2005. In 2015, the Company began to take steps to preserve its rights under the Development Agreement and started to engage in formal discussions with the government to redress historical tax issues relating to the Development Agreement. On October 3, 2018, a deed of settlement was signed by the Government of Zambia and LMC. The deed provides that, within 30 days of the deed, LMC shall file tax returns for 2012 through 2017,
and the government shall have the right to conduct and complete an audit of the returns within 60 days of the deed. LMC has filed the tax returns for 2012 through 2017 and the audit of these tax returns by the Zambian tax authority is expected to be completed in the next three months.
E) Business Combinations
Business combinations are accounted for using the acquisition method of accounting. The determination of fair value often requires management to make estimates and assumptions with respect to future production levels, operating, capital and closure costs in our LOM plans, future metal prices, foreign exchange rates, Net Asset Value (“NAV”) multiples, value of reserves outside LOM plans in relation to the assumptions related to comparable entities and the market values per ounce and per pound and discount rates. The excess of the purchase price over the estimated fair value of the net assets acquired is then assigned to goodwill. Refer to note 4 for further details on acquisitions.
4 > ACQUISITIONS AND DIVESTITURES
A) Acacia Mining plc
On September 17, 2019, Barrick acquired all of the shares in Acacia Mining plc (“Acacia”) that we did not already own (36.1%) through ashare-for-share exchange of 0.168 Barrick shares and any Acacia Exploration Special Dividends for each ordinary share of Acacia. The Acacia Exploration Special Dividends and any deferred cash consideration dividends (if applicable) will be paid as a consequence of a sales process to realize value from the sale of certain Acacia exploration properties to be undertaken during the two year period following closing. This transaction resulted in the issuance of 24,836,670 Barrick common shares or approximately 1% of Barrick’s share capital.
The difference between the carrying value of thenon-controlling interest and the September 16, 2019 closing price of Barrick’s common shares issued was recorded in equity in the third quarter of 2019 in the amount of $70 million.
Notwithstanding the completion of the Acacia transaction on September 17, 2019, we consolidated our interest in Acacia and recorded anon-controlling interest of 36.1% in the income statement for the entirety of the third quarter of 2019 as a matter of convenience. As at September 30, 2019, we derecognized thenon-controlling interest on the balance sheet related to our former 63.9% ownership of Acacia to reflect our current 100% interest. The former Acacia mine sites (Bulyanhulu, North Mara and Buzwagi) will now be referred to as Tanzania in our financial statements.
On October 20, 2019, Barrick announced that it had reached an agreement with the Government of Tanzania (“GoT”) to settle all disputes between the GoT and the mining companies formerly operated by Acacia but now managed by Barrick. The final agreements have been submitted to the Tanzanian Attorney General for review and legalization. As part of the agreement, the GoT will acquire a free carried shareholding of 16% in each of the mines. The accounting for the agreement will take place until the GoT’s 16% free-carried interest is made effective, which is expected in the fourth quarter. Refer to note 17 for further details on the agreement and impact on outstanding contingencies.
| BARRICK THIRD QUARTER 2019 | 109 | NOTES TO FINANCIAL STATEMENTS (UNAUDITED) |
B) Nevada Joint Venture
On March 10, 2019, we entered into an implementation agreement with Newmont Mining Corporation, now Newmont Goldcorp Corporation, (“Newmont Goldcorp”) to create a joint venture combining our respective mining operations, assets, reserves and talent in Nevada, USA. This includes Barrick’s Cortez, Goldstrike, Turquoise Ridge and Goldrush properties and Newmont’s Carlin, Twin Creeks, Phoenix, Long Canyon and Lone Tree properties. Barrick is the operator of the joint venture and owns 61.5%, with Newmont Goldcorp owning the remaining 38.5% of the joint venture. On July 1, 2019, the transaction concluded establishing Nevada Gold Mines LLC (“Nevada Gold Mines”). Barrick, as the majority joint venture partner, has the right to appoint a majority of the board members and can therefore control decisions requiring majority approval including, but not limited to, LOM plans, budgets and capital projects. Therefore, we have determined that Barrick controls Nevada Gold Mines and began consolidating the operating results, cash flows and net assets from July 1, 2019 with a 38.5%non-controlling interest.
We have determined that the transaction to acquire the Newmont Goldcorp mines represents a business combination with Barrick identified as the acquirer. We have undertaken a purchase price exercise to determine the fair value of the Newmont Goldcorp mines acquired and the fair value of thenon-controlling interest of the Barrick mines given up as consideration. The tables below present the preliminary allocation of the purchase price to the assets and liabilities acquired. This allocation is preliminary as we have not had sufficient time to complete the final allocation of values within Nevada Gold Mines. We expect to complete this process in the fourth quarter of 2019. The $1,645 million difference between the carrying value and the fair value of thenon-controlling interest in the Barrick mines given up was recorded in equity in the third quarter of 2019.
| millions | ||||
Fair value ofnon-controlling interest of Barrick mines given up | $ | 3,897 | ||
Preliminary fair value allocation of Newmont Goldcorp mines acquired |
| |||
Current assets | $ | 172 | ||
Inventory | 970 | |||
Property, plant and equipment | 3,511 | |||
Goodwill | 2,520 | |||
Total assets | $ | 7,173 | ||
Current liabilities | $ | 119 | ||
Deferred income tax liabilities | 268 | |||
Provisions | 449 | |||
Total liabilities | $ | 836 | ||
Non-controlling interests | 2,440 | |||
Net assets acquired | $ | 3,897 | ||
The Barrick mines in which we held 100% prior to the creation of Nevada Gold Mines (Cortez, Goldstrike and Goldrush) will continue to be accounted for at historical cost and continue to be consolidated with anon-controlling interest in these mines recorded as of July 1, 2019. Prior to July 1, 2019, our 75% interest in the Turquoise Ridge mine was accounted for
as a joint operation and following its contribution to Nevada Gold Mines it has been consolidated with anon-controlling interest. As a result, our previously held 75% interest was remeasured to fair value and a gain of $1.9 billion was recognized in the third quarter of 2019.
We primarily used a discounted cash flow model (being the net present value of expected future cash flows) to determine the fair value of the mining interests and used a replacement cost approach in determining the fair value of buildings, plant and equipment. Expected future cash flows are based on estimates of future gold prices inclusive of a $1,300 gold price and projected future revenues, estimated quantities of ore reserves and mineral resources, including expected conversions of resources to reserves, expected future production costs and capital expenditures based on the life of mine plans for the mines as at the acquisition date.
Goodwill arose on the acquisition principally because of the following factors: 1) it combines high-quality gold reserves in one of the world’s most prolific gold districts, positioning the Company for sustainable growth; 2) the ability to optimize ore sources and production schedules across the joint venture; and 3) the recognition of a deferred tax liability for the difference between the assigned values and the tax bases of assets acquired and liabilities assumed at amounts that do not reflect fair value. The goodwill is not deductible for income tax purposes.
Since July 1, 2019, the Newmont Goldcorp mines acquired contributed revenue of $550 million and net income of $109 million for the three months ended September 30, 2019.
Acquisition related costs of approximately $26 million were expensed in the three and nine month periods ended September 30, 2019 and were presented as part of corporate development costs in exploration, evaluation & project expense.
C) Randgold Resources Limited Merger
On January 1, 2019, we acquired 100% of the issued and outstanding shares of Randgold Resources Limited (the “Merger”). Each Randgold shareholder received 6.1280 common shares of Barrick for each Randgold share, which resulted in the issuance of 583,669,178 Barrick common shares. After this share issuance, Barrick shareholders owned 66.7%, while former Randgold shareholders owned 33.3%, of the shares of the combined company. We have determined that this transaction represents a business combination with Barrick identified as the acquirer. Based on the December 31, 2018 closing share price of Barrick’s common shares, the total consideration of the acquisition was $7.9 billion. We began consolidating the operating results, cash flows and net assets of Randgold from January 1, 2019.
Randgold was a publicly traded mining company with ownership interests in the following gold mines: Kibali in the Democratic Republic of Congo; Tongon in Côte d’Ivoire; Loulo-Gounkoto and Morila in Mali; and the Massawa project in Senegal. The following table includes the joint arrangements and entities other than 100% owned subsidiaries.
| BARRICK THIRD QUARTER 2019 | 110 | NOTES TO FINANCIAL STATEMENTS (UNAUDITED) |
| Place of business | Entity type | Economic interest1 | Method | |||||
Loulo | Mali | Subsidiary | 80% | Consolidation | ||||
Gounkoto | Mali | Subsidiary | 80% | Consolidation | ||||
Tongon | Côte d’Ivoire | Subsidiary | 89.7% | Consolidation | ||||
Kibali | Democratic Republic of Congo | JV | 45% | Equity Method | ||||
Morila | Mali | JV | 40% | Equity Method | ||||
| 1 | Unless otherwise noted, all of our joint arrangements are funded by contributions made by the parties sharing joint control in proportion to their economic interest. |
The table below presents the purchase cost and our preliminary allocation of the purchase price to the assets acquired and liabilities assumed. This allocation is preliminary as we have not had sufficient time to complete the valuation process. We have made minor adjustments in the third quarter and there may be further adjustments to the estimated fair values as the valuation work is finalized, which will be completed in the fourth quarter of 2019.
| millions | ||||
Purchase Cost | ||||
Fair value of equity shares issued | $ | 7,903 | ||
Fair value of restricted shares issued | 6 | |||
Fair value of consideration | $ | 7,909 | ||
Preliminary Fair Value at Acquisition |
| |||
Cash | $ | 751 | ||
Other current assets | 323 | |||
Equity in investees | 3,226 | |||
Property, plant and equipment | 3,903 | |||
Other assets | 230 | |||
Goodwill | 1,630 | |||
Total assets | $ | 10,063 | ||
Current liabilities | $ | 490 | ||
Deferred income tax liabilities | 704 | |||
Provisions | 55 | |||
Debt1 | 31 | |||
Total liabilities | $ | 1,280 | ||
Non-controlling interests | 874 | |||
Net assets | $ | 7,909 | ||
| 1 | Debt mainly relates to leases as a result of adopting IFRS16. |
In accordance with the acquisition method of accounting, the acquisition cost has been allocated to the underlying assets acquired and liabilities assumed, based primarily upon their estimated fair values at the date of acquisition. We primarily used a discounted cash flow model (being the net present value of expected future cash flows) to determine the fair value of the mining interests and used a replacement cost approach in determining the fair value of buildings, plant and equipment. Expected future cash flows are based on estimates of future gold prices and projected future revenues, estimated quantities of ore reserves and mineral resources, including expected conversions of resources to reserves, expected future production costs and capital expenditures based on the life of mine plans as at the acquisition date. The excess of acquisition cost over the net identifiable assets acquired represents goodwill.
Goodwill arose on the acquisition principally because of the following factors: 1) it significantly strengthened Barrick’s position in the industry relative to high-quality gold reserves in many of the world’s most prolific gold districts, positioning the Company for sustainable growth; 2) it included the acquisition of a proven management team, with a shared vision and commitment to excellence, and a powerful financial base that will support sustainable investment in growth; and 3) the recognition of a deferred tax liability for the difference between the assigned values and the tax bases of assets acquired and liabilities assumed at amounts that do not reflect fair value. The goodwill is not deductible for income tax purposes.
The fair value of accounts receivable is $193 million, which is equivalent to the contractual amount.
Prior to the Merger, Randgold had received various tax claims from the State of Mali in respect of its Mali operations, which totaled $267.7 million as at January 1, 2019. The total amount of the various tax claims, not including advances made in good faith to date, stood at $275 million at the end of the third quarter of 2019. The Company has a provision of $60 million recorded for the estimated final amount to settle the various tax claims. Refer to note 17 for further details.
Since it has been consolidated from January 1, 2019, Randgold contributed revenue of $397 million and $1,025 million, respectively, for the three and nine months ended September 30, 2019 and net income of $67 million and $127 million, respectively, for the three and nine months ended September 30, 2019.
Acquisition related costs of approximately $37 million were expensed in the prior year and were presented as part of corporate development costs in exploration, evaluation & project expense.
| BARRICK THIRD QUARTER 2019 | 111 | NOTES TO FINANCIAL STATEMENTS (UNAUDITED) |
5 > SEGMENT INFORMATION
Starting in the first quarter of 2019, management reviews the operating results and assesses performance of our operations in Nevada at an individual minesite level; therefore our Cortez and Goldstrike minesites, previously presented as Barrick Nevada, have been presented separately. Prior period figures have been restated to reflect this disaggregation. Barrick’s business is organized into seventeen minesites, one grouping of three minesites and two projects. Barrick’s Chief Operating Decision Maker (“CODM”), reviews the operating results, assesses performance and makes capital allocation decisions at the minesite, Company and/or project level. Upon completion of the Merger, Mark Bristow, as President and Chief Executive Officer, assumed this role. Each individual minesite and the Pascua-Lama project, with the exception of the Acacia mines (now called Barrick TZ Limited), are operating segments for financial reporting purposes. Following the merger with Randgold, were-evaluated our reportable operating segments and no longer report on our interests in the followingnon-core properties: Lagunas Norte and Pascua-Lama. Our presentation of our reportable operating segments consists of seven gold mines (Carlin, Cortez, Turquoise Ridge, Pueblo Viejo, Loulo-Gounkoto, Kibali and Veladero) and Tanzania, a grouping of three operating mines formerly held in Acacia. The remaining operating segments, including our remaining gold mines, copper mines and projects, have been grouped into an “other” category and will not be reported on individually. Segment performance is evaluated based on a number of measures including operating income before tax, production levels and unit production costs. Certain costs are managed on a consolidated basis and are therefore not reflected in segment income.
Consolidated Statement of Income Information
| Cost of Sales | ||||||||||||||||||||||||
For the three months ended September 30, 2019 | Revenue | Direct mining, royalties and community relations | Depreciation | Exploration, evaluation and project expenses | Other expenses (income)1 | Segment income (loss) | ||||||||||||||||||
Carlin2,5 | $652 | $344 | $101 | $6 | $5 | $196 | ||||||||||||||||||
Cortez2 | 300 | 117 | 53 | 2 | 3 | 125 | ||||||||||||||||||
Turquoise Ridge2,6 | 231 | 98 | 70 | 2 | — | 61 | ||||||||||||||||||
Pueblo Viejo2 | 353 | 133 | 48 | 4 | (3 | ) | 171 | |||||||||||||||||
Loulo-Gounkoto2 | 287 | 123 | 76 | 3 | 5 | 80 | ||||||||||||||||||
Kibali | 133 | 50 | 57 | 1 | — | 25 | ||||||||||||||||||
Veladero | 89 | 47 | 25 | 1 | 2 | 14 | ||||||||||||||||||
Tanzania2,7 | 140 | 74 | 24 | — | 42 | — | ||||||||||||||||||
Other Mines2,3,4 | 626 | 388 | 151 | 7 | 2 | 78 | ||||||||||||||||||
| Reportable segment income | $2,811 | $1,374 | $605 | $26 | $56 | $750 | ||||||||||||||||||
| Share of equity investees | (133 | ) | (50 | ) | (57 | ) | (1 | ) | — | (25 | ) | |||||||||||||
| Segment income | $2,678 | $1,324 | $548 | $25 | $56 | $725 | ||||||||||||||||||
Consolidated Statement of Income Information
|
| |||||||||||||||||||||||
| Cost of Sales | ||||||||||||||||||||||||
For the three months ended September 30, 2018 | Revenue | Direct mining, royalties and community relations | Depreciation | Exploration, evaluation and project expenses | Other expenses (income)1 | Segment income (loss) | ||||||||||||||||||
Carlin2,5 | $294 | $177 | $73 | $6 | ($4 | ) | $42 | |||||||||||||||||
Cortez2 | 432 | 122 | 102 | 3 | 6 | 199 | ||||||||||||||||||
Turquoise Ridge2,6 | 90 | 53 | 7 | — | — | 30 | ||||||||||||||||||
Pueblo Viejo2 | 324 | 148 | 48 | 7 | (1 | ) | 122 | |||||||||||||||||
Loulo-Gounkoto2 | — | — | — | — | — | — | ||||||||||||||||||
Kibali | — | — | — | — | — | — | ||||||||||||||||||
Veladero | 59 | 31 | 24 | — | (2 | ) | 6 | |||||||||||||||||
Tanzania2,7 | 166 | 95 | 19 | — | 17 | 35 | ||||||||||||||||||
Other Mines2,3,4 | 472 | 327 | 81 | 3 | 7 | 54 | ||||||||||||||||||
| Reportable segment income | $1,837 | $953 | $354 | $19 | $23 | $488 | ||||||||||||||||||
| Share of equity investees | — | — | — | — | — | — | ||||||||||||||||||
| Segment income | $1,837 | $953 | $354 | $19 | $23 | $488 | ||||||||||||||||||
| BARRICK THIRD QUARTER 2019 | 112 | NOTES TO FINANCIAL STATEMENTS (UNAUDITED) |
Consolidated Statement of Income Information
| Cost of Sales | ||||||||||||||||||||||||
For the nine months ended September 30, 2019 | Revenue | Direct mining, royalties and community relations | Depreciation | Exploration, evaluation and project expenses | Other expenses (income)1 | Segment income (loss) | ||||||||||||||||||
Carlin2,5 | $1,198 | $654 | $220 | $10 | $2 | $312 | ||||||||||||||||||
Cortez2 | 1,007 | 367 | 182 | 6 | 14 | 438 | ||||||||||||||||||
Turquoise Ridge2,6 | 441 | 185 | 85 | 3 | — | 168 | ||||||||||||||||||
Pueblo Viejo2 | 993 | 391 | 141 | 10 | (1 | ) | 452 | |||||||||||||||||
Loulo-Gounkoto2 | 740 | 343 | 222 | 7 | 11 | 157 | ||||||||||||||||||
Kibali | 375 | 153 | 144 | 1 | (1 | ) | 78 | |||||||||||||||||
Veladero | 280 | 155 | 86 | 2 | 1 | 36 | ||||||||||||||||||
Tanzania2,7 | 467 | 263 | 84 | — | 83 | 37 | ||||||||||||||||||
Other Mines2,3,4 | 1,708 | 1,101 | 412 | 15 | 21 | 159 | ||||||||||||||||||
| Reportable segment income | $7,209 | $3,612 | $1,576 | $54 | $130 | $1,837 | ||||||||||||||||||
| Share of equity investees | (375 | ) | (153 | ) | (144 | ) | (1 | ) | 1 | (78 | ) | |||||||||||||
| Segment income | $6,834 | $3,459 | $1,432 | $53 | $131 | $1,759 | ||||||||||||||||||
Consolidated Statement of Income Information
|
| |||||||||||||||||||||||
| Cost of Sales | ||||||||||||||||||||||||
For the nine months ended September 30, 2018 | Revenue | Direct mining, royalties and community relations | Depreciation | Exploration, evaluation and project expenses | Other expenses (income)1 | Segment income (loss) | ||||||||||||||||||
Carlin2,5 | $759 | $459 | $188 | $11 | ($3 | ) | $104 | |||||||||||||||||
Cortez2 | 1,166 | 321 | 274 | 8 | 13 | 550 | ||||||||||||||||||
Turquoise Ridge2,6 | 249 | 131 | 21 | — | — | 97 | ||||||||||||||||||
Pueblo Viejo2 | 977 | 408 | 132 | 15 | — | 422 | ||||||||||||||||||
Loulo-Gounkoto2 | — | — | — | — | — | — | ||||||||||||||||||
Kibali | — | — | — | — | — | — | ||||||||||||||||||
Veladero | 271 | 123 | 89 | 2 | (1 | ) | 58 | |||||||||||||||||
Tanzania2,7 | 499 | 276 | 66 | — | 18 | 139 | ||||||||||||||||||
Other Mines2,3,4 | 1,418 | 906 | 221 | 11 | 33 | 247 | ||||||||||||||||||
| Reportable segment income | $5,339 | $2,624 | $991 | $47 | $60 | $1,617 | ||||||||||||||||||
| Share of equity investees | — | — | — | — | — | — | ||||||||||||||||||
| Segment income | $5,339 | $2,624 | $991 | $47 | $60 | $1,617 | ||||||||||||||||||
| 1 | Includes accretion expense, which is included within finance costs in the consolidated statement of income. For the three months ended September 30, 2019, accretion expense was $13 million (2018: $14 million) and for the nine months ended September 30, 2019, accretion expense was $39 million (2018: $39 million). |
| 2 | Includesnon-controlling interest portion of revenues, cost of sales and segment income for the three months ended September 30, 2019 for Nevada Gold Mines $504 million, $348 million, $145 million (2018: $nil, $nil, $nil), Pueblo Viejo $140 million, $72 million, $67 million (2018: $131 million, $79 million, $48 million), Loulo-Gounkoto $57 million, $40 million, $16 million (2018: $nil, $nil, $nil), Tanzania $51 million, $35 million, $1 million (2018: $60 million, $42 million, $13 million), and Tongon $11 million, $11 million, $nil (2018: $nil, $nil, $nil) and for the nine months ended September 30, 2019 for Nevada Gold Mines $504 million, $348 million, $145 million (2018: $nil, $nil, $nil), Pueblo Viejo $390 million, $211 million, $175 million (2018: $388 million, $215 million, $166 million), Loulo-Gounkoto $148 million, $113 million, $32 million (2018: $nil, $nil, $nil), Tanzania $169 million, $125 million, $14 million (2018: $180 million, $124 million, $50 million) and Tongon $29 million, $32 million, $(3) million (2018: $nil, $nil, $nil). |
| 3 | Includes cost of sales of Pierina for the three months ended September 30, 2019 of $28 million (2018: $22 million) and for the nine months ended September 30, 2019 of $99 million (2018: $84 million) and Golden Sunlight for the three months ended September 30, 2019 of $1 million (2018: $13 million) and for the nine months ended September 30, 2019 of $29 million (2018: $39 million). |
| 4 | Includes provisional pricing adjustments for the three months ended September 30, 2019 of $1 million gains (2018: $6 million losses) and for the nine months ended September 30, 2019 of $15 million gains (2018: $35 million losses). |
| 5 | On July 1, 2019, Barrick’s Goldstrike and Newmont Goldcorp’s Carlin mines were contributed to Nevada Gold Mines and are now operated as one segment referred to as Carlin. As a result, the amounts presented represent Goldstrike (including South Arturo) up until June 30, 2019, and the combined results of Carlin (including Goldstrike) thereafter includingnon-controlling interest. Refer to note 4. |
| 6 | Barrick owned 75% of Turquoise Ridge up until June 30, 2019, with our joint venture partner, Newmont Goldcorp, owning the remaining 25%. Turquoise Ridge was accounted for as a joint operation and proportionately consolidated. On July 1, 2019, Barrick’s 75% interest in Turquoise Ridge and Newmont Goldcorp’s Twin Creeks and 25% interest in Turquoise Ridge were contributed to Nevada Gold Mines and are now operated as one segment referred to as Turquoise Ridge. The figures presented in this table are based on our 75% interest in Turquoise Ridge until June 30, 2019 and the combined results of Turquoise Ridge (including Twin Creeks) thereafter includingnon-controlling interest. Refer to note 4. |
| 7 | Formerly known as Acacia Mining plc. On September 17, 2019, Barrick acquired all of the shares of Acacia it did not own. Refer to note 4 for more information. |
| BARRICK THIRD QUARTER 2019 | 113 | NOTES TO FINANCIAL STATEMENTS (UNAUDITED) |
Reconciliation of Segment Income to Income Before Income Taxes
| For the three months ended September 30 | For the nine months ended September 30 | |||||||||||||||
| 2019 | 2018 | 2019 | 2018 | |||||||||||||
| Segment income | $725 | $488 | $1,759 | $1,617 | ||||||||||||
| Other cost of sales/amortization1 | (17 | ) | (8 | ) | (33 | ) | (28 | ) | ||||||||
| Exploration, evaluation and project expenses not attributable to segments | (61 | ) | (70 | ) | (205 | ) | (212 | ) | ||||||||
| General and administrative expenses | (68 | ) | (71 | ) | (181 | ) | (212 | ) | ||||||||
| Other income (expense) not attributable to segments | 1,895 | (6 | ) | 1,910 | (34 | ) | ||||||||||
| Impairment reversals (charges) not attributable to segments | 872 | (431 | ) | 857 | (492 | ) | ||||||||||
| Loss on currency translation | (40 | ) | (62 | ) | (56 | ) | (152 | ) | ||||||||
| Closed mine rehabilitation | (5 | ) | 6 | (46 | ) | 6 | ||||||||||
| Income from equity investees | 38 | 19 | 116 | 45 | ||||||||||||
| Finance costs, net (includesnon-segment accretion) | (112 | ) | (146 | ) | (324 | ) | (389 | ) | ||||||||
| Loss (gain) onnon-hedge derivatives2 | (1 | ) | — | — | 3 | |||||||||||
| Income (loss) before income taxes | $3,226 | ($281 | ) | $3,797 | $152 | |||||||||||
| 1 | Includes all realized hedge gains and losses for the three months ended September 30, 2019 of $nil (2018: $nil) and for the nine months ended September 30, 2019 of $nil losses (2018: $2 million losses). |
| 2 | Includes unrealizednon-hedge gains and losses for the three months ended September 30, 2019 of $1 million losses (2018: $nil) and for the nine months ended September 30, 2019 of $nil losses (2018: $nil). |
Capital Expenditures Information
| Segment capital expenditures1 | ||||||||||||||||
| For the three months ended September 30 | For the nine months ended September 30 | |||||||||||||||
| 2019 | 2018 | 2019 | 2018 | |||||||||||||
| Carlin2 | $98 | $35 | $217 | $153 | ||||||||||||
| Cortez | 92 | 98 | 257 | 256 | ||||||||||||
| Turquoise Ridge3 | 39 | 15 | 86 | 42 | ||||||||||||
| Pueblo Viejo | 28 | 39 | 86 | 110 | ||||||||||||
| Loulo-Gounkoto | 62 | — | 151 | — | ||||||||||||
| Kibali | 14 | — | 34 | — | ||||||||||||
| Veladero | 20 | 20 | 68 | 84 | ||||||||||||
| Tanzania4 | 13 | 23 | 46 | 74 | ||||||||||||
| Other Mines | 99 | 110 | 322 | 233 | ||||||||||||
| Reportable segment total | $465 | $340 | $1,267 | $952 | ||||||||||||
| Other items not allocated to segments | 37 | 19 | 86 | 79 | �� | |||||||||||
| Total | $502 | $359 | $1,353 | $1,031 | ||||||||||||
| Share of equity investees | (14 | ) | — | (34 | ) | — | ||||||||||
| Total | $488 | $359 | $1,319 | $1,031 | ||||||||||||
| 1 | Segment capital expenditures are presented for internal management reporting purposes on an accrual basis. Capital expenditures in the Consolidated Statements of Cash Flow are presented on a cash basis. For the three months ended September 30, 2019, cash expenditures were $502 million (2018: $387 million) and the decrease in accrued expenditures was $14 million (2018: $28 million decrease). For the nine months ended September 30, 2019, cash expenditures were $1,255 million (2018: $1,026 million) and the increase in accrued expenditures was $64 million (2018: $5 million increase). |
| 2 | On July 1, 2019, Barrick’s Goldstrike and Newmont Goldcorp’s Carlin mines were contributed to Nevada Gold Mines and are now operated as one segment referred to as Carlin. As a result, the amounts presented represent Goldstrike (including South Arturo) up until June 30, 2019, and the combined results of Carlin (including Goldstrike) thereafter includingnon-controlling interest. Refer to note 4. |
| 3 | Barrick owned 75% of Turquoise Ridge up until June 30, 2019, with our joint venture partner, Newmont Goldcorp, owning the remaining 25%. Turquoise Ridge was accounted for as a joint operation and proportionately consolidated. On July 1, 2019, Barrick’s 75% interest in Turquoise Ridge and Newmont Goldcorp’s Twin Creeks and 25% interest in Turquoise Ridge were contributed to Nevada Gold Mines and are now operated as one segment referred to as Turquoise Ridge. The figures presented in this table are based on our 75% interest in Turquoise Ridge until June 30, 2019 and the combined results of Turquoise Ridge (including Twin Creeks) thereafter includingnon-controlling interest. Refer to note 4. |
| 4 | Formerly known as Acacia Mining plc. On September 17, 2019, Barrick acquired all of the shares of Acacia it did not own. Refer to note 4 for more information. |
Purchase Commitments
At September 30, 2019, we had purchase obligations for supplies and consumables of $1,739 million (December 31, 2018: $1,972 million).
Capital Commitments
In addition to entering into various operational commitments in the normal course of business, we had capital commitments of $159 million at September 30, 2019 (December 31, 2018: $82 million).
| BARRICK THIRD QUARTER 2019 | 114 | NOTES TO FINANCIAL STATEMENTS (UNAUDITED) |
6 > REVENUE
| For the three months ended September 30 | For the nine months ended September 30 | |||||||||||||||
| 2019 | 2018 | 2019 | 2018 | |||||||||||||
| Gold sales | ||||||||||||||||
| Spot market sales | $2,549 | $1,652 | $6,371 | $4,848 | ||||||||||||
| Concentrate sales | 36 | 9 | 56 | 19 | ||||||||||||
| Provisional pricing adjustments | — | — | 1 | (1 | ) | |||||||||||
| $2,585 | $1,661 | $6,428 | $4,866 | |||||||||||||
| Copper sales | ||||||||||||||||
| Copper concentrate sales | $44 | $151 | $297 | $402 | ||||||||||||
| Provisional pricing adjustments | 1 | (6 | ) | 14 | (34 | ) | ||||||||||
| $45 | $145 | $311 | $368 | |||||||||||||
| Other sales1 | 48 | 31 | 95 | 105 | ||||||||||||
| Total | $2,678 | $1,837 | $6,834 | $5,339 | ||||||||||||
| 1 | Revenues include the sale ofby-products for our gold and copper mines. |
7 > COST OF SALES
| Gold | Copper | Other3 | Total | |||||||||||||||||||||||||||||
For the three months ended September 30 | 2019 | 2018 | 2019 | 2018 | 2019 | 2018 | 2019 | 2018 | ||||||||||||||||||||||||
| Direct mining cost1,2 | $1,207 | $790 | $30 | $96 | $1 | $— | $1,238 | $886 | ||||||||||||||||||||||||
| Depreciation | 538 | 319 | 13 | 37 | 8 | 7 | 559 | 363 | ||||||||||||||||||||||||
| Royalty expense | 79 | 45 | 5 | 11 | — | — | 84 | 56 | ||||||||||||||||||||||||
| Community relations | 7 | 10 | 1 | — | — | — | 8 | 10 | ||||||||||||||||||||||||
| $1,831 | $1,164 | $49 | $144 | $9 | $7 | $1,889 | $1,315 | |||||||||||||||||||||||||
| Gold | Copper | Other3 | Total | |||||||||||||||||||||||||||||
For the nine months ended September 30 | 2019 | 2018 | 2019 | 2018 | 2019 | 2018 | 2019 | 2018 | ||||||||||||||||||||||||
| Direct mining cost1,2 | $3,022 | $2,196 | $169 | $231 | $1 | $4 | $3,192 | $2,431 | ||||||||||||||||||||||||
| Depreciation | 1,353 | 907 | 83 | 86 | 24 | 23 | 1,460 | 1,016 | ||||||||||||||||||||||||
| Royalty expense | 223 | 138 | 26 | 28 | — | — | 249 | 166 | ||||||||||||||||||||||||
| Community relations | 20 | 27 | 3 | 3 | — | — | 23 | 30 | ||||||||||||||||||||||||
| $4,618 | $3,268 | $281 | $348 | $25 | $27 | $4,924 | $3,643 | |||||||||||||||||||||||||
| 1 | Direct mining cost includes charges to reduce the cost of inventory to net realizable value as follows: $nil for the three months ended September 30, 2019 (2018: $5 million) and $16 million for the nine months ended September 30, 2019 (2018: $10 million). |
| 2 | Direct mining cost includes the costs of extractingby-products. |
| 3 | Other includes realized hedge gains and losses and corporate amortization. |
8 > EARNINGS PER SHARE
| For the three months ended September 30 | For the nine months ended September 30 | |||||||||||||||||||||||||||||||
| 2019 | 2018 | 2019 | 2018 | |||||||||||||||||||||||||||||
| Basic | Diluted | Basic | Diluted | Basic | Diluted | Basic | Diluted | |||||||||||||||||||||||||
| Net income (loss) | $2,435 | $2,435 | ($386 | ) | ($386 | ) | $2,798 | $2,798 | ($270 | ) | ($270 | ) | ||||||||||||||||||||
| Net income attributable tonon-controlling interests | (158 | ) | (158 | ) | (26 | ) | (26 | ) | (216 | ) | (216 | ) | (78 | ) | (78 | ) | ||||||||||||||||
| Net income (loss) attributable to equity holders of Barrick Gold Corporation | $2,277 | $2,277 | ($412 | ) | ($412 | ) | $2,582 | $2,582 | ($348 | ) | ($348 | ) | ||||||||||||||||||||
| Weighted average shares outstanding | 1,756 | 1,756 | 1,167 | 1,167 | 1,751 | 1,751 | 1,167 | 1,167 | ||||||||||||||||||||||||
Earnings (loss) per share data attributable to the equity holders of Barrick Gold Corporation |
| |||||||||||||||||||||||||||||||
| Net income (loss) | $1.30 | $1.30 | ($0.35 | ) | ($0.35 | ) | $1.47 | $1.47 | ($0.30 | ) | ($0.30 | ) | ||||||||||||||||||||
| BARRICK THIRD QUARTER 2019 | 115 | NOTES TO FINANCIAL STATEMENTS (UNAUDITED) |
9 > OTHER EXPENSE
A) Other Expense (Income)
| For the three months ended September 30 | For the nine months ended | |||||||||||||||
| 2019 | 2018 | 2019 | 2018 | |||||||||||||
| Other expense: | ||||||||||||||||
Bank charges | $2 | $4 | $10 | $18 | ||||||||||||
Bulyanhulu reduced operations program cost1 | 6 | 6 | 18 | 23 | ||||||||||||
Insurance payment to Porgera JV | — | — | — | 13 | ||||||||||||
Tanzania transaction costs incurred by Acacia | 19 | — | 19 | — | ||||||||||||
Litigation | 4 | 35 | 23 | 61 | ||||||||||||
Miscellaneous write-offs | 5 | 2 | 7 | 6 | ||||||||||||
Tanzania - other | 5 | 4 | 10 | 9 | ||||||||||||
Other | 17 | (2 | ) | 25 | 15 | |||||||||||
| Total other expense | $58 | $49 | $112 | $145 | ||||||||||||
| Other income: | ||||||||||||||||
Gain on sale of long-lived assets | ($15 | ) | ($1 | ) | ($27 | ) | ($49 | ) | ||||||||
Remeasurement of Turquoise Ridge to fair value2 | (1,886 | ) | — | (1,886 | ) | — | ||||||||||
Insurance proceeds related to Kalgoorlie JV | — | (24 | ) | — | (24 | ) | ||||||||||
Other | (9 | ) | (8 | ) | (17 | ) | (17 | ) | ||||||||
| Total other income | ($1,910 | ) | ($33 | ) | ($1,930 | ) | ($90 | ) | ||||||||
| Total | ($1,852 | ) | $16 | ($1,818 | ) | $55 | ||||||||||
| 1 | Primarily relates to care and maintenance costs. |
| 2 | Refer to note 4 for further details. |
B) Impairment (Reversals) Charges
| For the three months ended September 30 | For the nine months ended September 30 | |||||||||||||||
| 2019 | 2018 | 2019 | 2018 | |||||||||||||
| Impairment (reversals) of non-current assets1 | ($872 | ) | $431 | ($857 | ) | $468 | ||||||||||
| Impairment of intangibles1 | — | — | — | 24 | ||||||||||||
| Total | ($872 | ) | $431 | ($857 | ) | $492 | ||||||||||
| 1 | Refer to note 13 for further details. |
10 > INCOME TAX EXPENSE
| For the three months ended September 30 | For the nine months ended September 30 | |||||||||||||||
| 2019 | 2018 | 2019 | 2018 | |||||||||||||
| Current | $163 | $18 | $396 | $247 | ||||||||||||
| Deferred | 628 | 87 | 603 | 175 | ||||||||||||
| $791 | $105 | $999 | $422 | |||||||||||||
Income tax expense was $999 million for the nine months ended September 30, 2019. The unadjusted effective income
tax rate for income for the nine months ended September 30, 2019, was 26% of the income before income taxes.
The underlying effective income tax rate on ordinary income for the nine months ended September 30, 2019 was 33% which includes the impact ofnon-deductible depreciation on the Randgold and Nevada Gold Mines purchase price allocations. Adjustments are made for the impact of the remeasurement of our previously held 75% interest in Turquoise Ridge to fair value; the impact of the impairment reversal at Lumwana; the impact of foreign currency translation losses on deferred tax balances; the impact ofnon-deductible losses on currency translation; the impact of a reduced corporate tax rate in Argentina on deferred tax balances; the impact of recognizing thenon-controlling interest on Turquoise Ridge´s deferred tax liabilities and the impact of other expense adjustments.
Currency Translation
Deferred tax balances are subject to remeasurement for changes in currency exchange rates each period. The most significant balances are Argentine and Malian net deferred tax liabilities. In the nine months ended September 30, 2019, tax expense of $40 million primarily arose from translation losses on tax balances in Argentina and Mali, due to the weakening of the Argentine peso and the West African CFA franc, respectively, against the US dollar. In the nine months ended September 30, 2018, tax expense of $30 million primarily arose from translation losses on tax balances in Argentina, due to the weakening of the Argentine peso against the US dollar. These translation losses are included within deferred income tax expense.
Nevada Gold Mines joint venture
Nevada Gold Mines is a limited liability company treated as a flow through partnership for US tax purposes. The partnership is not subject to income tax directly, but each of its partners is liable for tax on its share of the profits of the partnership. As such, Barrick accounts for its current and deferred tax associated with the investment (61.5% share) following the principles in IAS 12.
A deferred tax expense of $376 million was recorded in the third quarter of 2019 following the Turquoise Ridge mine remeasurement to fair value and the $1.9 billion recognized gain (refer to note 4).
Veladero Deferred Taxes
In December 2017, Argentina reduced its 35% corporate tax rate to 30% for 2018 and 2019, with further reduction to 25% for 2020 and thereafter. Concurrently, a dividend distribution tax was introduced that charges 7% tax on dividend distributions for 2018 and 2019, and 13% tax on dividend distributions for 2020 and thereafter.
A deferred tax recovery of $70 million was recorded in the second quarter of 2019 as a result of an inflation adjustment implemented for statutory financial statement purposes in Argentina, and finalized in the second quarter of 2019, which results in Veladero not having dividend distribution capacity for prior years. The impact of material inflationary adjustments on distributable reserves and deferred taxes is expected to remain variable and will be evaluated on an annual basis.
| BARRICK THIRD QUARTER 2019 | 116 | NOTES TO FINANCIAL STATEMENTS (UNAUDITED) |
11 > CASH FLOW – OTHER ITEMS
| Operating Cash Flows – Other Items | For the three months ended September 30 | For the nine months ended September 30 | ||||||||||||||
| 2019 | 2018 | 2019 | 2018 | |||||||||||||
| Adjustments fornon-cash income statement items: | ||||||||||||||||
Loss (gain) onnon-hedge derivatives | $1 | $— | $— | ($3 | ) | |||||||||||
Share-based compensation expense (recovery) | 25 | (1 | ) | 63 | 19 | |||||||||||
Income from investment in equity investees | (38 | ) | (19 | ) | (116 | ) | (45 | ) | ||||||||
Change in estimate of rehabilitation costs at closed mines | 5 | (6 | ) | 46 | (6 | ) | ||||||||||
Net inventory impairment charges | — | 5 | 16 | 10 | ||||||||||||
| Change in other assets and liabilities | (96 | ) | (25 | ) | (68 | ) | (130 | ) | ||||||||
| Settlement of rehabilitation obligations | (23 | ) | (17 | ) | (53 | ) | (49 | ) | ||||||||
| Other operating activities | ($126 | ) | ($63 | ) | ($112 | ) | ($204 | ) | ||||||||
| Cash flow arising from changes in: | ||||||||||||||||
Accounts receivable | ($6 | ) | $5 | ($39 | ) | $50 | ||||||||||
Inventory | 9 | 13 | 21 | (135 | ) | |||||||||||
Other current assets | (39 | ) | 6 | (133 | ) | (71 | ) | |||||||||
Accounts payable | 115 | 154 | (45 | ) | 87 | |||||||||||
Other current liabilities | (12 | ) | (11 | ) | (67 | ) | — | |||||||||
| Change in working capital | $67 | $167 | ($263 | ) | ($69 | ) | ||||||||||
| Investing Cash Flows – Other Items | For the three months ended September 30 | For the nine months ended September 30 | ||||||||||||||
| 2019 | 2018 | 2019 | 2018 | |||||||||||||
| Dividends received from equity method investments | $72 | $— | $104 | $— | ||||||||||||
| Funding of equity method investments | (2 | ) | — | (2 | ) | (5 | ) | |||||||||
| Shareholder loan repayments from equity method investments | 35 | — | 65 | — | ||||||||||||
| Other | (2 | ) | — | (2 | ) | — | ||||||||||
| Other net investing activities | $103 | $— | $165 | ($5 | ) | |||||||||||
12 > EQUITY ACCOUNTING METHOD INVESTMENT CONTINUITY
| Kibali | Jabal Sayid | Zaldívar | Other1 | Total | ||||||||||||||||
| At January 1, 2018 | $— | $206 | $975 | $32 | $1,213 | |||||||||||||||
| Funds invested | — | — | — | 5 | 5 | |||||||||||||||
| Equitypick-up (loss) from equity investees | — | 39 | 14 | (7 | ) | 46 | ||||||||||||||
| Impairment charges | — | — | — | (30 | ) | (30 | ) | |||||||||||||
| At December 31, 2018 | $— | $245 | $989 | $— | $1,234 | |||||||||||||||
| Acquisitions | 3,168 | — | — | 58 | 3,226 | |||||||||||||||
| Funds invested | — | — | — | 2 | 2 | |||||||||||||||
| Equitypick-up (loss) from equity investees | 80 | 36 | 11 | (11 | ) | 116 | ||||||||||||||
| Dividends paid | (53 | ) | — | (50 | ) | (1 | ) | (104 | ) | |||||||||||
| At September 30, 2019 | $3,195 | $281 | $950 | $48 | $4,474 | |||||||||||||||
| 1 | Other includes Morila. |
| BARRICK THIRD QUARTER 2019 | 117 | NOTES TO FINANCIAL STATEMENTS (UNAUDITED) |
13 > IMPAIRMENT OF GOODWILL AND OTHER ASSETS
In accordance with our accounting policy, goodwill is tested for impairment in the fourth quarter and also when there is an indicator of impairment.Non-current assets are tested for impairment or impairment reversals when events or changes in circumstances suggest that the carrying amount may not be recoverable or is understated. Refer to note 21 of the 2018 Annual Financial Statements for further information.
For the nine months ended September 30, 2019, we recorded net impairment reversals of $857 million (2018: $492 million impairments) fornon-current assets.
Summary of impairments (reversals)
| For the three months ended September 30 | For the nine months ended September 30 | |||||||||||||||
| 2019 | 2018 | 2019 | 2018 | |||||||||||||
Lumwana | ($947 | ) | $— | ($947 | ) | $— | ||||||||||
Cortez | 57 | — | 57 | 9 | ||||||||||||
Lagunas Norte | 12 | 405 | 12 | 405 | ||||||||||||
Golden Sunlight | 1 | — | 9 | — | ||||||||||||
Carlin | — | — | 2 | 5 | ||||||||||||
Equity Method Investments | — | — | — | 30 | ||||||||||||
Acacia | — | — | — | 24 | ||||||||||||
Pascua-Lama | — | — | — | (7 | ) | |||||||||||
Other1 | 5 | 26 | 10 | 26 | ||||||||||||
Total | ($872 | ) | $431 | ($857 | ) | $492 | ||||||||||
| 1 | Impairment charges for the third quarter of 2018 relate to impairment ofnon-current assets atnon-operating sites. |
Indicators of impairment
Third Quarter 2019
Lumwana
On September 28, 2018, as part of their 2019 budget, the Zambian government introduced changes to the current mining tax regime. The changes included an increase in royalty rates by 1.5%, the introduction of a 10% royalty on copper production if copper price increases above a certain price, the imposition of a 5% import duty on copper concentrates, thenon-deductibility of mineral royalties paid or payable for income tax purposes, and the replacement of the VAT with anon-refundable sales tax, although any outstanding VAT claims will be settled through the current refund mechanism. In the fourth quarter of 2018, the Zambian government finalized the changes to the current tax regime, which was effective January 1, 2019, with the exception of the changes to thenon-refundable sales tax. In August 2019, the Zambian government alleviated this fiscal uncertainty by withdrawing the legislative Bill relating to thenon-refundable sales tax and introduced a new Bill in September 2019 which contains measures to limit the claiming of VAT on certain items used by Lumwana.
In addition to these external impacts, we have updated our LOM plan for Lumwana based on the significant reductions achieved in the current year in unit mining costs and improvements in plant availability. This reduction in the cost base has allowed us to lower thecut-off grade which is expected to deliver a 5 year increase in the mine life of
Lumwana. Finally, during the third quarter of 2019, we also updated our long term copper price assumption to $3.00 per pound (previously $2.85 per pound). As a result of these indicators of impairment reversal, an assessment was undertaken and anon-current asset impairment reversal of $947 million was recognized in the third quarter of 2019, as we identified that Lumwana’s fair value less costs of disposal (“FVLCD”) of $1.4 billion exceeded its carrying value. The key assumptions and estimates used in determining the FVLCD are long-term copper prices of $3.00 per pound and a weighted average cost of capital (“WACC”) of 10.4%.
Nevada Gold Mines
On July 1, 2019 we formed Nevada Gold Mines, a joint venture combining the respective mining operations, assets, reserves and talent from Barrick and Newmont Goldcorp in Nevada, USA. This includes Barrick’s Cortez, Goldstrike, Turquoise Ridge and Goldrush properties and Newmont’s Carlin, Twin Creeks, Phoenix, Long Canyon and Lone Tree properties. Through the purchase price allocation exercise, we identified various assets with fair values less than their carrying values. Although we did not restate the assets of Goldstrike, Cortez and Goldrush to fair value, we identified indicators of impairment for certain land holdings and specific Cortez Hills Open Pit infrastructure assets and an impairment of $60 million was recorded in the third quarter of 2019. Refer to note 4 for further information.
Second Quarter 2019
Acacia
On May 21, 2019, Barrick met with the Directors and senior management of Acacia and presented a proposal to acquire all of the shares it did not already own in Acacia through a share for share exchange of 0.153 Barrick shares for each ordinary share of Acacia. The exchange ratio was based on the20-day volume weighted average trading prices of Acacia and Barrick as at market close in London and New York on May 20, 2019 and implied a value for 100% of Acacia of $787 million.
On July 19, 2019, we announced that the Boards of Barrick and Acacia reached an agreement on the terms of a recommended offer by Barrick for the 36.1% of Acacia that we did not own at that time. Under the terms of the agreement, the minority shareholders would exchange each Acacia share for 0.168 Barrick shares and would also be entitled to special dividends under certain conditions. The offer received shareholder approval in the third quarter of 2019 and the transaction closed on September 17, 2019.
During the second quarter of 2019, Acacia updated its life of mine plans and subsequent to that the Barrick technical team has had an opportunity to conduct detailed due diligence on the updated life of mine plans for the Acacia assets and risk adjust the value of the assets. The value implied by Barrick’s adjusted life of mine plans were deemed to be an indicator of impairment in the second quarter of 2019.
An impairment assessment was undertaken in the second quarter and Barrick assessed the carrying value of the individual cash generating units within Acacia (Bulyanhulu, North Mara and Buzwagi) and determined that the carrying
| BARRICK THIRD QUARTER 2019 | 118 | NOTES TO FINANCIAL STATEMENTS (UNAUDITED) |
amounts were recoverable. Therefore, no impairment was recognized.
The key assumptions and estimates used in determining the fair value less cost to dispose are short-term and long-term gold prices of $1,250 per ounce, NAV multiples of1.0-1.1 and a WACC of6.5%-6.9%. Other assumptions include a 50% economic share of future economic benefits generated by the mines for the Government of Tanzania (“GoT”), which includes taxes, royalties, tolls and a 16% free carry interest in the mines. Management assumed the resumption of concentrate sales and exports commencing in Q3 2019 and the resumption of production from underground mining at Bulyanhulu in 2020. The WACC applied was lower than the 2018 and 2017 impairment tests for the Acacia CGUs, based on lower risk levels given the state of Barrick’s negotiations with the GoT at that time and the expectation that an agreement would be signed once the recommended offer to purchase the minority shareholdings of Acacia as described above had closed and because the economic sharing of benefits had been modeled into the cash flows.
Third Quarter 2018
Lagunas Norte
In the third quarter of 2018, we updated a feasibility study for proposed projects relating to the processing of carbonaceous materials (“CMOP”) and the treatment of refractory sulphide ore (“PMR”) at Lagunas Norte in Peru. Based upon the findings of the feasibility study, it was determined not to proceed with the PMR project at that time. As a result, an impairment assessment was undertaken and anon-current asset impairment of $405 million was recognized in the third quarter of 2018, as we identified that Lagunas Norte’s carrying value exceeded its FVLCD of $150 million. The key assumptions and estimates used in determining the FVLCD were short-term and long-term gold prices of $1,200 per ounce, NAV multiple of1.1-1.2 and a WACC of 3.8%.
14 > FINANCIAL INSTRUMENTS
Financial instruments include cash; evidence of ownership in an entity; or a contract that imposes an obligation on one party and conveys a right to a second party to deliver/receive cash or another financial instrument.
A) Cash and Equivalents
Cash and equivalents include cash, term deposits, treasury bills and money market funds with original maturities of less than 90 days.
B) Debt
On July 15, 2019, Barrick completed a make-whole repurchase of the approximately $248 million of outstanding principal on the 4.95% notes due 2020. The settlement resulted in a debt extinguishment loss of $3 million.
C) Guarantee
In connection with the closing of Nevada Gold Mines on July 1, 2019 (refer to Note 4), Nevada Gold Mines provided a guarantee in respect of Newmont Goldcorp’s 2035 senior notes, which were originally issued in the aggregate principal amount of $600 million. During the third quarter of 2019, Newmont Goldcorp completed a transaction with their bondholders that resulted in the release of the guarantee by Nevada Gold Mines.
15 > FAIR VALUE MEASUREMENTS
A) Assets and Liabilities Measured at Fair Value on a Recurring Basis
As at September 30, 2019 | Quoted
(Level 1) | Significant
(Level 2) | Significant
(Level 3) | Aggregate
| ||||||||||||
Cash and equivalents | $2,405 | $— | $— | $2,405 | ||||||||||||
Other investments | 271 | — | — | 271 | ||||||||||||
Derivatives | — | 1 | — | 1 | ||||||||||||
Receivables from provisional copper and gold sales | — | 49 | — | 49 | ||||||||||||
| $2,676 | $50 | $— | $2,726 | |||||||||||||
B) Fair Values of Financial Assets and Liabilities
| As at September 30, 2019 | As at December 31, 2018 | |||||||||||||||
| Carrying amount | Estimated fair value | Carrying amount | Estimated fair value | |||||||||||||
| Financial assets | ||||||||||||||||
| Other assets1 | $627 | $627 | $559 | $559 | ||||||||||||
| Other investments2 | 271 | 271 | 209 | 209 | ||||||||||||
| Derivative assets | 1 | 1 | 3 | 3 | ||||||||||||
| $899 | $899 | $771 | $771 | |||||||||||||
Financial liabilities | ||||||||||||||||
Debt3 | $5,560 | $6,999 | $5,738 | $6,183 | ||||||||||||
Derivative liabilities | — | — | 3 | 3 | ||||||||||||
Other liabilities | 552 | 552 | 297 | 297 | ||||||||||||
| $6,112 | $7,551 | $6,038 | $6,483 | |||||||||||||
| 1 | Includes restricted cash and amounts due from our partners. |
| 2 | Recorded at fair value. Quoted market prices are used to determine fair value. |
| 3 | Debt is generally recorded at amortized cost. The fair value of debt is primarily determined using quoted market prices. Balance includes both current and long-term portions of debt. |
We do not offset financial assets with financial liabilities.
| BARRICK THIRD QUARTER 2019 | 119 | NOTES TO FINANCIAL STATEMENTS (UNAUDITED) |
C) Assets Measured at Fair Value on aNon-Recurring Basis
As at 30, 2019 | Quoted
(Level 1) | Significant
(Level 2) | Significant
(Level 3) | Aggregate fair value | ||||
Property, plant and equipment1 | — | — | 1,862 | 1,862 | ||||
| 1 | Property, plant and equipment were written up by $857 million, which was included in earnings in this period. |
The Company’s valuation techniques were presented in Note 26 of the 2018 Annual Financial Statements and have been consistently applied in these interim financial statements.
16 > CAPITAL STOCK
A) Authorized Capital Stock
Our authorized capital stock is composed of an unlimited number of common shares (issued 1,777,781,827 common shares as at September 30, 2019). Our common shares have no par value.
On January 1, 2019, we issued 583,669,178 common shares to Randgold shareholders as a result of the Merger. Refer to note 4 for further details.
On September 17, 2019, we issued 24,836,670 common shares to thenon-controlling shareholders of Acacia in exchange for their shares in Acacia. Refer to note 4 for further details.
B) Dividends
The Company’s practice has been to declare dividends after a quarter in the announcement of the results for the quarter. Dividends declared are paid in the same quarter. However, during the first quarter of 2019, $76.3 million in dividends were paid in relation to the additional dividend that was declared in the fourth quarter of 2018. In addition, the Company paid $256.2 million in dividends during the first quarter of 2019 that were declared by Randgold in the fourth quarter of 2018.
The Company’s dividend reinvestment plan resulted in 1,299,069 common shares issued to shareholders for the nine months ended September 30, 2019.
17 > CONTINGENCIES
Certain conditions may exist as of the date the financial statements are issued that may result in a loss to the Company, but which will only be resolved when one or more future events occur or fail to occur. The impact of any resulting loss from such matters affecting these financial statements and noted below may be material.
Except as noted below, no material changes have occurred with respect to the matters disclosed in Note 36 “Contingencies” to the 2018 Annual Financial Statements, and no new contingencies have occurred that are material to the Company since the issuance of the 2018 Annual Financial Statements.
The description set out below should be read in conjunction with Note 36 “Contingencies” to the 2018 Annual Financial Statements.
Litigation and Claims Update
Proposed Canadian Shareholder Class Action (Veladero)
On April 11, 2019, Barrick received an offer from the plaintiff to dismiss the proposed class action lawsuit without costs. The Ontario Superior Court of Justice ordered the dismissal of the proposed class action lawsuit on August 19, 2019, and the matter is now closed.
Proposed Canadian Securities Class Actions (Pascua-Lama)
In May 2019, the motion for leave to proceed with statutory misrepresentation claims and for class certification was heard in the Quebec action. The Quebec court has reserved judgment in this matter.
In July 2019, the motion for leave to proceed with statutory misrepresentation claims was heard in the Ontario action. In October 2019, the Ontario Superior Court of Justice dismissed all but one of those claims. The sole remaining statutory misrepresentation claim pertains to a statement concerning the water management system in Chile made by the Company in its Management’s Discussion and Analysis for the second quarter of 2012. The Company has filed a motion in the Divisional Court, an intermediate appellate court in Ontario, for leave to appeal the decision to allow that one claim to proceed. The Plaintiffs have the right to pursue an appeal to the Court of Appeal for Ontario with respect to the claims that were dismissed.
A date has not yet been set for a hearing on the motion for class certification in Ontario.
Pascua-Lama - SMA Regulatory Sanctions
On March 14, 2019, the Chilean Supreme Court annulled the October 12, 2018 administrative decision of the Antofagasta Environmental Court on procedural grounds and remanded the case back to the Environmental Court for review by a different panel of judges. The Chilean Supreme Court did not review the merits of the Revised Resolution, which remains in effect. CMN’s appeal of the Revised Resolution remains pending before the new panel of judges ordered by the Chilean Supreme Court, which heard arguments on July 23, 2019. The Company intends to vigorously defend this matter and continues to evaluate all of its legal options.
| BARRICK THIRD QUARTER 2019 | 120 | NOTES TO FINANCIAL STATEMENTS (UNAUDITED) |
Pascua-Lama – Water Quality Review
On February 19, 2019, the Chilean Supreme Court accepted the appeal by the indigenous residents of the Environmental Court’s decision. The Chilean Supreme Court heard oral arguments on September 10 and 11, 2019. A ruling on the matter remains pending. No amounts have been recorded for any potential liability arising from this matter, as the Company cannot reasonably predict any potential losses.
Veladero - September 2015 Release of Cyanide-Bearing Process Solution
Criminal Matters
Provincial Action
All defendants have completed the probationary period for community service and good behaviour and requested dismissal of the charges in the Provincial Action.
Veladero – Tax Assessment and Criminal Charges
Hearings for the Criminal Tax case were held between March 25 and March 27, 2019. The defendants filed a motion to dismiss based on the statute of limitations, which was granted in part and which has been appealed by the prosecution.
The Company filed Mutual Agreement Procedure applications in Canada on December 21, 2018, and in Argentina on March 29, 2019, pursuant to the Canada-Argentina Income Tax Convention Act (the “Canada-Argentina Tax Treaty”) to escalate resolution of the Tax Assessment to the competent authority (as defined in the Canada-Argentina Tax Treaty) in an effort to seek efficient resolution of the matter.
The Company believes that the Tax Assessment and the Criminal Tax Case are without merit and intends to defend the proceedings vigorously. No amounts have been recorded for any potential liability arising from the Tax Assessment or the Criminal Tax Case, as the Company cannot reasonably predict the outcome.
Argentine Glacier Legislation and Constitutional Litigation
On June 4, 2019, the National Supreme Court of Argentina dismissed the case on the basis that no harm deriving from the federal glacier law has been proven and that the federal glacier law does not impact Veladero and Pascua-Lama and the matter is now closed.
Pueblo Viejo – Amparo Action
On April 12, 2019, PVDC’s motion to challenge the timeliness of the appeal was accepted by the Constitutional Court, and the matter is now closed.
Writ of Kalikasan
On March 20, 2019, the Company was notified that the Court of Appeals granted a motion by the Petitioners to lift the Suspension of Proceedings and denied the motion to intervene filed by the two baranguays and set a preliminary case conference. In April 2019, the Company filed a motion for (i) reconsideration of the March 2019 order lifting the Suspension of Proceedings and dismissing the Company’s request that the case be dismissed for delay; (ii) a ruling on its pending Urgent Motion for Ruling on Jurisdiction and Motion for a Ruling on Subject-Matter Jurisdiction; and (iii) an order suspending the proceedings pending determination of these motions. The preliminary case conference was subsequently cancelled by the Court of Appeals in April 2019.
On September 12, 2019, the Court of Appeals ruled that the issues raised by the Company should be decided concurrently with a hearing of the merits of the dispute. The Court set a preliminary case conference date of September 18, 2019.
On September 17, 2019, the Company filed a further motion to request that the Court of Appeals determine the Company’s Urgent Motion for Ruling on Jurisdiction and Motion for a Ruling on Subject-Matter Jurisdiction prior to any merits hearing. Consequently, the Court of Appeals adjourned the September 18, 2019 preliminary case conference to October 21, 2019, to further consider the Company’s motion requesting the determination of the Company’s jurisdiction motions prior to any merits hearing.
On October 18, 2019, the Court of Appeals issued a Notice of Resolution, which, among other things, rejected the Company’s constitutional objections and held that the Court of Appeals has jurisdiction based on a “tentative” determination that the Company was doing business in the Philippines made exclusively on the basis of unproved allegations made by the Petitioners in their petition, which “tentative” determination expressly does not foreclose the possibility of a contrary finding on the basis of evidence at a later date. On November 4, 2019 the Company filed a Motion for Reconsideration seeking a reversal of the Notice of Resolution dated October 18, 2019.
On October 21, 2019, the Court of Appeals rescheduled the preliminary case conference from October 21, 2019 to January 27, 2020 and, following a request from Petitioners’ counsel, it directed that a court-annexed mediation take place on October 29, 2019. An additional mediation session has been scheduled for November 21, 2019. The Court of Appeals has not yet issued any decision related to certain remaining evidentiary matters. The Company intends to continue to defend the action vigorously.
Malian Tax Dispute
Prior to the Merger, Randgold had received various tax claims from the State of Mali in respect of its Mali operations, which totaled $267.7 million at January 1, 2019. As at the end of the second quarter, the total claim for 2018 and prior year periods had risen to $275 million. Each of Loulo and Gounkoto (which together form the Loulo-Gounkoto complex) and Morila have separate legally binding establishment conventions with the State of Mali, which guarantee fiscal stability, govern applicable taxes and allow for international arbitration in the event of disputes. Barrick has been actively engaged with the Malian authorities and is seeking a complete resolution of the various tax claims to avoid protracted arbitration.
During 2016, Randgold also received payment demands in respect of these disputed amounts, and consequently, from 2016 up to December 2018, Randgold paid tax advances to the State of Mali to support the resolution of the tax disputes, which after offsetting other tax payments resulted in a receivable being recorded of $41.1 million. As part of the purchase price allocation for the Merger (see note 4), the fair value of this receivable has been reduced to nil. In July 2019, a further advance of $43 million was paid to the State of Mali as part of a settlement proposal. A further $17 million was accrued, bringing the total amount recorded for these events to $60 million. This amount was recorded as a further update to the purchase price allocation in the second quarter. The
| BARRICK THIRD QUARTER 2019 | 121 | NOTES TO FINANCIAL STATEMENTS (UNAUDITED) |
Company continues to await the State of Mali’s response to its settlement proposal.
Reko Diq Arbitration
Barrick currently indirectly holds 50% of the shares of Tethyan Copper Company Pty Limited (“TCC”), with Antofagasta plc (“Antofagasta”) indirectly holding the other 50%. On November 15, 2011, the Government of the Province of Balochistan notified Tethyan Copper Company Pakistan (Private) Limited (“TCCP”) (the local operating subsidiary of TCC) of the rejection of TCCP’s application for a mining lease for the Reko Diq project, to which TCCP was lawfully entitled subject only to “routine” government requirements. On November 28, 2011, TCC filed a request for international arbitration against the Government of Pakistan (“GOP”) with the International Centre for Settlement of Investment Disputes (“ICSID”) asserting breaches of the Bilateral Investment Treaty (“BIT”) between Australia (where TCC is incorporated) and Pakistan.
On March 20, 2017, the Tribunal issued its decision, rejecting the GOP’s position. In March 2019, ICSID closed the record in the arbitration.
In July 2019, ICSID awarded $5.84 billion in damages to TCC in relation to the arbitration claims and unlawful denial of a mining lease for the Reko Diq project. Damages include compensation of $4.087 billion in relation to the fair market value of the Reko Diq project at the time the mining lease was denied, and interest until the date of the award of $1.753 billion. Compound interest continues to apply at a rate of US Prime +1% per annum until the award is paid. The Company cannot reasonably estimate the financial effect of this settlement award. No amounts have been recognized at this time.
Tanzania – Concentrate Export Ban and Related Disputes
On February 20, 2019, Barrick announced that it had arrived at a proposal with the Government of Tanzania (the “GoT”) that set forth the commercial terms to resolve outstanding disputes concerning Acacia’s operations in Tanzania.
On May 19, 2019, the GoT Negotiating Team wrote to Acacia’s three Tanzanian operating companies (the “TMCs”) to indicate that the GoT had resolved not to proceed to execute final agreements for the resolution of Acacia’s disputes if Acacia was one of the counterparties to the agreements.
On July 12, 2019, Acacia’s North Mara mine received a letter from the Mining Commission of the Tanzanian Ministry of Minerals informing it that the Mining Commission is soon to conduct an inspection of North Mara’s gold production (the “No Export Letter”). The No Export Letter stated that export permits for gold shipments from North Mara would be issued following completion of this inspection.
Following an investigation conducted by the Mining Commission on July 30 and 31, 2019, the North Mara mine received a letter from the Mining Commission (the “Inspection Findings Letter”) stating that it believes that certain provisions of the Mining Regulations, 2010 were violated and directing the North Mara mine to submit a feasibility study report and current mine plan for its approval by August 16, 2019. The Inspection Findings Letter also authorized the resumption of
gold exports from North Mara subject to its adherence to the export procedure.
On July 19, 2019, the Acacia Transaction Committee Directors and Barrick published a firm offer announcement pursuant to Rule 2.7 of the City Code on Takeovers and Mergers (“Rule 2.7 Announcement”) announcing that they had reached agreement on the terms of a recommended final offer by Barrick for the ordinary share capital of Acacia Mining plc that Barrick does not already own, with the belief that the recommended final offer would enable Barrick to finalize the terms of a full, final and comprehensive settlement of all of Acacia’s existing disputes with the GoT. To facilitate this and in anticipation of the Rule 2.7 Announcement, on July 17, 2019, Acacia announced that Bulyanhulu Gold Mine Limited and Pangea Minerals Limited would immediately seek a stay of their international arbitration proceedings with the GoT. As part of the stay, the hearings scheduled to begin in July 2019 were postponed. The parties to the arbitration have committed to providing the arbitration tribunal with an update on the status of the settlement discussions by December 30, 2019.
On September 12, 2019, the High Court of Justice in England and Wales made an order sanctioning the scheme of arrangement under Part 26 of the Companies Act 2006 (the “Scheme”), and on September 17, 2019, Barrick completed the acquisition of all of the shares of Acacia Mining plc that the Company did not already own pursuant to the Scheme. Acacia Mining plc ceased trading on the London Stock Exchange and became a wholly-owned subsidiary of Barrick called Barrick TZ Limited.
On October 20, 2019, Barrick announced that it had reached an agreement with the GoT to settle all disputes between the GoT and the mining companies formerly operated by Acacia but now managed by Barrick. The final agreements have been submitted to the Tanzanian Attorney General for review and legalization (see “Tanzanian Revenue Authority Assessments”).
Tanzanian Revenue Authority Assessments
On October 20, 2019, Barrick announced that it had reached an agreement with the GoT to settle all disputes between the GoT and the mining companies formerly operated by Acacia but now managed by Barrick. The final agreements have been submitted to the Tanzanian Attorney General for review and legalization.
The terms of the agreement include the payment of $300 million to settle all outstanding tax and other disputes; the lifting of the Ban; the sharing of future economic benefits from the Bulyanhulu, Buzwagi and North Mara mines on a 50/50 basis; and a dispute resolution mechanism that provides for binding international arbitration.
In conjunction with the finalization of the agreement, a new operating company called Twiga Minerals Corporation (“Twiga”) has been formed to manage the Bulyanhulu, Buzwagi and North Mara mines. The GoT will receive a free carried shareholding of 16% in each of the mines and will receive its half of the economic benefits from taxes, royalties, clearing fees and participation in all cash distributions made by the mines and Twiga. An annualtrue-up mechanism will be included to maintain the 50/50 split.
| BARRICK THIRD QUARTER 2019 | 122 | NOTES TO FINANCIAL STATEMENTS (UNAUDITED) |
North Mara Environmental Issues
During 2019, the GoT issued two environmental protection orders and directions to Acacia’s North Mara mine in relation to alleged breaches of environmental regulations relating to seepage from and the discharge of a hazardous substance from the North Mara mine Tailings Storage Facility (“TSF”). In March 2019, the GoT directed the North Mara Mine to resolve an incident that resulted in the spillage of water into the local environment. On July 16, 2019, the Tanzanian National Environment Management Council (“NEMC”) issued a Prohibition Notice (the “Prohibition Notice”) to North Mara Gold Mine Limited (the Tanzanian operating company of the North Mara mine), which ordered the North Mara mine to suspend operations at its TSF on Saturday July 20, 2019. NEMC cited the North Mara mine’s failure to contain and prevent seepage from the TSF as grounds for its issuance of the Prohibition Notice.
On September 17, 2019, following the submission of a detailed action plan to remediate issues related to the TSF and the implementation of remedial measures to contain the seepage from the TSF, the Prohibition Notice was lifted and North Mara was permitted to resume operations at the TSF.
Zaldívar Chilean Tax Assessment
On August 28, 2019, Barrick’s Chilean subsidiary that holds the Company’s interest in the Zaldívar mine, Compañía Minera Zaldívar Limitada (“CMZ”), received notice of a tax assessment from the Chilean Internal Revenue Service (“Chilean IRS”) amounting to approximately $1 billion in outstanding taxes, including interest and penalties (the “Zaldívar Tax Assessment”). The Zaldívar Tax Assessment primarily claims that CMZ improperly claimed a deduction relating to a loss on an intercompany transaction prior to recognizing and offsetting a capital gain on the sale of a 50% interest by CMZ in the Zaldívar mine to Antofagasta in 2015. CMZ filed an administrative appeal with the Chilean IRS on October 14, 2019. The Company believes that the Zaldívar Tax Assessment is without merit and intends to vigorously defend its position. No amounts have been recorded for any potential liability arising from the Zaldívar Tax Assessment as the Company cannot reasonably predict the outcome.
| BARRICK THIRD QUARTER 2019 | 123 | NOTES TO FINANCIAL STATEMENTS (UNAUDITED) |
Corporate Office
Barrick Gold Corporation
161 Bay Street, Suite 3700
Toronto, Ontario M5J 2S1
Canada
Telephone: +1 416861-9911
Email: investor@barrick.com
Website: www.barrick.com
Shares Listed
GOLD The New York Stock Exchange
ABX The Toronto Stock Exchange
Transfer Agents and Registrars
AST Trust Company (Canada)
P.O. Box 700, Postal Station B
Montreal, Quebec H3B 3K3
or
American Stock Transfer & Trust Company, LLC
6201 – 15 Avenue
Brooklyn, New York 11219
Telephone:1-800-387-0825
Fax:1-888-249-6189
Email: inquiries@astfinancial.com
Website: www.astfinancial.com
Enquiries
President and Chief Executive Officer
Mark Bristow
+1 647 205 7694
+44 788 071 1386
Senior Executive Vice-President and
Chief Financial Officer
Graham Shuttleworth
+1 647 262 2095
+44 779 771 1338
+44 1534 735 333
Investor and Media Relations
Kathy du Plessis
+44 20 7557 7738
Email: barrick@dpapr.com
Cautionary Statement on Forward-Looking Information
Certain information contained or incorporated by reference in this press release, including any information as to our strategy, projects, plans or future financial or operating performance, constitutes “forward-looking statements”. All statements, other than statements of historical fact, are forward-looking statements. The words “on track”, “deliver”, heading for”, “working on”, “points to”, “plan”, “progresses”, “upside”, “opportunities”, “scheduled for”, “objective”, “expected”, “potential”, “underway”, “strategy”, “will”, “being evaluated”, “proposed”, “aims”, “developing”, “continues” and similar expressions identify forward-looking statements. In particular, this press release contains forward-looking statements including, without limitation, with respect to: Barrick’s forward-looking production and cost guidance; timing of completion of a feasibility study for the potential plant expansion at Pueblo Viejo; potential mineralization, including at Fourmile; potential extensions to life of mine, including at Porgera, Veladero, Pueblo Viejo, Hemlo, Loulo Gounkoto and Kibali; timing of completion of Barrick’s five- andten-year plans; dispositions ofnon-core assets, and potential proceeds from any such
transactions; potential exploration targets and mineral resource potential, including reserve replenishment; opportunities to deliver value for Barrick’s owners and stakeholders; Barrick’s energy and sustainability strategies, and potential reductions to Barrick’s carbon footprint and costs; potential efficiency improvements and capital projects initiatives; future investments in community projects and contributions to local economies; the new partnership between Barrick and the GoT and the agreement to resolve all outstanding disputes between Acacia and the GoT; expectations regarding settlement negotiations with the Government of Mali; potential advancements in automation technology; Barrick’s human capital management and employee development plans; future engagement with the Government of the Democratic Republic of the Congo in respect of the new Mining Code introduced in 2018 and related regulations; and expectations regarding future price assumptions, financial performance and other outlook or guidance.
Forward-looking statements are necessarily based upon a number of estimates and assumptions including material estimates and assumptions related to the factors set forth below that, while considered reasonable by the Company as at the date of this press release in light of management’s experience and perception of current conditions and expected developments, are inherently subject to significant business, economic and competitive uncertainties and contingencies. Known and unknown factors could cause actual results to differ materially from those projected in the forward-looking statements and undue reliance should not be placed on such statements and information. Such factors include, but are not limited to: fluctuations in the spot and forward price of gold, copper or certain other commodities (such as silver, diesel fuel, natural gas and electricity); the speculative nature of mineral exploration and development; changes in mineral production performance, exploitation and exploration successes; risks associated with projects in the early stages of evaluation and for which additional engineering and other analysis is required; whether the agreement to settle all disputes between Acacia and the Government of Tanzania (the “GoT”) will be legalized and executed by the GoT; the Company’s ability to successfullyre-integrate Acacia’s operations; the benefits expected from recent transactions being realized, including Nevada Gold Mines; diminishing quantities or grades of reserves; increased costs, delays, suspensions and technical challenges associated with the construction of capital projects; operating or technical difficulties in connection with mining or development activities, including geotechnical challenges and disruptions in the maintenance or provision of required infrastructure and information technology systems; failure to comply with environmental and health and safety laws and regulations;non-renewal of key licenses by governmental authorities; timing of receipt of, or failure to comply with, necessary permits and approvals; uncertainty whether some or all of Barrick’s targeted investments and projects will meet the Company’s capital allocation objectives and internal hurdle rate; the impact of global liquidity and credit availability on the timing of cash flows and the values of assets and liabilities based on projected future cash flows; adverse changes in our credit ratings; the impact of inflation; fluctuations in the currency markets; changes in U.S. dollar interest rates; risks arising from holding derivative instruments; changes in national and local government legislation, taxation, controls or regulations and/or changes in the administration of laws, policies and practices, expropriation or nationalization of property and political or economic developments in Canada, the United States and other jurisdictions in which the Company or its affiliates do or may carry on business in the future; lack of certainty with respect to foreign legal systems, corruption and other factors that are inconsistent with the rule of law; risks associated with illegal and artisanal mining; the risks of operating in jurisdictions where infectious diseases present major health care issues; disruption of supply routes which may cause delays in construction and mining activities; damage to the Company’s reputation due to the actual or perceived occurrence of any number of events, including negative publicity with respect to the Company’s handling of environmental matters or dealings with community groups, whether true or not; the possibility that future exploration results will not be consistent with the Company’s expectations; risks that exploration data may be incomplete and considerable additional work may be required to complete further evaluation, including but not limited to drilling,
engineering and socioeconomic studies and investment; risk of loss due to acts of war, terrorism, sabotage and civil disturbances; litigation and legal and administrative proceedings; contests over title to properties, particularly title to undeveloped properties, or over access to water, power and other required infrastructure; business opportunities that may be presented to, or pursued by, the Company; our ability to successfully integrate acquisitions or complete divestitures; risks associated with working with partners in jointly controlled assets; employee relations including loss of key employees; increased costs and physical risks, including extreme weather events and resource shortages, related to climate change; and availability and increased costs associated with mining inputs and labor. In addition, there are risks and hazards associated with the business of mineral exploration, development and mining, including environmental hazards, industrial accidents, unusual or unexpected formations, pressures,cave-ins, flooding and gold bullion, copper cathode or gold or copper concentrate losses (and the risk of inadequate insurance, or inability to obtain insurance, to cover these risks).
Many of these uncertainties and contingencies can affect our actual results and could cause actual results to differ materially from those expressed or implied in any forward-looking statements made by, or on behalf of, us. Readers are cautioned that forward-looking statements are not guarantees of future performance. All of the forward-looking statements made in this press release are qualified by these cautionary statements. Specific reference is made to the most recent Form40-F/Annual Information Form on file with the SEC and Canadian provincial securities regulatory authorities for a more detailed discussion of some of the factors underlying forward-looking statements and the risks that may affect Barrick’s ability to achieve the expectations set forth in the forward-looking statements contained in this press release. We disclaim any intention or obligation to update or revise any forward-looking statements whether as a result of new information, future events or otherwise, except as required by applicable law.