Exhibit 99.1

STRONG Q4 CAPS GREAT YEAR FOR BARRICK
All amounts expressed in U.S. dollars unless otherwise indicated (Unaudited)
Toronto, February 12, 2020 — Barrick Gold Corporation’s gold production for 2019 of 5,465,000 ounces was at the top end of its guidance range while copper production of 432 million pounds was above the guidance range, the company reported today.
Announcing its results for the fourth quarter and the year, the company reported net earnings per share of $2.26 for the year and noted that its adjusted net earnings per share1 were up 46% year-on-year while debt net of cash was halved from 2018 to $2.2 billion. The quarterly dividend was increased by 40% from Q3, to $0.07 cents per share, which was itself a 25% increase from Q2.
In a presentation here, president and chief executive Mark Bristow said the successful formation of the Nevada Gold Mines joint venture during the year had resulted in the North American operations delivering at the midpoint of its production and cost guidance ranges. There were also strong performances from Barrick’s Latin American, Asia Pacific and Africa Middle East operations.
“In the year since the completion of Barrick’s merger with Randgold Resources, we have transformed the new company while creating the world’s largest gold mining complex in Nevada in a transaction that had been unsuccessfully pursued for two decades. The Acacia minorities’ buy-out enabled us to settle that company’s long-running dispute with the Tanzanian government and to integrate its assets into our operations. We’ve also started selling off non-core assets with the disposal of our stakes in the Kalgoorlie gold mine in Australia and the agreed sale of the Massawa project in Senegal,” Bristow said.
Continued on page 2 |
|

Financial and Operating
Highlights
(Unaudited)
| Financial Results | Q4 2019 | Q3 2019 | 2019 | 2018 | ||||||||||||
Realized gold price3,4 | 1,483 | 1,476 | 1,396 | 1,270 | ||||||||||||
($ per ounce) | ||||||||||||||||
Net earnings (loss) | 1,387 | 2,277 | 3,969 | (1,545) | ||||||||||||
($ millions) | ||||||||||||||||
Adjusted net earnings1 | 300 | 264 | 902 | 409 | ||||||||||||
($ millions) | ||||||||||||||||
Net cash provided by operating activities | 875 | 1,004 | 2,833 | 1,765 | ||||||||||||
($ millions) | ||||||||||||||||
Free cash flow5 | 429 | 502 | 1,132 | 365 | ||||||||||||
($ millions) | ||||||||||||||||
Net earnings (loss) per share($) | 0.78 | 1.30 | 2.26 | (1.32) | ||||||||||||
Adjusted net earnings per share1($) | 0.17 | 0.15 | 0.51 | 0.35 | ||||||||||||
Total attributable capital expenditures6($ millions) | 393 | 397 | 1,512 | 1,363 | ||||||||||||
Operating Results
Gold | Q4 2019 | Q3 2019 | 2019 | 2018 | ||||||||||||
Production | 1,439 | 1,306 | 5,465 | 4,527 | ||||||||||||
(000s of ounces) | ||||||||||||||||
Cost of sales7(Barrick’s share) | 1,046 | 1,065 | 1,005 | 892 | ||||||||||||
($ per ounce) | ||||||||||||||||
Total cash costs8 | 692 | 710 | 671 | 588 | ||||||||||||
($ per ounce) | ||||||||||||||||
All-in sustaining costs8 | 923 | 984 | 894 | 806 | ||||||||||||
($ per ounce) | ||||||||||||||||
Copper | ||||||||||||||||
Production | 117 | 112 | 432 | 383 | ||||||||||||
(millions of pounds) | ||||||||||||||||
Cost of sales7(Barrick’s share) | 2.26 | 2.00 | 2.14 | 2.40 | ||||||||||||
($ per pound) | ||||||||||||||||
C1 cash costs9 | 1.90 | 1.62 | 1.69 | 1.97 | ||||||||||||
($ per pound) | ||||||||||||||||
All-in sustaining costs9 | 2.82 | 2.58 | 2.52 | 2.82 | ||||||||||||
($ per pound) | ||||||||||||||||
Key Performance
Indicators
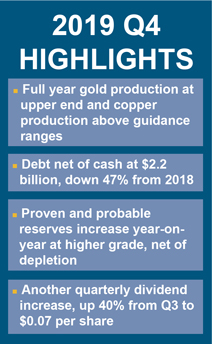
| ◾ | Full year gold production at upper end and copper production above guidance ranges |
| ◾ | Gold costs per ounce down quarter on quarter |
| ◾ | Debt net of cash at $2.2 billion, down 47% from 2018 |
| ◾ | Adjusted net earnings per share1up 46% year on year |
| ◾ | Increased efficiency drives significant year-over-year improvement in copper production and costs |
| ◾ | Successful formation and integration of Nevada Gold Mines JV results in North American operations delivering at midpoint of its production and cost guidance ranges |
| ◾ | Pueblo Viejo expansion evaluation and revised flowsheet enhances project |
| ◾ | Strong performances across the board at Latin American, Asia Pacific and Africa Middle East operations |
| ◾ | Proven and probable reserves increase net of depletionyear-on-year at higher grade |
| ◾ | Tanzanian disputes resolved with signing of framework agreement |
| ◾ | Significant progress made in resolving tax related issues in Mali to pave the way for further investment in the country |
| ◾ | Non-core asset disposals reinforce strategy of concentrated Tier One2asset portfolio |
| ◾ | Exceeded water recycling target of 70%; recycled >70% of water used at our sites |
| ◾ | Another quarterly dividend increase, up 40% from Q3 to $0.07 per share |
Continued from page 1
“We started the year with five Tier One2 gold mines and ended it with six, thanks to the Nevada deal. We’ve also succeeded in replenishing our reserves and resources, net of depletion, at a higher grade.”
Bristow said the pace of these achievements was attributable to a flattened management structure and the transfer of responsibilities from the corporate office to the operations.
“We now have agile multi-disciplinary teams capable not only of executing complex, industry-leading corporate transactions but also of running our operations efficiently while pursuing new growth opportunities,” he said.
“The significant reduction in Barrick’s debt and the growth in its liquidity means that the company is now capable of managing its business and taking advantage of new opportunities independent of the vagaries of the capital
markets. Our organic growth potential alone will support the10-year production plan we’ll be sharing with the market in March and our exploration teams are stocking our future pipeline.”
Bristow noted that there was a strong focus on automation and clean energy across the group, while retaining and building on the operations’ social license remained a priority. Barrick’s commitment to sustainability is evidenced by the fact that more than 80% of the water used by our operations was recycled or reused.
“We believe that our ability to operate successfully depends on our ability to deliver long-term value to shareholders and other stakeholders, including the host countries, and on scrupulously managing our impact on the environment,” he said.
Conference Call and Webcast
Please join us for a conference call and webcast today at 11:00 ET/16:00 GMT to discuss the results.
US and Canada,1-800-319-4610
UK, 0808 101 2791
International, +1 416915-3239
Webcast
The webcast will remain on the website for later viewing, and the conference call will be available for replay by telephone at 1 855 669 9658 (US and Canada) and +1 604 674 8052 (international), access code 3969.

BARRICK INCREASES DIVIDEND 40% FOR Q4 2019
Barrick Gold Corporation today announced that its Board of Directors has declared a dividend for the fourth quarter of 2019 of $0.07 per share, a 40% increase on the previous quarter’s dividend, payable on March 16, 2020 to shareholders of record at the close of business on February 28, 2020.10
Senior executive vice-president and chief financial officer Graham Shuttleworth said this was the third dividend increase this year and reflected the excellent performance for the year and Barrick’s profitability and financial strength.
“The board believes the dividend increase is justified by the significant reduction in net debt and strong balance sheet,
together with the growth in free cash flow supported by a robust5-year plan which we have shared with the market,” said Shuttleworth.
“At the time the Barrick-Randgold merger was announced, the Q3 2018 dividend was 3 cents per share, which was subsequently increased to 4 cents for Q1 2019 after the merger, then increased to 5 cents for Q3 2019 on the back of our strong operating performance, and now to 7 cents for Q4. This is consistent with the company’s stated financial and operating objectives and in line with the commitment to shareholder returns made when the merger with Randgold was announced on September 24, 2018.”
SUSTAINABILITY: AT THE HEART
OF BARRICK’S BUSINESS STRATEGY
Long before the current rise of investor interest in ESG (environmental, sustainability and governance) issues, Barrick and Randgold recognized that their ability to operate successfully was dependent on delivering long-term value to all stakeholders and to minimize their impact on the environment.
“At Barrick, ESG is not somebox-ticking compliance function but a core strategy,” says president and chief executive Mark Bristow. “It starts at the top and permeates through the entire organization, and we believe that if it is managed well, it will drive our ability to deliver long-term profitability. It’s not only a social imperative - it’s a commercial one.”
Grant Beringer, Barrick’s group sustainability executive, says every site is expected to minimize water and energy use, manage waste and land responsibly, and put employee safety first. The operations promote the social and economic development of their communities, and work constantly to form and maintain mutually beneficial partnerships with their stakeholders. Putting ESG into practice requires
accountability to these stakeholders, which is why Barrick reports comprehensively and transparently on its sustainability performance and impacts.
“In 2019, there were no fatalities or high-impact environmental incidents at any of our sites. We recycled more than 70% of the water we used and we made significant progress in curbing our carbon emissions, phasing in solar power at Loulo-Gounkoto, converting the power plant at Pueblo Viejo to natural gas and linking Veladero with grid power. We also developed and implemented biodiversity action plans at our priority sites and we’re on track to roll these out across the group by 2021. Our investment in community development projects exceeded $23 million for the year,” he said.
COMMITMENT TO EXCELLENCE IN GEOLOGY
SECURES SUSTAINABILITY
Barrick’s intensified focus on geocentric principles enables its geologists to increase existing reserves as well as to find their next major discovery, says Rob Krcmarov, executive vice-president, exploration and growth.
“Understanding the orebodies is the key to defining the revenue value of an asset as well as high-quality mine planning. It ensures that every bit of that value can be extracted safely and that the process maximizes the recovery rate,” he says.
“Loulo-Gounkoto and Cortez-Goldrush are prime examples of how orebody knowledge and quality geological work have delivered world-class discoveries, and there is an abundance of similar opportunities across our portfolio.”
Nevada Gold Mines’ holdings encompass more than one million hectares across some of the best-endowed gold trends in North America, and early versions of unified and more sophisticated geological models have already identified new areas of interest there. At Fourmile, the inferred resource was increased by more than 170%11 in 2019 thanks to an improved understanding of the mineralization controls, which also delivered a new high-grade discovery more than a kilometer from the main orebody.
In Latin America, the number of drill targets in the resource triangle had increased threefold by the end of the year. In the highly prospective and under-explored
El Indio belt, advances in exploration technology and improved ore deposit models are being employed to probe for concealed gold deposits.
At Porgera in Papua New Guinea, a new drill hole, hundreds of meters beyond the pit, has validated the exploration team’s prediction that the mineralized system is far larger than currently defined.
Africa remains a target-rich environment, with the Faraba complex in Mali and Bambadji in Senegal looking particularly promising. Both Loulo-Gounkoto in Mali and Kibali in the Democratic Republic of Congo continue to replace their reserves and develop their resource growth opportunities, while at the recently consolidated North Mara mine in Tanzania, a new orebody model has identified an abundant upside.
“All our Tier One2 mines have in excess of 10 years’ worth of reserves at a $1,200/oz gold price. We expect that many of these will yield extensions and additional discoveries and will be producing for years to come. It is significant in this regard to note that Barrick replaced its reserves net of depletion and at a higher grade in 2019,” says Krcmarov.
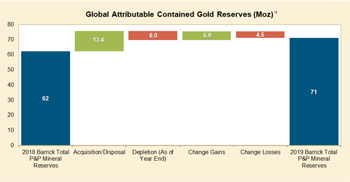
BARRICK GROWS AND IMPROVES RESERVE AND RESOURCE BASE
IN A YEAR OF CHANGE
Barrick’s annual resource and reserve declaration, published today as part of its fourth quarter results, shows an attributable gold mineral reserve increase of 14.5% in ounces at 7.7% higher grade after depletion from mining, reflecting a busy year which included the incorporation of Randgold Resources, the formation of the Nevada Gold Mines joint venture with Newmont and the disposal of KCGM. Attributable reserves now stand at 1,300 million tonnes at 1.68 g/t for 71 million ounces of gold.12 This has been achieved through reserve additions greater than mining depletion at a number of our principal assets including Kibali, Loulo-Gounkoto, Veladero, Porgera, Goldstrike underground mine, Leeville/Portal underground mines, Mega Pit, Turquoise Ridge underground mine, and Phoenix. This was achieved through the refocus on geology as a core discipline within the business and cost improvements at the Nevada joint venture, which allowed for the lowering ofcut-off grades and the increase in reserves.
Global attributable mineral resources also increased, net of depletion with significant inferred mineral resource additions at Robertson and Fourmile in the Cortez district of Nevada, moving these new projects up the resource triangle. Goldrush, Robertson, and Pueblo Viejo contain significant indicated and inferred mineral resources not currently in reserves and are three growth projects from which further reserve growth can be expected in the near future upon completion of feasibility studies. Total attributable measured and indicated mineral resources, now reported inclusive of reserves and at a $1,500/oz gold price stand at 3,400 million tonnes at 1.55 g/t for 170 million ounces, with a further 940 million tonnes at 1.30 g/t for 39 million ounces in the inferred category, highlight the potential for growth in a higher gold price environment.12 All underground mineral resources are now reported within $1,500/oz stope optimizer shells and as such have shown significant growth in ounces albeit at lower grade, but which better reflects the opportunity at higher gold prices.
The Group gold mineral reserve reconciliation is supplied below and explains the changes that occurred during the year. Acquisition and disposal includes the net change to Barrick’s reserves from the Randgold merger, the formation of the
Nevada joint venture, the Acacia minorities’ acquisition, and the disposition of KCGM. Total depletion includes depletion from mining which was offset by gains due to extensions to mineral reserves through drilling andcut-off grade changes. Losses incurred were comprised primarily of the reclassification of Lagunas Norte to mineral resources, plus the removal of the Phase Six pit pushback at Hemlo.
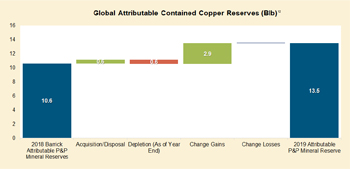
All assets are optimized on the full value of the deposit and as such copper and silver are reported as dedicated mineral resources and reserves for all assets where copper or silver is produced and sold as a primary product orby-product. Total attributable copper mineral reserves now stand at 1,600 million tonnes at 0.38% for 13 billion pounds of contained copper.12The growth of copper mineral reserves was primarily driven by Lumwana due to the reclassification and remodeling of the Chimiwungo pit and cost improvements, with a small contribution from Zaldivar.
Total attributable silver mineral reserves are 900 million tonnes at 5.03 g/t for 150 million ounces of contained silver.12
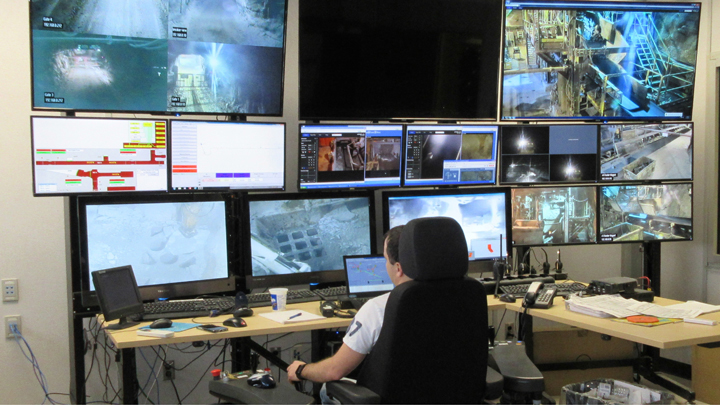
TAKING TECH TO THE NEXT LEVEL
Trials and projects designed to make Barrick’s operations more efficient as well as safer are driving the increased use of technology and automation across the group.
Centres of excellence have been established to advance autonomous applications for both surface and underground operations. This means that rather than having a range of operations trialing different systems, these will be proven on both technological and operating cost grounds at the centres. Should they pass these filters, they will be rolled out across the group.
In Nevada, which is the centre of surface automation and technology development for Barrick, the first stage of a project designed to enable the retrofitting of an autonomous system for Carlin’s haulage fleet has been completed successfully. A number of trucks have already been retrofitted and work is now under way on increasing their speed from 15km/h to 35km/h, and installing portable locators that will allow manned and unmanned operations in the same zone. Following the creation of the Nevada Gold Mines JV, the autonomous drilling trials Barrick and Newmont had been running with different systems have been consolidated and will be tested at Phoenix and Lone Tree this year.
Kibali remains at the leading edge of underground automation in the global gold mining industry. After the implementation of the Sandvik Automine Multifleet system, which allows
multiple autonomous machines to operate on the same haulage level; a trial to utilize this technology on the production levels has been completed successfully. Using the same operations centre as the haulage system, one operator can now control up to three machines acting semi-autonomously in three different zones.
Also at Kibali, the installation of the Newtrax system, which provides real-time visibility of the underground operations, including personnel and equipment tracking and proximity warning, machine health and productivity as well as automated control of ventilation fans, was completed and will be fully commissioned in Q1 of 2020.
With the rapid development of electric vehicles, Barrick has introduced a battery-powered development drill at Hemlo in a first step towards establishing the potential of this new technology. Further trials of battery equipment are planned, predominantly at Turquoise Ridge’s underground operation, where it offers the potential of increasing production without having to make significant changes to the ventilation system.
PEOPLE MAKE A BUSINESS
To build a modern mining business at the top of its field, you needbest-in-class people to run its portfolio ofbest-in-class assets, says president and chief executive Mark Bristow.
“That is why we are promoting a culture of inclusion across the organization and at every level. We’ve flattened the corporate structure to create a larger ownership base, we’re sharing our strategic vision with all employees and theroll-out of team effectiveness programs is reinforcing their understanding of and commitment to our high-performance ethos. I want everyone to come to work in the morning inspired by the desire to help make Barrick the world’s safest, most efficient, and most highly valued company,” he says.
Attracting, training and retaining the right people is obviously the basis of this employee-oriented philosophy. Barrick offers

Pictured: Poupak Bahamin, Barrick’s deputy general counsel
executive and management development programs at leading universities to foster its next generation of world-class leaders. It also invests in and mentors young professionals through rotational training and internship programs for college graduates.
“Our successful recruitment drive is filling our pipeline of future talent with people who come from a broad range of backgrounds but who all have the desire and the ability to buy into the Barrick DNA,” Bristow says.
KEEPING OUR COUNSEL
Rich Haddock has decided to defer his retirement and returns as Barrick’s general counsel in order, he says, to participate in the exciting new developments at the company. He joined Barrick in 1997 and has been involved in some of the most important steps in its growth.
Poupak Bahamin has joined Barrick as deputy general counsel from Norton Rose Fulbright, where she was a partner andco-led its US mining practice. She is the current chair of the World Association of Mining Lawyers.
EXPANSION PROJECT WILL UNLOCK VALUE, EXTEND
LIFE AT PUEBLO VIEJO
Studies continue to support a plant expansion project which will confirm Pueblo Viejo’s status as one of the world’s greatest gold mines by extending its life beyond 2040 at a production rate of some 800,000 ounces per year.13
Barrick president and chief executive Mark Bristow says a substantial portion of the mine’s mineral resources would have been sterilized by the limitation of its tailings storage facility. Alongside the plant expansion project, which will significantly boost throughput, the planned increase in the mine’s tailings management capacity has the potential to convert roughly 11 million ounces of indicated resources to reserves on a 100% basis.
“A study completed last quarter indicated that the throughput increase can be achieved without additional autoclaves. An oxidation upgrade will provide the required capacity at a lower capital and operating cost than the options previously considered,” explained John Steele, Barrick’s Metallurgy, Engineering and Capital Projects Executive.
Pueblo Viejo currently has 9.5 million ounces of gold in reserves. Total measured and indicated mineral resources contain 25 million ounces and thus offer a significant opportunity to expand reserves.14
The mine is an important component of the Dominican Republic’s economy, contributing more than 20% of the country’s annual corporate tax revenue. It operates in close partnership with the government and the community, and recently committed its support for the development of a local cacao-based agribusiness.
BARRICK BACK IN BUSINESS IN TANZANIA
Barrick says it has made significant progress in reshaping the Tanzanian operations it consolidated through the take-over of Acacia Mining in September last year in order to create a sustainable business capable of long-term value creation for its stakeholders.
At a signing ceremony with the President of the United Republic of Tanzania, Dr John Pombe Magufuli, to formalize the establishment of a joint venture between Barrick and the government, Bristow said the joint venture, which will give the government full visibility of and participation in operating decisions made for and by the North Mara, Bulyanhulu and Buzwagi mines, was a pioneering move which would take Barrick’s policy of partnership with its host countries to a new level.
The agreement also ratifies the creation of Twiga Minerals Corporation, the management company jointly owned by the government and Barrick, that will oversee the management of Barrick’s local operations, which are now owned 84% by Barrick and 16% by the government. The deal provides for a 50/50 sharing in the economic benefits generated by the mining operations after the recoupment of capital investments.
Following the ceremony, there are a number of matters which Barrick and the government will work together to implement. In particular, Barrick will partner with the University of Dar es Salaam and commit up to $10 million in funding over a10-year period for training and skills development in the mining industry, and will also commit up to $40 million to upgrade the road between Bulyanhulu and Mwanza as well as constructing a housing compound and related infrastructure.
“Since taking over the operatorship, we have been engaging with local communities to restore the mines’ social license to
operate and we are cooperating closely with the authorities to address the environmental issues at North Mara. In addition, we are working on a local supplier strategy as well as a community development plan to create sustainable economic opportunities for the people around our mines”, Bristow said.
Bristow said there was a strong focus on rationalizing and optimizing mine plans. Following the successful transition to owner mining at North Mara, this has already delivered a reduction in costs and an increase in free cash flow. A similar result is expected at Bulyanhulu, where an integrated study aimed at optimizing the complete orebody should kick-start the resumption of operations there later this year.
“Reflecting our confidence in the potential of this highly prospective gold region, we have budgeted $50 million for brown and greenfields exploration here in 2020 alone and are looking at various opportunities to sustain and expand our operations,” Bristow said.
In line with Barrick’s commitment to employing and advancing locals at its mines, Tanzanian nationals are being recruited and trained to replace expatriate employees as has been done successfully at Barrick’s other African operations. In addition, Acacia’s offices outside Tanzania have been closed, and company records andday-to-day decision-making and accountability have been moved back to the operations in Tanzania.
PIONEERING PARTNERSHIP WITH TANZANIA OFF TO
A STRONG START
Twiga Minerals Corporation, the recently formed joint venture between the Tanzanian government and Barrick, has had its first two board meetings, and Willem Jacobs, Barrick’s chief operating officer for Africa and the Middle East, says the positive energy in the room was palpable.
“Twiga has made a strong start, we’re getting the Tanzanian operations back on track and we’re building a strong foundation for sustainable profitability,” says Jacobs. “We recognize that there’s still a long way to go, considering that we also have to repair the damage these assets suffered during the previous operator’s longstand-off with the government,” he said.
“There are many examples of exploitation by the extractive industries, as well as their hosts. With their short-term focus, these enterprises are incapable of delivering sustainable profitability. Similarly, those governments which flirt with resource nationalization fail to see that the engine of profitability drives their economies. With its ‘Win Together, Lose Together’ creed, Twiga is a true partnership which will create long-term benefits and share them equally.”
KIBALI SOARS PAST GUIDANCE
TO POST ANOTHER RECORD YEAR
Barrick Gold Corporation’s Kibali mine beat its 2019 production guidance of 750,000 ounces of gold by a substantial margin, delivering 814,027 ounces in another record year.15
Barrick president and chief executive Mark Bristow told a media briefing here that Kibali’s continuing stellar performance was a demonstration of how a modern, Tier One2 gold mine could be developed and operated successfully in what is one of the world’s most remote and infrastructurally under-endowed regions. He also noted that in line with Barrick’s policy of employing, training and advancing locals, the mine was managed by a majority Congolese team, supported by a corps of majority Congolese supervisors and personnel.
Already one of the world’s most highly automated underground gold mines, Kibali continues its technological advance with the introduction of truck and drill training simulators and the integration of systems for personnel safety tracking and ventilation demand control. The simulators will also be used to train operators from Barrick’s Tanzanian mines.
“The completion of the Kalimva-Ikamva prefeasibility study has delivered another viable opencast project which will help balance Kibali’s opencast/underground ore ratio and enhance
the flexibility of the mine plan. Down-plunge extension drilling at Gorumbwa has highlighted future underground potential and ongoing conversion drilling at KCD is delivering reserve replenishment. All in all, Kibali is well on track not only to meet its10-year production targets but to extend them beyond this horizon,” Bristow said.
“We’re maintaining a strong focus on energy efficiency through the development of our grid stabilizer project, scheduled for commissioning in the second quarter of 2020. This uses new battery technology to offset the need for running diesel generators as a spinning reserve and ensures we maximize the use of renewable hydro power. The installation of three new elution diesel heaters will also help improve efficiencies and control power costs. It’s worth noting that our clean energy strategy not only achieves cost and efficiency benefits but also once again reduces Kibali’s environmental footprint.”
Bristow said despite the pace of production and the size and complexity of the mine, Kibali was maintaining its solid safety and environmental records, certified by ISO 45001 and ISO 14001 accreditations. It also remained committed to community upliftment and local economic development. In 2019, it spent $158 million with Congolese contractors and suppliers and in December, it started work on a trial section for a new concrete road between Durba and the Watsa bridge.

LOULO-GOUNKOTO COMMITS TO NEW DECADE OF
DELIVERY AND INVESTMENT
Barrick Gold Corporation’s Loulo-Gounkoto complex has again demonstrated its mettle, exceeding its 2019 guidance with production of 714,802 ounces of gold.16
Barrick’s president and chief executive Mark Bristow told a briefing for local media that the complex continued to perform consistently to plan and was still managing to replace depleted reserves through successful brownfields exploration and resource conversion.
“With the development of the complex’s third underground mine scheduled to start in the fourth quarter of this year, and an intensive exploration program in the Kenieba region, Loulo-Gounkoto has significant growth potential and is well-placed to meet all the targets of its10-year plan,” he said.
In line with Barrick’s clean energy strategy, Loulo-Gounkoto is pioneering the group’s first solar power project. This is being developed in four phases, with the first scheduled for commissioning at the end of the first quarter and the last in the fourth quarter of this year. It will add 20MW to the complex’s grid, reduce the unit cost of its power and cut carbon emissions by some 40,000 tonnes per year. Bristow said it would serve as a model for the introduction of solar power elsewhere across Barrick, particularly at its North American operations.
Also being implemented at present is the Ramjack Newtrax project, which is setting the foundation for the automation and monitoring of the complex’s underground mines through a fiber network.
Despite the high activity level, the complex maintained its solid safety record with Lost Time Injuries (LTIs) at Loulo decreasing from four to twoyear-on-year, and Gounkoto recording its second successiveLTI-free year.
Bristow said Loulo-Gounkoto continued to invest in community health, education, and economic development programs. One of these is the agricultural complex established and funded to the tune of $2.2 million.
This has produced its first crop of 48 young farmers who have been installed on 30 new farms and provided not only with the necessary technical and entrepreneurial skills, but with the credit to apply these effectively.
During 2019, Loulo-Gounkoto spent $313 million with local contractors and suppliers and continued developing local businesses by creating a $500,000 provision for an incubation project designed to incorporate local contractors into the mining industry.
“Over the past 23 years, Barrick and its legacy company Randgold Resources have contributed $7.2 billion to the Malian economy in the form of taxes, royalties, salaries and payments to local suppliers. Over the same period, our mines in Mali paid $2.7 billion in dividends, taxes and royalties to the state - almost three times the $1 billion dividend received by Barrick,” Bristow said.
“It is a cardinal principle of Barrick that our host countries and communities should share equitably in the benefits created by our operations. Some, such as skills development and employment creation, cannot be measured, but as these figures demonstrate, the quantifiable value we deliver to Mali is very substantial,” Bristow said.
“This is also the product of a long and constructive partnership between the government of Mali and ourselves, and in this regard it is gratifying to report that we have made significant progress towards settling the dispute between us over tax and related issues which allows us to look forward to continuing to grow our partnership with the Mali government and its people.”
Appendix 1
2020 Operating and Capital Expenditure Guidance
GOLD PRODUCTION AND COSTS |
| |||||||||||||||
| 2020 forecast attributable | 2020 forecast cost of | 2020 forecast total cash | 2020 forecastall-in | |||||||||||||
| production (000s ozs) | sales7($/oz) | costs8($/oz) | sustaining costs8 ($/oz) | |||||||||||||
Carlin (61.5%)17,18 | 1,000 - 1,050 | 920 -970 | 760 - 810 | 1,000 - 1,050 | ||||||||||||
Cortez (61.5%)17 | 450 - 480 | 980 - 1,030 | 640 - 690 | 910 - 960 | ||||||||||||
Turquoise Ridge(61.5%)17 | 430 - 460 | 900 - 950 | 540 - 590 | 690 - 740 | ||||||||||||
Phoenix (61.5%)17 | 100 - 120 | 1,850 - 1,900 | 700 - 750 | 920 - 970 | ||||||||||||
Long Canyon (61.5%)17 | 130 - 150 | 910 - 960 | 240 - 290 | 450 - 500 | ||||||||||||
Nevada Gold Mines(61.5%) | 2,100 - 2,250 | 970 - 1,020 | 660 - 710 | 880 - 930 | ||||||||||||
Hemlo | 200 - 220 | 960 - 1,010 | 800 - 850 | 1,200 - 1,250 | ||||||||||||
North America | 2,300 - 2,450 | 970 - 1,020 | 660 - 710 | 900 - 950 | ||||||||||||
Pueblo Viejo (60%) | 530 - 580 | 840 - 890 | 520 - 570 | 720 - 770 | ||||||||||||
Veladero (50%) | 240 - 270 | 1,220 - 1,270 | 670 - 720 | 1,250 - 1,300 | ||||||||||||
Porgera (47.5%) | 240 - 270 | 890 - 940 | 770 - 820 | 960 - 1,010 | ||||||||||||
Latin America & Asia Pacific | 1,000 - 1,100 | 930 - 980 | 610 - 660 | 890 - 940 | ||||||||||||
Loulo-Gounkoto (80%) | 500 - 540 | 1,050 - 1,100 | 620 - 670 | 970 - 1,020 | ||||||||||||
Kibali (45%) | 340 - 370 | 1,030 - 1,080 | 600 - 650 | 790 - 840 | ||||||||||||
North Mara19 | 240 - 270 | 750 - 800 | 570 - 620 | 830 - 880 | ||||||||||||
Tongon (89.7%) | 240 - 260 | 1,390 - 1,440 | 680 - 730 | 740 - 790 | ||||||||||||
Bulyanhulu19 | 30 - 50 | 1,210 - 1,260 | 790 - 840 | 1,110 - 1,160 | ||||||||||||
Buzwagi19 | 80 - 100 | 850 - 900 | 820 - 870 | 850 - 900 | ||||||||||||
Africa & Middle East | 1,450 - 1,600 | 1,040 - 1,090 | 640 - 690 | 870 - 920 | ||||||||||||
Total Attributable to Barrick20,21,22,23 | 4,800 - 5,200 | 980 - 1,030 | 650 - 700 | 920 - 970 | ||||||||||||
COPPER PRODUCTION AND COSTS |
| |||||||||||||||
| 2020 forecast attributable production (M lbs) | 2020 forecast cost of sales7($/lb) | 2020 forecast C1 cash costs9($/lb) | 2020 forecast all-in sustaining costs9 ($/lb) | |||||||||||||
Lumwana | 250 - 280 | 2.20 - 2.40 | 1.50 - 1.70 | 2.30 - 2.60 | ||||||||||||
Zaldívar (50%) | 120 - 135 | 2.40 - 2.70 | 1.65 - 1.85 | 2.30 - 2.60 | ||||||||||||
Jabal Sayid (50%) | 60 - 70 | 1.75 - 2.00 | 1.40 - 1.60 | 1.50 - 1.70 | ||||||||||||
Total Copper22 | 440 - 500 | 2.10 - 2.40 | 1.50 - 1.80 | 2.20 - 2.50 | ||||||||||||
CAPITAL EXPENDITURES |
| |||||||||||||||
| ($ millions) | ||||||||||||||||
Attributable minesite sustaining |
| 1,300 - 1,500 | ||||||||||||||
Attributable project | 300 - 400 | |||||||||||||||
Total attributable capital expenditures24 |
| 1,600 - 1,900 | ||||||||||||||
| BARRICK YEAR-END 2019 | 14 | PRESS RELEASE |
Appendix 2
Production and Cost Summary
Production and Cost Summary - Gold
| (Unaudited) | For the three months ended | For the years ended | ||||||||||||||||||||||
| 12/31/2019 | 9/30/2019 | % Change | 12/31/2019 | 12/31/2018 | % Change | |||||||||||||||||||
Nevada Gold Mines LLC (61.5%)a | ||||||||||||||||||||||||
Gold produced (000s oz attributable basis) | 585 | 535 | 9 % | 2,218 | 2,368 | (6)% | ||||||||||||||||||
Gold produced (000s oz 100% basis) | 951 | 870 | 9 % | 2,967 | 2,457 | 21 % | ||||||||||||||||||
Cost of sales ($/oz) | 1,038 | 1,027 | 1 % | 924 | 814 | 13 % | ||||||||||||||||||
Total cash costs ($/oz)b | 711 | 693 | 3 % | 634 | 526 | 20 % | ||||||||||||||||||
All-in sustaining costs ($/oz)b | 944 | 946 | 0 % | 828 | 664 | 25 % | ||||||||||||||||||
Cortez (61.5%)c | ||||||||||||||||||||||||
Gold produced (000s oz attributable basis) | 133 | 126 | 6 % | 801 | 1,265 | (37)% | ||||||||||||||||||
Gold produced (000s oz 100% basis) | 216 | 205 | 6 % | 963 | 1,265 | (24)% | ||||||||||||||||||
Cost of sales ($/oz) | 945 | 829 | 14 % | 762 | 659 | 16 % | ||||||||||||||||||
Total cash costs ($/oz)b | 681 | 570 | 19 % | 515 | 351 | 47 % | ||||||||||||||||||
All-in sustaining costs ($/oz)b | 1,012 | 772 | 31 % | 651 | 430 | 51 % | ||||||||||||||||||
Carlin (61.5%)d | ||||||||||||||||||||||||
Gold produced (000s oz attributable basis) | 276 | 278 | (1)% | 968 | 835 | 16 % | ||||||||||||||||||
Gold produced (000s oz 100% basis) | 449 | 452 | (1)% | 1,315 | 835 | 57 % | ||||||||||||||||||
Cost of sales ($/oz) | 975 | 1,007 | (3)% | 1,004 | 1,054 | (5)% | ||||||||||||||||||
Total cash costs ($/oz)b | 766 | 775 | (1)% | 746 | 740 | 1 % | ||||||||||||||||||
All-in sustaining costs ($/oz)b | 965 | 1,014 | (5)% | 984 | 983 | 0 % | ||||||||||||||||||
Turquoise Ridge (61.5%)e | ||||||||||||||||||||||||
Gold produced (000s oz attributable basis) | 111 | 82 | 35 % | 335 | 268 | 25 % | ||||||||||||||||||
Gold produced (000s oz 100% basis) | 181 | 133 | 35 % | 504 | 357 | 41 % | ||||||||||||||||||
Cost of sales ($/oz) | 971 | 1,077 | (10)% | 846 | 783 | 8 % | ||||||||||||||||||
Total cash costs ($/oz)b | 625 | 622 | 0 % | 585 | 678 | (14)% | ||||||||||||||||||
All-in sustaining costs ($/oz)b | 800 | 840 | (5)% | 732 | 756 | (3)% | ||||||||||||||||||
Phoenix (61.5%)f | ||||||||||||||||||||||||
Gold produced (000s oz attributable basis) | 31 | 25 | 24 % | 56 | ||||||||||||||||||||
Gold produced (000s oz 100% basis) | 50 | 41 | 24 % | 91 | ||||||||||||||||||||
Cost of sales ($/oz) | 2,025 | 2,186 | (7)% | 2,093 | ||||||||||||||||||||
Total cash costs ($/oz)b | 902 | 1,010 | (11)% | 947 | ||||||||||||||||||||
All-in sustaining costs ($/oz)b | 1,034 | 1,622 | (36)% | 1,282 | ||||||||||||||||||||
Long Canyon (61.5%)f | ||||||||||||||||||||||||
Gold produced (000s oz attributable basis) | 34 | 24 | 42 % | 58 | ||||||||||||||||||||
Gold produced (000s oz 100% basis) | 55 | 39 | 42 % | 94 | ||||||||||||||||||||
Cost of sales ($/oz) | 1,026 | 1,170 | (12)% | 1,088 | ||||||||||||||||||||
Total cash costs ($/oz)b | 317 | 353 | (10)% | 333 | ||||||||||||||||||||
All-in sustaining costs ($/oz)b | 657 | 714 | (8)% | 681 | ||||||||||||||||||||
Pueblo Viejo (60%) | ||||||||||||||||||||||||
Gold produced (000s oz attributable basis) | 179 | 139 | 29 % | 590 | 581 | 2 % | ||||||||||||||||||
Gold produced (000s oz 100% basis) | 298 | 232 | 29 % | 983 | 968 | 2 % | ||||||||||||||||||
Cost of sales ($/oz) | 660 | 807 | (18)% | 747 | 750 | 0 % | ||||||||||||||||||
Total cash costs ($/oz)b | 422 | 504 | (16)% | 471 | 465 | 1 % | ||||||||||||||||||
All-in sustaining costs ($/oz)b | 517 | 631 | (18)% | 592 | 623 | (5)% | ||||||||||||||||||
| BARRICK YEAR-END 2019 | 15 | PRESS RELEASE |
Production and Cost Summary - Gold (continued)
| (Unaudited) | For the three months ended | For the years ended | ||||||||||||||||||||||
| 12/31/2019 | 9/30/2019 | % Change | 12/31/19 | 12/31/18 | % Change | |||||||||||||||||||
Loulo-Gounkoto (80%)g | ||||||||||||||||||||||||
Gold produced (000s oz attributable basis) | 144 | 153 | (6)% | 572 | ||||||||||||||||||||
Gold produced (000s oz 100% basis) | 180 | 191 | (6)% | 715 | ||||||||||||||||||||
Cost of sales ($/oz) | 1,037 | 1,018 | 2 % | 1,044 | ||||||||||||||||||||
Total cash costs ($/oz)b | 631 | 630 | 0 % | 634 | ||||||||||||||||||||
All-in sustaining costs ($/oz)b | 917 | 966 | (5)% | 886 | ||||||||||||||||||||
Kibali (45%)g | ||||||||||||||||||||||||
Gold produced (000s oz attributable basis) | 87 | 91 | (4)% | 366 | ||||||||||||||||||||
Gold produced (000s oz 100% basis) | 193 | 202 | (4)% | 813 | ||||||||||||||||||||
Cost of sales ($/oz) | 1,205 | 1,187 | 2 % | 1,111 | ||||||||||||||||||||
Total cash costs ($/oz)b | 608 | 554 | 10 % | 568 | ||||||||||||||||||||
All-in sustaining costs ($/oz)b | 740 | 703 | 5 % | 693 | ||||||||||||||||||||
Kalgoorlie (50%)h | ||||||||||||||||||||||||
Gold produced (000s oz attributable basis) | 36 | 58 | (38)% | 206 | 314 | (34)% | ||||||||||||||||||
Gold produced (000s oz 100% basis) | 72 | 116 | (38)% | 413 | 628 | (34)% | ||||||||||||||||||
Cost of sales ($/oz) | 1,127 | 1,037 | 9 % | 1,062 | 899 | 18 % | ||||||||||||||||||
Total cash costs ($/oz)b | 940 | 856 | 10 % | 873 | 732 | 19 % | ||||||||||||||||||
All-in sustaining costs ($/oz)b | 1,172 | 1,170 | 0 % | 1,183 | 857 | 38 % | ||||||||||||||||||
Tongon (89.7%)g | ||||||||||||||||||||||||
Gold produced (000s oz attributable basis) | 61 | 62 | (2)% | 245 | ||||||||||||||||||||
Gold produced (000s oz 100% basis) | 68 | 69 | (2)% | 273 | ||||||||||||||||||||
Cost of sales ($/oz) | 1,476 | 1,396 | 6 % | 1,469 | ||||||||||||||||||||
Total cash costs ($/oz)b | 803 | 793 | 1 % | 787 | ||||||||||||||||||||
All-in sustaining costs ($/oz)b | 867 | 869 | 0 % | 844 | ||||||||||||||||||||
Porgera (47.5%) | ||||||||||||||||||||||||
Gold produced (000s oz attributable basis) | 82 | 75 | 9 % | 284 | 204 | 39 % | ||||||||||||||||||
Gold produced (000s oz 100% basis) | 172 | 158 | 9 % | 597 | 429 | 39 % | ||||||||||||||||||
Cost of sales ($/oz) | 909 | 1,024 | (11)% | 994 | 996 | 0 % | ||||||||||||||||||
Total cash costs ($/oz)b | 757 | 868 | (13)% | 838 | 796 | 5 % | ||||||||||||||||||
All-in sustaining costs ($/oz)b | 894 | 1,053 | (15)% | 1,003 | 1,083 | (7)% | ||||||||||||||||||
Veladero (50%)i | ||||||||||||||||||||||||
Gold produced (000s oz attributable basis) | 71 | 58 | 22 % | 274 | 278 | (1)% | ||||||||||||||||||
Gold produced (000s oz 100% basis) | 142 | 116 | 22 % | 548 | 556 | (1)% | ||||||||||||||||||
Cost of sales ($/oz) | 1,138 | 1,243 | (8)% | 1,188 | 1,112 | 7 % | ||||||||||||||||||
Total cash costs ($/oz)b | 710 | 773 | (8)% | 734 | 629 | 17 % | ||||||||||||||||||
All-in sustaining costs ($/oz)b | 1,142 | 1,142 | 0 % | 1,105 | 1,154 | (4)% | ||||||||||||||||||
Hemlo | ||||||||||||||||||||||||
Gold produced (000s oz) | 54 | 49 | 10 % | 213 | 171 | 25 % | ||||||||||||||||||
Cost of sales ($/oz) | 1,632 | 1,083 | 51 % | 1,137 | 1,157 | (2)% | ||||||||||||||||||
Total cash costs ($/oz)b | 1,091 | 953 | 14 % | 904 | 1,046 | (14)% | ||||||||||||||||||
All-in sustaining costs ($/oz)b | 1,380 | 1,280 | 8 % | 1,140 | 1,318 | (14)% | ||||||||||||||||||
North Maraj | ||||||||||||||||||||||||
Gold produced (000s oz attributable basis) | 103 | 29 | 255 % | 251 | 215 | 17 % | ||||||||||||||||||
Gold produced (000s oz 100% basis) | 103 | 45 | 129 % | 334 | 336 | (1)% | ||||||||||||||||||
Cost of sales ($/oz) | 1,021 | 907 | 13 % | 953 | 795 | 20 % | ||||||||||||||||||
Total cash costs ($/oz)b | 675 | 603 | 12 % | 646 | 603 | 7 % | ||||||||||||||||||
All-in sustaining costs ($/oz)b | 830 | 850 | (2)% | 802 | 830 | (3)% | ||||||||||||||||||
| BARRICK YEAR-END 2019 | 16 | PRESS RELEASE |
| (Unaudited) | For the three months ended | For the years ended | ||||||||||||||||||||||
| 12/31/2019 | 9/30/2019 | % Change | 12/31/19 | 12/31/18 | % Change | |||||||||||||||||||
Buzwagij | ||||||||||||||||||||||||
Gold produced (000s oz attributable basis) | 28 | 18 | 56 % | 83 | 93 | (11)% | ||||||||||||||||||
Gold produced (000s oz 100% basis) | 28 | 28 | — % | 115 | 146 | (21)% | ||||||||||||||||||
Cost of sales ($/oz) | 1,235 | 1,292 | (4)% | 1,240 | 939 | 32 % | ||||||||||||||||||
Total cash costs ($/oz)b | 1,144 | 1,202 | (5)% | 1,156 | 916 | 26 % | ||||||||||||||||||
All-in sustaining costs ($/oz)b | 1,169 | 1,220 | (4)% | 1,178 | 947 | 24 % | ||||||||||||||||||
Bulyanhuluj | ||||||||||||||||||||||||
Gold produced (000s oz attributable basis) | 9 | 6 | 50 % | 27 | 26 | 4 % | ||||||||||||||||||
Gold produced (000s oz 100% basis) | 9 | 9 | — % | 37 | 41 | (10)% | ||||||||||||||||||
Cost of sales ($/oz) | 1,293 | 1,288 | 0 % | 1,207 | 1,231 | (2)% | ||||||||||||||||||
Total cash costs ($/oz)b | 752 | 729 | 3 % | 676 | 650 | 4 % | ||||||||||||||||||
All-in sustaining costs ($/oz)b | 909 | 769 | 18 % | 773 | 754 | 3 % | ||||||||||||||||||
Total Attributable to Barrickk | ||||||||||||||||||||||||
Gold produced (000s oz attributable basis) | 1,439 | 1,306 | 10 % | 5,465 | 4,527 | 21 % | ||||||||||||||||||
Cost of sales ($/oz)l | 1,046 | 1,065 | (2)% | 1,005 | 892 | 13 % | ||||||||||||||||||
Total cash costs ($/oz)b | 692 | 710 | (3)% | 671 | 588 | 14 % | ||||||||||||||||||
All-in sustaining costs ($/oz)b | 923 | 984 | (6)% | 894 | 806 | 11 % | ||||||||||||||||||
| a. | Represents the combined results of Cortez, Goldstrike (including our 60% share of South Arturo) and our 75% interest in Turquoise Ridge until June 30, 2019. Commencing July 1, 2019, the date Nevada Gold Mines was established, the results represent our 61.5% interest in Cortez, Carlin (including Goldstrike and 60% of South Arturo), Turquoise Ridge (including Twin Creeks), Phoenix and Long Canyon. |
| b. | These arenon-GAAP financial performance measures with no standardized meaning under IFRS and therefore may not be comparable to similar measures presented by other issuers. For further information and a detailed reconciliation of eachnon-GAAP measure used in this section of the press release to the most directly comparable IFRS measure, please see pages 91 to 112 of our fourth quarter 2019 MD&A. |
| c. | On July 1, 2019, Cortez was contributed to Nevada Gold Mines, a joint venture with Newmont. As a result, the amounts presented are on an 100% basis up until June 30, 2019, and on a 61.5% basis thereafter. |
| d. | On July 1, 2019, Barrick’s Goldstrike and Newmont’s Carlin were contributed to Nevada Gold Mines and are now referred to as Carlin. As a result, the amounts presented represent Goldstrike on a 100% basis (including our 60% share of South Arturo) up until June 30, 2019, and the combined results of Carlin and Goldstrike (including our 60% share of South Arturo) on a 61.5% basis thereafter. |
| e. | Barrick owned 75% of Turquoise Ridge through to the end of the second quarter of 2019, with our joint venture partner, Newmont, owning the remaining 25%. Turquoise Ridge was proportionately consolidated on the basis that the joint venture partners that have joint control have rights to the assets and obligations for the liabilities relating to the arrangement. The figures presented in this table are based on our 75% interest in Turquoise Ridge until June 30, 2019. On July 1, 2019, Barrick’s 75% interest in Turquoise Ridge and Newmont’s Twin Creeks and 25% interest in Turquoise Ridge were contributed to Nevada Gold Mines. Starting July 1, 2019, the results represent our 61.5% share of Turquoise Ridge and Twin Creeks, now referred to as Turquoise Ridge. |
| f. | These sites were acquired as a result of the formation of Nevada Gold Mines on July 1, 2019. |
| g. | These sites did not form a part of the Barrick consolidated results in 2018 and 2017 as these sites were acquired as a result of the Merger. |
| h. | On November 28, 2019, we completed the sale of our 50% interest in Kalgoorlie in Western Australia to Saracen Mineral Holdings Limited for total cash consideration of $750 million. Accordingly, these represent our 50% interest until November 28, 2019. |
| i. | On June 30, 2017, we sold 50% of Veladero; therefore, these represent results on a 100% basis from January 1 to June 30, 2017 and on a 50% basis from July 1, 2017 onwards |
| j. | Formerly known as Acacia Mining plc. On September 17, 2019, Barrick acquired all of the shares of Acacia it did not own. Operating results are included at 100% from October 1, 2019 (notwithstanding the completion of the Acacia transaction on September 17, 2019, we consolidated our interest in Acacia and recorded anon-controlling interest of 36.1% in the income statement for the entirety of the third quarter of 2019 as a matter of convenience) up until the GoT’s 16% free-carried interest is made effective, which is expected to be January 1, 2020, and on an 84% basis thereafter. |
| k. | With the end of mining at Golden Sunlight and Morila in the second quarter and Lagunas Norte in the third quarter as previously reported, we have ceased to include production ornon-GAAP cost metrics for these sites from July 1, 2019 and October 1, 2019, respectively, onwards although these sites are included in the Total Attributable to Barrick in the prior period comparatives. |
| l. | Cost of sales per ounce (Barrick’s share) is calculated as cost of sales - gold on an attributable basis (excluding sites in care and maintenance) divided by gold equity ounces sold. |
| BARRICK YEAR-END 2019 | 17 | PRESS RELEASE |
Production and Cost Summary - Copper
| (Unaudited) | For the three months ended | For the years ended | ||||||||||||||||||||||
| 12/31/2019 | 9/30/2019 | % Change | 12/31/19 | 12/31/18 | % Change | |||||||||||||||||||
Lumwana | ||||||||||||||||||||||||
Copper production (millions lbs) | 63 | 65 | (3)% | 238 | 224 | 6 % | ||||||||||||||||||
Cost of sales ($/lb) | 2.22 | 2.04 | 9 % | 2.13 | 2.51 | (15)% | ||||||||||||||||||
C1 cash costs ($/lb)a | 2.10 | 1.83 | 15 % | 1.79 | 2.08 | (14)% | ||||||||||||||||||
All-in sustaining costs ($/lb)a | 3.41 | 3.66 | (7)% | 3.04 | 3.08 | (1)% | ||||||||||||||||||
Zaldívar (50%) | ||||||||||||||||||||||||
Copper production (millions lbs attributable basis) | 36 | 32 | 13 % | 128 | 104 | 23 % | ||||||||||||||||||
Copper produced (millions lbs 100% basis) | 72 | 64 | 13 % | 256 | 208 | 23 % | ||||||||||||||||||
Cost of sales ($/lb) | 2.59 | 2.18 | 19 % | 2.46 | 2.55 | (4)% | ||||||||||||||||||
C1 cash costs ($/lb)a | 1.95 | 1.55 | 26 % | 1.77 | 1.97 | (10)% | ||||||||||||||||||
All-in sustaining costs ($/lb)a | 2.56 | 1.91 | 34 % | 2.15 | 2.47 | (13)% | ||||||||||||||||||
Jabal Sayid (50%) | ||||||||||||||||||||||||
Copper production (millions lbs attributable basis) | 18 | 15 | 20 % | 66 | 55 | 20 % | ||||||||||||||||||
Copper produced (millions lbs 100% basis) | 36 | 30 | 20 % | 132 | 110 | 20 % | ||||||||||||||||||
Cost of sales ($/lb) | 1.47 | 1.63 | (10)% | 1.53 | 1.73 | (12)% | ||||||||||||||||||
C1 cash costs ($/lb)a | 1.29 | 1.42 | (9)% | 1.26 | 1.53 | (18)% | ||||||||||||||||||
All-in sustaining costs ($/lb)a | 1.78 | 1.65 | 8 % | 1.51 | 1.92 | (21)% | ||||||||||||||||||
Total Copper | ||||||||||||||||||||||||
Copper production (millions lbs attributable basis) | 117 | 112 | 4 % | 432 | 383 | 13 % | ||||||||||||||||||
Cost of sales ($/lb)b | 2.26 | 2.00 | 13 % | 2.14 | 2.40 | (11)% | ||||||||||||||||||
C1 cash costs ($/lb)a | 1.90 | 1.62 | 17 % | 1.69 | 1.97 | (14)% | ||||||||||||||||||
All-in sustaining costs ($/lb)a | 2.82 | 2.58 | 9 % | 2.52 | 2.82 | (11)% | ||||||||||||||||||
| a. | These arenon-GAAP financial performance measures with no standardized meaning under IFRS and therefore may not be comparable to similar measures presented by other issuers. For further information and a detailed reconciliation of eachnon-GAAP measure used in this section of the MD&A to the most directly comparable IFRS measure, please see pages 91 to 112 of our fourth quarter 2019 MD&A. |
| b. | Cost of sales per pound (Barrick’s share) is calculated as cost of sales - copper plus our equity share of cost of sales attributable to Zaldívar and Jabal Sayid divided by copper pounds sold. |
| BARRICK YEAR-END 2019 | 18 | PRESS RELEASE |
Appendix 3
2020 Outlook Assumptions and Economic Sensitivity Analysis
Outlook Assumptions and Economic Sensitivity Analysis
| 2020 Guidance Assumption | Hypothetical Change | Impact on EBITDA (millions)25 | Impact onAll-in Sustaining Costs8,9 | |||||
Gold revenue, net of royalties | $1,350/oz | +/- $100/oz | +/- $472 | +/- $4/oz | ||||
Copper revenue, net of royalties | $2.75/lb | +/- $0.50/lb | +/- $224 | +/- $0.02/lb | ||||
TECHNICAL INFORMATION
The scientific and technical information contained in this press release has been reviewed and approved by Steven Yopps, MMSA, Director - Metallurgy, North America; Craig Fiddes, North America Resource Modeling Manager; Chad Yuhasz, P.Geo, Mineral Resource Manager, Latin America and Australia Pacific; Simon Bottoms, CGeol, MGeol, FGS, MAusIMM, Mineral Resources Manager: Africa and Middle East; Rodney Quick, MSc, Pr. Sci.Nat, Mineral Resource Management and Evaluation Executive; John Steele, CIM, Metallurgy, Engineering and Capital Projects Executive; and Rob Krcmarov, FAusIMM, Executive Vice President, Exploration and Growth – each a “Qualified Person” as defined in National Instrument43-101 –Standards of Disclosure for Mineral Projects.
All mineral reserve and mineral resource estimates are estimated in accordance with National Instrument43-101 –Standards of Disclosure for Mineral Projects. Unless otherwise noted, such mineral reserve and mineral resource estimates are as of December 31, 2019.
Endnotes
Endnote 1
In this press release of unaudited financial results, “adjusted net earnings” and “adjusted net earnings per share” arenon-GAAP financial performance measures. Adjusted net earnings excludes the following from net earnings: certain impairment charges (reversals) related to intangibles, goodwill, property, plant and equipment, and investments; gains (losses) and otherone-time costs relating to acquisitions or dispositions; foreign currency translation gains (losses); significant tax adjustments not related to current period earnings; unrealized gains (losses) onnon-hedge derivative instruments; and the tax effect andnon-controlling interest of these items. The Company uses this measure internally to evaluate our underlying operating performance for the reporting periods presented and to assist with the planning and forecasting of future operating results. Barrick believes that adjusted net earnings is a useful measure of our performance because these adjusting items do not reflect the underlying operating performance of our core mining business and are not necessarily indicative of future operating results. Adjusted net earnings and adjusted net earnings per share are intended to provide additional information only and do not have any standardized meaning under IFRS and may not be comparable to similar measures of performance presented by other companies. They should not be considered in isolation or as a substitute for measures of performance prepared in accordance with IFRS. Further details on thesenon-GAAP measures are provided in the MD&A accompanying Barrick’s financial statements filed from time to time on SEDAR at www.sedar.com and on EDGAR at www.sec.gov.
| BARRICK YEAR-END 2019 | 19 | PRESS RELEASE |
Reconciliation of Net Earnings to Net Earnings per Share, Adjusted Net Earnings and Adjusted Net Earnings per Share
(Unaudited)
| ($ millions, except per share amounts in dollars) | For the three months ended | For the years ended | ||||||||||||||||||
| 12/31/19 | 9/30/19 | 12/31/19 | 12/31/18 | 12/31/17 | ||||||||||||||||
Net earnings (loss) attributable to equity holders of the Company | 1,387 | 2,277 | 3,969 | (1,545 | ) | 1,438 | ||||||||||||||
Impairment charges (reversals) related to long-lived assetsa | (566 | ) | (872 | ) | (1,423 | ) | 900 | (212 | ) | |||||||||||
Acquisition/disposition (gains) lossesb | (414 | ) | (1,901 | ) | (2,327 | ) | (68 | ) | (911 | ) | ||||||||||
(Gain) loss on currency translation | 53 | 40 | 109 | 136 | 72 | |||||||||||||||
Significant tax adjustmentsc | 74 | 35 | 34 | 742 | 244 | |||||||||||||||
Other (income) expense adjustmentsd | (845 | ) | 53 | (687 | ) | 366 | 178 | |||||||||||||
Unrealized gains (losses) onnon-hedge derivative instruments | 0 | 1 | 0 | 1 | (1 | ) | ||||||||||||||
Tax effect andnon-controlling intereste | 611 | 631 | 1,227 | (123 | ) | 68 | ||||||||||||||
Adjusted net earnings | 300 | 264 | 902 | 409 | 876 | |||||||||||||||
Net earnings (loss) per sharef | 0.78 | 1.30 | 2.26 | (1.32 | ) | 1.23 | ||||||||||||||
Adjusted net earnings per sharef | 0.17 | 0.15 | 0.51 | 0.35 | 0.75 | |||||||||||||||
| a. | Net impairment reversals for the current year primarily relate tonon-current asset reversals at Pueblo Viejo, partially offset by impairment charges at Pascua-Lama in the fourth quarter of 2019. This was further impacted bynon-current asset reversals at Lumwana in the third quarter of 2019. Net impairment charges for 2018 primarily relate tonon-current asset impairments at Lagunas Norte andnon-current asset and goodwill impairments at Veladero. |
| b. | Acquisition/disposition gains for the current year primarily relate to the gain on the sale of our 50% interest in Kalgoorlie in the fourth quarter of 2019 and the gain on the remeasurement of Turquoise Ridge to fair value as a result of its contribution to Nevada Gold Mines in the third quarter of 2019. |
| c. | Significant tax adjustments in 2018 primarily relate to thede-recognition of our Canadian and Peruvian deferred tax assets. |
| d. | Other expense adjustments for the current year primarily relate to the gain on thede-recognition of the deferred revenue liability relating to our silver sale agreement with Wheaton Precious Metals Corp. and the gain on a tax settlement at Lumwana, both occurring in the fourth quarter of 2019. |
| e. | Tax effect andnon-controlling interest for the current year primarily relates to the impairment charges related to long-lived assets. |
| f. | Calculated using weighted average number of shares outstanding under the basic method of earnings per share. |
Endnote 2
A Tier One Gold Asset is a mine with a stated life in excess of 10 years, annual production of at least 500,000 ounces of gold and total cash costs per ounce over the mine life that are in the lower half of the industry cost curve.
Endnote 3
Includes Tanzania on a 63.9% basis (notwithstanding the completion of the Acacia transaction on September 17, 2019, we consolidated our interest in Acacia and recorded anon-controlling interest of 36.1% in the income statement for the entirety of the third quarter of 2019 as a matter of convenience), Pueblo Viejo on a 60% basis, South Arturo on a 60% basis (36.9% from July 1, 2019 onwards as a result of its contribution to Nevada Gold Mines), and Veladero on a 50% basis, which reflects our equity share of production and sales. Also includes Loulo-Gounkoto on an 80% basis, Kibali on a 45% basis, Tongon on an 89.7% basis and Morila on a 40% basis, which reflects our equity share of production and sales, commencing January 1, 2019, the effective date of the Merger. Also removes thenon-controlling interest of 38.5% Nevada Gold Mines from July 1, 2019 onwards.
Endnote 4
“Realized price” is anon-GAAP financial measure which excludes from sales: unrealized gains and losses onnon-hedge derivative contracts; unrealizedmark-to-market gains and losses on provisional pricing from copper and gold sales contracts; sales attributable to ore purchase arrangements; treatment and refining charges; export duties; and cumulativecatch-up adjustments to revenue relating to our streaming arrangements. This measure is intended to enable Management to better understand the price realized in each reporting period for gold and copper sales because unrealizedmark-to-market values ofnon-hedge gold and copper derivatives are subject to change each period due to changes in market factors such as market and forward gold and copper prices, so that prices ultimately realized may differ from those recorded. The exclusion of such unrealizedmark-to-market gains and losses from the presentation of this performance measure enables investors to understand performance based on the realized proceeds of selling gold and copper production. The realized price measure is intended to provide additional information and does not have any standardized definition under IFRS and should not be considered in isolation or as a substitute for measures of performance prepared in accordance with IFRS. Further details on thesenon-GAAP measures are provided in the MD&A accompanying Barrick’s financial statements filed from time to time on SEDAR at www.sedar.com and on EDGAR at www.sec.gov.
| BARRICK YEAR-END 2019 | 20 | PRESS RELEASE |
Reconciliation of Sales to Realized Price per ounce/pound
(Unaudited)
($ millions, except per ounce/ pound information in dollars) | Gold | Copper | Gold | Copper | ||||||||||||||||||||||||||||||||||||
| For the three months ended | For the years ended | |||||||||||||||||||||||||||||||||||||||
| 12/31/19 | 9/30/19 | 12/31/19 | 9/30/19 | 12/31/19 | 12/31/18 | 12/31/17 | 12/31/19 | 12/31/18 | 12/31/17 | |||||||||||||||||||||||||||||||
Sales | 2,758 | 2,585 | 82 | 45 | 9,186 | 6,600 | 7,631 | 393 | 512 | 608 | ||||||||||||||||||||||||||||||
Sales applicable to non-controlling interests | (769 | ) | (748 | ) | 0 | 0 | (1,981 | ) | (734 | ) | (810 | ) | 0 | 0 | 0 | |||||||||||||||||||||||||
Sales applicable to equity method investmentsa,b | 139 | 140 | 147 | 100 | 543 | 0 | 0 | 492 | 442 | 427 | ||||||||||||||||||||||||||||||
Realizednon-hedge gold/copper derivative (losses) gains | 0 | 0 | 0 | 0 | 1 | 2 | 3 | 0 | 0 | 0 | ||||||||||||||||||||||||||||||
Sales applicable to sites in care and maintenancec | (56 | ) | (32 | ) | 0 | 0 | (140 | ) | (111 | ) | (153 | ) | 0 | 0 | 0 | |||||||||||||||||||||||||
Treatment and refinement charges | 0 | 0 | 25 | 18 | 0 | 1 | 1 | 99 | 144 | 157 | ||||||||||||||||||||||||||||||
Export duties | 0 | 0 | 0 | 0 | 0 | (1 | ) | 0 | 0 | 0 | 0 | |||||||||||||||||||||||||||||
Otherd | 22 | 0 | 0 | 0 | 22 | 12 | 0 | 0 | 0 | 0 | ||||||||||||||||||||||||||||||
Revenues – as adjusted | 2,094 | 1,945 | 254 | 163 | 7,631 | 5,769 | 6,672 | 984 | 1,098 | 1,192 | ||||||||||||||||||||||||||||||
Ounces/pounds sold (000s ounces/ millions pounds)c | 1,413 | 1,318 | 91 | 65 | 5,467 | 4,544 | 5,302 | 355 | 382 | 405 | ||||||||||||||||||||||||||||||
Realized gold/copper price per ounce/ pounde | 1,483 | 1,476 | 2.76 | 2.55 | 1,396 | 1,270 | 1,258 | 2.77 | 2.88 | 2.95 | ||||||||||||||||||||||||||||||
| a. | Represents sales of $130 million and $505 million, respectively, for the three months and year ended December 31, 2019 (September 30, 2019: $133 million; 2018: $nil; 2017: $nil) applicable to our 45% equity method investment in Kibali and $9 million and $39 million, respectively (September 30, 2019: $8 million; 2018: $nil; 2017: $nil) applicable to our 40% equity method investment in Morila for gold. Represents sales of $110 million and $343 million for the three months and year ended December 31, 2019 (September 30, 2019: $66 million; 2018: $300 million; 2017: $325 million) applicable to our 50% equity method investment in Zaldívar and $43 million and $168 million, respectively (September 30, 2019: $37 million; 2018: $161 million; 2017: $116 million) applicable to our 50% equity method investment in Jabal Sayid. |
| b. | Sales applicable to equity method investments are net of treatment and refinement charges. |
| c. | Figures exclude Pierina, Golden Sunlight and Morila starting in the third quarter of 2019, and Lagunas Norte starting in the fourth quarter of 2019 from the calculation of realized price per ounce, which are mining incidental ounces as they enter closure. |
| d. | Represents cumulativecatch-up adjustment to revenue relating to our streaming arrangements. |
| e. | Realized price per ounce/pound may not calculate based on amounts presented in this table due to rounding. |
Endnote 5
“Free cash flow” is anon-GAAP financial performance measure which deducts capital expenditures from net cash provided by operating activities. Barrick believes this to be a useful indicator of our ability to operate without reliance on additional borrowing or usage of existing cash. Free cash flow is intended to provide additional information only and does not have any standardized meaning under IFRS and may not be comparable to similar measures of performance presented by other companies. Free cash flow should not be considered in isolation or as a substitute for measures of performance prepared in accordance with IFRS. Further details on thisnon-GAAP measure are provided in the MD&A accompanying Barrick’s financial statements filed from time to time on SEDAR at www.sedar.com and on EDGAR at www.sec.gov.
Reconciliation of Net Cash Provided by Operating Activities to Free Cash Flow
(Unaudited)
| ($ millions) | For the three months ended | For the years ended | ||||||||||||||||||
| 12/31/19 | 9/30/19 | 12/31/19 | 12/31/18 | 12/31/17 | ||||||||||||||||
Net cash provided by operating activities | 875 | 1,004 | 2,833 | 1,765 | 2,065 | |||||||||||||||
Capital expenditures | (446 | ) | (502 | ) | (1,701 | ) | (1,400 | ) | (1,396 | ) | ||||||||||
Free cash flow | 429 | 502 | 1,132 | 365 | 669 | |||||||||||||||
Endnote 6
These amounts are presented on the same basis as our guidance and include our 60% share of Pueblo Viejo and South Arturo (36.9% of South Arturo from July 1, 2019 onwards as a result of its contribution to Nevada Gold Mines), our 63.9% share of Tanzania until September 30, 2019 (notwithstanding the completion of the Acacia transaction on September 17, 2019, we consolidated our interest in Acacia and recorded anon-controlling interest of 36.1% in the income statement for the entirety of the third quarter of 2019 as a matter of convenience) and our 50% share of Zaldívar and Jabal Sayid. Also includes our 80% share of Loulo-Gounkoto, 89.7% share of Tongon, 45% share of Kibali and 40% share of Morila commencing January 1, 2019, the effective date of the Merger. Starting July 1, 2019, it also includes our 61.5% share of Nevada Gold Mines.
| BARRICK YEAR-END 2019 | 21 | PRESS RELEASE |
Endnote 7
Cost of sales applicable to gold per ounce is calculated using cost of sales applicable to gold on an attributable basis (removing thenon-controlling interest of 40% Pueblo Viejo, 36.1% Tanzania until September 30, 2019 (notwithstanding the completion of the Acacia transaction on September 17, 2019, we consolidated our interest in Acacia and recorded anon-controlling interest of 36.1% in the income statement for the entirety of the third quarter of 2019 as a matter of convenience) and 40% South Arturo from cost of sales (63.1% of South Arturo from July 1, 2019 onwards as a result of its contribution to Nevada Gold Mines)), divided by attributable gold ounces. Thenon-controlling interest of 20% Loulo-Gounkoto and 10.3% of Tongon is also removed from cost of sales and our proportionate share of cost of sales attributable to equity method investments (Kibali and Morila) is included commencing January 1, 2019, the effective date of the Merger. Also removes thenon-controlling interest of 38.5% Nevada Gold Mines from cost of sales from July 1, 2019 onwards. Cost of sales applicable to copper per pound is calculated using cost of sales applicable to copper including our proportionate share of cost of sales attributable to equity method investments (Zaldívar and Jabal Sayid), divided by consolidated copper pounds (including our proportionate share of copper pounds from our equity method investments).
Endnote 8
“Total cash costs” per ounce,“All-in sustaining costs” per ounce and“All-in costs” per ounce arenon-GAAP financial performance measures. “Total cash costs” per ounce starts with cost of sales related to gold production but removes depreciation, thenon-controlling interest of cost of sales, and includesby-product credits.“All-in sustaining costs” per ounce begin with “Total cash costs” per ounce and add further costs which reflect the expenditures made to maintain current production levels, primarily sustaining capital expenditures, sustaining leases, general & administrative costs, minesite exploration and evaluation costs, and reclamation cost accretion and amortization.“All-in costs” per ounce starts with“All-in sustaining costs” per ounce and adds additional costs that reflect the varying costs of producing gold over the life-cycle of a mine, including: project capital expenditures and othernon-sustaining costs. Barrick believes that the use of “total cash costs” per ounce,“all-in sustaining costs” per ounce and“All-in costs” per ounce will assist investors, analysts and other stakeholders in understanding the costs associated with producing gold, understanding the economics of gold mining, assessing our operating performance and also our ability to generate free cash flow from current operations and to generate free cash flow on an overall Company basis. “Total cash costs” per ounce,“All-in sustaining costs” per ounce and“All-in costs” per ounce are intended to provide additional information only and do not have any standardized meaning under IFRS. Although a standardized definition ofall-in sustaining costs was published in 2013 by the World Gold Council (a market development organization for the gold industry comprised of and funded by 25 gold mining companies from around the world, including Barrick), it is not a regulatory organization, and other companies may calculate this measure differently. Starting from the first quarter of 2019, we have renamed “cash costs” to “total cash costs” when referring to our gold operations. The calculation of total cash costs is identical to our previous calculation of cash costs with only a change in the naming convention of thisnon-GAAP measure. These measures should not be considered in isolation or as a substitute for measures prepared in accordance with IFRS. Further details on thesenon-GAAP measures are provided in the MD&A accompanying Barrick’s financial statements filed from time to time on SEDAR at www.sedar.com and on EDGAR at www.sec.gov.
| BARRICK YEAR-END 2019 | 22 | PRESS RELEASE |
Reconciliation of Gold Cost of Sales to Total cash costs,All-in sustaining costs andAll-in costs, including on a per ounce basis
(Unaudited)
| ($ millions, except per ounce information in dollars) | For the three months ended | For the years ended | ||||||||||||||||||||
| Footnote | 12/31/19 | 9/30/19 | 12/31/19 | 12/31/18 | 12/31/17 | |||||||||||||||||
Cost of sales applicable to gold production | 1,896 | 1,831 | 6,514 | 4,621 | 4,836 | |||||||||||||||||
Depreciation | (549 | ) | (538 | ) | (1,902 | ) | (1,253 | ) | (1,529 | ) | ||||||||||||
Cash cost of sales applicable to equity method investments | 57 | 45 | 226 | 0 | 0 | |||||||||||||||||
By-product credits | (43 | ) | (48 | ) | (138 | ) | (131 | ) | (135 | ) | ||||||||||||
Realized (gains) losses on hedge andnon-hedge derivatives | a | 1 | 1 | 1 | 3 | 23 | ||||||||||||||||
Non-recurring items | b | (22 | ) | (4 | ) | (55 | ) | (172 | ) | 0 | ||||||||||||
Other | c | (37 | ) | (19 | ) | (102 | ) | (87 | ) | (106 | ) | |||||||||||
Non-controlling interests | d | (326 | ) | (339 | ) | (878 | ) | (313 | ) | (299 | ) | |||||||||||
Total cash costs | 977 | 929 | 3,666 | 2,668 | 2,790 | |||||||||||||||||
General & administrative costs | 31 | 68 | 212 | 265 | 248 | |||||||||||||||||
Minesite exploration and evaluation costs | e | 24 | 22 | 69 | 45 | 47 | ||||||||||||||||
Minesite sustaining capital expenditures | f | 394 | 406 | 1,320 | 975 | 1,109 | ||||||||||||||||
Sustaining leases | 4 | 5 | 27 | 0 | 0 | |||||||||||||||||
Rehabilitation - accretion and amortization (operating sites) | g | 7 | 28 | 65 | 81 | 64 | ||||||||||||||||
Non-controlling interest, copper operations and other | h | (135 | ) | (184 | ) | (470 | ) | (374 | ) | (273 | ) | |||||||||||
All-in sustaining costs | 1,302 | 1,274 | 4,889 | 3,660 | 3,985 | |||||||||||||||||
Project exploration and evaluation and project costs | e | 60 | 64 | 273 | 338 | 307 | ||||||||||||||||
Community relations costs not related to current operations | 0 | 1 | 2 | 4 | 4 | |||||||||||||||||
Project capital expenditures | f | 46 | 96 | 370 | 459 | 273 | ||||||||||||||||
Rehabilitation - accretion and amortization (non-operating sites) | g | 3 | 5 | 22 | 33 | 20 | ||||||||||||||||
Non-controlling interest and copper operations and other | h | (28 | ) | (46 | ) | (105 | ) | (21 | ) | (21 | ) | |||||||||||
All-in costs | 1,383 | 1,394 | 5,451 | 4,473 | 4,568 | |||||||||||||||||
Ounces sold - equity basis (000s ounces) | i | 1,413 | 1,318 | 5,467 | 4,544 | 5,302 | ||||||||||||||||
Cost of sales per ounce | j,k | 1,046 | 1,065 | 1,005 | 892 | 794 | ||||||||||||||||
Total cash costs per ounce | k | 692 | 710 | 671 | 588 | 526 | ||||||||||||||||
Total cash costs per ounce (on aco-product basis) | k,l | 712 | 735 | 689 | 607 | 544 | ||||||||||||||||
All-in sustaining costs per ounce | k | 923 | 984 | 894 | 806 | 750 | ||||||||||||||||
All-in sustaining costs per ounce (on aco-product basis) | k,l | 943 | 1,009 | 912 | 825 | 768 | ||||||||||||||||
All-in costs per ounce | k | 976 | 1,074 | 996 | 985 | 860 | ||||||||||||||||
All-in costs per ounce (on aco-product basis) | k,l | 996 | 1,099 | 1,014 | 1,004 | 878 | ||||||||||||||||
| a. | Realized (gains) losses on hedge andnon-hedge derivatives |
Includes realized hedge losses of $nil and $nil for the three months and year ended December 31, 2019, respectively (September 30, 2019: $nil; 2018: $4 million; 2017: $27 million), and realizednon-hedge losses of $1 million and $1 million for the three months and year ended December 31, 2019, respectively (September 30, 2019: $1 million; 2018: gains of $1 million; 2017: gains of $4 million).
| b. | Non-recurring items |
Non-recurring items in 2019 relate to organizational restructuring. These costs are not indicative of our cost of production and have been excluded from the calculation of total cash costs.
| c. | Other |
Other adjustments for the three months and year ended December 31, 2019 include the removal of total cash costs andby-product credits associated with our Pierina mine, Golden Sunlight and Morila starting in the third quarter of 2019, and Lagunas Norte starting in the fourth quarter of 2019, which all are mining incidental ounces as they enter closure, of $35 million and $92 million, respectively (September 30, 2019: $19 million; 2018: $87 million; 2017: $108 million).
| BARRICK YEAR-END 2019 | 23 | PRESS RELEASE |
| d. | Non-controlling interests |
Non-controlling interests includenon-controlling interests related to gold production of $477 million and $1,306 million, respectively, for the three months and year ended December 31, 2019 (September 30, 2019: $506 million; 2018: $453 million; 2017: $454 million).Non-controlling interests include Pueblo Viejo and Tanzania until September 30, 2019 (notwithstanding the completion of the Acacia transaction on September 17, 2019, we consolidated our interest in Acacia and recorded anon-controlling interest of 36.1% in the income statement for the entirety of the third quarter of 2019 as a matter of convenience). Starting January 1, 2019, the effective date of the Merger,non-controlling interests also include Loulo-Gounkoto and Tongon and starting July 1, 2019, it also includes Nevada Gold Mines.
| e. | Exploration and evaluation costs |
Exploration, evaluation and project expenses are presented as minesite if it supports current mine operations and project if it relates to future projects. Refer to page 84 of the Fourth Quarter 2019 MD&A.
| f. | Capital expenditures |
Capital expenditures are related to our gold sites only and are presented on a 100% cash basis starting from January 1, 2019 and on a 100% accrued basis for 2018 and 2017. They are split between minesite sustaining and project capital expenditures. Project capital expenditures are distinct projects designed to increase the net present value of the mine and are not related to current production. Significant projects in the current year are stripping at Rangefront declines, Cortez Crossroads, the Goldrush exploration declines, the Deep South Expansion, and construction of the third shaft at Turquoise Ridge. Refer to page 83 of the Fourth Quarter 2019 MD&A.
| g. | Rehabilitation - accretion and amortization |
Includes depreciation on the assets related to rehabilitation provisions of our gold operations and accretion on the rehabilitation provisions of our gold operations, split between operating andnon-operating sites.
| h. | Non-controlling interest and copper operations |
Removes general & administrative costs related tonon-controlling interests and copper based on a percentage allocation of revenue. Also removes exploration, evaluation and project expenses, rehabilitation costs and capital expenditures incurred by our copper sites and thenon-controlling interest of our Tanzania operations until September 30, 2019 (notwithstanding the completion of the Acacia transaction on September 17, 2019, we consolidated our interest in Acacia and recorded anon-controlling interest of 36.1% in the income statement for the entirety of the third quarter of 2019 as a matter of convenience) and Pueblo Viejo and South Arturo (63.1% of South Arturo from July 1, 2019 onwards as a result of its contribution to Nevada Gold Mines). Also removes thenon-controlling interest of our Loulo-Gounkoto and Tongon operating segments commencing January 1, 2019, the effective date of the Merger, and of Nevada Gold Mines starting July 1, 2019. It also includes capital expenditures applicable to equity method investments. Figures remove the impact of Pierina, Golden Sunlight and Morila starting in the third quarter of 2019, and Lagunas Norte starting in the fourth quarter of 2019. The impact is summarized as the following:
| ($ millions) | For the three months ended | For the years ended | ||||||||||||||||||
| Non-controlling interest, copper operations and other | 12/31/19 | 9/30/19 | 12/31/19 | 12/31/18 | 12/31/17 | |||||||||||||||
General & administrative costs | (3 | ) | (22 | ) | (58 | ) | (104 | ) | (21 | ) | ||||||||||
Minesite exploration and evaluation costs | (6 | ) | (9 | ) | (16 | ) | (3 | ) | (12 | ) | ||||||||||
Rehabilitation - accretion and amortization (operating sites) | (1 | ) | (10 | ) | (13 | ) | (6 | ) | (10 | ) | ||||||||||
Minesite sustaining capital expenditures | (125 | ) | (143 | ) | (383 | ) | (261 | ) | (230 | ) | ||||||||||
All-in sustaining costs total | (135 | ) | (184 | ) | (470 | ) | (374 | ) | (273 | ) | ||||||||||
Project exploration and evaluation and project costs | (14 | ) | (12 | ) | (54 | ) | (16 | ) | (17 | ) | ||||||||||
Project capital expenditures | (14 | ) | (34 | ) | (51 | ) | (5 | ) | (4 | ) | ||||||||||
All-in costs total | (28 | ) | (46 | ) | (105 | ) | (21 | ) | (21 | ) | ||||||||||
| i. | Ounces sold - equity basis |
Figures remove the impact of Pierina, Golden Sunlight and Morila starting in the third quarter of 2019, and Lagunas Norte starting in the fourth quarter of 2019, which are mining incidental ounces as the sites enter closure.
| j. | Cost of sales per ounce |
Figures remove the cost of sales impact of Pierina of $14 million and $113 million, respectively, for the three months and year ended December 31, 2019 (September 30, 2019: $28 million; 2018: $116 million; 2017: $174 million); starting in the third quarter of 2019, Golden Sunlight of $nil and $1 million, respectively, for the three months and year ended December 31, 2019 (September 30, 2019: $1 million; 2018: $nil; 2017: $nil) and Morila of $13 million and $23 million, respectively, for the three months and year ended December 31, 2019 (September 30, 2019: $10 million; 2018: $nil; 2017: $nil); and starting in the fourth quarter of 2019, Lagunas Norte of $26 million and $26 million, respectively, for the three months and year ended December 31, 2019 (September 30, 2019: $nil; 2018: $nil; 2017: $nil), which are mining incidental ounces as these sites enter closure. Cost of sales per ounce excludesnon-controlling interest related to gold production. Cost of sales applicable to gold per ounce is calculated using cost of sales on an attributable basis (removing thenon-controlling interest of 40% Pueblo Viejo, 36.1% Tanzania until September 30, 2019 (notwithstanding the completion of the Acacia transaction on September 17, 2019, we consolidated our interest in Acacia and recorded anon-controlling interest of 36.1% in the income statement for the entirety of the third quarter of 2019 as a matter of convenience) and 40% South Arturo from cost of sales (63.1% of South Arturo from July 1, 2019 onwards as a result of its contribution to Nevada Gold Mines)), divided by attributable gold ounces. Thenon-controlling interest of 20% Loulo-Gounkoto and 10.3% of Tongon is also removed from cost of sales and our proportionate share of cost of sales attributable to equity method investments (Kibali and Morila) is included commencing January 1, 2019, the effective date of the Merger. Also removes thenon-controlling interest of 38.5% Nevada Gold Mines from cost of sales from July 1, 2019 onwards.
| k. | Per ounce figures |
Cost of sales per ounce, cash costs per ounce,all-in sustaining costs per ounce andall-in costs per ounce may not calculate based on amounts presented in this table due to rounding.
| l. | Co-product costs per ounce |
Cash costs per ounce,all-in sustaining costs per ounce andall-in costs per ounce presented on aco-product basis remove the impact ofby-product credits of our gold production (net ofnon-controlling interest) calculated as:
| ($ millions) | For the three months ended | For the years ended | ||||||||||||||||||
| 12/31/19 | 9/30/19 | 12/31/19 | 12/31/18 | 12/31/17 | ||||||||||||||||
By-product credits | 43 | 48 | 138 | 131 | 135 | |||||||||||||||
Non-controlling interest | (17 | ) | (16 | ) | (48 | ) | (45 | ) | (30 | ) | ||||||||||
By-product credits (net ofnon-controlling interest) | 26 | 32 | 90 | 86 | 105 | |||||||||||||||
| BARRICK YEAR-END 2019 | 24 | PRESS RELEASE |
Endnote 9
“C1 cash costs” per pound and“All-in sustaining costs” per pound arenon-GAAP financial performance measures. “C1 cash costs” per pound is based on cost of sales but excludes the impact of depreciation and royalties and production taxes and includes treatment and refinement charges.“All-in sustaining costs” per pound begins with “C1 cash costs” per pound and adds further costs which reflect the additional costs of operating a mine, primarily sustaining capital expenditures, general & administrative costs and royalties and production taxes. Barrick believes that the use of “C1 cash costs” per pound and“all-in sustaining costs” per pound will assist investors, analysts, and other stakeholders in understanding the costs associated with producing copper, understanding the economics of copper mining, assessing our operating performance, and also our ability to generate free cash flow from current operations and to generate free cash flow on an overall Company basis. “C1 cash costs” per pound and“All-in sustaining costs” per pound are intended to provide additional information only, do not have any standardized meaning under IFRS, and may not be comparable to similar measures of performance presented by other companies. These measures should not be considered in isolation or as a substitute for measures of performance prepared in accordance with IFRS. Further details on thesenon-GAAP measures are provided in the MD&A accompanying Barrick’s financial statements filed from time to time on SEDAR at www.sedar.com and on EDGAR at www.sec.gov.
Reconciliation of Copper Cost of Sales to C1 cash costs andAll-in sustaining costs, including on a per pound basis
(Unaudited)
| ($ millions, except per pound information in dollars) | For the three months ended | For the years ended | ||||||||||||||||||
| 12/31/19 | 9/30/19 | 12/31/19 | 12/31/18 | 12/31/17 | ||||||||||||||||
Cost of sales | 80 | 49 | 361 | 558 | 399 | |||||||||||||||
Depreciation/amortization | (17 | ) | (13 | ) | (100 | ) | (170 | ) | (83 | ) | ||||||||||
Treatment and refinement charges | 25 | 18 | 99 | 144 | 157 | |||||||||||||||
Cash cost of sales applicable to equity method investments | 94 | 59 | 288 | 281 | 245 | |||||||||||||||
Less: royalties and production taxesa | (9 | ) | (5 | ) | (35 | ) | (44 | ) | (38 | ) | ||||||||||
By-product credits | (1 | ) | (3 | ) | (9 | ) | (6 | ) | (5 | ) | ||||||||||
Other | 0 | 0 | (5 | ) | (11 | ) | 0 | |||||||||||||
C1 cash cost of sales | 172 | 105 | 599 | 752 | 675 | |||||||||||||||
General & administrative costs | 3 | 5 | 19 | 28 | 12 | |||||||||||||||
Rehabilitation - accretion and amortization | 7 | 2 | 15 | 16 | 12 | |||||||||||||||
Royalties and production taxes | 9 | 5 | 35 | 44 | 38 | |||||||||||||||
Minesite exploration and evaluation costs | 2 | 1 | 6 | 4 | 6 | |||||||||||||||
Minesite sustaining capital expenditures | 60 | 48 | 215 | 220 | 204 | |||||||||||||||
Sustaining leases | 3 | 0 | 5 | 0 | 0 | |||||||||||||||
Inventory write-downs | 0 | 0 | 0 | 11 | 0 | |||||||||||||||
All-in sustaining costs | 256 | 166 | 894 | 1,075 | 947 | |||||||||||||||
Pounds sold - consolidated basis (millions pounds) | 91 | 65 | 355 | 382 | 405 | |||||||||||||||
Cost of sales per poundb,c | 2.26 | 2.00 | 2.14 | 2.40 | 1.77 | |||||||||||||||
C1 cash cost per poundb | 1.90 | 1.62 | 1.69 | 1.97 | 1.66 | |||||||||||||||
All-in sustaining costs per poundb | 2.82 | 2.58 | 2.52 | 2.82 | 2.34 | |||||||||||||||
| a. | For the three months and year ended December 31, 2019, royalties and production taxes include royalties of $8 million and $34 million, respectively (September 30, 2019: $5 million, 2018: $39 million and 2017: $38 million ). |
| b. | Cost of sales per pound, C1 cash costs per pound andall-in sustaining costs per pound may not calculate based on amounts presented in this table due to rounding. |
| c. | Cost of sales per pound related to copper is calculated using cost of sales including our proportionate share of cost of sales attributable to equity method investments (Zaldívar and Jabal Sayid), divided by consolidated copper pounds sold (including our proportionate share of copper pounds sold from our equity method investments). |
Endnote 10
The declaration and payment of dividends is at the discretion of the Board of Directors, and will depend on the Company’s financial results, cash requirements, prospects, and other factors deemed relevant by the Board.
Endnote 11
Estimated in accordance with National Instrument43-101 as required by Canadian securities regulatory authorities. Estimates are as of December 31, 2019. Fourmile inferred resources were 5.4 million tonnes at 10.9 g/t for 1.9 million ounces of gold as at December 31, 2019 compared to 1.2 million ounces at 18.6 g/t for 700,000 ounces of gold as at December 31, 2018. Complete mineral reserve and resource data, including tonnes, grades, and ounces, as well as the assumptions on which the mineral reserves for Barrick are reported, are set out in Barrick’s Q4 2019 Report issued on February 12, 2020.
| BARRICK YEAR-END 2019 | 25 | PRESS RELEASE |
Endnote 12
Estimated in accordance with National Instrument43-101 as required by Canadian securities regulatory authorities. Estimates are as of December 31, 2019, unless otherwise noted. Proven reserves of 280 million tonnes grading 2.42 g/t, representing 22 million ounces of gold; 420 million tonnes grading 0.4%, representing 3,700 million pounds of copper; and 150 million tonnes grading 4.31 g/t, representing 21 million ounces of silver. Probable reserves of 1,000 million tonnes grading 1.48 g/t, representing 49 million ounces of gold; 1,200 million tonnes grading 0.38%, representing 9,800 million pounds of copper; and 750 million tonnes grading 5.18 g/t, representing 120 million ounces of silver. Measured resources of 530 million tonnes grading 2.21 g/t, representing 37 million ounces of gold; 660 million tonnes grading 0.38%, representing 5,500 million pounds of copper; and 350 million tonnes grading 12.52 g/t, representing 140 million ounces of silver. Indicated resources of 2,800 million tonnes grading 1.43 g/t, representing 130 million ounces of gold; 2,400 million tonnes grading 0.38%, representing 21,000 million pounds of copper; and 2,000 million tonnes grading 13.44 g/t, representing 870 million ounces of silver. Inferred resources of 940 million tonnes grading 1.3 g/t, representing 39 million ounces of gold; 430 million tonnes grading 0.2%, representing 2,200 million pounds of copper; and 460 million tonnes grading 3.20 g/t, representing 47 million ounces of silver. Complete mineral reserve and resource data, including tonnes, grades, and ounces, as well as the assumptions on which the mineral reserves for Barrick are reported (on an attributable basis), are set out in Barrick’s Q4 2019 Report issued on February 12, 2020.
Estimates as of December 31, 2018, unless otherwise noted are proven reserves of 344.6 million tonnes grading 2.15 g/t, representing 23.9 million ounces of gold, and 169.2 million tonnes grading 0.59%, representing 2.195 billion pounds of copper. Probable reserves of 0.9 billion tonnes grading 1.33 g/t, representing 38.4 million ounces of gold, and 452.7 million tonnes grading 0.55%, representing 5.454 billion pounds of copper. Complete 2018 mineral reserve and resource data, including tonnes, grades, and ounces, can be found on pages33-45 of Barrick’s Annual InformationForm/Form 40-F for the year ended December 31, 2018 on file with Canadian provincial securities regulatory authorities and the U.S. Securities and Exchange Commission.
Endnote 13
For additional detail regarding Pueblo Viejo, see the Technical Report on the Pueblo Viejo mine, Sanchez Ramirez Province, Dominican Republic, dated March 19, 2018, and filed on SEDAR at www.sedar.com and EDGAR at www.sec.gov on March 23, 2018.
Endnote 14
Estimated in accordance with National Instrument43-101 as required by Canadian securities regulatory authorities. Estimates for Pueblo Viejo are as of December 31, 2019 (100% basis). Proven reserves of 16.83 million tonnes grading 2.68 g/t, representing 1.45 million ounces of gold. Probable reserves of 102.29 million tonnes grading 2.46 g/t, representing 8.08 million ounces of gold. Measured resources of 133.46 million tonnes grading 2.41 g/t, representing 10.35 million ounces of gold. Indicated resources of 206.77 million tonnes grading 2.25 g/t, representing 14.96 million ounces of gold. Inferred resources of 54.27 million tonnes grading 2.10 g/t, representing 3.67 million ounces of gold. Complete mineral reserve and resource data, including tonnes, grades, and ounces, as well as the assumptions on which the mineral reserves for Barrick are reported (on an attributable basis), are set out in Barrick’s Q4 2019 Report issued on February 12, 2020.
Endnote 15
On a 100% basis. Our 2019 attributable gold production forecast (45%) was 330 - 350 thousand ounces for Kibali.
Endnote 16
On a 100% basis. Our 2019 attributable production forecast (80%) was 520 - 570 thousand ounces for Loulo-Gounkoto.
Endnote 17
These five operations are part of Nevada Gold Mines from July 1, 2019. Amounts include Cortez (100%), Goldstrike (100%) and Turquoise Ridge (75%), also known collectively as Barrick Nevada, from January 1, 2019 to June 30, 2019, and Cortez, Carlin (which includes Goldstrike), Turquoise Ridge (including Twin Creeks), Phoenix and Long Canyon on a 61.5% basis from July 1, 2019 onwards as a result of the formation of Nevada Gold Mines with Newmont on July 1, 2019.
Endnote 18
Includes our 60% share of South Arturo from January 1, 2019 to June 30, 2019 and 36.9% from July 1, 2019 onwards as a result of the formation of Nevada Gold Mines with Newmont on July 1, 2019.
Endnote 19
Formerly known as Acacia Mining plc. On September 17, 2019, Barrick acquired all of the shares of Acacia it did not own. Operating results are included at 100% from October 1, 2019 (notwithstanding the completion of the Acacia transaction on September 17, 2019, we consolidated our interest in Acacia and recorded anon-controlling interest of 36.1% in the income statement for the entirety of the third quarter of 2019 as a matter of convenience) up until the GoT’s 16% free-carried interest is made effective, which is expected to be January 1, 2020, and on an 84% basis thereafter. As the GoT’s 16% free-carried interest is expected to be made effective in January 2020, our 2020 outlook represents our 84% share.
| BARRICK YEAR-END 2019 | 26 | PRESS RELEASE |
Endnote 20
Also includes Lagunas Norte, Golden Sunlight, and Morila (40%) and excludes Pierina which is mining incidental ounces as it enters closure. Due to the planned ramp down of operations, we have ceased to include production ornon-GAAP cost metrics for Golden Sunlight or Morila after the second quarter and Lagunas Norte after the third quarter.
Endnote 21
Total cash costs andall-in sustaining costs per ounce include costs allocated tonon-operating sites.
Endnote 22
Operating division guidance ranges reflect expectations at each individual operating division, and may not add up to the company-wide guidance range total. The company-wide 2019 results and guidance ranges exclude Pierina, which is mining incidental ounces as it enters closure, and Golden Sunlight and Morila after the second quarter of 2019 and Lagunas Norte after the third quarter of 2019 due to the planned ramp down of operations.
Endnote 23
Includes corporate administration costs.
Endnote 24
Attributable capital expenditures are presented on the same basis as guidance, which includes our 61.5% share of Nevada Gold Mines, our 60% share of Pueblo Viejo, our 80% share of Loulo-Gounkoto, our 89.7% share of Tongon, our 84% share of North Mara, Bulyanhulu and Buzwagi and our 50% share of Zaldívar and Jabal Sayid. As the GoT’s 16% free-carried interest is expected to be made effective as of January 1, 2020, our 2020 outlook represents our 84% share of North Mara, Bulyanhulu and Buzwagi.
Endnote 25
EBITDA is anon-GAAP financial measure, which excludes the following from net earnings: income tax expense; finance costs; finance income; and depreciation. Management believes that EBITDA is a valuable indicator of our ability to generate liquidity by producing operating cash flow to fund working capital needs, service debt obligations, and fund capital expenditures. Management uses EBITDA for this purpose. Adjusted EBITDA removes the effect of impairment charges; acquisition/disposition gains/losses; foreign currency translation gains/losses; other expense adjustments; unrealized gains onnon-hedge derivative instruments; and the impact of the income tax expense, finance costs, finance income and depreciation incurred in our equity method accounted investments. We believe these items provide a greater level of consistency with the adjusting items included in our Adjusted Net Earnings reconciliation, with the exception that these amounts are adjusted to remove any impact on finance costs/income, income tax expense and/or depreciation as they do not affect EBITDA. We believe this additional information will assist analysts, investors and other stakeholders of Barrick in better understanding our ability to generate liquidity from our full business, including equity method investments, by excluding these amounts from the calculation as they are not indicative of the performance of our core mining business and not necessarily reflective of the underlying operating results for the periods presented. EBITDA and adjusted EBITDA are intended to provide additional information only and do not have any standardized meaning under IFRS and may not be comparable to similar measures of performance presented by other companies. They should not be considered in isolation or as a substitute for measures of performance prepared in accordance with IFRS. Further details on thesenon-GAAP measures are provided in the MD&A accompanying Barrick’s financial statements filed from time to time on SEDAR at www.sedar.com and on EDGAR at www.sec.gov.
| BARRICK YEAR-END 2019 | 27 | PRESS RELEASE |
Reconciliation of Net Earnings to EBITDA and Adjusted EBITDA
(Unaudited)
($ millions) | For the three months ended | For the years ended | ||||||||||||||||||
| 12/31/19 | 9/30/19 | 12/31/19 | 12/31/18 | 12/31/17 | ||||||||||||||||
Net earnings (loss) | 1,776 | 2,435 | 4,574 | (1,435) | 1,516 | |||||||||||||||
Income tax expense | 784 | 791 | 1,783 | 1,198 | 1,231 | |||||||||||||||
Finance costs, neta | 90 | 106 | 394 | 458 | 624 | |||||||||||||||
Depreciation | 572 | 559 | 2,032 | 1,457 | 1,647 | |||||||||||||||
EBITDA | 3,222 | 3,891 | 8,783 | 1,678 | 5,018 | |||||||||||||||
Impairment charges (reversals) of long-lived assetsb | (566) | (872) | (1,423) | 900 | (212) | |||||||||||||||
Acquisition/disposition (gains)/lossesc | (414) | (1,901) | (2,327) | (68) | (911) | |||||||||||||||
Foreign currency translation (gains)/losses | 53 | 40 | 109 | 136 | 72 | |||||||||||||||
Other (income) expense adjustmentsd | (845) | 53 | (687) | 336 | 51 | |||||||||||||||
Unrealized gains onnon-hedge derivative instruments | 0 | 1 | 0 | 1 | (1) | |||||||||||||||
| Income tax expense, net finance costsa, and depreciation from equity investees | 112 | 85 | 378 | 97 | 98 | |||||||||||||||
Adjusted EBITDA | 1,562 | 1,297 | 4,833 | 3,080 | 4,115 | |||||||||||||||
| a. | Finance costs exclude accretion. |
| b. | Net impairment reversals for the current year primarily relate tonon-current asset reversals at Pueblo Viejo, partially offset by impairment charges at Pascua-Lama in the fourth quarter of 2019. This was further impacted bynon-current asset reversals at Lumwana in the third quarter of 2019. Net impairment charges for 2018 primarily relate tonon-current asset impairments at Lagunas Norte andnon-current asset and goodwill impairments at Veladero. |
| c. | Acquisition/disposition gains for the current year primarily relate to the gain on the sale of our 50% interest in Kalgoorlie in the fourth quarter of 2019 and the gain on the remeasurement of Turquoise Ridge to fair value as a result of its contribution to Nevada Gold Mines in the third quarter of 2019. |
| d. | Other expense adjustments for the current year primarily relate to the gain on thede-recognition of the deferred revenue liability relating to our silver sale agreement with Wheaton Precious Metals Corp. and the gain on a tax settlement at Lumwana, both occurring in the fourth quarter of 2019. |
| BARRICK YEAR-END 2019 | 28 | PRESS RELEASE |
MANAGEMENT’S DISCUSSION AND ANALYSIS (“MD&A”)
Management’s Discussion and Analysis (“MD&A”) is intended to help the reader understand Barrick Gold Corporation (“Barrick”, “we”, “our” or the “Company”), our operations, financial performance and the present and future business environment. This MD&A has been prepared as of February 12, 2020 for the year ended December 31, 2019. Unless otherwise indicated, all amounts are presented in US dollars.
For the purposes of preparing our MD&A, we consider the materiality of information. Information is considered material if: (i) such information results in, or would reasonably be expected to result in, a significant change in the market price or value of our shares; (ii) there is a substantial likelihood that a reasonable investor would consider it important in making
an investment decision; or (iii) it would significantly alter the total mix of information available to investors. We evaluate materiality with reference to all relevant circumstances, including potential market sensitivity.
Continuous disclosure materials, including our most recentForm 40-F/Annual Information Form, annual MD&A, audited consolidated financial statements, and Notice of Annual Meeting of Shareholders and Proxy Circular will be available on our website at www.barrick.com, on SEDAR at www.sedar.com and on EDGAR at www.sec.gov. For an explanation of terminology unique to the mining industry, readers should refer to the glossary on page 118.
CAUTIONARY STATEMENT ON FORWARD-LOOKING INFORMATION
Barrick cautions that, whether or not expressly stated, all full year and fourth quarter figures contained in this MD&A reflect our expected full year and fourth quarter results as of the date of this MD&A. Actual audited full year and fourth quarter results are subject to management’s final review, as well as review by the Company’s independent accounting firm, and may vary significantly from those expectations because of a number of factors, including, without limitation, additional or revised information, and changes in accounting standards or policies, or in how those standards are applied. For a complete picture of the Company’s financial performance, it will be necessary to review all of the information in the Company’s full year and fourth quarter financial report and related MD&A as filed on SEDAR at www.sedar.com and on EDGAR at www.sec.gov. Accordingly, readers are cautioned not to rely solely on the information contained herein.
Certain information contained or incorporated by reference in this MD&A, including any information as to our strategy, projects, plans or future financial or operating performance, constitutes “forward-looking statements”. All statements, other than statements of historical fact, are forward-looking statements. The words “believe”, “expect”, “anticipate”, “target”, “plan”, “objective”, “assume”, “intend”, “intention”, “project”, “goal”, “continue”, “budget”, “estimate”, “potential”, “may”, “will”, “can”, “could”, “would” and similar expressions identify forward-looking statements. In particular, this MD&A contains forward-looking statements including, without limitation, with respect to: Barrick’s goal to be the world’s most valued gold mining business; Barrick’s forward-looking production guidance and estimates of future costs ; cash flow forecasts; projected capital, operating and exploration expenditures; targeted debt and cost reductions; mine life and production rates; potential mineralization and metal or mineral recoveries; our ability to identify, invest in and develop potential Tier One, Tier Two and Strategic Assets; our strategies and plans with respect to environmental matters, including climate change; our future plans, growth potential, financial strength, investments and overall strategy; our plans and expected completion and benefits of our growth projects, including construction of twin exploration declines at Goldrush, the Turquoise Ridge Third Shaft, Pueblo Viejo plant expansion, Zaldívar chloride leach project, and Veladero
power transmission project; our ability to convert resources into reserves; asset sales, joint ventures and partnerships, including expected closing of the sale of our interest in Massawa; expectations regarding future price assumptions, financial performance and other outlook or guidance.
Forward-looking statements are necessarily based upon a number of estimates and assumptions including material estimates and assumptions related to the factors set forth below that, while considered reasonable by the Company as at the date of this MD&A in light of management’s experience and perception of current conditions and expected developments, are inherently subject to significant business, economic and competitive uncertainties and contingencies. Known and unknown factors could cause actual results to differ materially from those projected in the forward-looking statements and undue reliance should not be placed on such statements and information. Such factors include, but are not limited to: fluctuations in the spot and forward price of gold, copper or certain other commodities (such as silver, diesel fuel, natural gas and electricity); the speculative nature of mineral exploration and development; changes in mineral production performance, exploitation and exploration successes; risks associated with projects in the early stages of evaluation and for which additional engineering and other analysis is required; the Company’s ability to successfullyre-integrate Acacia’s operations; whether benefits expected from recent transactions are realized; disruption of supply routes which may cause delays in construction and mining activities at Barrick’s more remote properties; diminishing quantities or grades of reserves; increased costs, delays, suspensions and technical challenges associated with the construction of capital projects; operating or technical difficulties in connection with mining or development activities, including geotechnical challenges and disruptions in the maintenance or provision of required infrastructure and information technology systems; failure to comply with environmental and health and safety laws and regulations; timing of receipt of, or failure to comply with, necessary permits and approvals; uncertainty whether some or targeted investments and projects will meet the Company’s capital allocation objectives and internal hurdle rate; the impact of global liquidity and credit availability on the timing of cash flows and the values of assets and liabilities based on projected future cash flows; adverse changes in our credit ratings; the impact of inflation;
| BARRICK YEAR-END 2019 | 29 | MANAGEMENT’S DISCUSSION AND ANALYSIS |
fluctuations in the currency markets; changes in U.S. dollar interest rates; risks arising from holding derivative instruments; changes in national and local government legislation, taxation, controls or regulations and/or changes in the administration of laws, policies and practices; expropriation or nationalization of property and political or economic developments in Canada, the United States and other jurisdictions in which the Company or its affiliates do or may carry on business in the future; lack of certainty with respect to foreign legal systems, corruption and other factors that are inconsistent with the rule of law; risks associated with illegal and artisanal mining; the risks of operating in jurisdictions where infectious diseases present major health care issues; damage to the Company’s reputation due to the actual or perceived occurrence of any number of events, including negative publicity with respect to the Company’s handling of environmental matters or dealings with community groups, whether true or not; the possibility that future exploration results will not be consistent with the Company’s expectations; risks that exploration data may be incomplete and considerable additional work may be required to complete further evaluation, including but not limited to drilling, engineering and socioeconomic studies and investment; risk of loss due to acts of war, terrorism, sabotage and civil disturbances; litigation; contests over title to properties, particularly title to undeveloped properties, or over access to water, power and other required infrastructure; business opportunities that may be presented to, or pursued by, the Company; risks associated with the fact that certain of the initiatives described in this MD&A are still in the early stages and may not materialize; our ability to successfully integrate acquisitions or complete divestitures; risks associated with
working with partners in jointly controlled assets; employee relations including loss of key employees; increased costs and physical risks, including extreme weather events and resource shortages, related to climate change; and availability and increased costs associated with mining inputs and labor. In addition, there are risks and hazards associated with the business of mineral exploration, development and mining, including environmental hazards, industrial accidents, unusual or unexpected formations, pressures,cave-ins, flooding and gold bullion, copper cathode or gold or copper concentrate losses (and the risk of inadequate insurance, or inability to obtain insurance, to cover these risks).
Many of these uncertainties and contingencies can affect our actual results and could cause actual results to differ materially from those expressed or implied in any forward-looking statements made by, or on behalf of, us. Readers are cautioned that forward-looking statements are not guarantees of future performance. All of the forward-looking statements made in this MD&A are qualified by these cautionary statements. Specific reference is made to the most recent Form40-F/Annual Information Form on file with the SEC and Canadian provincial securities regulatory authorities for a more detailed discussion of some of the factors underlying forward-looking statements and the risks that may affect Barrick’s ability to achieve the expectations set forth in the forward-looking statements contained in this MD&A. We disclaim any intention or obligation to update or revise any forward-looking statements whether as a result of new information, future events or otherwise, except as required by applicable law.
MERGER WITH RANDGOLD RESOURCES LIMITED
On January 1, 2019, Barrick acquired 100% of the issued and outstanding shares of Randgold Resources Limited (“Randgold”) for $7.9 billion based on the December 31, 2018 closing share price of Barrick’s common shares (the “Merger”). We began consolidating the operating results, cash flows and net assets of Randgold from January 1, 2019 and the results presented in this MD&A reflect that.
USE OFNON-GAAP FINANCIAL PERFORMANCE MEASURES
We use the followingnon-GAAP financial performance measures in our MD&A:
| • | “adjusted net earnings” |
| • | “free cash flow” |
| • | “EBITDA” |
| • | “adjusted EBITDA” |
| • | “total cash costs per ounce” |
| • | “C1 cash costs per pound” |
| • | “all-in sustaining costs per ounce/pound” |
| • | “all-in costs per ounce” and |
| • | “realized price” |
For a detailed description of each of thenon-GAAP measures used in this MD&A and a detailed reconciliation to the most directly comparable measure under International Financial Reporting Standards (“IFRS”), please refer to theNon-GAAP Financial Performance Measures section of this MD&A on pages 91 to 112. Eachnon-GAAP financial performance measure has been annotated with a reference to an endnote on page 113. Thenon-GAAP financial performance measures
set out in this MD&A are intended to provide additional information to investors and do not have any standardized meaning under IFRS, and therefore may not be comparable to other issuers, and should not be considered in isolation or as a substitute for measures of performance prepared in accordance with IFRS.
Changes in Presentation ofNon-GAAP Financial Performance Measures
Realized Price
Starting with this MD&A, we began adjusting for the cumulativecatch-up adjustment to revenue relating to our streaming arrangements in our calculation of realized price. The prior periods have been restated to reflect this change. We believe that this additional information will assist analysts, investors and other stakeholders of Barrick to better understand our ability to generate revenue by excludingnon-cash amounts from the calculation as they are not necessarily reflective of the underlying operating results for the periods presented.
Total cash costs
Starting from the first quarter of 2019, we have renamed “cash costs” to “total cash costs” when referring to our gold operations. The calculation of total cash costs is identical to our previous calculation of cash costs with only a change in the naming convention of thisnon-GAAP measure.
| BARRICK YEAR-END 2019 | 30 | MANAGEMENT’S DISCUSSION AND ANALYSIS |
All-in sustaining costs andall-in costs
Starting from the first quarter of 2019, we have included sustaining capital expenditures and project capital expenditures on a cash basis instead of an accrual basis. As a result of adopting IFRS 16 Leases, the full lease amount is included in accrued capital expenditures on initial recognition. We believe that the change in capital expenditures from an accrual basis to a cash basis better reflects the timing of costs associated with our operations. The original World Gold Council (“WGC”) Guidance Note explicitly excluded certain financing activities fromall-in sustaining costs andall-in costs. As a result of the new lease accounting standard, the WGC Guidance Note was updated to include both the principal and interest portion of the cash lease payment in theall-in sustaining costs andall-in cost metrics. We have updated our calculation accordingly. Prior periods have not been restated but would not be materially different.
| INDEX | page | |
Overview | ||
Our Vision | 32 | |
Our Business | 32 | |
Our Strategy | 32 | |
Sustainability | 32 | |
Financial and Operating Highlights | 34 | |
Safety | 38 | |
Environment | 38 | |
Climate Change | 38 | |
Reserves and Resources | 39 | |
Key Business Developments | 40 | |
Outlook for 2020 | 43 | |
Risks and Risk Management | 46 | |
Market Overview | 47 | |
Production and Cost Summary | 49 | |
Operating Divisions Performance | 51 | |
Nevada Gold Mines | 52 | |
Carlin | 53 | |
Cortez | 55 | |
Turquoise Ridge | 57 | |
Other Nevada Gold Mines | 59 | |
Pueblo Viejo | 60 | |
Loulo-Gounkoto | 62 | |
Kibali | 64 | |
Veladero | 66 | |
Porgera | 68 | |
North Mara | 70 | |
Other Mines - Gold | 72 | |
Other Mines - Copper | 73 | |
Growth Projects | 74 | |
Exploration | 75 | |
| page | ||
| Review of Financial Results | 78 | |
Revenue | 78 | |
Production Costs | 79 | |
Capital Expenditures | 81 | |
General and Administrative Expenses | 81 | |
Exploration, Evaluation and Project Costs | 82 | |
Finance Costs, Net | 82 | |
Additional Significant Statement of Income Items | 83 | |
Income Tax Expense | 84 | |
| Financial Condition Review | 86 | |
Balance Sheet Review | 86 | |
Shareholders’ Equity | 86 | |
Financial Position and Liquidity | 86 | |
Summary of Cash Inflow (Outflow) | 87 | |
Summary of Financial Instruments | 88 | |
| Commitments and Contingencies | 89 | |
| Review of Quarterly Results | 90 | |
| IFRS Critical Accounting Policies and Accounting Estimates | 90 | |
| Non-GAAP Financial Performance Measures | 91 | |
| Technical Information | 113 | |
| Endnotes | 113 | |
| Glossary of Technical Terms | 118 | |
| Mineral Reserves and Mineral Resources | 119 | |
| BARRICK YEAR-END 2019 | 31 | MANAGEMENT’S DISCUSSION AND ANALYSIS |
OVERVIEW
Our Vision
We strive to be the world’s most valued gold mining business by finding, developing and owning the best assets, with the best people, to deliver sustainable returns for our owners and partners.
Our Business
Barrick is one of the world’s leading gold mining companies with annual gold production and gold reserves that are among the largest in the industry. We are principally engaged in the production and sale of gold and copper, as well as related activities such as exploration and mine development. We hold interests in fifteen producing gold mines, including six Tier One Gold Assets1 and a diversified asset portfolio positioned for growth in many of the world’s most prolific gold districts. These gold mines are geographically diversified and are located in Argentina, Canada, Côte d’Ivoire, the Democratic Republic of Congo, the Dominican Republic, Mali, Papua New Guinea, Tanzania and the United States. Our copper business includes a wholly-owned copper mine in Zambia and 50% interests in copper mines in Chile and Saudi Arabia. We also have exploration and development projects located throughout the Americas and Africa. We sell our production in the world market through the following distribution channels: gold bullion is sold in the gold spot market; and gold and copper concentrate is sold to independent smelting companies. Barrick shares trade on the New York Stock Exchange under the symbol GOLD and the Toronto Stock Exchange under the symbol ABX.
2019 Revenue (millions)
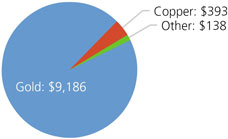
Our Strategy
Our strategy is to operate as business owners by attracting and developing world-class people who are informed and involved in the value chain of the business, act with integrity and are tireless in their pursuit of excellence. We are focused on returns to our stakeholders by optimizing free cash flow, managing risk to create long-term value for our shareholders and partnering with host governments and communities to transform their natural resources into sustainable benefits and mutual prosperity. We aim to achieve this through the following:
Asset Quality
| • | Grow and invest in a portfolio of Tier One Gold Assets1, Tier Two Gold Assets and Strategic Assets2 with an emphasis on organic growth. We will focus our efforts on |
identifying, investing in and developing assets that meet our investment criteria. With respect to Tier One Gold Assets, we are focused on assets with a reserve potential greater than 5 million ounces of gold that will generate an internal rate of return (IRR) of at least 15%. With respect to Tier Two Gold Assets, we are focused on assets with a reserve potential of greater than 3 million ounces of gold that will generate an IRR of at least 20% (in each case based on our long-term gold price assumptions). |
| • | Focus on brownfields opportunities at Nevada Gold Mines LLC (“Nevada Gold Mines”) following the integration of Barrick’s and Newmont Corporation’s (“Newmont”) interests in Nevada through the creation of the joint venture, together with Pueblo Viejo, Loulo-Gounkoto and Kibali. |
| • | Invest in exploration across extensive land positions in many of the world’s most prolific gold districts. |
| • | Maximize the long-term value of our strategic Copper Business3. |
| • | Sellnon-core assets over time in a disciplined manner. |
Operational Excellence
| • | Strive for zero harm workplaces. |
| • | Operate a flat management structure with a strong ownership culture. |
| • | Streamline management and operations, and hold management accountable for the businesses they manage. |
| • | Leverage innovation and technology to drive industry-leading efficiencies. |
| • | Build trust-based partnerships with host governments, business partners, and local communities to drive shared long-term value. |
Sustainable Profitability
| • | Follow a disciplined approach to growth, emphasizing long-term value for all stakeholders. |
| • | Increase returns to shareholders, driven by a focus on return on capital, internal rate of return and free cash flow. |
Sustainability
Barrick’s sustainability vision is to create long-term value for all our stakeholders. We contribute to the social and economic development of our host countries and communities. We protect the safety and health of our workforce. We respect human rights. And we manage our impacts on the natural environment, both today and with future generations in mind. We live our vision every day, by embedding environmental, social and economic considerations into all our business decisions, through partnerships with host governments and communities and by engaging respectfully with all our stakeholders.
Our approach to achieving these four ambitions is set out in a new overarching Sustainable Development Policy, which commits us to supporting the socio-economic development of host countries and communities. We have also published policies in the areas of Social Performance, which incorporates Community Development and Engagement, Occupational Health and Safety, and Environment and Human Rights. All policies meet or exceed the requirements of host country legislation and international standards such
| BARRICK YEAR-END 2019 | 32 | MANAGEMENT’S DISCUSSION AND ANALYSIS |
as the IFC Performance Standards or UN Guiding Principles on Business and Human Rights. Our updated Code of Conduct sets out the ethical behavior expected of everyone working at, or with, Barrick.
Day-to-day ownership of sustainability risks and opportunities is in the hands of individual sites - where our core business is located. Each operation’s General Manager, supported by dedicated teams on site, is accountable for putting Barrick’s vision into action at the site level. This includes maintaining anISO-certified environmental and safety management system, building robust community engagement mechanisms and managing energy and water plans.
We anticipate that the social and environmental expectations of mining companies will become even higher in the future. We are clear that our ability to maintain our social license to operate will depend on our ability to meet these expectations. To meet this challenge, we will continue to embed environmental, social and economic considerations into our business decisions, engage respectfully with stakeholders and act on their concerns and continue to build deep partnerships with our communities, host governments and other partners.
| BARRICK YEAR-END 2019 | 33 | MANAGEMENT’S DISCUSSION AND ANALYSIS |
FINANCIAL AND OPERATING HIGHLIGHTS
| (unaudited) | For the three months ended | For the years ended | ||||||||||||||||||||||||||
| 12/31/2019 | 9/30/2019 | % Change | 12/31/19 | 12/31/18 | % Change | 12/31/17 | ||||||||||||||||||||||
Financial Results ($ millions) | ||||||||||||||||||||||||||||
Revenues | 2,883 | 2,678 | 8 | % | 9,717 | 7,243 | 34 | % | 8,374 | |||||||||||||||||||
Cost of sales | 1,987 | 1,889 | 5 | % | 6,911 | 5,220 | 32 | % | 5,300 | |||||||||||||||||||
Net earnings (loss)a | 1,387 | 2,277 | (39 | )% | 3,969 | (1,545 | ) | 357 | % | 1,438 | ||||||||||||||||||
Adjusted net earningsb | 300 | 264 | 14 | % | 902 | 409 | 121 | % | 876 | |||||||||||||||||||
Adjusted EBITDAb | 1,562 | 1,297 | 20 | % | 4,833 | 3,080 | 57 | % | 4,115 | |||||||||||||||||||
Adjusted EBITDA marginc | 54 | % | 48 | % | 13 | % | 50 | % | 43 | % | 16 | % | 49 | % | ||||||||||||||
Total minesite sustaining capital expendituresd | 394 | 406 | (3 | )% | 1,320 | 968 | 36 | % | 1,116 | |||||||||||||||||||
Total project capital expendituresd | 46 | 96 | (52 | )% | 370 | 425 | (13 | )% | 280 | |||||||||||||||||||
Total consolidated capital expendituresd,e | 446 | 502 | (11 | )% | 1,701 | 1,400 | 22 | % | 1,396 | |||||||||||||||||||
Net cash provided by operating activities | 875 | 1,004 | (13 | )% | 2,833 | 1,765 | 61 | % | 2,065 | |||||||||||||||||||
Net cash provided by operating activities marginf | 30 | % | 37 | % | (19 | )% | 29 | % | 24 | % | 21 | % | 25 | % | ||||||||||||||
Free cash flowb | 429 | 502 | (15 | )% | 1,132 | 365 | 210 | % | 669 | |||||||||||||||||||
Net earnings (loss) per share (basic and diluted) | 0.78 | 1.30 | (40 | )% | 2.26 | (1.32 | ) | 271 | % | 1.23 | ||||||||||||||||||
Adjusted net earnings (basic)bper share | 0.17 | 0.15 | 13 | % | 0.51 | 0.35 | 46 | % | 0.75 | |||||||||||||||||||
Weighted average diluted common shares (millions of shares) | 1,778 | 1,756 | 1 | % | 1,758 | 1,167 | 51 | % | 1,166 | |||||||||||||||||||
Operating Results | ||||||||||||||||||||||||||||
Gold production (thousands of ounces)g | 1,439 | 1,306 | 10 | % | 5,465 | 4,527 | 21 | % | 5,323 | |||||||||||||||||||
Gold sold (thousands of ounces)g | 1,413 | 1,318 | 7 | % | 5,467 | 4,544 | 20 | % | 5,302 | |||||||||||||||||||
Market gold price ($/oz) | 1,481 | 1,472 | 1 | % | 1,393 | 1,268 | 10 | % | 1,257 | |||||||||||||||||||
Realized gold priceb,g($/oz) | 1,483 | 1,476 | 0 | % | 1,396 | 1,270 | 10 | % | 1,258 | |||||||||||||||||||
Gold cost of sales (Barrick’s share)g,h($/oz) | 1,046 | 1,065 | (2 | )% | 1,005 | 892 | 13 | % | 794 | |||||||||||||||||||
Gold total cash costsb,g($/oz) | 692 | 710 | (3 | )% | 671 | 588 | 14 | % | 526 | |||||||||||||||||||
Goldall-in sustaining costsb,g($/oz) | 923 | 984 | (6 | )% | 894 | 806 | 11 | % | 750 | |||||||||||||||||||
Copper production (millions of pounds)i | 117 | 112 | 4 | % | 432 | 383 | 13 | % | 413 | |||||||||||||||||||
Copper sold (millions of pounds)i | 91 | 65 | 40 | % | 355 | 382 | (7 | )% | 405 | |||||||||||||||||||
Market copper price ($/lb) | 2.67 | 2.63 | 2 | % | 2.72 | 2.96 | (8 | )% | 2.80 | |||||||||||||||||||
Realized copper priceb,i($/lb) | 2.76 | 2.55 | 8 | % | 2.77 | 2.88 | (4 | )% | 2.95 | |||||||||||||||||||
Copper cost of sales (Barrick’s share)i,j($/lb) | 2.26 | 2.00 | 13 | % | 2.14 | 2.40 | (11 | )% | 1.77 | |||||||||||||||||||
Copper C1 cash costsb,i($/lb) | 1.90 | 1.62 | 17 | % | 1.69 | 1.97 | (14 | )% | 1.66 | |||||||||||||||||||
Copperall-in sustaining costsb,i($/lb) | 2.82 | 2.58 | 9 | % | 2.52 | 2.82 | (11 | )% | 2.34 | |||||||||||||||||||
| | As at 12/31/19 | | | As at 9/30/19 | | | % Change | | | As at 12/31/18 | | | % Change | | | As at 12/31/17 | | |||||||||||
Financial Position ($ millions) | ||||||||||||||||||||||||||||
Debt (current and long-term) | 5,536 | 5,560 | 0 | % | 5,738 | (4 | )% | 6,423 | ||||||||||||||||||||
Cash and equivalents | 3,314 | 2,405 | 38 | % | 1,571 | 111 | % | 2,234 | ||||||||||||||||||||
Debt, net of cash | 2,222 | 3,155 | (30 | )% | 4,167 | (47 | )% | 4,189 | ||||||||||||||||||||
| a. | Net earnings (loss) represents net earnings (loss) attributable to the equity holders of the Company. |
| b. | Adjusted net earnings, adjusted EBITDA, free cash flow, adjusted net earnings per share, realized gold price,all-in sustaining costs, total cash costs, C1 cash costs and realized copper price arenon-GAAP financial performance measures with no standardized meaning under IFRS and therefore may not be comparable to similar measures presented by other issuers. For further information and a detailed reconciliation of eachnon-GAAP measure to the most directly comparable IFRS measure, please see pages 91 to 112 of this MD&A. |
| c. | Represents adjusted EBITDA divided by revenue. |
| d. | Amounts presented on a consolidated cash basis. Project capital expenditures are included in our calculation ofall-in costs, but not included in our calculation ofall-in sustaining costs. |
| e. | Total consolidated capital expenditures also includes capitalized interest. |
| f. | Represents net cash provided by operating activities divided by revenue. |
| g. | Includes Tanzania on a 63.9% basis until September 30, 2019 (notwithstanding the completion of the Acacia transaction on September 17, 2019, we consolidated our interest in Acacia and recorded anon-controlling interest of 36.1% in the income statement for the entirety of the third quarter of 2019 as a matter of convenience), Pueblo Viejo on a 60% basis, South Arturo on a 60% basis (36.9% from July 1, 2019 onwards as a result of its contribution to Nevada Gold Mines), and Veladero on a 50% basis, which reflects our equity share of production and sales. Also includes Loulo-Gounkoto on an 80% basis, Kibali on a 45% basis, Tongon on an 89.7% basis and Morila on a 40% basis, which reflects our equity share of production and sales, commencing January 1, 2019, the effective date of the Merger. Also removes thenon-controlling interest of 38.5% Nevada Gold Mines from July 1, 2019 onwards. |
| h. | Gold cost of sales (Barrick’s share) is calculated as cost of sales - gold on an attributable basis (excluding sites in care and maintenance) divided by ounces sold. |
| i. | Amounts reflect production and sales from Jabal Sayid and Zaldívar on a 50% basis, which reflects our equity share of production, and Lumwana. |
| j. | Copper cost of sales (Barrick’s share) is calculated as cost of sales - copper plus our equity share of cost of sales attributable to Zaldívar and Jabal Sayid divided by pounds sold. |
| BARRICK YEAR-END 2019 | 34 | MANAGEMENT’S DISCUSSION AND ANALYSIS |
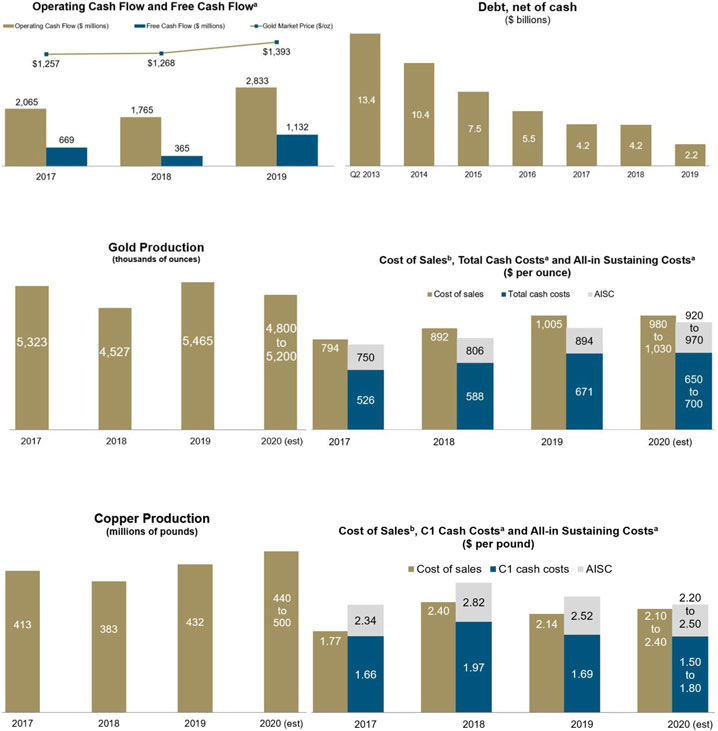
| a. | These arenon-GAAP financial performance measures with no standardized meaning under IFRS and therefore may not be comparable to similar measures presented by other issuers. For further information and a detailed reconciliation of eachnon-GAAP measure to the most directly comparable IFRS measure, please see pages 91 to 112 of this MD&A. |
| b. | Cost of sales applicable to gold per ounce is calculated using cost of sales applicable to gold on an attributable basis (removing thenon-controlling interest of 40% Pueblo Viejo, 36.1% Tanzania (notwithstanding the completion of the Acacia transaction on September 17, 2019, we consolidated our interest in Acacia and recorded anon-controlling interest of 36.1% in the income statement for the entirety of the third quarter of 2019 as a matter of convenience) and 40% South Arturo from cost of sales (63.1% of South Arturo from July 1, 2019 onwards as a result of its contribution to Nevada Gold Mines)), divided by attributable gold ounces. Thenon-controlling interest of 20% Loulo-Gounkoto and 10.3% of Tongon is also removed from cost of sales and our proportionate share of cost of sales attributable to equity method investments (Kibali and Morila) is included commencing January 1, 2019, the effective date of the Merger. Also removes thenon-controlling interest of 38.5% Nevada Gold Mines from cost of sales from July 1, 2019 onwards. Cost of sales applicable to copper per pound is calculated using cost of sales applicable to copper including our proportionate share of cost of sales attributable to equity method investments (Zaldívar and Jabal Sayid), divided by consolidated copper pounds (including our proportionate share of copper pounds from our equity method investments). |
| BARRICK YEAR-END 2019 | 35 | MANAGEMENT’S DISCUSSION AND ANALYSIS |
Factors affecting net earnings and adjusted net earnings4- three months ended December 31, 2019 versus September 30, 2019
Net earnings attributable to equity holders of Barrick (“net earnings”) for the three months ended December 31, 2019 were $1,387 million compared to $2,277 million in the prior quarter. The decrease was primarily due to a gain of $1.9 billion ($1.5 billion net of taxes) relating to the remeasurement of Turquoise Ridge to fair value as a result of its contribution to Nevada Gold Mines and an impairment reversal of $947 million ($663 million net of taxes) at Lumwana, both occurring in the prior quarter. In the current quarter, there were net impairment reversals of $566 million relating to an impairment reversal at Pueblo Viejo of $865 million ($277 million net of taxes andnon-controlling interest) and an impairment charge at Pascua-Lama of $296 million (no tax impact). Net earnings in the current quarter were further impacted by a $628 million gain on thede-recognition of the deferred revenue liability relating to our silver sale agreement with Wheaton Precious Metals Corp., a gain of $408 million resulting from the sale of our 50% interest in Kalgoorlie, and a gain of $216 million on a tax settlement at Lumwana. After adjusting for items that are not indicative of future operating earnings, adjusted net earnings4 of $300 million for the three months ended December 31, 2019 were $36 million higher than the prior quarter, due to an increase in revenue resulting from higher sales volume and marginally higher realized prices4, partially offset by higher cost of sales resulting from the increased sales volume.
Significant adjusting items(pre-tax and excludingnon-controlling interest effects) in the three months ended December 31, 2019 include:
| • | $845 million in other income adjustments, primarily related to a $628 million gain on thede-recognition of the deferred revenue liability relating to our silver sale agreement with Wheaton Precious Metals Corp. and a gain of $216 million on a tax settlement at Lumwana; |
| • | $566 million in net impairment reversals, relating to Pueblo Viejo, partially offset by impairment charges at Pascua-Lama; and |
| • | $414 million in acquisition/disposition gains, primarily resulting from the sale of our 50% interest in Kalgoorlie. |
Refer to page 91 for a full list of reconciling items between net earnings and adjusted net earnings4 for the current and previous periods.
Factors affecting net earnings and adjusted net earnings4- year ended December 31, 2019 versus December 31, 2018
Net earnings for the year ended December 31, 2019 were $3,969 million compared to a loss of $1,545 million in the same prior year period. The significant increase was mainly due to a gain of $1.9 billion ($1.5 billion net of taxes) relating to the remeasurement of Turquoise Ridge to fair value as a result of its contribution to Nevada Gold Mines and a gain of $408 million resulting from the sale of our 50% interest in Kalgoorlie. This was combined with impairment reversals at Lumwana of $947 million ($663 million net of taxes) and at Pueblo Viejo of $865 million ($277 million net of taxes andnon-controlling interest), partially offset by an impairment charge at Pascua-Lama of $296 million (no tax impact). In addition to these impacts, there were significant tax adjustments relating to thede-recognition of deferred tax assets of $814 million occurring in the prior year, a $628 million gain on thede-recognition of the deferred revenue liability relating to our silver sale agreement with Wheaton Precious Metals Corp., and a gain of $216 million on a tax settlement at Lumwana. After adjusting for items that are not indicative of future operating earnings, adjusted net earnings4 of $902 million for the year ended December 31, 2019 were $493 million higher than the same prior year period. The increase in adjusted net earnings was primarily due to higher sales volumes as a result of the Merger and the formation of Nevada Gold Mines. Excluding the impact of the Merger and the formation of Nevada Gold Mines, the increase in adjusted net earnings was primarily due to an increase in realized gold prices4.
Significant adjusting items(pre-tax and excludingnon-controlling interest effects) in the year December 31, 2019 include:
| • | $2,327 million in acquisition/disposition gains mainly relating to the remeasurement of Turquoise Ridge to fair value as a result of its contribution to Nevada Gold Mines and a gain of $408 million resulting from the sale of our 50% interest in Kalgoorlie; |
| • | $1,423 million in net impairment reversals, relating to Lumwana and Pueblo Viejo, partially offset by impairments at Pascua-Lama; and |
| • | $687 million in other income adjustments, primarily related to a $628 million gain on thede-recognition of the deferred revenue liability relating to our silver sale agreement with Wheaton Precious Metals Corp. and a gain of $216 million on a tax settlement at Lumwana, partially offset by severance costs as a result of the implementation of a number of organizational reductions. |
Refer to page 91 for a full list of reconciling items between net earnings and adjusted net earnings4 for the current and previous periods.
| BARRICK YEAR-END 2019 | 36 | MANAGEMENT’S DISCUSSION AND ANALYSIS |
Factors affecting Operating Cash Flow and Free Cash Flow4- three months ended December 31, 2019 versus September 30, 2019
In the three months ended December 31, 2019, we generated $875 million in operating cash flow, compared to $1,004 million in the prior quarter. The decrease of $129 million was primarily due to an increase in interest paid as a result of the timing of interest payments on our public market debt, partially offset by an increase in gold and copper sales volumes of 7% and 40%, respectively. This was further impacted by higher gold and copper realized prices4of $1,483 per ounce and $2.76 per pound, respectively, for the three months ended December 31, 2019, compared to $1,476 per ounce and $2.55 per pound, respectively, in the prior quarter.
Free cash flow4 for the three months ended December 31, 2019 was $429 million, compared to $502 million in the prior quarter, reflecting lower operating cash flows, partially offset by lower capital expenditures. In the three months ended December 31, 2019, capital expenditures on a cash basis were $446 million compared to $502 million in the prior quarter primarily due to lower project capital expenditures with the most significant change related to Cortez due to decreases at the Cortez Hills Underground Rangefront project.
Factors affecting Operating Cash Flow and Free Cash Flow4- year ended December 31, 2019 versus December 31, 2018
For the year ended December 31, 2019, we generated $2,833 million in operating cash flow, compared to $1,765 million in the same prior year period. The increase of $1,068 million was primarily due to higher sales volume as a result of the Merger and the formation of Nevada Gold Mines. This was combined with higher realized gold prices4of $1,396 per ounce in 2019 compared to $1,270 per ounce in 2018 and, partially offset by higher cost of sales per ounce5.
For 2019, we generated free cash flow4 of $1,132 million compared to $365 million in 2018. The increase primarily reflects higher operating cash flows, partially offset by higher capital expenditures. In 2019, capital expenditures on a cash basis were $1,701 million compared to $1,400 million in the same prior year period. Higher capital expenditures of $301 million were primarily due to an increase in minesite sustaining capital expenditures as a result of the Merger and the consolidation impact of Nevada Gold Mines, partially offset by lower project capital expenditures at Cortez due to decreasing Crossroads dewatering activities and Rangefront project expenditures.
| BARRICK YEAR-END 2019 | 37 | MANAGEMENT’S DISCUSSION AND ANALYSIS |
Safety
Our safety vision is “Every person going home safe and healthy every day.” In 2019, although we operated with zero fatalities, our Total Reportable Injury Frequency Rate6 (“TRIFR”) increased by 5%, from 2.12 to 2.24, year-over-year. In analyzing the incidents and frequencies, the combination of assets into Nevada Gold Mines in the North America region did have an impact on our performance. The Africa and Middle East region improvedyear-on-year in both Lost Time Injuries (“LTIs”) and TRIFR.
Barrick is fully committed to the safety, health and well-being of our people, their families and the communities in which we operate. We review safety performance and incidents, share lessons learned and communicate best practices across our business during weekly Executive Committee Review meetings, the main forum for senior management to review our current safety performance. We will continue our efforts to further reduce injury occurrences.
Every site has its own site-specific safety procedures, management plans and systems in place, in line with international best practice. Our goal is for the safety management systems at all operational mines to be certified to the internationally recognized ISO 45001 standard by the end of 2021.
Our renewed focus on safety and reaffirmed commitment to prevent fatalities has led to the company-wide roll out of new controls including our ten Fatality Prevention Commitments to help eliminate fatalities and serious injuries. Our Fatality Prevention Commitments align with the International Council on Mining and Metal’s Life Saving Controls, which are based upon lessons learned from fatal incidents within the mining industry, including Barrick’s experience. Our Commitments and Unacceptable Behaviors guideline has also been implemented, which reaffirms our zero tolerance policy for behavior such as working on site under the influence of drugs or alcohol.
Environment
Barrick continues to rebuild its reputation for environmental excellence and aims to become the world’s most valued gold mining business by delivering sustainable returns for our owners and partners, including the host communities and countries in which we operate.
We have set a corporate goal for all sites to have their Environmental Management System (“EMS”) certified to the ISO 14001:2015 standard by the end of 2020. Currently, all operations, except the Jabal Sayid mine in Saudi Arabia and the Tanzanian assets, are certified to this standard.
In 2019, we introduced a new Environmental Incident Reporting and Investigation Standard to better define the classification, reporting, responsibility and investigation of environmental incidents at Barrick sites. As defined by our new system, we had zero Class 1 - High Significance7 incidents and 13 Class 2 - Medium Significance8 incidents in 2019.
Climate Change
Climate change, including shifts in temperature and precipitation and more frequent severe weather events, could affect the mining industry in a range of possible ways. Volatile
climatic conditions can affect the stability and effectiveness of infrastructure and equipment; potentially impact environmental protection and site closure practices; lead to changes in the regulatory environment, including increased carbon tax regimes; and potentially impact the stability and cost of water and energy supplies. We therefore view climate change as a company, community, and global concern. In 2019, following our merger with Randgold and the formation of Nevada Gold Mines, we reviewed and updated the climate change strategy developed in 2017.
Barrick’s climate change strategy has three pillars: identify, understand and mitigate the risks associated with climate change; measure and reduce our impacts on climate change; and improve our disclosure on climate change. Action taken on each pillar in 2019 is described below.
Identify, understand and mitigate the risks associated with climate change
We continue to take steps to identify and manage risks and build resilience to climate change, as well as to position ourselves for new opportunities. In 2019, climate change- related factors continued to be incorporated into Barrick’s formal risk assessment process (for example, consideration is given to the availability of and access to water and the impact of increased precipitation, drought, or severe storms on operations as well as on communities near our operations). We have identified several climate-related risks and opportunities for our business: physical impacts of climate change, such as an increase in extended duration extreme precipitation events; an increase in regulations that seek to address climate change; and increased global investment in innovation andlow-carbon technologies.
Measure and reduce the Company’s impact on climate change
Mining is an energy-intensive business, and we understand the important link between energy use and greenhouse gas (“GHG”) emissions. By effectively managing our energy use, we can reduce our draw from local energy grids, reduce our GHG emissions, achieve more efficient production, and reduce direct mining costs. In 2019, we progressed the conversion of the Quisqueya I power generation facility in the Dominican Republic from heavy fuel oil to natural gas. We expect the power plant to receive its first liquefied natural gas deliveries in first quarter 2020. The conversion will help reduce the mine site’s power generation costs and GHG emissions by 30%. We also advanced a power transmission project at Veladero to connect the mine to grid power and started construction of a solar plant at Loulo-Gounkoto. Each of these projects is expected to reduce the need for diesel generators, thereby reducing our emissions and power generation costs.
Improve our disclosure on climate change
In 2019, one of our first reporting activities as a merged Company was to complete the CDP (formerly known as the Carbon Disclosure Project) emissions questionnaire which makes investor-relevant climate data widely available.
Throughout 2019, the Board’s Corporate Governance & Nominating Committee, which met quarterly, was responsible for overseeing Barrick’s policies, programs, and performance relating to the environment, including climate change. The Audit & Risk Committee assisted the Board in overseeing the Company’s management of enterprise risks as well as the implementation of policies and standards for monitoring and
| BARRICK YEAR-END 2019 | 38 | MANAGEMENT’S DISCUSSION AND ANALYSIS |
mitigating such risks. Climate change is built into our formal risk management process, outputs of which were reviewed by the Audit & Risk Committee throughout 2019. In addition, the Audit & Risk Committee reviewed the Company’s approach to climate change in the context of Barrick’s public disclosure.
At the management level, in furtherance of its commitment to sustainability, Barrick established the Environmental and Social Oversight (“E&S”) Committee in 2019. The E&S Committee is chaired by the President and Chief Executive Officer, and includes each of the regional Chief Operating Officers, Mine General Managers and health, safety, and environment and closure leads, as well as the Group Sustainability Executive and an independent sustainability consultant. The E&S Committee meets each quarter to review the Company’s sustainability performance and compliance with its sustainability policies, as well as to identify concerns and opportunities at the Company’s operations at an early stage. The President and Chief Executive Officer reviews the reports of the E&S Committee with the Corporate Governance & Nominating Committee on a quarterly basis as part of the Committee’s mandate to oversee Barrick’s environmental, safety and health, corporate social responsibility, and human rights programs, policies and performance.
Further to the specific focus of the E&S Committee, regular Executive Committee review meetings throughout 2019 allowed for the discussion of opportunities and risks that may help or hinder the Company from achieving its objectives, including climate-related risks (e.g., spring snow melts, hurricanes, flooding, and mud slides).
We expect our climate change activities to continue into 2020 and beyond. Site-level climate-related risks and mitigation plans will continue to be reviewed in the context of the company-wide risk assessment, and site-level plans to reduce energy and GHG emissions will be strengthened. We also expect to continue providing our climate-related disclosure. Overall, based on the work completed, Barrick continues to build resilience to withstand the potential impacts of climate change and leverage potential opportunities as the global economy transitions to alow-carbon future.
Reserves and Resources
Gold
Barrick’s 2019 reserves were calculated using a gold price assumption of $1,200 per ounce, consistent with 2018. As of December 31, 2019, Barrick’s proven and probable gold reserves were 71 million ounces9at an average grade of 1.68 g/t, compared to 62 million ounces10 at an average grade of 1.56 g/t in the previous year. Reserve replenishment was achieved across the majority of Barrick’s Tier One Assets1, including Kibali, Loulo-Gounkoto, Turquoise Ridge, together with Goldstrike and Leeville in the Carlin Complex.
There were several significant changes to mineral reservesyear-on-year, including the Merger with Randgold, the formation of Nevada Gold Mines with Newmont, the acquisition of the minority interests in Acacia and the divestiture of Kalgoorlie, which had the net impact of adding 13.4 million ounces to attributable proven and probable mineral reserves. Successful mineral resource conversion
added 5.9 million ounces to mineral reserves offsetting annual mining depletion of 6.0 million ounces of mining depletion.
In 2019, the principal addition to mineral reserves was through the Merger with Randgold, which added 13 million ounces at an average grade of 4.0 g/t to Barrick’s attributable proven and probable reserves. The Nevada Gold Mines transaction added a further 3.2 million ounces to attributable proven and probable reserves, net of the changes in ownership. Barrick’s acquisition of the minorities’ interest in Acacia and subsequent signing of the framework agreement with the Government of Tanzania (“GoT”), through which the GoT will acquire a 16% free-carried interest in the former Acacia sites, resulted in the addition of a further 1 million ounces in Barrick’s 84% attributable proven and probable reserves for North Mara, Bulyanhulu and Buzwagi. These additions from acquisition were partially offset by the removal of 3.7 million ounces of attributable proven and probable reserves from the divestment of Kalgoorlie.
In 2019, we also added 5.9 million ounces of attributable proven and probable reserves through the conversion of mineral resources as summarized below.
The Africa and Middle East region added 2.1 million ounces, of which Loulo-Gounkoto and Kibali were the primary contributors adding a combined 1.6 million ounces of attributable proven and probable reserves. This was principally from high-grade underground extensions at Yalea and KCD underground, as well as the addition of the Kalimva-Ikamva open pit at Kibali. Additional contributions came from an increase in the gold price assumption used to estimate mineral reserves to $1,200 per ounce (from $1,000 per ounce) for the acquired Randgold assets. Notably, proven and probable mineral reserve grades at both Loulo-Gounkoto and Kibali have stayed relatively consistentyear-on-year, highlighting the quality of these Tier One Assets.
North America added 2.8 million ounces of attributable proven and probable reserves, principally from high-grade underground extensions in Carlin and Turquoise Ridge. As expected, the elimination of the previous Toll Milling Agreement following the formation of Nevada Gold Mines allowed us to optimize the undergroundcut-off grade at Turquoise Ridge and contribute to theyear-on-year increase in reserves. For further information on Goldrush and Fourmile, please refer to the Projects section of this MD&A.
Supporting their potential to become Tier One Assets, Veladero and Porgera added a combined 1.0 million ounces of attributable proven and probable reserves. This was mainly due to the conversion of mineral resources at Veladero and underground extensions at Porgera.
The additions described above were partially offset by mining depletion of 6.0 million ounces of attributable proven and probable reserves, other losses of 4.5 million ounces, which were primarily comprised of the removal of the Phase Six pushback at Hemlo and the reclassification of 3.8 million ounces from mineral reserves at Lagunas Norte to mineral resources, in line with our decision to put the property on care and maintenance in 2019.
| BARRICK YEAR-END 2019 | 39 | MANAGEMENT’S DISCUSSION AND ANALYSIS |
In 2019, all mineral resources were calculated using a gold price assumption of $1,500 per ounce, consistent with 2018. Barrick’s mineral resources for 2019 are now reported on an inclusive basis, and include all areas that form mineral reserves, reported at a mineral resourcecut-off grade and the assumed commodity price. All open pit mineral resources are contained within a Whittle shell, while all underground mineral resources are contained within stope optimizer shells. As of December 31, 2019, measured and indicated gold resources were 170 million ounces9 at an average grade of 1.55 g/t and inferred gold resources were 39 million ounces9 at an average grade of 1.3 g/t.
Copper
Copper mineral reserves for 2019 were calculated using a copper price of $2.75 per pound and mineral resources at $3.50 per pound, consistent with 2018. As of December 31, 2019, proven and probable copper reserves were 13 billion pounds9, compared to 11 billion pounds10 at the end of 2018. The growth of copper mineral reserves was primarily driven by Lumwana which added 2.2 billion pounds of proven and
probable reserves. This was from a combination of reclassification and remodeling of the Chimiwungo pit and mine cost optimization. This optimization was a direct outcome of improved plant throughput and mining efficiency in 2019, resulting in a reduction of thecut-off grade at Lumwana.
Measured and indicated copper resources were 26 billion pounds9at an average grade of 0.38% andinferred copper resources were 2.2 billion pounds9 at an average grade of 0.2% as of December 31, 2019. An increase in copper mineral resources at Zaldívar was driven by the inclusion of leachable primary sulfide ore. Zaldívar is jointly owned by Antofagasta and Barrick and is operated by Antofagasta.
The 2019 mineral reserves and mineral resources are estimated using the combined value of gold, copper and silver. Accordingly mineral reserves and mineral resources are reported for all assets where copper or silver is produced and sold as a primary product or aby-product.
Key Business Developments
2019 Highlights
| • | Successful integration of former Randgold executive team and establishment of two additional regions modeled on the Africa regional team after transformational Merger completed on January 1, 2019 |
| • | Negotiation, completion and integration of former Barrick and Newmont operations in Nevada to form the Nevada Gold Mines joint venture - the single largest gold complex in the world and unlocking up to $500 million per annum in synergies |
| • | Acquisition of Acacia minority shareholdings and finalization of agreement to end dispute with the Government of Tanzania and restore our license to operate |
| • | Further rationalization of our portfolio to focus on Tier One Gold Assets1, Tier Two Gold Assets and Strategic Assets2 with the divestment of Kalgoorlie and pending sale of Massawa (expected to close in the first quarter of 2020) |
| • | Full year gold production at upper end and copper production above guidance ranges |
| • | Strengthened balance sheet through positive free cash flow, dispositions ofnon-core assets and debt repurchases |
| • | Debt, net of cash, now at $2.2 billion, a 47% decrease from the prior year and the lowest level since 2007 |
| • | Increasing shareholder returns having raised the quarterly dividend three times in respect of 2019 performance |
Sale of Massawa
On December 10, 2019, Barrick announced that it and its Senegalese joint venture partner have reached an agreement to sell their aggregate 90% interest in the Massawa project (“Massawa”) in Senegal to Teranga Gold Corporation (“Teranga”) for total consideration of up to $430 million.
The consideration consists of anup-front payment of $380 million, including a cash payment of approximately $300 million and Teranga common shares, plus a contingent payment of up to $50 million which is based upon the average gold price for the three-year period immediately following closing.
Barrick will receive 92.5% of the total purchase price for its interest in the Massawa project, with the balance to be received by Barrick’s local Senegalese partner for its minority interest. Barrick is providing $25 million of the $225 million syndicated debt financing secured by Teranga in connection with the transaction.
The transaction is expected to close in the first quarter of 2020 and is subject to receipt of the Massawa exploitation license and residual exploration license from the Government of Senegal, certain other acknowledgments from the Government of Senegal and other customary closing conditions.
Sale of Kalgoorlie
On November 28, 2019, we completed the sale of our 50% interest in the Kalgoorlie mine in Western Australia to Saracen Mineral Holdings Limited for total cash consideration of $750 million. The transaction resulted in a gain of $408 million for the year ended December 31, 2019.
Pascua-Lama
In the fourth quarter of 2019, we completed a study of the Pascua-Lama project and concluded that we do not have a plan that meets our investment criteria under our current assumptions. This was an indicator of impairment and we concluded that the carrying value of Pascua-Lama exceeded the Fair Value Less Cost to Dispose (“FVLCD”) and we recorded anon-current asset impairment of $296 million, based on a FVLCD of $398 million.
We have also updated the liability for the silver stream agreement to align with the conclusions from the completion of the study. The deferred revenue liability was derecognized, and a current liability was recognized for the residual balance payable to Wheaton Precious Metals Corp. of $253 million under the agreement. This adjustment resulted in $628 million recorded in Other Income.
In addition, a new closure plan and estimate supported by feasibility level engineering studies was finalized, which
| BARRICK YEAR-END 2019 | 40 | MANAGEMENT’S DISCUSSION AND ANALYSIS |
resulted in a decrease in the provision for environmental rehabilitation liability of $270 million.
Barrick’s intention is to update our geological understanding of the orebody and this process is expected to take a number of years to complete. The focus in 2020 at Pascua-Lama will be on addressing the gaps identified in the geological andgeo-metallurgical understanding of the orebody, building upon the improved 3D geology model completed in 2019. This includes a drill program at the Penelope deposit of Lama, as well as column testing to assess the amenability of Penelope ore for heap leaching at Veladero. Refer to the Exploration section of the MD&A for more information.
Acacia Mining plc
On September 17, 2019, Barrick acquired all of the Acacia Mining plc (“Acacia”) shares we did not already own through ashare-for-share exchange of 0.168 Barrick shares and any Acacia Exploration Special Dividends for each ordinary share of Acacia. The Acacia Exploration Special Dividends11 and any deferred cash consideration dividends (if applicable) will be paid as a consequence of a sales process to realize value from the sale of certain Acacia exploration properties to be undertaken during thetwo-year period following closing. This transaction resulted in the issuance of 24,836,876 Barrick common shares or approximately 1% of Barrick’s share capital. As a result, Acacia ceased trading on the London Stock Exchange and became a wholly-owned subsidiary of Barrick called Barrick TZ Limited.
Notwithstanding the completion of the Acacia transaction on September 17, 2019, we consolidated our interest in Acacia and recorded anon-controlling interest of 36.1% in the income statement for the entirety of the third quarter of 2019 as a matter of convenience. As at September 30, 2019, we derecognized thenon-controlling interest on the balance sheet related to our former 63.9% ownership of Acacia to reflect our 100% interest at that time. The former Acacia mine sites (Bulyanhulu, North Mara and Buzwagi) will now be referred to individually in this report.
On January 24, 2020, Barrick announced that the Company had ratified the creation of Twiga Minerals Corporation (“Twiga”) at a signing ceremony with the President of Tanzania, formalizing the establishment of a joint venture between Barrick and the Government of Tanzania (“GoT”) and resolution of all outstanding disputes between Barrick and the GoT, including the lifting of the previous concentrate export ban, effective immediately. The GoT will receive a free carried shareholding of 16% in each of the former Acacia mines (Bulyanhulu, Buzwagi and North Mara), and will receive its half of the economic benefits from taxes, royalties, clearing fees and participation in all cash distributions made by the mines and Twiga, after the recoupment of capital investments. Twiga will provide management services to the mines.
The terms of the signed agreement are consistent with those previously announced, including the payment of $300 million to settle all outstanding tax and other disputes (the “Settlement Payment”); the lifting of the concentrate export ban; the sharing of future economic benefits from the mines on a 50/50 basis; and a dispute resolution mechanism that provides for binding international arbitration. The 50/50 division of economic benefits will be maintained through an annualtrue-
up mechanism, which will not account for the Settlement Payment.
Barrick and the GoT continue to fulfill their respective obligations to satisfy all conditions of the signed agreement, primarily with respect to the execution and delivery of formal termination documents for the settlement of all outstanding disputes between the two parties.
Operating results are included at 100% from October 1, 2019 up until the GoT’s 16% free-carried interest is made effective, which is expected to be as of January 1, 2020, and on an 84% basis thereafter.
Nevada Gold Mines LLC
On March 10, 2019, we entered into an implementation agreement with Newmont to create a joint venture, named Nevada Gold Mines, combining our respective mining operations, assets, reserves and talent in Nevada, USA. This includes Barrick’s Cortez, Goldstrike, Turquoise Ridge and Goldrush properties and Newmont’s Carlin, Twin Creeks, Phoenix, Long Canyon and Lone Tree properties. On July 1, 2019, the transaction closed and we began consolidating the operating results, cash flows and net assets of Nevada Gold Mines from that date forward. Barrick is the operator of the joint venture and owns 61.5%, with Newmont owning the remaining 38.5% of the joint venture.
As a result of this transaction, Barrick recognized a gain in our earnings for the third quarter of $1.9 billion on the remeasurement of our previous 75% interest of Turquoise Ridge.
Debt Management
On July 15, 2019, Barrick completed a make-whole repurchase of the $248 million of outstanding principal on our 4.95% Notes due 2020 and incurred a loss on debt extinguishment of $3 million in the third quarter of 2019. The debt repayment is expected to result in an annualized interest saving of $12 million.
Subsequent to year end, on January 31, 2020, Barrick completed a make-whole repurchase of the $337 million of outstanding principal on our 3.85% Notes due 2022 and a loss on debt extinguishment of $15 million will be recorded in the first quarter of 2020. The debt repayment is expected to result in an annualized interest saving of $13 million.
Debt, net of cash, has been reduced by 47% from the prior year to $2.2 billion.
Reko Diq Arbitration
On July 12, 2019, the World Bank International Centre for Settlement of Investment Disputes (“ICSID”) awarded $5.84 billion in damages to Tethyan Copper Company Pty Limited (“TCC”), a joint venture held equally by Barrick and Antofagasta plc, in relation to the arbitration claims filed against the Government of Pakistan (“GOP”) following the unlawful denial of a mining lease for the Reko Diq project in Pakistan in 2011.
Damages include compensation of $4.087 billion in relation to the fair market value of the Reko Diq project at the time the mining lease was denied, and interest until the date of the award of $1.753 billion. Compound interest continues to
| BARRICK YEAR-END 2019 | 41 | MANAGEMENT’S DISCUSSION AND ANALYSIS |
apply at a rate of US Prime +1% per annum until the award is paid.
In November 2019, the GOP applied to annul TCC’s damages award, which resulted in an automatic stay on TCC from pursuing enforcement action. ICSID has constituted a committee to hear the annulment application, consisting of a president from South Korea and additional members from Mexico and Finland. The committee appointed by ICSID to hear the application for annulment will also determine whether the stay on enforcement proceedings should be extended or lifted while it considers the application for annulment. No decision on the GOP’s annulment application or the stay on enforcement proceedings has yet been made.
The proceeds of this award will not be recognized in our financial statements until any such proceeds have been collected.
Randgold Resources Limited Merger
On January 1, 2019, we acquired 100% of the issued and outstanding shares of Randgold. Each Randgold shareholder received 6.1280 common shares of Barrick for each Randgold share, which resulted in the issuance of 583,669,178 Barrick common shares. After this share issuance, Barrick shareholders owned 66.7%, while former Randgold shareholders owned 33.3%, of the shares of the combined company. We have determined that this transaction represents a business combination with Barrick identified as the acquirer. Based on the December 31, 2018 closing share price of Barrick’s common shares, the total consideration of the acquisition was $7.9 billion.
Randgold was a publicly traded mining company with ownership interests in the following gold mines: Kibali in the Democratic Republic of Congo; Tongon in Côte d’Ivoire; Loulo-Gounkoto and Morila in Mali; the Massawa project in Senegal and various exploration properties. We began
consolidating the operating results, cash flows and net assets of Randgold from January 1, 2019.
In conjunction with the Merger, Barrick has a new management team, effective January 1, 2019. Mark Bristow is now President and Chief Executive Officer of Barrick. He was formerly the Chief Executive Officer of Randgold, a position he held since its incorporation in 1995. Graham Shuttleworth is now Senior Executive Vice-President and Chief Financial Officer of Barrick, having formerly served as Randgold‘s Chief Financial Officer since 2007. Kevin Thomson, Senior Executive Vice-President, Strategic Matters, continues in the role to which he was appointed at Barrick in October 2014.
In addition, Barrick is now managed by three regional Chief Operating Officers, each of whom reports to the President and Chief Executive Officer. Catherine Raw, formerly Barrick’s Chief Financial Officer, was appointed Chief Operating Officer, North America. Mark Hill, formerly Barrick’s Chief Investment Officer, was appointed Chief Operating Officer, Latin America and Asia Pacific. Willem Jacobs, formerly Randgold’s General Manager East and Central Africa, was appointed Chief Operating Officer, Africa and Middle East.
Following the closing of the Merger, Barrick’s Board of Directors was reconstituted with the following nine Directors: John Thornton (Executive Chairman), Brett Harvey (Lead Independent Director) Mark Bristow, María Ignacia Benítez, Gustavo Cisneros, Christopher Coleman, Michael Evans, Brian Greenspun, and Andrew Quinn. Regrettably, on February 28, 2019, María Ignacia Benítez passed away. Barrick’s Corporate Governance & Nominating Committee initiated a search for an equally compelling and qualified female candidate to fill the vacant Board position and on August 9, 2019, we announced the appointment of Loreto Silva to the Board of Directors as an independent director.
| BARRICK YEAR-END 2019 | 42 | MANAGEMENT’S DISCUSSION AND ANALYSIS |
Outlook for 2020
Operating Division Guidance
Our 2019 gold and copper production, cost of sales, total cash costs4,all-in sustaining costs4 and 2020 forecast gold and copper production, cost of sales, total cash costs4 andall-in sustaining costs4 ranges by operating division are as follows:
| Operating Division | 2019 attributable production (000s ozs) | 2019 ($/oz) | 2019 ($/oz) | 2019 all-in ($/oz) | 2020 forecast attributable production (000s ozs) | 2020 forecast cost of salesa ($/oz) | 2020 forecast total cash costsb ($/oz) | 2020 forecast all-in sustaining costsb ($/oz) | ||||||||||||||||||||||||
Gold | ||||||||||||||||||||||||||||||||
Carlin (61.5%)c,d | 968 | 1,004 | 746 | 984 | 1,000 - 1,050 | 920 - 970 | 760 - 810 | 1,000 - 1,050 | ||||||||||||||||||||||||
Cortez (61.5%)c | 801 | 762 | 515 | 651 | 450 - 480 | 980 - 1,030 | 640 - 690 | 910 - 960 | ||||||||||||||||||||||||
Turquoise Ridge (61.5%)c | 335 | 846 | 585 | 732 | 430 - 460 | 900 - 950 | 540 - 590 | 690 - 740 | ||||||||||||||||||||||||
Phoenix (61.5%)c | 56 | 2,093 | 947 | 1,282 | 100 - 120 | 1,850 -1,900 | 700 - 750 | 920 - 970 | ||||||||||||||||||||||||
Long Canyon (61.5%)c | 58 | 1,088 | 333 | 681 | 130 - 150 | 910 - 960 | 240 - 290 | 450 - 500 | ||||||||||||||||||||||||
Nevada Gold Mines (61.5%) | 2,218 | 924 | 634 | 828 | 2,100 - 2,250 | 970 - 1,020 | 660 - 710 | 880 - 930 | ||||||||||||||||||||||||
Hemlo | 213 | 1,137 | 904 | 1,140 | 200 - 220 | 960 - 1,010 | 800 - 850 | 1,200 - 1,250 | ||||||||||||||||||||||||
North America | 2,431 | 943 | 655 | 851 | 2,300 - 2,450 | 970 - 1,020 | 660 - 710 | 900 - 950 | ||||||||||||||||||||||||
Pueblo Viejo (60%) | 590 | 747 | 471 | 592 | 530 - 580 | 840 - 890 | 520 - 570 | 720 - 770 | ||||||||||||||||||||||||
Veladero (50%) | 274 | 1,188 | 734 | 1,105 | 240 - 270 | 1,220 - 1,270 | 670 - 720 | 1,250 - 1,300 | ||||||||||||||||||||||||
Porgera (47.5%) | 284 | 994 | 838 | 1,003 | 240 - 270 | 890 - 940 | 770 - 820 | 960 - 1,010 | ||||||||||||||||||||||||
Kalgoorlie (50%)e | 206 | 1,062 | 873 | 1,183 | ||||||||||||||||||||||||||||
Latin America & Asia Pacific | 1,354 | 937 | 664 | 874 | 1,000 - 1,100 | 930 - 980 | 610 - 660 | 890 - 940 | ||||||||||||||||||||||||
Loulo-Gounkoto (80%) | 572 | 1,044 | 634 | 886 | 500 - 540 | 1,050 - 1,100 | 620 - 670 | 970 - 1,020 | ||||||||||||||||||||||||
Kibali (45%) | 366 | 1,111 | 568 | 693 | 340 - 370 | 1,030 - 1,080 | 600 - 650 | 790 - 840 | ||||||||||||||||||||||||
North Maraf | 251 | 953 | 646 | 802 | 240 - 270 | 750 - 800 | 570 - 620 | 830 - 880 | ||||||||||||||||||||||||
Tongon (89.7%) | 245 | 1,469 | 787 | 844 | 240 - 260 | 1,390 - 1,440 | 680 - 730 | 740 - 790 | ||||||||||||||||||||||||
Bulyanhuluf | 27 | 1,207 | 676 | 773 | 30 - 50 | 1,210 - 1,260 | 790 - 840 | 1,110 - 1,160 | ||||||||||||||||||||||||
Buzwagif | 83 | 1,240 | 1,156 | 1,178 | 80 - 100 | 850 - 900 | 820 - 870 | 850 - 900 | ||||||||||||||||||||||||
Africa & Middle East | 1,544 | 1,332 | 673 | 834 | 1,450 - 1,600 | 1,040 - 1,090 | 640 - 690 | | 870 - 920 | | ||||||||||||||||||||||
Total Attributable to Barrickg,h,i,j | 5,465 | 1,005 | 671 | 894 | 4,800 - 5,200 | 980 - 1,030 | 650 - 700 | 920 - 970 | ||||||||||||||||||||||||
2019 (M lbs) | 2019 cost of salesa ($/lb) | 2019 C1 ($/lb) | 2019 all-in ($/lb) | 2020 forecast (M lbs) | 2020 forecast ($/lb) | 2020 ($/lb) | 2020 forecast costsb ($/lb) | |||||||||||||||||||||||||
Copper | ||||||||||||||||||||||||||||||||
Lumwana | 238 | 2.13 | 1.79 | 3.04 | 250 - 280 | 2.20 - 2.40 | 1.50 - 1.70 | 2.30 - 2.60 | ||||||||||||||||||||||||
Zaldívar (50%) | 128 | 2.46 | 1.77 | 2.15 | 120 - 135 | 2.40 - 2.70 | 1.65 - 1.85 | 2.30 - 2.60 | ||||||||||||||||||||||||
Jabal Sayid (50%) | 66 | 1.53 | 1.26 | 1.51 | 60 - 70 | 1.75 - 2.00 | 1.40 - 1.60 | 1.50 - 1.70 | ||||||||||||||||||||||||
Total Copperi | 432 | 2.14 | 1.69 | 2.52 | 440 - 500 | 2.10 - 2.40 | 1.50 - 1.80 | 2.20 - 2.50 | ||||||||||||||||||||||||
| a. | Cost of sales applicable to gold per ounce is calculated using cost of sales applicable to gold on an attributable basis (removing thenon-controlling interest of 40% Pueblo Viejo, 20% of Loulo-Gounkoto, 10.3% of Tongon, 36.1% of Tanzania (notwithstanding the completion of the Acacia transaction on September 17, 2019, our results include our 63.9% share up until the end of the third quarter of 2019 as a matter of convenience) and 40% of South Arturo (63.1% of South Arturo from July 1, 2019 onwards as a result of its contribution to Nevada Gold Mines) from cost of sales and including our proportionate share of cost of sales attributable to our equity method investments in Kibali and Morila), divided by attributable gold ounces sold. Also removes thenon-controlling interest of 38.5% Nevada Gold Mines from cost of sales from July 1, 2019 onwards. Cost of sales applicable to copper per pound is calculated using cost of sales applicable to copper including our proportionate share of cost of sales attributable to our equity method investments in Zaldívar and Jabal Sayid, divided by consolidated copper pounds sold (including our proportionate share of copper pounds sold from our equity method investments). |
| b. | Total cash costs,all-in sustaining costs and C1 cash costs arenon-GAAP financial performance measures with no standardized meaning under IFRS and therefore may not be comparable to similar measures of performance presented by other issuers. For further information and a detailed reconciliation of thenon-GAAP measures used in this section of the MD&A to the most directly comparable IFRS measures, please see pages 91 to 112 of this MD&A. |
| c. | These five operations are part of Nevada Gold Mines from July 1, 2019. Amounts include Cortez (100%), Goldstrike (100%) and Turquoise Ridge (75%), also known collectively as Barrick Nevada, from January 1, 2019 to June 30, 2019, and Cortez, Carlin (which includes Goldstrike), Turquoise Ridge (including Twin Creeks), Phoenix and Long Canyon on a 61.5% basis from July 1, 2019 onwards as a result of the formation of Nevada Gold Mines with Newmont on July 1, 2019. |
| d. | Includes our 60% share of South Arturo from January 1, 2019 to June 30, 2019 and 36.9% from July 1, 2019 onwards as a result of the formation of Nevada Gold Mines with Newmont on July 1, 2019. |
| e. | As a result of the sale of our 50% interest in Kalgoorlie on November 28, 2019, there is no guidance for 2020. |
| f. | Formerly known as Acacia Mining plc. On September 17, 2019, Barrick acquired all of the shares of Acacia it did not own. Operating results are included at 100% from October 1, 2019 (notwithstanding the completion of the Acacia transaction on September 17, 2019, we consolidated our interest in Acacia and recorded anon-controlling interest of 36.1% in the income statement for the entirety of the third quarter of 2019 as a matter of convenience) up until the GoT’s 16% free-carried interest is made effective, which is expected to be January 1, 2020, and on an 84% basis thereafter. As the GoT’s 16% free-carried interest is expected to be made effective as of January 1, 2020, our 2020 outlook represents our 84% share. |
| g. | Also includes Lagunas Norte, Golden Sunlight, and Morila (40%) and excludes Pierina which is mining incidental ounces as it enters closure. Due to the planned ramp down of operations, we have ceased to include production ornon-GAAP cost metrics for Golden Sunlight or Morila after the second quarter and Lagunas Norte after the third quarter. |
| h. | Total cash costs andall-in sustaining costs per ounce include costs allocated tonon-operating sites. |
| i. | Operating division guidance ranges reflect expectations at each individual operating division, and may not add up to the company-wide guidance range total. The company-wide 2019 results and guidance ranges exclude Pierina, which is mining incidental ounces as it enters closure, and Golden Sunlight and Morila after the second quarter of 2019 and Lagunas Norte after the third quarter of 2019 due to the planned ramp down of operations. |
| j. | Includes corporate administration costs. |
| BARRICK YEAR-END 2019 | 43 | MANAGEMENT’S DISCUSSION AND ANALYSIS |
Operating Division, Consolidated Expense and Capital Guidance
Our 2019 gold and copper production, cost of sales, total cash costs4,all-in sustaining costs4, consolidated expenses and capital expenditures and 2020 forecast gold and copper production, cost of sales, total cash costs4,all-in sustaining costs4, consolidated expenses and capital expenditures are as follows:
| ($ millions, except per ounce/pound data) | 2019 Original Guidance | Q3 2019 Guidance | 2019 Actual | 2020 Guidance | ||||||||||||
Gold production and costs | ||||||||||||||||
Production (millions of ounces) | 5.10 - 5.60 | 5.10 - 5.60 | 5.47 | 4.80 - 5.20 | ||||||||||||
Gold unit production costs | ||||||||||||||||
Cost of sales - gold ($ per oz) | 880 - 940 | 940 - 990 | 1,005 | 980 - 1,030 | ||||||||||||
Total cash costs ($ per oz)a | 650 - 700 | 650 - 700 | 671 | 650 - 700 | ||||||||||||
Depreciation ($ per oz) | 215 - 235 | 320 - 350 | 348 | 300 - 330 | ||||||||||||
All-in sustaining costs ($ per oz)a | 870 - 920 | 870 - 920 | 894 | 920 - 970 | ||||||||||||
Copper production and costs | ||||||||||||||||
Production (millions of pounds) | 375 - 430 | 375 - 430 | 432 | 440 - 500 | ||||||||||||
Copper unit production costs | ||||||||||||||||
Cost of sales - copper ($ per lb) | 2.30 - 2.70 | 2.30 - 2.70 | 2.14 | 2.10 - 2.40 | ||||||||||||
C1 cash costs ($ per lb)a | 1.70 - 2.00 | 1.70 - 2.00 | 1.69 | 1.50 - 1.80 | ||||||||||||
Depreciation ($ per lb) | 0.60 - 0.70 | 0.60 - 0.70 | 0.28 | 0.60 - 0.70 | ||||||||||||
Copperall-in sustaining costs ($ per lb)a | 2.40 - 2.90 | 2.40 - 2.90 | 2.52 | 2.20 - 2.50 | ||||||||||||
Exploration and project expenses | 280 - 340 | 280 - 340 | 342 | 280 - 320 | ||||||||||||
Exploration and evaluation | 160 - 170 | 170 - 180 | 212 | 210 - 230 | ||||||||||||
Project expenses | 120 - 150 | 120 - 150 | 130 | 70 - 90 | ||||||||||||
General and administrative expenses | ~200 | ~200 | 212 | ~170 | ||||||||||||
Corporate administrationb | ~140 | ~140 | 148 | ~130 | ||||||||||||
Stock-based compensationc | ~40 | ~40 | 37 | ~40 | ||||||||||||
Acacia/Tanzania d | ~20 | ~20 | 27 | 0 | ||||||||||||
Other expense (income) | 80 - 100 | 80 - 100 | (3,100 | ) | 80 - 100 | |||||||||||
Finance costs, net e | 500 - 550 | 500 - 550 | 469 | 400 - 450 | ||||||||||||
Attributable capital expenditures: | ||||||||||||||||
Attributable minesite sustaining | 1,100 - 1,300 | 1,100 - 1,300 | 1,176 | 1,300 - 1,500 | ||||||||||||
Attributable project | 300 - 400 | 300 - 400 | 336 | 300 - 400 | ||||||||||||
Total attributable capital expenditures f | 1,400 - 1,700 | 1,400 - 1,700 | 1,512 | 1,600 - 1,900 | ||||||||||||
| a. | Total cash costs,all-in sustaining costs and C1 cash costs arenon-GAAP financial performance measures with no standardized meaning under IFRS and therefore may not be comparable to similar measures of performance presented by other issuers. For further information and a detailed reconciliation of thenon-GAAP measures used in this section of the MD&A to the most directly comparable IFRS measures, please see pages 91 to 112 of this MD&A. |
| b. | 2019 actual of $148 million includes $18 million of severance costs. |
| c. | 2019 actual based on US$18.59 and 2020 guidance based on a three-month trailing average ending December 31, 2019 of US$17.51 per share. |
| d. | For 2019, Acacia/Tanzania general and administrative expenses were substantially comprised of stock-based compensation and severance costs related to Acacia prior to the acquisition of thenon-controlling interest in September 2019. |
| e. | 2019 actual includes a net loss on debt extinguishment of $3 million. |
| f. | Attributable capital expenditures are presented on the same basis as guidance, which includes our 61.5% share of Nevada Gold Mines, our 60% share of Pueblo Viejo, our 80% share of Loulo-Gounkoto, our 89.7% share of Tongon, our 84% share of North Mara, Bulyanhulu and Buzwagi and our 50% share of Zaldívar and Jabal Sayid. As the GoT’s 16% free-carried interest is expected to be made effective as of January 1, 2020, our 2020 outlook represents our 84% share of North Mara, Bulyanhulu and Buzwagi. |
| BARRICK YEAR-END 2019 | 44 | MANAGEMENT’S DISCUSSION AND ANALYSIS |
2020 Guidance Analysis
Estimates of future production, cost of sales, and total cash costs4 presented in this MD&A are based on mine plans that reflect the expected method by which we will mine reserves at each site. Actual gold and copper production and associated costs may vary from these estimates due to a number of operational andnon-operational risk factors (see the “Cautionary Statement on Forward-Looking Information” on page 29 of this MD&A for a description of certain risk factors that could cause actual results to differ materially from these estimates).
Gold Production
We expect 2020 gold production to be in the range of 4.8 to 5.2 million ounces. As expected, gold production is lower year-over-year given the depletion of the high-grade Cortez Hills Open Pit deposit, divestment of Kalgoorlie and the decision to place Lagunas Norte, Morila and Golden Sunlight in care and maintenance in 2019. Based on mine sequencing and planned maintenance shutdowns, we expect gold production in the second half of 2020 to be slightly higher than the first half.
Gold Cost of Sales per ounce
On a per ounce basis, cost of sales applicable to gold5, after removing the portion related tonon-controlling interests, is expected to be in the range of $980 to $1,030 per ounce in 2020. This is in line with the prior year resulting from a full year impact of the higher depreciation at Nevada Gold Mines offset by lower cost of sales primarily at Kibali and North Mara.
Gold Total Cash Costs per ounce4
Total cash costs per ounce4 are expected to be in the range of $650 to $700, unchanged from the 2019 range. We expect Cortez to have higher total cash costs per ounce4 than 2019 driven primarily by the cessation of the comparatively high-grade,low-cost Cortez Hills Open Pit in the first half of 2019. We also expect higher total cash costs per ounce4 at Pueblo Viejo in 2020 due to lower grades compared to the prior year, in line with the mine plan. Lower costs year-over-year at Veladero, Porgera, and North Mara are expected to offset these impacts on Barrick’s total cash costs per ounce4.
GoldAll-In Sustaining Costs per ounce4
All-in sustaining costs per ounce4 are expected to be in the range of $920 to $970 for gold, slightly higher than 2019, and driven primarily by the increase in minesite sustaining capital expenditures as discussed below.
Copper Production and Costs
We expect 2020 copper production to be in the range of 440 to 500 million pounds, up from production of 432 million pounds in 2019. This increase is mainly driven by Lumwana following the sustainable improvements we have made to increase plant efficiency and availability through 2019. Together with cost rationalization, these performance improvements have driven a reduction in mining and processing costs per tonne and increased reserves.
In 2020, cost of sales applicable to copper5 is expected to be in the range of $2.10 to $2.40 per pound, in line with the $2.14 per pound outcome for 2019. C1 cash costs per pound4 guidance of $1.50 to $1.80 per pound for 2020 is also in line with 2019. Notably, we expect Lumwana C1 cash costs per pound4 of $1.50 to $1.70 to be lower year-over-year partially driven by the plant availability and efficiency improvements
we have implemented at the mine as discussed earlier. Copperall-in sustaining costs per pound4 guidance of $2.20 to $2.50 for 2020 represents an improvement from $2.52 in 2019.
Exploration and Project Expenses
We expect to incur approximately $210 to $230 million of exploration and evaluation expenditures in 2020 which includes 100% of the expenditure for Nevada Gold Mines for the full year.
We expect to incur approximately $70 to $90 million of project expenses in 2020, compared to $130 million in 2019. In 2020, project expenses are mainly related to the ongoing site costs at Pascua-Lama and advancing the expansion project at Pueblo Viejo.
General and Administrative Expenses
In 2020, we expect corporate administration costs to be approximately $130 million, a decrease of $18 million compared to 2019. This mainly reflects the additional severance costs incurred in 2019 associated with our workforce reduction following the Merger. This is partially offset byone-off integration costs associated with Randgold, Nevada Gold Mines and Acacia.
Separately, stock-based compensation expense in 2020 is expected to be approximately $40 million.
Finance Costs, Net
In 2020, net finance costs of $400 to $450 million primarily represent interest expense on long-term debt,non-cash interest expense relating to the gold and silver streaming agreements at Pueblo Viejo, and accretion, net of finance income. We expect net finance costs in 2020 to be lower year-over-year from $469 million in 2019 due in part to lower interest expense following debt repayments of $248 million in 2019. This is combined with the absence ofnon-cash interest expense related to the silver streaming agreement at Pascua-Lama. Our 2020 forecast includes the loss on debt extinguishment of $15 million related to the make-whole repurchase in January 2020 of $337 million of outstanding principal on our 3.85% Notes due 2022.
Capital Expenditures
Total attributable gold and copper capital expenditures for 2020 are expected to be in the range of $1,600 to $1,900 million. We continue to focus on the delivery of our project capital pipeline and we expect attributable project capital expenditures to be in the range of $300 to $400 million, consistent with 2019.
More than half of our attributable project capital expenditures in 2020 relate to advancing the expansion project at Pueblo Viejo, the third shaft project at Turquoise Ridge and construction of the Goldrush twin exploration declines. The remainder of project capital expenditure is mainly associated with the Zaldívar Chloride Leach Project and the restart of mining operations at Bulyanhulu.
Attributable minesite sustaining capital expenditures are expected to be in the range of $1,300 to $1,500 million compared to $1,176 million in 2019. The increase is primarily a result of increased capitalized stripping and underground development at Loulo-Gounkoto, the Phase 6 leach pad expansion at Veladero, tailings capacity expansion at Hemlo,
| BARRICK YEAR-END 2019 | 45 | MANAGEMENT’S DISCUSSION AND ANALYSIS |
plant refurbishment at Bulyanhulu and the development of the Kalima-Ikamva pit project at Kibali.
Effective Income Tax Rate
At a gold price of $1,350/oz, our expected effective tax rate range for 2020 is between 30% to 35%. The rate is sensitive
to the relative proportion of sales in high versus low tax jurisdictions, realized gold and copper prices, the proportion of income from our equity accounted investments and the level ofnon-tax affected costs in countries where we generate net losses.
Outlook Assumptions and Economic Sensitivity Analysis
| 2020 Guidance Assumption | Hypothetical Change | Impact on EBITDAa (millions) | Impact on All-in | |||||
Gold revenue, net of royalties | $1,350/oz | +/- $100/oz | +/- $472 | +/- $4/oz | ||||
Copper revenue, net of royalties | $2.75/lb | +/- $0.50/lb | +/- $224 | +/- $0.02/lb | ||||
| a. | EBITDA andall-in sustaining costs arenon-GAAP financial performance measures with no standardized definition under IFRS. For further information and a detailed reconciliation, please see pages 91 to 112 of this MD&A. |
Risks and Risk Management
Overview
The ability to deliver on our vision, strategic objectives and operating guidance depends on our ability to understand and appropriately respond to the uncertainties or “risks” we face that may prevent us from achieving our objectives. In order to achieve this we:
| • | Maintain a framework that permits us to manage risk effectively and in a manner that creates the greatest value; |
| • | Integrate a process for managing risk into all our important decision-making processes so that we reduce the effect of uncertainty on achieving our objectives; |
| • | Actively monitor key controls we rely on to achieve the Company’s objectives so that they remain in place and are effective at all times; and |
| • | Provide assurance to senior management and relevant committees of the Board on the effectiveness of key control activities. |
Board and Committee Oversight
We maintain strong risk oversight practices, with responsibilities outlined in the mandates of the Board and related committees. The Board’s mandate makes clear its responsibility for reviewing and discussing with management the processes used to assess and manage risk, including the identification by management of the principal risks of the business, and the implementation of appropriate systems to deal with such risks.
The Audit & Risk Committee of the Board of Directors assists the Board in overseeing the Company’s management of principal risks as well as the implementation of policies and standards for monitoring and modifying such risks, and monitoring and reviewing the Company’s financial position and financial risk management programs generally. The Corporate Governance & Nominating Committee assists the Board in overseeing the Company’s environmental, safety and health, corporate social responsibility, and human rights programs, policies and performance.
Management Oversight
Our weekly Executive Committee Review is the main forum for senior management to raise and discuss risks facing the operations and organization more broadly. At regularly scheduled meetings, the Board and the Audit & Risk Committee are provided with updates on the key issues identified by management at these weekly sessions.
Principal Risks
The following subsections describe some of our key sources of uncertainty and most important risk modification activities. The risks described below are not the only ones facing Barrick. Our business is subject to inherent risks in financial, regulatory, strategic and operational areas. For a more comprehensive discussion of those inherent risks, see “Risk Factors” in our most recent Form40-F/Annual Information Form on file with the SEC and Canadian provincial securities regulatory authorities. Also see the “Cautionary Statement on Forward-Looking Information” on page 29 of this MD&A.
Financial position and liquidity
Our liquidity profile, level of indebtedness and credit ratings are all factors in our ability to meet short- and long-term financial demands. Barrick’s outstanding debt balances impact liquidity through scheduled interest and principal repayments and the results of leverage ratio calculations, which could influence our investment grade credit ratings and ability to access capital markets. In addition, our ability to draw on our credit facility is subject to meeting its covenants. Our primary source of liquidity is our operating cash flow, which is dependent on the ability of our operations to deliver projected future cash flows. The ability of our operations to deliver projected future cash flows, as well as future changes in gold and copper market prices, either favorable or unfavorable, will continue to have a material impact on our cash flow and liquidity.
Key risk modification activities:
| • | Continued focus on generating positive free cash flow by improving the underlying cost structures of our operations in a sustainable manner; |
| • | Disciplined capital allocation criteria for all investments, to ensure a high degree of consistency and rigor is applied to all capital allocation decisions based on a comprehensive understanding of risk and reward; |
| • | Preparation of budgets and forecasts to understand the impact of different price scenarios on liquidity, and formulate appropriate strategies; |
| • | Reduced notional amount and lengthened average tenor of our outstanding debt through liability management activities; and |
| • | Other options available to the Company to enhance liquidity include drawing on our $3.0 billion undrawn credit facility, asset sales, joint ventures, or the issuance of debt or equity securities. |
| BARRICK YEAR-END 2019 | 46 | MANAGEMENT’S DISCUSSION AND ANALYSIS |
Improving free cash flow4 and costs
Our ability to improve productivity, drive down operating costs and reduce working capital remains a focus in 2020 and is subject to several sources of uncertainty. This includes our ability to achieve and maintain industry-leading margins by improving the productivity and efficiency of our operations through automation.
Key risk modification activities:
| • | Formation of Nevada Gold Mines joint venture to drive free cash flow through synergies without issuing shares; |
| • | Weekly Executive Committee Review to assess and respond to risks in a timely manner; |
| • | General and administrative costs halved in 2019 relative to 2018 guidance despite increase in asset base; and |
| • | Implemented a flat, operationally focused, agile management structure with a tenet in ownership culture. |
Social license to operate
At Barrick, we are committed to building, operating, and closing our mines in a safe and responsible manner. To do this, we seek to build trust-based partnerships with host governments and local communities to drive shared long-term value while working to minimize the social and environmental impacts of our activities. Geopolitical risks such as resource nationalism and incidents of corruption are inherent in the business of a company operating globally. Past environmental incidents in the extractive industry highlight the hazards (e.g., water management, tailings storage facilities, etc.) and the potential consequences to the environment, community health and safety. Our ability to maintain compliance with regulatory and community obligations in order to protect the environment and our host communities alike remains one of our top priorities. Barrick also recognizes climate change as an area of risk requiring specific focus.
Key risk modification activities:
| • | Obtaining full ownership of Acacia and resumingday-to-day management of the Tanzanian assets; |
| • | Our commitment to responsible mining is supported by a robust governance framework, including a new overarching Sustainable Development Policy and refreshed policies in the areas of Biodiversity, Social Performance, Occupational Health and Safety, Environment and Human Rights; |
| • | We also updated our Code of Business Conduct and Ethics which sets out the ethical behavior expected of everyone working at, or with, Barrick; |
| • | We take a partnership approach with our home and host governments. This means we work to balance our own interests and priorities with those of our government partners, working to ensure that everyone derives real value from our operations; |
| • | We open our social and environmental performance to third-party scrutiny, including through the ISO 14001re-certification process, International Cyanide Management Code audits, and annual human rights impact assessments; and |
| • | We continually review and update our closure plans and cost estimates to plan for environmentally responsible closure and monitoring of operations. |
Resources and reserves and production outlook
Like any mining company, we face the risk that we are unable to discover or acquire new resources or that we do not convert resources into production. As we move into 2020 and beyond, our overriding objective of growing free cash flow per share continues to be underpinned by a strong pipeline of organic projects and minesite expansion opportunities in our core regions. Uncertainty related to these and other opportunities exists (potentially both favorable and unfavorable) due to the speculative nature of mineral exploration and development as well as the potential for increased costs, delays, suspensions and technical challenges associated with the construction of capital projects.
Key risk modification activities:
| • | Focus on responsible mineral resource management, continuously improve ore body knowledge, and add to and upgrade reserves and resources; |
| • | Grow and invest in a portfolio of Tier One Gold Assets1, Tier Two Gold Assets and Strategic Assets2 with an emphasis on organic growth; and |
| • | Invest in exploration across extensive land positions in many of the world’s most prolific gold districts. |
Market Overview
The market prices of gold and, to a lesser extent, copper are the primary drivers of our profitability and our ability to generate free cash flow for our shareholders.
Gold
The price of gold is subject to volatile price movements over short periods of time and is affected by numerous industry and macroeconomic factors. During 2019, the gold price ranged from $1,266 per ounce to $1,557 per ounce. The average market price for the year of $1,393 per ounce represented an increase of 10% versus 2018.
Average Monthly Spot Gold Prices
(dollars per ounce)
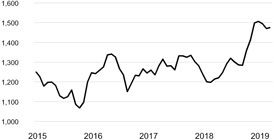
The price of gold rose significantly during the middle part of the year, reaching asix-year high in early September. During the year, the gold price was impacted by declining US dollar interest rates, global trade disputes and geopolitical tensions leading to increased investor interest.
Copper
During 2019, London Metal Exchange (“LME”) copper prices traded in a range of $2.50 to $3.00 per pound, averaged $2.72 per pound, and closed the year at $2.79 per pound. Copper prices are significantly influenced by physical demand from emerging markets, especially China.
Copper prices fell to the lows of the year in early September due to a strong US dollar, a weakening Chinese yuan, and concerns over global trade due to tariff actions before rising
| BARRICK YEAR-END 2019 | 47 | MANAGEMENT’S DISCUSSION AND ANALYSIS |
into the end of the year on low global stockpile levels and an easing in trade tensions between the US and China.
Average Monthly Spot Copper Prices
(dollars per pound)
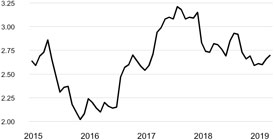
We have provisionally priced copper sales for which final price determination versus the relevant copper index is outstanding at the balance sheet date. As at December 31, 2019, we recorded 39 million pounds of copper sales still subject to final price settlement at an average provisional price of $2.80 per pound. The impact to net income before taxation of a 10% movement in the market price of copper would be approximately $11 million, holding all other variables constant.
Currency Exchange Rates
The results of our mining operations outside of the United States are affected by US dollar exchange rates. We have exposure to the Argentine peso through operating costs at our Veladero mine, and peso denominated VAT receivable balances. In addition, we have exposure to the Canadian and Australian dollars, Chilean peso, Papua New Guinea kina, Peruvian sol, Zambian kwacha, Tanzanian shilling, Dominican peso, West African CFA franc, Euro, South African rand, and British pound through mine operating and capital costs.
Fluctuations in the US dollar increase the volatility of our costs reported in US dollars. In 2019, the Australian dollar traded in a range of $0.67 to $0.73 against the US dollar, while the US dollar against the Canadian dollar, Argentine peso, and CFA franc ranged from $1.30 to $1.37 and ARS 36.85 to ARS 62.00, and XOF 568 to XOF 664, respectively. During the year, the US dollar traded strongly. Along with inflation pressures in Argentina and government actions, this led to a continued weakening of the Argentine peso during the year. During 2019, we did not have any currency hedge positions, and are unhedged against foreign exchange exposures as at December 31, 2019 beyond spot requirements.
Fuel
For 2019, the price of West Texas Intermediate (“WTI”) crude oil traded in a wide range between $44 and $67 per barrel, with an average market price of $57 per barrel, and closed the year at $61 per barrel. Oil prices were impacted by global trade tensions, geopolitical events, and the US dollar.
Average Monthly Spot Crude Oil Price (WTI)
(dollars per barrel)
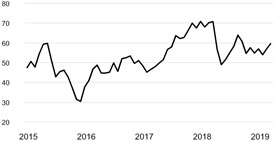
During 2019, we did not have any fuel hedge positions, and are unhedged against fuel exposures as at December 31, 2019.
US Dollar Interest Rates
After four years of benchmark rate increases by the US Federal Reserve, the benchmark rate was lowered by 75 basis points over the course of 2019 to a range of 1.50% to 1.75% in an effort to keep the economy stable during a period of slowing growth and global trade uncertainty. Further changes to short-term rates in 2020 are expected to be dependent on economic data.
At present, our interest rate exposure mainly relates to interest income received on our cash balances ($3.3 billion at December 31, 2019); themark-to-market value of derivative instruments; the carrying value of certain long-lived assets and liabilities; and the interest payments on our variable-rate debt ($0.1 billion at December 31, 2019). Currently, the amount of interest expense recorded in our consolidated statement of income is not materially impacted by changes in interest rates, because the majority of debt was issued at fixed interest rates. The relative amounts of variable-rate financial assets and liabilities may change in the future, depending on the amount of operating cash flow we generate, as well as the level of capital expenditures and our ability to borrow on favorable terms using fixed rate debt instruments. Changes in interest rates affect the accretion expense recorded on our provision for environmental rehabilitation and therefore would affect our net earnings.
| BARRICK YEAR-END 2019 | 48 | MANAGEMENT’S DISCUSSION AND ANALYSIS |
Production and Cost Summary - Gold
(Unaudited)
| For the three months ended | For the years ended | |||||||||||||||||||||||||||
| 12/31/2019 | 9/30/2019 | % Change | 12/31/2019 | 12/31/2018 | % Change | 12/31/2017 | ||||||||||||||||||||||
Nevada Gold Mines (61.5%)a | ||||||||||||||||||||||||||||
Gold produced (000s oz) | 585 | 535 | 9 | % | 2,218 | 2,368 | (6 | )% | 2,523 | |||||||||||||||||||
Cost of sales ($/oz) | 1,038 | 1,027 | 1 | % | 924 | 814 | 13 | % | 786 | |||||||||||||||||||
Total cash costs ($/oz)b | 711 | 693 | 3 | % | 634 | 526 | 20 | % | 467 | |||||||||||||||||||
All-in sustaining costs ($/oz)b | 944 | 946 | 0 | % | 828 | 664 | 25 | % | 634 | |||||||||||||||||||
Cortez (61.5%)c | ||||||||||||||||||||||||||||
Gold produced (000s oz) | 133 | 126 | 6 | % | 801 | 1,265 | (37 | )% | 1,447 | |||||||||||||||||||
Cost of sales ($/oz) | 945 | 829 | 14 | % | 762 | 659 | 16 | % | 657 | |||||||||||||||||||
Total cash costs ($/oz)b | 681 | 570 | 19 | % | 515 | 351 | 47 | % | 300 | |||||||||||||||||||
All-in sustaining costs ($/oz)b | 1,012 | 772 | 31 | % | 651 | 430 | 51 | % | 380 | |||||||||||||||||||
Carlin (61.5%)d | ||||||||||||||||||||||||||||
Gold produced (000s oz) | 276 | 278 | (1 | )% | 968 | 835 | 16 | % | 780 | |||||||||||||||||||
Cost of sales ($/oz) | 975 | 1,007 | (3 | )% | 1,004 | 1,054 | (5 | )% | 1,024 | |||||||||||||||||||
Total cash costs ($/oz)b | 766 | 775 | (1 | )% | 746 | 740 | 1 | % | 721 | |||||||||||||||||||
All-in sustaining costs ($/oz)b | 965 | 1,014 | (5 | )% | 984 | 983 | 0 | % | 1,045 | |||||||||||||||||||
Turquoise Ridge (61.5%)e | ||||||||||||||||||||||||||||
Gold produced (000s oz) | 111 | 82 | 35 | % | 335 | 268 | 25 | % | 211 | |||||||||||||||||||
Cost of sales ($/oz) | 971 | 1,077 | (10 | )% | 846 | 783 | 8 | % | 715 | |||||||||||||||||||
Total cash costs ($/oz)b | 625 | 622 | 0 | % | 585 | 678 | (14 | )% | 589 | |||||||||||||||||||
All-in sustaining costs ($/oz)b | 800 | 840 | (5 | )% | 732 | 756 | (3 | )% | 733 | |||||||||||||||||||
Phoenix (61.5%)f | ||||||||||||||||||||||||||||
Gold produced (000s oz) | 31 | 25 | 24 | % | 56 | |||||||||||||||||||||||
Cost of sales ($/oz) | 2,025 | 2,186 | (7 | )% | 2,093 | |||||||||||||||||||||||
Total cash costs ($/oz)b | 902 | 1,010 | (11 | )% | 947 | |||||||||||||||||||||||
All-in sustaining costs ($/oz)b | 1,034 | 1,622 | (36 | )% | 1,282 | |||||||||||||||||||||||
Long Canyon (61.5%)f | ||||||||||||||||||||||||||||
Gold produced (000s oz) | 34 | 24 | 42 | % | 58 | |||||||||||||||||||||||
Cost of sales ($/oz) | 1,026 | 1,170 | (12 | )% | 1,088 | |||||||||||||||||||||||
Total cash costs ($/oz)b | 317 | 353 | (10 | )% | 333 | |||||||||||||||||||||||
All-in sustaining costs ($/oz)b | 657 | 714 | (8 | )% | 681 | |||||||||||||||||||||||
Pueblo Viejo (60%) | ||||||||||||||||||||||||||||
Gold produced (000s oz) | 179 | 139 | 29 | %�� | 590 | 581 | 2 | % | 650 | |||||||||||||||||||
Cost of sales ($/oz) | 660 | 807 | (18 | )% | 747 | 750 | 0 | % | 699 | |||||||||||||||||||
Total cash costs ($/oz)b | 422 | 504 | (16 | )% | 471 | 465 | 1 | % | 405 | |||||||||||||||||||
All-in sustaining costs ($/oz)b | 517 | 631 | (18 | )% | 592 | 623 | (5 | )% | 525 | |||||||||||||||||||
Loulo-Gounkoto (80%)g | ||||||||||||||||||||||||||||
Gold produced (000s oz) | 144 | 153 | (6 | )% | 572 | |||||||||||||||||||||||
Cost of sales ($/oz) | 1,037 | 1,018 | 2 | % | 1,044 | |||||||||||||||||||||||
Total cash costs ($/oz)b | 631 | 630 | 0 | % | 634 | |||||||||||||||||||||||
All-in sustaining costs ($/oz)b | 917 | 966 | (5 | )% | 886 | |||||||||||||||||||||||
Kibali (45%)g | ||||||||||||||||||||||||||||
Gold produced (000s oz) | 87 | 91 | (4 | )% | 366 | |||||||||||||||||||||||
Cost of sales ($/oz) | 1,205 | 1,187 | 2 | % | 1,111 | |||||||||||||||||||||||
Total cash costs ($/oz)b | 608 | 554 | 10 | % | 568 | |||||||||||||||||||||||
All-in sustaining costs ($/oz)b | 740 | 703 | 5 | % | 693 | |||||||||||||||||||||||
Kalgoorlie (50%)h | ||||||||||||||||||||||||||||
Gold produced (000s oz) | 36 | 58 | (38 | )% | 206 | 314 | (34 | )% | 368 | |||||||||||||||||||
Cost of sales ($/oz) | 1,127 | 1,037 | 9 | % | 1,062 | 899 | 18 | % | 806 | |||||||||||||||||||
Total cash costs ($/oz)b | 940 | 856 | 10 | % | 873 | 732 | 19 | % | 642 | |||||||||||||||||||
All-in sustaining costs ($/oz)b | 1,172 | 1,170 | 0 | % | 1,183 | 857 | 38 | % | 729 | |||||||||||||||||||
Tongon (89.7%)g | ||||||||||||||||||||||||||||
Gold produced (000s oz) | 61 | 62 | (2 | )% | 245 | |||||||||||||||||||||||
Cost of sales ($/oz) | 1,476 | 1,396 | 6 | % | 1,469 | |||||||||||||||||||||||
Total cash costs ($/oz)b | 803 | 793 | 1 | % | 787 | |||||||||||||||||||||||
All-in sustaining costs ($/oz)b | 867 | 869 | 0 | % | 844 | |||||||||||||||||||||||
| BARRICK YEAR-END 2019 | 49 | MANAGEMENT’S DISCUSSION AND ANALYSIS |
Production and Cost Summary - Gold (continued)
| (unaudited) | For the three months ended | For the years ended | ||||||||||||||||||||||||||
| 12/31/2019 | 9/30/2019 | % Change | 12/31/19 | 12/31/18 | % Change | 12/31/2017 | ||||||||||||||||||||||
Porgera (47.5%) | ||||||||||||||||||||||||||||
Gold produced (000s oz) | 82 | 75 | 9 | % | 284 | 204 | 39 | % | 235 | |||||||||||||||||||
Cost of sales ($/oz) | 909 | 1,024 | (11 | )% | 994 | 996 | 0 | % | 944 | |||||||||||||||||||
Total cash costs ($/oz)b | 757 | 868 | (13 | )% | 838 | 796 | 5 | % | 781 | |||||||||||||||||||
All-in sustaining costs ($/oz)b | 894 | 1,053 | (15 | )% | 1,003 | 1,083 | (7 | )% | 993 | |||||||||||||||||||
Veladero (50%)i | ||||||||||||||||||||||||||||
Gold produced (000s oz) | 71 | 58 | 22 | % | 274 | 278 | (1 | )% | 432 | |||||||||||||||||||
Cost of sales ($/oz) | 1,138 | 1,243 | (8 | )% | 1,188 | 1,112 | 7 | % | 897 | |||||||||||||||||||
Total cash costs ($/oz)b | 710 | 773 | (8 | )% | 734 | 629 | 17 | % | 598 | |||||||||||||||||||
All-in sustaining costs ($/oz)b | 1,142 | 1,142 | 0 | % | 1,105 | 1,154 | (4 | )% | 987 | |||||||||||||||||||
Hemlo | ||||||||||||||||||||||||||||
Gold produced (000s oz) | 54 | 49 | 10 | % | 213 | 171 | 25 | % | 196 | |||||||||||||||||||
Cost of sales ($/oz) | 1,632 | 1,083 | 51 | % | 1,137 | 1,157 | (2 | )% | 986 | |||||||||||||||||||
Total cash costs ($/oz)b | 1,091 | 953 | 14 | % | 904 | 1,046 | (14 | )% | 841 | |||||||||||||||||||
All-in sustaining costs ($/oz)b | 1,380 | 1,280 | 8 | % | 1,140 | 1,318 | (14 | )% | 1,092 | |||||||||||||||||||
North Maraj | ||||||||||||||||||||||||||||
Gold produced (000s oz) | 103 | 29 | 255 | % | 251 | 215 | 17 | % | 207 | |||||||||||||||||||
Cost of sales ($/oz) | 1,021 | 907 | 13 | % | 953 | 795 | 20 | % | 683 | |||||||||||||||||||
Total cash costs ($/oz)b | 675 | 603 | 12 | % | 646 | 603 | 7 | % | 509 | |||||||||||||||||||
All-in sustaining costs ($/oz)b | 830 | 850 | (2 | )% | 802 | 830 | (3 | )% | 773 | |||||||||||||||||||
Buzwagij | ||||||||||||||||||||||||||||
Gold produced (000s oz) | 28 | 18 | 56 | % | 83 | 93 | (11 | )% | 172 | |||||||||||||||||||
Cost of sales ($/oz) | 1,235 | 1,292 | (4 | )% | 1,240 | 939 | 32 | % | 643 | |||||||||||||||||||
Total cash costs ($/oz)b | 1,144 | 1,202 | (5 | )% | 1,156 | 916 | 26 | % | 600 | |||||||||||||||||||
All-in sustaining costs ($/oz)b | 1,169 | 1,220 | (4 | )% | 1,178 | 947 | 24 | % | 632 | |||||||||||||||||||
Bulyanhuluj | ||||||||||||||||||||||||||||
Gold produced (000s oz) | 9 | 6 | 50 | % | 27 | 26 | 4 | % | 112 | |||||||||||||||||||
Cost of sales ($/oz) | 1,293 | 1,288 | 0 | % | 1,207 | 1,231 | (2 | )% | 1,309 | |||||||||||||||||||
Total cash costs ($/oz)b | 752 | 729 | 3 | % | 676 | 650 | 4 | % | 848 | |||||||||||||||||||
All-in sustaining costs ($/oz)b | 909 | 769 | 18 | % | 773 | 754 | 3 | % | 1,319 | |||||||||||||||||||
Total Attributable to Barrickk | ||||||||||||||||||||||||||||
Gold produced (000s oz) | 1,439 | 1,306 | 10 | % | 5,465 | 4,527 | 21 | % | 5,323 | |||||||||||||||||||
Cost of sales ($/oz)l | 1,046 | 1,065 | (2 | )% | 1,005 | 892 | 13 | % | 794 | |||||||||||||||||||
Total cash costs ($/oz)b | 692 | 710 | (3 | )% | 671 | 588 | 14 | % | 526 | |||||||||||||||||||
All-in sustaining costs ($/oz)b | 923 | 984 | (6 | )% | 894 | 806 | 11 | % | 750 | |||||||||||||||||||
| a. | Represents the combined results of Cortez, Goldstrike (including our 60% share of South Arturo) and our 75% interest in Turquoise Ridge until June 30, 2019. Commencing July 1, 2019, the date Nevada Gold Mines was established, the results represent our 61.5% interest in Cortez, Carlin (including Goldstrike and 60% of South Arturo), Turquoise Ridge (including Twin Creeks), Phoenix and Long Canyon. |
| b. | These arenon-GAAP financial performance measures with no standardized meaning under IFRS and therefore may not be comparable to similar measures presented by other issuers. For further information and a detailed reconciliation of eachnon-GAAP measure used in this section of the MD&A to the most directly comparable IFRS measure, please see pages 91 to 112 of this MD&A. |
| c. | On July 1, 2019, Cortez was contributed to Nevada Gold Mines, a joint venture with Newmont. As a result, the amounts presented are on an 100% basis up until June 30, 2019, and on a 61.5% basis thereafter. |
| d. | On July 1, 2019, Barrick’s Goldstrike and Newmont’s Carlin were contributed to Nevada Gold Mines and are now referred to as Carlin. As a result, the amounts presented represent Goldstrike on a 100% basis (including our 60% share of South Arturo) up until June 30, 2019, and the combined results of Carlin and Goldstrike (including our 60% share of South Arturo) on a 61.5% basis thereafter. |
| e. | Barrick owned 75% of Turquoise Ridge through to the end of the second quarter of 2019, with our joint venture partner, Newmont, owning the remaining 25%. Turquoise Ridge was proportionately consolidated on the basis that the joint venture partners that have joint control have rights to the assets and obligations for the liabilities relating to the arrangement. The figures presented in this table are based on our 75% interest in Turquoise Ridge until June 30, 2019. On July 1, 2019, Barrick’s 75% interest in Turquoise Ridge and Newmont’s Twin Creeks and 25% interest in Turquoise Ridge were contributed to Nevada Gold Mines. Starting July 1, 2019, the results represent our 61.5% share of Turquoise Ridge and Twin Creeks, now referred to as Turquoise Ridge. |
| f. | These sites were acquired as a result of the formation of Nevada Gold Mines on July 1, 2019. |
| g. | These sites did not form a part of the Barrick consolidated results in 2018 and 2017 as these sites were acquired as a result of the Merger. |
| h. | On November 28, 2019, we completed the sale of our 50% interest in Kalgoorlie in Western Australia to Saracen Mineral Holdings Limited for total cash consideration of $750 million. Accordingly, these represent our 50% interest until November 28, 2019. |
| i. | On June 30, 2017, we sold 50% of Veladero; therefore, these represent results on a 100% basis from January 1 to June 30, 2017 and on a 50% basis from July 1, 2017 onwards. |
| j. | Formerly known as Acacia Mining plc. On September 17, 2019, Barrick acquired all of the shares of Acacia it did not own. Operating results are included at 100% from October 1, 2019 (notwithstanding the completion of the Acacia transaction on September 17, 2019, we consolidated our interest in Acacia and recorded anon-controlling interest of 36.1% in the income statement for the entirety of the third quarter of 2019 as a matter of convenience) up until the GoT’s 16% free-carried interest is made effective, which is expected to be January 1, 2020, and on an 84% basis thereafter. |
| k. | With the end of mining at Golden Sunlight and Morila in the second quarter and Lagunas Norte in the third quarter as previously reported, we have ceased to include production ornon-GAAP cost metrics for these sites from July 1, 2019 and October 1, 2019, respectively, onwards although these sites are included in the Total Attributable to Barrick in the prior period comparatives. |
| l. | Cost of sales per ounce (Barrick’s share) is calculated as cost of sales - gold on an attributable basis (excluding sites in care and maintenance) divided by gold equity ounces sold. |
| BARRICK YEAR-END 2019 | 50 | MANAGEMENT’S DISCUSSION AND ANALYSIS |
Production and Cost Summary - Copper
| (unaudited) | For the three months ended | For the years ended | ||||||||||||||||||||||||||
| 12/31/2019 | 9/30/2019 | % Change | 12/31/19 | 12/31/18 | % Change | 12/31/17 | ||||||||||||||||||||||
Lumwana | ||||||||||||||||||||||||||||
Copper production (millions lbs) | 63 | 65 | (3 | )% | 238 | 224 | 6 | % | 256 | |||||||||||||||||||
Cost of sales ($/lb) | 2.22 | 2.04 | 9 | % | 2.13 | 2.51 | (15 | )% | 1.57 | |||||||||||||||||||
C1 cash costs ($/lb)a | 2.10 | 1.83 | 15 | % | 1.79 | 2.08 | (14 | )% | 1.66 | |||||||||||||||||||
All-in sustaining costs ($/lb)a | 3.41 | 3.66 | (7 | )% | 3.04 | 3.08 | (1 | )% | 2.35 | |||||||||||||||||||
Zaldívar (50%) | ||||||||||||||||||||||||||||
Copper production (millions lbs) | 36 | 32 | 13 | % | 128 | 104 | 23 | % | 114 | |||||||||||||||||||
Cost of sales ($/lb) | 2.59 | 2.18 | 19 | % | 2.46 | 2.55 | (4 | )% | 2.15 | |||||||||||||||||||
C1 cash costs ($/lb)a | 1.95 | 1.55 | 26 | % | 1.77 | 1.97 | (10 | )% | 1.66 | |||||||||||||||||||
All-in sustaining costs ($/lb)a | 2.56 | 1.91 | 34 | % | 2.15 | 2.47 | (13 | )% | 2.21 | |||||||||||||||||||
Jabal Sayid (50%) | ||||||||||||||||||||||||||||
Copper production (millions lbs) | 18 | 15 | 20 | % | 66 | 55 | 20 | % | 43 | |||||||||||||||||||
Cost of sales ($/lb) | 1.47 | 1.63 | (10 | )% | 1.53 | 1.73 | (12 | )% | 1.90 | |||||||||||||||||||
C1 cash costs ($/lb)a | 1.29 | 1.42 | (9 | )% | 1.26 | 1.53 | (18 | )% | 1.70 | |||||||||||||||||||
All-in sustaining costs ($/lb)a | 1.78 | 1.65 | 8 | % | 1.51 | 1.92 | (21 | )% | 2.30 | |||||||||||||||||||
Total Copper | ||||||||||||||||||||||||||||
Copper production (millions lbs) | 117 | 112 | 4 | % | 432 | 383 | 13 | % | 413 | |||||||||||||||||||
Cost of sales ($/lb)b | 2.26 | 2.00 | 13 | % | 2.14 | 2.40 | (11 | )% | 1.77 | |||||||||||||||||||
C1 cash costs ($/lb)a | 1.90 | 1.62 | 17 | % | 1.69 | 1.97 | (14 | )% | 1.66 | |||||||||||||||||||
All-in sustaining costs ($/lb)a | 2.82 | 2.58 | 9 | % | 2.52 | 2.82 | (11 | )% | 2.34 | |||||||||||||||||||
| a. | These arenon-GAAP financial performance measures with no standardized meaning under IFRS and therefore may not be comparable to similar measures presented by other issuers. For further information and a detailed reconciliation of eachnon-GAAP measure used in this section of the MD&A to the most directly comparable IFRS measure, please see pages 91 to 112 of this MD&A. |
| b. | Cost of sales per pound (Barrick’s share) is calculated as cost of sales - copper plus our equity share of cost of sales attributable to Zaldívar and Jabal Sayid divided by copper pounds sold. |
OPERATING DIVISIONS PERFORMANCE
Review of Operating Divisions Performance
Following the Merger in the first quarter of 2019 and the events surrounding Nevada Gold Mines and Acacia in the third quarter of 2019 (refer to page 40 for further details), our presentation of reportable operating segments consists of nine gold mines (Cortez, Carlin, Turquoise Ridge, Pueblo Viejo, Loulo-Gounkoto, Kibali, Veladero, Porgera and North Mara). The remaining operating segments, including our remaining gold mines, copper mines and projects, have been
grouped into an “other” category and will not be reported on individually. Segment performance is evaluated based on a number of measures including operating income before tax, production levels and unit production costs. Certain costs are managed on a consolidated basis and are therefore not reflected in segment income.
| BARRICK YEAR-END 2019 | 51 | MANAGEMENT’S DISCUSSION AND ANALYSIS |
Nevada Gold Mines (61.5% basis)a, Nevada USA
| Summary of Operating and Financial Data | For the three months ended | For the years ended | ||||||||||||||||||||||||||
| (unaudited) | 12/31/19 | 9/30/19 | % Change | 12/31/19 | 12/31/18 | % Change | 12/31/17 | |||||||||||||||||||||
Total tonnes mined (000s) | 53,267 | 52,528 | 1 | % | 189,456 | 182,204 | 4 | % | 211,733 | |||||||||||||||||||
Open pit ore | 9,316 | 7,706 | 21 | % | 26,942 | 20,605 | 31 | % | 17,530 | |||||||||||||||||||
Open pit waste | 42,623 | 43,572 | (2 | )% | 157,868 | 157,960 | 0 | % | 190,710 | |||||||||||||||||||
Underground | 1,328 | 1,250 | 6 | % | 4,646 | 3,639 | 28 | % | 3,493 | |||||||||||||||||||
Average grade (grams/tonne) | ||||||||||||||||||||||||||||
Open pit mined | 0.82 | 0.77 | 6 | % | 0.93 | 2.96 | (69 | )% | 2.70 | |||||||||||||||||||
Underground mined | 10.70 | 9.97 | 7 | % | 10.52 | 10.96 | (4 | )% | 10.58 | |||||||||||||||||||
Processed | 1.96 | 2.02 | (3 | )% | 2.29 | 3.47 | (34 | )% | 3.45 | |||||||||||||||||||
Ore tonnes processed (000s) | 11,586 | 10,211 | 13 | % | 36,724 | 25,680 | 43 | % | 24,366 | |||||||||||||||||||
Oxide mill | 3,044 | 3,124 | (3 | )% | 8,338 | 4,527 | 84 | % | 4,562 | |||||||||||||||||||
Roaster | 1,344 | 1,309 | 3 | % | 5,377 | 5,104 | 5 | % | 4,902 | |||||||||||||||||||
Autoclave | 1,556 | 1,316 | 18 | % | 5,656 | 5,338 | 6 | % | 4,730 | |||||||||||||||||||
Heap leach | 5,642 | 4,462 | 26 | % | 17,353 | 10,711 | 62 | % | 10,172 | |||||||||||||||||||
Recovery rate | 80 | % | 79 | % | 1 | % | 82 | % | 83 | % | (1 | )% | 86 | % | ||||||||||||||
Oxide Mill | 60 | % | 60 | % | 0 | % | 69 | % | 83 | % | (17 | )% | 91 | % | ||||||||||||||
Roaster | 86 | % | 87 | % | (1 | )% | 87 | % | 89 | % | (3 | )% | 89 | % | ||||||||||||||
Autoclave | 74 | % | 79 | % | (6 | )% | 74 | % | 69 | % | 8 | % | 62 | % | ||||||||||||||
Gold produced (000s oz) | 585 | 535 | 9 | % | 2,218 | 2,368 | (6 | )% | 2,523 | |||||||||||||||||||
Oxide mill | 76 | 76 | 0 | % | 336 | 590 | (43 | )% | 957 | |||||||||||||||||||
Roaster | 286 | 275 | 4 | % | 1,070 | 1,120 | (4 | )% | 929 | |||||||||||||||||||
Autoclave | 155 | 112 | 39 | % | 547 | 497 | 10 | % | 459 | |||||||||||||||||||
Heap leach | 68 | 72 | (6 | )% | 265 | 161 | 65 | % | 178 | |||||||||||||||||||
Gold sold (000s oz) | 565 | 537 | 5 | % | 2,223 | 2,359 | (6 | )% | 2,579 | |||||||||||||||||||
Revenue ($ millions) | 861 | 804 | 7 | % | 3,128 | 2,986 | 5 | % | 3,241 | |||||||||||||||||||
Cost of sales ($ millions) | 573 | 552 | 4 | % | 2,035 | 1,921 | 6 | % | 2,028 | |||||||||||||||||||
Income ($ millions) | 277 | 237 | 17 | % | 1,050 | 1,011 | 4 | % | 1,169 | |||||||||||||||||||
EBITDA ($ millions)b | 440 | 403 | 9 | % | 1,642 | 1,688 | (3 | )% | 1,990 | |||||||||||||||||||
EBITDA marginc | 51 | % | 50 | % | 2 | % | 52 | % | 57 | % | (7 | )% | 61 | % | ||||||||||||||
Capital expenditures ($ millions)d,e | 145 | 164 | (12 | )% | 627 | 626 | 0 | % | 620 | |||||||||||||||||||
Minesite sustainingd | 124 | 110 | 13 | % | 380 | 272 | 40 | % | 392 | |||||||||||||||||||
Projectd | 21 | 54 | (61 | )% | 247 | 354 | (30 | )% | 228 | |||||||||||||||||||
Cost of sales ($/oz) | 1,038 | 1,027 | 1 | % | 924 | 814 | 13 | % | 786 | |||||||||||||||||||
Total cash costs ($/oz)b | 711 | 693 | 3 | % | 634 | 526 | 20 | % | 467 | |||||||||||||||||||
All-in sustaining costs ($/oz)b | 944 | 946 | 0 | % | 828 | 664 | 25 | % | 634 | |||||||||||||||||||
All-in costs ($/oz)b | 982 | 1,048 | (6 | )% | 938 | 814 | 15 | % | 726 | |||||||||||||||||||
| a. | Represents the combined results of Cortez, Goldstrike (including our 60% share of South Arturo) and our 75% interest in Turquoise Ridge until June 30, 2019. Commencing July 1, 2019, the date Nevada Gold Mines was established, the results represent our 61.5% interest in Cortez, Carlin (including Goldstrike and 60% of South Arturo), Turquoise Ridge (including Twin Creeks), Phoenix and Long Canyon. |
| b. | These arenon-GAAP financial performance measures with no standardized meaning under IFRS and therefore may not be comparable to similar measures presented by other issuers. For further information and a detailed reconciliation of eachnon-GAAP measure used in this section of the MD&A to the most directly comparable IFRS measure, please see pages 91 to 112 of this MD&A. |
| c. | Represents EBITDA divided by revenue. |
| d. | Presented on a cash basis as a result of adopting IFRS 16Leasesstarting in the first quarter of 2019. Capital expenditures for 2018 and 2017 are presented on an accrued basis. Please refer to page 27 of this MD&A for more details. |
| e. | Amounts presented exclude capitalized interest. |
As discussed on page 40, on July 1, 2019, Nevada Gold Mines was established which encompasses Barrick’s former Cortez, Goldstrike, Turquoise Ridge and Goldrush properties and Newmont’s former Carlin, Twin Creeks, Phoenix, Long Canyon and Lone Tree properties. Barrick is the operator of the joint venture and owns 61.5%, with Newmont owning the remaining 38.5% of the joint venture. Refer to the following pages for a detailed discussion of Cortez, Carlin (including Goldstrike) and Turquoise Ridge (including Twin Creeks) results.
| BARRICK YEAR-END 2019 | 52 | MANAGEMENT’S DISCUSSION AND ANALYSIS |
Carlin (61.5% basis)a, Nevada USA
| Summary of Operating and Financial Data | For the three months ended | For the years ended | ||||||||||||||||||||||||||
| (unaudited) | 12/31/19 | 9/30/19 | % Change | 12/31/19 | 12/31/18 | % Change | 12/31/17 | |||||||||||||||||||||
Total tonnes mined (000s) | 13,639 | 11,584 | 18 | % | 49,343 | 59,605 | (17 | )% | 76,587 | |||||||||||||||||||
Open pit ore | 1,832 | 1,627 | 13 | % | 4,773 | 4,626 | 3 | % | 1,575 | |||||||||||||||||||
Open pit waste | 10,966 | 9,145 | 20 | % | 41,978 | 53,387 | (21 | )% | 73,374 | |||||||||||||||||||
Underground | 841 | 812 | 4 | % | 2,592 | 1,592 | 63 | % | 1,638 | |||||||||||||||||||
Average grade (grams/tonne) | ||||||||||||||||||||||||||||
Open pit mined | 1.84 | 1.44 | 28 | % | 2.08 | 3.75 | (44 | )% | 3.56 | |||||||||||||||||||
Underground mined | 9.40 | 8.61 | 9 | % | 9.09 | 9.39 | (3 | )% | 8.88 | |||||||||||||||||||
Processed | 3.65 | 3.33 | 10 | % | 3.80 | 4.32 | (12 | )% | 4.20 | |||||||||||||||||||
Ore tonnes processed (000s) | 3,156 | 3,188 | (1 | )% | 10,467 | 8,075 | 30 | % | 8,041 | |||||||||||||||||||
Oxide mill | 705 | 663 | 6 | % | 1,368 | n/a | n/a | n/a | ||||||||||||||||||||
Roaster | 991 | 980 | 1 | % | 3,627 | 3,341 | 9 | % | 3,783 | |||||||||||||||||||
Autoclave | 892 | 810 | 10 | % | 4,169 | 4,734 | n/a | 4,258 | ||||||||||||||||||||
Heap leach | 568 | 735 | (23 | )% | 1,303 | n/a | n/a | n/a | ||||||||||||||||||||
Recovery rate | 75 | % | 76 | % | (1 | )% | 75 | % | 74 | % | 1 | % | 77 | % | ||||||||||||||
Roaster | 86 | % | 87 | % | (1 | )% | 86 | % | 89 | % | (2 | )% | 88 | % | ||||||||||||||
Autoclave | 58 | % | 63 | % | (9 | )% | 59 | % | 53 | % | 12 | % | 62 | % | ||||||||||||||
Gold produced (000s oz) | 276 | 278 | (1 | )% | 968 | 835 | 16 | % | 780 | |||||||||||||||||||
Oxide mill | 11 | 14 | (21 | )% | 25 | n/a | n/a | n/a | ||||||||||||||||||||
Roaster | 205 | 213 | (4 | )% | 694 | 606 | 15 | % | 531 | |||||||||||||||||||
Autoclave | 49 | 38 | 29 | % | 225 | 229 | (2 | )% | 248 | |||||||||||||||||||
Heap leach | 11 | 13 | (15 | )% | 24 | n/a | n/a | n/a | ||||||||||||||||||||
Gold sold (000s oz) | 275 | 272 | 1 | % | 967 | 842 | 15 | % | 868 | |||||||||||||||||||
Revenue ($ millions) | 408 | 401 | 2 | % | 1,355 | 1,066 | 27 | % | 1,091 | |||||||||||||||||||
Cost of sales ($ millions) | 268 | 274 | (2 | )% | 971 | 886 | 10 | % | 889 | |||||||||||||||||||
Income ($ millions) | 133 | 121 | 10 | % | 370 | 166 | 123 | % | 186 | |||||||||||||||||||
EBITDA ($ millions)b | 191 | 183 | 5 | % | 609 | 428 | 42 | % | 446 | |||||||||||||||||||
EBITDA marginc | 47 | % | 46 | % | 3 | % | 45 | % | 40 | % | 12 | % | 41 | % | ||||||||||||||
Capital expenditures ($ millions)d,e | 51 | 56 | (9 | )% | 211 | 186 | 13 | % | 263 | |||||||||||||||||||
Minesite sustainingd | 51 | 56 | (9 | )% | 211 | 186 | 13 | % | 263 | |||||||||||||||||||
Projectd | 0 | 0 | 0 | % | 0 | 0 | 0 | % | 0 | |||||||||||||||||||
Cost of sales ($/oz) | 975 | 1,007 | (3 | )% | 1,004 | 1,054 | (5 | )% | 1,024 | |||||||||||||||||||
Total cash costs ($/oz)b | 766 | 775 | (1 | )% | 746 | 740 | 1 | % | 721 | |||||||||||||||||||
All-in sustaining costs ($/oz)b | 965 | 1,014 | (5 | )% | 984 | 983 | 0 | % | 1,045 | |||||||||||||||||||
All-in costs ($/oz)b | 965 | 1,014 | (5 | )% | 984 | 983 | 0 | % | 1,045 | |||||||||||||||||||
| a. | On July 1, 2019, Barrick’s Goldstrike operations and Newmont’s Carlin operations were contributed to Nevada Gold Mines and are now collectively referred to as Carlin. As a result, the amounts presented represent Goldstrike on a 100% basis (including our 60% share of South Arturo) up until June 30, 2019, and the combined results of Carlin and Goldstrike (including our 60% share of South Arturo) on a 61.5% basis thereafter. |
| b. | These arenon-GAAP financial performance measures with no standardized meaning under IFRS and therefore may not be comparable to similar measures presented by other issuers. For further information and a detailed reconciliation of eachnon-GAAP measure used in this section of the MD&A to the most directly comparable IFRS measure, please see pages 91 to 112 of this MD&A. |
| c. | Represents EBITDA divided by revenue. |
| d. | Presented on a cash basis as a result of adopting IFRS 16Leasesstarting in the first quarter of 2019. Capital expenditures for 2018 and 2017 are presented on an accrued basis. Please refer to page 27 of this MD&A for more details. |
| e. | Amounts presented exclude capitalized interest. |
On July 1, 2019, Barrick’s Goldstrike operations and Newmont’s Carlin operations were contributed to Nevada Gold Mines and are now collectively referred to as Carlin. As a result, the amounts presented represent Goldstrike on a 100% basis (including our 60% share of South Arturo) up until June 30, 2019, and the combined results of Carlin and Goldstrike (including our 60% share of South Arturo) on a 61.5% basis thereafter. As a result of this transaction, there is now a higher proportion of open pit ore mined and, consequently, the average grade processed is lower, which
also aligns with the inclusion of a heap leach facility contributed by Newmont.
Safety and Environment
Three LTIs were recorded during the quarter (at Goldstrike surface and Carlin) with an LTIFR of 1.27 per million hours worked versus 2.05 the previous quarter. Goldstrike underground reported zero LTIs during the fourth quarter. No Class 1 environmental incidents occurred during the quarter.
| BARRICK YEAR-END 2019 | 53 | MANAGEMENT’S DISCUSSION AND ANALYSIS |
Financial Results
Q4 2019 compared to Q3 2019
Carlin’s income for the fourth quarter of 2019 increased by 10% primarily due to lower cost of sales per ounce5 and higher sales volumes resulting from higher grade ore mined and processed.
Gold production in the fourth quarter of 2019 was 1% lower compared to the prior quarter, mainly due to lower production from the roasters and oxide mill offset by higher autoclave production. The higher autoclave production is a result of higher throughput from processing Carlin stockpiles from Pete open pit, a synergy unlocked by the creation of Nevada Gold Mines.
Cost of sales per ounce5 and total cash costs per ounce4in the fourth quarter of 2019 were 3% and 1% lower, respectively, than the prior quarter mainly due to a higher proportion of lower cost underground production in the feed mix.In the fourth quarter of 2019,all-in sustaining costs per ounce4 decreased by 5% compared to the prior quarter primarily due to lower minesite sustaining capital expenditures.
Capital expenditures in the fourth quarter of 2019 were 9% lower than the prior quarter due to lower underground development and equipment purchases, lower maintenance component replacements for the open pit and the completion of the autoclave brickre-line in the third quarter. Capital drilling also decreased due to the completion of drilling programs for the winter season.
2019 compared to 2018
Carlin’s income for 2019 reflects our 61.5% interest in Nevada Gold Mines and is inclusive of income from Newmont’s former Carlin operations and the Goldstrike operations from July 1, 2019. Income for Carlin for the first six months of 2019 and the twelve months of 2018 represents Barrick’s 100% interest in the Goldstrike operations (including the 60% interest in South Arturo) prior to the formation of Nevada Gold Mines. This was the primary driver of the 123% increase in Carlin’s income compared to 2018.
Income and EBITDA4,a
(unaudited)
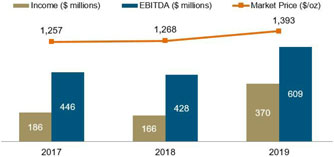
aThe results represent Goldstrike on a 100% basis (including our 60% share of South Arturo) from January 1, 2017 to June 30, 2019 and on the combined results of Carlin and Goldstrike (including our 60% share of South Arturo) on a 61.5% basis from July 1, 2019 onwards.
Gold production for 2019 was 16% higher compared to the prior year, primarily due to the inclusion of Newmont’s former Carlin operations from July 1, 2019. Production in the first six months of 2019 was also higher due to scheduled roaster maintenance at Goldstrike in the first six months of 2018. This was partially offset by the reduction in Barrick’s interest in Goldstrike (including the 60% interest in South Arturo) from 100% to 61.5% from July 1, 2019.
Productiona
(000s ounces)
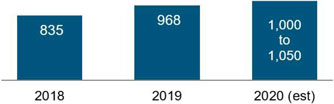
aThe results represent Goldstrike (including our 60% share of South Arturo) on a 100% basis from January 1, 2018 to June 30, 2019 and the combined results of Carlin and Goldstrike (including our 60% share of South Arturo) on a 61.5% basis from July 1, 2019 onwards.
Cost of sales per ounce5 was 5% lower than the prior year due to lower depreciation expense on a per ounce basis. Total cash costs per ounce4andall-in sustaining costs per ounce4were in line with the prior year.
Cost of Sales5, Total Cash Costs4and AISC4
($ per ounce) (unaudited)
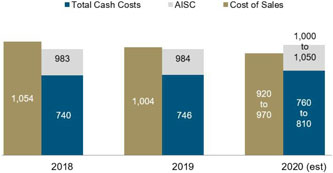
Capital expenditures for 2019 increased by 13% from the same prior year period due to higher minesite sustaining capital expenditures. Higher minesite sustaining capital expenditures are attributed to the inclusion of Newmont’s former Carlin operations, partially offset by the reduction in Barrick’s interest in Goldstrike (including the 60% interest in South Arturo) from 100% to 61.5% from July 1, 2019.
2019 compared to Outlook
Gold production for 2019 of 968 thousand ounces was within the guidance range of 960 to 1,020 thousand ounces. Cost of sales per ounce5 of $1,004 was lower than the guidance range of $1,020 to $1,080 per ounce. Total cash costs per ounce4 andall-in sustaining costs per ounce4 of $746 and $984, respectively, were within the guidance ranges of $740 to $790 per ounce, and $955 to $995 per ounce, respectively.
| BARRICK YEAR-END 2019 | 54 | MANAGEMENT’S DISCUSSION AND ANALYSIS |
Cortez (61.5% basis)a, Nevada USA
| Summary of Operating and Financial Data | For the three months ended | For the years ended | ||||||||||||||||||||||||||
| (unaudited) | 12/31/19 | 9/30/19 | % Change | 12/31/19 | 12/31/18 | % Change | 12/31/17 | |||||||||||||||||||||
Total tonnes mined (000s) | 23,422 | 23,357 | 0 | % | 105,949 | 121,929 | (13 | )% | 134,503 | |||||||||||||||||||
Open pit ore | 3,876 | 2,158 | 80 | % | 14,640 | 15,979 | (8 | )% | 15,955 | |||||||||||||||||||
Open pit waste | 19,275 | 20,948 | (8 | )% | 90,029 | 104,573 | (14 | )% | 117,336 | |||||||||||||||||||
Underground | 271 | 251 | 8 | % | 1,280 | 1,377 | (7 | )% | 1,212 | |||||||||||||||||||
Average grade (grams/tonne) | ||||||||||||||||||||||||||||
Open pit mined | 0.45 | 0.42 | 7 | % | 0.67 | 2.73 | (75 | )% | 2.65 | |||||||||||||||||||
Underground mined | 11.58 | 11.41 | 2 | % | 10.66 | 10.73 | (1 | )% | 13.28 | |||||||||||||||||||
Processed | 1.29 | 1.54 | (16 | )% | 1.60 | 2.67 | (40 | )% | 3.10 | |||||||||||||||||||
Ore tonnes processed (000s) | 4,259 | 2,837 | 50 | % | 17,583 | 17,001 | 3 | % | 15,853 | |||||||||||||||||||
Oxide mill | 638 | 654 | (2 | )% | 3,462 | 4,527 | (24 | )% | 4,562 | |||||||||||||||||||
Roaster | 353 | 329 | 7 | % | 1,750 | 1,763 | (1 | )% | 1,119 | |||||||||||||||||||
Heap leach | 3,268 | 1,854 | 76 | % | 12,371 | 10,711 | 15 | % | 10,172 | |||||||||||||||||||
Recovery rate | 75 | % | 84 | % | (10 | )% | 86 | % | 87 | % | (1 | )% | 92 | % | ||||||||||||||
Oxide Mill | 69 | % | 79 | % | (13 | )% | 78 | % | 83 | % | (6 | )% | 91 | % | ||||||||||||||
Roaster | 86 | % | 86 | % | 0 | % | 87 | % | 91 | % | (4 | )% | 91 | % | ||||||||||||||
Gold produced (000s oz) | 133 | 126 | 6 | % | 801 | 1,265 | (37 | )% | 1,447 | |||||||||||||||||||
Oxide mill | 35 | 34 | 3 | % | 253 | 590 | (57 | )% | 956 | |||||||||||||||||||
Roaster | 81 | 62 | 31 | % | 376 | 514 | (27 | )% | 312 | |||||||||||||||||||
Heap leach | 17 | 30 | (43 | )% | 172 | 161 | 7 | % | 178 | |||||||||||||||||||
Gold sold (000s oz) | 132 | 126 | 5 | % | 798 | 1,255 | (36 | )% | 1,489 | |||||||||||||||||||
Revenue ($ millions) | 194 | 185 | 5 | % | 1,086 | 1,589 | (32 | )% | 1,870 | |||||||||||||||||||
Cost of sales ($ millions) | 124 | 105 | 19 | % | 608 | 828 | (27 | )% | 979 | |||||||||||||||||||
Income ($ millions) | 69 | 77 | (10 | )% | 459 | 726 | (37 | )% | 873 | |||||||||||||||||||
EBITDA ($ millions)b | 105 | 109 | (4 | )% | 656 | 1,112 | (41 | )% | 1,405 | |||||||||||||||||||
EBITDA marginc | 54 | % | 59 | % | (9 | )% | 60 | % | 70 | % | (14 | )% | 75 | % | ||||||||||||||
Capital expenditures ($ millions)d,e | 43 | 53 | (19 | )% | 255 | 340 | (25 | )% | 294 | |||||||||||||||||||
Minesite sustainingd | 40 | 22 | 80 | % | 90 | 65 | 38 | % | 96 | |||||||||||||||||||
Projectd | 3 | 31 | (89 | )% | 165 | 275 | (40 | )% | 198 | |||||||||||||||||||
Cost of sales ($/oz) | 945 | 829 | 14 | % | 762 | 659 | 16 | % | 657 | |||||||||||||||||||
Total cash costs ($/oz)b | 681 | 570 | 19 | % | 515 | 351 | 47 | % | 300 | |||||||||||||||||||
All-in sustaining costs ($/oz)b | 1,012 | 772 | 31 | % | 651 | 430 | 51 | % | 380 | |||||||||||||||||||
All-in costs ($/oz)b | 1,039 | 1,020 | 2 | % | 854 | 649 | 31 | % | 512 | |||||||||||||||||||
| a. | On July 1, 2019, Cortez was contributed to Nevada Gold Mines, a joint venture with Newmont. As a result, the amounts presented are on a 100% basis up until June 30, 2019, and on a 61.5% basis thereafter. |
| b. | These arenon-GAAP financial performance measures with no standardized meaning under IFRS and therefore may not be comparable to similar measures presented by other issuers. For further information and a detailed reconciliation of eachnon-GAAP measure used in this section of the MD&A to the most directly comparable IFRS measure, please see pages 91 to 112 of this MD&A. |
| c. | Represents EBITDA divided by revenue. |
| d. | Presented on a cash basis as a result of adopting IFRS 16Leasesstarting in the first quarter of 2019. Capital expenditures for 2018 and 2017 are presented on an accrued basis. Please refer to page 27 of this MD&A for more details. |
| e. | Amounts presented exclude capitalized interest. |
On July 1, 2019, Barrick’s Cortez operations were contributed to Nevada Gold Mines, a joint venture with Newmont. As a result, the amounts presented represent Cortez on a 100% basis up until June 30, 2019 and on a 61.5% basis thereafter.
Safety and Environment
There were no LTIs at Cortez during the quarter which resulted in an LTIFR of zero per million hours, which is consistent with the prior quarter. No Class 1 environmental incidents occurred during the quarter.
Financial Results
Q4 2019 compared to Q3 2019
Cortez’s income for the fourth quarter of 2019 was 10% lower than the prior quarter primarily due to higher cost of sales per ounce5,partially offset by higher sales volume resulting from higher gold production.
Gold production in the fourth quarter of 2019 was 6% higher compared to the prior quarter, primarily due to increased underground ore mined and then processed at the Carlin Roasters combined with higher recoveries, partially offset by lower heap leach production. The routing of Cortez underground ore through Mill 6 at Carlin was a synergy unlocked by the creation of Nevada Gold Mines.
| BARRICK YEAR-END 2019 | 55 | MANAGEMENT’S DISCUSSION AND ANALYSIS |
Cost of sales per ounce5 and total cash costs per ounce4 in the fourth quarter of 2019 were 14% and 19% higher, respectively, versus the prior quarter primarily due to sales mix and ore routing. In the third quarter of 2019, the remaining higher grade,low-cost stockpiles from the Cortez Hills Open Pit (“CHOP”) were processed. In the fourth quarter of 2019,all-in sustaining costs per ounce4 increased by 31% compared to the prior quarter due to higher cash costs per ounce4 together with higher minesite sustaining capital expenditure.
Capital expenditures in the fourth quarter of 2019 decreased by 19% compared to the prior quarter due to lower project capital expenditures, partially offset by higher minesite sustaining capital expenditures. The lower project capital expenditures relative to the third quarter of 2019 were due to decreases at the Cortez Hills Underground Rangefront project and the change in classification of the Crossroads open pit project from project to sustaining capital. At the Rangefront project, the contractor was removed from site in the fourth quarter due tosub-standard work and safety performance and we are in the process of finding a replacement. The Crossroads open pit project transitioned to production status late in the third quarter frompre-production in the second quarter. Accordingly, higher minesite sustaining capital expenditures relative to the third quarter of 2019 is attributed to this transition.
2019 compared to 2018
Cortez’s income for 2019 reflects our 61.5% interest following the formation of Nevada Gold Mines as described above. Income for Cortez for the same prior year period represents Barrick’s 100% share of the Cortez operations. In addition to this impact, Cortez’s income was impacted by a decrease in sales volume reflecting lower gold production and higher cost of sales per ounce5partially offset by the higher realized gold price4.
Income and EBITDA4,a
(unaudited)
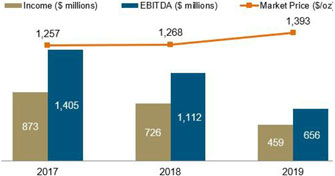
aThe results are on a 100% basis from January 1, 2017 to June 30, 2019 and on a 61.5% basis from July 1, 2019 onwards.
Gold production for 2019 was 37% lower, primarily due to the reduction in Barrick’s interest in Cortez from July 1, 2019 combined with lower grades mined and processed from CHOP as mining was completed in the second quarter of 2019. This was partially offset by higher leach production, and a reduction of gold in circuit. Leach production has increased as mining and placement from Crossroads ramped up in the current year and additional tonnes were placed under solution. The lower gold in circuit balances were also related to the completion of mining at CHOP as the high-grade CHOP ore in circuit was drawn down by the end of the second quarter of 2019.
Productiona
(000s ounces)
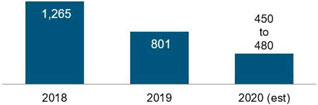
aThe results are on a 100% basis from January 1, 2017 to June 30, 2019 and on a 61.5% basis from July 1, 2019 onwards.
Cost of sales per ounce5for 2019 increased by 16%, due to higher total cash costs per ounce4 offset slightly by lower depreciation expense as mined ounce production has dropped significantly with the transition away from mining predominantly ore in the CHOP pit to waste stripping at Crossroads. Total cash costs per ounce4was 47% higher than the prior year due to lower grades as mining from CHOP was completed in the second quarter of 2019 combined with increased royalty costs and higher tonnes hauled. Royalties have increased as production shifts from CHOP to Crossroads, which carries a higher royalty rate.For 2019,all-in sustaining costs per ounce4 increased by 51% compared to 2018, due to higher total cash costs per ounce4and increased sustaining capital expenditures.
Cost of Sales5, Total Cash Costs4and AISC4
($ per ounce) (unaudited)
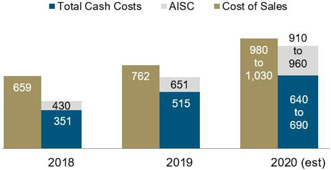
Capital expenditures for 2019 were 25% lower than the prior year due to the reduction in Barrick’s interest in Cortez from 100% to 61.5% from July 1, 2019. In addition to this, the lower project capital expenditures were due to decreasing Crossroads dewatering activities and Rangefront project expenditures. Sustaining capital increased over the prior year due to Area 30 leach pad expansion work.
2019 compared to Outlook
Gold production for 2019 of 801 thousand ounces was at the high end of the guidance range of 760 to 810 thousand ounces. Cost of sales per ounce5for 2019 was $762, which was lower than the guidance range of $810 to $850 per ounce. Total cash costs per ounce4andall-in sustaining costs per ounce4of $515 and $651, respectively, also came in better than guidance, with ranges of $530 to $580 per ounce and $670 to $710 per ounce, respectively.
| BARRICK YEAR-END 2019 | 56 | MANAGEMENT’S DISCUSSION AND ANALYSIS |
Turquoise Ridge (61.5%)a, Nevada USA
| Summary of Operating and Financial Data | For the three months ended | For the years ended | ||||||||||||||||||||||||||
| (unaudited) | 12/31/19 | 9/30/19 | % Change | 12/31/19 | 12/31/18 | % Change | 12/31/17 | |||||||||||||||||||||
Total tonnes mined (000s) | 3,819 | 4,811 | (21 | )% | 9,001 | 670 | 1,243 | % | 643 | |||||||||||||||||||
Open pit ore | 608 | 732 | (17 | )% | 1,340 | n/a | n/a | n/a | ||||||||||||||||||||
Open pit waste | 2,995 | 3,892 | (23 | )% | 6,887 | n/a | n/a | n/a | ||||||||||||||||||||
Underground | 216 | 187 | 16 | % | 774 | 670 | 16 | % | 643 | |||||||||||||||||||
Average grade (grams/tonne) | ||||||||||||||||||||||||||||
Open pit mined | 1.80 | 1.01 | 78 | % | 1.37 | n/a | n/a | n/a | ||||||||||||||||||||
Underground mined | 14.09 | 13.28 | 6 | % | 14.44 | 15.00 | (4 | )% | 15.45 | |||||||||||||||||||
Processed | 4.28 | 3.78 | 13 | % | 5.62 | 14.79 | (62 | )% | 15.01 | |||||||||||||||||||
Ore tonnes processed (000s) | 934 | 950 | (2 | )% | 2,201 | 604 | 264 | % | 472 | |||||||||||||||||||
Oxide Mill | 114 | 107 | 6 | % | 221 | n/a | n/a | n/a | ||||||||||||||||||||
Autoclave | 660 | 506 | 30 | % | 1,483 | 604 | 146 | % | 472 | |||||||||||||||||||
Heap leach | 160 | 337 | (53 | )% | 497 | n/a | n/a | n/a | ||||||||||||||||||||
Recovery Rate | 86 | % | 89 | % | (3 | )% | 89 | % | 93 | % | (4 | )% | 92 | % | ||||||||||||||
Oxide Mill | 87 | % | 87 | % | 0 | % | 87 | % | n/a | n/a | n/a | |||||||||||||||||
Autoclave | 86 | % | 89 | % | (3 | )% | 89 | % | 93 | % | (4 | )% | 92 | % | ||||||||||||||
Gold produced (000s oz) | 111 | 82 | 35 | % | 335 | 268 | 25 | % | 211 | |||||||||||||||||||
Oxide Mill | 3 | 5 | (40 | )% | 8 | n/a | n/a | n/a | ||||||||||||||||||||
Autoclave | 105 | 74 | 42 | % | 321 | 268 | 20 | % | 211 | |||||||||||||||||||
Heap leach | 3 | 3 | (11 | )% | 6 | n/a | n/a | n/a | ||||||||||||||||||||
Gold sold (000s oz) | 99 | 96 | 3 | % | 356 | 262 | 36 | % | 222 | |||||||||||||||||||
Revenue ($ millions) | 152 | 142 | 7 | % | 504 | 331 | 52 | % | 280 | |||||||||||||||||||
Cost of sales ($ millions) | 95 | 103 | (8 | )% | 300 | 206 | 46 | % | 159 | |||||||||||||||||||
Income ($ millions) | 56 | 38 | 47 | % | 201 | 126 | 59 | % | 119 | |||||||||||||||||||
EBITDA ($ millions)b | 90 | 81 | 12 | % | 293 | 154 | 90 | % | 147 | |||||||||||||||||||
EBITDA marginc | 59 | % | 57 | % | 4 | % | 58 | % | 47 | % | 25 | % | 53 | % | ||||||||||||||
Capital expenditures ($ millions)d | 24 | 26 | (7 | )% | 85 | 62 | 37 | % | 36 | |||||||||||||||||||
Minesite sustainingd | 18 | 18 | 1 | % | 50 | 20 | 149 | % | 32 | |||||||||||||||||||
Projectd | 6 | 8 | (25 | )% | 35 | 42 | (17 | )% | 4 | |||||||||||||||||||
Cost of sales ($/oz) | 971 | 1,077 | (10 | )% | 846 | 783 | 8 | % | 715 | |||||||||||||||||||
Total cash costs ($/oz)b | 625 | 622 | 0 | % | 585 | 678 | (14 | )% | 589 | |||||||||||||||||||
All-in sustaining costs ($/oz)b | 800 | 840 | (5 | )% | 732 | 756 | (3 | )% | 733 | |||||||||||||||||||
All-in costs ($/oz)b | 863 | 927 | (7 | )% | 834 | 916 | (9 | )% | 753 | |||||||||||||||||||
| a. | Prior to July 1, 2019, Barrick owned 75% of Turquoise Ridge with our joint venture partner, Newmont, owning the remaining 25%. Turquoise Ridge was proportionately consolidated on the basis that the joint venture partners that have joint control have rights to the assets and obligations for the liabilities relating to the arrangement. The figures presented in this table are based on our 75% interest in Turquoise Ridge until June 30, 2019. On July 1, 2019, Barrick’s 75% interest in Turquoise Ridge and Newmont’s 100% interest in Twin Creeks and 25% interest in Turquoise Ridge were contributed to Nevada Gold Mines. Starting July 1, 2019, the results represent our 61.5% share of Turquoise Ridge and Twin Creeks, now collectively referred to as Turquoise Ridge. |
| b. | These arenon-GAAP financial performance measures with no standardized meaning under IFRS and therefore may not be comparable to similar measures presented by other issuers. For further information and a detailed reconciliation of eachnon-GAAP measure used in this section of the MD&A to the most directly comparable IFRS measure, please see pages 91 to 112 of this MD&A. |
| c. | Represents EBITDA divided by revenue. |
| d. | Presented on a cash basis as a result of adopting IFRS 16Leasesstarting in the first quarter of 2019. Capital expenditures for 2018 and 2017 are presented on an accrued basis. Please refer to page 27 of this MD&A for more details. |
Barrick owned 75% of Turquoise Ridge through to the end of the second quarter of 2019, with our joint venture partner, Newmont, owning the remaining 25%. The figures presented in this table are based on our 75% interest in Turquoise Ridge until June 30, 2019. On July 1, 2019, Barrick’s 75% interest in Turquoise Ridge and Newmont’s Twin Creeks and 25% interest in Turquoise Ridge were contributed to Nevada Gold Mines. Starting July 1, 2019, our results represent our 61.5% share of Turquoise Ridge and Twin Creeks, now referred to as Turquoise Ridge. As a result of this transaction, from July 1, 2019, Turquoise Ridge includes the Twin Creeks open pit operations resulting in considerably higher tonnes mined at
a lower average grade of ore processed. It also includes the Twin Creeks processing operations and heap leach facility contributed by Newmont.
Safety and Environment
There were two LTIs during the quarter, which resulted in an LTIFR of 2.57 per million hours worked versus 1.41 the previous quarter. Site leadership teams continue to focus their field engagements to reinforce safe work requirements and reduce hand injury occurrences. No Class 1 environmental incidents occurred during the quarter.
| BARRICK YEAR-END 2019 | 57 | MANAGEMENT’S DISCUSSION AND ANALYSIS |
Financial Results
Q4 2019 compared to Q3 2019
Turquoise Ridge’s income for the fourth quarter of 2019 increased by 47% mainly due to lower cost of sales per ounce5in conjunction with higher sales volumes reflecting higher production.
Gold production in the fourth quarter of 2019 was 35% higher than the prior quarter, primarily due to increased autoclave throughput in addition to the processing of higher grade ore. The higher autoclave throughput is due to higher availability following a planned shutdown in the prior quarter.
Cost of sales per ounce5 in the fourth quarter of 2019 was 10% lower than the prior quarter. Inventory that was subject to a positive remeasurement to fair value upon the formation of Nevada Gold Mines on July 1, 2019 was largely sold and reflected in cost of sales for the third quarter of 2019.
Total cash costs per ounce4was in line with the prior quarter.All-in sustaining costs per ounce4 decreased by 5% compared to the prior quarter primarily reflecting lower minesite sustaining capital expenditures on a per ounce sold basis.
Capital expenditures in the fourth quarter of 2019 decreased by 7% compared to the prior quarter primarily due to lower project spend on the Third Shaft project.
2019 compared to 2018
Turquoise Ridge’s income for 2019 reflects our 61.5% interest in Nevada Gold Mines and is inclusive of income from Newmont’s former Twin Creeks operations and the Turquoise Ridge operations from July 1, 2019. Income for Turquoise Ridge for the first six months of 2019 and the twelve months of 2018 represents Barrick’s 75% interest in the Turquoise Ridge operations prior to the formation of Nevada Gold Mines. Consequently, this was the primary driver of the 59% increase in Turquoise Ridge’s income compared to 2018.
Income and EBITDA4,a
(unaudited)
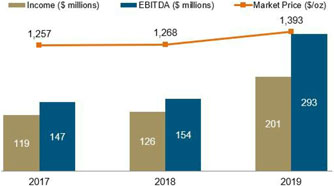
aThe results represent Turquoise Ridge on a 75% basis from January 1, 2017 to June 30, 2019 and the combined results of Turquoise Ridge and Twin Creeks on a 61.5% basis from July 1, 2019 onwards.
Gold production for 2019 was 25% higher compared to the prior year, primarily due to the inclusion of Newmont’s former Twin Creeks operations from July 1, 2019. Production was also higher in the first six months of 2019 relative to the first six months of 2018 due to higher ore tonnes mined at better grades. This was partially offset by the reduction in Barrick’s
interest in the Turquoise Ridge operations from 75% to 61.5% from July 1, 2019.
Productiona
(000s ounces)

aThe results represent Turquoise Ridge on a 75% basis from January 1, 2017 to June 30, 2019 and the combined results of Turquoise Ridge and Twin Creeks on a 61.5% basis from July 1, 2019 onwards.
Cost of sales per ounce5in 2019 was 8% per ounce higher than the prior year mainly reflecting an increase in depreciation resulting from the restatement of assets to fair value on the formation of Nevada Gold Mines as explained above. Total cash costs per ounce4was 14% lower than the prior year due to more high-grade underground ore being processed and the elimination of the Toll Milling Agreement as a result of the formation of Nevada Gold Mines. In 2019,all-in sustaining costs per ounce4 decreased by 3% compared to the prior year due to lower total cash costs per ounce4.
Cost of Sales5, Total Cash Costs4and AISC4
($ per ounce) (unaudited)
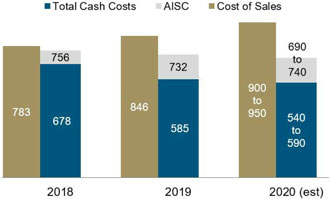
In 2019, capital expenditures increased by 37% compared to the prior year. The increase was due to higher minesite sustaining capital as a result of combining Turquoise Ridge with Twin Creeks, offset by lower project capital spend for the Third Shaft project.
2019 compared to Outlook
Gold production in 2019 of 335 thousand ounces was within the guidance range of 330 to 370 thousand ounces. Cost of sales per ounce5 and total cash costs per ounce4 of $846 and $585, respectively, were also within the guidance ranges of $800 to $850 per ounce and $550 to $600 per ounce, respectively.All-in sustaining costs per ounce4 of $732 was slightly over the guidance range of $680 to $730 per ounce.
| BARRICK YEAR-END 2019 | 58 | MANAGEMENT’S DISCUSSION AND ANALYSIS |
Other Nevada Gold Mines
| Summary of Operating and Financial Data | For the three months ended | |||||||||||||||||||||||||||||||||||||||
| (unaudited) | 12/31/19 | 9/30/19 | ||||||||||||||||||||||||||||||||||||||
| Gold produced (000s oz) | Cost of sales ($/oz) | Total ($/oz)a | All-in sustaining costs ($/oz)a | Capital Expend- ituresb | Gold produced (000s oz) | Cost of sales ($/oz) | Total ($/oz)a | All-in ($/oz)a | Capital Expend- ituresb | |||||||||||||||||||||||||||||||
Phoenix (61.5%)c | 31 | 2,025 | 902 | 1,034 | 5 | 25 | 2,186 | 1,010 | 1,622 | 9 | ||||||||||||||||||||||||||||||
Long Canyon (61.5%)c | 34 | 1,026 | 317 | 657 | 10 | 24 | 1,170 | 353 | 714 | 6 | ||||||||||||||||||||||||||||||
| a. | These arenon-GAAP financial performance measures with no standardized meaning under IFRS and therefore may not be comparable to similar measures presented by other issuers. For further information and a detailed reconciliation of eachnon-GAAP measure used in this section of the MD&A to the most directly comparable IFRS measure, please see pages 91 to 112 of this MD&A. |
| b. | Includes both minesite sustaining and project capital expenditures. |
| c. | These sites were acquired as a result of the formation of Nevada Gold Mines on July 1, 2019. |
Phoenix (61.5%)
Gold production in the fourth quarter of 2019 for Phoenix was 24% higher compared to the prior quarter, primarily due to a more optimized ore blend leading to better mill recoveries. Cost of sales per ounce5 in the fourth quarter of 2019 was 7% lower than the prior quarter due to an improvement in production and sales. Third quarter attributable sales were impacted by the timing of the first gold concentrate sale following the formation of Nevada Gold Mines. In the fourth quarter of 2019,all-in sustaining costs per ounce4 decreased by 36% compared to the prior quarter primarily due to the increase in ounces sold and higher copperby-product credits offset slightly by increased sustaining capital expenditures. Sustaining capital expenditures decreased in the fourth quarter of 2019 due to timing of the tailings damn construction.
Compared to our outlook, gold production of 56 thousand ounces in 2019 was within the guidance range of 50 to 70 thousand ounces. Cost of sales per ounce5 of $2,093 was better than the guidance range of $2,250 to $2,300 per ounce. Total cash costs per ounce4 of $947 was at the lower end of the guidance range of $940 to $990 per ounce, whileall-in sustaining costs per ounce4of $1,282 was above the guidance range of $1,120 to $1,150 per ounce.
Long Canyon (61.5%)
Gold production for Long Canyon in the fourth quarter of 2019 was 42% higher compared to the third quarter of 2019, primarily due to additional cells placed under leach, leading to improved recoveries. Cost of sales per ounce5 in the fourth quarter of 2019 was 12% lower than the prior quarter, mainly due to higher ounces sold driven by higher production.All-in sustaining costs per ounce4 decreased by 8% compared to the prior quarter, primarily due to higher production and sales driving lower total cash costs per ounce4 offset slightly by increased sustaining capital expenditures. Sustaining capital expenditures increased in the fourth quarter due to an increase in capitalized waste mined from Cut 7 of the open pit. Permitting for the open pit and underground expansions at Long Canyon is underway, though currently only the open pit is included in the life of mine plan.
Gold production in 2019 of 58 thousand ounces was above the guidance range of 40 to 50 thousand ounces. Cost of sales per ounce5 of $1,088 was better than the guidance range of $1,100 to $1,150 per ounce. Total cash costs per ounce4 of $333 was within the guidance range of $300 to $350 per ounce, whileall-in sustaining costs per ounce4 of $681 was significantly better than the guidance range of $920 to $950 per ounce.
| BARRICK YEAR-END 2019 | 59 | MANAGEMENT’S DISCUSSION AND ANALYSIS |
Pueblo Viejo (60% basis)a, Dominican Republic
| Summary of Operating and Financial Data | For the three months ended | For the years ended | ||||||||||||||||||||||||||
| (unaudited) | 12/31/19 | 9/30/19 | % Change | 12/31/19 | 12/31/18 | % Change | 12/31/17 | |||||||||||||||||||||
Open pit tonnes mined (000s) | 5,729 | 5,817 | (2 | )% | 24,732 | 24,063 | 3 | % | 23,430 | |||||||||||||||||||
Open pit ore | 3,083 | 1,767 | 74 | % | 8,085 | 9,418 | (14 | )% | 13,514 | |||||||||||||||||||
Open pit waste | 2,646 | 4,050 | (35 | )% | 16,647 | 14,645 | 14 | % | 9,916 | |||||||||||||||||||
Average grade (grams/tonne) | ||||||||||||||||||||||||||||
Open pit waste | 2.92 | 2.98 | (2 | )% | 2.76 | 2.78 | (1 | )% | 3.07 | |||||||||||||||||||
Processed | 4.20 | 4.05 | 4 | % | 3.91 | 4.04 | (3 | )% | 4.57 | |||||||||||||||||||
Autoclave ore tonnes processed (000s) | 1,464 | 1,182 | 24 | % | 5,164 | 5,008 | 3 | % | 4,791 | |||||||||||||||||||
Recovery Rate | 89 | % | 90 | % | (1 | )% | 89 | % | 89 | % | 0 | % | 92 | % | ||||||||||||||
Gold produced (000s oz) | 179 | 139 | 29 | % | 590 | 581 | 2 | % | 650 | |||||||||||||||||||
Gold sold (000s oz) | 174 | 136 | 28 | % | 584 | 590 | (1 | )% | 637 | |||||||||||||||||||
Revenue ($ millions) | 240 | 213 | 13 | % | 843 | 798 | 6 | % | 850 | |||||||||||||||||||
Cost of sales ($ millions) | 114 | 109 | 5 | % | 435 | 443 | (2 | )% | 445 | |||||||||||||||||||
Income ($ millions) | 125 | 104 | 20 | % | 402 | 342 | 18 | % | 395 | |||||||||||||||||||
EBITDA ($ millions)b | 159 | 133 | 20 | % | 522 | 457 | 14 | % | 538 | |||||||||||||||||||
EBITDA marginc | 66 | % | 62 | % | 6 | % | 62 | % | 57 | % | 8 | % | 63 | % | ||||||||||||||
Capital expenditures ($ millions)d | 14 | 16 | (13 | %) | 64 | 87 | (26 | )% | 69 | |||||||||||||||||||
Minesite sustainingd | 14 | 16 | (13 | %) | 64 | 87 | (26 | )% | 69 | |||||||||||||||||||
Projectd | 0 | 0 | 0 | % | 0 | 0 | 0 | % | 0 | |||||||||||||||||||
Cost of sales ($/oz) | 660 | 807 | (18 | %) | 747 | 750 | 0 | % | 699 | |||||||||||||||||||
Total cash costs ($/oz)b | 422 | 504 | (16 | %) | 471 | 465 | 1 | % | 405 | |||||||||||||||||||
All-in sustaining costs ($/oz)b | 517 | 631 | (18 | %) | 592 | 623 | (5 | )% | 525 | |||||||||||||||||||
All-in costs ($/oz)b | 525 | 636 | (17 | %) | 600 | 623 | (4 | )% | 525 | |||||||||||||||||||
| a. | Pueblo Viejo is accounted for as a subsidiary with a 40%non-controlling interest. The results in the table and the discussion that follows are based on our 60% share only. |
| b. | These arenon-GAAP financial performance measures with no standardized meaning under IFRS and therefore may not be comparable to similar measures presented by other issuers. For further information and a detailed reconciliation of eachnon-GAAP measure used in this section of the MD&A to the most directly comparable IFRS measure, please see pages 91 to 112 of this MD&A. |
| c. | Represents EBITDA divided by revenue. |
| d. | Presented on a cash basis as a result of adopting IFRS 16Leasesstarting in the first quarter of 2019. Capital expenditures for 2018 and 2017 are presented on an accrued basis. Please refer to page 27 of this MD&A for more details. |
Safety and Environment
There were no LTIs at Pueblo Viejo during the quarter which resulted in an LTIFR of zero per million hours worked, consistent with the previous quarter. No Class 1 environmental incidents were reported during the quarter.
Financial Results
Q4 2019 compared to Q3 2019
Pueblo Viejo’s income for the fourth quarter of 2019 was 20% higher than the third quarter of 2019 due to higher sales volume and lower cost of sales per ounce5.
Gold production for the fourth quarter of 2019 was 29% higher than the prior quarter mainly due to higher throughput following optimization work resulting in record oxidized sulfur tonnes as well as the completion of scheduled maintenance that occurred in the third quarter of 2019.
Cost of sales per ounce5 and total cash costs per ounce4 for the fourth quarter of 2019 were 18% and 16% lower, respectively, than the prior quarter primarily reflecting the impact of higher sales volume that was driven by the increase in grade and throughput. For the fourth quarter of 2019,all-in sustaining costs per ounce4 decreased by 18% mainly reflecting lower total cash costs per ounce4 and lower minesite sustaining capital expenditures.
Capital expenditures for the fourth quarter of 2019 decreased by 13% compared to the prior quarter, primarily due to lower expenditures at the Llagal Tailings Storage Facility and the completion of the replacement of oxygen plant motors in the third quarter of 2019.
2019 compared to 2018
Pueblo Viejo’s income for 2019 was 18% higher than the prior year due to higher realized gold prices4, while sales volume and cost of sales per ounce5remained relatively consistent.
Income and EBITDA4
(unaudited)
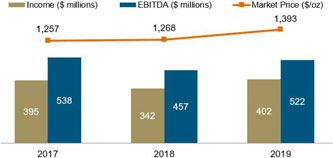
| BARRICK YEAR-END 2019 | 60 | MANAGEMENT’S DISCUSSION AND ANALYSIS |
Gold production for 2019 was 2% higher than the prior year mainly due to higher tonnes processed, partially offset by lower grade.
Production
(000s ounces)
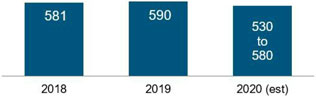
Cost of sales per ounce5 and total cash costs per ounce4 for 2019 were in line and increased by 1%, respectively, compared to the prior year primarily reflecting the impact of slightly lower sales volume. For 2019,all-in sustaining costs per ounce4 decreased by 5% mainly reflecting lower minesite sustaining capital expenditures, partially offset by slightly higher total cash costs per ounce4.
Cost of Sales5, Total Cash Costs4 and AISC4
($ per ounce) (unaudited)
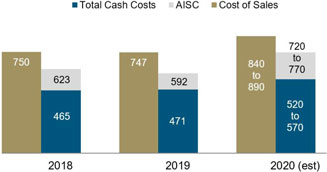
Capital expenditures for 2019 decreased by 26% compared to the prior year, primarily due to lower capitalized stripping from the Monte Negro and Cumba pits compared to a higher proportion of tonnes mined in the prior year from the Moore pit in accordance with the mine plan. This was combined with a decrease in tailings storage facility construction activities during the year.
2019 compared to Outlook
Gold production in 2019 of 590 thousand ounces was at the high end of the guidance range of 550 to 600 thousand ounces. Cost of sales per ounce5 of $747 was better than the guidance range of $780 to $830 per ounce. Total cash costs per ounce4 of $471 was at the low end of the guidance range of $465 to $510 per ounce.All-in sustaining costs per ounce4 of $592 was better than the guidance range of $610 to $650 per ounce.
| BARRICK YEAR-END 2019 | 61 | MANAGEMENT’S DISCUSSION AND ANALYSIS |
Loulo-Gounkoto (80% basis)a, Mali
| Summary of Operating and Financial Data | For the three months ended | For the years ended | ||||||||||||||||||||||||||
| (unaudited) | 12/31/19 | 9/30/19 | % Change | 12/31/19 | 12/31/18b | % Change | 12/31/17b | |||||||||||||||||||||
Total tonnes mined (000s) | 7,250 | 8,115 | (11 | )% | 32,192 | 30,926 | 4 | % | 27,972 | |||||||||||||||||||
Open pit ore | 1,080 | 286 | 278 | % | 2,726 | 3,484 | (22 | )% | 1,875 | |||||||||||||||||||
Open pit waste | 5,566 | 7,244 | (23 | )% | 27,183 | 25,278 | 8 | % | 23,925 | |||||||||||||||||||
Underground | 604 | 585 | 3 | % | 2,283 | 2,164 | 5 | % | 2,172 | |||||||||||||||||||
Average grade (grams/tonne) | ||||||||||||||||||||||||||||
Open pit mined | 5.69 | 4.06 | 40 | % | 4.83 | 3.10 | 56 | % | 4.10 | |||||||||||||||||||
Underground mined | 5.14 | 5.09 | 1 | % | 4.67 | 5.10 | (8 | )% | 6.20 | |||||||||||||||||||
Processed | 5.64 | 5.14 | 10 | % | 4.90 | 4.31 | 14 | % | 4.98 | |||||||||||||||||||
Ore tonnes processed (000s) | 886 | 1,013 | (13 | )% | 3,945 | 4,123 | (4 | )% | 3,934 | |||||||||||||||||||
Recovery rate | 89 | % | 92 | % | (3 | )% | 92 | % | 92 | % | 0 | % | 93 | % | ||||||||||||||
Gold produced (000s oz) | 144 | 153 | (6 | )% | 572 | 528 | 8 | % | 584 | |||||||||||||||||||
Gold sold (000s oz) | 144 | 155 | (7 | )% | 575 | 534 | 8 | % | 579 | |||||||||||||||||||
Revenue ($ millions) | 214 | 230 | (7 | )% | 806 | |||||||||||||||||||||||
Cost of sales ($ millions) | 149 | 159 | (7 | )% | 601 | |||||||||||||||||||||||
Income ($ millions) | 65 | 64 | 1 | % | 190 | |||||||||||||||||||||||
EBITDA ($ millions)c | 123 | 125 | (1 | )% | 426 | |||||||||||||||||||||||
EBITDA margind | 58 | % | 54 | % | 6 | % | 53 | % | ||||||||||||||||||||
Capital expenditures ($ millions) | 38 | 49 | (22 | )% | 136 | |||||||||||||||||||||||
Minesite sustaining | 37 | 49 | (24 | )% | 133 | |||||||||||||||||||||||
Project | 1 | 0 | 100 | % | 3 | |||||||||||||||||||||||
Cost of sales ($/oz) | 1,037 | 1,018 | 2 | % | 1,044 | |||||||||||||||||||||||
Total cash costs ($/oz)c | 631 | 630 | 0 | % | 634 | |||||||||||||||||||||||
All-in sustaining costs ($/oz)c | 917 | 966 | (5 | )% | 886 | |||||||||||||||||||||||
All-in costs ($/oz)c | 922 | 971 | (5 | )% | 891 | |||||||||||||||||||||||
| a. | Barrick owns 80% of Société des Mines de Loulo SA and Société des Mines de Gounkoto with the Republic of Mali owning 20%. Loulo-Gounkoto is accounted for as a subsidiary with a 20%non-controlling interest on the basis that Barrick controls the asset. The results in the table and the discussion that follows are based on our 80% share inclusive of the impact of the purchase price allocation resulting from the Merger. |
| b. | These results did not form a part of the Barrick consolidated results as this site was acquired as a result of the Merger. As a result, operational statistics are presented for reference purposes only. |
| c. | These arenon-GAAP financial performance measures with no standardized meaning under IFRS and therefore may not be comparable to similar measures presented by other issuers. For further information and a detailed reconciliation of eachnon-GAAP measure used in this section of the MD&A to the most directly comparable IFRS measure, please see pages 91 to 112 of this MD&A. |
| d. | Represents EBITDA divided by revenue. |
Safety and Environment
There were no LTIs during the fourth quarter at Loulo-Gounkoto, which was in line with the previous quarter. No Class 1 environmental incidents were recorded.
Financial Results
Q4 2019 compared to Q3 2019
Loulo-Gounkoto’s income for the fourth quarter of 2019 was in line with the prior quarter.
Gold production for the fourth quarter of 2019 was 6% lower than the prior quarter mainly due to lower plant throughput due to a girth gear failure, partially offset by higher feed grade from both Yalea and the Gounkoto South Pit. The girth gear was repaired in December 2019.
Cost of sales per ounce5 for the fourth quarter of 2019 was 2% higher than the prior quarter primarily due to higher depreciation per ounce. Total cash costs per ounce4was in line with the prior quarter as the impact of lower throughput was largely offset by the impact of the higher grade processed. For the fourth quarter of 2019,all-in sustaining costs per ounce4 decreased by 5% compared to the prior quarter
reflecting lower sustaining capital expenditures from reduced capitalized stripping.
Capital expenditures for the fourth quarter of 2019 decreased by 22% compared to the prior quarter, primarily due to lower capitalized stripping costs.
2019
Loulo-Gounkoto’s income for 2019 was $190 million.
Gold production in 2019 was 8% higher compared to the same prior year period, primarily due to higher feed grade from Yalea and the Gounkoto South Pit.
Production
(000s ounces)
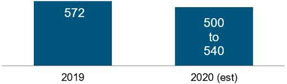
| BARRICK YEAR-END 2019 | 62 | MANAGEMENT’S DISCUSSION AND ANALYSIS |
Cost of sales per ounce5 and total cash costs per ounce4 in 2019 were $1,044 and $634, respectively. Cost of sales per ounce5 and total cash costs per ounce4 were positively impacted primarily by the higher feed grade to the mill. For 2019,all-in sustaining costs4 were $886 per ounce.
Cost of Sales5, Total Cash Costs4 and AISC4
($ per ounce) (unaudited)
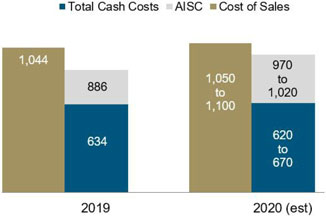
Capital expenditures in 2019 were $136 million, consisting of underground development and drilling in Gara and Yalea, as well as sustaining capital related to our solar power project at Loulo, capitalized drilling and expansion of the TSF.
2019 compared to Outlook
Gold production in 2019 of 572 thousand ounces was marginally above the guidance range of 520 to 570 thousand ounces. Cost of sales per ounce5 of $1,044 was higher than the guidance range of $880 to $930 per ounce. Total cash costs per ounce4 andall-in sustaining costs per ounce4 of $634 and $886, respectively, were also marginally above the guidance ranges of $575 to $625 per ounce and $810 to $850 per ounce, respectively.
| BARRICK YEAR-END 2019 | 63 | MANAGEMENT’S DISCUSSION AND ANALYSIS |
Kibali (45% basis)a, Democratic Republic of Congo
| Summary of Operating and Financial Data | For the three months ended | For the years ended | ||||||||||||||||||||||||||
| (unaudited) | 12/31/19 | 9/30/19 | % Change | 12/31/19 | 12/31/18b | % Change | 12/31/17b | |||||||||||||||||||||
Total tonnes mined (000s) | 3,096 | 3,077 | 1 | % | 12,273 | 14,790 | (17 | )% | 16,435 | |||||||||||||||||||
Open pit ore | 346 | 269 | 29 | % | 1,693 | 2,455 | (31 | )% | 2,239 | |||||||||||||||||||
Open pit waste | 2,290 | 2,330 | (2 | )% | 8,824 | 10,709 | (18 | )% | 13,275 | |||||||||||||||||||
Underground | 460 | 478 | (4 | )% | 1,756 | 1,626 | 8 | % | 921 | |||||||||||||||||||
Average grade (grams/tonne) | ||||||||||||||||||||||||||||
Open pit mined | 2.21 | 2.26 | (2 | )% | 2.32 | 2.43 | (4 | )% | 2.39 | |||||||||||||||||||
Underground mined | 4.68 | 5.17 | (9 | )% | 5.12 | 5.06 | 1 | % | 5.51 | |||||||||||||||||||
Processed | 3.67 | 3.74 | (2 | )% | 3.80 | 3.45 | 10 | % | 2.92 | |||||||||||||||||||
Ore tonnes processed (000s) | 839 | 852 | (2 | )% | 3,381 | 3,698 | (9 | )% | 3,429 | |||||||||||||||||||
Recovery rate | 88 | % | 88 | % | 0 | % | 89 | % | 89 | % | 0 | % | 83 | % | ||||||||||||||
Gold produced (000s oz) | 87 | 91 | (4 | )% | 366 | 363 | 1 | % | 268 | |||||||||||||||||||
Gold sold (000s oz) | 89 | 89 | 0 | % | 363 | 370 | (2 | )% | 272 | |||||||||||||||||||
Revenue ($ millions) | 130 | 133 | (2 | )% | 505 | |||||||||||||||||||||||
Cost of sales ($ millions) | 106 | 107 | (1 | )% | 403 | |||||||||||||||||||||||
Income ($ millions) | 30 | 25 | 20 | % | 108 | |||||||||||||||||||||||
EBITDA ($ millions)c | 82 | 82 | 0 | % | 304 | |||||||||||||||||||||||
EBITDA margind | 63 | % | 62 | % | 2 | % | 60 | % | ||||||||||||||||||||
Capital expenditures ($ millions) | 9 | 14 | (36 | )% | 43 | |||||||||||||||||||||||
Minesite sustaining | 9 | 13 | (31 | )% | 41 | |||||||||||||||||||||||
Project | 0 | 1 | (100 | )% | 2 | |||||||||||||||||||||||
Cost of sales ($/oz) | 1,205 | 1,187 | 2 | % | 1,111 | |||||||||||||||||||||||
Total cash costs ($/oz)c | 608 | 554 | 10 | % | 568 | |||||||||||||||||||||||
All-in sustaining costs ($/oz)c | 740 | 703 | 5 | % | 693 | |||||||||||||||||||||||
All-in costs ($/oz)c | 746 | 717 | 4 | % | 701 | |||||||||||||||||||||||
| a. | Barrick owns 45% of Kibali Goldmines SA (Kibali) with the Democratic Republic of Congo (“DRC”) and our joint venture partner, AngloGold Ashanti, owning 10% and 45%, respectively. Kibali is accounted for as an equity method investment on the basis that the joint venture partners that have joint control have rights to the net assets of the joint venture. The figures presented in this table and the discussion that follows are based on our 45% effective interest in Kibali inclusive of the impact of the purchase price allocation resulting from the Merger. |
| b. | These results did not form a part of the Barrick consolidated results as this site was acquired as a result of the Merger. As a result, operational statistics are presented for reference purposes only. |
| c. | These arenon-GAAP financial performance measures with no standardized meaning under IFRS and therefore may not be comparable to similar measures presented by other issuers. For further information and a detailed reconciliation of eachnon-GAAP measure used in this section of the MD&A to the most directly comparable IFRS measure, please see pages 91 to 112 of this MD&A. |
| d. | Represents EBITDA divided by revenue. |
Safety and Environment
Kibali did not sustain any LTIs during the fourth quarter, in line with the safety performance of the previous quarter. No Class 1 environmental incidents were recorded.
Financial Results
Q4 2019 compared to Q3 2019
Kibali’s income for the fourth quarter of 2019 was 20% higher than the third quarter of 2019.
Gold production for the fourth quarter of 2019 was 4% lower than the prior quarter as grade fed to the plant decreased in comparison with the prior period, in line with plan, as the restoration of stockpiles following the second quarter winder failure continued. Additionally, plant throughput decreased marginally, in line with plan.
Cost of sales per ounce5 and total cash costs per ounce4 for the fourth quarter of 2019 were 2% and 10% higher, respectively, than the prior quarter primarily due to the decrease in grade fed to the plant, increased grade control drilling costs and an increase in stripping costs that were
expensed. This was offset by lowerquarter-on-quarter general and administrative expenditure.
For the fourth quarter of 2019,all-in sustaining costs per ounce4 increased by 5% compared to the prior quarter, reflecting higher total cash costs per ounce4offset by lowerminesite sustaining capital expenditures as detailed below, when compared with the previous period.
Capital expenditures for the fourth quarter of 2019 decreased by 36% due to lower capitalized stripping and underground development, although these were in line with plan.
2019
Kibali’s income for 2019 was $108 million.
Gold production in 2019 was 1% higher compared to the same prior year period, primarily due to increased feed grade in the current period as a result of blending more higher grade underground material in line with the mine plan, partially offset by decreased throughput.
| BARRICK YEAR-END 2019 | 64 | MANAGEMENT’S DISCUSSION AND ANALYSIS |
Production
(000s ounces)
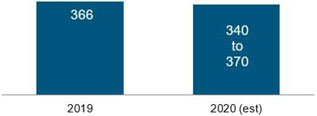
Cost of sales per ounce5 and total cash costs per ounce4 in 2019 were $1,111 and $568 per ounce, respectively. Cost of sales includes the depreciation charge relating to the purchase price allocation fair value increment. Although total cash costs per ounce4 were impacted by higher operating expenditures in the first quarter of the year, cost performance has improved over the remainder of the year. For 2019,all-in sustaining costs per ounce4 were $693 per ounce.
Cost of Sales5, Total Cash Costs4and AISC4
($ per ounce) (unaudited)
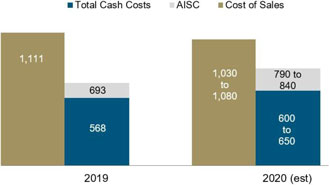
Capital expenditures in 2019 were $43 million, consisting of underground mining development, underground hauling equipment, capitalized stripping, capitalized drilling and rebuilds of mobile equipment.
2019 compared to Outlook
Gold production in 2019 of 366 thousand ounces was higher than the guidance range of 330 to 350 thousand ounces. Cost of sales per ounce5 of $1,111 was also better than the guidance range of $1,150 to $1,200 per ounce. Total cash costs per ounce4 andall-in sustaining costs per ounce4 of $568 and $693, respectively, were in the lower half of the guidance ranges of $555 to $605 per ounce and $670 to $730 per ounce, respectively.
| BARRICK YEAR-END 2019 | 65 | MANAGEMENT’S DISCUSSION AND ANALYSIS |
Veladero (50% basis)a,b, Argentina
| Summary of Operating and Financial Data | For the three months ended | For the years ended | ||||||||||||||||||||||||||
| (unaudited) | 12/31/19 | 9/30/19 | % Change | 12/31/19 | 12/31/18 | % Change | 12/31/17 | |||||||||||||||||||||
Open pit tonnes mined (000s) | 10,277 | 9,449 | 9 | % | 36,758 | 35,646 | 3 | % | 48,376 | |||||||||||||||||||
Open pit ore | 4,828 | 3,909 | 24 | % | 16,048 | 15,718 | 2 | % | 21,558 | |||||||||||||||||||
Open pit waste | 5,449 | 5,540 | (2 | )% | 20,710 | 19,928 | 4 | % | 26,818 | |||||||||||||||||||
Average grade (grams/tonne) | ||||||||||||||||||||||||||||
Open pit mined | 0.80 | 0.68 | 18 | % | 0.71 | 0.78 | (9 | )% | 1.00 | |||||||||||||||||||
Processed | 0.88 | 0.74 | 19 | % | 0.79 | 0.85 | (8 | )% | 1.02 | |||||||||||||||||||
Heap leach ore tonnes processed (000s) | 3,880 | 3,463 | 12 | % | 13,587 | 13,547 | 0 | % | 21,190 | |||||||||||||||||||
Gold produced (000s oz) | 71 | 58 | 22 | % | 274 | 278 | (1 | )% | 432 | |||||||||||||||||||
Gold sold (000s oz) | 70 | 59 | 19 | % | 271 | 280 | (3 | )% | 458 | |||||||||||||||||||
Revenue ($ millions) | 106 | 89 | 19 | % | 386 | 366 | 5 | % | 591 | |||||||||||||||||||
Cost of sales ($ millions) | 82 | 72 | 14 | % | 323 | 310 | 4 | % | 410 | |||||||||||||||||||
Income ($ millions) | 21 | 14 | 50 | % | 57 | 53 | 8 | % | 173 | |||||||||||||||||||
EBITDA ($ millions)c | 50 | 39 | 28 | % | 172 | 174 | (1 | )% | 292 | |||||||||||||||||||
EBITDA margind | 47 | % | 44 | % | 8 | % | 45 | % | 48 | % | (6 | )% | 49 | % | ||||||||||||||
Capital expenditures ($ millions)e | 28 | 19 | 47 | % | 106 | 143 | (26 | )% | 173 | |||||||||||||||||||
Minesite sustaininge | 28 | 19 | 47 | % | 91 | 143 | (37 | )% | 173 | |||||||||||||||||||
Projecte | 0 | 0 | 0 | % | 15 | 0 | 0 | % | 0 | |||||||||||||||||||
Cost of sales ($/oz) | 1,138 | 1,243 | (8 | )% | 1,188 | 1,112 | 7 | % | 897 | |||||||||||||||||||
Total cash costs ($/oz)c | 710 | 773 | (8 | )% | 734 | 629 | 17 | % | 598 | |||||||||||||||||||
All-in sustaining costs ($/oz)c | 1,142 | 1,142 | 0 | % | 1,105 | 1,154 | (4 | )% | 987 | |||||||||||||||||||
All-in costs ($/oz)c | 1,142 | 1,142 | 0 | % | 1,162 | 1,154 | 1 | % | 987 | |||||||||||||||||||
| a. | Barrick owns 50% of Veladero with our joint venture partner, Shandong Gold, owning the remaining 50%. Veladero is proportionately consolidated on the basis that the joint venture partners that have joint control have rights to the assets and obligations for the liabilities relating to the arrangement. The figures presented in this table and the discussion that follows are based on our 50% interest in Veladero inclusive of the impact of remeasurement of our interest in Veladero following the disposal of a 50% interest on June 30, 2017. |
| b. | On June 30, 2017, we sold 50% of Veladero; therefore, these represent results on a 100% basis from January 1 to June 30, 2017 and on a 50% basis from July 1, 2017 onwards. |
| c. | These arenon-GAAP financial performance measures with no standardized meaning under IFRS and therefore may not be comparable to similar measures presented by other issuers. For further information and a detailed reconciliation of eachnon-GAAP measure used in this section of the MD&A to the most directly comparable IFRS measure, please see pages 91 to 112 of this MD&A. |
| d. | Represents EBITDA divided by revenue. |
| e. | Presented on a cash basis as a result of adopting IFRS 16Leasesstarting in the first quarter of 2019. Capital expenditures for 2018 and 2017 are presented on an accrued basis. Please refer to page 27 of this MD&A for more details. |
Safety and Environment
At Veladero, two LTIs were recorded during the quarter resulting in a LTIFR of 1.24 per million hours worked versus 0.52 the previous quarter. No Class 1 environmental incidents occurred during the quarter.
Minera Andina del Sol SRL, the joint venture company that operates the Veladero mine, is the subject of various regulatory proceedings related to operational incidents occurring in March 2017, September 2016 and September 2015.
Financial Results
Q4 2019 compared to Q3 2019
Veladero’s income for the fourth quarter of 2019 was 50% higher than the third quarter of 2019 primarily due to higher sales volume and lower cost of sales per ounce5.
Gold production in the fourth quarter of 2019 was 22% higher than the prior quarter, primarily due to higher ore grades and higher tonnages processed, partially offset by lower leach pad recoveries.
Cost of sales per ounce5 and total cash costs per ounce4 in the fourth quarter of 2019 both decreased by 8%, mainly due to the impact of higher sales volumes, partially offset by higher direct mining costs, export duties and royalties from increased realized gold prices. In the fourth quarter of 2019,all-in sustaining costs per ounce4 remained in line with the prior quarter as lower total cash costs per ounce4 were offset by higher minesite sustaining capital expenditures.
Capital expenditures in the fourth quarter of 2019 increased by 47% compared to the prior quarter mainly relating to construction activities for leach pad expansion phases 4B, 5B and 6, combined with higher capitalized stripping.
2019 compared to 2018
Veladero’s income for 2019 was 8% higher than the prior year primarily due to higher realized gold prices4, partially offset by lower sales volumes and higher cost of sales per ounce5.
| BARRICK YEAR-END 2019 | 66 | MANAGEMENT’S DISCUSSION AND ANALYSIS |
Income and EBITDA4, a
(unaudited)
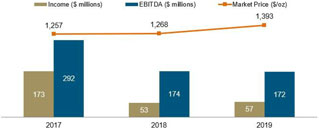
aThe results are on an 100% basis from January 1, 2017 to June 30, 2017 and on an 50% basis from July 1, 2017 onwards.
In 2019, gold production exceeded guidance with better than expected results from leach pad recovery initiatives and improved solution management. As a result, gold production was relatively consistent with the prior year as lower ore grades processed were partially offset by higher leach pad recoveries.
Productiona
(000s ounces)
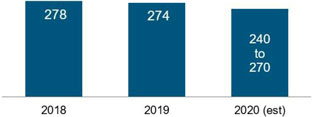
aThe results are on an 100% basis from January 1, 2017 to June 30, 2017 and on an 50% basis from July 1, 2017 onwards.
In 2019, cost of sales per ounce5andtotal cash costs per ounce4 increased by 7% and 17%, respectively, compared to the prior year mainly due to higher export duties and royalties resulting from increased realized gold prices4 and the export tax announced in September 2018 by the Argentine government. This was partially offset by the devaluation of the Argentine peso and business improvement initiatives. Cost of sales per ounce5was further impacted by lower depreciation expense.
All-in sustaining costs per ounce4 in 2019 decreased by 4% compared to the prior year primarily due to a decrease in minesite sustaining capital expenditures on a per ounce basis, partially offset by an increase in total cash costs per ounce4.
Cost of Sales5, Total Cash Costs4and AISC4
($ per ounce) (unaudited)
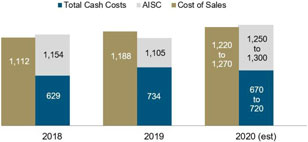
In 2019, capital expenditures decreased by 26% compared to the prior year mainly due to the funding of a power transmission line in Argentina as a result of an agreement made with the Provincial Power Regulatory Body of San Juan (“EPRE”) occurring in the prior year, lower capitalized stripping and lower purchases of components and mine equipment, partially offset by an increase in construction activities for leach pad expansion phases 4B, 5B, and 6.
2019 compared to Outlook
Gold production in 2019 of 274 thousand ounces exceeded the guidance range of 230 to 250 thousand ounces. All cost metrics came in below guidance. Cost of sales per ounce5 was $1,188 compared to the guidance range of $1,250 to $1,350 per ounce. Total cash costs per ounce4 was $734 compared to $770 to $820 per ounce, andall-in sustaining costs per ounce4 was $1,105, compared to $1,150 to $1,250 per ounce.
Regulatory matters
On December 14, 2019, the President of Argentina abolished the exchange rate limit applied to the calculation of export duties (previously ARS 4 for each $1). On December 23, 2019, the Argentine Congress further enacted an emergency law setting a maximum rate for mining export duties at 8%; however, this emergency law has not yet entered into force. Barrick is seeking the immediate implementation of the reduced 8% cap for customs purposes; however, a decision on this has not yet been made.
| BARRICK YEAR-END 2019 | 67 | MANAGEMENT’S DISCUSSION AND ANALYSIS |
Porgera (47.5% basis)a, Papua New Guinea
| Summary of Operating and Financial Data | For the three months ended | For the years ended | ||||||||||||||||||||||||||
| (unaudited) | 12/31/19 | 9/30/19 | % Change | 12/31/19 | 12/31/18 | % Change | 12/31/17 | |||||||||||||||||||||
Total tonnes mined (000s) | 2,880 | 3,657 | (21 | )% | 13,156 | 9,862 | 33 | % | 11,504 | |||||||||||||||||||
Open pit ore | 509 | 495 | 3 | % | 1,825 | 568 | 221 | % | 767 | |||||||||||||||||||
Open pit waste | 2,124 | 2,914 | (27 | )% | 10,406 | 8,529 | 22 | % | 9,912 | |||||||||||||||||||
Underground | 247 | 248 | 0 | % | 925 | 765 | 21 | % | 825 | |||||||||||||||||||
Average grade (grams/tonne) | ||||||||||||||||||||||||||||
Open pit mined | 2.07 | 2.07 | 0 | % | 1.92 | 2.06 | (7 | )% | 1.87 | |||||||||||||||||||
Underground mined | 7.86 | 5.88 | 34 | % | 6.67 | 6.93 | (4 | )% | 6.57 | |||||||||||||||||||
Processed | 3.94 | 3.33 | 18 | % | 3.44 | 3.46 | (1 | )% | 3.03 | |||||||||||||||||||
Autoclave ore tonnes processed (000s) | 705 | 705 | 0 | % | 2,640 | 2,138 | 23 | % | 2,798 | |||||||||||||||||||
Recovery Rate | 92 | % | 90 | % | 2 | % | 91 | % | 86 | % | 5 | % | 86 | % | ||||||||||||||
Gold produced (000s oz) | 82 | 75 | 9 | % | 284 | 204 | 39 | % | 235 | |||||||||||||||||||
Gold sold (000s oz) | 82 | 75 | 9 | % | 285 | 213 | 34 | % | 253 | |||||||||||||||||||
Revenue ($ millions) | 123 | 111 | 11 | % | 403 | 269 | 50 | % | 322 | |||||||||||||||||||
Cost of sales ($ millions) | 75 | 76 | (1 | )% | 284 | 212 | 34 | % | 238 | |||||||||||||||||||
Income ($ millions) | 44 | 35 | 26 | % | 113 | 56 | 102 | % | 83 | |||||||||||||||||||
EBITDA ($ millions)b | 56 | 46 | 22 | % | 155 | 98 | 58 | % | 121 | |||||||||||||||||||
EBITDA marginc | 46 | % | 44 | % | 4 | % | 38 | % | 36 | % | 6 | % | 38 | % | ||||||||||||||
Capital expenditures ($ millions)d | 11 | 14 | (21 | )% | 45 | 62 | (28 | )% | 55 | |||||||||||||||||||
Minesite sustainingd | 11 | 14 | (21 | )% | 45 | 62 | (28 | )% | 55 | |||||||||||||||||||
Projectd | 0 | 0 | 0 | % | 0 | 0 | 0 | % | 0 | |||||||||||||||||||
Cost of sales ($/oz) | 909 | 1,024 | (11 | )% | 994 | 996 | 0 | % | 944 | |||||||||||||||||||
Total cash costs ($/oz)b | 757 | 868 | (13 | )% | 838 | 796 | 5 | % | 781 | |||||||||||||||||||
All-in sustaining costs ($/oz)b | 894 | 1,053 | (15 | )% | 1,003 | 1,083 | (7 | )% | 993 | |||||||||||||||||||
All-in costs ($/oz)b | 894 | 1,053 | (15 | )% | 1,003 | 1,083 | (7 | )% | 993 | |||||||||||||||||||
| a. | Barrick owns 47.5% of Porgera with our joint venture partners, Zijin Mining and Mineral Resources Enga, owning the remaining 47.5% and 5%, respectively. Porgera is proportionately consolidated on the basis that the joint venture partners that have joint control have rights to the assets and obligations for the liabilities relating to the arrangement. The figures presented in this table and the discussion that follows are based on our 47.5% interest in Porgera. |
| b. | These arenon-GAAP financial performance measures with no standardized meaning under IFRS and therefore may not be comparable to similar measures presented by other issuers. For further information and a detailed reconciliation of eachnon-GAAP measure used in this section of the MD&A to the most directly comparable IFRS measure, please see pages 91 to 112 of this MD&A. |
| c. | Represents EBITDA divided by revenue. |
| d. | Presented on a cash basis as a result of adopting IFRS 16Leasesstarting in the first quarter of 2019. Capital expenditures for 2018 and 2017 are presented on an accrued basis. Please refer to page 27 of this MD&A for more details. |
Safety and Environment
There were 3 LTIs at Porgera during the quarter which resulted in an LTIFR of 1.04 per million hours worked versus 1.05 the previous quarter. No Class 1 environmental incidents were reported during the quarter.
Financial Results
Q4 2019 compared to Q3 2019
Porgera’s income for the fourth quarter of 2019 was 26% higher than the third quarter of 2019 primarily due to higher sales volume reflecting higher gold production and a decrease in cost of sales per ounce5.
Gold production in the fourth quarter of 2019 was 9% higher than the prior quarter, primarily due to higher underground ore grade mined and processed.
Cost of sales per ounce5 and total cash costs per ounce4 in the fourth quarter of 2019 decreased by 11% and 13%, respectively. This was mainly due to the higher underground grade processed and the depletion of historic concentrate
stockpiles in the previous quarter that was included in inventory at higher unit costs.
In the fourth quarter of 2019,all-in sustaining costs per ounce4 decreased by 15% compared to the prior quarter due to the decrease in total cash costs per ounce4and lower minesite sustaining capital expenditures.
Capital expenditures in the fourth quarter of 2019 decreased by 21% compared to the prior quarter due to lower capitalized stripping as the mining sequence changed from predominantly waste stripping to ore production, in line with the mine plan for the quarter.
2019 compared to 2018
Porgera’s income for 2019 was 102% higher than the prior year, primarily due to an increase in sales volume and higher realized gold prices4. In 2018, operations at Porgera were impacted by an earthquake which disrupted power supply for an extended period. This impacted all of the performance and cost metrics for 2018.
| BARRICK YEAR-END 2019 | 68 | MANAGEMENT’S DISCUSSION AND ANALYSIS |
Income and EBITDA4
(unaudited)
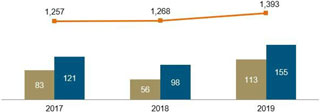
In 2019, gold production exceeded the top end of the guidance range and was 39% higher compared to the prior year, reflecting a strong finish to the year given better mill availability in the second half of 2019 as well as the impact to operations from the earthquake in the prior year.
Production
(000s ounces)

In 2019, cost of sales per ounce5 remained consistent with the prior year, while total cash costs per ounce4 increased by 5%. Higher total cash costs per ounce4 were due to increased energy costs related to power line interruptions during the first half of 2019, higher freight costs and increased maintenance activities following the deferral of this work in 2018 due to the earthquake. This was partially offset by the impact of higher sales volume.
All-in sustaining costs4 in 2019 decreased by 7% compared to the prior year due to lower minesite sustaining capital expenditures, partially offset by increased total cash costs per ounce4.
Cost of Sales5, Total Cash Costs4and AISC4
($ per ounce) (unaudited)
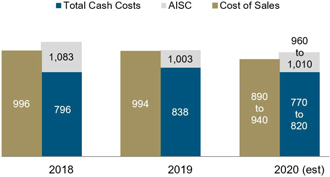
In 2019, capital expenditures decreased by 28% compared to the prior year primarily due to lower capitalized stripping as the mining sequence changed from predominantly waste stripping to ore production, in line with the mine plan.
2019 compared to Outlook
Gold production in 2019 of 284 thousand ounces exceeded the guidance range of 240 to 260 thousand ounces. All cost metrics were within guidance. Cost of sales per ounce5 of $994 was in the lower end of the guidance range of $980 to $1,030 per ounce. Total cash costs per ounce4 was $838 compared to $800 to $850 per ounce, andall-in sustaining costs per ounce4 was $1,003, compared to $985 to $1,025 per ounce.
Regulatory Matters
Porgera’s current Special Mining Lease terminated on August 16, 2019. The company has been working constructively with the government of Papua New Guinea to negotiate a20-year extension. On August 2, 2019, the National Court of Papua New Guinea ruled that the provisions of the country’s 1992 Mining Act applied to the Porgera gold mine, thus allowing it to continue operating while the application to extend its Special Mining Lease is being considered. The Company expects to reach an agreement with the government and does not expect interruptions to the operation while these discussions are ongoing.
| BARRICK YEAR-END 2019 | 69 | MANAGEMENT’S DISCUSSION AND ANALYSIS |
North Maraa, Tanzania
| Summary of Operating and Financial Data | For the three months ended | For the years ended | ||||||||||||||||||||||||||
| (unaudited) | 12/31/19 | 9/30/19 | % Change | 12/31/19 | 12/31/18 | % Change | 12/31/17 | |||||||||||||||||||||
Total tonnes mined (000s) | 3,529 | 1,780 | 98 | % | 10,388 | 10,821 | (4 | )% | 10,469 | |||||||||||||||||||
Open pit ore | 1,854 | 667 | 178 | % | 3,987 | 1,837 | 117 | % | 2,011 | |||||||||||||||||||
Open pit waste | 1,288 | 970 | 33 | % | 5,532 | 8,218 | (33 | )% | 7,765 | |||||||||||||||||||
Underground | 387 | 143 | 170 | % | 869 | 766 | 13 | % | 693 | |||||||||||||||||||
Average grade (grams/tonne) | ||||||||||||||||||||||||||||
Open pit mined | 2.12 | 1.89 | 12 | % | 2.03 | 2.00 | 2 | % | 1.73 | |||||||||||||||||||
Underground mined | 5.30 | 6.87 | (23 | )% | 6.82 | 7.79 | (12 | )% | 8.68 | |||||||||||||||||||
Processedb | 4.78 | 5.58 | (14 | )% | 4.50 | 3.96 | 14 | % | 3.85 | |||||||||||||||||||
Ore tonnes processed (000s) | 714 | 172 | 316 | % | 1,829 | 1,819 | 1 | % | 1,815 | |||||||||||||||||||
Recovery rate | 94 | % | 94 | % | 0 | % | 94 | % | 93 | % | 1 | % | 92 | % | ||||||||||||||
Mining | 94 | % | 94 | % | 0 | % | 94 | % | 93 | % | 1 | % | 92 | % | ||||||||||||||
Gold produced (000s oz) | 103 | 29 | 253 | % | 251 | 215 | 17 | % | 207 | |||||||||||||||||||
Gold sold (000s oz) | 103 | 36 | 186 | % | 248 | 212 | 17 | % | 207 | |||||||||||||||||||
Revenue ($ millions) | 153 | 55 | 178 | % | 350 | 270 | 30 | % | 261 | |||||||||||||||||||
Cost of sales ($ millions) | 105 | 33 | 216 | % | 236 | 169 | 40 | % | 141 | |||||||||||||||||||
Income ($ millions) | 52 | 20 | 163 | % | 112 | 94 | 19 | % | 112 | |||||||||||||||||||
EBITDA ($ millions)c | 87 | 31 | 184 | % | 187 | 134 | 40 | % | 148 | |||||||||||||||||||
EBITDA margind | 57 | % | 56 | % | 2 | % | 53 | % | 49 | % | 8 | % | 57 | % | ||||||||||||||
Capital expenditures ($ millions)e | 16 | 9 | 73 | % | 42 | 52 | (19 | )% | 59 | |||||||||||||||||||
Minesite sustaininge | 15 | 8 | 83 | % | 36 | 47 | (23 | )% | 52 | |||||||||||||||||||
Projecte | 1 | 1 | 0 | % | 6 | 5 | 20 | % | 7 | |||||||||||||||||||
Cost of sales ($/oz) | 1,021 | 907 | 13 | % | 953 | 795 | 20 | % | 683 | |||||||||||||||||||
Total cash costs ($/oz)c | 675 | 603 | 12 | % | 646 | 603 | 7 | % | 509 | |||||||||||||||||||
All-in sustaining costs ($/oz)c | 830 | 850 | (2 | )% | 802 | 830 | (3 | )% | 773 | |||||||||||||||||||
All-in costs ($/oz)c | 840 | 886 | (5 | )% | 824 | 855 | (4 | )% | 804 | |||||||||||||||||||
| a. | Formerly part of Acacia Mining plc. On September 17, 2019, Barrick acquired all of the shares of Acacia it did not own. The results are on a 63.9% basis until September 30, 2019 and on a 100% basis from October 1, 2019 onwards. |
| b. | Includes tailings retreatment. |
| c. | These arenon-GAAP financial performance measures with no standardized meaning under IFRS and therefore may not be comparable to similar measures presented by other issuers. For further information and a detailed reconciliation of eachnon-GAAP measure used in this section of the MD&A to the most directly comparable IFRS measure, please see pages 91 to 112 of this MD&A. |
| d. | Represents EBITDA divided by revenue. |
| e. | Presented on a cash basis as a result of adopting IFRS 16Leasesstarting in the first quarter of 2019. Capital expenditures for 2018 and 2017 are presented on an accrued basis. Please refer to page 27 of this MD&A for more details. |
On January 24, 2020, Barrick announced that the Company had ratified the creation of Twiga at a signing ceremony with the President of Tanzania, formalizing the establishment of a joint venture between Barrick and the Government of Tanzania (“GoT”) and resolution of all outstanding disputes between Barrick and the GoT. The GoT will receive a free carried shareholding of 16% in each of the former Acacia mines (Bulyanhulu, Buzwagi and North Mara), and will receive its half of the economic benefits from taxes, royalties, clearing fees and participation in all cash distributions made by the mines and Twiga, after the recoupment of capital investments. Twiga will provide management services to the mines. The GoT’s free-carried interest is expected to be made effective as of January 1, 2020.
Financial Results
Q4 2019 compared to Q3 2019
North Mara’s income for the fourth quarter of 2019 was 163% higher than the third quarter of 2019, mainly due to the impact of the acquisition of all of the shares that we did not own of Acacia on September 17, 2019. This resulted in our
attributable share of income being reported at 100% compared to 63.9% in the prior quarter. This was combined with higher sales volume as the prior quarter was impacted by a prohibition notice issued by the Tanzanian National Environment Management Council (“NEMC”) on July 16, 2019 (the “Prohibition Notice”) which resulted in the closure of the tailings storage facility (“TSF”) and shutdown of the processing plant for approximately two months. This was partially offset by higher cost of sales in the fourth quarter of 2019.
In the fourth quarter of 2019, gold production was 253% higher than the prior quarter, primarily due to the Prohibition Notice that occurred in the prior quarter, as discussed above and further below. This was further impacted by the acquisition of all of the shares that we did not own of Acacia, which resulted in an increase in our attributable production from 63.9% to 100%.
Cost of sales per ounce5 and total cash costs per ounce4in the fourth quarter of 2019 were 13% and 12% higher, respectively, than the prior quarter primarily due to higher
| BARRICK YEAR-END 2019 | 70 | MANAGEMENT’S DISCUSSION AND ANALYSIS |
sales-related costs driven by sales volumes and higher processing consumables costs, partly offset by lower general and administrative costs as the third quarter of 2019 included increased provisions for inventory obsolescence.All-in sustaining costs per ounce4 in the fourth quarter of 2019 were 2% lower than the prior quarter as a result of lower minesite sustaining capital expenditures on a per ounce sold basis, partially offset by higher total cash costs per ounce4.
Capital expenditures in the fourth quarter of 2019 were 73% higher than the third quarter of 2019, mainly due to the 36.1% increase in our attributable share of capital expenditures combined with higher minesite sustaining capital expenditures. Higher minesite sustaining capital expenditures are attributed to the deferral of capital projects due to the cash flow constraints experienced by Acacia as a result of the Prohibition Notice in the third quarter and the implementation of water management measures for the TSF.
2019 compared to 2018
North Mara’s income for 2019 was 19% higher than the prior year primarily due to the impact of the acquisition of all of the shares that we did not own of Acacia on September 17, 2019, as income was included at 100% starting from October 1, 2019. This was combined with higher realized gold prices4, partially offset by lower sales volumes and higher cost of sales per ounce5.
Income and EBITDA4,a
(unaudited)
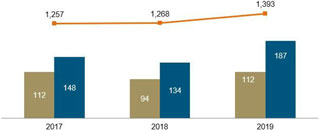
aThe results are on a 63.9% basis from January 1, 2017 to September 30, 2019 and on a 100% basis from October 1, 2019 onwards.
In 2019, gold production was 17% higher than the prior year primarily due to the 36.1% increase in our shareholding and attributable production. This was partly offset by lower production due to the Prohibition Notice which resulted in the closure of the North Mara TSF and shutdown of the processing plant for most of the third quarter of 2019.
Productiona
(000s ounces)
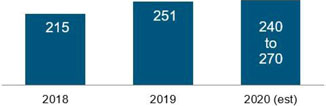
(unaudited)
aThe results are on a 63.9% basis from January 1, 2018 to September 30, 2019 and on a 100% basis from October 1, 2019 onwards. As the GoT’s 16% free-carried interest is expected to be made effective as of January 1, 2020, our 2020 outlook represents our 84% share.
Cost of sales per ounce5 and total cash costs per ounce4 in 2019 were 20% and 7% higher, respectively, than the prior year mainly due to higher stripping costs expensed in the current period and an increase in provisions for supplies obsolescence, partly offset by thebuild-up of ore inventory stockpiles.All-in sustaining costs per ounce4 were 3% lower than the prior year due to a decrease in minesite sustaining capital expenditures driven by lower capitalized stripping costs on the back of lower strip ratios, partially offset by higher total cash costs per ounce4.
Cost of Sales5, Total Cash Costs4and AISC4
($ per ounce) (unaudited)
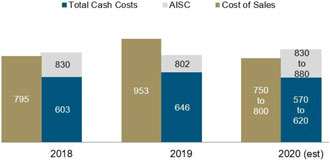
In 2019, capital expenditures decreased by 19% compared to the prior year mainly due to lower minesite sustaining capital expenditures. Lower minesite sustaining capital expenditures were attributed to reduced capitalized stripping costs driven by a lower strip ratio as mining entered the main ore zone of the Nyabirama open pit.
2019 compared to Outlook
Overall guidance for 2019 was previously only provided in relation to Acacia and not at the mine site level.
North Mara Environmental Issues
During 2019, the GoT issued two environmental protection orders and directions to Acacia’s North Mara mine in relation to alleged breaches of environmental regulations relating to seepage from and the discharge of a hazardous substance from the North Mara TSF. In March 2019, the GoT directed the North Mara mine to resolve an incident that resulted in the spillage of water into the local environment. On July 16, 2019, the NEMC issued the Prohibition Notice to North Mara Gold Mine Limited (the Tanzanian operating company of the North Mara mine), which ordered the North Mara mine to suspend operations at its TSF on July 20, 2019. NEMC cited the North Mara mine’s failure to contain and prevent seepage from the TSF as grounds for its issuance of the Prohibition Notice.
On September 17, 2019, following the submission of a detailed action plan to remediate issues related to the TSF and the implementation of remedial measures to contain the seepage from the TSF, the Prohibition Notice was lifted and North Mara was permitted to resume operations at the TSF.
| BARRICK YEAR-END 2019 | 71 | MANAGEMENT’S DISCUSSION AND ANALYSIS |
Other Mines - Gold
| Summary of Operating and Financial Data | For the three months ended | |||||||||||||||||||||||||||||||||||||||
| (unaudited) | 12/31/19 | 9/30/19 | ||||||||||||||||||||||||||||||||||||||
| Gold produced (000s oz) | Cost of ($/oz) | Total ($/oz)a | All-in ($/oz)a | Capital Expend- ituresb | Gold produced (000s oz) | Cost of sales ($/oz) | Total cash ($/oz)a | All-in ($/oz)a | Capital Expend- ituresb | |||||||||||||||||||||||||||||||
Kalgoorlie (50%)c | 36 | 1,127 | 940 | 1,172 | 6 | 58 | 1,037 | 856 | 1,170 | 15 | ||||||||||||||||||||||||||||||
Tongon (89.7%) | 61 | 1,476 | 803 | 867 | 3 | 62 | 1,396 | 793 | 869 | 4 | ||||||||||||||||||||||||||||||
Hemlo | 54 | 1,632 | 1,091 | 1,380 | 15 | 49 | 1,083 | 953 | 1,280 | 15 | ||||||||||||||||||||||||||||||
Buzwagid | 28 | 1,235 | 1,144 | 1,169 | 0 | 18 | 1,292 | 1,202 | 1,220 | 0 | ||||||||||||||||||||||||||||||
Bulyanhulud | 9 | 1,293 | 752 | 909 | 1 | 6 | 1,288 | 729 | 769 | 1 | ||||||||||||||||||||||||||||||
Lagunas Nortee | 33 | 1,661 | 1,327 | 1,422 | 0 | |||||||||||||||||||||||||||||||||||
| a. | These arenon-GAAP financial performance measures with no standardized meaning under IFRS and therefore may not be comparable to similar measures presented by other issuers. For further information and a detailed reconciliation of eachnon-GAAP measure used in this section of the MD&A to the most directly comparable IFRS measure, please see pages 91 to 112 of this MD&A. |
| b. | Includes both minesite sustaining and project capital expenditures. |
| c. | On November 28, 2019, we completed the sale of our 50% interest in Kalgoorlie in Western Australia to Saracen Mineral Holdings Limited for total cash consideration of $750 million. The transaction resulted in a gain of $408 million for the year ended December 31, 2019. The operating results reported for Kalgoorlie reflect the Company’s attributable share of Kalgoorlie’s results until the date of disposal. |
| d. | Formerly part of Acacia Mining plc. On September 17, 2019, Barrick acquired all of the shares of Acacia it did not own. |
| e. | As previously mentioned, as Lagunas Norte has transitioned to care and maintenance at the end of the third quarter of 2019, we have ceased to include the immaterial residual ounces in our production ornon-GAAP cost metrics for this operation. |
Kalgoorlie (50% basis), Australia
Gold production in the fourth quarter of 2019 for Kalgoorlie was 38% lower compared to the prior quarter, primarily due to the impact of the sale of our 50% interest in the Kalgoorlie mine on November 28, 2019. This was partially offset by higher recovery and throughput. Cost of sales per ounce5 in the fourth quarter of 2019 was 9% higher than the prior quarter mainly due to the impact of lower sales volume. In the fourth quarter of 2019,all-in sustaining costs per ounce4 was in line with the prior quarter as lower minesite sustaining capital expenditures was offset by higher total cash costs per ounce4.
Compared to our outlook, gold production in 2019 of 206 thousand ounces was below the guidance range of 260 to 280 thousand ounces, mainly due to the sale of our 50% interest in November 2019 and the exclusion zones put in place to safely manage the east and west walls of the pit as advised by Newmont (the operator during that time). Cost of sales per ounce5 of $1,062 was higher than the guidance range of $920 to $970 per ounce. Total cash costs per ounce4 andall-in sustaining costs per ounce4 of $873 and $1,183, respectively, were above the guidance ranges of $740 to $790 per ounce and $1,010 to $1,050 per ounce, respectively.
Tongon (89.7% basis), Côte d’Ivoire
Gold production for Tongon in the fourth quarter of 2019 was 2% lower than the prior quarter. Cost of sales per ounce5 in the fourth quarter of 2019 was 6% higher than the prior quarter as a result higher depreciation expense, partially offset by lower direct mining costs.All-in sustaining costs per ounce4in the fourth quarter of 2019 was in line with the prior quarter as both minesite sustaining capital expenditures on a per ounce basis and total cash costs per ounce4were largely in line with prior quarter.
Gold production in 2019 of 245 thousand ounces was slightly below the guidance range of 250 to 270 thousand ounces. Cost of sales per ounce5 of $1,469 was higher than the guidance range of $1,300 to $1,350 per ounce. Total cash costs per ounce4 andall-in sustaining costs per ounce4 of $787 and $844, respectively, were both slightly above the
guidance range of $710 to $760 per ounce and $780 to $820 per ounce, respectively.
Hemlo, Ontario, Canada
Hemlo’s gold production in the fourth quarter of 2019 was 10% higher than the prior quarter primarily due to higher mill throughput, partially offset by lower grade. Cost of sales per ounce5 in the fourth quarter of 2019 was 51% higher than the prior quarter primarily due to higher direct mining costs and higher royalties driven by an increase in realized gold prices4. In the fourth quarter of 2019,all-in sustaining costs per ounce4 increased by 8% compared to the prior quarter due to higher total cash costs4with sustaining capital expenditures in line with the prior quarter.
Gold production in 2019 of 213 thousand ounces was within the guidance range of 200 to 220 thousand ounces. Cost of sales per ounce5 of $1,137 and total cash costs per ounce4 of $904 were both above the guidance range of $890 to $940 per ounce and $765 to $815 per ounce, respectively.All-in sustaining costs per ounce4 of $1,140 was within the guidance range of $1,100 to $1,200 per ounce.
Buzwagi, Tanzania
Gold production for Buzwagi in the fourth quarter of 2019 was 56% higher compared to the third quarter of 2019, primarily due to the acquisition of all of the shares that we did not own in Acacia on September 17, 2019, which resulted in an increase in our attributable production to 100% (previously 63.9%). Cost of sales per ounce5 in the fourth quarter of 2019 was 4% lower than the prior quarter, mainly due to lower maintenance and contractor services costs driven by the timing of process plant maintenance.All-in sustaining costs per ounce4 decreased by 4% compared to the prior quarter, primarily due to lower total cash costs per ounce4.
Overall guidance for 2019 was previously only provided in relation to Acacia and not at the minesite level.
| BARRICK YEAR-END 2019 | 72 | MANAGEMENT’S DISCUSSION AND ANALYSIS |
Bulyanhulu, Tanzania
Gold production for Bulyanhulu in the fourth quarter of 2019 was 50% higher compared to the third quarter of 2019, primarily due to the acquisition of all of the shares that we did not own in Acacia on September 17, 2019, which resulted in an increase in our attributable production to 100% (previously 63.9%). Cost of sales per ounce5 in the fourth quarter of 2019 was largely in line with the prior quarter.All-in sustaining costs per ounce4 increased by 18% compared to the prior quarter, primarily due to the deferral of minesite sustaining capital
expenditures to the fourth quarter following cash flow constraints experienced by Acacia in the prior quarter as a result of the Prohibition Notice at North Mara.
Overall guidance for 2019 was previously only provided in relation to Acacia and not at the minesite level.
Other Mines - Copper
| Summary of Operating and Financial Data | For the three months ended | |||||||||||||||||||||||||||||||||||||||
| (unaudited) | 12/31/19 | 9/30/19 | ||||||||||||||||||||||||||||||||||||||
| Copper production (millions of pounds) | Cost of ($/lb) | C1 cash ($/lb)a | All-in ($/lb)a | Capital Expend- ituresb | Copper production (millions of pounds) | Cost of sales ($/lb) | C1 cash costs ($/lb)a | All-in sustaining costs ($/lb)a | Capital Expend- ituresb | |||||||||||||||||||||||||||||||
Lumwana | 63 | 2.22 | 2.10 | 3.41 | 37 | 65 | 2.04 | 1.83 | 3.66 | 37 | ||||||||||||||||||||||||||||||
Zaldívar (50%) | 36 | 2.59 | 1.95 | 2.56 | 21 | 32 | 2.18 | 1.55 | 1.91 | 11 | ||||||||||||||||||||||||||||||
Jabal Sayid (50%) | 18 | 1.47 | 1.29 | 1.78 | 7 | 15 | 1.63 | 1.42 | 1.65 | 4 | ||||||||||||||||||||||||||||||
| a. | These arenon-GAAP financial performance measures with no standardized meaning under IFRS and therefore may not be comparable to similar measures presented by other issuers. For further information and a detailed reconciliation of eachnon-GAAP measure used in this section of the MD&A to the most directly comparable IFRS measure, please see pages 91 to 112 of this MD&A. |
| b. | Includes both minesite sustaining and project capital expenditures. |
Lumwana, Zambia
Copper production for Lumwana in the fourth quarter of 2019 was 3% lower than the prior quarter due to a slight decrease in throughput and grade, in line with plan. As previously announced, sales continued to be affected by a major refurbishment at one of the third-party smelters that processes a portion of the mine’s concentrate. The refurbishment was completed in January 2020. We are evaluating our opportunities with this third-party smelter to steadily sell the concentrate stockpiled during the refurbishment period through the course of the year. Cost of sales per pound5 in the fourth quarter of 2019 was 9% higher than the prior quarter primarily due to lower capitalized stripping. In the fourth quarter of 2019,all-in sustaining costs per pound4 decreased by 7% compared to the prior quarter, primarily due to lower minesite sustaining capital expenditures on a per ounce basis, partially offset by higher C1 cash costs per pound4.
Compared to our outlook, copper production in 2019 of 238 million pounds was near the high end of the guidance range of 210 to 240 million pounds. Cost of sales per pound5 and C1 cash costs per pound4 of $2.13 and $1.79, respectively, were both below the guidance range of $2.25 to $2.50 per pound and $1.80 to $2.10 per pound, respectively.All-in sustaining costs4 of $3.04 per pound was within the guidance range of $2.75 to $3.15 per pound.
Zaldívar (50% basis), Chile
Copper production for Zaldívar in the fourth quarter of 2019 was 13% higher than the prior quarter mainly due to higher throughput and grades as well as operational initiatives implemented to reduce leach pad lift heights and resting times between irrigation cycles to accelerate recoveries. Cost of sales per pound5 in the fourth quarter of 2019 was 19% higher than the prior quarter primarily due to costs associated with the settlement of labor contract negotiations and the social unrest offset partially by a weaker local currency.All-in
sustaining costs per pound4 increased by 34% compared to the prior quarter primarily due to the impact of higher capitalized stripping and sustaining capital expenditures corresponding to budgeted purchases of spare parts for mine equipment and plant components.
Copper production in 2019 of 128 million pounds was close to the high end of the guidance range of 120 to 130 million pounds. All cost metrics were within the guidance ranges. Cost of sales per pound5 was $2.46 compared to $2.40 to $2.70 per pound. C1 cash costs per pound4 was $1.77, compared to $1.65 to $1.85 per pound, andall-in sustaining costs4 was $2.15, compared to $2.00 to $2.20 per pound.
Jabal Sayid (50% basis), Saudi Arabia
Jabal Sayid’s copper production in the fourth quarter of 2019 was 20% higher compared to the prior quarter, primarily due to an increase in underground mined tonnes after an improvement in availability from new equipment as well as better grades. Cost of sales per pound5 in the fourth quarter of 2019 was 10% lower than the prior quarter as a result of processing material with improved grade, combined with lower processing as well as general and administrative expenses.All-in sustaining costs per pound4 in the fourth quarter of 2019 increased by 8% when compared to the prior quarter, as lower total cash costs4 was outweighed by increased minesite sustaining capital expenditures primarily relating to the concentrate filter expansion project.
Copper production in 2019 of 66 million pounds exceeded the guidance range of 45 to 60 million pounds. All cost metrics were below the guidance range. Cost of sales per pound5 was $1.53 compared to $2.00 to $2.30 per pound. C1 cash costs per pound4 was $1.26, compared to $1.60 to $1.90 per pound, andall-in sustaining costs4 was $1.51, compared to $1.60 to $1.90 per pound.
| BARRICK YEAR-END 2019 | 73 | MANAGEMENT’S DISCUSSION AND ANALYSIS |
Growth Project Updates
Goldrush Complex, Nevada, USA
At the Goldrush Complex, updated resource models were completed for Goldrush and Fourmile and will be used as the basis of the final feasibility study. No changes to Goldrush mineral reserves have been declared in 2019; these will be updated in 2020 upon completion of mine design changes within the feasibility study. The mineral resources have been updated based on the new models with Goldrush now reported as part of Cortez underground resources as it is our intention for the Goldrush mine to be run under Cortez management once in production. We have standardized our mineral resource reporting to be inclusive of mineral reserves and all underground mineral resources are now reported within $1,500 per ounce stope optimized shells. We believe this better reflects the global underground potential of the deposits at the prescribed resource gold price and includes internal dilution within these stope shapes and, as such, there are higher tonnes at lower grade within the resource declarations. Attributable underground mineral resources at Goldrush (61.5%) now stands at 26.3 million tonnes at 7.8 g/t for 6.6 million ounces in the indicated category and 4.8 million tonnes at 7.60 g/t for 1.2 million ounces in the inferred category. Fourmile (100%) inferred underground mineral resources increased to 5.4 million tonnes at 10.9 g/t for 1.9 million ounces. Fourmile resources continue to be reported separately as it has not yet been contributed to Nevada Gold Mines.
A geotechnical mining rock mass model was also completed in the fourth quarter of 2019 and this will be used together with the updated geological and resource models to update stope and development designs for the feasibility study. Work on a localized dewatering model commenced in November 2019 and is progressing well with recommendations expected in the first quarter of 2020.
Construction of the twin exploration declines at Goldrush continues to progress ahead of schedule and achieved 1,296 meters of total development, an improvement of 328 meters compared to the 986 meters that was budgeted for the fourth quarter of 2019. Overall progress status stands at 61% (from 46% as at the end of the third quarter of 2019) and the forecast decline completion date is now November 2020 (previously March 2021). As at December 31, 2019, we have spent $128 million (including $19 million in the fourth quarter of 2019) on the Goldrush project inclusive of the exploration declines (100% basis). The current capital estimate for the Goldrush project is approximately $1.0 billion (100% basis), subject to the completion of the updated Goldrush feasibility study.
Permitting activities are advancingon-track following our submission of a Plan of Operations to the Bureau of Land Management in September 2019. We continue to expect updated mine and feed schedules by the third quarter of 2020 and the final Goldrush feasibility study to be completed in the first quarter of 2021.
Turquoise Ridge Third Shaft, Nevada, USA12
Construction of the third shaft at Turquoise Ridge, which has a hoisting capacity of 5,500 tonnes per day, continues to advance according to schedule and within budget, with efforts in 2019 focused on surface civil works and shaft sinking. Major progress in the fourth quarter of 2019 focused around sinking-plant commissioning and the commencement of sinking
activities. Shaft sinking commenced in early November and the shaft liner has advanced to a depth of 149 meters below collar. To date, we have spent $119 million (including $9 million in the fourth quarter of 2019) out of an estimated capital cost of approximately$300-$330 million (100% basis).
Pueblo Viejo Plant Expansion Study, Dominican Republic13
Studies remain supportive of a plant expansion at the Pueblo Viejo mine that could significantly increase throughput, allowing the mine to maintain average annual gold production of approximately 800,000 ounces after 2022 (100% basis).
Study work completed during the quarter resulted in a flowsheet adopting the upgrade of the existing autoclaves to “flash” (vaporize) additional water as the means of dissipating the extra heat from the higher sulfide feed to the pressure oxidation (POX) circuit. This involves additional high-pressure slurry pumps and recycle flash capability with thickening provided through an upgrade of existing facilities.
This oxidation solution provides for lower capital and operating costs compared to previously studied options. A new flotation circuit to enable higher sulfide feed for the oxidation circuit remains as previously proposed. Additional neutralization, flotation leach, limestone grinding and water treatment are also included in the new flowsheet. Fourth quarter debottlenecking studies identified a requirement for increased oxygen resulting in a revision of the oxygen plant design to 3,000 tonnes per day.
Block flow diagrams, process design criteria, process descriptions, process flow diagrams, and process and instrumentation drawings have been completed as have quantitative risk assessments during the fourth quarter of 2019. A preliminary operating and capital expenditure estimate, execution plan and schedule have been developed.
Work is also well advanced on the concept study for the management of additional tailings capacity to support the expansion of the process plant. In line with Pueblo Viejo’s environmental responsibility, baseline studies continue for the Environmental Impact Study for the process plant expansion.
Environmental Impact Studies are ongoing for additional tailings and waste rock management. Based on the advanced studies completed to date, we continue to progress our engineering and evaluation work towards a feasibility study for the process plant expansion and the proposed tailings storage facility.
Zaldívar Chloride Leach Project, Chile
Zaldívar is jointly owned by Antofagasta and Barrick and is operated by Antofagasta.
In December 2019, the Board of Compañía Minera Zaldívar approved the Chloride Leach Project. The capital cost of the project of $189 million (100% basis) consists of the cost of execution and commissioning as well as a joint venture board-controlled contingency provision. The project contemplates the construction of a chloride dosing system, an upgrade of the solvent extraction plant and the construction of additional washing ponds.
| BARRICK YEAR-END 2019 | 74 | MANAGEMENT’S DISCUSSION AND ANALYSIS |
Work will begin early in 2020, with 2022 expected to be the first full year of operation. Upon completion, the project is expected to increase copper recoveries by more than 10 percentage points through the addition of chlorides to the leach solution and with further potential upside in recoveries possible depending on the type of ore being processed. This process is based on a proprietary technology called CuproChlor® that was developed by Antofagasta at its Michilla operation, which had similar ore types to those that are processed at Zaldívar. Once completed and in full operation, the project is expected to increase production at Zaldívar by approximately10-15 kilotonnes per annum of copper at lower operating costs over the remaining life of the mine.
Veladero Power Transmission Project, Chile-Argentina
In 2019, we commenced construction of an extension to the existing Pascua-Lama power transmission line to connect to the Veladero mine. When completed in the second half of 2020, the power transmission line will allow Veladero to convert to grid power exported from Chile and cease operating the current high-cost diesel generation power plant located at site. A power purchase price agreement was also executed during the fourth quarter of 2019 to supply power from renewable energy that will significantly reduce Veladero’s carbon footprint.
Exploration
Nevada Gold Mines, Nevada, USA14
Nevada Gold Mines land holdings encompass more than two million acres across some of the best endowed gold trends in North America. Consolidation of these lands and associated data is being leveraged to build camp-scale, unified geologic models. In 2019, significant modeling advances were made with camp scale models created for the northern part of the Carlin Trend and Gold Quarry area. A preliminary geologic model of the consolidated Turquoise Ridge district was also completed in the fourth quarter of 2019.
During the fourth quarter of 2019, three diamond drill holes totaling 3,061 meters were completed across the Carlin Trend. A hole was completed within Little Boulder Basin at the end of the quarter. The hole intersected significant alteration and is the first of a series of framework holes to support target delineation in this area of extensive disturbance and post-mineral cover between Goldstrike and Leeville. One additional concept was tested to the south at Richmond Mountain during the quarter. The hole confirmed the geological interpretation. However, the alteration encountered was not encouraging.
At the Rainsub-district, noteworthy results from drilling completed in the second half of the year include two significant intercepts highlighting open-ended mineralization at two separate areas on this relatively underexplored portion of the southern Carlin Trend. The first hole(RAN-2355) intersected 6.1 meters at 8.52 g/t hosted in 130 meters of thick breccia overprinted by silicification and sulfidation altering a carbonate rock not traditionally considered a favorable host. The result validates potential for structurally controlled high-grade mineralization below the stratigraphic level of past exploration and production focus. The second hole evaluated potential along the northwest extension of the Rain fault corridor. The hole(RAN-2349) intersected 3.5 meters at 7.50 g/t about 600 meters south of the Rain fault and is open to the south and west. The potential of the Rainsub-district highlighted by these holes is a promising start to reinvigorating exploration in this target-rich area.
Heading into 2020, the Carlin Trend will become the most active exploration area in Barrick’s portfolio. Leveraging skills and knowledge from the recent success at Fourmile to make high-impact discoveries is the priority. To ensure effective target selection and testing, the program will continue to focus on building robust geologic understanding by relogging, mapping, sampling and drilling with data integrated into scale appropriate models.
At Turquoise Ridge, work towards unifying the geology model across this newly consolidated district is in progress. Merging of all available data is well advanced. Definition of the stratigraphic framework has prioritized marker unit identification with some success. A major relogging program will be advanced during the first quarter of 2020. The work will establish a more robust stratigraphic framework ahead of shifting focus to interpreting the structural framework necessary to delineating targets. Several target concepts have already emerged. These include an area of sparsely drilled favorable limestone host rock at the crest of a district-scale antiform cutting across the north end of the Twin Creeks Complex. The concept is supported by modeled geology and downhole geochemistry showing a vertically extensive auriferous and metal-rich plume. There are also several untested intersections ofore-controlling faults. These emerging targets will be prioritized together with additional concepts anticipated as the modeling and exploration effort matures.
Generative activities in Nevada have been reinvigorated with the consolidation of extensive data covering the Nevada Gold Mines area of interest. Regional scale modeling to link the major gold trends will begin early 2020. The effort will focus on delineating the Roberts Mountains thrust and underlying favorable carbonate rocks where cover conceals this priority targeting criteria across a vast area of interest.
Fourmile, Nevada, USA15
The discovery announced in the third quarter of 2019 was successfully followed up with a hole(FM19-14D) intersecting multiple discontinuous zones of high-grade mineralization over a vertical extent of 250 meters including 3.1 meters at 6.24 g/t, 7.5 meters at 9.22 g/t, 3.1 meters at 47.85 g/t, 3.7 meters at 86.19 g/t, 4.8 meters at 42.48 g/t, and 2.7 meters at 180.36 g/t. The discovery is located about a kilometer north of Fourmile in an area of sparse, 200 to 400 meter spaced, framework drill holes.Follow-up drilling will resume in the second quarter of 2020 following the winter break. Surface mapping and sampling were ongoing during the fourth quarter of 2019. Fieldwork continues to add value, even with target depths often exceeding a kilometer, by highlighting structural controls and geochemical leakage through barren bedrock cover as well as areas requiring framework drilling. Three widely spaced diamond drill holes totaling 4,292 meters were completed during the fourth quarter of 2019.
The focus in 2019 on aggressive advanced target testing resulted in more than doubling the inferred resource at
| BARRICK YEAR-END 2019 | 75 | MANAGEMENT’S DISCUSSION AND ANALYSIS |
Fourmile. To achieve this growth, a total of 43 new diamond drill holes totaling 40,712 meters were incorporated into geologic and resource models. The most significant addition was found at the intersection of the steeply west-dipping Anna fault identified from this season’s advanced targeting from the moderately west-dipping Sadler reverse fault and associated fold that has been a key targeting criterion for several seasons. Near this structural intersection, brecciated, metasomatized carbonate rock hosts high-grade mineralization. The zone remains opendown-dip to the west as well as along strike.Follow-up drilling will resume in the first quarter of 2020. These new holes will also provide excellent platforms to continue building confidence in the resource by directionally drilling across west-dipping mineralization at a favorable orientation.
With rapid resource growth and the potential significant value associated with high-grade mineralization intersected to date, work supporting geotechnical,geo-metallurgical, hydrological and other characterizations of Fourmile have been initiated. Exploration and technical studies are closely coordinated to leverage as much value as possible from every drill hole. A Fourmile study team will be organized in the first quarter of 2020 to evaluate andde-risk the project. The team will ultimately deliver a feasibility study, key to strategic decisions associated with the project including its possible inclusion into Nevada Gold Mines.
Hemlo, Ontario, Canada
An airborne magnetic survey and surface trenching program was completed during the fourth quarter of 2019. Integrating results from both programs shows a positive correlation between gold and magnetic susceptibility west of the mine.Follow-up will be an important aspect of the 2020 exploration program. Drilling the down plunge extension of the C Zone to assess growth potential was ongoing through the quarter and will continue into 2020. TheC-Zone represents most of the current resources and underground mill feed at Hemlo.
Pueblo Viejo, Dominican Republic
Drill testing of targets generated from the first integrated geological model and a renewed understanding on the controls to mineralization was the focus for the quarter. To the southeast of Mejita, a structural control to high grades was established and drill-tested; however, the favorable horizon has been eroded. To the east and northeast of Mejita, historic gold in soil anomalies grading +100ppb Au are in part coincident with the projection of a northeast ore controlling structure from the Moore Pit in an area coincident with newly mapped phreatomagmatic breccias. Drill testing intersected favorable alteration and results are pending. In the first quarter of 2020, we will be applying geophysical techniques to map potential concentrations of sulfides associated with mineralization at Arroyo Hondo and Arroyo del Rey; such surveys were historically successful at mapping sulfide association with the Monte Negro and Moore ore bodies.
Alturas-Del Carmen, Argentina
At Del Carmen, an updated mineral inventory was calculated for Rojo Grande which will contribute to further development studies for the Alturas project in 2020. Mineralization at Rojo Grande is at or near surface and could provide a source of early ore for potential development scenarios at Alturas. Finally, drill testing of four priority litho-structural targets in theAlturas-Del Carmen camp, incorporating newly defined high-
grade controls to mineralization, has commenced in January 2020.
Veladero, Argentina
At Veladero, a large 3.5 x 2.5 km alteration system has been delineated at the Coiron prospect, located to the southwest of the open pits. Mapping and geophysics have identified many characteristics of our known high sulfidation epithermal deposits and suggests a dominantly preserved hydrothermal system. Drill testing has commenced in January 2020. Multiple other brownfields targets are advancing to delineation and drill testing.
Lagunas Norte, Peru
At Lagunas Norte, we completed structural mapping and deep penetrating geophysics which is delineating both oxide and sulfide targets. Encouragingly, the southern extension of the Lagunas Norte Fault has been redefined and opens up potential for further mineralization to the south of the deposit. A drill program has commenced in January 2020 to test this zone.
Drilling was also initiated at the end of the fourth quarter of 2019 on two targets within the district: La Capilla and Antonio Chuco. At La Capilla, outcropping oxide mineralization defined by channel sampling and drilling extends over a 400 m strike. A potential diatreme feeder has been defined, which may extend mineralization over a much larger area. Drilling will test the diatreme concept and delineate the footprint potential of oxide mineralization. This project is less than 10 km east of Lagunas Norte and could provide near-term oxide material. At Antonio Chuco, 20 km south of Lagunas Norte, surface sampling has identified gold mineralization in north-south oriented silicified structures which may also control the emplacement of breccia bodies.
Pascua-Lama, Chile and Argentina
Barrick’s intention is to update our geological understanding of the orebody as part of our strategy to bring Pascua-Lama to account. This process is expected to take a number of years to complete.
The focus in 2020 at Pascua-Lama will be on addressing the gaps identified in the geological andgeo-metallurgical understanding of the orebody, building upon the improved 3D geology model completed in 2019. To support this, drilling over the next two summer seasons is being contemplated, which may drive further desktop studies. Additionally, a geological andgeo-metallurgical drill program at the Penelope deposit of Lama has been budgeted for 2020. Column testing is also planned to assess the amenability of Penelope ore for heap leaching at Veladero.
Porgera, Papua New Guinea
Focus during the quarter was on designing a drill program targeting the potential mineralization expansion of the open pit, into the Wangima zone. Historical wide-spaced drill results, combined with preliminary geophysical survey responses and surface sampling, indicated the possibility of a continuation of stacked structurally controlled lenses extending along strike within an interpreted intrusive corridor. Barrick plans to execute an exploratory/infill drill program from both surface and underground platforms during 2020 and 2021. The program is geologically designed as multi-phase and will be calibrated as results become available, and the geology is confirmed. Preliminary results support the
| BARRICK YEAR-END 2019 | 76 | MANAGEMENT’S DISCUSSION AND ANALYSIS |
extension of both the intrusive corridor and repetition of stacked structures.
Bambadji, Senegal16
At Bambadji,follow-up drilling started testing saprolite anomalies defined through auger drilling under suppressive regolith along the multi-kilometer Gefa-Maliki corridor. Preliminary results confirm bedrock mineralization over the first target tested in the south of the corridor where drill intercepts from the first two RC lines returned 7.0 meters at 16.72 g/t, 30.0 meters at 1.06 g/t and 13.0 meters at 1.31 g/t. Mineralization is hosted within brecciated albitite and fine-medium grained sediments associated with silica, hematite +/- tourmaline and disseminated or patchy pyrite. Results are pending for an extra six lines testing three kilometers of strike length with geological observations suggesting a continuous system past the Gefa Main target and extending a further five kilometers north across the Maliki target, where drilling is currently confirming similar geological findings. Drilling at the Madina target located on the Gounkoto Domain Boundary extension confirmed weak mineralization along northeastern structures propagating within a competent albitite body, but which do not have the potential for economic mineralization. Auger drilling and IP surveys are underway in the northern half of the permit to identify new opportunities to be tested in the second quarter of 2020.
Loulo-Gounkoto, Mali17
At Yalea, step out drilling confirmed the extension of the Transfer Zone over an additional 320 meters towards the South withfollow-up drilling planned in the first quarter of 2020 to extend this further. At Loulo 3, resource drilling was completed for the underground opportunity while exploration progressed to the north along the gap zone with Loulo 2, where initial observations show potential for a new open pit. New greenfield targets were generated along the Yalea structure and at the Yalea Ridge, withfollow-up planned during the first quarter of 2020. At Gounkoto, exploration in the south of the deposit below the current pit intersected additional high-grade shoots.Follow-up work is planned in the first quarter of 2020 to define if they have the potential to be mined from underground. Exploration on the Faraba Trend has focused on a newly recognized structure which is thought to control mineralization over four kilometers across the Faraba complex. Elsewhere in Mali, generative work is in progress in the Kenieba-Kedougou Inlier and in Mali South with ground being reviewed.
Tongon, Côte d’Ivoire
At Nielle, drilling focused on testing gaps along the Badenou trend with limited success in identifying potential for additional satellite resources. Deeper holes are being drilled at the Mercator target to test thedown-dip and plunge potential of higher grade shoots beneath the current pit shells.Sub-surface testing of priority targets in the license area is in progress withfollow-up drilling planned in the first quarter of 2020 on the best targets. Following the completion of resource conversion drilling at Djinni, optimization work on the updated model returned positive results with the deposit potentially extending the Tongon life of mine by almost a year at the current production rate. A feasibility study is planned at Djinni in 2020 to bring the deposit into the mining schedule.
Regional Exploration, Côte d’Ivoire
Drilling has been completed across seven priority targets on the Sissedougou and Mankono permits. Results received to
date confirmlow- to medium-grade mineralization related to quartz veining hosted within or at the contact with intrusives. Auger drilling is planned to follow potential extensions to some historic targets beneath suppressive regolith in the north of Sissedougou, while soil sampling is covering a major structure in the northeast of the permit. At Boundiali, shallow drilling was completed on the first targets of the Syama corridor, while two more targets remain to be tested before drawing definitive conclusions on the corridor. In southeastern Côte d’Ivoire, stream sampling across the Ketesso area of interest is expected to be completed early in 2020 allowing for the definition of anomalous basins forfollow-up.
Kibali, Democratic Republic of Congo18
At Kibali, KCD was the center of activities with further testing of the 12000 lode, a review of the 11000 lode for potential up anddown-dip extensions and the start of a deep hole testing the KCD down-plunge extension. At Pakaka and Ikamva, model updates and optimizations are being conducted to assess the potential for underground opportunities following positive drill results received in the third quarter of 2019. Oere was also an area of focus for ounce delivery along the KZ North structure with a third phase of drilling currently in progress to test the potential at depth and along strike. Results to date indicate the potential of a small satellite resource at Oere.
North Mara and Bulyanhulu, Tanzania
The main focus during the quarter was the delivery of an updated geologic model for Gokona underground at North Mara. The new model shows mineralization controlled by rheologic contrasts in the broadly folded host stratigraphy. Mineralization typically occurs along volcanic andesite, intermediate dyke and meta-sediment contacts. Significant upside exists in areas of the system where previous drilling issub-parallel to these folded contacts as well as along strike in both directions and in the footwall of the deposit. Going forward, takeaways from the new model will be applied to exploration along the highly prospective +20 km long Gokona mineralized trend. At Bulyanhulu, an updated geologic interpretation confirmed the exceptional geologic continuity of this system, as well as a near-surface target that has potential to host plunging shoots of higher grade mineralization.
Jabal Sayid, Kingdom of Saudi Arabia
At Jabal Sayid, target generation work continued through integration and interpretation of historic and new data from the remodeling of lodes 2 and 4. Drill testing of priority targets has started with the first hole investigating the extension of lode 4. To date, this hole has confirmed the continuity of the lithologic and alteration package host to the mineralization. Other brownfield and greenfield targets are being advanced to drill stage with priority targets testing planned for the second quarter of 2020.
| BARRICK YEAR-END 2019 | 77 | MANAGEMENT’S DISCUSSION AND ANALYSIS |
REVIEW OF FINANCIAL RESULTS
Revenue
| ($ millions, except per ounce/pound data in dollars) | For the three months ended | For the years ended | ||||||||||||||||||
| (unaudited) | 12/31/19 | 9/30/19 | 12/31/19 | 12/31/18 | 12/31/17 | |||||||||||||||
Gold 000s oz solda | 1,413 | 1,318 | 5,467 | 4,544 | 5,302 | |||||||||||||||
000s oz produceda | 1,439 | 1,306 | 5,465 | 4,527 | 5,323 | |||||||||||||||
Market price ($/oz) | 1,481 | 1,472 | 1,393 | 1,268 | 1,257 | |||||||||||||||
Realized price ($/oz)b | 1,483 | 1,476 | 1,396 | 1,270 | 1,258 | |||||||||||||||
Revenue | 2,758 | 2,585 | 9,186 | 6,600 | 7,631 | |||||||||||||||
Copper millions lbs solda | 91 | 65 | 355 | 382 | 405 | |||||||||||||||
millions lbs produceda | 117 | 112 | 432 | 383 | 413 | |||||||||||||||
Market price ($/lb) | 2.67 | 2.63 | 2.72 | 2.96 | 2.80 | |||||||||||||||
Realized price ($/lb)b | 2.76 | 2.55 | 2.77 | 2.88 | 2.95 | |||||||||||||||
Revenue | 82 | 45 | 393 | 512 | 608 | |||||||||||||||
Other sales | 43 | 48 | 138 | 131 | 135 | |||||||||||||||
Total revenue | 2,883 | 2,678 | 9,717 | 7,243 | 8,374 | |||||||||||||||
| a. | Includes our equity share of gold ounces from Tanzania until September 30, 2019 (notwithstanding the completion of the Acacia transaction on September 17, 2019, we consolidated our interest in Acacia and recorded anon-controlling interest of 36.1% in the income statement for the entirety of the third quarter of 2019 as a matter of convenience) and Pueblo Viejo and copper pounds from Zaldívar and Jabal Sayid. Also includes our equity share of gold ounces from Loulo-Gounkoto, Tongon, Kibali and Morila commencing January 1, 2019, the effective date of the Merger. Starting July 1, 2019, it also includes our 61.5% share of Nevada Gold Mines. |
| b. | Realized price is anon-GAAP financial performance measure with no standardized meaning under IFRS and therefore may not be comparable to similar measures of performance presented by other issuers. For further information and a detailed reconciliation of eachnon-GAAP measure used in this section of the MD&A to the most directly comparable IFRS measure, please see pages 91 to 112 of this MD&A. |
2019 gold production of 5.47 million ounces was at the upper end of the guidance range of5.1-5.6 million ounces and 2019 copper production of 432 million pounds was above the guidance range of375-430 million pounds.
Q4 2019 compared to Q3 2019
In the fourth quarter of 2019, gold revenues increased by 7% compared to the third quarter of 2019 primarily due to higher sales volume, combined with higher realized gold prices4. The average market price for the three-month period ended December 31, 2019 was $1,481 per ounce versus $1,472 per ounce for the prior quarter. During the fourth quarter of 2019, the gold price ranged from $1,446 per ounce to $1,525 per ounce and closed the quarter at $1,515 per ounce. Gold prices in the quarter were influenced by fluctuations in US Treasury rates and changes in expectations for US benchmark interest rates; movements in the US dollar; economic concerns as a result of global trade disputes; and net purchases from investors and the official sector.
Attributable Gold Production Variance (000s oz)
Q4 2019 compared to Q3 2019
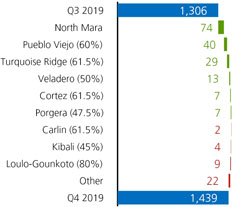
In the fourth quarter of 2019, attributable gold production was 133 thousand ounces higher than the prior quarter, primarily due to the impact of the acquisition of all of the shares that we did not own of Acacia on September 17, 2019, which resulted in an increase in attributable production at North Mara, Bulyanhulu and Buzwagi to 100% (from 63.9%). This was combined with the resumption of operations at North Mara after the lifting of the Prohibition Notice late in the third quarter of 2019, higher throughput at Pueblo Viejo due to record sulfur tonnes oxidized following optimization work, partially offset by the sale of our 50% interest in Kalgoorlie (included in the Other category above) on November 28, 2019.
Copper revenues in the fourth quarter of 2019 increased by 82% compared to the prior quarter, primarily due to higher copper sales volume and higher realized copper prices4. The average market price in the fourth quarter of 2019 was $2.67 per pound versus $2.63 per pound in the prior quarter. In the fourth quarter of 2019, the realized copper price4 was higher than the market copper price as a result of the impact of positive provisional pricing adjustments recorded, whereas negative provisional pricing adjustments were recorded in the prior quarter. During the fourth quarter of 2019, the copper price ranged from $2.53 per pound to $2.84 per pound and closed the quarter at $2.79 per pound. Copper prices in the fourth quarter were positively influenced by progress on trade negotiations between the US and China and a further reduction in global stockpiles.
Attributable copper production in the fourth quarter of 2019 increased by 5 million pounds compared to the prior quarter, primarily due to higher throughput and grades at both Zaldívar and Jabal Sayid. In spite of a strong quarter on production, sales were negatively affected by a major refurbishment at one of the third-party smelters that processes a portion of Lumwana’s concentrate. The refurbishment was completed in January 2020. We are evaluating our opportunities with this third-party smelter to steadily sell the concentrate stockpiled during the refurbishment period through the course of the year.
| BARRICK YEAR-END 2019 | 78 | MANAGEMENT’S DISCUSSION AND ANALYSIS |
2019 compared to 2018
In 2019, gold revenues increased by 39% compared to the prior year primarily due to the inclusion of production from sites acquired as part of the Merger and due to the formation of Nevada Gold Mines, which commenced on July 1, 2019 and is consolidated and included in revenue at 100%. Excluding the impact of the Merger and the formation of Nevada Gold Mines, gold revenues were in line with the prior year as a decrease in gold sales volumes was largely offset by an increase in realized gold prices4. The average market gold price for 2019 was $1,393 per ounce versus $1,268 per ounce in the prior year.
In 2019, attributable gold production was 938 thousand ounces or 21% higher than the prior year. Excluding the impact of the Merger and the formation of Nevada Gold Mines, gold production for the year decreased by 383 thousand ounces or 8%, mainly due to lower grades mined and processed at Cortez as mining from CHOP was completed in the second quarter of 2019.
Gold Production Variance (000s oz)
year ended December 31, 2019
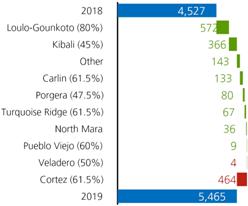
Copper revenues for 2019 were down 23% compared to the prior year due to lower realized copper prices4, combined with lower copper sales volume. Copper sales were adversely impacted by a major refurbishment at one of the third-party smelters that processes a portion of Lumwana’s concentrate. In 2019, the realized copper price4 was higher than the market copper price as a result of positive provisional pricing adjustments to copper sales that were subject to finalization in 2019. The 2018 realized copper price4was lower than the market copper price as a result of negative provisional pricing adjustments, the opposite impact from the current year.
Attributable copper production for 2019 was 13% higher than the prior year, mainly due to the improvements in plant availability and efficiency implemented at Lumwana, as well as higher grade and throughput at Zaldívar following crusher and conveyor issues that occurred in the prior year period.
Production Costs
| ($ millions, except per ounce/ pound data in dollars) | For the three months ended | For the years ended | ||||||||||||||||||
| 12/31/19 | 9/30/19 | 12/31/19 | 12/31/18 | 12/31/17 | ||||||||||||||||
Gold | ||||||||||||||||||||
Direct mining costsa | 1,252 | 1,207 | 4,274 | 3,130 | 3,063 | |||||||||||||||
Depreciation | 549 | 538 | 1,902 | 1,253 | 1,529 | |||||||||||||||
Royalty expense | 85 | 79 | 308 | 196 | 206 | |||||||||||||||
Community relations | 10 | 7 | 30 | 42 | 38 | |||||||||||||||
Cost of sales | 1,896 | 1,831 | 6,514 | 4,621 | 4,836 | |||||||||||||||
Cost of sales ($/oz)b | 1,046 | 1,065 | 1,005 | 892 | 794 | |||||||||||||||
Total cash costs ($/oz)c | 692 | 710 | 671 | 588 | 526 | |||||||||||||||
All-in sustaining costs ($/oz)c | 923 | 984 | 894 | 806 | 750 | |||||||||||||||
Copper | ||||||||||||||||||||
Direct mining costs | 55 | 30 | 224 | 344 | 274 | |||||||||||||||
Depreciation | 17 | 13 | 100 | 170 | 83 | |||||||||||||||
Royalty expense | 8 | 5 | 34 | 39 | 38 | |||||||||||||||
Community relations | 0 | 1 | 3 | 5 | 4 | |||||||||||||||
Cost of sales | 80 | 49 | 361 | 558 | 399 | |||||||||||||||
Cost of sales ($/lb)b | 2.26 | 2.00 | 2.14 | 2.40 | 1.77 | |||||||||||||||
C1 cash costs ($/lb)c | 1.90 | 1.62 | 1.69 | 1.97 | 1.66 | |||||||||||||||
All-in sustaining costs ($/lb)c | 2.82 | 2.58 | 2.52 | 2.82 | 2.34 | |||||||||||||||
| a. | Includes mining and processing costs. |
| b. | Cost of sales applicable to gold per ounce is calculated using cost of sales applicable to gold on an attributable basis (removing thenon-controlling interest of 40% Pueblo Viejo, 36.1% Tanzania until September 30, 2019 (notwithstanding the completion of the Acacia transaction on September 17, 2019, we consolidated our interest in Acacia and recorded anon-controlling interest of 36.1% in the income statement for the entirety of the third quarter of 2019 as a matter of convenience) and 40% South Arturo from cost of sales (63.1% of South Arturo from July 1, 2019 onwards as a result of its contribution to Nevada Gold Mines)), divided by attributable gold ounces. Thenon-controlling interest of 20% Loulo-Gounkoto and 10.3% of Tongon is also removed from cost of sales and our proportionate share of cost of sales attributable to equity method investments (Kibali and Morila) is included commencing January 1, 2019, the effective date of the Merger. Also removes thenon-controlling interest of 38.5% Nevada Gold Mines from cost of sales from July 1, 2019 onwards. Cost of sales applicable to copper per pound is calculated using cost of sales applicable to copper including our proportionate share of cost of sales attributable to equity method investments (Zaldívar and Jabal Sayid), divided by consolidated copper pounds (including our proportionate share of copper pounds from our equity method investments). |
| c. | Total cash costs, C1 cash costs andall-in sustaining costs arenon-GAAP financial performance measures with no standardized meaning under IFRS and therefore may not be comparable to similar measures of performance presented by other issuers. For further information and a detailed reconciliation of eachnon-GAAP measure used in this section of the MD&A to the most directly comparable IFRS measure, please see pages 91 to 112 of this MD&A. |
| BARRICK YEAR-END 2019 | 79 | MANAGEMENT’S DISCUSSION AND ANALYSIS |
Q4 2019 compared to Q3 2019
In the fourth quarter of 2019, cost of sales applicable to gold was 4% higher compared to the third quarter of 2019 as a result of increased sales volume. Our 45% interest in Kibali and 40% interest in Morila are equity accounted for and therefore we do not include their cost of sales in our consolidated gold cost of sales. On a per ounce basis, cost of sales applicable to gold5, after including our proportionate share of cost of sales at our equity method investees, and total cash costs4 were 2% and 3% lower, respectively, than the prior quarter primarily due to the impact of higher grade and throughput at Pueblo Viejo, partially offset by lower grades at Cortez as the remaining higher grade,low-cost stockpiles from CHOP were processed in the third quarter of 2019.
In the fourth quarter of 2019, goldall-in sustaining costs4 decreased by 6% on a per ounce basis compared to the prior quarter primarily due to lower total cash costs4 as discussed above, combined with lower general and administrative expenses and lower minesite sustaining capital expenditures.
In the fourth quarter of 2019, cost of sales applicable to copper was 63% higher than the prior quarter primarily due to higher copper sales volume at Lumwana as a result of our efforts to sell concentrate through other channels while the major refurbishment at one of the third-party smelters continued. Our 50% interests in Zaldívar and Jabal Sayid are equity accounted for and therefore we do not include their cost of sales in our consolidated copper cost of sales. On a per pound basis, cost of sales applicable to copper5 and C1 cash costs4, after including our proportionate share of cost of sales at our equity method investees, increased by 13% and 17%, respectively, compared to the prior quarter primarily due to more stripping expenditures being expensed rather than capitalized at Zaldívar and Lumwana.
In the fourth quarter of 2019, copperall-in sustaining costs4, which have been adjusted to include our proportionate share of equity method investees, were 9% higher per pound than the prior quarter primarily reflecting higher C1 cash costs4, partially offset by lower minesite sustaining capital expenditures on a per pound sold basis.
2019 compared to 2018
2019 cost of sales applicable to gold5 was $1,005 per ounce compared to our guidance range of$940-$990 per ounce. In 2019, cost of sales applicable to gold was 41% higher than the prior year primarily due to increased sales volume resulting from the Merger and the formation of Nevada Gold Mines. Excluding the impact of the Merger and Nevada Gold Mines, cost of sales applicable to gold was 3% lower compared to the prior year, in line with the change in production after adjusting for the impact of the Merger and Nevada Gold Mines. On a per ounce basis, cost of sales applicable to gold5, after including our proportionate share of cost of sales at our equity method investees, was 13% higher than the prior year primarily due to higher depreciation on a per ounce basis as a result of the fair value increments applied to our interests in the legacy Randgold and Nevada Gold Mines operations. Total cash costs per ounce4 increased by 14% compared to the same prior year period primarily due to the impact of lower grades processed from Cortez and higher export duties and royalties at Veladero.
Gold total cash costs4 andall-in sustaining costs4for 2019 were $671 and $894 per ounce, respectively, both within the guidance ranges of$650-$700 and$870-$920 per ounce. In 2019, goldall-in sustaining costs per ounce4 increased by 11% compared to the prior year primarily due to higher total cash costs4 as discussed above, combined with higher minesite sustaining capital expenditures on a per ounce basis, partially offset by lower general and administrative expenses.
2019 cost of sales applicable to copper5and C1 cash costs4were $2.14 and $1.69 per pound, both below our guidance ranges of$2.30-$2.70 and$1.70-$2.00 per pound, respectively. In 2019, cost of sales applicable to copper was 35% lower than the prior year, primarily due to the impact of lower copper sales volume at Lumwana, as sales were negatively affected by a major refurbishment at one of the third-party smelters that processes a portion of Lumwana’s concentrate. The refurbishment was completed in January 2020. We are evaluating our opportunities with this third-party smelter to steadily sell the concentrate stockpiled during the refurbishment period through the course of the year. Our 50% interests in Zaldívar and Jabal Sayid are equity accounted for and therefore we do not include their cost of sales in our consolidated copper cost of sales. On a per pound basis, cost of sales applicable to copper5and C1 cash costs4, after including our proportionate share of cost of sales at our equity method investees, decreased by 11% and 14%, respectively, compared to the prior year primarily due to the fundamental and sustainable improvements in plant availability and operational efficiency initiatives implemented at Lumwana.
2019 copperall-in sustaining costs4, which have been adjusted to include our proportionate share of equity method investments, were $2.52 per pound, at the lower end of our guidance range of$2.40-$2.90 per pound. Copperall-in sustaining costs4 were 11% lower than the prior year primarily reflecting the lower total C1 cash costs4, partially offset by higher minesite sustaining capital expenditures on a per pound basis.
| BARRICK YEAR-END 2019 | 80 | MANAGEMENT’S DISCUSSION AND ANALYSIS |
Capital Expendituresa
| ($ millions) | For the three months ended | For the years ended | ||||||||||||||||||
| (unaudited) | 12/31/19 | 9/30/19 | 12/31/19 | 12/31/18 | 12/31/17 | |||||||||||||||
Minesite sustainingb | 394 | 406 | 1,320 | 968 | 1,116 | |||||||||||||||
Project capital expendituresc | 46 | 96 | 370 | 425 | 280 | |||||||||||||||
Capitalized interest | 6 | 0 | 11 | 7 | 0 | |||||||||||||||
Total consolidated capital expenditures | 446 | 502 | 1,701 | 1,400 | 1,396 | |||||||||||||||
Attributable capital expendituresd | 393 | 397 | 1,512 | 1,363 | 1,314 | |||||||||||||||
2019 Attributable capital expenditures guidanced | | $1,400 to $1,700 |
| |||||||||||||||||
| a. | These amounts are presented on a 100% cash basis, except for attributable capital expenditures. |
| b. | Includes both minesite sustaining and mine development. |
| c. | Project capital expenditures (on an accrued basis until December 31, 2018, and on a cash basis thereafter) are included in our calculation ofall-in costs, but not included in our calculation ofall-in sustaining costs. |
| d. | These amounts are presented on the same basis as our guidance and include our 60% share of Pueblo Viejo and South Arturo (36.9% of South Arturo from July 1, 2019 onwards as a result of its contribution to Nevada Gold Mines), our 63.9% share of Tanzania until September 30, 2019 (notwithstanding the completion of the Acacia transaction on September 17, 2019, we consolidated our interest in Acacia and recorded anon-controlling interest of 36.1% in the income statement for the entirety of the third quarter of 2019 as a matter of convenience) and our 50% share of Zaldívar and Jabal Sayid. Also includes our 80% share of Loulo-Gounkoto, 89.7% share of Tongon, 45% share of Kibali and 40% share of Morila commencing January 1, 2019, the effective date of the Merger. Starting July 1, 2019, it also includes our 61.5% share of Nevada Gold Mines. |
Q4 2019 compared to Q3 2019
In the fourth quarter of 2019, total consolidated capital expenditures on a cash basis decreased by 11% compared to the third quarter of 2019, primarily due to lower project capital expenditures of 52%, combined with a decrease in minesite sustaining capital expenditures of 3%. Lower project capital expenditures are mainly attributed to Cortez due to decreases at the Cortez Hills Underground Rangefront project and the change in classification of the Crossroads open pit project. Crossroads transitioned to production status late in the third quarter of 2019 frompre-production prior to that. As such, lower project capital expenditures are attributable to this transition resulting in a change in the classification of capital expenditures from project to sustaining. The decrease in minesite sustaining capital expenditures is the result of lower stripping costs capitalized at Loulo-Gounkoto, partially offset by the change in classification of the Crossroads open pit project as discussed above.
2019 compared to 2018
In 2019, total consolidated capital expenditures on a cash basis increased by 22% compared to the prior year, primarily due to the impact of the sites acquired as part of the Merger and from Nevada Gold Mines, which commenced on July 1, 2019, and is consolidated and included at 100%. Excluding the impact of the Merger and the formation of Nevada Gold Mines, capital expenditures decreased by 4% mainly due to lower project capital expenditures at Cortez due to decreasing
Crossroads dewatering activities and Rangefront project expenditures, while minesite sustaining capital expenditures remained in line with the prior year.
2019 compared to Outlook
Attributable capital expenditures for 2019 of $1,512 million were at the lower end of the guidance range of $1,400 to $1,700 million.
General and Administrative Expenses
| ($ millions) | For the three months ended | For the years ended | ||||||||||||||||||
| (unaudited) | 12/31/19 | 9/30/19 | 12/31/19 | 12/31/18 | 12/31/17 | |||||||||||||||
Corporate administrationa | 26 | 39 | 148 | 212 | 201 | |||||||||||||||
Share-based compensationb | 5 | 13 | 37 | 27 | 26 | |||||||||||||||
Tanzaniac | 0 | 16 | 27 | 26 | 21 | |||||||||||||||
General & administrative expenses | 31 | 68 | 212 | 265 | 248 | |||||||||||||||
2019 General & administrative expenses guidance | ~$200 | |||||||||||||||||||
| a. | For the three months and year ended December 31, 2019, corporate administration costs include approximately $nil and $18 million, respectively, of severance costs (September 30, 2019: $3 million; 2018 $63 million; 2017: $3 million). |
| b. | Based on US$18.59 share price as at December 31, 2019 (September 30, 2019: US$17.33; 2018: US$13.54; 2017: $14.47) and excludes share-based compensation relating to Tanzania. |
| c. | Formerly known as Acacia Mining plc. This line includes severance costs of approximately $13 million and $15 million, for the three months and year ended December 31, 2019, respectively. |
Q4 2019 compared to Q3 2019
In the fourth quarter of 2019, general and administrative expenses decreased by $37 million compared to the third quarter of 2019 primarily due to severance costs incurred by Tanzania resulting from the closure of Acacia’s London and Johannesburg offices that occurred in the prior quarter. This was combined with lower corporate administration expenses of $13 million mainly due to cost reductions and lower short-term incentive accruals during the quarter. This was further impacted by lower share-based compensation of $8 million mainly resulting from a more modest increase in our share price during the fourth quarter of 2019 compared to the increase in the prior quarter.
2019 compared to 2018
General and administrative expenses decreased by $53 million compared to the prior year due to lower corporate administration expenses attributed to the organizational reductions related to both the implementation of the decentralized operating model in the prior year and the Merger in the current period. This was partially offset by higher share-based compensation resulting from higher share prices compared to the prior year.
2019 compared to Outlook
Exclusive of severance costs of $33 million, general and administrative expenses were lower than guidance of ~$200 million. Corporate administration expenses of $130 million (excluding severances of $18 million) were below guidance of ~$140 million, highlighting the benefit of cost reduction activities during the year and the implementation of our flat, operationally focused, agile management structure.
| BARRICK YEAR-END 2019 | 81 | MANAGEMENT’S DISCUSSION AND ANALYSIS |
Exploration, Evaluation and Project Costs
| ($ millions) | For the three months ended | For the years ended | ||||||||||||||||||
| (unaudited) | 12/31/19 | 9/30/19 | 12/31/19 | 12/31/18 | 12/31/17 | |||||||||||||||
Global exploration and evaluation | 33 | �� | 34 | 143 | 121 | 126 | ||||||||||||||
Advanced project costs: | ||||||||||||||||||||
Pascua-Lama | 11 | 13 | 49 | 77 | 122 | |||||||||||||||
Other | 6 | 5 | 20 | 36 | 14 | |||||||||||||||
Corporate development | 10 | 11 | 51 | 60 | 13 | |||||||||||||||
Business improvement and innovation | 0 | 1 | 10 | 44 | 32 | |||||||||||||||
Minesite exploration and evaluation | 24 | 22 | 69 | 45 | 47 | |||||||||||||||
Total exploration, evaluation and project expenses | 84 | 86 | 342 | 383 | 354 | |||||||||||||||
2019 total E&E and project expenses guidance | | $280 to $340 |
| |||||||||||||||||
Q4 2019 compared to Q3 2019
Exploration, evaluation and project expenses for thefourth quarter of 2019 were in line with the prior quarter.
2019 compared to 2018
Exploration, evaluation and project costs for 2019 decreased by $41 million compared to the prior year. This was due to lower advanced project costs, primarily at Pascua-Lama, and lower business improvement and innovation costs as a result of digitization initiatives occurring in the prior year. This was partially offset by an increase in minesite exploration and evaluation expenses at Nevada Gold Mines and higher global exploration and evaluation expenses mainly due to the expansion project at Pueblo Viejo.
2019 compared to Outlook
Exploration, evaluation and project costs for 2019 were marginally above the top end of the guidance range of $280 to $340 million. This was due to higher exploration and evaluation expenditures, which were above the guidance range of $170 to $180 million, marginally offset by lower project expenditure, which was at the lower end of the $120 to $150 million range.
Finance Costs, Net
| ($ millions) | For the three months ended | For the years ended | ||||||||||||||||||
| (unaudited) | 12/31/19 | 9/30/19 | 12/31/19 | 12/31/18 | 12/31/17 | |||||||||||||||
Interest expensea | 104 | 112 | 435 | 452 | 511 | |||||||||||||||
Accretion | 16 | 19 | 75 | 87 | 67 | |||||||||||||||
Loss on debt extinguishment | 0 | 3 | 3 | 29 | 127 | |||||||||||||||
Interest capitalized | (6 | ) | (3 | ) | (14 | ) | (9 | ) | 0 | |||||||||||
Other finance costs | 5 | (2 | ) | 1 | 1 | 0 | ||||||||||||||
Finance income | (13 | ) | (4 | ) | (31 | ) | (15 | ) | (14 | ) | ||||||||||
Finance costs, net | 106 | 125 | 469 | 545 | 691 | |||||||||||||||
2019 finance costs, net guidance | | $500 to $550 |
| |||||||||||||||||
| a. | For the three months and year ended December 31, 2019, interest expense includes approximately $28 million and $103 million, respectively, ofnon-cash interest expense relating to the gold and silver streaming agreements with Wheaton Precious Metals Corp. and Royal Gold, Inc. (September 30, 2019: $25 million; 2018: $98 million; 2017: $101 million). |
Q4 2019 compared to Q3 2019
In the fourth quarter of 2019, net finance costs were 15% lower than the prior quarter, mainly due to an increase in finance income resulting from the unwinding of the discount related to a prepaid long-term royalty at Carlin which was recorded at its fair value on the formation of Nevada Gold Mines.
2019 compared to 2018
In 2019, net finance costs were 14% lower than the prior year primarily due to a decrease in loss on debt extinguishment and lower interest expense, both attributable to debt reductions we have made over the preceding 18 months. The loss on debt extinguishment in 2019 relates to the make-whole repurchase of the outstanding $248 million of principal of our 4.95% notes due 2020 in July 2019. For 2018, the loss on debt extinguishment relates to the make-whole repurchase of the remaining $629 million of principal on the 4.40% Notes due 2021 in July 2018, which also resulted in a decrease in interest expense compared to the prior year.
2019 compared to Outlook
Net finance costs for 2019 were below the guidance range of $500 to $550 million. This was due to higher finance income and lower accretion expense on our environmental rehabilitation provisions.
| BARRICK YEAR-END 2019 | 82 | MANAGEMENT’S DISCUSSION AND ANALYSIS |
Additional Significant Statement of Income Items
| ($ millions) | For the three months ended | For the years ended | ||||||||||||||||||
| (unaudited) | 12/31/19 | 9/30/19 | 12/31/19 | 12/31/18 | 12/31/17 | |||||||||||||||
Impairment charges (reversals) | (566 | ) | (872 | ) | (1,423 | ) | 900 | (212 | ) | |||||||||||
Loss on currency translation | 53 | 40 | 109 | 136 | 72 | |||||||||||||||
Other expense (income) | (1,282 | ) | (1,852 | ) | (3,100 | ) | 90 | (799 | ) | |||||||||||
Impairment Charges (Reversals)
| ($ millions) | For the three months ended | For the years ended | ||||||||||||||||||
| (unaudited) | 12/31/19 | 9/30/19 | 12/31/19 | 12/31/18 | 12/31/17 | |||||||||||||||
Post-tax (our | Post-tax (our share) | Post-tax (our share) | Post-tax (our share) | Post-tax (our share) | ||||||||||||||||
Asset impairments (reversals) | ||||||||||||||||||||
| Lumwana | 0 | (663 | ) | (663 | ) | 0 | (259 | ) | ||||||||||||
| Pueblo Viejo | (277 | ) | 0 | (277 | ) | 0 | 0 | |||||||||||||
| Pascua-Lama | 296 | 0 | 296 | (7 | ) | 407 | ||||||||||||||
| Nevada Gold Mines | 0 | 46 | 48 | 11 | 0 | |||||||||||||||
| Lagunas Norte | 0 | 11 | 12 | 405 | 2 | |||||||||||||||
| Veladero | 0 | 0 | 2 | 160 | 0 | |||||||||||||||
| Equity method investments | 0 | 0 | 0 | 30 | 0 | |||||||||||||||
| Acacia exploration sites | 0 | 0 | 0 | 17 | 0 | |||||||||||||||
| Cerro Casale | 0 | 0 | 0 | 0 | (518 | ) | ||||||||||||||
| Bulyanhulu | 0 | 0 | 0 | 0 | 350 | |||||||||||||||
| Golden Sunlight | 0 | 0 | 0 | 0 | 2 | |||||||||||||||
| Exploration sites | 0 | 0 | 0 | 0 | 8 | |||||||||||||||
| Other | 3 | 4 | 14 | 29 | 1 | |||||||||||||||
Total asset impairment charges (reversals) | 22 | (602 | ) | (568 | ) | 645 | (7 | ) | ||||||||||||
Goodwill | ||||||||||||||||||||
| Veladero | 0 | 0 | 0 | 154 | 0 | |||||||||||||||
Total goodwill impairment charges | 0 | 0 | 0 | 154 | 0 | |||||||||||||||
Tax effects and NCI | (588 | ) | (270 | ) | (855 | ) | 101 | (205 | ) | |||||||||||
Total impairment charges (reversals) | (566 | ) | (872 | ) | (1,423 | ) | 900 | (212 | ) | |||||||||||
Impairment Charges (Reversals)
Q4 2019 compared to Q3 2019
In the fourth quarter of 2019, net impairment charges were $22 million (net of tax andnon-controlling interests) compared to reversals of $602 million (net of tax andnon-controlling interests) in the prior quarter. The net impairment charge in the fourth quarter of 2019 mainly relates to a charge of $296 million (no tax impact) at Pascua-Lama, as we completed a
study of the Pascua-Lama project and concluded that we do not have a plan that meets our investment criteria under our current assumptions. This was partially offset by net impairment reversals at Pueblo Viejo of $277 million net of tax andnon-controlling interest ($865 millionpre-tax andnon-controlling interest), reflecting the progression of our engineering and evaluation work on the process plant expansion and additional tailings facility. In conjunction with the increase in the long-term gold price assumption, this has resulted in an improvement in the life of mine cash flows for the mine site. In the third quarter of 2019, the net impairment reversal relates to a reversal at Lumwana of $663 million net of tax ($947 millionpre-tax), partially offset by impairments of land holdings and CHOP infrastructure assets at Cortez.
2019 compared to 2018
In 2019, we recognized $568 million (net of tax andnon-controlling interests) of net impairment reversals fornon-current assets. This was mainly at Lumwana: $663 million net of tax ($947 millionpre-tax) as a result of significant reductions achieved in the current year in unit mining costs and improvements in plant availability reflected in our updated life of mine plan, combined with an increase in our long-term copper price assumption of $3.00 per pound from $2.85 per pound. In addition, we recognized $277 million net of tax andnon-controlling interest ($865 millionpre-tax andnon-controlling interest) of net impairment reversals at Pueblo Viejo, reflecting the progression of our engineering and evaluation work on the process plant expansion and additional tailings facility in conjunction with the increase in the long-term gold price assumption. This was partially offset by net impairment charges of $296 million (no tax impact) at Pascua-Lama, as we completed a study of the Pascua-Lama project and concluded that we do not have a plan that meets our investment criteria under our current assumptions.
Loss on Currency Translation
Q4 2019 compared to Q3 2019
Loss on currency translation in the fourth quarter of 2019 was $53 million compared to $40 million in the prior quarter. The increase was primarily due to the revaluation of a Zambian tax settlement, partially offset by lower unrealized foreign currency translation losses resulting from a modest depreciation of the Argentine peso in the current quarter versus a significant depreciation in the prior quarter. This currency depreciation resulted in the revaluation of our peso denominated value-added tax receivable balances. During the fourth quarter of 2019, the Argentine peso continued to weaken versus the US dollar due in part to high inflation.
2019 compared to 2018
Loss on currency translation for 2019 decreased by $27 million compared to the prior year. The decrease was primarily due to continued unrealized foreign currency translation losses relating to the Argentine peso, but from a lower asset base in 2019 versus 2018. The peso has significantly depreciated in both periods and has revalued our peso denominated value-added tax receivable balances. After modest appreciation of the Argentine peso in the second quarter of 2019, the impact of inflation and political uncertainty in Argentina experienced in the third and fourth quarters of 2019 has driven a return to the general trend in recent years of a weakening peso versus the US dollar.
| BARRICK YEAR-END 2019 | 83 | MANAGEMENT’S DISCUSSION AND ANALYSIS |
Other Expense (Income)
Q4 2019 compared to Q3 2019
In the fourth quarter of 2019, other income was $1,282 million compared to $1,852 million in the prior quarter. Other income in the fourth quarter of 2019 mainly relates to a $628 million gain on thede-recognition of the deferred revenue liability relating to our silver sale agreement with Wheaton Precious Metals Corp. Other income in the fourth quarter of 2019 also includes a gain of $408 million resulting from the sale of our 50% interest in Kalgoorlie, and a gain of $216 million on a tax settlement at Lumwana. Other income in the third quarter of 2019 mainly related to the gain on the remeasurement of Barrick’s 75% interest in Turquoise Ridge to fair value as a result of its contribution to Nevada Gold Mines. Refer to note 4 to the Financial Statements for more information.
2019 compared to 2018
Other income was $3,100 million in 2019 compared to an expense of $90 million in the prior year. In 2019, we recognized a gain of $1,886 million relating to the remeasurement of Barrick’s 75% interest in Turquoise Ridge to fair value as a result of its contribution to Nevada Gold Mines, and a $628 million gain on thede-recognition of the deferred revenue liability relating to our silver sale agreement with Wheaton Precious Metals Corp. This was further impacted by a gain of $408 million resulting from the sale of our 50% interest in Kalgoorlie, and a gain of $216 million on a tax settlement at Lumwana. In 2018, we recognized $68 million of litigation fees, which primarily consists of legal fees at Acacia, and the settlement of a dispute regarding a historical supplier contract acquired as part of the Equinox acquisition in 2011; $51 million of write-offs, which relates primarily to thewrite-off of a Western Australia long-term stamp duty receivable; and $13 million related to an insurance payment to our Porgera JV. This was partially offset by a $45 million gain on the sale of anon-core royalty asset at Acacia, and $24 million of insurance proceeds received at Kalgoorlie.
Income Tax Expense
Income tax expense was $1,783 million in 2019. The underlying effective tax rate for ordinary income in 2019 was 34% after adjusting for the impact of the change in accounting for the Wheaton Precious Metals Corp. silver streaming agreement; the accounting gain on disposal of Turquoise Ridge; the profit on sale of Kalgoorlie; the net impact of foreign currency translation losses on deferred tax balances; the impact of impairment charges (reversals); the impact of debt extinguishment costs; the impact of asset sales andnon-hedge derivatives; the impact ofnon-deductible foreign exchange losses; the impact of accruing for US withholding tax; and the impact of other expense adjustments. The unadjusted tax rate for income in 2019 was 28% of the loss before income taxes.
We record deferred tax charges or credits if changes in facts or circumstances affect the estimated tax basis of assets and therefore the amount of deferred tax assets or liabilities to reflect changing expectations in our ability to realize deferred tax assets. The interpretation of tax regulations and legislation and their application to our business is complex and subject to change. We have significant amounts of deferred tax assets, including tax loss carry forwards, and also deferred tax liabilities. We have significant amounts of unrecognized deferred tax assets (e.g. for tax losses in Canada). Potential changes of any of these amounts, as well as our ability to
realize deferred tax assets, could significantly affect net income or cash flow in future periods.
| Reconciliation to Canadian Statutory Rate | ||||||||
| For the years ended | 12/31/19 | 12/31/18 | ||||||
At 26.5% statutory rate | 1,684 | (63 | ) | |||||
Increase (decrease) due to: | ||||||||
Allowances and special tax deductionsa | (129 | ) | (59 | ) | ||||
Impact of foreign tax ratesb | (264 | ) | (4 | ) | ||||
Expenses not tax deductible | 78 | 74 | ||||||
Impairment charges not recognized in deferred tax assets | 45 | 168 | ||||||
Goodwill impairment charges not tax deductible | 0 | 54 | ||||||
Net currency translation losses on deferred tax balances | 43 | 41 | ||||||
Tax impact from pass-through entities and equity accounted investments | (140 | ) | (15 | ) | ||||
Current year tax losses not recognized in deferred tax assets | 8 | 100 | ||||||
Sale of 50% interest in Kalgoorlie | 12 | 0 | ||||||
De-recognition of deferred tax assets | 4 | 814 | ||||||
United States adjustment toone-time toll charge | 0 | (49 | ) | |||||
Adjustments in respect of prior years | (13 | ) | 3 | |||||
Increase to income tax related contingent liabilities | 21 | 0 | ||||||
Dominican Republic tax audit | 0 | 42 | ||||||
Impact of tax rate changes | (35 | ) | 0 | |||||
United States withholding taxes | 30 | (107 | ) | |||||
Other withholding taxes | 24 | 14 | ||||||
Mining taxes | 412 | 184 | ||||||
Other items | 3 | 1 | ||||||
Income tax expense | 1,783 | 1,198 | ||||||
| a. | We are able to claim certain allowances and tax deductions unique to extractive industries that result in a lower effective tax rate. |
| b. | We operate in multiple foreign tax jurisdictions that have tax rates different than the Canadian statutory rate. |
The more significant items impacting income tax expense in 2019 and 2018 include the following:
Currency Translation
Deferred tax balances are subject to remeasurement for changes in currency exchange rates each period. This is required in countries where tax is paid in local currency and accounts are prepared in local GAAP. The most significant balances are Argentine deferred tax liabilities. In 2019 and 2018, tax expense of $75 million and $41 million, respectively, primarily arose from translation losses due to the weakening of the Argentine peso against the US dollar. These translation losses are included within deferred tax expense (recovery). In 2019, deferred tax balances for legacy Randgold assets in Mali and Côte d’Ivoire required remeasurement at year end.
De-recognition of Deferred Tax Assets
In the fourth quarter of 2018, we recorded a deferred tax expense of $673 million related tode-recognition of the deferred tax asset in Canada, and a deferred tax expense of $141 million related tode-recognition of the deferred tax asset in Peru. Thede-recognition of the deferred tax asset in Canada follows the Merger and management’s focus on growing the business globally, particularly on our Tier OneGold Assets1 which are outside of Canada. This required us
| BARRICK YEAR-END 2019 | 84 | MANAGEMENT’S DISCUSSION AND ANALYSIS |
to reassess the level of repatriated earnings expected in Canada, and Canadian income thereon to support the deferred tax asset. Thede-recognition of the deferred tax asset does not constrain our ability to use Canadian carry forward tax losses against future income in Canada; however, we did not expect to be able to use these losses in the foreseeable future as a result of the change in strategy in the fourth quarter of 2018. Thede-recognition of the deferred tax asset in Peru in the fourth quarter of 2018 follows management’s review of expected future earnings. The associated impairment of inventory at Lagunas Norte was also driven by the change in the fourth quarter of 2018 in our expected approach to financing future reclamation activities in Peru. Based on these reviews in Canada and Peru, it was determined that the realization of these deferred tax assets was no longer probable.
United States Withholding Taxes
In the fourth quarter of 2018, primarily due to restructuring associated with the Merger, we concluded that going forward, we would reinvest our future undistributed earnings of our United States subsidiaries indefinitely. As a result of our reassessment, we recorded a deferred tax recovery of $107 million.
In 2019, we reassessed our intentions on the current and future undistributed earnings of our United States subsidiaries due to the formation of Nevada Gold Mines. Based on the free cash flow that we expect Nevada Gold Mines to generate, together with other factors, we concluded that it was no longer our intent to indefinitely reinvest our current and future undistributed earnings of our United States subsidiaries. Therefore in the fourth quarter of 2019, we recognized an increase in our income tax provisions in the amount of $30 million, representing withholding tax on undistributed United States earnings.
Framework for former Acacia Operations in Tanzania
On October 20, 2019, Barrick announced that it had reached an agreement with the Government of Tanzania (“GoT”) to settle all disputes between the GoT and the mining companies formerly operated by Acacia but now managed by Barrick. The final agreements were submitted to the Tanzanian Attorney General for review and legalization.
On January 24, 2020, Barrick announced that the Company had ratified the creation of Twiga at a signing ceremony with the President of Tanzania, formalizing the establishment of a joint venture between Barrick and the GoT and resolution of all outstanding disputes between Barrick and the GoT, including the lifting of the previous concentrate export ban, effective immediately.
The terms of the signed agreement are consistent with those previously announced, including the payment of $300 million to settle all outstanding tax and other disputes (the “Settlement Payment”); the lifting of the concentrate export ban; the sharing of future economic benefits from the mines on a 50/50 basis; and a dispute resolution mechanism that provides for binding international arbitration. The 50/50 division of economic benefits will be maintained through an annualtrue-up mechanism, which will not account for the Settlement Payment.
The Settlement Payment will be paid in installments, with an initial payment of $100 million to the GoT following the resumption of mineral concentrate exports. Five subsequent annual payments of $40 million each will be made, starting on the first anniversary of the fulfillment of all conditions of the signed agreement, subject to certain cash flow conditions.
A tax provision of $128 million had been recorded prior to December 31, 2016 in respect of tax disputes related to Acacia. Of this amount, $70 million was recorded in 2016. In the third quarter of 2017, an additional amount of $172 million was recorded as current tax expense.
Zambian Tax Matters
The mining taxes assessed to the Lumwana Mine have contradicted the Development Agreement that was finalized between Lumwana Mining Company Limited (“LMC”) and the Government of Zambia on December 16, 2005. In 2015, the Company began to take steps to preserve its rights under the Development Agreement and started to engage in formal discussions with the government to redress historical tax issues relating to the Development Agreement. On October 3, 2018, a deed of settlement was signed by the Government of Zambia and LMC. The deed provided that, within 30 days of the deed, LMC shall file tax returns for 2012 through 2017, and the government shall have the right to conduct and complete an audit of the returns. The audit of these tax returns by the Zambian tax authority was completed in the fourth quarter of 2019 and we recorded a $50 million asset reflecting the final settlement of this matter. We also released historical accruals resulting in a total of $216 million recognized in Other Income in 2019.
| BARRICK YEAR-END 2019 | 85 | MANAGEMENT’S DISCUSSION AND ANALYSIS |
| FINANCIAL CONDITION REVIEW | ||||||||||||
| Summary Balance Sheet and Key Financial Ratios | ||||||||||||
| ($ millions, except ratios and share amounts) (unaudited) | As at December 31, 2019 | As at December 31, 2018 | As at December 31, 2017 | |||||||||
Total cash and equivalents | 3,314 | 1,571 | 2,234 | |||||||||
Current assets | 3,573 | 2,407 | 2,450 | |||||||||
Non-current assets | 37,505 | 18,653 | 20,624 | |||||||||
Total Assets | 44,392 | 22,631 | 25,308 | |||||||||
Current liabilities excluding short-term debt | 1,904 | 1,625 | 1,688 | |||||||||
Non-current liabilities excluding long-term debta | 7,125 | 5,883 | 6,130 | |||||||||
Debt (current and long-term) | 5,536 | 5,738 | 6,423 | |||||||||
Total Liabilities | 14,565 | 13,246 | 14,241 | |||||||||
Total shareholders’ equity | 21,432 | 7,593 | 9,286 | |||||||||
Non-controlling interests | 8,395 | 1,792 | 1,781 | |||||||||
Total Equity | 29,827 | 9,385 | 11,067 | |||||||||
Total common shares outstanding (millions of shares)b | 1,778 | 1,168 | 1,167 | |||||||||
Key Financial Ratios: | ||||||||||||
Current ratioc | 3.02:1 | 2.38:1 | 2.68:1 | |||||||||
Debt-to-equityd | 0.19:1 | 0.61:1 | 0.58:1 | |||||||||
| a. | Non-current financial liabilities as at December 31, 2019 were $5,656 million (2018: $6,201 million; 2017: $6,844 million). |
| b. | Total common shares outstanding do not include 0.3 million stock options. |
| c. | Represents current assets (excluding assetsheld-for-sale) divided by current liabilities (including short-term debt and excluding liabilitiesheld-for-sale) as at December 31, 2019, December 31, 2018 and December 31, 2017. |
| d. | Represents debt divided by total shareholders’ equity (including minority interest) as at December 31, 2019, December 31, 2018, and December 31, 2017. |
Balance Sheet Review
Total assets were $44.4 billion at December 31, 2019, approximately $21.8 billion higher than at December 31, 2018, primarily reflecting the impact of the sites acquired and asset values restated to fair value in connection with the formation of Nevada Gold Mines on July 1, 2019. These sites are consolidated at 100%. The increase in total assets also reflects the $7.9 billion Merger.
Our asset base is primarily comprised ofnon-current assets such as property, plant and equipment and goodwill, reflecting the capital-intensive nature of the mining business and our history of growth through acquisitions. Other significant assets include production inventories, indirect taxes recoverable and receivable, concentrate sales receivables, other government transaction and joint venture related receivables, and cash and equivalents.
Total liabilities at December 31, 2019 were $14.6 billion, approximately $1.3 billion higher than at December 31, 2018, also reflecting the impact of the formation of Nevada Gold Mines and the Merger. This was combined with the resulting increase in deferred income tax liabilities. Our liabilities are primarily comprised of debt, othernon-current liabilities such as provisions and deferred income tax liabilities, and accounts payable.
| Shareholders’ Equity | ||||
As at 2/4/2020 | Number of shares | |||
Common shares | 1,777,926,611 | |||
Stock options | 277,732 | |||
As a result of the Merger, 583,669,178 Barrick common shares were issued to the former Randgold shareholders. On
September 17, 2019, we issued 24,836,670 common shares to the minority shareholders of Acacia in exchange for their shares in Acacia.
Financial Position and Liquidity
Total cash and cash equivalents as at December 31, 2019 were $3.3 billion. Our capital structure comprises a mix of debt,non-controlling interest (primarily at Nevada Gold Mines) and shareholders’ equity. As at December 31, 2019, our total debt was $5.5 billion (debt net of cash and equivalents was $2.2 billion) and ourdebt-to-equity ratio was 0.19:1. This compares to debt as at December 31, 2018 of $5.7 billion (debt net of cash and cash equivalents was $4.2 billion), and adebt-to-equity ratio of 0.61:1.
On January 31, 2020, we completed a make-whole repurchase of the outstanding $337 million of principal of the 3.85% notes due 2022, which has reduced our total debt to approximately $5.2 billion subsequent to year end.
We currently have less than $40 million in debt due before 2021, and approximately $5 billion of our outstanding debt matures after 2032. In November 2019, we amended and restated the credit and guarantee agreement (the “Credit Facility”) with certain lenders, which requires such lenders to make available to us a credit facility of $3.0 billion or the equivalent amount in Canadian dollars. The Credit Facility, which is unsecured, currently has an interest rate of London Interbank Offered Rate (“LIBOR”) plus 1.25% on drawn amounts, and a commitment rate of 0.15% on undrawn amounts. As part of the amendment and restatement, the termination date of the Credit Facility was extended from January 2024 to January 2025. The Credit Facility is undrawn as at December 31, 2019.
| BARRICK YEAR-END 2019 | 86 | MANAGEMENT’S DISCUSSION AND ANALYSIS |
In 2020, we have capital commitments of $155 million and expect to incur attributable sustaining and project capital expenditures of approximately $1,600 to $1,900 million in 2020 based on our guidance range on page 43. In 2020, we have $323 million in interest payments and other amounts as detailed in the table on page 89. In addition, we have contractual obligations and commitments of $473 million in purchase obligations for supplies and consumables. We expect to fund these commitments through operating cash flow, which is our primary source of liquidity, as well as existing cash balances.
Our operating cash flow is dependent on the ability of our operations to deliver projected future cash flows. The market prices of gold, and to a lesser extent copper, are the primary drivers of our operating cash flow. Other options to enhance liquidity include further portfolio optimization and the creation of new joint ventures and partnerships; issuance of equity securities in the public markets or to private investors, which could be undertaken for liquidity enhancement and/or in connection with establishing a strategic partnership; issuance of long-term debt securities in the public markets or to private investors (Moody’s and S&P currently rate Barrick’s outstanding long-term debt as investment grade, with ratings of Baa2 and BBB, respectively); and drawing on the $3.0 billion available under our undrawn Credit Facility (subject to compliance with covenants and the making of certain representations and warranties, this facility is available for drawdown as a source of financing). The key financial covenant in our undrawn Credit Facility requires Barrick to maintain a net debt to total capitalization ratio of less than 0.60:1. Barrick’s net debt to total capitalization ratio was 0.07:1 as at December 31, 2019 (0.31:1 as at December 31, 2018).
| Summary of Cash Inflow (Outflow) | ||||||||||||||||||||
| ($ millions) | For the three months ended | For the years ended | ||||||||||||||||||
| (unaudited) | 12/31/19 | 9/30/19 | 12/31/19 | 12/31/18 | 12/31/17 | |||||||||||||||
Net cash provided by operating activities | 875 | 1,004 | 2,833 | 1,765 | 2,065 | |||||||||||||||
Investing activities | ||||||||||||||||||||
Capital expenditures | (446 | ) | (502 | ) | (1,701 | ) | (1,400 | ) | (1,396 | ) | ||||||||||
Cash acquired in Merger | 0 | 0 | 751 | 0 | 0 | |||||||||||||||
Divestitures | 750 | 0 | 750 | 0 | 0 | |||||||||||||||
Cash received from equity method investments | 113 | 72 | 217 | 0 | 0 | |||||||||||||||
Other | (55 | ) | 47 | 33 | (94 | ) | 1,059 | |||||||||||||
Total investing inflows (outflows) | 362 | (383 | ) | 50 | (1,494 | ) | (337 | ) | ||||||||||||
Financing activities | ||||||||||||||||||||
Net change in debta | (6 | ) | (269 | ) | (309 | ) | (687 | ) | (1,533 | ) | ||||||||||
Dividendsb | (87 | ) | (67 | ) | (548 | ) | (125 | ) | (125 | ) | ||||||||||
Net (disbursements) funding tonon-controlling interests | (236 | ) | (31 | ) | (281 | ) | (84 | ) | (126 | ) | ||||||||||
Other | 1 | (2 | ) | (1 | ) | (29 | ) | (102 | ) | |||||||||||
Total financing inflows (outflows) | (328 | ) | (369 | ) | (1,139 | ) | (925 | ) | (1,886 | ) | ||||||||||
Effect of exchange rate | 0 | 0 | (1 | ) | (9 | ) | 3 | |||||||||||||
Increase (decrease) in cash and equivalents | 909 | 252 | 1,743 | (663 | ) | (155 | ) | |||||||||||||
| a. | The difference between the net change in debt on a cash basis and the net change on the balance sheet is due to changes innon-cash charges, specifically the unwinding of discounts and amortization of debt issue costs. |
| b. | For the three months ended December 31, 2019, we declared and paid dividends in US dollars totaling $0.05 per share. For the year ended December 31, 2019, we declared and paid $0.13 and $0.20 per share to Barrick shareholders, respectively (September 30, 2019: declared and paid $0.04 per share; 2018: declared $0.19 per share and paid $0.12 per share; 2017: declared and paid $0.12 per share). Dividends paid for the year ended December 31, 2019 also includes $2.69 per share to Randgold shareholders (2018: nil; 2017: nil). |
Q4 2019 compared to Q3 2019
In the fourth quarter of 2019, we generated $875 million in operating cash flow, compared to $1,004 million in the prior quarter. The decrease of $129 million was primarily due to an increase in interest paid as a result of the timing of payments on our long-term debt (generally paid semi-annually). This was partially offset by an increase in gold and copper sales volumes, higher gold and copper realized prices4, and lower gold cost of sales per ounce5.
Cash inflows from investing activities in the fourth quarter of 2019 were $362 million, compared to cash outflows of $383
| BARRICK YEAR-END 2019 | 87 | MANAGEMENT’S DISCUSSION AND ANALYSIS |
million in the prior quarter. The increase was primarily due to the sale of our 50% interest in Kalgoorlie for cash consideration of $750 million.
Net financing cash outflows for the fourth quarter of 2019 amounted to $328 million, compared to $369 million in the prior quarter. The decrease of $41 million is primarily due to the make-whole repurchase of our 4.95% notes due 2020 in July 2019 occurring in the prior quarter. This was partially offset by an increase in disbursements tonon-controlling interests.
2019 compared to 2018
In 2019, we generated $2,833 million in operating cash flow, compared to $1,765 million in the prior year. The increase of $1,068 million was primarily due to higher gold sales volume and higher gold realized prices4, partially offset by higher gold cost of sales per ounce5.
Cash inflows from investing activities for 2019 were $50 million compared to an outflow of $1,494 million in the prior year. The increase was primarily due to cash acquired of $751 million
as a result of the Merger and total cash consideration received of $750 million relating to the sale of our 50% interest in Kalgoorlie. This was combined with dividends received and shareholder loan repayments from equity method investments of $217 million, and lower investment purchases of $155 million. The investing inflows more than offset an increase in capital expenditures in the current year.
Net financing cash outflows for 2019 amounted to $1,139 million, compared to $925 million in the prior year. The higher outflows are primarily due to increased dividend payments. This was due to the first quarter 2019 payment of dividends declared in the fourth quarter of 2018 by Barrick and Randgold of $67 million and $256 million, respectively. This was combined with an increase in dividends declared starting in the first quarter of 2019, reflecting Barrick’s profitability and financial strength and is in line with the commitment to shareholder returns when the Merger was announced. Net financing cash outflows were also impacted by an increase in disbursements tonon-controlling interests, partially offset by lower debt repayments during the year.
| Summary of Financial Instruments | ||||||
| As at December 31, 2019 (unaudited) | ||||||
| Financial Instrument | Principal/Notional Amount | Associated Risks | ||||
| ● Interest rate | ||||||
Cash and equivalents | $3,314 | million | ● Credit | |||
| ● Credit | ||||||
Accounts receivable | $363 | million | ● Market | |||
| ● Market | ||||||
Other investments | $258 | million | ● Liquidity | |||
Accounts payable | $1,190 | million | ● Liquidity | |||
Debt | $5,564 | million | ● Interest rate | |||
Restricted share units | $43 | million | ● Market | |||
Deferred share units | $9 | million | ● Market | |||
| BARRICK YEAR-END 2019 | 88 | MANAGEMENT’S DISCUSSION AND ANALYSIS |
COMMITMENTS AND CONTINGENCIES
Litigation and Claims
We are currently subject to various litigation proceedings, and we may be involved in disputes with other parties in the future that may result in litigation. If we are unable to resolve these disputes favorably, it may have a material adverse impact on our financial condition, cash flow and results of operations.
Contractual Obligations and Commitments
In the normal course of business, we enter into contracts that give rise to commitments for future minimum payments. The following tablesummarizes the remaining contractual maturities of our financial liabilities and operating and capital commitments shown on an undiscounted basis:
| ($ millions) | Payments due as at December 31, 2019 | |||||||||||||||||||||||||||
| (unaudited) | 2020 | 2021 | 2022 | 2023 | 2024 | 2025 and thereafter | Total | |||||||||||||||||||||
Debta | ||||||||||||||||||||||||||||
Repayment of principalb | 14 | 7 | 337 | 0 | 0 | 5,109 | 5,467 | |||||||||||||||||||||
Capital leases | 25 | 15 | 12 | 8 | 5 | 32 | 97 | |||||||||||||||||||||
Interest | 323 | 321 | 314 | 307 | 306 | 4,445 | 6,016 | |||||||||||||||||||||
Provisions for environmental rehabilitationc | 169 | 174 | 193 | 176 | 143 | 2,103 | 2,958 | |||||||||||||||||||||
Restricted share units | 28 | 11 | 3 | 0 | 0 | 0 | 42 | |||||||||||||||||||||
Pension benefits and other post-retirement benefits | 27 | 7 | 7 | 7 | 6 | 99 | 153 | |||||||||||||||||||||
Minimum royalty paymentsd | 27 | 1 | 1 | 1 | 1 | 0 | 31 | |||||||||||||||||||||
Purchase obligations for supplies and consumablese | 473 | 229 | 142 | 142 | 142 | 553 | 1,681 | |||||||||||||||||||||
Capital commitmentsf | 155 | 111 | 37 | 27 | 31 | 22 | 383 | |||||||||||||||||||||
Social development costsg | 30 | 8 | 7 | 3 | 6 | 53 | 107 | |||||||||||||||||||||
Deposit on Pascua-Lama silver sale agreementh | 253 | 0 | 0 | 0 | 0 | 0 | 253 | |||||||||||||||||||||
Total | 1,524 | 884 | 1,053 | 671 | 640 | 12,416 | 17,188 | |||||||||||||||||||||
| a. | Debt and Interest - Our debt obligations do not include any subjective acceleration clauses or other clauses that enable the holder of the debt to call for early repayment, except in the event that we breach any of the terms and conditions of the debt or for other customary events of default. We are not required to post any collateral under any debt obligations. Projected interest payments on variable rate debt were based on interest rates in effect at December 31, 2019. Interest is calculated on our long-term debt obligations using both fixed and variable rates. |
| b. | Repayment of principal - On January 31, 2020, we completed a make-whole repurchase of the outstanding $337 million of principal of the 3.85% notes due 2022. The $337 million of principal is included in the table above. |
| c. | Provisions for environmental rehabilitation-Amounts presented in the table represent the undiscounted uninflated future payments for the expected cost of provisions for environmental rehabilitation. |
| d. | Minimum royalty payments are related to continuing operations and are presented net of recoverable amounts. |
| e. | Purchase obligations for supplies and consumables - Includes commitments related to new purchase obligations to secure a supply of acid, tires and cyanide for our production process. |
| f. | Capital commitments - Purchase obligations for capital expenditures include only those items where binding commitments have been entered into. |
| g. | Social development costs – Includes a commitment of $42 million ($28 million in 2020 and $14 million in 2025 and thereafter) related to the funding of a power transmission line in Argentina. |
| h. | Deposit on Pascua-Lama silver sale agreement - Relates to our silver sale agreement with Wheaton Precious Metals Corp. |
| BARRICK YEAR-END 2019 | 89 | MANAGEMENT’S DISCUSSION AND ANALYSIS |
REVIEW OF QUARTERLY RESULTS
Quarterly Informationa
| 2019 | 2018 | |||||||||||||||||||||||||||||||
| ($ millions, except where indicated) (unaudited) | Q4 | Q3 | Q2 | Q1 | Q4 | Q3 | Q2 | Q1 | ||||||||||||||||||||||||
Revenues | 2,883 | 2,678 | 2,063 | 2,093 | 1,904 | 1,837 | 1,712 | 1,790 | ||||||||||||||||||||||||
Realized price per ounce – goldb | 1,483 | 1,476 | 1,317 | 1,307 | 1,223 | 1,216 | 1,313 | 1,332 | ||||||||||||||||||||||||
Realized price per pound – copperb | 2.76 | 2.55 | 2.62 | 3.07 | 2.76 | 2.76 | 3.11 | 2.98 | ||||||||||||||||||||||||
Cost of sales | 1,987 | 1,889 | 1,545 | 1,490 | 1,577 | 1,315 | 1,176 | 1,152 | ||||||||||||||||||||||||
Net earnings (loss) | 1,387 | 2,277 | 194 | 111 | (1,197 | ) | (412 | ) | (94 | ) | 158 | |||||||||||||||||||||
Per share (dollars)c | 0.78 | 1.30 | 0.11 | 0.06 | (1.02 | ) | (0.35 | ) | (0.08 | ) | 0.14 | |||||||||||||||||||||
Adjusted net earningsb | 300 | 264 | 154 | 184 | 69 | 89 | 81 | 170 | ||||||||||||||||||||||||
Per share (dollars)b,c | 0.17 | 0.15 | 0.09 | 0.11 | 0.06 | 0.08 | 0.07 | 0.15 | ||||||||||||||||||||||||
Operating cash flow | 875 | 1,004 | 434 | 520 | 411 | 706 | 141 | 507 | ||||||||||||||||||||||||
Cash capital expenditures | 446 | 502 | 379 | 374 | 374 | 387 | 313 | 326 | ||||||||||||||||||||||||
Free cash flowb | 429 | 502 | 55 | 146 | 37 | 319 | (172 | ) | 181 | |||||||||||||||||||||||
| a. | Sum of all the quarters may not add up to the annual total due to rounding. |
| b. | Realized price, adjusted net earnings, adjusted net earnings per share and free cash flow arenon-GAAP financial performance measures with no standardized meaning under IFRS and therefore may not be comparable to similar measures of performance presented by other issuers. For further information and a detailed reconciliation of eachnon-GAAP measure used in this section of the MD&A to the most directly comparable IFRS measure, please see pages 91 to 112 of this MD&A. |
| c. | Calculated using weighted average number of shares outstanding under the basic method of earnings per share. |
Our recent financial results reflect our emphasis on cost discipline and growing operating cash flow. The positive free cash flow4 generated, combined with the proceeds from various divestitures, have allowed us to continually strengthen our balance sheet over the past two years.
In the fourth quarter of 2019, we recorded $22 million (net of tax andnon-controlling interests) of net impairment charges, mainly relating to a charge at Pascua-Lama of $296 million, partially offset by a net impairment reversal at Pueblo Viejo of $277 million. We also recorded a $628 million gain on thede-recognition of the deferred revenue liability relating to our silver sale agreement with Wheaton Precious Metals Corp., a gain of $408 million resulting from the sale of our 50% interest in Kalgoorlie, and a gain of $216 million on a tax settlement at Lumwana. In the third quarter of 2019, net earnings and cash flows were impacted by the formation of Nevada Gold Mines and the commencement of the
contribution of its operations to Barrick’s net earnings and cash flows. Net earnings in the third quarter of 2019 includes a $1.5 billion (net of tax effects) gain on remeasurement of Turquoise Ridge as a result of its contribution to Nevada Gold Mines and a $663 million (net of tax effects) impairment reversal at Lumwana. Starting in the first quarter of 2019, we had an increase in sales volume due to the Merger and the commencement of the contribution of Randgold’s operations to Barrick’s net earnings and cash flows. In the fourth quarter of 2018, we recorded $319 million (net of tax effects andnon-controlling interests) of net asset impairments primarily relating to impairments of $160 million ofnon-current assets and $154 million of goodwill at the Veladero mine. We also recorded in the fourth quarter of 2018 an inventory impairment of $166 million at Lagunas Norte, which was included in cost of sales. In the third quarter of 2018, we recorded a $405 million impairment charge resulting from an asset impairment at Lagunas Norte.
IFRS CRITICAL ACCOUNTING POLICIES AND ACCOUNTING ESTIMATES
Management has discussed the development and selection of our critical accounting estimates with the Audit Committee of the Board of Directors, and the Audit Committee has reviewed the disclosure relating to such estimates in conjunction with its review of this MD&A. The accounting policies and methods we utilize determine how we report our financial condition and results of operations, and they may require Management to make estimates or rely on assumptions about matters that are inherently uncertain. The consolidated financial statements are prepared in accordance with IFRS as issued by the International Accounting Standards Board (“IASB”) under the historical cost convention, as modified by revaluation of certain financial assets, derivative contracts and post-retirement assets.
Critical Accounting Estimates and Judgments
Certain accounting estimates have been identified as being “critical” to the presentation of our financial condition and results of operations because they require us to make
subjective and/or complex judgments about matters that are inherently uncertain; or there is a reasonable likelihood that materially different amounts could be reported under different conditions or using different assumptions and estimates.
| BARRICK YEAR-END 2019 | 90 | MANAGEMENT’S DISCUSSION AND ANALYSIS |
NON-GAAP FINANCIAL PERFORMANCE MEASURES
Adjusted Net Earnings and Adjusted Net Earnings per Share
Adjusted net earnings is anon-GAAP financial measure which excludes the following from net earnings:
| • | Impairment charges (reversals) related to intangibles, goodwill, property, plant and equipment, and investments; |
| • | Acquisition/disposition gains/losses; |
| • | Foreign currency translation gains/losses; |
| • | Significant tax adjustments; |
| • | Unrealized gains/losses onnon-hedge derivative instruments; and |
| • | Tax effect andnon-controlling interest of the above items. |
Management uses this measure internally to evaluate our underlying operating performance for the reporting periods presented and to assist with the planning and forecasting of future operating results. Management believes that adjusted net earnings is a useful measure of our performance because impairment charges, acquisition/disposition gains/losses and significant tax adjustments do not reflect the underlying operating performance of our core mining business and are not necessarily indicative of future operating results. Furthermore, foreign currency translation gains/losses and unrealized gains/losses fromnon-hedge derivatives are not necessarily reflective of the underlying operating results for the reporting periods presented. The tax effect andnon-controlling interest of the adjusting items are also excluded
to reconcile the amounts to Barrick’s share on apost-tax basis, consistent with net earnings.
As noted, we use this measure for internal purposes. Management’s internal budgets and forecasts and public guidance do not reflect the types of items we adjust for. Consequently, the presentation of adjusted net earnings enables investors and analysts to better understand the underlying operating performance of our core mining business through the eyes of management. Management periodically evaluates the components of adjusted net earnings based on an internal assessment of performance measures that are useful for evaluating the operating performance of our business segments and a review of thenon-GAAP measures used by mining industry analysts and other mining companies.
Adjusted net earnings is intended to provide additional information only and does not have any standardized definition under IFRS and should not be considered in isolation or as a substitute for measures of performance prepared in accordance with IFRS. The measures are not necessarily indicative of operating profit or cash flow from operations as determined under IFRS. Other companies may calculate these measures differently. The following table reconciles thesenon-GAAP measures to the most directly comparable IFRS measure.
Reconciliation of Net Earnings to Net Earnings per Share, Adjusted Net Earnings and Adjusted Net Earnings per Share
(unaudited)
| ($ millions, except per share amounts in dollars) | For the three months ended | For the years ended | ||||||||||||||||||
| 12/31/19 | 9/30/19 | 12/31/19 | 12/31/18 | 12/31/17 | ||||||||||||||||
Net earnings (loss) attributable to equity holders of the Company | 1,387 | 2,277 | 3,969 | (1,545 | ) | 1,438 | ||||||||||||||
Impairment charges (reversals) related to long-lived assetsa | (566 | ) | (872 | ) | (1,423 | ) | 900 | (212 | ) | |||||||||||
Acquisition/disposition (gains) lossesb | (414 | ) | (1,901 | ) | (2,327 | ) | (68 | ) | (911 | ) | ||||||||||
(Gain) loss on currency translation | 53 | 40 | 109 | 136 | 72 | |||||||||||||||
Significant tax adjustmentsc | 74 | 35 | 34 | 742 | 244 | |||||||||||||||
Other (income) expense adjustmentsd | (845 | ) | 53 | (687 | ) | 366 | 178 | |||||||||||||
Unrealized gains (losses) onnon-hedge derivative instruments | 0 | 1 | 0 | 1 | (1 | ) | ||||||||||||||
Tax effect andnon-controlling intereste | 611 | 631 | 1,227 | (123 | ) | 68 | ||||||||||||||
Adjusted net earnings | 300 | 264 | 902 | 409 | 876 | |||||||||||||||
Net earnings (loss) per sharef | 0.78 | 1.30 | 2.26 | (1.32 | ) | 1.23 | ||||||||||||||
Adjusted net earnings per sharef | 0.17 | 0.15 | 0.51 | 0.35 | 0.75 | |||||||||||||||
| a. | Net impairment reversals for the current year primarily relate tonon-current asset reversals at Pueblo Viejo, partially offset by impairment charges at Pascua-Lama in the fourth quarter of 2019. This was further impacted bynon-current asset reversals at Lumwana in the third quarter of 2019. Net impairment charges for 2018 primarily relate tonon-current asset impairments at Lagunas Norte andnon-current asset and goodwill impairments at Veladero. |
| b. | Acquisition/disposition gains for the current year primarily relate to the gain on the sale of our 50% interest in Kalgoorlie in the fourth quarter of 2019 and the gain on the remeasurement of Turquoise Ridge to fair value as a result of its contribution to Nevada Gold Mines in the third quarter of 2019. |
| c. | Significant tax adjustments in 2018 primarily relate to thede-recognition of our Canadian and Peruvian deferred tax assets. |
| d. | Other expense adjustments for the current year primarily relate to the gain on thede-recognition of the deferred revenue liability relating to our silver sale agreement with Wheaton Precious Metals Corp. and the gain on a tax settlement at Lumwana, both occurring in the fourth quarter of 2019. |
| e. | Tax effect andnon-controlling interest for the current year primarily relates to the impairment charges related to long-lived assets. |
| f. | Calculated using weighted average number of shares outstanding under the basic method of earnings per share. |
Free Cash Flow
Free cash flow is a measure that deducts capital expenditures from net cash provided by operating activities. Management believes this to be a useful indicator of our ability to operate without reliance on additional borrowing or usage of existing cash.
Free cash flow is intended to provide additional information only and does not have any standardized definition under IFRS, and should not be considered in isolation or as a
substitute for measures of performance prepared in accordance with IFRS. The measure is not necessarily indicative of operating profit or cash flow from operations as determined under IFRS. Other companies may calculate this measure differently. The following table reconciles thisnon-GAAP measure to the most directly comparable IFRS measure.
| BARRICK YEAR-END 2019 | 91 | MANAGEMENT’S DISCUSSION AND ANALYSIS |
Reconciliation of Net Cash Provided by Operating Activities to Free Cash Flow
(Unaudited)
| ($ millions) | For the three months ended | For the years ended | ||||||||||||||||||
| 12/31/19 | 9/30/19 | 12/31/19 | 12/31/18 | 12/31/17 | ||||||||||||||||
Net cash provided by operating activities | 875 | 1,004 | 2,833 | 1,765 | 2,065 | |||||||||||||||
Capital expenditures | (446 | ) | (502 | ) | (1,701 | ) | (1,400 | ) | (1,396 | ) | ||||||||||
Free cash flow | 429 | 502 | 1,132 | 365 | 669 | |||||||||||||||
Total cash costs per ounce,All-in sustaining costs per ounce,All-in costs per ounce, C1 cash costs per pound andAll-in sustaining costs per pound
Total cash costs per ounce,all-in sustaining costs per ounce andall-in costs per ounce arenon-GAAP financial measures which are calculated based on the definition published by the World Gold Council (a market development organization for the gold industry comprised of and funded by 25 gold mining companies from around the world, including Barrick). The WGC is not a regulatory organization. Management uses these measures to monitor the performance of our gold mining operations and its ability to generate positive cash flow, both on an individual site basis and an overall company basis.
Total cash costs start with our cost of sales related to gold production and removes depreciation, thenon-controlling interest of cost of sales and includesby-product credits.All-in sustaining costs start with total cash costs and include sustaining capital expenditures, sustaining leases, general and administrative costs, minesite exploration and evaluation costs and reclamation cost accretion and amortization. These additional costs reflect the expenditures made to maintain current production levels.
Starting from the first quarter of 2019, we have renamed “cash costs” to “total cash costs” when referring to our gold operations. The calculation of total cash costs is identical to our previous calculation of cash costs with only a change in the naming convention of thisnon-GAAP measure.
All-in costs starts withall-in sustaining costs and adds additional costs that reflect the varying costs of producing gold over the life-cycle of a mine, including: project capital expenditures (capital expenditures at new projects and discrete projects at existing operations intended to increase production capacity and will not benefit production for at least 12 months) and othernon-sustaining costs (primarilynon-sustaining leases, exploration and evaluation costs, community relations costs and general and administrative costs that are not associated with current operations). These definitions recognize that there are different costs associated with the life-cycle of a mine, and that it is therefore appropriate to distinguish between sustaining andnon-sustaining costs.
Starting from the first quarter of 2019, we have included sustaining capital expenditures and project capital expenditures on a cash basis instead of an accrual basis. As a result of adopting IFRS 16Leases, the full lease amount is included in accrued capital expenditures on initial recognition. We believe that the change in capital expenditures from an accrual basis to a cash basis better reflects the timing of costs associated with our operations. The original World Gold Council (“WGC”) Guidance Note explicitly excluded certain financing activities fromall-in sustaining costs andall-in costs. As a result of the new lease accounting standard, the WGC Guidance Note was updated to include both the principal and interest portion of the cash lease payment in theall-in sustaining costs andall-in cost metrics. We have updated our calculation accordingly. Prior periods have not been restated but would not be materially different.
We believe that our use of total cash costs,all-in sustaining costs andall-in costs will assist analysts, investors and other stakeholders of Barrick in understanding the costs associated with producing gold, understanding the economics of gold mining, assessing our operating performance and also our ability to generate free cash flow from current operations and to generate free cash flow on an overall company basis. Due to the capital-intensive nature of the industry and the long useful lives over which these items are depreciated, there can be a significant timing difference between net earnings calculated in accordance with IFRS and the amount of free cash flow that is being generated by a mine and therefore we believe these measures are usefulnon-GAAP operating metrics and supplement our IFRS disclosures. These measures are not representative of all of our cash expenditures as they do not include income tax payments, interest costs or dividend payments. These measures do not include depreciation or amortization.
Total cash costs per ounce,all-in sustaining costs andall-in costs are intended to provide additional information only and do not have standardized definitions under IFRS and should not be considered in isolation or as a substitute for measures of performance prepared in accordance with IFRS. These measures are not equivalent to net income or cash flow from operations as determined under IFRS. Although the WGC has published a standardized definition, other companies may calculate these measures differently.
In addition to presenting these metrics on aby-product basis, we have calculated these metrics on aco-product basis. Ourco-product metrics remove the impact of other metal sales that are produced as aby-product of our gold production from cost per ounce calculations but does not reflect a reduction in costs for costs associated with other metal sales.
C1 cash costs per pound andall-in sustaining costs per pound arenon-GAAP financial measures related to our copper mine operations. We believe that C1 cash costs per pound enables investors to better understand the performance of our copper operations in comparison to other copper producers who present results on a similar basis. C1 cash costs per pound excludes royalties and production taxes andnon-routine charges as they are not direct production costs.All-in sustaining costs per pound is similar to the goldall-in sustaining costs metric and management uses this to better evaluate the costs of copper production. We believe this measure enables investors to better understand the operating performance of our copper mines as this measure reflects all of the sustaining expenditures incurred in order to produce copper.All-in sustaining costs per pound includes C1 cash costs, sustaining capital expenditures, sustaining leases, general and administrative costs, minesite exploration and evaluation costs, royalties and production taxes, reclamation cost accretion and amortization and write-downs taken on inventory to net realizable value.
| BARRICK YEAR-END 2019 | 92 | MANAGEMENT’S DISCUSSION AND ANALYSIS |
Reconciliation of Gold Cost of Sales to Total cash costs,All-in sustaining costs andAll-in costs, including on a per ounce basis
(Unaudited)
| ($ millions, except per ounce information in dollars) | For the three months ended | For the years ended | ||||||||||||||||||||
| Footnote | 12/31/19 | 9/30/19 | 12/31/19 | 12/31/18 | 12/31/17 | |||||||||||||||||
Cost of sales applicable to gold production | 1,896 | 1,831 | 6,514 | 4,621 | 4,836 | |||||||||||||||||
Depreciation | (549 | ) | (538 | ) | (1,902 | ) | (1,253 | ) | (1,529 | ) | ||||||||||||
Cash cost of sales applicable to equity method investments | 57 | 45 | 226 | 0 | 0 | |||||||||||||||||
By-product credits | (43 | ) | (48 | ) | (138 | ) | (131 | ) | (135 | ) | ||||||||||||
Realized (gains) losses on hedge andnon-hedge derivatives | a | 1 | 1 | 1 | 3 | 23 | ||||||||||||||||
Non-recurring items | b | (22 | ) | (4 | ) | (55 | ) | (172 | ) | 0 | ||||||||||||
Other | c | (37 | ) | (19 | ) | (102 | ) | (87 | ) | (106 | ) | |||||||||||
Non-controlling interests | d | (326 | ) | (339 | ) | (878 | ) | (313 | ) | (299 | ) | |||||||||||
Total cash costs | 977 | 929 | 3,666 | 2,668 | 2,790 | |||||||||||||||||
General & administrative costs | 31 | 68 | 212 | 265 | 248 | |||||||||||||||||
Minesite exploration and evaluation costs | e | 24 | 22 | 69 | 45 | 47 | ||||||||||||||||
Minesite sustaining capital expenditures | f | 394 | 406 | 1,320 | 975 | 1,109 | ||||||||||||||||
Sustaining leases | 4 | 5 | 27 | 0 | 0 | |||||||||||||||||
Rehabilitation - accretion and amortization (operating sites) | g | 7 | 28 | 65 | 81 | 64 | ||||||||||||||||
Non-controlling interest, copper operations and other | h | (135 | ) | (184 | ) | (470 | ) | (374 | ) | (273 | ) | |||||||||||
All-in sustaining costs | 1,302 | 1,274 | 4,889 | 3,660 | 3,985 | |||||||||||||||||
Project exploration and evaluation and project costs | e | 60 | 64 | 273 | 338 | 307 | ||||||||||||||||
Community relations costs not related to current operations | 0 | 1 | 2 | 4 | 4 | |||||||||||||||||
Project capital expenditures | f | 46 | 96 | 370 | 459 | 273 | ||||||||||||||||
Rehabilitation - accretion and amortization(non-operating sites) | g | 3 | 5 | 22 | 33 | 20 | ||||||||||||||||
Non-controlling interest and copper operations and other | h | (28 | ) | (46 | ) | (105 | ) | (21 | ) | (21 | ) | |||||||||||
All-in costs | 1,383 | 1,394 | 5,451 | 4,473 | 4,568 | |||||||||||||||||
Ounces sold - equity basis (000s ounces) | i | 1,413 | 1,318 | 5,467 | 4,544 | 5,302 | ||||||||||||||||
Cost of sales per ounce | j,k | 1,046 | 1,065 | 1,005 | 892 | 794 | ||||||||||||||||
Total cash costs per ounce | k | 692 | 710 | 671 | 588 | 526 | ||||||||||||||||
Total cash costs per ounce (on aco-product basis) | k,l | 712 | 735 | 689 | 607 | 544 | ||||||||||||||||
All-in sustaining costs per ounce | k | 923 | 984 | 894 | 806 | 750 | ||||||||||||||||
All-in sustaining costs per ounce (on aco-product basis) | k,l | 943 | 1,009 | 912 | 825 | 768 | ||||||||||||||||
All-in costs per ounce | k | 976 | 1,074 | 996 | 985 | 860 | ||||||||||||||||
All-in costs per ounce (on aco-product basis) | k,l | 996 | 1,099 | 1,014 | 1,004 | 878 | ||||||||||||||||
| a. | Realized (gains) losses on hedge andnon-hedge derivatives |
Includes realized hedge losses of $nil and $nil for the three months and year ended December 31, 2019, respectively (September 30, 2019: $nil; 2018: $4 million; 2017: $27 million), and realizednon-hedge losses of $1 million and $1 million for the three months and year ended December 31, 2019, respectively (September 30, 2019: $1 million; 2018: gains of $1 million; 2017: gains of $4 million).
| b. | Non-recurring items |
Non-recurring items in 2019 relate to organizational restructuring. These costs are not indicative of our cost of production and have been excluded from the calculation of total cash costs.
| c. | Other |
Other adjustments for the three months and year ended December 31, 2019 include the removal of total cash costs andby-product credits associated with our Pierina mine, Golden Sunlight and Morila starting in the third quarter of 2019, and Lagunas Norte starting in the fourth quarter of 2019, which all are mining incidental ounces as they enter closure, of $35 million and $92 million, respectively (September 30, 2019: $19 million; 2018: $87 million; 2017: $108 million).
| BARRICK YEAR-END 2019 | 93 | MANAGEMENT’S DISCUSSION AND ANALYSIS |
| d. | Non-controlling interests |
Non-controlling interests includenon-controlling interests related to gold production of $477 million and $1,306 million, respectively, for the three months and year ended December 31, 2019 (September 30, 2019: $506 million; 2018: $453 million; 2017: $454 million).Non-controlling interests include Pueblo Viejo and Tanzania until September 30, 2019 (notwithstanding the completion of the Acacia transaction on September 17, 2019, we consolidated our interest in Acacia and recorded anon-controlling interest of 36.1% in the income statement for the entirety of the third quarter of 2019 as a matter of convenience). Starting January 1, 2019, the effective date of the Merger,non-controlling interests also include Loulo-Gounkoto and Tongon and starting July 1, 2019, it also includes Nevada Gold Mines.
| e. | Exploration and evaluation costs |
Exploration, evaluation and project expenses are presented as minesite if it supports current mine operations and project if it relates to future projects. Refer to page 82 of this MD&A.
| f. | Capital expenditures |
Capital expenditures are related to our gold sites only and are presented on a 100% cash basis starting from January 1, 2019 and on a 100% accrued basis for 2018 and 2017. They are split between minesite sustaining and project capital expenditures. Project capital expenditures are distinct projects designed to increase the net present value of the mine and are not related to current production. Significant projects in the current year are stripping at Rangefront declines, Cortez Crossroads, the Goldrush exploration declines, the Deep South Expansion, and construction of the third shaft at Turquoise Ridge. Refer to page 81 of this MD&A.
| g. | Rehabilitation - accretion and amortization |
Includes depreciation on the assets related to rehabilitation provisions of our gold operations and accretion on the rehabilitation provisions of our gold operations, split between operating andnon-operating sites.
| h. | Non-controlling interest and copper operations |
Removes general & administrative costs related tonon-controlling interests and copper based on a percentage allocation of revenue. Also removes exploration, evaluation and project expenses, rehabilitation costs and capital expenditures incurred by our copper sites and thenon-controlling interest of our Tanzania operations until September 30, 2019 (notwithstanding the completion of the Acacia transaction on September 17, 2019, we consolidated our interest in Acacia and recorded anon-controlling interest of 36.1% in the income statement for the entirety of the third quarter of 2019 as a matter of convenience) and Pueblo Viejo and South Arturo (63.1% of South Arturo from July 1, 2019 onwards as a result of its contribution to Nevada Gold Mines). Also removes thenon-controlling interest of our Loulo-Gounkoto and Tongon operating segments commencing January 1, 2019, the effective date of the Merger, and of Nevada Gold Mines starting July 1, 2019. It also includes capital expenditures applicable to equity method investments. Figures remove the impact of Pierina, Golden Sunlight and Morila starting in the third quarter of 2019, and Lagunas Norte starting in the fourth quarter of 2019. The impact is summarized as the following:
| ($ millions) | For the three months ended | For the years ended | ||||||||||||||||||
| Non-controlling interest, copper operations and other | 12/31/19 | 9/30/19 | 12/31/19 | 12/31/18 | 12/31/17 | |||||||||||||||
General & administrative costs | (3 | ) | (22 | ) | (58 | ) | (104 | ) | (21 | ) | ||||||||||
Minesite exploration and evaluation costs | (6 | ) | (9 | ) | (16 | ) | (3 | ) | (12 | ) | ||||||||||
Rehabilitation - accretion and amortization (operating sites) | (1 | ) | (10 | ) | (13 | ) | (6 | ) | (10 | ) | ||||||||||
Minesite sustaining capital expenditures | (125 | ) | (143 | ) | (383 | ) | (261 | ) | (230 | ) | ||||||||||
All-in sustaining costs total | (135 | ) | (184 | ) | (470 | ) | (374 | ) | (273 | ) | ||||||||||
Project exploration and evaluation and project costs | (14 | ) | (12 | ) | (54 | ) | (16 | ) | (17 | ) | ||||||||||
Project capital expenditures | (14 | ) | (34 | ) | (51 | ) | (5 | ) | (4 | ) | ||||||||||
All-in costs total | (28 | ) | (46 | ) | (105 | ) | (21 | ) | (21 | ) | ||||||||||
| i. | Ounces sold - equity basis |
Figures remove the impact of Pierina, Golden Sunlight and Morila starting in the third quarter of 2019, and Lagunas Norte starting in the fourth quarter of 2019, which are mining incidental ounces as the sites enter closure.
| j. | Cost of sales per ounce |
Figures remove the cost of sales impact of Pierina of $14 million and $113 million, respectively, for the three months and year ended December 31, 2019 (September 30, 2019: $28 million; 2018: $116 million; 2017: $174 million); starting in the third quarter of 2019, Golden Sunlight of $nil and $1 million, respectively, for the three months and year ended December 31, 2019 (September 30, 2019: $1 million; 2018: $nil; 2017: $nil) and Morila of $13 million and $23 million, respectively, for the three months and year ended December 31, 2019 (September 30, 2019: $10 million; 2018: $nil; 2017: $nil); and starting in the fourth quarter of 2019, Lagunas Norte of $26 million and $26 million, respectively, for the three months and year ended December 31, 2019 (September 30, 2019: $nil; 2018: $nil; 2017: $nil), which are mining incidental ounces as these sites enter closure. Cost of sales per ounce excludesnon-controlling interest related to gold production. Cost of sales applicable to gold per ounce is calculated using cost of sales on an attributable basis (removing thenon-controlling interest of 40% Pueblo Viejo, 36.1% Tanzania until September 30, 2019 (notwithstanding the completion of the Acacia transaction on September 17, 2019, we consolidated our interest in Acacia and recorded anon-controlling interest of 36.1% in the income statement for the entirety of the third quarter of 2019 as a matter of convenience) and 40% South Arturo from cost of sales (63.1% of South Arturo from July 1, 2019 onwards as a result of its contribution to Nevada Gold Mines)), divided by attributable gold ounces. Thenon-controlling interest of 20% Loulo-Gounkoto and 10.3% of Tongon is also removed from cost of sales and our proportionate share of cost of sales attributable to equity method investments (Kibali and Morila) is included commencing January 1, 2019, the effective date of the Merger. Also removes thenon-controlling interest of 38.5% Nevada Gold Mines from cost of sales from July 1, 2019 onwards.
| k. | Per ounce figures |
Cost of sales per ounce, cash costs per ounce,all-in sustaining costs per ounce andall-in costs per ounce may not calculate based on amounts presented in this table due to rounding.
| l. | Co-product costs per ounce |
Cash costs per ounce,all-in sustaining costs per ounce andall-in costs per ounce presented on aco-product basis remove the impact ofby-product credits of our gold production (net ofnon-controlling interest) calculated as:
| ($ millions) | For the three months ended | For the years ended | ||||||||||||||||||
| 12/31/19 | 9/30/19 | 12/31/19 | 12/31/18 | 12/31/17 | ||||||||||||||||
By-product credits | 43 | 48 | 138 | 131 | 135 | |||||||||||||||
Non-controlling interest | (17 | ) | (16 | ) | (48 | ) | (45 | ) | (30 | ) | ||||||||||
By-product credits (net ofnon-controlling interest) | 26 | 32 | 90 | 86 | 105 | |||||||||||||||
| BARRICK YEAR-END 2019 | 94 | MANAGEMENT’S DISCUSSION AND ANALYSIS |
Reconciliation of Gold Cost of Sales to Total cash costs,All-in sustaining costs andAll-in costs, including on a per ounce basis, by operating segment
(unaudited)
| ($ millions, except per ounce information in dollars) | For the three months ended 12/31/19 | |||||||||||||||||||||||||||||||||||||
| Footnote | Carlina | Cortezb | Turquoise Ridgec | Long Canyond | Phoenixd | Nevada Gold Minese | Hemlo | Pueblo Viejo | Veladero | |||||||||||||||||||||||||||||
Cost of sales applicable to gold production | 436 | 202 | 155 | 55 | 86 | 934 | 87 | 189 | 82 | |||||||||||||||||||||||||||||
Depreciation | (92 | ) | (58 | ) | (55 | ) | (38 | ) | (22 | ) | (265 | ) | (7 | ) | (55 | ) | (29 | ) | ||||||||||||||||||||
By-product credits | 0 | 0 | (1 | ) | 0 | (26 | ) | (27 | ) | 0 | (12 | ) | (3 | ) | ||||||||||||||||||||||||
Non-recurring items | f | (1 | ) | 0 | 0 | 0 | 0 | (1 | ) | (21 | ) | (1 | ) | 0 | ||||||||||||||||||||||||
Other | 0 | 0 | 0 | 0 | 0 | 0 | 0 | 0 | 0 | |||||||||||||||||||||||||||||
Non-controlling interests | (132 | ) | (54 | ) | (38 | ) | (7 | ) | (14 | ) | (245 | ) | 0 | (48 | ) | 0 | ||||||||||||||||||||||
Total cash costs | 211 | 90 | 61 | 10 | 24 | 396 | 59 | 73 | 50 | |||||||||||||||||||||||||||||
General & administrative costs | 0 | 0 | 0 | 0 | 0 | 0 | 0 | 0 | 0 | |||||||||||||||||||||||||||||
Minesite exploration and evaluation costs | g | 8 | 3 | 1 | 3 | 1 | 16 | 0 | 0 | 1 | ||||||||||||||||||||||||||||
Minesite sustaining capital expenditures | h | 92 | 65 | 29 | 17 | 8 | 211 | 15 | 23 | 28 | ||||||||||||||||||||||||||||
Sustaining leases | 0 | 0 | 0 | 0 | 0 | 0 | 1 | 0 | 0 | |||||||||||||||||||||||||||||
Rehabilitation - accretion and amortization (operating sites) | i | 0 | 4 | (1 | ) | (1 | ) | (2 | ) | 0 | 0 | 4 | 1 | |||||||||||||||||||||||||
Non-controlling interests | (45 | ) | (29 | ) | (9 | ) | (7 | ) | (4 | ) | (94 | ) | 0 | (11 | ) | 0 | ||||||||||||||||||||||
All-in sustaining costs | 266 | 133 | 81 | 22 | 27 | 529 | 75 | 89 | 80 | |||||||||||||||||||||||||||||
Project exploration and evaluation and project costs | g | 0 | 0 | 0 | 0 | 0 | 0 | 0 | 6 | 0 | ||||||||||||||||||||||||||||
Project capital expenditures | h | 0 | 6 | 11 | 0 | 0 | 38 | 0 | 0 | 0 | ||||||||||||||||||||||||||||
Non-controlling interests | 0 | (3 | ) | (5 | ) | 0 | 0 | (17 | ) | 0 | (3 | ) | 0 | |||||||||||||||||||||||||
All-in costs | 266 | 136 | 87 | 22 | 27 | 550 | 75 | 92 | 80 | |||||||||||||||||||||||||||||
Ounces sold - equity basis (000s ounces) | 275 | 132 | 99 | 33 | 26 | 565 | 53 | 174 | 70 | |||||||||||||||||||||||||||||
Cost of sales per ounce | j,k | 975 | 945 | 971 | 1,026 | 2,025 | 1,038 | 1,632 | 660 | 1,138 | ||||||||||||||||||||||||||||
Total cash costs per ounce | k | 766 | 681 | 625 | 317 | 902 | 711 | 1,091 | 422 | 710 | ||||||||||||||||||||||||||||
Total cash costs per ounce (on aco-product basis) | k,l | 767 | 684 | 632 | 319 | 1,504 | 760 | 1,094 | 462 | 733 | ||||||||||||||||||||||||||||
All-in sustaining costs per ounce | k | 965 | 1,012 | 800 | 657 | 1,034 | 944 | 1,380 | 517 | 1,142 | ||||||||||||||||||||||||||||
All-in sustaining costs per ounce (on aco-product basis) | k,l | 966 | 1,015 | 807 | 659 | 1,636 | 993 | 1,383 | 557 | 1,165 | ||||||||||||||||||||||||||||
All-in costs per ounce | k | 965 | 1,039 | 863 | 657 | 1,034 | 982 | 1,384 | 525 | 1,142 | ||||||||||||||||||||||||||||
All-in costs per ounce (on aco-product basis) | k,l | 966 | 1,042 | 870 | 659 | 1,636 | 1,031 | 1,387 | 565 | 1,165 | ||||||||||||||||||||||||||||
| BARRICK YEAR-END 2019 | 95 | MANAGEMENT’S DISCUSSION AND ANALYSIS |
| ($ millions, except per ounce information in dollars) | For the three months ended 12/31/19 | |||||||||||||||||||||||||||||||||
| Footnote | Porgera | Kalgoorliem | Loulo- Gounkoto | Kibali | North Maran | Tongon | Bulyanhulun | Buzwagin | ||||||||||||||||||||||||||
Cost of sales applicable to gold production | 75 | 44 | 186 | 106 | 105 | 99 | 12 | 31 | ||||||||||||||||||||||||||
Depreciation | (12 | ) | (6 | ) | (73 | ) | (52 | ) | (35 | ) | (45 | ) | (5 | ) | (2 | ) | ||||||||||||||||||
By-product credits | (1 | ) | (1 | ) | 0 | (1 | ) | (1 | ) | (1 | ) | 0 | 0 | |||||||||||||||||||||
Non-recurring items | f | 0 | 0 | 0 | 0 | 0 | 0 | 0 | 0 | |||||||||||||||||||||||||
Other | 0 | 0 | 0 | 0 | 0 | 0 | 0 | 0 | ||||||||||||||||||||||||||
Non-controlling interests | 0 | 0 | (22 | ) | 0 | 0 | (6 | ) | 0 | 0 | ||||||||||||||||||||||||
Total cash costs | 62 | 37 | 91 | 53 | 69 | 47 | 7 | 29 | ||||||||||||||||||||||||||
General & administrative costs | 0 | 0 | 0 | 0 | 0 | 0 | 0 | 0 | ||||||||||||||||||||||||||
Minesite exploration and evaluation costs | g | 1 | 2 | 5 | 2 | 0 | 1 | 0 | 0 | |||||||||||||||||||||||||
Minesite sustaining capital expenditures | h | 11 | 6 | 46 | 9 | 15 | 3 | 1 | 0 | |||||||||||||||||||||||||
Sustaining leases | 1 | 0 | 0 | 1 | 0 | 1 | 0 | 1 | ||||||||||||||||||||||||||
Rehabilitation - accretion and amortization (operating sites) | i | (1 | ) | 1 | 1 | 0 | 1 | 0 | 0 | 0 | ||||||||||||||||||||||||
Non-controlling interests | 0 | 0 | (11 | ) | 0 | 0 | (1 | ) | 0 | 0 | ||||||||||||||||||||||||
All-in sustaining costs | 74 | 46 | 132 | 65 | 85 | 51 | 8 | 30 | ||||||||||||||||||||||||||
Project exploration and evaluation and project costs | g | 0 | 0 | 0 | 0 | 0 | 0 | 0 | 0 | |||||||||||||||||||||||||
Project capital expenditures | h | 0 | 0 | 1 | 0 | 1 | 0 | 1 | 0 | |||||||||||||||||||||||||
Non-controlling interests | 0 | 0 | 0 | 0 | 0 | 0 | 0 | 0 | ||||||||||||||||||||||||||
All-in costs | 74 | 46 | 133 | 65 | 86 | 51 | 9 | 30 | ||||||||||||||||||||||||||
Ounces sold - equity basis (000s ounces) | 82 | 39 | 144 | 89 | 103 | 59 | 9 | 26 | ||||||||||||||||||||||||||
Cost of sales per ounce | j,k | 909 | 1,127 | 1,037 | 1,205 | 1,021 | 1,476 | 1,293 | 1,235 | |||||||||||||||||||||||||
Total cash costs per ounce | k | 757 | 940 | 631 | 608 | 675 | 803 | 752 | 1,144 | |||||||||||||||||||||||||
Total cash costs per ounce (on aco-product basis) | k,l | 765 | 943 | 631 | 611 | 687 | 805 | 805 | 1,161 | |||||||||||||||||||||||||
All-in sustaining costs per ounce | k | 894 | 1,172 | 917 | 740 | 830 | 867 | 909 | 1,169 | |||||||||||||||||||||||||
All-in sustaining costs per ounce (on aco-product basis) | k,l | 902 | 1,175 | 917 | 743 | 842 | 869 | 962 | 1,186 | |||||||||||||||||||||||||
All-in costs per ounce | k | 894 | 1,172 | 922 | 746 | 840 | 867 | 935 | 1,169 | |||||||||||||||||||||||||
All-in costs per ounce (on aco-product basis) | k,l | 902 | 1,175 | 922 | 749 | 852 | 869 | 988 | 1,186 | |||||||||||||||||||||||||
| BARRICK YEAR-END 2019 | 96 | MANAGEMENT’S DISCUSSION AND ANALYSIS |
| ($ millions, except per ounce information in dollars) | For the three months ended 9/30/19 | |||||||||||||||||||||||||||||||||||||
| Footnote | Carlina | Cortezb | Turquoise Ridgec | Long Canyond | Phoenixd | Nevada Gold Minese | Hemlo | Pueblo Viejo | Veladero | |||||||||||||||||||||||||||||
Cost of sales applicable to gold production | 445 | 170 | 168 | 46 | 68 | 897 | 55 | 181 | 72 | |||||||||||||||||||||||||||||
Depreciation | (101 | ) | (53 | ) | (70 | ) | (32 | ) | (14 | ) | (270 | ) | (6 | ) | (48 | ) | (25 | ) | ||||||||||||||||||||
By-product credits | (1 | ) | (1 | ) | (1 | ) | 0 | (22 | ) | (25 | ) | (1 | ) | (17 | ) | (1 | ) | |||||||||||||||||||||
Non-recurring items | f | 0 | 0 | 0 | 0 | 0 | 0 | (1 | ) | 0 | 0 | |||||||||||||||||||||||||||
Other | 0 | 0 | 0 | 0 | 0 | 0 | 0 | 0 | 0 | |||||||||||||||||||||||||||||
Non-controlling interests | (133 | ) | (45 | ) | (37 | ) | (5 | ) | (13 | ) | (233 | ) | 0 | (48 | ) | 0 | ||||||||||||||||||||||
Total cash costs | 210 | 71 | 60 | 9 | 19 | 369 | 47 | 68 | 46 | |||||||||||||||||||||||||||||
General & administrative costs | 0 | 0 | 0 | 0 | 0 | 0 | 0 | 0 | 0 | |||||||||||||||||||||||||||||
Minesite exploration and evaluation costs | g | 5 | 2 | 2 | 3 | 0 | 12 | 0 | 0 | 1 | ||||||||||||||||||||||||||||
Minesite sustaining capital expenditures | h | 102 | 36 | 27 | 9 | 14 | 188 | 15 | 27 | 19 | ||||||||||||||||||||||||||||
Sustaining leases | 0 | 0 | 1 | 0 | 0 | 1 | 0 | 0 | 1 | |||||||||||||||||||||||||||||
Rehabilitation - accretion and amortization (operating sites) | i | 8 | 4 | 3 | 1 | 4 | 20 | 1 | 3 | 1 | ||||||||||||||||||||||||||||
Non-controlling interests | (48 | ) | (15 | ) | (12 | ) | (5 | ) | (6 | ) | (86 | ) | 0 | (12 | ) | 0 | ||||||||||||||||||||||
All-in sustaining costs | 277 | 98 | 81 | 17 | 31 | 504 | 63 | 86 | 68 | |||||||||||||||||||||||||||||
Project exploration and evaluation and project costs | g | 0 | 0 | 0 | 0 | 0 | 0 | 0 | 0 | 0 | ||||||||||||||||||||||||||||
Project capital expenditures | h | 0 | 49 | 13 | 0 | 0 | 85 | 0 | 0 | 0 | ||||||||||||||||||||||||||||
Non-controlling interests | 0 | (18 | ) | (5 | ) | 0 | 0 | (31 | ) | 0 | 0 | 0 | ||||||||||||||||||||||||||
All-in costs | 277 | 129 | 89 | 17 | 31 | 558 | 63 | 86 | 68 | |||||||||||||||||||||||||||||
Ounces sold - equity basis (000s ounces) | 272 | 126 | 96 | 24 | 19 | 537 | 50 | 136 | 59 | |||||||||||||||||||||||||||||
Cost of sales per ounce | j,k | 1,007 | 829 | 1,077 | 1,170 | 2,186 | 1,027 | 1,083 | 807 | 1,243 | ||||||||||||||||||||||||||||
Total cash costs per ounce | k | 775 | 570 | 622 | 353 | 1,010 | 693 | 953 | 504 | 773 | ||||||||||||||||||||||||||||
Total cash costs per ounce (on aco-product basis) | k,l | 776 | 571 | 622 | 355 | 1,734 | 694 | 956 | 587 | 799 | ||||||||||||||||||||||||||||
All-in sustaining costs per ounce | k | 1,014 | 772 | 840 | 714 | 1,622 | 946 | 1,280 | 631 | 1,142 | ||||||||||||||||||||||||||||
All-in sustaining costs per ounce (on aco-product basis) | k,l | 1,015 | 773 | 840 | 716 | 2,346 | 947 | 1,283 | 714 | 1,168 | ||||||||||||||||||||||||||||
All-in costs per ounce | k | 1,014 | 1,020 | 927 | 714 | 1,622 | 1,048 | 1,280 | 636 | 1,142 | ||||||||||||||||||||||||||||
All-in costs per ounce (on aco-product basis) | k,l | 1,015 | 1,021 | 927 | 716 | 2,346 | 1,049 | 1,283 | 719 | 1,168 | ||||||||||||||||||||||||||||
| BARRICK YEAR-END 2019 | 97 | MANAGEMENT’S DISCUSSION AND ANALYSIS |
| ($ millions, except per ounce information in dollars) | For the three months ended 9/30/19 | |||||||||||||||||||||||||||||||||||||
| Footnote | Porgera | Kalgoorliem | Lagunas Norteo | Loulo- Gounkoto | Kibali | North Maran | Tongon | Bulyanhulun | Buzwagin | |||||||||||||||||||||||||||||
Cost of sales applicable to gold production | 77 | 60 | 54 | 199 | 107 | 52 | 102 | 11 | 35 | |||||||||||||||||||||||||||||
Depreciation | (11 | ) | (10 | ) | (5 | ) | (76 | ) | (57 | ) | (17 | ) | (44 | ) | (5 | ) | (2 | ) | ||||||||||||||||||||
By-product credits | (1 | ) | 0 | (2 | ) | 0 | 0 | (1 | ) | 0 | 0 | 0 | ||||||||||||||||||||||||||
Non-recurring items | f | 0 | 0 | (3 | ) | 0 | 0 | 0 | 0 | 0 | 0 | |||||||||||||||||||||||||||
Other | 0 | 0 | 0 | 0 | 0 | 0 | 0 | 0 | 0 | |||||||||||||||||||||||||||||
Non-controlling interests | 0 | 0 | 0 | (25 | ) | 0 | (13 | ) | (6 | ) | (2 | ) | (12 | ) | ||||||||||||||||||||||||
Total cash costs | 65 | 50 | 44 | 98 | 50 | 21 | 52 | 4 | 21 | |||||||||||||||||||||||||||||
General & administrative costs | 0 | 0 | 0 | 0 | 0 | 0 | 0 | 0 | 0 | |||||||||||||||||||||||||||||
Minesite exploration and evaluation costs | g | 0 | 2 | 1 | 3 | 0 | 0 | 0 | 0 | 0 | ||||||||||||||||||||||||||||
Minesite sustaining capital expenditures | h | 14 | 15 | 0 | 60 | 13 | 14 | 4 | 0 | 0 | ||||||||||||||||||||||||||||
Sustaining leases | 1 | 1 | 0 | 2 | 0 | 0 | 1 | 0 | 0 | |||||||||||||||||||||||||||||
Rehabilitation - accretion and amortization (operating sites) | i | (1 | ) | 0 | 2 | 0 | 0 | 1 | 0 | 0 | 0 | |||||||||||||||||||||||||||
Non-controlling interests | 0 | 0 | 0 | (13 | ) | 0 | (5 | ) | 0 | 0 | 0 | |||||||||||||||||||||||||||
All-in sustaining costs | 79 | 68 | 47 | 150 | 63 | 31 | 57 | 4 | 21 | |||||||||||||||||||||||||||||
Project exploration and evaluation and project costs | g | 0 | 0 | 0 | 0 | 0 | 0 | 0 | 0 | 0 | ||||||||||||||||||||||||||||
Project capital expenditures | h | 0 | 0 | 0 | 1 | 1 | 1 | 0 | 1 | 0 | ||||||||||||||||||||||||||||
Non-controlling interests | 0 | 0 | 0 | (1 | ) | 0 | 0 | 0 | 0 | 0 | ||||||||||||||||||||||||||||
All-in costs | 79 | 68 | 47 | 150 | 64 | 32 | 57 | 5 | 21 | |||||||||||||||||||||||||||||
Ounces sold - equity basis (000s ounces) | 75 | 58 | 33 | 155 | 89 | 36 | 66 | 5 | 18 | |||||||||||||||||||||||||||||
Cost of sales per ounce | j,k | 1,024 | 1,037 | 1,661 | 1,018 | 1,187 | 907 | 1,396 | 1,288 | 1,292 | ||||||||||||||||||||||||||||
Total cash costs per ounce | k | 868 | 856 | 1,327 | 630 | 554 | 603 | 793 | 729 | 1,202 | ||||||||||||||||||||||||||||
Total cash costs per ounce (on aco-product basis) | k,l | 878 | 859 | 1,374 | 630 | 554 | 608 | 795 | 754 | 1,210 | ||||||||||||||||||||||||||||
All-in sustaining costs per ounce | k | 1,053 | 1,170 | 1,422 | 966 | 703 | 850 | 869 | 769 | 1,220 | ||||||||||||||||||||||||||||
All-in sustaining costs per ounce (on aco-product basis) | k,l | 1,063 | 1,173 | 1,469 | 966 | 703 | 855 | 871 | 794 | 1,228 | ||||||||||||||||||||||||||||
All-in costs per ounce | k | 1,053 | 1,170 | 1,422 | 971 | 717 | 886 | 869 | 866 | 1,220 | ||||||||||||||||||||||||||||
All-in costs per ounce (on aco-product basis) | k,l | 1,063 | 1,173 | 1,469 | 971 | 717 | 891 | 871 | 891 | 1,228 | ||||||||||||||||||||||||||||
| BARRICK YEAR-END 2019 | 98 | MANAGEMENT’S DISCUSSION AND ANALYSIS |
| ($ millions, except per ounce information in dollars) | For the year ended 12/31/19 | |||||||||||||||||||||||||||||||||
| Footnote | Carlina | Cortezb | Turquoise Ridgec | Long Canyond | Phoenixd | Nevada Gold Minese | Hemlo | North America | ||||||||||||||||||||||||||
Cost of sales applicable to gold production | 1,310 | 751 | 425 | 101 | 154 | 2,741 | 247 | 2,988 | ||||||||||||||||||||||||||
Depreciation | (312 | ) | (240 | ) | (140 | ) | (70 | ) | (36 | ) | (798 | ) | (27 | ) | (825 | ) | ||||||||||||||||||
By-product credits | (1 | ) | (1 | ) | (2 | ) | 0 | (48 | ) | (52 | ) | (1 | ) | (53 | ) | |||||||||||||||||||
Non-recurring items | f | (10 | ) | 0 | 0 | 0 | 0 | (10 | ) | (23 | ) | (33 | ) | |||||||||||||||||||||
Other | 0 | 0 | 0 | 0 | 0 | 0 | 0 | 0 | ||||||||||||||||||||||||||
Non-controlling interests | (266 | ) | (99 | ) | (75 | ) | (12 | ) | (27 | ) | (479 | ) | 0 | (479 | ) | |||||||||||||||||||
Total cash costs | 721 | 411 | 208 | 19 | 43 | 1,402 | 196 | 1,598 | ||||||||||||||||||||||||||
General & administrative costs | 0 | 0 | 0 | 0 | 0 | 0 | 0 | 0 | ||||||||||||||||||||||||||
Minesite exploration and evaluation costs | g | 17 | 8 | 4 | 6 | 1 | 36 | 1 | 37 | |||||||||||||||||||||||||
Minesite sustaining capital expenditures | h | 307 | 129 | 70 | 26 | 22 | 554 | 47 | 601 | |||||||||||||||||||||||||
Sustaining leases | 0 | 0 | 1 | 0 | 0 | 1 | 1 | 2 | ||||||||||||||||||||||||||
Rehabilitation - accretion and amortization (operating sites) | i | 10 | 16 | 2 | 0 | 2 | 30 | 2 | 32 | |||||||||||||||||||||||||
Non-controlling interests | (102 | ) | (44 | ) | (21 | ) | (12 | ) | (10 | ) | (189 | ) | 0 | (189 | ) | |||||||||||||||||||
All-in sustaining costs | 953 | 520 | 264 | 39 | 58 | 1,834 | 247 | 2,081 | ||||||||||||||||||||||||||
Project exploration and evaluation and project costs | g | 0 | 0 | 0 | 0 | 0 | 0 | 0 | 0 | |||||||||||||||||||||||||
Project capital expenditures | h | 0 | 186 | 45 | 0 | 0 | 295 | 0 | 295 | |||||||||||||||||||||||||
Non-controlling interests | 0 | (21 | ) | (10 | ) | 0 | 0 | (48 | ) | 0 | (48 | ) | ||||||||||||||||||||||
All-in costs | 953 | 685 | 299 | 39 | 58 | 2,081 | 247 | 2,328 | ||||||||||||||||||||||||||
Ounces sold - equity basis (000s ounces) | 967 | 798 | 356 | 57 | 45 | 2,223 | 217 | 2,440 | ||||||||||||||||||||||||||
Cost of sales per ounce | j,k | 1,004 | 762 | 846 | 1,088 | 2,093 | 924 | 1,137 | 943 | |||||||||||||||||||||||||
Total cash costs per ounce | k | 746 | 515 | 585 | 333 | 947 | 634 | 904 | 655 | |||||||||||||||||||||||||
Total cash costs per ounce (on aco-product basis) | k,l | 747 | 516 | 588 | 335 | 1,600 | 657 | 907 | 677 | |||||||||||||||||||||||||
All-in sustaining costs per ounce | k | 984 | 651 | 732 | 681 | 1,282 | 828 | 1,140 | 851 | |||||||||||||||||||||||||
All-in sustaining costs per ounce (on aco-product basis) | k,l | 985 | 652 | 735 | 683 | 1,935 | 851 | 1,143 | 873 | |||||||||||||||||||||||||
All-in costs per ounce | k | 984 | 854 | 834 | 681 | 1,282 | 938 | 1,141 | 953 | |||||||||||||||||||||||||
All-in costs per ounce (on aco-product basis) | k,l | 985 | 855 | 837 | 683 | 1,935 | 961 | 1,144 | 975 | |||||||||||||||||||||||||
| BARRICK YEAR-END 2019 | 99 | MANAGEMENT’S DISCUSSION AND ANALYSIS |
| ($ millions, except per ounce information in dollars) | For the year ended 12/31/19 | |||||||||||||||||||||
| Footnote | Pueblo Viejo | Veladero | Porgera | Kalgoorliem | Latin America & Asia Pacific | |||||||||||||||||
Cost of sales applicable to gold production | 721 | 323 | 284 | 223 | 1,551 | |||||||||||||||||
Depreciation | (196 | ) | (115 | ) | (42 | ) | (38 | ) | (391 | ) | ||||||||||||
By-product credits | (61 | ) | (8 | ) | (3 | ) | (1 | ) | (73 | ) | ||||||||||||
Non-recurring items | f | (2 | ) | (1 | ) | 0 | 0 | (3 | ) | |||||||||||||
Other | 0 | 0 | 0 | 0 | 0 | |||||||||||||||||
Non-controlling interests | (187 | ) | 0 | 0 | 0 | (187 | ) | |||||||||||||||
Total cash costs | 275 | 199 | 239 | 184 | 897 | |||||||||||||||||
General & administrative costs | 0 | 0 | 0 | 0 | 0 | |||||||||||||||||
Minesite exploration and evaluation costs | g | 0 | 3 | 2 | 6 | 11 | ||||||||||||||||
Minesite sustaining capital expenditures | h | 107 | 91 | 45 | 52 | 295 | ||||||||||||||||
Sustaining leases | 0 | 2 | 3 | 4 | 9 | |||||||||||||||||
Rehabilitation - accretion and amortization (operating sites) | i | 10 | 5 | (2 | ) | 3 | 16 | |||||||||||||||
Non-controlling interests | (47 | ) | 0 | 0 | 0 | (47 | ) | |||||||||||||||
All-in sustaining costs | 345 | 300 | 287 | 249 | 1,181 | |||||||||||||||||
Project exploration and evaluation and project costs | g | 8 | 0 | 0 | 0 | 8 | ||||||||||||||||
Project capital expenditures | h | 0 | 15 | 0 | 0 | 15 | ||||||||||||||||
Non-controlling interests | (3 | ) | 0 | 0 | 0 | (3 | ) | |||||||||||||||
All-in costs | 350 | 315 | 287 | 249 | 1,201 | |||||||||||||||||
Ounces sold - equity basis (000s ounces) | 584 | 271 | 285 | 210 | 1,350 | |||||||||||||||||
Cost of sales per ounce | j,k | 747 | 1,188 | 994 | 1,062 | 937 | ||||||||||||||||
Total cash costs per ounce | k | 471 | 734 | 838 | 873 | 664 | ||||||||||||||||
Total cash costs per ounce (on aco-product basis) | k,l | 536 | 759 | 848 | 876 | 716 | ||||||||||||||||
All-in sustaining costs per ounce | k | 592 | 1,105 | 1,003 | 1,183 | 874 | ||||||||||||||||
All-in sustaining costs per ounce (on aco-product basis) | k,l | 657 | 1,130 | 1,013 | 1,186 | 926 | ||||||||||||||||
All-in costs per ounce | k | 600 | 1,162 | 1,003 | 1,183 | 885 | ||||||||||||||||
All-in costs per ounce (on aco-product basis) | k,l | 665 | 1,187 | 1,013 | 1,186 | 937 | ||||||||||||||||
| BARRICK YEAR-END 2019 | 100 | MANAGEMENT’S DISCUSSION AND ANALYSIS |
| ($ millions, except per ounce information in dollars) | For the year ended 12/31/19 | |||||||||||||||||||||||||||||
| Footnote | Loulo- Gounkoto | Kibali | North Maran | Tongon | Bulyanhulun | Buzwagin | Africa & Middle East | |||||||||||||||||||||||
Cost of sales applicable to gold production | 751 | 403 | 310 | 402 | 45 | 138 | 2,049 | |||||||||||||||||||||||
Depreciation | (295 | ) | (196 | ) | (97 | ) | (186 | ) | (19 | ) | (8 | ) | (801 | ) | ||||||||||||||||
By-product credits | 0 | (1 | ) | (2 | ) | (1 | ) | (1 | ) | (1 | ) | (6 | ) | |||||||||||||||||
Non-recurring items | f | 0 | 0 | 0 | 0 | 0 | 0 | 0 | ||||||||||||||||||||||
Other | 0 | 0 | 0 | 0 | 0 | 0 | 0 | |||||||||||||||||||||||
Non-controlling interests | (91 | ) | 0 | (51 | ) | (23 | ) | (7 | ) | (36 | ) | (208 | ) | |||||||||||||||||
Total cash costs | 365 | 206 | 160 | 192 | 18 | 93 | 1,034 | |||||||||||||||||||||||
General & administrative costs | 0 | 0 | 0 | 0 | 0 | 0 | 0 | |||||||||||||||||||||||
Minesite exploration and evaluation costs | g | 12 | 3 | 0 | 3 | 0 | 0 | 18 | ||||||||||||||||||||||
Minesite sustaining capital expenditures | h | 165 | 41 | 48 | 11 | 2 | 0 | 267 | ||||||||||||||||||||||
Sustaining leases | 3 | 1 | 0 | 2 | 0 | 1 | 7 | |||||||||||||||||||||||
Rehabilitation - accretion and amortization (operating sites) | i | 1 | 0 | 3 | 0 | 1 | 1 | 6 | ||||||||||||||||||||||
Non-controlling interests | (37 | ) | 0 | (13 | ) | (2 | ) | (1 | ) | 0 | (53 | ) | ||||||||||||||||||
All-in sustaining costs | 509 | 251 | 198 | 206 | 20 | 95 | 1,279 | |||||||||||||||||||||||
Project exploration and evaluation and project costs | g | 0 | 0 | 0 | 0 | 0 | 0 | 0 | ||||||||||||||||||||||
Project capital expenditures | h | 4 | 2 | 9 | 0 | 3 | 0 | 18 | ||||||||||||||||||||||
Non-controlling interests | (1 | ) | 0 | (3 | ) | 0 | (1 | ) | 0 | (5 | ) | |||||||||||||||||||
All-in costs | 512 | 253 | 204 | 206 | 22 | 95 | 1,292 | |||||||||||||||||||||||
Ounces sold - equity basis (000s ounces) | 575 | 363 | 248 | 245 | 27 | 81 | 1,539 | |||||||||||||||||||||||
Cost of sales per ounce | j,k | 1,044 | 1,111 | 953 | 1,469 | 1,207 | 1,240 | 1,332 | ||||||||||||||||||||||
Total cash costs per ounce | k | 634 | 568 | 646 | 787 | 676 | 1,156 | 673 | ||||||||||||||||||||||
Total cash costs per ounce (on aco-product basis) | k,l | 634 | 571 | 654 | 789 | 709 | 1,166 | 677 | ||||||||||||||||||||||
All-in sustaining costs per ounce | k | 886 | 693 | 802 | 844 | 773 | 1,178 | 834 | ||||||||||||||||||||||
All-in sustaining costs per ounce (on aco-product basis) | k,l | 886 | 696 | 810 | 846 | 806 | 1,188 | 838 | ||||||||||||||||||||||
All-in costs per ounce | k | 891 | 701 | 824 | 846 | 840 | 1,178 | 842 | ||||||||||||||||||||||
All-in costs per ounce (on aco-product basis) | k,l | 891 | 704 | 832 | 848 | 873 | 1,188 | 846 | ||||||||||||||||||||||
| BARRICK YEAR-END 2019 | 101 | MANAGEMENT’S DISCUSSION AND ANALYSIS |
| ($ millions, except per ounce information in dollars) | For the year ended 12/31/18 | |||||||||||||||||||||||||||||||||||||||||
| Footnote | Carlina | Cortezb | Turquoise Ridgec | Long Canyond | Phoenixd | Nevada Gold Minese | Hemlo | Golden Sunlighto | Pueblo Viejo | Veladero | ||||||||||||||||||||||||||||||||
Cost of sales applicable to gold production | 886 | 828 | 206 | 1,921 | 195 | 53 | 732 | 310 | ||||||||||||||||||||||||||||||||||
Depreciation | (262 | ) | (386 | ) | (28 | ) | (677 | ) | (18 | ) | 0 | (185 | ) | (121 | ) | |||||||||||||||||||||||||||
By-product credits | (1 | ) | (1 | ) | 0 | (2 | ) | (1 | ) | 0 | (90 | ) | (8 | ) | ||||||||||||||||||||||||||||
Non-recurring items | f | 0 | 0 | 0 | 0 | 0 | 0 | (2 | ) | (4 | ) | |||||||||||||||||||||||||||||||
Other | 0 | 0 | 0 | 0 | 0 | 0 | 2 | 0 | ||||||||||||||||||||||||||||||||||
Non-controlling interests | 0 | 0 | 0 | 0 | 0 | 0 | (183 | ) | 0 | |||||||||||||||||||||||||||||||||
Total cash costs | 623 | 441 | 178 | 1,242 | 176 | 53 | 274 | 177 | ||||||||||||||||||||||||||||||||||
General & administrative costs | 0 | 0 | 0 | 0 | 0 | 0 | 0 | 0 | ||||||||||||||||||||||||||||||||||
Minesite exploration and evaluation costs | g | 13 | 6 | 0 | 19 | 0 | 0 | 0 | 2 | |||||||||||||||||||||||||||||||||
Minesite sustaining capital expenditures | h | 195 | 65 | 20 | 280 | 42 | 3 | 145 | 143 | |||||||||||||||||||||||||||||||||
Sustaining leases | 0 | 0 | 0 | 0 | 0 | 0 | 0 | 0 | ||||||||||||||||||||||||||||||||||
Rehabilitation - accretion and amortization (operating sites) | i | 5 | 25 | 1 | 31 | 4 | 3 | 10 | 1 | |||||||||||||||||||||||||||||||||
Non-controlling interests | (10 | ) | 0 | 0 | (10 | ) | 0 | 0 | (62 | ) | 0 | |||||||||||||||||||||||||||||||
All-in sustaining costs | 826 | 537 | 199 | 1,562 | 222 | 59 | 367 | 323 | ||||||||||||||||||||||||||||||||||
Project exploration and evaluation and project costs | g | 0 | 0 | 0 | 6 | 0 | 0 | 0 | 0 | |||||||||||||||||||||||||||||||||
Project capital expenditures | h | 0 | 276 | 42 | 354 | 0 | 0 | 0 | 0 | |||||||||||||||||||||||||||||||||
Non-controlling interests | 0 | 0 | 0 | 0 | 0 | 0 | 0 | 0 | ||||||||||||||||||||||||||||||||||
All-in costs | 826 | 813 | 241 | 1,922 | 222 | 59 | 367 | 323 | ||||||||||||||||||||||||||||||||||
Ounces sold - equity basis (000s ounces) | 842 | 1,255 | 262 | 2,359 | 168 | 30 | 590 | 280 | ||||||||||||||||||||||||||||||||||
Cost of sales per ounce | j,k | 1,054 | 659 | 783 | 814 | 1,157 | 1,755 | 750 | 1,112 | |||||||||||||||||||||||||||||||||
Total cash costs per ounce | k | 740 | 351 | 678 | 526 | 1,046 | 1,762 | 465 | 629 | |||||||||||||||||||||||||||||||||
Total cash costs per ounce (on aco-product basis) | k,l | 742 | 352 | 678 | 527 | 1,050 | 1,772 | 553 | 654 | |||||||||||||||||||||||||||||||||
All-in sustaining costs per ounce | k | 983 | 430 | 756 | 664 | 1,318 | 1,954 | 623 | 1,154 | |||||||||||||||||||||||||||||||||
All-in sustaining costs per ounce (on aco-product basis) | k,l | 985 | 431 | 756 | 665 | 1,322 | 1,964 | 711 | 1,179 | |||||||||||||||||||||||||||||||||
All-in costs per ounce | k | 983 | 649 | 916 | 814 | 1,320 | 1,954 | 623 | 1,154 | |||||||||||||||||||||||||||||||||
All-in costs per ounce (on aco-product basis) | k,l | 985 | 650 | 916 | 815 | 1,324 | 1,964 | 711 | 1,179 | |||||||||||||||||||||||||||||||||
| BARRICK YEAR-END 2019 | 102 | MANAGEMENT’S DISCUSSION AND ANALYSIS |
| ($ millions, except per ounce information in dollars) | For the year ended 12/31/18 | |||||||||||||||||||||||||||||||||||||||||
| Footnote | Porgera | Kalgoorlie | Lagunas Norteo | Loulo- Gounkotop | Kibalip | North Maran | Tongonp | Bulyanhulun | Buzwagin | Morilao,p | ||||||||||||||||||||||||||||||||
Cost of sales applicable to gold production | 213 | 288 | 337 | 264 | 53 | 139 | ||||||||||||||||||||||||||||||||||||
Depreciation | (42 | ) | (52 | ) | (46 | ) | (62 | ) | (24 | ) | (3 | ) | ||||||||||||||||||||||||||||||
By-product credits | (2 | ) | (2 | ) | (13 | ) | (2 | ) | (1 | ) | (1 | ) | ||||||||||||||||||||||||||||||
Non-recurring items | f | 0 | 0 | (166 | ) | 0 | 0 | 0 | ||||||||||||||||||||||||||||||||||
Other | 0 | 0 | 0 | 0 | 0 | 0 | ||||||||||||||||||||||||||||||||||||
Non-controlling interests | 0 | 0 | 0 | (72 | ) | (10 | ) | (49 | ) | |||||||||||||||||||||||||||||||||
Total cash costs | 169 | 234 | 112 | 128 | 18 | 86 | ||||||||||||||||||||||||||||||||||||
General & administrative costs | 0 | 0 | 0 | 0 | 0 | 0 | ||||||||||||||||||||||||||||||||||||
Minesite exploration and evaluation costs | g | 0 | 10 | 2 | 0 | 0 | 0 | |||||||||||||||||||||||||||||||||||
Minesite sustaining capital expenditures | h | 62 | 26 | 20 | 74 | 3 | 4 | |||||||||||||||||||||||||||||||||||
Sustaining leases | 0 | 0 | 0 | 0 | 0 | 0 | ||||||||||||||||||||||||||||||||||||
Rehabilitation - accretion and amortization (operating sites) | i | (1 | ) | 4 | 25 | 2 | 1 | 1 | ||||||||||||||||||||||||||||||||||
Non-controlling interests | 0 | 0 | 0 | (27 | ) | (1 | ) | (2 | ) | |||||||||||||||||||||||||||||||||
All-in sustaining costs | 230 | 274 | 159 | 177 | 21 | 89 | ||||||||||||||||||||||||||||||||||||
Project exploration and evaluation and project costs | g | 0 | 0 | 0 | 0 | 0 | 0 | |||||||||||||||||||||||||||||||||||
Project capital expenditures | h | 0 | 0 | 2 | 8 | 4 | 0 | |||||||||||||||||||||||||||||||||||
Non-controlling interests | 0 | 0 | 0 | (3 | ) | (1 | ) | 0 | ||||||||||||||||||||||||||||||||||
All-in costs | 230 | 274 | 161 | 182 | 24 | 89 | ||||||||||||||||||||||||||||||||||||
Ounces sold - equity basis (000s ounces) | 213 | 320 | 251 | 212 | 27 | 94 | ||||||||||||||||||||||||||||||||||||
Cost of sales per ounce | j,k | 996 | 899 | 1,342 | 795 | 1,231 | 939 | |||||||||||||||||||||||||||||||||||
Total cash costs per ounce | k | 796 | 732 | 448 | 603 | 650 | 916 | |||||||||||||||||||||||||||||||||||
Total cash costs per ounce (on aco-product basis) | k,l | 810 | 737 | 499 | 609 | 674 | 922 | |||||||||||||||||||||||||||||||||||
All-in sustaining costs per ounce | k | 1,083 | 857 | 636 | 830 | 754 | 947 | |||||||||||||||||||||||||||||||||||
All-in sustaining costs per ounce (on aco-product basis) | k,l | 1,097 | 862 | 687 | 836 | 778 | 953 | |||||||||||||||||||||||||||||||||||
All-in costs per ounce | k | 1,083 | 857 | 644 | 855 | 848 | 947 | |||||||||||||||||||||||||||||||||||
All-in costs per ounce (on aco-product basis) | k,l | 1,097 | 862 | 695 | 861 | 872 | 953 | |||||||||||||||||||||||||||||||||||
| BARRICK YEAR-END 2019 | 103 | MANAGEMENT’S DISCUSSION AND ANALYSIS |
| ($ millions, except per ounce information in dollars) | For the year ended 12/31/17 | |||||||||||||||||||||||||||||||||||||||||
| Footnote | Carlina | Cortezb | Turquoise Ridgec | Long Canyond | Phoenixd | Nevada Gold Minese | Hemlo | Golden Sunlighto | Pueblo Viejo | Veladeroq | ||||||||||||||||||||||||||||||||
Cost of sales applicable to gold production | 889 | 980 | 159 | 2,028 | 193 | 55 | 730 | 410 | ||||||||||||||||||||||||||||||||||
Depreciation | (260 | ) | (533 | ) | (28 | ) | (821 | ) | (27 | ) | (3 | ) | (229 | ) | (119 | ) | ||||||||||||||||||||||||||
By-product credits | (2 | ) | (1 | ) | 0 | (3 | ) | (1 | ) | 0 | (72 | ) | (17 | ) | ||||||||||||||||||||||||||||
Non-recurring items | f | 0 | 0 | 0 | 0 | 0 | 0 | 0 | 0 | |||||||||||||||||||||||||||||||||
Other | 0 | 0 | 0 | 0 | 0 | 0 | 0 | 0 | ||||||||||||||||||||||||||||||||||
Non-controlling interests | (1 | ) | 0 | 0 | (1 | ) | 0 | 0 | (171 | ) | 0 | |||||||||||||||||||||||||||||||
Total cash costs | 626 | 446 | 131 | 1,203 | 165 | 52 | 258 | 274 | ||||||||||||||||||||||||||||||||||
General & administrative costs | 0 | 0 | 0 | 0 | 0 | 0 | 0 | 0 | ||||||||||||||||||||||||||||||||||
Minesite exploration and evaluation costs | g | 10 | 6 | 0 | 16 | 0 | 0 | 0 | 3 | |||||||||||||||||||||||||||||||||
Minesite sustaining capital expenditures | h | 264 | 96 | 32 | 392 | 44 | 0 | 114 | 173 | |||||||||||||||||||||||||||||||||
Sustaining leases | 0 | 0 | 0 | 0 | 0 | 0 | 0 | 0 | ||||||||||||||||||||||||||||||||||
Rehabilitation - accretion and amortization (operating sites) | i | 10 | 15 | 1 | 26 | 5 | 2 | 13 | 2 | |||||||||||||||||||||||||||||||||
Non-controlling interests | (3 | ) | 0 | 0 | (3 | ) | 0 | 0 | (51 | ) | 0 | |||||||||||||||||||||||||||||||
All-in sustaining costs | 907 | 563 | 164 | 1,634 | 214 | 54 | 334 | 452 | ||||||||||||||||||||||||||||||||||
Project exploration and evaluation and project costs | g | 0 | 0 | 0 | 8 | 0 | 0 | 0 | 0 | |||||||||||||||||||||||||||||||||
Project capital expenditures | h | 0 | 198 | 4 | 228 | 5 | 1 | 0 | 0 | |||||||||||||||||||||||||||||||||
Non-controlling interests | 0 | 0 | 0 | 0 | 0 | 0 | 0 | 0 | ||||||||||||||||||||||||||||||||||
All-in costs | 907 | 761 | 168 | 1,870 | 219 | 55 | 334 | 452 | ||||||||||||||||||||||||||||||||||
Ounces sold - equity basis (000s ounces) | 868 | 1,489 | 222 | 2,579 | 196 | 41 | 637 | 458 | ||||||||||||||||||||||||||||||||||
Cost of sales per ounce | j,k | 1,024 | 657 | 715 | 786 | 986 | 1,334 | 699 | 897 | |||||||||||||||||||||||||||||||||
Total cash costs per ounce | k | 721 | 300 | 589 | 467 | 841 | 1,265 | 405 | 598 | |||||||||||||||||||||||||||||||||
Total cash costs per ounce (on aco-product basis) | k,l | 723 | 301 | 589 | 468 | 846 | 1,270 | 475 | 636 | |||||||||||||||||||||||||||||||||
All-in sustaining costs per ounce | k | 1,045 | 380 | 733 | 634 | 1,092 | 1,329 | 525 | 987 | |||||||||||||||||||||||||||||||||
All-in sustaining costs per ounce (on aco-product basis) | k,l | 1,047 | 381 | 733 | 635 | 1,097 | 1,334 | 595 | 1,025 | |||||||||||||||||||||||||||||||||
All-in costs per ounce | k | 1,045 | 512 | 753 | 726 | 1,119 | 1,349 | 525 | 987 | |||||||||||||||||||||||||||||||||
All-in costs per ounce (on aco-product basis) | k,l | 1,047 | 513 | 753 | 727 | 1,124 | 1,354 | 595 | 1,025 | |||||||||||||||||||||||||||||||||
| BARRICK YEAR-END 2019 | 104 | MANAGEMENT’S DISCUSSION AND ANALYSIS |
| ($ millions, except per ounce information in dollars) | For the year ended 12/31/17 | |||||||||||||||||||||||||||||||||||||||||
| Footnote | Porgera | Kalgoorlie | Lagunas Norteo | Loulo- Gounkotop | Kibalip | North Maran | Tongonp | Bulyanhulun | Buzwagin | Morilao,p | ||||||||||||||||||||||||||||||||
Cost of sales applicable to gold production | 239 | 292 | 245 | 223 | 142 | 104 | ||||||||||||||||||||||||||||||||||||
Depreciation | (39 | ) | (58 | ) | (68 | ) | (56 | ) | (47 | ) | (4 | ) | ||||||||||||||||||||||||||||||
By-product credits | (3 | ) | (2 | ) | (16 | ) | (1 | ) | (3 | ) | (3 | ) | ||||||||||||||||||||||||||||||
Non-recurring items | f | 0 | 0 | 0 | 0 | 0 | 0 | |||||||||||||||||||||||||||||||||||
Other | 0 | 0 | 0 | 0 | 1 | 0 | ||||||||||||||||||||||||||||||||||||
Non-controlling interests | 0 | 0 | 0 | (60 | ) | (33 | ) | (34 | ) | |||||||||||||||||||||||||||||||||
Total cash costs | 197 | 232 | 161 | 106 | 60 | 63 | ||||||||||||||||||||||||||||||||||||
General & administrative costs | 0 | 0 | 0 | 0 | 0 | 0 | ||||||||||||||||||||||||||||||||||||
Minesite exploration and evaluation costs | g | 1 | 9 | 4 | 0 | 0 | 0 | |||||||||||||||||||||||||||||||||||
Minesite sustaining capital expenditures | h | 55 | 20 | 20 | 83 | 49 | 5 | |||||||||||||||||||||||||||||||||||
Sustaining leases | 0 | 0 | 0 | 0 | 0 | 0 | ||||||||||||||||||||||||||||||||||||
Rehabilitation - accretion and amortization (operating sites) | i | (2 | ) | 3 | 7 | 3 | 2 | 1 | ||||||||||||||||||||||||||||||||||
Non-controlling interests | 0 | 0 | 0 | (31 | ) | (18 | ) | (2 | ) | |||||||||||||||||||||||||||||||||
All-in sustaining costs | 251 | 264 | 192 | 161 | 93 | 67 | ||||||||||||||||||||||||||||||||||||
Project exploration and evaluation and project costs | g | 0 | 0 | 0 | 0 | 0 | 0 | |||||||||||||||||||||||||||||||||||
Project capital expenditures | h | 0 | 0 | 5 | 10 | 1 | 0 | |||||||||||||||||||||||||||||||||||
Non-controlling interests | 0 | 0 | 0 | (4 | ) | 0 | 0 | |||||||||||||||||||||||||||||||||||
All-in costs | 251 | 264 | 197 | 167 | 94 | 67 | ||||||||||||||||||||||||||||||||||||
Ounces sold - equity basis (000s ounces) | 253 | 362 | 397 | 207 | 69 | 103 | ||||||||||||||||||||||||||||||||||||
Cost of sales per ounce | j,k | 944 | 806 | 617 | 683 | 1,309 | 643 | |||||||||||||||||||||||||||||||||||
Total cash costs per ounce | k | 781 | 642 | 405 | 509 | 848 | 600 | |||||||||||||||||||||||||||||||||||
Total cash costs per ounce (on aco-product basis) | k,l | 791 | 647 | 446 | 513 | 872 | 616 | |||||||||||||||||||||||||||||||||||
All-in sustaining costs per ounce | k | 993 | 729 | 483 | 773 | 1,319 | 632 | |||||||||||||||||||||||||||||||||||
All-in sustaining costs per ounce (on aco-product basis) | k,l | 1,003 | 734 | 524 | 777 | 1,343 | 648 | |||||||||||||||||||||||||||||||||||
All-in costs per ounce | k | 993 | 729 | 497 | 804 | 1,330 | 632 | |||||||||||||||||||||||||||||||||||
All-in costs per ounce (on aco-product basis) | k,l | 1,003 | 734 | 538 | 808 | 1,354 | 648 | |||||||||||||||||||||||||||||||||||
| a. | On July 1, 2019, Barrick’s Goldstrike and Newmont’s Carlin were contributed to Nevada Gold Mines and are now referred to as Carlin. As a result, the amounts presented represent Goldstrike on a 100% basis (including our 60% share of South Arturo) up until June 30, 2019, and the combined results of Carlin and Goldstrike (including our 60% share of South Arturo) on a 61.5% basis thereafter. |
| b. | On July 1, 2019, Cortez was contributed to Nevada Gold Mines, a joint venture with Newmont. As a result, the amounts presented are on a 100% basis up until June 30, 2019, and on a 61.5% basis thereafter. |
| c. | Barrick owned 75% of Turquoise Ridge through to the end of the second quarter of 2019, with our joint venture partner, Newmont, owning the remaining 25%. Turquoise Ridge was proportionately consolidated on the basis that the joint venture partners that have joint control have rights to the assets and obligations for the liabilities relating to the arrangement. The figures presented in this table are based on our 75% interest in Turquoise Ridge until June 30, 2019. On July 1, 2019, Barrick’s 75% interest in Turquoise Ridge and Newmont’s Twin Creeks and 25% interest in Turquoise Ridge were contributed to Nevada Gold Mines. Starting July 1, 2019, the results represent our 61.5% share of Turquoise Ridge and Twin Creeks, now referred to as Turquoise Ridge. |
| d. | These sites were acquired as a result of the formation of Nevada Gold Mines on July 1, 2019. The results for 2018 and 2017 did not form a part of the Barrick consolidated results as these sites were acquired as a result of the formation of Nevada Gold Mines. Therefore, no comparative figures are provided. |
| BARRICK YEAR-END 2019 | 105 | MANAGEMENT’S DISCUSSION AND ANALYSIS |
| e. | Represents the combined results of Cortez, Goldstrike (including our 60% share of South Arturo) and our 75% interest in Turquoise Ridge until June 30, 2019. Commencing July 1, 2019, the date Nevada Gold Mines was established, the results represent our 61.5% interest in Cortez, Carlin (including Goldstrike and 60% of South Arturo), Turquoise Ridge (including Twin Creeks), Phoenix and Long Canyon. |
| f. | Non-recurring items |
Non-recurring items in 2019 relate to organizational restructuring. These costs are not indicative of our cost of production and have been excluded from the calculation of total cash costs.
| g. | Exploration and evaluation costs |
Exploration, evaluation and project expenses are presented as minesite sustaining if it supports current mine operations and project if it relates to future projects. Refer to page 82 of this MD&A.
| h. | Capital expenditures |
Capital expenditures are related to our gold sites only and are presented on a 100% cash basis starting from January 1, 2019 and on a 100% accrued basis for 2018 and 2017. They are split between minesite sustaining and project capital expenditures. Project capital expenditures are distinct projects designed to increase the net present value of the mine and are not related to current production. Significant projects in the current year are stripping at Rangefront declines, Cortez Crossroads, the Goldrush exploration declines, the Deep South Expansion, and construction of the third shaft at Turquoise Ridge. Refer to page 81 of this MD&A.
| i. | Rehabilitation - accretion and amortization |
Includes depreciation on the assets related to rehabilitation provisions of our gold operations and accretion on the rehabilitation provision of our gold operations, split between operating andnon-operating sites.
| j. | Cost of sales per ounce |
Cost of sales applicable to gold per ounce is calculated using cost of sales on an attributable basis (removing thenon-controlling interest of 40% Pueblo Viejo, 36.1% Tanzania until September 30, 2019 (notwithstanding the completion of the Acacia transaction on September 17, 2019, we consolidated our interest in Acacia and recorded anon-controlling interest of 36.1% in the income statement for the entirety of the third quarter of 2019 as a matter of convenience) and 40% South Arturo from cost of sales (63.1% of South Arturo from July 1, 2019 onwards as a result of its contribution to Nevada Gold Mines)), divided by attributable gold ounces. Thenon-controlling interest of 20% Loulo-Gounkoto and 10.3% of Tongon is also removed from cost of sales and our proportionate share of cost of sales attributable to equity method investments (Kibali and Morila) is included commencing January 1, 2019, the effective date of the Merger. Also removes thenon-controlling interest of 38.5% Nevada Gold Mines from cost of sales from July 1, 2019 onwards.
| k. | Per ounce figures |
Cost of sales per ounce, total cash costs per ounce,all-in sustaining costs per ounce andall-in costs per ounce may not calculate based on amounts presented in this table due to rounding.
| l. | Co-product costs per ounce |
Total cash costs per ounce,all-in sustaining costs per ounce andall-in costs per ounce presented on aco-product basis removes the impact ofby-product credits of our gold production (net ofnon-controlling interest) calculated as:
| ($ millions) | For the three months ended 12/31/19 | |||||||||||||||||||||||||||||||||||
| Carlina | Cortezb | Turquoise Ridgec | Long Canyond | Phoenixd | Nevada Gold Minese | Hemlo | Pueblo Viejo | Veladero | ||||||||||||||||||||||||||||
By-product credits | 0 | 0 | 1 | 0 | 26 | 27 | 0 | 12 | 3 | |||||||||||||||||||||||||||
Non-controlling interest | 0 | 0 | (1 | ) | 0 | (9 | ) | (10 | ) | 0 | (6 | ) | 0 | |||||||||||||||||||||||
By-product credits (net ofnon-controlling interest) | 0 | 0 | 0 | 0 | 17 | 17 | 0 | 6 | 3 | |||||||||||||||||||||||||||
($ millions) | For the three months ended 12/31/19 | |||||||||||||||||||||||||||||||||||
| Porgera | Kalgoorliem | Loulo- Gounkoto | Kibali | North Maran | Tongon | Bulyanhulun | Buzwagin | |||||||||||||||||||||||||||||
By-product credits | 1 | 1 | 0 | 1 | 1 | 1 | 0 | 0 | ||||||||||||||||||||||||||||
Non-controlling interest | 0 | 0 | 0 | 0 | 0 | 0 | 0 | 0 | ||||||||||||||||||||||||||||
By-product credits (net ofnon-controlling interest) | 1 | 1 | 0 | 1 | 1 | 1 | 0 | 0 | ||||||||||||||||||||||||||||
($ millions) | For the three months ended 9/30/19 | |||||||||||||||||||||||||||||||||||
| Carlina | Cortezb | Turquoise Ridgec | Long Canyond | Phoenixd | Nevada Gold Minese | Hemlo | Pueblo Viejo | Veladero | ||||||||||||||||||||||||||||
By-product credits | 1 | 1 | 1 | 0 | 22 | 25 | 1 | 17 | 1 | |||||||||||||||||||||||||||
Non-controlling interest | 0 | 0 | 0 | 0 | (9 | ) | (9 | ) | 0 | (6 | ) | 0 | ||||||||||||||||||||||||
By-product credits (net ofnon-controlling interest) | 1 | 1 | 1 | 0 | 13 | 16 | 1 | 11 | 1 | |||||||||||||||||||||||||||
($ millions) | For the three months ended 9/30/19 | |||||||||||||||||||||||||||||||||||
| Porgera | Kalgoorliem | Lagunas Norteo | Loulo- Gounkoto | Kibali | North Maran | Tongon | Bulyanhulun | Buzwagin | ||||||||||||||||||||||||||||
By-product credits | 1 | 0 | 2 | 0 | 0 | 1 | 0 | 0 | 0 | |||||||||||||||||||||||||||
Non-controlling interest | 0 | 0 | 0 | 0 | 0 | 0 | 0 | 0 | 0 | |||||||||||||||||||||||||||
By-product credits (net ofnon-controlling interest) | 1 | 0 | 2 | 0 | 0 | 1 | 0 | 0 | 0 | |||||||||||||||||||||||||||
| BARRICK YEAR-END 2019 | 106 | MANAGEMENT’S DISCUSSION AND ANALYSIS |
| For the year ended 12/31/19 | ||||||||||||||||||||||||||||||||||||
| Carlina | Cortezb | Turquoise Ridgec | Long Canyond | Phoenixd | Nevada Gold Minese | Hemlo | Pueblo Viejo | Veladero | ||||||||||||||||||||||||||||
By-product credits | 1 | 1 | 2 | 0 | 48 | 52 | 1 | 61 | 8 | |||||||||||||||||||||||||||
Non-controlling interest | 0 | 0 | (1 | ) | 0 | (18 | ) | (19 | ) | 0 | (24 | ) | 0 | |||||||||||||||||||||||
By-product credits (net ofnon-controlling interest) | 1 | 1 | 1 | 0 | 30 | 33 | 1 | 37 | 8 | |||||||||||||||||||||||||||
| For the year ended 12/31/19 | ||||||||||||||||||||||||||||||||||||
| Porgera | Kalgoorliem | Loulo- Gounkoto | Kibali | North Maran | Tongon | Bulyanhulun | Buzwagin | |||||||||||||||||||||||||||||
By-product credits | 3 | 1 | 0 | 1 | 2 | 1 | 1 | 1 | ||||||||||||||||||||||||||||
Non-controlling interest | 0 | 0 | 0 | 0 | 0 | 0 | 0 | 0 | ||||||||||||||||||||||||||||
By-product credits (net ofnon-controlling interest) | 3 | 1 | 0 | 1 | 2 | 1 | 1 | 1 | ||||||||||||||||||||||||||||
| For the year ended 12/31/18 | ||||||||||||||||||||||||||||||||||||||||
| Carlina | Cortezb | Turquoise Ridgec | Long Canyond | Phoenixd | Nevada Gold Minese | Hemlo | Golden Sunlighto | Pueblo Viejo | Veladero | |||||||||||||||||||||||||||||||
By-product credits | 1 | 1 | 0 | 2 | 1 | 0 | 90 | 8 | ||||||||||||||||||||||||||||||||
Non-controlling interest | 0 | 0 | 0 | 0 | 0 | 0 | (37) | 0 | ||||||||||||||||||||||||||||||||
By-product credits (net ofnon-controlling interest) | 1 | 1 | 0 | 2 | 1 | 0 | 53 | 8 | ||||||||||||||||||||||||||||||||
| For the year ended 12/31/18 | ||||||||||||||||||||||||||||||||||||||||
| Porgera | Kalgoorlie | Lagunas Norteo | Loulo- Gounkotop | Kibalip | North Maran | Tongonp | Bulyanhulun | Buzwagin | Morilao,p | |||||||||||||||||||||||||||||||
By-product credits | 2 | 2 | 13 | 2 | 1 | 1 | ||||||||||||||||||||||||||||||||||
Non-controlling interest | 0 | 0 | 0 | (1) | 0 | 0 | ||||||||||||||||||||||||||||||||||
By-product credits (net ofnon-controlling interest) | 2 | 2 | 13 | 1 | 1 | 1 | ||||||||||||||||||||||||||||||||||
| For the year ended 12/31/17 | ||||||||||||||||||||||||||||||||||||||||
| Carlina | Cortezb | Turquoise Ridgec | Long Canyond | Phoenixd | Nevada Gold Minese | Hemlo | Golden Sunlighto | Pueblo Viejo | Veladeroq | |||||||||||||||||||||||||||||||
By-product credits | 2 | 1 | 0 | 3 | 1 | 0 | 72 | 17 | ||||||||||||||||||||||||||||||||
Non-controlling interest | 0 | 0 | 0 | 0 | 0 | 0 | 0 | 0 | ||||||||||||||||||||||||||||||||
By-product credits (net ofnon-controlling interest) | 2 | 1 | 0 | 3 | 1 | 0 | 72 | 17 | ||||||||||||||||||||||||||||||||
| For the year ended 12/31/17 | ||||||||||||||||||||||||||||||||||||||||
| Porgera | Kalgoorlie | | Lagunas Norte | o | | Loulo Gounkoto | - p | Kibali | p | North Mara | n | Tongon | p | Bulyanhulu | n | Buzwagi | n | Morila | o,p | |||||||||||||||||||||
By-product credits | 3 | 2 | 16 | 1 | 3 | 3 | ||||||||||||||||||||||||||||||||||
Non-controlling interest | 0 | 0 | 0 | 0 | (1) | (2) | ||||||||||||||||||||||||||||||||||
By-product credits (net ofnon-controlling interest) | 3 | 2 | 16 | 1 | 2 | 1 | ||||||||||||||||||||||||||||||||||
| m. | On November 28, 2019, we completed the sale of our 50% interest in Kalgoorlie in Western Australia to Saracen Mineral Holdings Limited for total cash consideration of $750 million. The transaction resulted in a gain of $408 million for the year ended December 31, 2019. The operating results reported for Kalgoorlie reflect the Company’s attributable share of Kalgoorlie’s results until the date of disposal. |
| n. | Formerly part of Acacia Mining plc. On September 17, 2019, Barrick acquired all of the shares of Acacia it did not own. The results are on a 63.9% basis until September 30, 2019 and on a 100% basis from October 1, 2019 onwards. |
| o. | With the end of mining at Lagunas Norte in the third quarter of 2019 and at Golden Sunlight and Morila in the second quarter of 2019 as previously reported, we have ceased to include production ornon-GAAP cost metrics for these sites from October 1, 2019 and July 1, 2019, respectively, onwards. |
| p. | The results for 2018 and 2017 did not form a part of the Barrick consolidated results as these sites were acquired as a result of the Merger. Therefore, no comparative figures are provided. |
| q. | On June 30, 2017, we sold 50% of Veladero; therefore, these represent results on a 100% basis from January 1 to June 30, 2017 and on a 50% basis from July 1, 2017 onwards. |
| BARRICK YEAR-END 2019 | 107 | MANAGEMENT’S DISCUSSION AND ANALYSIS |
Reconciliation of Copper Cost of Sales to C1 cash costs andAll-in sustaining costs, including on a per pound basis
(unaudited)
| ($ millions, except per pound information in dollars) | For the three months ended | For the years ended | ||||||||||||||||||
| 12/31/19 | 9/30/19 | 12/31/19 | 12/31/18 | 12/31/17 | ||||||||||||||||
Cost of sales | 80 | 49 | 361 | 558 | 399 | |||||||||||||||
Depreciation/amortization | (17 | ) | (13 | ) | (100 | ) | (170 | ) | (83 | ) | ||||||||||
Treatment and refinement charges | 25 | 18 | 99 | 144 | 157 | |||||||||||||||
Cash cost of sales applicable to equity method investments | 94 | 59 | 288 | 281 | 245 | |||||||||||||||
Less: royalties and production taxesa | (9 | ) | (5 | ) | (35 | ) | (44 | ) | (38 | ) | ||||||||||
By-product credits | (1 | ) | (3 | ) | (9 | ) | (6 | ) | (5 | ) | ||||||||||
Other | 0 | 0 | (5 | ) | (11 | ) | 0 | |||||||||||||
C1 cash cost of sales | 172 | 105 | 599 | 752 | 675 | |||||||||||||||
General & administrative costs | 3 | 5 | 19 | 28 | 12 | |||||||||||||||
Rehabilitation - accretion and amortization | 7 | 2 | 15 | 16 | 12 | |||||||||||||||
Royalties and production taxes | 9 | 5 | 35 | 44 | 38 | |||||||||||||||
Minesite exploration and evaluation costs | 2 | 1 | 6 | 4 | 6 | |||||||||||||||
Minesite sustaining capital expenditures | 60 | 48 | 215 | 220 | 204 | |||||||||||||||
Sustaining leases | 3 | 0 | 5 | 0 | 0 | |||||||||||||||
Inventory write-downs | 0 | 0 | 0 | 11 | 0 | |||||||||||||||
All-in sustaining costs | 256 | 166 | 894 | 1,075 | 947 | |||||||||||||||
Pounds sold - consolidated basis (millions pounds) | 91 | 65 | 355 | 382 | 405 | |||||||||||||||
Cost of sales per poundb,c | 2.26 | 2.00 | 2.14 | 2.40 | 1.77 | |||||||||||||||
C1 cash costs per poundb | 1.90 | 1.62 | 1.69 | 1.97 | 1.66 | |||||||||||||||
All-in sustaining costs per poundb | 2.82 | 2.58 | 2.52 | 2.82 | 2.34 | |||||||||||||||
| a. | For the three months and year ended December 31, 2019, royalties and production taxes include royalties of $8 million and $34 million, respectively (September 30, 2019: $5 million, 2018: $39 million and 2017: $38 million). |
| b. | Cost of sales per pound, C1 cash costs per pound andall-in sustaining costs per pound may not calculate based on amounts presented in this table due to rounding. |
| c. | Cost of sales per pound related to copper is calculated using cost of sales including our proportionate share of cost of sales attributable to equity method investments (Zaldívar and Jabal Sayid), divided by consolidated copper pounds sold (including our proportionate share of copper pounds sold from our equity method investments). |
| BARRICK YEAR-END 2019 | 108 | MANAGEMENT’S DISCUSSION AND ANALYSIS |
Reconciliation of Copper Cost of Sales to C1 cash costs andAll-in sustaining costs, including on a per pound basis, by operating site
(unaudited)
| ($ millions, except per pound information in dollars) | For the three months ended | |||||||||||||||||||||||
| 12/31/19 | 9/30/19 | |||||||||||||||||||||||
| Zaldívar | Lumwana | Jabal Sayid | Zaldívar | Lumwana | Jabal Sayid | |||||||||||||||||||
Cost of sales | 104 | 80 | 22 | 57 | 49 | 24 | ||||||||||||||||||
Depreciation/amortization | (26 | ) | (17 | ) | (7 | ) | (17 | ) | (13 | ) | (5 | ) | ||||||||||||
Treatment and refinement charges | 0 | 20 | 5 | 0 | 14 | 4 | ||||||||||||||||||
Less: royalties and production taxesa | 0 | (9 | ) | 0 | 0 | (5 | ) | 0 | ||||||||||||||||
By-product credits | 0 | 0 | (1 | ) | 0 | 0 | (3 | ) | ||||||||||||||||
Other | 0 | 0 | 0 | 0 | 0 | 0 | ||||||||||||||||||
C1 cash cost of sales | 78 | 74 | 19 | 40 | 45 | 20 | ||||||||||||||||||
Rehabilitation - accretion and amortization | 4 | 3 | 0 | 0 | 2 | 0 | ||||||||||||||||||
Royalties and production taxes | 0 | 9 | 0 | 0 | 5 | 0 | ||||||||||||||||||
Minesite exploration and evaluation costs | 2 | 0 | 0 | 1 | 0 | 0 | ||||||||||||||||||
Minesite sustaining capital expenditures | 16 | 37 | 7 | 7 | 37 | 4 | ||||||||||||||||||
Sustaining leases | 3 | 0 | 0 | 0 | 0 | 0 | ||||||||||||||||||
Inventory write-downs | 0 | 0 | 0 | 0 | 0 | 0 | ||||||||||||||||||
All-in sustaining costs | 103 | 123 | 26 | 48 | 89 | 24 | ||||||||||||||||||
Pounds sold - consolidated basis (millions pounds) | 40 | 36 | 15 | 26 | 24 | 15 | ||||||||||||||||||
Cost of sales per poundb,c | 2.59 | 2.22 | 1.47 | 2.18 | 2.04 | 1.63 | ||||||||||||||||||
C1 cash costs per poundb | 1.95 | 2.10 | 1.29 | 1.55 | 1.83 | 1.42 | ||||||||||||||||||
All-in sustaining costs per poundb | 2.56 | 3.41 | 1.78 | 1.91 | 3.66 | 1.65 | ||||||||||||||||||
| ($ millions, except per pound information in dollars) | For the years ended December 31 | |||||||||||||||||||||||||||||||||||
| 12/31/19 | 12/31/18 | 12/31/17 | ||||||||||||||||||||||||||||||||||
| Zaldívar | Lumwana | Jabal Sayid | Zaldívar | Lumwana | Jabal Sayid | Zaldívar | Lumwana | Jabal Sayid | ||||||||||||||||||||||||||||
Cost of sales | 307 | 361 | 93 | 261 | 558 | 98 | 243 | 396 | 75 | |||||||||||||||||||||||||||
Depreciation/amortization | (86 | ) | (100 | ) | (27 | ) | (59 | ) | (170 | ) | (19 | ) | (55 | ) | (83 | ) | (17 | ) | ||||||||||||||||||
Treatment and refinement charges | 0 | 80 | 19 | 0 | 125 | 19 | 0 | 144 | 14 | |||||||||||||||||||||||||||
Less: royalties and production taxesa | 0 | (35 | ) | 0 | 0 | (39 | ) | (5 | ) | 0 | (38 | ) | 0 | |||||||||||||||||||||||
By-product credits | 0 | 0 | (9 | ) | 0 | 0 | (6 | ) | 0 | 0 | (5 | ) | ||||||||||||||||||||||||
Other | 0 | (5 | ) | 0 | 0 | (11 | ) | 0 | 0 | 0 | 0 | |||||||||||||||||||||||||
C1 cash cost of sales | 221 | 301 | 76 | 202 | 463 | 87 | 188 | 419 | 67 | |||||||||||||||||||||||||||
Rehabilitation - accretion and amortization | 5 | 10 | 0 | 0 | 16 | 0 | 0 | 12 | 0 | |||||||||||||||||||||||||||
Royalties and production taxesa | 0 | 35 | 0 | 0 | 39 | 5 | 0 | 38 | 0 | |||||||||||||||||||||||||||
Minesite exploration and evaluation costs | 6 | 0 | 0 | 2 | 2 | 0 | 4 | 2 | 0 | |||||||||||||||||||||||||||
Minesite sustaining capital expenditures | 34 | 166 | 15 | 49 | 154 | 17 | 58 | 123 | 23 | |||||||||||||||||||||||||||
Sustaining leases | 3 | 2 | 0 | 0 | 0 | 0 | 0 | 0 | 0 | |||||||||||||||||||||||||||
Inventory write-downs | 0 | 0 | 0 | 0 | 11 | 0 | 0 | 0 | 0 | |||||||||||||||||||||||||||
All-in sustaining costs | 269 | 514 | 91 | 253 | 685 | 109 | 250 | 594 | 90 | |||||||||||||||||||||||||||
Pounds sold - consolidated basis (millions pounds) | 125 | 169 | 61 | 103 | 222 | 57 | 113 | 253 | 39 | |||||||||||||||||||||||||||
Cost of sales per poundb,c | 2.46 | 2.13 | 1.53 | 2.55 | 2.51 | 1.73 | 2.15 | 1.57 | 1.90 | |||||||||||||||||||||||||||
C1 cash costs per poundb | 1.77 | 1.79 | 1.26 | 1.97 | 2.08 | 1.53 | 1.66 | 1.66 | 1.70 | |||||||||||||||||||||||||||
All-in sustaining costs per poundb | 2.15 | 3.04 | 1.51 | 2.47 | 3.08 | 1.92 | 2.21 | 2.35 | 2.30 | |||||||||||||||||||||||||||
| a. | For the three months and year ended December 31, 2019, royalties and production taxes include royalties of $8 million and $34 million, respectively (September 30, 2019: $5 million; 2018: $39 million and 2017: $38 million, respectively). |
| b. | Cost of sales per pound, C1 cash costs per pound andall-in sustaining costs per pound may not calculate based on amounts presented in this table due to rounding. |
| c. | Cost of sales per pound applicable to copper is calculated using cost of sales including our proportionate share of cost of sales attributable to equity method investments (Zaldívar and Jabal Sayid), divided by consolidated copper pounds sold (including our proportionate share of copper pounds sold from our equity method investments). |
| BARRICK YEAR-END 2019 | 109 | MANAGEMENT’S DISCUSSION AND ANALYSIS |
EBITDA and Adjusted EBITDA
EBITDA is anon-GAAP financial measure, which excludes the following from net earnings:
| • | Income tax expense; |
| • | Finance costs; |
| • | Finance income; and |
| • | Depreciation. |
Management believes that EBITDA is a valuable indicator of our ability to generate liquidity by producing operating cash flow to fund working capital needs, service debt obligations, and fund capital expenditures. Management uses EBITDA for this purpose. EBITDA is also frequently used by investors and analysts for valuation purposes whereby EBITDA is multiplied by a factor or “EBITDA multiple” that is based on an observed or inferred relationship between EBITDA and market values to determine the approximate total enterprise value of a company.
Adjusted EBITDA removes the effect of impairment charges; acquisition/disposition gains/losses; foreign currency translation gains/losses; other expense adjustments; and unrealized gains onnon-hedge derivative instruments. We also remove the impact of the income tax expense, finance costs, finance income and depreciation incurred in our equity method accounted investments. We believe these items
provide a greater level of consistency with the adjusting items included in our Adjusted Net Earnings reconciliation, with the exception that these amounts are adjusted to remove any impact on finance costs/income, income tax expense and/or depreciation as they do not affect EBITDA. We believe this additional information will assist analysts, investors and other stakeholders of Barrick in better understanding our ability to generate liquidity from our full business, including equity method investments, by excluding these amounts from the calculation as they are not indicative of the performance of our core mining business and not necessarily reflective of the underlying operating results for the periods presented.
EBITDA and adjusted EBITDA are intended to provide additional information to investors and analysts and do not have any standardized definition under IFRS, and should not be considered in isolation or as a substitute for measures of performance prepared in accordance with IFRS. EBITDA and adjusted EBITDA exclude the impact of cash costs of financing activities and taxes, and the effects of changes in operating working capital balances, and therefore are not necessarily indicative of operating profit or cash flow from operations as determined under IFRS. Other companies may calculate EBITDA and adjusted EBITDA differently.
Reconciliation of Net Earnings to EBITDA and Adjusted EBITDA
(unaudited)
| ($ millions) | For the three months ended | For the years ended | ||||||||||||||||||
| 12/31/19 | 9/30/19 | 12/31/19 | 12/31/18 | 12/31/17 | ||||||||||||||||
Net earnings (loss) | 1,776 | 2,435 | 4,574 | (1,435 | ) | 1,516 | ||||||||||||||
Income tax expense | 784 | 791 | 1,783 | 1,198 | 1,231 | |||||||||||||||
Finance costs, neta | 90 | 106 | 394 | 458 | 624 | |||||||||||||||
Depreciation | 572 | 559 | 2,032 | 1,457 | 1,647 | |||||||||||||||
EBITDA | 3,222 | 3,891 | 8,783 | 1,678 | 5,018 | |||||||||||||||
Impairment charges (reversals) of long-lived assetsb | (566 | ) | (872 | ) | (1,423 | ) | 900 | (212 | ) | |||||||||||
Acquisition/disposition (gains)/lossesc | (414 | ) | (1,901 | ) | (2,327 | ) | (68 | ) | (911 | ) | ||||||||||
Foreign currency translation (gains)/losses | 53 | 40 | 109 | 136 | 72 | |||||||||||||||
Other (income) expense adjustmentsd | (845 | ) | 53 | (687 | ) | 336 | 51 | |||||||||||||
Unrealized gains onnon-hedge derivative instruments | 0 | 1 | 0 | 1 | (1 | ) | ||||||||||||||
Income tax expense, net finance costsa, and depreciation from equity investees | 112 | 85 | 378 | 97 | 98 | |||||||||||||||
Adjusted EBITDA | 1,562 | 1,297 | 4,833 | 3,080 | 4,115 | |||||||||||||||
| a. | Finance costs exclude accretion. |
| b. | Net impairment reversals for the current year primarily relate tonon-current asset reversals at Pueblo Viejo, partially offset by impairment charges at Pascua-Lama in the fourth quarter of 2019. This was further impacted bynon-current asset reversals at Lumwana in the third quarter of 2019. Net impairment charges for 2018 primarily relate tonon-current asset impairments at Lagunas Norte andnon-current asset and goodwill impairments at Veladero. |
| c. | Acquisition/disposition gains for the current year primarily relate to the gain on the sale of our 50% interest in Kalgoorlie in the fourth quarter of 2019 and the gain on the remeasurement of Turquoise Ridge to fair value as a result of its contribution to Nevada Gold Mines in the third quarter of 2019. |
| d. | Other expense adjustments for the current year primarily relate to the gain on thede-recognition of the deferred revenue liability relating to our silver sale agreement with Wheaton Precious Metals Corp. and the gain on a tax settlement at Lumwana, both occurring in the fourth quarter of 2019. |
| BARRICK YEAR-END 2019 | 110 | MANAGEMENT’S DISCUSSION AND ANALYSIS |
Reconciliation of Segment Income to Segment EBITDA
(unaudited)
| ($ millions) | For the three months ended 12/31/19 | |||||||||||||||||||||||||||||||||||||||
| Carlin (61.5%) | Cortez (61.5%) | Turquoise Ridge (61.5%) | Nevada Gold Mines (61.5%) | Pueblo Viejo (60%) | Loulo- Gounkoto (80%) | Kibali (45%) | Veladero (50%) | Porgera (47.5%) | North Maraa | |||||||||||||||||||||||||||||||
Income | 133 | 69 | 56 | 277 | 125 | 65 | 30 | 21 | 44 | 52 | ||||||||||||||||||||||||||||||
Depreciation | 58 | 36 | 34 | 163 | 34 | 58 | 52 | 29 | 12 | 35 | ||||||||||||||||||||||||||||||
EBITDA | 191 | 105 | 90 | 440 | 159 | 123 | 82 | 50 | 56 | 87 | ||||||||||||||||||||||||||||||
| For the three months ended 9/30/19 | ||||||||||||||||||||||||||||||||||||||||
| Carlin (61.5%) | Cortez (61.5%) | Turquoise Ridge (61.5%) | Nevada Gold Mines (61.5%) | Pueblo Viejo (60%) | Loulo- Gounkoto (80%) | Kibali (45%) | Veladero (50%) | Porgera (47.5%) | North Maraa | |||||||||||||||||||||||||||||||
Income | 121 | 77 | 38 | 237 | 104 | 64 | 25 | 14 | 35 | 20 | ||||||||||||||||||||||||||||||
Depreciation | 62 | 32 | 43 | 166 | 29 | 61 | 57 | 25 | 11 | 11 | ||||||||||||||||||||||||||||||
EBITDA | 183 | 109 | 81 | 403 | 133 | 125 | 82 | 39 | 46 | 31 | ||||||||||||||||||||||||||||||
| For the year ended 12/31/19 | ||||||||||||||||||||||||||||||||||||||||
| Carlinb (61.5%) | Cortezc (61.5%) | Turquoise Ridged (61.5%) | Nevada Gold Minese (61.5%) | Pueblo Viejo (60%) | Loulo- Gounkoto (80%) | Kibali (45%) | Veladero (50%) | Porgera (47.5%) | North Maraa | |||||||||||||||||||||||||||||||
Income | 370 | 459 | 201 | 1,050 | 402 | 190 | 108 | 57 | 113 | 112 | ||||||||||||||||||||||||||||||
Depreciation | 239 | 197 | 92 | 592 | 120 | 236 | 196 | 115 | 42 | 75 | ||||||||||||||||||||||||||||||
EBITDA | 609 | 656 | 293 | 1,642 | 522 | 426 | 304 | 172 | 155 | 187 | ||||||||||||||||||||||||||||||
| For the year ended 12/31/18 | ||||||||||||||||||||||||||||||||||||||||
| Carlinb (61.5%) | Cortezc (61.5%) | Turquoise Ridged (61.5%) | Nevada Gold Minese (61.5%) | Pueblo Viejo (60%) | Loulo- Gounkotof | Kibalif | Veladero (50%) | Porgera (47.5%) | North Maraa | |||||||||||||||||||||||||||||||
Income | 166 | 726 | 126 | 1,011 | 342 | 53 | 56 | 94 | ||||||||||||||||||||||||||||||||
Depreciation | 262 | 386 | 28 | 677 | 115 | 121 | 42 | 40 | ||||||||||||||||||||||||||||||||
EBITDA | 428 | 1,112 | 154 | 1,688 | 457 | 174 | 98 | 134 | ||||||||||||||||||||||||||||||||
| For the year ended 12/31/17 | ||||||||||||||||||||||||||||||||||||||||
| Carlinb (61.5%) | Cortezc (61.5%) | Turquoise Ridged (61.5%) | Nevada Gold Minese (61.5%) | Pueblo Viejo (60%) | Loulo- Gounkotof | Kibalif | Veladero (50%)g | Porgera (47.5%) | North Maraa | |||||||||||||||||||||||||||||||
Income | 186 | 873 | 119 | 1,169 | 395 | 173 | 83 | 112 | ||||||||||||||||||||||||||||||||
Depreciation | 260 | 532 | 28 | 821 | 143 | 119 | 38 | 36 | ||||||||||||||||||||||||||||||||
EBITDA | 446 | 1,405 | 147 | 1,990 | 538 | 292 | 121 | 148 | ||||||||||||||||||||||||||||||||
| a. | Formerly part of Acacia Mining plc. On September 17, 2019, Barrick acquired all of the shares of Acacia it did not own. The results are on a 63.9% basis until September 30, 2019 and on a 100% basis from October 1, 2019 onwards. |
| b. | On July 1, 2019, Barrick’s Goldstrike and Newmont’s Carlin were contributed to Nevada Gold Mines and are now referred to as Carlin. As a result, the amounts presented represent Goldstrike on a 100% basis (including our 60% share of South Arturo) up until June 30, 2019, and the combined results of Carlin and Goldstrike (including our 60% share of South Arturo) on a 61.5% basis thereafter. |
| c. | On July 1, 2019, Cortez was contributed to Nevada Gold Mines, a joint venture with Newmont. As a result, the amounts presented are on a 100% basis up until June 30, 2019, and on a 61.5% basis thereafter. |
| d. | Barrick owned 75% of Turquoise Ridge through to the end of the second quarter of 2019, with our joint venture partner, Newmont, owning the remaining 25%. Turquoise Ridge was proportionately consolidated on the basis that the joint venture partners that have joint control have rights to the assets and obligations for the liabilities relating to the arrangement. The figures presented in this table are based on our 75% interest in Turquoise Ridge until June 30, 2019. On July 1, 2019, Barrick’s 75% interest in Turquoise Ridge and Newmont’s Twin Creeks and 25% interest in Turquoise Ridge were contributed to Nevada Gold Mines. Starting July 1, 2019, the results represent our 61.5% share of Turquoise Ridge and Twin Creeks, now referred to as Turquoise Ridge. |
| e. | Represents the combined results of Cortez, Goldstrike (including our 60% share of South Arturo) and our 75% interest in Turquoise Ridge until June 30, 2019. Commencing July 1, 2019, the date Nevada Gold Mines was established, the results represent our 61.5% interest in Cortez, Carlin (including Goldstrike and 60% of South Arturo), Turquoise Ridge (including Twin Creeks), Phoenix and Long Canyon. |
| f. | The results for 2018 and 2017 did not form a part of the Barrick consolidated results as these sites were acquired as a result of the Merger. Therefore, no comparative figures are provided. |
| g. | On June 30, 2017, we sold 50% of Veladero; therefore, these represent results on a 100% basis from January 1 to June 30, 2017 and on a 50% basis from July 1, 2017 onwards. |
| BARRICK YEAR-END 2019 | 111 | MANAGEMENT’S DISCUSSION AND ANALYSIS |
Realized Price
Realized price is anon-GAAP financial measure which excludes from sales:
| • | Unrealized gains and losses onnon-hedge derivative contracts; |
| • | Unrealizedmark-to-market gains and losses on provisional pricing from copper and gold sales contracts; |
| • | Sales attributable to ore purchase arrangements; |
| • | Treatment and refining charges; |
| • | Export duties; and |
| • | Cumulativecatch-up adjustment to revenue relating to our streaming arrangements. |
Starting with this MD&A, we began adjusting for the cumulativecatch-up adjustment to revenue relating to our streaming arrangements in our calculation of realized price. The prior periods have been restated to reflect this change. We believe that this additional information will assist analysts, investors and other stakeholders of Barrick to better understand our ability to generate revenue by excludingnon-cash amounts from the calculation as they are not necessarily reflective of the underlying operating results for the periods presented.
This measure is intended to enable Management to better understand the price realized in each reporting period for gold and copper sales because unrealizedmark-to-market values ofnon-hedge gold and copper derivatives are subject to change each period due to changes in market factors such as market and forward gold and copper prices, so that prices ultimately realized may differ from those recorded. The exclusion of such unrealizedmark-to-market gains and losses
from the presentation of this performance measure enables investors to understand performance based on the realized proceeds of selling gold and copper production.
The gains and losses onnon-hedge derivatives and receivable balances relate to instruments/balances that mature in future periods, at which time the gains and losses will become realized. The amounts of these gains and losses reflect fair values based on market valuation assumptions at the end of each period and do not necessarily represent the amounts that will become realized on maturity. We also exclude export duties that are paid upon sale and netted against revenues as well as treatment and refining charges that are paid to the refiner on gold and copper concentrate sales that are netted against revenues. We believe this provides investors and analysts with a more accurate measure with which to compare to market gold prices and to assess our gold sales performance. For those reasons, management believes that this measure provides a more accurate reflection of our Company’s past performance and is a better indicator of its expected performance in future periods.
The realized price measure is intended to provide additional information, and does not have any standardized definition under IFRS and should not be considered in isolation or as a substitute for measures of performance prepared in accordance with IFRS. The measure is not necessarily indicative of sales as determined under IFRS. Other companies may calculate this measure differently. The following table reconciles realized prices to the most directly comparable IFRS measure.
Reconciliation of Sales to Realized Price per ounce/pound
(unaudited)
| ($ millions, except per ounce/pound information in dollars) | Gold | Copper | Gold | Copper | ||||||||||||||||||||||||||||||||||||
| For the three months ended | For the years ended | |||||||||||||||||||||||||||||||||||||||
| 12/31/19 | 9/30/19 | 12/31/19 | 9/30/19 | 12/31/19 | 12/31/18 | 12/31/17 | 12/31/19 | 12/31/18 | 12/31/17 | |||||||||||||||||||||||||||||||
Sales | 2,758 | 2,585 | 82 | 45 | 9,186 | 6,600 | 7,631 | 393 | 512 | 608 | ||||||||||||||||||||||||||||||
Sales applicable tonon-controlling interests | (769 | ) | (748 | ) | 0 | 0 | (1,981 | ) | (734 | ) | (810 | ) | 0 | 0 | 0 | |||||||||||||||||||||||||
Sales applicable to equity method investmentsa,b | 139 | 140 | 147 | 100 | 543 | 0 | 0 | 492 | 442 | 427 | ||||||||||||||||||||||||||||||
Realizednon-hedge gold/copper derivative (losses) gains | 0 | 0 | 0 | 0 | 1 | 2 | 3 | 0 | 0 | 0 | ||||||||||||||||||||||||||||||
Sales applicable to sites in care and maintenancec | (56 | ) | (32 | ) | 0 | 0 | (140 | ) | (111 | ) | (153 | ) | 0 | 0 | 0 | |||||||||||||||||||||||||
Treatment and refinement charges | 0 | 0 | 25 | 18 | 0 | 1 | 1 | 99 | 144 | 157 | ||||||||||||||||||||||||||||||
Export duties | 0 | 0 | 0 | 0 | 0 | (1 | ) | 0 | 0 | 0 | 0 | |||||||||||||||||||||||||||||
Otherd | 22 | 0 | 0 | 0 | 22 | 12 | 0 | 0 | 0 | 0 | ||||||||||||||||||||||||||||||
Revenues – as adjusted | 2,094 | 1,945 | 254 | 163 | 7,631 | 5,769 | 6,672 | 984 | 1,098 | 1,192 | ||||||||||||||||||||||||||||||
Ounces/pounds sold (000s ounces/millions pounds)c | 1,413 | 1,318 | 91 | 65 | 5,467 | 4,544 | 5,302 | 355 | 382 | 405 | ||||||||||||||||||||||||||||||
Realized gold/copper price per ounce/pounde | 1,483 | 1,476 | 2.76 | 2.55 | 1,396 | 1,270 | 1,258 | 2.77 | 2.88 | 2.95 | ||||||||||||||||||||||||||||||
| a. | Represents sales of $130 million and $505 million, respectively, for the three months and year ended December 31, 2019 (September 30, 2019: $133 million; 2018: $nil; 2017: $nil) applicable to our 45% equity method investment in Kibali and $9 million and $39 million, respectively (September 30, 2019: $8 million; 2018: $nil; 2017: $nil) applicable to our 40% equity method investment in Morila for gold. Represents sales of $110 million and $343 million for the three months and year ended December 31, 2019 (September 30, 2019: $66 million; 2018: $300 million; 2017: $325 million) applicable to our 50% equity method investment in Zaldívar and $43 million and $168 million, respectively (September 30, 2019: $37 million; 2018: $161 million; 2017: $116 million) applicable to our 50% equity method investment in Jabal Sayid. |
| b. | Sales applicable to equity method investments are net of treatment and refinement charges. |
| c. | Figures exclude Pierina, Golden Sunlight and Morila starting in the third quarter of 2019, and Lagunas Norte starting in the fourth quarter of 2019 from the calculation of realized price per ounce, which are mining incidental ounces as they enter closure. |
| d. | Represents cumulativecatch-up adjustment to revenue relating to our streaming arrangements. |
| e. | Realized price per ounce/pound may not calculate based on amounts presented in this table due to rounding. |
| BARRICK YEAR-END 2019 | 112 | MANAGEMENT’S DISCUSSION AND ANALYSIS |
TECHNICAL INFORMATION
The scientific and technical information contained in this MD&A has been reviewed and approved by Steven Yopps, MMSA, Director - Metallurgy, North America; Craig Fiddes, North America Resource Modeling Manager; Chad Yuhasz, P.Geo, Mineral Resource Manager, Latin America and Australia Pacific; Simon Bottoms, CGeol, MGeol, FGS, MAusIMM, Mineral Resources Manager: Africa and Middle East; Rodney Quick, MSc, Pr. Sci.Nat, Mineral Resource Management and Evaluation Executive; John Steele, CIM, Metallurgy, Engineering and Capital Projects Executive; and Rob Krcmarov, FAusIMM, Executive Vice President, Exploration and Growth – each a “Qualified Person” as defined in National Instrument43-101 –Standards of Disclosure for Mineral Projects.
All mineral reserve and mineral resource estimates are estimated in accordance with National Instrument43-101 –Standards of Disclosure for Mineral Projects. Unless otherwise noted, such mineral reserve and mineral resource estimates are as of December 31, 2019.
ENDNOTES
| 1 | A Tier One Gold Asset is a mine with a stated life in excess of 10 years, annual production of at least 500,000 ounces of gold and total cash costs per ounce over the mine life that are in the lower half of the industry cost curve. |
| 2 | A Tier Two Gold Asset is a mine with a stated life in excess of 10 years, annual production of at least 250,000 ounces of gold and total cash costs per ounce over the mine life that are in the lower half of the industry cost curve. A Strategic Asset is an asset which in the opinion of Barrick, has the potential to deliver significant unrealized value in the future. |
| 3 | Currently consists of Barrick’s Lumwana mine and Zaldívar and Jabal Sayid copper joint ventures. |
| 4 | These arenon-GAAP financial performance measures with no standardized meaning under IFRS and therefore may not be comparable to similar measures presented by other issuers. For further information and a detailed reconciliation of eachnon-GAAP measure to the most directly comparable IFRS measure, please see pages 91 to 112 of this MD&A. |
| 5 | Cost of sales applicable to gold per ounce is calculated using cost of sales applicable to gold on an attributable basis (removing thenon-controlling interest of 40% Pueblo Viejo, 36.1% Tanzania until September 30, 2019 (notwithstanding the completion of the Acacia transaction on September 17, 2019, we consolidated our interest in Acacia and recorded anon-controlling interest of 36.1% in the income statement for the entirety of the third quarter of 2019 as a matter of convenience) and 40% South Arturo from cost of sales (63.1% of South Arturo from July 1, 2019 onwards as a result of its contribution to Nevada Gold Mines)), divided by attributable gold ounces. Thenon-controlling interest of 20% Loulo-Gounkoto and 10.3% of Tongon is also removed from cost of sales and our proportionate share of cost of sales attributable to equity method investments (Kibali and Morila) is included commencing January 1, 2019, the effective date of the Merger. Also removes thenon-controlling interest of 38.5% Nevada Gold Mines from cost of sales from July 1, 2019 onwards. Cost of sales applicable to copper per pound is calculated using cost of sales applicable to copper including our proportionate share of cost of sales attributable to equity method investments (Zaldívar and Jabal Sayid), divided by consolidated copper pounds (including our proportionate share of copper pounds from our equity method investments). |
| 6 | Total reportable incident frequency rate (“TRIFR”) is a ratio calculated as follows: number of reportable injuries x 1,000,000 hours divided by the total number of hours worked. Reportable injuries include fatalities, lost time injuries, restricted duty injuries, and medically treated injuries. |
| 7 | Class 1 - High Significance is defined as an incident that causes significant negative impacts on human health or the environment or an incident that extends onto publicly accessible land and has the potential to cause significant adverse impact to surrounding communities, livestock or wildlife. |
| 8 | Class 2 - Medium Significance is defined as an incident that has the potential to cause negative impact on human health or the environment but is reasonably anticipated to result in only localized and short-term environmental or community impact requiring minor remediation. |
| 9 | Estimated in accordance with National Instrument43-101 as required by Canadian securities regulatory authorities. Estimates are as of December 31, 2019, unless otherwise noted. Proven reserves of 280 million tonnes grading 2.42 g/t, representing 22 million ounces of gold, and 420 million tonnes grading 0.4%, representing 3,700 million pounds of copper. Probable reserves of 1,000 million tonnes grading 1.48 g/t, representing 49 million ounces of gold, and 1,200 million tonnes grading 0.38%, representing 9,800 million pounds of copper. Measured resources of 530 million tonnes grading 2.21 g/t, representing 37 million ounces of gold, and 660 million tonnes grading 0.38%, representing 5,500 million pounds of copper. Indicated resources of 2,800 million tonnes grading 1.43 g/t, representing 130 million ounces of gold, and 2,400 million tonnes grading 0.38%, representing 21,000 million pounds of copper. Inferred resources of 940 million tonnes grading 1.3 g/t, representing 39 million ounces of gold, and 430 million tonnes grading 0.2%, representing 2,200 million pounds of copper. Complete mineral reserve and mineral resource data for all mines and projects referenced in this MD&A, including tonnes, grades, and ounces, can be found on pages119-129 of Barrick’s Fourth Quarter andYear-End 2019 Report. |
| 10 | Estimated in accordance with National Instrument43-101 as required by Canadian securities regulatory authorities. Estimates are as of December 31, 2018, unless otherwise noted. Proven reserves of 344.6 million tonnes grading 2.15 g/t, representing 23.9 million ounces of gold and probable reserves of 0.9 billion tonnes grading 1.33 g/t, representing 38.4 million ounces of |
| BARRICK YEAR-END 2019 | 113 | MANAGEMENT’S DISCUSSION AND ANALYSIS |
gold. 11 billion pounds of copper reserves were comprised of proven reserves of 285.6 million tonnes grading 0.43%, representing 2.7 billion pounds of copper and probable reserves of 940.0 million tonnes grading 0.38%, representing 7.9 billion pounds of copper. Complete 2018 mineral reserve and mineral resource data for all mines and projects referenced in this MD&A, including tonnes, grades, and ounces, can be found on pages35-41 of Barrick’s Annual InformationForm/Form 40-F for the year ended December 31, 2018 on file with Canadian provincial securities regulatory authorities and the U.S. Securities and Exchange Commission. |
| 11 | The term “Acacia Exploration Special Dividends” refers to special dividends potentially payable by Barrick to former shareholders of Acacia, as a consequence of the sales process to realize value from the sale (if any) of certain of Acacia’s exploration assets located in the Republic of Kenya, the Republic of Mali and Burkina Faso, and excluding the sale of Acacia’s interests in the Nyanzaga Gold Project in Tanzania and the South Houndé Project in Burkina Faso, for which Acacia had already commenced and advanced sales processes. |
| 12 | See the Technical Report on the Turquoise Ridge mine, dated March 19, 2019, and filed on SEDAR at www.sedar.com and EDGAR at www.sec.gov on March 23, 2019. |
| 13 | See the Technical Report on the Pueblo Viejo mine, Sanchez Ramirez Province, Dominican Republic, dated March 19, 2018, and filed on SEDAR at www.sedar.com and EDGAR at www.sec.gov on March 23, 2018. |
| 14 | Carlin Trend Exploration Significant Intercepts1 |
| Drill Results from Q4 2019 | ||||||||||
| Drill Hole | Azimuth | Dip | Interval (m) | Width (m)2 | Au (g/t) | |||||
RAN-02349 | 0 | (90) | 538.0 - 541.5 | 3.5 | 7.50 | |||||
| 507.8 - 509.2 | 1.4 | 5.33 | ||||||||
RAN-02355 | 0 | (90) | 516.0 - 516.9 | 0.9 | 5.93 | |||||
| 520.6 - 526.7 | 6.1 | 8.52 | ||||||||
| 1. | All intercepts calculated using a 5 g/t Au cutoff and are uncapped; minimum intercept width is 0.8 m; internal dilution is less than 20% total width. |
| 2. | True widths of intercepts are uncertain at this stage, geometry of orebody is unconstrained. |
The drilling results for the Carlin Trend exploration area in this MD&A have been prepared in accordance with National Instrument43-101 – Standards of Disclosure for Mineral Projects. All drill hole assay information has been manually reviewed and approved by staff geologists andre-checked by the project manager. Sample preparation and analyses are conducted by ALS Minerals. Procedures are employed to ensure security of samples during their delivery from the drill rig to the laboratory. The quality assurance procedures, data verification and assay protocols used in connection with drilling and sampling on the Carlin Trend conform to industry accepted quality control methods.
| BARRICK YEAR-END 2019 | 114 | MANAGEMENT’S DISCUSSION AND ANALYSIS |
| Historic Drill Results1 | ||||||||||
| Drill Hole | Azimuth | Dip | Interval (m) | Width (m)2 | Au (g/t) | |||||
DPC-0241 | 072 | (57) | 160.9 - 165.5 | 4.6 | 7.48 | |||||
| 168.5 - 179.2 | 10.7 | 10.57 | ||||||||
| 199.0 - 200.5 | 1.5 | 6.91 | ||||||||
| 212.8 - 217.5 | 4.7 | 10.82 | ||||||||
| 229.5 - 231.0 | 1.5 | 6.42 | ||||||||
| 243.2 - 244.7 | 1.5 | 5.17 | ||||||||
| 273.7 - 276.8 | 3.1 | 8.75 | ||||||||
| 334.7 - 365.2 | 30.5 | 15.86 | ||||||||
| 369.7 - 396.2 | 26.5 | 11.24 | ||||||||
| 421.5 - 430.6 | 9.1 | 5.89 | ||||||||
DSU-00190 | 105 | (60) | 379.5 - 388.5 | 9.0 | 12.81 | |||||
GEN-017033 | 105 | (75) | 271.6 - 274.1 | 2.5 | 8.46 | |||||
| 296.3 - 297.7 | 1.4 | 5.47 | ||||||||
| 302.1 - 303.0 | 0.9 | 10.7 | ||||||||
| 307.3 - 308.8 | 1.5 | 5.28 | ||||||||
| 316.2 - 320.8 | 4.0 | 11.08 | ||||||||
| 326.8 - 352.5 | 24.7 | 8.56 | ||||||||
U12-P05-16 | 059 | (30) | 141.7 - 144.8 | 3.1 | 8.09 | |||||
| 370.3 - 371.8 | 1.5 | 5.93 | ||||||||
| 376.4 - 391.7 | 15.3 | 7.14 | ||||||||
| 394.7 - 396.2 | 1.5 | 5.27 | ||||||||
| 397.8 - 400.8 | 3.0 | 6.15 | ||||||||
GB-681CM4 | 0 | (90) | 608.1 - 614.2 | 6.1 | 23.17 | |||||
| 620.3 - 621.8 | 1.5 | 17.29 | ||||||||
| 661.4 - 662.9 | 1.5 | 7.19 | ||||||||
| 725.4 - 730.0 | 4.6 | 8.58 | ||||||||
| 736.1 - 739.2 | 3.1 | 6.73 | ||||||||
| 740.7 - 742.2 | 1.5 | 5.99 | ||||||||
| 763.5 - 765.0 | 1.5 | 10.79 | ||||||||
U17-M05-02 | 075 | (45) | 7.6 - 9.1 | 1.5 | 5.08 | |||||
| 13.7 - 21.3 | 7.6 | 7.82 | ||||||||
| 193.6 - 202.7 | 9.1 | 21.02 | ||||||||
| 1. | All intercepts are from legacy drilling, completed prior to 2019. |
| 2. | True widths of intercepts are uncertain at this stage, geometry of orebody is unconstrained. |
| 3. | Interval vs. width discrepancy is due tosub-meter no recovery zone internal to intercept. |
| 4. | Laboratory unknown. |
The drilling results for the Carlin Trend exploration area in this MD&A have been prepared in accordance with National Instrument43-101 – Standards of Disclosure for Mineral Projects. All drill hole assay information has been manually reviewed and approved by staff geologists andre-checked by the project manager. Sample preparation and analyses are conducted by ALS Minerals or predecessor companies. Procedures are employed to ensure security of samples during their delivery from the drill rig to the laboratory. The quality assurance procedures, data verification and assay protocols used in connection with drilling and sampling on the Carlin Trend conform to industry accepted quality control methods.
| BARRICK YEAR-END 2019 | 115 | MANAGEMENT’S DISCUSSION AND ANALYSIS |
| 15 | Fourmile Significant Intercepts1 |
| Drill Results from Q4 2019 | ||||||||||
| Drill Hole2 | Azimuth | Dip | Interval (m) | Width (m)3 | Au (g/t) | |||||
FM19-14D | 233 | (73) | 1100.3 - 1103.3 | 3 | 6.2 | |||||
| 1148.0 - 1155.5 | 7.5 | 9.2 | ||||||||
| 1169.3 - 1162.8 | 1.5 | 9.3 | ||||||||
| 1234.7 - 1236.2 | 1.5 | 7.5 | ||||||||
| 1239.3 - 1242.3 | 3 | 47.8 | ||||||||
| 1259.1 - 1260.6 | 1.5 | 7.0 | ||||||||
| 1301.8 - 1303.3 | 1.5 | 20.2 | ||||||||
| 1309.4 - 1310.9 | 1.5 | 16.3 | ||||||||
| 1333.8 - 1337.5 | 3.7 | 86.2 | ||||||||
| 1343.5 - 1345.2 | 1.7 | 29.6 | ||||||||
| 1356.6 - 1361.2 | 4.6 | 42.5 | ||||||||
| 1372.8 - 1375.5 | 2.7 | 180.3 | ||||||||
FM19-26D4 | 65 | (75) | 717.8 - 719.2 | 1.4 | 5.2 | |||||
| 774.8 - 776.3 | 1.5 | 18.5 | ||||||||
FM19-40D | 173 | (84) | 870.2 - 871.7 | 1.5 | 10.4 | |||||
| 883 - 895.5 | 12.5 | 31.2 | ||||||||
| 904.4 - 926 | 21.6 | 24.9 | ||||||||
FM19-61D | 251 | (86) | 835.2 - 854.7 | 19.5 | 17.9 | |||||
| 863.5 - 872.0 | 8.5 | 10.4 | ||||||||
| 889.7 - 891.5 | 1.8 | 6.5 | ||||||||
| 892.9 - 894.0 | 1.1 | 10.8 | ||||||||
| 898.9 - 901.9 | 3.0 | 6.5 | ||||||||
| 957.1 - 959.5 | 2.4 | 14.8 | ||||||||
FM19-64D | 119 | (85) | 881.7 - 885.1 | 3.4 | 15.9 | |||||
FM19-68D | 166 | (77) | 1092.1 - 1096.5 | 4.4 | 18.1 | |||||
| 1. | All intercepts calculated using a 5 g/t Au cutoff and are uncapped; minimum intercept width is 0.8 m; internal dilution is less than 20% total width. |
| 2. | Fourmile drill hole nomenclature: FM (Fourmile) followed by the year (19 for 2019) or GRC (Gold Rush Core) with no designation of the year. |
| 3. | True widths of intercepts are uncertain at this stage. |
| 4. | Partial results reported in Q2 2019. |
The drilling results for the Fourmile property contained in this MD&A have been prepared in accordance with National Instrument43-101 – Standards of Disclosure for Mineral Projects. All drill hole assay information has been manually reviewed and approved by staff geologists andre-checked by the project manager. Sample preparation and analyses are conducted by ALS Minerals. Procedures are employed to ensure security of samples during their delivery from the drill rig to the laboratory. The quality assurance procedures, data verification and assay protocols used in connection with drilling and sampling on the Fourmile property conform to industry accepted quality control methods.
| 16 | Bambadji Significant Intercepts1 |
| Drill Results from Q4 2019 | ||||||||||
| Drill Hole2 | Azimuth | Dip | Interval (m) | Width (m)3 | Au (g/t) | |||||
GFRC007 | 90 | (50) | 6.0 - 19.0 | 13.00 | 1.31 | |||||
GFRC008 | 90 | (50) | 22.0 - 52.0 | 30.00 | 1.06 | |||||
GFRC009 | 90 | (50) | 7.0 - 33.0 | 26.00 | 0.55 | |||||
GFRC013 | 90 | (50) | 19.0 - 26.0 | 8.00 | 0.68 | |||||
GFRC029 | 90 | (50) | 26.0 - 30.0 | 4.00 | 5.15 | |||||
GFRC031 | 90 | (50) | 41.0 - 48.0 | 7.00 | 16.72 | |||||
| 1. | All intercepts calculated using a 0.5 g/t Au cutoff and are uncapped; minimum intercept width is 2 m; internal dilution is less than 2 m total width. |
| 2. | Gefa drill hole nomenclature: prospect initial GF (Gefa), followed by type of drilling RC (Reverse Circulation) and DH (Diamond Drilling). |
| 3. | True widths of intercepts are uncertain at this stage. |
| BARRICK YEAR-END 2019 | 116 | MANAGEMENT’S DISCUSSION AND ANALYSIS |
The drilling results for the Bambadji property contained in this MD&A have been prepared in accordance with National Instrument43-101 – Standards of Disclosure for Mineral Projects. All drill hole assay information has been manually reviewed and approved by staff geologists andre-checked by the project manager. Sample preparation and analyses are conducted by SGS, an independent laboratory. Industry accepted best practices for preparation and fire assaying procedures are utilized to determine gold content. Procedures are employed to ensure security of samples during their delivery from the drill rig to the laboratory. The quality assurance procedures, data verification and assay protocols used in connection with drilling and sampling on the Bambadji property conform to industry accepted quality control methods.
| 17 | See the Technical Report on the Loulo-Gounkoto Gold Mine Complex, Mali, dated September 18, 2018, with an effective date of December 31, 2017, and filed on SEDAR at www.sedar.com and EDGAR at www.sec.gov on January 2, 2019. |
| 18 | See the Technical Report on the Kibali Gold Mine, Republic of Congo, dated September 18, 2018, with an effective date of December 31, 2017, and filed on SEDAR at www.sedar.com and EDGAR at www.sec.gov on January 2, 2019. |
| BARRICK YEAR-END 2019 | 117 | MANAGEMENT’S DISCUSSION AND ANALYSIS |
GLOSSARY OF TECHNICAL TERMS
ALL-IN SUSTAINING COSTS: Anon-GAAP measure of cost per ounce/pound for gold/copper. Refer to page 93 of this MD&A for further information and a reconciliation of the measure.
AUTOCLAVE: Oxidation process in which high temperatures and pressures are applied to convert refractory sulfide mineralization into amenable oxide ore.
BY-PRODUCT: A secondary metal or mineral product recovered in the milling process such as silver.
C1 CASH COSTS: Anon-GAAP measure of cost per pound for copper. Refer to page 108 of this MD&A for further information and a reconciliation of the measure.
CONCENTRATE: A very fine, powder-like product containing the valuable ore mineral from which most of the waste mineral has been eliminated.
CONTAINED OUNCES: Represents ounces in the ground before loss of ounces not able to be recovered by the applicable metallurgical process.
DEVELOPMENT: Work carried out for the purpose of gaining access to an ore body. In an underground mine this includes shaft sinking, crosscutting, drifting and raising. In an open pit mine, development includes the removal of overburden.
DILUTION: The effect of waste orlow-grade ore which is unavoidably included in the mined ore, lowering the recovered grade.
DORÉ: Unrefined gold and silver bullion bars usually consisting of approximately 90 percent precious metals that will be further refined to almost pure metal.
DRILLING:
Core: drilling with a hollow bit with a diamond cutting rim to produce a cylindrical core that is used for geological study and assays. Used in mineral exploration.
In-fill: drilling closer spaced holes in between existing holes, used to provide greater geological detail and to help establish reserve estimates.
EXPLORATION: Prospecting, sampling, mapping, diamond-drilling and other work involved in searching for ore.
FREE CASH FLOW: Anon-GAAP measure that reflects our ability to generate cash flow. Refer to page 91 of this MD&A for a definition.
GRADE: The amount of metal in each tonne of ore, expressed as grams per tonne for precious metals and as a percentage for most other metals.
Cut-off grade: the minimum metal grade at which an ore body can be economically mined (used in the calculation of ore reserves).
Mill-head grade: metal content per tonne of ore going into a mill for processing. (g/t)
Reserve grade: estimated metal content of an ore body, based on reserve calculations.
HEAP LEACHING: A process whereby gold/copper is extracted by “heaping” broken ore on sloping impermeable pads and continually applying to the heaps a weak cyanide solution/sulfuric acid which dissolves the contained gold/copper. The gold/copper-laden solution is then collected for gold/copper recovery.
HEAP LEACH PAD: A large impermeable foundation or pad used as a base for ore during heap leaching.
MILL: A processing facility where ore is finely ground and thereafter undergoes physical or chemical treatment to extract the valuable metals.
MINERAL RESERVE: See pages 119 to 129 – Summary Gold/Copper Mineral Reserves and Mineral Resources.
MINERAL RESOURCE: See pages 119 to 129 – Summary Gold/Copper Mineral Reserves and Mineral Resources.
OPEN PIT: A mine where the minerals are mined entirely from the surface.
ORE: Rock, generally containing metallic ornon-metallic minerals, which can be mined and processed at a profit.
ORE BODY: A sufficiently large amount of ore that can be mined economically.
OUNCES: Troy ounce is a unit of measure used for weighing gold at 999.9 parts per thousand purity and is equivalent to 31.1035g.
RECLAMATION: The process by which lands disturbed as a result of mining activity are modified to support beneficial land use. Reclamation activity may include the removal of buildings, equipment, machinery and other physical remnants of mining, closure of tailings storage facilities, leach pads and other mine features, and contouring, covering andre-vegetation of waste rock and other disturbed areas.
RECOVERY RATE: A term used in process metallurgy to indicate the proportion of valuable material physically recovered in the processing of ore. It is generally stated as a percentage of the valuable material recovered compared to the total material originally contained.
REFINING: The final stage of metal production in which impurities are removed from the molten metal.
STRIPPING: Removal of overburden or waste rock overlying an ore body in preparation for mining by open pit methods.
TAILINGS: The material that remains after all economically and technically recoverable precious metals have been removed from the ore during processing.
TOTAL CASH COSTS: Anon-GAAP measure of cost per ounce for gold. Refer to page 93 of this MD&A for further information and a reconciliation of the measure.
| BARRICK YEAR-END 2019 | 118 | MANAGEMENT’S DISCUSSION AND ANALYSIS |
Mineral Reserves and Mineral Resources
| GOLD MINERAL RESERVES1,2,3 | ||||||||||||||||||||||||||||||||||||||||||||
| As at December 31, 2019 | PROVEN | PROBABLE | TOTAL | |||||||||||||||||||||||||||||||||||||||||
| Tonnes | Grade | Contained ozs | Tonnes | Grade | Contained ozs | Tonnes | Grade | Contained ozs | ||||||||||||||||||||||||||||||||||||
| Based on attributable ounces | (Mt) | (g/t) | (Moz) | (Mt) | (g/t) | (Moz) | (Mt) | (g/t) | (Moz) | |||||||||||||||||||||||||||||||||||
AFRICA AND MIDDLE EAST | ||||||||||||||||||||||||||||||||||||||||||||
Kibali surface | 3.5 | 2.49 | 0.28 | 7.1 | 3.14 | 0.71 | 11 | 2.92 | 0.99 | |||||||||||||||||||||||||||||||||||
Kibali underground | 5.8 | 5.13 | 0.95 | 14 | 4.76 | 2.2 | 20 | 4.87 | 3.2 | |||||||||||||||||||||||||||||||||||
Kibali (45.00%) total | 9.3 | 4.13 | 1.2 | 22 | 4.23 | 2.9 | 31 | 4.20 | 4.2 | |||||||||||||||||||||||||||||||||||
Loulo-Gounkoto surface | 8.4 | 2.95 | 0.80 | 9.7 | 3.56 | 1.1 | 18 | 3.28 | 1.9 | |||||||||||||||||||||||||||||||||||
Loulo-Gounkoto underground | 9.0 | 4.64 | 1.3 | 18 | 5.41 | 3.2 | 27 | 5.16 | 4.5 | |||||||||||||||||||||||||||||||||||
Loulo-Gounkoto (80.00%) total | 17 | 3.83 | 2.1 | 28 | 4.77 | 4.3 | 45 | 4.41 | 6.4 | |||||||||||||||||||||||||||||||||||
Tongon surface (89.70%) | 4.3 | 1.94 | 0.27 | 4.6 | 2.33 | 0.35 | 8.9 | 2.14 | 0.61 | |||||||||||||||||||||||||||||||||||
Massawa surface (83.25%)4 | — | — | — | 17 | 3.94 | 2.2 | 17 | 3.94 | 2.2 | |||||||||||||||||||||||||||||||||||
Bulyanhulu surface5,6 | — | — | — | 1.1 | 1.19 | 0.041 | 1.1 | 1.19 | 0.041 | |||||||||||||||||||||||||||||||||||
Bulyanhulu underground5,6 | 2.0 | 11.01 | 0.72 | 4.4 | 10.56 | 1.5 | 6.4 | 10.70 | 2.2 | |||||||||||||||||||||||||||||||||||
Bulyanhulu (84.00%) total5,6 | 2.0 | 11.01 | 0.72 | 5.5 | 8.72 | 1.5 | 7.5 | 9.34 | 2.2 | |||||||||||||||||||||||||||||||||||
North Mara surface 6 | 0.34 | 2.63 | 0.029 | 15 | 1.47 | 0.70 | 15 | 1.49 | 0.73 | |||||||||||||||||||||||||||||||||||
North Mara underground 6 | 0.77 | 5.39 | 0.13 | 5.0 | 5.40 | 0.87 | 5.8 | 5.40 | 1.0 | |||||||||||||||||||||||||||||||||||
North Mara (84.00%) total6 | 1.1 | 4.54 | 0.16 | 20 | 2.46 | 1.6 | 21 | 2.57 | 1.7 | |||||||||||||||||||||||||||||||||||
Buzwagi surface (84.00%)6 | — | — | — | 5.1 | 0.84 | 0.14 | 5.1 | 0.84 | 0.14 | |||||||||||||||||||||||||||||||||||
Jabal Sayid surface (50.00%) | 7.2 | 0.20 | 0.046 | 5.4 | 0.29 | 0.051 | 13 | 0.24 | 0.097 | |||||||||||||||||||||||||||||||||||
AFRICA AND MIDDLE EAST TOTAL | 41 | 3.44 | 4.6 | 110 | 3.78 | 13 | 150 | 3.69 | 18 | |||||||||||||||||||||||||||||||||||
NORTH AMERICA | ||||||||||||||||||||||||||||||||||||||||||||
Hemlo surface | — | — | — | 1.6 | 1.28 | 0.066 | 1.6 | 1.28 | 0.066 | |||||||||||||||||||||||||||||||||||
Hemlo underground | 0.91 | 4.94 | 0.15 | 8.1 | 4.30 | 1.1 | 9.0 | 4.37 | 1.3 | |||||||||||||||||||||||||||||||||||
Hemlo (100%) total | 0.91 | 4.94 | 0.15 | 9.7 | 3.81 | 1.2 | 11 | 3.90 | 1.3 | |||||||||||||||||||||||||||||||||||
Long Canyon surface (61.50%) | 0.26 | 2.23 | 0.019 | 4.6 | 2.49 | 0.37 | 4.9 | 2.48 | 0.39 | |||||||||||||||||||||||||||||||||||
Phoenix surface (61.50%) | 9.4 | 0.66 | 0.20 | 94 | 0.59 | 1.8 | 100 | 0.59 | 2.0 | |||||||||||||||||||||||||||||||||||
Carlin surface | 43 | 2.70 | 3.7 | 60 | 1.75 | 3.4 | 100 | 2.15 | 7.1 | |||||||||||||||||||||||||||||||||||
Carlin underground | 13 | 9.75 | 4.2 | 5.9 | 9.23 | 1.7 | 19 | 9.59 | 5.9 | |||||||||||||||||||||||||||||||||||
Carlin (61.50%) total | 56 | 4.37 | 7.9 | 65 | 2.42 | 5.1 | 120 | 3.32 | 13 | |||||||||||||||||||||||||||||||||||
Cortez surface | 4.4 | 2.40 | 0.34 | 53 | 1.26 | 2.1 | 57 | 1.35 | 2.5 | |||||||||||||||||||||||||||||||||||
Cortez underground7 | 0.59 | 9.61 | 0.18 | 11 | 9.93 | 3.4 | 11 | 9.91 | 3.6 | |||||||||||||||||||||||||||||||||||
Cortez (61.50%) total | 5.0 | 3.25 | 0.52 | 64 | 2.73 | 5.6 | 69 | 2.77 | 6.1 | |||||||||||||||||||||||||||||||||||
Turquoise Ridge surface | 18 | 2.02 | 1.2 | 16 | 1.86 | 0.94 | 34 | 1.95 | 2.1 | |||||||||||||||||||||||||||||||||||
Turquoise Ridge underground | 9.8 | 11.55 | 3.6 | 7.8 | 10.08 | 2.5 | 18 | 10.90 | 6.2 | |||||||||||||||||||||||||||||||||||
Turquoise Ridge (61.50%) total | 28 | 5.38 | 4.8 | 23 | 4.59 | 3.5 | 51 | 5.02 | 8.3 | |||||||||||||||||||||||||||||||||||
NORTH AMERICA TOTAL | 99 | 4.25 | 14 | 260 | 2.08 | 17 | 360 | 2.68 | 31 | |||||||||||||||||||||||||||||||||||
| BARRICK YEAR-END 2019 | 119 | RESERVES AND RESOURCES |
| GOLD MINERAL RESERVES1,2,3 | ||||||||||||||||||||||||||||||||||||||||||||
| As at December 31, 2019 | PROVEN | PROBABLE | TOTAL | |||||||||||||||||||||||||||||||||||||||||
| Tonnes | Grade | Contained ozs | Tonnes | Grade | Contained ozs | Tonnes | Grade | Contained ozs | ||||||||||||||||||||||||||||||||||||
| Based on attributable ounces | (Mt) | (g/t) | (Moz) | (Mt) | (g/t) | (Moz) | (Mt) | (g/t) | (Moz) | |||||||||||||||||||||||||||||||||||
LATIN AMERICA AND ASIA PACIFIC |
| |||||||||||||||||||||||||||||||||||||||||||
Norte Abierto surface (50.00%) | 110 | 0.65 | 2.4 | 480 | 0.59 | 9.2 | 600 | 0.60 | 12 | |||||||||||||||||||||||||||||||||||
Pueblo Viejo surface (60.00%) | 10 | 2.68 | 0.87 | 61 | 2.46 | 4.8 | 71 | 2.49 | 5.7 | |||||||||||||||||||||||||||||||||||
Veladero surface (50.00%) | 15 | 0.60 | 0.30 | 110 | 0.74 | 2.5 | 120 | 0.73 | 2.8 | |||||||||||||||||||||||||||||||||||
Porgera surface | — | — | — | 8.5 | 3.63 | 0.99 | 8.5 | 3.63 | 0.99 | |||||||||||||||||||||||||||||||||||
Porgera underground | 1.3 | 6.68 | 0.29 | 5.3 | 6.25 | 1.1 | 6.6 | 6.33 | 1.3 | |||||||||||||||||||||||||||||||||||
Porgera (47.50%) total | 1.3 | 6.68 | 0.29 | 14 | 4.63 | 2.1 | 15 | 4.81 | 2.3 | |||||||||||||||||||||||||||||||||||
LATIN AMERICA AND ASIA PACIFIC TOTAL | 140 | 0.84 | 3.8 | 660 | 0.87 | 19 | 810 | 0.87 | 22 | |||||||||||||||||||||||||||||||||||
| ||||||||||||||||||||||||||||||||||||||||||||
TOTAL | 280 | 2.42 | 22 | 1,000 | 1.48 | 49 | 1,300 | 1.68 | 71 | |||||||||||||||||||||||||||||||||||
1 See accompanying Mineral Reserves and Mineral Resources endnote #1.
2 See accompanying Mineral Reserves and Mineral Resources endnote #2.
3 See accompanying Mineral Reserves and Mineral Resources endnote #4.
4 See accompanying Mineral Reserves and Mineral Resources endnote #9.
5 See accompanying Mineral Reserves and Mineral Resources endnote #15.
6 See accompanying Mineral Reserves and Mineral Resources endnote #10.
7 See accompanying Mineral Reserves and Mineral Resources endnote #17.
| COPPER MINERAL RESERVES1,2,3,4 | ||||||||||||||||||||||||||||||||||||||||||||
As at December 31, 2019 | PROVEN | PROBABLE | TOTAL | |||||||||||||||||||||||||||||||||||||||||
| Tonnes | Cu Grade | Contained Cu | Tonnes | Cu Grade | Contained Cu | Tonnes | Cu Grade | Contained Cu | ||||||||||||||||||||||||||||||||||||
| Based on attributable pounds | (Mt) | (%) | (Mlb) | (Mt) | (%) | (Mlb) | (Mt) | (%) | (Mlb) | |||||||||||||||||||||||||||||||||||
AFRICA AND MIDDLE EAST | ||||||||||||||||||||||||||||||||||||||||||||
Bulyanhulu underground (84.00%)5,6 | 2.0 | 0.53 | 24 | 4.4 | 0.56 | 54 | 6.4 | 0.55 | 77 | |||||||||||||||||||||||||||||||||||
Lumwana surface (100%) | 58 | 0.50 | 640 | 480 | 0.56 | 6,000 | 540 | 0.56 | 6,600 | |||||||||||||||||||||||||||||||||||
Jabal Sayid surface | 0.079 | 3.21 | 5.6 | — | — | — | 0.079 | 3.21 | 5.6 | |||||||||||||||||||||||||||||||||||
Jabal Sayid underground | 7.1 | 2.44 | 380 | 5.4 | 2.09 | 250 | 13 | 2.29 | 630 | |||||||||||||||||||||||||||||||||||
Jabal Sayid (50.00%) total | 7.2 | 2.45 | 390 | 5.4 | 2.09 | 250 | 13 | 2.29 | 640 | |||||||||||||||||||||||||||||||||||
AFRICA AND MIDDLE EAST TOTAL | 67 | 0.71 | 1,100 | 490 | 0.58 | 6,300 | 560 | 0.59 | 7,300 | |||||||||||||||||||||||||||||||||||
NORTH AMERICA | ||||||||||||||||||||||||||||||||||||||||||||
Phoenix surface (61.50%) | 27 | 0.19 | 120 | 130 | 0.17 | 490 | 160 | 0.18 | 610 | |||||||||||||||||||||||||||||||||||
NORTH AMERICA TOTAL | 27 | 0.19 | 120 | 130 | 0.17 | 490 | 160 | 0.18 | 610 | |||||||||||||||||||||||||||||||||||
LATIN AMERICA AND ASIA PACIFIC |
| |||||||||||||||||||||||||||||||||||||||||||
Zaldívar surface (50.00%) | 220 | 0.43 | 2,100 | 69 | 0.42 | 640 | 280 | 0.43 | 2,700 | |||||||||||||||||||||||||||||||||||
Norte Abierto surface (50.00%) | 110 | 0.19 | 480 | 480 | 0.23 | 2400 | 600 | 0.22 | 2,900 | |||||||||||||||||||||||||||||||||||
LATIN AMERICA AND ASIA PACIFIC TOTAL | 330 | 0.35 | 2,500 | 550 | 0.25 | 3,000 | 880 | 0.29 | 5,600 | |||||||||||||||||||||||||||||||||||
| ||||||||||||||||||||||||||||||||||||||||||||
TOTAL | 420 | 0.4 | 3,700 | 1,200 | 0.38 | 9,800 | 1,600 | 0.38 | 13,000 | |||||||||||||||||||||||||||||||||||
1 See accompanying Mineral Reserves and Mineral Resources endnote #1.
2 See accompanying Mineral Reserves and Mineral Resources endnote #2.
3 See accompanying Mineral Reserves and Mineral Resources endnote #7.
4 See accompanying Mineral Reserves and Mineral Resources endnote #4.
5 See accompanying Mineral Reserves and Mineral Resources endnote #15.
6 See accompanying Mineral Reserves and Mineral Resources endnote #10.
| BARRICK YEAR-END 2019 | 120 | RESERVES AND RESOURCES |
| SILVER MINERAL RESERVES1,2,3,4 | ||||||||||||||||||||||||||||||||||||||||||||
| As at December 31, 2019 | PROVEN | PROBABLE | TOTAL | |||||||||||||||||||||||||||||||||||||||||
| Tonnes | Ag Grade | Contained Ag | Tonnes | Ag Grade | Contained Ag | Tonnes | Ag Grade | Contained Ag | ||||||||||||||||||||||||||||||||||||
| Based on attributable ounces | (Mt) | (g/t) | (Moz) | (Mt) | (g/t) | (Moz) | (Mt) | (g/t) | (Moz) | |||||||||||||||||||||||||||||||||||
AFRICA AND MIDDLE EAST | ||||||||||||||||||||||||||||||||||||||||||||
Bulyanhulu underground (84.00%)5,6 | 2.0 | 8.91 | 0.58 | 4.4 | 6.19 | 0.87 | 6.4 | 7.05 | 1.5 | |||||||||||||||||||||||||||||||||||
AFRICA AND MIDDLE EAST TOTAL | 2.0 | 8.91 | 0.58 | 4.4 | 6.19 | 0.87 | 6.4 | 7.05 | 1.5 | |||||||||||||||||||||||||||||||||||
NORTH AMERICA | ||||||||||||||||||||||||||||||||||||||||||||
Phoenix surface (61.50%) | 9.4 | 8.18 | 2.5 | 94 | 6.99 | 21 | 100 | 7.10 | 24 | |||||||||||||||||||||||||||||||||||
NORTH AMERICA TOTAL | 9.4 | 8.18 | 2.5 | 94 | 6.99 | 21 | 100 | 7.10 | 24 | |||||||||||||||||||||||||||||||||||
LATIN AMERICA AND ASIA PACIFIC | ||||||||||||||||||||||||||||||||||||||||||||
Pueblo Viejo surface (60.00%) | 10 | 14.45 | 4.7 | 61 | 16.30 | 32 | 71 | 16.04 | 37 | |||||||||||||||||||||||||||||||||||
Norte Abierto surface (50.00%) | 110 | 1.91 | 7.0 | 480 | 1.43 | 22 | 600 | 1.52 | 29 | |||||||||||||||||||||||||||||||||||
Veladero surface (50.00%) | 15 | 12.68 | 6.2 | 110 | 14.27 | 48 | 120 | 14.07 | 54 | |||||||||||||||||||||||||||||||||||
LATIN AMERICA AND ASIA PACIFIC TOTAL | 140 | 3.99 | 18 | 650 | 4.91 | 100 | 790 | 4.75 | 120 | |||||||||||||||||||||||||||||||||||
| ||||||||||||||||||||||||||||||||||||||||||||
TOTAL | 150 | 4.31 | 21 | 750 | 5.18 | 120 | 900 | 5.03 | 150 | |||||||||||||||||||||||||||||||||||
1 See accompanying Mineral Reserves and Mineral Resources endnote #1.
2 See accompanying Mineral Reserves and Mineral Resources endnote #2.
3 See accompanying Mineral Reserves and Mineral Resources endnote #7.
4 See accompanying Mineral Reserves and Mineral Resources endnote #4.
5 See accompanying Mineral Reserves and Mineral Resources endnote #15.
6 See accompanying Mineral Reserves and Mineral Resources endnote #10.
| BARRICK YEAR-END 2019 | 121 | RESERVES AND RESOURCES |
| GOLD MINERAL RESOURCES1,2,3,4 | ||||||||||||||||||||||||||||||||||||||||||||||||||||
| As at December 31, 2019 | MEASURED (M) 5,6 | INDICATED (I) 5,7 | (M) + (I) 5,6,7 | INFERRED 8 | ||||||||||||||||||||||||||||||||||||||||||||||||
| Tonnes | Grade | Contained ozs | Tonnes | Grade | Contained ozs | Contained ozs | Tonnes | Grade | Contained ozs | |||||||||||||||||||||||||||||||||||||||||||
| Based on attributable ounces | (Mt) | (g/t) | (Moz) | (Mt) | (g/t) | (Moz) | (Moz) | (Mt) | (g/t) | (Moz) | ||||||||||||||||||||||||||||||||||||||||||
AFRICA AND MIDDLE EAST | ||||||||||||||||||||||||||||||||||||||||||||||||||||
Kibali surface | 5.3 | 2.43 | 0.42 | 15 | 2.63 | 1.3 | 1.7 | 5.0 | 2.0 | 0.32 | ||||||||||||||||||||||||||||||||||||||||||
Kibali underground | 9.2 | 4.94 | 1.5 | 28 | 3.66 | 3.3 | 4.8 | 7.0 | 4.1 | 0.93 | ||||||||||||||||||||||||||||||||||||||||||
Kibali (45.00%) total | 14 | 4.02 | 1.9 | 43 | 3.30 | 4.6 | 6.5 | 12 | 3.2 | 1.2 | ||||||||||||||||||||||||||||||||||||||||||
Loulo-Gounkoto surface | 9.9 | 3.06 | 0.98 | 15 | 3.44 | 1.6 | 2.6 | 3.3 | 2.9 | 0.31 | ||||||||||||||||||||||||||||||||||||||||||
Loulo-Gounkoto underground | 14 | 4.79 | 2.2 | 21 | 5.55 | 3.8 | 6.0 | 12 | 4.1 | 1.6 | ||||||||||||||||||||||||||||||||||||||||||
Loulo-Gounkoto (80.00%) total | 24 | 4.09 | 3.2 | 36 | 4.69 | 5.4 | 8.6 | 15 | 3.9 | 1.9 | ||||||||||||||||||||||||||||||||||||||||||
Tongon surface (89.70%) | 4.6 | 2.05 | 0.31 | 11 | 2.43 | 0.86 | 1.2 | 5.3 | 2.4 | 0.41 | ||||||||||||||||||||||||||||||||||||||||||
Massawa surface9 | — | — | — | 19 | 4.00 | 2.5 | 2.5 | 3.1 | 2.2 | 0.22 | ||||||||||||||||||||||||||||||||||||||||||
Massawa underground 9 | — | — | — | — | — | — | — | 2.2 | 4.1 | 0.29 | ||||||||||||||||||||||||||||||||||||||||||
Massawa (83.25%) 9 | — | — | — | 19 | 4.00 | 2.5 | 2.5 | 5.3 | 3.0 | 0.51 | ||||||||||||||||||||||||||||||||||||||||||
Bulyanhulu surface10 | — | — | — | 1.1 | 1.19 | 0.041 | 0.041 | — | — | — | ||||||||||||||||||||||||||||||||||||||||||
Bulyanhulu underground 10 | 3.1 | 12.55 | 1.3 | 9.8 | 8.99 | 2.8 | 4.1 | 13 | 11.8 | 4.8 | ||||||||||||||||||||||||||||||||||||||||||
Bulyanhulu (84.00%) total10 | 3.1 | 12.55 | 1.3 | 11 | 8.22 | 2.9 | 4.1 | 13 | 11.8 | 4.8 | ||||||||||||||||||||||||||||||||||||||||||
North Mara surface10 | 2.3 | 2.37 | 0.18 | 27 | 1.73 | 1.5 | 1.7 | 1.8 | 1.1 | 0.060 | ||||||||||||||||||||||||||||||||||||||||||
North Mara underground10 | 0.74 | 6.13 | 0.15 | 10 | 4.57 | 1.5 | 1.7 | 6.3 | 4.5 | 0.91 | ||||||||||||||||||||||||||||||||||||||||||
North Mara (84.00%) total10 | 3.1 | 3.28 | 0.32 | 37 | 2.52 | 3.0 | 3.3 | 8.1 | 3.7 | 0.97 | ||||||||||||||||||||||||||||||||||||||||||
Buzwagi surface (84.00%)10 | — | — | — | 7.9 | 0.99 | 0.25 | 0.25 | 20 | 0.9 | 0.56 | ||||||||||||||||||||||||||||||||||||||||||
Jabal Sayid surface (50.00%) | 7.6 | 0.24 | 0.057 | 7.1 | 0.40 | 0.092 | 0.15 | 2.2 | 0.6 | 0.041 | ||||||||||||||||||||||||||||||||||||||||||
AFRICA AND MIDDLE EAST TOTAL | 57 | 3.81 | 7.0 | 170 | 3.52 | 19 | 27 | 81 | 4.0 | 10 | ||||||||||||||||||||||||||||||||||||||||||
NORTH AMERICA | ||||||||||||||||||||||||||||||||||||||||||||||||||||
Carlin surface | 47 | 2.59 | 3.9 | 130 | 1.48 | 6.4 | 10 | 12 | 1.1 | 0.40 | ||||||||||||||||||||||||||||||||||||||||||
Carlin underground | 21 | 8.23 | 5.6 | 10 | 7.67 | 2.6 | 8.2 | 3.2 | 8.0 | 0.82 | ||||||||||||||||||||||||||||||||||||||||||
Carlin (61.50%) total | 68 | 4.35 | 9.5 | 140 | 1.93 | 8.9 | 18 | 15 | 2.6 | 1.2 | ||||||||||||||||||||||||||||||||||||||||||
Cortez surface | 5.0 | 2.33 | 0.38 | 75 | 1.33 | 3.2 | 3.6 | 43 | 0.6 | 0.89 | ||||||||||||||||||||||||||||||||||||||||||
Cortez underground11 | 0.90 | 8.41 | 0.24 | 36 | 8.09 | 9.3 | 9.5 | 5.5 | 7.7 | 1.4 | ||||||||||||||||||||||||||||||||||||||||||
Cortez (61.50%) total | 5.9 | 3.26 | 0.62 | 110 | 3.51 | 12 | 13 | 49 | 1.4 | 2.2 | ||||||||||||||||||||||||||||||||||||||||||
Donlin surface (50.00%) | 3.9 | 2.52 | 0.31 | 270 | 2.24 | 19 | 20 | 46 | 2.0 | 3.0 | ||||||||||||||||||||||||||||||||||||||||||
Hemlo surface | — | — | — | 32 | 1.91 | 2.0 | 2.0 | 3.0 | 1.0 | 0.096 | ||||||||||||||||||||||||||||||||||||||||||
Hemlo underground | 1.8 | 4.25 | 0.25 | 8.6 | 3.19 | 0.88 | 1.1 | 6.0 | 4.7 | 0.91 | ||||||||||||||||||||||||||||||||||||||||||
Hemlo (100%) total | 1.8 | 4.25 | 0.25 | 41 | 2.18 | 2.9 | 3.1 | 9.1 | 3.5 | 1.0 | ||||||||||||||||||||||||||||||||||||||||||
Long Canyon surface | 0.65 | 2.79 | 0.059 | 10 | 2.65 | 0.89 | 0.95 | 1.6 | 1.6 | 0.083 | ||||||||||||||||||||||||||||||||||||||||||
Long Canyon underground | 0.085 | 11.80 | 0.032 | 1.1 | 9.29 | 0.33 | 0.36 | 0.20 | 6.1 | 0.039 | ||||||||||||||||||||||||||||||||||||||||||
Long Canyon (61.50%) total | 0.74 | 3.83 | 0.091 | 12 | 3.29 | 1.2 | 1.3 | 1.8 | 2.1 | 0.12 | ||||||||||||||||||||||||||||||||||||||||||
Turquoise Ridge surface | 24 | 2.06 | 1.6 | 32 | 1.96 | 2.0 | 3.6 | 11 | 1.6 | 0.57 | ||||||||||||||||||||||||||||||||||||||||||
Turquoise Ridge underground | 14 | 10.00 | 4.4 | 10 | 9.09 | 3.0 | 7.4 | 1.8 | 9.1 | 0.53 | ||||||||||||||||||||||||||||||||||||||||||
Turquoise Ridge (61.50%) total | 38 | 4.95 | 6.0 | 42 | 3.72 | 5.0 | 11 | 13 | 2.7 | 1.1 | ||||||||||||||||||||||||||||||||||||||||||
Phoenix surface (61.50%) | 15 | 0.60 | 0.28 | 180 | 0.53 | 3.1 | 3.4 | 12 | 0.4 | 0.15 | ||||||||||||||||||||||||||||||||||||||||||
Fourmile underground (100%) | — | — | — | — | — | — | — | 5.4 | 10.9 | 1.9 | ||||||||||||||||||||||||||||||||||||||||||
NORTH AMERICA TOTAL | 130 | 4.00 | 17 | 800 | 2.06 | 53 | 70 | 150 | 2.2 | 11 | ||||||||||||||||||||||||||||||||||||||||||
| BARRICK YEAR-END 2019 | 122 | RESERVES AND RESOURCES |
| GOLD MINERAL RESOURCES1,2,3,4 | ||||||||||||||||||||||||||||||||||||||||||||||||||||
| As at December 31, 2019 | MEASURED (M)5,6 | INDICATED (I)5,7 | (M) + (I) 5,6,7 | INFERRED8 | ||||||||||||||||||||||||||||||||||||||||||||||||
| Tonnes | Grade | Contained ozs | Tonnes | Grade | Contained ozs | Contained ozs | Tonnes | Grade | Contained ozs | |||||||||||||||||||||||||||||||||||||||||||
| Based on attributable ounces | (Mt) | (g/t) | (Moz) | (Mt) | (g/t) | (Moz) | (Moz) | (Mt) | (g/t) | (Moz) | ||||||||||||||||||||||||||||||||||||||||||
LATIN AMERICA AND ASIA PACIFIC | ||||||||||||||||||||||||||||||||||||||||||||||||||||
Pueblo Viejo surface (60.00%) | 80 | 2.41 | 6.2 | 120 | 2.25 | 9.0 | 15 | 33 | 2.1 | 2.2 | ||||||||||||||||||||||||||||||||||||||||||
Norte Abierto surface (50.00%) | 190 | 0.63 | 3.9 | 1,100 | 0.53 | 19 | 22 | 370 | 0.4 | 4.4 | ||||||||||||||||||||||||||||||||||||||||||
Pascua Lama surface (100%) | 43 | 1.86 | 2.6 | 390 | 1.49 | 19 | 21 | 15 | 1.7 | 0.86 | ||||||||||||||||||||||||||||||||||||||||||
Veladero surface (50.00%) | 18 | 0.56 | 0.33 | 180 | 0.63 | 3.6 | 4.0 | 20 | 0.7 | 0.42 | ||||||||||||||||||||||||||||||||||||||||||
Lagunas Norte surface (100%) | 1.4 | 0.94 | 0.043 | 57 | 2.31 | 4.2 | 4.3 | 1.4 | 1.1 | 0.050 | ||||||||||||||||||||||||||||||||||||||||||
Alturas surface (100%) | — | — | — | — | — | — | — | 260 | 1.1 | 8.9 | ||||||||||||||||||||||||||||||||||||||||||
Porgera surface | — | — | — | 15 | 3.24 | 1.6 | 1.6 | 7.1 | 2.6 | 0.58 | ||||||||||||||||||||||||||||||||||||||||||
Porgera underground | 1.5 | 6.57 | 0.31 | 8.7 | 6.16 | 1.7 | 2.0 | 2.8 | 6.5 | 0.57 | ||||||||||||||||||||||||||||||||||||||||||
Porgera (47.50%) total | 1.5 | 6.57 | 0.31 | 24 | 4.30 | 3.3 | 3.6 | 9.8 | 3.7 | 1.2 | ||||||||||||||||||||||||||||||||||||||||||
LATIN AMERICA AND ASIA PACIFIC TOTAL | 340 | 1.24 | 13 | 1,900 | 0.96 | 58 | 71 | 710 | 0.8 | 18 | ||||||||||||||||||||||||||||||||||||||||||
| ||||||||||||||||||||||||||||||||||||||||||||||||||||
TOTAL | 530 | 2.21 | 37 | 2,800 | 1.43 | 130 | 170 | 940 | 1.3 | 39 | ||||||||||||||||||||||||||||||||||||||||||
1 Mineral resources which are not mineral reserves do not have demonstrated economic viability.
2 See accompanying Mineral Reserves and Mineral Resources endnote #1.
3 See accompanying Mineral Reserves and Mineral Resources endnote #3.
4 See accompanying Mineral Reserves and Mineral Resources endnote #4.
5 See accompanying Mineral Reserves and Mineral Resources endnote #5.
6 Measured mineral resources are shown inclusive of proven mineral reserves.
7Indicated mineral resources are shown inclusive of probable mineral reserves.
8 See accompanying Mineral Reserves and Mineral Resources endnote #6.
9 See accompanying Mineral Reserves and Mineral Resources endnote #9.
10 See accompanying Mineral Reserves and Mineral Resources endnote #10.
11 See accompanying Mineral Reserves and Mineral Resources endnote #17.
| BARRICK YEAR-END 2019 | 123 | RESERVES AND RESOURCES |
| COPPER MINERAL RESOURCES1,2,3,4,5 | ||||||||||||||||||||||||||||||||||||||||||||||||||||
| As at December 31, 2019 | MEASURED (M)6,7 | INDICATED (I)7,8 | (M) + (I) 6,7,8 | INFERRED9 | ||||||||||||||||||||||||||||||||||||||||||||||||
| Tonnes | Grade | Contained lbs | Tonnes | Grade | Contained lbs | Contained lbs | Tonnes | Grade | Contained lbs | |||||||||||||||||||||||||||||||||||||||||||
| Based on attributable pounds | (Mt) | (%) | (Mlb) | (Mt) | (%) | (Mlb) | (Mlb) | (Mt) | (%) | (Mlb) | ||||||||||||||||||||||||||||||||||||||||||
AFRICA AND MIDDLE EAST | ||||||||||||||||||||||||||||||||||||||||||||||||||||
Bulyanhulu underground (84.00%)10 | 3.1 | 0.54 | 37 | 9.8 | 0.44 | 94 | 130 | 13 | 0.6 | 170 | ||||||||||||||||||||||||||||||||||||||||||
Lumwana surface (100%) | 81 | 0.53 | 940 | 850 | 0.65 | 12,000 | 13,000 | 9.6 | 0.5 | 120 | ||||||||||||||||||||||||||||||||||||||||||
Jabal Sayid surface | 0.079 | 3.21 | 5.6 | — | — | — | 5.6 | — | — | — | ||||||||||||||||||||||||||||||||||||||||||
Jabal Sayid underground | 7.5 | 2.66 | 440 | 7.1 | 2.38 | 370 | 810 | 2.2 | 2.1 | 100 | ||||||||||||||||||||||||||||||||||||||||||
Jabal Sayid (50.00%) total | 7.6 | 2.66 | 440 | 7.1 | 2.38 | 370 | 820 | 2.2 | 2.1 | 100 | ||||||||||||||||||||||||||||||||||||||||||
AFRICA AND MIDDLE EAST TOTAL | 91 | 0.71 | 1,400 | 860 | 0.66 | 13,000 | 14,000 | 24 | 0.7 | 390 | ||||||||||||||||||||||||||||||||||||||||||
NORTH AMERICA | ||||||||||||||||||||||||||||||||||||||||||||||||||||
Phoenix surface (61.50%) | 43 | 0.18 | 170 | 260 | 0.16 | 880 | 1,100 | 18 | 0.2 | 62 | ||||||||||||||||||||||||||||||||||||||||||
NORTH AMERICA TOTAL | 43 | 0.18 | 170 | 260 | 0.16 | 880 | 1,100 | 18 | 0.2 | 62 | ||||||||||||||||||||||||||||||||||||||||||
LATIN AMERICA AND ASIA PACIFIC | ||||||||||||||||||||||||||||||||||||||||||||||||||||
Zaldívar surface (50.00%) | 350 | 0.41 | 3,200 | 280 | 0.38 | 2,400 | 5,500 | 29 | 0.4 | 260 | ||||||||||||||||||||||||||||||||||||||||||
Norte Abierto surface (50.00%) | 170 | 0.21 | 790 | 1000 | 0.21 | 4,700 | 5,500 | 360 | 0.2 | 1,400 | ||||||||||||||||||||||||||||||||||||||||||
LATIN AMERICA AND ASIA PACIFIC TOTAL | 520 | 0.34 | 3,900 | 1,300 | 0.25 | 7,100 | 11,000 | 390 | 0.2 | 1,700 | ||||||||||||||||||||||||||||||||||||||||||
| ||||||||||||||||||||||||||||||||||||||||||||||||||||
TOTAL | 660 | 0.38 | 5,500 | 2,400 | 0.38 | 21,000 | 26,000 | 430 | 0.2 | 2,200 | ||||||||||||||||||||||||||||||||||||||||||
1 Mineral resources which are not mineral reserves do not have demonstrated economic viability.
2 See accompanying Mineral Reserves and Mineral Resources endnote #1.
3 See accompanying Mineral Reserves and Mineral Resources endnote #3.
4 See accompanying Mineral Reserves and Mineral Resources endnote #4.
5 See accompanying Mineral Reserves and Mineral Resources endnote #7.
6 Measured mineral resources are shown inclusive of proven mineral reserves.
7 See accompanying Mineral Reserves and Mineral Resources endnote #5.
8 Indicated mineral resources are shown inclusive of probable mineral reserves.
9 See accompanying Mineral Reserves and Mineral Resources endnote #6.
10 See accompanying Mineral Reserves and Mineral Resources endnote #10.
| BARRICK YEAR-END 2019 | 124 | RESERVES AND RESOURCES |
| SILVER MINERAL RESOURCES1,2,3,4,5 | ||||||||||||||||||||||||||||||||||||||||||||||||||||
| As at December 31, 2019 | MEASURED (M)6,7 | INDICATED (I)7,8 | (M) + (I) 6,7,8 | INFERRED9 | ||||||||||||||||||||||||||||||||||||||||||||||||
| Tonnes | Ag Grade | Contained Ag | Tonnes | Ag Grade | Contained ozs | Contained ozs | Tonnes | Ag Grade | Contained ozs | |||||||||||||||||||||||||||||||||||||||||||
| Based on attributable ounces | (Mt) | (g/t) | (Moz) | (Mt) | (g/t) | (Moz) | (Moz) | (Mt) | (g/t) | (Moz) | ||||||||||||||||||||||||||||||||||||||||||
AFRICA AND MIDDLE EAST | ||||||||||||||||||||||||||||||||||||||||||||||||||||
Bulyanhulu underground (84.00%)10 | 3.1 | 7.96 | 0.80 | 9.8 | 6.17 | 1.9 | 2.7 | 13 | 9.0 | 3.7 | ||||||||||||||||||||||||||||||||||||||||||
AFRICA AND MIDDLE EAST TOTAL | 3.1 | 7.96 | 0.80 | 9.8 | 6.17 | 1.9 | 2.7 | 13 | 9.0 | 3.7 | ||||||||||||||||||||||||||||||||||||||||||
NORTH AMERICA | ||||||||||||||||||||||||||||||||||||||||||||||||||||
Phoenix surface (61.50%) | 15 | 7.42 | 3.5 | 180 | 6.38 | 37 | 41 | 12 | 6.1 | 2.5 | ||||||||||||||||||||||||||||||||||||||||||
NORTH AMERICA TOTAL | 15 | 7.42 | 3.5 | 180 | 6.38 | 37 | 41 | 12 | 6.1 | 2.5 | ||||||||||||||||||||||||||||||||||||||||||
LATIN AMERICA AND ASIA PACIFIC | ||||||||||||||||||||||||||||||||||||||||||||||||||||
Pueblo Viejo surface (60.00%) | 80 | 16.16 | 42 | 120 | 11.17 | 45 | 86 | 33 | 10.6 | 11 | ||||||||||||||||||||||||||||||||||||||||||
Norte Abierto surface (50.00%) | 190 | 1.62 | 10 | 1,100 | 1.23 | 43 | 53 | 370 | 1.0 | 11 | ||||||||||||||||||||||||||||||||||||||||||
Pascua-Lama surface (100%) | 43 | 57.21 | 79 | 390 | 52.22 | 660 | 740 | 15 | 17.8 | 8.8 | ||||||||||||||||||||||||||||||||||||||||||
Lagunas Norte surface (100%) | 1.4 | 2.69 | 0.12 | 57 | 5.40 | 9.9 | 10 | 1.4 | 3.5 | 0.16 | ||||||||||||||||||||||||||||||||||||||||||
Veladero surface (50.00%) | 18 | 11.97 | 7.0 | 180 | 14.06 | 80 | 87 | 20 | 15.0 | 9.5 | ||||||||||||||||||||||||||||||||||||||||||
LATIN AMERICA AND ASIA PACIFIC TOTAL | 330 | 12.78 | 140 | 1,800 | 14.19 | 840 | 970 | 440 | 2.9 | 41 | ||||||||||||||||||||||||||||||||||||||||||
| ||||||||||||||||||||||||||||||||||||||||||||||||||||
TOTAL | 350 | 12.52 | 140 | 2,000 | 13.44 | 870 | 1,000 | 460 | 3.2 | 47 | ||||||||||||||||||||||||||||||||||||||||||
1 Mineral resources which are not mineral reserves do not have demonstrated economic viability.
2 See accompanying Mineral Reserves and Mineral Resources endnote #1.
3 See accompanying Mineral Reserves and Mineral Resources endnote #3.
4 See accompanying Mineral Reserves and Mineral Resources endnote #4.
5 See accompanying Mineral Reserves and Mineral Resources endnote #7.
6 Measured mineral resources are shown inclusive of proven mineral reserves.
7 See accompanying Mineral Reserves and Mineral Resources endnote #5.
8Indicated mineral resources are shown inclusive of probable mineral reserves.
9 See accompanying Mineral Reserves and Mineral Resources endnote #6.
10 See accompanying Mineral Reserves and Mineral Resources endnote #10.
| BARRICK YEAR-END 2019 | 125 | RESERVES AND RESOURCES |
| SUMMARY GOLD MINERAL RESERVES1,2,3 | ||||||||||||||||||||||||||||||
| For the years ended December 31 | 2019 | 2018 | ||||||||||||||||||||||||||||
| Ownership | Tonnes | Grade | Ounces | Ownership | Tonnes | Grade | Ounces | |||||||||||||||||||||||
| Based on attributable ounces | % | (Mt) | (g/t) | (Moz) | % | (Mt) | (g/t) | (Moz) | ||||||||||||||||||||||
AFRICA AND MIDDLE EAST | ||||||||||||||||||||||||||||||
Kibali surface 4 | 45.00% | 11 | 2.92 | 0.99 | ||||||||||||||||||||||||||
Kibali underground 4 | 45.00% | 20 | 4.87 | 3.2 | ||||||||||||||||||||||||||
Kibali Total 4 | 45.00% | 31 | 4.20 | 4.2 | ||||||||||||||||||||||||||
Loulo-Gounkoto surface 4 | 80.00% | 18 | 3.28 | 1.9 | ||||||||||||||||||||||||||
Loulo-Gounkoto underground4 | 80.00% | 27 | 5.16 | 4.5 | ||||||||||||||||||||||||||
Loulo-Gounkoto Total4 | 80.00% | 45 | 4.41 | 6.4 | ||||||||||||||||||||||||||
Tongon surface4 | 89.70% | 8.9 | 2.14 | 0.61 | ||||||||||||||||||||||||||
Massawa surface 4,5 | 83.25% | 17 | 3.94 | 2.2 | ||||||||||||||||||||||||||
Bulyanhulu surface6 | 84.00% | 1.1 | 1.19 | 0.041 | ||||||||||||||||||||||||||
Bulyanhulu underground 6 | 84.00% | 6.4 | 10.70 | 2.2 | ||||||||||||||||||||||||||
Bulyanhulu Total6 | 84.00% | 7.5 | 9.34 | 2.2 | 63.90 | % | 6.6 | 8.2 | 1.7 | |||||||||||||||||||||
North Mara surface 6 | 84.00% | 15 | 1.49 | 0.73 | ||||||||||||||||||||||||||
North Mara underground6 | 84.00% | 5.8 | 5.40 | 1.0 | ||||||||||||||||||||||||||
North Mara Total6 | 84.00% | 21 | 2.57 | 1.7 | 63.90 | % | 17 | 2.59 | 1.4 | |||||||||||||||||||||
Buzwagi surface6 | 84.00% | 5.1 | 0.84 | 0.14 | 63.90 | % | 6.8 | 0.90 | 0.20 | |||||||||||||||||||||
Jabal Sayid surface | 50.00% | 13 | 0.24 | 0.097 | ||||||||||||||||||||||||||
AFRICA AND MIDDLE EAST TOTAL | 150 | 3.69 | 18 | |||||||||||||||||||||||||||
NORTH AMERICA | ||||||||||||||||||||||||||||||
Hemlo surface | 100% | 1.6 | 1.28 | 0.066 | ||||||||||||||||||||||||||
Hemlo underground | 100% | 9.0 | 4.37 | 1.3 | ||||||||||||||||||||||||||
Hemlo Total | 100% | 11 | 3.90 | 1.3 | 100 | % | 24 | 2.48 | 1.9 | |||||||||||||||||||||
Golden Sunlight | 100 | % | 0.30 | 1.70 | — | |||||||||||||||||||||||||
Long Canyon surface Total7 | 61.50% | 4.9 | 2.48 | 0.39 | ||||||||||||||||||||||||||
Phoenix surface7 | 61.50% | 100 | 0.59 | 2.0 | ||||||||||||||||||||||||||
Carlin surface8 | 61.50% | 100 | 2.15 | 7.1 | 100 | % | 63 | 2.99 | 6.1 | |||||||||||||||||||||
Carlin Underground8 | 61.50% | 19 | 9.59 | 5.9 | 100 | % | 8.9 | 9.98 | 2.9 | |||||||||||||||||||||
Carlin Total8 | 61.50% | 120 | 3.32 | 13.0 | 100 | % | 72 | 3.91 | 9.0 | |||||||||||||||||||||
Cortez surface9 | 61.50% | 57 | 1.35 | 2.5 | ||||||||||||||||||||||||||
Cortez Underground9,10 | 61.50% | 11 | 9.91 | 3.6 | ||||||||||||||||||||||||||
Cortez Total9 | 61.50% | 69 | 2.77 | 6.1 | 100 | % | 150 | 1.87 | 11 | |||||||||||||||||||||
Turquoise Ridge surface11 | 61.50% | 34 | 1.95 | 2.1 | ||||||||||||||||||||||||||
Turquoise Ridge underground11 | 61.50% | 18 | 10.90 | 6.2 | ||||||||||||||||||||||||||
Turquoise Ridge Total11 | 61.50% | 51 | 5.02 | 8.3 | 75 | % | 16 | 12.97 | 6.8 | |||||||||||||||||||||
NORTH AMERICA TOTAL | 360 | 2.68 | 31 | |||||||||||||||||||||||||||
LATIN AMERICA AND ASIA PACIFIC | ||||||||||||||||||||||||||||||
Norte Abierto surface | 50.00% | 600 | 0.60 | 12.0 | 50.00 | % | 600 | 0.60 | 12 | |||||||||||||||||||||
Pueblo Viejo surface | 60.00% | 71 | 2.49 | 5.7 | 60.00 | % | 77 | 2.66 | 6.6 | |||||||||||||||||||||
Veladero surface | 50.00% | 120 | 0.73 | 2.8 | 50.00 | % | 110 | 0.74 | 2.5 | |||||||||||||||||||||
Lagunas Norte | 100% | — | — | — | 100 | % | 45 | 2.74 | 4.0 | |||||||||||||||||||||
Porgera surface | 47.50% | 8.5 | 3.63 | 0.99 | ||||||||||||||||||||||||||
Porgera underground | 47.50% | 6.6 | 6.33 | 1.3 | ||||||||||||||||||||||||||
Porgera Total | 47.50% | 15 | 4.81 | 2.3 | 47.50 | % | 13 | 4.93 | 2.1 | |||||||||||||||||||||
Kalgoorlie12 | 50.00 | % | 96 | 1.18 | 3.7 | |||||||||||||||||||||||||
LATIN AMERICA AND ASIA PACIFIC TOTAL | 810 | 0.87 | 22 | |||||||||||||||||||||||||||
Other | 14 | 0.24 | 0.10 | |||||||||||||||||||||||||||
TOTAL | 1,300 | 1.68 | 71 | 1,200 | 1.56 | 62 | ||||||||||||||||||||||||
1 See accompanying Mineral Reserves and Mineral Resources endnote #1.
2 See accompanying Mineral Reserves and Mineral Resources endnote #2.
3 See accompanying Mineral Reserves and Mineral Resources endnote #4.
4 See accompanying Mineral Reserve and Mineral Resource endnote #8.
5 See accompanying Mineral Reserve and Mineral Resource endnote #9.
6 See accompanying Mineral Reserve and Mineral Resource endnote #10.
| BARRICK YEAR-END 2019 | 126 | RESERVES AND RESOURCES |
7 See accompanying Mineral Reserve and Mineral Resource endnote #11.
8 See accompanying Mineral Reserve and Mineral Resource endnote #12.
9 See accompanying Mineral Reserve and Mineral Resource endnote #13.
10 See accompanying Mineral Reserve and Mineral Resource endnote #17.
11 See accompanying Mineral Reserve and Mineral Resource endnote #14.
12 See accompanying Mineral Reserve and Mineral Resource endnote #16.
| BARRICK YEAR-END 2019 | 127 | RESERVES AND RESOURCES |
Mineral Reserves and Resources Endnotes
| 1. | Mineral reserves (“reserves”) and mineral resources (“resources”) have been estimated as at December 31, 2019 (unless otherwise noted) in accordance with National Instrument43-101 as required by Canadian securities regulatory authorities. For United States reporting purposes, the SEC has adopted amendments to its disclosure rules to modernize the mineral property disclosure requirements for issuers whose securities are registered with the SEC under the Securities and Exchange Act of 1934, as amended (the “Exchange Act”). These amendments became effective February 25, 2019 (the “SEC Modernization Rules”) with compliance required for the first fiscal year beginning on or after January 1, 2021. The SEC Modernization Rules replace the historical property disclosure requirements for mining registrants that were included in SEC Industry Guide 7, which will be rescinded from and after the required compliance date of the SEC Modernization Rules. As a result of the adoption of the SEC Modernization Rules, the SEC now recognizes estimates of “measured”, “indicated” and “inferred” mineral resources. In addition, the SEC has amended its definitions of “proven mineral reserves” and “probable mineral reserves” to be substantially similar to the corresponding Canadian Institute of Mining, Metallurgy and Petroleum definitions, as required by NI43-101. U.S. investors should understand that “inferred” mineral resources have a great amount of uncertainty as to their existence and great uncertainty as to their economic and legal feasibility. In addition, U.S. investors are cautioned not to assume that any part or all of Barrick’s mineral resources constitute or will be converted into reserves. Mineral resource and mineral reserve estimations have been prepared by employees of Barrick, its joint venture partners or its joint venture operating companies, as applicable, under the supervision of regional Mineral Resource Managers Simon Bottoms, Africa & Middle East Mineral Resource Manager and Chad Yuhasz, Latin America & Australia Pacific Mineral Resource Manager, Craig Fiddes, North America Resource Modeling Manager and reviewed by Rodney Quick Barrick Executive Mineral Resource Management and Evaluation. Except as noted below, reserves have been estimated based on an assumed gold price of US$1,200 per ounce, an assumed silver price of US$16.50 per ounce, and an assumed copper price of US$2.75 per pound and long-term average exchange rates of 1.30 CAD/US$. Reserve estimates incorporate current and/or expected mine plans and cost levels at each property.Varying cut-off grades have been used depending on the mine and type of ore contained in the reserves. Barrick’s normal data verification procedures have been employed in connection with the calculations. Verification procedures include industry-standard quality control practices. Resources as at December 31, 2019 have been estimated usingvarying cut-off grades, depending on both the type of mine or project, its maturity and ore types at each property. |
| 2. | In confirming our annual reserves for each of our mineral properties, projects, and operations, we conduct a reserve test on December 31 of each year to verify that the future undiscounted cash flow from reserves is positive. The cash flow ignores all sunk costs and only considers future operating and closure expenses as well as any future capital costs. |
| 3. | The Barrick 2018 mineral resources were reported on an exclusive basis and exclude all areas that form mineral reserves; the Barrick 2019 mineral resources are reported on an inclusive basis and include all areas that form mineral reserves, reported at a mineral resourcecut-off and associated commodity price. As a result, the respective Barrick 2018 mineral resources are not directly comparable to that of the Barrick 2019 mineral resources. |
| 4. | All mineral resource and mineral reserve estimates of tonnes, Au oz, Ag oz and Cu lb are reported to the second significant digit. |
| 5. | All measured and indicated mineral resource estimates of grade and all proven and probable mineral reserve estimates of grade for Au g/t, Ag g/t and Cu % are reported to 2 decimal places. |
| 6. | All inferred mineral resource estimates of grade for Au g/t, Ag g/t and Cu % are reported to 1 decimal place. |
| 7. | 2019 polymetallic mineral resources and mineral reserves are estimated using the combined value of gold, copper & silver and accordingly are reported as Gold, Copper & Silver mineral resources and mineral reserves. |
| 8. | These sites were acquired as a result of the Merger and therefore are not reported as of December 31, 2018. |
| 9. | On December 10, 2019, Barrick entered into an agreement to sell its interest in Massawa to Teranga Gold Corporation. The transaction is expected to close in the first quarter of 2020. For additional information, see page 40 of Barrick’s Fourth Quarter and Year End Report 2020. |
| 10. | Formerly known as Acacia Mining plc. On September 17, 2019, Barrick acquired all of the shares of Acacia it did not own, bringing its ownership of Bulyanhulu, North Mara and Buzwagi up from 63.9% to 100%. On January 24, 2020, Barrick announced the signing of an agreement with the GoT, through which, among other things, the GoT will acquire a 16% free-carried interest in these sites, expected to be made effective as of January 1, 2020. For convenience, Barrick is reporting these mineral reserves and resources at its resulting 84% ownership interest. |
| 11. | These sites were acquired as a result of the formation of Nevada Gold Mines on July 1, 2019. |
| 12. | On July 1, 2019, Barrick’s Goldstrike and Newmont’s Carlin were contributed to Nevada Gold Mines and are now referred to as Carlin. As a result, the amounts presented as of December 31, 2018 represent Goldstrike on a 100% basis (including our 60% share of South Arturo), and the amounts presented as of December 31, 2019 represent Carlin and Goldstrike (including our 60% share of South Arturo) on a 61.5% basis. |
| 13. | On July 1, 2019, Cortez was contributed to Nevada Gold Mines. As a result, Barrick now holds a 61.5% interest in Cortez. The amounts presented as of December 31, 2018 represent Cortez and Goldrush on a 100% basis, and the amounts presented as of December 31, 2019 represent Cortez and Goldrush on a 61.5% basis. |
| BARRICK YEAR-END 2019 | 128 | RESERVES AND RESOURCES |
| 14. | On July 1, 2019, Barrick’s 75% interest in Turquoise Ridge and Newmont’s Twin Creeks and 25% interest in Turquoise Ridge were contributed to Nevada Gold Mines. As a result, the amounts presented as of December 31, 2018 are based on our 75% interest in Turquoise Ridge and the amounts presented as of December 31, 2019 represent our 61.5% share of Turquoise Ridge and Twin Creeks, now referred to as Turquoise Ridge. |
| 15. | Silver and copper probable reserve tonnage at the Bulyanhulu mine is less than the gold probable reserve tonnage because the gold reserve includes 1.3 million tonnes of tailings material which are being separately reprocessed for recovery of gold only. |
| 16. | On November 28, 2019, we completed the sale of our 50% interest in Kalgoorlie in Western Australia to Saracen Mineral Holdings Limited. For additional information, see page 40 of Barrick’s Fourth Quarter and Year End Report 2019. |
| 17. | Cortez underground includes 3.9 million tonnes at 9.69 g/t for 1.2 million ounces of probable reserves, 26.3 million tonnes at 7.80 g/t for 6.6 million ounces of indicated resources and 4.8 million tonnes at 7.60 g/t for 1.2 million ounces of inferred resources related to Goldrush. As noted in endnote #3, mineral resources are reported on an inclusive basis. |
| BARRICK YEAR-END 2019 | 129 | RESERVES AND RESOURCES |
Consolidated Statements of Income
(unaudited)
| Barrick Gold Corporation | ||||||||
| For the years ended December 31 (in millions of United States dollars, except per share data) | 2019 | 2018 | ||||||
Revenue | $9,717 | $7,243 | ||||||
Costs and expenses | ||||||||
Cost of sales | 6,911 | 5,220 | ||||||
General and administrative expenses | 212 | 265 | ||||||
Exploration, evaluation and project expenses | 342 | 383 | ||||||
Impairment (reversals) charges | (1,423 | ) | 900 | |||||
Loss on currency translation | 109 | 136 | ||||||
Closed mine rehabilitation | 5 | (13 | ) | |||||
Income from equity investees | (165 | ) | (46 | ) | ||||
Other (income) expense | (3,100 | ) | 90 | |||||
Income before finance items and income taxes | 6,826 | 308 | ||||||
Finance costs, net | (469 | ) | (545 | ) | ||||
Income (loss) before income taxes | 6,357 | (237 | ) | |||||
Income tax expense | (1,783 | ) | (1,198 | ) | ||||
Net income (loss) | $4,574 | ($1,435 | ) | |||||
Attributable to: | ||||||||
Equity holders of Barrick Gold Corporation | $3,969 | ($1,545 | ) | |||||
Non-controlling interests | $605 | $110 | ||||||
Earnings (loss) per share data attributable to the equity holders of Barrick Gold Corporation | ||||||||
Net income (loss) | ||||||||
Basic | $2.26 | ($1.32 | ) | |||||
Diluted | $2.26 | ($1.32 | ) | |||||
Consolidated Statements of Comprehensive Income
(unaudited)
| Barrick Gold Corporation | ||||||||
| For the years ended December 31 (in millions of United States dollars) | 2019 | 2018 | ||||||
Net income (loss) | $ | 4,574 | ($ | 1,435 | ) | |||
Other comprehensive income (loss), net of taxes | ||||||||
Items that may be reclassified subsequently to profit or loss: | ||||||||
Unrealized gains (losses) on derivatives designated as cash flow hedges, net of tax $nil and ($12) | — | 8 | ||||||
Realized (gains) losses on derivatives designated as cash flow hedges, net of tax $nil and $3 | — | (2 | ) | |||||
Currency translation adjustments, net of tax $nil and $nil | (6 | ) | (9 | ) | ||||
Items that will not be reclassified to profit or loss: | ||||||||
Actuarial gain (loss) on post-employment benefit obligations, net of tax ($3) and $nil | (6 | ) | (2 | ) | ||||
Net change on equity investments, net of tax $nil and $nil | 48 | 16 | ||||||
Total other comprehensive income | 36 | 11 | ||||||
Total comprehensive income (loss) | $ | 4,610 | ($ | 1,424 | ) | |||
Attributable to: | ||||||||
Equity holders of Barrick Gold Corporation | $ | 4,005 | ($ | 1,534 | ) | |||
Non-controlling interests | $605 | $110 | ||||||
Consolidated Statements of Cash Flow
(unaudited)
Barrick Gold Corporation
| For the years ended December 31 (in millions of United States dollars) | 2019 | 2018 | ||||||
OPERATING ACTIVITIES | ||||||||
Net income (loss) | $4,574 | ($1,435 | ) | |||||
Adjustments for the following items: | ||||||||
Depreciation | 2,032 | 1,457 | ||||||
Finance costs | 500 | 560 | ||||||
Impairment (reversals) charges | (1,423 | ) | 900 | |||||
Income tax expense | 1,783 | 1,198 | ||||||
Loss on currency translation | 109 | 136 | ||||||
Gain on sale ofnon-current assets | (441 | ) | (68 | ) | ||||
Remeasurement of Turquoise Ridge to fair value | (1,886 | ) | — | |||||
Change in working capital | (357 | ) | (173 | ) | ||||
Other operating activities
| (1,070 | ) | (62 | ) | ||||
Operating cash flows before interest and income taxes
| 3,821 | 2,513 | ||||||
Interest paid | (333 | ) | (350 | ) | ||||
Income taxes paid | (655 | ) | (398 | ) | ||||
Net cash provided by operating activities
| 2,833 | 1,765 | ||||||
INVESTING ACTIVITIES | ||||||||
Property, plant and equipment | ||||||||
Capital expenditures | (1,701 | ) | (1,400 | ) | ||||
Sales proceeds | 41 | 70 | ||||||
Divestitures | 750 | — | ||||||
Investment purchases | (4 | ) | (159 | ) | ||||
Cash acquired in merger | 751 | — | ||||||
Other investing activities
| 213 | (5 | ) | |||||
Net cash provided by (used in) investing activities
| 50 | (1,494 | ) | |||||
FINANCING ACTIVITIES | ||||||||
Lease repayments | (28 | ) | — | |||||
Debt repayments | (281 | ) | (687 | ) | ||||
Dividends | (548 | ) | (125 | ) | ||||
Funding fromnon-controlling interests | 140 | 24 | ||||||
Disbursements tonon-controlling interests | (421 | ) | (108 | ) | ||||
Other financing activities
| (1 | ) | (29 | ) | ||||
Net cash used in financing activities
| (1,139 | ) | (925 | ) | ||||
Effect of exchange rate changes on cash and equivalents
| (1 | ) | (9 | ) | ||||
Net increase (decrease) in cash and equivalents | 1,743 | (663 | ) | |||||
Cash and equivalents at beginning of year
| 1,571 | 2,234 | ||||||
Cash and equivalents at the end of year
| $3,314 | $1,571 | ||||||
Consolidated Balance Sheets
(unaudited)
Barrick Gold Corporation
(in millions of United States dollars) | As at December 31, 2019 | As at December 31, 2018 | ||||||
ASSETS | ||||||||
Current assets | ||||||||
Cash and equivalents | $3,314 | $1,571 | ||||||
Accounts receivable | 363 | 248 | ||||||
Inventories | 2,289 | 1,852 | ||||||
Other current assets | 565 | 307 | ||||||
Total current assets (excluding assets classified asheld-for-sale) | 6,531 | 3,978 | ||||||
Assets classified asheld-for-sale | 356 | — | ||||||
Total current assets | 6,887 | 3,978 | ||||||
Non-current assets | ||||||||
Non-current portion of inventory | 2,300 | 1,696 | ||||||
Equity in investees | 4,527 | 1,234 | ||||||
Property, plant and equipment | 24,141 | 12,826 | ||||||
Intangible assets | 226 | 227 | ||||||
Goodwill | 4,769 | 1,176 | ||||||
Deferred income tax assets | 235 | 259 | ||||||
Other assets | 1,307 | 1,235 | ||||||
Total assets | $44,392 | $22,631 | ||||||
LIABILITIES AND EQUITY | ||||||||
Current liabilities | ||||||||
Accounts payable | $1,190 | $1,101 | ||||||
Debt | 375 | 43 | ||||||
Current income tax liabilities | 92 | 203 | ||||||
Other current liabilities | 622 | 321 | ||||||
Total current liabilities (excluding liabilities classified asheld-for-sale) | 2,279 | 1,668 | ||||||
Liabilities classified asheld-for-sale | — | — | ||||||
Total current liabilities | 2,279 | 1,668 | ||||||
Non-current liabilities | ||||||||
Debt | 5,161 | 5,695 | ||||||
Provisions | 3,114 | 2,904 | ||||||
Deferred income tax liabilities | 3,091 | 1,236 | ||||||
Other liabilities | 920 | 1,743 | ||||||
Total liabilities | 14,565 | 13,246 | ||||||
Equity | ||||||||
Capital stock | 29,231 | 20,883 | ||||||
Deficit | (9,722 | ) | (13,453 | ) | ||||
Accumulated other comprehensive loss | (122 | ) | (158 | ) | ||||
Other | 2,045 | 321 | ||||||
Total equity attributable to Barrick Gold Corporation shareholders | 21,432 | 7,593 | ||||||
Non-controlling interests | 8,395 | 1,792 | ||||||
Total equity | 29,827 | 9,385 | ||||||
Contingencies and commitments | ||||||||
Total liabilities and equity | $44,392 | $22,631 | ||||||
Consolidated Statements of Changes in Equity
(Unaudited)
| Barrick Gold Corporation | Attributable to equity holders of the Company | |||||||||||||||||||||||||||||||
| (in millions of United States dollars) | Common Shares (in thousands) | Capital stock | Retained earnings (deficit) | Accumulated other comprehensive income (loss)1 | Other2 | Total equity attributable to shareholders | Non- controlling interests | Total equity | ||||||||||||||||||||||||
At January 1, 2019 | 1,167,847 | $20,883 | ($13,453 | ) | ($158 | ) | $321 | $7,593 | $1,792 | $9,385 | ||||||||||||||||||||||
Net income (loss) | — | — | 3,969 | — | — | 3,969 | 605 | 4,574 | ||||||||||||||||||||||||
Total other comprehensive income | — | — | — | 36 | — | 36 | — | 36 | ||||||||||||||||||||||||
Total comprehensive income (loss) | — | $— | $3,969 | $36 | $— | $4,005 | $605 | $4,610 | ||||||||||||||||||||||||
Transactions with owners | ||||||||||||||||||||||||||||||||
Dividends | — | — | (218 | ) | — | — | (218 | ) | — | (218 | ) | |||||||||||||||||||||
Merger with Randgold Resources Limited | 583,669 | 7,903 | — | — | — | 7,903 | 872 | 8,775 | ||||||||||||||||||||||||
Nevada Gold Mines JV with Newmont Goldcorp Corporation | — | — | — | — | 1,645 | 1,645 | 5,910 | 7,555 | ||||||||||||||||||||||||
Acquisition of 36.1% of Acacia Mining plc | 24,837 | 423 | — | — | 70 | 493 | (495 | ) | (2 | ) | ||||||||||||||||||||||
Issued on exercise of stock options | 131 | 2 | — | — | — | 2 | — | 2 | ||||||||||||||||||||||||
Funding fromnon-controlling interests | — | — | — | — | — | — | 140 | 140 | ||||||||||||||||||||||||
Other decrease innon-controlling interests | — | — | — | — | — | — | (429 | ) | (429 | ) | ||||||||||||||||||||||
Dividend reinvestment plan | 1,443 | 20 | (20 | ) | — | — | — | — | — | |||||||||||||||||||||||
Share-based payments | — | — | — | — | 9 | 9 | — | 9 | ||||||||||||||||||||||||
Total transactions with owners | 610,080 | $8,348 | ($238 | ) | $— | $1,724 | $9,834 | $5,998 | $15,832 | |||||||||||||||||||||||
At December 31, 2019 | 1,777,927 | $29,231 | ($9,722 | ) | ($122 | ) | $2,045 | $21,432 | $8,395 | $29,827 | ||||||||||||||||||||||
At December 31, 2017 | 1,166,577 | $20,893 | ($11,759 | ) | ($169 | ) | $321 | $9,286 | $1,781 | $11,067 | ||||||||||||||||||||||
Impact of adopting IFRS 15 on January 1, 2018 | — | — | 64 | — | — | 64 | — | 64 | ||||||||||||||||||||||||
At January 1, 2018 (restated) | 1,166,577 | $20,893 | ($11,695 | ) | ($169 | ) | $321 | $9,350 | $1,781 | $11,131 | ||||||||||||||||||||||
Net (loss) income | — | — | (1,545 | ) | — | — | (1,545 | ) | 110 | (1,435 | ) | |||||||||||||||||||||
Total other comprehensive income | — | — | — | 11 | — | 11 | — | 11 | ||||||||||||||||||||||||
Total comprehensive (loss) income | — | $— | ($1,545 | ) | $11 | $— | ($1,534 | ) | $110 | ($1,424 | ) | |||||||||||||||||||||
Transactions with owners | ||||||||||||||||||||||||||||||||
Dividends | — | — | (199 | ) | — | — | (199 | ) | — | (199 | ) | |||||||||||||||||||||
Issued on exercise of stock options | 20 | — | — | — | — | — | — | — | ||||||||||||||||||||||||
Funding fromnon-controlling interests | — | — | — | — | — | — | 24 | 24 | ||||||||||||||||||||||||
Other decrease innon-controlling interests | — | — | — | — | — | — | (123 | ) | (123 | ) | ||||||||||||||||||||||
Dividend reinvestment plan | 1,250 | 14 | (14 | ) | — | — | — | — | — | |||||||||||||||||||||||
Other3 | — | (24 | ) | — | — | — | (24 | ) | — | (24 | ) | |||||||||||||||||||||
Total transactions with owners | 1,270 | ($10 | ) | ($213 | ) | $— | $— | ($223 | ) | ($99 | ) | ($322 | ) | |||||||||||||||||||
At December 31, 2018 | 1,167,847 | $20,883 | ($13,453 | ) | ($158 | ) | $321 | $7,593 | $1,792 | $9,385 | ||||||||||||||||||||||
| 1 | Includes cumulative translation adjustments as at December 31, 2019: $88 million loss (December 31, 2018: $82 million loss). |
| 2 | Includes additionalpaid-in capital as at December 31, 2019: $2,007 million (December 31, 2018: $283 million). |
| 3 | Represents a reversal of a previously recognized deferred tax asset, which was originally recognized in capital stock. |
Corporate Office
Barrick Gold Corporation
161 Bay Street, Suite 3700
Toronto, Ontario M5J 2S1
Canada
Telephone: +1 416861-9911
Email: investor@barrick.com
Website: www.barrick.com
Shares Listed
| GOLD | The New York Stock Exchange |
| ABX | The Toronto Stock Exchange |
Transfer Agents and Registrars
AST Trust Company (Canada)
P.O. Box 700, Postal Station B
Montreal, Quebec H3B 3K3
or
American Stock Transfer & Trust Company, LLC
6201 – 15 Avenue
Brooklyn, New York 11219
Telephone:1-800-387-0825
Fax:1-888-249-6189
Email: inquiries@astfinancial.com
Website: www.astfinancial.com
Enquiries
President and Chief Executive Officer
Mark Bristow
+1 647 205 7694
+44 788 071 1386
Senior Executive Vice-President and
Chief Financial Officer
Graham Shuttleworth
+1 647 262 2095
+44 779 771 1338
+44 1534 735 333
Investor and Media Relations
Kathy du Plessis
+44 20 7557 7738
barrick@dpapr.com
Cautionary Statement on Forward-Looking Information
Barrick cautions that, whether or not expressly stated, all full year and fourth quarter figures contained in this press release reflect our expected full year and fourth quarter results as of the date of this press release. Actual audited full year and fourth quarter results are subject to management’s final review, as well as review by the Company’s independent accounting firm, and may vary significantly from those expectations because of a number of factors, including, without limitation, additional or revised information, and changes in accounting standards or policies, or in how those standards are applied. For a complete picture of the Company’s financial performance, it will be necessary to review all of the information in the Company’s full year and fourth quarter financial report and related MD&A as filed on SEDAR at www.sedar.com and on EDGAR at www.sec.gov. Accordingly, readers are cautioned not to rely solely on the information contained herein.
Certain information contained or incorporated by reference in this press release, including any information as to our strategy, projects, plans or future financial or operating performance, constitutes “forward-looking statements”. All statements, other than statements of historical fact, are forward-looking statements. The words “believe”, “expect”, “anticipate”, “target”, “plan”, “objective”, “assume”, “intend”, “intention”, “project”, “goal”, “continue”, “budget”, “estimate”, “potential”, “may”, “will”, “can”, “could”, “would” and similar expressions identify forward-looking statements. In particular, this press release contains forward-looking statements including, without limitation, with respect to: Barrick’s goal to be the world’s most valued gold mining business; our strategies and plans with respect to environmental, sustainability and governance issues; mine life and production rates; potential mineralization and metal or mineral recoveries; expected replacement of mineral reserves and resources; our future plans, growth potential, financial strength, investments and overall strategy; our plans and expected completion and benefits of our projects, including automation initiatives, Pueblo Viejo plant expansion, projects at Loulo Gounkoto (including the development of the complex’s third underground mine, exploration program, solar power project and the Ramjack Newtrax automation and monitoring project) and the grid stabilizer project at Kibali; progress with respect to the settlement of tax disputes with the Malian government and our future working relationship as long-term partners; future investments in community projects and contributions to local economies; and long-term value creation for the stakeholders of Barrick’s Tanzanian operations.
Forward-looking statements are necessarily based upon a number of estimates and assumptions including material estimates and assumptions related to the factors set forth below that, while considered reasonable by the Company as at the date of this press release in light of management’s experience and perception of current conditions and expected developments, are inherently subject to significant business, economic and competitive uncertainties and contingencies. Known and unknown factors could cause actual results to differ materially from those projected in the forward-looking statements and undue reliance should not be placed on such statements and information. Such factors include, but are not limited to: fluctuations in the spot and forward price of gold,
copper or certain other commodities (such as silver, diesel fuel, natural gas and electricity); the speculative nature of mineral exploration and development; changes in mineral production performance, exploitation and exploration successes; risks associated with projects in the early stages of evaluation and for which additional engineering and other analysis is required ; the Company’s ability to successfullyre-integrateAcacia’s operations; whether benefits expected from recent transactions are realized; disruption of supply routes which may cause delays in construction and mining activities at Barrick’s more remote properties; diminishing quantities or grades of reserves; increased costs, delays, suspensions and technical challenges associated with the construction of capital projects; operating or technical difficulties in connection with mining or development activities, including geotechnical challenges and disruptions in the maintenance or provision of required infrastructure and information technology systems; failure to comply with environmental and
health and safety laws and regulations; timing of receipt of, or failure to comply with, necessary permits and approvals; uncertainty whether some or targeted investments and projects will meet the Company’s capital allocation objectives and internal hurdle rate; the impact of global liquidity and credit availability on the timing of cash flows and the values of assets and liabilities based on projected future cash flows; adverse changes in our credit ratings; the impact of inflation; fluctuations in the currency markets; changes in U.S. dollar interest rates; risks arising from holding derivative instruments; changes in national and local government legislation, taxation, controls or regulations and/or changes in the administration of laws, policies and practices; expropriation or nationalization of property and political or economic developments in Canada, the United States and other jurisdictions in which the Company or its affiliates do or may carry on business in the future; lack of certainty with respect to foreign legal systems, corruption and other factors that are inconsistent with the rule of law; risks associated with illegal and artisanal mining; the risks of operating in jurisdictions where infectious diseases present major health care issues; damage to the Company’s reputation due to the actual or perceived occurrence of any number of events, including negative publicity with respect to the Company’s handling of environmental matters or dealings with community groups, whether true or not; the possibility that future exploration results will not be consistent with the Company’s expectations; risks that exploration data may be incomplete and considerable additional work may be required to complete further evaluation, including but not limited to drilling, engineering and socioeconomic studies and investment; risk of loss due to acts of war, terrorism, sabotage and civil disturbances; litigation; contests over title to properties, particularly title to undeveloped properties, or over access to water, power and other required infrastructure; business opportunities that may be presented to, or pursued by, the Company; risks associated with the fact that certain of the initiatives described in this press release are still in the early stages and may not materialize; our ability to successfully integrate acquisitions or complete divestitures; risks associated with working with partners in jointly controlled assets; employee relations including loss of key employees; increased costs and physical risks, including extreme weather events and resource shortages, related to climate change;
and availability and increased costs associated with mining inputs and labor. In addition, there are risks and hazards associated with the business of mineral exploration, development and mining, including environmental hazards, industrial accidents, unusual or unexpected formations, pressures,cave-ins, flooding and gold bullion, copper cathode or gold or copper concentrate losses (and the risk of inadequate insurance, or inability to obtain insurance, to cover these risks).
Many of these uncertainties and contingencies can affect our actual results and could cause actual results to differ materially from those expressed or implied in any forward-looking statements made by, or on behalf of, us. Readers are cautioned that forward-looking statements are not guarantees of future performance. All of the forward-looking statements made in this press release are qualified by these cautionary statements. Specific reference is made to the most recent Form40-F/Annual Information Form on file with the SEC and Canadian provincial securities regulatory authorities for a more detailed discussion of some of the factors underlying forward-looking statements and the risks that may affect Barrick’s ability to achieve the expectations set forth in the forward-looking statements contained in this press release. We disclaim any intention or obligation to update or revise any forward-looking statements whether as a result of new information, future events or otherwise, except as required by applicable law.