BARRICK GOLD CORP0000756894--12-312020Q26-K2020-06-30false————————3———————3,7430000756894iso4217:USD0000756894abx:PorgeraMember2020-04-0100007568942020-01-012020-06-3000007568942020-04-012020-06-3000007568942019-04-012019-06-3000007568942019-01-012019-06-30iso4217:USDxbrli:shares00007568942020-03-3100007568942019-03-3100007568942019-12-3100007568942018-12-3100007568942020-06-3000007568942019-06-30xbrli:shares0000756894ifrs-full:IssuedCapitalMember2019-12-310000756894ifrs-full:RetainedEarningsMember2019-12-310000756894ifrs-full:AccumulatedOtherComprehensiveIncomeMember2019-12-310000756894ifrs-full:OtherEquityInterestMember2019-12-310000756894ifrs-full:EquityAttributableToOwnersOfParentMember2019-12-310000756894ifrs-full:NoncontrollingInterestsMember2019-12-310000756894ifrs-full:RetainedEarningsMember2020-01-012020-06-300000756894ifrs-full:EquityAttributableToOwnersOfParentMember2020-01-012020-06-300000756894ifrs-full:NoncontrollingInterestsMember2020-01-012020-06-300000756894ifrs-full:IssuedCapitalMember2020-01-012020-06-300000756894ifrs-full:AccumulatedOtherComprehensiveIncomeMember2020-01-012020-06-300000756894ifrs-full:OtherEquityInterestMember2020-01-012020-06-300000756894abx:TanzanianMinesMemberifrs-full:NoncontrollingInterestsMember2020-01-012020-06-300000756894abx:TanzanianMinesMember2020-01-012020-06-300000756894ifrs-full:IssuedCapitalMember2020-06-300000756894ifrs-full:RetainedEarningsMember2020-06-300000756894ifrs-full:AccumulatedOtherComprehensiveIncomeMember2020-06-300000756894ifrs-full:OtherEquityInterestMember2020-06-300000756894ifrs-full:EquityAttributableToOwnersOfParentMember2020-06-300000756894ifrs-full:NoncontrollingInterestsMember2020-06-300000756894ifrs-full:IssuedCapitalMember2018-12-310000756894ifrs-full:RetainedEarningsMember2018-12-310000756894ifrs-full:AccumulatedOtherComprehensiveIncomeMember2018-12-310000756894ifrs-full:OtherEquityInterestMember2018-12-310000756894ifrs-full:EquityAttributableToOwnersOfParentMember2018-12-310000756894ifrs-full:NoncontrollingInterestsMember2018-12-310000756894ifrs-full:RetainedEarningsMember2019-01-012019-06-300000756894ifrs-full:EquityAttributableToOwnersOfParentMember2019-01-012019-06-300000756894ifrs-full:NoncontrollingInterestsMember2019-01-012019-06-300000756894ifrs-full:AccumulatedOtherComprehensiveIncomeMember2019-01-012019-06-300000756894abx:RandgoldCorporationMemberifrs-full:IssuedCapitalMember2019-01-012019-06-300000756894ifrs-full:EquityAttributableToOwnersOfParentMemberabx:RandgoldCorporationMember2019-01-012019-06-300000756894abx:RandgoldCorporationMemberifrs-full:NoncontrollingInterestsMember2019-01-012019-06-300000756894abx:RandgoldCorporationMember2019-01-012019-06-300000756894ifrs-full:IssuedCapitalMember2019-01-012019-06-300000756894ifrs-full:OtherEquityInterestMember2019-01-012019-06-300000756894ifrs-full:IssuedCapitalMember2019-06-300000756894ifrs-full:RetainedEarningsMember2019-06-300000756894ifrs-full:AccumulatedOtherComprehensiveIncomeMember2019-06-300000756894ifrs-full:OtherEquityInterestMember2019-06-300000756894ifrs-full:EquityAttributableToOwnersOfParentMember2019-06-300000756894ifrs-full:NoncontrollingInterestsMember2019-06-300000756894ifrs-full:ReserveOfExchangeDifferencesOnTranslationMember2020-06-300000756894ifrs-full:ReserveOfExchangeDifferencesOnTranslationMember2019-06-300000756894ifrs-full:AdditionalPaidinCapitalMember2020-06-300000756894ifrs-full:AdditionalPaidinCapitalMember2019-12-310000756894ifrs-full:AdditionalPaidinCapitalMember2019-06-300000756894ifrs-full:ProvisionForDecommissioningRestorationAndRehabilitationCostsMember2020-04-012020-06-300000756894ifrs-full:ProvisionForDecommissioningRestorationAndRehabilitationCostsMember2019-04-012019-06-300000756894ifrs-full:ProvisionForDecommissioningRestorationAndRehabilitationCostsMember2020-01-012020-06-300000756894ifrs-full:ProvisionForDecommissioningRestorationAndRehabilitationCostsMember2019-01-012019-06-300000756894country:CLabx:PascuaLamaMember2020-06-300000756894country:CLabx:PascuaLamaMember2019-12-310000756894abx:PascuaLamaMembercountry:AR2020-06-300000756894abx:PascuaLamaMembercountry:AR2019-12-31xbrli:pure0000756894abx:MassawaMember2020-03-042020-03-040000756894abx:MassawaMember2020-03-040000756894abx:CashAndCashEquivalents1Memberabx:MassawaMember2020-03-042020-03-040000756894abx:TerangaGoldCorporationMemberabx:MassawaMember2020-03-040000756894abx:ContingentPaymentMemberabx:MassawaMember2020-03-042020-03-040000756894abx:ContingentPaymentMemberifrs-full:AtFairValueMemberabx:MassawaMember2020-03-042020-03-040000756894abx:MassawaMember2020-01-012020-03-31abx:minesite0000756894abx:ConsolidatedtotalMember2019-06-30abx:investment0000756894ifrs-full:OperatingSegmentsMember2019-06-300000756894ifrs-full:OperatingSegmentsMemberabx:CarlinMember2020-04-012020-06-300000756894ifrs-full:OperatingSegmentsMemberabx:Cortez1Member2020-04-012020-06-300000756894ifrs-full:OperatingSegmentsMemberabx:TurquoiseRidgeMember2020-04-012020-06-300000756894ifrs-full:OperatingSegmentsMemberabx:PuebloViejoMember2020-04-012020-06-300000756894ifrs-full:OperatingSegmentsMemberabx:LouloGounkotoMember2020-04-012020-06-300000756894abx:KibaliMemberifrs-full:OperatingSegmentsMember2020-04-012020-06-300000756894ifrs-full:OperatingSegmentsMemberabx:VeladeroMember2020-04-012020-06-300000756894ifrs-full:OperatingSegmentsMemberabx:PorgeraMember2020-04-012020-06-300000756894ifrs-full:OperatingSegmentsMemberabx:NorthMara1Member2020-04-012020-06-300000756894ifrs-full:OperatingSegmentsMemberifrs-full:AllOtherSegmentsMember2020-04-012020-06-300000756894ifrs-full:OperatingSegmentsMember2020-04-012020-06-300000756894abx:KibaliMemberifrs-full:InvestmentsAccountedForUsingEquityMethodMember2020-04-012020-06-300000756894abx:ConsolidatedtotalMember2020-04-012020-06-300000756894ifrs-full:OperatingSegmentsMemberabx:CarlinMember2019-04-012019-06-300000756894ifrs-full:OperatingSegmentsMemberabx:Cortez1Member2019-04-012019-06-300000756894ifrs-full:OperatingSegmentsMemberabx:TurquoiseRidgeMember2019-04-012019-06-300000756894ifrs-full:OperatingSegmentsMemberabx:PuebloViejoMember2019-04-012019-06-300000756894ifrs-full:OperatingSegmentsMemberabx:LouloGounkotoMember2019-04-012019-06-300000756894abx:KibaliMemberifrs-full:OperatingSegmentsMember2019-04-012019-06-300000756894ifrs-full:OperatingSegmentsMemberabx:VeladeroMember2019-04-012019-06-300000756894ifrs-full:OperatingSegmentsMemberabx:PorgeraMember2019-04-012019-06-300000756894ifrs-full:OperatingSegmentsMemberabx:NorthMara1Member2019-04-012019-06-300000756894ifrs-full:OperatingSegmentsMemberifrs-full:AllOtherSegmentsMember2019-04-012019-06-300000756894ifrs-full:OperatingSegmentsMember2019-04-012019-06-300000756894abx:KibaliMemberifrs-full:InvestmentsAccountedForUsingEquityMethodMember2019-04-012019-06-300000756894abx:ConsolidatedtotalMember2019-04-012019-06-300000756894ifrs-full:OperatingSegmentsMemberabx:CarlinMember2020-01-012020-06-300000756894ifrs-full:OperatingSegmentsMemberabx:Cortez1Member2020-01-012020-06-300000756894ifrs-full:OperatingSegmentsMemberabx:TurquoiseRidgeMember2020-01-012020-06-300000756894ifrs-full:OperatingSegmentsMemberabx:PuebloViejoMember2020-01-012020-06-300000756894ifrs-full:OperatingSegmentsMemberabx:LouloGounkotoMember2020-01-012020-06-300000756894abx:KibaliMemberifrs-full:OperatingSegmentsMember2020-01-012020-06-300000756894ifrs-full:OperatingSegmentsMemberabx:VeladeroMember2020-01-012020-06-300000756894ifrs-full:OperatingSegmentsMemberabx:PorgeraMember2020-01-012020-06-300000756894ifrs-full:OperatingSegmentsMemberabx:NorthMara1Member2020-01-012020-06-300000756894ifrs-full:OperatingSegmentsMemberifrs-full:AllOtherSegmentsMember2020-01-012020-06-300000756894ifrs-full:OperatingSegmentsMember2020-01-012020-06-300000756894abx:KibaliMemberifrs-full:InvestmentsAccountedForUsingEquityMethodMember2020-01-012020-06-300000756894abx:ConsolidatedtotalMember2020-01-012020-06-300000756894ifrs-full:OperatingSegmentsMemberabx:CarlinMember2019-01-012019-06-300000756894ifrs-full:OperatingSegmentsMemberabx:Cortez1Member2019-01-012019-06-300000756894ifrs-full:OperatingSegmentsMemberabx:TurquoiseRidgeMember2019-01-012019-06-300000756894ifrs-full:OperatingSegmentsMemberabx:PuebloViejoMember2019-01-012019-06-300000756894ifrs-full:OperatingSegmentsMemberabx:LouloGounkotoMember2019-01-012019-06-300000756894abx:KibaliMemberifrs-full:OperatingSegmentsMember2019-01-012019-06-300000756894ifrs-full:OperatingSegmentsMemberabx:VeladeroMember2019-01-012019-06-300000756894ifrs-full:OperatingSegmentsMemberabx:PorgeraMember2019-01-012019-06-300000756894ifrs-full:OperatingSegmentsMemberabx:NorthMara1Member2019-01-012019-06-300000756894ifrs-full:OperatingSegmentsMemberifrs-full:AllOtherSegmentsMember2019-01-012019-06-300000756894ifrs-full:OperatingSegmentsMember2019-01-012019-06-300000756894abx:KibaliMemberifrs-full:InvestmentsAccountedForUsingEquityMethodMember2019-01-012019-06-300000756894abx:ConsolidatedtotalMember2019-01-012019-06-300000756894abx:NevadaGoldMinesMember2020-04-012020-06-300000756894abx:PuebloViejoMember2020-04-012020-06-300000756894abx:PuebloViejoMember2019-04-012019-06-300000756894abx:LouloGounkotoMember2020-04-012020-06-300000756894abx:LouloGounkotoMember2019-04-012019-06-300000756894abx:TanzanianMinesMember2020-04-012020-06-300000756894abx:TanzanianMinesMember2019-04-012019-06-300000756894abx:TongonMember2020-04-012020-06-300000756894abx:TongonMember2019-04-012019-06-300000756894abx:NevadaGoldMinesMember2020-01-012020-06-300000756894abx:PuebloViejoMember2020-01-012020-06-300000756894abx:PuebloViejoMember2019-01-012019-06-300000756894abx:LouloGounkotoMember2020-01-012020-06-300000756894abx:LouloGounkotoMember2019-01-012019-06-300000756894abx:TanzanianMinesMember2020-01-012020-06-300000756894abx:TanzanianMinesMember2019-01-012019-06-300000756894abx:TongonMember2020-01-012020-06-300000756894abx:TongonMember2019-01-012019-06-300000756894ifrs-full:MaterialReconcilingItemsMember2020-04-012020-06-300000756894ifrs-full:MaterialReconcilingItemsMember2019-04-012019-06-300000756894ifrs-full:MaterialReconcilingItemsMember2020-01-012020-06-300000756894ifrs-full:MaterialReconcilingItemsMember2019-01-012019-06-300000756894ifrs-full:MaterialReconcilingItemsMemberabx:TanzanianMinesMember2020-04-012020-06-300000756894ifrs-full:MaterialReconcilingItemsMemberabx:TanzanianMinesMember2019-04-012019-06-300000756894ifrs-full:MaterialReconcilingItemsMemberabx:NevadaGoldMinesMember2020-04-012020-06-300000756894ifrs-full:MaterialReconcilingItemsMemberabx:NevadaGoldMinesMember2019-04-012019-06-300000756894ifrs-full:MaterialReconcilingItemsMemberabx:TanzanianMinesMember2020-01-012020-06-300000756894ifrs-full:MaterialReconcilingItemsMemberabx:TanzanianMinesMember2019-01-012019-06-300000756894ifrs-full:MaterialReconcilingItemsMemberabx:NevadaGoldMinesMember2020-01-012020-06-300000756894ifrs-full:MaterialReconcilingItemsMemberabx:NevadaGoldMinesMember2019-01-012019-06-300000756894ifrs-full:UnallocatedAmountsMember2020-04-012020-06-300000756894ifrs-full:UnallocatedAmountsMember2019-04-012019-06-300000756894ifrs-full:UnallocatedAmountsMember2020-01-012020-06-300000756894ifrs-full:UnallocatedAmountsMember2019-01-012019-06-300000756894ifrs-full:MaterialReconcilingItemsMemberifrs-full:AllOtherSegmentsMember2020-04-012020-06-300000756894ifrs-full:MaterialReconcilingItemsMemberifrs-full:AllOtherSegmentsMember2019-04-012019-06-300000756894ifrs-full:MaterialReconcilingItemsMemberifrs-full:AllOtherSegmentsMember2020-01-012020-06-300000756894ifrs-full:MaterialReconcilingItemsMemberifrs-full:AllOtherSegmentsMember2019-01-012019-06-300000756894ifrs-full:AllOtherSegmentsMember2020-04-012020-06-300000756894ifrs-full:AllOtherSegmentsMember2019-04-012019-06-300000756894ifrs-full:AllOtherSegmentsMember2020-01-012020-06-300000756894ifrs-full:AllOtherSegmentsMember2019-01-012019-06-300000756894abx:SpotMarketGoldMember2020-04-012020-06-300000756894abx:SpotMarketGoldMember2019-04-012019-06-300000756894abx:SpotMarketGoldMember2020-01-012020-06-300000756894abx:SpotMarketGoldMember2019-01-012019-06-300000756894abx:GoldConcentrateMember2020-04-012020-06-300000756894abx:GoldConcentrateMember2019-04-012019-06-300000756894abx:GoldConcentrateMember2020-01-012020-06-300000756894abx:GoldConcentrateMember2019-01-012019-06-300000756894abx:GoldProvisionalPricingAdjustmentsMember2020-04-012020-06-300000756894abx:GoldProvisionalPricingAdjustmentsMember2019-04-012019-06-300000756894abx:GoldProvisionalPricingAdjustmentsMember2020-01-012020-06-300000756894abx:GoldProvisionalPricingAdjustmentsMember2019-01-012019-06-300000756894abx:GoldMember2020-04-012020-06-300000756894abx:GoldMember2019-04-012019-06-300000756894abx:GoldMember2020-01-012020-06-300000756894abx:GoldMember2019-01-012019-06-300000756894abx:CopperconcentrateMember2020-04-012020-06-300000756894abx:CopperconcentrateMember2019-04-012019-06-300000756894abx:CopperconcentrateMember2020-01-012020-06-300000756894abx:CopperconcentrateMember2019-01-012019-06-300000756894abx:CopperProvisionalPricingAdjustmentsMember2020-04-012020-06-300000756894abx:CopperProvisionalPricingAdjustmentsMember2019-04-012019-06-300000756894abx:CopperProvisionalPricingAdjustmentsMember2020-01-012020-06-300000756894abx:CopperProvisionalPricingAdjustmentsMember2019-01-012019-06-300000756894abx:CopperMember2020-04-012020-06-300000756894abx:CopperMember2019-04-012019-06-300000756894abx:CopperMember2020-01-012020-06-300000756894abx:CopperMember2019-01-012019-06-300000756894abx:OtherProductsMember2020-04-012020-06-300000756894abx:OtherProductsMember2019-04-012019-06-300000756894abx:OtherProductsMember2020-01-012020-06-300000756894abx:OtherProductsMember2019-01-012019-06-300000756894abx:SilverMember2020-04-012020-06-300000756894abx:SilverMember2019-04-012019-06-300000756894abx:SilverMember2020-01-012020-06-300000756894abx:SilverMember2019-01-012019-06-300000756894ifrs-full:NoncurrentAssetsOrDisposalGroupsClassifiedAsHeldForSaleMember2020-04-012020-06-300000756894ifrs-full:NoncurrentAssetsOrDisposalGroupsClassifiedAsHeldForSaleMember2019-04-012019-06-300000756894ifrs-full:NoncurrentAssetsOrDisposalGroupsClassifiedAsHeldForSaleMember2020-01-012020-06-300000756894ifrs-full:NoncurrentAssetsOrDisposalGroupsClassifiedAsHeldForSaleMember2019-01-012019-06-300000756894ifrs-full:IntangibleAssetsOtherThanGoodwillMember2020-04-012020-06-300000756894ifrs-full:IntangibleAssetsOtherThanGoodwillMember2019-04-012019-06-300000756894ifrs-full:IntangibleAssetsOtherThanGoodwillMember2020-01-012020-06-300000756894ifrs-full:IntangibleAssetsOtherThanGoodwillMember2019-01-012019-06-300000756894country:MLcountry:AR2020-01-012020-06-300000756894country:AR2017-01-012017-12-310000756894country:AR2019-01-012019-12-310000756894country:AR2018-01-012018-12-310000756894country:AR2020-01-012020-06-300000756894country:TZ2020-01-012020-03-310000756894country:TZ2020-04-012020-06-300000756894abx:KibaliMember2018-12-310000756894abx:JabalSayidMember2018-12-310000756894abx:ZaldivarMember2018-12-310000756894abx:OtherJVMember2018-12-310000756894ifrs-full:JointVenturesMember2018-12-310000756894abx:KibaliMember2019-01-012019-12-310000756894abx:JabalSayidMember2019-01-012019-12-310000756894abx:ZaldivarMember2019-01-012019-12-310000756894abx:OtherJVMember2019-01-012019-12-310000756894ifrs-full:JointVenturesMember2019-01-012019-12-310000756894abx:KibaliMember2019-12-310000756894abx:JabalSayidMember2019-12-310000756894abx:ZaldivarMember2019-12-310000756894abx:OtherJVMember2019-12-310000756894ifrs-full:JointVenturesMember2019-12-310000756894abx:KibaliMember2020-01-012020-06-300000756894abx:JabalSayidMember2020-01-012020-06-300000756894abx:ZaldivarMember2020-01-012020-06-300000756894abx:OtherJVMember2020-01-012020-06-300000756894ifrs-full:JointVenturesMember2020-01-012020-06-300000756894abx:KibaliMember2020-06-300000756894abx:JabalSayidMember2020-06-300000756894abx:ZaldivarMember2020-06-300000756894abx:OtherJVMember2020-06-300000756894ifrs-full:JointVenturesMember2020-06-300000756894abx:PorgeraMember2020-04-012020-06-300000756894abx:PorgeraMember2020-06-300000756894abx:TanzanianMinesMember2020-01-012020-03-310000756894abx:TanzanianMinesMemberabx:ShortTermMember2020-01-012020-03-310000756894abx:TanzanianMinesMemberabx:LongTermMember2020-01-012020-03-310000756894srt:MinimumMemberabx:TanzanianMinesMember2020-01-012020-03-310000756894srt:MaximumMemberabx:TanzanianMinesMember2020-01-012020-03-310000756894ifrs-full:IndividualAssetsOrCashgeneratingUnitsMemberabx:BulyanhuluMember2020-01-012020-03-310000756894ifrs-full:IndividualAssetsOrCashgeneratingUnitsMemberabx:NorthMara1Member2020-01-012020-03-310000756894ifrs-full:IndividualAssetsOrCashgeneratingUnitsMemberabx:BulyanhuluMember2020-03-310000756894ifrs-full:IndividualAssetsOrCashgeneratingUnitsMemberabx:NorthMara1Member2020-03-310000756894abx:ThreePointEightFivePercentBGCNotesDue2022Member2020-01-312020-01-310000756894abx:ThreePointEightFivePercentBGCNotesDue2022Member2020-01-310000756894abx:AcaciaCreditFacilityMember2020-01-012020-01-310000756894abx:CashAndCashEquivalents1Memberifrs-full:Level1OfFairValueHierarchyMemberifrs-full:RecurringFairValueMeasurementMember2020-06-300000756894abx:CashAndCashEquivalents1Memberifrs-full:Level2OfFairValueHierarchyMemberifrs-full:RecurringFairValueMeasurementMember2020-06-300000756894ifrs-full:Level3OfFairValueHierarchyMemberabx:CashAndCashEquivalents1Memberifrs-full:RecurringFairValueMeasurementMember2020-06-300000756894abx:CashAndCashEquivalents1Memberifrs-full:RecurringFairValueMeasurementMember2020-06-300000756894abx:OtherinvestmentsMemberifrs-full:Level1OfFairValueHierarchyMemberifrs-full:RecurringFairValueMeasurementMember2020-06-300000756894ifrs-full:Level2OfFairValueHierarchyMemberabx:OtherinvestmentsMemberifrs-full:RecurringFairValueMeasurementMember2020-06-300000756894ifrs-full:Level3OfFairValueHierarchyMemberabx:OtherinvestmentsMemberifrs-full:RecurringFairValueMeasurementMember2020-06-300000756894abx:OtherinvestmentsMemberifrs-full:RecurringFairValueMeasurementMember2020-06-300000756894ifrs-full:DerivativesMemberifrs-full:Level1OfFairValueHierarchyMemberifrs-full:RecurringFairValueMeasurementMember2020-06-300000756894ifrs-full:DerivativesMemberifrs-full:Level2OfFairValueHierarchyMemberifrs-full:RecurringFairValueMeasurementMember2020-06-300000756894ifrs-full:Level3OfFairValueHierarchyMemberifrs-full:DerivativesMemberifrs-full:RecurringFairValueMeasurementMember2020-06-300000756894ifrs-full:DerivativesMemberifrs-full:RecurringFairValueMeasurementMember2020-06-300000756894abx:ReceivablesfromprovisionalcopperandgoldsalesMemberifrs-full:Level1OfFairValueHierarchyMemberifrs-full:RecurringFairValueMeasurementMember2020-06-300000756894abx:ReceivablesfromprovisionalcopperandgoldsalesMemberifrs-full:Level2OfFairValueHierarchyMemberifrs-full:RecurringFairValueMeasurementMember2020-06-300000756894ifrs-full:Level3OfFairValueHierarchyMemberabx:ReceivablesfromprovisionalcopperandgoldsalesMemberifrs-full:RecurringFairValueMeasurementMember2020-06-300000756894abx:ReceivablesfromprovisionalcopperandgoldsalesMemberifrs-full:RecurringFairValueMeasurementMember2020-06-300000756894ifrs-full:Level1OfFairValueHierarchyMemberifrs-full:RecurringFairValueMeasurementMember2020-06-300000756894ifrs-full:Level2OfFairValueHierarchyMemberifrs-full:RecurringFairValueMeasurementMember2020-06-300000756894ifrs-full:Level3OfFairValueHierarchyMemberifrs-full:RecurringFairValueMeasurementMember2020-06-300000756894ifrs-full:RecurringFairValueMeasurementMember2020-06-300000756894ifrs-full:OtherAssetsMemberifrs-full:NotMeasuredAtFairValueInStatementOfFinancialPositionButForWhichFairValueIsDisclosedMember2020-06-300000756894ifrs-full:OtherAssetsMemberifrs-full:RecurringFairValueMeasurementMember2020-06-300000756894ifrs-full:OtherAssetsMemberifrs-full:NotMeasuredAtFairValueInStatementOfFinancialPositionButForWhichFairValueIsDisclosedMember2019-12-310000756894ifrs-full:OtherAssetsMemberifrs-full:RecurringFairValueMeasurementMember2019-12-310000756894abx:OtherinvestmentsMemberifrs-full:NotMeasuredAtFairValueInStatementOfFinancialPositionButForWhichFairValueIsDisclosedMember2020-06-300000756894abx:OtherinvestmentsMemberifrs-full:NotMeasuredAtFairValueInStatementOfFinancialPositionButForWhichFairValueIsDisclosedMember2019-12-310000756894abx:OtherinvestmentsMemberifrs-full:RecurringFairValueMeasurementMember2019-12-310000756894ifrs-full:DerivativesMemberifrs-full:NotMeasuredAtFairValueInStatementOfFinancialPositionButForWhichFairValueIsDisclosedMember2020-06-300000756894ifrs-full:DerivativesMemberifrs-full:NotMeasuredAtFairValueInStatementOfFinancialPositionButForWhichFairValueIsDisclosedMember2019-12-310000756894ifrs-full:DerivativesMemberifrs-full:RecurringFairValueMeasurementMember2019-12-310000756894ifrs-full:NotMeasuredAtFairValueInStatementOfFinancialPositionButForWhichFairValueIsDisclosedMember2020-06-300000756894ifrs-full:NotMeasuredAtFairValueInStatementOfFinancialPositionButForWhichFairValueIsDisclosedMember2019-12-310000756894ifrs-full:RecurringFairValueMeasurementMember2019-12-310000756894abx:Borrowings1Memberifrs-full:NotMeasuredAtFairValueInStatementOfFinancialPositionButForWhichFairValueIsDisclosedMember2020-06-300000756894abx:Borrowings1Memberifrs-full:RecurringFairValueMeasurementMember2020-06-300000756894abx:Borrowings1Memberifrs-full:NotMeasuredAtFairValueInStatementOfFinancialPositionButForWhichFairValueIsDisclosedMember2019-12-310000756894abx:Borrowings1Memberifrs-full:RecurringFairValueMeasurementMember2019-12-310000756894ifrs-full:NotMeasuredAtFairValueInStatementOfFinancialPositionButForWhichFairValueIsDisclosedMemberifrs-full:DerivativesMember2020-06-300000756894ifrs-full:RecurringFairValueMeasurementMemberifrs-full:DerivativesMember2020-06-300000756894ifrs-full:NotMeasuredAtFairValueInStatementOfFinancialPositionButForWhichFairValueIsDisclosedMemberifrs-full:DerivativesMember2019-12-310000756894ifrs-full:RecurringFairValueMeasurementMemberifrs-full:DerivativesMember2019-12-310000756894abx:OtherLiabilities1Memberifrs-full:NotMeasuredAtFairValueInStatementOfFinancialPositionButForWhichFairValueIsDisclosedMember2020-06-300000756894abx:OtherLiabilities1Memberifrs-full:RecurringFairValueMeasurementMember2020-06-300000756894abx:OtherLiabilities1Memberifrs-full:NotMeasuredAtFairValueInStatementOfFinancialPositionButForWhichFairValueIsDisclosedMember2019-12-310000756894abx:OtherLiabilities1Memberifrs-full:RecurringFairValueMeasurementMember2019-12-310000756894ifrs-full:OrdinarySharesMember2020-06-300000756894ifrs-full:LegalProceedingsContingentLiabilityMemberabx:PascuaLamaMemberabx:CanadianSecuritiesClassActionsMember2020-06-300000756894ifrs-full:TaxContingentLiabilityMemberabx:TaxAssessmentAndCriminalChargesMemberabx:VeladeroMember2020-06-300000756894ifrs-full:LegalProceedingsContingentLiabilityMemberabx:MarcopperMinesMemberabx:WritOfKalikasanMember2020-06-300000756894abx:TanzanianMinesMember2020-01-012020-06-300000756894abx:MassawaMember2020-05-070000756894abx:TaxDisputeMemberifrs-full:TaxContingentLiabilityMemberabx:MassawaMember2020-06-30
MANAGEMENT’S DISCUSSION AND ANALYSIS (“MD&A”)
QUARTERLY REPORT ON THE SECOND QUARTER OF 2020
This portion of the Quarterly Report provides management’s discussion and analysis (“MD&A”) of the financial condition and results of operations, to enable a reader to assess material changes in financial condition and results of operations as at, and for the three and six month periods ended June 30, 2020, in comparison to the corresponding prior-year periods. The MD&A is intended to help the reader understand Barrick Gold Corporation (“Barrick”, “we”, “our” or the “Company”), our operations, financial performance and present and future business environment. This MD&A, which has been prepared as of August 7, 2020, is intended to supplement and complement the condensed unaudited interim consolidated financial statements and notes thereto, prepared in accordance with International Accounting Standard 34 Interim Financial Reporting (“IAS 34”) as issued by the International Accounting Standards Board (“IASB”), for the three and six month periods ended June 30, 2020 (collectively, the “Financial Statements”), which are included in this Quarterly Report on pages 112 to 128. You are encouraged to review the Financial Statements in conjunction with your review of this MD&A. This MD&A should be read in conjunction with both the annual audited consolidated financial statements for the two years ended December 31, 2019, the related
annual MD&A included in the 2019 Annual Report, and the most recent Form 40–F/Annual Information Form on file with the U.S. Securities and Exchange Commission (“SEC”) and Canadian provincial securities regulatory authorities. These documents and additional information relating to the Company are available on SEDAR at www.sedar.com and EDGAR at www.sec.gov. Certain notes to the Financial Statements are specifically referred to in this MD&A and such notes are incorporated by reference herein. All dollar amounts in this MD&A are in millions of United States dollars (“$” or “US$”), unless otherwise specified.
For the purposes of preparing our MD&A, we consider the materiality of information. Information is considered material if: (i) such information results in, or would reasonably be expected to result in, a significant change in the market price or value of our shares; or (ii) there is a substantial likelihood that a reasonable investor would consider it important in making an investment decision; or (iii) it would significantly alter the total mix of information available to investors. We evaluate materiality with reference to all relevant circumstances, including potential market sensitivity.
CAUTIONARY STATEMENT ON FORWARD-LOOKING INFORMATION
Certain information contained or incorporated by reference in this MD&A, including any information as to our strategy, projects, plans or future financial or operating performance, constitutes “forward-looking statements”. All statements, other than statements of historical fact, are forward-looking statements. The words “believe”, “expect”, “anticipate”, “target”, “plan”, “objective”, “assume”, “intend”, “project”, “pursue”, “goal”, “continue”, “budget”, “estimate”, “potential”, “may”, “will”, “can”, “could”, “would”, “should” and similar expressions identify forward-looking statements. In particular, this MD&A contains forward-looking statements including, without limitation, with respect to: Barrick’s forward-looking production guidance; estimates of future cost of sales per ounce for gold and per pound for copper, total cash costs per ounce and C1 cash costs per pound, and all-in-sustaining costs per ounce/pound; cash flow forecasts; projected capital, operating and exploration expenditures; mine life and production rates; Barrick’s engagement with local communities to manage the Covid-19 pandemic; estimated timing for construction of, and production from, new projects, including the Goldrush twin exploration declines and the Veladero Phase 6 leach pad expansion; timing of completion of a final feasibility study for Goldrush and approval of the plan of operations; the potential for plant expansion at Pueblo Viejo to increase throughput; potential benefits of the chloride leach project at Zaldívar and the power transmission project at Veladero; the partnership between Barrick and the Government of Tanzania ("GoT") and the agreement to resolve all outstanding disputes between Acacia and the GoT; Barrick and Barrick Niugini Limited’s (“BNL”) response to the government of Papua New Guinea’s decision not to extend
Porgera’s special mining lease and to the Internal Revenue Commission’s proposed tax adjustments; the duration of the temporary suspension of operations at Porgera; our pipeline of high confidence projects at or near existing operations; potential mineralization and metal or mineral recoveries; our ability to convert resources into reserves; asset sales, joint ventures and partnerships; Barrick’s strategy, plans, targets and goals in respect of environmental and social governance issues; and expectations regarding future price assumptions, financial performance and other outlook or guidance.
Forward-looking statements are necessarily based upon a number of estimates and assumptions including material estimates and assumptions related to the factors set forth below that, while considered reasonable by the Company as at the date of this MD&A in light of management’s experience and perception of current conditions and expected developments, are inherently subject to significant business, economic and competitive uncertainties and contingencies. Known and unknown factors could cause actual results to differ materially from those projected in the forward-looking statements and undue reliance should not be placed on such statements and information. Such factors include, but are not limited to: fluctuations in the spot and forward price of gold, copper or certain other commodities (such as silver, diesel fuel, natural gas and electricity); the speculative nature of mineral exploration and development; changes in mineral production performance, exploitation and exploration successes; risks associated with projects in the early stages of evaluation and for which additional engineering and other analysis is
| | | | | | | | |
| BARRICK SECOND QUARTER 2020 | 21 | MANAGEMENT'S DISCUSSION AND ANALYSIS |
required; the benefits expected from recent transactions being realized, including Nevada Gold Mines; diminishing quantities or grades of reserves; increased costs, delays, suspensions and technical challenges associated with the construction of capital projects; operating or technical difficulties in connection with mining or development activities, including geotechnical challenges and disruptions in the maintenance or provision of required infrastructure and information technology systems; failure to comply with environmental and health and safety laws and regulations; non-renewal of key licenses by governmental authorities, including non-renewal of Porgera’s Special Mining Lease; timing of receipt of, or failure to comply with, necessary permits and approvals; uncertainty whether some or all of Barrick's targeted investments and projects will meet the Company’s capital allocation objectives and internal hurdle rate; the impact of global liquidity and credit availability on the timing of cash flows and the values of assets and liabilities based on projected future cash flows; adverse changes in our credit ratings; the impact of inflation; fluctuations in the currency markets; changes in U.S. dollar interest rates; risks arising from holding derivative instruments; changes in national and local government legislation, taxation, controls or regulations and/or changes in the administration of laws, policies and practices, expropriation or nationalization of property and political or economic developments in Canada, the United States and other jurisdictions in which the Company or its affiliates do or may carry on business in the future; lack of certainty with respect to foreign legal systems, corruption and other factors that are inconsistent with the rule of law; risks associated with illegal and artisanal mining; risks associated with new diseases, epidemics and pandemics, including the effects and potential effects of the global Covid-19 pandemic; disruption of supply routes which may cause delays in construction and mining activities; damage to the Company’s reputation due to the actual or perceived occurrence of any number of events, including negative publicity with respect to the Company’s handling of environmental matters or dealings with community groups, whether true or not; the possibility that future exploration results will not be consistent with the Company’s expectations; risks that exploration data may be incomplete and considerable additional work may be required to complete further evaluation, including but not limited to
drilling, engineering and socioeconomic studies and investment; risk of loss due to acts of war, terrorism, sabotage and civil disturbances; litigation and legal and administrative proceedings; contests over title to properties, particularly title to undeveloped properties, or over access to water, power and other required infrastructure; business opportunities that may be presented to, or pursued by, the Company; our ability to successfully integrate acquisitions or complete divestitures, including our ability to successfully reintegrate Acacia’s operations; risks associated with working with partners in jointly controlled assets; employee relations including loss of key employees; increased costs and physical risks, including extreme weather events and resource shortages, related to climate change; and availability and increased costs associated with mining inputs and labor. Barrick also cautions that its 2020 guidance may be impacted by the unprecedented business and social disruption caused by the spread of Covid-19. In addition, there are risks and hazards associated with the business of mineral exploration, development and mining, including environmental hazards, industrial accidents, unusual or unexpected formations, pressures, cave-ins, flooding and gold bullion, copper cathode or gold or copper concentrate losses (and the risk of inadequate insurance, or inability to obtain insurance, to cover these risks).
Many of these uncertainties and contingencies can affect our actual results and could cause actual results to differ materially from those expressed or implied in any forward-looking statements made by, or on behalf of, us. Readers are cautioned that forward-looking statements are not guarantees of future performance. All of the forward-looking statements made in this MD&A are qualified by these cautionary statements. Specific reference is made to the most recent Form 40-F/Annual Information Form on file with the SEC and Canadian provincial securities regulatory authorities for a more detailed discussion of some of the factors underlying forward-looking statements and the risks that may affect Barrick’s ability to achieve the expectations set forth in the forward-looking statements contained in this MD&A. We disclaim any intention or obligation to update or revise any forward-looking statements whether as a result of new information, future events or otherwise, except as required by applicable law.
| | | | | | | | |
| BARRICK SECOND QUARTER 2020 | 22 | MANAGEMENT'S DISCUSSION AND ANALYSIS |
USE OF NON-GAAP FINANCIAL PERFORMANCE MEASURES
We use the following non-GAAP financial performance measures in our MD&A:
•"adjusted net earnings"
•"free cash flow"
•"EBITDA"
•"adjusted EBITDA"
•"total cash costs per ounce"
•"C1 cash costs per pound"
•"all-in sustaining costs per ounce/pound"
•"all-in costs per ounce" and
•"realized price"
For a detailed description of each of the non-GAAP financial performance measures used in this MD&A and a detailed reconciliation to the most directly comparable measure under International Financial Reporting Standards (“IFRS”), please refer to the Non-GAAP Financial Performance Measures section of this MD&A on pages 79 to 103. Each non-GAAP financial performance measure has been annotated with a reference to an endnote on page 104. The non-GAAP financial performance measures set out in this MD&A are intended to provide additional information to investors and do not have any standardized meaning under IFRS, and therefore may not be comparable to other issuers, and should not be considered in isolation or as a substitute for measures of performance prepared in accordance with IFRS.
| | | | | |
| | |
| INDEX | page |
| | |
| Overview | |
| | |
| Financial and Operating Highlights | |
| Key Business Developments | |
| Environmental and Social Governance | |
| Outlook | |
| Production and Cost Summary | |
| |
| Operating Divisions Performance | |
| |
| Nevada Gold Mines | |
| Carlin | |
| Cortez | |
| Turquoise Ridge | |
| Other Mines - Nevada Gold Mines | |
| Pueblo Viejo | |
| Loulo-Gounkoto | |
| Kibali | |
| Veladero | |
| Porgera | |
| North Mara | |
| Other Mines - Gold | |
| Other Mines - Copper | |
| Growth Projects | |
| Exploration and Mineral Resource Management | |
| |
| Review of Financial Results | |
| | |
| Revenue | |
| Production Costs | |
| Capital Expenditures | |
| General and Administrative Expenses | |
| Exploration, Evaluation and Project Expenses | |
| Finance Costs, Net | |
| Additional Significant Statement of Income Items | |
| Income Tax Expense | |
| | |
| Financial Condition Review | |
| | |
| Balance Sheet Review | |
| Shareholders’ Equity | |
| Financial Position and Liquidity | |
| Summary of Cash Inflow (Outflow) | |
| | |
| |
| |
| |
| |
| |
| |
| |
| |
| |
| |
| |
| |
| Commitments and Contingencies | |
| | |
| Review of Quarterly Results | |
| | |
Internal Control over Financial Reporting and
Disclosure Controls and Procedures | |
| | |
| IFRS Critical Accounting Policies and Accounting Estimates | |
| | |
| Non-GAAP Financial Performance Measures | |
| | |
| Technical Information | |
| | |
| Endnotes | |
| |
| Financial Statements | |
| |
| Notes to Consolidated Financial Statements | |
| | | | | | | | |
| BARRICK SECOND QUARTER 2020 | 23 | MANAGEMENT'S DISCUSSION AND ANALYSIS |
OVERVIEW
Financial and Operating Highlights
| | | | | | | | | | | | | | | | | | | | | | | | | | |
| For the three months ended | | | | | For the six months ended | | |
| | 6/30/20 | 3/31/20 | % Change | 6/30/19 | % Change | 6/30/20 | 6/30/19 | % Change |
Financial Results ($ millions) | | | | | | | | |
| Revenues | 3,055 | | 2,721 | | 12 | % | 2,063 | | 48 | % | 5,776 | | 4,156 | | 39 | % |
| Cost of sales | 1,900 | | 1,776 | | 7 | % | 1,545 | | 23 | % | 3,676 | | 3,035 | | 21 | % |
Net earningsa | 357 | | 400 | | (11) | % | 194 | | 84 | % | 757 | | 305 | | 148 | % |
Adjusted net earningsb | 415 | | 285 | | 46 | % | 154 | | 169 | % | 700 | | 338 | | 107 | % |
Adjusted EBITDAb | 1,697 | | 1,466 | | 16 | % | 972 | | 75 | % | 3,163 | | 1,974 | | 60 | % |
Adjusted EBITDA marginb,c | 56 | % | 54 | % | 4 | % | 47 | % | 19 | % | 55 | % | 47 | % | 17 | % |
Minesite sustaining capital expendituresd | 420 | | 370 | | 14 | % | 267 | | 57 | % | 790 | | 520 | | 52 | % |
Project capital expendituresd | 85 | | 76 | | 12 | % | 108 | | (21) | % | 161 | | 228 | | (29) | % |
Total consolidated capital expendituresd,e | 509 | | 451 | | 13 | % | 379 | | 34 | % | 960 | | 753 | | 27 | % |
| Net cash provided by operating activities | 1,031 | | 889 | | 16 | % | 434 | | 138 | % | 1,920 | | 954 | | 101 | % |
Net cash provided by operating activities marginf | 34 | % | 33 | % | 3 | % | 21 | % | 62 | % | 33 | % | 23 | % | 43 | % |
Free cash flowb | 522 | | 438 | | 19 | % | 55 | | 849 | % | 960 | | 201 | | 378 | % |
| | | | | | | | |
| Net earnings per share (basic and diluted) | 0.20 | | 0.22 | | (9) | % | 0.11 | | 82 | % | 0.43 | | 0.17 | | 153 | % |
Adjusted net earnings (basic)b per share | 0.23 | | 0.16 | | 44 | % | 0.09 | | 156 | % | 0.39 | | 0.19 | | 105 | % |
| Weighted average diluted common shares (millions of shares) | 1,778 | | 1,778 | | 0 | % | 1,752 | | 1 | % | 1,778 | | 1,749 | | 2 | % |
| Operating Results | | | | | | | | |
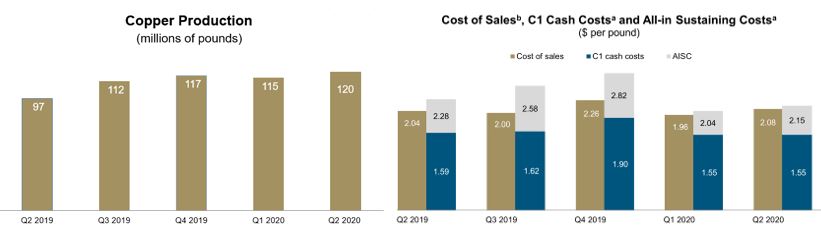
Gold production (thousands of ounces)g | 1,149 | | 1,250 | | (8) | % | 1,353 | | (15) | % | 2,399 | | 2,720 | | (12) | % |
Gold sold (thousands of ounces)g | 1,224 | | 1,220 | | 0 | % | 1,372 | | (11) | % | 2,444 | | 2,737 | | (11) | % |
| | | | | | | | |
| Market gold price ($/oz) | 1,711 | | 1,583 | | 8 | % | 1,309 | | 31 | % | 1,645 | | 1,307 | | 26 | % |
Realized gold priceb,g ($/oz) | 1,725 | | 1,589 | | 9 | % | 1,317 | | 31 | % | 1,657 | | 1,312 | | 26 | % |
Gold cost of sales (Barrick’s share)g,h ($/oz) | 1,075 | | 1,020 | | 5 | % | 964 | | 12 | % | 1,048 | | 956 | | 10 | % |
Gold total cash costsb,g ($/oz) | 716 | | 692 | | 3 | % | 651 | | 10 | % | 704 | | 641 | | 10 | % |
Gold all-in sustaining costsb,g ($/oz) | 1,031 | | 954 | | 8 | % | 869 | | 19 | % | 993 | | 842 | | 18 | % |
Copper production (millions of pounds)i | 120 | | 115 | | 4 | % | 97 | | 24 | % | 235 | | 203 | | 16 | % |
Copper sold (millions of pounds)i | 123 | | 110 | | 12 | % | 96 | | 28 | % | 233 | | 199 | | 17 | % |
| | | | | | | | |
| Market copper price ($/lb) | 2.43 | | 2.56 | | (5) | % | 2.77 | | (12) | % | 2.49 | | 2.80 | | (11) | % |
Realized copper priceb,i ($/lb) | 2.79 | | 2.23 | | 25 | % | 2.62 | | 6 | % | 2.53 | | 2.85 | | (11) | % |
Copper cost of sales (Barrick’s share)i,j ($/lb) | 2.08 | | 1.96 | | 6 | % | 2.04 | | 2 | % | 2.03 | | 2.13 | | (5) | % |
Copper C1 cash costsb,i ($/lb) | 1.55 | | 1.55 | | 0 | % | 1.59 | | (3) | % | 1.55 | | 1.62 | | (4) | % |
Copper all-in sustaining costsb,i ($/lb) | 2.15 | | 2.04 | | 5 | % | 2.28 | | (6) | % | 2.10 | | 2.37 | | (11) | % |
| | | | | | | | |
| | As at 6/30/20 | As at 3/31/20 | % Change | As at 6/30/19 | % Change | | | |
Financial Position ($ millions) | | | | | | | | |
| Debt (current and long-term) | 5,168 | | 5,179 | | 0 | % | 5,807 | | (11) | % | | | |
| Cash and equivalents | 3,743 | | 3,327 | | 13 | % | 2,153 | | 74 | % | | | |
| | | | | | | | |
| | | | | | | | |
| Debt, net of cash | 1,425 | | 1,852 | | (23) | % | 3,654 | | (61) | % | | | |
a.Net earnings represents net earnings attributable to the equity holders of the Company.
b.Adjusted net earnings, adjusted EBITDA, adjusted EBITDA margin, free cash flow, adjusted net earnings per share, realized gold price, all-in sustaining costs, total cash costs, C1 cash costs and realized copper price are non-GAAP financial performance measures with no standardized meaning under IFRS and therefore may not be comparable to similar measures presented by other issuers. For further information and a detailed reconciliation of each non-GAAP measure to the most directly comparable IFRS measure, please see pages 79 to 103 of this MD&A.
c.Represents adjusted EBITDA divided by revenue.
d.Amounts presented on a consolidated cash basis. Project capital expenditures are included in our calculation of all-in costs, but not included in our calculation of all-in sustaining costs.
e.Total consolidated capital expenditures also includes capitalized interest.
f.Represents net cash provided by operating activities divided by revenue.
g.Includes North Mara, Bulyanhulu and Buzwagi on a 84% basis starting January 1, 2020 (and on a 63.9% basis from January 1, 2019 to September 30, 2019; notwithstanding the completion of the Acacia transaction on September 17, 2019, we consolidated our interest in Acacia and recorded a non-controlling interest of 36.1% in the income statement for the entirety of the third quarter of 2019 as a matter of convenience, and on a 100% basis from October 1, 2019 to December 31, 2019), Pueblo Viejo on a 60% basis, South Arturo on a 36.9% basis from July 1, 2019 onwards as a result of its contribution to Nevada Gold Mines (and on a 60% basis from January 1, 2019 to June 30, 2019), Veladero on a 50% basis, Loulo-Gounkoto on an 80% basis, Kibali on a 45% basis, Tongon on an 89.7% basis, and Morila on a 40% basis until the second quarter of 2019, which reflects our equity share of production and sales. Also removes the non-controlling interest of 38.5% Nevada Gold Mines from July 1, 2019 onwards.
h.Gold cost of sales (Barrick’s share) is calculated as gold cost of sales on an attributable basis (excluding sites in care and maintenance) divided by ounces sold.
i.Amounts reflect production and sales from Jabal Sayid and Zaldívar on a 50% basis, which reflects our equity share of production, and Lumwana.
j.Copper cost of sales (Barrick’s share) is calculated as copper cost of sales plus our equity share of cost of sales attributable to Zaldívar and Jabal Sayid divided by pounds sold.
| | | | | | | | |
| BARRICK SECOND QUARTER 2020 | 24 | MANAGEMENT'S DISCUSSION AND ANALYSIS |
a.These are non-GAAP financial performance measures with no standardized meaning under IFRS and therefore may not be comparable to similar measures presented by other issuers. For further information and a detailed reconciliation of each non-GAAP measure to the most directly comparable IFRS measure, please see pages 79 to 103 of this MD&A.
b.Cost of sales applicable to gold per ounce is calculated using cost of sales applicable to gold on an attributable basis (removing the non-controlling interest of 40% Pueblo Viejo; 20% Loulo-Gounkoto; 10.3% Tongon; 16% North Mara, Bulyanhulu and Buzwagi starting January 1, 2020, the date the GoT's 16% free carried interest was made effective (36.1% from January 1, 2019 to September 30, 2019; notwithstanding the completion of the Acacia transaction on September 17, 2019, we consolidated our interest in Acacia and recorded a non-controlling interest of 36.1% in the income statement for the entirety of the third quarter of 2019 as a matter of convenience); 63.1% South Arturo from cost of sales from July 1, 2019 onwards as a result of its contribution to Nevada Gold Mines (and on a 40% basis from January 1, 2019 to June 30, 2019); and our proportionate share of cost of sales attributable to equity method investments (Kibali, and Morila until the second quarter of 2019), divided by attributable gold ounces. Also removes the non-controlling interest of 38.5% Nevada Gold Mines from cost of sales from July 1, 2019 onwards. Cost of sales applicable to copper per pound is calculated using cost of sales applicable to copper including our proportionate share of cost of sales attributable to equity method investments (Zaldívar and Jabal Sayid), divided by consolidated copper pounds (including our proportionate share of copper pounds from our equity method investments).
| | | | | | | | |
| BARRICK SECOND QUARTER 2020 | 25 | MANAGEMENT'S DISCUSSION AND ANALYSIS |
Factors affecting net earnings and adjusted net earnings1 - three months ended June 30, 2020 versus March 31, 2020
Net earnings attributable to equity holders of Barrick ("net earnings") for the three months ended June 30, 2020 were $357 million compared to $400 million in the prior quarter. The decrease was primarily due to items occurring in the prior quarter:
•a net impairment reversal of $115 million ($336 million before tax) resulting from the agreement with the GoT being signed and made effective in the first quarter of 2020; and
•a gain of $54 million (no tax impact) on the sale of Massawa.
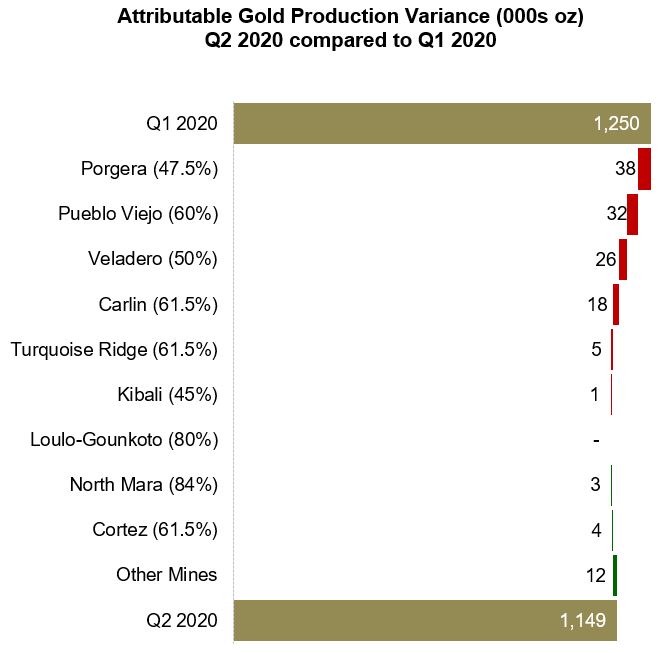
After adjusting for items that are not indicative of future operating earnings, adjusted net earnings1 of $415 million for the three months ended June 30, 2020 were 46% higher than the prior quarter. The increase in adjusted net earnings1 was mainly due to the higher realized gold price1 of $1,725 per ounce in the three months ended June 30, 2020 compared to $1,589 per ounce in the prior quarter. This was combined with marginally higher gold sales volumes following the re-commencement of exports of concentrate stockpiled in Tanzania, together with production from the end of the first quarter of 2020, which was sold at the start of the current quarter at Loulo-Gounkoto. This was partially offset by lower gold sales volumes across the rest of the portfolio, primarily due to reduced production at Porgera as the mine entered care and maintenance on April 25, 2020, a planned maintenance shutdown at Pueblo Viejo, and the impact of Covid-19 at Veladero where movement and social distancing restrictions slowed the remobilization of employees and contractors back to site following the lifting of quarantine restrictions in April.
Factors affecting net earnings and adjusted net earnings1 - three months ended June 30, 2020 versus June 30, 2019
Net earnings for the second quarter of 2020 were $357 million compared to $194 million in the same prior year period. After adjusting for items that are not indicative of future operating earnings, adjusted net earnings1 of $415 million in the second quarter of 2020 were $261 million higher than the same prior year period. The increase was primarily due to the higher realized gold price1 of $1,725 per ounce in the three months ended June 30, 2020 compared to $1,317 per ounce in the same prior year period, combined with the impact of the formation of Nevada Gold Mines on July 1, 2019. This was partially offset by lower gold sales volumes, primarily due to lower grades mined and processed at Cortez, and Porgera entering care and maintenance on April 25, 2020, combined with the sale of our 50% interest in Kalgoorlie on November 28, 2019. Gold sales volumes in the current period were further impacted by the Covid-19 quarantine and movement restrictions at Veladero, partially offset by the re-commencement of exports of concentrate stockpiled in Tanzania.
Significant adjusting items in the three months ended June 30, 2020 include:
•$33 million ($48 million before tax and non-controlling interest) in other expense adjustments, mainly related to care and maintenance expenses at Porgera and donations relating to Covid-19;
•$20 million ($23 million before tax and non-controlling interest) in net impairment charges, relating to miscellaneous assets.
Refer to page 80 for a full list of reconciling items between net earnings and adjusted net earnings1 for the current and previous periods.
Factors affecting net earnings and adjusted net earnings1 - six months ended June 30, 2020 versus June 30, 2019
Net earnings for the six months ended June 30, 2020 were $757 million compared to $305 million in the same prior year period. The increase was partially due to the net impairment reversal of $111 million ($332 million before tax) resulting from the agreement with the GoT being signed and made effective in the first quarter of 2020 and the gain of $54 million (no tax impact) on the sale of Massawa. After adjusting for items that are not indicative of future operating earnings, adjusted net earnings1 of $700 million for the six months ended June 30, 2020 were $362 million higher than the same prior year period. The significant increase in adjusted net earnings was primarily due to an increase in the realized gold price1 of $1,657 per ounce in the six months ended June 30, 2020 compared to $1,312 per ounce in the same prior year period, combined with the impact of the formation of Nevada Gold Mines on July 1, 2019. This was partially offset by lower sales volume primarily due to lower grades mined and processed at Cortez as mining from the Cortez Hills Open Pit was completed in the second quarter of 2019 and the sale of our 50% interest in Kalgoorlie on November 28, 2019. Gold sales in the current period were further impacted by Porgera entering care and maintenance on April 25, 2020 and the Covid-19 quarantine and movement restrictions at Veladero, partially offset by the re-commencement of exports of concentrate stockpiled in Tanzania.
Significant adjusting items in the six months ended June 30, 2020 include:
•$95 million ($313 million before tax and non-controlling interest) in net impairment reversals, primarily relating to the Tanzanian assets;
•$52 million (no tax impact) in acquisition/disposition gains mainly relating to the sale of Massawa; partly offset by
•$124 million ($146 million before tax and non-controlling interest) in other expense adjustments, primarily related to the impact of changes in the discount rate assumptions on our closed mine rehabilitation provision, care and maintenance expenses at Porgera and donations related to Covid-19.
Refer to page 80 for a full list of reconciling items between net earnings and adjusted net earnings1 for the current and previous periods.
* Numerical annotations throughout the text of this document refer to the endnotes found on page 104.
| | | | | | | | |
| BARRICK SECOND QUARTER 2020 | 26 | MANAGEMENT'S DISCUSSION AND ANALYSIS |
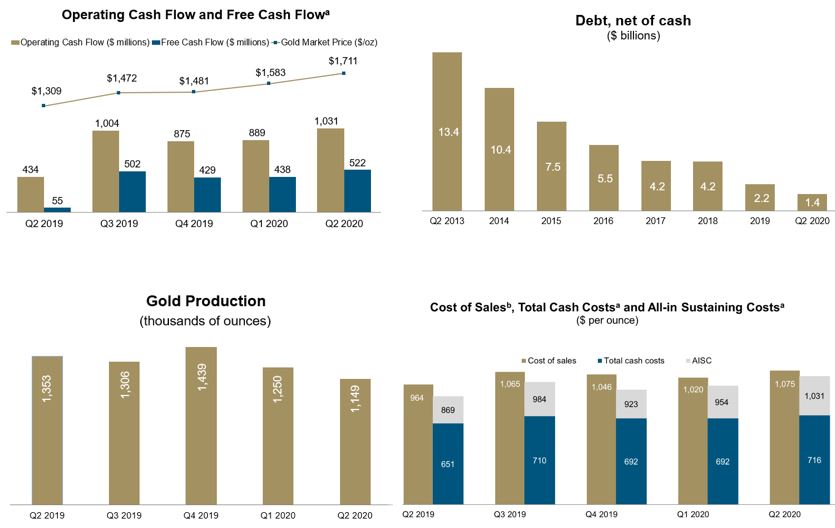
Factors affecting Operating Cash Flow and Free Cash Flow1 - three months ended June 30, 2020 versus March 31, 2020
In the three months ended June 30, 2020, we generated $1,031 million in operating cash flow, compared to $889 million in the prior quarter. The increase of $142 million was primarily due to a favorable movement in working capital, mainly in other current assets and liabilities, accounts payable and inventory. This was combined with the higher realized gold price1 of $1,725 per ounce in the three months ended June 30, 2020 compared to $1,589 per ounce in the prior quarter, combined with slightly higher gold sales volume. This was partially offset by higher cash taxes and interest paid.
Free cash flow1 for the three months ended June 30, 2020 was $522 million, compared to $438 million in the prior quarter, reflecting higher operating cash flows, partially offset by higher capital expenditures. In the second quarter of 2020, higher capital expenditures were mainly attributed to increased capitalized stripping at Loulo-Gounkoto and our investment on the tailings storage facility, other water management initiatives and land acquisitions at North Mara.
Factors affecting Operating Cash Flow and Free Cash Flow1 - three months ended June 30, 2020 versus June 30, 2019
In the second quarter of 2020, we generated $1,031 million in operating cash flow, compared to $434 million in the same prior year period. The increase of $597 million was primarily due to the higher realized gold price1 of $1,725 per ounce in the three months ended June 30, 2020 compared to $1,317 per ounce in the same prior year period, partially offset by lower gold sales volume and higher cash taxes paid.
In the second quarter of 2020, we generated free cash flow1 of $522 million compared to $55 million in the same prior year period. The increase primarily reflects higher operating cash flows, partially offset by higher capital expenditures. In the second quarter of 2020, capital expenditures on a cash basis were $509 million compared to $379 million in the second quarter of 2019. The increase in capital expenditures of $130 million was primarily due to the impact of the sites acquired as part of the formation of Nevada Gold Mines on July 1, 2019, which is consolidated and included at 100%. This was further impacted by increased capitalized stripping at Loulo-Gounkoto and expenditure on the tailings storage facility, other water management initiatives and land acquisitions at North Mara.
Factors affecting Operating Cash Flow and Free Cash Flow1 - six months ended June 30, 2020 versus June 30, 2019
For the six months ended June 30, 2020, we generated $1,920 million in operating cash flow, compared to $954 million in the same prior year period. The increase of $966 million was primarily due to the higher realized gold price1 of $1,657 per ounce in the six months ended June 30, 2020 compared to $1,312 per ounce in the same prior year period, partially offset by lower gold sales volume and higher cash taxes paid.
For the six months ended June 30, 2020, we generated free cash flow1 of $960 million compared to $201 million in the same prior year period. The increase primarily reflects higher operating cash flows, partially offset by higher capital expenditures. In the six months ended June 30, 2020, capital expenditures on a cash basis were $960 million compared to $753 million in the same prior year period. Higher capital expenditures of $207 million were primarily due to the impact of the sites acquired as part of the formation of Nevada Gold Mines on July 1, 2019, which is consolidated and included at 100%. This was further impacted by increased capitalized stripping at Loulo-Gounkoto and expenditure on the tailings storage facility, other water management initiatives and land acquisitions at North Mara.
| | | | | | | | |
| BARRICK SECOND QUARTER 2020 | 27 | MANAGEMENT'S DISCUSSION AND ANALYSIS |
Key Business Developments
Covid-19 pandemic
Barrick continues to work closely with our local communities on managing the impacts of the Covid-19 pandemic on our people and our business. Barrick has a strong culture of caring for the welfare of its employees and communities. Our well-established prevention practices and procedures, and the experience we gained from dealing with two Ebola outbreaks around our African operations, has assisted us as we face this new and unprecedented challenge. We have been actively working to support government responses to the Covid-19 pandemic, both financially and using our supply chain to secure key supplies for the benefit of the communities in which we operate.
Our preference for employing nationals in the countries where we operate rather than expatriates, means that we are not dependent upon a workforce traveling to a site on a regular basis from other parts of the globe. Although we have adapted certain operating procedures to respond to Covid-19 to date, our operations have not been significantly impacted by the pandemic with the exception of Veladero. In Argentina, a mandatory nationwide quarantine was lifted in April, while movement and social distancing restrictions slowed the remobilization of employees and contractors back to Veladero.
Early and considered actions by management including social distancing, screening and contact tracing measures have been implemented at all our sites. This has allowed our sites to continue to produce and sell their production as well as keep our people and local communities safe at the same time. These actions have minimized the impacts of the pandemic at our operations and facilitated the delivery of strong operating cash flow in the first half of 2020. Our focus on strengthening our balance sheet in recent years has given us the financial strength to endure any short-term impacts to our operations. We have $3.7 billion in cash, an undrawn $3.0 billion credit facility and no significant debt repayments due until 2033, providing us with sufficient liquidity to execute on our strategic goals.
We also recognize the situation remains dynamic and as such, we continue to monitor developments around the world and believe we have positioned Barrick as best we can to weather the storm.
Porgera Special Mining Lease Extension
Porgera's Special Mining Lease (“SML”) terminated on August 16, 2019. The Company applied for a 20-year extension of the SML in June 2017 and has been engaging with the Government of Papua New Guinea on this matter since then. On August 2, 2019, the National Court of Papua New Guinea ruled that the provisions of the country’s 1992 Mining Act applied to the Porgera gold mine, thus allowing it to continue operating while the application to extend its SML was being considered. Also in 2019, in response to a request from Papua New Guinea Prime Minister Marape, the Company proposed a benefit-sharing arrangement that would deliver more than half the economic benefits from the Porgera mine to Papua New Guinea stakeholders, including the Government, for the remainder of the life of mine, estimated at 20 years.
On April 24, 2020, Barrick Niugini Limited (“BNL”), the majority owner and operator of the Porgera joint venture, received a communication from the Government of Papua New Guinea that the SML would not be extended. The Company believes the Government’s decision not to extend the SML is tantamount to nationalization without due process and in violation of the Government’s legal obligations to BNL. The Company remains willing to discuss the issue with Prime Minister Marape and his Government in light of the potentially catastrophic impact of this decision for the communities at Porgera and in Enga Province, and for the country as a whole. BNL will pursue all legal avenues to challenge the Government’s decision and to recover any damages that BNL may suffer as a result of the Government’s decision. The Company will not discuss transitional arrangements for the management of the Porgera mine, as proposed by the Government, as this is not consistent with BNL’s rights. Based on the communication received from the Government of Papua New Guinea that the SML would not be extended, Porgera was placed on temporary care and maintenance on April 25, 2020 to ensure the safety and security of our employees and communities.
On April 28, 2020, BNL filed a Judicial Review action against the Government of Papua New Guinea in the Papua New Guinea National Court of Justice. Judicial Review is a proceeding that challenges the procedural and constitutional adequacy of government administrative actions. The Judicial Review action seeks to quash the decision not to extend the SML on the grounds that the Government did not comply with the applicable legal standards and processes. On June 5, 2020, the National Court granted BNL leave to apply for Judicial Review.
BNL asked the National Court for a stay of the decision not to extend the SML to enable BNL to stay in possession of the mine to put it on temporary care and maintenance and to protect the mine’s assets. After a hearing on April 30, 2020, the National Court ordered that BNL could stay in possession of the Porgera mine “to ensure that the environment, the integrity of the mine and the rights of the landowners are not compromised” and ordered the Government of Papua New Guinea to cooperate with that objective. On July 17, 2020, the Court stayed any further actions to implement the decision not to extend the SML.
Trial was set to commence in the Judicial Review action on August 12, 2020. BNL sought leave to appeal two procedural rulings of the National Court that would affect the trial to the Supreme Court of Papua New Guinea. In hearings on August 5 and 6, 2020, the Supreme Court granted leave for BNL's appeals and stayed the trial.
On July 9, 2020, BNL initiated conciliation proceedings before the World Bank’s International Centre for Settlement of Investment Disputes (“ICSID”). Through this conciliation, BNL seeks to reach an agreement for the extension of the SML on terms that will be mutually beneficial to the Company and to all Papua New Guinea stakeholders.
| | | | | | | | |
| BARRICK SECOND QUARTER 2020 | 28 | MANAGEMENT'S DISCUSSION AND ANALYSIS |
Simultaneously with BNL initiating the conciliation proceedings, Barrick (PD) Australia Pty Limited (“Barrick PD”), the Company’s subsidiary and an investor in the Porgera mine, has given notice to the Government of Papua New Guinea that a dispute has arisen under the Bilateral Investment Treaty (“BIT”) between Papua New Guinea and Australia, and has referred the dispute to arbitration before the ICSID. Barrick PD seeks to recover damages it has already suffered and damages it may suffer in the future by virtue of the Government’s wrongful refusal to grant an extension of the SML. The dispute notice expressly invites the Government to engage in consultations and negotiations in an attempt to resolve the investment treaty dispute.
Our priority remains the health and safety of all our employees and community stakeholders. Due to the uncertainty related to the timing and scope of future developments on the mine’s operating outlook, we have withdrawn our full year 2020 guidance for Porgera. As this is a rapidly evolving situation, we will reassess on an ongoing basis and provide further updates in due course, while maintaining operational readiness.
Partial Monetization of Investment in Shandong Gold
In June 2020, we sold 79,268,800 shares of Shandong Gold Mining Co., Ltd. (“Shandong Gold”), for net proceeds of $208 million. Barrick continues to hold 10,250,000 shares of Shandong Gold, representing a 2.05% interest in Shandong Gold’s Hong-Kong listed (H-class) shares, re-affirming its commitment to the strong existing long-term strategic partnership between the two companies.
Sale of Massawa
On March 4, 2020, Barrick and our Senegalese joint venture partner completed the sale of our aggregate 90% interest in the Massawa project (“Massawa”) in Senegal to Teranga Gold Corporation (“Teranga”) for total consideration fair valued at $440 million on the date of closing. Barrick received 92.5% of the consideration for its interest in the Massawa project, with the balance received by Barrick’s local Senegalese partner. Barrick received a net of $256 million in cash and 19,164,403 Teranga common shares (worth $104 million at the date of closing) plus a contingent payment of up to $46.25 million based on the three year average gold price, which was valued at $28 million at the date of closing. The cash consideration received was net of $25 million that Barrick provided through its participation in the $225 million syndicated debt financing facility secured by Teranga in connection with the transaction. The facility has a final repayment date of December 31, 2022. The difference between the fair value of consideration received and the carrying value of the assets on closing was $54 million and was recognized as a gain in the first quarter of 2020.
Refer to note 4 to the Financial Statements for more information.
Tanzania
On January 24, 2020, Barrick announced that the Company had ratified the creation of Twiga Minerals Corporation
(“Twiga”) at a signing ceremony with the President of Tanzania, formalizing the establishment of a joint venture between Barrick and the Government of Tanzania (“GoT”) and resolution of all outstanding disputes between Barrick and the GoT, including the lifting of the previous concentrate export ban, effective immediately. Effective January 1, 2020, the GoT received a free carried shareholding of 16% in each of the Tanzania mines (Bulyanhulu, Buzwagi and North Mara), a 16% interest in the shareholder loans owed by the operating companies and will receive half of the economic benefits from the Tanzanian operations from taxes, royalties, clearing fees and participation in all cash distributions made by the mines and Twiga, after the recoupment of capital investments. Twiga will provide management services to the mines. Refer to note 13 to the Financial Statements for further information.
The terms of the signed agreement are consistent with those previously announced, including the payment of $300 million to settle all outstanding tax and other disputes (the “Settlement Payment”); the lifting of the concentrate export ban; the sharing of future economic benefits from the mines on a 50/50 basis; and a dispute resolution mechanism that provides for binding international arbitration. The 50/50 division of economic benefits will be maintained through an annual true-up mechanism, which is exclusive of the Settlement Payment.
Barrick and the GoT continue efforts to fulfill their respective obligations to satisfy all conditions of the signed agreement, primarily with respect to the execution and delivery of formal termination documents for the settlement of all outstanding disputes between the two parties. In the second quarter of 2020, exports of the concentrate stockpiled in Tanzania commenced and we began recognizing these sales in revenue and cost of sales. We also made a payment of $100 million to the GoT representing the first installment of the Settlement Payment in the second quarter of 2020, reducing the previously recorded Settlement Payment liability of $300 million on the balance sheet.
Operating results are included at 84% from January 1, 2020. We recognized a net impairment reversal of $111 million ($332 million before tax) resulting from the agreement with the GoT being signed and made effective in the first quarter. Refer to note 13 to the Financial Statements for more information.
Debt Management
On January 31, 2020, Barrick paid $356 million, including $4 million of accrued and unpaid interest, to complete a make-whole repurchase of the $337 million of outstanding principal on our 3.85% Notes due April 2022. A loss on debt extinguishment of $15 million was recorded in the first quarter of 2020. The debt repayment is expected to result in an annualized interest savings of $13 million.
| | | | | | | | |
| BARRICK SECOND QUARTER 2020 | 29 | MANAGEMENT'S DISCUSSION AND ANALYSIS |
Environmental and Social Governance
At Barrick, Environmental and Social Governance ("ESG") has been a key focus for our business since we began. Making sure we respect human rights, protect the health and safety of our people and local communities, share the benefits of our operations, and manage our impacts on the environment is both embedded in our business decision-making processes and every facet of our operations. It is enshrined in our sustainability vision and mission as well as in our guiding principles. We monitor our sustainability performance because it helps us make better decisions, helps to de-risk projects, discover new opportunities and deliver real value for our business. Sustainable development is truly at the heart of Barrick, and our sustainability vision is embedded in every aspect of what we do.
To reinforce our belief in transparently disclosing our sustainability performance and to better understand our performance relative to our industry peers, we developed and published our inaugural Sustainability Scorecard with the publication of our 2019 Sustainability Report released in April 2020. The scorecard ranks us against our peers, where applicable, and against our own internal metrics and aggregates that performance into an overall score. It compares our performance across our priority ESG areas: Health and Safety, Social and Economic Development, Human Rights, the Environment as well as Governance. After reviewing the published performance metrics from our peers, we were able to quantify our score. Overall, we scored a B grade (on a scale where A represents high performance and E represents poor performance), which we believe accurately reflected our improvements in sustainability performance through 2019, but also acknowledges that there are still areas that we strive to improve.
Our sustainability vision puts four key ambitions at the center of our business: creating economic benefits; protecting health and safety; respecting human rights; and minimizing our environmental impact.
Safety
Our safety vision is “Every person going home safe and healthy every day.” In the first half of 2020, we have operated with zero fatalities.
Barrick is fully committed to the safety, health and well-being of our people, their families and the communities in which we operate. We review safety performance and incidents, share lessons learned and communicate best practices across our business during weekly Executive Committee meetings, which is the main forum for senior management to review our current safety performance. Safety performance is also reported as part of our quarterly Environmental & Social Oversight Committee ("E&S Committee") meetings and to the Board's Corporate Governance & Nominating Committee.
With 17 operations spanning four continents together with a range of operating environments, how our Safety policy and commitments are translated on the ground varies. Each site has its own site-specific safety procedures, management plans and systems in place, informed by its operating context. All site systems, plans and procedures
align with international best practice. Our goal is for the safety management systems at all operational mines to be certified to the internationally recognized ISO 45001 standard by the end of 2021, with three sites already accredited.
During 2019, we rolled out new controls including our ten Fatality Prevention Commitments to help eliminate fatalities and serious injuries. Our Fatality Prevention Commitments align with the International Council on Mining and Metal’s Life Saving Controls, which are based upon lessons learned from fatal incidents within the mining industry, including Barrick’s experience. Our Commitments and Unacceptable Behaviors guideline has also been implemented, which reaffirms our zero-tolerance policy for behavior such as working on site under the influence of drugs or alcohol.
The group has also started the roll out of our “Journey to Zero Harm” initiative which is focused on Visible Felt Leadership, engagement with our workforce, aligning and improving our standards, ensuring accountability to our safety commitments and ensuring employees are fit for duty. The continued focus on safety has helped drive safety performance improvements across the group in the first half of 2020. Our Total Reportable Injury Frequency Rate (“TRIFR”) for the quarter was 1.65, a slight increase from the prior quarter of 1.64.
The group recorded fewer Lost Time Injuries ("LTIs") compared to the prior quarter, with the related frequency rates also decreasing quarter on quarter. For the second quarter of 2020, our group Lost Time Injury Frequency Rate ("LTIFR") was 0.27 compared to 0.32 in the first quarter of 2020.
Environment
Barrick continues to rebuild its reputation for environmental excellence and aims to become the world’s most valued gold mining business by delivering sustainable returns for our owners and partners, including the host communities and countries in which we operate.
We have set a corporate goal for all sites to have their Environmental Management System (“EMS”) certified to the ISO 14001:2015 standard by the end of 2020. Currently, all operations, except the Jabal Sayid mine in Saudi Arabia and the three Tanzanian mines, are certified to this standard. Certification audits for these assets are scheduled to take place late in the second half of 2020.
We maintained our strong track record of stewardship and did not record any Class 1 environmental incidents in the first half of 2020.
Climate
Climate change, including shifts in temperature and precipitation and more frequent severe weather events, could affect the mining industry in a range of possible ways. For example, volatile climatic conditions can affect the stability and effectiveness of infrastructure and equipment; potentially impact environmental protection and site closure practices; lead to changes in the regulatory environment, including increased carbon tax regimes; and potentially
| | | | | | | | |
| BARRICK SECOND QUARTER 2020 | 30 | MANAGEMENT'S DISCUSSION AND ANALYSIS |
impact the stability and cost of water as well as energy supplies. We therefore view climate change as a company, community, and global concern. Following our merger with Randgold (the "Merger") and the formation of Nevada Gold Mines, we reviewed and updated the climate change strategy developed in 2017.
Barrick’s climate change strategy has three pillars: identify, understand and mitigate the risks associated with climate change; measure and reduce our impacts on climate change; and improve our disclosure on climate change. Action taken on each pillar is described below.
Identify, understand and mitigate the risks associated with climate change
We continue to take steps to identify and manage risks and build resilience to climate change, as well as to position ourselves for new opportunities. Climate change-related factors continue to be incorporated into Barrick’s formal risk assessment process (for example, consideration is given to the availability of and access to water and the impact of increased precipitation, drought, or severe storms on operations as well as on communities near our operations). We have identified several climate-related risks and opportunities for our business including: physical impacts of climate change, such as an increase in extended duration extreme precipitation events; an increase in regulations that seek to address climate change; and increased global investment in innovation and low-carbon technologies.
Measure and reduce the Company’s impact on climate change
Mining is an energy-intensive business, and we understand the important link between energy use and greenhouse gas (“GHG”) emissions. By measuring and effectively managing our energy use, we can reduce our draw from local energy grids, reduce our GHG emissions, achieve more efficient production, and reduce our costs. In the first quarter of 2020, we completed the conversion of the Quisqueya I power generation facility in the Dominican Republic from heavy fuel oil to natural gas and we received the first liquefied natural gas deliveries in February 2020. The conversion will help reduce the mine site’s power generation costs and is expected to reduce GHG emissions by 30%. In the second quarter of 2020, we progressed construction of a solar plant at Loulo-Gounkoto, and we introduced battery technology into the microgrid at Kibali. Each of these projects is expected to reduce the need for diesel generators, thereby reducing our emissions and power generation costs.
Improve our disclosure on climate change
As part of our commitment to improve our disclosure on climate change, we complete the annual CDP (formerly known as the Carbon Disclosure Project) emissions questionnaire, which makes investor-relevant climate data widely available. In 2019, Barrick received a grade of B minus on the CDP Climate Change Questionnaire. This grade places Barrick in the 'management' scoring band, with a rank higher than our sector and regional peers. Approximately 32% of companies assessed are ranked in the 'management' scoring band. We are currently compiling our response to this year’s CDP questionnaire, and are working to improve our performance.
The Board’s Corporate Governance & Nominating Committee meets quarterly and is responsible for
overseeing Barrick’s policies, programs, and performance relating to the environment, including climate change. The Audit & Risk Committee assists the Board in overseeing the Company’s management of enterprise risks as well as the implementation of policies and standards for monitoring and mitigating such risks. Climate change is built into our formal risk management process, outputs of which were reviewed by the Audit & Risk Committee throughout 2019 and through the first six months of this year. In addition, the Audit & Risk Committee reviewed the Company’s approach to climate change in the context of Barrick’s public disclosures.
As detailed in our 2019 Sustainability Report, Barrick has updated its GHG emissions reduction target to achieve a reduction of at least 10% by 2030, while maintaining a steady ounce production profile. The basis of this reduction is against a 2018 baseline that combines legacy Barrick and Randgold data as well as 2018 emissions from the assets that we assumed operational control in 2019, including Nevada Gold Mines and the Tanzanian mines. Barrick’s actions to achieve this target include increasing the proportion of renewable energy sources in the Company’s energy mix and switching to cleaner energy sources.
We expect our focus on climate change to continue through 2020 and beyond. Site-level climate-related risks and mitigation plans will continue to be reviewed in the context of the company-wide risk assessment. Site-level plans to reduce energy and GHG emissions will also be strengthened, and we plan to supplement our corporate emissions reduction target with context-based site specific emissions reduction targets.
We continue to align our disclosures with the Taskforce on Climate-related Financial Disclosures ("TCFD") and in 2020, will work to incorporate scenario analysis into our disclosure. We have a strong foundation and Barrick continues to build further resilience to withstand the potential impacts of climate change and leverage potential opportunities as the global economy transitions to a low-carbon future.
Water
Our aim is to deliver enough water for the effective operation of our mines, while at the same time protecting the quality and quantity of water available to host communities and other users in our watersheds. Our commitment to responsible water use is codified in our Environmental Policy, which requires us to minimize our use of water, control and manage our impacts on water quality, and engage with stakeholders, including local communities, to maintain sustainable management of water resources for the benefit of all local users.
Each mine has its own site-specific water management plan, which considers: 1) the different water sources available; 2) the local climate conditions; and 3) the needs of local users and the needs of the mine. This information is supplemented by a range of international frameworks and tools such as the WWF Water Risk Filter to evaluate water risks.
We include each mine’s water risks in its operational risk register. These risks are then aggregated and incorporated
| | | | | | | | |
| BARRICK SECOND QUARTER 2020 | 31 | MANAGEMENT'S DISCUSSION AND ANALYSIS |
into the corporate risk register. Our identified water related risks include: 1) Managing excess water in regions with high rainfall; 2) Maintaining access to water in arid areas and regions prone to water scarcity; and 3) Regulatory risks related to permitting limits as well as municipal and national regulations for water use.
During the second quarter of 2020, we reviewed our water accounting framework to further improve accuracy of our water reporting and to identify areas where further efficiencies may be wrought. We also plan to develop context-based site level water reuse and recycling targets. Our water recycling and reuse rate for the six months ended June 30, 2020 is 77%, which is above our annual target of 75%.
Tailings
We are committed to ensuring our tailings storage facilities (TSFs) meet global best practices for safety. Our TSFs are carefully engineered and regularly inspected, particularly those in regions with high rainfall and seismic activities.
Barrick currently manages 70 TSFs, of which 22 (31%) are operating, 47 (67%) are closed, and one is inactive. A riverine tailings disposal system was being used at the Porgera Joint Venture in Papua New Guinea prior to entering care and maintenance on April 25, 2020. In 2020, independent reviews will be conducted at our Pueblo Viejo, Turquoise Ridge, Phoenix, Carlin, Hemlo, Loulo-Gounkoto and Tongon mines, and at the Giant Nickel and Nickel Plate closure sites.
During the first quarter of 2020, a third party review was undertaken at the Llagal TSF at Pueblo Viejo and a review of the first draft of the 2020 site investigation campaign was carried out at the Nickel Plate closure site.
Social
We regard our host communities and countries as important partners in our business, and we are committed to contributing to their social and economic development. Our sustainability policies also commit us to be transparent in our relationships with host communities, government authorities, the public and other key stakeholders as well as to conduct our business with integrity through our absolute opposition to corruption, and through requiring our suppliers to operate ethically and responsibly as a condition of doing business with us.
Community and economic development
Our commitment to social and economic development is set out in our overarching Sustainable Development Policy and our Social Performance Policy.
•Paying our fair share of taxes - The taxes, royalties and dividends we pay provide significant income for our host countries as well as help to fund vital services and infrastructure. We report all government and tax payments transparently, primarily through the reporting mechanism of the Canadian Extractive Sector Transparency Measures Act (“ESTMA”) reporting.
•Prioritizing local hiring - The jobs we create provide valuable training and employment in regions where opportunities are often scarce. Additionally, the priority we place on buying goods and services from local communities and host countries leverages our supply chain and multiplies the economic benefits of our
presence. 97% of our workers and 76% of senior management are nationals from our host countries. We have a target of 80% of senior management from host country nationals by the end of 2020.
•Prioritizing local buying - Our procurement processes prioritize local companies, followed by those from the larger region or host country. At the end of 2019, we procured over $4.4 billion of goods and services from suppliers based in our host countries on a 100% basis.
•Investing in community-led development initiatives - We believe that no one knows the needs of local communities better than the communities themselves. That is why we have set a target for all our sites to have community development committees ("CDC"). The role of the CDC is to allocate the community investment budget to those projects and initiatives most needed and desired by the local communities. Each CDC is elected and is made up of a mix of local leaders, community members and representatives from local women and youth groups. In the second quarter of 2020, we spent $4.1 million on community development across the group. Year-to-date, our community development spend has exceeded $8.8 million.
Human rights
Respect for human rights is a central part of our sustainability vision. We have zero tolerance for human rights violations wherever we operate. We avoid causing or contributing to human rights violations and we facilitate access to remedies. Our commitment to respect human rights is codified in our standalone Human Rights Policy and informed by the expectations of the UN Guiding Principles on Business and Human Rights, the Voluntary Principles on Security and Human Rights, and the OECD Guidelines for Multinational Enterprises.
Our commitments to respect human rights is operationalized on the ground via our Human Rights Program, the fundamental principles of which include:
•Monitoring and reporting
•Due diligence
•Training
•Disciplinary action and remedy
We also expect the same standards from those we work, with including suppliers as our supplier Code of Ethics incorporates human rights provisions.
Responsibility for the oversight and implementation of our human rights compliance program sits with our Group Sustainability Executive, with support from our Senior Vice President Business Assurance and Risk, and our Human Resources Executive.
Governance
At the management level, in furtherance of its commitment to sustainability, Barrick established the E&S Committee in 2019. The E&S Committee is chaired by the President and Chief Executive Officer, and includes each of the regional Chief Operating Officers, Mine General Managers and health, safety, and environment and closure leads, as well as the Group Sustainability Executive and an independent sustainability consultant. The E&S Committee meets each quarter to review the Company’s sustainability performance and compliance with its sustainability policies, as well as to identify concerns and opportunities at the Company’s
| | | | | | | | |
| BARRICK SECOND QUARTER 2020 | 32 | MANAGEMENT'S DISCUSSION AND ANALYSIS |
operations at an early stage. The President and Chief Executive Officer reviews the reports of the E&S Committee with the Board's Corporate Governance & Nominating Committee on a quarterly basis as part of the Committee’s mandate to oversee the policies and performance of Barrick’s environmental, safety and health, corporate social responsibility, and human rights programs.
Further to the specific focus of the E&S Committee, weekly Executive Committee review meetings allow for the discussion of opportunities and risks that may help or hinder the Company from achieving its objectives, including climate-related risks.
Full Year 2020 Outlook
As previously disclosed, due to the uncertainty related to the timing and scope of future developments at Porgera, our full year 2020 guidance for this site has been withdrawn. Porgera remains on care and maintenance. Our 2020 gold production guidance for the group continues to reflect this development at Porgera and remains unchanged at 4.6 to 5.0 million ounces.
Group 2020 cost guidance remains unchanged, including cost of sales of $980 - $1,030 per ounce2, total cash costs of $650 - $700 per ounce1 and all-in sustaining costs of $920 - $970 per ounce1.
At Veladero, performance in the first half of 2020 was impacted by a mandatory nationwide quarantine in response to the Covid-19 pandemic and subsequent movement and social distancing restrictions slowed the remobilization of employees and contractors back to site. This was combined with severe winter weather conditions that impacted mining and processing operations. Additionally, the demobilization of the majority of our contractors working on capital projects in accordance with the government’s pandemic response has delayed the construction and commissioning of leach pad phases. Due to these developments, production at Veladero is currently trending below guidance for 2020 at slightly higher per ounce costs. Refer to the Veladero section of the MD&A for further detail.
At Hemlo, costs are trending above guidance for 2020, partially due to an increase in royalty expense from higher gold prices and mining in underground zones that incur a higher net profits interest ("NPI") royalty burden. Additionally, our costs have been impacted by a temporary delay in our new underground contractor arriving at site due to quarantine and movement restrictions in response to the Covid-19 pandemic. The new underground contractor started mobilizing to site at the end of the second quarter of 2020, with the ramp-up of underground development now underway. Production at Hemlo remains on track to achieve 2020 guidance. Refer to the Other Mines - Gold section of the MD&A for further detail.
We expect gold production in the second half of 2020 to be in line with the first half due to the developments at Veladero as described above and the deferral of the Carlin Mill 6 roaster maintenance shutdown to the third quarter of 2020.
Additionally, we are continuing to monitor the impact of the Covid-19 pandemic. Our 2020 guidance may be further impacted if the operation or development of our mines and projects are disrupted due to efforts to slow the spread of the virus.
Notwithstanding the additional risks as highlighted above, at this stage, all remaining guidance metrics are unchanged.
| | | | | |
Company Guidance ($ millions, except per ounce/pound data) | 2020
Estimate |
| Gold production (millions of ounces) | 4.60 - 5.00 |
| Gold cost metrics | |
| Cost of sales - gold ($/oz) | 980 - 1,030 |
Total cash costs ($/oz)a | 650 - 700 |
| Depreciation ($/oz) | 300 - 330 |
All-in sustaining costs ($/oz)a | 920 - 970 |
| Copper production (millions of pounds) | 440 - 500 |
| Copper cost metrics | |
| Cost of sales - copper ($/lb) | 2.10 - 2.40 |
C1 cash costs ($/lb)a | 1.50 - 1.80 |
| Depreciation ($/lb) | 0.60 - 0.70 |
All-in sustaining costs ($/lb)a | 2.20 - 2.50 |
| Exploration and project expenses | 280 - 320 |
| Exploration and evaluation | 210 - 230 |
| Project expenses | 70 - 90 |
| General and administrative expenses | ~170 |
| Corporate administration | ~130 |
Share-based compensationb | ~40 |
| |
| Other expense | 80 - 100 |
| Finance costs, net | 400 - 450 |
| Attributable capital expenditures: | |
| Attributable minesite sustaining | 1,300 - 1,500 |
| Attributable project | 300 - 400 |
Total attributable capital expendituresc | 1,600 - 1,900 |
Effective income tax rated | 30% - 35% |
| Key assumptions (used for guidance) | |
| Gold Price ($/oz) | 1,350 | |
| Copper Price ($/lb) | 2.75 | |
| Oil Price (WTI) ($/barrel) | 65 | |
| AUD Exchange Rate (AUD:USD) | 0.70 | |
| ARS Exchange Rate (USD:ARS) | 65 | |
| CAD Exchange Rate (USD:CAD) | 1.30 | |
| CLP Exchange Rate (USD:CLP) | 725 | |
| EUR Exchange Rate (EUR:USD) | 1.20 | |
a.Total cash costs, C1 cash costs and all-in sustaining costs are non-GAAP financial performance measures with no standardized meaning under IFRS and therefore may not be comparable to similar measures of performance presented by other issuers. For further information and a detailed reconciliation of the non-GAAP measures used in this section of the MD&A to the most directly comparable IFRS measure, please see pages 79 to 103 of this MD&A.
b.Based on a US$17.51 share price.
c.2020 Guidance includes our 61.5% share of Nevada Gold Mines, our 60% share of Pueblo Viejo, our 80% share of Loulo-Gounkoto, our 89.7% share of Tongon, our 84% share of North Mara, Bulyanhulu and Buzwagi, our 50% share of Zaldívar and Jabal Sayid, and our 45% share of Kibali, and our share of joint operations.
d.Based on key assumptions included in this table.
| | | | | | | | |
| BARRICK SECOND QUARTER 2020 | 33 | MANAGEMENT'S DISCUSSION AND ANALYSIS |
Operating Division Guidance
Our 2020 forecast gold and copper production, cost of salesa, total cash costsb, all-in sustaining costsb, and C1 cash costsb ranges by operating division are as follows:
| | | | | | | | | | | | | | |
| Operating Division | 2020 forecast attributable production (000s ozs) | 2020 forecast cost of salesa ($/oz) | 2020 forecast total cash costsb ($/oz) | 2020 forecast all-in sustaining costsb ($/oz) |
| Gold | | | | |
Carlin (61.5%)c | 1,000 - 1,050 | 920 - 970 | 760 - 810 | 1,000 - 1,050 |
| Cortez (61.5%) | 450 - 480 | 980 - 1,030 | 640 - 690 | 910 - 960 |
| Turquoise Ridge (61.5%) | 430 - 460 | 900 - 950 | 540 - 590 | 690 - 740 |
| Phoenix (61.5%) | 100 - 120 | 1,850 - 1,900 | 700 - 750 | 920 - 970 |
| Long Canyon (61.5%) | 130 - 150 | 910 - 960 | 240 - 290 | 450 - 500 |
| Nevada Gold Mines (61.5%) | 2,100 - 2,250 | 970 - 1,020 | 660 - 710 | 880 - 930 |
| Hemlo | 200 - 220 | 960 - 1,010 | 800 - 850 | 1,200 - 1,250 |
| North America | 2,300 - 2,450 | 970 - 1,020 | 660 - 710 | 900 - 950 |
| | | | |
| Pueblo Viejo (60%) | 530 - 580 | 840 - 890 | 520 - 570 | 720 - 770 |
| Veladero (50%) | 240 - 270 | 1,220 - 1,270 | 670 - 720 | 1,250 - 1,300 |
Porgera (47.5%)d | | | | |
| | | | |
| Latin America & Asia Pacific | 800 - 900 | 930 - 980 | 610 - 660 | 890 - 940 |
| | | | |
| Loulo-Gounkoto (80%) | 500 - 540 | 1,050 - 1,100 | 620 - 670 | 970 - 1,020 |
| Kibali (45%) | 340 - 370 | 1,030 - 1,080 | 600 - 650 | 790 - 840 |
North Mara (84%)e | 240 - 270 | 750 - 800 | 570 - 620 | 830 - 880 |
| Tongon (89.7%) | 240 - 260 | 1,390 - 1,440 | 680 - 730 | 740 - 790 |
Bulyanhulu (84%)e | 30 - 50 | 1,210 - 1,260 | 790 - 840 | 1,110 - 1,160 |
Buzwagi (84%)e | 80 - 100 | 850 - 900 | 820 - 870 | 850 - 900 |
| Africa & Middle East | 1,450 - 1,600 | 1,040 - 1,090 | 640 - 690 | 870 - 920 |
| | | | |
Total Attributable to Barrickf,g,h | 4,600 - 5,000 | 980 - 1,030 | 650 - 700 | 920 - 970 |
| | | | |
| | 2020 forecast attributable production (M lbs) | 2020 forecast cost of salesa ($/lb) | 2020 forecast C1 cash costsb ($/lb) | 2020 forecast all-in sustaining costsb ($/lb) |
| Copper | | | | |
| Lumwana | 250 - 280 | 2.20 - 2.40 | 1.50 - 1.70 | 2.30 - 2.60 |
| Zaldívar (50%) | 120 - 135 | 2.40 - 2.70 | 1.65 - 1.85 | 2.30 - 2.60 |
| Jabal Sayid (50%) | 60 - 70 | 1.75 - 2.00 | 1.40 - 1.60 | 1.50 - 1.70 |
Total Copperh | 440 - 500 | 2.10 - 2.40 | 1.50 - 1.80 | 2.20 - 2.50 |
a.Cost of sales applicable to gold per ounce is calculated using cost of sales applicable to gold on an attributable basis (removing the non-controlling interest of 38.5% of Nevada Gold Mines (including 63.1% of South Arturo), 40% of Pueblo Viejo, 20% of Loulo-Gounkoto, 10.3% of Tongon, and 16% of North Mara, Bulyanhulu and Buzwagi from cost of sales and including our proportionate share of cost of sales attributable to our equity method investments in Kibali), divided by attributable gold ounces sold. Cost of sales applicable to copper per pound is calculated using cost of sales applicable to copper including our proportionate share of cost of sales attributable to our equity method investments in Zaldívar and Jabal Sayid, divided by consolidated copper pounds sold (including our proportionate share of copper pounds sold from our equity method investments).
b.Total cash costs, all-in sustaining costs and C1 cash costs are non-GAAP financial performance measures with no standardized meaning under IFRS and therefore may not be comparable to similar measures of performance presented by other issuers. For further information and a detailed reconciliation of the non-GAAP measures used in this section of the MD&A to the most directly comparable IFRS measures, please see pages 79 to 103 of this MD&A.
c.Includes our 36.9% share of South Arturo.
d.Based on the communication we received from the Government of Papua New Guinea that the SML will not be extended, Porgera was placed on temporary care and maintenance on April 25, 2020 to ensure the safety and security of our employees and communities. Due to the uncertainty related to the timing and scope of future developments on the mine’s operating outlook, our full year 2020 guidance for Porgera has been withdrawn.
e.Amounts are on an 84% basis as the GoT's 16% free-carried interest was made effective from January 1, 2020.
f.Total cash costs and all-in sustaining costs per ounce include the impact of hedges and/or costs allocated to non-operating sites.
g.Operating unit guidance ranges reflect expectations at each individual operating unit, and may not add up to the company-wide guidance range total. Guidance ranges exclude Pierina, Lagunas Norte, Golden Sunlight and Morila (40%).
h.Includes corporate administration costs.
| | | | | | | | |
| BARRICK SECOND QUARTER 2020 | 34 | MANAGEMENT'S DISCUSSION AND ANALYSIS |
Production and Cost Summary - Gold
| | | | | | | | | | | | | | | | | |
| For the three months ended | | | | |
| 6/30/20 | 3/31/20 | % Change | 6/30/19 | % Change |
Nevada Gold Mines LLC (61.5%)a | | | | | |
| Gold produced (000s oz) | 521 | | 526 | | (1) | % | 526 | | (1) | % |
| Cost of sales ($/oz) | 1,055 | | 995 | | 6 | % | 842 | | 25 | % |
Total cash costs ($/oz)b | 728 | | 690 | | 6 | % | 594 | | 23 | % |
All-in sustaining costs ($/oz)b | 985 | | 952 | | 3 | % | 752 | | 31 | % |
Carlin (61.5%)c | | | | | |
| Gold produced (000s oz) | 235 | | 253 | | (7) | % | 181 | | 30 | % |
| Cost of sales ($/oz) | 1,037 | | 970 | | 7 | % | 1,116 | | (7) | % |
Total cash costs ($/oz)b | 850 | | 776 | | 10 | % | 769 | | 11 | % |
All-in sustaining costs ($/oz)b | 1,130 | | 1,007 | | 12 | % | 1,088 | | 4 | % |
Cortez (61.5%)d | | | | | |
| Gold produced (000s oz) | 132 | | 128 | | 3 | % | 280 | | (53) | % |
| Cost of sales ($/oz) | 870 | | 876 | | (1) | % | 719 | | 21 | % |
Total cash costs ($/oz)b | 613 | | 614 | | 0 | % | 489 | | 25 | % |
All-in sustaining costs ($/oz)b | 950 | | 1,009 | | (6) | % | 561 | | 69 | % |
Turquoise Ridge (61.5%)e | | | | | |
| Gold produced (000s oz) | 79 | | 84 | | (6) | % | 65 | | 22 | % |
| Cost of sales ($/oz) | 1,073 | | 1,032 | | 4 | % | 665 | | 61 | % |
Total cash costs ($/oz)b | 753 | | 668 | | 13 | % | 569 | | 32 | % |
All-in sustaining costs ($/oz)b | 829 | | 806 | | 3 | % | 667 | | 24 | % |
Phoenix (61.5%)f | | | | | |
| Gold produced (000s oz) | 35 | | 35 | | 0 | % | | |
| Cost of sales ($/oz) | 1,726 | | 1,583 | | 9 | % | | |
Total cash costs ($/oz)b | 725 | | 737 | | (2) | % | | |
All-in sustaining costs ($/oz)b | 957 | | 914 | | 5 | % | | |
Long Canyon (61.5%)f | | | | | |
| Gold produced (000s oz) | 40 | | 26 | | 54 | % | | |
| Cost of sales ($/oz) | 1,009 | | 1,025 | | (2) | % | | |
Total cash costs ($/oz)b | 308 | | 345 | | (11) | % | | |
All-in sustaining costs ($/oz)b | 430 | | 561 | | (23) | % | | |
| Pueblo Viejo (60%) | | | | | |
| Gold produced (000s oz) | 111 | | 143 | | (22) | % | 124 | | (10) | % |
| Cost of sales ($/oz) | 935 | | 767 | | 22 | % | 852 | | 10 | % |
Total cash costs ($/oz)b | 579 | | 502 | | 15 | % | 557 | | 4 | % |
All-in sustaining costs ($/oz)b | 720 | | 626 | | 15 | % | 702 | | 3 | % |
| Loulo-Gounkoto (80%) | | | | | |
| Gold produced (000s oz) | 141 | | 141 | | 0 | % | 147 | | (4) | % |
| Cost of sales ($/oz) | 1,012 | | 1,002 | | 1 | % | 1,072 | | (6) | % |
Total cash costs ($/oz)b | 639 | | 614 | | 4 | % | 598 | | 7 | % |
All-in sustaining costs ($/oz)b | 1,030 | | 891 | | 16 | % | 811 | | 27 | % |
| Kibali (45%) | | | | | |
| Gold produced (000s oz) | 90 | | 91 | | (1) | % | 95 | | (5) | % |
| Cost of sales ($/oz) | 1,067 | | 1,045 | | 2 | % | 868 | | 23 | % |
Total cash costs ($/oz)b | 617 | | 582 | | 6 | % | 540 | | 14 | % |
All-in sustaining costs ($/oz)b | 739 | | 773 | | (4) | % | 651 | | 14 | % |
| Veladero (50%) | | | | | |
| Gold produced (000s oz) | 49 | | 75 | | (35) | % | 75 | | (35) | % |
| Cost of sales ($/oz) | 1,228 | | 1,182 | | 4 | % | 1,186 | | 4 | % |
Total cash costs ($/oz)b | 801 | | 788 | | 2 | % | 746 | | 7 | % |
All-in sustaining costs ($/oz)b | 1,383 | | 1,266 | | 9 | % | 1,046 | | 32 | % |
| Porgera (47.5%) | | | | | |
| Gold produced (000s oz) | 24 | | 62 | | (61) | % | 61 | | (61) | % |
| Cost of sales ($/oz) | 1,141 | | 1,097 | | 4 | % | 1,032 | | 11 | % |
Total cash costs ($/oz)b | 875 | | 941 | | (7) | % | 893 | | (2) | % |
All-in sustaining costs ($/oz)b | 1,046 | | 1,089 | | (4) | % | 1,112 | | (6) | % |
| | | | | |
| | | | | |
| | | | | |
| | | | | |
| | | | | |
| | | | | |
| | | | | |
| | | | | |
| | | | | |
| | | | | |
| | | | | |
| | | | | |
| | | | | |
| | | | | |
| | | | | |
| | | | | |
| | | | | |
| | | | | |
| | | | | |
| | | | | |
| | | | | |
| | | | | |
| | | | | |
| | | | | |
| | | | | |
| | | | | |
| | | | | |
| | | | | |
| | | | | |
| | | | | |
| | | | | |
| | | | | |
| | | | | |
| | | | | |
| | | | | |
| | | | | |
| | | | | |
| | | | | |
| | | | | |
| | | | | |
| | | | | | | | |
| BARRICK SECOND QUARTER 2020 | 35 | MANAGEMENT'S DISCUSSION AND ANALYSIS |
Production and Cost Summary - Gold (continued)
| | | | | | | | | | | | | | | | | |
| For the three months ended | | | | |
| 6/30/20 | 3/31/20 | % Change | 6/30/19 | % Change |
| | | | | |
| | | | | |
| | | | | |
| | | | | |
| | | | | |
| | | | | |
| | | | | |
| | | | | |
| | | | | |
| | | | | |
| | | | | |
| | | | | |
| | | | | |
| | | | | |
| | | | | |
| | | | | |
| | | | | |
| | | | | |
| | | | | |
| | | | | |
| | | | | |
| | | | | |
| | | | | |
| | | | | |
| | | | | |
| | | | | |
| | | | | |
| | | | | |
| | | | | |
| | | | | |
| | | | | |
| | | | | |
| | | | | |
| | | | | |
| | | | | |
| | | | | |
| | | | | |
| | | | | |
| | | | | |
| | | | | |
| | | | | |
| | | | | |
| | | | | |
| | | | | |
| | | | | |
| | | | | |
| | | | | |
| | | | | |
| | | | | |
| | | | | |
| | | | | |
| | | | | |
| | | | | |
| | | | | |
| | | | | |
| Tongon (89.7%) | | | | | |
| Gold produced (000s oz) | 64 | | 61 | | 5 | % | 61 | | 5 | % |
| Cost of sales ($/oz) | 1,275 | | 1,368 | | (7) | % | 1,562 | | (18) | % |
Total cash costs ($/oz)b | 688 | | 762 | | (10) | % | 750 | | (8) | % |
All-in sustaining costs ($/oz)b | 745 | | 788 | | (5) | % | 802 | | (7) | % |
| Hemlo | | | | | |
| Gold produced (000s oz) | 54 | | 57 | | (5) | % | 55 | | (2) | % |
| Cost of sales ($/oz) | 1,268 | | 1,119 | | 13 | % | 953 | | 33 | % |
Total cash costs ($/oz)b | 1,080 | | 945 | | 14 | % | 822 | | 31 | % |
All-in sustaining costs ($/oz)b | 1,456 | | 1,281 | | 14 | % | 1,015 | | 43 | % |
North Marag | | | | | |
| Gold produced (000s oz) | 68 | | 65 | | 5 | % | 76 | | (11) | % |
| Cost of sales ($/oz) | 1,040 | | 959 | | 8 | % | 800 | | 30 | % |
Total cash costs ($/oz)b | 724 | | 646 | | 12 | % | 539 | | 34 | % |
All-in sustaining costs ($/oz)b | 1,166 | | 816 | | 43 | % | 675 | | 73 | % |
Buzwagig | | | | | |
| Gold produced (000s oz) | 20 | | 22 | | (9) | % | 19 | | 5 | % |
| Cost of sales ($/oz) | 909 | | 1,373 | | (34) | % | 1,198 | | (24) | % |
Total cash costs ($/oz)b | 751 | | 1,275 | | (41) | % | 1,099 | | (32) | % |
All-in sustaining costs ($/oz)b | 770 | | 1,288 | | (40) | % | 1,150 | | (33) | % |
Bulyanhulug | | | | | |
| Gold produced (000s oz) | 7 | | 7 | | 0 | % | 6 | | 17 | % |
| Cost of sales ($/oz) | 1,658 | | 1,685 | | (2) | % | 1,217 | | 36 | % |
Total cash costs ($/oz)b | 950 | | 686 | | 38 | % | 525 | | 81 | % |
All-in sustaining costs ($/oz)b | 1,014 | | 906 | | 12 | % | 666 | | 52 | % |
Kalgoorlie (50%)h | | | | | |
| Gold produced (000s oz) | | | | 57 | | (100) | % |
| Cost of sales ($/oz) | | | | 1,038 | | (100) | % |
Total cash costs ($/oz)b | | | | 846 | | (100) | % |
All-in sustaining costs ($/oz)b | | | | 1,204 | | (100) | % |
Total Attributable to Barricki | | | | | |
| Gold produced (000s oz) | 1,149 | | 1,250 | | (8) | % | 1,353 | | (15) | % |
Cost of sales ($/oz)j | 1,075 | | 1,020 | | 5 | % | 964 | | 12 | % |
Total cash costs ($/oz)b | 716 | | 692 | | 3 | % | 651 | | 10 | % |
All-in sustaining costs ($/oz)b | 1,031 | | 954 | | 8 | % | 869 | | 19 | % |
a.Represents the combined results of Cortez, Goldstrike (including our 60% share of South Arturo) and our 75% interest in Turquoise Ridge until June 30, 2019. Commencing July 1, 2019, the date Nevada Gold Mines was established, the results represent our 61.5% interest in Cortez, Carlin (including Goldstrike and 60% of South Arturo), Turquoise Ridge (including Twin Creeks), Phoenix and Long Canyon.
b.These are non-GAAP financial performance measures with no standardized meaning under IFRS and therefore may not be comparable to similar measures presented by other issuers. For further information and a detailed reconciliation of each non-GAAP measure used in this section of the MD&A to the most directly comparable IFRS measure, please see pages 79 to 103 of this MD&A.
c.On July 1, 2019, Barrick's Goldstrike and Newmont's Carlin were contributed to Nevada Gold Mines and are now referred to as Carlin. As a result, the amounts presented represent Goldstrike on a 100% basis (including our 60% share of South Arturo) up until June 30, 2019, and the combined results of Carlin and Goldstrike (including NGM's 60% share of South Arturo) on a 61.5% basis thereafter.
d.On July 1, 2019, Cortez was contributed to Nevada Gold Mines, a joint venture with Newmont. As a result, the amounts presented are on an 100% basis up until June 30, 2019, and on a 61.5% basis thereafter.
e.Barrick owned 75% of Turquoise Ridge through to the end of the second quarter of 2019, with our joint venture partner, Newmont, owning the remaining 25%. Turquoise Ridge was proportionately consolidated on the basis that the joint venture partners that have joint control have rights to the assets and obligations for the liabilities relating to the arrangement. The figures presented in this table are based on our 75% interest in Turquoise Ridge until June 30, 2019. On July 1, 2019, Barrick's 75% interest in Turquoise Ridge as well as Newmont's Twin Creeks and 25% interest in Turquoise Ridge were contributed to Nevada Gold Mines. Starting July 1, 2019, the results represent our 61.5% share of Turquoise Ridge and Twin Creeks, now referred to as Turquoise Ridge.
f.A 61.5% interest in these sites was acquired as a result of the formation of Nevada Gold Mines on July 1, 2019.
g.Formerly known as Acacia Mining plc. On September 17, 2019, Barrick acquired all of the shares of Acacia it did not own. Operating results are included at 100% from October 1, 2019 to December 31, 2019 (notwithstanding the completion of the Acacia transaction on September 17, 2019, we consolidated our interest in Acacia and recorded a non-controlling interest of 36.1% in the income statement for the entirety of the third quarter of 2019 as a matter of convenience), and on an 84% basis thereafter as the GoT's 16% free-carried interest was made effective from January 1, 2020.
h.On November 28, 2019, we completed the sale of our 50% interest in Kalgoorlie in Western Australia to Saracen Mineral Holdings Limited for total cash consideration of $750 million. Accordingly, these represent our 50% interest until November 28, 2019.
i.Excludes Pierina; Lagunas Norte starting in the fourth quarter of 2019; and Golden Sunlight and Morila (40%) starting in the third quarter of 2019 which are producing incidental ounces as they reach the end of their mine lives.
j.Cost of sales per ounce (Barrick’s share) is calculated as gold cost of sales on an attributable basis (excluding sites in care and maintenance) divided by gold equity ounces sold.
| | | | | | | | |
| BARRICK SECOND QUARTER 2020 | 36 | MANAGEMENT'S DISCUSSION AND ANALYSIS |
Production and Cost Summary - Copper
| | | | | | | | | | | | | | | | | |
| For the three months ended | | | | |
| 6/30/20 | 3/31/20 | % Change | 6/30/19 | % Change |
| | | | | |
| | | | | |
| | | | | |
| | | | | |
| | | | | |
| | | | | |
| | | | | |
| | | | | |
| | | | | |
| | | | | |
| | | | | |
| | | | | |
| | | | | |
| | | | | |
| | | | | |
| | | | | |
| | | | | |
| | | | | |
| | | | | |
| | | | | |
| | | | | |
| | | | | |
| | | | | |
| | | | | |
| | | | | |
| | | | | |
| | | | | |
| | | | | |
| | | | | |
| | | | | |
| | | | | |
| | | | | |
| | | | | |
| | | | | |
| | | | | |
| | | | | |
| | | | | |
| | | | | |
| | | | | |
| | | | | |
| | | | | |
| | | | | |
| | | | | |
| | | | | |
| | | | | |
| Lumwana | | | | | |
| Copper production (millions lbs) | 72 | | 64 | | 13 | % | 49 | | 47 | % |
| Cost of sales ($/lb) | 2.06 | | 1.94 | | 6 | % | 2.07 | | 0 | % |
C1 cash costs ($/lb)a | 1.55 | | 1.63 | | (5) | % | 1.70 | | (9) | % |
All-in sustaining costs ($/lb)a | 2.27 | | 2.26 | | 0 | % | 2.78 | | (18) | % |
Zaldívar (50%) | | | | | |
| Copper production (millions lbs) | 28 | | 31 | | (10) | % | 32 | | (13) | % |
| Cost of sales ($/lb) | 2.52 | | 2.39 | | 5 | % | 2.32 | | 9 | % |
C1 cash costs ($/lb)a | 1.79 | | 1.71 | | 5 | % | 1.61 | | 11 | % |
All-in sustaining costs ($/lb)a | 2.09 | | 1.99 | | 5 | % | 1.85 | | 13 | % |
| Jabal Sayid (50%) | | | | | |
| Copper production (millions lbs) | 20 | | 20 | | 0 | % | 16 | | 25 | % |
| Cost of sales ($/lb) | 1.41 | | 1.28 | | 10 | % | 1.45 | | (3) | % |
C1 cash costs ($/lb)a | 1.14 | | 0.97 | | 18 | % | 1.22 | | (7) | % |
All-in sustaining costs ($/lb)a | 1.41 | | 1.11 | | 27 | % | 1.31 | | 8 | % |
| Total Copper | | | | | |
| Copper production (millions lbs) | 120 | | 115 | | 4 | % | 97 | | 24 | % |
Cost of sales ($/lb)b | 2.08 | | 1.96 | | 6 | % | 2.04 | | 2 | % |
C1 cash costs ($/lb)a | 1.55 | | 1.55 | | 0 | % | 1.59 | | (3) | % |
All-in sustaining costs ($/lb)a | 2.15 | | 2.04 | | 5 | % | 2.28 | | (6) | % |
a.These are non-GAAP financial performance measures with no standardized meaning under IFRS and therefore may not be comparable to similar measures presented by other issuers. For further information and a detailed reconciliation of each non-GAAP measure used in this section of the MD&A to the most directly comparable IFRS measure, please see pages 79 to 103 of this MD&A.
b.Cost of sales per pound (Barrick’s share) is calculated as copper cost of sales plus our equity share of cost of sales attributable to Zaldívar and Jabal Sayid divided by copper pounds sold.
OPERATING DIVISIONS PERFORMANCE
Our presentation of reportable operating segments consists of nine gold mines (Cortez, Carlin, Turquoise Ridge, Pueblo Viejo, Loulo-Gounkoto, Kibali, Veladero, Porgera and North Mara). The remaining operating segments, including our remaining gold mines, copper mines and projects, have been grouped into an “other” category and will not be
reported on individually. Segment performance is evaluated based on a number of measures including operating income before tax, production levels and unit production costs. Certain costs are managed on a consolidated basis and are therefore not reflected in segment income.
| | | | | | | | |
| BARRICK SECOND QUARTER 2020 | 37 | MANAGEMENT'S DISCUSSION AND ANALYSIS |
Nevada Gold Mines (61.5% basis)a, Nevada USA
| | | | | | | | | | | | | | | | | | | | | | | | | | |
| Summary of Operating and Financial Data | | For the three months ended | | | | For the six months ended | | |
| | 6/30/20 | 3/31/20 | % Change | 6/30/19 | % Change | 6/30/20 | 6/30/19 | % Change |
| Total tonnes mined (000s) | 52,132 | | 56,516 | | (8) | % | 43,916 | | 19 | % | 108,648 | | 83,661 | | 30 | % |
| Open pit ore | 7,398 | | 10,433 | | (29) | % | 4,339 | | 71 | % | 17,831 | | 9,920 | | 80 | % |
| | | | | | | | |
| | | | | | | | |
| Open pit waste | 43,421 | | 44,808 | | (3) | % | 38,569 | | 13 | % | 88,229 | | 71,673 | | 23 | % |
| Underground | 1,313 | | 1,275 | | 3 | % | 1,008 | | 30 | % | 2,588 | | 2,068 | | 25 | % |
| Average grade (grams/tonne) | | | | | | | | |
| Open pit mined | 1.47 | | 0.78 | | 88 | % | 0.72 | | 104 | % | 1.07 | | 1.15 | | (7) | % |
| Underground mined | 9.61 | | 10.03 | | (4) | % | 10.86 | | (12) | % | 9.82 | | 10.75 | | (9) | % |
| Processed | 2.27 | | 1.71 | | 33 | % | 2.50 | | (9) | % | 1.95 | | 2.46 | | (21) | % |
| Ore tonnes processed (000s) | 9,280 | | 12,359 | | (25) | % | 7,137 | | 30 | % | 21,639 | | 14,927 | | 45 | % |
| Oxide mill | 3,254 | | 3,189 | | 2 | % | 1,114 | | 192 | % | 6,443 | | 2,170 | | 197 | % |
| Roaster | 1,110 | | 1,304 | | (15) | % | 1,364 | | (19) | % | 2,414 | | 2,724 | | (11) | % |
| Autoclave | 1,495 | | 1,402 | | 7 | % | 1,351 | | 11 | % | 2,897 | | 2,784 | | 4 | % |
| Heap leach | 3,421 | | 6,464 | | (47) | % | 3,308 | | 3 | % | 9,885 | | 7,249 | | 36 | % |
| Recovery rate | 80 | % | 81 | % | (1) | % | 79 | % | 1 | % | 81 | % | 83 | % | (2) | % |
| Oxide Mill | 72 | % | 72 | % | 0 | % | 78 | % | (8) | % | 72 | % | 80 | % | (10) | % |
| Roaster | 87 | % | 86 | % | 1 | % | 87 | % | 0 | % | 86 | % | 87 | % | (1) | % |
| Autoclave | 74 | % | 75 | % | (1) | % | 67 | % | 10 | % | 74 | % | 73 | % | 2 | % |
| Gold produced (000s oz) | 521 | | 526 | | (1) | % | 526 | | (1) | % | 1,047 | | 1,098 | | (5) | % |
| Oxide mill | 73 | | 71 | | 3 | % | 82 | | (11) | % | 144 | | 184 | | (22) | % |
| Roaster | 252 | | 260 | | (3) | % | 255 | | (1) | % | 512 | | 509 | | 1 | % |
| Autoclave | 122 | | 129 | | (5) | % | 122 | | 0 | % | 251 | | 280 | | (10) | % |
| Heap leach | 74 | | 66 | | 12 | % | 67 | | 10 | % | 140 | | 125 | | 12 | % |
| Gold sold (000s oz) | 522 | | 528 | | (1) | % | 547 | | (5) | % | 1,050 | | 1,121 | | (6) | % |
| Revenue ($ millions) | 919 | | 853 | | 8 | % | 713 | | 29 | % | 1,772 | | 1,463 | | 21 | % |
| Cost of sales ($ millions) | 546 | | 527 | | 4 | % | 462 | | 18 | % | 1,073 | | 910 | | 18 | % |
| | | | | | | | |
| | | | | | | | |
| Income ($ millions) | 357 | | 316 | | 13 | % | 244 | | 46 | % | 673 | | 536 | | 26 | % |
EBITDA ($ millions)b | 503 | | 462 | | 9 | % | 371 | | 36 | % | 965 | | 799 | | 21 | % |
EBITDA marginb,c | 55 | % | 54 | % | 2 | % | 52 | % | 6 | % | 54 | % | 55 | % | (1) | % |
Capital expenditures ($ millions)d | 161 | | 143 | | 13 | % | 169 | | (5) | % | 304 | | 318 | | (4) | % |
| Minesite sustaining | 124 | | 122 | | 2 | % | 76 | | 63 | % | 246 | | 146 | | 68 | % |
| Project | 37 | | 21 | | 76 | % | 93 | | (60) | % | 58 | | 172 | | (66) | % |
| Cost of sales ($/oz) | 1,055 | | 995 | | 6 | % | 842 | | 25 | % | 1,027 | | 811 | | 27 | % |
Total cash costs ($/oz)b | 728 | | 690 | | 6 | % | 594 | | 23 | % | 709 | | 567 | | 25 | % |
All-in sustaining costs ($/oz)b | 985 | | 952 | | 3 | % | 752 | | 31 | % | 968 | | 714 | | 36 | % |
All-in costs ($/oz)b | 1,052 | | 993 | | 6 | % | 922 | | 14 | % | 1,022 | | 868 | | 18 | % |
a.Represents the combined results of Cortez, Goldstrike (including our 60% share of South Arturo) and our 75% interest in Turquoise Ridge until June 30, 2019. Commencing July 1, 2019, the date Nevada Gold Mines was established, the results represent our 61.5% interest in Cortez, Carlin (including Goldstrike and 60% of South Arturo), Turquoise Ridge (including Twin Creeks), Phoenix and Long Canyon.
b.These are non-GAAP financial performance measures with no standardized meaning under IFRS and therefore may not be comparable to similar measures presented by other issuers. For further information and a detailed reconciliation of each non-GAAP measure used in this section of the MD&A to the most directly comparable IFRS measure, please see pages 79 to 103 of this MD&A.
c.Represents EBITDA divided by revenue.
d.Amounts presented exclude capitalized interest.
On July 1, 2019, Nevada Gold Mines ("NGM") was established, which includes Barrick's Cortez, Goldstrike, Turquoise Ridge and Goldrush properties and Newmont Corporation's ("Newmont") Carlin, Twin Creeks, Phoenix, Long Canyon and Lone Tree properties. Barrick is the operator of the joint venture and owns 61.5%, with Newmont owning the remaining 38.5% of the joint venture. Refer to the following pages for a detailed discussion of Cortez, Carlin (including Goldstrike) and Turquoise Ridge (including Twin Creeks) results.
| | | | | | | | |
| BARRICK SECOND QUARTER 2020 | 38 | MANAGEMENT'S DISCUSSION AND ANALYSIS |
Carlin (61.5% basis)a, Nevada USA
| | | | | | | | | | | | | | | | | | | | | | | | | | |
| Summary of Operating and Financial Data | | | For the three months ended | | | For the six months ended | | |
| | 6/30/20 | 3/31/20 | % Change | 6/30/19 | % Change | 6/30/20 | 6/30/19 | % Change |
| Total tonnes mined (000s) | 15,793 | | 17,120 | | (8) | % | 12,138 | | 30 | % | 32,913 | | 24,120 | | 36 | % |
| Open pit ore | 1,576 | | 1,467 | | 7 | % | 394 | | 300 | % | 3,043 | | 1,314 | | 132 | % |
| Open pit waste | 13,407 | | 14,901 | | (10) | % | 11,286 | | 19 | % | 28,308 | | 21,867 | | 29 | % |
| | | | | | | | |
| | | | | | | | |
| Underground | 810 | | 752 | | 8 | % | 458 | | 77 | % | 1,562 | | 939 | | 66 | % |
| Average grade (grams/tonne) | | | | | | | | |
| Open pit mined | 2.42 | | 1.36 | | 78 | % | 1.43 | | 69 | % | 1.91 | | 3.25 | | (41) | % |
| Underground mined | 9.56 | | 9.45 | | 1 | % | 9.32 | | 3 | % | 9.51 | | 9.24 | | 3 | % |
| Processed | 3.60 | | 3.41 | | 6 | % | 4.26 | | (15) | % | 3.50 | | 4.28 | | (18) | % |
| Ore tonnes processed (000s) | 2,835 | | 3,229 | | (12) | % | 1,961 | | 45 | % | 6,064 | | 4,123 | | 47 | % |
| Oxide mill | 764 | | 669 | | 14 | % | n/a | n/a | 1,433 | | n/a | n/a |
| Roasters | 710 | | 928 | | (23) | % | 772 | | (8) | % | 1,638 | | 1,656 | | (1) | % |
| Autoclave | 899 | | 853 | | 5 | % | 1,189 | | (24) | % | 1,752 | | 2,467 | | (29) | % |
| Heap leach | 462 | | 779 | | (41) | % | n/a | n/a | 1,241 | | n/a | n/a |
| Recovery rate | 80 | % | 71 | % | 13 | % | 71 | % | 13 | % | 80 | % | 75 | % | 7 | % |
| | | | | | | | |
| Roasters | 86 | % | 85 | % | 1 | % | 86 | % | 0 | % | 86 | % | 86 | % | 0 | % |
| Autoclave | 64 | % | 64 | % | 0 | % | 50 | % | 28 | % | 64 | % | 59 | % | 8 | % |
| Gold produced (000s oz) | 235 | | 253 | | (7) | % | 181 | | 30 | % | 488 | | 414 | | 18 | % |
| | | | | | | | |
| | | | | | | | |
| Oxide mill | 8 | | 9 | | (11) | % | n/a | n/a | 17 | | n/a | n/a |
| Roasters | 168 | | 183 | | (8) | % | 124 | | 35 | % | 351 | | 276 | | 27 | % |
| Autoclave | 48 | | 50 | | (4) | % | 57 | | (16) | % | 98 | | 138 | | (29) | % |
| Heap leach | 11 | | 11 | | 0 | % | n/a | n/a | 22 | | n/a | n/a |
| Gold sold (000s oz) | 234 | | 256 | | (9) | % | 181 | | 29 | % | 490 | | 420 | | 17 | % |
| Revenue ($ millions) | 402 | | 407 | | (1) | % | 235 | | 71 | % | 809 | | 546 | | 48 | % |
| Cost of sales ($ millions) | 243 | | 248 | | (2) | % | 203 | | 20 | % | 491 | | 429 | | 14 | % |
| | | | | | | | |
| | | | | | | | |
| Income ($ millions) | 151 | | 153 | | (1) | % | 33 | | 358 | % | 304 | | 116 | | 162 | % |
EBITDA ($ millions)b | 195 | | 202 | | (3) | % | 86 | | 127 | % | 397 | | 235 | | 69 | % |
EBITDA marginb,c | 49 | % | 50 | % | (2) | % | 37 | % | 32 | % | 49 | % | 43 | % | 14 | % |
| Capital expenditures ($ millions) | 60 | | 55 | | 9 | % | 54 | | 11 | % | 115 | | 104 | | 11 | % |
| Minesite sustaining | 60 | | 55 | | 9 | % | 54 | | 11 | % | 115 | | 104 | | 11 | % |
| Project | 0 | | 0 | | 0 | % | 0 | | 0 | % | 0 | | 0 | | 0 | % |
| Cost of sales ($/oz) | 1,037 | | 970 | | 7 | % | 1,116 | | (7) | % | 1,002 | | 1,020 | | (2) | % |
Total cash costs ($/oz)b | 850 | | 776 | | 10 | % | 769 | | 11 | % | 812 | | 713 | | 14 | % |
All-in sustaining costs ($/oz)b | 1,130 | | 1,007 | | 12 | % | 1,088 | | 4 | % | 1,066 | | 976 | | 9 | % |
All-in costs ($/oz)b | 1,130 | | 1,007 | | 12 | % | 1,088 | | 4 | % | 1,066 | | 976 | | 9 | % |
a.On July 1, 2019, Barrick's Goldstrike and Newmont's Carlin were contributed to Nevada Gold Mines and are now referred to as Carlin. As a result, the amounts presented represent Goldstrike on a 100% basis (including our 60% share of South Arturo) up until June 30, 2019, and the combined results of Carlin and Goldstrike (including NGM's 60% share of South Arturo) on a 61.5% basis thereafter.
b.These are non-GAAP financial performance measures with no standardized meaning under IFRS and therefore may not be comparable to similar measures presented by other issuers. For further information and a detailed reconciliation of each non-GAAP measure used in this section of the MD&A to the most directly comparable IFRS measure, please see pages 79 to 103 of this MD&A.
c.Represents EBITDA divided by revenue.
On July 1, 2019, Barrick's Goldstrike and Newmont's Carlin were contributed to Nevada Gold Mines and are now referred to as Carlin. As a result, the amounts presented represent Goldstrike on a 100% basis (including our 60% share of South Arturo) up until June 30, 2019, and the combined results of Carlin and Goldstrike (including NGM's 60% share of South Arturo) on a 61.5% basis thereafter. As a result of this transaction, there is now a higher proportion of open pit ore mined and consequently, the average grade processed is lower which also aligns with the inclusion of the heap leach facilities contributed by Newmont.
Safety and Environment
Site leadership teams continue to focus their field engagements on reducing the occurrence of injuries that result from pinch-points and slips, trips and falls. Across all operations within Carlin, two LTIs were recorded during the quarter with an LTIFR of 0.86 per million hours worked versus 0.96 (two LTIs) in the previous quarter. The TRIFR for the quarter was 3.45 per million hours worked, an increase from the previous quarter of 2.89. No Class 13 environmental incidents occurred during the quarter.
| | | | | | | | |
| BARRICK SECOND QUARTER 2020 | 39 | MANAGEMENT'S DISCUSSION AND ANALYSIS |
Financial Results
Q2 2020 compared to Q1 2020
Carlin's income for the second quarter of 2020 was 1% lower than the prior quarter due to a decrease in sales volume and higher cost of sales per ounce2, which was largely offset by the higher realized gold price1.
Gold production in the second quarter of 2020 was 7% lower compared to the prior quarter, primarily due to scheduled plant maintenance at the Goldstrike roaster. In addition, production was impacted by an increase in high grade Cortez ore processed by the Carlin roasters, which displaced lower grade Carlin open pit ore in the feed mix. Underground ore tonnes mined were 8% higher than the prior quarter combined with 1% higher grades, however, due to the roaster shutdown noted above, some of this material will be processed in the third quarter. Operational adjustments for Covid-19 impacted open pit tonnages as truck drivers were repurposed to transport employees to and from site due to social distancing measures; however this did not impact second quarter production as the lower tonnage was from stripping phases.
Cost of sales per ounce2 and total cash costs per ounce1 in the second quarter of 2020 were 7% and 10% higher, respectively, than the prior quarter due to lower throughput and higher costs associated with the scheduled plant maintenance at the Goldstrike roaster. In the second quarter of 2020, all-in sustaining costs per ounce1 were 12% higher than the prior quarter due to higher total cash costs1 combined with higher sustaining capital expenditures.
Capital expenditures in the second quarter of 2020 were 9% higher than the prior quarter due to higher sustaining capital from the Goldstrike roaster related to throughput efficiency projects.
Q2 2020 compared to Q2 2019
Carlin's income for the three month period ended June 30, 2020 reflects our 61.5% interest in Nevada Gold Mines and is inclusive of income from Newmont's former Carlin operations and the Goldstrike operations following the formation of Nevada Gold Mines on July 1, 2019. Income from Carlin for the same prior year period represents Barrick's 100% interest in the Goldstrike operations. Consequently, this, combined with higher realized gold prices1, were the primary drivers of the 358% increase in Carlin's income compared to the second quarter of 2019.
Gold production for the three month period ended June 30, 2020 was 30% higher compared to the same prior year period, primarily due to the inclusion of Newmont's former Carlin operations from July 1, 2019, partially offset by the reduction in Barrick's interest in Goldstrike from 100% in the prior year period to 61.5% in the current period.
Cost of sales per ounce2 for the three month period ended June 30, 2020 was 7% lower compared to the prior year period due to a decrease in depreciation expense, primarily driven by extended asset lives based on the latest life of
mine plan, partially offset by the drivers causing higher total cash costs per ounce1. Total cash costs per ounce1 for the current period was 11% higher than the same prior year period mainly due to the change in sales mix with the establishment of Nevada Gold Mines. This has resulted in an overall lower grade ore processed, partially offset by higher volumes through the addition of Newmont's former Carlin operations to the Goldstrike operations. For the three month period ended June 30, 2020, all-in sustaining costs per ounce1 increased by 4% compared to the same prior year period primarily due to higher total cash costs per ounce1, offset by lower minesite sustaining capital expenditures on a per ounce basis.
Capital expenditures for the three month period ended June 30, 2020 increased by 11% mainly due to an increase in minesite sustaining capital expenditures driven by the inclusion of Newmont's former Carlin operations in the current period.
YTD Q2 2020 compared to YTD Q2 2019
Carlin's income for the six month period ended June 30, 2020 was 162% higher than the same prior year period primarily due to an increase in sales volume, a decrease in cost of sales per ounce2 and the higher realized gold price1.
Gold production for the six month period ended June 30, 2020 was 18% higher compared to the same prior year period, primarily due to the inclusion of Newmont's former Carlin operations, partially offset by the reduction in Barrick's interest in Goldstrike from 100% to 61.5% from July 1, 2019.
Cost of sales per ounce2 for the six month period ended June 30, 2020 was 2% lower compared to the same prior year period due to a decrease in depreciation expense, primarily driven by extended asset lives based on the latest life of mine plan, partially offset by the drivers causing higher total cash costs per ounce1. Total cash costs per ounce1 for the current period was 14% higher than the same prior year period mainly due to the change in sales mix with the establishment of Nevada Gold Mines. This has resulted in an overall lower grade ore processed, partially offset by higher volumes through the addition of Newmont's former Carlin operations to the Goldstrike operations. For the six month period ended June 30, 2020, all-in sustaining costs per ounce1 increased by 9% compared to the same prior year period primarily due to the impact of higher total cash costs per ounce1, partially offset by lower minesite sustaining capital expenditures on a per ounce basis.
Capital expenditures for the six month period ended June 30, 2020 increased by 11% from the same prior year period due to higher minesite sustaining capital expenditures. Higher minesite sustaining capital expenditures are attributed to the inclusion of Newmont's former Carlin operations, partially offset by the reduction in Barrick's interest in Goldstrike from 100% to 61.5% from July 1, 2019.
| | | | | | | | |
| BARRICK SECOND QUARTER 2020 | 40 | MANAGEMENT'S DISCUSSION AND ANALYSIS |
Cortez (61.5% basis)a, Nevada USA
| | | | | | | | | | | | | | | | | | | | | | | | | | |
| Summary of Operating and Financial Data | | | For the three months ended | | | For the six months ended | | |
| | 6/30/20 | 3/31/20 | % Change | 6/30/19 | % Change | 6/30/20 | 6/30/19 | % Change |
| Total tonnes mined (000s) | 20,719 | | 22,696 | | (9) | % | 31,598 | | (34) | % | 43,415 | | 59,170 | | (27) | % |
| Open pit ore | 1,792 | | 4,566 | | (61) | % | 3,945 | | (55) | % | 6,358 | | 8,606 | | (26) | % |
| Open pit waste | 18,639 | | 17,841 | | 4 | % | 27,283 | | (32) | % | 36,480 | | 49,806 | | (27) | % |
| | | | | | | | |
| | | | | | | | |
| Underground | 288 | | 289 | | 0 | % | 370 | | (22) | % | 577 | | 758 | | (24) | % |
| Average grade (grams/tonne) | | | | | | | | |
| Open pit mined | 0.50 | | 0.44 | | 14 | % | 0.65 | | (23) | % | 0.46 | | 0.83 | | (45) | % |
| Underground mined | 10.29 | | 10.63 | | (3) | % | 10.74 | | (4) | % | 10.46 | | 10.04 | | 4 | % |
| Processed | 1.87 | | 1.06 | | 76 | % | 1.82 | | 3 | % | 1.33 | | 1.74 | | (24) | % |
| Ore tonnes processed (000s) | 2,381 | | 4,783 | | (50) | % | 5,014 | | (53) | % | 7,164 | | 10,487 | | (32) | % |
| Oxide mill | 613 | | 670 | | (9) | % | 1,114 | | (45) | % | 1,283 | | 2,170 | | (41) | % |
| Roasters | 400 | | 376 | | 6 | % | 592 | | (32) | % | 776 | | 1,068 | | (27) | % |
| Heap leach | 1,368 | | 3,737 | | (63) | % | 3,308 | | (59) | % | 5,105 | | 7,249 | | (30) | % |
| Recovery rate | 84 | % | 84 | % | 0 | % | 84 | % | 0 | % | 83 | % | 88 | % | (6) | % |
| Oxide Mill | 75 | % | 72 | % | 4 | % | 78 | % | (4) | % | 74 | % | 80 | % | (8) | % |
| Roasters | 87 | % | 88 | % | (1) | % | 88 | % | (1) | % | 88 | % | 88 | % | 0 | % |
| | | | | | | | |
| Gold produced (000s oz) | 132 | | 128 | | 3 | % | 280 | | (53) | % | 260 | | 542 | | (52) | % |
| Oxide mill | 30 | | 26 | | 15 | % | 82 | | (63) | % | 56 | | 184 | | (69) | % |
| Roasters | 84 | | 77 | | 9 | % | 131 | | (36) | % | 161 | | 233 | | (31) | % |
| | | | | | | | |
| Heap leach | 18 | | 25 | | (28) | % | 67 | | (73) | % | 43 | | 125 | | (66) | % |
| Gold sold (000s oz) | 132 | | 128 | | 3 | % | 281 | | (53) | % | 260 | | 540 | | (52) | % |
| Revenue ($ millions) | 226 | | 203 | | 11 | % | 368 | | (39 | %) | 429 | | 707 | | (39) | % |
| Cost of sales ($ millions) | 115 | | 112 | | 3 | % | 202 | | (43) | % | 227 | | 379 | | (40) | % |
| | | | | | | | |
| | | | | | | | |
| Income ($ millions) | 109 | | 89 | | 22 | % | 158 | | (31) | % | 198 | | 313 | | (37) | % |
EBITDA ($ millions)b | 144 | | 122 | | 18 | % | 223 | | (35) | % | 266 | | 442 | | (40) | % |
EBITDA marginb,c | 64 | % | 60 | % | 7 | % | 61 | % | 5 | % | 62 | % | 63 | % | (2) | % |
Capital expenditures ($ millions)d | 52 | | 50 | | 4 | % | 83 | | (37) | % | 102 | | 159 | | (36) | % |
| Minesite sustaining | 42 | | 46 | | (9) | % | 15 | | 180 | % | 88 | | 28 | | 214 | % |
| Project | 10 | | 4 | | 150 | % | 68 | | (85) | % | 14 | | 131 | | (89) | % |
| Cost of sales ($/oz) | 870 | | 876 | | (1) | % | 719 | | 21 | % | 873 | | 701 | | 25 | % |
Total cash costs ($/oz)b | 613 | | 614 | | 0 | % | 489 | | 25 | % | 614 | | 462 | | 33 | % |
All-in sustaining costs ($/oz)b | 950 | | 1,009 | | (6) | % | 561 | | 69 | % | 979 | | 535 | | 83 | % |
All-in costs ($/oz)b | 1,031 | | 1,039 | | (1) | % | 795 | | 30 | % | 1,035 | | 773 | | 34 | % |
a.On July 1, 2019, Cortez was contributed to Nevada Gold Mines, a joint venture with Newmont. As a result, the amounts presented are on an 100% basis up until June 30, 2019, and on a 61.5% basis thereafter.
b.These are non-GAAP financial performance measures with no standardized meaning under IFRS and therefore may not be comparable to similar measures presented by other issuers. For further information and a detailed reconciliation of each non-GAAP measure used in this section of the MD&A to the most directly comparable IFRS measure, please see pages 79 to 103 of this MD&A.
c.Represents EBITDA divided by revenue.
d.Amounts presented exclude capitalized interest.
On July 1, 2019, Barrick's Cortez operations were contributed to Nevada Gold Mines, a joint venture with Newmont. As a result, the amounts presented represent Cortez on a 100% basis up until June 30, 2019 and on a 61.5% basis thereafter.
Safety and Environment
There was one LTI at Cortez during the quarter which resulted in a LTIFR of 0.87 per million hours worked, compared to zero LTIs (0.00 per million hours worked) in the previous quarter. The TRIFR was 3.50 per million hours worked, a decrease from the 4.10 per million hours worked in the previous quarter. No Class 13 environmental incidents occurred during the quarter.
Financial Results
Q2 2020 compared to Q1 2020
Cortez’s income for the second quarter of 2020 was 22% higher than the first quarter of 2020 due to the higher realized gold price1, lower cost of sales per ounce2 and an increase in sales volume.
Gold production in the second quarter of 2020 was 3% higher compared to the prior quarter, primarily due to higher grades processed at the Cortez oxide mill and more material shipped to the Carlin roasters. The increase in oxide mill gold production was driven by higher grade material from Crossroads and Pipeline, more Cortez Hills Underground ("CHUG") material processed and higher overall plant recovery. Increased recoveries were driven by improvement initiatives on our CIL tanks, carbon quality and ore characterization. Gold production at the roasters was
| | | | | | | | |
| BARRICK SECOND QUARTER 2020 | 41 | MANAGEMENT'S DISCUSSION AND ANALYSIS |
also higher due to the increase in stockpiled Cortez Hills Open Pit ("CHOP") material processed in the current quarter. This was partially offset by lower gold production from the heap leach as a result of fewer tonnes placed on the Area 30 pad. Open pit ore tonnes mined decreased compared to the prior quarter in line with the mine plan sequence. Underground mining was in line with the prior quarter.
Cost of sales per ounce2 and total cash costs per ounce1 in the second quarter of 2020 were both in line with the prior quarter. In the second quarter of 2020, all-in sustaining costs per ounce1 were 6% lower than the prior quarter mainly due to lower minesite sustaining capital expenditures.
Capital expenditures in the second quarter of 2020 increased by 4% compared to the prior quarter due to higher project capital expenditures, partially offset by lower minesite sustaining capital expenditures. Higher project capital expenditures were due to increased spending on the CHUG Rangefront decline project as the new primary contractor is advancing the project back on schedule after the removal of the previous contractor in the fourth quarter of 2019 due to safety violations, as previously disclosed. Minesite sustaining capital expenditures were lower relative to the first quarter of 2020 due to reduced spending on dewatering and water management projects that were nearing completion in the current period. This was combined with reduced spending on mining equipment for CHOP buttress work as the majority of rebuilds occurred in the first quarter of 2020.
Q2 2020 compared to Q2 2019
Cortez’s income for the three month period ended June 30, 2020 reflects the formation of Nevada Gold Mines as described above. Income from Cortez for the same prior year period represents Barrick's 100% share of the Cortez operations. This is the primary driver of the reduction in Cortez's income compared to the same prior year period. Aside from this impact, Cortez's income in the current period was also positively impacted by the higher realized gold price1.
Gold production for the three month period ended June 30, 2020 was 53% lower due to the reduction in Barrick's interest in Cortez from 100% in the same prior year period to 61.5% in the current period. In addition to this impact, gold production was lower due to a reduction in grades processed through the oxide mill and heap leach as mining from the high grade CHOP deposit was completed in the second quarter of 2019. This is slightly offset by increased production through the Carlin roasters as more stockpiled CHOP refractory ore was shipped and processed in the current quarter.
Cost of sales per ounce2 and total cash costs per ounce1 for the three month period ended June 30, 2020 were 21% and 25% higher, respectively, than the same prior year period, due to lower grades processed, combined with increased direct operating costs. This was primarily due to higher processing and haulage costs resulting from the increase in tonnes transported to and processed at the Carlin roasters. For the three month period ended June 30, 2020, all-in sustaining costs per ounce1 increased by 69% compared to the same prior year period, driven by higher minesite sustaining capital expenditures on a per ounce basis in addition to the higher total cash costs per ounce1.
Capital expenditures for the three month period ended June 30, 2020 decreased by 37% from the same prior year period due to the reduction in Barrick's interest in Cortez from 100% in the same prior year period to 61.5% in the current quarter. In addition, project capital expenditures were lower due to the end of Crossroads pre-production stripping as it transitioned to production status in the third quarter of 2019. The decrease in project capital expenditures was partially offset by an increase in minesite sustaining capital due to Crossroads capitalized stripping (whereas it was treated as project capital expenditures in the pre-production phase in the same prior year period), increased spending on water management and additional mining equipment for CHOP buttress work.
YTD Q2 2020 compared to YTD Q2 2019
Cortez’s income for the six month period ended June 30, 2020 reflects the formation of Nevada Gold Mines as described above. Income for Cortez for the same prior year period represents Barrick's 100% share of the Cortez operations. This is the primary driver of the reduction in Cortez's income compared to the same prior year period. Aside from this impact, Cortez's income in the current period was also positively impacted by the higher realized gold price1.
Gold production for the six month period ended June 30, 2020 was 52% lower compared to the same prior year period, primarily due to the reduction in Barrick's interest in Cortez from July 1, 2019 onward, combined with lower grades mined and processed from CHOP as mining was completed in the second quarter of 2019. This was partially offset by an increase in CHUG ore mined and processed at the Carlin roasters, as well as a reduction of gold-in-circuit inventory.
Cost of sales per ounce2 and total cash costs per ounce1 for the six month period ended June 30, 2020 were 25% and 33% higher, respectively, than the same prior year period, primarily due to the lower grade impact described above combined with higher direct operating costs. This was primarily due to an increase in tonnes shipped and processed at the Carlin roasters and higher royalty costs. Royalties have increased as production shifted from CHOP to Crossroads, which carries a higher royalty rate. In addition, the higher realized gold price1 is also having an impact on royalties. For the six month period ended June 30, 2020, all-in sustaining costs per ounce1 increased by 83% compared to the same prior year period, due to higher minesite sustaining capital expenditures in addition to the higher total cash costs per ounce1.
Capital expenditures for the six month period ended June 30, 2020 were 36% lower than the same prior year period due to the reduction in Barrick's interest in Cortez from 100% to 61.5% from July 1, 2019 onward. In addition, lower project capital expenditures were due to the end of Crossroads pre-production stripping as it transitioned to production status in the third quarter of 2019 as well as a ramp down in the CHUG Rangefront decline and Crossroads dewatering projects. The decrease in project capital expenditures were partially offset by an increase in minesite sustaining capital expenditures due to Crossroads capitalized stripping (whereas it was treated as project capital expenditures in the pre-production phase in the same prior year period), increased spending on water management and additional mining equipment for CHOP buttress work.
| | | | | | | | |
| BARRICK SECOND QUARTER 2020 | 42 | MANAGEMENT'S DISCUSSION AND ANALYSIS |
Turquoise Ridge (61.5%)a, Nevada USA
| | | | | | | | | | | | | | | | | | | | | | | | | | |
| Summary of Operating and Financial Data | | For the three months ended | | | | For the six months ended | | |
| | 6/30/20 | 3/31/20 | % Change | 6/30/19 | % Change | 6/30/20 | 6/30/19 | % Change |
| Total tonnes mined (000s) | 3,870 | | 3,744 | | 3 | % | 180 | 2,050 | % | 7,614 | | 371 | 1,952 | % |
| Open pit ore | 1,094 | | 1,008 | | 9 | % | n/a | n/a | 2,102 | | n/a | n/a |
| Open pit waste | 2,561 | | 2,502 | | 2 | % | n/a | n/a | 5,063 | | n/a | n/a |
| Underground | 215 | | 234 | | (8) | % | 180 | 19 | % | 449 | | 371 | 21 | % |
| Average grade (grams/tonne) | | | | | | | | |
| Open pit mined | 2.63 | | 1.91 | | 38 | % | n/a | n/a | 2.29 | | n/a | n/a |
| Underground mined | 8.96 | | 10.98 | | (18) | % | 14.28 | (37) | % | 9.98 | | 15.12 | (34) | % |
| Processed | 3.61 | | 3.35 | | 8 | % | n/a | n/a | 3.47 | | n/a | n/a |
| Ore tonnes processed (000s) | 821 | | 862 | | (5) | % | n/a | n/a | 1,683 | | n/a | n/a |
| | | | | | | | |
| Oxide Mill | 108 | | 120 | | (10) | % | n/a | n/a | 228 | | n/a | n/a |
| Autoclave | 596 | | 549 | | 9 | % | n/a | n/a | 1,145 | | n/a | n/a |
| Heap leach | 117 | | 193 | | (39) | % | n/a | n/a | 310 | | n/a | n/a |
| Recovery rate | 82 | % | 84 | % | (2) | % | 91 | % | (10) | % | 83 | % | 92 | % | (10) | % |
| | | | | | | | |
| | | | | | | | |
| | | | | | | | |
| | | | | | | | |
| Oxide Mill | 86 | % | 84 | % | 2 | % | n/a | n/a | 85 | % | n/a | n/a |
| Autoclave | 82 | % | 85 | % | (4) | % | 91 | % | (10) | % | 83 | % | 92 | % | (10) | % |
| Gold produced (000s oz) | 79 | | 84 | | (6) | % | 65 | 22 | % | 163 | | 142 | 15 | % |
| Oxide Mill | 3 | | 4 | | (25) | % | n/a | n/a | 7 | | n/a | n/a |
| Autoclave | 74 | | 78 | | (5) | % | 65 | 14 | % | 152 | | 142 | 7 | % |
| Heap leach | 2 | | 2 | | 0 | % | n/a | n/a | 4 | | n/a | n/a |
| Gold sold (000s oz) | 79 | | 87 | | (9) | % | 85 | (7) | % | 166 | | 161 | 3 | % |
| Revenue ($ millions) | 134 | | 139 | | (4) | % | 110 | 22 | % | 273 | | 210 | 30 | % |
| Cost of sales ($ millions) | 84 | | 90 | | (7) | % | 57 | 47 | % | 174 | | 102 | 71 | % |
| | | | | | | | |
| | | | | | | | |
| Income ($ millions) | 48 | | 47 | | 2 | % | 53 | (9) | % | 95 | | 107 | (11) | % |
EBITDA ($ millions)b | 73 | | 78 | | (6) | % | 62 | 18 | % | 151 | | 122 | 24 | % |
EBITDA marginb,c | 54 | % | 56 | % | (4) | % | 56 | % | (4) | % | 55 | | 58 | % | (5) | % |
| Capital expenditures ($ millions) | 9 | | 19 | | (53) | % | 19 | (53) | % | 28 | | 35 | (20) | % |
| Minesite sustaining | 3 | | 11 | | (73) | % | 7 | (58) | % | 14 | | 14 | 0 | % |
| Project | 6 | | 8 | | (25) | % | 12 | (50) | % | 14 | | 21 | (33) | % |
| Cost of sales ($/oz) | 1,073 | | 1,032 | | 4 | % | 665 | 61 | % | 1,051 | | 631 | 67 | % |
Total cash costs ($/oz)b | 753 | | 668 | | 13 | % | 569 | 32 | % | 708 | | 539 | 31 | % |
All-in sustaining costs ($/oz)b | 829 | | 806 | | 3 | % | 667 | 24 | % | 817 | | 632 | 29 | % |
All-in costs ($/oz)b | 894 | | 903 | | (1) | % | 806 | 11 | % | 899 | | 764 | 18 | % |
a.Barrick owned 75% of Turquoise Ridge through to the end of the second quarter of 2019, with our joint venture partner, Newmont, owning the remaining 25%. Turquoise Ridge was proportionately consolidated on the basis that the joint venture partners that have joint control have rights to the assets and obligations for the liabilities relating to the arrangement. The figures presented in this table are based on our 75% interest in Turquoise Ridge until June 30, 2019. On July 1, 2019, Barrick's 75% interest in Turquoise Ridge as well as Newmont's Twin Creeks and 25% interest in Turquoise Ridge were contributed to Nevada Gold Mines. Starting July 1, 2019, the results represent our 61.5% share of Turquoise Ridge and Twin Creeks, now referred to as Turquoise Ridge.
b.These are non-GAAP financial performance measures with no standardized meaning under IFRS and therefore may not be comparable to similar measures presented by other issuers. For further information and a detailed reconciliation of each non-GAAP measure used in this section of the MD&A to the most directly comparable IFRS measure, please see pages 79 to 103 of this MD&A.
c.Represents EBITDA divided by revenue.
Barrick owned 75% of Turquoise Ridge through to the end of the second quarter of 2019, with our joint venture partner, Newmont, owning the remaining 25%. The figures presented in this table are based on our 75% interest in Turquoise Ridge until June 30, 2019. On July 1, 2019, Barrick's 75% interest in Turquoise Ridge as well as Newmont's Twin Creeks and 25% interest in Turquoise Ridge were contributed to Nevada Gold Mines. Starting July 1, 2019, our results represent our 61.5% share of Turquoise Ridge and Twin Creeks, now referred to as Turquoise Ridge. As a result of this transaction, from July 1, 2019, Turquoise Ridge includes the Twin Creeks open pit operations resulting in considerably higher tonnes mined at a lower average grade of ore processed. The site also
includes the Twin Creeks processing operations and heap leach facility contributed by Newmont.
Safety and Environment
There was one LTI during the quarter which resulted in an LTIFR of 1.42 per million hours worked (versus a LTIFR of 1.49 in the previous quarter). The TRIFR for the quarter was 5.66 per million hours worked, which was an increase on the 4.48 achieved in the previous quarter. No Class 13 environmental incidents occurred during the quarter.
| | | | | | | | |
| BARRICK SECOND QUARTER 2020 | 43 | MANAGEMENT'S DISCUSSION AND ANALYSIS |
Financial Results
Q2 2020 compared to Q1 2020
Turquoise Ridge’s income for the second quarter of 2020 was 2% higher compared to the prior quarter, primarily due to higher realized gold prices1, partially offset by lower sales volume and a higher cost of sales per ounce2.
Gold production in the second quarter of 2020 was 6% lower than the prior quarter, primarily due to the drawdown of gold-in-circuit inventory in the first quarter of 2020. This was combined with lower head grade and recoveries for the autoclave in the current quarter, which was partially offset by higher autoclave tonnages. Lower grades processed were primarily impacted by lower tonnes and grade mined from TR underground quarter on quarter. During the quarter, changes were made to the leadership team to ensure the geological understanding and operating efficiencies required to realize the orebodies’ full potential are in place.
Cost of sales per ounce2 and total cash costs per ounce1 in the second quarter of 2020 were 4% and 13% higher, respectively, than the prior quarter, mainly due to the impact of the gold-in-circuit inventory drawdown and lower autoclave grade and recovery as described above. All-in sustaining costs per ounce1 was 3% higher than the prior quarter, primarily reflecting higher total cash costs per ounce1, partially offset by lower minesite sustaining capital expenditure.
Capital expenditures in the second quarter of 2020 decreased by 53% compared to the prior quarter due to lower capitalized stripping, a decrease in underground development and the timing of various underground sustaining capital projects.
Q2 2020 compared to Q2 2019
Turquoise Ridge’s income for the second quarter of 2020 reflects our 61.5% interest in Nevada Gold Mines and is inclusive of income from the Twin Creeks operations following the formation of Nevada Gold Mines on July 1, 2019. Income from Turquoise Ridge for the second quarter of 2019 represents Barrick's 75% share of the Turquoise Ridge underground operations. In addition to this impact, the Turquoise Ridge assets have been restated to fair market value as a consequence of the formation of Nevada Gold Mines, which has resulted in a higher depreciation charge from July 1, 2019 onwards. This was the primary driver of the lower income in the current quarter relative to the same prior year period. Aside from this impact, Turquoise Ridge's income in the current quarter was also positively impacted by the higher realized gold price1.
Gold production for the three month period ended June 30, 2020 was 22% higher compared to the same prior year period, primarily due to the inclusion of Twin Creeks, partially offset by the reduction in Barrick's interest in Turquoise Ridge from 75% in the same prior year period to 61.5% from July 1, 2019 onward.
Cost of sales per ounce2 for the three month period ended June 30, 2020 was 61% higher than the same prior year
period reflecting the higher total cash costs per ounce1 and higher depreciation charges following the restatement to fair value as described above. For the three month period ended June 30, 2020, total cash costs per ounce1 increased by 32% compared to the same prior year period, primarily due to the impact of lower grades. All-in sustaining costs per ounce1 increased by 24%, reflecting higher total cash costs per ounce1, partially offset by lower minesite sustaining capital expenditure.
Capital expenditures for the three month period ended June 30, 2020, decreased by 53% compared to the same prior year period, mainly due to a decrease in underground development and underground mobile equipment purchases occurring in the same prior year period.
YTD Q2 2020 compared to YTD Q2 2019
Turquoise Ridge’s income for the six month period ended June 30, 2020 reflects our 61.5% interest in Nevada Gold Mines and is inclusive of income from the Twin Creeks operations following the formation of Nevada Gold Mines on July 1, 2019. Income from Turquoise Ridge for the first six months of 2019 represents Barrick's 75% share of the Turquoise Ridge operations. In addition to this impact, the Turquoise Ridge assets have been restated to fair market value as a consequence of the formation of NGM, which has resulted in a higher depreciation charge from July 1, 2019 onwards. This was the primary driver of the lower income in the current period relative to the same prior year period. Aside from this impact, Turquoise Ridge’s income for the six month period ended June 30, 2020 was also positively impacted by the higher realized gold price1.
Gold production for the six month period ended June 30, 2020 was 15% higher compared to the same prior year period, primarily due to the inclusion of Twin Creeks partially offset by the reduction in Barrick's interest in Turquoise Ridge from 75% to 61.5% from July 1, 2019.
Cost of sales per ounce2 for the six month period ended June 30, 2020 was 67% higher than the same prior year period reflecting the higher total cash costs per ounce1 and the higher depreciation charge from July 1, 2019 following the restatement to fair value as described above. For the six month period ended June 30, 2020, total cash costs per ounce1 increased by 31% compared to the same prior year period primarily due to the impact of lower grades. All-in sustaining costs per ounce1 increased by 29% compared to the same prior year period primarily reflecting higher total cash costs per ounce1 and slightly lower minesite sustaining capital expenditure on a per ounce basis.
Capital expenditures for the six month period ended June 30, 2020 decreased by 20% compared to the same prior year period mainly due to lower project capital expenditure, while minesite sustaining capital expenditure remained relatively consistent compared to the same prior year period. Lower project capital expenditure is in line with the construction schedule of the Third Shaft, as the focus is currently on shaft sinking activities with surface infrastructure now largely in place.
| | | | | | | | |
| BARRICK SECOND QUARTER 2020 | 44 | MANAGEMENT'S DISCUSSION AND ANALYSIS |
Other Mines - Nevada Gold Mines
| | | | | | | | | | | | | | | | | | | | | | | | | | | | | | | | | |
| Summary of Operating and Financial Data | | | | | | | For the three months ended | | | | |
| 6/30/20 | | | | | | 3/31/20 | | | | |
| Gold produced (000s oz) | Cost of sales
($/oz) | Total cash costs ($/oz)a | All-in sustaining costs ($/oz)a | Capital Expend-ituresb | | Gold produced (000s oz) | Cost of sales
($/oz) | Total cash costs ($/oz)a | All-in sustaining costs ($/oz)a | Capital Expend-ituresb |
| Phoenix (61.5%) | 35 | 1,726 | | 725 | | 957 | | 8 | | | 35 | 1,583 | | 737 | | 914 | | 4 | |
| Long Canyon (61.5%) | 40 | 1,009 | | 308 | | 430 | | 3 | | | 26 | 1,025 | | 345 | | 561 | | 5 | |
a.These are non-GAAP financial performance measures with no standardized meaning under IFRS and therefore may not be comparable to similar measures presented by other issuers. For further information and a detailed reconciliation of each non-GAAP measure used in this section of the MD&A to the most directly comparable IFRS measure, please see pages 79 to 103 of this MD&A.
b.Includes both minesite sustaining and project capital expenditures.
Phoenix
Gold production in the second quarter of 2020 for Phoenix was in line with the prior quarter as slightly higher grades were offset by slightly lower recovery. Mill throughput remained consistent with the prior quarter. Cost of sales per ounce2 in the second quarter of 2020 was 9% higher, mainly due to inventory movements related to a drawdown of concentrate inventory. All-in sustaining costs per ounce1 was also impacted by increased capital expenditures. Capital expenditures were 100% higher compared to the prior quarter as a result of increased capitalized stripping due to mine sequencing and higher capitalized drilling.
Long Canyon
Gold production for Long Canyon in the second quarter of 2020 was 54% higher compared to the first quarter of 2020, primarily due to a focus on leach cycle and water management to drawdown pad inventory in order to de-risk production in the second half of the year. This was partially offset by an increase in ore tonnes mined and placed on leach pads with mining moving into the main part of the ore
body in Cut 7.
Cost of sales per ounce2 in the second quarter of 2020 was 2% lower than the prior quarter. In the second quarter of 2020, all-in sustaining costs per ounce1 decreased by 23% compared to the prior quarter primarily due to lower sustaining capital. Capital expenditures decreased by 40% compared to the prior quarter due to the completion of capitalized stripping in Cut 7 as mining progressed from waste stripping to mining in the main ore body in the first quarter of 2020.
Permitting for the mine life extension has been temporarily paused. A review seeking to optimize the project, including water management, was initiated during the second quarter of 2020.
| | | | | | | | |
| BARRICK SECOND QUARTER 2020 | 45 | MANAGEMENT'S DISCUSSION AND ANALYSIS |
Pueblo Viejo (60% basis)a, Dominican Republic
| | | | | | | | | | | | | | | | | | | | | | | | | | |
| Summary of Operating and Financial Data | | | For the three months ended | | | For the six months ended | | |
| | 6/30/20 | 3/31/20 | % Change | 6/30/19 | % Change | 6/30/20 | 6/30/19 | % Change |
| Open pit tonnes mined (000s) | 4,647 | | 4,039 | | 15 | % | 6,116 | | (24) | % | 8,686 | | 13,186 | | (34) | % |
| Open pit ore | 1,469 | | 627 | | 134 | % | 1,496 | | (2) | % | 2,096 | | 3,235 | | (35) | % |
| Open pit waste | 3,178 | | 3,412 | | (7) | % | 4,620 | | (31) | % | 6,590 | | 9,951 | | (34) | % |
| | | | | | | | |
| | | | | | | | |
| Average grade (grams/tonne) | | | | | | | | |
| Open pit mined | 2.53 | | 2.21 | | 14 | % | 2.74 | | (8) | % | 2.43 | | 2.49 | | (2) | % |
| Processed | 3.45 | | 3.44 | | 0 | % | 3.56 | | (3) | % | 3.44 | | 3.66 | | (6) | % |
| Autoclave ore tonnes processed (000s) | 1,088 | | 1,471 | | (26) | % | 1,212 | | (10) | % | 2,559 | | 2,518 | | 2 | % |
| Recovery rate | 89 | % | 89 | % | 0 | % | 90 | % | (1) | % | 89 | % | 89 | % | 0 | % |
| Gold produced (000s oz) | 111 | | 143 | | (22) | % | 124 | | (10) | % | 254 | | 272 | | (7) | % |
| Gold sold (000s oz) | 115 | | 144 | | (20) | % | 132 | | (13) | % | 259 | | 274 | | (5) | % |
| Revenue ($ millions) | 201 | | 216 | | (7) | % | 192 | | 5 | % | 417 | | 390 | | 7 | % |
| Cost of sales ($ millions) | 108 | | 111 | | (3) | % | 114 | | (5) | % | 219 | | 212 | | 3 | % |
| | | | | | | | |
| | | | | | | | |
| Income ($ millions) | 92 | | 102 | | (10) | % | 75 | | 23 | % | 194 | | 173 | | 12 | % |
EBITDA ($ millions)b | 125 | | 134 | | (7) | % | 104 | | 20 | % | 259 | | 230 | | 13 | % |
EBITDA marginb,c | 62 | % | 62 | % | 0 | % | 54 | % | 15 | % | 62 | % | 59 | % | 5 | % |
| Capital expenditures ($ millions) | 21 | | 17 | | 22 | % | 18 | | 16 | % | 38 | | 34 | | 11 | % |
| Minesite sustaining | 15 | | 17 | | (10) | % | 18 | | (15) | % | 32 | | 34 | | (5) | % |
| Project | 6 | | 0 | | 100 | % | 0 | | 100 | % | 6 | | 0 | | 100 | % |
| Cost of sales ($/oz) | 935 | | 767 | | 22 | % | 852 | | 10 | % | 842 | | 772 | | 9 | % |
Total cash costs ($/oz)b | 579 | | 502 | | 15 | % | 557 | | 4 | % | 536 | | 487 | | 10 | % |
All-in sustaining costs ($/oz)b | 720 | | 626 | | 15 | % | 702 | | 3 | % | 668 | | 619 | | 8 | % |
All-in costs ($/oz)b | 763 | | 635 | | 20 | % | 724 | | 5 | % | 692 | | 630 | | 10 | % |
a.Pueblo Viejo is accounted for as a subsidiary with a 40% non-controlling interest. The results in the table and the discussion that follows are based on our 60% share only.
b.These are non-GAAP financial performance measures with no standardized meaning under IFRS and therefore may not be comparable to similar measures presented by other issuers. For further information and a detailed reconciliation of each non-GAAP measure used in this section of the MD&A to the most directly comparable IFRS measure, please see pages 79 to 103 of this MD&A.
c.Represents EBITDA divided by revenue.
Safety and Environment
There was one LTI during the quarter which resulted in an LTIFR of 0.51 per million hours worked versus zero LTIs (0.00 per million hours worked) in the previous quarter. The TRIFR for the quarter was 2.06 per million hours worked compared to 0.42 in the previous quarter. No Class 13 environmental incidents were reported during the quarter.
Financial Results
Q2 2020 compared to Q1 2020
Pueblo Viejo’s income for the second quarter of 2020 was 10% lower than the first quarter of 2020, due to lower sales volume and a higher cost of sales per ounce2, partially offset by the higher realized gold price1.
Gold production for the second quarter of 2020 was 22% lower than the prior quarter due to the lower tonnes processed as a result of our annual total plant maintenance shutdown in the second quarter of 2020. In the second quarter of 2020, ore tonnes mined increased compared to the prior quarter in line with the mineplan sequence as well as lower stripping requirements in the active mining phases, whereas mining activity during the first quarter of 2020 was focused on limestone mining. We expect production to be higher in the second half of 2020 with the major scheduled plant maintenance shutdowns now complete for 2020.
Cost of sales per ounce2 and total cash costs per ounce1 for the second quarter of 2020 were 22% and 15% higher, respectively, than the prior quarter mainly as a result of the
lower production, costs associated with the total plant shutdown and higher royalties resulting from higher realized gold prices1. This was partially offset by lower energy costs. For the second quarter of 2020, all-in sustaining costs per ounce1 increased by 15%, mainly reflecting higher total cash costs per ounce1.
Capital expenditures for the second quarter of 2020 increased by 22% compared to the prior quarter, primarily due to the commencement of early works expenditures for the proposed plant and tailings expansion project, partially offset by lower capitalized stripping costs. Expansion project expenditures were related mainly to deposits for long-lead, critical path equipment to expedite project completion.
Q2 2020 compared to Q2 2019
Pueblo Viejo’s income for the three month period ended June 30, 2020 was 23% higher than the same prior year period, driven by the higher realized gold price1, partially offset by a higher cost of sales per ounce2 and lower sales volume.
Gold production for the three month period ended June 30, 2020 was 10% lower than the same prior year period, due to lower tonnes processed as a result of an extended total plant shutdown period as Covid-19 restrictions required maintenance activities to be sequenced across multiple mini-shutdowns. Current period production was also impacted by lower head grade resulting from a higher
| | | | | | | | |
| BARRICK SECOND QUARTER 2020 | 46 | MANAGEMENT'S DISCUSSION AND ANALYSIS |
proportion of stockpile ore in the feed blend combined with lower mined grade, which reflected the planned mining sequence.
Cost of sales per ounce2 increased by 10% compared to the same prior year period as a result of lower production driven by lower throughput and grades processed as well as higher royalties and depreciation. This was partially offset by lower energy costs. Higher depreciation resulted from the impairment reversal recognized in the fourth quarter of 2019. Similarly, total cash costs per ounce1 for the three month period ended June 30, 2020 was 4% higher than the same prior year period, also due to lower production and higher royalties, combined with lower prices and volumes from third-party sales of excess power generated by our Quisqueya power plant. For the three month period ended June 30, 2020, all-in sustaining costs per ounce1 increased by 3% compared to the same prior year period reflecting higher total cash costs per ounce1, partially offset by lower sustaining capital expenditures.
Capital expenditures for the three month period ended June 30, 2020 increased by 16% compared to the same prior year period, primarily due to the commencement of early works expenditures for the proposed plant and tailings expansion project, partially offset by lower capitalized stripping costs.
YTD Q2 2020 compared to YTD Q2 2019
Pueblo Viejo’s income for the six month period ended June 30, 2020 was 12% higher than the same prior year period, primarily due to the higher realized gold price1, partially offset by lower sales volumes and a higher cost of sales per ounce2.
Gold production for the six month period ended June 30, 2020 was 7% lower than the same prior year period, primarily due to lower head grade resulting from a higher proportion of stockpile ore in the feed blend combined with lower mined grade, which reflected the planned mining sequence. This was partially offset by higher throughput.
Cost of sales per ounce2 and total cash costs per ounce1 for the six month period ended June 30, 2020 were 9% and 10% higher, respectively, than the same prior year period mainly due to the impact of lower production driven by lower grade, reduced silver by-product credits, higher royalties as well as lower prices and volumes from third-party sales of excess power generated by our Quisqueya power plant. For the six month period ended June 30, 2020, all-in sustaining costs per ounce1 increased by 8% compared to the same prior year period, primarily reflecting higher total cash costs per ounce1.
Capital expenditures for the six month period ended June 30, 2020 increased by 11% compared to the same prior year period, primarily due to the commencement of early works expenditures for the proposed plant and tailings expansion project, partially offset by lower capitalized stripping costs.
| | | | | | | | |
| BARRICK SECOND QUARTER 2020 | 47 | MANAGEMENT'S DISCUSSION AND ANALYSIS |
Loulo-Gounkoto (80% basis)a, Mali
| | | | | | | | | | | | | | | | | | | | | | | | | | |
| Summary of Operating and Financial Data | | For the three months ended | | | | For the six months ended | | |
| | 6/30/20 | 3/31/20 | % Change | 6/30/19 | % Change | 6/30/20 | 6/30/19 | % Change |
| Total tonnes mined (000s) | 8,736 | | 7,572 | | 15 | % | 8,048 | | 9 | % | 16,308 | | 16,827 | | (3) | % |
| Open pit ore | 57 | | 599 | | (90) | % | 818 | | (93) | % | 656 | | 1,360 | | (52) | % |
| Open pit waste | 8,145 | | 6,405 | | 27 | % | 6,673 | | 22 | % | 14,550 | | 14,373 | | 1 | % |
| Underground | 534 | | 568 | | (6) | % | 557 | | (4) | % | 1,102 | | 1,094 | | 1 | % |
| | | | | | | | |
| | | | | | | | |
| Average grade (grams/tonne) | | | | | | | | |
| Open pit mined | 1.54 | | 7.47 | | (79) | % | 4.58 | | (66) | % | 6.96 | | 4.31 | | 61 | % |
| Underground mined | 4.21 | | 4.16 | | 1 | % | 3.96 | | 6 | % | 4.18 | | 4.20 | | 0 | % |
| Processed | 4.92 | | 4.96 | | (1) | % | 4.74 | | 4 | % | 4.94 | | 4.47 | | 11 | % |
| Ore tonnes processed (000s) | 972 | | 980 | | (1) | % | 1,034 | | (6) | % | 1,952 | | 2,045 | | (5) | % |
| Recovery rate | 92 | % | 90 | % | 2 | % | 93 | % | (1) | % | 91 | % | 94 | % | (3) | % |
| Gold produced (000s oz) | 141 | | 141 | | 0 | % | 147 | | (4) | % | 282 | | 275 | | 3 | % |
| Gold sold (000s oz) | 157 | | 123 | | 28 | % | 148 | | 6 | % | 280 | | 276 | | 1 | % |
| Revenue ($ millions) | 272 | | 194 | | 40 | % | 194 | | 40 | % | 466 | | 362 | | 29 | % |
| Cost of sales ($ millions) | 160 | | 122 | | 31 | % | 158 | | 2 | % | 282 | | 293 | | (4) | % |
| | | | | | | | |
| | | | | | | | |
| Income ($ millions) | 107 | | 68 | | 58 | % | 32 | | 235 | % | 175 | | 61 | | 187 | % |
EBITDA ($ millions)b | 167 | | 115 | | 45 | % | 102 | | 63 | % | 282 | | 178 | | 58 | % |
EBITDA marginb,c | 61 | % | 59 | % | 3 | % | 53 | % | 15 | % | 60 | % | 49 | % | 23 | % |
| Capital expenditures ($ millions) | 55 | | 32 | | 73 | % | 31 | | 78 | % | 87 | | 49 | | 78 | % |
| Minesite sustaining | 55 | | 32 | | 73 | % | 29 | | 90 | % | 87 | | 47 | | 86 | % |
| Project | 0 | | 0 | | 0 | % | 2 | | (100) | % | 0 | | 2 | | (100) | % |
| Cost of sales ($/oz) | 1,012 | | 1,002 | | 1 | % | 1,072 | | (6) | % | 1,007 | | 1,063 | | (5) | % |
Total cash costs ($/oz)b | 639 | | 614 | | 4 | % | 598 | | 7 | % | 628 | | 638 | | (2) | % |
All-in sustaining costs ($/oz)b | 1,030 | | 891 | | 16 | % | 811 | | 27 | % | 968 | | 824 | | 18 | % |
All-in costs ($/oz)b | 1,030 | | 891 | | 16 | % | 821 | | 25 | % | 969 | | 830 | | 17 | % |
a.Barrick owns 80% of Société des Mines de Loulo SA and Société des Mines de Gounkoto with the Republic of Mali owning 20%. Loulo-Gounkoto is accounted for as a subsidiary with a 20% non-controlling interest on the basis that Barrick controls the asset. The results in the table and the discussion that follows are based on our 80% share inclusive of the impact of the purchase price allocation resulting from the Merger.
b.These are non-GAAP financial performance measures with no standardized meaning under IFRS and therefore may not be comparable to similar measures presented by other issuers. For further information and a detailed reconciliation of each non-GAAP measure used in this section of the MD&A to the most directly comparable IFRS measure, please see pages 79 to 103 of this MD&A.
c.Represents EBITDA divided by revenue.
Safety and Environment
There were zero LTIs recorded during the quarter with an LTIFR of 0.00 per million hours worked, in line with the previous quarter. The TRIFR was 1.55 per million hours worked, a decrease from the previous quarter of 2.04. No Class 13 environmental incidents occurred during the quarter.
Financial Results
Q2 2020 compared to Q1 2020
Loulo-Gounkoto’s income for the second quarter of 2020 was 58% higher than the first quarter of 2020, primarily due to the higher realized gold price1 and increased sales volume, partially offset by a slightly higher cost of sales per ounce2.
Gold production for the second quarter of 2020 was in line with the prior quarter mainly due to lower feed grade and throughput, offset by higher recovery. Gold sales for the quarter were higher than gold production, as production from the end of the first quarter of 2020 was sold at the start of the current quarter.
Cost of sales per ounce2 and total cash costs per ounce1 for the second quarter of 2020 were 1% and 4% higher, respectively, than the prior quarter, primarily due to
marginally higher operating costs in addition to higher royalties as a result of higher realized gold prices1. Cost of sales per ounce2 was further impacted by lower depreciation charges. For the second quarter of 2020, all-in sustaining costs per ounce1 increased by 16% compared to the prior quarter as a result of higher total cash costs per ounce1 and higher minesite sustaining capital expenditures.
Capital expenditures for the second quarter of 2020 increased by 73% compared to the prior quarter due to an increase in minesite sustaining capital, mainly from increased capitalized stripping at the Gounkoto open pit.
Q2 2020 compared to Q2 2019
Loulo-Gounkoto’s income for the second quarter of 2020 was 235% higher than the same prior year period, primarily due to the higher realized gold price1, a lower cost of sales per ounce2 and higher sales volume.
Gold production in the three month period ended June 30, 2020 was 4% lower compared to the same prior year period, primarily due to the lower throughput and recovery, partially offset by higher feed grade.
Cost of sales per ounce2 for the second quarter of 2020 was 6% lower than the same prior year period primarily due
| | | | | | | | |
| BARRICK SECOND QUARTER 2020 | 48 | MANAGEMENT'S DISCUSSION AND ANALYSIS |
to lower depreciation, partially offset by higher processing costs. Total cash costs per ounce1 was 7% higher than the prior year mainly due to the impact of higher mining and operating costs. For the second quarter of 2020, all-in sustaining costs per ounce1 increased by 27% compared to the same prior year period reflecting higher minesite sustaining capital expenditures and higher total cash costs per ounce1.
Capital expenditures in the three month period ended June 30, 2020 increased by 78% compared to the same prior year period driven by higher capitalized stripping at the Gounkoto open pit, higher sustaining capital and higher capitalized drilling. This was partially offset by lower underground development at Yalea and Gara.
YTD Q2 2020 compared to YTD Q2 2019
Loulo-Gounkoto’s income for the six month period ended June 30, 2020 was 187% higher than the same prior year period, primarily due to the higher realized gold price1, lower cost of sales per ounce and increased sales volume.
Gold production in the six month period ended June 30, 2020 was 3% higher compared to the same prior year period, primarily due to the higher feed grade processed from Yalea underground and the Gounkoto open pit, partially offset by lower throughput and recovery.
Cost of sales per ounce2 and total cash costs per ounce1 for the six month period ended June 30, 2020 was 5% and 2% lower, respectively, than the same prior year period primarily due to higher grade. Cost of sales per ounce2 was further impacted by lower depreciation. For the six month period ended June 30, 2020, all-in sustaining costs per ounce1 increased by 18% compared to the same prior year period reflecting higher minesite sustaining capital expenditures, partially offset by lower total cash costs per ounce1.
Capital expenditures in the six month period ended June 30, 2020 increased by 78% compared to the same prior year period driven by higher capitalized stripping at Gounkoto and other minesite sustaining capital across the complex.
Regulatory Matters
On September 27, 2019, Mali adopted an ordinance introducing a new Mining Code of the Republic of Mali (the “2019 Mining Code”), which was ratified by the Malian National Assembly on April 28, 2020. The 2019 Mining Code cancels and replaces Law No. 2012-015 dated February 27, 2012 (the “2012 Mining Code”) and governs the mining industry going forward. The implementation decree to the 2019 Mining Code remains under discussion.
Under the transitory provisions of the 2019 Mining Code, pre-existing mining titles and mining conventions in force remain valid for their remaining term and their holders continue to benefit from the stability of the tax and customs regime set out therein.
In addition, each of Loulo and Gounkoto (which together form Loulo-Gounkoto) and Morila have separate legally binding establishment conventions with the State of Mali, which guarantee the stability of the regime set out therein, govern applicable taxes and allow for international arbitration in the event of disputes. During the second quarter of 2020, an agreement was reached for a 15 year extension of the convention governing Loulo at its expiration in 2023.
Refer to note 17 of the FInancial Statements for more information.
| | | | | | | | |
| BARRICK SECOND QUARTER 2020 | 49 | MANAGEMENT'S DISCUSSION AND ANALYSIS |
Kibali (45% basis)a, Democratic Republic of Congo
| | | | | | | | | | | | | | | | | | | | | | | | | | |
| Summary of Operating and Financial Data | | For the three months ended | | | | For the six months ended | | |
| | 6/30/20 | 3/31/20 | % Change | 6/30/19 | % Change | 6/30/20 | 6/30/19 | % Change |
| Total tonnes mined (000s) | 3,253 | | 3,175 | | 2 | % | 2,938 | | 11 | % | 6,428 | | 6,100 | | 5 | % |
| Open pit ore | 316 | | 375 | | (16) | % | 426 | | (26) | % | 691 | | 1,078 | | (36) | % |
| Open pit waste | 2,507 | | 2,333 | | 7 | % | 2,126 | | 18 | % | 4,840 | | 4,204 | | 15 | % |
| Underground | 430 | | 467 | | (8) | % | 386 | | 11 | % | 897 | | 818 | | 10 | % |
| | | | | | | | |
| | | | | | | | |
| Average grade (grams/tonne) | | | | | | | | |
| Open pit mined | 1.97 | | 2.12 | | (7) | % | 2.44 | | (19) | % | 2.05 | | 2.38 | | (14) | % |
| Underground mined | 5.25 | | 5.16 | | 2 | % | 5.27 | | 0 | % | 5.20 | | 5.33 | | (2) | % |
| Processed | 3.68 | | 3.77 | | (2) | % | 3.88 | | (5) | % | 3.72 | | 3.88 | | (4) | % |
| Ore tonnes processed (000s) | 857 | | 838 | | 2 | % | 850 | | 1 | % | 1,695 | | 1,690 | | 0 | % |
| Recovery rate | 89 | % | 89 | % | 0 | % | 89 | % | 0 | % | 89 | % | 89 | % | 0 | % |
| Gold produced (000s oz) | 90 | | 91 | | (1) | % | 95 | | (5) | % | 181 | | 188 | | (4) | % |
| Gold sold (000s oz) | 96 | | 88 | | 9 | % | 95 | | 1 | % | 184 | | 185 | | (1) | % |
| Revenue ($ millions) | 164 | | 140 | | 17 | % | 125 | | 31 | % | 304 | | 242 | | 26 | % |
| Cost of sales ($ millions) | 101 | | 93 | | 9 | % | 82 | | 23 | % | 194 | | 190 | | 2 | % |
| | | | | | | | |
| | | | | | | | |
| Income ($ millions) | 64 | | 48 | | 33 | % | 43 | | 49 | % | 112 | | 53 | | 111 | % |
EBITDA ($ millions)b | 106 | | 89 | | 19 | % | 74 | | 43 | % | 195 | | 140 | | 39 | % |
EBITDA marginb,c | 65 | % | 64 | % | 3 | % | 59 | % | 10 | % | 64 | % | 58 | % | 10 | % |
| Capital expenditures ($ millions) | 10 | | 15 | | (33) | % | 10 | | 0 | % | 25 | | 20 | | 25 | % |
| Minesite sustaining | 9 | | 15 | | (40) | % | 10 | | (10) | % | 24 | | 19 | | 26 | % |
| Project | 1 | | 0 | | 100 | % | 0 | | 100 | % | 1 | | 1 | | 0 | % |
| Cost of sales ($/oz) | 1,067 | | 1,045 | | 2 | % | 868 | | 23 | % | 1,057 | | 1,030 | | 3 | % |
Total cash costs ($/oz)b | 617 | | 582 | | 6 | % | 540 | | 14 | % | 600 | | 556 | | 8 | % |
All-in sustaining costs ($/oz)b | 739 | | 773 | | (4) | % | 651 | | 14 | % | 755 | | 665 | | 14 | % |
All-in costs ($/oz)b | 750 | | 773 | | (3) | % | 655 | | 15 | % | 760 | | 669 | | 14 | % |
a.Barrick owns 45% of Kibali Goldmines SA (Kibali) with the Democratic Republic of Congo ("DRC") and our joint venture partner, AngloGold Ashanti, owning 10% and 45%, respectively. Kibali is accounted for as an equity method investment on the basis that the joint venture partners that have joint control have rights to the net assets of the joint venture. The figures presented in this table and the discussion that follows are based on our 45% effective interest in Kibali inclusive of the impact of the purchase price allocation resulting from the Merger.
b.These are non-GAAP financial performance measures with no standardized meaning under IFRS and therefore may not be comparable to similar measures presented by other issuers. For further information and a detailed reconciliation of each non-GAAP measure used in this section of the MD&A to the most directly comparable IFRS measure, please see pages 79 to 103 of this MD&A.
c.Represents EBITDA divided by revenue.
Safety and Environment
There were zero LTIs during the quarter at Kibali, which resulted in an LTIFR of 0.00 per million hours worked, compared to one LTI (0.29 per million hours worked) in the prior quarter. The TRIFR was 0.87 per million hours worked, a decrease on the 2.59 achieved for the previous quarter. No Class 13 environmental incidents occurred during the quarter.
Financial Results
Q2 2020 compared to Q1 2020
Kibali’s income for the second quarter of 2020 was 33% higher than the first quarter of 2020, primarily due to the higher realized gold price1 and increased sales volume, partially offset by a higher cost of sales per ounce2.
Gold production for the second quarter of 2020 was 1% lower than the prior quarter, as decreased feed grade resulting from lower underground tonnes mined was largely offset by solid plant performance, yielding increased throughput. Gold sales for the second quarter of 2020 were 9% higher than the prior quarter due to the timing of shipments.
Cost of sales per ounce2 and total cash costs per ounce1 for the second quarter of 2020 were 2% and 6% higher than
the prior quarter, respectively, primarily due to increased labor and logistics charges, combined with higher royalties resulting from higher realized gold prices1.
For the second quarter of 2020, all-in sustaining costs per ounce1 decreased by 4% compared to the prior quarter, due to lower sustaining capital expenditures, partially offset by higher total cash costs per ounce1.
Capital expenditures for the second quarter of 2020 decreased by 33% mainly due to lower underground capital development and the timing of capital expenditures.
Q2 2020 compared to Q2 2019
Kibali’s income for the three month period ended June 30, 2020 was 49% higher than the second quarter of 2019, mainly due to the higher realized gold price1 partially offset by a higher cost of sales per ounce2.
Gold production in the three month period ended June 30, 2020 was 5% lower compared to the same prior year period, primarily due to slightly decreased feed grade in the current period, in line with the mine plan.
Cost of sales per ounce2 and total cash costs per ounce1 in the three month period ended June 30, 2020 were 23%
| | | | | | | | |
| BARRICK SECOND QUARTER 2020 | 50 | MANAGEMENT'S DISCUSSION AND ANALYSIS |
and 14% higher, respectively, due to slightly decreased feed grade, in line with the mine plan, as well as increased labor and logistics charges and higher royalties resulting from higher realized gold prices1. For the three month period ended June 30, 2020, all-in sustaining costs per ounce1 were 14% higher compared to the same prior year period consistent with the higher total cash costs per ounce1.
Capital expenditures in the three month period ended June 30, 2020 were in line with the second quarter of 2019.
YTD Q2 2020 compared to YTD Q2 2019
Kibali’s income for the six month period ended June 30, 2020 was 111% higher than the same prior year period, mainly due to the higher realized gold price1 which was partially offset by a higher cost of sales per ounce2.
Gold production in the six month period ended June 30, 2020 was 4% lower compared to the same prior year
period, primarily due to slightly lower grade processed in the current period, in line with the mine plan.
Cost of sales per ounce2 and total cash costs per ounce1 in the six month period ended June 30, 2020 were 3% and 8% higher, respectively, as a result of the lower feed grade, in line with the mine plan, as well as increased labor and logistics charges and higher royalties resulting from higher realized gold prices1. For the six month period ended June 30, 2020, all-in sustaining costs per ounce1 were 14% higher compared to the same prior year period due to higher total cash costs per ounce1 and increased sustaining capital expenditures.
Capital expenditures in the six month period ended June 30, 2020 were 25% higher than the same prior year period, mainly due to higher capitalized stripping, additional capitalized drilling and slightly higher underground development spend.
| | | | | | | | |
| BARRICK SECOND QUARTER 2020 | 51 | MANAGEMENT'S DISCUSSION AND ANALYSIS |
Veladero (50% basis)a, Argentina
| | | | | | | | | | | | | | | | | | | | | | | | | | |
| Summary of Operating and Financial Data | | | For the three months ended | | | For the six months ended | | |
| | 6/30/20 | 3/31/20 | % Change | 6/30/19 | % Change | 6/30/20 | 6/30/19 | % Change |
| Open pit tonnes mined (000s) | 5,015 | | 8,280 | | (39) | % | 8,184 | | (39) | % | 13,295 | | 17,032 | | (22) | % |
| Open pit ore | 2,630 | | 3,871 | | (32) | % | 3,712 | | (29) | % | 6,501 | | 7,311 | | (11) | % |
| Open pit waste | 2,385 | | 4,409 | | (46) | % | 4,472 | | (47) | % | 6,794 | | 9,721 | | (30) | % |
| Average grade (grams/tonne) | | | | | | | | |
| Open pit mined | 0.89 | | 0.74 | | 20 | % | 0.63 | | 41 | % | 0.80 | | 0.66 | | 21 | % |
| Processed | 0.93 | | 0.80 | | 16 | % | 0.75 | | 24 | % | 0.86 | | 0.75 | | 15 | % |
| Heap leach ore tonnes processed (000s) | 2,609 | | 3,243 | | (20) | % | 2,828 | | (8) | % | 5,852 | | 6,244 | | (6) | % |
| | | | | | | | |
| | | | | | | | |
| Gold produced (000s oz) | 49 | | 75 | | (35) | % | 75 | | (35) | % | 124 | | 145 | | (14) | % |
| Gold sold (000s oz) | 35 | | 57 | | (39) | % | 74 | | (53) | % | 92 | | 142 | | (35) | % |
| Revenue ($ millions) | 62 | | 90 | | (31) | % | 100 | | (38 | %) | 152 | | 191 | | (20) | % |
| Cost of sales ($ millions) | 43 | | 67 | | (36) | % | 88 | | (51) | % | 110 | | 169 | | (35) | % |
| | | | | | | | |
| | | | | | | | |
| Income ($ millions) | 16 | | 24 | | (33) | % | 12 | | 33 | % | 40 | | 22 | | 82 | % |
EBITDA ($ millions)b | 29 | | 46 | | (37) | % | 43 | | (33) | % | 75 | | 83 | | (10) | % |
EBITDA marginb,c | 47 | % | 51 | % | (8) | % | 43 | % | 9 | % | 49 | % | 43 | % | 15 | % |
| Capital expenditures ($ millions) | 20 | | 40 | | (50) | % | 19 | | 5 | % | 60 | | 59 | | 2 | % |
| Minesite sustaining | 20 | | 25 | | (20) | % | 19 | | 5 | % | 45 | | 44 | | 2 | % |
| Project | 0 | | 15 | | (100) | % | 0 | | 0 | % | 15 | | 15 | | 0 | % |
| Cost of sales ($/oz) | 1,228 | | 1,182 | | 4 | % | 1,186 | | 4 | % | 1,200 | | 1,190 | | 1 | % |
Total cash costs ($/oz)b | 801 | | 788 | | 2 | % | 746 | | 7 | % | 793 | | 730 | | 9 | % |
All-in sustaining costs ($/oz)b | 1,383 | | 1,266 | | 9 | % | 1,046 | | 32 | % | 1,311 | | 1,072 | | 22 | % |
All-in costs ($/oz)b | 1,383 | | 1,537 | | (10) | % | 1,046 | | 32 | % | 1,477 | | 1,180 | | 25 | % |
a.Barrick owns 50% of Veladero with our joint venture partner, Shandong Gold, owning the remaining 50%. Veladero is proportionately consolidated on the basis that the joint venture partners that have joint control have rights to the assets and obligations for the liabilities relating to the arrangement. The figures presented in this table and the discussion that follows are based on our 50% interest in Veladero inclusive of the impact of remeasurement of our interest in Veladero following the disposal of a 50% interest on June 30, 2017.
b.These are non-GAAP financial performance measures with no standardized meaning under IFRS and therefore may not be comparable to similar measures presented by other issuers. For further information and a detailed reconciliation of each non-GAAP measure used in this section of the MD&A to the most directly comparable IFRS measure, please see pages 79 to 103 of this MD&A.
c.Represents EBITDA divided by revenue.
Safety and Environment
Veladero continues to deliver a high standard of safety with no LTIs recorded during the quarter, resulting in a LTIFR of 0.00 per million hours worked versus 0.37 in the previous quarter. The TRIFR for the quarter was 0.48 per million hours worked, a decrease on the 0.75 achieved in the previous quarter. No Class 13 environmental incidents occurred during the quarter.
Minera Andina del Sol SRL, the joint venture company that operates the Veladero mine, is the subject of various regulatory proceedings related to operational incidents occurring in March 2017, September 2016 and September 2015. Refer to note 17 to the Financial Statements for more information regarding these and related matters.
Financial Results
Q2 2020 compared to Q1 2020
Veladero’s income for the second quarter of 2020 was 33% lower than the first quarter of 2020 primarily due to lower sales volume and a higher cost of sales per ounce2, partially offset by the higher realized gold price1.
Gold production in the second quarter of 2020 was 35% lower than the prior quarter primarily due to the suspension of mining operations following the implementation of quarantine and movement restrictions by the national government of Argentina on March 19, 2020 in response to
the Covid-19 pandemic. Although these were lifted in early April, movement and social distancing restrictions slowed the remobilization of employees and contractors back to site. This was combined with severe winter weather conditions during June and the shutting off of the irrigation on phases 4B/5B for upgrades to the solution collection system. These impacts were partially offset by the higher head grade of ore processed in the quarter.
The majority of the contractors working on capital projects for the leach pad expansion phases were demobilized ahead of winter in accordance with the government's pandemic response. We now expect the phase 6 leach pad expansion to be completed in the first half of 2021 compared to an initial planned completion date within the fourth quarter of 2020. As a result of this delay, together with the performance in the first half of the year, production at Veladero is currently trending below guidance for 2020 at slightly higher per ounce costs.
Cost of sales per ounce2 and total cash costs per ounce1 in the second quarter of 2020 increased by 4% and 2%, respectively, mainly due to the impact of the operational issues described above resulting in lower sales volume and lower by-product credits due to reduced silver sales. In the second quarter of 2020, all-in sustaining costs per ounce1 increased by 9% compared to the prior quarter, due to higher total cash costs per ounce1 and higher minesite sustaining capital expenditures on a per ounce basis.
| | | | | | | | |
| BARRICK SECOND QUARTER 2020 | 52 | MANAGEMENT'S DISCUSSION AND ANALYSIS |
Capital expenditures were 50% lower compared to the previous quarter mainly due to lower project capital expenditures. Project capital expenditures mainly relate to the final unconditional payment of $15 million made during the first quarter of 2020 for the funding of a power transmission line in Argentina as a result of an agreement made with the Provincial Power Regulatory Body of San Juan (“EPRE”). Sustaining capital expenditures in the second quarter of 2020 were lower than the prior quarter mainly due to the implementation of movement and social distancing restrictions by the national government of Argentina and prioritization of operational continuity over the leach pad expansion and other capital projects.
Q2 2020 compared to Q2 2019
Veladero’s income for the three month period ended June 30, 2020 was 33% higher compared to the same prior year period, due to the higher realized gold price1, partially offset by lower sales volume and a higher cost of sales per ounce2.
Gold production for the three month period ended June 30, 2020 was 35% lower than the same prior year period, primarily from a decrease in fresh ore stacked on the leach pad due to the suspension of mining operations following the implementation of quarantine and movement restrictions by the national government of Argentina in March 2020 in response to the Covid-19 pandemic and the shutting off of phases 4B/5B for upgrades. This was partially offset by the higher head grade of ore processed.
Cost of sales per ounce2 and total cash costs per ounce1 for the three month period ended June 30, 2020 were 4% and 7% higher, respectively, than the same prior year period, mainly due to the impact of the operational issues described above resulting in lower sales volume, partially offset by decreased operating costs resulting from lower mining activity in the current quarter. For the three month period ended June 30, 2020, all-in sustaining costs per ounce1 increased by 32% compared to the same prior year period, mainly attributed to the impact of lower sales volume on minesite sustaining capital expenditures on a per ounce basis and higher total cash costs per ounce1.
Capital expenditures for the three month period ended June 30, 2020 were 5% higher than the same prior year period mainly due to higher capitalized stripping.
YTD Q2 2020 compared to YTD Q2 2019
Veladero’s income for the six month period ended June 30, 2020 was 82% higher than the same prior year period, primarily due to the higher realized gold price1, partially offset by lower sales volumes.
Gold production for the six month period ended June 30, 2020 was 14% lower than the same prior year period, primarily due to lower tonnes stacked on the leach pad as a result of the mine stoppage and restrictions upon restart to comply with the government's Covid-19 protocols and the
phase 4B/5B upgrades as described above, partially offset by higher ore grades.
Cost of sales per ounce2 and total cash costs per ounce1 for the six month period ended June 30, 2020 were 1% and 9% higher, respectively, than the same prior year period, primarily due to the impact of lower sales volume, increased export duties as described above and higher royalties reflecting higher realized gold prices1. For the six month period ended June 30, 2020, all-in sustaining costs per ounce1 increased by 22% compared to the same prior year period, mainly attributed to the impact of lower sales volume on minesite sustaining capital expenditures on a per ounce basis and higher total cash costs per ounce1.
Capital expenditures for the six month period ended June 30, 2020 increased by 2% compared to the same prior year period due to construction activities for the leach pad expansion and other value enhancing projects such as the power transmission project.
Regulatory Matters
On December 23, 2019, the Argentine Congress enacted an emergency law reducing the rate for mining export duties to 8% from 12%. This emergency law was not in force during the first quarter of 2020 and exports of doré from Veladero during this period were subject to the higher 12% rate. Following the issuance of a legal injunction in favor of Veladero in March 2020, the reduced rate of 8% was applied for all doré shipments in the second quarter of 2020. The Argentine Tax Authority appealed the March 2020 ruling.
On July 17, 2020, a legal injunction was issued in favor of the Argentine Tax Authority which reinstated the export duty rate of 12% with immediate effect (from 8%). On July 22, 2020, Barrick filed a new legal injunction to prevent the July 17, 2020 ruling from taking effect. This injunction was subsequently granted on August 4, 2020, which re-established the reduced rate of 8%. The Company has requested the application of the lower 8% rate on future shipments.
On September 1, 2019, the Argentine government issued Decree 609/2019 announcing currency restrictions in Argentina (the "Decree"). Subsequently, the Central Bank of Argentina issued Communication “A” 6770 complementing the Decree. As a result, export proceeds were required to be converted into Argentine pesos within 5 days, which was later extended to 180 days. Dividend distributions and payments to foreign suppliers now require specific authorizations from the Central Bank. These currency restrictions have had limited impact on mining operations to date but we continue to optimize the timing of our gold sales to minimize our exposure to currency devaluation, while advancing constructive discussions with the Central Bank on our rights to repatriate profits.
| | | | | | | | |
| BARRICK SECOND QUARTER 2020 | 53 | MANAGEMENT'S DISCUSSION AND ANALYSIS |
Porgera (47.5% basis)a, Papua New Guinea
| | | | | | | | | | | | | | | | | | | | | | | | | | |
| Summary of Operating and Financial Data | | | For the three months ended | | | For the six months ended | | |
| | 6/30/20 | 3/31/20 | % Change | 6/30/19 | % Change | 6/30/20 | 6/30/19 | % Change |
| Total tonnes mined (000s) | 654 | | 2,809 | | (77) | % | 3,655 | | (82) | % | 3,463 | | 6,619 | | (48) | % |
| Open pit ore | 143 | | 427 | | (67) | % | 430 | | (67) | % | 570 | | 821 | | (31) | % |
| Open pit waste | 452 | | 2,170 | | (79) | % | 3,005 | | (85) | % | 2,622 | | 5,368 | | (51) | % |
| Underground | 59 | | 212 | | (72) | % | 220 | | (73) | % | 271 | | 430 | | (37) | % |
| Average grade (grams/tonne) | | | | | | | | |
| Open pit mined | 1.75 | | 1.71 | | 2 | % | 1.64 | | 7 | % | 1.72 | | 1.74 | | (1) | % |
| Underground mined | 5.40 | | 5.82 | | (7) | % | 5.96 | | (9) | % | 5.72 | | 6.43 | | (11) | % |
| Processed | 3.16 | | 2.98 | | 6 | % | 3.25 | | (3) | % | 3.01 | | 3.22 | | (7) | % |
| Autoclave ore tonnes processed (000s) | 200 | | 736 | | (73) | % | 557 | | (64) | % | 936 | | 1,230 | | (24) | % |
| Recovery rate | 91 | % | 90 | % | 1 | % | 90 | % | 1 | % | 90 | % | 90 | % | 0 | % |
| Gold produced (000s oz) | 24 | | 62 | | (61) | % | 61 | | (61) | % | 86 | | 127 | | (32) | % |
| Gold sold (000s oz) | 24 | | 63 | | (62) | % | 63 | | (62) | % | 87 | | 128 | | (32) | % |
| Revenue ($ millions) | 39 | | 101 | | (61 | %) | 83 | | (53) | % | 140 | | 169 | | (17) | % |
| Cost of sales ($ millions) | 26 | | 70 | | (63) | % | 65 | | (60) | % | 96 | | 133 | | (28) | % |
| Income ($ millions) | (13) | | 29 | | (145) | % | 16 | | (181) | % | 16 | | 34 | | (53) | % |
EBITDA ($ millions)b | (7) | | 39 | | (118) | % | 24 | | (129) | % | 32 | | 53 | | (40) | % |
EBITDA marginb,c | (18) | % | 39 | % | (146) | % | 29 | % | (162) | % | 23 | % | 31 | % | (27) | % |
| Capital expenditures ($ millions) | 2 | | 8 | | (75) | % | 12 | | (83) | % | 10 | | 20 | | (50) | % |
| Minesite sustaining | 2 | | 8 | | (75) | % | 12 | | (83) | % | 10 | | 20 | | (50) | % |
| Project | 0 | | 0 | | 0 | % | 0 | | 0 | % | 0 | | 0 | | 0 | % |
| Cost of sales ($/oz) | 1,141 | | 1,097 | | 4 | % | 1,032 | | 11 | % | 1,109 | | 1,031 | | 8 | % |
Total cash costs ($/oz)b | 875 | | 941 | | (7) | % | 893 | | (2) | % | 923 | | 873 | | 6 | % |
All-in sustaining costs ($/oz)b | 1,046 | | 1,089 | | (4) | % | 1,112 | | (6) | % | 1,077 | | 1,044 | | 3 | % |
All-in costs ($/oz)b | 1,046 | | 1,089 | | (4) | % | 1,112 | | (6) | % | 1,077 | | 1,044 | | 3 | % |
a.Barrick owns 47.5% of Porgera with our joint venture partners, Zijin Mining and Mineral Resources Enga, owning the remaining 47.5% and 5%, respectively. Porgera is proportionately consolidated on the basis that the joint venture partners that have joint control have rights to the assets and obligations for the liabilities relating to the arrangement. The figures presented in this table and the discussion that follows are based on our 47.5% interest in Porgera.
b.These are non-GAAP financial performance measures with no standardized meaning under IFRS and therefore may not be comparable to similar measures presented by other issuers. For further information and a detailed reconciliation of each non-GAAP measure used in this section of the MD&A to the most directly comparable IFRS measure, please see pages 79 to 103 of this MD&A.
c.Represents EBITDA divided by revenue.
Safety and Environment
There were zero LTIs at Porgera during the quarter, which resulted in an LTIFR of 0.00 per million hours worked versus 0.33 in the previous quarter. The TRIFR for the quarter was 0.00 per million hours worked compared to 1.31 in the previous quarter. No Class 13 environmental incidents occurred during the quarter.
Financial Results
On April 25, 2020, Porgera was placed on care and maintenance after the Government of Papua New Guinea communicated on April 24, 2020 that the SML would not be extended. Refer to the section below for further details. This has had a significant negative impact on Porgera's financial results for the second quarter of 2020 and six month period ended June 30, 2020
Q2 2020 compared to Q1 2020
Porgera recorded a loss for the second quarter of 2020 which was due to the mine entering care and maintenance as described above. This compared to income of $29 million in the prior quarter.
Gold production in the second quarter of 2020 was 61% lower than the prior quarter as the mine was placed on care and maintenance on April 25, 2020.
Cost of sales per ounce2 and total cash costs per ounce1 in the second quarter of 2020 increased by 4% and decreased by 7%, respectively, due to the cessation of all mining activity after April 24, 2020 and the mine being placed on care and maintenance. Cost of sales per ounce2 increased compared to the prior quarter due to continued straight-line depreciation despite lower production. In the second quarter of 2020, all-in sustaining costs per ounce1 decreased by 4% compared to the prior quarter due to the decrease in total cash costs per ounce1, combined with lower minesite sustaining capital expenditures.
Capital expenditures in the second quarter of 2020 decreased by 75% compared to the prior quarter as the mine was placed on care and maintenance as described above.
Q2 2020 compared to Q2 2019
Porgera recorded a loss for the three month period ended June 30, 2020 primarily due to the mine being placed on care and maintenance. This compared to income of $16 million in the prior year period.
Gold production for the three month period ended June 30, 2020 was 61% lower than the same prior year period,
| | | | | | | | |
| BARRICK SECOND QUARTER 2020 | 54 | MANAGEMENT'S DISCUSSION AND ANALYSIS |
primarily due to the mine being placed on care and maintenance.
In the second quarter of 2020, cost of sales per ounce2 and total cash costs per ounce1 increased by 11% and decreased by 2%, due to the cessation of all mining activity after April 24, 2020 and the mine being placed on care and maintenance. Cost of sales per ounce2 increased compared to the same prior year period due to continued straight-line depreciation despite lower production. All-in sustaining costs per ounce1 in the second quarter of 2020 decreased by 6% compared to the same prior year period, mainly due to the decrease in total cash costs per ounce1, combined with lower minesite sustaining capital expenditures.
For the three month period ended June 30, 2020, capital expenditures decreased by 83% compared to the same prior year period as a result of the mine being placed on care and maintenance.
YTD Q2 2020 compared to YTD Q2 2019
Porgera’s income for the six month period ended June 30, 2020 was 53% lower than the same prior year period primarily due to the mine being placed on care and maintenance during the current period.
Gold production for the six month period ended June 30, 2020 was 32% lower than the same prior year period, primarily due to the mine being placed on care and maintenance during the current period.
For the six month period ended June 30, 2020, cost of sales per ounce2 and total cash costs per ounce1 increased by 8% and 6%, respectively, mainly due to the cessation of all mining activity after April 24, 2020 and the mine being placed on care and maintenance. Cost of sales per ounce2 increased compared to the same prior year period due to continued straight-line depreciation despite lower production. All-in sustaining costs per ounce1 for the six month period ended June 30, 2020 increased by 3% compared to the same prior year period, mainly due to the increase in total cash costs per ounce1, partially offset by lower minesite sustaining capital expenditures.
For the six month period ended June 30, 2020, capital expenditures decreased by 50% compared to the same prior year period as a result of the mine being placed on care and maintenance.
Porgera Special Mining Lease Extension
Porgera's SML terminated on August 16, 2019. The Company applied for a 20-year extension of the SML in June 2017 and has been engaging with the Government of Papua New Guinea on this matter since then. On August 2, 2019, the National Court of Papua New Guinea ruled that the provisions of the country’s 1992 Mining Act applied to the Porgera gold mine, thus allowing it to continue operating while the application to extend its SML was being considered. Also in 2019, in response to a request from Papua New Guinea Prime Minister Marape, the Company proposed a benefit-sharing arrangement that would deliver more than half the economic benefits from the Porgera mine to Papua New Guinea stakeholders, including the
Government, for the remainder of the life of mine, estimated at 20 years.
On April 24, 2020, BNL, the majority owner and operator of the Porgera joint venture, received a communication from the Government of Papua New Guinea that the SML would not be extended. The Company believes the Government’s decision not to extend the SML is tantamount to nationalization without due process and in violation of the Government’s legal obligations to BNL. The Company remains willing to discuss the issue with Prime Minister Marape and his Government in light of the potentially catastrophic impact of this decision for the communities at Porgera and in Enga Province, and for the country as a whole. BNL will pursue all legal avenues to challenge the Government’s decision and to recover any damages that BNL may suffer as a result of the Government’s decision. The Company will not discuss transitional arrangements for the management of the Porgera mine, as proposed by the Government, as this is not consistent with BNL’s rights. Based on the communication received from the Government of Papua New Guinea that the SML would not be extended, Porgera was placed on temporary care and maintenance on April 25, 2020 to ensure the safety and security of our employees and communities.
On April 28, 2020, BNL filed a Judicial Review action against the Government of Papua New Guinea in the Papua New Guinea National Court of Justice. Judicial Review is a proceeding that challenges the procedural and constitutional adequacy of government administrative actions. The Judicial Review action seeks to quash the decision not to extend the SML on the grounds that the Government did not comply with the applicable legal standards and processes. On June 5, 2020, the National Court granted BNL leave to apply for Judicial Review.
BNL asked the National Court for a stay of the decision not to extend the SML to enable BNL to stay in possession of the mine to put it on temporary care and maintenance and to protect the mine’s assets. After a hearing on April 30, 2020, the National Court ordered that BNL could stay in possession of the Porgera mine “to ensure that the environment, the integrity of the mine and the rights of the landowners are not compromised” and ordered the Government of Papua New Guinea to cooperate with that objective. On July 17, 2020, the Court stayed any further actions to implement the decision not to extend the SML.
Trial was set to commence in the Judicial Review action on August 12, 2020. BNL sought leave to appeal two procedural rulings of the National Court that would affect the trial to the Supreme Court of Papua New Guinea. In hearings on August 5 and 6, 2020, the Supreme Court granted leave for BNL's appeals and stayed the trial.
On July 9, 2020, BNL initiated conciliation proceedings before the ICSID. Through this conciliation, BNL seeks to reach an agreement for the extension of the SML on terms that will be mutually beneficial to the Company and to all Papua New Guinea stakeholders.
Simultaneously with BNL initiating the conciliation proceedings, Barrick PD, the Company’s subsidiary and an investor in the Porgera mine, has given notice to the
| | | | | | | | |
| BARRICK SECOND QUARTER 2020 | 55 | MANAGEMENT'S DISCUSSION AND ANALYSIS |
Government of Papua New Guinea that a dispute has arisen under the BIT between Papua New Guinea and Australia, and has referred the dispute to arbitration before the ICSID. Barrick PD seeks to recover damages it has already suffered and damages it may suffer in the future by virtue of the Government’s wrongful refusal to grant an extension of the SML. The dispute notice expressly invites the Government to engage in consultations and negotiations in an attempt to resolve the investment treaty dispute.
Our priority remains the health and safety of all our employees and community stakeholders. Due to the uncertainty related to the timing and scope of future developments on the mine’s operating outlook, we have withdrawn our full year 2020 guidance for Porgera. As this is a rapidly evolving situation, we will reassess on an ongoing basis and provide further updates in due course, while maintaining operational readiness.
Porgera Tax Audits
In April 2020, BNL received a position paper from the Internal Revenue Commission ("IRC") in Papua New Guinea asserting various proposed adjustments and other tax liabilities amounting to $191 million (not including potential penalties) arising from tax audits of BNL conducted for 2006 through 2015. BNL responded to the position paper on June 30, 2020. The Company has reviewed the IRC position paper and concluded that there is no merit to the proposed adjustments, except for certain immaterial items for which a provision had already been made. The Company intends to defend its position vigorously and has not recorded any additional estimated amounts for the potential liability arising from the IRC position paper as the Company cannot reasonably predict the outcome.
| | | | | | | | |
| BARRICK SECOND QUARTER 2020 | 56 | MANAGEMENT'S DISCUSSION AND ANALYSIS |
North Mara (84% basis)a, Tanzania
| | | | | | | | | | | | | | | | | | | | | | | | | | |
| Summary of Operating and Financial Data | | | For the three months ended | | | For the six months ended | | |
| | 6/30/20 | 3/31/20 | % Change | 6/30/19 | % Change | 6/30/20 | 6/30/19 | % Change |
| Total tonnes mined (000s) | 766 | | 2,448 | | (69) | % | 2,709 | | (72) | % | 3,214 | | 5,078 | | (37) | % |
| | | | | | | | |
| | | | | | | | |
| | | | | | | | |
| | | | | | | | |
| Open pit ore | 326 | | 1,158 | | (72) | % | 812 | | (60) | % | 1,484 | | 1,466 | | 1 | % |
| Open pit waste | 204 | | 993 | | (79) | % | 1,728 | | (88) | % | 1,197 | | 3,272 | | (63) | % |
| Underground | 236 | | 297 | | (21) | % | 169 | | 40 | % | 533 | | 339 | | 57 | % |
| Average grade (grams/tonne) | | | | | | | | |
| Open pit mined | 2.53 | | 2.04 | | 24 | % | 2.19 | | 16 | % | 2.14 | | 2.03 | | 6 | % |
| Underground mined | 9.95 | | 4.13 | | 141 | % | 9.76 | | 2 | % | 6.79 | | 7.94 | | (14) | % |
| Processed | 3.75 | | 3.42 | | 10 | % | 5.37 | | (30) | % | 3.58 | | 4.17 | | (14) | % |
| Ore tonnes processed (000s) | 611 | | 636 | | (4) | % | 467 | | 31 | % | 1,247 | | 945 | | 32 | % |
| Recovery rate | 93 | % | 93 | % | 0 | % | 94 | % | (1) | % | 93 | % | 93 | % | 0 | % |
| | | | | | | | |
| | | | | | | | |
| Gold produced (000s oz) | 68 | | 65 | | 5 | % | 76 | | (11) | % | 133 | | 118 | | 13 | % |
| Gold sold (000s oz) | 67 | | 70 | | (4) | % | 66 | | 2 | % | 137 | | 109 | | 26 | % |
| Revenue ($ millions) | 117 | | 111 | | 5 | % | 86 | | 35 | % | 228 | | 142 | | 60 | % |
| Cost of sales ($ millions) | 71 | | 66 | | 7 | % | 52 | | 37 | % | 137 | | 98 | | 40 | % |
| | | | | | | | |
| | | | | | | | |
| Income ($ millions) | 44 | | 49 | | (10) | % | 31 | | 41 | % | 93 | | 40 | | 132 | % |
EBITDA ($ millions)b | 65 | | 70 | | (7) | % | 47 | | 38 | % | 135 | | 69 | | 96 | % |
EBITDA marginb,c | 56 | % | 63 | % | (11) | % | 55 | % | 2 | % | 59 | % | 48 | % | 23 | % |
| Capital expenditures ($ millions) | 30 | | 13 | | 130 | % | 10 | | 198 | % | 43 | | 17 | | 152 | % |
| Minesite sustaining | 29 | | 11 | | 162 | % | 7 | | 312 | % | 40 | | 13 | | 206 | % |
| | | | | | | | |
| | | | | | | | |
| Project | 1 | | 2 | | (50) | % | 3 | | (67) | % | 3 | | 4 | | (25) | % |
| Cost of sales ($/oz) | 1,040 | | 959 | | 8 | % | 800 | | 30 | % | 999 | | 905 | | 10 | % |
Total cash costs ($/oz)b | 724 | | 646 | | 12 | % | 539 | | 34 | % | 684 | | 625 | | 10 | % |
All-in sustaining costs ($/oz)b | 1,166 | | 816 | | 43 | % | 675 | | 73 | % | 987 | | 782 | | 26 | % |
All-in costs ($/oz)b | 1,195 | | 838 | | 43 | % | 703 | | 70 | % | 1,013 | | 815 | | 24 | % |
a.Formerly part of Acacia Mining plc. On September 17, 2019, Barrick acquired all of the shares of Acacia it did not own. The results are on a 63.9% basis until September 30, 2019 (notwithstanding the completion of the Acacia transaction on September 17, 2019, we consolidated our interest in Acacia and recorded a non-controlling interest of 36.1% in the income statement for the entirety of the third quarter of 2019 as a matter of convenience), on a 100% basis from October 1, 2019 to December 31, 2019 and on a 84% basis starting January 1, 2020, the date the GoT's 16% free carried interest was made effective.
b.These are non-GAAP financial performance measures with no standardized meaning under IFRS and therefore may not be comparable to similar measures presented by other issuers. For further information and a detailed reconciliation of each non-GAAP measure used in this section of the MD&A to the most directly comparable IFRS measure, please see pages 79 to 103 of this MD&A.
c.Represents EBITDA divided by revenue.
On January 24, 2020, Barrick announced that the Company had ratified the creation of Twiga at a signing ceremony with the President of Tanzania, formalizing the establishment of a joint venture between Barrick and the GoT and resolution of all outstanding disputes between Barrick and the GoT, including the lifting of the previous concentrate export ban, effective immediately. Effective January 1, 2020, the GoT received a free carried shareholding of 16% in each of the Tanzania mines (Bulyanhulu, Buzwagi and North Mara), a 16% interest in the shareholder loans owed by the operating companies and will receive half of the economic benefits from the Tanzanian operations from taxes, royalties, clearing fees and participation in all cash distributions made by the mines and Twiga, after the recoupment of capital investments. Twiga will provide management services to the mines.
Safety and Environment
There were zero LTIs recorded at North Mara during the quarter, which resulted in an LTIFR of 0.00 per million hours worked, in line with what was achieved in the previous quarter. The TRIFR was 3.32 per million hours worked, which is an increase from the 0.53 recorded in the previous quarter. No Class 13 environmental incidents occurred during the quarter.
Financial Results
Q2 2020 compared to Q1 2020
North Mara's income for the second quarter of 2020 was 10% lower than the first quarter of 2020 due to a higher cost of sales per ounce2 as well as lower sales volumes compared to the prior quarter as a result of the timing of gold shipments. This was partially offset by the higher realized gold price1.
In the second quarter of 2020, gold production was 5% higher than the prior quarter. This was primarily due to higher processed grade as open pit mining ceased during the quarter, and mill feed was mainly sourced from higher grade underground zones at Gokona. Over the near-to-medium term, we expect North Mara to continue operations exclusively as an underground mine, supplemented with the processing of stockpiled material to maintain the production profile. Following the completion of the Acacia transaction in the third quarter of 2019, we continue to evaluate sequencing at North Mara and expect to update the mineplan in due course for an optimized restart of open pit mining.
Cost of sales per ounce2 and total cash costs per ounce1 in the second quarter of 2020 were 8% and 12% higher,
| | | | | | | | |
| BARRICK SECOND QUARTER 2020 | 57 | MANAGEMENT'S DISCUSSION AND ANALYSIS |
respectively, due to higher direct mining costs from the transition to an exclusively underground operation following the cessation of open pit mining, as well as the additional costs related to this transition. All-in sustaining costs per ounce1 in the second quarter of 2020 was 43% higher than the prior quarter, mainly due to higher total cash costs per ounce1 and higher minesite sustaining capital expenditures.
Capital expenditures in the second quarter of 2020 were 130% higher compared to the first quarter of 2020 mainly due to our investment in the tailings storage facility, other water management initiatives and land acquisitions. We expect this capital investment to reduce over time as these legacy issues in Tanzania inherited from Acacia are addressed.
Q2 2020 compared to Q2 2019
North Mara's income for the three month period ended June 30, 2020 was 41% higher than the same prior year period, mainly due to the higher realized gold price1, partially offset by a higher cost of sales per ounce2. This was further impacted by the change in our percentage ownership from 63.9% in the same prior year period to 84% in the current period.
For the three month period ended June 30, 2020, gold production was 11% lower than the same prior year period following mineplan resequencing to ensure relatively consistent feed grade over the life of mine, compared to the variability of the previous mineplan. Production was also impacted by the cessation of open pit mining in the current quarter, which resulted in an increased proportion of stockpiled material processed to supplement underground ore feed. Offsetting these impacts was the change in our percentage ownership as described above.
Cost of sales per ounce2 and total cash costs per ounce1 in the three month period ended June 30, 2020 were 30% and 34% higher, respectively, than the same prior year period. This primarily reflected the lower feed grade, combined with higher direct mining costs from the transition at North Mara to an exclusively underground operation following the cessation of open pit mining, as well as the additional costs related to this transition. All-in sustaining costs per ounce1 in the second quarter of 2020 was 73% higher than the same prior year period mainly due to higher total cash costs per ounce1 and higher minesite sustaining capital expenditures.
For the three month period ended June 30, 2020, capital expenditures increased by 198% compared to the same
prior year period mainly due to our investment in the tailings storage facility, other water management initiatives, land acquisitions as well as the increase in our ownership interest as described above. We expect this capital investment to reduce over time as these legacy issues in Tanzania inherited from Acacia are addressed.
YTD Q2 2020 compared to YTD Q2 2019
North Mara's income for the six month period ended June 30, 2020 was 132% higher than the same prior year period, mainly due to the higher realized gold price1, partially offset by a higher cost of sales per ounce2. This was further impacted by the change in our percentage ownership from 63.9% in the same prior year period to 84% in the current period.
For the six month period ended June 30, 2020, gold production was 13% higher than the same prior year period, mainly due to the increase in our ownership interest. Partially offsetting this impact, the feed grade was lower in the current period following mineplan resequencing to ensure relatively consistent feed grade over the life of mine, compared to the variability of the previous mineplan. Production was also impacted by the cessation of open pit mining in the current period, which resulted in an increased proportion of stockpiled material processed to supplement underground ore feed.
Cost of sales per ounce2 and total cash costs per ounce1 in the six month period ended June 30, 2020 were both 10% higher than the same prior year period. This primarily reflected the lower feed grade, combined with higher direct mining costs from the transition at North Mara to an exclusively underground operation following the cessation of open pit mining, as well as the additional costs related to this transition. All-in sustaining costs per ounce1 for the six month period ended June 30, 2020 was 26% higher than the same prior year period mainly due to higher total cash costs per ounce1 and higher minesite sustaining capital expenditures on a per ounce basis.
For the six month period ended June 30, 2020, capital expenditures increased by 152% compared to the same prior year period, primarily due to the increase in our ownership interest as described above and our investment in the tailings storage facility, other water management initiatives and land acquisitions. We expect this capital investment to reduce over time as these legacy issues in Tanzania inherited from Acacia are addressed.
| | | | | | | | |
| BARRICK SECOND QUARTER 2020 | 58 | MANAGEMENT'S DISCUSSION AND ANALYSIS |
Other Mines - Gold
| | | | | | | | | | | | | | | | | | | | | | | | | | | | | | | | | |
| Summary of Operating and Financial Data | | | | | | | For the three months ended | | | | |
| 6/30/20 | | | | | | 3/31/20 | | | | |
| Gold produced (000s oz) | Cost of sales
($/oz) | Total cash costs
($/oz)a | All-in sustaining costs
($/oz)a | Capital Expend-ituresb | | Gold produced (000s oz) | Cost of sales
($/oz) | Total cash costs ($/oz)a | All-in sustaining costs ($/oz)a | Capital Expend-ituresb |
| | | | | | | | | | | |
| Tongon (89.7%) | 64 | 1,275 | | 688 | | 745 | | 2 | | | 61 | 1,368 | | 762 | | 788 | | 1 | |
| | | | | | | | | | | |
| Hemlo | 54 | 1,268 | | 1,080 | | 1,456 | | 19 | | | 57 | 1,119 | | 945 | | 1,281 | | 19 | |
| | | | | | | | | | | |
Buzwagic | 20 | 909 | | 751 | | 770 | | 1 | | | 22 | 1,373 | | 1,275 | | 1,288 | | 0 | |
Bulyanhuluc | 7 | 1,658 | | 950 | | 1,014 | | 8 | | | 7 | 1,685 | | 686 | | 906 | | 2 | |
| | | | | | | | | | | |
a.These are non-GAAP financial performance measures with no standardized meaning under IFRS and therefore may not be comparable to similar measures presented by other issuers. For further information and a detailed reconciliation of each non-GAAP measure used in this section of the MD&A to the most directly comparable IFRS measure, please see pages 79 to 103 of this MD&A.
b.Includes both minesite sustaining and project capital expenditures.
c.Formerly part of Acacia Mining plc. On September 17, 2019, Barrick acquired all of the shares of Acacia it did not own. The results are on a 100% basis from October 1, 2019 to December 31, 2019 and on a 84% basis starting January 1, 2020, the date the GoT's 16% free carried interest was made effective.
Tongon (89.7% basis), Côte d'Ivoire
Gold production for Tongon in the second quarter of 2020 was 5% higher than the prior quarter. Cost of sales per ounce2 in the second quarter of 2020 was 7% lower than the prior quarter as a result of lower depreciation charges and lower total cash costs per ounce1. The decrease in total cash costs per ounce1 was primarily driven by lower processing and mining costs. All-in sustaining costs per ounce1 in the second quarter of 2020 decreased by 5%, mainly due to the decrease in total cash costs per ounce1, partially offset by higher minesite sustaining capital.
Hemlo, Ontario, Canada
Hemlo's gold production in the second quarter of 2020 was 5% lower than the prior quarter due to lower throughput, partially offset by higher grades. Cost of sales per ounce2 and total cash costs per ounce1 in the second quarter of 2020 were 13% and 14% higher, respectively, than the prior quarter primarily due to an increased proportion of higher-cost open pit stockpile material processed at the mill, as well as higher royalties resulting from higher gold prices and mining in underground zones that incur a higher NPI royalty burden. In the second quarter of 2020, all-in sustaining costs per ounce1 increased by 14% compared to the prior quarter reflecting the increase in higher total cash costs per ounce1. Minesite sustaining capital was in line with the prior quarter.
Production at Hemlo remains on track to achieve 2020 guidance. Costs are trending above guidance for 2020, partially due to an increase in royalty expense from higher gold prices and mining in underground zones that incur a higher NPI royalty burden as described above. Additionally, our costs have been impacted by a temporary delay in our new underground contractor arriving at site due to quarantine and movement restrictions in response to the Covid-19 pandemic. This temporarily delayed the ramp-up of underground development, resulting in an increased proportion of higher-cost open pit stockpiled material processed at the mill. The new underground contractor started mobilizing to site at the end of the second quarter of 2020, with the ramp-up of underground development now underway.
Buzwagi, Tanzania
Gold production for Buzwagi in the second quarter of 2020 was 9% lower compared to the first quarter of 2020, as a result of two maintenance events resulting in lower throughput. Cost of sales per ounce2 and all-in sustaining costs per ounce1 in the second quarter decreased by 34% and 40%, respectively, mainly due to the sale of lower cost stockpiled concentrate following the re-commencement of exports.
Bulyanhulu, Tanzania
Gold production for Bulyanhulu in the second quarter of 2020 was in line with the first quarter of 2020. Cost of sales per ounce2 in the second quarter of 2020 was 2% lower than the prior quarter, which reflects the impact of the sale of stockpiled concentrate following the re-commencement of exports. Relative to the gold produced in the current quarter, the stockpiled concentrate has a lower depreciation cost per ounce and a higher total cash cost per ounce1. All-in sustaining costs per ounce1 were 12% higher than the prior quarter, primarily due to higher total cash costs per ounce1 and increased minesite sustaining capital expenditures related to refurbishment projects in connection with the restart of mining activities by the end of the year.
| | | | | | | | |
| BARRICK SECOND QUARTER 2020 | 59 | MANAGEMENT'S DISCUSSION AND ANALYSIS |
Other Mines - Copper
| | | | | | | | | | | | | | | | | | | | | | | | | | | | | | | | | |
| Summary of Operating and Financial Data | | | | | | | For the three months ended | | | | |
| 6/30/20 | | | | | | 3/31/20 | | | | |
| Copper production (millions of pounds) | Cost of sales
($/lb) | C1 cash costs
($/lb)a | All-in sustaining costs
($/lb)a | Capital Expend-ituresb | | Copper production (millions of pounds) | Cost of sales
($/lb) | C1 cash costs
($/lb)a | All-in sustaining costs
($/lb)a | Capital Expend-ituresb |
| Lumwana | 72 | 2.06 | | 1.55 | | 2.27 | | 40 | | | 64 | 1.94 | | 1.63 | | 2.26 | | 25 | |
Zaldívar (50%) | 28 | 2.52 | | 1.79 | | 2.09 | | 13 | | | 31 | 2.39 | | 1.71 | | 1.99 | | 15 | |
| Jabal Sayid (50%) | 20 | 1.41 | | 1.14 | | 1.41 | | 5 | | | 20 | 1.28 | | 0.97 | | 1.11 | | 2 | |
a.These are non-GAAP financial performance measures with no standardized meaning under IFRS and therefore may not be comparable to similar measures presented by other issuers. For further information and a detailed reconciliation of each non-GAAP measure used in this section of the MD&A to the most directly comparable IFRS measure, please see pages 79 to 103 of this MD&A.
b.Includes both minesite sustaining and project capital expenditures.
Lumwana, Zambia
Copper production for Lumwana in the second quarter of 2020 was 13% higher than the prior quarter as the mine benefited from improved mined tonnes and grades, combined with solid throughput performance at the plant. Cost of sales per pound2 in the second quarter of 2020 was 6% higher than the prior quarter due to higher depreciation, partially offset by lower C1 cash costs per pound1. C1 cash costs per pound1 were lower compared to the prior quarter as a result of improved feed grade, decreased mining costs, as well as lower general and administrative expenses, and lower concentrate marketing unit costs. In the second quarter of 2020, all-in sustaining costs per pound1 was in line with the prior quarter, with increased capitalized stripping offsetting the lower C1 cash costs per pound1.
Zaldívar (50% basis), Chile
Copper production for Zaldívar in the second quarter of 2020 was 10% lower than the prior quarter mainly due to lower grades and recoveries, partially offset by improved heap leach circuit throughput. Cost of sales per pound2 in the second quarter of 2020 was 5% higher than the prior quarter primarily due to lower production, partially offset by lower energy costs and a favorable currency exchange rate. All-in sustaining costs per pound1 increased by 5% compared to the prior quarter primarily due to higher C1 cash costs per pound1 as well as higher minesite sustaining capital expenditures due to the timing of payments for capital projects.
Jabal Sayid (50% basis), Saudi Arabia
Jabal Sayid's copper production in the second quarter of 2020 was in line with the prior period, as higher plant throughput was offset by lower feed grade compared to the prior quarter, though marginally higher than plan. Cost of sales per pound2 in the second quarter of 2020 was 10% higher than the prior period, primarily due to higher C1 cash costs per pound1. C1 cash costs per pound1 was 18% higher, mainly as a result of lower grades and increased underground mining costs. All-in sustaining costs per pound1 in the second quarter of 2020 increased by 27% compared to the prior quarter as a result of higher C1 cash costs per pound1, as well as spend related to electrical infrastructure and the timing of capital expenditure, with the year-to-date position in line with plan.
| | | | | | | | |
| BARRICK SECOND QUARTER 2020 | 60 | MANAGEMENT'S DISCUSSION AND ANALYSIS |
Growth Project Updates
Goldrush Complex, Nevada, USA
At the Goldrush Complex, drilling operations continue at both Goldrush and Fourmile (Fourmile is not currently included in the Nevada Gold Mines joint venture with Newmont, but may be contributed in the future if certain criteria are met). The main objectives for this drilling program include defining the edge of the orebody, orebody continuity, inferred resource addition and exploration upside definition.
The geotechnical mining rock mass model for Goldrush has now been fully integrated into the mine planning process. Mine design is currently progressing well with the first LOM schedule on track for review in the third quarter of 2020.
Work on a localized dewatering model for Goldrush has been completed to a pre-feasibility level and indicates that certain zones within the mining area could benefit from underground dewatering. The initial mine plan produced as part of the feasibility study will continue to be based on the more conservative regional dewatering model. This approach will result in lower risk to the startup mine plan in the short-to-medium-term, while still allowing Goldrush to incorporate potential benefits from any opportunities identified by the localized dewatering model in the medium-to-long-term.
Construction of the twin exploration declines at Goldrush continues to progress ahead of schedule. Overall progress against the contracted development stands at 88% (from 74% at the end of the first quarter of 2020). The updated forecast for completion of contracted development is September 2020, which should enable the commencement of owner development in the fourth quarter of 2020 - six months earlier than planned.
The integration of the Goldrush project team into the Cortez structure has been completed and the consolidated underground management team is currently progressing operational readiness, in line with the accelerated project progress.
During 2021, underground development and exploration will continue at Goldrush. First ore will be exposed in the first half of 2021 as part of ongoing exploration and development. Activities in 2021 will primarily focus on verifying geological, geotechnical and geohydrological models developed for the feasibility study until the Record of Decision ("ROD") is received. Following receipt of the ROD, construction of infrastructure to allow us to ramp-up production activities can commence.
As at June 30, 2020, we have spent $175 million (including $30 million in the second quarter of 2020) on the Goldrush project, inclusive of the exploration declines (100% basis). The current capital estimate for the Goldrush project is approximately $1.0 billion (100% basis), subject to the completion of the final Goldrush feasibility study. We continue to expect this study to be completed in the first quarter of 2021.
Permitting activities continue to advance largely on-track for the second quarter of 2020, including the approval of the
water attenuation study by the state authorities. We continue to expect receipt of a ROD in the fourth quarter of 2021, in-line with the current schedule.
Turquoise Ridge Third Shaft, Nevada, USA4
Construction of the third shaft at Turquoise Ridge, which has a hoisting capacity of 5,500 tonnes per day, continues to advance according to schedule and within budget. Efforts in the second quarter of 2020 included the restart of surface construction works associated with permanent materials handling systems and the continuance of sinking activities. The shaft liner has now advanced to a depth of 509 meters below the collar as at June 30, 2020. To date, we have spent $142 million (including $12 million in the second quarter of 2020) out of an estimated capital cost of approximately $300-$330 million (100% basis).
Pueblo Viejo Plant and Tailings Expansion Study, Dominican Republic5
Studies for the process plant and tailings expansion at the Pueblo Viejo mine remain supportive of an increase in throughput, allowing the operation to maintain minimum average annual gold production of approximately 800,000 ounces after 2022 (100% basis).
The Pueblo Viejo process plant expansion study flowsheet includes an additional primary crusher, coarse ore stockpile and ore reclaim delivering to a new single stage semi-autogenous grinding (SAG) mill. A new flotation circuit will concentrate the bulk of the sulfide ore prior to oxidation. The concentrate will be blended with fresh milled ore to feed the modified autoclave circuit, which will have additional oxygen supplied from a new 3,000 tonnes per day facility. The existing autoclaves will be upgraded to increase the sulfur processing capacity of each autoclave through additional high-pressure cooling water and recycle flash capability using additional slurry pumping and thickening.
Engineering design of the flowsheet progressed during the quarter, with several long lead equipment packages and orders placed. This includes the oxygen plant, which is the longest lead item of all the plant items.
The process plant expansion environmental impact study has been submitted and received by authorities. The study for additional tailings capacity to support the expansion of the process plant continues. The field work for baseline environmental assessment and geotechnical investigation has progressed slower than planned, due to quarantine measures in the Dominican Republic in response to the Covid-19 pandemic that have now largely been lifted. We continue constructive discussions with the national authorities to obtain the necessary permitting to proceed.
Zaldívar Chloride Leach Project, Chile
Zaldívar is jointly owned by Antofagasta and Barrick, and is operated by Antofagasta.
In December 2019, the Board of Compañía Minera Zaldívar approved the Chloride Leach Project. The capital cost of the project of $189 million (100% basis) consists of the cost of execution and commissioning as well as a joint venture
| | | | | | | | |
| BARRICK SECOND QUARTER 2020 | 61 | MANAGEMENT'S DISCUSSION AND ANALYSIS |
board-controlled contingency provision. The project contemplates the construction of a chloride dosing system, an upgrade of the solvent extraction plant and the construction of additional washing ponds.
Although work has started on site, the majority of project work execution has been limited by travel and isolation restrictions in response to the Covid-19 pandemic. Detailed engineering is now 99% complete. Mobilization of construction contractors ramped up in July with onsite earthworks and assembly activities expected to commence in August. Preliminary scheduling currently indicates a potential six-month delay in project commissioning with no expected impact in the estimated capital cost.
Upon commissioning, the project is expected to increase copper recoveries by more than 10 percentage points through the addition of chlorides to the leach solution and with further potential upside in recoveries possible depending on the type of ore being processed. This process is based on a proprietary technology called CuproChlor® that was developed by Antofagasta at its Michilla operation, which had similar ore types to those that are processed at Zaldívar. Once completed and in full operation, the project is expected to increase production at Zaldívar by approximately 10 to 15 thousand tonnes per annum at lower operating costs over the remaining life of mine.
Veladero Power Transmission Project, Chile and Argentina
In 2019, we commenced construction of an extension to the existing Pascua-Lama power transmission line to connect to Veladero. Upon completion, the power transmission line will allow Veladero to convert to grid power exported from Chile and cease operating the current high-cost diesel generation power plant located at site. A power purchase price agreement was executed during the fourth quarter of 2019 to supply power from renewable energy that will significantly reduce Veladero’s carbon footprint.
Due to the quarantine and movement restrictions imposed by the national government of Argentina, construction of the power transmission project temporarily ceased in March 2020 as previously reported. With the project currently advanced to 71% completion, we are preparing for a restart of construction activities. We now expect completion of the Veladero power transmission project by the end of 2021.
Exploration and Mineral Resource Management
North America
In Nevada, up to 12 drills were turning across the Carlin and Cortez districts during the second quarter of 2020. By the end of the quarter, an additional two drills were active at Turquoise Ridge. A total of 27,462 meters were drilled. The priority continues to be weighted towards making discoveries with the balance of the drilling focused on deposit expansion. Geological models at the district scale are complete in all three camps, forming the foundation for target development. A regional scale model focused on the location of the Roberts Mountains Thrust was well advanced at the end of the quarter. Deposit scale models continue to be a focus with significant improvements completed at Leeville, Ren, Gold Quarry, Emigrant, Goldrush and Fourmile in support of targeting and resource estimation efforts.
In Canada, exploration efforts in the Hemlo camp continued drilling activities with one drill moving from underground to surface. District-scale surface activities aimed at discovering mineralization beyond the footprint of Hemlo, to the west of current operations, has commenced.
Fourmile, Nevada, USA6
Step-out drilling during the quarter continued to expand mineral inventory, while infill drilling refined the geological model and confirmed the two principal styles of mineralization and their controls.
A hole offsetting the Dorothy discovery to the west returned 9.4 meters at 17.9 g/t, which significantly expanded the footprint. Mineralization remains open to the north, south,
and west where drilling continues to explore for the limits of the mineralized breccia.
At Sophia, a drill hole intersected 8.4 meters at 21.5 g/t in a stratigraphically controlled zone, closing the gap and expanding continuity for several hundred meters southwest toward Blanche. Targeting structurally controlled mineralization down-dip and west of Sophia was also successful, intersecting 9.9 meters at 48.4 g/t and extending mineralization by more than 100 meters. A follow up hole to the north intersected multiple zones of visual mineralization at the Wenban 8/5 contact as well as in a breccia hanging wall to a quartz feldspar porphyry dike in Wenban 4. An additional follow up hole to the north is targeting further expansion along strike.
Assays are pending for visually altered zones from several more drill holes, including drilling between Fourmile and Goldrush. These holes targeted the gap between the deposits, an area where mineralization transitions from more stratigraphic control to the south to breccia-hosted, structural control to the north. Moreover, FM20-160D intersected multiple significant intervals including 5.2 meters at 10.6 g/t and 3.9 meters at 7.3 g/t, closing the gap to Fourmile and demonstrating that the Goldrush orebody remains open to the north-northwest.
At Fourmile, six angled drill holes were completed to better define resource shapes and confirmed significant high grades in the Fourmile lodes. The holes will allow the breccia lodes to be revised to better constrain estimation domains. The updated geological model will be completed in the third quarter of 2020.
| | | | | | | | |
| BARRICK SECOND QUARTER 2020 | 62 | MANAGEMENT'S DISCUSSION AND ANALYSIS |
Nevada Gold Mines, Nevada, USA7
At Cortez, results were received for three holes testing a large area covered by post-mineral basalt and gravel two kilometers east of Goldrush. These three holes were drilled at kilometer spacing to continue building a geologic framework critical to vectoring to targets concealed by post-mineral cover. All three holes intersected favorable host rock. Two of the three holes returned anomalous Carlin-type geochemistry (Au, As, Sb, Tl, Hg). A hole contained visual alteration at the same stratigraphic position hosting Goldrush mineralization, though lacked significant mineralization. Another hole returned 4 meters at 1.2 g/t in a structural zone above favorable host rock. The down-dip projection of this structural zone, where geologic interpretation suggests it could cut more favorable reactive carbonate rocks, may warrant follow-up drilling. Other notable observations from this drilling include metasomatism and overthickened sections of favorable carbonate host rocks due to thrust faulting and associated folding. The identification of a new center of metasomatism is an important development given the best deposits in the camp are found near metasomatic fronts.
On the Carlin Trend, north of the Leeville deposit, wide spaced surface drilling extended mineralization by 1.5 kilometers, with the highest grade directly in the footwall of the north-northeast striking Basin Bounding Fault. A hole offsetting the best legacy intercept (25 meters at 21.4 g/t) 80 meters to the southeast, returned 21.3 meters at 35.3 g/t. This is the best ever recorded result north of Leeville and appears to be strongly stratigraphically controlled at the contact between the Popovich and Rodeo Creek Formations. Drilling of this emerging new zone of strong alteration and high-grade mineralization will continue to be a priority through the remainder of the year as we look to understand the full potential of Greater Leeville inventory ounces.
On the North Carlin Trend, Little Boulder Basin separates Goldstrike and Leeville. The highly prospective, eight square kilometer area is the center of the giant North Carlin Trend hydrothermal system. Millions of ounces of high-grade mineralization occur along structures at the edges of the basin, with high value deposits occurring at the margins of a pre-mineral stock. The basin where the favorable host lithologies occur at depths between one and two kilometers is sparsely drilled. Framework drilling to develop full geological understanding is in progress. Results from the second hole of the program intersected 146 meters of low-grade (averaging 0.67 g/t), stratiform mineralization including 3.1 meters at 7.32 g/t and 1.5 meters at 5.2 g/t, which indicates that a mineralizing hydrothermal fluid has passed through the area. This is considered encouraging because the nearest hole testing the favorable stratigraphy is about a kilometer away. The holes are providing critical geological information including alteration of target type, identification of out-of-sequence stratigraphy that demonstrates structural complexity, and deep-tapping fertile structures that will be used to refine targets as the program advances.
The Post-Gen fault system cuts through the northern Carlin Trend where it is recognized as the most significant fertile fault on the trend. It is a series of down dropping, normal faults that offset the steep east dipping favorable host
stratigraphy in the apex of the Tuscarora anticline. Underground deposits occur in the footwall with plunging breccia bodies that remain open down-dip. Drilling targets along this corridor has been a challenge. Drilling was paused at the start of the second quarter of 2020 and drill tactics changed to address challenging ground conditions found in the Post-Gen Fault corridor. After resuming the program, a hole targeting the down plunge extension of the Deep Post orebody successfully tested the target. The hole intersected more than 250 meters of hydrothermal breccia with multiple thin 5-10 g/t intercepts in the targeted host rock as well as the Post fault zone.
Further south along the Carlin Trend, exploration is pursuing open-ended mineralization adjacent to the giant Gold Quarry deposit. Geological framework drilling of the sparsely drilled area to the southwest of the Gold Quarry mine has confirmed favorable stratigraphy, continuation of fertile faults, alteration and has intersected weak mineralization (33 meters at 0.4 g/t). A third hole northwest of the Chukar-Alunite fault is now testing the source of a kilometer-scale geochemical plume interpreted to be the center of an untested hydrothermal cell west of Gold Quarry and southwest of the Mac deposit. The data from this framework program has provided critical geological information and initial vectors to motivate future targeting in this large undertested area.
Even further south on the Carlin Trend in the Rain District, data compilation leading to a district scale model was nearing completion at the end of the second quarter of 2020. Drilling to fill a large data gap in an area covered by recent basin-filling gravels between the Maggie Creek and Rain districts commenced. The hole will provide a framework to refine the edge of the carbonate platform and associated favorable slope facies rocks, which host the majority of ore on the trend. Closer to the Rain deposit, target development has focused on the potential to discover high-grade mineralization, building on results from last year’s program as well as strong and open-ended vectors highlighted by alteration and geochemistry. Additional drilling will start during the third quarter of 2020.
At Turquoise Ridge, data mining and relogging are well underway and will form the foundation to correlate the geology across the entire district. In parallel, local controls to mineralization are being reviewed across all orebodies to develop a fully integrated district scale model, which will be used to regenerate new and additional targets in the district. Meanwhile, framework drilling on several emerging priority areas has already commenced.
Priority areas of focus and potential are between the Vista and Mega pits on the legacy Twin Creeks property, which are shallowly drilled and poorly understood. The vertical stacking of mineralization in multiple and less favorable stratigraphic units in the Vista pit area coincides with other important geological features. This includes a poorly constrained metamorphic aureole and open-ended geochemical vectors, pointing to more favorable host rocks at depth, where drilling of the Nexus and Trifecta targets were in progress during the current quarter. The Leviathan area lies in the west wall of the Mega pit on a parasitic anticline, subparallel to the ore-controlling Conolea and Fiberline anticlines, as well as a strong geochemical plume
| | | | | | | | |
| BARRICK SECOND QUARTER 2020 | 63 | MANAGEMENT'S DISCUSSION AND ANALYSIS |
that is open at depth. Drilling of this target has commenced.
Hemlo, Canada8
The final hole of the C Zone 100-series deep drilling program was completed at a total depth of 1,371 meters. The hole (1751908.1W2) intersected the 100-series, 300-series and South Rim mineralization. At true widths, significant intervals included 4 meters at 3.9 g/t as well as 1.1 meters at 11.7 g/t. These intervals are 800 meters below existing workings and 300 meters below the base of the current resource. While grades were moderate, the program established confidence in the geology model at depth and increased the resolution of the fold geometry. These results, combined with results from previous holes in this program, show broad-scale fold controls of 100-series mineralization down-plunge.
Meanwhile, district scale exploration well beyond the current known limits of the ore-bodies has commenced after years of inactivity. Field follow up has commenced on areas of interest defined by regional data compilation combined with a high-resolution drone geophysical survey. Some of these areas of interest are known to coincide with gold mineralization. Clearing and evaluation of a series of five trenches over a kilometer and a half west of the Williams open pit is underway. A new geology model is being developed in the Blackfly area, west of the C Zone, which will incorporate recent trench sampling and mapping, recent wide-spaced framework holes and legacy data ahead of targeting significant new lodes in the area.
Latin America & Asia Pacific
Pueblo Viejo, Dominican Republic
Mineral Resource Management (“MRM”) remained focused on rolling-forward quarterly updates of the 3D geological model, continuing to incrementally build on the framework and findings defined during 2019 and the first quarter of 2020. This model now incorporates recent work on defining a robust structural framework for the deposit. This upgraded model is being leveraged to generate a higher confidence mineral resource estimate. It will also provide geological context to the high grades intersected at Mejita NE in the prior quarter and will be projected beyond the pit limits to generate new target areas.
Recently trialed 3D induced polarization (IP) geophysics is proving highly successful at identifying sulphides. A strong chargeability anomaly was identified northwest of the Moore and Monte Negro pits with the same orientation, scale and amplitude as historic surveys and mineralization at Moore and Monte Negro. Drill follow-up of this anomaly commenced in the second quarter of 2020 and has confirmed the anomaly coincides with strong alteration and abundant sulphides. Due to the apparent effectiveness of this technique to identify sulphide accumulations, the survey will be expanded, including areas of projected structural complexity.
El Indio Belt, Argentina and Chile9
In the combined Pascua-Lama and Veladero camp, work has transitioned from drill testing of known legacy targets to understanding the foundational geology and fundamental controls that generate these world class orebodies. Models are being generated from the ground up, by locating,
compiling, consolidating, validating and interpreting the datasets that span over 25 years of legacy work. The data consolidation for the entire district was completed by the end of the second quarter of 2020, and validation is almost complete. The goal is to have a single, consistent and cohesive geological model for the entire camp, incorporating the Pascua-Lama and Veladero orebody geology models. A robust, high confidence model will enable targeting to be more predictive as well as improve ranking and prioritization of a new generation of quality targets.
Our evolving understanding of the geological controls to mineralization has already identified a prospective extension of the east-southeast magmatic and mineralized corridor east of the camp.
At Pascua-Lama, work continues to focus on a compilation and validation program of all historical geological, metallurgical and mining data to improve the 3D models. All historical data is being digitized and scanned into software to allow a comprehensive review and update to the 3D deposit model. This updated "data-driven" geological model was nearing completion as of the end of the second quarter and was confirming geological and geometallurgical gaps that could be tested through a potential drill program during the summer. The drill program would be specifically focused on testing the recent geological model and mineralization controls, capturing additional metallurgical variability samples, and geotechnical information to assist in advancing project knowledge.
At the southern end of the El Indio belt, drilling was successfully completed on four satellite targets at Del Carmen-Alturas. High-grade mineralization reported in the prior quarter at Chibolita was extended 200 meters southward, intersecting 28 meters at 3.38 g/t from 211 meters, including 17 meters at 5.20 g/t (DDH-DCA-040). A significant amount of additional unclassified mineralization has now been defined by drilling beyond the current inferred resources of 260 million tonnes at 1.1 g/t containing 8.9 million ounces over the past two field seasons. This inventory is predominantly in Argentina and is expected to be incorporated into an updated Del Carmen-Alturas economic model. The mineralization in Argentina is relatively shallow or near surface. High-grade mineralization, such as that intersected at Chibolita, could enhance project economics if suitably continuous. To fully understand the geological controls of these high-grade zones, a detailed study has been initiated to resolve the geometry and continuity, as well as to potentially determine how to predict or identify further high-grade zones.
Beyond the known deposits of the El Indio belt, screening of multiple targets was also completed during the field season. 21 targets were field reviewed, five of which were promoted up the resource triangle and 13 are pending analytical results and peer review.
Veladero, Argentina10
A quarterly update to the 3D geological model was completed. This included all data from the recently completed re-logging program of more than 150,000 meters of drilling, as well as an entire series of re-interpreted 50 to 100 meters spaced litho-structural, alteration and
| | | | | | | | |
| BARRICK SECOND QUARTER 2020 | 64 | MANAGEMENT'S DISCUSSION AND ANALYSIS |
mineralization sections. The principal focus of this model update was on the inclusion of multiple late stage silicification alteration events as recent re-logging and core drilling has identified this as probable controls to higher grade mineralization within the Veladero orebody.
Drilling during the second quarter of 2020 focused on testing the newly modeled mineralization controls, returning a significant result of 87 meters at 4.08 g/t including 72 meters at 5.06 g/t (drilled width approximates true width due to the nature of mineralization), starting from 353 meters depth in hole DDH-958c. Hole DDH-960 intersected 18 meters at 0.98 g/t from 189 meters, 35 meters at 0.53 g/t from 230 meters and 25 meters at 0.47 g/t from 283 meters (drilled width approximates true width due to the nature of mineralization). The drill intersection in hole DDH-958c supports the new geological framework, while identifying elevated mineralization beyond the LOM pit boundaries, as the intersection lies approximately 75 meters outside the eastern pit wall in the current LOM plan. At the district level, two brownfield targets have been delineated for drill testing this upcoming summer, while three other areas of interest have been identified for follow up activities such as mapping, sampling and geophysics.
Porgera, Papua New Guinea
As discussed on page 28, Porgera has been placed on temporary care and maintenance and consequently, all exploration activities have ceased.
Lagunas Norte, Peru
A first principles rebuild of the 3D geological model was delivered using a new lithostructural framework for the orebody. It will be leveraged into a new resource estimate and geo-metallurgical model in the third quarter of 2020. The updated geological model was based on results from a significant data compilation program that commenced during the first quarter of 2020 including all historical drilling, production sampling (blast holes) and pit mapping to ensure the foundation of the new model is based on all available data. This data compilation program resulted in a fully re-constructed project database, inclusive of all known project sampling data. A preliminary infill and expansion drill program has been designed for execution in the third and fourth quarters of 2020. Due to the higher gold price environment, MRM is also investigating opportunities for a potential in-pit leach definition drill campaign.
In the Lagunas District, compilation and analysis of over 20 years of historic mapping has determined that east-west faults are normal faults and played a key role in controlling and preserving mineralization. This new insight is generating new targets close to our operating facilities and driving prioritization of known targets.
A five-hole drill program testing multiple geological concepts for mineralization controls on the periphery of the Lagunas Norte deposit neared completion by the end of the second quarter of 2020. An updated geology model and mineral inventory is pending receipt of final assays.
At La Capilla, located 10 kilometers east of Lagunas Norte, all results were received from the eleven-hole drill program completed in the prior quarter. An approximate 400 meter
zone of at-or-near surface oxide mineralization has been delineated along an east-west corridor on the southern margin of a diatreme, which remains open along strike. A parallel east-west corridor has been identified on the northern margin of the diatreme, which remains open for at least 500 meters.
Japan Gold Exploration Alliance
A screening program over Japan Gold’s property portfolio commenced in the current quarter with teams carrying out stream sediment sampling, rock chip sampling and ground gravity surveys over parts of the Hokusatsu region in the Southern Kyushu epithermal gold province.
Eight projects, or approximately thirty percent of the southern Kyushu project areas, have had bulk leach extractable gold (BLEG) sampling completed over them in the second quarter of 2020. A total of 456 BLEG samples, and 367 rock-chip samples have been collected to date. Samples have been submitted for analysis and results are pending. The rock chip sampling, mainly of transported rocks in streams, has successfully identified argillic alteration associated with epithermal systems, with evidence of mineralization in veins and veinlets in multiple drainages across the sampled area. A full analysis will be prepared when results are received.
A Japanese geophysical contractor completed a trial semi-detailed gravity survey. Results are currently being processed and interpreted.
Work in Kyushu has now been paused, with the field teams moving to Hokkaido to take full advantage of the summer field season before winter snows cut-off access (expected to be in late November), at which point the work in Kyushu will resume.
Africa & Middle East
Bambadji, Senegal11
At Bambadji, work focused along the newly defined, greater than 10 kilometers Latifa-Kora corridor with reverse circulation (RC) drilling testing the Fava, Diala, Diala West, Kora and Kora-Soya targets. Results from wide spaced scout holes defined deep weathering up to 100 meters of vertical depth with anomalous gold mineralization. Further work is required to vector into potential mineralized shoots.
Drilling also tested for the presence of shoots at Kabetea and Latifa, with good results at the latter including 9.07 meters at 3.32 g/t. Latifa remains open towards the north, where auger drilling defined the surface trace of the system concealed under laterite. In the western part of the permit, mostly underlain by the Faleme volcanics, two RC/diamond drill fences tested the Kabewest model that hydrothermal breccias host mineralization. A notable result from the first diamond hole is 5.65 meters at 3.41 g/t, while results for the second diamond hole as well as the RC holes are pending. Drilling is currently testing the Dakota target in the south of Kabewest.
Follow-up work resumed at the end of the quarter at Gefa where previous RC drilling delineated a continuous system with potential economic zones. Diamond drilling to confirm the model was initiated with one hole completed at Gefa
| | | | | | | | |
| BARRICK SECOND QUARTER 2020 | 65 | MANAGEMENT'S DISCUSSION AND ANALYSIS |
Main before the site became inaccessible due to the rise of water in the main Dalema river. The hole confirmed a large system hosted in an albitite with 34.0 meters at 1.37 g/t including 5.50 meters at 3.41 g/t. The next diamond holes to test the system along strike to the south will be drilled after the wet season. The auger program across the Setoumboung area, immediately east of the Gefa targets, has been put on hold until after the wet season.
Loulo-Gounkoto, Mali12
At Loulo, the Yalea Transfer Zone (TZ) shoot was extended by an additional 160 meters during the second quarter of 2020 and is currently 480 meters south of the extent of the 2019 block model. Significant intercepts include 14.95 meters at 7.34 g/t and 8.70 meters at 22 g/t. Notably, the southernmost drill hole to date intersected strong mineralization and textures indicative of high-grade shoots. If pending assays confirm gold mineralization, this would substantially increase the resource potential to the south and down-dip. In addition, a facies change and thickening of the host limestone unit below the southern TZ, is hosting thick zones of mineralization in the main Yalea Shear position including 66.0 meters at 4.83 g/t, 28.0 meters at 4.10 g/t, 25.4 meters at 4.61 g/t, 17.8 meters at 3.22 g/t and 17.4 meters at 15.68 g/t. This robust mineralization further enhances the significant resource potential.
At Loulo 3, drilling at the north end of the deposit supports the emergence of strong footwall mineralization but with a corresponding decrease in tenor within the main structure. Footwall intercepts include 19.25 meters at 6.06 g/t and 6.85 meters at 5.81 g/t. Scout drilling 180 meters north of current Loulo 3 drill coverage intersected alteration with stringer sulphides texture which potentially indicate proximity to higher grade shoots. Lithosample results over the Yalea Ridge area support three new main target areas of interest that will be drill tested in the third quarter of 2020 utilizing a man portable diamond rig.
At the Gounkoto MZ1 North Shoot, scout drilling failed to intersect high-grade shoot textures. A serial section review through the area has indicated that the shoot trends could be shallower than expected at depth, and the potential for extensions remain.
At Faraba North, several additional sparsely drilled mineralized zones were identified, some of which are associated with higher-grade mineralization. These will be drilled to confirm higher grade continuity to potentially expand the current conceptual pit design.
At the DB1 Greenfields target, south of the Gounkoto open pit on the Domain Boundary Structure, drilling has confirmed the potential for a mineralized trend over a strike length of approximately one kilometer, with significant results including 9.0 meters at 3.42 g/t and 7.0 meters at 7.23 g/t. Diamond drilling is planned to confirm the target geology before additional RC infill lines are completed to assess the open pit potential. RC drilling to date indicates potential shoot controls that will influence drill hole success and targeting strategy.
Elsewhere in Mali, generative work continues in the Kenieba-Kedougou Inlier and in Mali South.
Tongon, Côte d'Ivoire13
At Mercator, a revised geological model was optimized, which resulted in an increased average grade for the deposit. However, the overall metal contained in the reoptimized pit remained unchanged. Conceptual economic analysis with final pit designs are underway for this satellite deposit located 15 kilometers from the Tongon plant.
Exploration during the second quarter of 2020 focused on several priority targets located on three major structures. Auger drilling tested the extension of the main shear system to the north of Tongon in the Seydou North – Jubula area (results are pending). At Tiebila East, scout drilling confirmed a significant system hosted within silica-sericite-carbonate tuff and volcaniclastics with some encouraging intercepts, including 25.0 meters at 2.10 g/t. Follow up is planned to effectively test this emerging target. Scout drilling is underway at the Soumo target, which is highlighted by a 3.6 kilometer long high-soil anomaly, along with northeast structures interpreted from aeromagnetic data and a deep conductive feature on the margin of a thermal aureole related to a wide granitoid intrusion complex. Multiple mineralized bands are expected from this corridor located five kilometers from Tongon. Follow up drilling will continue in the third quarter of 2020, including the evaluation of four targets along the western flank of the Badenou trend with the aim to continue delivering ounces to extend Tongon's mine life.
Regional Exploration, Côte d'Ivoire
Field work continued across our portfolio in northern and southeastern Côte d’Ivoire.
At Mankono-Sissedougou, results from an auger program on the ANV target area identified a number of follow up targets which will be tested after the completion of a ground geophysical survey, which is required to establish the geological framework. At Yere North, a mineralized intrusion was identified through pitting and trenching, with follow up drilling planned after the rainy season. Two other auger programs were completed at Kagon on the Mankono-Sissedougou permit and on the Nafoun permit, results for both programs are pending. Trenching at Tengrela North confirmed an interpreted northeast splay to the Syama structure that is anomalous in gold. In southeastern Côte d’Ivoire, stream sediment sampling to the southeast of the Zaranou corridor will be completed in the third quarter of 2020.
Kibali and Ngayu Belt, Democratic Republic of Congo14
At Kibali, the deep hole testing the continuity of the KCD system 500 meters down plunge from previous drilling as well as 600 meters below the current haulage level was further delayed due to technical issues. Drilling has reached the 5000 lode banded iron formation (BIF), confirming the geological model but without any mineralization intersected so far. At Kombokolo, a drill fence is in progress to test the extension of mineralization related to the hinge and limbs of a tightly folded BIF 500 meters down plunge from the mined pit. The drilling confirms the geological model and extension of the mineralized system, with one hole returning 9.20 meters at 3.97 g/t while the other holes returned weak results thus far. Conclusions on this drilling are to be reported in the third quarter of 2020.
| | | | | | | | |
| BARRICK SECOND QUARTER 2020 | 66 | MANAGEMENT'S DISCUSSION AND ANALYSIS |
At Pakaka, a fence of drill holes 600 meters down-plunge from the $1,500/oz resource pit shell confirmed the presence of the main upper mineralized lens as well as an additional lens at depth. The latter is interpreted to pass beneath the current Pakaka open pit and daylight at surface as the Tete-Bankangwe target. A full analysis is being carried out to review any open pit potential and to continue assessing the underground potential.
Several targets were drill tested in the Madungu-Memekazi-Renzi target area located four kilometers east of KCD. Best results, including 8.0 meters at 2.96 g/t and 7.0 meters at 1.08 g/t were obtained at Renzi, where a mineralized structure within metasediments was defined over a 500 meter strike length, warranting follow up drilling.
At Makoro, located 50 kilometers east of KCD, field work has demonstrated mineralization occurring along two major northwest corridors, 600 meters apart, extending over a two kilometer strike length. Lithosampling of artisanal sites along these two shears support the prospectivity of both structures which will be further investigated.
At Ngayu, drilling commenced testing priority targets, with the first two holes completed at Anguluku. Results are pending.
North Mara and Buzwagi, Tanzania
At North Mara, re-logging to extend the geological model a further 900 meters eastward along strike to cover Nyabigena has been completed. Analysis of the updated model has generated numerous near mine targets and confirms the mineralized system remains open in all directions. To test these new opportunities, a substantial 22,100 meter phased step-out drilling program to add inferred resources and convert indicated resources to reserves has commenced. This program aims to deliver additional ounces into the mine plan this year and inform a decision for a larger pit layback at Nyabigena.
Meanwhile, advanced grade control drilling (20 holes for 12,196 meters) focused on the Upper West, Deep Central, and Upper East Extension underground targets at Gokona, has returned results that exceed the expected grade from the current block model when compared on a hole-by-hole basis. An increase in inferred resources and conversion of indicated resources to reserves within these targets is therefore anticipated, and the program is on-track to replace mining depletion out to 2021, by further increasing the resource inventory at Gokona by year-end.
Looking ahead, two high priority targets situated on the western strike extension of Gokona beyond the limit of underground development are prioritized for exploration drilling. New exploration permits have also been granted within the North Mara district.
At Buzwagi, scout drilling testing the geological continuity of the mineralized system in three structural targets located beneath the pit has commenced. Three holes totaling 2,720 meters have been planned and the program is scheduled for completion in September. The aim of this scout program is to validate the exploration model for additional upside potential at depth, and a decision on follow-up drilling is
dependent on the observations and results from this initial work.
Jabal Sayid, Kingdom of Saudi Arabia15
Following the prior quarter’s success with JSSE001 (18.80 meters at 3.88% Cu) in extending the feeder zone to Lode 4, hole JSSE003, targeting an additional 150 meters of eastern strike, intersected the system but with weaker expected mineralization. Current observations now indicate the target could be closer to surface.
Mineralization potential remains open, highlighted by sub-cropping silica-haematite alteration and sulfides interpreted to represent the continuation of the Lode 4 feeder system. At Lode 2 NW, hole BDH2063 returned 9.13 meters at 2.77% Cu and 12 meters at 2.57% Cu in an area more than 75 meters beneath the Lode 2 resource base. This confirms the updated geological model in an area previously interpreted to be sub-economic due to poor drill hole coverage. Further drilling is in progress to delineate the full extent of the lode.
Drilling also tested two greenfield targets with the potential to host new lodes. At Jabal Sayid southeast, one kilometer southeast of Lode 4, hole BDHR010 confirmed a system with favorable silica alteration and chert correlating with the largest surface chert outcrop at Jabal Sayid. This demonstrates the continuity and scale to the alteration footprint of this target. The intersection of strong alteration and intervals of semi-massive pyrite and trace chalcopyrite in drilling indicates that the target is also deeper.
| | | | | | | | |
| BARRICK SECOND QUARTER 2020 | 67 | MANAGEMENT'S DISCUSSION AND ANALYSIS |
REVIEW OF FINANCIAL RESULTS
Revenue
| | | | | | | | | | | | | | | | | |
| ($ millions, except per ounce/pound data in dollars) | For the three
months ended | | | For the six months ended | |
| | 6/30/20 | 3/31/20 | 6/30/19 | 6/30/20 | 6/30/19 |
| Gold | | | | | |
000s oz solda | 1,224 | | 1,220 | | 1,372 | | 2,444 | | 2,737 | |
000s oz produceda | 1,149 | | 1,250 | | 1,353 | | 2,399 | | 2,720 | |
Market price ($/oz) | 1,711 | | 1,583 | | 1,309 | | 1,645 | | 1,307 | |
Realized price ($/oz)b | 1,725 | | 1,589 | | 1,317 | | 1,657 | | 1,312 | |
| Revenue | 2,812 | | 2,593 | | 1,937 | | 5,405 | | 3,843 | |
| Copper | | | | | |
millions lbs solda | 123 | | 110 | | 96 | | 233 | | 199 | |
millions lbs produceda | 120 | | 115 | | 97 | | 235 | | 203 | |
Market price ($/lb) | 2.43 | | 2.56 | | 2.77 | | 2.49 | | 2.80 | |
Realized price ($/lb)b | 2.79 | | 2.23 | | 2.62 | | 2.53 | | 2.85 | |
| Revenue | 184 | | 99 | | 103 | | 283 | | 266 | |
| Other sales | 59 | | 29 | | 23 | | 88 | | 47 | |
| Total revenue | 3,055 | | 2,721 | | 2,063 | | 5,776 | | 4,156 | |
a.Includes our equity share of gold ounces from Tanzania (results are on a 63.9% basis until September 30, 2019 (notwithstanding the completion of the Acacia transaction on September 17, 2019, we consolidated our interest in Acacia and recorded a non-controlling interest of 36.1% in the income statement for the entirety of the third quarter of 2019 as a matter of convenience), on a 100% basis from October 1, 2019 to December 31, 2019 and on a 84% basis starting January 1, 2020, the date the GoT's 16% free carried interest was made effective), Pueblo Viejo, Loulo-Gounkoto, Tongon, Kibali, Morila and copper pounds from Zaldívar and Jabal Sayid. Starting July 1, 2019, it also includes our 61.5% share of Nevada Gold Mines.
b.Realized price is a non-GAAP financial performance measure with no standardized meaning under IFRS and therefore may not be comparable to similar measures of performance presented by other issuers. For further information and a detailed reconciliation of each non-GAAP measure used in this section of the MD&A to the most directly comparable IFRS measure, please see pages 79 to 103 of this MD&A.
Q2 2020 compared to Q1 2020
In the second quarter of 2020, gold revenues increased by 8% compared to the first quarter of 2020 primarily due to a higher realized gold price1 and marginally higher sales volumes. The average market price for the three month period ended June 30, 2020 was $1,711 per ounce versus $1,583 per ounce for the prior quarter. During the second quarter of 2020, the gold price ranged from $1,569 per ounce to $1,786 per ounce, a seven-year high, and closed the quarter at $1,768 per ounce. Gold prices in the quarter continued to be volatile as a result of the economic impact of the Covid-19 pandemic and the fiscal and monetary stimulus measures put in place by global governments and central banks. In particular, gold’s seven-year high resulted from low global interest rates, including US 5-year real interest rates trading at negative levels throughout the quarter, and investors purchasing gold as a safe haven investment and store of value, with global ETF holdings of gold reaching all-time highs.
In the second quarter of 2020, gold production on an attributable basis was 101 thousand ounces lower than the prior quarter, primarily due to reduced production at Porgera as the mine entered care and maintenance on April 25, 2020, a planned maintenance shutdown at Pueblo Viejo, and the impact of Covid-19 at Veladero where movement and social distancing restrictions slowed the remobilization of employees and contractors back to site following the lifting of quarantine restrictions in April. Gold sales were higher than gold production during the quarter following the re-commencement of exports of concentrate stockpiled in Tanzania, combined with production from the end of the first quarter of 2020, which was sold at the start of the current quarter at Loulo-Gounkoto.
Copper revenues in the second quarter of 2020 increased by 86% compared to the prior quarter, primarily due to the higher realized copper price1, combined with increased copper sales volume. The average market price in the second quarter of 2020 was $2.43 per pound, a decrease of 5% from the prior quarter. The realized copper price1 in the second quarter of 2020 was higher than the market copper price as a result of the impact of positive provisional pricing adjustments recorded, whereas negative provisional pricing adjustments were recorded in the prior quarter. During the second quarter of 2020, the copper price traded in a wide range of $2.16 per pound to $2.75 per pound and closed the quarter near the high for the period at $2.74 per pound. Copper prices in the second quarter were positively influenced by an increase in manufacturing activity in China after operations that closed due to the coronavirus subsequently reopened, a return of risk appetite in financial risk markets in anticipation of an economic recovery, and a decrease in the trade-weighted value of the US dollar.
| | | | | | | | |
| BARRICK SECOND QUARTER 2020 | 68 | MANAGEMENT'S DISCUSSION AND ANALYSIS |
Attributable copper production in the second quarter of 2020 was 5 million pounds higher compared to the prior quarter, driven by a stronger performance at Lumwana as the mine benefited from improved mined tonnes and grades, combined with solid throughput performance at the plant.
Q2 2020 compared to Q2 2019
For the three month period ended June 30, 2020, gold revenues increased by 45% compared to the same prior year period primarily due to the impact of production from the formation of Nevada Gold Mines on July 1, 2019, which is consolidated and included in revenue at 100%. Excluding the impact of Nevada Gold Mines, gold revenues increased by 9% compared to the same prior year period, mainly due to an increase in the realized gold price1, partially offset by a decrease in sales volumes. The average market price for the three month period ended June 30, 2020 was $1,711 per ounce versus $1,309 per ounce for the same prior year period.
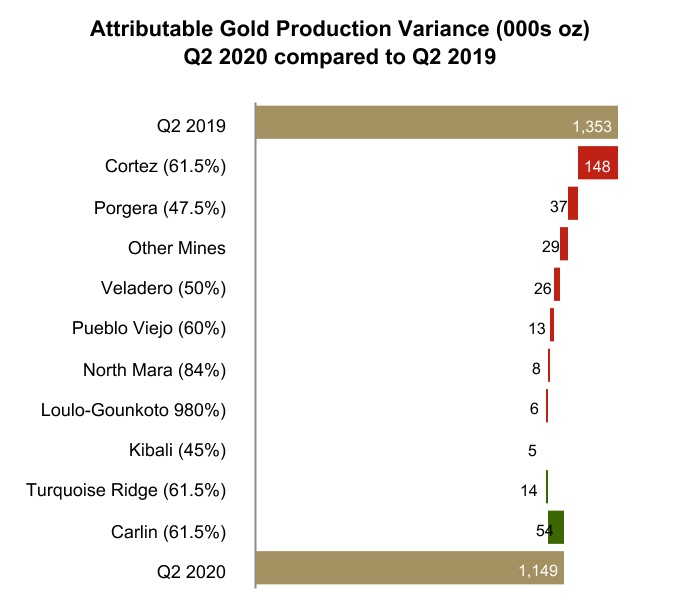
For the three month period ended June 30, 2020, attributable gold production was 204 thousand ounces lower than the same prior year period. Excluding the impact of the formation of Nevada Gold Mines, gold production for the three month period ended June 30, 2020 decreased by 305 thousand ounces, primarily due to lower grades mined and processed at Cortez and Porgera entering care and maintenance on April 25, 2020. This was combined with the sale of our 50% interest in Kalgoorlie on November 28, 2019, and the exclusion of Golden Sunlight and Morila after the second quarter of 2019 and Lagunas Norte after the third quarter of 2019 in our production metric as they have entered care and maintenance (all included in the Other Mines category above). Lower production was further impacted by Covid-19 at Veladero where movement and social distancing restrictions slowed the remobilization of employees and contractors back to site following the lifting of quarantine restrictions in April. Gold sales were higher than gold production during the quarter following the re-commencement of exports of concentrate stockpiled in Tanzania, combined with production from the end of the first
quarter of 2020 which was sold at the start of the current quarter at Loulo-Gounkoto.
Copper revenues for the three month period ended June 30, 2020 increased by 79% compared to the same prior year period, primarily due to higher copper sales volumes and the higher realized copper price1. In the second quarter of 2020, the realized copper price1 was higher than the market copper price as a result of the impact of positive provisional pricing adjustments recorded in the second quarter of 2020, whereas negative provisional pricing adjustments were recorded in the same prior year period.
Attributable copper production for the three month period ended June 30, 2020, increased by 23 million pounds compared to the same prior year period, mainly at Lumwana resulting from the strong performance during the current quarter, whereas in the same prior year period, production was impacted by the repeated tears in the main crusher conveyor and the subsequent use of lower grade stockpile as mill feed.
YTD Q2 2020 compared to YTD Q2 2019
For the six month period ended June 30, 2020, gold revenues increased 41% compared to the same prior year period primarily due to the impact of production from the formation of Nevada Gold Mines on July 1, 2019, which is consolidated and included in revenue at 100%. Excluding the impact of Nevada Gold Mines, gold revenues increased by 7% compared to the same prior year period, mainly due to an increase in the realized gold price1, partially offset by a decrease in sales volumes. The average market price for the six month period ended June 30, 2020 was $1,645 per ounce versus $1,307 per ounce for the same prior year period.
For the six month period ended June 30, 2020, attributable gold production was 321 thousand ounces lower than the same prior year period. Excluding the impact of the formation of Nevada Gold Mines, gold production for the six month period ended June 30, 2020 decreased by 495 thousand ounces, mainly due to lower grades mined and processed at Cortez as mining from CHOP was completed in the second quarter of 2019, the sale of our 50% interest in Kalgoorlie on November 28, 2019, and the exclusion of Golden Sunlight and Morila after the second quarter of 2019 and Lagunas Norte after the third quarter of 2019 in our production metric as they have entered care and maintenance. Gold production was further impacted as Porgera entered care and maintenance on April 25, 2020 and by Covid-19 at Veladero where movement and social distancing restrictions slowed the remobilization of employees and contractors back to site after quarantine restrictions were lifted in April. Gold sales were higher than gold production for the six month period ended June 30, 2020 following the re-commencement of exports of concentrate stockpiled in Tanzania.
Copper revenues for the six month period ended June 30, 2020 increased by 6% compared to the same prior year period. Higher copper revenues for the six month period were primarily due to higher sales volumes, partially offset by the lower realized copper price1. For the six month period ended June 30, 2020, the realized copper price1 was
| | | | | | | | |
| BARRICK SECOND QUARTER 2020 | 69 | MANAGEMENT'S DISCUSSION AND ANALYSIS |
higher than the market copper price as a result of the impact of positive provisional pricing adjustments recorded in the current year, consistent with the same prior year period.
Attributable copper production for the six month period ended June 30, 2020, increased by 32 million pounds compared to the same prior year period, mainly at Lumwana resulting from the strong performance during the current period, whereas in the same prior year period, production was impacted by the repeated tears in the main crusher conveyor and the subsequent use of lower grade stockpile as mill feed.
Production Costs
| | | | | | | | | | | | | | | | | |
| ($ millions, except per ounce/pound data in dollars) | For the three months ended | | | For the six months ended | |
| | 6/30/20 | 3/31/20 | 6/30/19 | 6/30/20 | 6/30/19 |
| Gold | | | | | |
Direct mining costsa | 1,121 | | 1,080 | | 921 | | 2,201 | | 1,815 | |
| Depreciation | 498 | | 474 | | 431 | | 972 | | 815 | |
| Royalty expense | 116 | | 84 | | 78 | | 200 | | 144 | |
| Community relations | 5 | | 5 | | 7 | | 10 | | 13 | |
| Cost of sales | 1,740 | | 1,643 | | 1,437 | | 3,383 | | 2,787 | |
Cost of sales ($/oz)b | 1,075 | | 1,020 | | 964 | | 1,048 | | 956 | |
Total cash costs ($/oz)c | 716 | | 692 | | 651 | | 704 | | 641 | |
All-in sustaining costs ($/oz)c | 1,031 | | 954 | | 869 | | 993 | | 842 | |
| Copper | | | | | |
| Direct mining costs | 79 | | 69 | | 63 | | 148 | | 139 | |
| Depreciation | 63 | | 43 | | 28 | | 106 | | 70 | |
| Royalty expense | 11 | | 11 | | 9 | | 22 | | 21 | |
| Community relations | 0 | | 1 | | 1 | | 1 | | 2 | |
| Cost of sales | 153 | | 124 | | 101 | | 277 | | 232 | |
Cost of sales ($/lb)b | 2.08 | | 1.96 | | 2.04 | | 2.03 | | 2.13 | |
C1 cash costs ($/lb)c | 1.55 | | 1.55 | | 1.59 | | 1.55 | | 1.62 | |
All-in sustaining costs ($/lb)c | 2.15 | | 2.04 | | 2.28 | | 2.10 | | 2.37 | |
a.Includes mining and processing costs.
b.Cost of sales applicable to gold per ounce is calculated using cost of sales applicable to gold on an attributable basis (removing the non-controlling interest of 40% Pueblo Viejo; 20% Loulo-Gounkoto; 10.3% Tongon; 16% North Mara, Bulyanhulu and Buzwagi starting January 1, 2020, the date the GoT's 16% free carried interest was made effective (36.1% from January 1, 2019 to September 30, 2019; notwithstanding the completion of the Acacia transaction on September 17, 2019, we consolidated our interest in Acacia and recorded a non-controlling interest of 36.1% in the income statement for the entirety of the third quarter of 2019 as a matter of convenience); 63.1% South Arturo from cost of sales from July 1, 2019 onwards as a result of its contribution to Nevada Gold Mines (and on a 40% basis from January 1, 2019 to June 30, 2019); and our proportionate share of cost of sales attributable to equity method investments (Kibali, and Morila until the second quarter of 2019), divided by attributable gold ounces. Also removes the non-controlling interest of 38.5% Nevada Gold Mines from cost of sales from July 1, 2019 onwards. Cost of sales applicable to copper per pound is calculated using cost of sales applicable to copper including our proportionate share of cost of sales attributable to equity method
investments (Zaldívar and Jabal Sayid), divided by consolidated copper pounds (including our proportionate share of copper pounds from our equity method investments).
c.Total cash costs, C1 cash costs and all-in sustaining costs are non-GAAP financial performance measures with no standardized meaning under IFRS and therefore may not be comparable to similar measures of performance presented by other issuers. For further information and a detailed reconciliation of each non-GAAP measure used in this section of the MD&A to the most directly comparable IFRS measure, please see pages 79 to 103 of this MD&A.
Q2 2020 compared to Q1 2020
In the second quarter of 2020, cost of sales applicable to gold was 6% higher compared to the first quarter of 2020, mainly due to increased royalties as a result of the higher realized gold price1 and higher sales volume following the re-commencement of exports of concentrate stockpiled in Tanzania. Our 45% interest in Kibali and 40% interest in Morila are equity accounted for and therefore we do not include their cost of sales in our consolidated gold cost of sales. On a per ounce basis, cost of sales applicable to gold2, after including our proportionate share of cost of sales at our equity method investees, and total cash costs per ounce1 were 5% and 3% higher, respectively, than the prior quarter, mainly due to higher royalties resulting from higher realized gold prices1, combined with costs associated with the annual total plant maintenance shutdown at Pueblo Viejo. This was partially offset by lower energy input costs.
In the second quarter of 2020, gold all-in sustaining costs per ounce1 was up 8% compared to the prior quarter, primarily due to higher minesite sustaining capital expenditures on a per ounce basis and higher total cash costs per ounce1.
In the second quarter of 2020, cost of sales applicable to copper was 23% higher than the prior quarter primarily due to higher sales volume at Lumwana driven by higher production. Our 50% interests in Zaldívar and Jabal Sayid are equity accounted for and therefore we do not include their cost of sales in our consolidated copper cost of sales. On a per pound basis, cost of sales applicable to copper2, after including our proportionate share of cost of sales at our equity method investees, increased by 6% due to higher depreciation. C1 cash costs1 remained consistent with the prior quarter as lower grade processed and increased underground mining costs at Jabal Sayid were offset by improved feed grade, decreased mining as well as general and administrative expenses, and lower concentrate marketing unit costs at Lumwana.
In the second quarter of 2020, copper all-in sustaining costs1, which have been adjusted to include our proportionate share of equity method investees, were 5% higher per pound than the prior quarter primarily reflecting higher minesite sustaining capital expenditures, while C1 cash costs per pound1 remained consistent with the prior period.
Q2 2020 compared to Q2 2019
For the three month period ended June 30, 2020, cost of sales applicable to gold was 21% higher than the same prior year period primarily due to the formation of Nevada Gold Mines on July 1, 2019, which is consolidated and included in cost of sales at 100%. Excluding the impact of Nevada Gold Mines, cost of sales applicable to gold was
| | | | | | | | |
| BARRICK SECOND QUARTER 2020 | 70 | MANAGEMENT'S DISCUSSION AND ANALYSIS |
11% lower compared to the same prior year period, primarily due to lower sales volume. Our 45% interest in Kibali and 40% interest in Morila are equity accounted for and therefore we do not include their cost of sales in our consolidated gold cost of sales. On a per ounce basis, cost of sales applicable to gold2, after including our proportionate share of cost of sales at our equity method investees, and total cash costs per ounce1 were 12% and 10% higher, respectively, compared to the same prior year period mainly due to the impact of the lower average grade processed at Cortez and the contribution from Nevada Gold Mines, which has resulted in a higher proportion of gold sourced from lower grade open pit ore in our sales mix.
For the three month period ended June 30, 2020, gold all-in sustaining costs1 increased by 19% on a per ounce basis compared to the same prior year period, primarily due to an increase in total cash costs per ounce1, combined with higher minesite sustaining capital expenditures.
For the three month period ended June 30, 2020, cost of sales applicable to copper was 51% higher than the same prior year period, primarily due to increased sales volume. Our 50% interests in Zaldívar and Jabal Sayid are equity accounted for and therefore we do not include their cost of sales in our consolidated copper cost of sales. On a per pound basis, cost of sales applicable to copper2 and C1 cash costs1, after including our proportionate share of cost of sales at our equity method investees, increased by 2% and decreased by 3%, respectively, as higher depreciation was partially offset by lower direct mining costs.
For the three month period ended June 30, 2020, copper all-in sustaining costs1, which have been adjusted to include our proportionate share of equity method investees, was 6% lower per pound than the same prior year period primarily reflecting lower C1 cash costs per pound1, combined with lower minesite sustaining capital expenditures on a per pound basis.
YTD Q2 2020 compared to YTD Q2 2019
For the six month period ended June 30, 2020, cost of sales applicable to gold was 21% higher than the same prior year period due to higher sales volume resulting from the formation of Nevada Gold Mines on July 1, 2019, which is consolidated and included in cost of sales at 100%. Excluding the impact of the formation of Nevada Gold Mines, cost of sales applicable to gold was 9% lower than the same prior year period, mainly due to decreased sales volume. Our 45% interest in Kibali and 40% interest in Morila are equity accounted for and therefore we do not include their cost of sales in our consolidated gold cost of sales. On a per ounce basis, cost of sales applicable to gold2 and total cash costs per ounce1, after including our proportionate share of cost of sales at our equity method investees, were both 10% higher than the same prior year period, primarily due to the lower average grade processed at Cortez and the contribution from Nevada Gold Mines, which has resulted in a higher proportion of gold sourced from lower grade open pit in our sales mix.
For the six month period ended June 30, 2020, gold all-in sustaining costs per ounce1 increased by 18% compared to the same prior year period, primarily due to an increase in
total cash costs per ounce1 and higher minesite sustaining capital expenditures.
For the six month period ended June 30, 2020, cost of sales applicable to copper was 19% higher than the same prior year period primarily due to increased sales volume. Our 50% interests in Zaldívar and Jabal Sayid are equity accounted for and therefore we do not include their cost of sales in our consolidated copper cost of sales. On a per pound basis, cost of sales applicable to copper2 and C1 cash costs1, after including our proportionate share of cost of sales at our equity method investees, decreased by 5% and 4%, respectively, compared to the same prior year period primarily due to the improved feed grade, decreased mining as well as general and administrative expenses, and lower concentrate marketing unit costs at Lumwana.
For the six month period ended June 30, 2020, copper all-in sustaining costs1, which have been adjusted to include our proportionate share of equity method investees, were 11% lower per pound than the same prior year period primarily reflecting the lower C1 cash costs1, combined with lower higher minesite sustaining capital expenditures.
Capital Expendituresa
| | | | | | | | | | | | | | | | | |
| ($ millions) | For the three
months ended | | | For the six months ended | |
| | 6/30/20 | 3/31/20 | 6/30/19 | 6/30/20 | 6/30/19 |
Minesite sustainingb | 420 | | 370 | | 267 | | 790 | | 520 | |
Project capital expendituresc | 85 | | 76 | | 108 | | 161 | | 228 | |
| Capitalized interest | 4 | | 5 | | 4 | | 9 | | 5 | |
| Total consolidated capital expenditures | 509 | | 451 | | 379 | | 960 | | 753 | |
Attributable capital expendituresd | 402 | | 364 | | 361 | | 766 | | 722 | |
a.These amounts are presented on a 100% cash basis, except for attributable capital expenditures.
b.Includes both minesite sustaining and mine development.
c.Project capital expenditures are included in our calculation of all-in costs, but not included in our calculation of all-in sustaining costs.
d.These amounts are presented on the same basis as our guidance and include our 60% share of Pueblo Viejo, 80% share of Loulo-Gounkoto, 89.7% share of Tongon, 45% share of Kibali, 40% share of Morila and 60% share of South Arturo (36.9% of South Arturo from July 1, 2019 onwards as a result of its contribution to Nevada Gold Mines), our 84% share of Tanzania starting January 1, 2020, the date the GoT's 16% free carried interest was made effective (63.9% share from January 1, 2019 to September 30, 2019; notwithstanding the completion of the Acacia transaction on September 17, 2019, we consolidated our interest in Acacia and recorded a non-controlling interest of 36.1% in the income statement for the entirety of the third quarter of 2019 as a matter of convenience, and 100% share from October 1, 2019 to December 31, 2019) and our 50% share of Zaldívar and Jabal Sayid. Starting July 1, 2019, it also includes our 61.5% share of Nevada Gold Mines.
Q2 2020 compared to Q1 2020
In the second quarter of 2020, total consolidated capital expenditures on a cash basis increased by 13% compared to the first quarter of 2020, mainly due to an increase in minesite sustaining capital expenditures. Higher minesite sustaining capital expenditures were mainly attributed to increased capitalized stripping at Loulo-Gounkoto and our
| | | | | | | | |
| BARRICK SECOND QUARTER 2020 | 71 | MANAGEMENT'S DISCUSSION AND ANALYSIS |
investment on the tailings storage facility, other water management initiatives and land acquisitions at North Mara.
Q2 2020 compared to Q2 2019
For the three month period ended June 30, 2020, total consolidated capital expenditures on a cash basis increased by 34% compared to the same prior year period, primarily due to the impact of the sites acquired as part of the formation of Nevada Gold Mines on July 1, 2019, which is consolidated and included at 100%. Excluding the impact of the formation of Nevada Gold Mines, capital expenditures increased by 12%, mainly due to increased capitalized stripping at Loulo-Gounkoto and our investment on the tailings storage facility, other water management initiatives and land acquisitions at North Mara. There was also a decrease in project capital expenditures and a corresponding increase in minesite sustaining capital expenditures as the Crossroads pit at Cortez was in pre-production in the first quarter of 2019 and transitioned to production status in the third quarter of 2019.
YTD Q2 2020 compared to YTD Q2 2019
For the six month period ended June 30, 2020, total consolidated capital expenditures on a cash basis increased by 27% compared to the same prior year period, mainly due to the impact of the sites acquired as part of the formation of Nevada Gold Mines on July 1, 2019, which is consolidated and included at 100%. Excluding the impact of the formation of Nevada Gold Mines, capital expenditures increased by 6%, as a result of increased capitalized stripping at Loulo-Gounkoto and our investment on the tailings storage facility, other water management initiatives and land acquisitions at North Mara. There was also a decrease in project capital expenditures and a corresponding increase in minesite sustaining capital expenditures as the Crossroads pit at Cortez was in pre-production in the first quarter of 2019 and transitioned to production status in the third quarter of 2019.
General and Administrative Expenses
| | | | | | | | | | | | | | | | | |
| ($ millions) | For the three months
ended | | | For the six months ended | |
| | 6/30/20 | 3/31/20 | 6/30/19 | 6/30/20 | 6/30/19 |
Corporate administrationa | 31 | | 33 | | 40 | | 64 | | 83 | |
Share-based compensationb | 40 | | 7 | | 13 | | 47 | | 19 | |
Tanzaniac | 0 | | 0 | | 6 | | 0 | | 11 | |
| General & administrative expenses | 71 | | 40 | | 59 | | 111 | | 113 | |
a.For the three and six months ended June 30, 2020, corporate administration costs include approximately $nil and $nil of severance costs (March 31, 2020: $nil and June 30, 2019: $10 million and $15 million, respectively).
b.Based on a US$26.94 share price as at June 30, 2020 (March 31, 2020: US$18.32 and June 30, 2019: US$15.77).
c.Formerly known as Acacia Mining plc.
Q2 2020 compared to Q1 2020
In the second quarter of 2020, general and administrative expenses increased by $31 million compared to the first quarter of 2020 due to higher share-based compensation due to a 47% increase in our share price during the second quarter. Corporate administration costs were $2 million lower compared to the first quarter of 2020.
Q2 2020 compared to Q2 2019
For the three month period ended June 30, 2020, general and administrative expenses increased by $12 million compared to the same prior year period, primarily due to an increase in share-based compensation as the increase in our share price was higher compared to the same prior year period. This was offset by lower corporate administration costs as well as lower general and administrative expenses at Tanzania due to the closure of Acacia's London and Johannesburg offices in the third quarter of 2019.
YTD Q2 2020 compared to YTD Q2 2019
For the six month period ended June 30, 2020, general and administrative expenses were marginally lower as compared to the same prior year period. Lower corporate administration expenses were attributed to a decrease in our corporate office headcount compared to the same prior year period and was combined with lower general and administrative expenses at Tanzania due to the closure of Acacia's London and Johannesburg offices in the third quarter of 2019. This was offset by higher share-based compensation expense as the increase in our share price was higher compared to the same prior year period.
Exploration, Evaluation and Project Expenses
| | | | | | | | | | | | | | | | | |
| ($ millions) | For the three months ended | | | For the six months ended | |
| | 6/30/20 | 3/31/20 | 6/30/19 | 6/30/20 | 6/30/19 |
| Global exploration and evaluation | 39 | | 39 | | 45 | | 78 | | 76 | |
| Project costs: | | | | | |
| Pascua-Lama | 8 | | 10 | | 12 | | 18 | | 25 | |
| | | | | |
| | | | | |
| Other | 5 | | 4 | | 5 | | 9 | | 9 | |
| Corporate development | 3 | | 3 | | 22 | | 6 | | 30 | |
| Business improvement and innovation | 0 | | 0 | | 2 | | 0 | | 9 | |
| Global exploration and evaluation and project expense | 55 | | 56 | | 86 | | 111 | | 149 | |
| Minesite exploration and evaluation | 23 | | 15 | | 12 | | 38 | | 23 | |
| Total exploration, evaluation and project expenses | 78 | | 71 | | 98 | | 149 | | 172 | |
Q2 2020 compared to Q1 2020
Exploration, evaluation and project expenses for the second quarter of 2020 increased by $7 million compared to the first quarter of 2020. This was primarily due to higher minesite exploration and evaluation costs at Carlin due to a delayed start of activity in the prior quarter and at Turquoise Ridge as surface exploration started early in the second quarter of 2020.
Q2 2020 compared to Q2 2019
Exploration, evaluation and project expenses for the three month period ended June 30, 2020 was $20 million lower than the same prior year period, mainly due to lower corporate development costs. Corporate development
| | | | | | | | |
| BARRICK SECOND QUARTER 2020 | 72 | MANAGEMENT'S DISCUSSION AND ANALYSIS |
costs in the same prior year period is related to the establishment of Nevada Gold Mines.
YTD Q2 2020 compared to YTD Q2 2019
Exploration, evaluation and project expenses for the six month period ended June 30, 2020 was $23 million lower than the same prior year period, primarily due to lower corporate development costs as a result of transaction costs relating to the establishment of Nevada Gold Mines occurring in the same prior year period.
Finance Costs, Net
| | | | | | | | | | | | | | | | | |
| ($ millions) | For the three months ended | | | For the six months ended | |
| | 6/30/20 | 3/31/20 | 6/30/19 | 6/30/20 | 6/30/19 |
Interest expensea | 84 | | 88 | | 109 | | 172 | | 218 | |
| Accretion | 8 | | 16 | | 20 | | 24 | | 40 | |
| Loss on debt extinguishment | 0 | | 15 | | 0 | | 15 | | 0 | |
| Interest capitalized | (4) | | (5) | | (3) | | (9) | | (5) | |
| Other finance costs | 0 | | 0 | | (1) | | 0 | | (1) | |
| Finance income | (6) | | (10) | | (7) | | (16) | | (14) | |
| Finance costs, net | 82 | | 104 | | 118 | | 186 | | 238 | |
a.For the three and six months ended June 30, 2020, interest expense includes approximately $8 million and $17 million, respectively, of non-cash interest expense relating to the gold and silver streaming agreement with Royal Gold, Inc. (March 31, 2020: $9 million and June 30, 2019: $25 million and $50 million, respectively, which is inclusive of amounts relating to the silver streaming agreement with Wheaton Precious Metals Corp.).
Q2 2020 compared to Q1 2020
In the second quarter of 2020, net finance costs were 21% lower than the prior quarter, mainly due to a decrease in loss on debt extinguishment, combined with lower accretion resulting from a decrease in interest rates. The loss on debt extinguishment in the prior quarter relates to the make-whole repurchase of the outstanding $337 million of principal of our 3.85% notes due 2022 in January 2020.
Q2 2020 compared to Q2 2019
For the three month period ended June 30, 2020, net finance costs were 31% lower than the same prior year period, primarily due to a decrease in interest expense attributed to the absence of non-cash interest expense related to the silver streaming agreement at Pascua-Lama, following the de-recognition of the deferred revenue liability at the end of the fourth quarter of 2019. This was combined with lower accretion resulting from a decrease in interest rates.
YTD Q2 2020 compared to YTD Q2 2019
For the six month period ended June 30, 2020, net finance costs were 22% lower than the same prior year period, primarily due to a decrease in interest expense attributed to the absence of non-cash interest expense related to the silver streaming agreement at Pascua-Lama as described above, combined with lower accretion expense resulting from lower interest rates. This was partially offset by a loss on debt extinguishment relating to the make-whole repurchase of the remaining $337 million of principal of our 3.85% notes due 2022 in January 2020.
Additional Significant Statement of Income Items
| | | | | | | | | | | | | | | | | | | | | |
| ($ millions) | For the three
months ended | | | For the six months ended | | | | | |
| | 6/30/20 | 3/31/20 | 6/30/19 | 6/30/20 | | 6/30/19 | | | |
| Impairment charges (reversals) | 23 | | (336) | | 12 | | (313) | | | 15 | | | | |
| Loss (gain) on currency translation | 2 | | 16 | | (6) | | 18 | | | 16 | | | | |
| Other expense (income) | 73 | | (35) | | 7 | | 38 | | | 33 | | | | |
Impairment Charges (Reversals)
Q2 2020 compared to Q1 2020
In the second quarter of 2020, net impairment charges were $23 million compared to net impairment reversals of $336 million in the prior quarter. The net impairment charge in the second quarter of 2020 relates to miscellaneous assets across multiple sites. In the first quarter of 2020, the net impairment reversal is from our Tanzanian assets resulting from the agreement with the GoT being signed and made effective.
Q2 2020 compared to Q2 2019
For the three month period ended June 30, 2020, net impairment reversals were $23 million compared to net impairment charges of $12 million in the same prior year period. The net impairment reversal in the second quarter of 2020 relates to miscellaneous assets across multiple sites. In the second quarter of 2019, the net impairment charges mainly relate to equipment at Golden Sunlight as underground development has ceased.
YTD Q2 2020 compared to YTD Q2 2019
For the six month period ended June 30, 2020, net impairment reversals were $313 million compared to net impairment charges of $15 million in the same prior year period. The net impairment reversal in the current year primarily relates to a $332 million net impairment reversal of our Tanzanian assets resulting from the agreement with the GoT being signed and made effective in the first quarter of 2020. For the six month period ended June 30, 2019, the impairment charges mainly relate to equipment at Golden Sunlight as underground development has ceased.
For a further breakdown of impairment charges and reversals, refer to note 13 of the Financial Statements.
(Gain) Loss on Currency Translation
Q2 2020 compared to Q1 2020
Loss on currency translation in the second quarter of 2020 was $2 million compared to $16 million in the prior quarter. The losses incurred during the second quarter of 2020 were primarily due to unrealized foreign currency translation losses relating to the continued depreciation of the Argentine peso, partially offset by the appreciation of the West African CFA franc. These currency fluctuations resulted in a revaluation of our peso and CFA franc denominated value-added tax receivable balances.
Q2 2020 compared to Q2 2019
Loss on currency translation in the second quarter of 2020 was $2 million compared to gains of $6 million in the same prior year period, mainly due to unrealized foreign currency translation losses relating to the Argentine peso, which depreciated in the current period compared to an
| | | | | | | | |
| BARRICK SECOND QUARTER 2020 | 73 | MANAGEMENT'S DISCUSSION AND ANALYSIS |
appreciation in the same prior year period. Fluctuations in the Argentine peso exchange rate versus the US dollar revalue our peso denominated value-added tax receivable balances.
YTD Q2 2020 compared to YTD Q2 2019
Loss on currency translation for the six month period ended June 30, 2020 increased by $2 million compared to the same prior year period, mainly due to unrealized foreign currency losses relating to the Argentine peso, which depreciated at a greater rate in the six month period ended June 30, 2020 compared to the same prior year period. Fluctuations in the Argentine peso exchange rate versus the US dollar revalue our peso denominated value-added tax receivable balances. The Argentine peso has weakened against the US dollar due in part to high inflation and economic uncertainty in the country. This was partially offset by the gains on the revaluation of Canadian dollar denominated liabilities.
Other Expense (Income)
Q2 2020 compared to Q1 2020
In the second quarter of 2020, other expense was $73 million compared to income of $35 million in the prior quarter. Other expense in the second quarter of 2020 mainly relates to care and maintenance expenses at Porgera and donations made to host communities relating to the Covid-19 pandemic. Other income in the first quarter of 2020 primarily consists of the gain on the sale of Massawa of $54 million, partially offset by losses on non-hedge derivatives.
Q2 2020 compared to Q2 2019
For the three month period ended June 30, 2020, other expense was $73 million compared to $7 million in the same prior year period. Other expense in the second quarter of 2020 mainly relates to care and maintenance expenses at Porgera and donations made to host communities relating to the Covid-19 pandemic. For the three month period ended June 30, 2019, other expense primarily consists of Acacia-related costs and litigation expenses, partially offset by a gain of $12 million on the sale of long-lived assets.
YTD Q2 2020 compared to YTD Q2 2019
For the six month period ended June 30, 2020, other expense was $38 million compared to $33 million in the same prior year period. Other expense in the current year mainly relates to care and maintenance expenses at Porgera and donations made to host communities relating to the Covid-19 pandemic. This was partially offset by the gain on the sale of Massawa of $54 million.
For a further breakdown of other expense (income), refer to note 9 to the Financial Statements.
Income Tax Expense
Income tax expense was $258 million in the second quarter of 2020. The unadjusted effective income tax rate in the second quarter of 2020 was 29% of the income before income taxes.
The underlying effective income tax rate on ordinary income in the second quarter of 2020 was 29% after adjusting for the impact of impairment charges; the impact of a partial recognition of our previously unrecognized deferred tax asset at Buzwagi; the impact of foreign currency translation losses on deferred tax balances; the impact of non-deductible foreign exchange losses; the impact of Covid-19 donations; the impact of the Porgera mine being placed on care and maintenance; and the impact of other expense adjustments.
We record deferred tax charges or credits if changes in facts or circumstances affect the estimated tax basis of assets and therefore the amount of deferred tax assets or liabilities to reflect changing expectations in our ability to realize deferred tax assets. The interpretation of tax regulations and legislation as well as their application to our business is complex and subject to change. We have significant amounts of deferred tax assets (mostly unrecognized), including tax loss carry forwards, and also deferred tax liabilities. Potential changes of any of these amounts, as well as our ability to realize deferred tax assets, could significantly affect net income or cash flow in future periods. For further details on income tax expense, refer to note 10 of the Financial Statements.
Nevada Gold Mines
Nevada Gold Mines is a limited liability company treated as a flow through partnership for US tax purposes. The partnership is not subject to federal income tax directly, but each of its partners is liable for tax on its share of the profits of the partnership. As such, Barrick accounts for its current and deferred income tax associated with the investment (61.5% share) following the principles in IAS 12.
Tanzania
On January 24, 2020, Barrick formalized the establishment of a joint venture between Barrick and the GoT and resolution of all outstanding disputes between Barrick and the GoT, including the lifting of the previous concentrate export ban, effective immediately. Refer to note 13 to the Financial Statements for further information.
A deferred tax recovery of $8 million was recorded in the second quarter of 2020 due to the recognition of deferred tax assets at Buzwagi.
| | | | | | | | |
| BARRICK SECOND QUARTER 2020 | 74 | MANAGEMENT'S DISCUSSION AND ANALYSIS |
FINANCIAL CONDITION REVIEW
Summary Balance Sheet and Key Financial Ratios
| | | | | | | | |
| ($ millions, except ratios and share amounts) | As at 6/30/20 | As at 12/31/19 |
| Total cash and equivalents | 3,743 | 3,314 |
| Current assets | 3,176 | 3,573 |
| Non-current assets | 38,261 | 37,505 |
| Total Assets | 45,180 | 44,392 |
| Current liabilities excluding short-term debt | 1,785 | 2,001 |
Non-current liabilities excluding long-term debta | 7,481 | 7,028 |
| Debt (current and long-term) | 5,168 | 5,536 |
| Total Liabilities | 14,434 | 14,565 |
| Total shareholders’ equity | 22,032 | 21,432 |
| Non-controlling interests | 8,714 | 8,395 |
| Total Equity | 30,746 | 29,827 |
Total common shares outstanding (millions of shares)b | 1,778 | 1,778 |
| Debt, net of cash | 1,425 | 2,222 |
| Key Financial Ratios: | | |
Current ratioc | 3.82:1 | 2.90:1 |
Debt-to-equityd | 0.17:1 | 0.19:1 |
a.Non-current financial liabilities as at June 30, 2020 were $5,469 million (December 31, 2019: $5,559 million).
b.Total common shares outstanding do not include 0.1 million stock options.
c.Represents current assets divided by current liabilities (including short-term debt) as at June 30, 2020 and December 31, 2019.
d.Represents debt divided by total shareholders’ equity (including minority interest) as at June 30, 2020 and December 31, 2019.
Balance Sheet Review
Total assets were $45.2 billion at June 30, 2020, approximately $0.8 billion higher than at December 31, 2019, primarily reflecting the non-current asset impairment reversal of $737 million of our Tanzanian assets resulting from the agreement with the GoT being signed and made effective in the first quarter of 2020.
Our asset base is primarily comprised of non-current assets such as property, plant and equipment and goodwill, reflecting the capital-intensive nature of the mining business and our history of growing through acquisitions. Other significant assets include production inventories, indirect taxes recoverable and receivable, concentrate sales receivable, other government and joint venture related receivables, and cash and equivalents.
Total liabilities at June 30, 2020 were $14.4 billion, which was slightly lower than total liabilities at December 31, 2019. Our liabilities are primarily comprised of debt, other non-current liabilities such as provisions and deferred income tax liabilities, and accounts payable.
Shareholders’ Equity
| | | | | |
| As at 7/30/2020 | Number of shares |
| Common shares | 1,778,068,071 | |
| Stock options | 109,000 | |
Financial Position and Liquidity
We believe we have sufficient financial resources to meet our business requirements for the foreseeable future, including capital expenditures, working capital requirements, interest payments and dividends. To date, we have not experienced significant negative impacts to liquidity as a result of the Covid-19 pandemic. During the
second quarter, cash balances continued to grow and debt, net of cash, was further reduced.
Total cash and cash equivalents as at June 30, 2020 were $3.7 billion. Our capital structure comprises a mix of debt, non-controlling interest (primarily at Nevada Gold Mines) and shareholders’ equity. As at June 30, 2020, our total debt was $5.2 billion (debt, net of cash and equivalents was $1.4 billion) and our debt-to-equity ratio was 0.17:1. This compares to debt as at December 31, 2019 of $5.5 billion (debt, net of cash and equivalents was $2.2 billion), and a debt-to-equity ratio of 0.19:1.
Uses of cash for the remainder of 2020 include capital commitments of $162 million and we expect to incur attributable sustaining and project capital expenditures of approximately $800 to $1,100 million during the second half of the year, based on our guidance range on page 33. For the remainder of 2020, we have contractual obligations and commitments of $423 million for supplies and consumables. In addition, we have $155 million in interest payments and other amounts as detailed in the table on page 77. We expect to fund these commitments through operating cash flow, which is our primary source of liquidity, as well as existing cash balances.
Our operating cash flow is dependent on the ability of our operations to deliver projected future cash flows. The market prices of gold, and to a lesser extent copper, are the primary drivers of our operating cash flow. Other options to enhance liquidity include further portfolio optimization and the creation of new joint ventures and partnerships; issuance of equity securities in the public markets or to private investors, which could be undertaken for liquidity enhancement and/or in connection with establishing a strategic partnership; issuance of long-term debt securities
| | | | | | | | |
| BARRICK SECOND QUARTER 2020 | 75 | MANAGEMENT'S DISCUSSION AND ANALYSIS |
in the public markets or to private investors (Moody’s and S&P currently rate Barrick’s outstanding long-term debt as investment grade, with ratings of Baa2 and BBB, respectively and during the second quarter, S&P revised their outlook on Barrick's credit rating to Positive from Stable); and drawing on the $3.0 billion available under our undrawn credit facility (subject to compliance with covenants and the making of certain representations and warranties, this facility is available for drawdown as a source of financing). The key financial covenant in our undrawn credit facility requires Barrick to maintain a net debt to total capitalization ratio of less than 0.60:1. Barrick’s net debt to total capitalization ratio was 0.04:1 as at June 30, 2020 (0.07:1 as at December 31, 2019).
Summary of Cash Inflow (Outflow)
| | | | | | | | | | | | | | | | | |
| ($ millions) | For the three months ended | | | For the six months ended | |
| | 6/30/20 | 3/31/20 | 6/30/19 | 6/30/20 | 6/30/19 |
| Net cash provided by operating activities | 1,031 | | 889 | | 434 | | 1,920 | | 954 | |
| Investing activities | | | | | |
| Capital expenditures | (509) | | (451) | | (379) | | (960) | | (753) | |
| Investment sales (purchases) | 206 | | 0 | | (4) | | 206 | | (7) | |
| Cash acquired in merger | 0 | | 0 | | 0 | | 0 | | 751 | |
| Divestitures | 0 | | 256 | | 0 | | 256 | | 0 | |
| Dividends received from equity method investments | 29 | | 25 | | 17 | | 54 | | 32 | |
| Other | 10 | | 7 | | 15 | | 17 | | 48 | |
| Total investing inflows (outflows) | (264) | | (163) | | (351) | | (427) | | 71 | |
Net change in debta | (7) | | (356) | | (6) | | (363) | | (34) | |
| | | | | |
Dividendsb | (124) | | (122) | | (61) | | (246) | | (394) | |
| Net disbursements to non-controlling interests | (217) | | (216) | | (15) | | (433) | | (14) | |
| Other | 0 | | (15) | | 0 | | (15) | | 0 | |
| Total financing inflows (outflows) | (348) | | (709) | | (82) | | (1,057) | | (442) | |
| Effect of exchange rate | (3) | | (4) | | (1) | | (7) | | (1) | |
| Increase (decrease) in cash and equivalents | 416 | | 13 | | 0 | | 429 | | 582 | |
a.The difference between the net change in debt on a cash basis and the net change on the balance sheet is due to changes in non-cash charges, specifically the unwinding of discounts and amortization of debt issue costs.
b.For the three and six months ended June 30, 2020, we declared and paid dividends per share in US dollars totaling $0.07 and $0.14, respectively, (March 31, 2020: declared and paid $0.07; June 30, 2019: declared and paid $0.04; declared $0.04 and paid $0.11, and also paid $2.69 per share to Randgold shareholders, respectively).
Q2 2020 compared to Q1 2020
In the second quarter of 2020, we generated $1,031 million in operating cash flow, compared to $889 million in the prior quarter. The increase of $142 million was primarily due to a favorable movement in working capital, mainly in other current assets and liabilities, accounts payable and inventory. This was combined with the higher realized gold
price1 and higher gold sales volumes, partially offset by higher cash taxes and interest paid.
Cash outflows from investing activities in the second quarter of 2020 were $264 million compared to $163 million in the prior quarter. The change of $101 million was primarily due to increased capital expenditures and a decrease in cash proceeds from divestitures (we received $256 million relating to the sale of Massawa in the first quarter of 2020), partially offset by a net investment sales inflow primarily relating to the sale of shares in Shandong Gold.
Net financing cash outflows for the second quarter of 2020 amounted to $348 million, compared to $709 million in the prior quarter. The decrease of $361 million is primarily due to the make-whole repurchase of the outstanding $337 million of principal of our 3.85% notes due 2022 in the first quarter of 2020.
Q2 2020 compared to Q2 2019
In the second quarter of 2020, we generated $1,031 million in operating cash flow, compared to $434 million in the same prior year period. The increase of $597 million was primarily due to the higher realized gold price1, partially offset by lower gold sales volume and higher cash taxes paid.
Cash outflows from investing activities in the second quarter of 2020 were $264 million compared to $351 million in the same prior year period. The change of $87 million million was primarily due to net investment sales primarily relating to the proceeds from the sale of shares in Shandong Gold, partially offset by higher capital expenditures primarily as a result of the formation of Nevada Gold Mines.
Net financing cash outflows for the second quarter of 2020 amounted to $348 million, compared to $82 million in the same prior year period. The increase of $266 million is primarily due to higher disbursements to non-controlling interests driven by the formation of Nevada Gold Mines, combined with an increase in dividends paid, reflecting Barrick's profitability, financial strength and commitment to shareholder returns.
YTD Q2 2020 compared to YTD Q2 2019
For the six month period ended June 30, 2020, we generated $1,920 million in operating cash flow, compared to $954 million in the same prior year period. The increase of $966 million was primarily due to the higher realized gold price1, partially offset by lower gold sales volume and higher cash taxes paid.
Cash outflows from investing activities for the six month period ended June 30, 2020 were $427 million compared to an inflow of $71 million in the same prior year period. The change of $498 million was primarily due to higher capital expenditures, mainly as a result of the formation of Nevada Gold Mines. This was partially offset by the cash proceeds of $256 million relating to the sale of Massawa and net investment sales of $206 million primarily from the sale of shares in Shandong Gold, compared to the cash acquired as a result of the Merger of $751 million in the same prior year period.
| | | | | | | | |
| BARRICK SECOND QUARTER 2020 | 76 | MANAGEMENT'S DISCUSSION AND ANALYSIS |
Net financing cash outflows for the six month period ended June 30, 2020 amounted to $1,057 million, compared to $442 million in the same prior year period. The increase of $615 million is primarily due to higher disbursements to non-controlling interests driven by the formation of Nevada Gold Mines, combined with the make-whole repurchase of the outstanding $337 million of principal of our 3.85% notes
due 2022 in January 2020. This was partially offset by lower dividends paid as even though dividends per share to Barrick shareholders have increased year over year, we paid a dividend to former Randgold shareholders in the same prior year period.
COMMITMENTS AND CONTINGENCIES
Litigation and Claims
We are currently subject to various litigation proceedings as disclosed in note 17 to the Financial Statements, and we may be involved in disputes with other parties in the future that may result in litigation. If we are unable to resolve these disputes favorably, it may have a material adverse impact on our financial condition, cash flow and results of operations.
Contractual Obligations and Commitments
In the normal course of business, we enter into contracts that give rise to commitments for future minimum payments. The following table summarizes the remaining contractual maturities of our financial liabilities and operating and capital commitments shown on an undiscounted basis:
| | | | | | | | | | | | | | | | | | | | | | | |
| ($ millions) | Payments due as at 6/30/20 | | | | | | |
| | 2020 | 2021 | 2022 | 2023 | 2024 | 2025 and thereafter | Total |
Debta | | | | | | | |
| Repayment of principal | 0 | 7 | 0 | 0 | 0 | 5,109 | 5,116 |
| Capital leases | 12 | 13 | 9 | 6 | 4 | 32 | 76 |
| Interest | 155 | 308 | 307 | 307 | 306 | 4,447 | 5,830 |
Provisions for environmental rehabilitationb | 136 | 177 | 191 | 180 | 141 | 2,169 | 2,994 |
| | | | | | | |
| Restricted share units | 12 | 20 | 7 | 0 | 0 | 0 | 39 |
| Pension benefits and other post-retirement benefits | 14 | 7 | 7 | 7 | 6 | 99 | 140 |
| | | | | | | |
Minimum royalty paymentsc | 1 | 1 | 1 | 1 | 1 | 2 | 7 |
Purchase obligations for supplies and consumablesd | 423 | 224 | 117 | 100 | 99 | 521 | 1,484 |
Capital commitmentse | 162 | 43 | 1 | 0 | 0 | 0 | 206 |
Social development costsf | 9 | 11 | 5 | 4 | 4 | 53 | 86 |
Deposit on Pascua-Lama silver sale agreementg | 253 | 0 | 0 | 0 | 0 | 0 | 253 |
| Total | 1,177 | 811 | 645 | 605 | 561 | 12,432 | 16,231 |
a.Debt and Interest - Our debt obligations do not include any subjective acceleration clauses or other clauses that enable the holder of the debt to call for early repayment, except in the event that we breach any of the terms and conditions of the debt or for other customary events of default. We are not required to post any collateral under any debt obligations. Projected interest payments on variable rate debt were based on interest rates in effect at June 30, 2020. Interest is calculated on our long-term debt obligations using both fixed and variable rates.
b.Provisions for environmental rehabilitation - Amounts presented in the table represent the undiscounted uninflated future payments for the expected cost of provisions for environmental rehabilitation.
c.Minimum royalty payments are related to continuing operations and are presented net of recoverable amounts.
d.Purchase obligations for supplies and consumables - Includes commitments related to new purchase obligations to secure a supply of acid, tires and cyanide for our production process.
e.Capital commitments - Purchase obligations for capital expenditures include only those items where binding commitments have been entered into.
f.Social development costs - Includes a commitment of $14 million in 2025 and thereafter related to the funding of a power transmission line in Argentina.
g.Deposit on Pascua-Lama silver sale agreement - Relates to our silver sale agreement with Wheaton Precious Metals Corp.
| | | | | | | | |
| BARRICK SECOND QUARTER 2020 | 77 | MANAGEMENT'S DISCUSSION AND ANALYSIS |
REVIEW OF QUARTERLY RESULTS
Quarterly Informationa
| | | | | | | | | | | | | | | | | | | | | | | | | | |
| ($ millions, except where indicated) | 2020 | 2020 | 2019 | 2019 | 2019 | 2019 | 2018 | 2018 |
| Q2 | Q1 | Q4 | Q3 | Q2 | Q1 | Q4 | Q3 |
| Revenues | 3,055 | 2,721 | 2,883 | 2,678 | 2,063 | 2,093 | 1,904 | 1,837 |
Realized price per ounce – goldb | 1,725 | 1,589 | 1,483 | 1,476 | 1,317 | 1,307 | 1,223 | 1,216 |
Realized price per pound – copperb | 2.79 | 2.23 | 2.76 | 2.55 | 2.62 | 3.07 | 2.76 | 2.76 |
| Cost of sales | 1,900 | 1,776 | 1,987 | 1,889 | 1,545 | 1,490 | 1,577 | 1,315 |
| Net earnings (loss) | 357 | 400 | 1,387 | 2,277 | 194 | 111 | (1,197) | (412) |
Per share (dollars)c | 0.20 | 0.22 | 0.78 | 1.30 | 0.11 | 0.06 | (1.02) | (0.35) |
Adjusted net earningsb | 415 | 285 | 300 | 264 | 154 | 184 | 69 | 89 |
Per share (dollars)b,c | 0.23 | 0.16 | 0.17 | 0.15 | 0.09 | 0.11 | 0.06 | 0.08 |
| Operating cash flow | 1,031 | 889 | 875 | 1,004 | 434 | 520 | 411 | 706 |
| Cash capital expenditures | 509 | 451 | 446 | 502 | 379 | 374 | 374 | 387 |
Free cash flowb | 522 | 438 | 429 | 502 | 55 | 146 | 37 | 319 |
a.Sum of all the quarters may not add up to the annual total due to rounding.
b.Realized price, adjusted net earnings, adjusted net earnings per share and free cash flow are non-GAAP financial performance measures with no standardized meaning under IFRS and therefore may not be comparable to similar measures of performance presented by other issuers. For further information and a detailed reconciliation of each non-GAAP measure used in this section of the MD&A to the most directly comparable IFRS measure, please see pages 79 to 103 of this MD&A.
c.Calculated using weighted average number of shares outstanding under the basic method of earnings per share.
Our recent financial results reflect our emphasis on cost discipline, an agile management structure that empowers our site based leadership teams and a portfolio of Tier One16 assets. This combined with rising gold prices has resulted in stronger operating cash flows. The positive free cash flow1 generated, together with the proceeds from various divestitures, have allowed us to continue to strengthen our balance sheet over the past two years and to increase returns to shareholders.
These same fundamentals have also driven the higher net earnings in recent quarters. Prior to that, starting in the first quarter of 2019, the Merger resulted in the commencement of the contribution of Randgold's operations to Barrick's net earnings and cash flows. Net earnings has also been impacted by the following items in each quarter which have been excluded from adjusted net earnings1. In the first quarter of 2020, we recorded a net impairment reversal of $115 million (net of tax effects), resulting from the agreement with the GoT being signed and made effective in the first quarter of 2020. In the fourth quarter of 2019, we recorded $22 million (net of tax and non-controlling interests) of net impairment charges, mainly relating to a charge at Pascua-Lama of $296 million (no tax impact), partially offset by a net impairment reversal at Pueblo Viejo
of $277 million (net of taxes and non-controlling interest). We also recorded a $628 million (no tax impact) gain on the de-recognition of the deferred revenue liability relating to our silver sale agreement with Wheaton Precious Metals Corp., a gain of $408 million (no tax impact) resulting from the sale of our 50% interest in Kalgoorlie, and a gain of $216 million (no tax impact) on a settlement of customs duty and indirect taxes at Lumwana. In the third quarter of 2019, net earnings and cash flows were impacted by the formation of Nevada Gold Mines and the commencement of the contribution of its operations to Barrick's net earnings and cash flows. Net earnings in the third quarter of 2019 included a $1.5 billion (net of tax effects) gain on the remeasurement of Turquoise Ridge as a result of its contribution to Nevada Gold Mines and a $663 million (net of tax effects) impairment reversal at Lumwana. In the fourth quarter of 2018, we recorded $319 million (net of tax effects and non-controlling interests) of net asset impairments primarily relating to $160 million of non-current assets and $154 million of goodwill at the Veladero mine. We also recorded in the fourth quarter of 2018 an inventory impairment of $166 million at Lagunas Norte, which was included in cost of sales. In the third quarter of 2018, we recorded a $405 million impairment charge resulting from an asset impairment at Lagunas Norte.
INTERNAL CONTROL OVER FINANCIAL REPORTING AND DISCLOSURE CONTROLS AND PROCEDURES
Management is responsible for establishing and maintaining adequate internal control over financial reporting and disclosure controls and procedures as defined in our 2019 annual MD&A.
Together, the internal control frameworks provide internal control over financial reporting and disclosure. Due to its inherent limitations, internal control over financial reporting and disclosure may not prevent or detect all misstatements. Further, the effectiveness of internal control is subject to the risk that controls may become inadequate because of
changes in conditions, or that the degree of compliance with policies or procedures may change.
There were no changes in our internal controls over financial reporting during the three months ended June 30, 2020 that have materially affected, or are reasonably likely to materially affect, our internal controls over financial reporting.
Under the supervision and with the participation of management, including the President and Chief Executive Officer and Senior Executive Vice-President and Chief
| | | | | | | | |
| BARRICK SECOND QUARTER 2020 | 78 | MANAGEMENT'S DISCUSSION AND ANALYSIS |
Financial Officer, management will continue to monitor and evaluate the design and effectiveness of its internal control over financial reporting and disclosure controls and
procedures, and may make modifications from time to time as considered necessary.
IFRS CRITICAL ACCOUNTING POLICIES AND ACCOUNTING ESTIMATES
Management has discussed the development and selection of our critical accounting estimates with the Audit and Risk Committee of the Board of Directors, and the Audit and Risk Committee has reviewed the disclosure relating to such estimates in conjunction with its review of this MD&A. The accounting policies and methods we utilize determine how we report our financial condition and results of operations, and they may require Management to make estimates or rely on assumptions about matters that are inherently uncertain. The consolidated financial statements have been prepared in accordance with International Financial Reporting Standards (“IFRS”) as issued by the International Accounting Standards Board (“IASB”) under the historical cost convention, as modified by revaluation of certain financial assets, derivative contracts and post-retirement assets. Our significant accounting policies are disclosed in
note 2 of the Financial Statements, including a summary of current and future changes in accounting policies.
Critical Accounting Estimates and Judgments
Certain accounting estimates have been identified as being “critical” to the presentation of our financial condition and results of operations because they require us to make subjective and/or complex judgments about matters that are inherently uncertain; or there is a reasonable likelihood that materially different amounts could be reported under different conditions or using different assumptions and estimates. Our significant accounting judgments, estimates and assumptions are disclosed in note 3 of the accompanying Financial Statements.
NON-GAAP FINANCIAL PERFORMANCE MEASURES
Adjusted Net Earnings and Adjusted Net Earnings per Share
Adjusted net earnings is a non-GAAP financial measure which excludes the following from net earnings:
•Impairment charges (reversals) related to intangibles, goodwill, property, plant and equipment, and investments;
•Acquisition/disposition gains/losses;
•Foreign currency translation gains/losses;
•Significant tax adjustments; and
•Tax effect and non-controlling interest of the above items.
Management uses this measure internally to evaluate our underlying operating performance for the reporting periods presented and to assist with the planning and forecasting of future operating results. Management believes that adjusted net earnings is a useful measure of our performance because impairment charges, acquisition/disposition gains/losses and significant tax adjustments do not reflect the underlying operating performance of our core mining business and are not necessarily indicative of future operating results. Furthermore, foreign currency translation gains/losses are not necessarily reflective of the underlying operating results for the reporting periods presented. The tax effect and non-controlling interest of the adjusting items are also excluded to reconcile the amounts to Barrick’s share on a post-tax basis, consistent with net earnings.
As noted, we use this measure for internal purposes. Management’s internal budgets and forecasts and public guidance do not include the types of items we adjust for. Consequently, the presentation of adjusted net earnings enables investors and analysts to better understand the underlying operating performance of our core mining business through the eyes of management. Management periodically evaluates the components of adjusted net earnings based on an internal assessment of performance measures that are useful for evaluating the operating performance of our business segments and a review of the non-GAAP measures used by mining industry analysts and other mining companies.
Adjusted net earnings is intended to provide additional information only and does not have any standardized definition under IFRS and should not be considered in isolation or as a substitute for measures of performance prepared in accordance with IFRS. The measures are not necessarily indicative of operating profit or cash flow from operations as determined under IFRS. Other companies may calculate these measures differently. The following table reconciles these non-GAAP measures to the most directly comparable IFRS measure.
| | | | | | | | |
| BARRICK SECOND QUARTER 2020 | 79 | MANAGEMENT'S DISCUSSION AND ANALYSIS |
Reconciliation of Net Earnings to Net Earnings per Share, Adjusted Net Earnings and Adjusted Net Earnings per Share
| | | | | | | | | | | | | | | | | |
| ($ millions, except per share amounts in dollars) | For the three months ended | | | For the six months ended | |
| | 6/30/20 | 3/31/20 | 6/30/19 | 6/30/20 | 6/30/19 |
| Net earnings attributable to equity holders of the Company | 357 | | 400 | | 194 | | 757 | | 305 | |
Impairment charges (reversals) related to intangibles, goodwill, property, plant and equipment, and investmentsa | 23 | | (336) | | 12 | | (313) | | 15 | |
Acquisition/disposition (gains) lossesb | 8 | | (60) | | (12) | | (52) | | (12) | |
| Loss (gain) on currency translation | 2 | | 16 | | (6) | | 18 | | 16 | |
Significant tax adjustmentsc | (7) | | (44) | | (83) | | (51) | | (75) | |
Other expense adjustmentsd | 48 | | 98 | | 58 | | 146 | | 104 | |
| | | | | |
Tax effect and non-controlling intereste | (16) | | 211 | | (9) | | 195 | | (15) | |
| Adjusted net earnings | 415 | | 285 | | 154 | | 700 | | 338 | |
Net earnings per sharef | 0.20 | | 0.22 | | 0.11 | | 0.43 | | 0.17 | |
Adjusted net earnings per sharef | 0.23 | | 0.16 | | 0.09 | | 0.39 | | 0.19 | |
a.Net impairment charges for the three month period ended June 30, 2020 relate to miscellaneous assets. For the three month period ended March 31, 2020 and the six month period ended June 30, 2020, net impairment reversals primarily relate to non-current asset reversals at our Tanzanian assets.
b.Acquisition/disposition gains for the three month period ended March 31, 2020 and the six month period ended June 30, 2020 primarily relate to the gain on the sale of Massawa.
c.Significant tax adjustments for the three month period ended March 31, 2020 and the six month period ended June 30, 2020 primarily relate to deferred tax recoveries as a result of tax reform measures in Argentina and adjustments made in recognition of the net settlement of all outstanding disputes with the GoT. For the three and six month periods ended June 30, 2019, significant tax adjustments primarily relate to an adjustment to deferred taxes at Veladero. Refer to Note 10 to the Financial Statements for more information.
d.Other expense adjustments for the three and six month period ended June 30, 2020 primarily relate to care and maintenance expenses at Porgera and Covid-19 donations. The six month period ended June 30, 2020 was further impacted by changes in the discount rate assumptions on our closed mine rehabilitation provision. For the three month period ended March 31, 2020, other expense adjustments primarily relate to the impact of changes in the discount rate assumptions on our closed mine rehabilitation provision and losses on debt extinguishment. Other expense adjustments for the three and six month periods ended June 30, 2019 primarily relate to severance costs as a result of the implementation of a number of organizational reductions, the impact of changes in the discount rate assumptions on our closed mine rehabilitation provision and transaction costs related to Nevada Gold Mines.
e.Tax effect and non-controlling interest for the three month periods ended March 31, 2020 and December 31, 2019 primarily relates to the net impairment reversals related to long-lived assets.
f.Calculated using weighted average number of shares outstanding under the basic method of earnings per share.
Free Cash Flow
Free cash flow is a measure that deducts capital expenditures from net cash provided by operating activities. Management believes this to be a useful indicator of our ability to operate without reliance on additional borrowing or usage of existing cash.
Free cash flow is intended to provide additional information only and does not have any standardized definition under
IFRS and should not be considered in isolation or as a substitute for measures of performance prepared in accordance with IFRS. The measure is not necessarily indicative of operating profit or cash flow from operations as determined under IFRS. Other companies may calculate this measure differently. The following table reconciles this non-GAAP measure to the most directly comparable IFRS measure.
Reconciliation of Net Cash Provided by Operating Activities to Free Cash Flow
| | | | | | | | | | | | | | | | | | | |
| ($ millions) | For the three months ended | | | For the six months ended | | | |
| | 6/30/20 | 3/31/20 | 6/30/19 | 6/30/20 | 6/30/19 | | |
| Net cash provided by operating activities | 1,031 | | 889 | | 434 | | 1,920 | | 954 | | | |
| Capital expenditures | (509) | | (451) | | (379) | | (960) | | (753) | | | |
| Free cash flow | 522 | | 438 | | 55 | | 960 | | 201 | | | |
| | | | | | | | |
| BARRICK SECOND QUARTER 2020 | 80 | MANAGEMENT'S DISCUSSION AND ANALYSIS |
Total cash costs per ounce, All-in sustaining costs per ounce, All-in costs per ounce, C1 cash costs per pound and All-in sustaining costs per pound
Total cash costs per ounce, all-in sustaining costs per ounce and all-in costs per ounce are non-GAAP financial measures which are calculated based on the definition published by the World Gold Council (a market development organization for the gold industry comprised of and funded by gold mining companies from around the world, including Barrick). The WGC is not a regulatory organization. Management uses these measures to monitor the performance of our gold mining operations and its ability to generate positive cash flow, both on an individual site basis and an overall company basis.
Total cash costs start with our cost of sales related to gold production and removes depreciation, the non-controlling interest of cost of sales and includes by-product credits. All-in sustaining costs start with total cash costs and include sustaining capital expenditures, sustaining leases, general and administrative costs, minesite exploration and evaluation costs and reclamation cost accretion and amortization. These additional costs reflect the expenditures made to maintain current production levels.
All-in costs starts with all-in sustaining costs and adds additional costs that reflect the varying costs of producing gold over the life-cycle of a mine, including: project capital expenditures (capital expenditures at new projects and discrete projects at existing operations intended to increase production capacity and will not benefit production for at least 12 months) and other non-sustaining costs (primarily non-sustaining leases, exploration and evaluation costs, community relations costs and general and administrative costs that are not associated with current operations). These definitions recognize that there are different costs associated with the life-cycle of a mine, and that it is therefore appropriate to distinguish between sustaining and non-sustaining costs.
We believe that our use of total cash costs, all-in sustaining costs and all-in costs will assist analysts, investors and other stakeholders of Barrick in understanding the costs associated with producing gold, understanding the economics of gold mining, assessing our operating performance and also our ability to generate free cash flow from current operations and to generate free cash flow on an overall company basis. Due to the capital-intensive nature of the industry and the long useful lives over which these items are depreciated, there can be a significant timing difference between net earnings calculated in
accordance with IFRS and the amount of free cash flow that is being generated by a mine and therefore we believe these measures are useful non-GAAP operating metrics and supplement our IFRS disclosures. These measures are not representative of all of our cash expenditures as they do not include income tax payments, interest costs or dividend payments. These measures do not include depreciation or amortization.
Total cash costs per ounce, all-in sustaining costs and all-in costs are intended to provide additional information only and do not have standardized definitions under IFRS and should not be considered in isolation or as a substitute for measures of performance prepared in accordance with IFRS. These measures are not equivalent to net income or cash flow from operations as determined under IFRS. Although the WGC has published a standardized definition, other companies may calculate these measures differently.
In addition to presenting these metrics on a by-product basis, we have calculated these metrics on a co-product basis. Our co-product metrics remove the impact of other metal sales that are produced as a by-product of our gold production from cost per ounce calculations but does not reflect a reduction in costs for costs associated with other metal sales.
C1 cash costs per pound and all-in sustaining costs per pound are non-GAAP financial measures related to our copper mine operations. We believe that C1 cash costs per pound enables investors to better understand the performance of our copper operations in comparison to other copper producers who present results on a similar basis. C1 cash costs per pound excludes royalties and production taxes and non-routine charges as they are not direct production costs. All-in sustaining costs per pound is similar to the gold all-in sustaining costs metric and management uses this to better evaluate the costs of copper production. We believe this measure enables investors to better understand the operating performance of our copper mines as this measure reflects all of the sustaining expenditures incurred in order to produce copper. All-in sustaining costs per pound includes C1 cash costs, sustaining capital expenditures, sustaining leases, general and administrative costs, minesite exploration and evaluation costs, royalties and production taxes, reclamation cost accretion and amortization and write-downs taken on inventory to net realizable value.
| | | | | | | | |
| BARRICK SECOND QUARTER 2020 | 81 | MANAGEMENT'S DISCUSSION AND ANALYSIS |
Reconciliation of Gold Cost of Sales to Total cash costs, All-in sustaining costs and All-in costs, including on a per ounce basis
| | | | | | | | | | | | | | | | | | | | |
| ($ millions, except per ounce information in dollars) | | For the three months ended | | | For the six months ended | |
| | Footnote | 6/30/20 | 3/31/20 | 6/30/19 | 6/30/20 | 6/30/19 |
| Cost of sales applicable to gold production | | 1,740 | | 1,643 | | 1,437 | | 3,383 | | 2,787 | |
| Depreciation | | (498) | | (474) | | (431) | | (972) | | (815) | |
| Cash cost of sales applicable to equity method investments | | 62 | | 52 | | 62 | | 114 | | 124 | |
| By-product credits | | (59) | | (29) | | (23) | | (88) | | (47) | |
| Realized (gains) losses on hedge and non-hedge derivatives | a | 1 | | 0 | | (1) | | 1 | | (1) | |
| Non-recurring items | b | 0 | | 0 | | (9) | | 0 | | (29) | |
| Other | c | (26) | | (27) | | (26) | | (53) | | (46) | |
| Non-controlling interests | d | (336) | | (316) | | (112) | | (652) | | (213) | |
| Total cash costs | | 884 | | 849 | | 897 | | 1,733 | | 1,760 | |
| General & administrative costs | | 71 | | 40 | | 59 | | 111 | | 113 | |
| Minesite exploration and evaluation costs | e | 23 | | 15 | | 12 | | 38 | | 23 | |
| Minesite sustaining capital expenditures | f | 420 | | 370 | | 267 | | 790 | | 520 | |
| Sustaining leases | | 10 | | 0 | | 8 | | 10 | | 18 | |
| Rehabilitation - accretion and amortization (operating sites) | g | 12 | | 14 | | 16 | | 26 | | 30 | |
| Non-controlling interest, copper operations and other | h | (158) | | (125) | | (76) | | (283) | | (151) | |
| All-in sustaining costs | | 1,262 | | 1,163 | | 1,183 | | 2,425 | | 2,313 | |
| Project exploration and evaluation and project costs | e | 55 | | 56 | | 86 | | 111 | | 149 | |
| Community relations costs not related to current operations | | 0 | | 1 | | 0 | | 1 | | 1 | |
| Project capital expenditures | f | 85 | | 76 | | 108 | | 161 | | 228 | |
| Rehabilitation - accretion and amortization (non-operating sites) | g | 4 | | 2 | | 7 | | 6 | | 14 | |
| Non-controlling interest and copper operations and other | h | (36) | | (17) | | (28) | | (53) | | (31) | |
| All-in costs | | 1,370 | | 1,281 | | 1,356 | | 2,651 | | 2,674 | |
| Ounces sold - equity basis (000s ounces) | i | 1,224 | | 1,220 | | 1,372 | | 2,444 | | 2,737 | |
| Cost of sales per ounce | j,k | 1,075 | | 1,020 | | 964 | | 1,048 | | 956 | |
| Total cash costs per ounce | k | 716 | | 692 | | 651 | | 704 | | 641 | |
| Total cash costs per ounce (on a co-product basis) | k,l | 747 | | 705 | | 663 | | 726 | | 654 | |
| All-in sustaining costs per ounce | k | 1,031 | | 954 | | 869 | | 993 | | 842 | |
| All-in sustaining costs per ounce (on a co-product basis) | k,l | 1,062 | | 967 | | 881 | | 1,015 | | 855 | |
| All-in costs per ounce | k | 1,118 | | 1,052 | | 999 | | 1,085 | | 976 | |
| All-in costs per ounce (on a co-product basis) | k,l | 1,149 | | 1,065 | | 1,011 | | 1,107 | | 989 | |
a.Realized (gains) losses on hedge and non-hedge derivatives
Includes realized hedge losses of $nil and $nil, respectively, for the three and six month periods ended June 30, 2020 (March 31, 2020: $nil and June 30, 2019: $nil and $nil, respectively), and realized non-hedge losses of $1 million and $1 million, respectively, for the three and six month periods ended June 30, 2020 (March 31, 2020: $nil and June 30, 2019: gains of $1 million and $1 million, respectively). Refer to note 5 to the Financial Statements for further information.
b.Non-recurring items
Non-recurring items in 2019 relate to organizational restructuring. These costs are not indicative of our cost of production and have been excluded from the calculation of total cash costs.
c.Other
Other adjustments for the three and six month period ended June 30, 2020 include the removal of total cash costs and by-product credits associated with: our Pierina mine; Golden Sunlight and Morila starting in the third quarter of 2019; and Lagunas Norte starting in the fourth quarter of 2019, which all are mining incidental ounces as they enter closure of $26 million and $51 million, respectively, (March 31, 2020: $25 million; June 30, 2019: $19 million and $37 million, respectively, relating to Pierina only).
d.Non-controlling interests
Non-controlling interests include non-controlling interests related to gold production of $495 million and $961 million, respectively, for the three and six month periods ended June 30, 2020 (March 31, 2020: $466 million and June 30, 2019: $171 million and $323 million, respectively). Non-controlling interests include Pueblo Viejo, Loulo-Gounkoto, Tongon, North Mara, Bulyanhulu, Buzwagi (notwithstanding the completion of the Acacia transaction on September 17, 2019, we consolidated our interest in Acacia and recorded a non-controlling interest of 36.1% in the income statement for the entirety of the third quarter of 2019 as a matter of convenience) and Nevada Gold Mines starting July 1, 2019. Refer to note 5 to the Financial Statements for further information.
e.Exploration and evaluation costs
Exploration, evaluation and project expenses are presented as minesite sustaining if it supports current mine operations and project if it relates to future projects. Refer to page 72 of this MD&A.
| | | | | | | | |
| BARRICK SECOND QUARTER 2020 | 82 | MANAGEMENT'S DISCUSSION AND ANALYSIS |
f.Capital expenditures
Capital expenditures are related to our gold sites only and are split between minesite sustaining and project capital expenditures. Project capital expenditures are distinct projects designed to increase the net present value of the mine and are not related to current production. Significant projects in the current year are the expansion project at Pueblo Viejo, the Goldrush exploration declines, the restart of mining activities at Bulyanhulu, and construction of the third shaft at Turquoise Ridge. Refer to page 71 of this MD&A.
g.Rehabilitation—accretion and amortization
Includes depreciation on the assets related to rehabilitation provisions of our gold operations and accretion on the rehabilitation provision of our gold operations, split between operating and non-operating sites.
h.Non-controlling interest and copper operations
Removes general & administrative costs related to non-controlling interests and copper based on a percentage allocation of revenue. Also removes exploration, evaluation and project expenses, rehabilitation costs and capital expenditures incurred by our copper sites and the non-controlling interest of North Mara, Bulyanhulu and Buzwagi (notwithstanding the completion of the Acacia transaction on September 17, 2019, we consolidated our interest in Acacia and recorded a non-controlling interest of 36.1% in the income statement for the entirety of the third quarter of 2019 as a matter of convenience), Pueblo Viejo, Loulo-Gounkoto and Tongon operating segments and South Arturo (63.1% of South Arturo from July 1, 2019 onwards as a result of its contribution to Nevada Gold Mines). Also removes the non-controlling interest of Nevada Gold Mines starting July 1, 2019. It also includes capital expenditures applicable to equity method investments. Figures remove the impact of Pierina; Golden Sunlight and Morila starting in the third quarter of 2019; and Lagunas Norte starting in the fourth quarter of 2019. The impact is summarized as the following:
| | | | | | | | | | | | | | | | | |
| ($ millions) | For the three months ended | | | For the six months ended | |
| Non-controlling interest, copper operations and other | 6/30/20 | 3/31/20 | 6/30/19 | 6/30/20 | 6/30/19 |
| General & administrative costs | (8) | | (6) | | (23) | | (14) | | (33) | |
| Minesite exploration and evaluation expenses | (8) | | (3) | | 0 | | (11) | | (1) | |
| Rehabilitation - accretion and amortization (operating sites) | (4) | | (4) | | (1) | | (8) | | (2) | |
| Minesite sustaining capital expenditures | (138) | | (112) | | (52) | | (250) | | (115) | |
| All-in sustaining costs total | (158) | | (125) | | (76) | | (283) | | (151) | |
| Project exploration and evaluation and project costs | (9) | | (3) | | (26) | | (12) | | (28) | |
| Project capital expenditures | (27) | | (14) | | (2) | | (41) | | (3) | |
| All-in costs total | (36) | | (17) | | (28) | | (53) | | (31) | |
i.Ounces sold - equity basis
Figures remove the impact of: Pierina; Golden Sunlight and Morila starting in the third quarter of 2019; and Lagunas Norte starting in the fourth quarter of 2019, which are producing incidental ounces as they reach the end of their mine lives.
j.Cost of sales per ounce
Figures remove the cost of sales impact of: Pierina of $4 million and $10 million, respectively, for the three and six month periods ended June 30, 2020 (March 31, 2020: $6 million and June 30, 2019: $44 million and $71 million, respectively); starting in the third quarter of 2019, Golden Sunlight of $nil and $nil, respectively, for the three and six month periods ended June 30, 2020 (March 31, 2020: $nil and June 30, 2019: $nil and $nil, respectively) and Morila of $8 million and $14 million, respectively, for the three and six month periods ended June 30, 2020 (March 31, 2020: $6 million and June 30, 2019: $nil and $nil, respectively); and starting in the fourth quarter of 2019, Lagunas Norte of $23 million and $43 million, respectively, for the three and six month periods ended June 30, 2020 (March 31, 2020: $21 million and June 30, 2019: $nil and $nil, respectively), which are mining incidental ounces as these sites enter closure. Cost of sales per ounce excludes non-controlling interest related to gold production. Cost of sales applicable to gold per ounce is calculated using cost of sales on an attributable basis (removing the non-controlling interest of 40% Pueblo Viejo, 20% of Loulo-Gounkoto, 10.3% of Tongon, 16% North Mara, Bulyanhulu and Buzwagi starting January 1, 2020, the effective date of the GoT's free carried interest (36.1% up until September 30, 2019; notwithstanding the completion of the Acacia transaction on September 17, 2019, we consolidated our interest in Acacia and recorded a non-controlling interest of 36.1% in the income statement for the entirety of the third quarter of 2019 as a matter of convenience) and 40% South Arturo from cost of sales (63.1% of South Arturo from July 1, 2019 onwards as a result of its contribution to Nevada Gold Mines)), divided by attributable gold ounces. The non-controlling interest of 38.5% Nevada Gold Mines is also removed from cost of sales from July 1, 2019 onwards.
k.Per ounce figures
Cost of sales per ounce, total cash costs per ounce, all-in sustaining costs per ounce and all-in costs per ounce may not calculate based on amounts presented in this table due to rounding.
l.Co-product costs per ounce
Total cash costs per ounce, all-in sustaining costs per ounce and all-in costs per ounce presented on a co-product basis removes the impact of by-product credits of our gold production (net of non-controlling interest) calculated as:
| | | | | | | | | | | | | | | | | |
| ($ millions) | For the three months ended | | | For the six months ended | |
| | 6/30/20 | 3/31/20 | 6/30/19 | 6/30/20 | 6/30/19 |
| By-product credits | 59 | | 29 | | 23 | | 88 | | 47 | |
| Non-controlling interest | (22) | | (15) | | (7) | | (37) | | (15) | |
| By-product credits (net of non-controlling interest) | 37 | | 14 | | 16 | | 51 | | 32 | |
| | | | | | | | |
| BARRICK SECOND QUARTER 2020 | 83 | MANAGEMENT'S DISCUSSION AND ANALYSIS |
Reconciliation of Gold Cost of Sales to Total cash costs, All-in sustaining costs and All-in costs, including on a per ounce basis, by operating site
| | | | | | | | | | | | | | | | | | | | | | | | | | | | | |
| ($ millions, except per ounce information in dollars) | | | | | For the three months ended 6/30/20 | | | | |
| | Footnote | Carlina | Cortezb | Turquoise Ridgec | Long Canyond | Phoenixd | Nevada Gold Minese | Hemlo | North America |
| Cost of sales applicable to gold production | | 395 | | 187 | | 136 | | 63 | | 108 | | 889 | | 68 | | 957 | |
| Depreciation | | (70) | | (56) | | (40) | | (44) | | (27) | | (237) | | (10) | | (247) | |
| By-product credits | | (1) | | 0 | | 0 | | 0 | | (36) | | (37) | | 0 | | (37) | |
| Non-recurring items | f | 0 | | 0 | | 0 | | 0 | | 0 | | 0 | | 0 | | 0 | |
| Other | | 0 | | 0 | | 0 | | 0 | | 0 | | 0 | | 0 | | 0 | |
| Non-controlling interests | | (125) | | (51) | | (37) | | (7) | | (18) | | (238) | | 0 | | (238) | |
| Total cash costs | | 199 | | 80 | | 59 | | 12 | | 27 | | 377 | | 58 | | 435 | |
| General & administrative costs | | 0 | | 0 | | 0 | | 0 | | 0 | | 0 | | 0 | | 0 | |
| Minesite exploration and evaluation costs | g | 7 | | 3 | | 4 | | 3 | | 1 | | 18 | | 0 | | 18 | |
| Minesite sustaining capital expenditures | f | 97 | | 67 | | 5 | | 5 | | 13 | | 193 | | 19 | | 212 | |
| Sustaining leases | | 0 | | 0 | | 0 | | 0 | | 0 | | 0 | | 0 | | 0 | |
| Rehabilitation - accretion and amortization (operating sites) | i | 2 | | 3 | | 0 | | 1 | | 0 | | 6 | | 1 | | 7 | |
| Non-controlling interests | | (41) | | (28) | | (4) | | (3) | | (5) | | (87) | | 0 | | (87) | |
| All-in sustaining costs | | 264 | | 125 | | 64 | | 18 | | 36 | | 507 | | 78 | | 585 | |
| Project exploration and evaluation and project costs | e | 0 | | 0 | | 0 | | 0 | | 0 | | 0 | | 0 | | 0 | |
| Project capital expenditures | f | 0 | | 17 | | 8 | | 0 | | 0 | | 57 | | 0 | | 57 | |
| | | | | | | | | |
| Non-controlling interests | | 0 | | (7) | | (2) | | 0 | | 0 | | (20) | | 0 | | (20) | |
| All-in costs | | 264 | | 135 | | 70 | | 18 | | 36 | | 544 | | 78 | | 622 | |
| Ounces sold - equity basis (000s ounces) | | 234 | | 132 | | 79 | | 38 | | 39 | | 522 | | 54 | | 576 | |
| Cost of sales per ounce | j,k | 1,037 | | 870 | | 1,073 | | 1,009 | | 1,726 | | 1,055 | | 1,268 | | 1,075 | |
| Total cash costs per ounce | k | 850 | | 613 | | 753 | | 308 | | 725 | | 728 | | 1,080 | | 761 | |
| Total cash costs per ounce (on a co-product basis) | k,l | 851 | | 613 | | 753 | | 308 | | 1,293 | | 797 | | 1,087 | | 824 | |
| All-in sustaining costs per ounce | k | 1,130 | | 950 | | 829 | | 430 | | 957 | | 985 | | 1,456 | | 1,029 | |
| All-in sustaining costs per ounce (on a co-product basis) | k,l | 1,131 | | 950 | | 829 | | 430 | | 1,525 | | 1,054 | | 1,463 | | 1,092 | |
| All-in costs per ounce | k | 1,130 | | 1,031 | | 894 | | 430 | | 957 | | 1,052 | | 1,456 | | 1,090 | |
| All-in costs per ounce (on a co-product basis) | k,l | 1,131 | | 1,031 | | 894 | | 430 | | 1,525 | | 1,121 | | 1,463 | | 1,153 | |
| | | | | | | | | |
| | | | | | | | | |
| | | | | | | | | |
| | | | | | | | |
| BARRICK SECOND QUARTER 2020 | 84 | MANAGEMENT'S DISCUSSION AND ANALYSIS |
| | | | | | | | | | | | | | | | | |
| ($ millions, except per ounce information in dollars) | | | | For the three months ended 6/30/20 | |
| | Footnote | Pueblo Viejo | Veladero | Porgera | Latin America & Asia Pacific |
| Cost of sales applicable to gold production | | 178 | | 43 | | 26 | | 247 | |
| Depreciation | | (54) | | (13) | | (6) | | (73) | |
| By-product credits | | (13) | | (1) | | (1) | | (15) | |
| Non-recurring items | f | 0 | | 0 | | 0 | | 0 | |
| Other | | 0 | | 0 | | 0 | | 0 | |
| Non-controlling interests | | (44) | | 0 | | 0 | | (44) | |
| Total cash costs | | 67 | | 29 | | 19 | | 115 | |
| General & administrative costs | | 0 | | 0 | | 0 | | 0 | |
| Minesite exploration and evaluation costs | g | 0 | | 0 | | 0 | | 0 | |
| Minesite sustaining capital expenditures | h | 26 | | 20 | | 2 | | 48 | |
| Sustaining leases | | 0 | | 1 | | 1 | | 2 | |
| Rehabilitation - accretion and amortization (operating sites) | i | 2 | | 1 | | 0 | | 3 | |
| Non-controlling interests | | (11) | | 0 | | 0 | | (11) | |
| All-in sustaining costs | | 84 | | 51 | | 22 | | 157 | |
| Project exploration and evaluation and project costs | e | 0 | | 0 | | 0 | | 0 | |
| Project capital expenditures | h | 9 | | 0 | | 0 | | 9 | |
| | | | | |
| Non-controlling interests | | (3) | | 0 | | 0 | | (3) | |
| All-in costs | | 90 | | 51 | | 22 | | 163 | |
| Ounces sold - equity basis (000s ounces) | | 115 | | 35 | | 24 | | 174 | |
| Cost of sales per ounce | j,k | 935 | | 1,228 | | 1,141 | | 1,023 | |
| Total cash costs per ounce | k | 579 | | 801 | | 875 | | 664 | |
| Total cash costs per ounce (on a co-product basis) | k,l | 649 | | 840 | | 884 | | 743 | |
| All-in sustaining costs per ounce | k | 720 | | 1,383 | | 1,046 | | 900 | |
| All-in sustaining costs per ounce (on a co-product basis) | k,l | 790 | | 1,422 | | 1,055 | | 979 | |
| All-in costs per ounce | k | 763 | | 1,383 | | 1,046 | | 929 | |
| All-in costs per ounce (on a co-product basis) | k,l | 833 | | 1,422 | | 1,055 | | 1,008 | |
| | | | | | | | |
| BARRICK SECOND QUARTER 2020 | 85 | MANAGEMENT'S DISCUSSION AND ANALYSIS |
| | | | | | | | | | | | | | | | | | | | | | | | | | |
| ($ millions, except per ounce information in dollars) | | | | For the three months ended 6/30/20 | | | | |
| | Footnote | Loulo-Gounkoto | Kibali | North Maran | Tongon | Bulyanhulun | Buzwagin | Africa & Middle East |
| Cost of sales applicable to gold production | | 200 | | 101 | | 84 | | 96 | | 60 | | 61 | | 602 | |
| Depreciation | | (74) | | (42) | | (25) | | (45) | | (23) | | (2) | | (211) | |
| By-product credits | | 0 | | (1) | | 0 | | 0 | | (4) | | (9) | | (14) | |
| Non-recurring items | f | 0 | | 0 | | 0 | | 0 | | 0 | | 0 | | 0 | |
| Other | | 0 | | 0 | | 0 | | 0 | | 0 | | 0 | | 0 | |
| Non-controlling interests | | (25) | | 0 | | (9) | | (5) | | (5) | | (8) | | (52) | |
| Total cash costs | | 101 | | 58 | | 50 | | 46 | | 28 | | 42 | | 325 | |
| General & administrative costs | | 0 | | 0 | | 0 | | 0 | | 0 | | 0 | | 0 | |
| Minesite exploration and evaluation costs | g | 4 | | 1 | | 0 | | 1 | | 0 | | 0 | | 6 | |
| Minesite sustaining capital expenditures | h | 70 | | 9 | | 34 | | 3 | | 3 | | 1 | | 120 | |
| Sustaining leases | | 2 | | 2 | | 0 | | 1 | | 0 | | 1 | | 6 | |
| Rehabilitation - accretion and amortization (operating sites) | i | 1 | | 1 | | 1 | | 0 | | 0 | | 0 | | 3 | |
| Non-controlling interests | | (16) | | 0 | | (6) | | (1) | | (1) | | 0 | | (24) | |
| All-in sustaining costs | | 162 | | 71 | | 79 | | 50 | | 30 | | 44 | | 436 | |
| Project exploration and evaluation and project costs | e | 0 | | 0 | | 0 | | 0 | | 0 | | 0 | | 0 | |
| Project capital expenditures | h | 0 | | 1 | | 2 | | 0 | | 7 | | 0 | | 10 | |
| | | | | | | | |
| Non-controlling interests | | 0 | | 0 | | (1) | | 0 | | (1) | | 0 | | (2) | |
| All-in costs | | 162 | | 72 | | 80 | | 50 | | 36 | | 44 | | 444 | |
| Ounces sold - equity basis (000s ounces) | | 157 | | 96 | | 67 | | 68 | | 30 | | 56 | | 474 | |
| Cost of sales per ounce | j,k | 1,012 | | 1,067 | | 1,040 | | 1,275 | | 1,658 | | 909 | | 1,094 | |
| Total cash costs per ounce | k | 639 | | 617 | | 724 | | 688 | | 950 | | 751 | | 687 | |
| Total cash costs per ounce (on a co-product basis) | k,l | 639 | | 620 | | 730 | | 689 | | 1,030 | | 865 | | 711 | |
| All-in sustaining costs per ounce | k | 1,030 | | 739 | | 1,166 | | 745 | | 1,014 | | 770 | | 919 | |
| All-in sustaining costs per ounce (on a co-product basis) | k,l | 1,030 | | 742 | | 1,172 | | 746 | | 1,094 | | 884 | | 943 | |
| All-in costs per ounce | k | 1,030 | | 750 | | 1,195 | | 745 | | 1,214 | | 770 | | 938 | |
| All-in costs per ounce (on a co-product basis) | k,l | 1,030 | | 753 | | 1,201 | | 746 | | 1,294 | | 884 | | 962 | |
| | | | | | | | |
| BARRICK SECOND QUARTER 2020 | 86 | MANAGEMENT'S DISCUSSION AND ANALYSIS |
| | | | | | | | | | | | | | | | | | | | | | | | | | | | | |
| ($ millions, except per ounce information in dollars) | | | | | For the three months ended 3/31/20 | | | | |
| | Footnote | Carlina | Cortezb | Turquoise Ridgec | Long Canyond | Phoenixd | Nevada Gold Minese | Hemlo | North America |
| Cost of sales applicable to gold production | | 404 | | 182 | | 147 | | 45 | | 78 | | 856 | | 65 | | 921 | |
| Depreciation | | (80) | | (54) | | (51) | | (30) | | (22) | | (237) | | (10) | | (247) | |
| By-product credits | | 0 | | 0 | | (1) | | 0 | | (20) | | (21) | | 0 | | (21) | |
| Non-recurring items | f | 0 | | 0 | | 0 | | 0 | | 0 | | 0 | | 0 | | 0 | |
| Other | | 0 | | 0 | | 0 | | 0 | | 0 | | 0 | | 0 | | 0 | |
| Non-controlling interests | | (125) | | (49) | | (37) | | (6) | | (14) | | (231) | | 0 | | (231) | |
| Total cash costs | | 199 | | 79 | | 58 | | 9 | | 22 | | 367 | | 55 | | 422 | |
| General & administrative costs | | 0 | | 0 | | 0 | | 0 | | 0 | | 0 | | 0 | | 0 | |
| Minesite exploration and evaluation costs | g | 3 | | 2 | | 1 | | 1 | | 0 | | 7 | | 0 | | 7 | |
| Minesite sustaining capital expenditures | f | 91 | | 76 | | 18 | | 8 | | 7 | | 209 | | 19 | | 228 | |
| Sustaining leases | | 0 | | 0 | | 0 | | 0 | | 0 | | 0 | | 0 | | 0 | |
| Rehabilitation - accretion and amortization (operating sites) | i | 2 | | 4 | | 0 | | 0 | | 1 | | 7 | | 0 | | 7 | |
| Non-controlling interests | | (37) | | (32) | | (7) | | (4) | | (3) | | (83) | | 0 | | (83) | |
| All-in sustaining costs | | 258 | | 129 | | 70 | | 14 | | 27 | | 507 | | 74 | | 581 | |
| Project exploration and evaluation and project costs | e | 0 | | 0 | | 0 | | 0 | | 0 | | 0 | | 0 | | 0 | |
| Project capital expenditures | f | 0 | | 6 | | 14 | | 0 | | 0 | | 35 | | 0 | | 35 | |
| | | | | | | | | |
| Non-controlling interests | | 0 | | (2) | | (6) | | 0 | | 0 | | (13) | | 0 | | (13) | |
| All-in costs | | 258 | | 133 | | 78 | | 14 | | 27 | | 529 | | 74 | | 603 | |
| Ounces sold - equity basis (000s ounces) | | 256 | | 128 | | 87 | | 27 | | 30 | | 528 | | 58 | | 586 | |
| Cost of sales per ounce | j,k | 970 | | 876 | | 1,032 | | 1,025 | | 1,583 | | 995 | | 1,119 | | 1,007 | |
| Total cash costs per ounce | k | 776 | | 614 | | 668 | | 345 | | 737 | | 690 | | 945 | | 720 | |
| Total cash costs per ounce (on a co-product basis) | k,l | 777 | | 614 | | 672 | | 347 | | 1,140 | | 730 | | 945 | | 757 | |
| All-in sustaining costs per ounce | k | 1,007 | | 1,009 | | 806 | | 561 | | 914 | | 952 | | 1,281 | | 979 | |
| All-in sustaining costs per ounce (on a co-product basis) | k,l | 1,008 | | 1,009 | | 810 | | 563 | | 1,317 | | 992 | | 1,281 | | 1,016 | |
| All-in costs per ounce | k | 1,007 | | 1,039 | | 903 | | 561 | | 914 | | 993 | | 1,288 | | 1,017 | |
| All-in costs per ounce (on a co-product basis) | k,l | 1,008 | | 1,039 | | 907 | | 563 | | 1,317 | | 1,033 | | 1,288 | | 1,054 | |
| | | | | | | | |
| BARRICK SECOND QUARTER 2020 | 87 | MANAGEMENT'S DISCUSSION AND ANALYSIS |
| | | | | | | | | | | | | | | | | |
| ($ millions, except per ounce information in dollars) | | | | For the three months ended 3/31/20 | |
| | Footnote | Pueblo Viejo | Veladero | Porgera | Latin America & Asia Pacific |
| Cost of sales applicable to gold production | | 185 | | 67 | | 70 | | 322 | |
| Depreciation | | (53) | | (22) | | (10) | | (85) | |
| By-product credits | | (12) | | (1) | | 0 | | (13) | |
| Non-recurring items | f | 0 | | 0 | | 0 | | 0 | |
| Other | | 0 | | 0 | | 0 | | 0 | |
| Non-controlling interests | | (48) | | 0 | | 0 | | (48) | |
| Total cash costs | | 72 | | 44 | | 60 | | 176 | |
| General & administrative costs | | 0 | | 0 | | 0 | | 0 | |
| Minesite exploration and evaluation costs | g | 0 | | 0 | | 1 | | 1 | |
| Minesite sustaining capital expenditures | h | 28 | | 25 | | 8 | | 61 | |
| Sustaining leases | | 0 | | 0 | | 1 | | 1 | |
| Rehabilitation - accretion and amortization (operating sites) | i | 1 | | 1 | | 0 | | 2 | |
| Non-controlling interests | | (12) | | 0 | | 0 | | (12) | |
| All-in sustaining costs | | 89 | | 70 | | 70 | | 229 | |
| Project exploration and evaluation and project costs | e | 2 | | 0 | | 0 | | 2 | |
| Project capital expenditures | h | 0 | | 15 | | 0 | | 15 | |
| | | | | |
| Non-controlling interests | | (1) | | 0 | | 0 | | (1) | |
| All-in costs | | 90 | | 85 | | 70 | | 245 | |
| Ounces sold - equity basis (000s ounces) | | 144 | | 57 | | 63 | | 264 | |
| Cost of sales per ounce | j,k | 767 | | 1,182 | | 1,097 | | 935 | |
| Total cash costs per ounce | k | 502 | | 788 | | 941 | | 668 | |
| Total cash costs per ounce (on a co-product basis) | k,l | 548 | | 806 | | 946 | | 718 | |
| All-in sustaining costs per ounce | k | 626 | | 1,266 | | 1,089 | | 874 | |
| All-in sustaining costs per ounce (on a co-product basis) | k,l | 672 | | 1,284 | | 1,094 | | 924 | |
| All-in costs per ounce | k | 635 | | 1,537 | | 1,089 | | 934 | |
| All-in costs per ounce (on a co-product basis) | k,l | 681 | | 1,555 | | 1,094 | | 984 | |
| | | | | | | | |
| BARRICK SECOND QUARTER 2020 | 88 | MANAGEMENT'S DISCUSSION AND ANALYSIS |
| | | | | | | | | | | | | | | | | | | | | | | | | | |
| ($ millions, except per ounce information in dollars) | | | | For the three months ended 3/31/20 | | | | |
| | Footnote | Loulo-Gounkoto | Kibali | North Maran | Tongon | Bulyanhulun | Buzwagin | Africa & Middle East |
| Cost of sales applicable to gold production | | 153 | | 93 | | 79 | | 89 | | 14 | | 39 | | 467 | |
| Depreciation | | (59) | | (41) | | (25) | | (39) | | (8) | | (3) | | (175) | |
| By-product credits | | 0 | | 0 | | (1) | | 0 | | 0 | | 0 | | (1) | |
| Non-recurring items | f | 0 | | 0 | | 0 | | 0 | | 0 | | 0 | | 0 | |
| Other | | 0 | | 0 | | 0 | | 0 | | 0 | | 0 | | 0 | |
| Non-controlling interests | | (19) | | 0 | | (9) | | (5) | | (1) | | (6) | | (40) | |
| Total cash costs | | 75 | | 52 | | 44 | | 45 | | 5 | | 30 | | 251 | |
| General & administrative costs | | 0 | | 0 | | 0 | | 0 | | 0 | | 0 | | 0 | |
| Minesite exploration and evaluation costs | g | 2 | | 1 | | 0 | | 1 | | 0 | | 0 | | 4 | |
| Minesite sustaining capital expenditures | h | 39 | | 15 | | 14 | | 1 | | 1 | | 0 | | 70 | |
| Sustaining leases | | 0 | | 0 | | 0 | | 0 | | 0 | | 0 | | 0 | |
| Rehabilitation - accretion and amortization (operating sites) | i | 1 | | 0 | | 1 | | 0 | | 0 | | 0 | | 2 | |
| Non-controlling interests | | (8) | | 0 | | (2) | | 0 | | 0 | | 0 | | (10) | |
| All-in sustaining costs | | 109 | | 68 | | 57 | | 47 | | 6 | | 30 | | 317 | |
| Project exploration and evaluation and project costs | e | 0 | | 0 | | 0 | | 0 | | 0 | | 0 | | 0 | |
| Project capital expenditures | h | 0 | | 0 | | 2 | | 0 | | 1 | | 0 | | 3 | |
| | | | | | | | |
| Non-controlling interests | | 0 | | 0 | | 0 | | 0 | | 0 | | 0 | | 0 | |
| All-in costs | | 109 | | 68 | | 59 | | 47 | | 7 | | 30 | | 320 | |
| Ounces sold - equity basis (000s ounces) | | 123 | | 88 | | 70 | | 58 | | 7 | | 24 | | 370 | |
| Cost of sales per ounce | j,k | 1,002 | | 1,045 | | 959 | | 1,368 | | 1,685 | | 1,373 | | 1,099 | |
| Total cash costs per ounce | k | 614 | | 582 | | 646 | | 762 | | 686 | | 1,275 | | 680 | |
| Total cash costs per ounce (on a co-product basis) | k,l | 614 | | 585 | | 653 | | 763 | | 709 | | 1,282 | | 684 | |
| All-in sustaining costs per ounce | k | 891 | | 773 | | 816 | | 788 | | 906 | | 1,288 | | 859 | |
| All-in sustaining costs per ounce (on a co-product basis) | k,l | 891 | | 776 | | 823 | | 789 | | 929 | | 1,295 | | 863 | |
| All-in costs per ounce | k | 891 | | 773 | | 838 | | 788 | | 1,038 | | 1,288 | | 865 | |
| All-in costs per ounce (on a co-product basis) | k,l | 891 | | 776 | | 845 | | 789 | | 1,061 | | 1,295 | | 869 | |
| | | | | | | | |
| BARRICK SECOND QUARTER 2020 | 89 | MANAGEMENT'S DISCUSSION AND ANALYSIS |
| | | | | | | | | | | | | | | | | | | | | | | | | | | | | | | | | | | | | | | | |
| ($ millions, except per ounce information in dollars) | | | | | | | For the three months ended 6/30/19 | | | | | | | | | |
| | Footnote | Carlina | Cortezb | Turquoise Ridgec | Nevada Gold Minese | Hemlo | Golden Sunlighto | Pueblo Viejo | Veladero | Porgera | Kalgoorlie | | | | | |
| Cost of sales applicable to gold production | | 203 | | 202 | | 57 | | 462 | | 52 | | 12 | | 188 | | 88 | | 65 | | 57 | | | | | | |
| Depreciation | | (53) | | (65) | | (9) | | (127) | | (7) | | (2) | | (47) | | (31) | | (8) | | (11) | | | | | | |
| By-product credits | | 0 | | 0 | | 0 | | 0 | | 0 | | 0 | | (16) | | (2) | | 0 | | 0 | | | | | | |
| | | | | | | | | | | | | | | | |
| Non-recurring items | f | (9) | | 0 | | 0 | | (9) | | 0 | | 0 | | 0 | | 1 | | 0 | | 0 | | | | | | |
| Other | | 0 | | 0 | | 0 | | 0 | | 0 | | 0 | | 0 | | 0 | | 0 | | 0 | | | | | | |
| Non-controlling interests | | (1) | | 0 | | 0 | | (1) | | 0 | | 0 | | (50) | | 0 | | 0 | | 0 | | | | | | |
| Total cash costs | | 140 | | 137 | | 48 | | 325 | 45 | | 10 | | 75 | | 56 | | 57 | | 46 | | | | | | |
| General & administrative costs | | 0 | | 0 | | 0 | | 0 | | 0 | | 0 | | 0 | | 0 | | 0 | | 0 | | | | | | |
| Minesite exploration and evaluation costs | g | 2 | | 1 | | 1 | | 4 | | 1 | | 0 | | 0 | | 1 | | 1 | | 1 | | | | | | |
| Minesite sustaining capital expenditures | h | 58 | | 15 | | 7 | | 80 | | 9 | | 1 | | 30 | | 19 | | 12 | | 16 | | | | | | |
| Sustaining leases | | 0 | | 0 | | 0 | | 0 | | 0 | | 0 | | 0 | | 0 | | 0 | | 1 | | | | | | |
| Rehabilitation - accretion and amortization (operating sites) | i | 1 | | 4 | | 0 | | 5 | | 1 | | 1 | | 1 | | 2 | | 1 | | 1 | | | | | | |
| Non-controlling interests | | (4) | | 0 | | 0 | | (4) | | 0 | | 0 | | (12) | | 0 | | 0 | | 0 | | | | | | |
| All-in sustaining costs | | 197 | | 157 | | 56 | | 410 | | 56 | | 12 | | 94 | | 78 | | 71 | | 65 | | | | | | |
| Project exploration and evaluation and project costs | e | 0 | | 0 | | 0 | | 0 | | 0 | | 0 | | 3 | | 0 | | 0 | | 0 | | | | | | |
| Project capital expenditures | h | 0 | | 68 | | 12 | | 93 | | 0 | | 0 | | 0 | | 0 | | 0 | | 0 | | | | | | |
| Non-controlling interests | | 0 | | 0 | | 0 | | 0 | | 0 | | 0 | | 0 | | 0 | | 0 | | 0 | | | | | | |
| All-in costs | | 197 | | 225 | | 68 | | 503 | | 56 | | 12 | | 97 | | 78 | | 71 | | 65 | | | | | | |
| Ounces sold - equity basis (000s ounces) | | 181 | | 281 | | 85 | | 547 | | 56 | | 6 | | 132 | | 74 | | 63 | | 55 | | | | | | |
| Cost of sales per ounce | j,k | 1,116 | | 719 | | 665 | | 842 | | 953 | | 2,336 | | 852 | | 1,186 | | 1,032 | | 1,038 | | | | | | |
| Total cash costs per ounce | k | 769 | | 489 | | 569 | | 594 | | 822 | | 2,037 | | 557 | | 746 | | 893 | | 846 | | | | | | |
| Total cash costs per ounce (on a co-product basis) | k,l | 770 | | 490 | | 569 | | 595 | | 825 | | 2,076 | | 631 | | 775 | | 903 | | 847 | | | | | | |
| All-in sustaining costs per ounce | k | 1,088 | | 561 | | 667 | | 752 | | 1,015 | | 2,434 | | 702 | | 1,046 | | 1,112 | | 1,204 | | | | | | |
| All-in sustaining costs per ounce (on a co-product basis) | k,l | 1,089 | | 562 | | 667 | | 753 | | 1,018 | | 2,473 | | 776 | | 1,075 | | 1,122 | | 1,205 | | | | | | |
| All-in costs per ounce | k | 1,088 | | 795 | | 806 | | 922 | | 1,017 | | 2,434 | | 724 | | 1,046 | | 1,112 | | 1,204 | | | | | | |
| All-in costs per ounce (on a co-product basis) | k,l | 1,089 | | 796 | | 806 | | 923 | | 1,020 | | 2,473 | | 798 | | 1,075 | | 1,122 | | 1,205 | | | | | | |
| | | | | | | | | | | | | | | | |
| | | | | | | | | | | | | | | | |
| | | | | | | | | | | | | | | | |
| | | | | | | | |
| BARRICK SECOND QUARTER 2020 | 90 | MANAGEMENT'S DISCUSSION AND ANALYSIS |
| | | | | | | | | | | | | | | | | | | | | | | | | | | | | | |
| ($ millions, except per ounce information in dollars) | | | | For the three months ended 6/30/19 | | | | | | |
| | Footnote | Lagunas Norteo | Loulo-Gounkoto | Kibali | North Maran | Tongon | Bulyanhulun | Buzwagin | | Morilao |
| Cost of sales applicable to gold production | | 37 | | 197 | | 82 | | 81 | | 103 | | 14 | | 38 | | | 19 | |
| Depreciation | | (7) | | (87) | | (31) | | (25) | | (53) | | (7) | | (2) | | | (8) | |
| By-product credits | | (2) | | 0 | | 0 | | (1) | | 0 | | (1) | | 0 | | | 0 | |
| Non-recurring items | f | 0 | | 0 | | 0 | | 0 | | 0 | | 0 | | 0 | | | 0 | |
| Other | | 0 | | 0 | | 0 | | 0 | | 0 | | 0 | | 0 | | | 0 | |
| Non-controlling interests | | 0 | | (22) | | 0 | | (20) | | (5) | | (2) | | (13) | | | 0 | |
| Total cash costs | | 28 | | 88 | | 51 | | 35 | | 45 | | 4 | | 23 | | | 11 | |
| General & administrative costs | | 0 | | 0 | | 0 | | 0 | | 0 | | 0 | | 0 | | | 0 | |
| Minesite exploration and evaluation costs | g | 0 | | 2 | | 1 | | 0 | | 1 | | 0 | | 0 | | | 0 | |
| Minesite sustaining capital expenditures | h | 4 | | 37 | | 10 | | 11 | | 2 | | 1 | | 0 | | | 0 | |
| Sustaining leases | | 3 | | 0 | | 0 | | 0 | | 0 | | 0 | | 1 | | | 0 | |
| Rehabilitation - accretion and amortization (operating sites) | i | 3 | | 0 | | 0 | | 1 | | 0 | | 1 | | 0 | | | 0 | |
| Non-controlling interests | | 0 | | (8) | | 0 | | (4) | | (1) | | (1) | | 0 | | | 0 | |
| All-in sustaining costs | | 38 | | 119 | | 62 | | 43 | | 47 | | 5 | | 24 | | | 11 | |
| Project exploration and evaluation and project costs | e | 0 | | 0 | | 0 | | 0 | | 0 | | 0 | | 0 | | | 0 | |
| Project capital expenditures | h | 0 | | 2 | | 0 | | 4 | | 0 | | 1 | | 0 | | | 0 | |
| Non-controlling interests | | 0 | | 0 | | 0 | | (1) | | 0 | | (1) | | 0 | | | 0 | |
| All-in costs | | 38 | | 121 | | 62 | | 46 | | 47 | | 5 | | 24 | | | 11 | |
| Ounces sold - equity basis (000s ounces) | | 38 | | 148 | | 95 | | 66 | | 59 | | 7 | | 19 | | | 7 | |
| Cost of sales per ounce | j,k | 952 | | 1,072 | | 868 | | 800 | | 1,562 | | 1,217 | | 1,198 | | | 2,585 | |
| Total cash costs per ounce | k | 732 | | 598 | | 540 | | 539 | | 750 | | 525 | | 1,099 | | | 1,446 | |
| Total cash costs per ounce (on a co-product basis) | k,l | 772 | | 598 | | 542 | | 544 | | 752 | | 545 | | 1,105 | | | 1,450 | |
| All-in sustaining costs per ounce | k | 998 | | 811 | | 651 | | 675 | | 802 | | 666 | | 1,150 | | | 1,449 | |
| All-in sustaining costs per ounce (on a co-product basis) | k,l | 1,038 | | 811 | | 653 | | 680 | | 804 | | 686 | | 1,156 | | | 1,453 | |
| All-in costs per ounce | k | 998 | | 821 | | 655 | | 703 | | 803 | | 736 | | 1,150 | | | 1,449 | |
| All-in costs per ounce (on a co-product basis) | k,l | 1,038 | | 821 | | 657 | | 708 | | 805 | | 756 | | 1,156 | | | 1,453 | |
| | | | | | | | | | |
| | | | | | | | |
| BARRICK SECOND QUARTER 2020 | 91 | MANAGEMENT'S DISCUSSION AND ANALYSIS |
| | | | | | | | | | | | | | | | | | | | | | | | | | | | | |
| ($ millions, except per ounce information in dollars) | | | | | For the six months ended 6/30/2020 | | | | |
| | Footnote | Carlina | Cortezb | Turquoise Ridgec | Long Canyond | Phoenixd | Nevada Gold Minese | Hemlo | North America |
| Cost of sales applicable to gold production | | 799 | | 369 | | 283 | | 108 | | 186 | | 1,745 | | 133 | | 1,878 | |
| Depreciation | | (150) | | (110) | | (91) | | (74) | | (49) | | (474) | | (20) | | (494) | |
| By-product credits | | (1) | | 0 | | (1) | | 0 | | (56) | | (58) | | 0 | | (58) | |
| Non-recurring items | f | 0 | | 0 | | 0 | | 0 | | 0 | | 0 | | 0 | | 0 | |
| Other | | 0 | | 0 | | 0 | | 0 | | 0 | | 0 | | 0 | | 0 | |
| Non-controlling interests | | (250) | | (100) | | (74) | | (13) | | (32) | | (469) | | 0 | | (469) | |
| Total cash costs | | 398 | | 159 | | 117 | | 21 | | 49 | | 744 | | 113 | | 857 | |
| General & administrative costs | | 0 | | 0 | | 0 | | 0 | | 0 | | 0 | | 0 | | 0 | |
| Minesite exploration and evaluation costs | g | 10 | | 5 | | 5 | | 4 | | 1 | | 25 | | 0 | | 25 | |
| Minesite sustaining capital expenditures | f | 188 | | 143 | | 23 | | 13 | | 20 | | 402 | | 38 | | 440 | |
| Sustaining leases | | 0 | | 0 | | 0 | | 0 | | 0 | | 0 | | 0 | | 0 | |
| Rehabilitation - accretion and amortization (operating sites) | i | 4 | | 7 | | 0 | | 1 | | 1 | | 13 | | 1 | | 14 | |
| Non-controlling interests | | (78) | | (60) | | (11) | | (7) | | (8) | | (170) | | 0 | | (170) | |
| All-in sustaining costs | | 522 | | 254 | | 134 | | 32 | | 63 | | 1,014 | | 152 | | 1,166 | |
| Project exploration and evaluation and project costs | e | 0 | | 0 | | 0 | | 0 | | 0 | | 0 | | 0 | | 0 | |
| Project capital expenditures | f | 0 | | 23 | | 22 | | 0 | | 0 | | 91 | | 0 | | 91 | |
| | | | | | | | | |
| Non-controlling interests | | 0 | | (9) | | (8) | | 0 | | 0 | | (33) | | 0 | | (33) | |
| All-in costs | | 522 | | 268 | | 148 | | 32 | | 63 | | 1,072 | | 152 | | 1,224 | |
| Ounces sold - equity basis (000s ounces) | | 490 | | 260 | | 166 | | 65 | | 69 | | 1,050 | | 112 | | 1,162 | |
| Cost of sales per ounce | j,k | 1,002 | | 873 | | 1,051 | | 1,016 | | 1,663 | | 1,027 | | 1,191 | | 1,043 | |
| Total cash costs per ounce | k | 812 | | 614 | | 708 | | 323 | | 730 | | 709 | | 1,010 | | 738 | |
| Total cash costs per ounce (on a co-product basis) | k,l | 813 | | 614 | | 710 | | 324 | | 1,225 | | 763 | | 1,014 | | 789 | |
| All-in sustaining costs per ounce | k | 1,066 | | 979 | | 817 | | 484 | | 938 | | 968 | | 1,365 | | 1,006 | |
| All-in sustaining costs per ounce (on a co-product basis) | k,l | 1,067 | | 979 | | 819 | | 485 | | 1,433 | | 1,022 | | 1,369 | | 1,057 | |
| All-in costs per ounce | k | 1,066 | | 1,035 | | 899 | | 484 | | 938 | | 1,022 | | 1,368 | | 1,056 | |
| All-in costs per ounce (on a co-product basis) | k,l | 1,067 | | 1,035 | | 901 | | 485 | | 1,433 | | 1,076 | | 1,372 | | 1,107 | |
| | | | | | | | |
| BARRICK SECOND QUARTER 2020 | 92 | MANAGEMENT'S DISCUSSION AND ANALYSIS |
| | | | | | | | | | | | | | | | | |
| ($ millions, except per ounce information in dollars) | | | | For the six months ended 6/30/2020 | |
| | Footnote | Pueblo Viejo | Veladero | Porgera | Latin America & Asia Pacific |
| Cost of sales applicable to gold production | | 363 | | 110 | | 96 | | 569 | |
| Depreciation | | (107) | | (35) | | (16) | | (158) | |
| By-product credits | | (25) | | (2) | | (1) | | (28) | |
| Non-recurring items | f | 0 | | 0 | | 0 | | 0 | |
| Other | | 0 | | 0 | | 0 | | 0 | |
| Non-controlling interests | | (92) | | 0 | | 0 | | (92) | |
| Total cash costs | | 139 | | 73 | | 79 | | 291 | |
| General & administrative costs | | 0 | | 0 | | 0 | | 0 | |
| Minesite exploration and evaluation costs | g | 0 | | 0 | | 1 | | 1 | |
| Minesite sustaining capital expenditures | h | 54 | | 45 | | 10 | | 109 | |
| Sustaining leases | | 0 | | 1 | | 2 | | 3 | |
| Rehabilitation - accretion and amortization (operating sites) | i | 3 | | 2 | | 0 | | 5 | |
| Non-controlling interests | | (23) | | 0 | | 0 | | (23) | |
| All-in sustaining costs | | 173 | | 121 | | 92 | | 386 | |
| Project exploration and evaluation and project costs | e | 2 | | 0 | | 0 | | 2 | |
| Project capital expenditures | h | 9 | | 15 | | 0 | | 24 | |
| | | | | |
| Non-controlling interests | | (4) | | 0 | | 0 | | (4) | |
| All-in costs | | 180 | | 136 | | 92 | | 408 | |
| Ounces sold - equity basis (000s ounces) | | 259 | | 92 | | 87 | | 438 | |
| Cost of sales per ounce | j,k | 842 | | 1,200 | | 1,109 | | 970 | |
| Total cash costs per ounce | k | 536 | | 793 | | 923 | | 667 | |
| Total cash costs per ounce (on a co-product basis) | k,l | 592 | | 813 | | 929 | | 729 | |
| All-in sustaining costs per ounce | k | 668 | | 1,311 | | 1,077 | | 884 | |
| All-in sustaining costs per ounce (on a co-product basis) | k,l | 724 | | 1,331 | | 1,083 | | 946 | |
| All-in costs per ounce | k | 692 | | 1,477 | | 1,077 | | 932 | |
| All-in costs per ounce (on a co-product basis) | k,l | 748 | | 1,497 | | 1,083 | | 994 | |
| | | | | | | | |
| BARRICK SECOND QUARTER 2020 | 93 | MANAGEMENT'S DISCUSSION AND ANALYSIS |
| | | | | | | | | | | | | | | | | | | | | | | | | | |
| ($ millions, except per ounce information in dollars) | | | | For the six months ended 6/30/2020 | | | | |
| | Footnote | Loulo-Gounkoto | Kibali | North Maran | Tongon | Bulyanhulun | Buzwagin | Africa & Middle East |
| Cost of sales applicable to gold production | | 353 | | 194 | | 163 | | 185 | | 74 | | 100 | | 1,069 | |
| Depreciation | | (133) | | (83) | | (50) | | (84) | | (31) | | (5) | | (386) | |
| By-product credits | | 0 | | (1) | | (1) | | 0 | | (4) | | (9) | | (15) | |
| Non-recurring items | f | 0 | | 0 | | 0 | | 0 | | 0 | | 0 | | 0 | |
| Other | | 0 | | 0 | | 0 | | 0 | | 0 | | 0 | | 0 | |
| Non-controlling interests | | (44) | | 0 | | (18) | | (10) | | (6) | | (14) | | (92) | |
| Total cash costs | | 176 | | 110 | | 94 | | 91 | | 33 | | 72 | | 576 | |
| General & administrative costs | | 0 | | 0 | | 0 | | 0 | | 0 | | 0 | | 0 | |
| Minesite exploration and evaluation costs | g | 6 | | 2 | | 0 | | 2 | | 0 | | 0 | | 10 | |
| Minesite sustaining capital expenditures | h | 109 | | 24 | | 48 | | 4 | | 4 | | 1 | | 190 | |
| Sustaining leases | | 2 | | 2 | | 0 | | 1 | | 0 | | 1 | | 6 | |
| Rehabilitation - accretion and amortization (operating sites) | i | 2 | | 1 | | 2 | | 0 | | 0 | | 0 | | 5 | |
| Non-controlling interests | | (24) | | 0 | | (8) | | (1) | | (1) | | 0 | | (34) | |
| All-in sustaining costs | | 271 | | 139 | | 136 | | 97 | | 36 | | 74 | | 753 | |
| Project exploration and evaluation and project costs | e | 0 | | 0 | | 0 | | 0 | | 0 | | 0 | | 0 | |
| Project capital expenditures | h | 0 | | 1 | | 4 | | 0 | | 8 | | 0 | | 13 | |
| | | | | | | | |
| Non-controlling interests | | 0 | | 0 | | (1) | | 0 | | (1) | | 0 | | (2) | |
| All-in costs | | 271 | | 140 | | 139 | | 97 | | 43 | | 74 | | 764 | |
| Ounces sold - equity basis (000s ounces) | | 280 | | 184 | | 137 | | 126 | | 37 | | 80 | | 844 | |
| Cost of sales per ounce | j,k | 1,007 | | 1,057 | | 999 | | 1,318 | | 1,663 | | 1,048 | | 1,096 | |
| Total cash costs per ounce | k | 628 | | 600 | | 684 | | 722 | | 899 | | 909 | | 684 | |
| Total cash costs per ounce (on a co-product basis) | k,l | 628 | | 603 | | 691 | | 723 | | 968 | | 991 | | 699 | |
| All-in sustaining costs per ounce | k | 968 | | 755 | | 987 | | 765 | | 993 | | 926 | | 892 | |
| All-in sustaining costs per ounce (on a co-product basis) | k,l | 968 | | 758 | | 994 | | 766 | | 1,062 | | 1,008 | | 907 | |
| All-in costs per ounce | k | 969 | | 760 | | 1,013 | | 765 | | 1,180 | | 926 | | 906 | |
| All-in costs per ounce (on a co-product basis) | k,l | 969 | | 763 | | 1,020 | | 766 | | 1,249 | | 1,008 | | 921 | |
| | | | | | | | |
| BARRICK SECOND QUARTER 2020 | 94 | MANAGEMENT'S DISCUSSION AND ANALYSIS |
| | | | | | | | | | | | | | | | | | | | | | | | | | | | | | | | | | | | | | | | |
| ($ millions, except per ounce information in dollars) | | | | | | | For the six months ended 6/30/2019 | | | | | | | | | |
| | Footnote | Carlina | Cortezb | Turquoise Ridgec | Nevada Gold Minese | Hemlo | Golden Sunlighto | Pueblo Viejo | Veladero | Porgera | Kalgoorliem | | | | | |
| Cost of sales applicable to gold production | | 429 | | 379 | | 102 | | 910 | | 105 | | 28 | | 351 | | 169 | | 132 | | 119 | | | | | | |
| Depreciation | | (119) | | (129) | | (15) | | (263) | | (14) | | (3) | | (93) | | (61) | | (19) | | (22) | | | | | | |
| By-product credits | | 0 | | 0 | | 0 | | 0 | | 0 | | 0 | | (32) | | (4) | | (1) | | 0 | | | | | | |
| | | | | | | | | | | | | | | | |
| Non-recurring items | f | (9) | | 0 | | 0 | | (9) | | (1) | | 0 | | (1) | | (1) | | 0 | | 0 | | | | | | |
| Other | | 0 | | 0 | | 0 | | 0 | | 0 | | 0 | | 0 | | 0 | | 0 | | 0 | | | | | | |
| Non-controlling interests | | (1) | | 0 | | 0 | | (1) | | 0 | | 0 | | (91) | | 0 | | 0 | | 0 | | | | | | |
| Total cash costs | | 300 | | 250 | | 87 | | 637 | | 90 | | 25 | | 134 | | 103 | | 112 | | 97 | | | | | | |
| General & administrative costs | | 0 | | 0 | | 0 | | 0 | | 0 | | 0 | | 0 | | 0 | | 0 | | 0 | | | | | | |
| Minesite exploration and evaluation costs | g | 4 | | 3 | | 1 | | 8 | | 1 | | 0 | | 0 | | 1 | | 1 | | 2 | | | | | | |
| Minesite sustaining capital expenditures | h | 113 | | 28 | | 14 | | 155 | | 17 | | 2 | | 57 | | 44 | | 20 | | 31 | | | | | | |
| Sustaining leases | | 0 | | 0 | | 0 | | 0 | | 0 | | 0 | | 0 | | 1 | | 1 | | 3 | | | | | | |
| Rehabilitation - accretion and amortization (operating sites) | i | 2 | | 8 | | 0 | | 10 | | 1 | | 4 | | 3 | | 3 | | 0 | | 2 | | | | | | |
| Non-controlling interests | | (9) | | 0 | | 0 | | (9) | | 0 | | 0 | | (24) | | 0 | | 0 | | 0 | | | | | | |
| All-in sustaining costs | | 410 | | 289 | | 102 | | 801 | | 109 | | 31 | | 170 | | 152 | | 134 | | 135 | | | | | | |
| Project exploration and evaluation and project costs | e | 0 | | 0 | | 0 | | 0 | | 0 | | 0 | | 3 | | 0 | | 0 | | 0 | | | | | | |
| Project capital expenditures | h | 0 | | 131 | | 21 | | 172 | | 0 | | 0 | | 0 | | 15 | | 0 | | 0 | | | | | | |
| Non-controlling interests | | 0 | | 0 | | 0 | | 0 | | 0 | | 0 | | 0 | | 0 | | 0 | | 0 | | | | | | |
| All-in costs | | 410 | | 420 | | 123 | | 973 | | 109 | | 31 | | 173 | | 167 | | 134 | | 135 | | | | | | |
| Ounces sold - equity basis (000s ounces) | | 420 | | 540 | | 161 | | 1,121 | | 114 | | 13 | | 274 | | 142 | | 128 | | 113 | | | | | | |
| Cost of sales per ounce | j,k | 1,020 | | 701 | | 631 | | 811 | | 929 | | 2,244 | | 772 | | 1,190 | | 1,031 | | 1,052 | | | | | | |
| Total cash costs per ounce | k | 713 | | 462 | | 539 | | 567 | | 795 | | 2,001 | | 487 | | 730 | | 873 | | 858 | | | | | | |
| Total cash costs per ounce (on a co-product basis) | k,l | 714 | | 463 | | 539 | | 568 | | 799 | | 2,030 | | 560 | | 756 | | 885 | | 860 | | | | | | |
| All-in sustaining costs per ounce | k | 976 | | 535 | | 632 | | 714 | | 964 | | 2,455 | | 619 | | 1,072 | | 1,044 | | 1,194 | | | | | | |
| All-in sustaining costs per ounce (on a co-product basis) | k,l | 977 | | 536 | | 632 | | 715 | | 968 | | 2,484 | | 692 | | 1,098 | | 1,056 | | 1,196 | | | | | | |
| All-in costs per ounce | k | 976 | | 773 | | 764 | | 868 | | 965 | | 2,455 | | 630 | | 1,180 | | 1,044 | | 1,194 | | | | | | |
| All-in costs per ounce (on a co-product basis) | k,l | 977 | | 774 | | 764 | | 869 | | 969 | | 2,484 | | 703 | | 1,206 | | 1,056 | | 1,196 | | | | | | |
| | | | | | | | | | | | | | | | |
| | | | | | | | | | | | | | | | |
| | | | | | | | | | | | | | | | |
| | | | | | | | |
| BARRICK SECOND QUARTER 2020 | 95 | MANAGEMENT'S DISCUSSION AND ANALYSIS |
| | | | | | | | | | | | | | | | | | | | | | | | | | | | | |
| ($ millions, except per ounce information in dollars) | | | | | | For the six months ended 6/30/2019 | | | |
| | Footnote | Lagunas Norteo | Loulo-Gounkoto | Kibali | North Maran | Tongon | Bulyanhulun | Buzwagin | Morilao |
| Cost of sales applicable to gold production | | 85 | | 366 | | 190 | | 153 | | 201 | | 24 | | 72 | | 33 | |
| Depreciation | | (14) | | (146) | | (87) | | (45) | | (97) | | (11) | | (4) | | (11) | |
| By-product credits | | (4) | | 0 | | 0 | | (1) | | 0 | | (1) | | 0 | | 0 | |
| Non-recurring items | f | (15) | | 0 | | 0 | | 0 | | 0 | | 0 | | 0 | | 0 | |
| Other | | 0 | | 0 | | 0 | | 0 | | 0 | | 0 | | 0 | | 0 | |
| Non-controlling interests | | 0 | | (44) | | 0 | | (39) | | (11) | | (4) | | (24) | | 0 | |
| Total cash costs | | 52 | | 176 | | 103 | | 68 | | 93 | | 8 | | 44 | | 22 | |
| General & administrative costs | | 0 | | 0 | | 0 | | 0 | | 0 | | 0 | | 0 | | 0 | |
| Minesite exploration and evaluation costs | g | 1 | | 4 | | 1 | | 0 | | 2 | | 0 | | 0 | | 0 | |
| Minesite sustaining capital expenditures | h | 11 | | 59 | | 19 | | 20 | | 4 | | 1 | | 0 | | 0 | |
| Sustaining leases | | 8 | | 1 | | 0 | | 0 | | 0 | | 0 | | 1 | | 0 | |
| Rehabilitation - accretion and amortization (operating sites) | i | 5 | | 0 | | 0 | | 2 | | 0 | | 1 | | 0 | | 0 | |
| Non-controlling interests | | 0 | | (13) | | 0 | | (8) | | (1) | | (1) | | 0 | | 0 | |
| All-in sustaining costs | | 77 | | 227 | | 123 | | 82 | | 98 | | 9 | | 45 | | 22 | |
| Project exploration and evaluation and project costs | e | 0 | | 0 | | 0 | | 0 | | 0 | | 0 | | 0 | | 0 | |
| Project capital expenditures | h | 0 | | 2 | | 1 | | 6 | | 0 | | 2 | | 0 | | 0 | |
| Non-controlling interests | | 0 | | 0 | | 0 | | (2) | | 0 | | (1) | | 0 | | 0 | |
| All-in costs | | 77 | | 229 | | 124 | | 86 | | 98 | | 10 | | 45 | | 22 | |
| Ounces sold - equity basis (000s ounces) | | 75 | | 276 | | 185 | | 109 | | 120 | | 13 | | 37 | | 17 | |
| Cost of sales per ounce | j,k | 1,123 | | 1,063 | | 1,030 | | 905 | | 1,506 | | 1,113 | | 1,219 | | 1,940 | |
| Total cash costs per ounce | k | 686 | | 638 | | 556 | | 625 | | 775 | | 573 | | 1,130 | | 1,282 | |
| Total cash costs per ounce (on a co-product basis) | k,l | 739 | | 638 | | 559 | | 631 | | 777 | | 596 | | 1,137 | | 1,285 | |
| All-in sustaining costs per ounce | k | 1,008 | | 824 | | 665 | | 782 | | 819 | | 711 | | 1,187 | | 1,284 | |
| All-in sustaining costs per ounce (on a co-product basis) | k,l | 1,061 | | 824 | | 668 | | 788 | | 821 | | 734 | | 1,194 | | 1,287 | |
| All-in costs per ounce | k | 1,005 | | 830 | | 669 | | 815 | | 822 | | 809 | | 1,187 | | 1,284 | |
| All-in costs per ounce (on a co-product basis) | k,l | 1,058 | | 830 | | 672 | | 821 | | 824 | | 832 | | 1,194 | | 1,287 | |
a.On July 1, 2019, Barrick's Goldstrike and Newmont's Carlin were contributed to Nevada Gold Mines and are now referred to as Carlin. As a result, the amounts presented represent Goldstrike on a 100% basis (including our 60% share of South Arturo) up until June 30, 2019, and the combined results of Carlin and Goldstrike (including our 60% share of South Arturo) on a 61.5% basis thereafter.
b.On July 1, 2019, Cortez was contributed to Nevada Gold Mines, a joint venture with Newmont. As a result, the amounts presented are on a 100% basis up until June 30, 2019, and on a 61.5% basis thereafter.
c.Barrick owned 75% of Turquoise Ridge through to the end of the second quarter of 2019, with our joint venture partner, Newmont, owning the remaining 25%. Turquoise Ridge was proportionately consolidated on the basis that the joint venture partners that have joint control have rights to the assets and obligations for the liabilities relating to the arrangement. The figures presented in this table are based on our 75% interest in Turquoise Ridge until June 30, 2019. On July 1, 2019, Barrick's 75% interest in Turquoise Ridge as well as Newmont's Twin Creeks and 25% interest in Turquoise Ridge were contributed to Nevada Gold Mines. Starting July 1, 2019, the results represent our 61.5% share of Turquoise Ridge and Twin Creeks, now referred to as Turquoise Ridge.
d.These sites were acquired as a result of the formation of Nevada Gold Mines on July 1, 2019. The results for the three months ended March 31, 2019 did not form a part of the Barrick consolidated results as these sites were acquired as a result of the formation of Nevada Gold Mines. Therefore, no comparative figures are provided.
| | | | | | | | |
| BARRICK SECOND QUARTER 2020 | 96 | MANAGEMENT'S DISCUSSION AND ANALYSIS |
e.Represents the combined results of Cortez, Goldstrike (including our 60% share of South Arturo) and our 75% interest in Turquoise Ridge until June 30, 2019. Commencing July 1, 2019, the date Nevada Gold Mines was established, the results represent our 61.5% interest in Cortez, Carlin (including Goldstrike and 60% of South Arturo), Turquoise Ridge (including Twin Creeks), Phoenix and Long Canyon.
f.Non-recurring items
Non-recurring items in 2019 relate to organizational restructuring. These costs are not indicative of our cost of production and have been excluded from the calculation of total cash costs.
g.Exploration and evaluation costs
Exploration, evaluation and project expenses are presented as minesite sustaining if it supports current mine operations and project if it relates to future projects. Refer to page 72 of this MD&A.
h.Capital expenditures
Capital expenditures are related to our gold sites only and are split between minesite sustaining and project capital expenditures. Project capital expenditures are distinct projects designed to increase the net present value of the mine and are not related to current production. Significant projects in the current year are the expansion project at Pueblo Viejo, the Goldrush exploration declines, the restart of mining activities at Bulyanhulu, and construction of the third shaft at Turquoise Ridge. Refer to page 71 of this MD&A.
i.Rehabilitation - accretion and amortization
Includes depreciation on the assets related to rehabilitation provisions of our gold operations and accretion on the rehabilitation provision of our gold operations, split between operating and non-operating sites.
j.Cost of sales per ounce
Cost of sales applicable to gold per ounce is calculated using cost of sales on an attributable basis (removing the non-controlling interest of 40% Pueblo Viejo, 20% Loulo-Gounkoto, 10.3% Tongon, 16% North Mara, Bulyanhulu and Buzwagi starting January 1, 2020, the date the GoT's 16% free carried interest was made effective (36.1% until September 30, 2019; notwithstanding the completion of the Acacia transaction on September 17, 2019, we consolidated our interest in Acacia and recorded a non-controlling interest of 36.1% in the income statement for the entirety of the third quarter of 2019 as a matter of convenience) and 40% South Arturo from cost of sales (63.1% of South Arturo from July 1, 2019 onwards as a result of its contribution to Nevada Gold Mines)), divided by attributable gold ounces. The non-controlling interest of 38.5% Nevada Gold Mines is also removed from cost of sales from July 1, 2019 onwards.
k.Per ounce figures
Cost of sales per ounce, total cash costs per ounce, all-in sustaining costs per ounce and all-in costs per ounce may not calculate based on amounts presented in this table due to rounding.
l.Co-product costs per ounce
Total cash costs per ounce, all-in sustaining costs per ounce and all-in costs per ounce presented on a co-product basis removes the impact of by-product credits of our gold production (net of non-controlling interest) calculated as:
| | | | | | | | | | | | | | | | | | | | | | | | | | | | | |
| ($ millions) | For the three months ended 6/30/20 | | | | | | | | |
| | Carlina | Cortezb | Turquoise Ridgec | Long Canyond | Phoenixd | Nevada Gold Minese | Hemlo | Pueblo Viejo | Veladero |
| By-product credits | 1 | | 0 | | 0 | | 0 | | 36 | | 37 | | 0 | | 13 | | 1 | |
| Non-controlling interest | 0 | | 0 | | 0 | | 0 | | (13) | | (13) | | 0 | | (6) | | 0 | |
| By-product credits (net of non-controlling interest) | 1 | | 0 | | 0 | | 0 | | 23 | | 24 | | 0 | | 7 | | 1 | |
| | | | | | | | | |
| ($ millions) | For the three months ended 6/30/20 | | | | | | | | |
| | Porgera | Loulo-Gounkoto | Kibali | North Maran | Tongon | Bulyanhulun | Buzwagin | | |
| By-product credits | 1 | | 0 | | 1 | | 0 | | 0 | | 4 | | 9 | | |
| Non-controlling interest | 0 | | 0 | | 0 | | 0 | | 0 | | (1) | | (1) | | |
| By-product credits (net of non-controlling interest) | 1 | | 0 | | 1 | | 0 | | 0 | | 3 | | 8 | | | |
| | | | | | | | | |
| ($ millions) | For the three months ended 3/31/20 | | | | | | | | |
| | Carlina | Cortezb | Turquoise Ridgec | Long Canyond | Phoenixd | Nevada Gold Minese | Hemlo | Pueblo Viejo | Veladero |
| By-product credits | 0 | | 0 | | 1 | | 0 | | 20 | | 21 | | 0 | | 12 | | 1 | |
| Non-controlling interest | 0 | | 0 | | 0 | | 0 | | (8) | | (8) | | 0 | | (5) | | 0 | |
| By-product credits (net of non-controlling interest) | 0 | | 0 | | 1 | | 0 | | 12 | | 13 | | 0 | | 7 | | 1 | |
| | | | | | | | | |
| ($ millions) | For the three months ended 3/31/20 | | | | | | | | |
| | Porgera | Loulo-Gounkoto | Kibali | North Maran | Tongon | Bulyanhulun | Buzwagin | | |
| By-product credits | 0 | | 0 | | 0 | | 1 | | 0 | | 0 | | 0 | | | |
| Non-controlling interest | 0 | | 0 | | 0 | | 0 | | 0 | | 0 | | 0 | | | |
| By-product credits (net of non-controlling interest) | 0 | | 0 | | 0 | | 1 | | 0 | | 0 | | 0 | | | |
| | | | | | | | | |
| | | | | | | | | |
| | | | | | | | | |
| | | | | | | | | |
| | | | | | | | | |
| | | | | | | | | |
| | | | | | | | | |
| | | | | | | | | |
| | | | | | | | | |
| | | | | | | | | |
| | | | | | | | | |
| | | | | | | | | |
| | | | | | | | | |
| | | | | | | | | |
| | | | | | | | | |
| | | | | | | | | |
| | | | | | | | | |
| | | | | | | | | |
| | | | | | | | | |
| | | | | | | | | |
| | | | | | | | | |
| | | | | | | | | |
| | | | | | | | | |
| | | | | | | | | |
| | | | | | | | | |
| | | | | | | | | |
| | | | | | | | | |
| | | | | | | | | |
| | | | | | | | |
| BARRICK SECOND QUARTER 2020 | 97 | MANAGEMENT'S DISCUSSION AND ANALYSIS |
| | | | | | | | | | | | | | | | | | | | | | | | | | | | | | | | |
| ($ millions) | For the three months ended 6/30/19 | | | | | | | | | |
| | Carlina | Cortezb | Turquoise Ridgec | Nevada Gold Minese | Hemlo | Golden Sunlighto | Pueblo Viejo | Veladero | Porgera | Kalgoorliem |
| By-product credits | 0 | | 0 | | 0 | | 0 | | 0 | | 0 | | 16 | | 2 | | 0 | | 0 | |
| Non-controlling interest | 0 | | 0 | | 0 | | 0 | | 0 | | 0 | | (6) | | 0 | | 0 | | 0 | |
| By-product credits (net of non-controlling interest) | 0 | | 0 | | 0 | | 0 | | 0 | | 0 | | 10 | | 2 | | 0 | | 0 | |
| | | | | | | | | | |
| ($ millions) | For the three months ended 6/30/19 | | | | | | | | | |
| | Lagunas Norteo | Loulo-Gounkoto | Kibali | North Maran | Tongon | Bulyanhulun | Buzwagin | Morilao | | |
| By-product credits | 2 | | 0 | | 0 | | 1 | | 0 | | 1 | | 0 | | 0 | | | |
| Non-controlling interest | 0 | | 0 | | 0 | | (1) | | 0 | | 0 | | 0 | | 0 | | | |
| By-product credits (net of non-controlling interest) | 2 | | 0 | | 0 | | 0 | | 0 | | 1 | | 0 | | 0 | | | |
| | | | | | | | | | |
| | | | | | | | | | |
| | | | | | | | | | |
| | | | | | | | | | |
| | | | | | | | | | |
| | | | | | | | | | |
| | | | | | | | | | |
| | | | | | | | | | |
| | | | | | | | | | |
| | | | | | | | | | |
| | | | | | | | | | |
| | | | | | | | | | |
| | | | | | | | | | |
| | | | | | | | | | |
| | | | | | | | | | |
| | | | | | | | | | |
| | | | | | | | | | |
| | | | | | | | | | |
| | | | | | | | | | |
| | | | | | | | | | |
| | | | | | | | | | |
| | | | | | | | | | |
| | | | | | | | | | |
| | | | | | | | | | |
| | | | | | | | | | | | | | | | | | | | | | | | | | | | | |
| | | | | | | | | |
| | | | | | | | | |
| | | | | | | | | |
| | | | | | | | | |
| | | | | | | | | |
| | | | | | | | | |
| | | | | | | | | |
| | | | | | | | | |
| | | | | | | | | |
| | | | | | | | | |
| | | | | | | | | |
| | | | | | | | | |
| ($ millions) | For the six months ended 6/30/2020 | | | | | | | | |
| | Carlina | Cortezb | Turquoise Ridgec | Long Canyond | Phoenixd | Nevada Gold Minese | Hemlo | Pueblo Viejo | Veladero |
| By-product credits | 1 | | 0 | | 1 | | 0 | | 56 | | 58 | | 0 | | 25 | | 2 | |
| Non-controlling interest | 0 | | 0 | | 0 | | 0 | | (21) | | (21) | | 0 | | (11) | | 0 | |
| By-product credits (net of non-controlling interest) | 1 | | 0 | | 1 | | 0 | | 35 | | 37 | | 0 | | 14 | | 2 | |
| | | | | | | | | |
| ($ millions) | For the six months ended 6/30/2020 | | | | | | | | |
| | Porgera | Loulo-Gounkoto | Kibali | North Maran | Tongon | Bulyanhulun | Buzwagin | | |
| By-product credits | 1 | | 0 | | 1 | | 1 | | 0 | | 4 | | 9 | | |
| Non-controlling interest | 0 | | 0 | | 0 | | 0 | | 0 | | (1) | | (1) | | |
| By-product credits (net of non-controlling interest) | 1 | | 0 | | 1 | | 1 | | 0 | | 3 | | 8 | | |
| | | | | | | | | |
| | | | | | | | | |
| | | | | | | | | |
| | | | | | | | | |
| | | | | | | | | |
| | | | | | | | | |
| | | | | | | | | |
| | | | | | | | | |
| | | | | | | | | |
| | | | | | | | | |
| | | | | | | | | |
| | | | | | | | | |
| | | | | | | | | | | | | | | | | | | | | | | | | | | | | | | | |
| | | | | | | | | | |
| | | | | | | | | | |
| | | | | | | | | | |
| | | | | | | | | | |
| | | | | | | | | | |
| | | | | | | | | | |
| | | | | | | | | | |
| | | | | | | | | | |
| | | | | | | | | | |
| | | | | | | | | | |
| | | | | | | | | | |
| | | | | | | | | | |
| | | | | | | | | | |
| | | | | | | | | | |
| | | | | | | | | | |
| | | | | | | | | | |
| | | | | | | | | | |
| | | | | | | | | | |
| | | | | | | | | | |
| | | | | | | | | | |
| | | | | | | | | | |
| | | | | | | | | | |
| | | | | | | | | | |
| | | | | | | | | | |
| ($ millions) | For the six months ended 6/30/2019 | | | | | | | | | |
| | Carlina | Cortezb | Turquoise Ridgec | Barrick Nevadae | Hemlo | Golden Sunlighto | Pueblo Viejo | Veladero | Porgera | Kalgoorliem |
| By-product credits | 0 | | 0 | | 0 | | 0 | 0 | 0 | | 32 | | 4 | | 1 | | 0 | |
| Non-controlling interest | 0 | | 0 | | 0 | | 0 | 0 | 0 | | (12) | | 0 | | 0 | | 0 | |
| By-product credits (net of non-controlling interest) | 0 | | 0 | | 0 | | 0 | 0 | 0 | | 20 | | 4 | | 1 | | 0 | |
| | | | | | | | | | |
| ($ millions) | For the six months ended 6/30/2019 | | | | | | | | | |
| | Lagunas Norteo | Loulo-Gounkoto | Kibali | North Maran | Tongon | Bulyanhulun | Buzwagin | Morilao | | |
| By-product credits | 4 | | 0 | | 0 | | 1 | | 0 | | 1 | | 0 | | 0 | | | |
| Non-controlling interest | 0 | | 0 | | 0 | | (1) | | 0 | | 0 | | 0 | | 0 | | | |
| By-product credits (net of non-controlling interest) | 4 | | 0 | | 0 | | 0 | | 0 | | 1 | | 0 | | 0 | | | |
m.On November 28, 2019, we completed the sale of our 50% interest in Kalgoorlie in Western Australia to Saracen Mineral Holdings Limited for total cash consideration of $750 million. The transaction resulted in a gain of $408 million for the year ended December 31, 2019. The operating results reported for Kalgoorlie reflect the Company’s attributable share of Kalgoorlie’s results until the date of disposal.
n.Formerly part of Acacia Mining plc. On September 17, 2019, Barrick acquired all of the shares of Acacia it did not own. The results are on a 63.9% basis until September 30, 2019 (notwithstanding the completion of the Acacia transaction on September 17, 2019, we consolidated our interest in Acacia and recorded a non-controlling interest of 36.1% in the income statement for the entirety of the third quarter of 2019 as a matter of convenience), on a 100% basis from October 1, 2019 to December 31, 2019, and on an 84% basis from January 1, 2020 onwards, the date the GoT's 16% free carried interest was made effective.
o.With the end of mining at Lagunas Norte in the third quarter of 2019 and at Golden Sunlight and Morila in the second quarter of 2019 as previously reported, we have ceased to include production or non-GAAP cost metrics for these sites from October 1, 2019 and July 1, 2019, respectively, onwards.
| | | | | | | | |
| BARRICK SECOND QUARTER 2020 | 98 | MANAGEMENT'S DISCUSSION AND ANALYSIS |
Reconciliation of Copper Cost of Sales to C1 cash costs and All-in sustaining costs, including on a per pound basis
| | | | | | | | | | | | | | | | | |
| ($ millions, except per pound information in dollars) | For the three months ended | | | For the six months ended | |
| | 6/30/20 | 3/31/20 | 6/30/19 | 6/30/20 | 6/30/19 |
| Cost of sales | 153 | | 124 | | 101 | | 277 | | 232 | |
| Depreciation/amortization | (63) | | (43) | | (28) | | (106) | | (70) | |
| Treatment and refinement charges | 40 | | 39 | | 25 | | 79 | | 56 | |
| Cash cost of sales applicable to equity method investments | 72 | | 66 | | 69 | | 138 | | 135 | |
Less: royalties and production taxesa | (11) | | (11) | | (9) | | (22) | | (21) | |
| By-product credits | (3) | | (3) | | (2) | | (6) | | (5) | |
| Other | 0 | | 0 | | (5) | | 0 | | (5) | |
| C1 cash costs | 188 | | 172 | | 151 | | 360 | | 322 | |
| General & administrative costs | 6 | | 3 | | 6 | | 9 | | 11 | |
| Rehabilitation - accretion and amortization | 2 | | 3 | | 3 | | 5 | | 6 | |
Royalties and production taxesa | 11 | | 11 | | 9 | | 22 | | 21 | |
| Minesite exploration and evaluation costs | 1 | | 1 | | 1 | | 2 | | 3 | |
| Minesite sustaining capital expenditures | 52 | | 32 | | 48 | | 84 | | 107 | |
| Sustaining leases | 2 | | 3 | | 1 | | 5 | | 2 | |
| | | | | |
| All-in sustaining costs | 262 | | 225 | | 219 | | 487 | | 472 | |
| Pounds sold - consolidated basis (millions pounds) | 123 | | 110 | | 96 | | 233 | | 199 | |
Cost of sales per poundb,c | 2.08 | | 1.96 | | 2.04 | | 2.03 | | 2.13 | |
C1 cash cost per poundb | 1.55 | | 1.55 | | 1.59 | | 1.55 | | 1.62 | |
All-in sustaining costs per poundb | 2.15 | | 2.04 | | 2.28 | | 2.10 | | 2.37 | |
a.For the three and six month period ended June 30, 2020, royalties and production taxes include royalties of $11 million and $22 million respectively (March 31, 2020: $11 million and June 30, 2019: $9 million and $21 million respectively).
b.Cost of sales per pound, C1 cash costs per pound and all-in sustaining costs per pound may not calculate based on amounts presented in this table due to rounding.
c.Cost of sales applicable to copper per pound is calculated using cost of sales including our proportionate share of cost of sales attributable to equity method investments (Zaldívar and Jabal Sayid), divided by consolidated copper pounds (including our proportionate share of copper pounds from our equity method investments).
| | | | | | | | |
| BARRICK SECOND QUARTER 2020 | 99 | MANAGEMENT'S DISCUSSION AND ANALYSIS |
Reconciliation of Copper Cost of Sales to C1 cash costs and All-in sustaining costs, including on a per pound basis, by operating site
| | | | | | | | | | | | | | | | | | | | | | | | | | | | | |
| ($ millions, except per pound information in dollars) | | | For the three months ended | | | | | | |
| 6/30/20 | | | 3/31/20 | | | 6/30/19 | | |
| | Zaldívar | Lumwana | Jabal Sayid | Zaldívar | Lumwana | Jabal Sayid | Zaldívar | Lumwana | Jabal Sayid |
| Cost of sales | 78 | | 153 | | 24 | | 70 | | 124 | | 22 | | 72 | | 101 | | 25 | |
| Depreciation/amortization | (23) | | (63) | | (7) | | (20) | | (43) | | (6) | | (22) | | (28) | | (6) | |
| Treatment and refinement charges | 0 | | 36 | | 4 | | 0 | | 34 | | 5 | | 0 | | 20 | | 5 | |
Less: royalties and production taxesa | 0 | | (11) | | 0 | | 0 | | (11) | | 0 | | 0 | | (9) | | 0 | |
| By-product credits | 0 | | 0 | | (3) | | 0 | | 0 | | (3) | | 0 | | 0 | | (2) | |
| Other | 0 | | 0 | | 0 | | 0 | | 0 | | 0 | | 0 | | (5) | | 0 | |
| C1 cash costs | 55 | | 115 | | 18 | | 50 | | 104 | | 18 | | 50 | | 79 | | 22 | |
| Rehabilitation - accretion and amortization | 0 | | 2 | | 0 | | 0 | | 3 | | 0 | | 1 | | 2 | | 0 | |
Royalties and production taxesa | 0 | | 11 | | 0 | | 0 | | 11 | | 0 | | 0 | | 9 | | 0 | |
| Minesite exploration and evaluation costs | 1 | | 0 | | 0 | | 1 | | 0 | | 0 | | 1 | | 0 | | 0 | |
| Minesite sustaining capital expenditures | 7 | | 39 | | 6 | | 6 | | 25 | | 1 | | 7 | | 40 | | 1 | |
| Sustaining leases | 2 | | 0 | | 0 | | 1 | | 2 | | 0 | | 0 | | 1 | | 0 | |
| | | | | | | | | |
| All-in sustaining costs | 65 | | 167 | | 24 | | 58 | | 145 | | 19 | | 59 | | 131 | | 23 | |
| Pounds sold - consolidated basis (millions pounds) | 30 | | 75 | | 18 | | 30 | | 63 | | 17 | | 31 | | 48 | | 17 | |
Cost of sales per poundb,c | 2.52 | | 2.06 | | 1.41 | | 2.39 | | 1.94 | | 1.28 | | 2.32 | | 2.07 | | 1.45 | |
C1 cash cost per poundb | 1.79 | | 1.55 | | 1.14 | | 1.71 | | 1.63 | | 0.97 | | 1.61 | | 1.70 | | 1.22 | |
All-in sustaining costs per poundb | 2.09 | | 2.27 | | 1.41 | | 1.99 | | 2.26 | | 1.11 | | 1.85 | | 2.78 | | 1.31 | |
| | | | | | | | | | | | | | | | | | | | | | | |
| ($ millions, except per pound information in dollars) | | | | For the six months ended | | | | | |
| 6/30/20 | | | 6/30/19 | | | | | |
| | Zaldívar | Lumwana | Jabal Sayid | Zaldívar | Lumwana | Jabal Sayid | | | |
| Cost of sales | 148 | | 277 | | 46 | | 146 | | 232 | | 47 | | | | |
| Depreciation/amortization | (43) | | (106) | | (13) | | (43) | | (70) | | (15) | | | | |
| Treatment and refinement charges | 0 | | 70 | | 9 | | 0 | | 46 | | 10 | | | | |
Less: royalties and production taxesa | 0 | | (22) | | 0 | | 0 | | (21) | | 0 | | | | |
| By-product credits | 0 | | 0 | | (6) | | 0 | | 0 | | (5) | | | | |
| Other | 0 | | 0 | | 0 | | 0 | | (5) | | 0 | | | | |
| C1 cash costs | 105 | | 219 | | 36 | | 103 | | 182 | | 37 | | | | |
| Rehabilitation - accretion and amortization | 0 | | 5 | | 0 | | 1 | | 5 | | 0 | | | | |
Royalties and production taxesa | 0 | | 22 | | 0 | | 0 | | 21 | | 0 | | | | |
| Minesite exploration and evaluation costs | 2 | | 0 | | 0 | | 3 | | 0 | | 0 | | | | |
| Minesite sustaining capital expenditures | 13 | | 64 | | 7 | | 11 | | 92 | | 4 | | | | |
| Sustaining leases | 3 | | 2 | | 0 | | 0 | | 2 | | 0 | | | | |
| | | | | | | | | |
| All-in sustaining costs | 123 | | 312 | | 43 | | 118 | | 302 | | 41 | | | | |
| Pounds sold - consolidated basis (millions pounds) | 60 | | 138 | | 35 | | 59 | | 109 | | 31 | | | | |
Cost of sales per poundb,c | 2.46 | | 2.01 | | 1.35 | | 2.49 | | 2.07 | | 1.45 | | | | |
C1 cash costs per poundb | 1.75 | | 1.59 | | 1.06 | | 1.75 | | 1.68 | | 1.16 | | | | |
All-in sustaining costs per poundb | 2.04 | | 2.27 | | 1.26 | | 1.98 | | 2.79 | | 1.31 | | | | |
a.For the three and six month period ended June 30, 2020, royalties and production taxes include royalties of $11 million and $22 million respectively (March 31, 2020: $11 million and June 30, 2019: $9 million and $21 million respectively).
b.Cost of sales per pound, C1 cash costs per pound and all-in sustaining costs per pound may not calculate based on amounts presented in this table due to rounding.
c.Cost of sales applicable to copper per pound is calculated using cost of sales including our proportionate share of cost of sales attributable to equity method investments (Zaldívar and Jabal Sayid), divided by consolidated copper pounds (including our proportionate share of copper pounds from our equity method investments).
| | | | | | | | |
| BARRICK SECOND QUARTER 2020 | 100 | MANAGEMENT'S DISCUSSION AND ANALYSIS |
EBITDA and Adjusted EBITDA
EBITDA is a non-GAAP financial measure, which excludes the following from net earnings:
•Income tax expense;
•Finance costs;
•Finance income; and
•Depreciation.
Management believes that EBITDA is a valuable indicator of our ability to generate liquidity by producing operating cash flow to fund working capital needs, service debt obligations, and fund capital expenditures. Management uses EBITDA for this purpose. EBITDA is also frequently used by investors and analysts for valuation purposes whereby EBITDA is multiplied by a factor or “EBITDA multiple” that is based on an observed or inferred relationship between EBITDA and market values to determine the approximate total enterprise value of a company.
Adjusted EBITDA removes the effect of impairment charges; acquisition/disposition gains/losses; foreign currency translation gains/losses; other expense adjustments; and income tax expense, finance costs, finance income and depreciation from equity investees. We believe these items provide a greater level of consistency with the adjusting items included in our Adjusted Net
Earnings reconciliation, with the exception that these amounts are adjusted to remove any impact on finance costs/income, income tax expense and/or depreciation, including the impact incurred in our equity method accounted investments, as they do not affect EBITDA. We believe this additional information will assist analysts, investors and other stakeholders of Barrick in better understanding our ability to generate liquidity from operating cash flow, by excluding these amounts from the calculation as they are not indicative of the performance of our core mining business and not necessarily reflective of the underlying operating results for the periods presented.
EBITDA and adjusted EBITDA are intended to provide additional information to investors and analysts and do not have any standardized definition under IFRS and should not be considered in isolation or as a substitute for measures of performance prepared in accordance with IFRS. EBITDA and adjusted EBITDA exclude the impact of cash costs of financing activities and taxes, and the effects of changes in operating working capital balances, and therefore are not necessarily indicative of operating profit or cash flow from operations as determined under IFRS. Other companies may calculate EBITDA and adjusted EBITDA differently.
Reconciliation of Net Earnings to EBITDA and Adjusted EBITDA
| | | | | | | | | | | | | | | | | |
| ($ millions) | For the three months ended | | | For the six months ended | |
| | 6/30/20 | 3/31/20 | 6/30/19 | 6/30/20 | 6/30/19 |
| Net earnings (loss) | 622 | | 663 | | 223 | | 1,285 | | 363 | |
| Income tax expense | 258 | | 386 | | 41 | | 644 | | 208 | |
Finance costs, neta | 74 | | 88 | | 98 | | 162 | | 198 | |
| Depreciation | 566 | | 524 | | 466 | | 1,090 | | 901 | |
| EBITDA | 1,520 | | 1,661 | | 828 | | 3,181 | | 1,670 | |
Impairment charges (reversals) of long-lived assetsb | 23 | | (336) | | 12 | | (313) | | 15 | |
Acquisition/disposition (gains) lossesc | 8 | | (60) | | (12) | | (52) | | (12) | |
| Loss (gain) on currency translation | 2 | | 16 | | (6) | | 18 | | 16 | |
Other expense (income) adjustmentsd | 48 | | 98 | | 58 | | 146 | | 104 | |
| | | | | |
| Income tax expense, net finance costs, and depreciation from equity investees | 96 | | 87 | | 92 | | 183 | | 181 | |
| Adjusted EBITDA | 1,697 | | 1,466 | | 972 | | 3,163 | | 1,974 | |
a.Finance costs exclude accretion.
b.Net impairment charges for the three month period ended June 30, 2020 relate to miscellaneous assets. For the three month period ended March 31, 2020 and the six month period ended June 30, 2020, net impairment reversals primarily relate to non-current asset reversals at our Tanzanian assets.
c.Acquisition/disposition gains for the three month period ended March 31, 2020 and the six month period ended June 30, 2020 primarily relate to the gain on the sale of Massawa.
d.Other expense adjustments for the three and six month period ended June 30, 2020 primarily relate to care and maintenance expenses at Porgera and Covid-19 donations. The six month period ended June 30, 2020 was further impacted by changes in the discount rate assumptions on our closed mine rehabilitation provision. For the three month period ended March 31, 2020, other expense adjustments primarily relate to the impact of changes in the discount rate assumptions on our closed mine rehabilitation provision and losses on debt extinguishment. Other expense adjustments for the three and six month periods ended June 30, 2019 primarily relate to severance costs as a result of the implementation of a number of organizational reductions, the impact of changes in the discount rate assumptions on our closed mine rehabilitation provision and transaction costs related to Nevada Gold Mines.
| | | | | | | | |
| BARRICK SECOND QUARTER 2020 | 101 | MANAGEMENT'S DISCUSSION AND ANALYSIS |
Reconciliation of Income to EBITDA by operating site
| | | | | | | | | | | | | | | | | | | | | | | | | | | | | | | | |
| ($ millions) | | For the three months ended 6/30/20 | | | | | | | | |
| | Carlina (61.5%) | Cortez (61.5%) | Turquoise Ridgeb (61.5%) | Nevada Gold Minesc (61.5%) | Pueblo Viejo (60%) | Loulo-Gounkoto (80%) | Kibali (45%) | Veladero (50%) | Porgera (47.5%) | North Marad (84%) |
| Income | 151 | | 109 | | 48 | | 357 | | 92 | | 107 | | 64 | | 16 | | (13) | | 44 | |
| Depreciation | 44 | | 35 | | 25 | | 146 | | 33 | | 60 | | 42 | | 13 | | 6 | | 21 | |
| EBITDA | 195 | | 144 | | 73 | | 503 | | 125 | | 167 | | 106 | | 29 | | (7) | | 65 | |
| | | | | | | | | | |
| | | For the three months ended 3/31/20 | | | | | | | | |
| | Carlina (61.5%) | Cortez (61.5%) | Turquoise Ridgeb (61.5%) | Nevada Gold Minesc (61.5%) | Pueblo Viejo (60%) | Loulo-Gounkoto (80%) | Kibali (45%) | Veladero (50%) | Porgera (47.5%) | North Marad (100%) |
| Income | 153 | | 89 | | 47 | | 316 | | 102 | | 68 | | 48 | | 24 | | 29 | | 49 | |
| Depreciation | 49 | | 33 | | 31 | | 146 | | 32 | | 47 | | 41 | | 22 | | 10 | | 21 | |
| EBITDA | 202 | | 122 | | 78 | | 462 | | 134 | | 115 | | 89 | | 46 | | 39 | | 70 | |
| | | | | | | | | | |
| | | For the three months ended 6/30/19 | | | | | | | | |
| | Carlina (61.5%) | Cortez (61.5%) | Turquoise Ridgeb (61.5%) | Nevada Gold Minesc (61.5%) | Pueblo Viejo (60%) | Loulo-Gounkoto (80%) | Kibali (45%) | Veladero (50%) | Porgera (47.5%) | North Marad (84%) |
| Income | 33 | | 158 | | 53 | | 244 | | 75 | | 32 | | 43 | | 12 | | 16 | | 31 | |
| Depreciation | 53 | | 65 | | 9 | | 127 | | 29 | | 70 | | 31 | | 31 | | 8 | | 16 | |
| EBITDA | 86 | | 223 | | 62 | | 371 | | 104 | | 102 | | 74 | | 43 | | 24 | | 47 | |
| | | | | | | | | | |
| ($ millions) | | For the six months ended 6/30/2020 | | | | | | | | |
| | Carlina (61.5%) | Cortez (61.5%) | Turquoise Ridgeb (61.5%) | Nevada Gold Minesc (61.5%) | Pueblo Viejo (60%) | Loulo-Gounkoto (80%) | Kibali (45%) | Veladero (50%) | Porgera (47.5%) | North Marad (84%) |
| Income | 304 | | 198 | | 95 | | 673 | | 194 | | 175 | | 112 | | 40 | | 16 | | 93 | |
| Depreciation | 93 | | 68 | | 56 | | 292 | | 65 | | 107 | | 83 | | 35 | | 16 | | 42 | |
| EBITDA | 397 | | 266 | | 151 | | 965 | | 259 | | 282 | | 195 | | 75 | | 32 | | 135 | |
| | | | | | | | | | |
| ($ millions) | For the six months ended 6/30/2019 | | | | | | | | | |
| | Carlina (61.5%) | Cortez (61.5%) | Turquoise Ridgeb (61.5%) | Nevada Gold Minesc (61.5%) | Pueblo Viejo (60%) | Loulo-Gounkoto (80%) | Kibali (45%) | Veladero (50%) | Porgera (47.5%) | North Marad (84%) |
| Income | 116 | | 313 | | 107 | | 536 | | 173 | | 61 | | 53 | | 22 | | 34 | | 40 | |
| Depreciation | 119 | | 129 | | 15 | | 263 | | 57 | | 117 | | 87 | | 61 | | 19 | | 29 | |
| EBITDA | 235 | | 442 | | 122 | | 799 | | 230 | | 178 | | 140 | | 83 | | 53 | | 69 | |
a.On July 1, 2019, Barrick's Goldstrike and Newmont's Carlin were contributed to Nevada Gold Mines and are now referred to as Carlin. As a result, the amounts presented represent Goldstrike on a 100% basis (including our 60% share of South Arturo) up until June 30, 2019, and the combined results of Carlin and Goldstrike (including NGM's 60% share of South Arturo) on a 61.5% basis thereafter.
b.Barrick owned 75% of Turquoise Ridge through to the end of the second quarter of 2019, with our joint venture partner, Newmont, owning the remaining 25%. Turquoise Ridge was proportionately consolidated on the basis that the joint venture partners that have joint control have rights to the assets and obligations for the liabilities relating to the arrangement. The figures presented in this table are based on our 75% interest in Turquoise Ridge until June 30, 2019. On July 1, 2019, Barrick's 75% interest in Turquoise Ridge as well as Newmont's Twin Creeks and 25% interest in Turquoise Ridge were contributed to Nevada Gold Mines. Starting July 1, 2019, the results represent our 61.5% share of Turquoise Ridge and Twin Creeks, now referred to as Turquoise Ridge.
c.Represents the combined results of Cortez, Goldstrike (including our 60% share of South Arturo) and our 75% interest in Turquoise Ridge until June 30, 2019. Commencing July 1, 2019, the date Nevada Gold Mines was established, the results represent our 61.5% interest in Cortez, Carlin (including Goldstrike and 60% of South Arturo), Turquoise Ridge (including Twin Creeks), Phoenix and Long Canyon.
d.Formerly part of Acacia Mining plc. On September 17, 2019, Barrick acquired all of the shares of Acacia it did not own. The results are on a 63.9% basis until September 30, 2019 (notwithstanding the completion of the Acacia transaction on September 17, 2019, we consolidated our interest in Acacia and recorded a non-controlling interest of 36.1% in the income statement for the entirety of the third quarter of 2019 as a matter of convenience), on a 100% basis from October 1, 2019 to December 31, 2019, and on an 84% basis from January 1, 2020 onwards, the effective date of the GoT's free carried interest.
| | | | | | | | |
| BARRICK SECOND QUARTER 2020 | 102 | MANAGEMENT'S DISCUSSION AND ANALYSIS |
Realized Price
Realized price is a non-GAAP financial measure which excludes from sales:
•Unrealized gains and losses on non-hedge derivative contracts;
•Unrealized mark-to-market gains and losses on provisional pricing from copper and gold sales contracts;
•Sales attributable to ore purchase arrangements;
•Treatment and refining charges; and
•Cumulative catch-up adjustment to revenue relating to our streaming arrangements.
This measure is intended to enable Management to better understand the price realized in each reporting period for gold and copper sales because unrealized mark-to-market values of non-hedge gold and copper derivatives are subject to change each period due to changes in market factors such as market and forward gold and copper prices, so that prices ultimately realized may differ from those recorded. The exclusion of such unrealized mark-to-market gains and losses from the presentation of this performance measure enables investors to understand performance based on the realized proceeds of selling gold and copper production.
The gains and losses on non-hedge derivatives and receivable balances relate to instruments/balances that
mature in future periods, at which time the gains and losses will become realized. The amounts of these gains and losses reflect fair values based on market valuation assumptions at the end of each period and do not necessarily represent the amounts that will become realized on maturity. We also exclude export duties that are paid upon sale and netted against revenues as well as treatment and refining charges that are paid to the refiner on gold and copper concentrate sales that are netted against revenues. We believe this provides investors and analysts with a more accurate measure with which to compare to market gold prices and to assess our gold sales performance. For those reasons, management believes that this measure provides a more accurate reflection of our Company’s past performance and is a better indicator of its expected performance in future periods.
The realized price measure is intended to provide additional information, and does not have any standardized definition under IFRS and should not be considered in isolation or as a substitute for measures of performance prepared in accordance with IFRS. The measure is not necessarily indicative of sales as determined under IFRS. Other companies may calculate this measure differently. The following table reconciles realized prices to the most directly comparable IFRS measure.
Reconciliation of Sales to Realized Price per ounce/pound
| | | | | | | | | | | | | | | | | | | | | | | | | | | | | | | | |
| | | | | | | | | | |
| ($ millions, except per ounce/pound information in dollars) | Gold | | | Copper | | | Gold | | Copper | |
| | For the three months ended | | | | | | For the six months ended | | | |
| | 6/30/20 | 3/31/20 | 6/30/19 | 6/30/20 | 3/31/20 | 6/30/19 | 6/30/20 | 6/30/19 | 6/30/20 | 6/30/19 |
| Sales | 2,812 | | 2,593 | | 1,937 | | 184 | | 99 | | 103 | | 5,405 | | 3,843 | | 283 | | 266 | |
| Sales applicable to non-controlling interests | (822) | | (770) | | (240) | | 0 | | 0 | | 0 | | (1,592) | | (464) | | 0 | | 0 | |
Sales applicable to equity method investmentsa,b | 172 | | 147 | | 135 | | 120 | | 107 | | 124 | | 319 | | 264 | | 227 | | 245 | |
| Realized non-hedge gold/copper derivative (losses) gains | 0 | | 0 | | 1 | | 0 | | 0 | | 0 | | 0 | | 1 | | 0 | | 0 | |
Sales applicable to sites in care and maintenancec | (53) | | (46) | | (26) | | 0 | | 0 | | 0 | | (99) | | (52) | | 0 | | 0 | |
| Treatment and refinement charges | 2 | | 0 | | 0 | | 40 | | 39 | | 25 | | 2 | | 0 | | 79 | | 56 | |
| | | | | | | | | | |
Otherd | 0 | | 15 | | 0 | | 0 | | 0 | | 0 | | 15 | | 0 | | 0 | | 0 | |
| Revenues – as adjusted | 2,111 | | 1,939 | | 1,807 | | 344 | | 245 | | 252 | | 4,050 | | 3,592 | | 589 | | 567 | |
Ounces/pounds sold (000s ounces/millions pounds)c | 1,224 | | 1,220 | | 1,372 | | 123 | | 110 | | 96 | | 2,444 | | 2,737 | | 233 | | 199 | |
Realized gold/copper price per ounce/pounde | 1,725 | | 1,589 | | 1,317 | | 2.79 | | 2.23 | | 2.62 | | 1,657 | | 1,312 | | 2.53 | | 2.85 | |
a.Represents sales of $164 million and $304 million, respectively, for the three and six month periods ended June 30, 2020 (March 31, 2020: $140 million and June 30, 2019: $125 million and $242 million, respectively) applicable to our 45% equity method investment in Kibali and $nil and nil, respectively, (March 31, 2020: $nil and June 30, 2019: $10 million and $22 million, respectively) applicable to our 40% equity method investment in Morila for gold. Represents sales of $78 million and $150 million, respectively, for the three and six months ended June 30, 2020 (March 31, 2020: $72 million and June 30, 2019: $86 million and $167 million, respectively) applicable to our 50% equity method investment in Zaldívar and $46 million and $86 million, respectively (March 31, 2020: $40 million and June 30, 2019: $44 million and $88 million, respectively) applicable to our 50% equity method investment in Jabal Sayid for copper.
b.Sales applicable to equity method investments are net of treatment and refinement charges.
c.Figures exclude: Pierina; Golden Sunlight and Morila starting in the third quarter of 2019; and Lagunas Norte starting in the fourth quarter of 2019, from the calculation of realized price per ounce as the mine is mining incidental ounces as it enters closure.
d.Represents cumulative catch-up adjustment to revenue relating to our streaming arrangements. Refer to note 2f of the 2019 Annual Financial Statements for more information.
e.Realized price per ounce/pound may not calculate based on amounts presented in this table due to rounding.
| | | | | | | | |
| BARRICK SECOND QUARTER 2020 | 103 | MANAGEMENT'S DISCUSSION AND ANALYSIS |
TECHNICAL INFORMATION
The scientific and technical information contained in this MD&A has been reviewed and approved by Steven Yopps, MMSA, Manager of Growth Projects, Nevada Gold Mines; Craig Fiddes, SME-RM, Manager – Resource Modeling, Nevada Gold Mines; Chad Yuhasz, P.Geo, Mineral Resource Manager, Latin America and Asia Pacific; Simon Bottoms, CGeol, MGeol, FGS, FAusIMM, Mineral Resources Manager: Africa and Middle East; Rodney Quick, MSc, Pr. Sci.Nat, Mineral Resource Management and Evaluation Executive; John Steele, CIM, Metallurgy, Engineering and Capital Projects Executive; and Rob Krcmarov, FAusIMM, Executive Vice President, Exploration and Growth – each a “Qualified Person” as defined in National Instrument 43-101 – Standards of Disclosure for Mineral Projects.
All mineral reserve and mineral resource estimates are estimated in accordance with National Instrument 43-101 – Standards of Disclosure for Mineral Projects. Unless otherwise noted, such mineral reserve and mineral resource estimates are as of December 31, 2019.
ENDNOTES
1These are non-GAAP financial performance measures with no standardized meaning under IFRS and therefore may not be comparable to similar measures presented by other issuers. For further information and a detailed reconciliation of each non-GAAP measure to the most directly comparable IFRS measure, please see pages 79 to 103 of this MD&A.
2Cost of sales applicable to gold per ounce is calculated using cost of sales applicable to gold on an attributable basis (removing the non-controlling interest of 40% Pueblo Viejo; 20% Loulo-Gounkoto; 10.3% Tongon; 16% North Mara, Bulyanhulu and Buzwagi starting January 1, 2020, the date the GoT's 16% free carried interest was made effective (36.1% from January 1, 2019 to September 30, 2019; notwithstanding the completion of the Acacia transaction on September 17, 2019, we consolidated our interest in Acacia and recorded a non-controlling interest of 36.1% in the income statement for the entirety of the third quarter of 2019 as a matter of convenience); 63.1% South Arturo from cost of sales from July 1, 2019 onwards as a result of its contribution to Nevada Gold Mines (and on a 40% basis from January 1, 2019 to June 30, 2019); and our proportionate share of cost of sales attributable to equity method investments (Kibali, and Morila until the second quarter of 2019), divided by attributable gold ounces. Also removes the non-controlling interest of 38.5% Nevada Gold Mines from cost of sales from July 1, 2019 onwards. Cost of sales applicable to copper per pound is calculated using cost of sales applicable to copper including our proportionate share of cost of sales attributable to equity method investments (Zaldívar and Jabal Sayid), divided by consolidated copper pounds (including our proportionate share of copper pounds from our equity method investments).
3Class 1 - High Significance is defined as an incident that causes significant negative impacts on human health or the environment or an incident that extends onto publicly accessible land and has the potential to cause significant adverse impact to surrounding communities, livestock or wildlife.
4See the Technical Report on the Turquoise Ridge complex, dated March 25, 2020, and filed on SEDAR at www.sedar.com and EDGAR at www.sec.gov on March 25, 2020.
5See the Technical Report on the Pueblo Viejo mine, Sanchez Ramirez Province, Dominican Republic, dated March 19, 2018, and filed on SEDAR at www.sedar.com and EDGAR at www.sec.gov on March 23, 2018.
| | | | | | | | |
| BARRICK SECOND QUARTER 2020 | 104 | MANAGEMENT'S DISCUSSION AND ANALYSIS |
6Fourmile Significant Interceptsa
| | | | | | | | | | | | | | | | | |
| Drill Results from Q2 2020 | | | | | |
Drill Holeb | Azimuth | Dip | Interval (m) | Width (m)c | Au (g/t) |
FM20-153Dd | 73 | (80) | 1177.8 - 1182.5 | 4.7 | 41.5 |
| | | 1388.7 - 1390.1 | 1.4 | 14.6 |
| | | 1406.4 - 1415.8 | 9.4 | 17.9 |
| | | 1419.5 - 1421.0 | 1.5 | 24 |
| FM20-154D | 42 | (84) | 1424.6 - 1425.5 | 0.9 | 16 |
| FM20-156D | 128 | (81) | | | no significant intercept |
| | | 794.1 - 802.5 | 8.4 | 21.5 |
| FM20-158D | 78 | (73) | 1153.2 - 1154.1 | 0.9 | 10.6 |
FM20-159De | 23 | (76) | | | no significant intercept |
| | | 588.6 - 593.8 | 5.2 | 10.6 |
| | | 597.7 - 599.2 | 1.5 | 5.6 |
FM20-160De | 121 | (71) | 602.3 - 606.2 | 3.9 | 7.3 |
| | | 1151.5 - 1153.0 | 1.5 | 30.3 |
| | | 1157.0 - 1159.4 | 2.4 | 15.1 |
| | | 1169.7 - 1172.6 | 2.9 | 13.1 |
FM20-161De | 98 | (84) | 1232.8 - 1236.0 | 3.2 | 10.5 |
FM20-165De | 88 | (80) | 1503.7 - 1505.2 | 1.5 | 28.6 |
a.All intercepts calculated using a 5 g/t Au cutoff and are uncapped; minimum intercept width is 0.8 m; internal dilution is less than 20% total width.
b.Fourmile drill hole nomenclature: FM (Fourmile) followed by the year (20 for 2020).
c.True width of intercepts are uncertain at this stage.
d.Partial results reported in Q1 2020.
e.Partial results received.
The drilling results for the Fourmile property contained in this MD&A have been prepared in accordance with National Instrument 43-101 – Standards of Disclosure for Mineral Projects. All drill hole assay information has been manually reviewed and approved by staff geologists and re-checked by the project manager. Sample preparation and analyses are conducted by ALS Minerals. Procedures are employed to ensure security of samples during their delivery from the drill rig to the laboratory. The quality assurance procedures, data verification and assay protocols used in connection with drilling and sampling on the Fourmile property conform to industry accepted quality control methods.
7Carlin Trend Significant Interceptsa
| | | | | | | | | | | | | | | | | |
| Drill Results from Q2 2020 | | | | | |
Drill Holeb | Azimuth | Dip | Interval (m) | Width (m)c | Au (g/t) |
| | | 781.2 - 782.7 | 1.5 | 6.9 |
| | | 784.6 - 786.1 | 1.5 | 5.1 |
| | | 807.4 - 810.5 | 3.1 | 5.5 |
| | | 825.7 - 847.0 | 21.3 | 35.3 |
| | | 898.2 - 901.9 | 3.7 | 9 |
| CGX-00076A | 115 | (75) | 908.3 - 909.2 | 0.9 | 7.4 |
| | | 842.5 - 847.7 | 5.2 | 10.9 |
| | | 850.7 - 854.4 | 3.7 | 9.4 |
| | | 911.1 - 912.6 | 1.5 | 9.1 |
PGX-20002d | 9 | (68) | 914.1 - 915.6 | 1.5 | 5.5 |
| | | 980.4 - 983.5 | 3.1 | 7.3 |
| LBB-20002 | 0 | (90) | 1059.0 - 1060.5 | 1.5 | 5.2 |
a.All intercepts calculated using a 5 g/t Au cutoff and are uncapped; minimum intercept width is 0.8 m; internal dilution is less than 20% total width
b.Carlin Trend drill hole nomenclature: Project area (CGX - Leeville, PGX - Post-Gen, LBB - Little Boulder Basin) followed by the year (20 for 2020) then hole number
c.True width of intercepts are uncertain at this stage.
d.Partial results received; results pending from 145-819 m and 977-1053 m
| | | | | | | | |
| BARRICK SECOND QUARTER 2020 | 105 | MANAGEMENT'S DISCUSSION AND ANALYSIS |
The drilling results for the Carlin Trend contained in this MD&A have been prepared in accordance with National Instrument 43-101 – Standards of Disclosure for Mineral Projects. All drill hole assay information has been manually reviewed and approved by staff geologists and re-checked by the project manager. Sample preparation and analyses are conducted by ALS Minerals. Procedures are employed to ensure security of samples during their delivery from the drill rig to the laboratory. The quality assurance procedures, data verification and assay protocols used in connection with drilling and sampling on the Carlin Trend conform to industry accepted quality control methods.
8Hemlo Significant Interceptsa
| | | | | | | | | | | | | | | | | |
| Drill Results from Q2 2020 | | | | | |
Drill Holeb | Azimuth | Dip | Interval (m) | Width (m)c | Au (g/t) |
| | | 873.0 - 880.0 | 7.0 | 3.85 |
| | | 876.0 - 877.0 | 1.0 | 9.01 |
| | | 879.0 - 880.0 | 1 | 8.23 |
| | | 1048.4 - 1049.0 | 0.6 | 5.91 |
| | | 1102.0 - 1103.0 | 1.0 | 8.78 |
| 1751908.1W2 | 290 | (76) | 1229.0 - 1231.0 | 2.0 | 11.70 |
a.All intercepts calculated using a 0.2 g/t Au cutoff and are uncapped; minimum intercept width is 0.5 m; internal dilution is less than 50% total width.
b.Hemlo drill hole nomenclature: Mine level (175 for 9175 level) followed by the year (19 for 2019 when the program commenced) then hole number and wedge number (W2 for wedge two)
c.True width of intercepts are calculated based on intersection angle of dominant fabric of rock and core axis
The drilling results for Hemlo contained in this MD&A have been prepared in accordance with National Instrument 43-101 – Standards of Disclosure for Mineral Projects. All drill hole assay information has been manually reviewed and approved by staff geologists and re-checked by the project manager. Sample preparation and analyses are conducted by ALS Minerals. Procedures are employed to ensure security of samples during their delivery from the drill rig to the laboratory. The quality assurance procedures, data verification and assay protocols used in connection with drilling and sampling at Hemlo conform to industry accepted quality control methods.
9Alturas-Del Carmen Significant Interceptsa
| | | | | | | | | | | | | | | | | |
| Drill Results from Q2 2020 | | | | | |
| Drill Hole | Azimuth | Dip | Interval (m) | Width (m)b | Au (g/t) |
| DDH-DCA-40 | 270 | (65) | 221 - 239 | 28.00 | 3.38 |
| | | 221 - 238 | 17.00 | 5.20 |
a.All significant intercepts calculated using a 0.25 gpt Au cutoff and are uncapped; a minimum intercept length of 10m is reported, with internal dilution of no more than 10 consecutive meters below cut-off included in the calculation.
b.True widths uncertain at this stage.
The drilling results for the Alturas-Del Carmen property contained in this MD&A have been prepared in accordance with National Instrument 43-101 – Standards of Disclosure for Mineral Projects. All drill hole assay information has been manually reviewed and approved by staff geologists and re-checked by the project manager. Sample preparation and analyses are conducted by ALS Peru, an independent laboratory. Procedures are employed to ensure security of samples during their delivery from the drill rig to the laboratory. The quality assurance procedures, data verification and assay protocols used in connection with drilling and sampling on the Alturas-Del Carmen property conform to industry accepted quality control methods.
10Veladero Significant Interceptsa
| | | | | | | | | | | | | | | | | |
| Drill Results from Q2 2020 | | | | | |
Drill Holeb | Azimuth | Dip | Interval (m) | Width (m)c | Au (g/t) |
| | | 353 - 440 | 87.00 | 4.08 |
| DDH-958C | 270 | (77) | 189 - 207 | 18.00 | 0.98 |
| | | 230 - 265 | 35.00 | 0.53 |
| DDH-960 | 90 | (80) | 283 - 308 | 25.00 | 0.47 |
| | | | | |
| | | | | |
a.Significant intervals reported with intervals ≥ 15 m and cutoff ≥ 0.3 ppm Au
b.Significant intervals reported with intervals ≥ 15m and ≥ 0.5 ppm Au
c.Due to nature of mineralization in the Veladero orebody, and the angle of intersection to mineralization, all drilled widths approximate true width
| | | | | | | | |
| BARRICK SECOND QUARTER 2020 | 106 | MANAGEMENT'S DISCUSSION AND ANALYSIS |
The drilling results for the Veladero property contained in this MD&A have been prepared in accordance with National Instrument 43-101 Standards of Disclosure for Mineral Projects. All drill hole assay information has been manually reviewed and approved by staff geologists and re-checked by the Mineral Resources Manager. Sample preparation and analysis are conducted at the Alex Stewart Laboratory in Mendoza, an independent laboratory. Procedures are employed to ensure security of samples. The quality assurance procedures, data verification and assay protocols used in connection with drilling and sampling on the Veladero property conform to industry accepted quality control methods.
11Bambadji Significant Interceptsa
| | | | | | | | | | | | | | | | | |
| Drill Results from Q2 2020 | | | | | |
Drill Holeb | Azimuth | Dip | Interval (m) | Width (m)c | Au (g/t) |
| LFDH001 | 270 | (50) | 28.75 - 37.82 | 9.07 | 3.32 |
| LFRC002 | 90 | (55) | 34.00 - 55.00 | 21.00 | 1.00 |
| KBWDH001 | 135 | (55) | 99.60 - 105.25 | 5.65 | 3.41 |
| | | 142.80 - 144.54 | 1.74 | 4.58 |
| | | 192.00 - 200.40 | 8.40 | 1.30 |
| KBWRC002 | 135 | (55) | 91.00 - 113.00 | 22.00 | 0.54 |
| KBWRC005 | 135 | (55) | 55.00 - 78.00 | 23.00 | 1.30 |
| | | 100.00 - 107.00 | 7.00 | 0.93 |
| GFDH001 | 90 | (60) | 47.50 - 81.50 | 34.00 | 1.37 |
a.All intercepts calculated using a 0.5 g/t Au cutoff and are uncapped; minimum intercept width is 2m; internal dilution is equal to or less than 2m total width.
b.Gefa drill hole nomenclature: prospect initial GF (Gefa) followed by type of drilling RC (Reverse Circulation) and DH (Diamond Drilling).
c.True widths uncertain at this stage.
The drilling results for the Bambadji property contained in this MD&A have been prepared in accordance with National Instrument 43-101 – Standards of Disclosure for Mineral Projects. All drill hole assay information has been manually reviewed and approved by staff geologists and re-checked by the project manager. Sample preparation and analyses are conducted by SGS Bamako, an independent laboratory. Procedures are employed to ensure security of samples during their delivery from the drill rig to the laboratory. The quality assurance procedures, data verification and assay protocols used in connection with drilling and sampling on the Bambadji property conform to industry accepted quality control methods.
12Loulo-Goukoto Significant Interceptsa
| | | | | | | | | | | | | | | | | |
| Drill Results from Q2 2020 | | | | | |
Drill Holeb | Azimuth | Dip | Interval (m) | Width (m)c | Au (g/t) |
| | | | | |
| | | | | |
| | | | | |
| | | | | |
| | | | | |
| | | | | |
| | | | | |
| DB1RC007 | 225.69 | (52.79) | 108.00 - 117.00 | 9.00 | 3.42 |
| DB1RC014 | 229.4 | (51.25) | 255.00 - 262.00 | 7.00 | 7.23 |
| | | 25.00 - 27.00 | 2.00 | 0.99 |
| DB1RC016 | 231.32 | (52.78) | 30.00 - 32.00 | 2.00 | 0.85 |
| | | 69.00 - 73.00 | 4.00 | 0.62 |
| | | 76.00 - 78.00 | 2.00 | 0.58 |
| DB1RC017 | 228 | (51) | 92.00 - 95.00 | 3.00 | 0.83 |
| | | 71.00 - 76.00 | 5.00 | 1.68 |
| | | 199.00 - 204.00 | 5.00 | 0.98 |
| DB1RC018 | 227.4 | (52.11) | 215.00 - 217.00 | 2.00 | 1.19 |
| | | | | |
| | | | | |
| | | | | |
| | | | | |
| | | | | |
| | | | | |
| | | 673.20 - 676.40 | 3.20 | 2.28 |
| GKDH520 | 253.17 | (60) | 771.65 - 776.92 | 5.27 | 1.51 |
| | | | | |
| | | | | |
| | | | | |
| | | | | |
| | | | | |
| | | | | |
| | | | | |
| | | | | |
| | | | | |
| | | | | |
| | | 567.85 - 571.05 | 3.20 | 1.72 |
| | | 581.00 - 584.70 | 3.70 | 0.64 |
| | | 593.10 - 595.15 | 2.05 | 1.10 |
| GKUGDH047 | 227.17 | (60.89) | 605.30 - 608.20 | 2.90 | 0.68 |
| | | 568.50 - 579.00 | 10.50 | 0.98 |
| | | 580.00 - 588.40 | 8.40 | 1.04 |
| | | 590.65 - 593.45 | 2.80 | 1.85 |
| GKUGDH048 | 252.99 | (68.26) | 596.00 - 599.00 | 3.00 | 1.23 |
| | | 507.70 - 512.70 | 5.00 | 0.97 |
| GKUGDH049 | 254.46 | (54.89) | 526.30 - 536.55 | 10.25 | 4.25 |
| | | 448.30 - 452.90 | 4.60 | 0.96 |
| | | | | | | | |
| BARRICK SECOND QUARTER 2020 | 107 | MANAGEMENT'S DISCUSSION AND ANALYSIS |
| | | | | | | | | | | | | | | | | |
| | | 462.00 - 464.10 | 2.10 | 1.49 |
| GKUGDH050 | 237.97 | (65.57) | 484.50 - 490.85 | 6.35 | 2.56 |
| | | 425.00 - 429.45 | 4.45 | 1.67 |
| | | 448.45 - 466.00 | 17.55 | 2.39 |
| GKUGDH051 | 236.39 | (64.48) | 494.55 - 499.00 | 4.45 | 2.24 |
| | | 430.00 - 444.00 | 14.00 | 3.64 |
| | | 445.20 - 454.85 | 9.65 | 2.35 |
| | | 455.80 - 459.00 | 3.20 | 3.90 |
| GKUGDH052 | 249.41 | (53.14) | 472.35 - 474.55 | 2.20 | 1.34 |
| | | 413.40 - 424.20 | 10.80 | 1.92 |
| | | 431.65 - 434.15 | 2.50 | 1.08 |
| | | 456.20 - 463.45 | 7.25 | 1.74 |
| | | 464.25 - 470.90 | 6.65 | 1.39 |
| GKUGDH053 | 242.72 | (66.9) | 479.80 - 484.10 | 4.30 | 6.20 |
| | | 536.30 - 538.90 | 2.60 | 0.96 |
| | | 554.65 - 557.40 | 2.75 | 1.52 |
| | | 577.00 - 587.00 | 10.00 | 2.46 |
| GKUGDH054 | 250.54 | (65.6) | 595.75 - 604.70 | 8.95 | 2.28 |
| | | 394.70 - 397.20 | 2.50 | 3.72 |
| | | 477.10 - 480.50 | 3.40 | 1.39 |
| GKUGDH056 | 239.52 | (56.39) | 502.10 - 505.90 | 3.80 | 0.69 |
| | | 411.40 - 416.80 | 5.40 | 2.34 |
| | | 419.05 - 424.95 | 5.90 | 4.47 |
| | | 426.85 - 438.50 | 11.65 | 8.51 |
| | | 443.00 - 445.20 | 2.20 | 1.40 |
| | | 496.30 - 506.15 | 9.85 | 1.16 |
| | | 507.20 - 525.80 | 18.60 | 2.03 |
| | | 528.00 - 530.90 | 2.90 | 1.56 |
| | | 536.85 - 544.60 | 7.75 | 0.58 |
| GKUGDH057 | 232.71 | (62.1) | 551.00 - 562.30 | 11.30 | 1.36 |
| | | 464.00 - 482.05 | 18.05 | 6.57 |
| | | 483.90 - 490.35 | 6.45 | 0.68 |
| | | 517.00 - 519.20 | 2.20 | 1.75 |
| | | 524.80 - 537.00 | 12.20 | 2.43 |
| GKUGDH058 | 243.13 | (64.94) | 540.00 - 546.00 | 6.00 | 4.11 |
| | | 411.55 - 416.80 | 5.25 | 1.21 |
| | | 463.00 - 465.00 | 2.00 | 0.73 |
| | | 469.00 - 479.25 | 10.25 | 1.45 |
| | | 491.80 - 495.00 | 3.20 | 1.12 |
| GKUGDH059 | 248.62 | (72.6) | 529.00 - 532.95 | 3.95 | 1.06 |
| | | 245.75 - 248.55 | 2.80 | 2.85 |
| GKUGDH061 | 254.99 | (50.72) | 296.85 - 315.55 | 18.70 | 5.52 |
| | | 426.20 - 433.35 | 7.15 | 1.68 |
| | | 446.35 - 452.05 | 5.70 | 2.59 |
| | | 529.90 - 534.10 | 4.20 | 0.72 |
| GKUGDH064 | 269.79 | (64.31) | 539.20 - 547.95 | 8.75 | 1.04 |
| GKUGDH075 | 252.5 | (57) | 463.10 - 476.00 | 12.90 | 2.63 |
| | | | | |
| | | | | |
| | | | | |
| | | | | |
| | | | | |
| | | | | |
| | | | | |
| | | | | |
| | | | | |
| | | | | |
| | | | | |
| | | | | |
| | | | | |
| | | | | |
| | | | | |
| | | | | |
| | | | | |
| L3DH250 | 228.1 | (50.9) | 322.00 - 346.80 | 24.80 | 7.51 |
| | | 570.65 - 579.05 | 8.40 | 2.27 |
| L3DH251B | 214 | (59.37) | 581.25 - 587.35 | 6.10 | 5.81 |
| | | 218.80 - 222.55 | 3.75 | 1.74 |
| | | 234.00 - 237.95 | 3.95 | 0.57 |
| L3DH252B | 235.28 | (52.12) | 240.80 - 243.45 | 2.65 | 0.52 |
| L3DH253 | 258.08 | (49.8) | 256.60 - 263.40 | 6.80 | 2.08 |
| | | 358.60 - 363.30 | 4.70 | 10.52 |
| | | | | | | | |
| BARRICK SECOND QUARTER 2020 | 108 | MANAGEMENT'S DISCUSSION AND ANALYSIS |
| | | | | | | | | | | | | | | | | |
| L3DH254 | 245.15 | (73.33) | 365.40 - 367.60 | 2.20 | 6.45 |
| | | 594.95 - 620.10 | 25.15 | 3.12 |
| | | 622.00 - 628.85 | 6.85 | 5.81 |
| L3DH265 | 217.16 | (61.14) | 633.85 - 638.30 | 4.45 | 3.40 |
| | | 342.50 - 345.90 | 3.40 | 1.26 |
| L3DH267 | 226.35 | (60.68) | 359.90 - 363.80 | 3.90 | 4.73 |
| L3DH270 | 223.29 | (60.83) | 434.70 - 440.05 | 5.35 | 2.46 |
| | | | | |
| | | | | |
| | | | | |
| | | | | |
| | | | | |
| YADH148 | 68 | (61) | 920.80 - 932.30 | 11.50 | 1.85 |
| YADH156 | 67 | (60) | 970.70 - 985.00 | 14.30 | 2.63 |
| YADH160 | 68.89 | (62.2) | 988.30 - 995.20 | 6.90 | 5.19 |
| | | | | |
| YADH43 | 76 | (74) | 836.70 - 844.00 | 7.30 | 7.24 |
| | | | | |
| | | | | |
| | | | | |
| | | | | |
| | | | | |
| | | | | |
| | | | | |
| | | | | |
| | | | | |
| | | | | |
| | | 1,097.80 - 1,110.60 | 12.80 | 5.51 |
| | | 1,112.80 - 1,115.20 | 2.40 | 0.81 |
| | | 1,131.00 - 1,133.10 | 2.10 | 1.37 |
| | | 1,136.45 - 1,141.00 | 4.55 | 5.50 |
| | | 1,143.10 - 1,154.00 | 10.90 | 5.95 |
| YADH60 | 57 | (72) | 1,155.15 - 1,163.00 | 7.85 | 2.31 |
| YADH61 | 74 | (65) | 911.00 - 926.40 | 15.40 | 6.88 |
| | | 1,192.40 - 1,209.80 | 17.40 | 15.68 |
| | | 1,211.00 - 1,213.70 | 2.70 | 1.29 |
| | | 1,233.80 - 1,236.30 | 2.50 | 4.74 |
| YADH63 | 58 | (66) | 1,244.95 - 1,249.10 | 4.15 | 6.22 |
| | | | | |
| | | | | |
| | | | | |
| | | | | |
| | | | | |
| | | | | |
| | | | | |
| | | | | |
| | | | | |
| | | | | |
| | | | | |
| | | | | |
| | | | | |
| | | | | |
| | | | | |
| | | 954.75 - 963.40 | 8.65 | 2.70 |
| | | 978.70 - 983.30 | 4.60 | 0.93 |
| | | 984.37 - 987.60 | 3.23 | 0.55 |
| YADH72 | 66 | (63) | 988.80 - 995.00 | 6.20 | 0.59 |
| | | | | |
| | | | | |
| | | | | |
| | | | | |
| | | | | |
| | | | | |
| | | | | |
| | | | | |
| | | | | |
| | | | | |
| | | | | |
| | | | | |
| | | | | |
| | | | | |
| | | | | |
| | | | | |
| | | | | |
| | | 1,102.05 - 1,117.00 | 14.95 | 7.34 |
| YDH297 | 50.49 | (77.32) | 1,117.90 - 1,126.60 | 8.70 | 5.22 |
| | | 1,116.70 - 1,126.75 | 10.05 | 3.06 |
| | | 1,162.50 - 1,165.30 | 2.80 | 0.70 |
| YDH298 | 59.22 | (75.37) | 1,197.50 - 1,201.50 | 4.00 | 7.01 |
a.All intercepts calculated using a 0.5 g/t Au cutoff and are uncapped; minimum intercept width is 2m; internal dilution is equal to or less than 2m total width.
b.Loulo – Gounkoto drill hole nomenclature: prospect initial Y/YA (Yalea), L2 & L2MARS (Loulo 2), L3L2 (Loulo 3 - Loulo 2), L3 (Loulo 3), GK (Gounkoto), GKUG (Gounkoto Underground) GKAGC (Gounkoto Advanced Grade Control), DB1 (Domain Boundary 1) followed by type of drilling RC (Reverse Circulation) and DH (Diamond Drilling).
c.True widths uncertain at this stage.
The drilling results for the Loulo-Gounkoto property contained in this MD&A have been prepared in accordance with National Instrument 43-101 – Standards of Disclosure for Mineral Projects. All drill hole assay information has been manually reviewed and approved by staff geologists and re-checked by the project manager. Sample preparation and analyses are conducted by SGS Bamako, an independent laboratory. Industry accepted best practices for preparation and fire assaying procedures are utilized to determine gold content. Procedures are employed to ensure security of samples during their delivery from the drill rig to the laboratory. The quality assurance procedures, data verification and assay protocols used in connection with drilling and sampling on the Loulo property conform to industry accepted quality control methods.
| | | | | | | | |
| BARRICK SECOND QUARTER 2020 | 109 | MANAGEMENT'S DISCUSSION AND ANALYSIS |
13Tiebila East Significant Drill Interceptsa
| | | | | | | | | | | | | | | | | |
| Drill Results from Q2 2020 | | | | | |
Drill Holeb | Azimuth | Dip | Interval (m) | Width (m)c | Au (g/t) |
| | | 26.00 - 29.00 | 3.00 | 0.59 |
| TBRC001 | 300 | (50) | 46.00 - 53.00 | 7.00 | 1.39 |
| | | 36.00 - 38.00 | 2.00 | 1.16 |
| | | 79.00 - 83.00 | 4.00 | 2.07 |
| TBRC002 | 300 | (50) | 102.00 - 104.00 | 2.00 | 1.51 |
| | | 73.00 - 75.00 | 2.00 | 0.65 |
| | | 91.00 - 95.00 | 4.00 | 2.48 |
| | | 113.00 - 117.00 | 4.00 | 1.35 |
| TBRC003 | 300 | (50) | 143.00 - 149.00 | 6.00 | 1.56 |
| | | 67.00 - 92.00 | 25.00 | 2.10 |
| TBRC004 | 300 | (50) | 99.00 - 101.00 | 2.00 | 1.03 |
| | | 42.00 - 44.00 | 2.00 | 0.91 |
| | | 53.00 - 59.00 | 6.00 | 0.83 |
| | | 67.00 - 69.00 | 2.00 | 1.28 |
| | | 71.00 - 73.00 | 2.00 | 0.64 |
| TBRC006 | 300 | (50) | 80.00 - 97.00 | 17.00 | 0.72 |
a.All intercepts calculated using a 0.5 g/t Au cutoff and are uncapped; minimum intercept width is 2m; internal dilution is equal to or less than 25% total width.
b.Tiebila East drill hole nomenclature: prospect initial TB (Tiebila) followed by type of drilling RC (Reverse Circulation)
c.True widths uncertain at this stage.
The drilling results for the Nielle property contained in this MD&A have been prepared in accordance with National Instrument 43-101 – Standards of Disclosure for Mineral Projects. All drill hole assay information has been manually reviewed and approved by staff geologists and re-checked by the project manager. Sample preparation and analyses are conducted by SGS, an independent laboratory. Procedures are employed to ensure security of samples during their delivery from the drill rig to the laboratory. The quality assurance procedures, data verification and assay protocols used in connection with drilling and sampling on the Nielle property conform to industry accepted quality control methods.
14Kibali Significant Interceptsa
| | | | | | | | | | | | | | | | | |
| Drill Results from Q2 2020 | | | | | |
Drill Holeb | Azimuth | Dip | Interval (m) | Width (m)c | Cu (%) |
| KKDD047 | 155 | (70) | 310.00 - 319.20 | 9.20 | 3.97 |
| KKDD049 | 155 | (70) | 306.50 - 311.60 | 5.10 | 1.16 |
| MMRC0025 | 215 | (60) | 43.00 - 51.00 | 8.00 | 2.96 |
| MMRC0026 | 215 | (60) | 42.00 - 49.00 | 7.00 | 1.08 |
| MMRC0027 | 180 | (60) | 18.00 - 20.00 | 2.00 | 0.62 |
| MMRC0030 | 165 | (60) | 8.00 - 17.00 | 9.00 | 0.70 |
| MMRC0031 | 165 | (60) | 60.00 - 62.00 | 2.00 | 1.70 |
| MMRC0032 | 165 | (60) | 125.00 - 127.00 | 2.00 | 0.63 |
| | | 8.00 - 12.00 | 4.00 | 3.09 |
| MMRC0035 | 165 | (60) | 64.00 - 66.00 | 2.00 | 1.86 |
| MMRC0036 | 160 | (80) | 16.00 - 21.00 | 5.00 | 0.60 |
a.All intercepts calculated using a 0.5 g/t Au cutoff and are uncapped; minimum intercept width is 2m; internal dilution is equal to or less than 2m total width.
b.Kibali drill hole nomenclature: prospect initial KK (Kombokolo), MM (Memekazi) followed by type of drilling RC (Reverse Circulation) and DD (Diamond Drilling)
c.True widths uncertain at this stage.
The drilling results for the Kibali property contained in this MD&A have been prepared in accordance with National Instrument 43-101 –Standards of Disclosure for Mineral Projects. All drill hole assay information has been manually reviewed and
| | | | | | | | |
| BARRICK SECOND QUARTER 2020 | 110 | MANAGEMENT'S DISCUSSION AND ANALYSIS |
approved by staff geologists and re-checked by the project manager. Sample preparation and analyses are conducted by SGS, an independent laboratory. Industry accepted best practices for preparation and fire assaying procedures are utilized to determine gold content. Procedures are employed to ensure security of samples during their delivery from the drill rig to the laboratory. The quality assurance procedures, data verification and assay protocols used in connection with drilling and sampling on the Kibali property conform to industry accepted quality control methods.
15Jabal Sayid Significant Interceptsa
| | | | | | | | | | | | | | | | | |
| Drill Results from Q2 2020 | | | | | |
Drill Holeb | Azimuth | Dip | Interval (m) | Width (m)c | Cu (%) |
| | | | | |
| | | 508.00 - 517.13 | 9.13 | 2.77 |
| | | 534.00 - 546.00 | 12.00 | 2.57 |
| BDH2063 | 88 | (60) | 548.00 - 550.00 | 2.00 | 1.80 |
| | | 114.00 - 116.00 | 2.00 | 1.82 |
| JED2502 | 215 | (21) | 120.71 - 123.00 | 2.29 | 2.75 |
| | | 146.00 - 148.00 | 2.00 | 2.37 |
| | | 151.65 - 155.95 | 4.30 | 3.43 |
| JED2503 | 225 | (1) | 174.00 - 176.00 | 2.00 | 2.70 |
| JED2507 | 245 | (1) | 149.00 - 151.00 | 2.00 | 2.20 |
a.All intercepts calculated using a 1.5% Cu cutoff and are uncapped; minimum intercept width is 2m; internal dilution is equal to or less than 2m total width.
b.Jabal Sayid drill hole nomenclature: project initial JS (Jabal Sayid), prospect initial SE (SE) followed by hole number.
c.True widths uncertain at this stage.
The drilling results for the Jabal Sayid property contained in this MD&A have been prepared in accordance with National Instrument 43-101 –Standards of Disclosure for Mineral Projects. All drill hole assay information has been manually reviewed and approved by staff geologists and re-checked by the project manager. Sample preparation and analyses are conducted by ALS Jeddah, an independent laboratory. Procedures are employed to ensure security of samples during their delivery from the drill rig to the laboratory. The quality assurance procedures, data verification and assay protocols used in connection with drilling and sampling on the Jabal Sayid property conform to industry accepted quality control methods.
16Barrick defines a Tier One mine as one that produces in excess of 500,000 ounces of gold per annum and has a life of at least 10 years.
| | | | | | | | |
| BARRICK SECOND QUARTER 2020 | 111 | MANAGEMENT'S DISCUSSION AND ANALYSIS |
Consolidated Statements of Income
| | | | | | | | | | | | | | |
Barrick Gold Corporation
(in millions of United States dollars, except per share data) (Unaudited) | Three months ended June 30, | | Six months ended June 30, | |
| | 2020 | 2019 | 2020 | 2019 |
| Revenue (notes 5 and 6) | $3,055 | | $2,063 | | $5,776 | | $4,156 | |
| Costs and expenses (income) | | | | |
| Cost of sales (notes 5 and 7) | 1,900 | | 1,545 | | 3,676 | | 3,035 | |
| General and administrative expenses | 71 | | 59 | | 111 | | 113 | |
| Exploration, evaluation and project expenses | 78 | | 98 | | 149 | | 172 | |
| Impairment (reversals) charges (notes 9B and 13) | 23 | | 12 | | (313) | | 15 | |
| Loss (gain) on currency translation | 2 | | (6) | | 18 | | 16 | |
| Closed mine rehabilitation | 7 | | 16 | | 97 | | 41 | |
| Income from equity investees (note 12) | (61) | | (50) | | (115) | | (78) | |
| | | | |
| Other expense (note 9A) | 73 | | 7 | | 38 | | 33 | |
| Income before finance costs and income taxes | $962 | | $382 | | $2,115 | | $809 | |
| Finance costs, net | (82) | | (118) | | (186) | | (238) | |
| Income before income taxes | $880 | | $264 | | $1,929 | | $571 | |
| Income tax expense (note 10) | (258) | | (41) | | (644) | | (208) | |
| Net income | $622 | | $223 | | $1,285 | | $363 | |
| Attributable to: | | | | |
| Equity holders of Barrick Gold Corporation | $357 | | $194 | | $757 | | $305 | |
| Non-controlling interests | $265 | | $29 | | $528 | | $58 | |
| | | | |
| Earnings per share data attributable to the equity holders of Barrick Gold Corporation (note 8) | | | | |
| Net income | | | | |
| Basic | $0.20 | | $0.11 | | $0.43 | | $0.17 | |
| Diluted | $0.20 | | $0.11 | | $0.43 | | $0.17 | |
| | | | |
| | | | |
| | | | |
| | | | |
| | | | |
| | | | |
| | | | |
The accompanying notes are an integral part of these condensed interim consolidated financial statements.
| | | | | | | | |
| BARRICK SECOND QUARTER 2020 | 112 | FINANCIAL STATEMENTS (UNAUDITED) |
Consolidated Statements of Comprehensive Income
| | | | | | | | | | | | | | |
Barrick Gold Corporation (in millions of United States dollars) (Unaudited) | Three months ended June 30, | | Six months ended June 30, | |
| | 2020 | 2019 | 2020 | 2019 |
| Net income | $622 | | $223 | | $1,285 | | $363 | |
| Other comprehensive (loss) income, net of taxes | | | | |
| Items that may be reclassified subsequently to profit or loss: | | | | |
| Unrealized gains (losses) on derivatives designated as cash flow hedges, net of tax $nil, $nil, $nil and $nil | (2) | | — | | (1) | | — | |
| | | | |
| Currency translation adjustments, net of tax $nil, $nil, $nil and $nil | (1) | | (1) | | (5) | | (3) | |
| Items that will not be reclassified to profit or loss: | | | | |
| Actuarial gain (loss) on post employment benefit obligations, net of tax ($3), $nil, $nil and $nil | (5) | | — | | (2) | | — | |
| Net change on equity investments, net of tax $nil, $nil, $nil and $nil | 118 | | 11 | | 93 | | 7 | |
| | | | |
| Total other comprehensive income | 110 | | 10 | | 85 | | 4 | |
| Total comprehensive income | $732 | | $233 | | $1,370 | | $367 | |
| Attributable to: | | | | |
| Equity holders of Barrick Gold Corporation | $467 | | $204 | | $842 | | $309 | |
| Non-controlling interests | $265 | | $29 | | $528 | | $58 | |
| | | | |
| | | | |
| | | | |
| | | | |
| | | | |
| | | | |
The accompanying notes are an integral part of these condensed interim consolidated financial statements.
| | | | | | | | |
| BARRICK SECOND QUARTER 2020 | 113 | FINANCIAL STATEMENTS (UNAUDITED) |
Consolidated Statements of Cash Flow
| | | | | | | | | | | | | | |
Barrick Gold Corporation
(in millions of United States dollars) (Unaudited) | Three months ended June 30, | | Six months ended June 30, | |
| | 2020 | 2019 | 2020 | 2019 |
| OPERATING ACTIVITIES | | | | |
| Net income | $622 | | $223 | | $1,285 | | $363 | |
| Adjustments for the following items: | | | | |
| Depreciation | 566 | | 466 | | 1,090 | | 901 | |
| Finance costs, net | 86 | | 125 | | 197 | | 252 | |
| Impairment (reversals) charges (notes 9B and 13) | 23 | | 12 | | (313) | | 15 | |
| Income tax expense (note 10) | 258 | | 41 | | 644 | | 208 | |
| | | | |
| Loss (gain) on sale of non-current assets | 8 | | (12) | | (52) | | (12) | |
| Loss (gain) on currency translation | 2 | | (6) | | 18 | | 16 | |
| Change in working capital (note 11) | (9) | | (82) | | (341) | | (330) | |
| Other operating activities (note 11) | (35) | | 38 | | 18 | | 14 | |
| Operating cash flows before interest and income taxes | 1,521 | | 805 | | 2,546 | | 1,427 | |
| Interest paid | (130) | | (137) | | (154) | | (165) | |
| Income taxes paid | (360) | | (234) | | (472) | | (308) | |
| Net cash provided by operating activities | 1,031 | | 434 | | 1,920 | | 954 | |
| INVESTING ACTIVITIES | | | | |
| Property, plant and equipment | | | | |
| Capital expenditures (note 5) | (509) | | (379) | | (960) | | (753) | |
| Sales proceeds | 9 | | 15 | | 16 | | 18 | |
| Investment sales (purchases) | 206 | | (4) | | 206 | | (7) | |
| Divestitures (note 4) | — | | — | | 256 | | — | |
| Cash acquired in merger | — | | — | | — | | 751 | |
| Other investing activities (note 11) | 30 | | 17 | | 55 | | 62 | |
| Net cash provided by (used in) investing activities | (264) | | (351) | | (427) | | 71 | |
| FINANCING ACTIVITIES | | | | |
| | | | |
| Lease repayments | (7) | | (6) | | (12) | | (18) | |
| | | | |
| | | | |
| Debt repayments | — | | — | | (351) | | (16) | |
| Dividends | (124) | | (61) | | (246) | | (394) | |
| Funding from non-controlling interests | — | | 8 | | 1 | | 14 | |
| Disbursements to non-controlling interests | (217) | | (23) | | (434) | | (28) | |
| Other financing activities | — | | — | | (15) | | — | |
| Net cash used in financing activities | (348) | | (82) | | (1,057) | | (442) | |
| Effect of exchange rate changes on cash and equivalents | (3) | | (1) | | (7) | | (1) | |
| Net increase in cash and equivalents | 416 | | — | | 429 | | 582 | |
| Cash and equivalents at the beginning of period | 3,327 | | 2,153 | | 3,314 | | 1,571 | |
| Cash and equivalents at the end of period | $3,743 | | $2,153 | | $3,743 | | $2,153 | |
| | | | |
| | | | |
| | | | |
| | | | |
| | | | |
| | | | |
| | | | |
| | | | |
| | | | |
The accompanying notes are an integral part of these condensed interim consolidated financial statements.
| | | | | | | | |
| BARRICK SECOND QUARTER 2020 | 114 | FINANCIAL STATEMENTS (UNAUDITED) |
Consolidated Balance Sheets
| | | | | | | | |
Barrick Gold Corporation
(in millions of United States dollars) (Unaudited) | As at June 30, | As at December 31, |
| | 2020 | 2019 |
| ASSETS | | |
| Current assets | | |
| Cash and equivalents (note 14A) | $3,743 | | $3,314 | |
| Accounts receivable | 407 | | 363 | |
| Inventories | 2,160 | | 2,289 | |
| Other current assets | 609 | | 565 | |
| Total current assets (excluding assets classified as held for sale) | $6,919 | | $6,531 | |
| Assets classified as held for sale (note 4A) | — | | 356 | |
| Total current assets | $6,919 | | $6,887 | |
| Non-current assets | | |
| Equity in investees (note 12) | 4,587 | | 4,527 | |
| Property, plant and equipment | 24,727 | | 24,141 | |
| Goodwill | 4,769 | | 4,769 | |
| Intangible assets | 214 | | 226 | |
| Deferred income tax assets | 143 | | 235 | |
| Non-current portion of inventory | 2,460 | | 2,300 | |
| Other assets | 1,361 | | 1,307 | |
| Total assets | $45,180 | | $44,392 | |
| LIABILITIES AND EQUITY | | |
| Current liabilities | | |
| Accounts payable | $1,072 | | $1,155 | |
| Debt (note 14B) | 26 | | 375 | |
| Current income tax liabilities | 122 | | 224 | |
| Other current liabilities | 591 | | 622 | |
| Total current liabilities | $1,811 | | $2,376 | |
| Non-current liabilities | | |
| Debt (note 14B) | 5,142 | | 5,161 | |
| Provisions | 3,291 | | 3,114 | |
| Deferred income tax liabilities | 3,106 | | 3,091 | |
| Other liabilities | 1,084 | | 823 | |
| Total liabilities | $14,434 | | $14,565 | |
| Equity | | |
| Capital stock (note 16) | $29,234 | | $29,231 | |
| Deficit | (9,214) | | (9,722) | |
| Accumulated other comprehensive loss | (37) | | (122) | |
| Other | 2,049 | | 2,045 | |
| Total equity attributable to Barrick Gold Corporation shareholders | $22,032 | | $21,432 | |
| Non-controlling interests | 8,714 | | 8,395 | |
| Total equity | $30,746 | | $29,827 | |
| Contingencies and commitments (notes 5 and 17) | | |
| Total liabilities and equity | $45,180 | | $44,392 | |
| | |
| | |
| | |
| | |
| | |
| | |
| | |
| | |
| | |
| | |
| | |
The accompanying notes are an integral part of these condensed interim consolidated financial statements.
| | | | | | | | |
| BARRICK SECOND QUARTER 2020 | 115 | FINANCIAL STATEMENTS (UNAUDITED) |
Consolidated Statements of Changes in Equity
| | | | | | | | | | | | | | | | | | | | | | | | | | | | | |
| Barrick Gold Corporation | | Attributable to equity holders of the company | | | | | | | | | |
| (in millions of United States dollars) (Unaudited) | Common Shares (in thousands) | Capital stock | Retained earnings (deficit) | Accumulated other comprehensive income (loss)1 | Other2 | Total equity attributable to shareholders | Non-controlling interests | Total equity | | | |
| At January 1, 2020 | 1,777,927 | | $29,231 | | ($9,722) | | ($122) | | $2,045 | | $21,432 | | $8,395 | | $29,827 | | | | |
| Net income | — | | — | | 757 | | — | | — | | 757 | | 528 | | 1,285 | | | | |
| Total other comprehensive income (loss) | — | | — | | — | | 85 | | — | | 85 | | — | | 85 | | | | |
| Total comprehensive income | — | | — | | 757 | | 85 | | — | | 842 | | 528 | | 1,370 | | | | |
| Transactions with owners | | | | | | | | | | | |
| Dividends | — | | — | | (246) | | — | | — | | (246) | | — | | (246) | | | | |
| Issuance of 16% interest in Tanzania mines (note 13) | — | | — | | — | | — | | — | | — | | 238 | | 238 | | | | |
| | | | | | | | | | | |
| | | | | | | | | | | |
| Issued on exercise of stock options | 40 | | — | | — | | — | | — | | — | | — | | — | | | | |
| Funding from non-controlling interests | — | | — | | — | | — | | — | | — | | 1 | | 1 | | | | |
| Disbursements to non-controlling interests | — | | — | | — | | — | | — | | — | | (448) | | (448) | | | | |
| Dividend reinvestment plan (note 16) | 101 | | 3 | | (3) | | — | | — | | — | | — | | — | | | | |
| Share-based payments | — | | — | | — | | — | | 4 | | 4 | | — | | 4 | | | | |
| Total transactions with owners | 141 | | 3 | | (249) | | — | | 4 | | (242) | | (209) | | (451) | | | | |
| At June 30, 2020 | 1,778,068 | | $29,234 | | ($9,214) | | ($37) | | $2,049 | | $22,032 | | $8,714 | | $30,746 | | | | |
| | | | | | | | | | | |
| | | | | | | | | | | |
| | | | | | | | | | | |
| At January 1, 2019 | 1,167,847 | | $20,883 | | ($13,453) | | ($158) | | $321 | | $7,593 | | $1,792 | | $9,385 | | | | |
| Net income | — | | — | | 305 | | — | | — | | 305 | | 58 | | 363 | | | | |
| Total other comprehensive income | — | | — | | — | | 4 | | — | | 4 | | — | | 4 | | | | |
| Total comprehensive income | — | | — | | 305 | | 4 | | — | | 309 | | 58 | | 367 | | | | |
| Transactions with owners | | | | | | | | | | | |
| Dividends | — | | — | | (64) | | — | | — | | (64) | | — | | (64) | | | | |
| Merger with Randgold Resources Limited | 583,669 | | 7,903 | | — | | — | | — | | 7,903 | | 885 | | 8,788 | | | | |
| | | | | | | | | | | |
| Issued on exercise of stock options | 25 | | — | | — | | — | | — | | — | | — | | — | | | | |
| Funding from non-controlling interests | — | | — | | — | | — | | — | | — | | 14 | | 14 | | | | |
| Disbursements to non-controlling interests | — | | — | | — | | — | | — | | — | | (28) | | (28) | | | | |
| Dividend reinvestment plan (note 16) | 1,128 | | 15 | | (15) | | — | | — | | — | | — | | — | | | | |
| Share-based payments | — | | — | | — | | — | | 5 | | 5 | | — | | 5 | | | | |
| Total transactions with owners | 584,822 | | 7,918 | | (79) | | — | | 5 | | 7,844 | | 871 | | 8,715 | | | | |
| At June 30, 2019 | 1,752,669 | | $28,801 | | ($13,227) | | ($154) | | $326 | | $15,746 | | $2,721 | | $18,467 | | | | |
| | | | | | | | | | | |
| | | | | | | | | | | |
| | | | | | | | | | | |
| | | | | | | | | | | |
| | | | | | | | | | | |
| | | | | | | | | | | |
| | | | | | | | | | | |
| | | | | | | | | | | |
| | | | | | | | | | | |
| | | | | | | | | | | |
| | | | | | | | | | | |
1Includes cumulative translation losses at June 30, 2020: $92 million (June 30, 2019: $84 million).
2Includes additional paid-in capital as at June 30, 2020: $2,011 million (December 31, 2019: $2,007 million; June 30, 2019: $283 million).
The accompanying notes are an integral part of these condensed interim consolidated financial statements.
| | | | | | | | |
| BARRICK SECOND QUARTER 2020 | 116 | FINANCIAL STATEMENTS (UNAUDITED) |
NOTES TO CONSOLIDATED
FINANCIAL STATEMENTS
Barrick Gold Corporation. Tabular dollar amounts in millions of United States dollars, unless otherwise shown.
1 > CORPORATE INFORMATION
Barrick Gold Corporation (“Barrick”, “we” or the “Company”) is a corporation governed by the Business Corporations Act (British Columbia). The Company’s head office is located at Brookfield Place, TD Canada Trust Tower, 161 Bay Street, Suite 3700, Toronto, Ontario, M5J 2S1. The Company’s registered office is 925 West Georgia Street, Suite 1600, Vancouver, British Columbia, V6C 3L2. We are principally engaged in the production and sale of gold and copper, as well as related activities such as exploration and mine development. We sell our gold and copper into the world market.
We have ownership interests in producing gold mines that are located in Argentina, Canada, Côte d'Ivoire, the Democratic Republic of Congo, the Dominican Republic, Mali, Papua New Guinea, Tanzania and the United States. We have ownership interests in producing copper mines in Chile, Saudi Arabia and Zambia. We also have various projects located throughout the Americas.
2 > SIGNIFICANT ACCOUNTING POLICIES
A) Statement of Compliance
These condensed interim consolidated financial statements have been prepared in accordance with International Accounting Standard 34 Interim Financial Reporting (“IAS 34”) as issued by the International Accounting Standards Board (“IASB”). These interim financial statements should be read in conjunction with Barrick’s most recently issued Annual Report which includes information necessary or useful to understanding the Company’s business and financial statement presentation. In particular, the Company’s significant accounting policies were presented in Note 2 of the Annual Consolidated Financial Statements for the year ended December 31, 2019 ("2019 Annual Financial Statements"), and have been consistently applied in the preparation of these interim financial statements, except as otherwise noted in Note 2B. These condensed interim consolidated financial statements were authorized for issuance by the Board of Directors on August 7, 2020.
B) New Accounting Standards Issued But Not Yet Effective
Certain new accounting standards and interpretations have been published that are not mandatory for the current period and have not been early adopted. These standards are not expected to have a material impact on Barrick in the current or future reporting periods.
3 > SIGNIFICANT JUDGMENTS, ESTIMATES, ASSUMPTIONS AND RISKS
The judgments, estimates, assumptions and risks discussed here reflect updates from the 2019 Annual Financial Statements. For judgments, estimates, assumptions and risks related to other areas not discussed in these interim consolidated financial statements, please refer to Notes 3 and 28 of the 2019 Annual Financial Statements.
A) Provision for Environmental Rehabilitation (“PER”)
Provisions are updated each reporting period for changes to expected cash flows and for the effect of changes in the discount rate and foreign exchange rates. The change in estimate is added or deducted from the related asset and depreciated over the expected economic life of the operation to which it relates. We recorded a net increase of $nil (2019: $69 million net increase) to the PER at our minesites for the three months ended June 30, 2020 and a net increase of $136 million (2019: $271 million net increase) for the six months ended June 30, 2020 primarily due to a decrease in the discount rate.
Adjustments to the estimated amount and timing of future closure and rehabilitation cash flows are a normal occurrence in light of the significant judgments and estimates involved. Rehabilitation provisions are adjusted as a result of changes in estimates and assumptions and are accounted for prospectively. In the fourth quarter of each year, our life of mine plans are updated and that typically results in an update to the rehabilitation provision.
B) Pascua-Lama
The Pascua-Lama project received $394 million as at June 30, 2020 (December 31, 2019: $424 million) in value added tax (“VAT”) refunds in Chile relating to the development of the Chilean side of the project. Under the current arrangement this amount must be repaid if the project does not evidence exports for an amount of $3,538 million within a term that expires on December 31, 2026, unless extended. Interest on this amount would accrue from the date of non-compliance.
In addition, we have recorded $63 million in VAT recoverable in Argentina as at June 30, 2020 (December 31, 2019: $72 million) relating to the development of the Argentinean side of the project. These amounts may not be fully recoverable if the project does not enter into production and are subject to foreign currency risk as the amounts are recoverable in Argentine pesos.
C) Contingencies
Contingencies can be either possible assets or possible liabilities arising from past events which, by their nature, will be resolved only when one or more future events, not wholly within our control, occur or fail to occur. The assessment of such contingencies inherently involves the exercise of significant judgment and estimates of the outcome of future events. Refer to note 17 for further details on contingencies.
D) Covid-19
On March 11, 2020, the Covid-19 outbreak was declared a pandemic by the World Health Organization. The outbreak
| | | | | | | | |
| BARRICK SECOND QUARTER 2020 | 117 | NOTES TO FINANCIAL STATEMENTS (UNAUDITED) |
and efforts to contain it have had a significant effect on commodity prices and capital markets. Although we have adapted certain operating procedures to respond to Covid-19 to date, our operations have not been significantly impacted by the pandemic with the exception of Veladero. In Argentina, a mandatory nationwide quarantine was lifted in April, while movement and social distancing restrictions slowed the remobilization of employees and contractors back to Veladero. Notwithstanding the proactive and considered actions taken to maintain a safe workplace, it is possible that in the future there will be negative impacts on our operations or supply chain and the pandemic may trigger actions such as reduced mining and production activities at our operations. This could have a material adverse effect on our cash flows, earnings, results of operations and financial position.
Our sites have continued to produce and sell their production, with no significant disruptions to date, with the exception of Veladero as noted above. Our ability to maintain production across our operations combined with increased market gold prices, has resulted in Barrick being able to deliver strong operating cash flow in the first half of 2020. Barrick has $3.7 billion in cash, an undrawn $3.0 billion credit facility and no significant debt repayments due until 2033, providing us with sufficient liquidity to manage through this period of uncertainty.
While we have not experienced any significant negative impact to date, the extent to which Covid-19 impacts future business activity or financial results, and the duration of any such negative impact, will depend on future developments, which are highly uncertain and unknown at this time.
4 > ACQUISITIONS AND DIVESTITURES
A) Massawa Project
On March 4, 2020, Barrick and our Senegalese joint venture partner completed the sale of our aggregate 90% interest in the Massawa project (“Massawa”) in Senegal to Teranga Gold Corporation (“Teranga”) for total consideration fair valued at $440 million on the date of closing. Barrick received 92.5% of the consideration for its interest in the Massawa project, with the balance received by Barrick’s local Senegalese partner. Barrick received a net of $256 million in cash and 19,164,403 Teranga common shares (worth $104 million at the date of closing) plus a contingent payment of up to $46.25 million based on the three year average gold price, which was valued at $28 million at the date of closing. The cash consideration received was net of $25 million that Barrick provided through its participation in the $225 million syndicated debt financing facility secured by Teranga in connection with the transaction. The facility has a final repayment date of December 31, 2022. The difference between the fair value of consideration received and the carrying value of the assets on closing was $54 million and was recognized as a gain in the first quarter of 2020.
| | | | | | | | |
| BARRICK SECOND QUARTER 2020 | 118 | NOTES TO FINANCIAL STATEMENTS (UNAUDITED) |
5 > SEGMENT INFORMATION
Barrick’s business is organized into eighteen minesites and one project. Barrick’s Chief Operating Decision Maker ("CODM") (Mark Bristow, President and Chief Executive Officer) reviews the operating results, assesses performance and makes capital allocation decisions at the minesite, Company and/or project level. Each individual minesite and the Pascua-Lama project are operating segments for financial reporting purposes. Our presentation of our reportable operating segments consists of nine gold mines (Carlin, Cortez, Turquoise Ridge, Pueblo Viejo, Loulo-Gounkoto, Kibali, Veladero, Porgera and North Mara). The remaining operating segments, including our copper mines, remaining gold mines and project, have been grouped into an “other” category and will not be reported on individually. Segment performance is evaluated based on a number of measures including operating income before tax, production levels and unit production costs. Certain costs are managed on a consolidated basis and are therefore not reflected in segment income. Prior period figures have been restated to reflect the changes made to our reportable operating segments in the prior year.
Consolidated Statement of Income Information
| | | | | | | | | | | | | | | | | | | | | | |
| | | Cost of Sales | | | | | | |
| For the three months ended June 30, 2020 | Revenue | Direct mining, royalties and community relations | Depreciation | Exploration, evaluation and project expenses | Other expenses (income)1 | Segment income (loss) | | |
Carlin2 | $654 | | $325 | | $70 | | $7 | | $6 | | $246 | | | |
Cortez2 | 368 | | 131 | | 56 | | 3 | | — | | 178 | | | |
Turquoise Ridge2 | 218 | | 96 | | 40 | | 4 | | — | | 78 | | | |
Pueblo Viejo2 | 335 | | 124 | | 54 | | 2 | | (2) | | 157 | | | |
Loulo-Gounkoto2 | 340 | | 126 | | 74 | | 4 | | 2 | | 134 | | | |
| Kibali | 164 | | 59 | | 42 | | 1 | | (2) | | 64 | | | |
| Veladero | 62 | | 30 | | 13 | | — | | 3 | | 16 | | | |
| Porgera | 39 | | 20 | | 6 | | — | | 26 | | (13) | | | |
North Mara2 | 139 | | 59 | | 25 | | — | | 2 | | 53 | | | |
Other Mines2,3 | 900 | | 420 | | 218 | | 3 | | 23 | | 236 | | | |
| Reportable segment total | $3,219 | | $1,390 | | $598 | | $24 | | $58 | | $1,149 | | | |
| Share of equity investees | (164) | | (59) | | (42) | | (1) | | 2 | | (64) | | | |
| Segment total | $3,055 | | $1,331 | | $556 | | $23 | | $60 | | $1,085 | | | |
| | | | | | | | |
| | | | | | | | |
| | | | | | | | |
| | | | | | | | |
Consolidated Statement of Income Information
| | | | | | | | | | | | | | | | | | | | | | |
| | | Cost of Sales | | | | | | |
| For the three months ended June 30, 2019 | Revenue | Direct mining, royalties and community relations | Depreciation | Exploration, evaluation and project expenses | Other expenses (income)1 | Segment income (loss) | | |
Carlin2 | $235 | | $150 | | $53 | | $2 | | ($3) | | $33 | | | |
Cortez2 | 368 | | 137 | | 65 | | 2 | | 6 | | 158 | | | |
Turquoise Ridge2 | 110 | | 48 | | 9 | | 1 | | (1) | | 53 | | | |
Pueblo Viejo2 | 314 | | 141 | | 47 | | 3 | | 1 | | 122 | | | |
Loulo-Gounkoto2 | 243 | | 110 | | 87 | | 2 | | 3 | | 41 | | | |
| Kibali | 125 | | 51 | | 31 | | — | | — | | 43 | | | |
| Veladero | 100 | | 57 | | 31 | | 1 | | (1) | | 12 | | | |
| Porgera | 83 | | 57 | | 8 | | 1 | | 1 | | 16 | | | |
North Mara2 | 135 | | 56 | | 25 | | — | | 5 | | 49 | | | |
Other Mines2,3 | 475 | | 322 | | 133 | | 3 | | 16 | | 1 | | | |
| Reportable segment total | $2,188 | | $1,129 | | $489 | | $15 | | $27 | | $528 | | | |
| Share of equity investees | (125) | | (51) | | (31) | | — | | — | | (43) | | | |
| Segment total | $2,063 | | $1,078 | | $458 | | $15 | | $27 | | $485 | | | |
| | | | | | | | |
| | | | | | | | |
| | | | | | | | |
| | | | | | | | |
| | | | | | | | |
| BARRICK SECOND QUARTER 2020 | 119 | NOTES TO FINANCIAL STATEMENTS (UNAUDITED) |
Consolidated Statement of Income Information
| | | | | | | | | | | | | | | | | | | | | | |
| | | Cost of Sales | | | | | | |
| For the six months ended June 30, 2020 | Revenue | Direct mining, royalties and community relations | Depreciation | Exploration, evaluation and project expenses | Other expenses (income)1 | Segment income (loss) | | |
Carlin2 | $1,316 | | $649 | | $150 | | $10 | | $12 | | $495 | | | |
Cortez2 | 698 | | 259 | | 110 | | 5 | | 2 | | 322 | | | |
Turquoise Ridge2 | 444 | | 192 | | 91 | | 5 | | 2 | | 154 | | | |
Pueblo Viejo2 | 709 | | 256 | | 107 | | 5 | | — | | 341 | | | |
Loulo-Gounkoto2 | 583 | | 220 | | 133 | | 6 | | 5 | | 219 | | | |
| Kibali | 304 | | 111 | | 83 | | 2 | | (4) | | 112 | | | |
| Veladero | 152 | | 75 | | 35 | | — | | 2 | | 40 | | | |
| Porgera | 140 | | 80 | | 16 | | 1 | | 27 | | 16 | | | |
North Mara2 | 271 | | 113 | | 50 | | — | | (3) | | 111 | | | |
Other Mines2,3 | 1,463 | | 740 | | 378 | | 7 | | 37 | | 301 | | | |
| Reportable segment total | $6,080 | | $2,695 | | $1,153 | | $41 | | $80 | | $2,111 | | | |
| Share of equity investees | (304) | | (111) | | (83) | | (2) | | 4 | | (112) | | | |
| Segment total | $5,776 | | $2,584 | | $1,070 | | $39 | | $84 | | $1,999 | | | |
| | | | | | | | |
| | | | | | | | |
| | | | | | | | |
| | | | | | | | |
Consolidated Statement of Income Information
| | | | | | | | | | | | | | | | | | | | | | |
| | | Cost of Sales | | | | | | |
| For the six months ended June 30, 2019 | Revenue | Direct mining, royalties and community relations | Depreciation | Exploration, evaluation and project expenses | Other expenses (income)1 | Segment income (loss) | | |
Carlin2 | $546 | | $310 | | $119 | | $4 | | ($3) | | $116 | | | |
Cortez2 | 707 | | 250 | | 129 | | 4 | | 11 | | 313 | | | |
Turquoise Ridge2 | 210 | | 87 | | 15 | | 1 | | — | | 107 | | | |
Pueblo Viejo2 | 640 | | 258 | | 93 | | 6 | | 2 | | 281 | | | |
Loulo-Gounkoto2 | 453 | | 220 | | 146 | | 4 | | 6 | | 77 | | | |
| Kibali | 242 | | 103 | | 87 | | — | | (1) | | 53 | | | |
| Veladero | 191 | | 108 | | 61 | | 1 | | (1) | | 22 | | | |
| Porgera | 169 | | 114 | | 19 | | 1 | | 1 | | 34 | | | |
North Mara2 | 223 | | 108 | | 45 | | — | | 7 | | 63 | | | |
Other Mines2,3 | 1,017 | | 679 | | 256 | | 7 | | 35 | | 40 | | | |
| Reportable segment total | $4,398 | | $2,237 | | $970 | | $28 | | $57 | | $1,106 | | | |
| Share of equity investees | (242) | | (103) | | (87) | | — | | 1 | | (53) | | | |
| Segment total | $4,156 | | $2,134 | | $883 | | $28 | | $58 | | $1,053 | | | |
| | | | | | | | |
| | | | | | | | |
| | | | | | | | |
| | | | | | | | |
1Includes accretion expense, which is included within finance costs in the consolidated statement of income. For the three months ended June 30, 2020, accretion expense was $6 million (2019: $13 million) and for the six months ended June 30, 2020, accretion expense was $18 million (2019: $26 million).
2Includes non-controlling interest portion of revenues, cost of sales and segment income for the three months ended June 30, 2020 for Nevada Gold Mines $577 million, $342 million, $224 million (2019: $nil, $nil, $nil), Pueblo Viejo $134 million, $70 million, $65 million (2019: $122 million, $74 million, $47 million), Loulo-Gounkoto $68 million, $40 million, $27 million (2019: $49 million, $39 million, $9 million), North Mara, Bulyanhulu and Buzwagi $52 million, $32 million, $18 million (2019: $68 million, $48 million, $15 million), and Tongon $13 million, $11 million, $4 million (2019: $9 million, $10 million, $(1) million) and for the six months ended June 30, 2020 for Nevada Gold Mines $1,113 million, $672 million, $424 million (2019: $nil, $nil, $nil), Pueblo Viejo $292 million, $144 million, $147 million (2019: $250 million, $139 million, $108 million), Loulo-Gounkoto $117 million, $71 million, $44 million (2019: $91 million, $73 million, $16 million), North Mara, Bulyanhulu and Buzwagi $83 million, $54 million, $26 million (2019: $118 million, $90 million, $19 million) and Tongon $24 million, $20 million, $5 million (2019: $18 million, $21 million, $(3) million).
3Includes provisional pricing adjustments for the three months ended June 30, 2020 of $31 million gains (2019: $8 million losses) and for the six months ended June 30, 2020 of $7 million gains (2019: $14 million gains).
| | | | | | | | |
| BARRICK SECOND QUARTER 2020 | 120 | NOTES TO FINANCIAL STATEMENTS (UNAUDITED) |
Reconciliation of Segment Income to Income Before Income Taxes
| | | | | | | | | | | | | | |
| | For the three months ended June 30 | | For the six months ended June 30 | |
| | 2020 | 2019 | 2020 | 2019 |
| Segment income | $1,085 | | $485 | | $1,999 | | $1,053 | |
| Other cost of sales/amortization | (13) | | (9) | | (22) | | (18) | |
| Exploration, evaluation and project expenses not attributable to segments | (55) | | (83) | | (110) | | (144) | |
| General and administrative expenses | (71) | | (59) | | (111) | | (113) | |
| Other income (expense) not attributable to segments | (31) | | 7 | | 23 | | (2) | |
| Impairment reversals (charges) | (23) | | (12) | | 313 | | (15) | |
| Gain (loss) on currency translation | (2) | | 6 | | (18) | | (16) | |
| Closed mine rehabilitation | (7) | | (16) | | (97) | | (41) | |
| Income from equity investees | 61 | | 50 | | 115 | | 78 | |
| Finance costs, net (includes non-segment accretion) | (76) | | (105) | | (168) | | (212) | |
| Gain on non-hedge derivatives | 12 | | — | | 5 | | 1 | |
Income before income taxes1 | $880 | | $264 | | $1,929 | | $571 | |
| | | | |
| | | | |
| | | | |
| | | | |
1Includes non-controlling interest portion of revenues, cost of sales and non-segment income for the three months ended June 30, 2020 for Acacia, $nil, $nil, $nil (2019: $nil, $nil,$(3) million) and Nevada Gold Mines, $nil, $2 million, $(9) million (2019: $nil, $nil, $nil) and for the six months ended June 30, 2020 for Acacia, $nil, $nil, $nil (2019: $nil, $nil, $(6) million) and Nevada Gold Mines, $nil, $2 million, $(9) million (2019: $nil $nil, $nil).
Capital Expenditures Information
| | | | | | | | | | | | | | |
| | Segment capital expenditures1 | | | |
| | For the three months ended June 30 | | For the six months ended June 30 | |
| | 2020 | 2019 | 2020 | 2019 |
| Carlin | $103 | | $64 | | $196 | | $119 | |
| Cortez | 91 | | 88 | | 178 | | 165 | |
| Turquoise Ridge | 23 | | 21 | | 53 | | 47 | |
| Pueblo Viejo | 32 | | 26 | | 60 | | 58 | |
| Loulo-Gounkoto | 70 | | 39 | | 109 | | 89 | |
| Kibali | 16 | | 10 | | 31 | | 20 | |
| Veladero | 16 | | 19 | | 42 | | 48 | |
| Porgera | 3 | | 20 | | 11 | | 29 | |
| North Mara | 21 | | 15 | | 36 | | 28 | |
| Other Mines | 94 | | 82 | | 155 | | 197 | |
| Reportable segment total | $469 | | $384 | | $871 | | $800 | |
| Other items not allocated to segments | 57 | | 19 | | 91 | | 51 | |
| Total | $526 | | $403 | | $962 | | $851 | |
| Share of equity investees | (16) | | (10) | | (31) | | (20) | |
| Total | $510 | | $393 | | $931 | | $831 | |
| | | | |
| | | | |
| | | | |
| | | | |
| | | | |
1Segment capital expenditures are presented for internal management reporting purposes on an accrual basis. Capital expenditures in the Consolidated Statements of Cash Flow are presented on a cash basis. For the three months ended June 30, 2020, cash expenditures were $509 million (2019: $379 million) and the increase in accrued expenditures was $1 million (2019: $14 million increase). For the six months ended June 30, 2020, cash expenditures were $960 million (2019: $753 million) and the decrease in accrued expenditures was $29 million (2019: $78 million increase).
Purchase Commitments
At June 30, 2020, we had purchase obligations for supplies and consumables of $1,484 million (December 31, 2019: $1,681 million).
Capital Commitments
In addition to entering into various operational commitments in the normal course of business, we had capital commitments of $206 million at June 30, 2020 (December 31, 2019: $383 million).
| | | | | | | | |
| BARRICK SECOND QUARTER 2020 | 121 | NOTES TO FINANCIAL STATEMENTS (UNAUDITED) |
6 > REVENUE
| | | | | | | | | | | | | | |
| | For the three months ended June 30 | | For the six months ended June 30 | |
| | 2020 | 2019 | 2020 | 2019 |
| Gold sales | | | | |
| Spot market sales | $2,617 | | $1,928 | | $5,172 | | $3,822 | |
| Concentrate sales | 191 | | 8 | | 229 | | 20 | |
| Provisional pricing adjustments | 4 | | 1 | | 4 | | 1 | |
| $2,812 | | $1,937 | | $5,405 | | $3,843 | |
| Copper sales | | | | |
| Copper concentrate sales | $157 | | $112 | | $280 | | $253 | |
| Provisional pricing adjustments | 27 | | (9) | | 3 | | 13 | |
| $184 | | $103 | | $283 | | $266 | |
Other sales1 | 59 | | 23 | | 88 | | 47 | |
| Total | $3,055 | | $2,063 | | $5,776 | | $4,156 | |
| | | | |
| | | | |
| | | | |
| | | | |
| | | | |
| | | | |
| | | | |
1Revenues include the sale of by-products for our gold and copper mines including silver revenue of $19 million for the three months ended June 30, 2020 (2019: $23 million) and $30 million for the six months ended June 30, 2020 (2019: $47 million).
7 > COST OF SALES
| | | | | | | | | | | | | | | | | | | | | | | | | | | | | |
| | Gold | | Copper | | Other3 | | Total | | | | |
| For the three months ended June 30 | 2020 | 2019 | 2020 | 2019 | 2020 | 2019 | 2020 | 2019 | | | |
Direct mining cost1,2 | $1,121 | | $921 | | $79 | | $63 | | $2 | | $— | | $1,202 | | $984 | | | | |
| Depreciation | 498 | | 431 | | 63 | | 28 | | 5 | | 7 | | 566 | | 466 | | | | |
| Royalty expense | 116 | | 78 | | 11 | | 9 | | — | | — | | 127 | | 87 | | | | |
| Community relations | 5 | | 7 | | — | | 1 | | — | | — | | 5 | | 8 | | | | |
| $1,740 | | $1,437 | | $153 | | $101 | | $7 | | $7 | | $1,900 | | $1,545 | | | | |
| | Gold | | Copper | | Other3 | | Total | | | | |
| For the six months ended June 30 | 2020 | 2019 | 2020 | 2019 | 2020 | 2019 | 2020 | 2019 | | | |
Direct mining cost1,2 | $2,201 | | $1,815 | | $148 | | $139 | | $4 | | $— | | $2,353 | | $1,954 | | | | |
| Depreciation | 972 | | 815 | | 106 | | 70 | | 12 | | 16 | | 1,090 | | 901 | | | | |
| Royalty expense | 200 | | 144 | | 22 | | 21 | | — | | — | | 222 | | 165 | | | | |
| Community relations | 10 | | 13 | | 1 | | 2 | | — | | — | | 11 | | 15 | | | | |
| $3,383 | | $2,787 | | $277 | | $232 | | $16 | | $16 | | $3,676 | | $3,035 | | | | |
| | | | | | | | | | | |
| | | | | | | | | | | |
| | | | | | | | | | | |
| | | | | | | | | | | |
| | | | | | | | | | | |
1Direct mining cost includes charges to reduce the cost of inventory to net realizable value as follows: $1 million for the three months ended June 30, 2020 (2019: $12 million) and $18 million for the six months ended June 30, 2020 (2019: $16 million).
2Direct mining cost includes the costs of extracting by-products.
3Other includes realized hedge gains and losses and corporate amortization.
8 > EARNINGS PER SHARE
| | | | | | | | | | | | | | | | | | | | | | | | | | |
| | For the three months ended June 30 | | | | For the six months ended June 30 | | | |
| | 2020 | | 2019 | | 2020 | | 2019 | |
| | Basic | Diluted | Basic | Diluted | Basic | Diluted | Basic | Diluted |
| Net income | $622 | | $622 | | $223 | | $223 | | $1,285 | | $1,285 | | $363 | | $363 | |
| Net income attributable to non-controlling interests | (265) | | (265) | | (29) | | (29) | | (528) | | (528) | | (58) | | (58) | |
| Net income attributable to equity holders of Barrick Gold Corporation | $357 | | $357 | | $194 | | $194 | | $757 | | $757 | | $305 | | $305 | |
| Weighted average shares outstanding | 1,778 | | 1,778 | | 1,752 | | 1,752 | | 1,778 | | 1,778 | | 1,749 | | 1,749 | |
| | | | | | | | |
| Basic and diluted earnings per share data attributable to the equity holders of Barrick Gold Corporation | $0.20 | | $0.20 | | $0.11 | | $0.11 | | $0.43 | | $0.43 | | $0.17 | | $0.17 | |
| | | | | | | | |
| | | | | | | | |
| | | | | | | | |
| | | | | | | | |
| | | | | | | | |
| | | | | | | | |
| BARRICK SECOND QUARTER 2020 | 122 | NOTES TO FINANCIAL STATEMENTS (UNAUDITED) |
9 > OTHER EXPENSE
A) Other Expense (Income)
| | | | | | | | | | | | | | |
| | For the three months ended June 30 | | For the six months ended June 30 | |
| | 2020 | 2019 | 2020 | 2019 |
| Other expense: | | | | |
| Bank charges | $5 | | $3 | | $9 | | $8 | |
Bulyanhulu reduced operations program cost1 | 7 | | 6 | | 14 | | 12 | |
| | | | |
| | | | |
| Litigation | 6 | | 9 | | 9 | | 19 | |
| Miscellaneous write-offs | — | | — | | 1 | | 2 | |
| Covid-19 donations | 18 | | — | | 18 | | — | |
| Porgera care and maintenance costs | 27 | | — | | 27 | | — | |
| Acacia - other | — | | 4 | | — | | 5 | |
| Other | 20 | | — | | 29 | | 8 | |
| Total other expense | $83 | | $22 | | $107 | | $54 | |
| Other income: | | | | |
| Loss (gain) on sale of long-lived assets | $8 | | ($12) | | ($52) | | ($12) | |
| | | | |
| | | | |
| Gain on non-hedge derivatives | (12) | | — | | (5) | | (1) | |
| Other | (6) | | (3) | | (12) | | (8) | |
| Total other income | ($10) | | ($15) | | ($69) | | ($21) | |
| Total | $73 | | $7 | | $38 | | $33 | |
| | | | |
| | | | |
| | | | |
| | | | |
| | | | |
| | | | |
1Primarily relates to care and maintenance costs.
B) Impairment (Reversals) Charges
| | | | | | | | | | | | | | |
| | For the three months ended June 30 | | For the six months ended June 30 | |
| | 2020 | 2019 | 2020 | 2019 |
Impairment (reversals) of non-current assets1 | $11 | | $12 | | ($325) | | $15 | |
| Impairment of intangibles | 12 | | — | | 12 | | — | |
| Total | $23 | | $12 | | ($313) | | $15 | |
| | | | |
| | | | |
1Refer to note 13 for further details.
10 > INCOME TAX EXPENSE
| | | | | | | | | | | | | | |
| | For the three months ended June 30 | | For the six months ended June 30 | |
| | 2020 | 2019 | 2020 | 2019 |
| Current | $222 | | $103 | | $474 | | $233 | |
| Deferred | 36 | | (62) | | 170 | | (25) | |
| $258 | | $41 | | $644 | | $208 | |
| | | | |
| | | | |
| | | | |
| | | | |
Income tax expense was $644 million for the six months ended June 30, 2020. The unadjusted effective income tax rate for the six months ended June 30, 2020, was 33% of the income before income taxes.
The underlying effective income tax rate on ordinary income for the six months ended June 30, 2020 was 29% after adjusting for the gain on sale of the Massawa project; the impact of the settlement of all outstanding disputes with the Government of Tanzania ("GoT"); the impact of impairment charges; the impact of the transfer of a free carried shareholding of 16% in each of the Tanzania mines to the
GoT; the impact of foreign currency translation losses on deferred tax balances; the impact of non-deductible foreign exchange losses; the impact of a reduced corporate tax rate in Argentina on deferred tax balances; the impact of Covid-19 donations; the impact of the Porgera mine being placed on care and maintenance; and the impact of other expense adjustments.
Currency Translation
Deferred tax balances are subject to remeasurement for changes in currency exchange rates each period. The most significant balances are Argentine and Malian net deferred tax liabilities. In the six months ended June 30, 2020, a tax recovery of $1 million primarily arose from translation losses and gains on tax balances in Argentina and Mali, respectively, due to the weakening of the Argentine peso and strengthening of the West African CFA franc, against the US dollar. These net translation gains are included within deferred income tax expense.
Nevada Gold Mines
Nevada Gold Mines is a limited liability company treated as a flow through partnership for US tax purposes. The partnership is not subject to federal income tax directly, but each of its partners is liable for tax on its share of the profits of the partnership. As such, Barrick accounts for its current and deferred income tax associated with the investment (61.5% share) following the principles in IAS 12.
Argentina Deferred Taxes
In December 2017, Argentina reduced its 35% corporate tax rate to 30% for 2018 and 2019, with a further reduction to 25% for 2020 and thereafter. Concurrently, a dividend distribution tax was introduced that charges 7% tax on dividend distributions for 2018 and 2019, and 13% tax on dividend distributions for 2020 and thereafter. On December 23, 2019, Argentina enacted a law that the previously approved corporate tax rate reduction from 30% to 25% will be deferred for one year until January 1, 2021. Therefore, the corporate tax rate of 30% is unchanged for the 2020 calendar year. The scheduled increase of dividend withholding tax from 7% to 13% was also deferred until January 1, 2021.
A deferred tax recovery of $35 million was recorded in the first quarter of 2020 as a result of the tax reform measures.
Tanzania
On January 24, 2020, Barrick formalized the establishment of a joint venture between Barrick and the GoT and resolution of all outstanding disputes between Barrick and the GoT, including the lifting of the previous concentrate export ban, effective immediately. Refer to note 13 for further details.
A current tax expense and deferred tax recovery of $21 million and $44 million, respectively, was recorded in the first quarter of 2020, largely to reflect the terms of the framework agreement with the GoT. An additional deferred tax recovery of $8 million was recorded in the second quarter of 2020 due to the recognition of deferred tax assets at Buzwagi.
| | | | | | | | |
| BARRICK SECOND QUARTER 2020 | 123 | NOTES TO FINANCIAL STATEMENTS (UNAUDITED) |
11 > CASH FLOW – OTHER ITEMS
| | | | | | | | | | | | | | |
| Operating Cash Flows – Other Items | For the three months ended June 30 | | For the six months ended June 30 | |
| | 2020 | 2019 | 2020 | 2019 |
| Adjustments for non-cash income statement items: | | | | |
| Gain on non-hedge derivatives | ($12) | | $— | | ($5) | | ($1) | |
| Share-based compensation expense | 33 | | 26 | | 50 | | 38 | |
| Income from investment in equity investees | (61) | | (50) | | (115) | | (78) | |
| Change in estimate of rehabilitation costs at closed mines | 7 | | 16 | | 97 | | 41 | |
| Net inventory impairment charges | 1 | | 12 | | 18 | | 16 | |
| Change in other assets and liabilities | 21 | | 50 | | 17 | | 28 | |
| Settlement of rehabilitation obligations | (24) | | (16) | | (44) | | (30) | |
| Other operating activities | ($35) | | $38 | | $18 | | $14 | |
| Cash flow arising from changes in: | | | | |
| Accounts receivable | ($40) | | ($44) | | ($48) | | ($33) | |
| Inventory | 59 | | 22 | | (25) | | 12 | |
| Other current assets | (33) | | (9) | | (139) | | (94) | |
| Accounts payable | 6 | | (37) | | (73) | | (160) | |
| Other current liabilities | (1) | | (14) | | (56) | | (55) | |
| Change in working capital | ($9) | | ($82) | | ($341) | | ($330) | |
| Investing Cash Flows – Other Items | For the three months ended June 30 | | For the six months ended June 30 | |
| | 2020 | 2019 | 2020 | 2019 |
| Dividends received from equity method investments | $29 | | $17 | | $54 | | $32 | |
| | | | |
| Shareholder loan repayments from equity method investments | 1 | | — | | 1 | | 30 | |
| | | | |
| Other net investing activities | $30 | | $17 | | $55 | | $62 | |
| | | | |
| | | | |
| | | | |
| | | | |
| | | | |
12 > EQUITY ACCOUNTING METHOD INVESTMENT CONTINUITY
| | | | | | | | | | | | | | | | | | | | | |
| Kibali | | | Jabal Sayid | Zaldívar | Other | Total | | |
| At January 1, 2019 | $— | | | | $245 | | $989 | | $— | | $1,234 | | | |
| Acquisitions | 3,195 | | | | — | | — | | 58 | | 3,253 | | | |
| Equity pick-up from equity investees | 98 | | | | 51 | | 16 | | — | | 165 | | | |
| Funds invested | — | | | | — | | — | | 2 | | 2 | | | |
| Dividends received | (75) | | | | — | | (50) | | — | | (125) | | | |
| Shareholder loan repayment | — | | | | — | | — | | (2) | | (2) | | | |
| At December 31, 2019 | $3,218 | | | | $296 | | $955 | | $58 | | $4,527 | | | |
| | | | | | | | | |
| Equity pick-up from equity investees | 87 | | | | 28 | | — | | — | | 115 | | | |
| | | | | | | | | |
| Shareholder loan repayment | — | | | | — | | — | | (1) | | (1) | | | |
| Dividends received | (54) | | | | — | | — | | — | | (54) | | | |
| At June 30, 2020 | $3,251 | | | | $324 | | $955 | | $57 | | $4,587 | | | |
| | | | | | | | | |
| | | | | | | | | |
| | | | | | | | | |
| | | | | | | | | |
| | | | | | | | | |
| | | | | | | | |
| BARRICK SECOND QUARTER 2020 | 124 | NOTES TO FINANCIAL STATEMENTS (UNAUDITED) |
13 > IMPAIRMENT OF GOODWILL AND OTHER ASSETS
In accordance with our accounting policy, goodwill is tested for impairment in the fourth quarter and also when there is an indicator of impairment. Non-current assets are tested for impairment or impairment reversals when events or changes in circumstances suggest that the carrying amount may not be recoverable or is understated. Refer to note 21 of the 2019 Annual Financial Statements for further information.
For the six months ended June 30, 2020, we recorded net impairment reversals of $313 million (2019: $15 million impairments) for non-current assets.
Indicators of impairment and reversals
Second Quarter 2020
Porgera
As described in note 17, on April 24, 2020, we received communication from the Government of Papua New Guinea that the Special Mining Lease will not be extended, and therefore Porgera was placed on temporary care and maintenance on April 25, 2020. We have performed an analysis and concluded that the carrying value of our 47.5% share of Porgera ($254 million as at June 30, 2020) remains recoverable under the temporary care and maintenance scenario. The ultimate resolution of this dispute may differ from this assumption and there is no guarantee that the carrying value will remain recoverable.
First Quarter 2020
Tanzania
On January 24, 2020, Barrick formalized the establishment of a joint venture between Barrick and the GoT and resolution of all outstanding disputes between Barrick and the GoT, including the lifting of the previous concentrate export ban, effective immediately. Effective January 1, 2020, the GoT received a free carried shareholding of 16% in each of the Tanzania mines (Bulyanhulu, Buzwagi and North Mara), a 16% interest in the shareholder loans owed by the operating companies and will receive half of the economic benefits from the Tanzanian operations from taxes, royalties, clearing fees and participation in all cash distributions made by the mines, after the recoupment of capital investments.
We have determined this to be an indicator of impairment reversal, as the resolution of the long standing dispute has led to a decrease in the risk adjustment previously included in the weighted average cost of capital ("WACC") and the removal of the estimated impact of the previously anticipated issuance of the equity to the GoT. The key assumptions and estimates used in determining the fair value less cost to dispose (“FVLCD”) are a short-term gold price of $1,350 per ounce, long-term gold price of $1,300 per ounce, NAV multiples of 1.1-1.3 and a WACC of 5.4%-6.2%. Management assumed the resumption of concentrate sales and exports commencing in Q2 2020 and the resumption of production from underground mining at Bulyanhulu in 2020. We identified that the FVLCD exceeded the carrying value and a full non-current asset impairment reversal was recognized in the first quarter of 2020 of $649 million at Bulyanhulu and $88 million at North
Mara, based on a FVLCD of $1,237 million and $967 million, respectively. No impairment reversal was recognized at Buzwagi.
The FVLCD was also used to determine the initial value assigned to the 16% equity interest in each of the operating mines that was given to the GoT. The recognition of this non-controlling interest in the three Tanzanian mines resulted in a loss of $238 million being recognized in the first quarter of 2020. The assignment of 16% of the existing shareholder loans also resulted in the recognition of a $167 million loss in the first quarter of 2020.
As the signing of the agreement to resolve all outstanding disputes with the GoT caused the impairment reversal, loss on equity issuance and loss on assignment of shareholder loans, the financial impact has been aggregated and presented as a $332 million net impairment reversal on the consolidated statement of income.
14 > FINANCIAL INSTRUMENTS
Financial instruments include cash; evidence of ownership in an entity; or a contract that imposes an obligation on one party and conveys a right to a second party to deliver/receive cash or another financial instrument.
A) Cash and Equivalents
Cash and equivalents include cash, term deposits, treasury bills and money market funds with original maturities of less than 90 days.
B) Debt
On January 31, 2020, Barrick completed a make-whole redemption of the approximately $337 million of outstanding principal on the 3.85% notes due 2022. The settlement resulted in a debt extinguishment loss of $15 million.
In January 2020, the final installment of $14 million was repaid for the Acacia Credit Facility.
| | | | | | | | |
| BARRICK SECOND QUARTER 2020 | 125 | NOTES TO FINANCIAL STATEMENTS (UNAUDITED) |
15 > FAIR VALUE MEASUREMENTS
A) Assets and Liabilities Measured at Fair Value on a Recurring Basis
| | | | | | | | | | | | | | | | |
| As at June 30, 2020 | Quoted prices in active markets for identical assets | Significant other observable inputs | Significant unobservable inputs | Aggregate fair value | | |
| (Level 1) | (Level 2) | (Level 3) | | | |
| Cash and equivalents | $3,743 | | $— | | $— | | $3,743 | | | |
| Other investments | 250 | | — | | — | | 250 | | | |
| Derivatives | — | | 35 | | — | | 35 | | | |
| Receivables from provisional copper and gold sales | — | | 153 | | — | | 153 | | | |
| $3,993 | | $188 | | $— | | $4,181 | | | |
| | | | | | |
| | | | | | |
| | | | | | |
| | | | | | |
| | | | | | |
B) Fair Values of Financial Assets and Liabilities
| | | | | | | | | | | | | | |
| | As at June 30, 2020 | | As at December 31, 2019 | |
| Carrying amount | Estimated fair value | Carrying amount | Estimated fair value |
| Financial assets | | | | |
Other assets1 | $639 | | $639 | | $612 | | $612 | |
Other investments2 | 250 | | 250 | | 258 | | 258 | |
Derivative assets3 | 37 | | 37 | | 1 | | 1 | |
| $926 | | $926 | | $871 | | $871 | |
| Financial liabilities | | | | |
Debt4 | $5,168 | | $6,960 | | $5,536 | | $6,854 | |
| Derivative liabilities | 2 | | 2 | | — | | — | |
| Other liabilities | 352 | | 352 | | 209 | | 209 | |
| $5,522 | | $7,314 | | $5,745 | | $7,063 | |
| | | | |
| | | | |
| | | | |
| | | | |
| | | | |
1Includes restricted cash and amounts due from our partners.
2Recorded at fair value. Quoted market prices are used to determine fair value.
3Primarily consists of contingent consideration received as part of the sale of Massawa
4Debt is generally recorded at amortized cost. The fair value of debt is primarily determined using quoted market prices. Balance includes both current and long-term portions of debt.
The Company’s valuation techniques were presented in Note 26 of the 2019 Annual Financial Statements and have been consistently applied in these interim financial statements.
16 > CAPITAL STOCK
A) Authorized Capital Stock
Our authorized capital stock is composed of an unlimited number of common shares (issued 1,778,068,071 common shares as at June 30, 2020). Our common shares have no par value.
B) Dividends
The Company’s practice has been to declare dividends after a quarter in the announcement of the results for the quarter. Dividends declared are paid in the same quarter.
The Company’s dividend reinvestment plan resulted in 101,460 common shares issued to shareholders for the six months ended June 30, 2020.
17 > CONTINGENCIES
Certain conditions may exist as of the date the financial statements are issued that may result in a loss to the Company, but which will only be resolved when one or more future events occur or fail to occur. The impact of any resulting loss from such matters affecting these financial statements and noted below may be material.
Except as noted below, no material changes have occurred with respect to the matters disclosed in Note 36 “Contingencies” to the 2019 Annual Financial Statements, and no new contingencies have occurred that are material to the Company since the issuance of the 2019 Annual Financial Statements.
The description set out below should be read in conjunction with Note 36 “Contingencies” to the 2019 Annual Financial Statements.
Litigation and Claims Update
Proposed Canadian Securities Class Actions (Pascua-Lama)
In March 2020, the Quebec court denied both the leave to proceed with statutory secondary market misrepresentations claims and class certification motions. As a result, subject to appeal, the claimant cannot pursue the statutory secondary market misrepresentation claims, and can only pursue his other purported claims on an individual basis rather than on behalf of other shareholders. The claimant has not yet filed an appeal.
The motion for class certification in Ontario has not yet been heard. The Ontario court has indicated that it does not intend to hear that motion until after the Plaintiffs’ appeal from the October 2019 decision dismissing all but one of the statutory secondary market misrepresentation claims is decided.
The Company intends to vigorously defend the proposed Canadian securities class actions. No amounts have been recorded for any potential liability arising from these matters, as the Company cannot reasonably predict the outcome.
Veladero - September 2015 Release of Cyanide-Bearing Process Solution
Glaciers Investigation
Due to the Argentine response to Covid-19, the oral arguments originally scheduled for April and May 2020 in this matter have been postponed and have not yet been rescheduled.
| | | | | | | | |
| BARRICK SECOND QUARTER 2020 | 126 | NOTES TO FINANCIAL STATEMENTS (UNAUDITED) |
Veladero – Tax Assessment and Criminal Charges
In the Criminal Tax Case, the Argentinean Federal Tax Authority's appeal of the trial court's ruling on the defendants' motion to dismiss on statute of limitations grounds was denied. Additional evidence from an Argentine income tax expert will be submitted to the trial court to support the defendants’ arguments.
The Company believes that the Tax Assessment and the Criminal Tax Case are without merit and intends to defend the proceedings vigorously. No amounts have been recorded for any potential liability arising from the Tax Assessment or the Criminal Tax Case, as the Company cannot reasonably predict the outcome.
Writ of Kalikasan
The tentative trial date of March 23, 2020 was postponed due to the Philippine government's response to the Covid-19 pandemic. While the Court has now reopened, a rescheduled trial date has not yet been set.
No amounts have been recorded for any potential liability under this matter, as the Company cannot reasonably predict the outcome. The Company intends to continue to defend the action vigorously.
Malian Tax Dispute
The Company has settled all of the existing tax disputes with the State of Mali and the matters are now closed. The existing disputes were settled for an amount within the provision recorded for these matters in the Company’s 2019 Annual Financial Statements.
Tanzania – Concentrate Export Ban and Related Disputes
On January 24, 2020, Barrick announced that the Company had ratified the creation of Twiga at a signing ceremony with the President of Tanzania, formalizing the establishment of a joint venture between Barrick and the GoT and resolution of all outstanding disputes between Barrick and the GoT, including the lifting of the previous concentrate export ban, effective immediately. The GoT received a free carried shareholding of 16% in each of the Tanzania mines (Bulyanhulu, Buzwagi and North Mara), a 16% interest in the shareholder loans owed by the operating companies and will receive its half of the economic benefits from taxes, royalties, clearing fees and participation in all cash distributions made by the mines and Twiga, after the recoupment of capital investments. Twiga will provide management services to the mines. Barrick and the GoT continue efforts to fulfill their respective obligations to satisfy all conditions of the signed agreement, primarily with respect to the execution and delivery of formal termination documents for the settlement of all outstanding disputes between the two parties.
Tanzanian Revenue Authority Assessments
All of the tax disputes with the TRA were resolved as part of the settlement with the GoT described above under "Tanzania – Concentrate Export Ban and Related Disputes." As noted above, Barrick and the GoT continue efforts to fulfill their respective obligations to satisfy all conditions of the signed agreement, primarily with respect to the execution and delivery of formal termination documents for the settlement of all outstanding disputes between the two parties.
Porgera Special Mining Lease Extension
Porgera's Special Mining Lease (“SML”) terminated on August 16, 2019. The Company applied for a 20-year extension of the SML in June 2017 and has been engaging with the Government of Papua New Guinea on this matter since then. On August 2, 2019, the National Court of Papua New Guinea ruled that the provisions of the country’s 1992 Mining Act applied to the Porgera gold mine, thus allowing it to continue operating while the application to extend its SML was being considered. Also in 2019, in response to a request from Papua New Guinea Prime Minister Marape, the Company proposed a benefit-sharing arrangement that would deliver more than half the economic benefits from the Porgera mine to Papua New Guinea stakeholders, including the Government, for the remainder of the life of mine, estimated at 20 years.
On April 24, 2020, Barrick Niugini Limited (“BNL”), the majority owner and operator of the Porgera joint venture, received a communication from the Government of Papua New Guinea that the SML would not be extended. The Company believes the Government’s decision not to extend the SML is tantamount to nationalization without due process and in violation of the Government’s legal obligations to BNL. The Company remains willing to discuss the issue with Prime Minister Marape and his Government in light of the potentially catastrophic impact of this decision for the communities at Porgera and in Enga Province, and for the country as a whole. BNL will pursue all legal avenues to challenge the Government’s decision and to recover any damages that BNL may suffer as a result of the Government’s decision. The Company will not discuss transitional arrangements for the management of the Porgera mine, as proposed by the Government, as this is not consistent with BNL’s rights. Based on the communication received from the Government of Papua New Guinea that the SML would not be extended, Porgera was placed on temporary care and maintenance on April 25, 2020 to ensure the safety and security of our employees and communities.
On April 28, 2020, BNL filed a Judicial Review action against the Government of Papua New Guinea in the Papua New Guinea National Court of Justice. Judicial Review is a proceeding that challenges the procedural and constitutional adequacy of government administrative actions. The Judicial Review action seeks to quash the decision not to extend the SML on the grounds that the Government did not comply with the applicable legal standards and processes. On June 5, 2020, the National Court granted BNL leave to apply for Judicial Review.
BNL asked the National Court for a stay of the decision not to extend the SML to enable BNL to stay in possession of the mine to put it on temporary care and maintenance and to protect the mine’s assets. After a hearing on April 30, 2020, the National Court ordered that BNL could stay in possession of the Porgera mine “to ensure that the environment, the integrity of the mine and the rights of the landowners are not compromised” and ordered the Government of Papua New Guinea to cooperate with that objective. On July 17, 2020, the Court stayed any further actions to implement the decision not to extend the SML.
| | | | | | | | |
| BARRICK SECOND QUARTER 2020 | 127 | NOTES TO FINANCIAL STATEMENTS (UNAUDITED) |
Trial was set to commence in the Judicial Review action on August 12, 2020. BNL sought leave to appeal two procedural rulings of the National Court that would affect the trial to the Supreme Court of Papua New Guinea. In hearings on August 5 and 6, 2020, the Supreme Court granted leave for BNL's appeals and stayed the trial.
On July 9, 2020, BNL initiated conciliation proceedings before the World Bank’s International Centre for Settlement of Investment Disputes (“ICSID”). Through this conciliation, BNL seeks to reach an agreement for the extension of the SML on terms that will be mutually beneficial to the Company and to all Papua New Guinea stakeholders.
Simultaneously with BNL initiating the conciliation proceedings, Barrick (PD) Australia Pty Limited (“Barrick PD”), the Company’s subsidiary and an investor in the Porgera mine, has given notice to the Government of Papua New Guinea that a dispute has arisen under the Bilateral Investment Treaty (“BIT”) between Papua New Guinea and Australia, and has referred the dispute to arbitration before the ICSID. Barrick PD seeks to recover damages it has already suffered and damages it may suffer in the future by virtue of the Government’s wrongful refusal to grant an extension of the SML. The dispute notice expressly invites the Government to engage in consultations and negotiations in an attempt to resolve the investment treaty dispute.
Porgera Tax Audits
In April 2020, BNL received a position paper from the Internal Revenue Commission ("IRC") in Papua New Guinea asserting various proposed adjustments and other tax liabilities amounting to $191 million (not including potential penalties) arising from tax audits of BNL conducted for 2006 through 2015. BNL responded to the position paper on June 30, 2020. The Company has reviewed the IRC position paper and concluded that there is no merit to the proposed adjustments, except for certain immaterial items for which a provision had already been made. The Company intends to defend its position vigorously and has not recorded any additional estimated amounts for the potential liability arising from the IRC position paper as the Company cannot reasonably predict the outcome.
Zaldívar Chilean Tax Assessment
On March 17, 2020, Compañía Minera Zaldívar Limitada ("CMZ"), Barrick’s Chilean subsidiary that holds the Company’s interest in the Zaldívar mine, filed a claim against the Chilean IRS at the Tax Court of Coquimbo (the “Tax Court”) to nullify the Zaldívar Tax Assessment. The Chilean IRS filed their response to CMZ’s claim on April 13, 2020.
On May 22, 2020, the Tax Court held a conciliation hearing which did not result in the resolution of the matter. The Tax Court then granted a joint proposal from CMZ and the Chilean IRS to suspend the legal case until September 2020 while settlement discussions continue.
Massawa Senegalese Tax Dispute
The Company received a Notice for Reassessment, dated May 7, 2020, from the Senegalese Tax Authority (“SRA”) asserting capital gains and withholding tax liabilities and penalties of approximately $211 million arising from the disposal of the subsidiary that held the Company’s interest in the Massawa project in March 2020. The Company has reviewed the Notice for Reassessment and has concluded that the proposed tax claims are without merit as Massawa’s mining convention with the State of Senegal specifically precludes them. The Company submitted its response to the SRA on June 5, 2020 and intends to vigorously defend its position. No amounts have been recorded for any potential liability arising from the Notice for Reassessment as the Company cannot reasonably predict the outcome.
| | | | | | | | |
| BARRICK SECOND QUARTER 2020 | 128 | NOTES TO FINANCIAL STATEMENTS (UNAUDITED) |
Corporate Office
Barrick Gold Corporation
161 Bay Street, Suite 3700
Toronto, Ontario M5J 2S1
Canada
Telephone: +1 416 861-9911
Email: investor@barrick.com
Website: www.barrick.com
Shares Listed
GOLD The New York Stock Exchange
ABX The Toronto Stock Exchange
Transfer Agents and Registrars
AST Trust Company (Canada)
P.O. Box 700, Postal Station B
Montreal, Quebec H3B 3K3
or
American Stock Transfer & Trust Company, LLC
6201 – 15 Avenue
Brooklyn, New York 11219
Telephone: 1-800-387-0825
Fax: 1-888-249-6189
Email: inquiries@astfinancial.com
Website: www.astfinancial.com
Enquiries
President and chief executive
Mark Bristow
+1 647 205 7694
+44 788 071 1386
SEVP and chief financial officer
Graham Shuttleworth
+1 647 262 2095
+44 779 771 1338
Investor and media Relations
Kathy du Plessis
+44 20 7557 7738
Email: barrick@dpapr.com
Cautionary Statement on Forward-Looking Information
Certain information contained or incorporated by reference in this press release, including any information as to our strategy, projects, plans or future financial or operating performance, constitutes “forward-looking statements”. All statements, other than statements of historical fact, are forward-looking statements. The words “deliver”, "plan", "objective", "expected", “potential”, “strategy”, “will”, "continues", “ongoing” and similar expressions identify forward-looking statements. In particular, this press release contains forward-looking statements including, without limitation, with respect to: Barrick’s forward-looking production guidance and estimates of future costs; Barrick’s non-core asset disposal strategy; potential extensions to life of mine, including at Hemlo; production rates, including potential production from North Mara and Bulyanhulu; Barrick’s response to the government of Papua New Guinea’s decision not to extend Porgera’s Special Mining Lease; the duration of the temporary suspension of operations at Porgera; potential mineralization; potential exploration targets and mineral resource potential, including reserve replenishment; future dividend levels; Barrick’s engagement with local communities to manage the Covid-19 pandemic; future investments in community
projects and contributions to local economies; the new joint venture with the Government of Tanzania; timing of resumption of production at Bulyanhulu; timing of development of the Goldrush declines; and expectations regarding future price assumptions, financial performance and other outlook or guidance.
Forward-looking statements are necessarily based upon a number of estimates and assumptions including material estimates and assumptions related to the factors set forth below that, while considered reasonable by the Company as at the date of this press release in light of management’s experience and perception of current conditions and expected developments, are inherently subject to significant business, economic and competitive uncertainties and contingencies. Known and unknown factors could cause actual results to differ materially from those projected in the forward-looking statements and undue reliance should not be placed on such statements and information. Such factors include, but are not limited to: fluctuations in the spot and forward price of gold, copper or certain other commodities (such as silver, diesel fuel, natural gas and electricity); the speculative nature of mineral exploration
and development; changes in mineral production performance, exploitation and exploration successes; risks associated with projects in the early stages of evaluation and for which additional engineering and other analysis is required; the benefits expected from recent transactions being realized; diminishing quantities or grades of reserves; increased costs, delays, suspensions and technical challenges associated with the construction of capital projects; operating or technical difficulties in connection with mining or development activities, including geotechnical challenges and disruptions in the maintenance or provision of required infrastructure and information technology systems; failure to comply with environmental and health and safety laws and regulations; non-renewal of key licenses by governmental authorities, including non-renewal of Porgera’s Special Mining Lease; timing of receipt of, or failure to comply with, necessary permits and approvals; uncertainty whether some or all of Barrick's targeted investments and projects will meet the Company’s capital allocation objectives and internal hurdle rate; the impact of global liquidity and credit availability on the timing of cash flows and the values of assets and liabilities based on projected future cash flows; adverse changes in our credit ratings; the impact of inflation; fluctuations in the currency markets; changes in U.S. dollar interest rates; risks arising from holding derivative instruments; changes in national and local government legislation, taxation, controls or regulations and/or changes in the administration of laws, policies and practices, expropriation or nationalization of property and political or economic developments in Canada, the United States and other jurisdictions in which the Company or its affiliates do or may carry on business in the future; lack of certainty with respect to foreign legal systems, corruption and other factors that are inconsistent with the rule of law; risks associated with illegal and artisanal mining; risks associated with new diseases, epidemics and pandemics, including the effects and potential effects of the global Covid-19 pandemic; disruption of supply routes which may cause delays in construction and mining activities; damage to the Company’s reputation due to the actual or perceived occurrence of any number of events, including negative publicity with respect to the Company’s handling of environmental matters or dealings with community groups, whether true or not; the possibility that future exploration results will not be consistent with the Company’s expectations; risks that exploration data may be incomplete and considerable additional work may be required to complete further evaluation, including but not limited to drilling, engineering and socioeconomic studies and investment; risk of loss due to acts of war, terrorism, sabotage and civil disturbances; litigation and legal and administrative proceedings; contests over title to properties, particularly title to undeveloped properties, or over access to water, power and other required infrastructure; business opportunities that may be presented to, or pursued by, the Company; our ability to successfully integrate acquisitions or complete divestitures, including our ability to successfully reintegrate Acacia’s operations; risks associated with working with partners in jointly controlled assets; employee relations including loss of key employees; increased costs and physical risks, including extreme weather events and resource shortages, related to climate change; and availability and increased costs associated with mining inputs and labor. Barrick also cautions that its 2020 guidance may be impacted by the unprecedented business
and social disruption caused by the spread of Covid-19. In addition, there are risks and hazards associated with the business of mineral exploration, development and mining, including environmental hazards, industrial accidents, unusual or unexpected formations, pressures, cave-ins, flooding and gold bullion, copper cathode or gold or copper concentrate losses (and the risk of inadequate insurance, or inability to obtain insurance, to cover these risks).
Many of these uncertainties and contingencies can affect our actual results and could cause actual results to differ materially from those expressed or implied in any forward-looking statements made by, or on behalf of, us. Readers are cautioned that forward-looking statements are not guarantees of future performance. All of the forward-looking statements made in this press release are qualified by these cautionary statements. Specific reference is made to the most recent Form 40-F/Annual Information Form on file with the SEC and Canadian provincial securities regulatory authorities for a more detailed discussion of some of the factors underlying forward-looking statements and the risks that may affect Barrick’s ability to achieve the expectations set forth in the forward-looking statements contained in this press release. We disclaim any intention or obligation to update or revise any forward-looking statements whether as a result of new information, future events or otherwise, except as required by applicable law.